Exhibit 99.1

Investor Meeting
February 29, , 2012
Foote Hydro 1918
Zeeland 2007
Lake Winds 2012
This presentation is made as of the date hereof and contains “forward? looking statements” as defined in Rule 3b? 6 of the Securities Exchange Act of 1934, as amended, Rule 175 of the Securities Act of 1933, as amended, and relevant legal decisions. The forward? looking statements are subject to risks and uncertainties. They should be read in conjunction with “FORWARD? LOOKING STATEMENTS AND
INFORMATION” and “RISK FACTORS” sections of CMS Energy’s and Consumers Energy’s Form 10? K for the year ended December 31 and as updated in subsequent 10? Qs. CMS Energy’s and Consumers Energy’s “FORWARD? LOOKING STATEMENTS AND
INFORMATION” and “RISK FACTORS” sections are incorporated herein by reference and discuss important factors that could cause CMS Energy’s and Consumers Energy’s results to differ materially from those anticipated in such statements. CMS Energy and Consumers Energy undertake no obligation to update any of the information presented herein to reflect facts, events or circumstances after the date hereof.
The presentation also includes non? GAAP measures when describing CMS Energy’s results of operations and financial performance. A reconciliation of each of these measures to the most directly comparable GAAP measure is included in the appendix and posted on our website at www.cmsenergy.com.
Reported earnings could vary because of several factors, such as legacy issues associated with prior asset sales. Because of those uncertainties, the company is not providing reported earnings guidance.
Agenda
• Welcome Tom Webb
• CMS Energy Overview John Russell
• Consumers Energy Overview
• Distribution & Customer Operations Dan Malone
• Customer Experience & Operations Patti Poppe
• Electric Generation & Energy Supply Jack Hanson
• Rates & Regulation Ronn Rasmussen
• Financial Overview Tom Webb
• Q&A
CMS Energy Overview
John Russell President and CEO
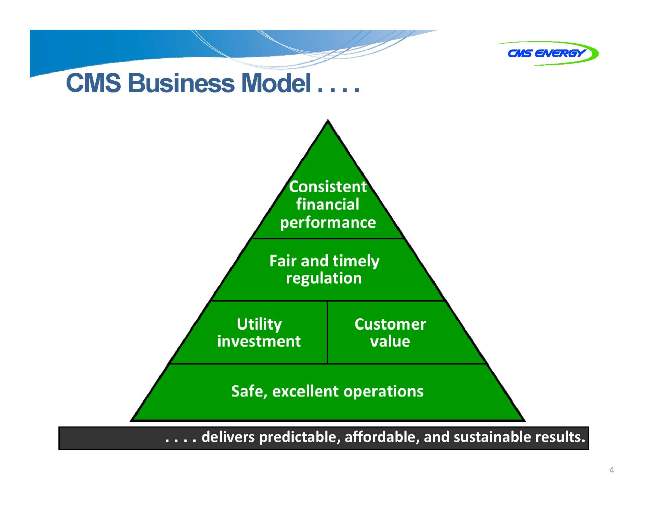
CMS Business Model . . . .
. . . . delivers predictable, affordable, and sustainable results.
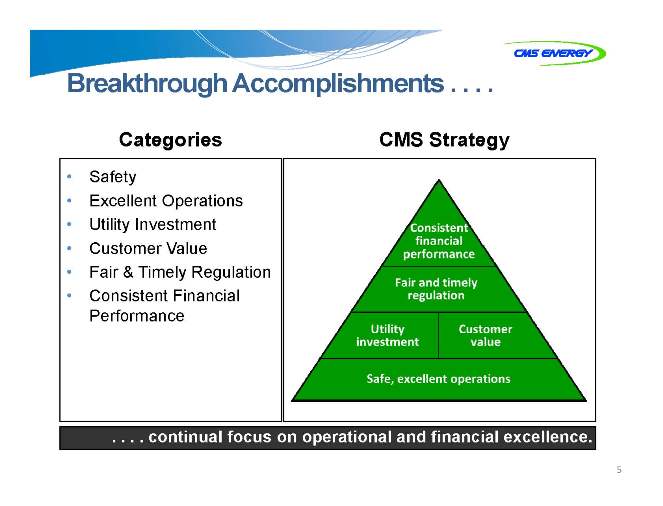
Breakthrough Accomplishments . . . .
Categories
CMS Strategy
Safety
Excellent Operations Utility Investment Customer Value Fair & Timely Regulation Consistent Financial Performance
. . . . continual focus on operational and financial excellence.
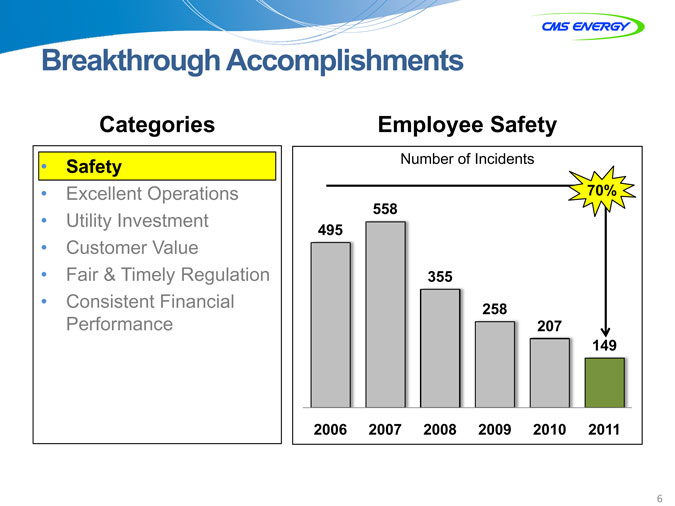
Breakthrough Accomplishments
Categories
Safety
Excellent Operations
Utility Investment
Customer Value Fair & Timely Regulation Consistent Financial Performance
Employee Safety
Number of Incidents
70%
558 495
355
258 207 149
2006 2007 2008 2009 2010 2011
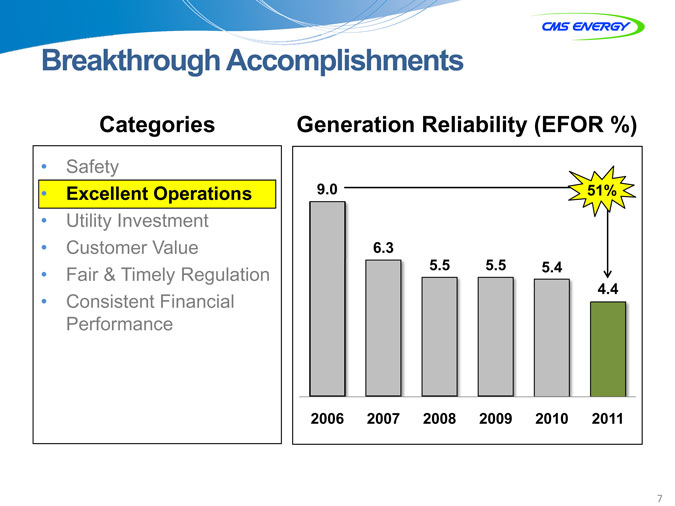
Breakthrough Accomplishments
Categories
Safety
Excellent Operations
Utility Investment Customer Value Fair & Timely Regulation Consistent Financial Performance
Generation Reliability (EFOR %)
9.0 51%
6.3
5.5 5.5 5.4 4.4
2006 2007 2008 2009 2010 2011
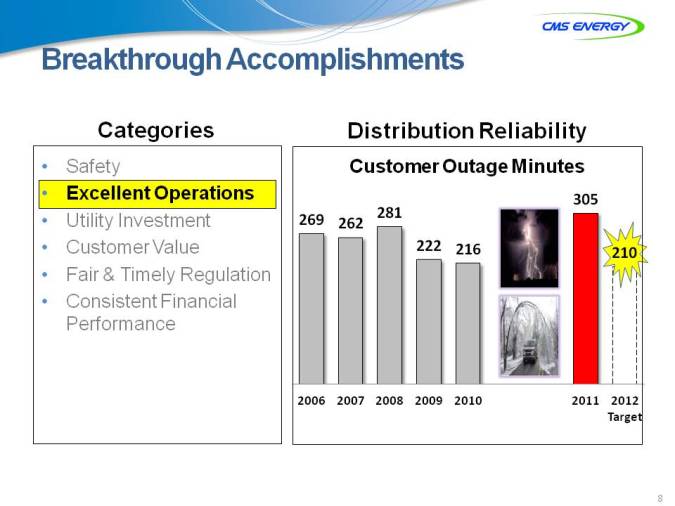
Breakthrough Accomplishments
Categories
Safety
Excellent Operations
Utility Investment Customer Value Fair & Timely Regulation Consistent Financial Performance
Distribution Reliability
Customer Outage Minutes
305 281 269 262 222 216 210 210
2006 2007 2008 2009 2010 20112012 Targe
Breakthrough Accomplishments
Categories
Safety
Excellent Operations
Utility Investment Customer Value Fair & Timely Regulation Consistent Financial Performance
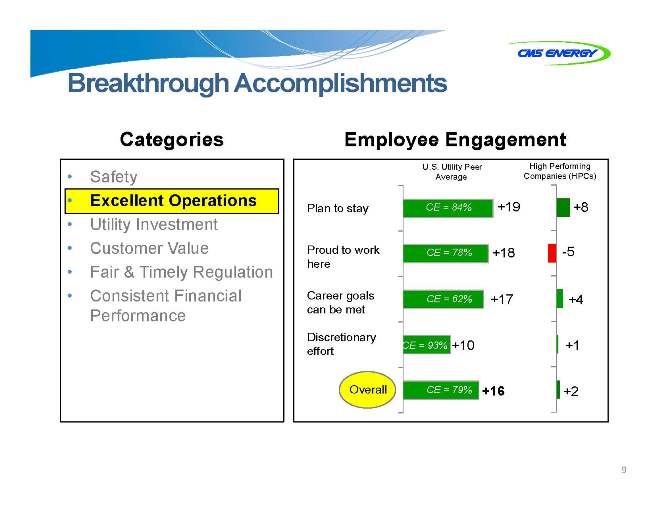
Employee Engagement
U.S. Utility Peer High Performing Average Companies (HPCs)
Plan to stay CE = 84% +19 +8
Proud to work CE = 78% +18 -5 here
Career goals CE = 62% +17 +4 can be met
Discretionary
CE = 93% +10 +1 effort
Overall CE = 79% +16 +2
9
Breakthrough Accomplishments
Categories
Safety
Excellent Operations
Utility Investment Customer Value Fair & Timely Regulation Consistent Financial Performance
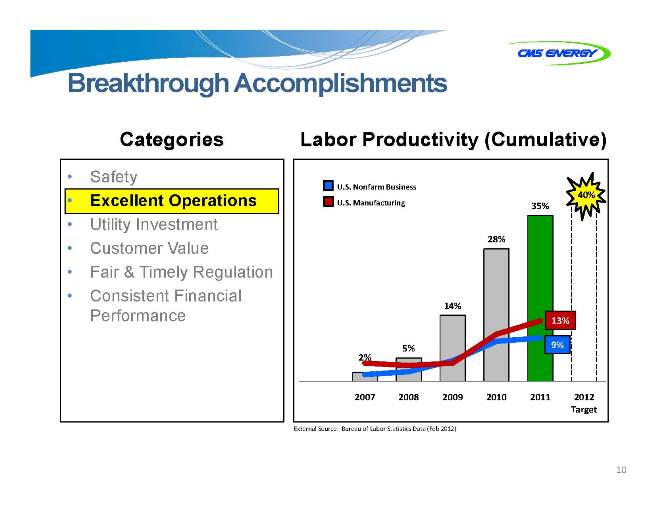
Labor Productivity (Cumulative)
U.S. Nonfarm Business
40% U.S. Manufacturing 35%
28%
14%
13%
9% 5% 2%
2007 2008 2009 2010 2011 2012 Target
External Source: Bureau of Labor Statistics Data (Feb 2012)
10

Breakthrough Accomplishments . . . .
Categories
Safety
Excellent Operations
Utility Investment
Customer Value Fair & Timely Regulation Consistent Financial Performance
5 | | Year, $6.6 Billion Plan |
Bils Planned Rate Base Growth
$15 14
13 5%-7% 12 11 10 9
8 | | Reliability/Deliverability Renewables |
7 | | Smart Grid Environmental |
6 | | Maintenance Depreciation |
2011 2012 2013 2014 2015 2016 Average Base Rate (bils) $10.9 $11.5 $12.3 $13.2 $14.0
. . . . planned investment grows rate base.
11
Breakthrough Accomplishments . . . .
Categories
Safety
Excellent Operations
Utility Investment
Customer Value
Fair & Timely Regulation Consistent Financial Performance
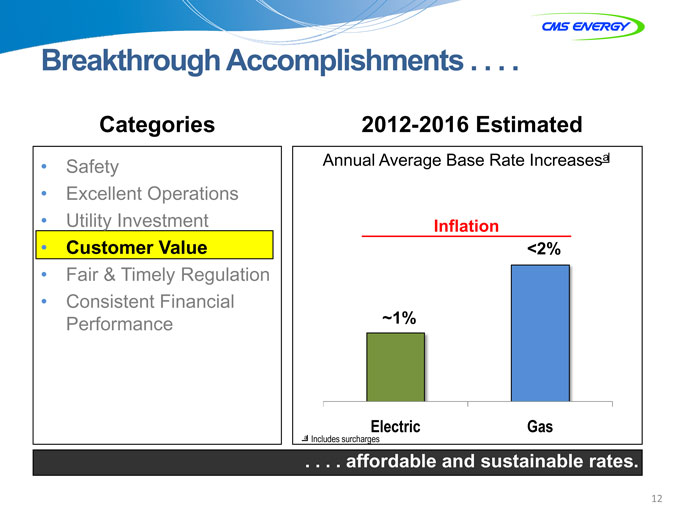
2012-2016 Estimated
Annual Average Base Rate Increasesa
Inflation <2%
~1%
Electric Gas
a Includes surcharges
. . . . affordable and sustainable rates.
12
Breakthrough Accomplishments
Categories
Safety
Excellent Operations Utility Investment Customer Value
Fair & Timely Regulation
Consistent Financial Performance
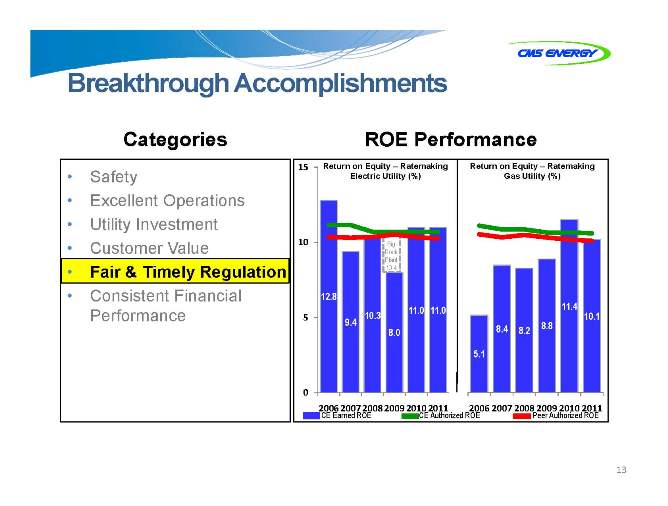
ROE Performance
15 Return on Equity – Ratemaking Return on Equity – Ratemaking Electric Utility (%) Gas Utility (%)
10 Big Rock Plant 10.4
12.8 11.4 11.0 11.0
5 | | 10.3 10.1 9.4 8.8 8.0 8.4 8.2 5.1 |
0
2006 2007 2008 2009 2010 2011 2006 2007 2008 2009 2010 2011
CE Earned ROE CE Authorized ROE Peer Authorized ROE
13
Breakthrough Accomplishments . . . .
Categories
Safety
Excellent Operations Customer Value Utility Investment Fair & Timely Regulation
Consistent Financial Performance
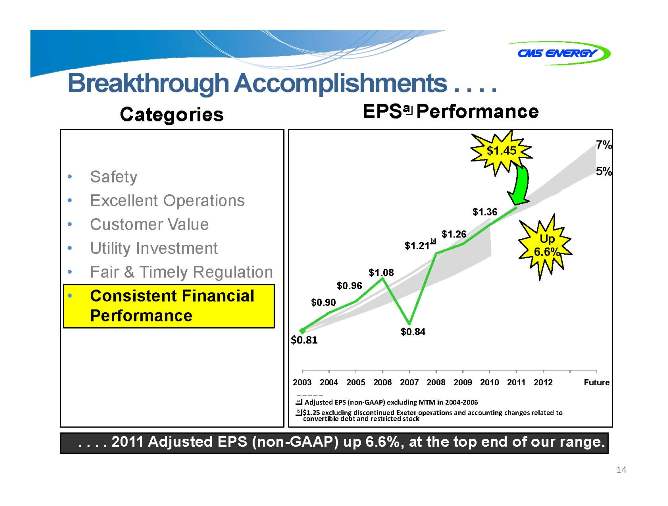
EPS Performance
7% $1.45 5%
$1.36
b $1.26 Up $1.21 6.6% $1.08 $0.96 $0.90
$0.84
0.81
2003 2004 2005 2006 2007 2008 2009 2010 2011 2012 Future
a Adjusted EPS (non? GAAP) excluding MTM in 2004? 2006 b $1.25 excluding discontinued Exeter operations and accounting changes related to convertible debt and restricted stock
. . . . 2011 Adjusted EPS (non-GAAP) up 6.6%, at the top end of our range.
14
Breakthrough Accomplishments
Categories
Safety
Excellent Operations Customer Value Utility Investment Fair & Timely Regulation
Consistent Financial Performance
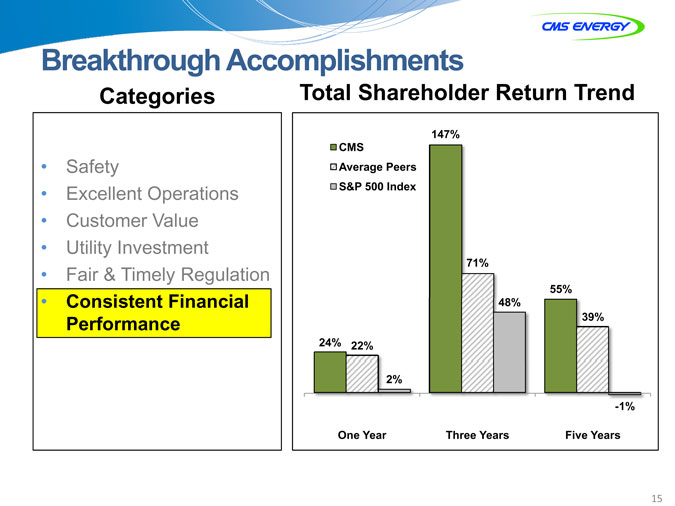
Total Shareholder Return Trend
147% CMS
Average Peers S&P 500 Index
71%
55% 48% 39%
24% 22%
2%
-1%
One Year Three Years Five Years
15
Our Top Priorities . . . .
New Breakthrough goals
Unrelenting customer focus
Strong investor alignment
Supportive regulatory compact
World class risk mitigation
Consistent financial performance
. . . . with predictable, sustainable growth.
16
Consumers Energy Overview
Consistent financial performance
Fair and timely regulation
Utility Customer Dan Malone investment value
Safe, excellent operations Senior Vice President
Distribution & Customer Operations
Safety, Reliability and Customer Value . . . .
• Safety
– Employee safety
– Public safety
• Productivity
• Reliability
– Gas infrastructure
– Electric infrastructure
– Smart Grid infrastructure
• Customer Value
. . . . 125 years of service.
18

Productivity . . . .
Cumulative Productivity
60%
49%
50% 43%
6%
40% 22%
30%
21%
20%
21%
10% Year
0% Total
0% Target
2009 2010 2011 2012 Target
Headcount
4,806
4,595
4,532
4,431
2009 2010 2011 2012 Target
. . . . improving operational performance.
19
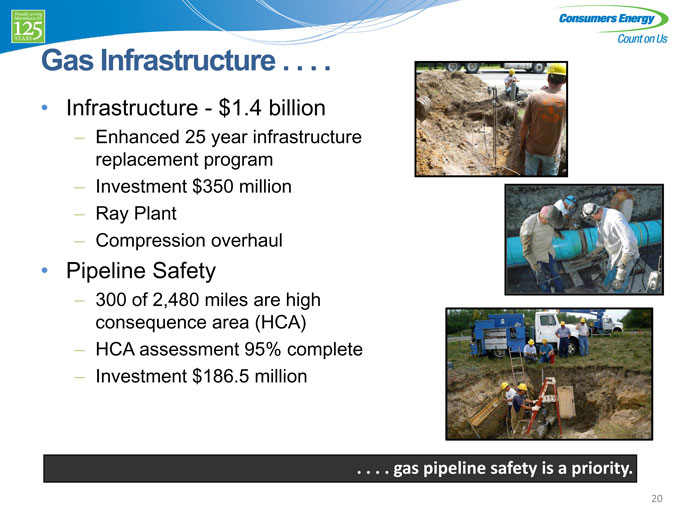
Gas Infrastructure . . . .
• Infrastructure—$1.4 billion
– Enhanced 25 year infrastructure replacement program
– Investment $350 million
– Ray Plant
– Compression overhaul
• Pipeline Safety
– 300 of 2,480 miles are high consequence area (HCA)
– HCA assessment 95% complete
– Investment $186.5 million
. . . . gas pipeline safety is a priority.
20
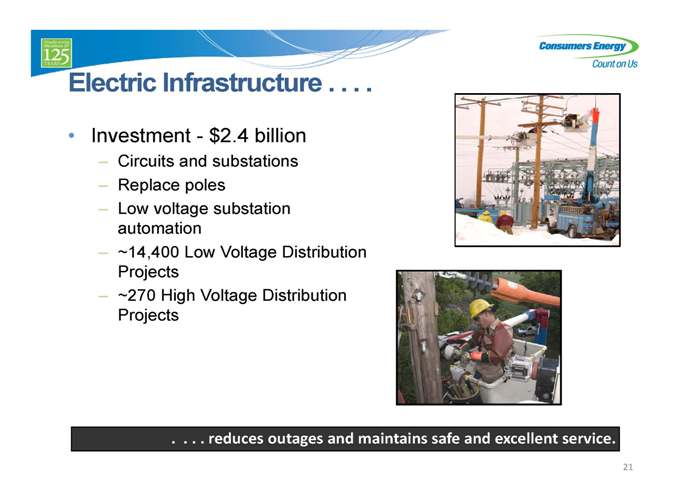
Electric Infrastructure . . . .
• Investment—$2.4 billion
– Circuits and substations
– Replace poles
– Low voltage substation automation
– ~14,400 Low Voltage Distribution Projects
– ~270 High Voltage Distribution Projects
. . . . reduces outages and maintains safe and excellent service.
21

System Investment Results . . . .
Peak Load
Previous Record Aug 2006
8883 MW
New Record July 2011
8930 MW
2006 2007 2008 2009 2010 2011
Performance
Time in 70%-90% Load Number of Customers
25 % 20
15 10 5 0
2006 2011
30,000 25,000 20,000 15,000 10,000 5,000 0
. . . . minimize risk of failure during peak conditions.
22
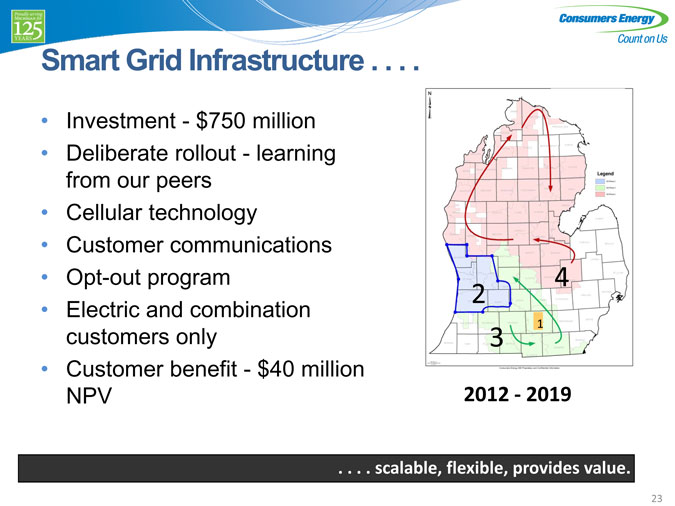
Smart Grid Infrastructure . . . .
Investment—$750 million Deliberate rollout—learning from our peers Cellular technology Customer communications Opt-out program Electric and combination customers only Customer benefit—$40 million NPV
2012 2019 ?
. . . . scalable,calable, flexible, provides value.
23
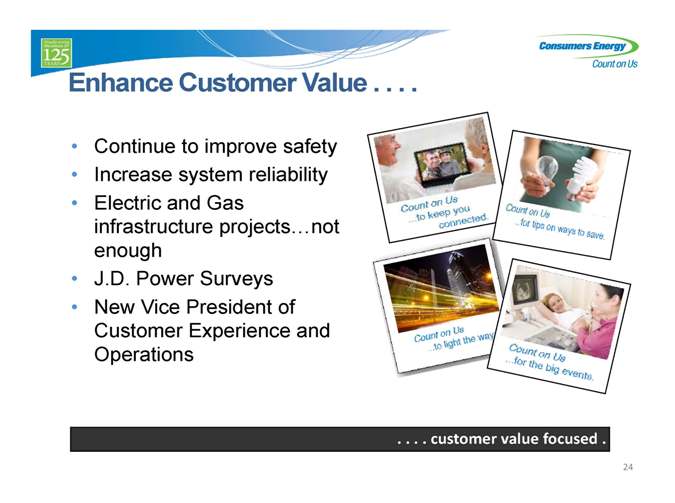
Enhance Customer Value . . . .
Continue to improve safety Increase system reliability Electric and Gas infrastructure projects…not enough
J.D. Power Surveys
New Vice President of Customer Experience and Operations
. . . . customer value focused .
24
Consumers Energy Overview
Patti Poppe Vice President
Customer Experience & Operations
Consistent financial performance
Fair and timely regulation
Utility Customer investment value
Safe, excellent operations
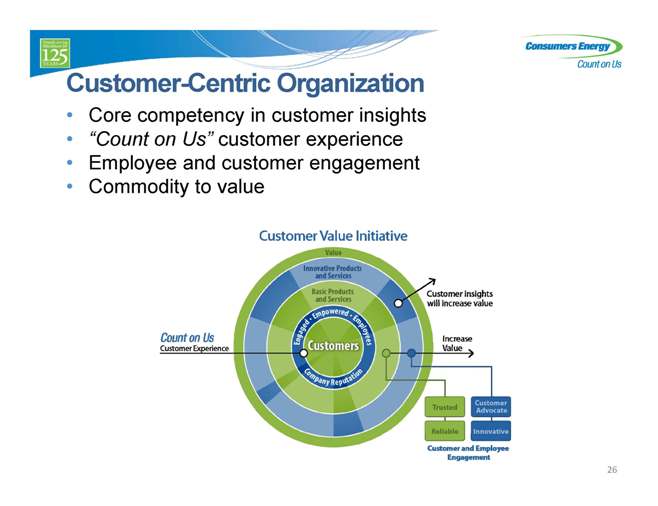
Customer-Centric Organization
Core competency in customer insights “Count on Us” customer experience Employee and customer engagement Commodity to value
26
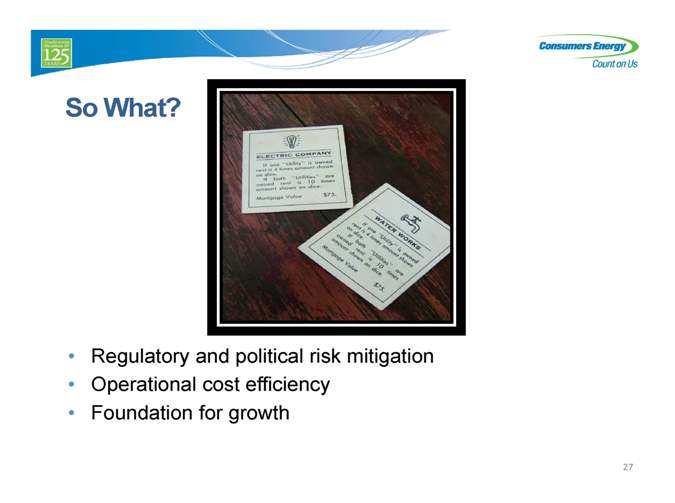
So What?
Regulatory and political risk mitigation Operational cost efficiency
Foundation for growth
27

Customer Insights . . . .
Qualitative and quantitative research studies Organization design Operational response
. . . . mustust become a core competency.
28

“Count on Us” Customer Experience
Getting it right the first time
Operational improvements for all customer touch points Providing a total experience that makes customers want to choose us
More than 90,000,000 opportunities to serve our customers well.
29

Customer & Employee Engagement . . . .
• Community engagement
– Charitable giving
– Grassroots effort
– 125 Year celebrations
• Strategic business customer engagement
• Low-income customer experience project
. . . . improves the perception of value.
30
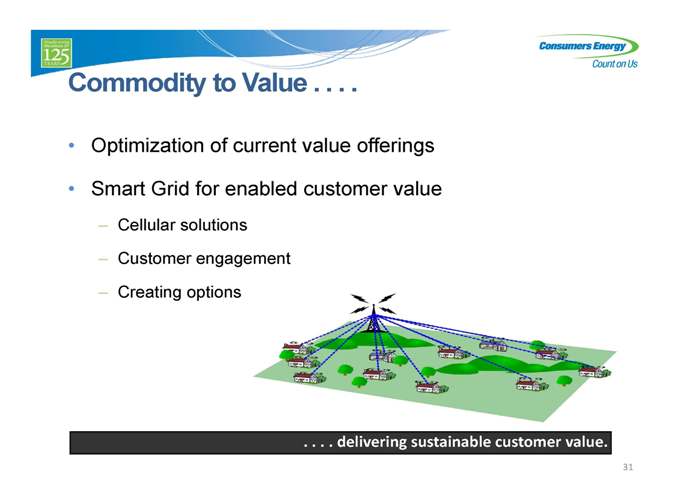
Commodity to Value . . . .
• Optimization of current value offerings
• Smart Grid for enabled customer value
– Cellular solutions
– Customer engagement
– Creating options
. . . . deliveringelivering sustainable customer value.
31
Count on Us
32
Consumers Energy Overview
Jack Hanson Senior Vice President Electric Generation & Energy Supply
Consistent financial performance
Fair and timely regulation
Utility Customer investment value
Safe, excellent operations
Overview
Environmental compliance
Investment
– Environmental
– Renewable
Balanced portfolio
34
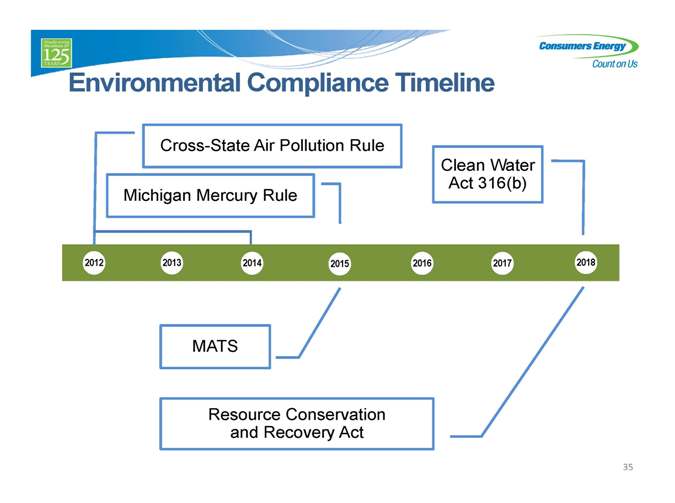
Environmental Compliance Timeline
Cross-State Air Pollution Rule
Clean Water Act 316(b) Michigan Mercury Rule
2012 2013 2014 2015 2016 2017 2018
MATS
Resource Conservation and Recovery Act
35
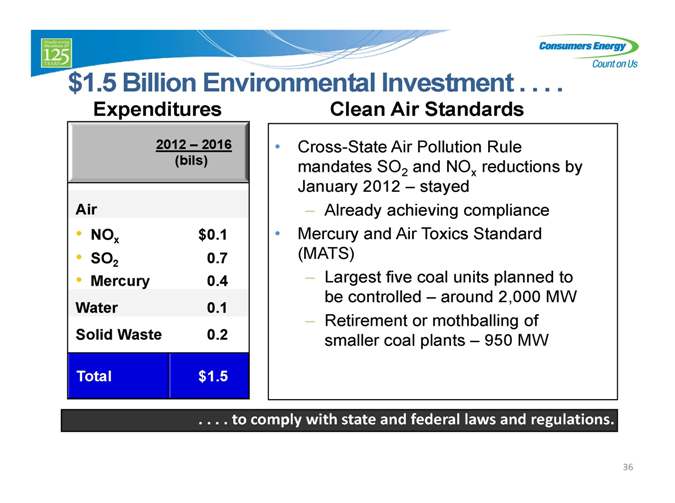
$1.5 Billion Environmental Investment . . . .
Expenditures
2012 – 2016 (bils)
Air
• NOx $0.1
• SO2 0.7
• Mercury 0.4 Water 0.1 Solid Waste 0.2
Total $1.5
Clean Air Standards
• Cross-State Air Pollution Rule mandates SO2 and NOx reductions by January 2012 – stayed
– Already achieving compliance
• Mercury and Air Toxics Standard (MATS)
– Largest five coal units planned to be controlled – around 2,000 MW
– Retirement or mothballing of smaller coal plants – 950 MW
. . . . to comply with state and federal laws and regulations.
36
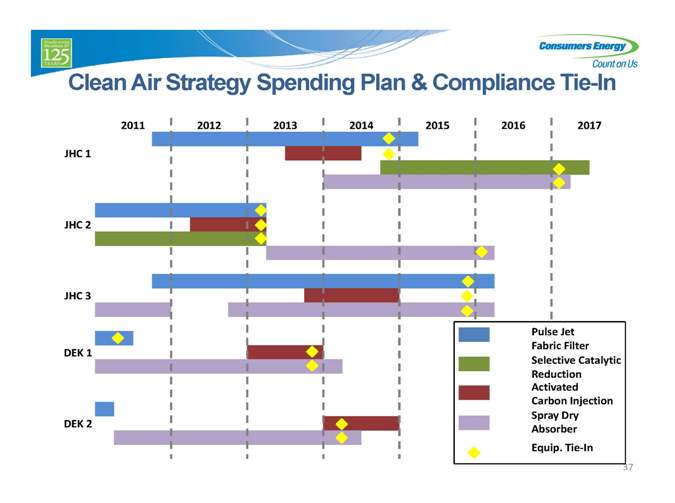
Clean Air Strategy Spending Plan & Compliance Tie-In
2011 2012 2013 2014 2015 2016 2017
JHC 1
JHC 2
JHC 3
Pulse Jet Fabric Filter
Selective Catalytic Reduction Activated Carbon Injection Spray Dry Absorber Equip. Tie? In
37
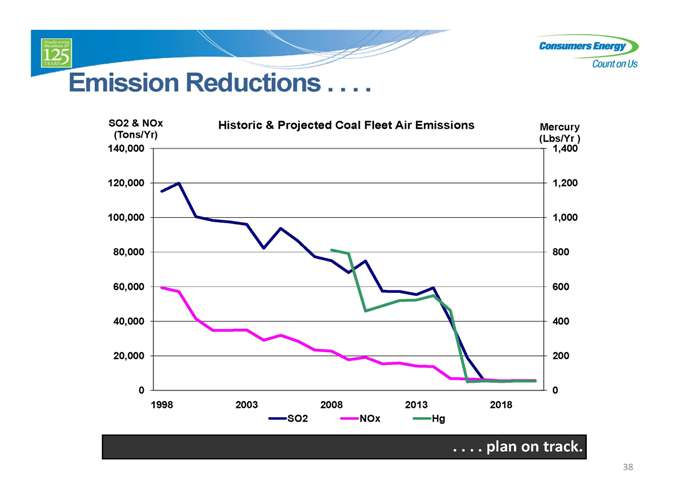
Emission Reductions . . . .
SO2 & NOx (Tons/Yr) 140,000
120,000 100,000 80,000 60,000 40,000 20,000 0
Historic & Projected Coal Fleet Air Emissions
Mercury (Lbs/Yr ) 1,400
1,200 1,000 800 600 400 200 0
1998 2003 2008 2013 2018 SO2 NOx Hg
. . . . plan on track.
38
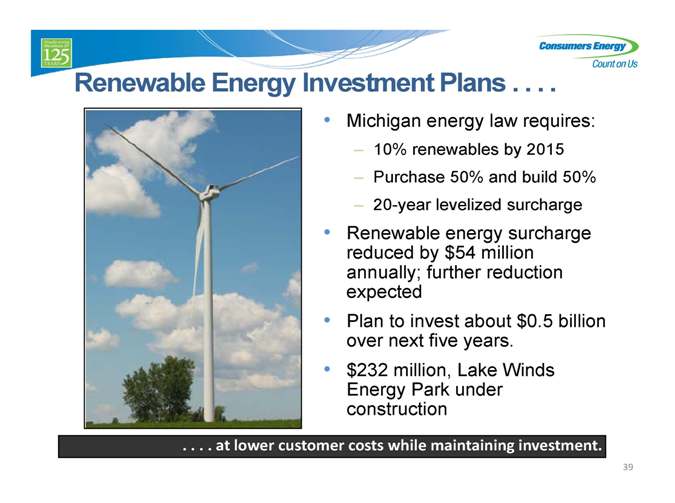
Renewable Energy Investment Plans . . . .
Michigan energy law requires:
– 10% renewables by 2015
– Purchase 50% and build 50%
– 20-year levelized surcharge
Renewable energy surcharge reduced by $54 million annually; further reduction expected Plan to invest about $0.5 billion over next five years. $232 million, Lake Winds Energy Park under construction
. . . . at lower customer costs while maintaining investment.
39
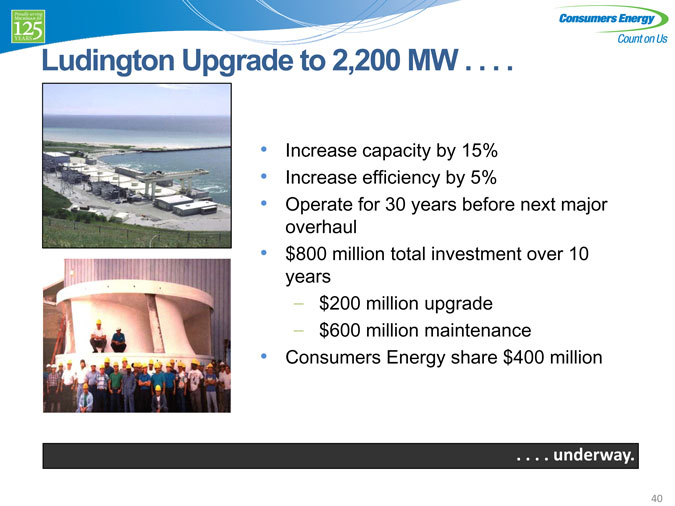
Ludington Upgrade to 2,200 MW . . . .
Increase capacity by 15% Increase efficiency by 5%
Operate for 30 years before next major overhaul $800 million total investment over 10 years
– $200 million upgrade
– $600 million maintenance
Consumers Energy share $400 million
. . . . underway.
40
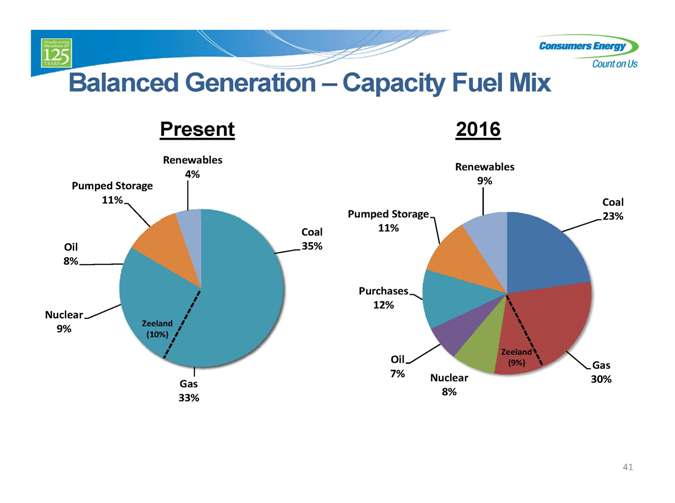
Balanced Generation – Capacity Fuel Mix
Present
Renewables 4% Pumped Storage 11%
Coal Oil 35% 8%
Nuclear
Zeeland
9%
(10%)
Gas 33%
2016
Renewables 9%
Coal Pumped Storage 23% 11%
Purchases 12%
Oil Zeeland
(9%) Gas
7% Nuclear
30% 8%
41
Electric Generation and Energy Supply Priorities
Plan to invest $1.5 billion over next five years to achieve compliance with all environmental standards By 2016, plants are expected to be emitting approximately 90% less:
– Nitrogen Oxides
– Sulfur Dioxide
– Mercury
Achieve 10% renewable standard by 2015 Maintain balanced generation portfolio mix
42
��
Consumers Energy Overview
Ronn Rasmussen Vice President Rates & Regulation
Consistent financial performance
Fair and timely regulation
Utility Customer investment value
Safe, excellent operations
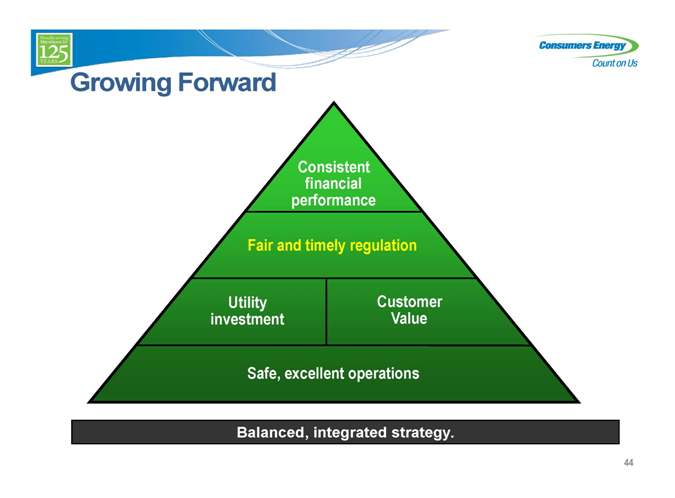
Growing Forward
Consistent financial performance
Fair and timely regulation
Utility Customer Customer investment value Value
Safe, excellent operations
Balanced, integrated strategy.
44
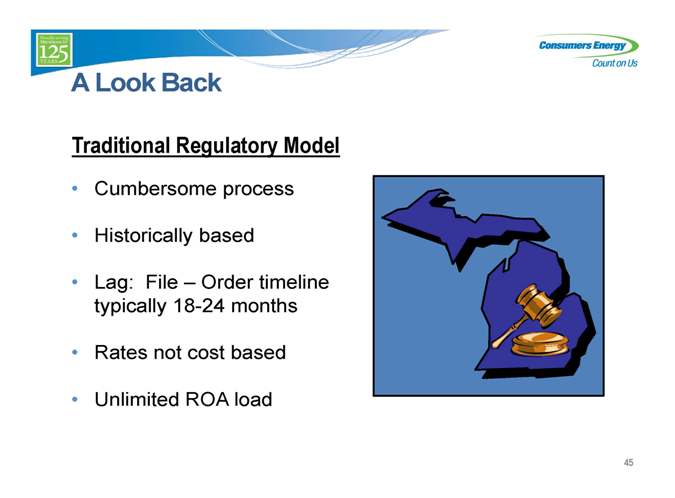
A Look Back
Traditional Regulatory Model
• Cumbersome process
• Historically based
• Lag: File – Order timeline typically 18-24 months
• Rates not cost based
• Unlimited ROA load
45

Michigan Energy Legislation . . . .
Forward looking Reduced “Lag”
– File and implement
– 12 month “hard stop”
Transition to cost based rates
ROA “Cap”
. . . . enhanced regulatory certainty.
46

ROE Performance – Ratemaking
Combined ROE
11.1% 10.8%
10.3% 9.9% 9.7% 9.1%
2006 2007 2008 2009 2010 2011
Actual ROE Authorized ROE
Actual ROE vs Authorized
104% 101% 93% 98% 99% 93% 91% 91% 92% 82% 86%
2006 2007 2008 2009 2010 2011
CMS Peers
Peer data NA for 2011
47

Rate Case Timeline
2008 2009 2010 2011 2012
ELECTRIC Offsets
Filed $214 M Filed $178 M Filed $195 M Renewables $(57) DOE (23) Increase Increase Increase Total $(80)
Self- Final Self- Final implement Self- implement $Order 139 M implement Order $118 M $179 M $150 M $146 M
New Decision
Energy 78% 97%%
Law
GAS Filed Filed Filed $114 M $55 M $49 M
Increase 74% Increase Increase
Self- Order Final Final Self-implement $89 M $66 M $ Order 31 M implement $23 M Decision
2008 2009 2010 2011 2012
Frequent and streamlined rate case strategy continues.
9
48
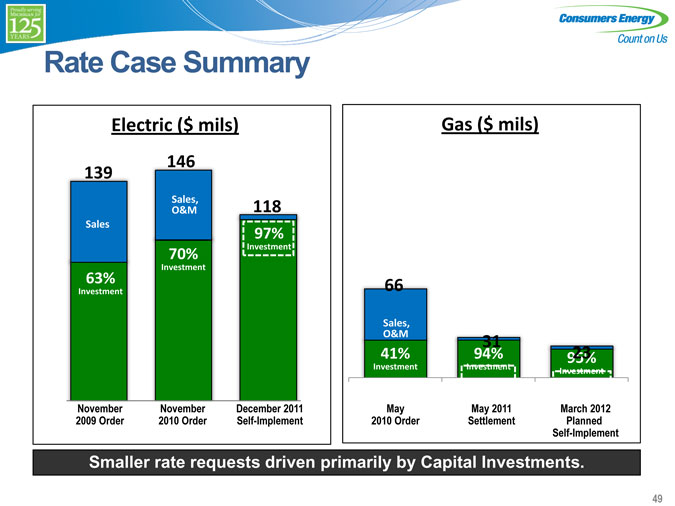
Rate Case Summary
Electric ($ mils)
146 139
Sales, 118 O&M
Sales
97%
Investment
70%
Investment
63%
Investment
November 2009 Order
November 2010 Order
December 2011 Self-Implement
Gas ($ mils)
66
Sales, O&M
41%
Investment
31 94%
Investment
95% 23
Investment
May 2010 Order
May 2011 Settlement
March 2012 Planned Self-Implement
Smaller rate requests driven primarily by Capital Investments.
49
Challenges
• ROA “Cap”
• Michigan economy
• Rate fatigue
50
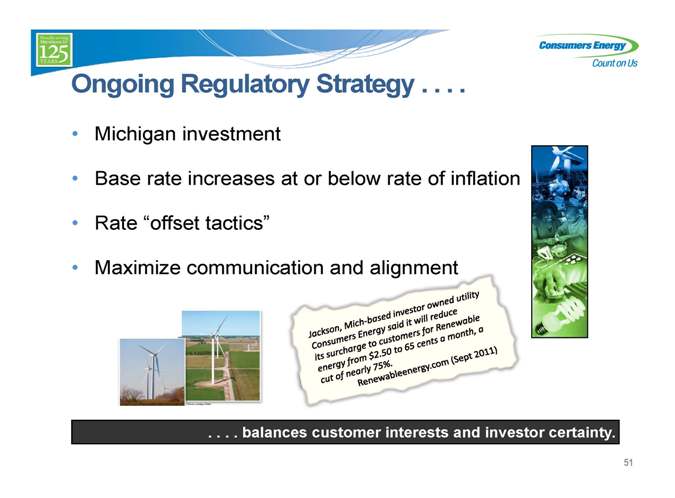
Ongoing Regulatory Strategy . . . .
Michigan investment
Base rate increases at or below rate of inflation Rate “offset tactics” Maximize communication and alignment
. . . . balances customer interests and investor certainty.
51
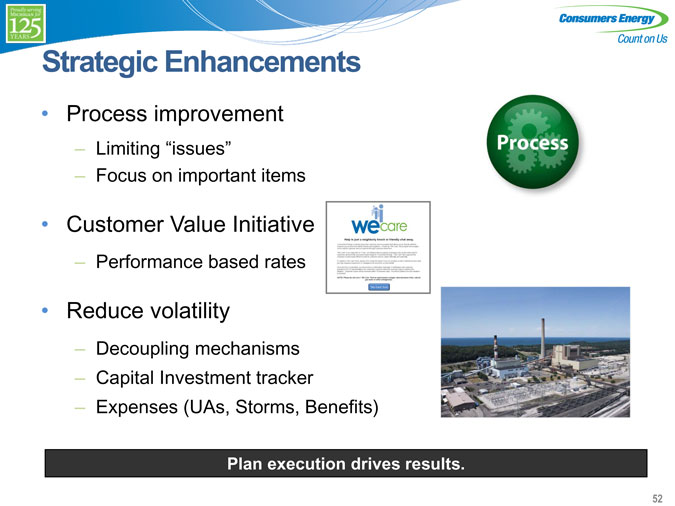
Strategic Enhancements
Process improvement
– Limiting “issues”
– Focus on important items
Customer Value Initiative
– Performance based rates
Reduce volatility
– Decoupling mechanisms
– Capital Investment tracker
– Expenses (UAs, Storms, Benefits)
Plan execution drives results.
RJR 9
52
Financial Overview
Tom Webb
Executive Vice President & CFO
Consistent financial performance
Fair and timely regulation
Utility Customer investment value
Safe, excellent operations
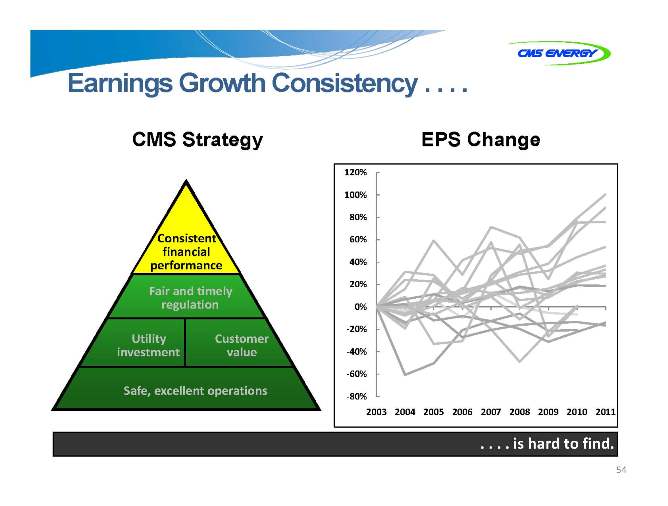
Earnings Growth Consistency . . . .
CMS Strategy
Consistent financial performance
Fair and timely regulation
Utility Customer investment value
Safe, excellent operations
EPS Change
120% 100% 80% 60% 40% 20% 0% ? 20% ? 40% ? 60%
? 80%
2003 2004 2005 2006 2007 2008 2009 2010 2011
. . . . iss hard to find.
54
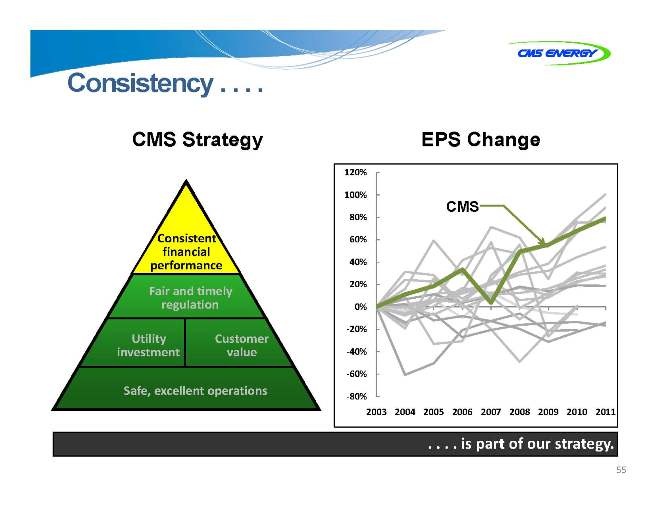
Consistency . . . .
CMS Strategy
Consistent financial performance
Fair and timely regulation
Utility Customer investment value
Safe, excellent operations
EPS Change
120%
100%
CMS
80% 60% 40% 20% 0% ? 20% ? 40% ? 60%
? 80%
2003 2004 2005 2006 2007 2008 2009 2010 2011
. . . . is partart of our strategy.
55
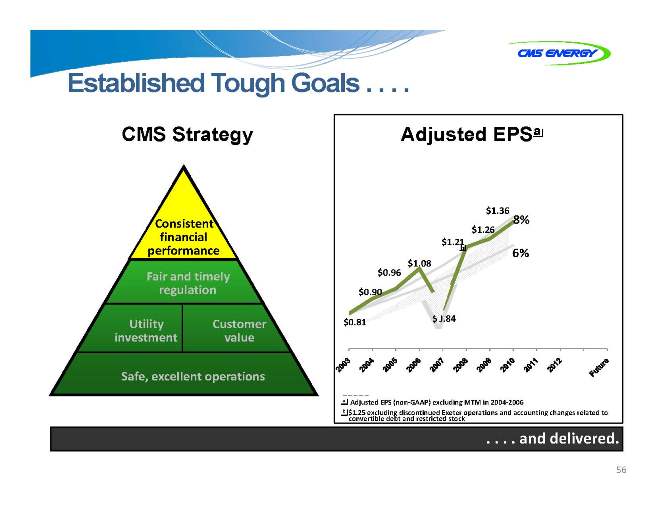
Established Tough Goals . . . .
CMS Strategy
Consistent financial performance
Fair and timely regulation
Utility Customer investment value
Safe, excellent operations
Adjusted EPSa
$1.36 8%
$1.26
$1.21
b 6%
$1.08
$0.96
$0.90
$0.84
$0.81
a Adjusted EPS (non? GAAP) excluding MTM in 2004? 2006 b $1.25 excluding discontinued Exeter operations and accounting changes related to convertible debt and restricted stock
. . . . andnd delivered.
56
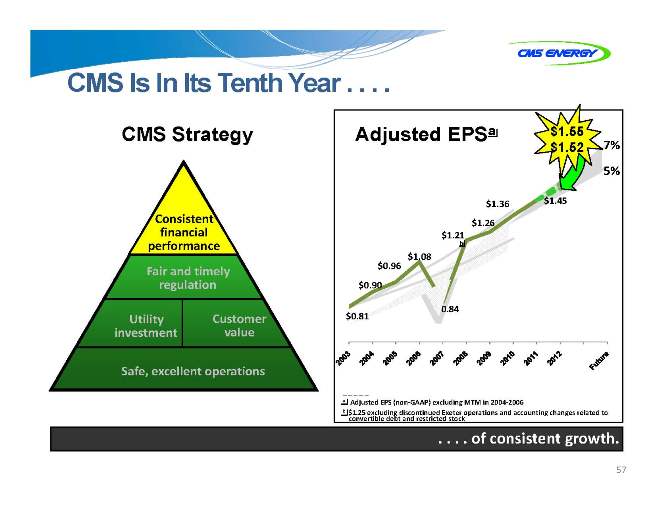
CMS Is In Its Tenth Year . . . .
CMS Strategy
Consistent financial performance
Fair and timely regulation
Utility Customer investment value
Safe, excellent operations
Adjusted EPSa $1.55
$1.52 7% 5%
$1.36 $1.45
$1.26
$1.21
b
$1.08
$0.96
$0.90
$0.81 $0.84
a Adjusted EPS (non? GAAP) excluding MTM in 2004? 2006 b $1.25 excluding discontinued Exeter operations and accounting changes related to convertible debt and restricted stock
. . . . off consistent growth.
57
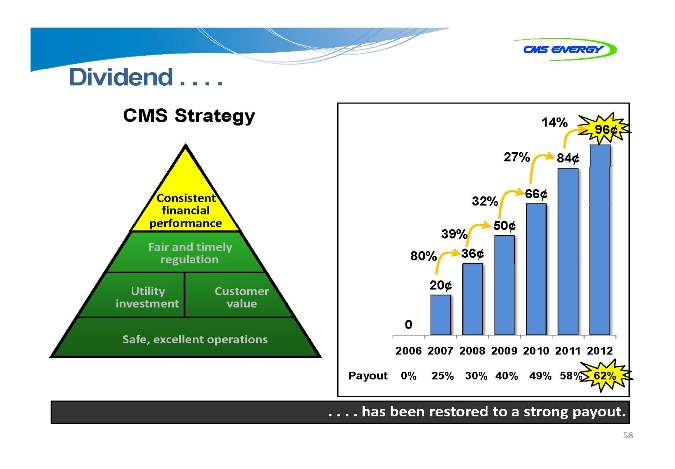
Dividend . .. . .
CMS Strategy
Consistent financial performance
Fair and timely regulation
Utility Customer investment value
Safe, excellent operations
14% 96¢
27% 84¢
66¢ 32% 50¢ 39% 80% 36¢
20¢
0
2006 2007 2008 2009 2010 2011 2012
Payout 0% 25% 30% 40% 49% 58% 62%
. . . . hasas been restored to a strong payout.
58
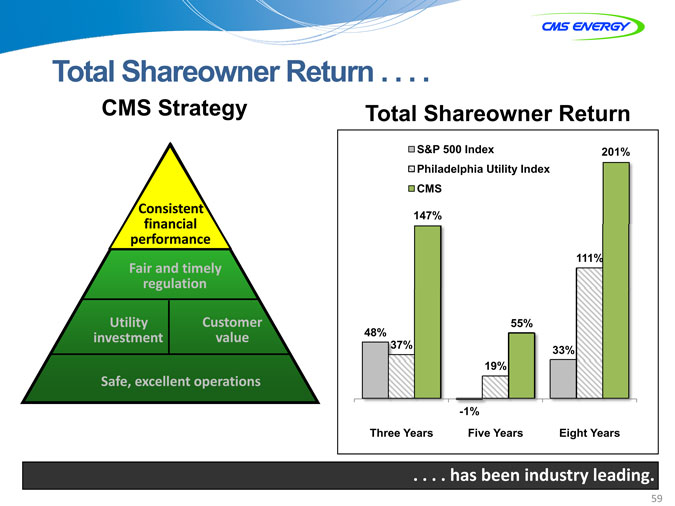
Total Shareowner Return . . . .
CMS Strategy
Consistent financial performance
Fair and timely regulation
Utility Customer investment value
Safe, excellent operations
Total Shareowner Return
S&P 500 Index 201% Philadelphia Utility Index CMS
147%
111%
55% 48% 37% 33% 19%
-1%
Three Years Five Years Eight Years
. . . . hasas been industry leading.
59
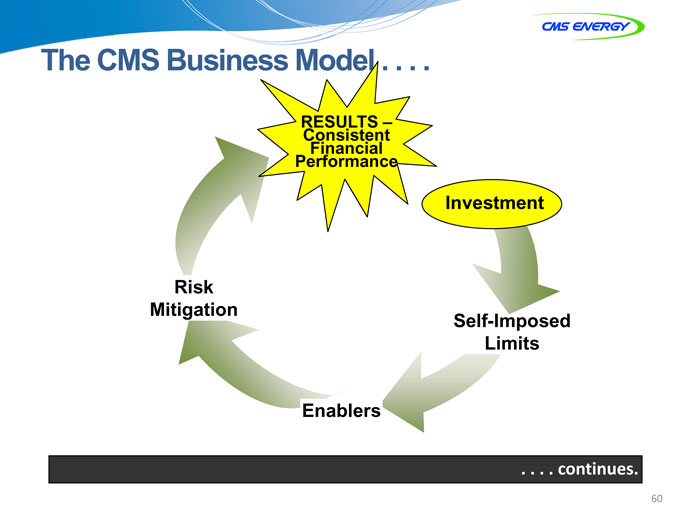
The CMS Business Model . . . .
RESULTS –Consistent Financial Performance
Investment
Risk Mitigation
Self-Imposed Limits
Enablers
. . . . continuesontinues.
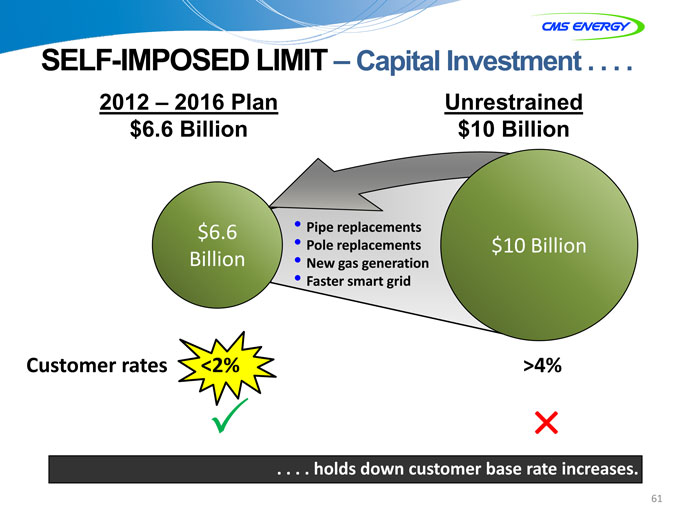
SELF-IMPOSED LIMIT – Capital Investment . . . .
2012 – 2016 Plan $6.6 Billion
Unrestrained
$10 Billion
$6.6 Billion
Pipe replacements Pole replacements New gas generation Faster smart grid
$10 Billion
Customer rates <2%
>4%
. . . . holdsolds down customer base rate increases.
61
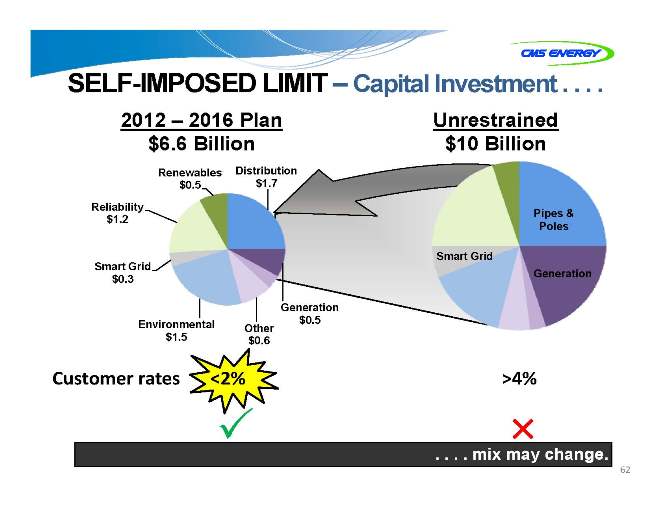
SELF-IMPOSED LIMIT – Capital Investment . . . .
2012 – 2016 Plan $6.6 Billion
Unrestrained
$10 Billion
Renewables Distribution $0.5 $1.7 Reliability $1.2
Smart Grid $0.3
Generation Environmental $0.5 Other $1.5 $0.6
Pipes & Poles
Smart Grid
Generation
Customer rates <2%
>4%
. . . . mixix may change.
62
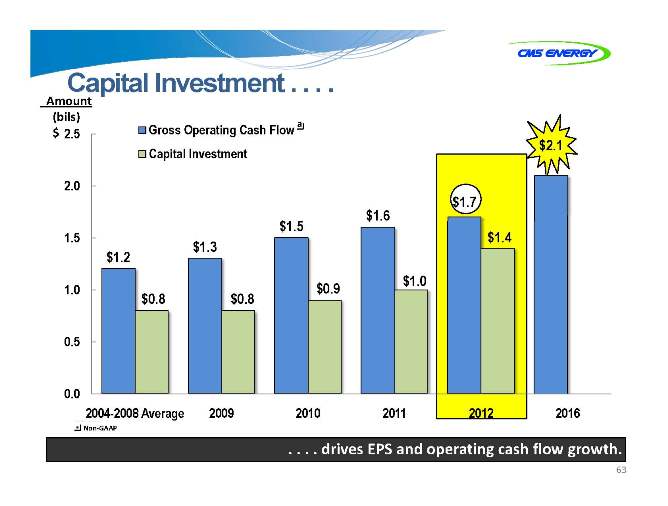
Capital Investment . . . .
Amount (bils) $ 2.5
2.0 1.5 1.0 0.5 0.0
Gross Operating Cash Flow a $2.1 Capital Investment
$1.6 $1.7 $1.5 $1.4 $1.3 $1.2 $1.0 $0.9 $0.8 $0.8
2004-2008 Average 2009 2010 2011 2012 2016
a Non? GAAP
. . . . drives EPS and operating cash flow growth.
63
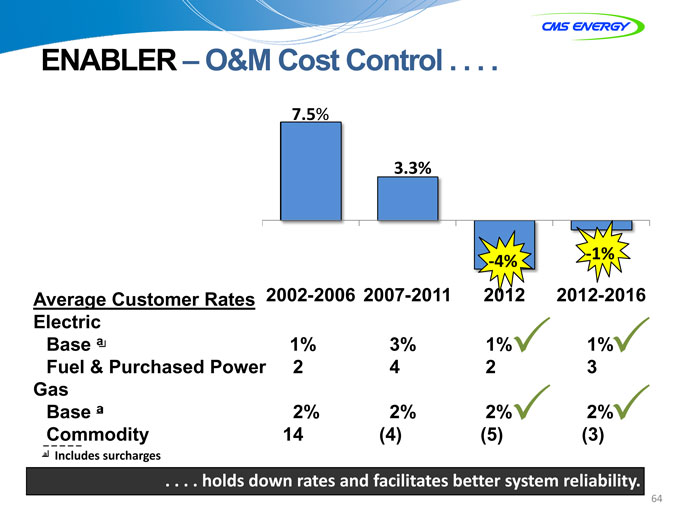
ENABLER – O&M Cost Control . . . .
? 1% ? 4%
Average Customer Rates 2002-2006 2007-2011 2012 2012-2016 Electric Base a 1% 3% 1%31% 3 Fuel & Purchased Power 2 4 2 3 Gas Base a 2% 2% 2%32% 3 _Commodity 14 (4) (5) (3)
a Includes surcharges
. . . . holds down rates and facilitates better system reliability.
64
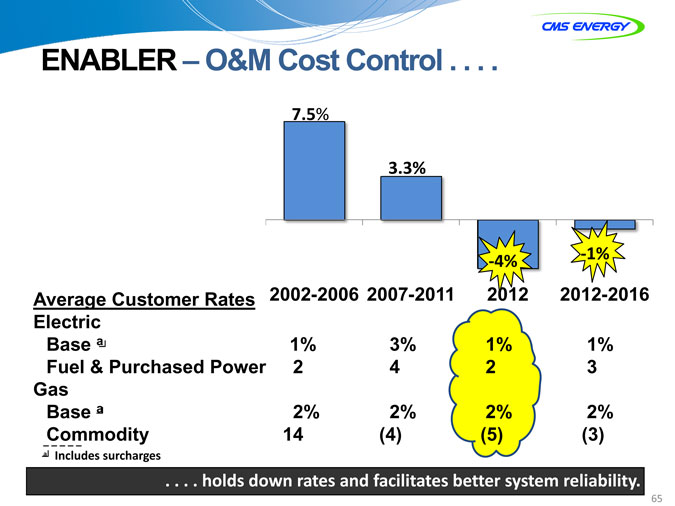
ENABLER – O&M Cost Control . . . .
7.5%
3.3%
? 1% ? 4%
Average Customer Rates 2002-2006 2007-2011 2012 2012-2016 Electric Base a 1% 3% 1% 1% Fuel & Purchased Power 2 4 2 3 Gas Base a 2% 2% 2% 2% _Commodity 14 (4) (5) (3)
a Includes surcharges
. . . . holds down rates and facilitates better system reliability.
65

ENABLER – Sales Recovery . . . .
Electric Salesa
GWh
Up 5% 40,000 2010 to 2012
6% decline
35,000
2007 to 2009
30,000
25,000 Up 9% 1983 &1984
7% decline 20,000 1979 to 1982
15,000 0
1975 1979 1983 1987 1991 1995 1999 2003 2007 2012 2011
Electric Salesa vs Prior Years
+2.1% +2.2%
+1.7%
+1.3%
? 0.7%
+5% ? 2.0% ? 3.0%
? 6%
2006 2007 2008 2009 2010 2011 2012
a Weather adjusted
. . . . adds rate “headroom”.
66
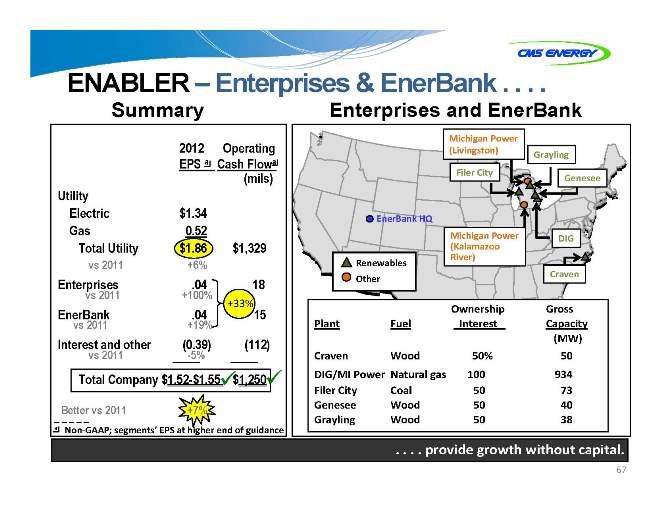
ENABLER – Enterprises & EnerBank . . . .
Summary Enterprises and EnerBank
2012 Operating EPS a Cash Flowa (mils) Utility Electric $1.34 Gas 0.52 Total Utility $1.86 $1,329
vs 2011 +6%
Enterprises .04 18
vs 2011 +100%
EnerBank .04 +33%15
vs 2011 +19%
Interest and other (0.39) (112)
vs 2011 -5%
Total Company $1.52-$1.55?$1,250?
_ Better vs 2011 +7% a Non? GAAP; segments’ EPS at higher end of guidance
Michigan Power
(Livingston)
Grayling
Filer City
Genesee
EnerBank HQ
Michigan Power DIG (Kalamazoo River) Renewables Craven Other
Ownership Gross Plant Fuel Interest Capacity (MW) Craven Wood 50% 50 DIG/MI Power Natural gas 100 934 Filer City Coal 50 73 Genesee Wood 50 40 Grayling Wood 50 38
. . . . provide growth without capital.
67
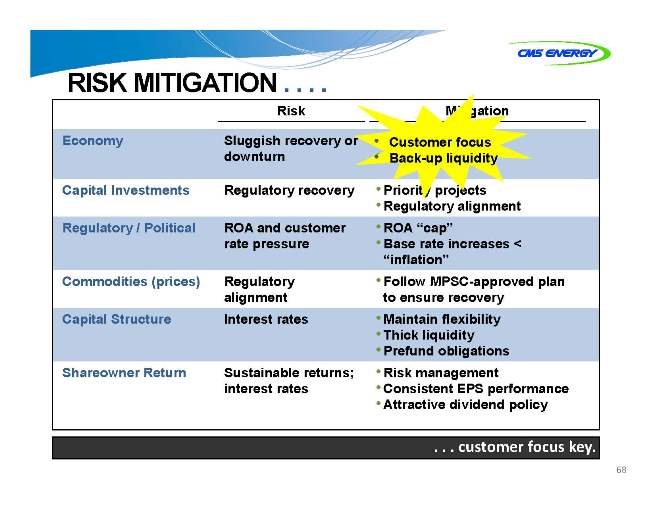
RISK MITIGATION . . . .
Risk Mitigation Economy Sluggish recovery or •• Customer focus downturn •• Back -up -up liquidity Capital Investments Regulatory recovery •Priority projects •Regulatory alignment Regulatory / Political ROA and customer •ROA “cap” rate pressure •Base rate increases < “inflation” Commodities (prices) Regulatory •Follow MPSC-approved plan alignment to ensure recovery Capital Structure Interest rates •Maintain flexibility •Thick liquidity •Prefund obligations Shareowner Return Sustainable returns; •Risk management interest rates •Consistent EPS performance •Attractive dividend policy
. . . customerustomer focus key.
68
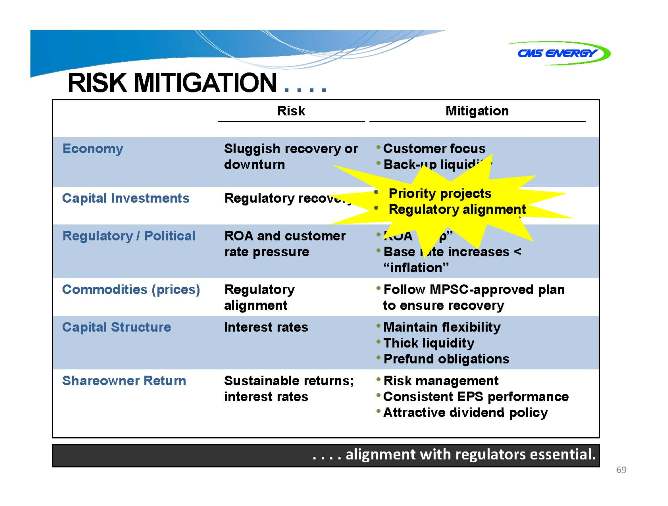
RISK MITIGATION . . . .
Risk Mitigation
Economy Sluggish recovery or •Customer focus downturn •Back-up liquidity Capital Investments Regulatory recovery ••Priority Priorityprojects projects ••Re Regulatory gulatory ali alignment gnment Regulatory / Political ROA and customer •ROA “cap” rate pressure •Base rate increases < “inflation” Commodities (prices) Regulatory •Follow MPSC-approved plan alignment to ensure recovery Capital Structure Interest rates •Maintain flexibility •Thick liquidity •Prefund obligations Shareowner Return Sustainable returns; •Risk management interest rates •Consistent EPS performance •Attractive dividend policy
. . . . alignmentlignment with regulators essential.
69
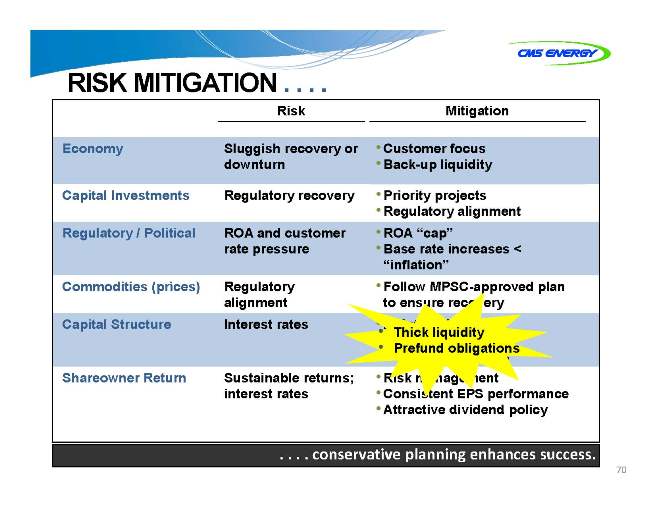
RISK MITIGATION . . . .
Risk Mitigation
Economy Sluggish recovery or •Customer focus downturn •Back-up liquidity Capital Investments Regulatory recovery •Priority projects •Regulatory alignment Regulatory / Political ROA and customer •ROA “cap” rate pressure •Base rate increases < “inflation” Commodities (prices) Regulatory •Follow MPSC-approved plan alignment to ensure recovery Capital Structure Interest rates •Maintain flexibility •• Thick liquidity •Thick liquidity Prefund obligations •Prefund obligations Shareowner Return Sustainable returns; •Risk management interest rates •Consistent EPS performance •Attractive dividend policy
. . . . conservativeonservative planning enhances success.
70
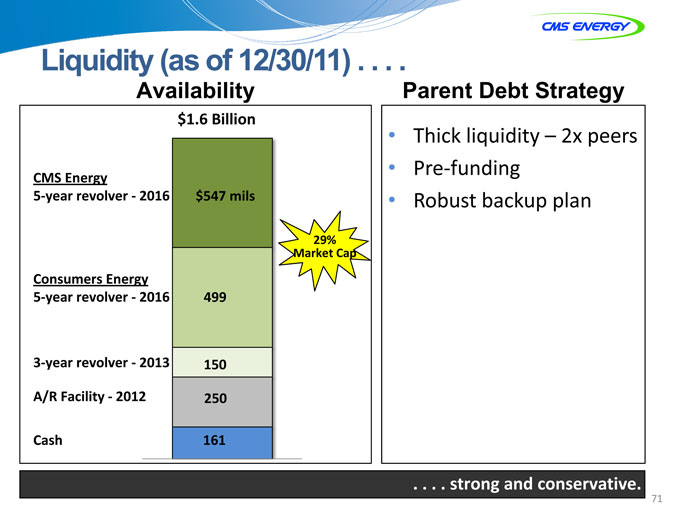
Liquidity (as of 12/30/11) .
Availability
$1.6 Billion
CMS Energy
5? year revolver 2016 ? $547 mils
29% Market Cap
Consumers Energy
5? year revolver 2016 ? 499
3? year revolver 2013 ? 150
A/R Facility 2012 ? 250
Cash 161
Parent Debt Strategy
Thick liquidity – 2x peers Pre? funding Robust backup plan
. . . . strongtrong and conservative.
71
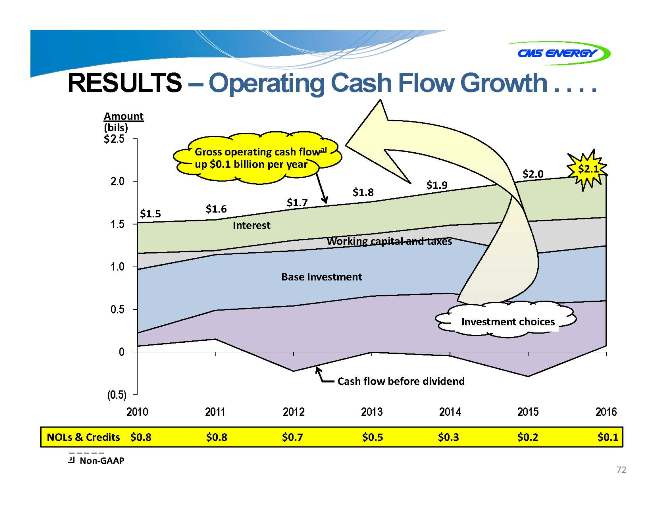
RESULTS – Operating Cash Flow Growth . . . .
Amount (bils) $2.5
Gross operating cash flowa up $0.1 billion per year
$2.1
$2.0
2.0 $1.9
$1.8
$1.7
$1.6
1.5 $1.5
Interest
Working capital and taxes
1.0
Base Investment
0.5
Investment choices
0.0
Cash flow before dividend
(0.5)
2010 2011 2012 2013 2014 2015 2016
NOLs & Credits $0.8 $0.8 $0.7 $0.5 $0.3 $0.2 $0.1
a Non? GAAP
72
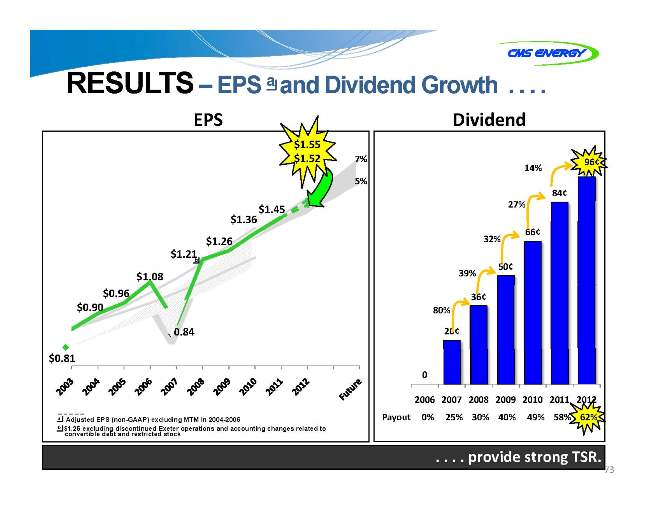
RESULTS– EPS a and Dividend Growth . . . .
EPS
$1.55
$1.52 7% 5%
$1.45
$1.36
$1.26
$1.21
b
$1.08
$0.96
$0.90
$0.84
$0.81
a Adjusted EPS (non-GAAP) excluding MTM in 2004-2006 b $1.25 excluding discontinued Exeter operations and accounting changes related to convertible debt and restricted stock
Dividend
96¢ 14%
84¢ 27%
32% 66¢
50¢ 39%
36¢ 80%
20¢
0
2006 2007 2008 2009 2010 2011 2012
Payout 0% 25% 30% 40% 49% 58% 62%
. . . . providerovide strong TSR.
73
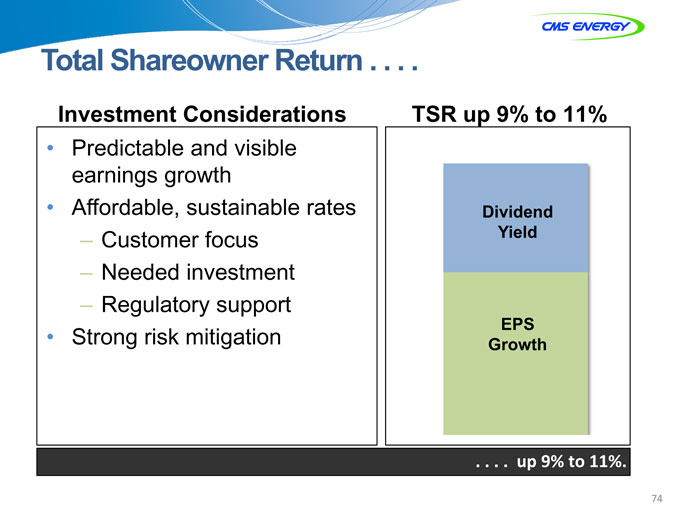
Total Shareowner Return . . . .
Investment Considerations
Predictable and visible earnings growth Affordable, sustainable rates
– Customer focus
– Needed investment
– Regulatory support Strong risk mitigation
TSR up 9% to 11%
Dividend Yield
EPS Growth
. . . . upp 9% to 11%.
74


APPENDIX
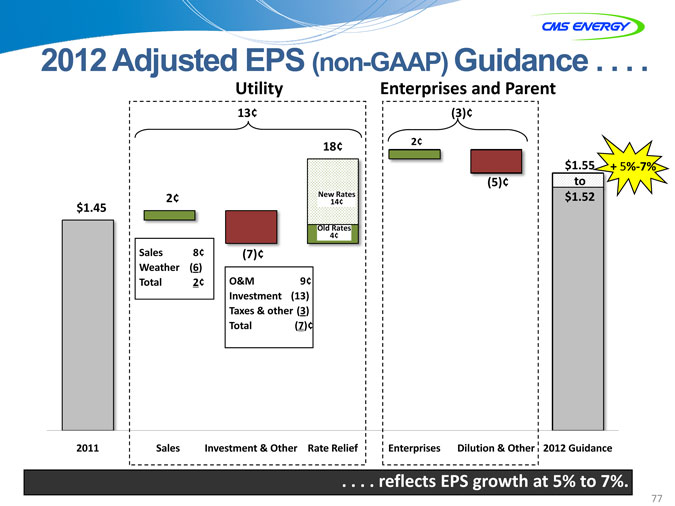
2012 Adjusted EPS (non-GAAP) Guidance . . . .
Utility Enterprises and Parent
13¢
18¢
$1.45
Old Rates 4¢
Sales 8¢ (7)¢ Weather (6)
Total 2¢ O&M 9¢ Investment (13) Taxes & other (3) Total (7)¢
2011 Sales Investment & Other Rate Relief
$1.55 + 5%? 7% (5)¢ to
$1.52
Enterprises Dilution & Other 2012 Guidance
. . . . reflects EPS growth at 5% to 7%.
77
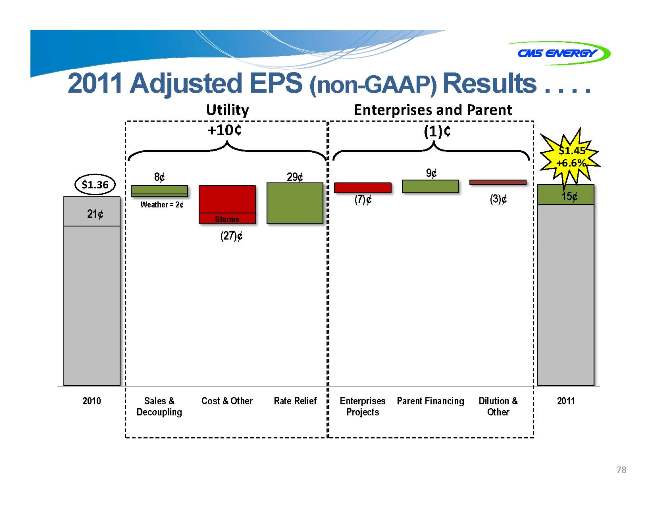
2011 Adjusted EPS (non-GAAP) Results . . . .
Utility +10¢
$1.36
Weather = 2¢
21¢
Storms
2010 Sales & Cost & Other Rate Relief Decoupling
Enterprises and Parent (1)¢
$1.45
9¢ +6.6%
Enterprises Parent Financing Dilution & 2011 Projects Other
78
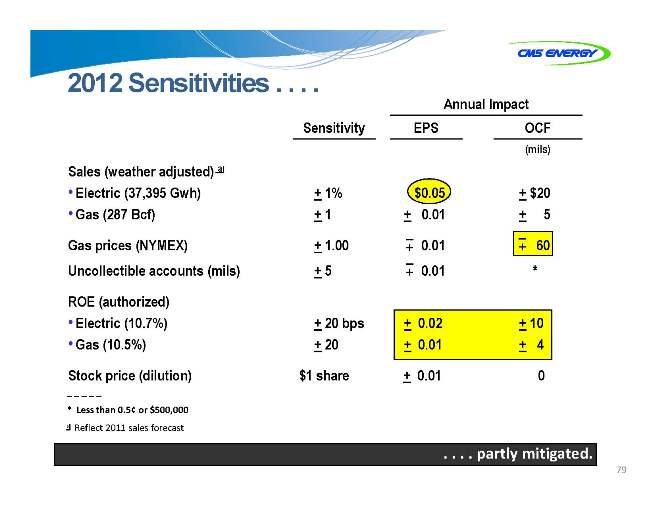
2012 Sensitivities . . . .
Annual Impact Sensitivity EPS OCF
(mils)
Sales (weather adjusted) a
• Electric (37,395 Gwh) + 1% $0.05 + $20
• Gas (287 Bcf) + 1 + 0.01 + 5 Gas prices (NYMEX) + 1.00 –+ 0.01 –+ 60 Uncollectible accounts (mils) + 5 –+ 0.01 * ROE (authorized)
• Electric (10.7%) + 20 bps + 0.02 + 10
• Gas (10.5%) + 20 + 0.01 + 4 Stock price (dilution) $1 share + 0.01 0
* | | Less than 0.5¢ or $500,000 a Reflect 2011 sales forecast |
. . . . partly mitigated.
79
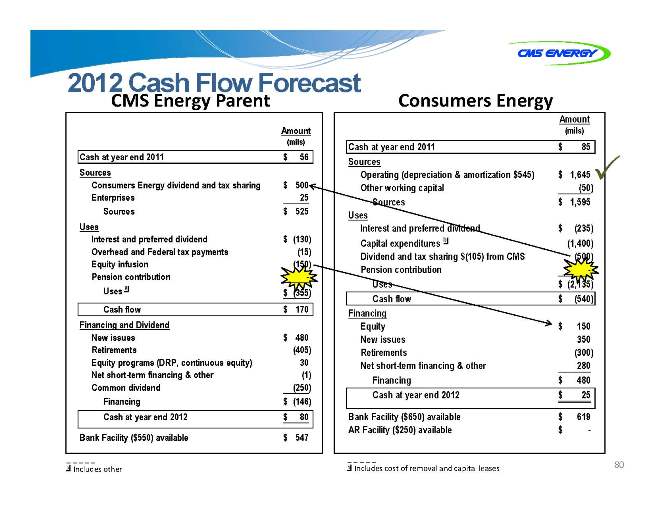
2012 CMS Cash Energy Flow Parent Forecast
Consumers Energy
Amount (mils) Cash at year end 2011 $ 56 Sources Consumers Energy dividend and tax sharing $ 500 Enterprises 25 Sources $ 525 Uses Interest and preferred dividend $ (130) Overhead and Federal tax payments (15) Equity infusion (150) Pension contribution -Uses a $ (355) Cash flow $ 170 Financing and Dividend New issues $ 480 Retirements (405) Equity programs (DRP, continuous equity) 30 Net short-term financing & other (1) Common dividend (250) Financing $ (146) Cash at year end 2012 $ 80
Bank Facility ($550) available $ 547
a Includes other
Amount (mils) Cash at year end 2011 $ 85 Sources Operating (depreciation & amortization $545) $ 1,645 Other working capital (50) Sources $ 1,595 Uses Interest and preferred dividend $ (235) Capital expenditures b (1,400) Dividend and tax sharing $(105) from CMS (500) Pension contribution -Uses $ (2,135) Cash flow $ (540) Financing Equity $ 150 New issues 350 Retirements (300) Net short-term financing & other 280 Financing $ 480 Cash at year end 2012 $ 25
Bank Facility ($650) available $ 619 AR Facility ($250) available $ -
b Includes cost of removal and capital leases
80
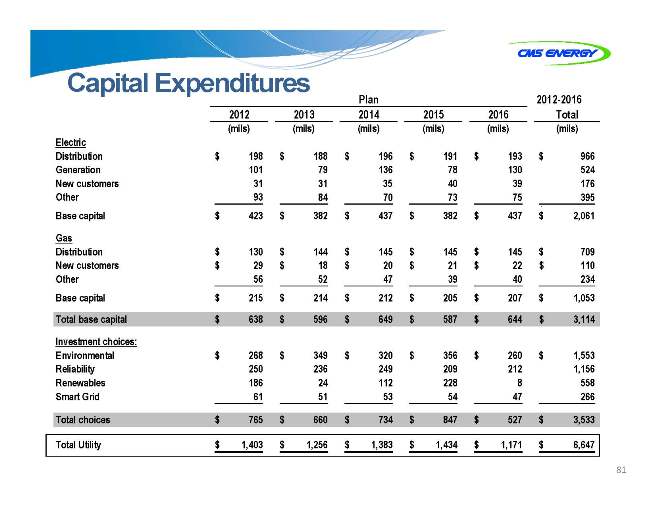
Capital Expenditures
Plan 2012-2016 2012 2013 2014 2015 2016 Total (mils) (mils) (mils) (mils) (mils) (mils) Electric Distribution $ 198 $ 188 $ 196 $ 191 $ 193 $ 966 Generation 101 79 136 78 130 524 New customers 31 31 35 40 39 176 Other 93 84 70 73 75 $ 395 Base capital $ 423 $ 382 $ 437 $ 382 $ 437 $ 2,061 Gas Distribution $ 130 $ 144 $ 145 $ 145 $ 145 $ 709 New customers $ 29 $ 18 $ 20 $ 21 $ 22 $ 110 Other 56 52 47 39 40 234 Base capital $ 215 $ 214 $ 212 $ 205 $ 207 $ 1,053 Total base capital $ 638 $ 596 $ 649 $ 587 $ 644 $ 3,114 Investment choices: Environmental $ 268 $ 349 $ 320 $ 356 $ 260 $ 1,553 Reliability 250 236 249 209 212 1,156 Renewables 186 24 112 228 8 558 Smart Grid 61 51 53 54 47 266
Total choices $ 765 $ 660 $ 734 $ 847 $ 527 $ 3,533
Total Utility $ 1,403 $ 1,256 $ 1,383 $ 1,434 $ 1,171 $ 6,647
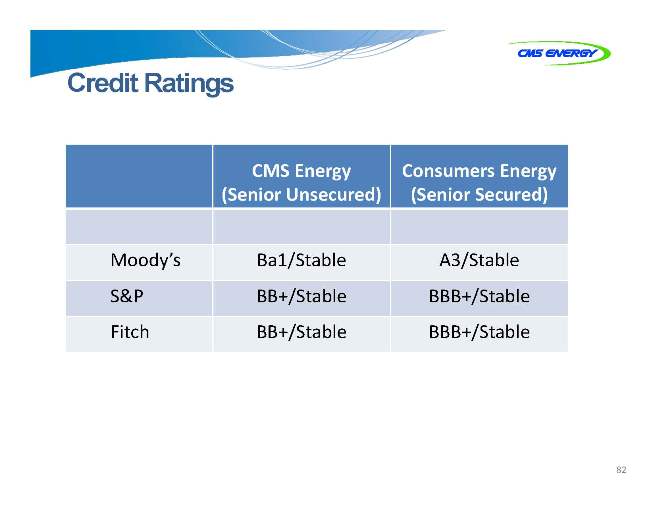
Credit Ratings
CMS Energy Consumers Energy (Senior Unsecured) (Senior Secured)
Moody’s Ba1/Stable A3/Stable S&P BB+/Stable BBB+/Stable Fitch BB+/Stable BBB+/Stable
82
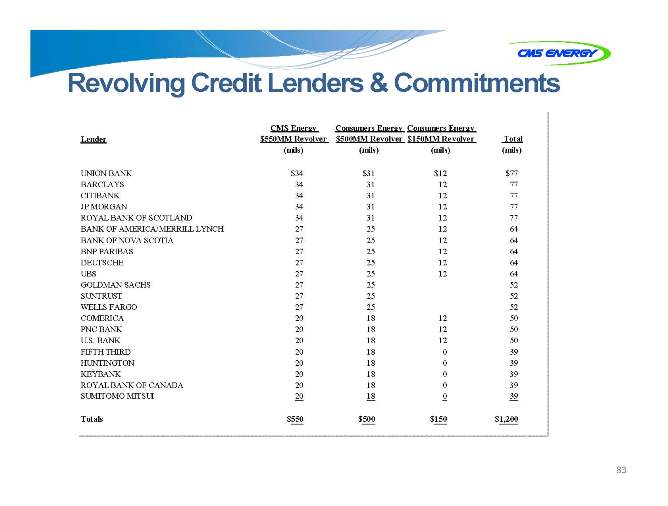
Revolving Credit Lenders & Commitments
CMS Energy Consumers Energy Consumers Energy
Lender $550MM Revolver $500MM Revolver $150MM Revolver Total (mils) (mils) (mils) (mils)
UNION BANK $34 $31 $12 $77 BARCLAYS 34 31 12 77 CITIBANK 34 31 12 77 JP MORGAN 34 31 12 77 ROYAL BANK OF SCOTLAND 34 31 12 77 BANK OF AMERICA/MERRILL LYNCH 27 25 12 64 BANK OF NOVA SCOTIA 27 25 12 64 BNP PARIBAS 27 25 12 64 DEUTSCHE 27 25 12 64 UBS 27 25 12 64
GOLDMAN SACHS 27 25 52 SUNTRUST 27 25 52 WELLS FARGO 27 25 52 COMERICA 20 18 12 50 PNC BANK 20 18 12 50 U.S. BANK 20 18 12 50 FIFTH THIRD 20 18 0 39 HUNTINGTON 20 18 0 39 KEYBANK 20 18 0 39 ROYAL BANK OF CANADA 20 18 0 39 SUMITOMO MITSUI 20 18 0 39
Totals $550 $500 $150 $1,200
83

GAAP RECONCILIATION
CMS Energy
Reconciliation of Gross Operating Cash Flow to GAAP Operating Activities
(unaudited)
(mils)
| | | | | | | | | | | | | | | | | | | | | | | | | | | | | | | | |
| | | 2009
| | | 2010
| | | 2011
| | | 2012
| | | 2013
| | | 2014
| | | 2015
| | | 2016
| |
Consumers Operating Income + Depreciation & Amortization | | $ | 1,248 | | | $ | 1,498 | | | $ | 1,527 | | | $ | 1,645 | | | $ | 1,735 | | | $ | 1,860 | | | $ | 1,976 | | | $ | 2,051 | |
Enterprises Project Cash Flows | | | 16 | | | | 39 | | | | 24 | | | | 25 | | | | 27 | | | | 33 | | | | 35 | | | | 35 | |
| | |
|
|
| |
|
|
| |
|
|
| |
|
|
| |
|
|
| |
|
|
| |
|
|
| |
|
|
|
Gross Operating Cash Flow | | $ | 1,264 | | | $ | 1,537 | | | $ | 1,551 | | | $ | 1,670 | | | $ | 1,762 | | | $ | 1,893 | | | $ | 2,011 | | | $ | 2,086 | |
Other operating activities including taxes, interest payments and working capital | | | (416 | ) | | | (578 | ) | | | (382 | ) | | | (420 | ) | | | (412 | ) | | | (443 | ) | | | (756 | ) | | | (776 | ) |
| | |
|
|
| |
|
|
| |
|
|
| |
|
|
| |
|
|
| |
|
|
| |
|
|
| |
|
|
|
Net cash provided by operating activities | | $ | 848 | | | $ | 959 | | | $ | 1,169 | | | $ | 1,250 | | | $ | 1,350 | | | $ | 1,450 | | | $ | 1,255 | | | $ | 1,310 | |
| | |
|
|
| |
|
|
| |
|
|
| |
|
|
| |
|
|
| |
|
|
| |
|
|
| |
|
|
|
2009-16 OCF
CMS ENERGY CORPORATION
Earnings Per Share By Year GAAP Reconciliation
(Unaudited)
| | | | | | | | | | | | | | | | | | | | | | | | | | | | | | | | | | | | |
| | | 2003
| | | 2004
| | | 2005
| | | 2006
| | | 2007
| | | 2008
| | | 2009
| | | 2010
| | | 2011
| |
Reported earnings (loss) per share - GAAP | | | ($0.30 | ) | | | $0.64 | | | | ($0.44 | ) | | | ($0.41 | ) | | | ($1.02 | ) | | $ | 1.20 | | | $ | 0.91 | | | $ | 1.28 | | | $ | 1.58 | |
| | |
|
|
| |
|
|
| |
|
|
| |
|
|
| |
|
|
| |
|
|
| |
|
|
| |
|
|
| |
|
|
|
After-tax items: | | | | | | | | | | | | | | | | | | | | | | | | | | | | | | | | | | | | |
Electric and gas utility | | | 0.21 | | | | (0.39 | ) | | | — | | | | — | | | | (0.07 | ) | | | 0.05 | | | | 0.33 | | | | 0.03 | | | | 0.00 | |
Enterprises | | | 0.74 | | | | 0.62 | | | | 0.04 | | | | (0.02 | ) | | | 1.25 | | | | (0.02 | ) | | | 0.09 | | | | (0.03 | ) | | | (0.11 | ) |
Corporate interest and other | | | 0.16 | | | | (0.03 | ) | | | 0.04 | | | | 0.27 | | | | (0.32 | ) | | | (0.02 | ) | | | 0.01 | | | | * | | | | (0.01 | ) |
Discontinued operations (income) loss | | | (0.16 | ) | | | 0.02 | | | | (0.07 | ) | | | (0.03 | ) | | | 0.40 | | | | (* | ) | | | (0.08 | ) | | | 0.08 | | | | (0.01 | ) |
Asset impairment charges, net | | | — | | | | — | | | | 1.82 | | | | 0.76 | | | | 0.60 | | | | — | | | | — | | | | — | | | | — | |
Cumulative accounting changes | | | 0.16 | | | | 0.01 | | | | — | | | | — | | | | — | | | | — | | | | — | | | | — | | | | — | |
| | |
|
|
| |
|
|
| |
|
|
| |
|
|
| |
|
|
| |
|
|
| |
|
|
| |
|
|
| |
|
|
|
Adjusted earnings per share, including MTM - non-GAAP | | $ | 0.81 | | | $ | 0.87 | | | $ | 1.39 | | | $ | 0.57 | | | $ | 0.84 | | | $ | 1.21 | (a) | | $ | 1.26 | | | $ | 1.36 | | | $ | 1.45 | |
Mark-to-market impacts | | | | | | | 0.03 | | | | (0.43 | ) | | | 0.51 | | | | | | | | | | | | | | | | | | | | | |
| | |
|
|
| |
|
|
| |
|
|
| |
|
|
| |
|
|
| |
|
|
| |
|
|
| |
|
|
| |
|
|
|
Adjusted earnings per share, excluding MTM - non-GAAP | | | NA | | | $ | 0.90 | | | $ | 0.96 | | | $ | 1.08 | | | | NA | | | | NA | | | | NA | | | | NA | | | | NA | |
| | |
|
|
| |
|
|
| |
|
|
| |
|
|
| |
|
|
| |
|
|
| |
|
|
| |
|
|
| |
|
|
|
| * | | Less than $500 thousand or $0.01 per share. |
| (a) | | $1.25 excluding discontinued Exeter operations and accounting changes related to convertible debt and restricted stock. |
2003-11 EPS
CMS ENERGY CORPORATION
Earnings By Quarter and Year GAAP Reconciliation
(Unaudited)
| | | | | | | | | | | | | | | | | | | | |
(In millions, except per share amounts)
| | 2010
| |
| | | 1Q
| | | 2Q
| | | 3Q
| | | 4Q
| | | YTD Dec
| |
Reported net income - GAAP | | $ | 85 | | | $ | 80 | | | $ | 134 | | | $ | 25 | | | $ | 324 | |
| | |
|
|
| |
|
|
| |
|
|
| |
|
|
| |
|
|
|
After-tax items: | | | | | | | | | | | | | | | | | | | | |
Electric and gas utility | | | 6 | | | | * | | | | — | | | | — | | | | 6 | |
Enterprises | | | 1 | | | | (31 | ) | | | (2 | ) | | | 24 | | | | (8 | ) |
Corporate interest and other | | | * | | | | * | | | | — | | | | * | | | | * | |
Discontinued operations loss | | | 1 | | | | 16 | | | | * | | | | 6 | | | | 23 | |
| | |
|
|
| |
|
|
| |
|
|
| |
|
|
| |
|
|
|
Adjusted income - non-GAAP | | $ | 93 | | | $ | 65 | | | $ | 132 | | | $ | 55 | | | $ | 345 | |
| | |
|
|
| |
|
|
| |
|
|
| |
|
|
| |
|
|
|
Average shares outstanding, basic | | | 228.0 | | | | 228.2 | | | | 229.0 | | | | 240.7 | | | | 231.5 | |
Average shares outstanding, diluted | | | 246.5 | | | | 247.6 | | | | 254.7 | | | | 258.4 | �� | | | 252.9 | |
| | |
|
|
| |
|
|
| |
|
|
| |
|
|
| |
|
|
|
Reported earnings per share - GAAP | | $ | 0.34 | | | $ | 0.32 | | | $ | 0.53 | | | $ | 0.09 | | | $ | 1.28 | |
| | |
|
|
| |
|
|
| |
|
|
| |
|
|
| |
|
|
|
After-tax items: | | | | | | | | | | | | | | | | | | | | |
Electric and gas utility | | | 0.03 | | | | * | | | | — | | | | — | | | | 0.03 | |
Enterprises | | | * | | | | (0.13 | ) | | | (0.01 | ) | | | 0.10 | | | | (0.03 | ) |
Corporate interest and other | | | * | | | | * | | | | — | | | | * | | | | * | |
Discontinued operations loss | | | 0.01 | | | | 0.07 | | | | * | | | | 0.02 | | | | 0.08 | |
| | |
|
|
| |
|
|
| |
|
|
| |
|
|
| |
|
|
|
Adjusted earnings per share - non-GAAP | | $ | 0.38 | | | $ | 0.26 | | | $ | 0.52 | | | $ | 0.21 | | | $ | 1.36 | |
| | |
|
|
| |
|
|
| |
|
|
| |
|
|
| |
|
|
|
| |
(In millions, except per share amounts)
| | 2011
| |
| | | 1Q
| | | 2Q
| | | 3Q
| | | 4Q
| | | YTD Dec
| |
Reported net income - GAAP | | $ | 135 | | | $ | 100 | | | $ | 139 | | | $ | 41 | | | $ | 415 | |
| | |
|
|
| |
|
|
| |
|
|
| |
|
|
| |
|
|
|
After-tax items: | | | | | | | | | | | | | | | | | | | | |
Electric and gas utility | | | — | | | | — | | | | — | | | | — | | | | — | |
Enterprises | | | * | | | | (28 | ) | | | * | | | | 1 | | | | (27 | ) |
Corporate interest and other | | | — | | | | (4 | ) | | | — | | | | * | | | | (4 | ) |
Discontinued operations income | | | (2 | ) | | | * | | | | * | | | | * | | | | (2 | ) |
| | |
|
|
| |
|
|
| |
|
|
| |
|
|
| |
|
|
|
Adjusted income - non-GAAP | | $ | 133 | | | $ | 68 | | | $ | 139 | | | $ | 42 | | | $ | 382 | |
| | |
|
|
| |
|
|
| |
|
|
| |
|
|
| |
|
|
|
Average shares outstanding, basic | | | 250.0 | | | | 250.3 | | | | 251.3 | | | | 251.7 | | | | 250.8 | |
Average shares outstanding, diluted | | | 261.7 | | | | 261.9 | | | | 263.9 | | | | 265.5 | | | | 263.4 | |
| | |
|
|
| |
|
|
| |
|
|
| |
|
|
| |
|
|
|
Reported earnings per share - GAAP | | $ | 0.52 | | | $ | 0.38 | | | $ | 0.53 | | | $ | 0.15 | | | $ | 1.58 | |
| | |
|
|
| |
|
|
| |
|
|
| |
|
|
| |
|
|
|
After-tax items: | | | | | | | | | | | | | | | | | | | | |
Electric and gas utility | | | — | | | | — | | | | — | | | | — | | | | — | |
Enterprises | | | * | | | | (0.11 | ) | | | * | | | | * | | | | (0.11 | ) |
Corporate interest and other | | | — | | | | (0.01 | ) | | | — | | | | * | | | | (0.01 | ) |
Discontinued operations income | | | (0.01 | ) | | | * | | | | * | | | | * | | | | (0.01 | ) |
| | |
|
|
| |
|
|
| |
|
|
| |
|
|
| |
|
|
|
Adjusted earnings per share - non-GAAP | | $ | 0.51 | | | $ | 0.26 | | | $ | 0.53 | | | $ | 0.15 | | | $ | 1.45 | |
| | |
|
|
| |
|
|
| |
|
|
| |
|
|
| |
|
|
|
Note: Year-to-date (YTD) EPS may not equal sum of quarters due to share count differences.
* | | Less than $500 thousand or $0.01 per share. |
2011 A-1
CMS Energy Corporation
Earnings Segment Results GAAP Reconciliation
(Unaudited)
| | | | | | | | | | | | | | | | |
| | | Three Months Ended
| | | Twelve Months Ended
| |
December 31
| | 2011
| | | 2010
| | | 2011
| | | 2010
| |
Electric Utility | | | | | | | | | | | | | | | | |
Reported | | $ | 0.09 | | | $ | 0.08 | | | $ | 1.27 | | | $ | 1.20 | |
Downsizing Program | | | — | | | | — | | | | — | | | | 0.02 | |
| | |
|
|
| |
|
|
| |
|
|
| |
|
|
|
Adjusted | | $ | 0.09 | | | $ | 0.08 | | | $ | 1.27 | | | $ | 1.22 | |
| | |
|
|
| |
|
|
| |
|
|
| |
|
|
|
Gas Utility | | | | | | | | | | | | | | | | |
Reported | | $ | 0.16 | | | $ | 0.22 | | | $ | 0.49 | | | $ | 0.50 | |
Downsizing Program | | | — | | | | — | | | | — | | | | 0.01 | |
| | |
|
|
| |
|
|
| |
|
|
| |
|
|
|
Adjusted | | $ | 0.16 | | | $ | 0.22 | | | $ | 0.49 | | | $ | 0.51 | |
| | |
|
|
| |
|
|
| |
|
|
| |
|
|
|
Enterprises | | | | | | | | | | | | | | | | |
Reported | | $ | (0.01 | ) | | $ | (0.07 | ) | | $ | 0.13 | | | $ | 0.14 | |
Tax Changes | | | — | | | | — | | | | (0.11 | ) | | | — | |
Asset Sales (Gains) Losses and Other | | | * | | | | 0.10 | | | | * | | | | (0.03 | ) |
| | |
|
|
| |
|
|
| |
|
|
| |
|
|
|
Adjusted | | $ | (0.01 | ) | | $ | 0.03 | | | $ | 0.02 | | | $ | 0.11 | |
| | |
|
|
| |
|
|
| |
|
|
| |
|
|
|
Corporate Interest and Other | | | | | | | | | | | | | | | | |
Reported | | $ | (0.09 | ) | | $ | (0.12 | ) | | $ | (0.32 | ) | | $ | (0.48 | ) |
Tax Changes | | | — | | | | — | | | | (0.01 | ) | | | — | |
Asset Sales Gains and Other | | | * | | | | * | | | | * | | | | * | |
| | |
|
|
| |
|
|
| |
|
|
| |
|
|
|
Adjusted | | $ | (0.09 | ) | | $ | (0.12 | ) | | $ | (0.33 | ) | | $ | (0.48 | ) |
| | |
|
|
| |
|
|
| |
|
|
| |
|
|
|
Discontinued Operations | | | | | | | | | | | | | | | | |
Reported | | $ | * | | | $ | (0.02 | ) | | $ | 0.01 | | | $ | (0.08 | ) |
Discontinued Operations (Income) Loss | | | ( | *) | | | 0.02 | | | | (0.01 | ) | | | 0.08 | |
| | |
|
|
| |
|
|
| |
|
|
| |
|
|
|
Adjusted | | $ | — | | | $ | — | | | $ | — | | | $ | — | |
| | |
|
|
| |
|
|
| |
|
|
| |
|
|
|
Totals | | | | | | | | | | | | | | | | |
Reported | | $ | 0.15 | | | $ | 0.09 | | | $ | 1.58 | | | $ | 1.28 | |
Discontinued Operations (Income) Loss | | | ( | *) | | | 0.02 | | | | (0.01 | ) | | | 0.08 | |
Downsizing Program | | | — | | | | — | | | | — | | | | 0.03 | |
Tax Changes | | | — | | | | — | | | | (0.12 | ) | | | — | |
Asset Sales (Gains) Losses and Other | | | * | | | | 0.10 | | | | * | | | | (0.03 | ) |
| | |
|
|
| |
|
|
| |
|
|
| |
|
|
|
Adjusted | | $ | 0.15 | | | $ | 0.21 | | | $ | 1.45 | | | $ | 1.36 | |
| | |
|
|
| |
|
|
| |
|
|
| |
|
|
|
Average Common Shares Outstanding - Diluted (in millions) | | | 265.5 | | | | 258.4 | | | | 263.4 | | | | 252.9 | |
| | |
|
|
| |
|
|
| |
|
|
| |
|
|
|
* | | Less than $0.01 per share. |
2011 A-2
Consumers Energy
2011 Cash Flow GAAP Reconciliation (in millions) (unaudited)
| | | | | | | | | | | | | | | | | | | | | | | | | | | | | | | | | | | | | | |
| | | | | | Reclassifications From Sources and Uses to Statement of Cash Flows
| | | Consolidated Statements of Cash Flows
|
Presentation Sources and Uses
| | | Tax
Sharing
Operating
| | | Interest
Payments
as Operating
| | | Other Working
Capital
as Investing
| | | Capital
Lease Pymts
as Financing
| | | Securitization
Debt Pymts
as Financing
| | | Preferred
Dividends
as Financing
| | | Common
Dividends
as Financing
| | |
Description
| | non-GAAP
Amount
| | | | | | | | | | GAAP
Amount
| | | Description
|
Cash at year end 2010 | | $ | 71 | | | $ | — | | | $ | — | | | $ | — | | | $ | — | | | $ | — | | | $ | — | | | $ | — | | | $ | 71 | | | Cash at year end 2010 |
Sources | | | | | | | | | | | | | | | | | | | | | | | | | | | | | | | | | | | | | | |
Operating | | $ | 1,527 | | | | | | | | | | | | | | | | | | | | | | | | | | | | | | | | | | | |
Other working capital | | | 219 | | | | | | | | | | | | | | | | | | | | | | | | | | | | | | | | | | | Net cash provided by operating activities |
| | |
|
|
| |
|
|
| |
|
|
| |
|
|
| |
|
|
| |
|
|
| |
|
|
| |
|
|
| |
|
|
| |
Sources | | $ | 1,746 | | | $ | 23 | | | $ | (231 | ) | | $ | (276 | ) | | $ | 24 | | | $ | 37 | | | $ | — | | | $ | — | | | $ | 1,323 | | |
Uses | | | | | | | | | | | | | | | | | | | | | | | | | | | | | | | | | | | | | | |
Interest and preferred dividends | | $ | (233 | ) | | | | | | | | | | | | | | | | | | | | | | | | | | | | | | | | | | |
Pension Contribution | | | (242 | ) | | | | | | | | | | | — | | | | | | | | | | | | | | | | | | | | | | | |
Capital expenditures | | | (985 | ) | | | | | | | | | | | — | | | | | | | | | | | | | | | | | | | | | | | |
Dividends/tax sharing to CMS | | | (351 | ) | | | | | | | | | | | | | | | | | | | | | | | | | | | | | | | | | | Net cash provided by investing activities |
| | |
|
|
| |
|
|
| |
|
|
| |
|
|
| |
|
|
| |
|
|
| |
|
|
| |
|
|
| |
|
|
| |
Uses | | $ | (1,811 | ) | | $ | (23 | ) | | $ | 231 | | | $ | 276 | | | $ | — | | | $ | — | | | $ | 2 | | | $ | 374 | | | $ | (951 | ) | |
| | |
|
|
| |
|
|
| |
|
|
| |
|
|
| |
|
|
| |
|
|
| |
|
|
| |
|
|
| |
|
|
| | |
Cash flow | | $ | (65 | ) | | $ | — | | | $ | — | | | $ | — | | | $ | 24 | | | $ | 37 | | | $ | 2 | | | $ | 374 | | | $ | 372 | | | Cash flow from operating and investing activities |
| | | | | | | | | | | | | | | | | | | | | | | | | | | | | | | | | | | | | | |
Financing | | | | | | | | | | | | | | | | | | | | | | | | | | | | | | | | | | | | | | |
Equity | | $ | 125 | | | | | | | | | | | | | | | | | | | | | | | | | | | | | | | | | | | |
New Issues | | | — | | | | | | | | | | | | | | | | | | | | | | | | | | | | | | | | | | | |
Retirements | | | — | | | | | | | | | | | | | | | | | | | | | | | | | | | | | | | | | | | |
Net short-term financing & other | | | (46 | ) | | | | | | | | | | | | | | | | | | | | | | | | | | | | | | | | | | Net cash provided by financing activities |
| | |
|
|
| |
|
|
| |
|
|
| |
|
|
| |
|
|
| |
|
|
| |
|
|
| |
|
|
| |
|
|
| |
Financing | | $ | 79 | | | $ | — | | | $ | — | | | $ | — | | | $ | (24 | ) | | $ | (37 | ) | | $ | (2 | ) | | $ | (374 | ) | | $ | (358 | ) | |
| | |
|
|
| |
|
|
| |
|
|
| |
|
|
| |
|
|
| |
|
|
| |
|
|
| |
|
|
| |
|
|
| | |
Net change in cash | | $ | 14 | | | $ | — | | | $ | — | | | $ | — | | | $ | — | | | $ | — | | | $ | — | | | $ | — | | | $ | 14 | | | Net change in cash |
| | |
|
|
| |
|
|
| |
|
|
| |
|
|
| |
|
|
| |
|
|
| |
|
|
| |
|
|
| |
|
|
| | |
Cash at year end 2011 | | $ | 85 | | | $ | — | | | $ | — | | | $ | — | | | $ | — | | | $ | — | | | $ | — | | | $ | — | | | $ | 85 | | | Cash at year end 2011 |
| | |
|
|
| |
|
|
| |
|
|
| |
|
|
| |
|
|
| |
|
|
| |
|
|
| |
|
|
| |
|
|
| | |
2011 A-3
CMS Energy Parent
2011 Cash Flow GAAP Reconciliation (in millions) (unaudited)
| | | | | | | | | | | | | | | | | | | | | | | | | | | | | | | | | | |
| | | | | | Reclassifications From Sources and Uses to Statement of Cash Flows
| | | | | | |
Presentation Sources and Uses
| | | Interest
Payments
as Operating
| | | Overheads &
Tax Payments
as Operating
| | | Other
Uses (a)
as Operating
| | | Financing
as Operating
and
Investing
| | | Other
and
Rounding
| | | Cash From
Consolidated
Companies
| | | Consolidated Statements of Cash Flows
|
Description
| | non-GAAP
Amount
| | | | | | | | | GAAP
Amount
| | | Description
|
Cash at year end 2010 | | $ | 163 | | | $ | — | | | $ | — | | | $ | — | | | $ | — | | | $ | — | | | $ | 13 | | | $ | 176 | | | Cash at year end 2010 |
Sources | | | | | | | | | | | | | | | | | | | | | | | | | | | | | | | | | | |
Consumers Energy dividends/tax sharing | | $ | 351 | | | | | | | | | | | | | | | | | | | | | | | | | | | | | | | |
Enterprises | | | 24 | | | | | | | | | | | | | | | | — | | | | — | | | | | | | | | | | Net cash provided by operating activities |
| | |
|
|
| |
|
|
| |
|
|
| |
|
|
| |
|
|
| |
|
|
| |
|
|
| |
|
|
| |
Sources | | $ | 375 | | | $ | (127 | ) | | $ | (23 | ) | | $ | (7 | ) | | $ | (9 | ) | | $ | — | | | $ | 11 | | | $ | 220 | | |
Uses | | | | | | | | | | | | | | | | | | | | | | | | | | | | | | | | | | |
Interest and preferred dividends | | $ | (127 | ) | | | | | | | | | | | | | | | | | | | | | | | | | | | | | | |
Overhead and Federal tax payments | | | (23 | ) | | | | | | | | | | | | | | | | | | | | | | | | | | | | | | |
Equity infusions | | | (125 | ) | | | | | | | | | | | | | | | | | | | | | | | | | | | | | | |
Pension contribution | | | (8 | ) | | | | | | | | | | | | | | | | | | | | | | | | | | | | | | Net cash provided by investing activities |
| | |
|
|
| |
|
|
| |
|
|
| |
|
|
| |
|
|
| |
|
|
| |
|
|
| |
|
|
| |
Uses (a) | | $ | (283 | ) | | $ | 127 | | | $ | 23 | | | $ | 7 | | | $ | (4 | ) | | $ | — | | | $ | (102 | ) | | $ | (232 | ) | |
| | |
|
|
| |
|
|
| |
|
|
| |
|
|
| |
|
|
| |
|
|
| |
|
|
| |
|
|
| | |
Cash flow | | $ | 92 | | | $ | — | | | $ | — | | | $ | — | | | $ | (13 | ) | | $ | — | | | $ | (91 | ) | | $ | (12 | ) | | Cash flow from operating and investing activities |
| | | | | | | | | | | | | | | | | | | | | | | | | | | | | | | | | | |
Financing and dividends | | | | | | | | | | | | | | | | | | | | | | | | | | | | | | | | | | |
New Issues | | $ | 250 | | | | | | | | | | | | | | | | | | | | | | | | | | | | | | | |
Retirements | | | (262 | ) | | | | | | | | | | | | | | | | | | | | | | | | | | | | | | |
Equity programs (DRP, continuous equity) | | | 29 | | | | | | | | | | | | | | | | | | | | | | | | | | | | | | | |
Net short-term financing & other | | | (5 | ) | | | | | | | | | | | | | | | | | | | | | | | | | | | | | | |
Common dividend | | | (211 | ) | | | | | | | | | | | | | | | | | | | | | | | | | | | | | | Net cash provided by financing activities |
| | |
|
|
| |
|
|
| |
|
|
| |
|
|
| |
|
|
| |
|
|
| |
|
|
| |
|
|
| |
Financing | | $ | (199 | ) | | $ | — | | | $ | — | | | $ | — | | | $ | 13 | | | $ | (2 | ) | | $ | 98 | | | $ | (90 | ) | |
| | |
|
|
| |
|
|
| |
|
|
| |
|
|
| |
|
|
| |
|
|
| |
|
|
| |
|
|
| | |
Net change in cash | | $ | (107 | ) | | $ | — | | | $ | — | | | $ | — | | | $ | — | | | $ | (2 | ) | | $ | 7 | | | $ | (102 | ) | | Net change in cash |
Change in Cash and Cash Equivalents | | | — | | | | — | | | | — | | | | — | | | | — | | | | 2 | | | | — | | | | 2 | | | Change in Cash and Cash Equivalents |
| | |
|
|
| |
|
|
| |
|
|
| |
|
|
| |
|
|
| |
|
|
| |
|
|
| |
|
|
| | |
Cash at year end 2011 | | $ | 56 | | | $ | — | | | $ | — | | | $ | — | | | $ | — | | | $ | — | | | $ | 20 | | | $ | 76 | | | Cash at year end 2011 |
| | |
|
|
| |
|
|
| |
|
|
| |
|
|
| |
|
|
| |
|
|
| |
|
|
| |
|
|
| | |
| (a) | | Includes other and roundings |
2011 A-4
Consolidated CMS Energy
2011 Consolidation of Consumers Energy and CMS Energy Parent Statements of Cash Flow (in millions) (unaudited)
| | | | | | | | | | | | | | | | | | | | | | |
| | | | | | | | | Eliminations/Reclassifications
to Arrive at the Consolidated
Statement of Cash Flows
| | | | | | |
Statements of Cash Flows
| | | Consumers Common Dividend as Financing
| | | Equity Infusions to Consumers
| | | | | | |
| | | Consumers Amount
| | | CMS Parent Amount
| | | | | Consolidated Statements of Cash Flows
|
Description
| | | | | | Amount
| | | Description
|
Cash at year end 2010 | | $ | 71 | | | $ | 176 | | | $ | — | | | $ | — | | | $ | 247 | | | Cash at year end 2010 |
Net cash provided by operating activities | | $ | 1,323 | | | $ | 220 | | | $ | (374 | ) | | $ | — | | | $ | 1,169 | | | Net cash provided by operating activities |
Net cash provided by investing activities | | | (951 | ) | | | (232 | ) | | | — | | | | 125 | | | | (1,058 | ) | | Net cash provided by investing activities |
| | |
|
|
| |
|
|
| |
|
|
| |
|
|
| |
|
|
| | |
Cash flow from operating and investing activities | | $ | 372 | | | $ | (12 | ) | | $ | (374 | ) | | $ | 125 | | | $ | 111 | | | Cash flow from operating and investing activities |
Net cash provided by financing activities | | $ | (358 | ) | | $ | (90 | ) | | $ | 374 | | | $ | (125 | ) | | $ | (199 | ) | | Net cash provided by financing activities |
| | |
|
|
| |
|
|
| |
|
|
| |
|
|
| |
|
|
| | |
Net change in cash | | $ | 14 | | | $ | (102 | ) | | $ | — | | | $ | — | | | $ | (88 | ) | | Net change in cash |
Change in Cash and Cash Equivalents | | | — | | | | 2 | | | | — | | | | — | | | | 2 | | | Decrease (Increase) in Cash and Cash Equivalents |
| | |
|
|
| |
|
|
| |
|
|
| |
|
|
| |
|
|
| | |
Cash at year end 2011 | | $ | 85 | | | $ | 76 | | | $ | — | | | $ | — | | | $ | 161 | | | Cash at year end 2011 |
| | |
|
|
| |
|
|
| |
|
|
| |
|
|
| |
|
|
| | |
2011 A-5
CMS Energy
Reconciliation of Gross Operating Cash Flow to GAAP Operating Activities
(unaudited)
(mils)
| | | | | | | | | | | | | | | | | | | | | | | | |
| | | 2004
| | | 2005
| | | 2006
| | | 2007
| | | 2008
| | | Five Year
Average
| |
Utility Operating Income + Depreciation & Amortization | | $ | 1,022 | | | $ | 899 | | | $ | 1,021 | | | $ | 1,085 | | | $ | 1,317 | | | $ | 1,069 | |
Enterprises Project Cash Flows | | | 131 | | | | 294 | | | | 154 | | | | (30 | ) | | | 28 | | | | 115 | |
| | |
|
|
| |
|
|
| |
|
|
| |
|
|
| |
|
|
| |
|
|
|
Gross Operating Cash Flow | | $ | 1,153 | | | $ | 1,193 | | | $ | 1,175 | | | $ | 1,055 | | | $ | 1,345 | | | $ | 1,184 | |
Other operating activies including taxes, interest payments and working capital | | | (800 | ) | | | (595 | ) | | | (487 | ) | | | (1,032 | ) | | | (788 | ) | | | (740 | ) |
| | |
|
|
| |
|
|
| |
|
|
| |
|
|
| |
|
|
| |
|
|
|
Net cash provided by operating activites | | $ | 353 | | | $ | 598 | | | $ | 688 | | | $ | 23 | | | $ | 557 | | | $ | 444 | |
| | |
|
|
| |
|
|
| |
|
|
| |
|
|
| |
|
|
| |
|
|
|
2004-2008 OCF
Consumers Energy
2012 Forecasted Cash Flow GAAP Reconciliation (in millions) (unaudited)
| | | | | | | | | | | | | | | | | | | | | | | | | | | | | | | | | | | | | | |
| | | | | | Reclassifications From Sources and Uses to Statement of Cash Flows
| | | | | | |
Presentation Sources and Uses
| | | Tax
Sharing
Operating
| | | Interest
Payments
as Operating
| | | Other
Working
Capital
as Investing
| | | Capital
Lease Pymts
as Financing
| | | Securitization
Debt Pymts
as Financing
| | | Preferred
Dividends
as Financing
| | | Common
Dividends
as Financing
| | | Consolidated Statements of Cash Flows
|
| | | non-GAAP | | | | | | | | | | GAAP | | | |
Description
| | Amount
| | | | | | | | | | Amount
| | | Description
|
Cash at year end 2011 | | $ | 85 | | | $ | — | | | $ | — | | | $ | — | | | $ | — | | | $ | — | | | $ | — | | | $ | — | | | $ | 85 | | | Cash at year end 2011 |
Sources | | | | | | | | | | | | | | | | | | | | | | | | | | | | | | | | | | | | | | |
Operating | | $ | 1,645 | | | | | | | | | | | | | | | | | | | | | | | | | | | | | | | | | | | |
Other working capital | | | (50 | ) | | | | | | | | | | | | | | | | | | | | | | | | | | | | | | | | | | Net cash provided by operating activities |
| | |
|
|
| |
|
|
| |
|
|
| |
|
|
| |
|
|
| |
|
|
| |
|
|
| |
|
|
| |
|
|
| |
Sources | | $ | 1,595 | | | $ | (105 | ) | | $ | (233 | ) | | $ | 9 | | | $ | 30 | | | $ | 39 | | | $ | — | | | $ | — | | | $ | 1,335 | | |
Uses | | | | | | | | | | | | | | | | | | | | | | | | | | | | | | | | | | | | | | |
Interest and preferred dividends | | $ | (235 | ) | | | | | | | | | | | | | | | | | | | | | | | | | | | | | | | | | | |
Capital expenditures | | | (1,400 | ) | | | | | | | | | | | | | | | | | | | | | | | | | | | | | | | | | | |
Dividends/tax sharing to CMS | | | (500 | ) | | | | | | | | | | | | | | | | | | | | | | | | | | | | | | | | | | Net cash provided by investing activities |
| | |
|
|
| |
|
|
| |
|
|
| |
|
|
| |
|
|
| |
|
|
| |
|
|
| |
|
|
| |
|
|
| |
Uses | | $ | (2,135 | ) | | $ | 105 | | | $ | 233 | | | $ | (9 | ) | | $ | — | | | $ | — | | | $ | 2 | | | $ | 395 | | | $ | (1,409 | ) | |
| | |
|
|
| |
|
|
| |
|
|
| |
|
|
| |
|
|
| |
|
|
| |
|
|
| |
|
|
| |
|
|
| | |
Cash flow | | $ | (540 | ) | | $ | — | | | $ | — | | | $ | — | | | $ | 30 | | | $ | 39 | | | $ | 2 | | | $ | 395 | | | $ | (74 | ) | | Cash flow from operating andinvesting activities |
| | | | | | | | | | | | | | | | | | | | | | | | | | | | | | | | | | | | | | |
Financing | | | | | | | | | | | | | | | | | | | | | | | | | | | | | | | | | | | | | | |
Equity | | $ | 150 | | | | | | | | | | | | | | | | | | | | | | | | | | | | | | | | | | | |
New Issues | | | 350 | | | | | | | | | | | | | | | | | | | | | | | | | | | | | | | | | | | |
Retirements | | | (300 | ) | | | | | | | | | | | | | | | | | | | | | | | | | | | | | | | | | | |
Net short-term financing & other | | | 280 | | | | | | | | | | | | | | | | | | | | | | | | | | | | | | | | | | | Net cash provided by financing activities |
| | |
|
|
| |
|
|
| |
|
|
| |
|
|
| |
|
|
| |
|
|
| |
|
|
| |
|
|
| |
|
|
| |
Financing | | $ | 480 | | | $ | — | | | $ | — | | | $ | — | | | $ | (30 | ) | | $ | (39 | ) | | $ | (2 | ) | | $ | (395 | ) | | $ | 14 | | |
| | |
|
|
| |
|
|
| |
|
|
| |
|
|
| |
|
|
| |
|
|
| |
|
|
| |
|
|
| |
|
|
| | |
Net change in cash | | $ | (60 | ) | | $ | — | | | $ | — | | | $ | — | | | $ | — | | | $ | — | | | $ | — | | | $ | — | | | $ | (60 | ) | | Net change in cash |
| | |
|
|
| |
|
|
| |
|
|
| |
|
|
| |
|
|
| |
|
|
| |
|
|
| |
|
|
| |
|
|
| | |
Cash at year end 2012 | | $ | 25 | | | $ | — | | | $ | — | | | $ | — | | | $ | — | | | $ | — | | | $ | — | | | $ | — | | | $ | 25 | | | Cash at year end 2012 |
| | |
|
|
| |
|
|
| |
|
|
| |
|
|
| |
|
|
| |
|
|
| |
|
|
| |
|
|
| |
|
|
| | |
2012 B-1
CMS Energy Parent
2012 Forecasted Cash Flow GAAP Reconciliation (in millions) (unaudited)
| | | | | | | | | | | | | | | | | | | | | | | | | | | | | | |
| | | | | | Reclassifications From Sources and Uses to Statement of Cash
Flows
| | | | | | |
Presentation Sources and Uses
| | | Interest
Payments
as Operating
| | | Overheads &
Tax
Payments
as Operating
| | | Other
Uses (a)
as Operating
| | | Financing
as Operating
| | | Cash From
Consolidated
Companies
| | | Consolidated Statements of Cash
Flows
|
Description
| | non-GAAP
Amount
| | | | | | | | GAAP
Amount
| | | Description
|
Cash at year end 2011 | | $ | 56 | | | $ | — | | | $ | — | | | $ | — | | | $ | — | | | $ | 20 | | | $ | 76 | | | Cash at year end 2011 |
Sources | | | | | | | | | | | | | | | | | | | | | | | | | | | | | | |
Consumers Energy dividends/tax sharing | | $ | 500 | | | | | | | | | | | | | | | | | | | | | | | | | | | |
Enterprises | | | 25 | | | | | | | | | | | | | | | | | | | | | | | | | | | Net cash provided byoperating activities |
| | |
|
|
| |
|
|
| |
|
|
| |
|
|
| |
|
|
| |
|
|
| |
|
|
| |
Sources | | $ | 525 | | | $ | (130 | ) | | $ | (15 | ) | | $ | (48 | ) | | $ | (35 | ) | | $ | 15 | | | $ | 312 | | |
Uses | | | | | | | | | | | | | | | | | | | | | | | | | | | | | | |
Interest and preferred dividends | | $ | (130 | ) | | | | | | | | | | | | | | | | | | | | | | | | | | |
Overhead and Federal tax payments | | | (15 | ) | | | | | | | | | | | | | | | | | | | | | | | | | | |
Equity infusions | | | (150 | ) | | | | | | | | | | | | | | | | | | | | | | | | | | Net cash provided by investing activities |
| | |
|
|
| |
|
|
| |
|
|
| |
|
|
| |
|
|
| |
|
|
| |
|
|
| |
Uses (a) | | $ | (355 | ) | | $ | 130 | | | $ | 15 | | | $ | 48 | | | $ | — | | | $ | (141 | ) | | $ | (303 | ) | |
| | |
|
|
| |
|
|
| |
|
|
| |
|
|
| |
|
|
| |
|
|
| |
|
|
| | |
Cash flow | | $ | 170 | | | $ | — | | | $ | — | | | $ | — | | | $ | (35 | ) | | $ | (126 | ) | | $ | 9 | | | Cash flow from operating and investing activities |
| | | | | | | | | | | | | | | | | | | | | | | | | | | | | | |
Financing and dividends | | | | | | | | | | | | | | | | | | | | | | | | | | | | | | |
New Issues | | $ | 480 | | | | | | | | | | | | | | | | | | | | | | | | | | | |
Retirements | | | (405 | ) | | | | | | | | | | | | | | | | | | | | | | | | | | |
Equity programs (DRP, continuous equity) | | | 30 | | | | | | | | | | | | | | | | | | | | | | | | | | | |
Net short-term financing & other | | | (1 | ) | | | | | | | | | | | | | | | | | | | | | | | | | | |
Common dividend | | | (250 | ) | | | | | | | | | | | | | | | | | | | | | | | | | | Net cash provided by financing activities |
| | |
|
|
| |
|
|
| |
|
|
| |
|
|
| |
|
|
| |
|
|
| |
|
|
| |
Financing | | $ | (146 | ) | | $ | — | | | $ | — | | | $ | — | | | $ | 35 | | | $ | 155 | | | $ | 44 | | |
| | |
|
|
| |
|
|
| |
|
|
| |
|
|
| |
|
|
| |
|
|
| |
|
|
| | |
Net change in cash | | $ | 24 | | | $ | — | | | $ | — | | | $ | — | | | $ | — | | | $ | 29 | | | $ | 53 | | | Net change in cash |
| | |
|
|
| |
|
|
| |
|
|
| |
|
|
| |
|
|
| |
|
|
| |
|
|
| | |
Cash at year end 2012 | | $ | 80 | | | $ | — | | | $ | — | | | $ | — | | | $ | — | | | $ | 49 | | | $ | 129 | | | Cash at year end 2012 |
| | |
|
|
| |
|
|
| |
|
|
| |
|
|
| |
|
|
| |
|
|
| |
|
|
| | |
(a) | | Includes other and roundings |
2012 B-2
Consolidated CMS Energy
2012 Forecasted Consolidation of Consumers Energy and CMS Energy Parent Statements of Cash Flow (in millions) (unaudited)
| | | | | | | | | | | | | | | | | | | | | | | | | | |
| | | | | | | | | Eliminations/Reclassifications to Arrive at
the Consolidated Statement of Cash Flows
| | | | | | |
Statements of Cash Flows
| | | Consumers
Common
Dividend
as Financing
| | | Consumers
Preferred
Dividend
as Operating
| | | Equity
Infusions to
Consumers
| | | | | | |
| | | Consumers
Amount
| | | CMS Parent
Amount
| | | | | | Consolidated Statements of Cash Flows
|
Description
| | | | | | | Amount
| | | Description
|
Cash at year end 2011 | | $ | 85 | | | $ | 76 | | | $ | — | | | $ | — | | | $ | — | | | $ | 161 | | | Cash at year end 2011 |
Net cash provided by operating activities | | $ | 1,335 | | | $ | 312 | | | $ | (395 | ) | | $ | (2 | ) | | $ | — | | | $ | 1,250 | | | Net cash provided by operating activities |
Net cash provided by investing activities | | | (1,409 | ) | | | (303 | ) | | | — | | | | — | | | | 150 | | | | (1,562 | ) | | Net cash provided by investing activities |
| | |
|
|
| |
|
|
| |
|
|
| |
|
|
| |
|
|
| |
|
|
| | |
Cash flow from | | $ | (74 | ) | | $ | 9 | | | $ | (395 | ) | | $ | (2 | ) | | $ | 150 | | | $ | (312 | ) | | Cash flow from |
operating and | | | | | | | | | | | | | | | | | | | | | | | | | | operating and |
investing activities | | | | | | | | | | | | | | | | | | | | | | | | | | investing activities |
Net cash provided by financing activities | | $ | 14 | | | $ | 44 | | | $ | 395 | | | $ | 2 | | | $ | (150 | ) | | $ | 305 | | | Net cash provided by financing activities |
| | |
|
|
| |
|
|
| |
|
|
| |
|
|
| |
|
|
| |
|
|
| | |
Net change in cash | | $ | (60 | ) | | $ | 53 | | | $ | — | | | $ | — | | | $ | — | | | $ | (7 | ) | | Net change in cash |
| | |
|
|
| |
|
|
| |
|
|
| |
|
|
| |
|
|
| |
|
|
| | |
Cash at year end 2012 | | $ | 25 | | | $ | 129 | | | $ | — | | | $ | — | | | $ | — | | | $ | 154 | | | Cash at year end 2012 |
| | |
|
|
| |
|
|
| |
|
|
| |
|
|
| |
|
|
| |
|
|
| | |
2012 B-3

BIOGRAPHIES

Consumers Energy
One Energy Plaza
Jackson, MI 49201
Jackson L. Hanson (Jack) is senior vice president of electric generation and
energy supply for Consumers Energy, the principal subsidiary of CMS Energy.
He was elected to this position in 2011.
Hanson has overall responsibility for the utility’s generating units, major
projects and construction, and environmental programs and compliance.
He also ensures energy supply resources are available and used economically
to serve Consumers Energy’s electric and natural gas resources.
Prior to his current role, Hanson was senior vice president of electric
generation from 2010 to 2011. He also served as vice president of generation
engineering and services and worked as the plant business manager for
Consumers Energy’s J.H. Campbell and J.R. Whiting Generating Complexes.
Before overseeing two of the company’s fossil-fuel generating facilities,
Hanson served as chief of staff for the generation organization and held several
leadership positions at the Palisades nuclear plant.
During a break in service from 2000 to 2003, Hanson served in various senior
management roles at the Rocky Flats Environmental Technology Site.
Hanson has a master’s degree in business administration from the University of
Notre Dame and a bachelor’s degree in mechanical engineering from the U.S.
Naval Academy.
Hanson left the U.S. Navy as a lieutenant after serving for five years prior to
joining Consumers Energy in 1983.
Jackson L. Hanson
Senior Vice President of
Generation and Energy Supply
Jackson L. Hanson
4/25/11

Consumers Energy
One Energy Plaza
Jackson, MI 49201
Daniel J. Malone
Senior Vice President of
Distribution and Customer
Operations
Daniel J. Malone is senior vice president of distribution and customer operations
for Consumers Energy, the principal subsidiary of CMS Energy. He was
elected to the position in May 2010.
Malone has overall responsibility for the company’s electric and gas distribution
systems, energy operations, customer operations, gas transmission and storage,
employee development and skilling, Smart Grid program implementation and
industrial safety. Energy operations is responsible for operating and maintaining
the electric and natural gas delivery systems that serve the utility’s customers.
Customer operations is responsible for the company’s revenue recovery,
customer services and energy optimization programs.
Malone joined Consumers Energy in 1984 as a graduate health physicist in the
radiological services department and has spent the majority of his career with
the company. From 2001 to 2006, he held leadership positions with Nuclear
Management Co., which operated Consumers Energy’s Palisades nuclear plant
in Covert, Mich.
In 2006, Malone rejoined Consumers Energy as manager of the equipment
services department. Later the same year, he was named site business manager
for the utility’s J.H. Campbell Generating Complex in Port Sheldon Township,
west of Grand Rapids, Mich.
Malone earned a bachelor’s degree in environmental science from Purdue
University and holds a nuclear senior reactor operator certification. In 2008, he
completed the Advanced Management Program at the Harvard Business School.
Daniel J. Malone
4/25/11

Consumers Energy
One Energy Plaza
Jackson, MI 49201
Patricia K. Poppe
Vice president of Customer
Experience and Operations
Patricia K. Poppe is vice president of customer experience and operations for
Consumers Energy, the principal subsidiary of CMS Energy. She was elected to
this position in January 2011.
Poppe leads Consumers Energy’s customer experience and operations department,
which includes customer call centers, billing and revenue recovery, energy
efficiency, the Smart Grid program, customer insights and quality, and
customer experience design and marketing.
Before joining Consumers Energy, Poppe served as director of regulated
marketing for energy optimization at DTE Energy. She also worked as director
of DTE Energy’s North Region Power Plants, overseeing five generating
facilities, and led a transformative effort and sustainable process improvement
program as director of enterprise performance excellence.
Prior to working for DTE Energy, Poppe held a variety of plant management
positions during her 15-year career at General Motors Co., including serving as
assistant plant manager of the Lansing Grand River assembly plant.
Poppe earned a master’s degree in management from the Stanford University
Graduate School of Business and received a bachelor’s degree and master’s
degree in industrial engineering from Purdue University.
Patricia K. Poppe
10/10/11
Consumers Energy
One Energy Plaza
Jackson, MI 49201
Ronn J. Rasmussen is vice president of rates and regulation for Consumers Energy, the principal subsidiary of CMS Energy. He was named to the position in 2006.
He previously was executive director of rates and business support for Consumers Energy’s gas and electric business units. He was responsible for managing the company’s regulatory strategy and rate case preparation and proceedings. In addition, he oversaw the company’s planning and budgeting process. Rasmussen also has held leadership positions in accounting, gas supply and rates.
Rasmussen graduated with a bachelor’s degree in accounting from Ferris State University. He joined Consumers Energy in 1978.
RONN J. RASMUSSEN
VICE PRESIDENT, RATES AND REGULATION
Ronn J. Rasmussen
12/15/09
CMS Energy
One Energy Plaza
Jackson, MI 49201
John G. Russell is president and chief executive officer of CMS Energy and its principal subsidiary, Consumers Energy, which serves 1.8 million electric customers and 1.7 million natural gas customers. The company has annual revenues of $6 billion, assets totaling $15.3 billion and 7,700 employees.
Prior to his current position, Russell was president and chief operating officer of Consumers Energy from 2004 to 2010. He also served as president of the electric utility until 2004. Previously, Russell was senior vice president of electric transmission and distribution and held several leadership positions in customer operations, electric restructuring and logistics management. During a break in service from 1985 to 1987, Russell managed the shipping operations for Meijer Inc.
Russell graduated from Michigan State University with a bachelor’s degree in business administration in 1980. In 1994, he completed the Program for Management Development at the Harvard Business School.
He is a member of the board of directors for CMS Energy and Consumers Energy, and Hubbell Incorporated.
He also serves on the boards of the Edison Electric Institute (EEI), the American Gas Association (AGA), the Business Leaders for Michigan, Grand Rapids-based The Right Place Inc., and the Michigan Chamber of Commerce.
John G. Russell
President and Chief exeCutive OffiCer — CMs energy and COnsuMers energy
John G. Russell
9/1/11
CMS Energy
One Energy Plaza
Jackson, MI 49201
Thomas J. Webb is executive vice president and chief financial officer of CMS Energy and its principal subsidiary, Consumers Energy. He was named to this position in 2002.
Webb also serves as chairman of the board of EnerBank USA, a nationwide provider of consumer loans.
Before joining CMS Energy, Webb had been executive vice president and chief financial officer for Kellogg Co. At Kellogg, he helped drive the purchase of Keebler Co., the largest acquisition in Kellogg’s history. He led the financing effort which included the largest bond offering to that date, $4.6 billion, in the history of the consumer-branded industry.
From 1996 to 1999, Webb was senior vice president and chief financial officer of Visteon, an $18 billion automotive components business with major production facilities in 30 countries.
Webb began his career at Ford Motor Co. in 1977, holding increasingly responsible financial and managerial positions internationally for more than 22 years. He earned a Bachelor of Science degree and Master of Business Administration in finance from George Mason University. He received the National Distinguished Service Award from the Boy Scouts of America.
THOMAS J. WEBB
EXECUTIVE VICE PRESIDENT AND CHIEF FINANCIAL OFFICER
THOMAS J. WEBB
12/15/09