Exhibit 99.1

Investor Meetings
September 23-26, 2013
Cross Winds® Energy Park
Gas Combined Cycle Plant
Consumers Smart Energy Program
This presentation is made as of the date hereof and contains “forward-looking statements” as defined in Rule 3b-6 of the Securities Exchange Act of 1934, Rule 175 of the Securities Act of 1933, and relevant legal decisions. The forward-looking statements are subject to risks and uncertainties. All forward-looking statements should be considered in the context of the risk and other factors detailed from time to time in CMS Energy’s and Consumers Energy’s Securities and Exchange Commission filings. Forward-looking statements should be read in conjunction with “FORWARD-LOOKING STATEMENTS AND INFORMATION” and “RISK FACTORS” sections of CMS Energy’s and Consumers Energy’s Form 10-K for the year ended December 31, 2012 and as updated in subsequent 10-Qs. CMS Energy’s and Consumers Energy’s “FORWARD-LOOKING STATEMENTS AND INFORMATION” and “RISK FACTORS” sections are incorporated herein by reference and discuss important factors that could cause CMS Energy’s and Consumers Energy’s results to differ materially from those anticipated in such statements. CMS Energy and Consumers Energy undertake no obligation to update any of the information presented herein to reflect facts, events or circumstances after the date hereof.
The presentation also includes non-GAAP measures when describing CMS Energy’s results of operations and financial performance. A reconciliation of each of these measures to the most directly comparable GAAP measure is included in the appendix and posted on our website at www.cmsenergy.com.
CMS Energy provides historical financial results on both a reported (Generally Accepted Accounting Principles) and adjusted (non-GAAP) basis and provides forward-looking guidance on an adjusted basis. Management views adjusted earnings as a key measure of the company’s present operating financial performance, unaffected by discontinued operations, asset sales, impairments, regulatory items from prior years, or other items. These items have the potential to impact, favorably or unfavorably, the company’s reported earnings in future periods. Because the company is not able to estimate the impact of these matters, the company is not providing a reconciliation to the comparable future period reported earnings.
1 |
|
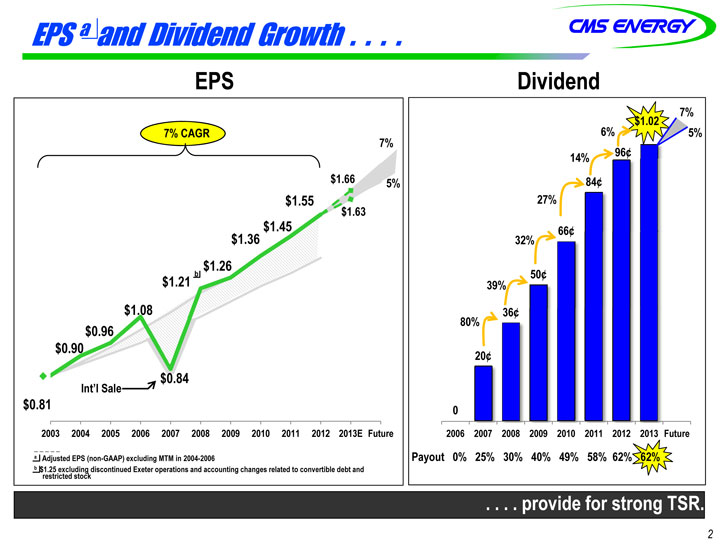
EPS a and Dividend Growth . . . .
EPS
7% CAGR
7%
$1.66 5% $1.55 $1.63 $1.36 $1.45 $1.26
$1.21 $1.08 $0.96 $0.90
$0.84
Int’b l Sale $0.81
2003 2004 2005 2006 2007 2008 2009 2010 2011 2012 2013E Future
a Adjusted EPS (non-GAAP) excluding MTM in 2004-2006
b $1.25 excluding discontinued Exeter operations and accounting changes related to convertible debt and restricted stock
Dividend
7%
6% $1.02 5% 14% 96 84 27%
66¢ 32%
39% 50¢ 36¢ 80%
20¢
0
2006 2007 2008 2009 2010 2011 2012 2013 Future
Payout 0% 25% 30% 40% 49% 58% 62% 62%
. . . . provide for strong TSR.
2 |
|
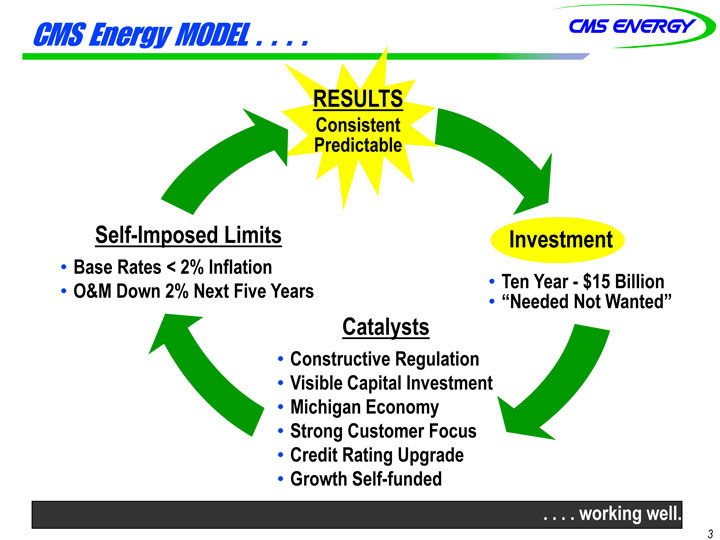
CMS Energy MODEL
RESULTS
Consistent Predictable
Self-Imposed Limits
Base Rates < 2% Inflation
O&M Down 2% Next Five Years Investment
Ten Year—$15 Billion
“Needed Not Wanted” Catalysts
Constructive Regulation
Visible Capital Investment
Michigan Economy
Strong Customer Focus
Credit Rating Upgrade
Growth Self-funded
working well.
3 |
|
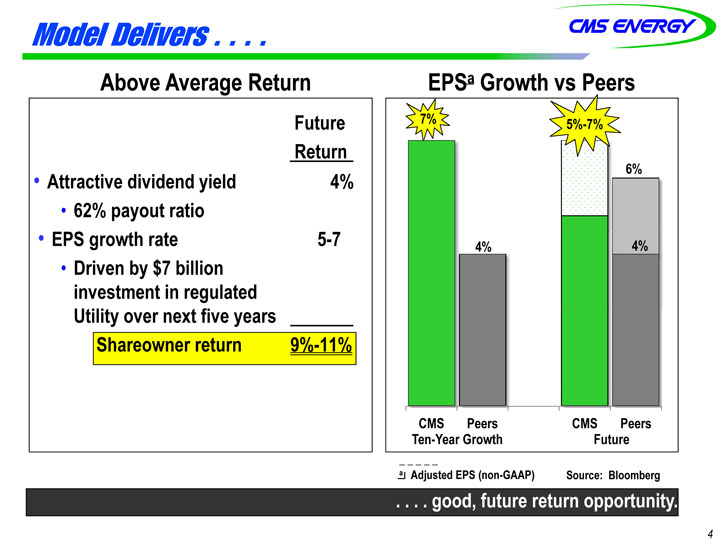
Model Delivers . . . .
Above Average Return
Future Return
Attractive dividend yield 4%
62% payout ratio
EPS growth rate 5-7
Driven by $7 billion investment in regulated Utility over next five years
Shareowner return 9%-11%
EPSa Growth vs Peers
7% 5%-7%
6%
5%
4% 4%
CMS Peers CMS Peers
Ten-Year Growth Future
a Adjusted EPS (non-GAAP) Source: Bloomberg
good, future return opportunity.
4 |
|
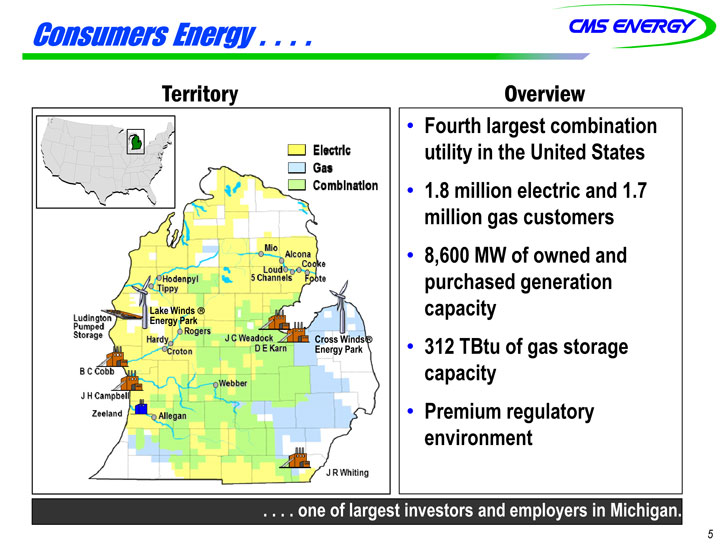
Consumers Energy . . . .
Territory
Overview
Fourth largest combination utility in the United States
1.8 million electric and 1.7 million gas customers
8,600 MW of owned and purchased generation capacity
312 TBtu of gas storage capacity
Premium regulatory environment
. . . . one of largest investors and employers in Michigan.
5 |
|
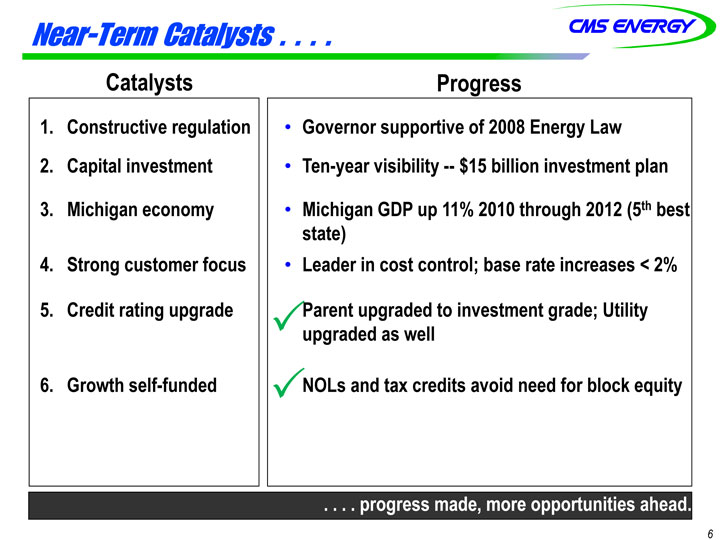
Near-Term Catalysts . . . .
Catalysts
1. Constructive regulation
2. Capital investment
3. Michigan economy
4. Strong customer focus
5. Credit rating upgrade
6. Growth self-funded
Progress
Governor supportive of 2008 Energy Law
Ten-year visibility — $15 billion investment plan
Michigan GDP up 11% 2010 through 2012 (5th best state)
Leader in cost control; base rate increases < 2%
Parent upgraded to investment grade; Utility upgraded as well
NOLs and tax credits avoid need for block equity
progress made, more opportunities ahead.
6 |
|
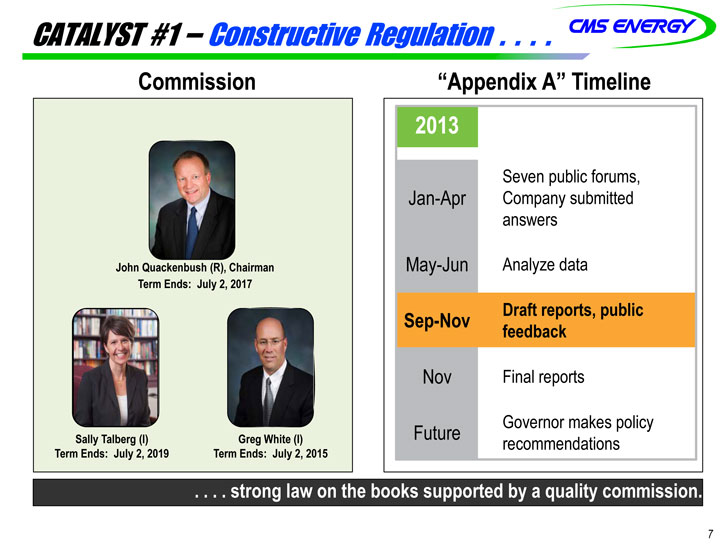
CATALYST #1 – Constructive Regulation
Commission
John Quackenbush (R), Chairman Term Ends: July 2, 2017
Sally Talberg (I) Term Ends: July 2, 2019
Greg White (I) Term Ends: July 2, 2015
“Appendix A” Timeline
2013
Seven public forums,
Jan-Apr Company submitted
answers
May-Jun Analyze data
Sep-Nov Draft reports, public
feedback
Nov Final reports
Future Governor makes policy
recommendations
strong law on the books supported by a quality commission.
7 |
|
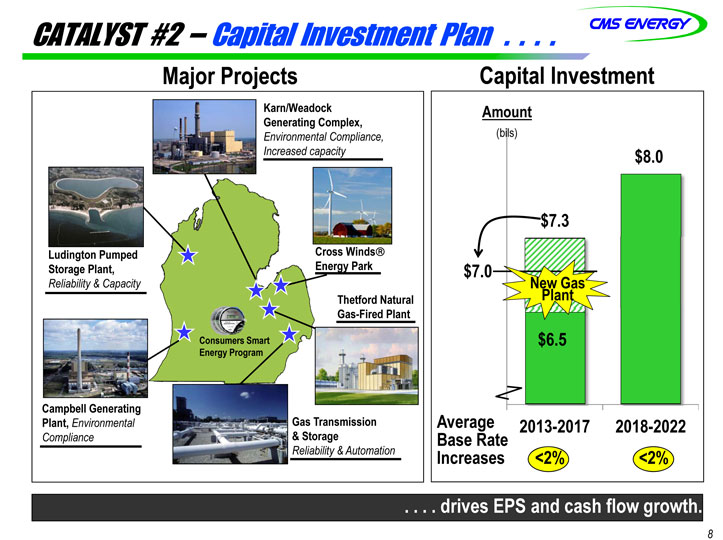
CATALYST #2 – Capital Investment Plan . . . .
Major Projects
Karn/Weadock Generating Complex,
Environmental Compliance, Increased capacity
Ludington Pumped Storage Plant,
Reliability & Capacity
Cross Winds® Energy Park
Thetford Natural Gas-Fired Plant
Campbell Generating Plant, Environmental Compliance
Gas Transmission
& Storage
Reliability & Automation
Capital Investment
Amount
(bils)
$8.0
$7.3
New Gas
Plant
Average 2013-2017 2018-2022
Base Rate
Increases <2% <2%
. . . . drives EPS and cash flow growth.
8 |
|
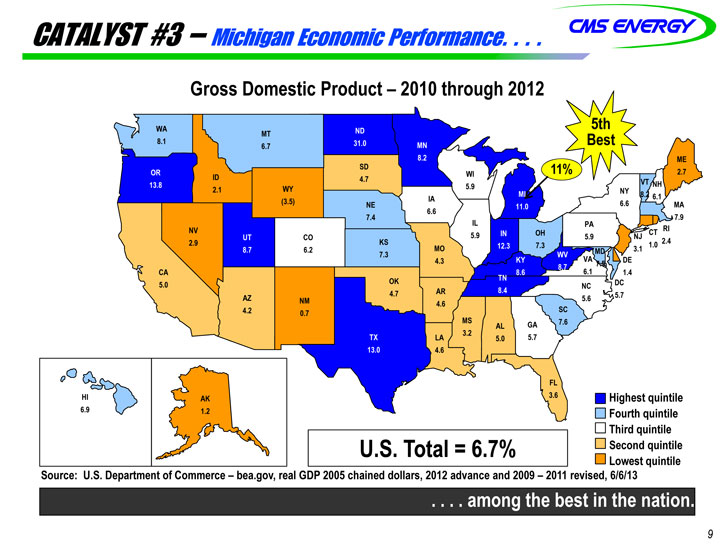
CATALYST #3 – Michigan Economic Performance. . . .
Gross Domestic Product – 2010 through 2012
WA 5th MT
8.1 Best 6.7 ME
SD 11%
WI 2.7 ID 4.7 VT NH
2.1 WY 5.9
NY 8.2 IA 6.1
(3.5) NE 6.6 MA 6.6
7.4 7.9 IL PA
NV RI 5.9 OH CT
CO 5.9 NJ 2.9 KS 2.4
7.3 1.0 6.2 MO MD 3.1 7.3 4.3 VA DE 6.1 7.5 CA 1.4 OK TN
5.0 NC DC 4.7 AR 5.7 AZ NM 5.6 4.6 4.2 SC 0.7 MS
GA 7.6 AL 3.2
LA 5.0 5.7 4.6 FL
HI AK 6.9 1.2
U.S. Total = 6.7%
Highest quintile Fourth quintile Third quintile Second quintile Lowest quintile
Source: U.S. Department of Commerce – bea.gov, real GDP 2005 chained dollars, 2012 advance and 2009 – 2011 revised, 6/6/13
among the best in the nation.
9
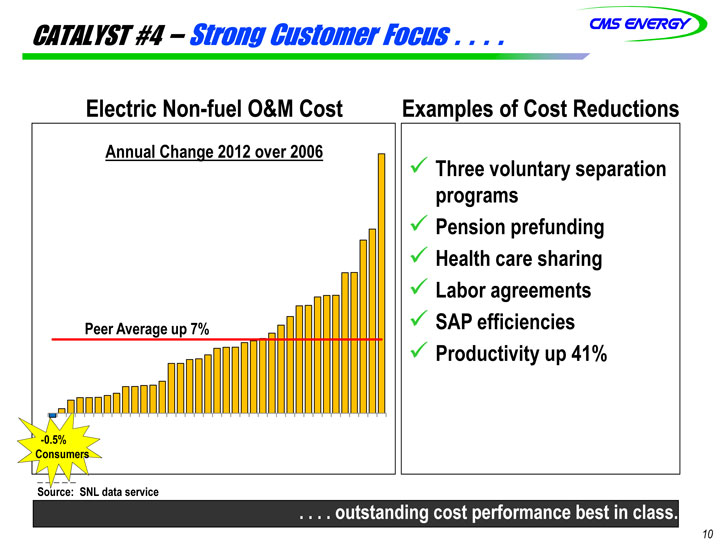
CATALYST #4 – Strong Customer Focus
Electric Non-fuel O&M Cost
Annual Change 2012 over 2006
Peer Average up 7%
-0.5% Consumers
Source: SNL data service
Examples of Cost Reductions
Three voluntary separation programs
Pension prefunding
Health care sharing
Labor agreements
SAP efficiencies
Productivity up 41%
outstanding cost performance best in class.
10
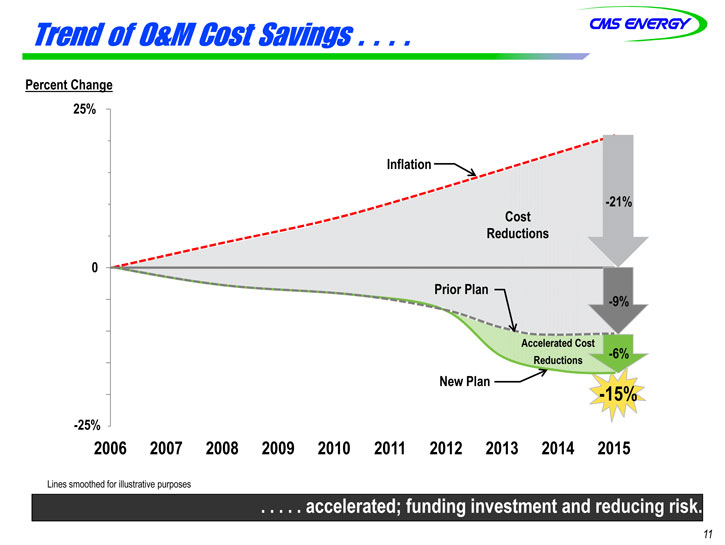
Trend of O&M Cost Savings
Percent Change
25%
Inflation
-21%
Cost
Reductions
0
Prior Plan
-9%
Accelerated Cost
Reductions -6%
New Plan
-15%
-25%
2006 2007 2008 2009 2010 2011 2012 2013 2014 2015
Lines smoothed for illustrative purposes
accelerated funding investment and reducing risk.
11
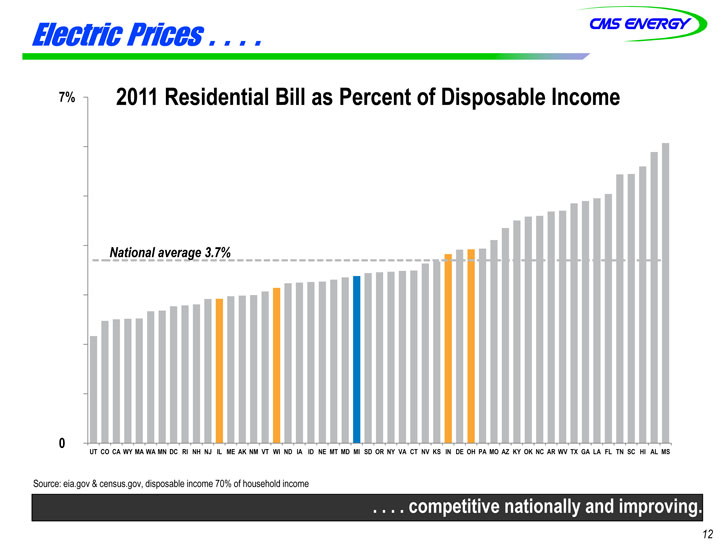
Electric Prices . . . .
7% 2011 Residential Bill as Percent of Disposable Income
National average 3.7%
UT CO CA WY MA WA MN DC RI NH NJ IL ME AK NM VT WI ND IA ID NE MT MD MI SD OR NY VA CT NV KS IN DE OH PA MO AZ KY OK NC AR WV TX GA LA FL TN SC HI AL MS
Source: eia.gov & census.gov, disposable income 70% of household income
competitive nationally and improving.
12
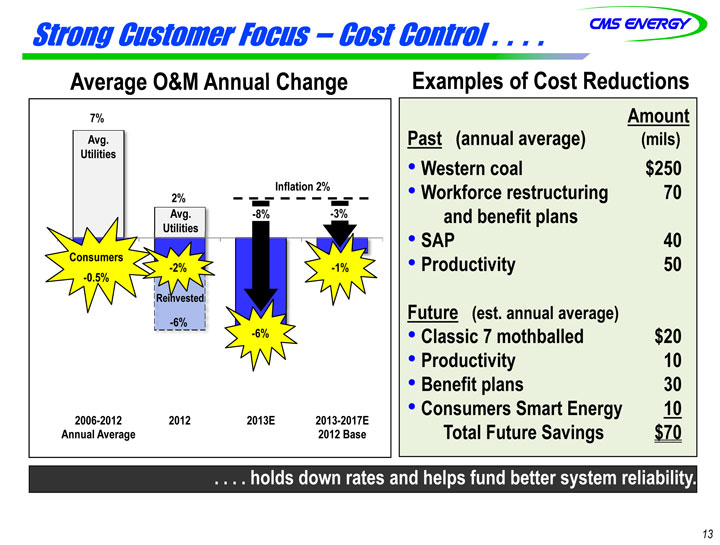
Strong Customer Focus – Cost Control . . . .
Average O&M Annual Change
7%
Avg.
Utilities
Inflation 2%
2%
Avg. -8% -3%
Utilities
Consumers
-2% -1%
-0.5%
Reinvested
-6%
2006-2012 2012 2013E 2013-2017E
Annual Average 2012 Base
Examples of Cost Reductions
Amount
Past (annual average) (mils)
Western coal $250
Workforce restructuring 70
and benefit plans
SAP 40
Productivity 50
Future (est. annual average)
Classic 7 mothballed $20
Productivity 10
Benefit plans 30
Consumers Smart Energy 10
Total Future Savings $70
holds down rates and helps fund better system reliability.
13
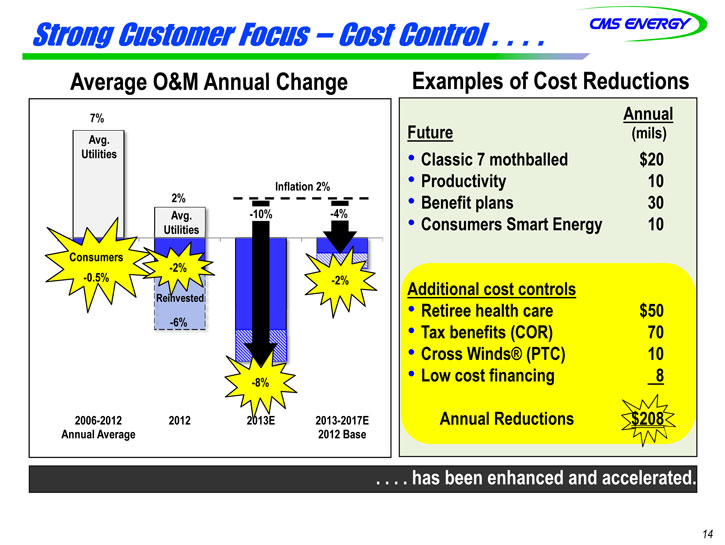
Strong Customer Focus – Cost Control
Average O&M Annual Change
7%
Avg.
Utilities
Inflation 2%
2%
Avg. -10% -4%
Utilities
Consumers
-2%
-0.5% -2%
Reinvested
-6%
-8%
2006-2012 2012 2013E 2013-2017E
Annual Average 2012 Base
Examples of Cost Reductions
Annual
Future (mils)
Classic 7 mothballed $20
Productivity 10
Benefit plans 30
Consumers Smart Energy 10
Additional cost controls
Retiree health care $50
Tax benefits (COR) 70
Cross Winds® (PTC) 10
Low cost financing 8
Annual Reductions $208
has been enhanced and accelerated.
14
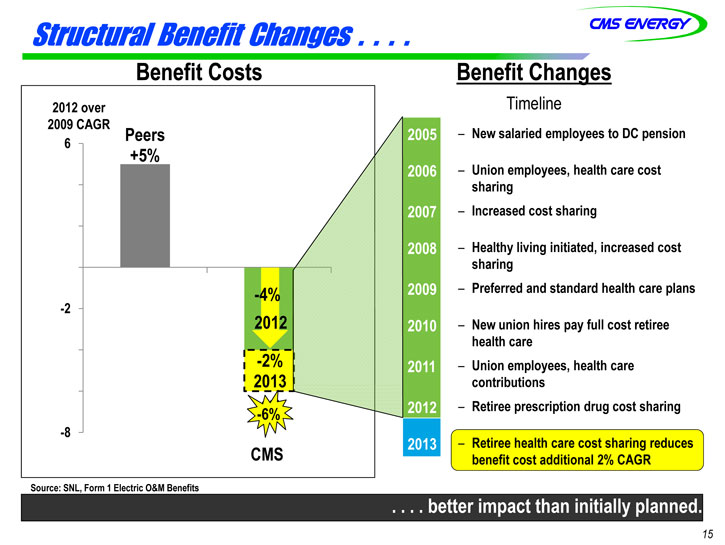
Structural Benefit Changes
Benefit Costs
2012 over
2009 CAGR
6 |
| Peers 2005 |
+5%
2006
2007
2008
-4% 2009
-2
2012 2010
-2% 2011
2013
-6% 2012
-8
CMS 2013
Source: SNL, Form 1 Electric O&M Benefits
Benefit Changes
Timeline
– New salaried employees to DC pension
– Union employees, health care cost sharing
– Increased cost sharing
– Healthy living initiated, increased cost sharing
– Preferred and standard health care plans
– New union hires pay full cost retiree health care
– Union employees, health care contributions
– Retiree prescription drug cost sharing
– Retiree health care cost sharing reduces benefit cost additional 2% CAGR
better impact than initially planned.
15
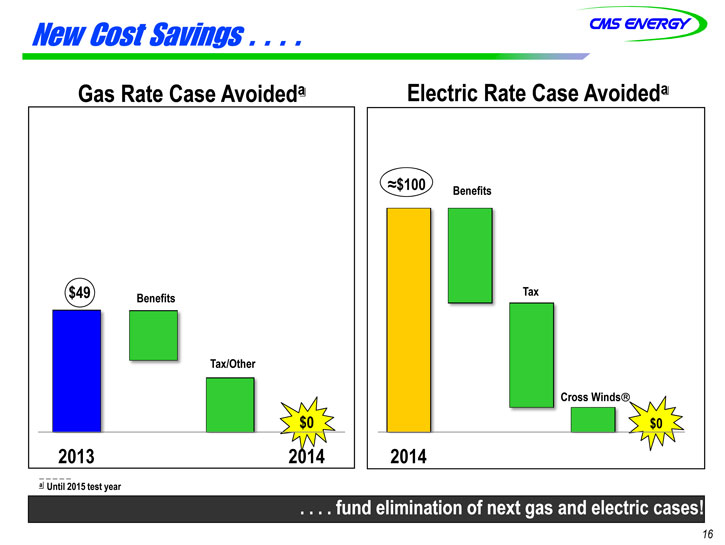
New Cost Savings
Gas Rate Case Avoideda
$49 Benefits
Tax/Other
$0
2013 2014
a Until 2015 test year
Electric Rate Case Avoideda
?$100 Benefits
Tax
Cross Winds®
$0
2014
fund elimination of next gas and electric cases!
16
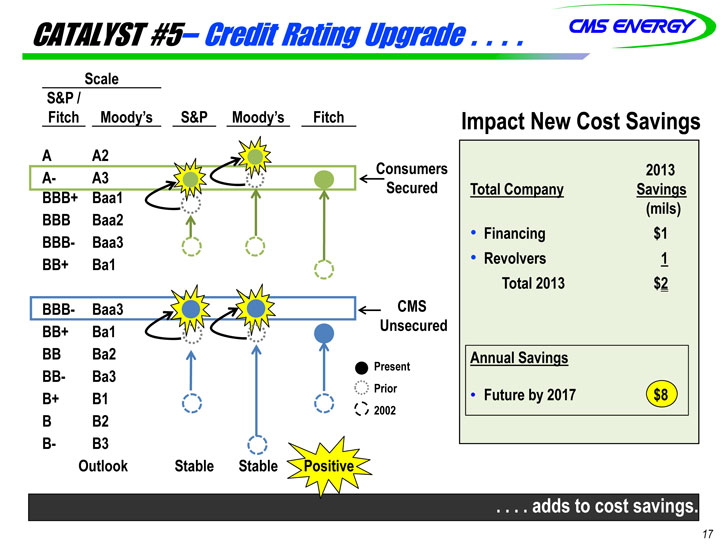
CATALYST #5– Credit Rating Upgrade
Scale
S&P / Fitch Moody’s S&P Moody’s Fitch
A A2
A- A3 Consumers
BBB+ Baa1 Secured
BBB Baa2
BBB- Baa3
BB+ Ba1
BBB- Baa3 CMS
BB+ Ba1 Unsecured
BB Ba2
Present
BB- Ba3
Prior
B+ B1
2002
B B2
B- B3
Outlook Stable Stable Positive
Impact New Cost Savings
2013
Total Company Savings
(mils)
Financing $ 1
Revolvers 1
Total 2013 $ 2
Annual Savings
Future by 2017 $ 8
adds to cost savings.
17
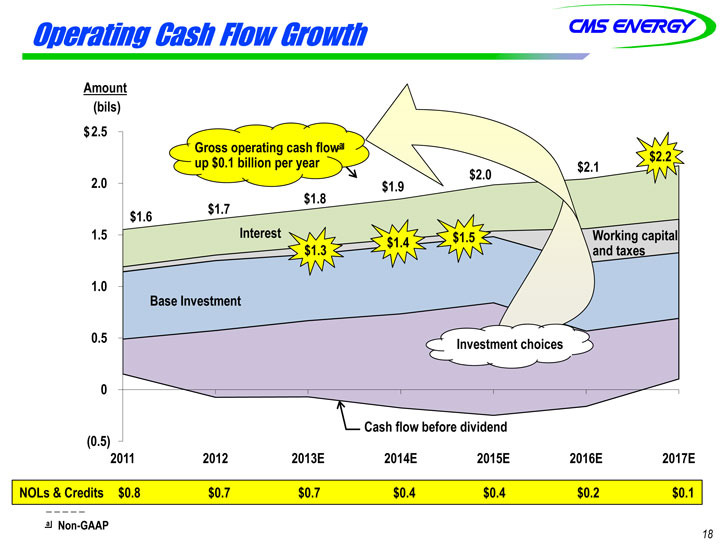
Operating Cash Flow Growth
Amount
(bils)
$ 2.5
Gross operating cash flowa
up $0.1 billion per year $2.0 $2.1 $2.2
2.0 $1.9
$1.8
$1.6 $1.7
1.5 Interest $1.4 $1.5 king capital
$1.3 taxes
1.0
Base Investment
0.5 Investment choices
0
Cash flow before dividend
(0.5)
2011 2012 2013E 2014E 2015E 2016E 2017E
NOLs & Credits $0.8 $0.7 $0.7 $0.4 $0.4 $0.2 $0.1
a Non-GAAP
18
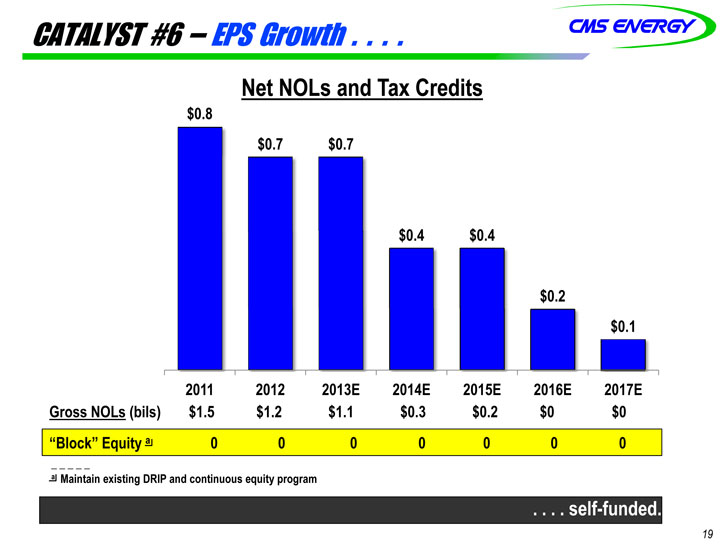
CATALYST #6 – EPS Growth . . . .
Net NOLs and Tax Credits
$0.8
$0.7 $0.7
$0.4 $0.4
$0.2
$0.1
2011 2012 2013E 2014E 2015E 2016E 2017E
Gross NOLs (bils) $1.5 $1.2 $1.1 $0.3 $0.2 $0 $0
“Block” Equity a 0 0 0 0 0 0 0
a Maintain existing DRIP and continuous equity program
self-funded.
19
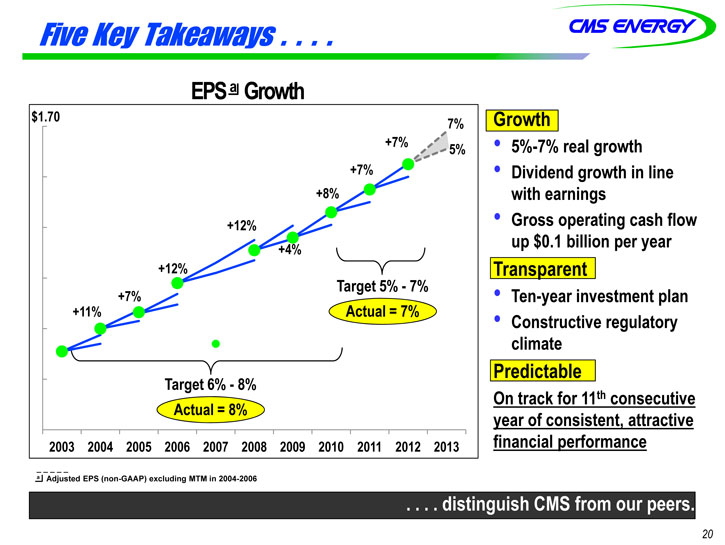
Five Key Takeaways
EPS a Growth
$1.70 7%
+7% 5%
+7%
+8%
+12%
+4%
+12%
+7% Target 5%—7%
+11% Actual = 7%
Target 6%—8%
Actual = 8%
2003 2004 2005 2006 2007 2008 2009 2010 2011 2012 2013
Growth
5%-7% real growth
Dividend growth in line with earnings
Gross operating cash flow up $0.1 billion per year
Transparent
Ten-year investment plan
Constructive regulatory climate
Predictable
On track for 11th consecutive year of consistent, attractive financial performance
a Adjusted EPS (non-GAAP) excluding MTM in 2004-2006
distinguish CMS from our peers.
20

APPENDIX
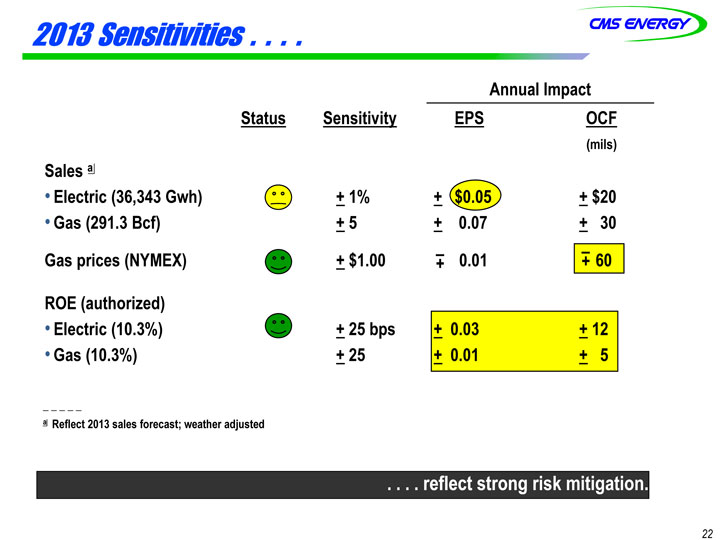
2013 Sensitivities
Annual Impact
Status Sensitivity EPS OCF
(mils)
Sales a
• |
| Electric (36,343 Gwh) + 1% + $0.05 + $20 |
• |
| Gas (291.3 Bcf) + 5 + 0.07 + 30 |
Gas prices (NYMEX) + $1.00 –+ 0.01 –+ 60
ROE (authorized)
• |
| Electric (10.3%) + 25 bps + 0.03 + 12 |
• |
| Gas (10.3%) + 25 + 0.01 + 5 |
a Reflect 2013 sales forecast; weather adjusted
reflect strong risk mitigation.
22
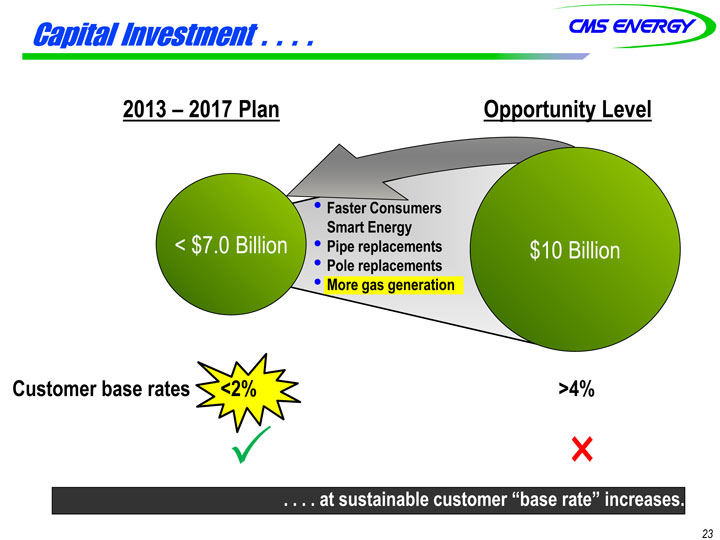
Capital Investment
2013 – 2017 Plan
< $7.0 Billion
Faster Consumers Smart Energy
Pipe replacements
Pole replacements
More gas generation
Opportunity Level
$10 Billion
Customer base rates <2% >4%
at sustainable customer “base rate” increases.
23
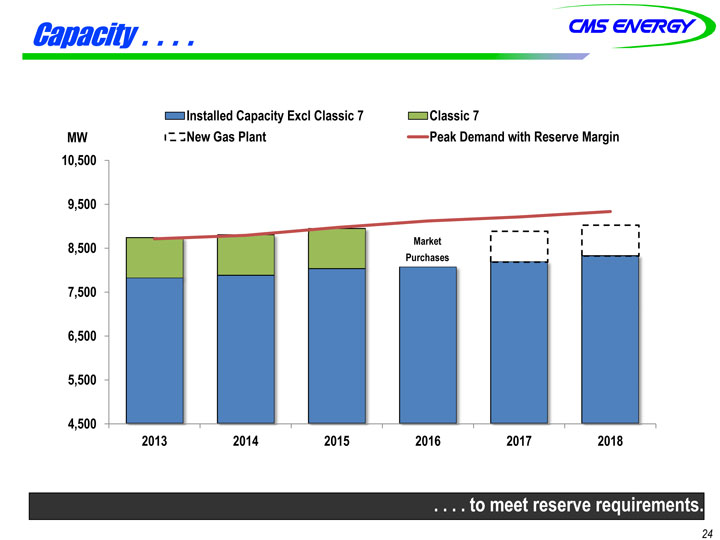
Capacity
Installed Capacity Excl Classic 7 New Gas Plant Classic 7
Peak Demand with Reserve Margin
MW
10,500
9,500
8,500 Market
Purchases
7,500
6,500
5,500
4,500
2013 2014 2015 2016 2017 2018
.to meet reserve requirements.
24
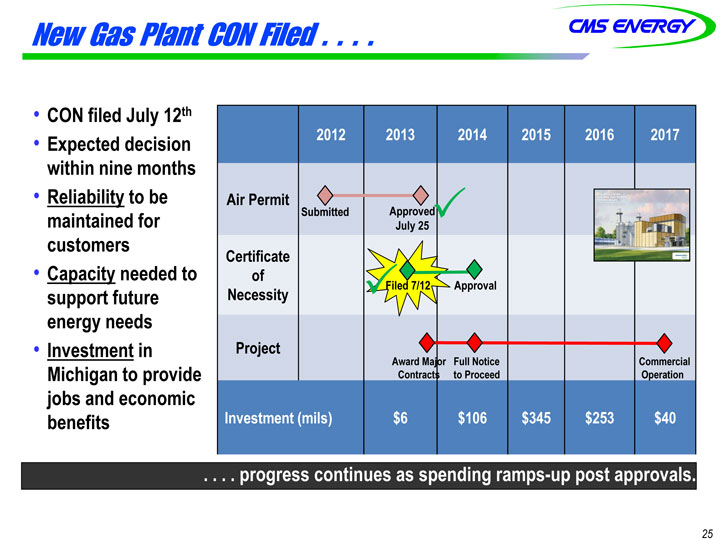
New Gas Plant CON Filed
CON filed July 12th
Expected decision within nine months
Reliability to be maintained for customers
Capacity needed to support future energy needs
Investment in Michigan to provide jobs and economic benefits
2012 2013 2014 2015 2016 2017
Air Permit
Submitted Approved
July 25
Certificate
of
Necessity Filed 7/12 Approval
Project
Award Major Full Notice Commercial
Contracts to Proceed Operation
Investment (mils) $6 $106 $345 $253 $40
progress continues as spending ramps-up post approvals.
25
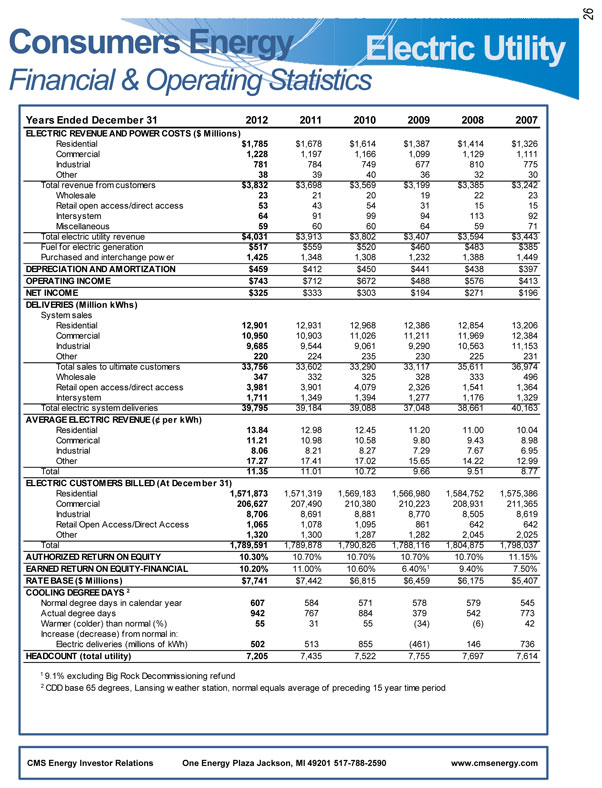
Consumers Energy
Financial & Operating Statistics
Years Ended December 31 2012 2011 2010 2009 2008 2007
ELECTRIC REVENUE AND POWER COSTS ($ Millions)
Residential $1,785 $1,678 $1,614 $1,387 $1,414 $1,326
Commercial 1,228 1,197 1,166 1,099 1,129 1,111
Industrial 781 784 749 677 810 775
Other 38 39 40 36 32 30
Total revenue from customers $3,832 $3,698 $3,569 $3,199 $3,385 $3,242
Wholesale 23 21 20 19 22 23
Retail open access/direct access 53 43 54 31 15 15
Intersystem 64 91 99 94 113 92
Miscellaneous 59 60 60 64 59 71
Total electric utility revenue $4,031 $3,913 $3,802 $3,407 $3,594 $3,443
Fuel for electric generation $517 $559 $520 $460 $483 $385
Purchased and interchange power 1,425 1,348 1,308 1,232 1,388 1,449
DEPRECIATION AND AMORTIZATION $459 $412 $450 $441 $438 $397
OPERATING INCOME $743 $712 $672 $488 $576 $413
NET INCOME $325 $333 $303 $194 $271 $196
DELIVERIES (Million kWhs)
System sales
Residential 12,901 12,931 12,968 12,386 12,854 13,206
Commercial 10,950 10,903 11,026 11,211 11,969 12,384
Industrial 9,685 9,544 9,061 9,290 10,563 11,153
Other 220 224 235 230 225 231
Total sales to ultimate customers 33,756 33,602 33,290 33,117 35,611 36,974
Wholesale 347 332 325 328 333 496
Retail open access/direct access 3,981 3,901 4,079 2,326 1,541 1,364
Intersystem 1,711 1,349 1,394 1,277 1,176 1,329
Total electric system deliveries 39,795 39,184 39,088 37,048 38,661 40,163
AVERAGE ELECTRIC REVENUE (¢ per kWh)
Residential 13.84 12.98 12.45 11.20 11.00 10.04
Commerical 11.21 10.98 10.58 9.80 9.43 8.98
Industrial 8.06 8.21 8.27 7.29 7.67 6.95
Other 17.27 17.41 17.02 15.65 14.22 12.99
Total 11.35 11.01 10.72 9.66 9.51 8.77
ELECTRIC CUSTOMERS BILLED (At December 31)
Residential 1,571,873 1,571,319 1,569,183 1,566,980 1,584,752 1,575,386
Commercial 206,627 207,490 210,380 210,223 208,931 211,365
Indu trial 8,706 8,691 8,881 8,770 8,505 8,619
Retail Open Access/Direct Access 1,065 1,078 1,095 861 642 642
Other 1,320 1,300 1,287 1,282 2,045 2,025
Total 1,789,591 1,789,878 1,790,826 1,788,116 1,804,875 1,798,037
AUTHORIZED RETURN ON EQUITY 10.30% 10.70% 10.70% 10.70% 10.70% 11.15%
EARNED RETURN ON EQUITY-FINANCIAL 10.20% 11.00% 10.60% 6.40%1 9.40% 7.50%
RATE BASE ($ Millions) $7,741 $7,442 $6,815 $6,459 $6,175 $5,407
COOLING DEGREE DAYS 2
Normal degree days in calendar year 607 584 571 578 579 545
Actual degree days 942 767 884 379 542 773
Warmer (colder) than normal (%) 55 31 55 (34) (6) 42
Increase (decrease) from normal in:
Electric deliveries (millions of kWh) 502 513 855 (461) 146 736
HEADCOUNT (total utility) 7,205 7,435 7,522 7,755 7,697 7,614
1 |
| 9.1% excluding Big Rock Decommissioning refund |
2 |
| CDD base 65 degrees, Lansing weather station, normal equals average of preceding 15 year time period |
CMS Energy Investor Relations One Energy Plaza Jackson, MI 49201 517-788-2590 www.cmsenergy.com
26
Consumers Energy
Financial & Operating Statistics
Years Ended December 31 2012 2011 2010 2009 2008 2007
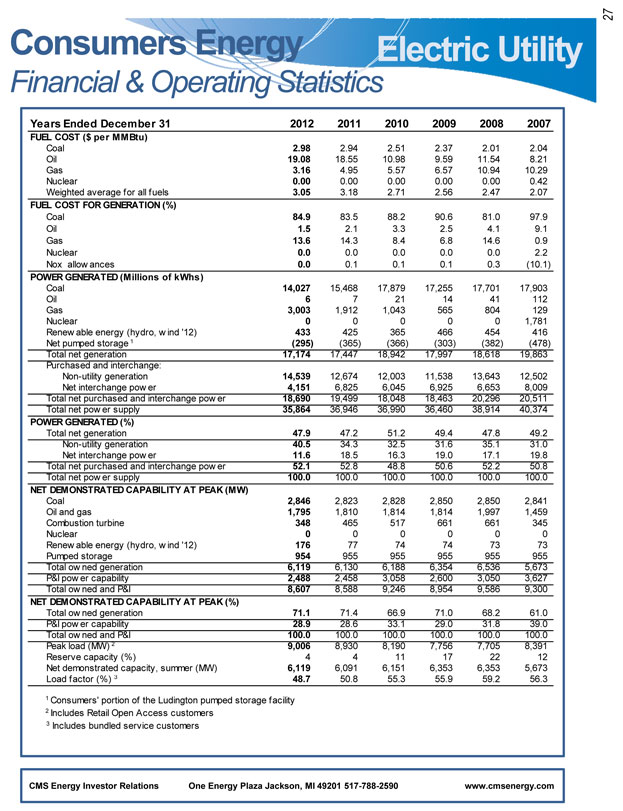
FUEL COST ($ per MMBtu)
Coal 2.98 2.94 2.51 2.37 2.01 2.04
Oil 19.08 18.55 10.98 9.59 11.54 8.21
Gas 3.16 4.95 5.57 6.57 10.94 10.29
Nuclear 0.00 0.00 0.00 0.00 0.00 0.42
Weighted average for all fuels 3.05 3.18 2.71 2.56 2.47 2.07
FUEL COST FOR GENERATION (%)
Oil 1.5 2.1 3.3 2.5 4.1 9.1
Gas 13.6 14.3 8.4 6.8 14.6 0.9
Nuclear 0.0 0.0 0.0 0.0 0.0 2.2
Nox allow ances 0.0 0.1 0.1 0.1 0.3 (10.1)
POWER GENERATED (Millions of kWhs)
Coal 14,027 15,468 17,879 17,255 17,701 17,903
Oil 6 7 21 14 41 112
Gas 3,003 1,912 1,043 565 804 129
Nuclear 0 0 0 0 0 1,781
Renew able energy (hydro, w ind ‘12) 433 425 365 466 454 416
Net pumped storage 1 (295) (365) (366) (303) (382) (478)
Total net generation 17,174 17,447 18,942 17,997 18,618 19,863
Purchased and interchange:
Non-utility generation 14,539 12,674 12,003 11,538 13,643 12,502
Net interchange power 4,151 6,825 6,045 6,925 6,653 8,009
Total net purchased and interchange power 18,690 19,499 18,048 18,463 20,296 20,511
Total net power supply 35,864 36,946 36,990 36,460 38,914 40,374
POWER GENERATED (%)
Total net generation 47.9 47.2 51.2 49.4 47.8 49.2
Non-utility generation 40.5 34.3 32.5 31.6 35.1 31.0
Net interchange power 11.6 18.5 16.3 19.0 17.1 19.8
Total net purchased and interchange power 52.1 52.8 48.8 50.6 52.2 50.8
Total net power supply 100.0 100.0 100.0 100.0 100.0 100.0
NET DEMONSTRATED CAPABILITY AT PEAK (MW)
Coal 2,846 2,823 2,828 2,850 2,850 2,841
Oil and gas 1,795 1,810 1,814 1,814 1,997 1,459
Combustion turbine 348 465 517 661 661 345
Nuclear 0 0 0 0 0 0
Renew able energy (hydro, w ind ‘12) 176 77 74 74 73 73
Pumped storage 954 955 955 955 955 955
Total owned generation 6,119 6,130 6,188 6,354 6,536 5,673
P&I power capability 2,488 2,458 3,058 2,600 3,050 3,627
Total owned and P&I 8,607 8,588 9,246 8,954 9,586 9,300
NET DEMONSTRATED CAPABILITY AT PEAK (%)
Total owned generation 71.1 71.4 66.9 71.0 68.2 61.0
P&I power capability 28.9 28.6 33.1 29.0 31.8 39.0
Total owned and P&I 100.0 100.0 100.0 100.0 100.0 100.0
Peak load (MW) 2 9,006 8,930 8,190 7,756 7,705 8,391
Reserve capacity (%) 4 4 11 17 22 12
Net demonstrated capacity, summer (MW) 6,119 6,091 6,151 6,353 6,353 5,673
Load factor (%) 3 48.7 50.8 55.3 55.9 59.2 56.3
1 |
| Consumers’ portion of the Ludington pumped storage facility |
2 |
| Includes Retail Open Access customers |
3 |
| Includes bundled service customers |
CMS Energy Investor Relations One Energy Plaza Jackson, MI 49201 517-788-2590 www.cmsenergy.com
27
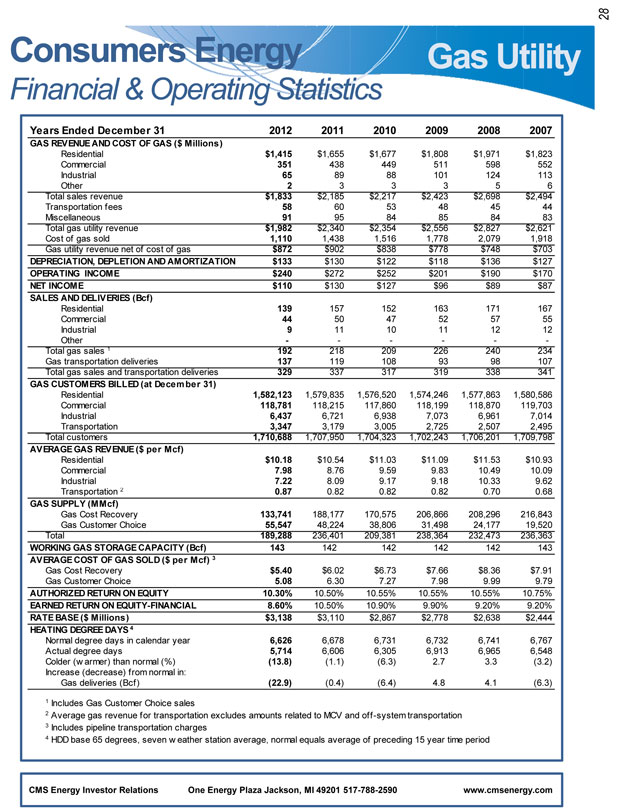
Consumers Energy
Financial & Operating Statistics
Years Ended December 31 2012 2011 2010 2009 2008 2007
GAS REVENUE AND COST OF GAS ($ Millions)
Residential $1,415 $1,655 $1,677 $1,808 $1,971 $1,823
Commercial 351 438 449 511 598 552
Industrial 65 89 88 101 124 113
Other 2 3 3 3 5 6
Total sales revenue $1,833 $2,185 $2,217 $2,423 $2,698 $2,494
Transportation fees 58 60 53 48 45 44
Miscellaneous 91 95 84 85 84 83
Total gas utility revenue $1,982 $2,340 $2,354 $2,556 $2,827 $2,621
Cost of gas sold 1,110 1,438 1,516 1,778 2,079 1,918
Gas utility revenue net of cost of gas $872 $902 $838 $778 $748 $703
DEPRECIATION, DEPLETION AND AMORTIZATION $133 $130 $122 $118 $136 $127
OPERATING INCOME $240 $272 $252 $201 $190 $170
NET INCOME $110 $130 $127 $96 $89 $87
SALES AND DELIVERIES (Bcf)
Residential 139 157 152 163 171 167
Commercial 44 50 47 52 57 55
Industrial 9 11 10 11 12 12
Other
Total gas sales 1 192 218 209 226 240 234
Gas transportation deliveries 137 119 108 93 98 107
Total gas sales and transportatio deliveries 329 337 317 319 338 341
GAS CUSTOMERS BILLED (at Dece mber 31)
Residential 1,582,123 1,579,835 1,576,520 1,574,246 1,577,863 1,580,586
Commercial 118,781 118,215 117,860 118,199 118,870 119,703
Industrial 6,437 6,721 6,938 7,073 6,961 7,014
Transportation 3,347 3,179 3,005 2,725 2,507 2,495
Total customers 1,710,688 1,707,950 1,704,323 1,702,243 1,706,201 1,709,798
AVERAGE GAS REVENUE ($ per Mcf)
Residential $10.18 $10.54 $11.03 $11.09 $11.53 $10.93
Commercial 7.98 8.76 9.59 9.83 10.49 10.09
Industrial 7.22 8.09 9.17 9.18 10.33 9.62
Transportation 2 0.87 0.82 0.82 0.82 0.70 0.68
GAS SUPPLY (MMcf)
Gas Cost Recovery 133,741 188,177 170,575 206,866 208,296 216,843
Gas Customer Choice 55,547 48,224 38,806 31,498 24,177 19,520
Total 189,288 236,401 209,381 238,364 232,473 236,363
WORKING GAS STORAGE CAPACITY (Bcf) 143 142 142 142 142 143
AVERAGE COST OF GAS SOLD ($ per Mcf) 3
Gas Cost Recovery $5.40 $6.02 $6.73 $7.66 $8.36 $7.91
Gas Customer Choice 5.08 6.30 7.27 7.98 9.99 9.79
AUTHORIZED RETURN ON EQUITY 10.30% 10.50% 10.55% 10.55% 10.55% 10.75%
EARNED RETURN ON EQUITY-FINANCIAL 8.60% 10.50% 10.90% 9.90% 9.20% 9.20%
RATE BASE ($ Millions) $3,138 $3,110 $2,867 $2,778 $2,638 $2,444
HEATING DEGREE DAYS 4
Normal degree days in calendar year 6,626 6,678 6,731 6,732 6,741 6,767
Actual degree days 5,714 6,606 6,305 6,913 6,965 6,548
Colder (warmer) than normal (%) (13.8) (1.1) (6.3) 2.7 3.3 (3.2)
Increase (decrease) from normal in:
Gas deliveries (Bcf) (22.9) (0.4) (6.4) 4.8 4.1 (6.3)
1 |
| Includes Gas Customer Choice sales |
2 |
| Average gas revenue for transportation excludes amounts related to MCV and off-system transportation |
3 |
| Includes pipeline transportation charges |
4 |
| HDD base 65 degrees, seven weather station average, normal equals average of preceding 15 year time period |
CMS Energy Investor Relations One Energy Plaza Jackson, MI 49201 517-788-2590 www.cmsenergy.com
28
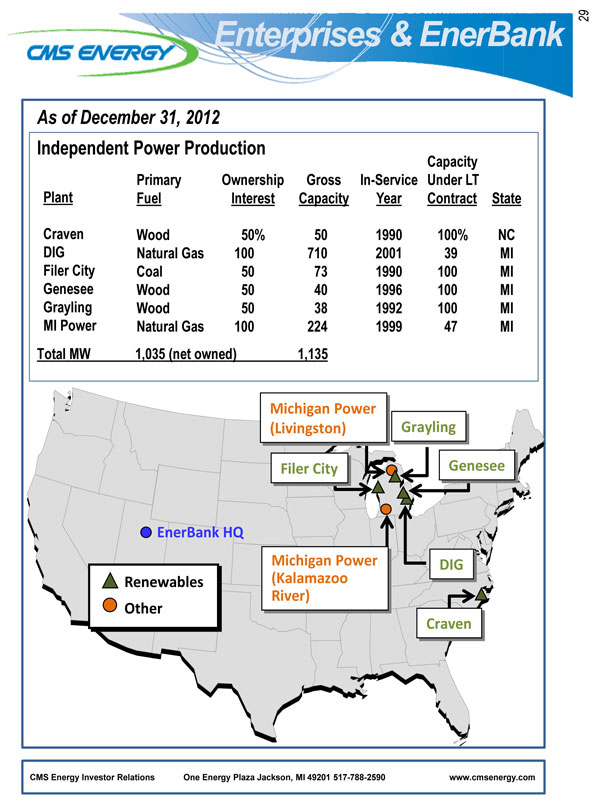
As of December 31, 2012
Independent Power Production
Capacity
Primary Ownership Gross In-Service Under LT
Plant Fuel Interest Capacity Year Contract State
Craven Wood 50% 50 1990 100% NC
DIG Natural Gas 100 710 2001 39 MI
Filer City Coal 50 73 1990 100 MI
Genesee Wood 50 40 1996 100 MI
Grayling Wood 50 38 1992 100 MI
MI Power Natural Gas 100 224 1999 47 MI
Total MW 1,035 (net owned) 1,135
Michigan Power
(Livingston) Grayling
Filer City Genesee
EnerBank HQ
DIG
Michigan Power
(Kalamazoo River)
Craven
Renewables Other
CMS Energy Investor Relations One Energy Plaza Jackson, MI 49201 517-788-2590 www.cmsenergy.com

GAAP Reconciliation

CMS ENERGY CORPORATION
Earnings Per Share By Year GAAP Reconciliation
(Unaudited)
| 2003 | 2004 | 2005 | 2006 | 2007 | 2008 | 2009 | 2010 | 2011 | 2012 | |||||||||||||||||||||||||||||||
Reported earnings (loss) per share - GAAP | ($ | 0.30 | ) | $ | 0.64 | ($ | 0.44 | ) | ($ | 0.41 | ) | ($ | 1.02 | ) | $ | 1.20 | $ | 0.91 | $ | 1.28 | $ | 1.58 | $ | 1.42 | ||||||||||||||||
After-tax items: | ||||||||||||||||||||||||||||||||||||||||
Electric and gas utility | 0.21 | (0.39 | ) | — | — | (0.07 | ) | 0.05 | 0.33 | 0.03 | 0.00 | 0.17 | ||||||||||||||||||||||||||||
Enterprises | 0.74 | 0.62 | 0.04 | (0.02 | ) | 1.25 | (0.02 | ) | 0.09 | (0.03 | ) | (0.11 | ) | (0.01 | ) | |||||||||||||||||||||||||
Corporate interest and other | 0.16 | (0.03 | ) | 0.04 | 0.27 | (0.32 | ) | (0.02 | ) | 0.01 | * | (0.01 | ) | * | ||||||||||||||||||||||||||
Discontinued operations (income) loss | (0.16 | ) | 0.02 | (0.07 | ) | (0.03 | ) | 0.40 | ( | *) | (0.08 | ) | 0.08 | (0.01 | ) | (0.03 | ) | |||||||||||||||||||||||
Asset impairment charges, net | — | — | 1.82 | 0.76 | 0.60 | — | — | — | — | — | ||||||||||||||||||||||||||||||
Cumulative accounting changes | 0.16 | 0.01 | — | — | — | — | — | — | — | — | ||||||||||||||||||||||||||||||
Adjusted earnings per share, including MTM - non-GAA | $ | 0.81 | $ | 0.87 | $ | 1.39 | $ | 0.57 | $ | 0.84 | $ | 1.21 | (a) | $ | 1.26 | $ | 1.36 | $ | 1.45 | $ | 1.55 | |||||||||||||||||||
Mark-to-market impacts | 0.03 | (0.43 | ) | 0.51 | ||||||||||||||||||||||||||||||||||||
Adjusted earnings per share, excluding MTM - non-GAA | NA | $ | 0.90 | $ | 0.96 | $ | 1.08 | NA | NA | NA | NA | NA | NA | |||||||||||||||||||||||||||
| * | Less than $500 thousand or $0.01 per share. |
| (a) | $1.25 excluding discontinued Exeter operations and accounting changes related to convertible debt and restricted stock. |
CMS Energy
Reconciliation of Gross Operating Cash Flow to GAAP Operating Activities
(unaudited)
(mils)
| 2011 | 2012 | 2013 | 2014 | 2015 | 2016 | 2017 | ||||||||||||||||||||||
Consumers Operating Income + Depreciation & Amortization | $ | 1,527 | $ | 1,635 | $ | 1,735 | $ | 1,821 | $ | 1,948 | $ | 2,011 | $ | 2,113 | ||||||||||||||
Enterprises Project Cash Flows | 24 | 17 | 20 | 29 | 37 | 44 | 56 | |||||||||||||||||||||
Gross Operating Cash Flow | $ | 1,551 | $ | 1,652 | $ | 1,755 | $ | 1,850 | $ | 1,985 | $ | 2,055 | $ | 2,169 | ||||||||||||||
Other operating activities including taxes, interest payments and working capital | (382 | ) | (411 | ) | (405 | ) | (400 | ) | (435 | ) | (805 | ) | (819 | ) | ||||||||||||||
Net cash provided by operating activities | $ | 1,169 | $ | 1,241 | $ | 1,350 | $ | 1,450 | $ | 1,550 | $ | 1,250 | $ | 1,350 | ||||||||||||||