Exhibit 99.1

Investor Meeting
Grand Rapids, Michigan October 24, 2013
Cross Winds® Energy Park
Gas Combined Cycle Plant
Consumers Smart Energy Program

John Russell
President & CEO
Welcome
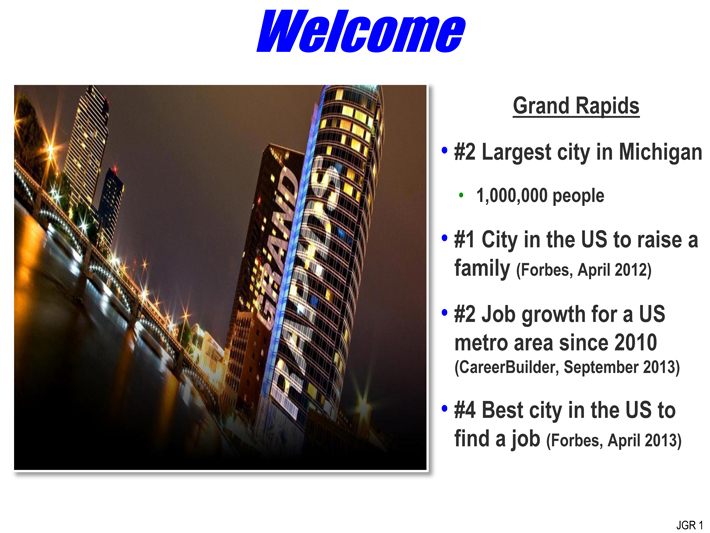
Grand Rapids
#2 Largest city in Michigan
1,000,000 people
#1 City in the US to raise a
family (Forbes, April 2012)
#2 Job growth for a US metro area since 2010
(CareerBuilder, September 2013)
#4 Best city in the US to
find a job (Forbes, April 2013)
JGR 1
Agenda
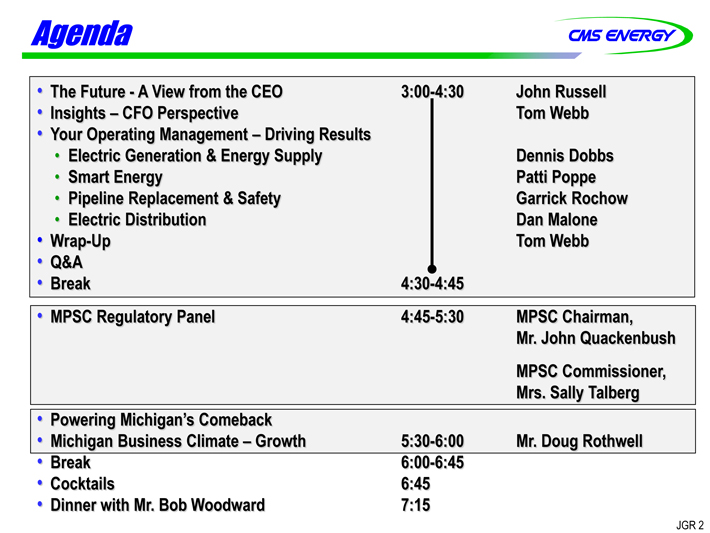
The Future - A View from the CEO 3:00-4:30 John Russell
Insights – CFO Perspective Tom Webb
Your Operating Management – Driving Results
Electric Generation & Energy Supply Dennis Dobbs
Smart Energy Patti Poppe
Pipeline Replacement & Safety Garrick Rochow
Electric Distribution Dan Malone
Wrap-Up Tom Webb
Q&A
Break 4:30-4:45
MPSC Regulatory Panel 4:45-5:30 MPSC Chairman,
Mr. John Quackenbush
MPSC Commissioner,
Mrs. Sally Talberg
Powering Michigan’s Comeback
Michigan Business Climate – Growth 5:30-6:00 Mr. Doug Rothwell
Break 6:00-6:45
Cocktails 6:45
Dinner with Mr. Bob Woodward 7:15
JGR 2
This presentation is made as of the date hereof and contains “forward-looking statements” as defined in Rule 3b-6 of the Securities Exchange Act of 1934, Rule 175 of the Securities Act of 1933, and relevant legal decisions. The forward-looking statements are subject to risks and uncertainties. All forward-looking statements should be considered in the context of the risk and other factors detailed from time to time in CMS Energy’s and Consumers Energy’s Securities and Exchange Commission filings. Forward-looking statements should be read in conjunction with “FORWARD-LOOKING STATEMENTS AND
INFORMATION” and “RISK FACTORS” sections of CMS Energy’s and Consumers Energy’s Form 10-K for the year ended December 31, 2012 and as updated in subsequent 10-Qs. CMS Energy’s and Consumers Energy’s “FORWARD-LOOKING STATEMENTS AND INFORMATION” and “RISK FACTORS” sections are incorporated herein by reference and discuss important factors that could cause CMS Energy’s and Consumers Energy’s results to differ materially from those anticipated in such statements. CMS Energy and Consumers Energy undertake no obligation to update any of the information presented herein to reflect facts, events or circumstances after the date hereof.
The presentation also includes non-GAAP measures when describing CMS Energy’s results of operations and financial performance. A reconciliation of each of these measures to the most directly comparable GAAP measure is included in the appendix and posted on our website at www.cmsenergy.com.
CMS Energy provides historical financial results on both a reported (Generally Accepted Accounting Principles) and adjusted (non-GAAP) basis and provides forward-looking guidance on an adjusted basis. Management views adjusted earnings as a key measure of the company’s present operating financial performance, unaffected by discontinued operations, asset sales, impairments, regulatory items from prior years, or other items. These items have the potential to impact, favorably or unfavorably, the company’s reported earnings in future periods. Because the company is not able to estimate the impact of these matters, the company is not providing a reconciliation to the comparable future period reported earnings.
JGR 3
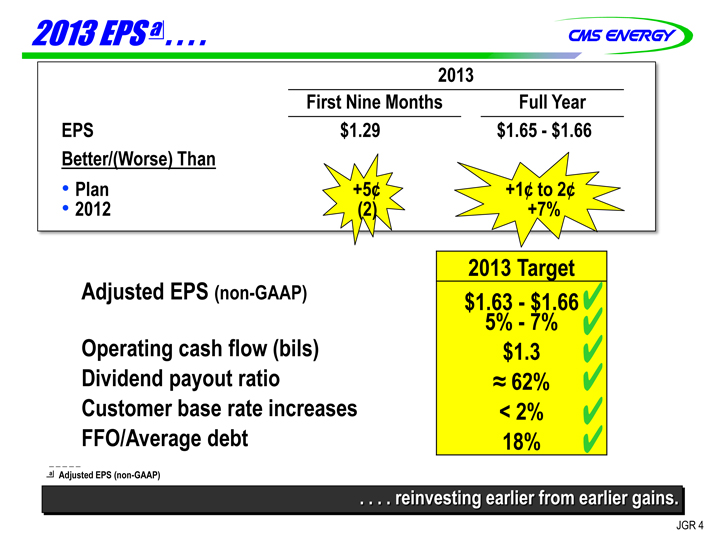
2013 EPS a .. . . .
2013
First Nine Months Full Year
EPS $1.29 $1.65 -$1.66
Better/(Worse) Than
Plan +5¢ +1¢ to 2¢
2012 (2) +7%
Adjusted EPS (non-GAAP) Operating cash flow (bils) Dividend payout ratio Customer base rate increases FFO/Average debt
a Adjusted EPS (non-GAAP)
2013 Target
$1.63 -$1.66
5% -7%
$1.3
62%
< 2%
18%
. . . . reinvesting earlier from earlier gains.
JGR 4
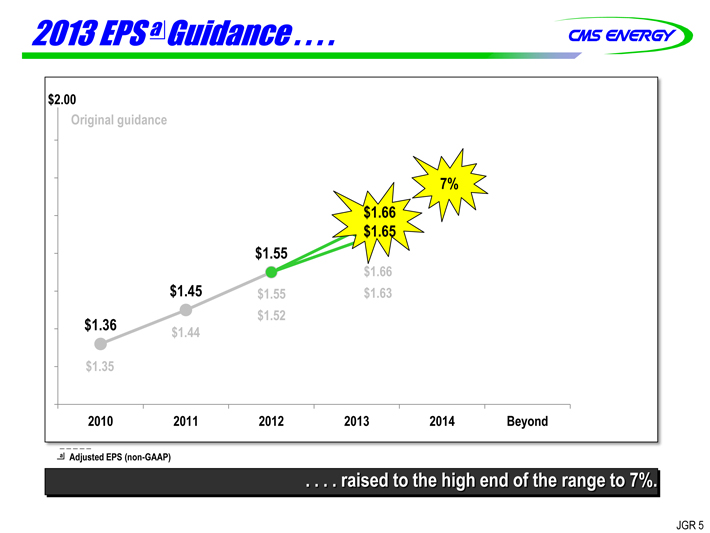
2013 EPS a Guidance . . . .
$2.00
Original guidance
7%
$1.66
$1.65
$1.55
$1.66
$1.45 $1.55 $1.63
$1.52
$1.36 $1.44
$1.35
2010 2011 2012 2013 2014 Beyond
a Adjusted EPS (non-GAAP)
. . . . raised to the high end of the range to 7%.
JGR 5
Vision
Best in Class
Best Value
Proud to Wear the Colors
JGR 6
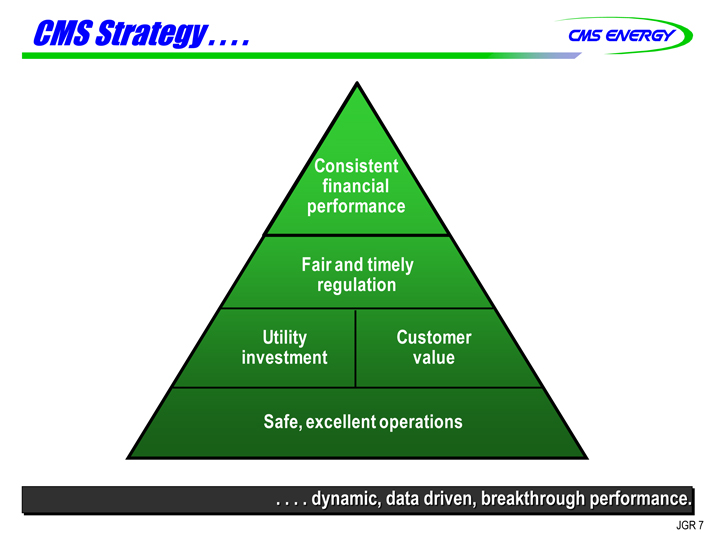
CMS Strategy . . . .
Consistent
financial
performance
Fair and timely
regulation
Utility
Customer
investment
value
Safe, excellent operations
. . . . dynamic, data driven, breakthrough performance.
JGR 7
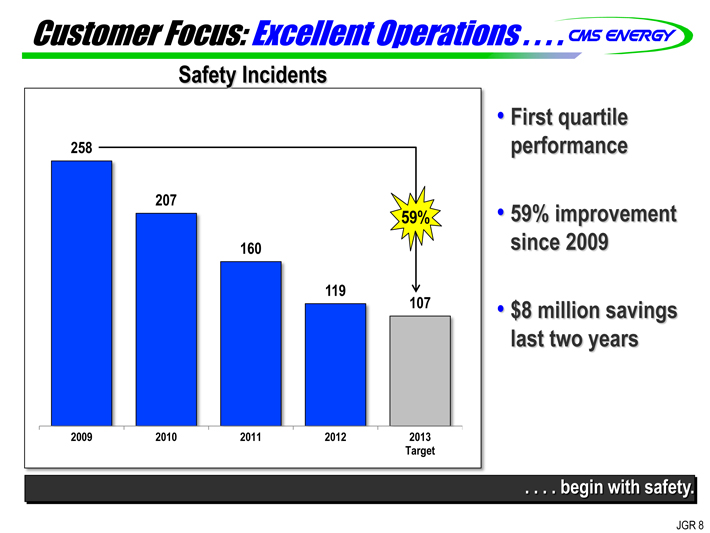
Customer Focus: Excellent Operations . . . .
Safety Incidents
258
207
59%
160
119 107
2009 2010 2011 2012 2013
Target
First quartile
performance
59% improvement
since 2009
$8 million savings
last two years
. . . . begin with safety.
JGR 8
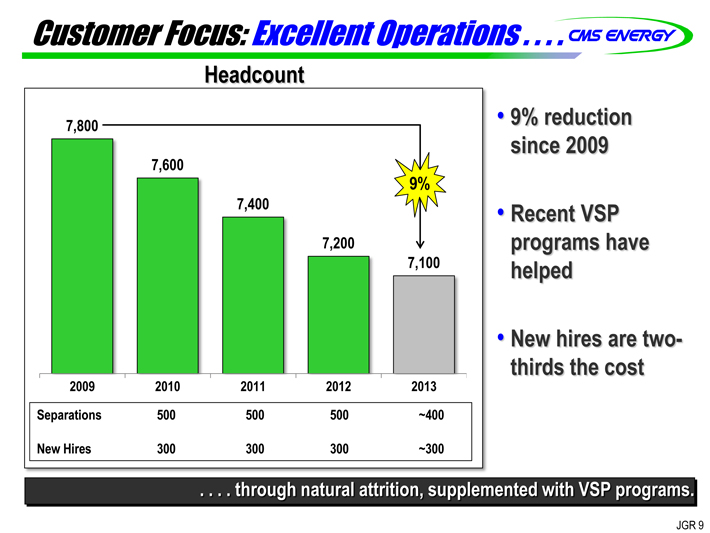
Customer Focus: Excellent Operations . . . .
Headcount
7,800
7,600
9%
7,400
7,200
7,100
2009 2010 2011 2012 2013
Separations 500 500 500 ~400
New Hires 300 300 300 ~300
9% reduction since 2009
Recent VSP programs have helped
New hires are two-thirds the cost
. . . . through natural attrition, supplemented with VSP programs.
JGR 9
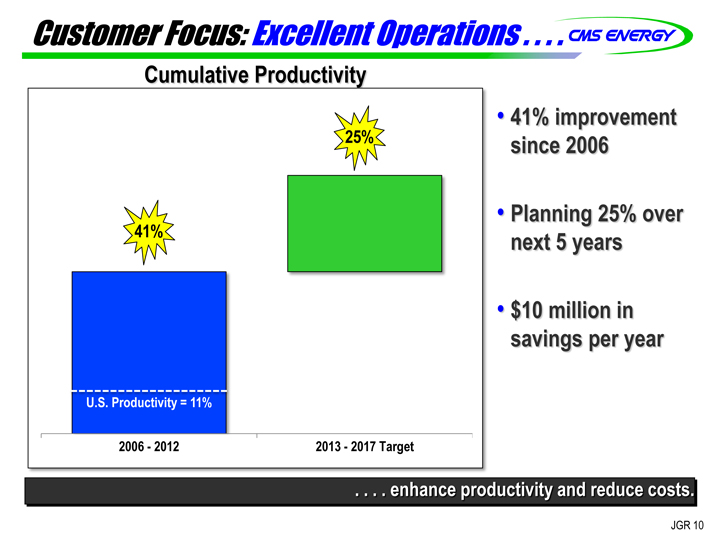
Customer Focus: Excellent Operations . . . .
Cumulative Productivity
25%
41%
U.S. Productivity = 11%
2006-2012 2013-2017 Target
41% improvement since 2006
Planning 25% over next 5 years
$10 million in savings per year
. . . . enhance productivity and reduce costs.
JGR 10
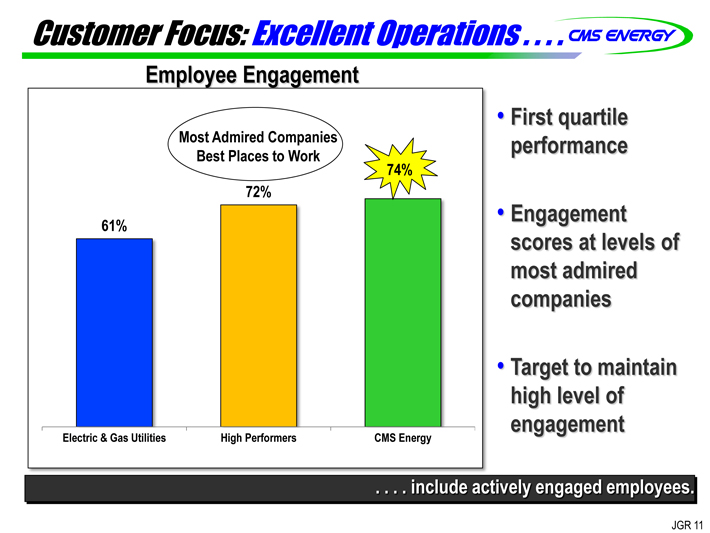
Customer Focus: Excellent Operations . . . .
Employee Engagement
Most Admired Companies
Best Places to Work
74%
72%
61%
Electric & Gas Utilities High Performers CMS Energy
First quartile performance
Engagement scores at levels of most admired companies
Target to maintain high level of engagement
. . . . include actively engaged employees.
JGR 11
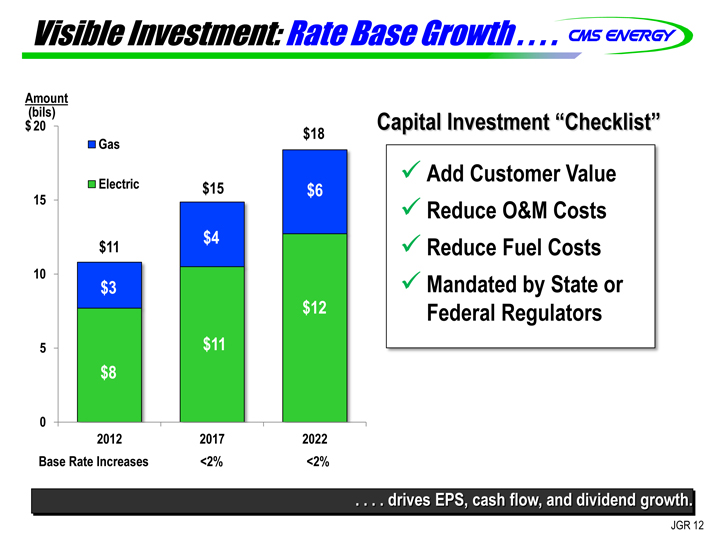
Visible Investment: Rate Base Growth . . . .
Amount
(bils)
$20 $18
Gas
15 Electric $15 $6
$11 $4
10
$3
$12
5 $11
$8
0
2012 2017 2022
Base Rate Increases <2% <2%
Capital Investment “Checklist”
Add Customer Value
Reduce
O&M Costs
Reduce
Fuel Costs
Mandated by State or
Federal
Regulators
. . . . drives EPS, cash flow, and dividend growth.
JGR 12
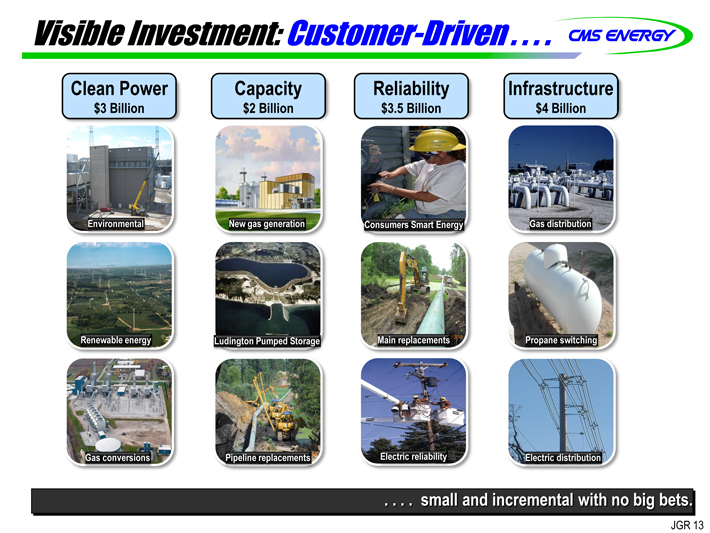
Visible Investment: Customer-Driven . . . .
Clean Power Capacity Reliability Infrastructure
$3 Billion $2 Billion $3.5 Billion $4 Billion
Environmental New gas generation Consumers Smart Energy Gas distribution
Renewable energy Ludington Pumped Storage Main replacements Propane switching
Gas conversions Pipeline replacements Electric reliability Electric distribution
. . . . small and incremental with no big bets.
JGR 13
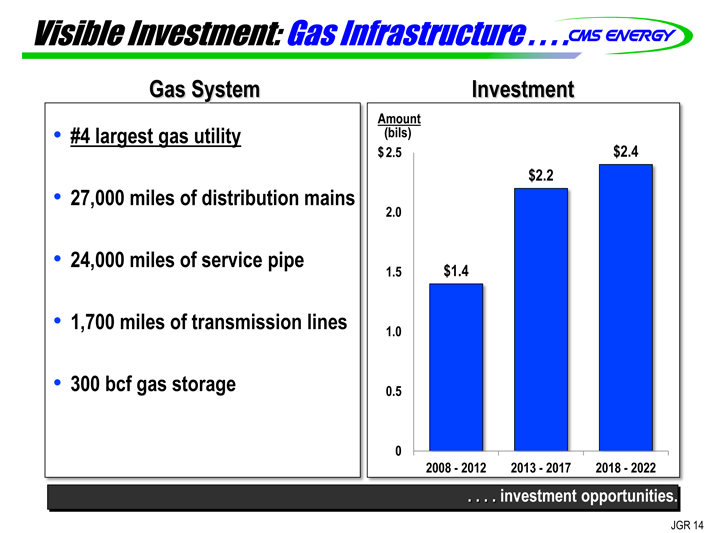
Visible Investment: Gas Infrastructure . . . .
Gas System
#4 largest gas utility
27,000 miles of distribution mains
24,000 miles of service pipe
1,700 miles of transmission lines
300 bcf gas storage
Investment
Amount
(bils)
$2.5 $2.4
$2.2
2.0
1.5 $1.4
1.0
0.5
0
2008-2012 2013-2017 2018-2022
. . . . investment opportunities.
JGR 14
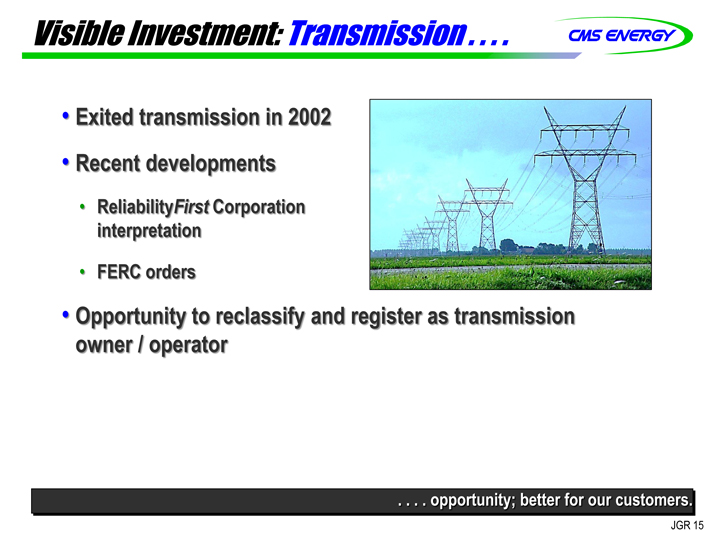
Visible Investment: Transmission . . . .
Exited transmission in 2002
Recent developments
ReliabilityFirst Corporation interpretation
FERC orders
Opportunity to reclassify and register as transmission owner / operator
. . . . opportunity; better for our customers.
JGR 15
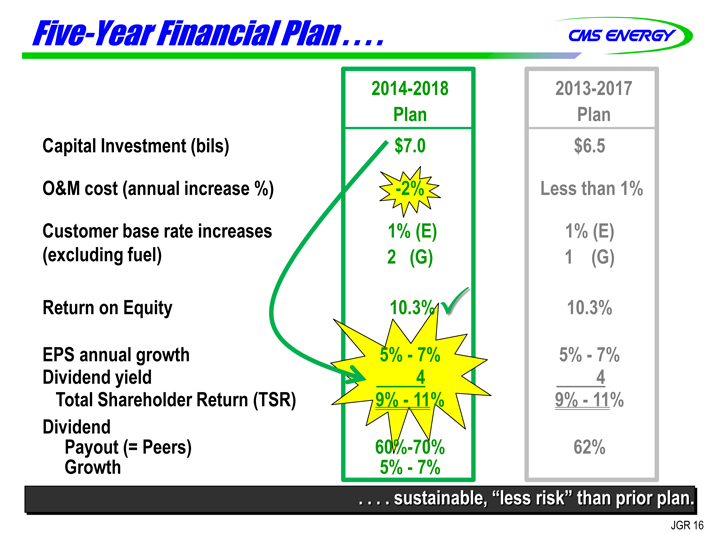
Five-Year Financial Plan . . . .
Capital Investment (bils) O&M cost (annual increase %) Customer base rate increases (excluding fuel)
Return on Equity EPS annual growth Dividend yield
Total Shareholder Return (TSR) Dividend Payout (= Peers) Growth
2014-2018 2013-2017
Plan Plan
$7.0 $6.5
-2% Less than 1%
1% (E) 1% (E)
2 (G) 1 (G)
10.3% 10.3%
5%-7% 5%-7%
4 4
9%-11% 9%-11%
60%-70% 62%
5%-7%
. . . . sustainable, “less risk” than prior plan.
JGR 16
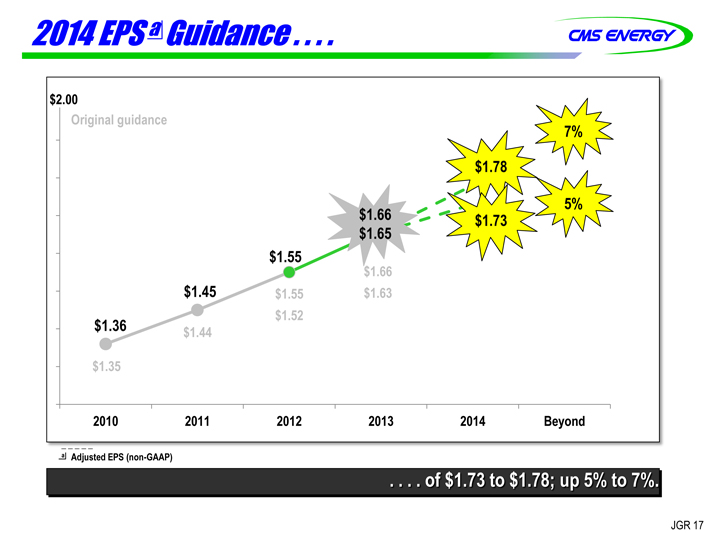
2014 EPS a Guidance . . . .
$2.00
Original guidance 7%
$1.78
5%
$ 1.65 $ 1.66 $1.73
$1.55
$1.66
$1.45 $1.55 $1.63
$1.36 $1.44
$1.35
2010 2011 2012 2013 2014 Beyond
a Adjusted EPS (non-GAAP)
. . . . of $1.73 to $1.78; up 5% to 7%.
JGR 17
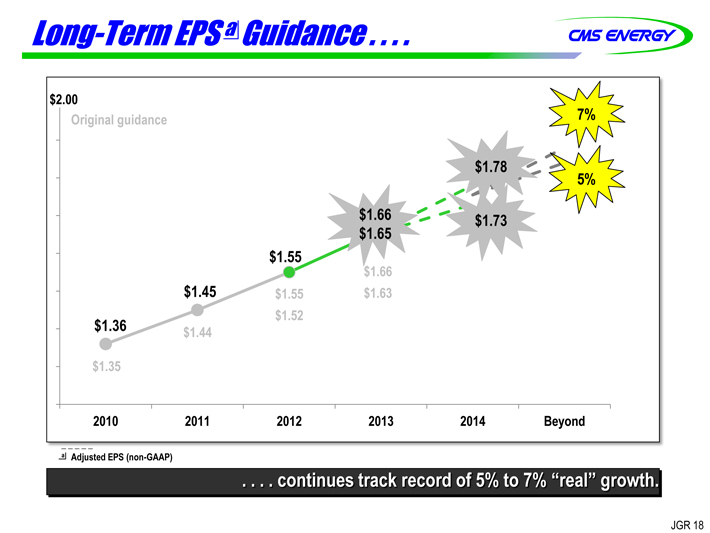
Long-Term EPS a Guidance . . . .
$2.00
Original guidance 7%
$1.78 5%
$1.66 $1.73
$1.65
$1.55
$1.66
$1.45 $1.55 $1.63
$1.52
$1.36 $1.44
$1.35
2010 2011 2012 2013 2014 Beyond
a Adjusted EPS (non-GAAP)
. . . . continues track record of 5% to 7% “real” growth.
JGR 18
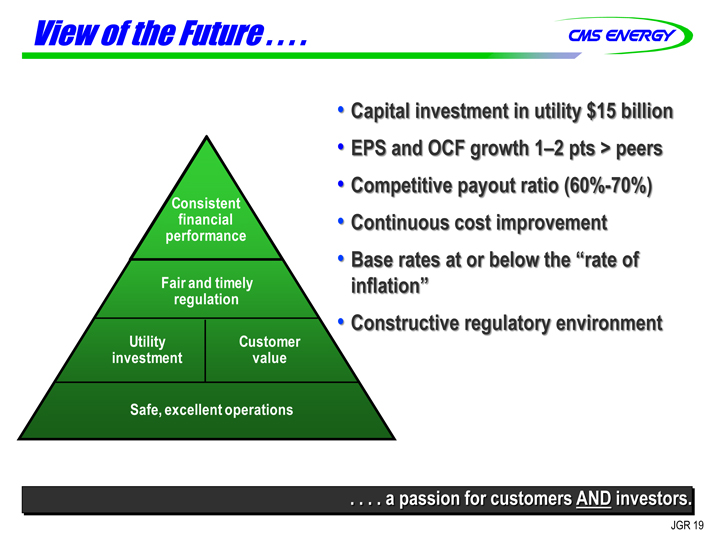
View of the Future . . . .
Consistent
financial
performance
Fair and timely
regulation
Utility
Customer
investment
value
Safe, excellent operations
Capital investment in utility $15 billion
EPS and OCF growth 1–2 pts > peers
Competitive payout ratio (60%-70%)
Continuous cost improvement
Base rates at or below the “rate of inflation”
Constructive regulatory environment
. . . . a passion for customers AND investors.
JGR 19

Tom Webb
Executive Vice President & CFO
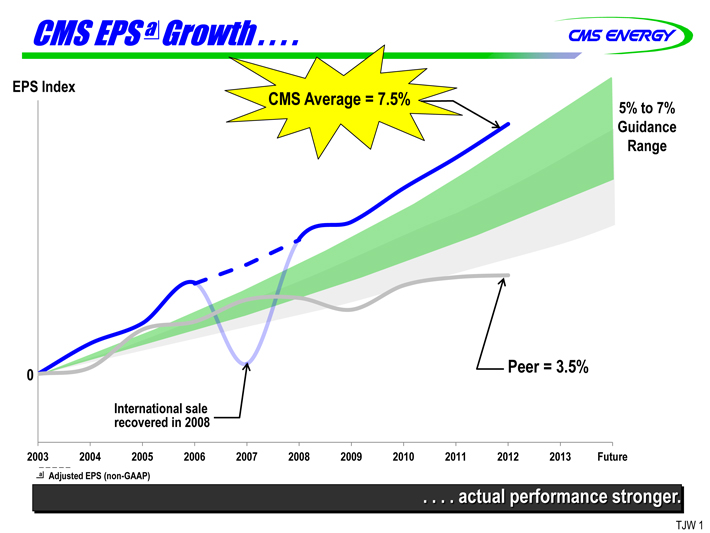
CMS EPS a Growth . . . .
EPS Index
CMS Average = 7.5% 5% to 7%
Guidance
Range
0 Peer = 3.5%
International sale
recovered in 2008
2003 2004 2005 2006 2007 2008 2009 2010 2011 2012 2013 Future
a Adjusted EPS (non-GAAP)
. . . . actual performance stronger.
TJW 1
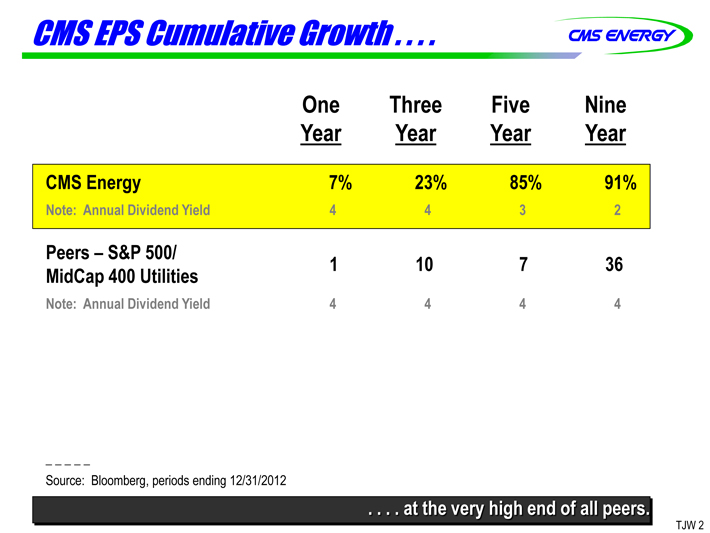
CMS EPS Cumulative Growth . . . .
One Three Five Nine
Year Year Year Year
CMS Energy 7% 23% 85% 91%
Note: Annual Dividend Yield 4 4 3 2
Peers – S&P 500/
MidCap 400 Utilities 1 10 7 36
Note: Annual Dividend Yield 4 4 4 4
Source: Bloomberg, periods ending 12/31/2012
. . . . at the very high end of all peers.
TJW 2
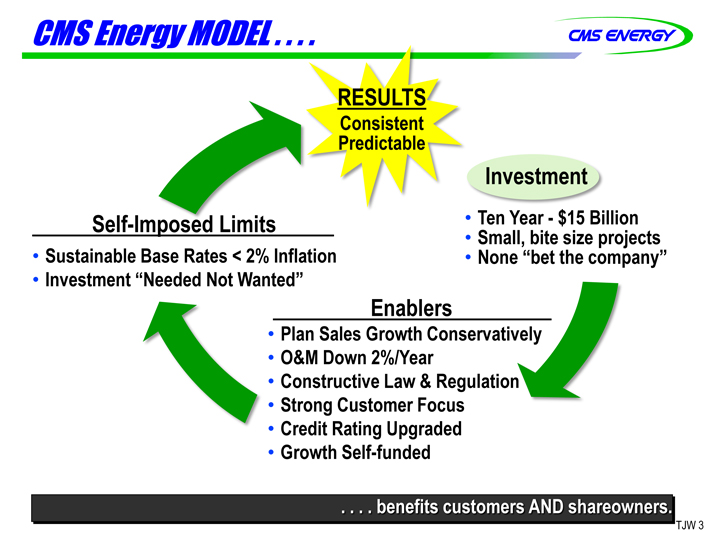
CMS Energy MODEL . . . .
RESULTS
Consistent
Predictable
Investment
Self-Imposed Limits • Ten Year - $15 Billion
• Small, bite size projects
Sustainable Base Rates < 2% Inflation None “bet the company”
Investment “Needed Not Wanted”
Enablers
• Plan Sales Growth Conservatively
• O&M Down 2%/Year
• Constructive Law & Regulation
• Strong Customer Focus
• Credit Rating Upgraded
• Growth Self-funded
. . . . benefits customers AND shareowners.
TJW 3
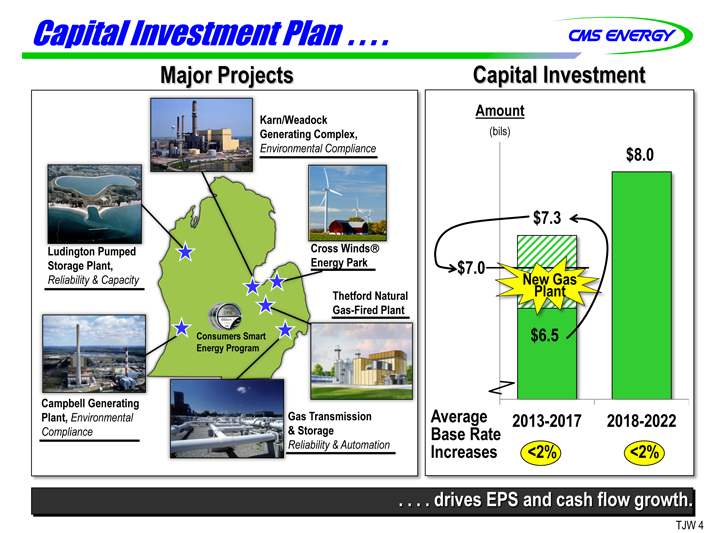
Capital Investment Plan . . . .
Major Projects
Karn/Weadock
Generating Complex,
Environmental Compliance
Ludington Pumped
Cross Winds®
Storage Plant, Energy Park
Reliability & Capacity
Thetford Natural
Gas-Fired Plant
Consumers Smart
Energy Program
Campbell Generating
Plant, Environmental Gas Transmission
Compliance & Storage
Reliability & Automation
Capital Investment
Amount
(bils)
$8.0
$7.3
$7.0
New Gas
Plant
$6.5
Average
2013-2017
2018-2022
Base Rate
Increases
<2%
<2%
. . . . drives EPS and cash flow growth.
TJW 4
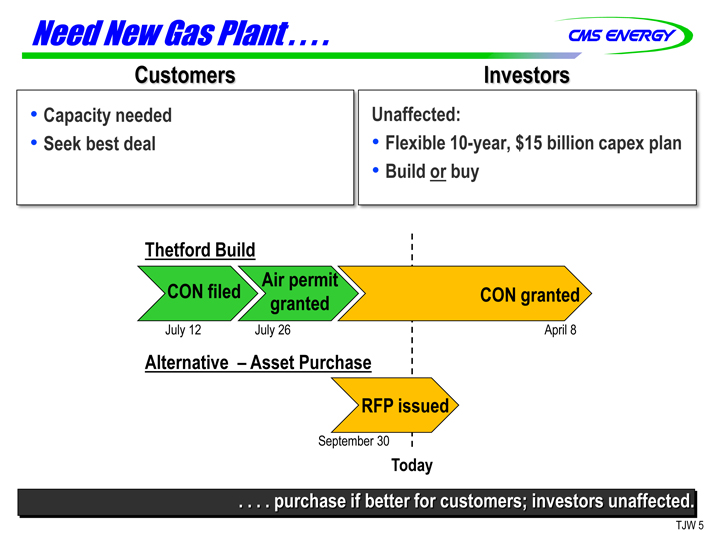
Need New Gas Plant . . . .
Customers Investors
Capacity needed Unaffected:
Seek best deal • Flexible 10-year, $15 billion capex plan • Build or buy
Thetford Build
Air permit
CON filed granted CON granted
July 12 July 26 April 8
Alternative – Asset Purchase
RFP issued
September 30
Today
. . . . purchase if better for customers; investors unaffected.
TJW 5
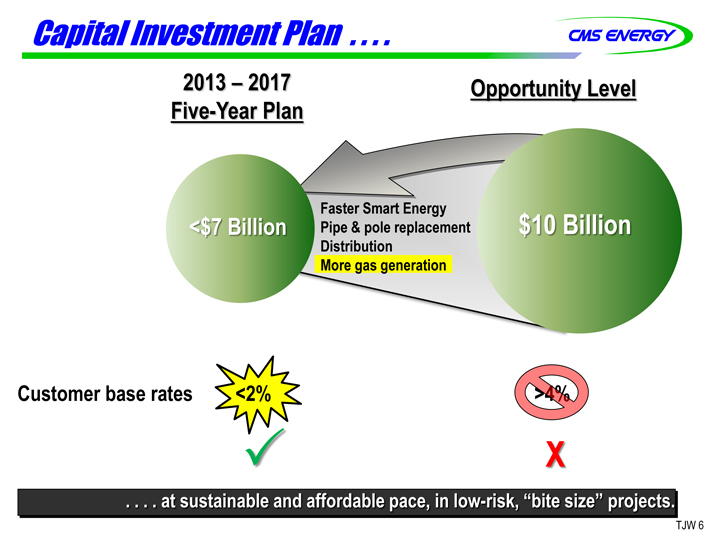
Capital Investment Plan . . . .
2013 – 2017 Opportunity Level
Five-Year Plan
<$7 Billion Pipe Faster & Smart pole replacement Energy $10 Billion
Distribution
More gas generation
Customer base rates <2% >4%
X
. . . . at sustainable and affordable pace, in low-risk, “bite size” projects.
TJW 6
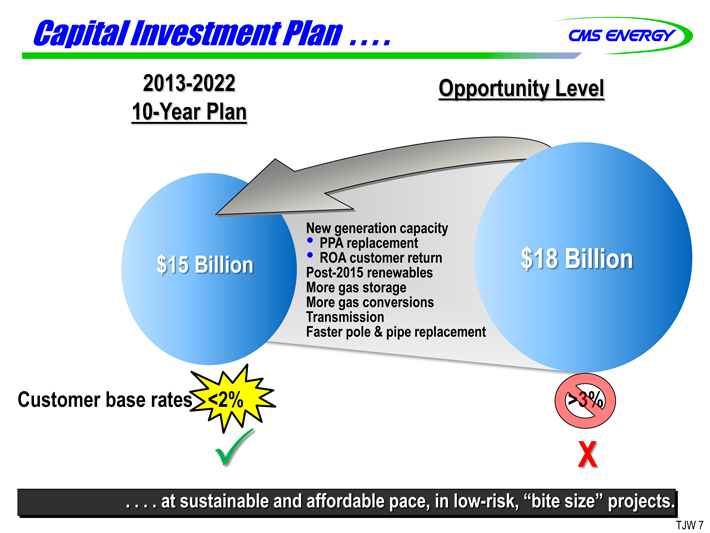
Capital Investment Plan . . . .
2013-2022 Opportunity Level
10-Year Plan
New generation capacity
• PPA replacement
$15 Billion • ROA customer return $18 Billion
Post-2015 renewables
More gas storage
More gas conversions
Transmission
Faster pole & pipe replacement
Customer base rates <2% >3%
X
. . . . at sustainable and affordable pace, in low-risk, “bite size” ojects.
TJW 7
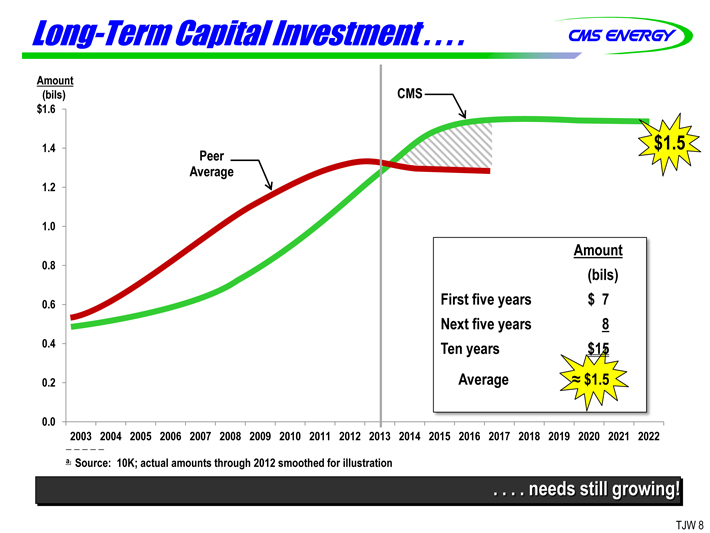
Long-Term Capital Investment . . . .
Amount
(bils) CMS
$1.6
1.4 $1.5
Peer
Average
1.2
1.0
Amount
0.8 (bils)
0.6 First five years $ 7
Next five years 8
0.4 Ten years $15
0.2 Average $1.5
0.0
2003 2004 2005 2006 2007 2008 2009 2010 2011 2012 2013 2014 2015 2016 2017 2018 2019 2020 2021 2022
a Source: 10K; actual amounts through 2012 smoothed for illustration
. . . . needs still growing!
TJW 8
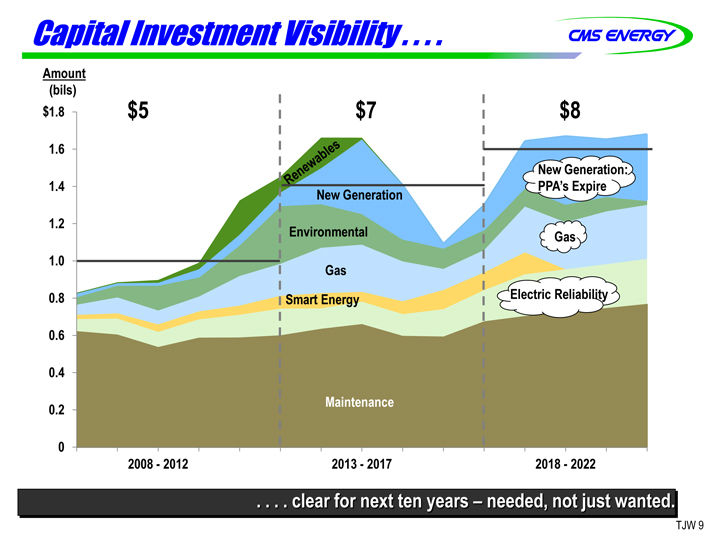
Capital Investment Visibility . . . .
Amount
(bils)
$1.8 $5 $7 $8
1.6
New Generation:
1.4 PPA’s Expire
New Generation
1.2 Environmental Gas
1.0 Gas
0.8 Smart Energy Electric Reliability
0.6
0.4
0.2 Maintenance
0
2008 - 2012 2013 - 2017 2018 - 2022
. . . . clear for next ten years – needed, not just wanted.
TJW 9
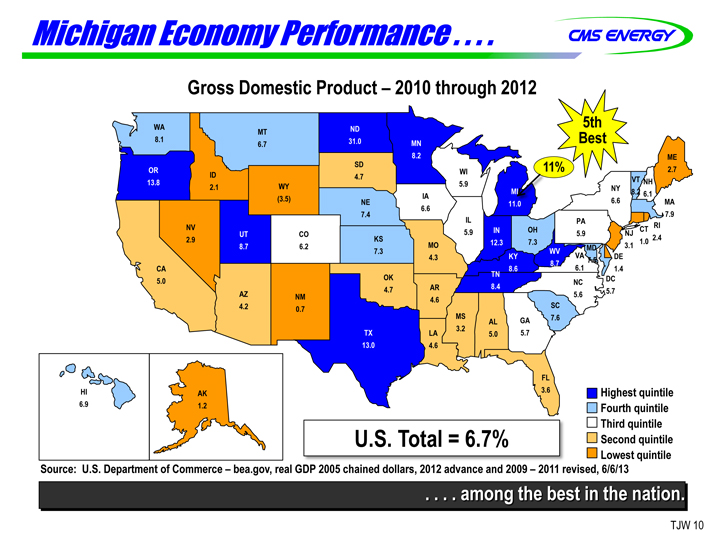
Michigan Economy Performance . . . .
Gross Domestic Product – 2010 through 2012
WA ND 5th
MT
8.1 6.7 31.0 MN Best
8.2 ME
OR SD WI 11% 2.7
13.8 ID 4.7 5.9 VT NH
2.1 (3.5) WY IA MI 6.6 NY 8.2 6.1 MA
NE 11.0
6.6
7.4 7.9
IL PA
NV UT CO 5.9 IN OH 5.9 NJ CT RI
2.9 8.7 6.2 KS MO 12.3 7.3 MD 3.1 1.0 2.4
7.3 4.3 KY WV VA 7.5 DE
8.7
CA 8.6 6.1 1.4
OK TN
5.0 NC DC
4.7 AR 8.4 5.7
AZ NM 4.6 5.6
4.2 0.7 SC
MS AL GA 7.6
TX LA 3.2 5.0 5.7
13.0 4.6
FL
HI AK 3.6 Highest quintile
6.9 1.2 Fourth quintile
Third quintile
U.S. Total = 6.7% Second quintile
Lowest quintile
Source: U.S. Department of Commerce – bea.gov, real GDP 2005 chained dollars, 2012 advance and 2009 – 2011 revised, 6/6/13
. . . . among the best in the nation.
TJW 10
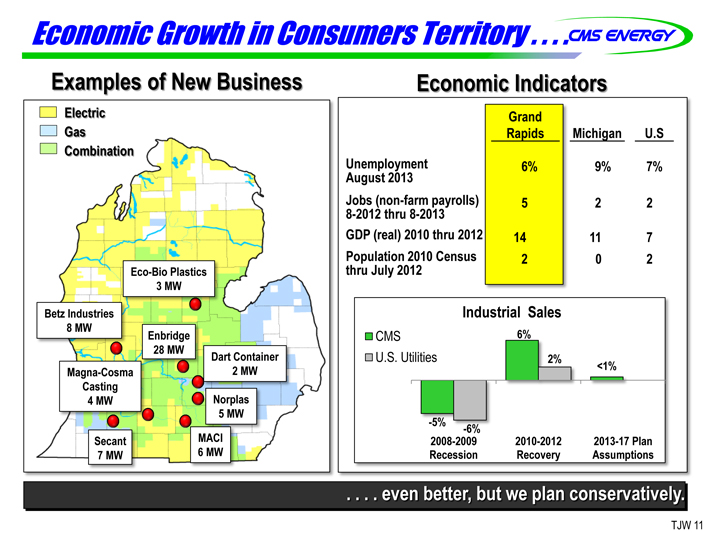
Economic Growth in Consumers Territory . . . .
Examples of New Business
Electric
Gas
Combination
Eco-Bio Plastics
3 MW
Betz Industries
8 MW
Enbridge
28 MW
Dart Container
Magna-Cosma
2 MW
Casting
4 MW
Norplas
5 MW
Secant
MACI
7 MW
6 MW
Economic Indicators
Grand
Rapids Michigan U.S
Unemployment 6% 9% 7%
August 2013
Jobs (non-farm payrolls) 5 2 2
8-2012 thru 8-2013
GDP (real) 2010 thru 2012 14 11 7
Population 2010 Census 2 0 2
thru July 2012
Industrial Sales
CMS 6%
U.S. Utilities 2% <1%
-5% -6%
2008-2009 2010-2012 2013-17 Plan
Recession Recovery Assumptions
. . . . even better, but we plan conservatively.
TJW 11
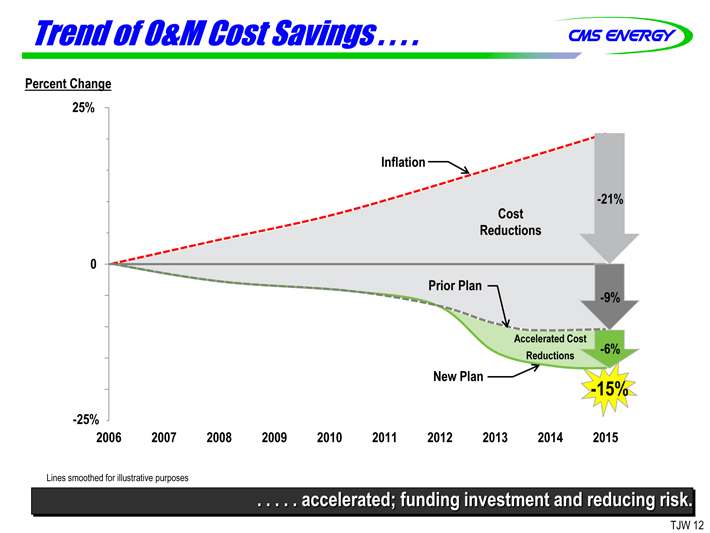
Trend of O&M Cost Savings . . . .
Percent Change
25%
Inflation
-21%
Cost
Reductions
0
Prior Plan
-9%
Accelerated Cost
Reductions -6%
New Plan -15%
-25%
2006 2007 2008 2009 2010 2011 2012 2013 2014 2015
Lines smoothed for illustrative purposes
. . . . .. accelerated; funding investment and reducing risk.
TJW 12

Continuous Cost Reduction . . . .
2012 over 2006 Electric Non-fuel
O&M Cost
Peer Average up 6%
-0.4%
Consumers
Source: SNL data service
How – One Example
Headcount
7,600
7,200
$100k
Each
600
$60k
1,000
Each
2010
2012
People Productivity = $64 Million
. . . . . part of CMS mindset.
TJW 13
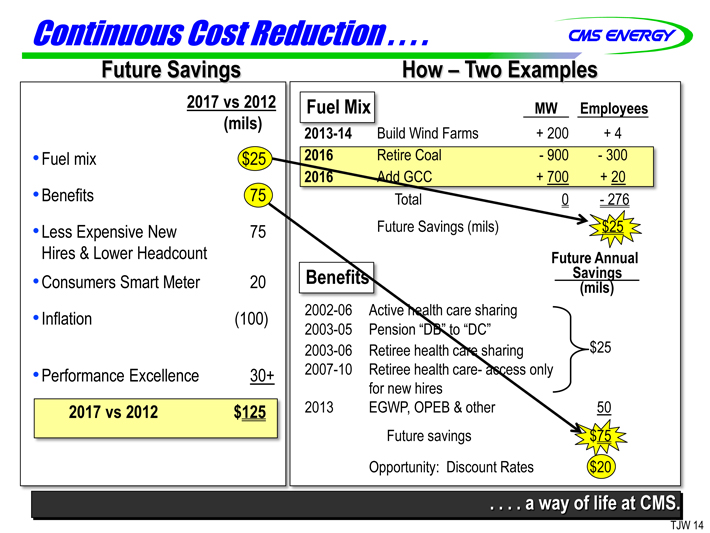
Continuous Cost Reduction . . . .
Future Savings
2017 vs 2012
(mils)
Fuel mix
$25
Benefits
75
Less Expensive New
75
Hires & Lower Headcount
Consumers Smart Meter
20
Inflation
(100)
Performance Excellence
30+
2017 vs 2012
$125
How – Two Examples
Fuel Mix MW Employees
2013-14 Build Wind Farms + 200 + 4
2016 Retire Coal - 900 - 300
2016 Add GCC + 700 + 20
Total 0 - 276
Future Savings (mils) $25
Future Annual
Benefits Savings
(mils)
2002-06 Active health care sharing
2003-05 Pension “DB” to “DC”
2003-06 Retiree health care sharing $25
2007-10 Retiree health care- access only
for new hires
2013 EGWP, OPEB & other 50
Future savings $75
Opportunity: Discount Rates $20
. . . . a way of life at CMS.
TJW 14
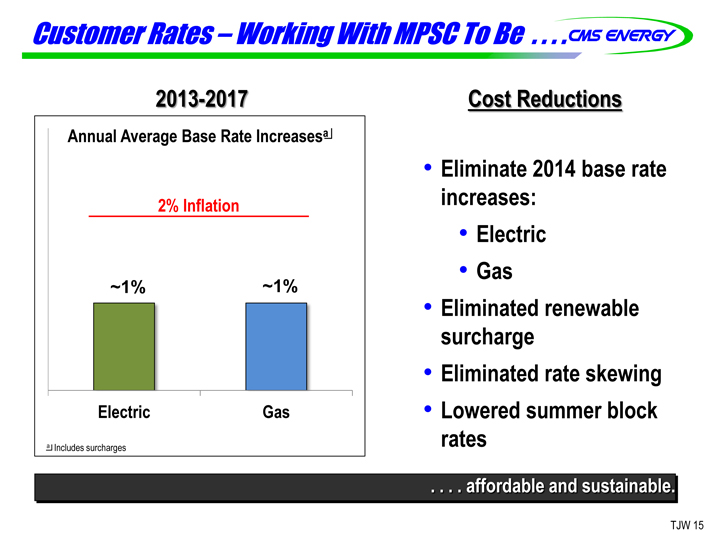
Customer Rates – Working With MPSC To Be . . . .
2013-2017
Annual Average Base Rate Increases a
2% Inflation
~1% ~1%
Electric Gas
a Includes surcharges
Cost Reductions
Eliminate 2014 base rate increases:
Electric
Gas
Eliminated renewable surcharge
Eliminated rate skewing
Lowered summer block rates
. . . . affordable and sustainable.
TJW 15
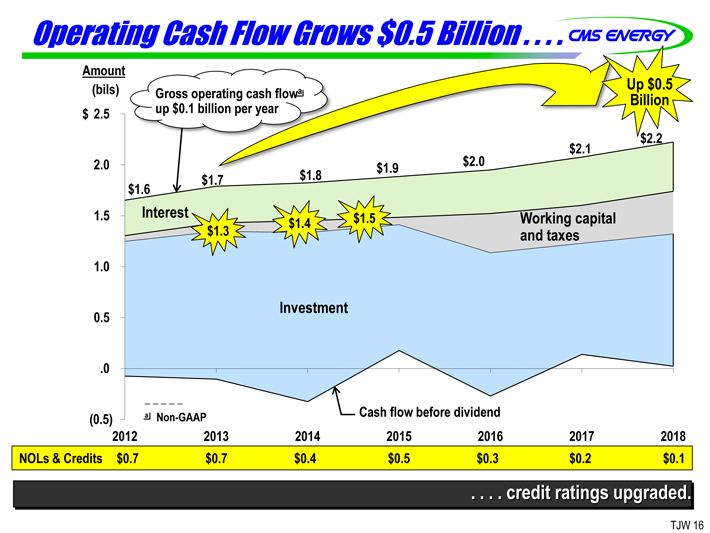
Operating Cash Flow Grows $0.5 Billion . . . .
Amount
(bils) Gross operating cash flow a Up $0.5
Billion
$ 2.5 up $0.1 billion
$2.2
2.0
$1.6 $1.7 $1.8 $1.9 $2.1
1.5 Interest $1.4 $1.5 Working capital
$1.3 and taxes
1.0
0.5 Investment
.0
(0.5) a Non-GAAP Cash flow before dividend
2012 2013 2014 2015 2016 2017 2018
NOLs & Credits $0.7 $0.7 $0.4 $0.5 $0.3 $0.2 $0.1
. . . . credit ratings upgraded.
TJW 16
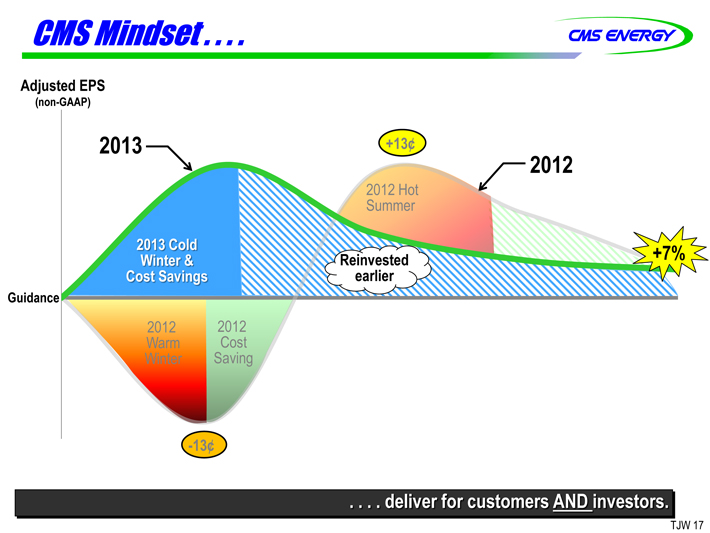
CMS Mindset . . . .
Adjusted EPS
(non-GAAP)
2013 +13¢ 2012
2012 Hot
Summer
2013 Cold +7%
Winter & Reinvested
Cost Savings earlier
Guidance
2012 2012
Warm Cost
Winter Saving
-13¢
. . . . deliver for customers AND investors.
TJW 17
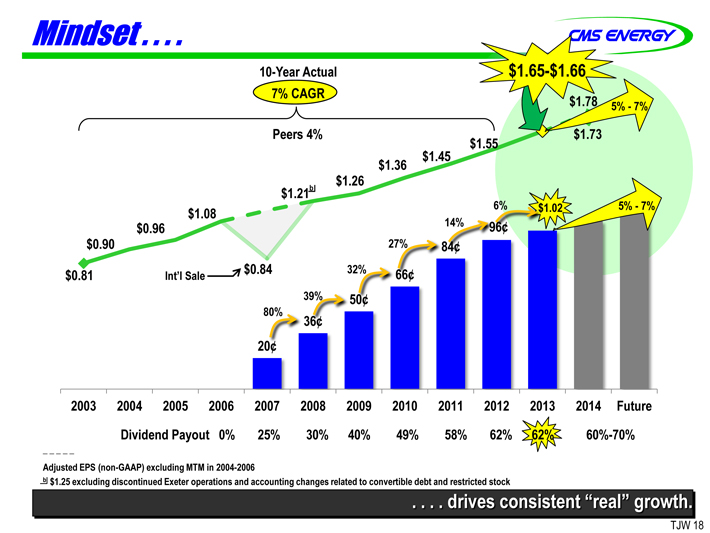
Mindset . .. . .
10-Year Actual $1.65-$1.66
7% CAGR $1.78 5% -7%
Peers 4% $1.73
$1.55
$1.36 $1.45
$1.26
$1.21b
$1.08 6% 5% -7%
$0.96 14%
$0.90
$0.81 Int’l Sale $0.84 32%
80%
20
39% 36 50 27 66 84 96 $1.02
2003 2004 2005 2006 2007 2008 2009 2010 2011 2012 2013 2014 Future
Dividend Payout 0% 25% 30% 40% 49% 58% 62% 62% 60%-70%
Adjusted EPS (non-GAAP) excluding MTM in 2004-2006
b $1.25 excluding discontinued Exeter operations and accounting changes related to convertible debt and restricted stock
. . . . drives consistent “real” growth.
TJW 18

Electric Generation & Energy Supply
Dennis Dobbs Vice President Generation Engineering & Services
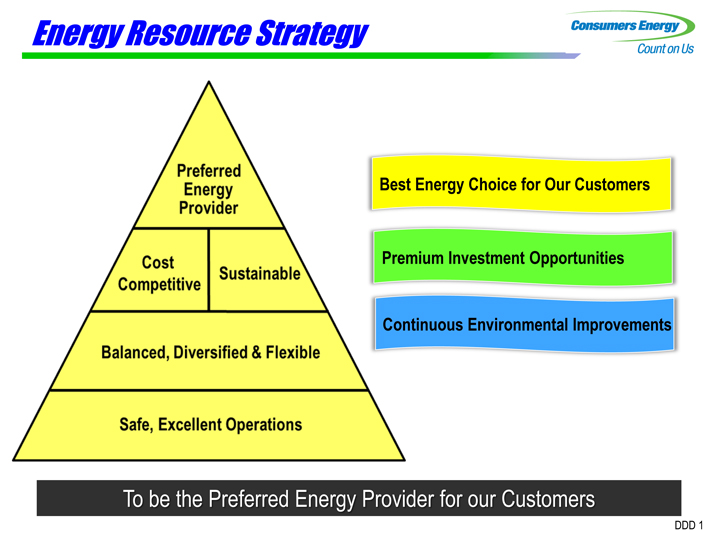
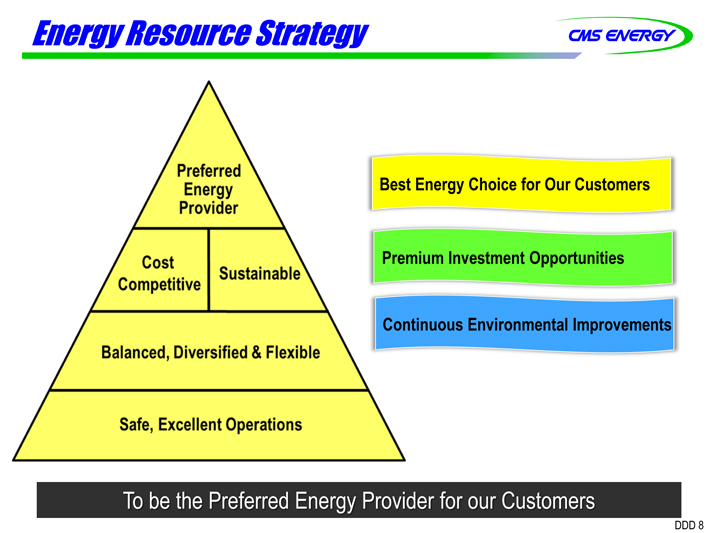
Energy Resource Strategy
Best Energy Choice for Our Customers Premium Investment Opportunities Continuous Environmental Improvements
To be the Preferred Energy Provider for our Customers
Preferred Energy Provider
Cost Competitive Sustainable Balanced, Diversified & Flexible
Safe, Excellent Operations
DDD 1
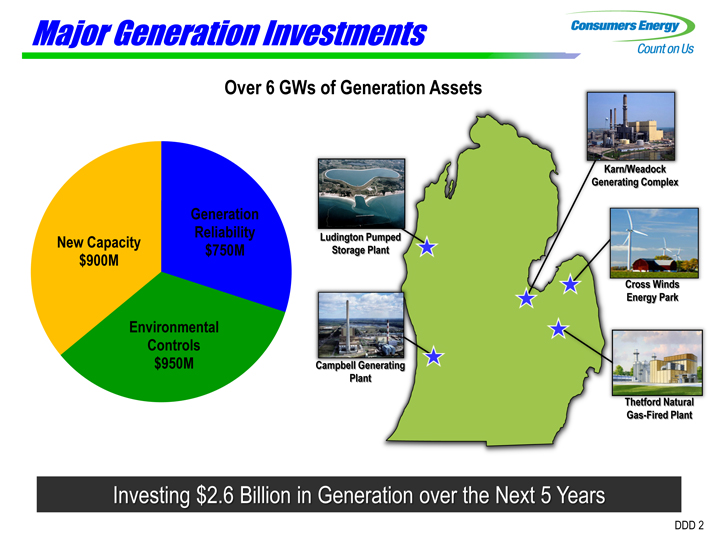
Major Generation Investments
Over 6 GWs of Generation Assets
Generating Complex
Generation
Reliability
New Capacity $750M Storage Plant
$900M
Energy Park
Environmental
Controls
$950M
Plant
Gas-Fired Plant
Ludington Pumped Cambell Generating Kam/Weadock Cross Winds Thetford Natural
Investing $2.6 Billion in Generation over the Next 5 Years
DDD 2
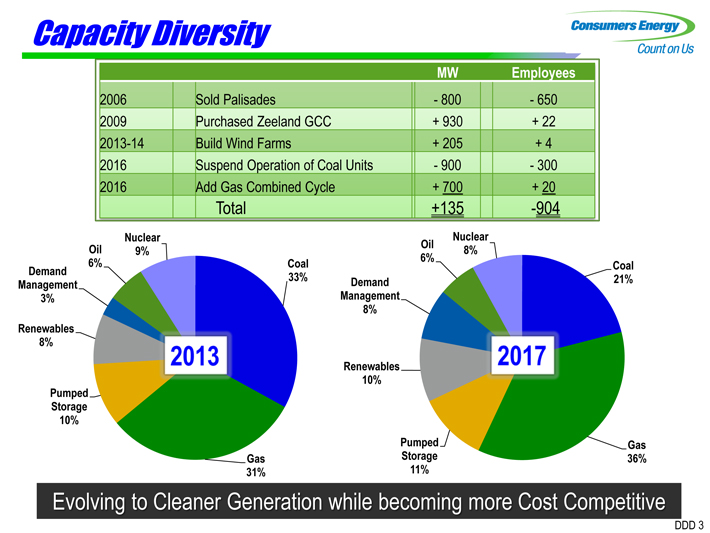
Capacity Diversity
MW Employees
2006 Sold Palisades - 800 -650
2009 Purchased Zeeland GCC + 930 + 22
2013-14 Build Wind Farms + 205 + 4
2016 Suspend Operation of Coal Units - 900 -300
2016 Add Gas Combined Cycle + 700 + 20
Total +135 -904
Nuclear Nuclear
Oil 9% Oil 8%
6% Coal 6% Coal
Demand
Management 33% Demand 21%
3% Management
8%
Renewables
8%
Renewables
10%
Pumped
Storage
10%
Pumped Gas
Gas Storage 36%
31% 11%
Evolving to Cleaner Generation while becoming more Cost Competitive
DDD 3

Projected CO2 Intensity
2,500
Existing Coal
2,000
Range for Potential Regulation on Existing Sources
MWh 1,500
per Consumers Energy Projected CO2 Intensity
2
CO 1,000
of Natural Gas Combined Cycle
Pounds
500
0 Nuclear, Wind & Solar
2013 2014 2015 2016 2017 2018 2019 2020 2021 2022 2023 2024 2025
Positioned well for potential CO2 regulations
DDD 4
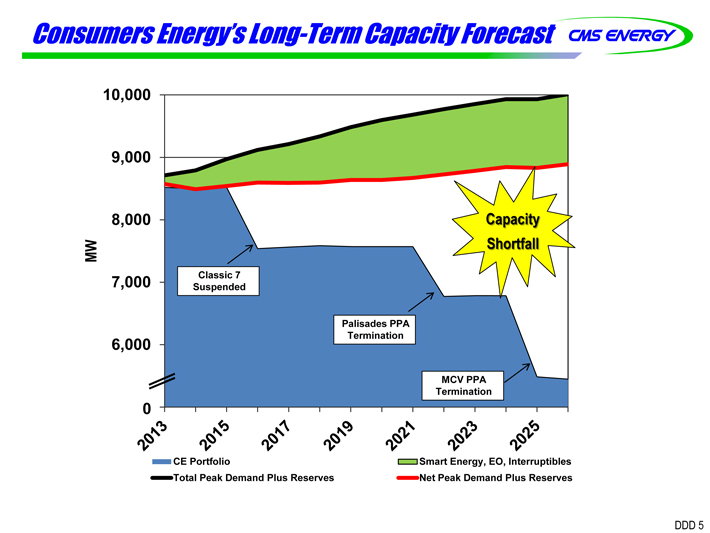
Consumers Energy’s Long-Term Capacity Forecast
10,000
9,000
8,000 Capacity
MW Shortfall
7,000 Suspended Classic 7
Palisades PPA
6,000 Termination
MCV PPA
Termination
0
2013 2015 2017 2019 2021 2023 2025
CE Portfolio Smart Energy, EO, Interruptibles
Total Peak Demand Plus Reserves Net Peak Demand Plus Reserves
DDD 5
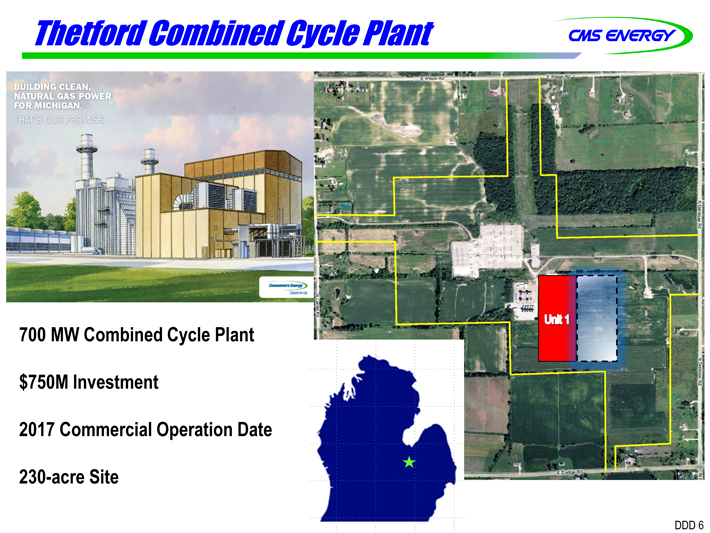
Thetford Combined Cycle Plant
700 MW Combined Cycle Plant $750M Investment 2017 Commercial Operation Date 230-acre Site
BUILDING CLEAN, NATURAL GAS POWER FOR MICHIGAN THAT’S OUR PROMISE
DDD 6
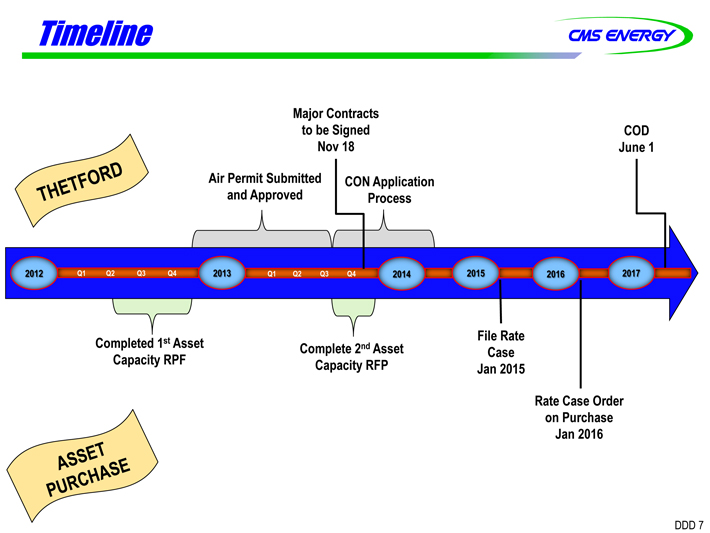
Timeline
Major Contracts
to be Signed COD
Nov 18 June 1
Air Permit Submitted CON Application
and Approved Process
2012 Q1 Q2 Q3 Q4 2013 Q1 Q2 Q3 Q4 2014 2015 2016 2017
File Rate
Completed Capacity 1st RPF Asset Complete 2nd Asset Case
Capacity RFP Jan 2015
Rate Case Order
on Purchase
Jan 2016
THETFORD ASSET PURCHASE
DDD 7
Energy Resource Strategy
Best Energy Choice for Our Customers Premium Investment Opportunities Continuous Environmental Improvements
To be the Preferred Energy Provider for our Customers
Preferred Energy Provider Cost Competitive Sustainable Balanced, Diversified & Flexible Safe, Excellent Operations
DDD 8
State of the Business Smart Energy
Patti Poppe
Vice President Customer Experience
& Operations
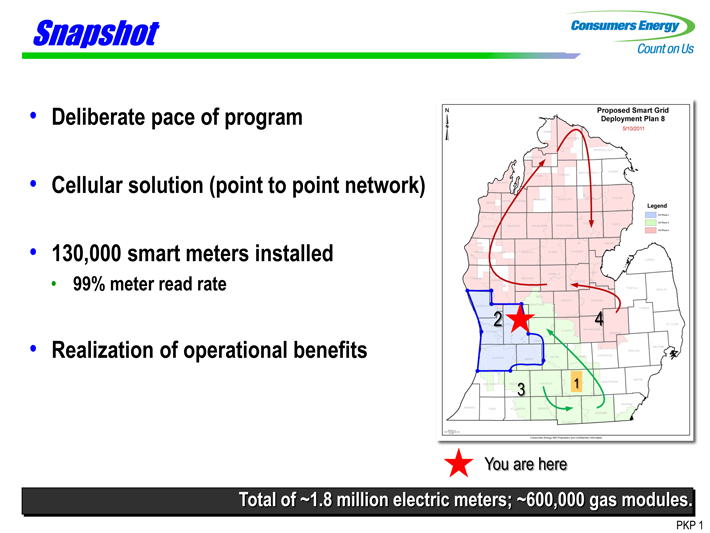
Snapshot
Deliberate pace of program
Cellular solution (point to point network)
130,000 smart meters installed
99% meter read rate
Realization of operational benefits
2 4
3 1
You are here Proposed Smart Grid Deployment Plan8 5/10/2011
Total of ~1.8 million electric meters; ~600,000 gas modules.
PKP 1
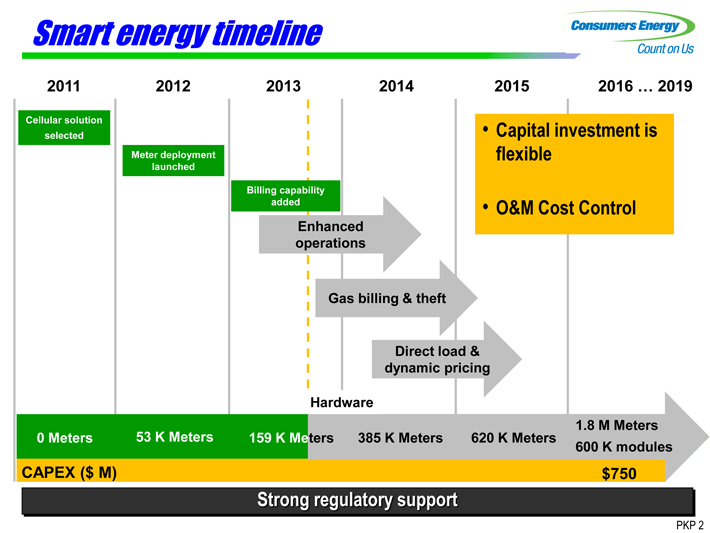
Smart energy timeline
2011 2012 2013 2014 2015 2016 … 2019
Cellular solution • Capital investment is
selected
Meter deployment flexible
launched
Billing capability
added • O&M Cost Control
Enhanced
operations
Gas billing & theft
Direct load &
dynamic pricing
Hardware
1.8 M Meters
0 Meters 53 K Meters 159 K Meters 385 K Meters 620 K Meters 600 K modules
CAPEX ($ M) $750
Strong regulatory support
PKP 2
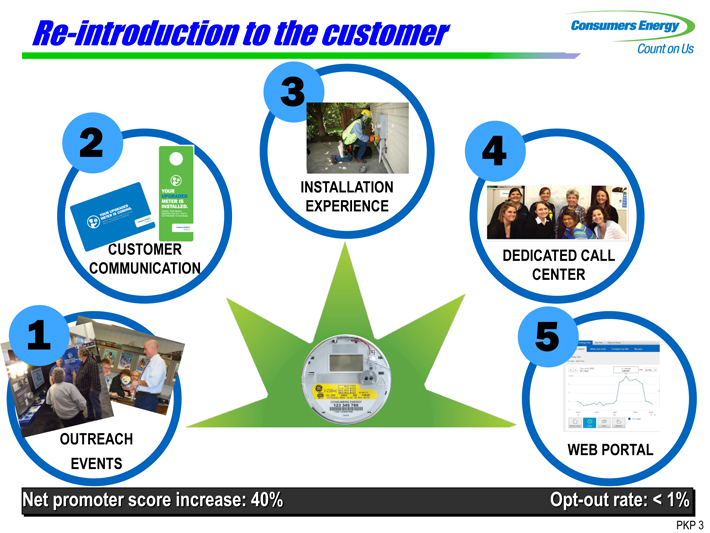
Re-introduction to the customer
3
2 4
INSTALLATION
EXPERIENCE
CUSTOMER DEDICATED CALL
COMMUNICATION CENTER
1 5
OUTREACH WEB PORTAL
EVENTS
Net promoter score increase: 40%
Opt-out rate: < 1%
PKP 3
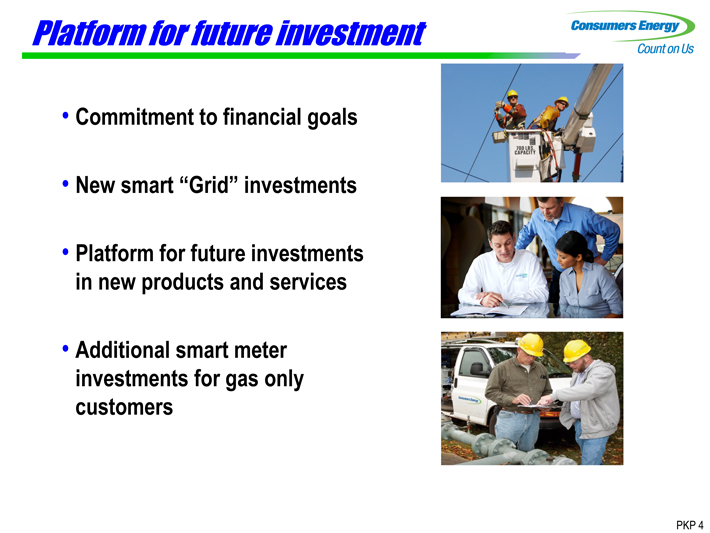
Platform for future investment
Commitment to financial goals
New smart “Grid” investments
Platform for future investments in new products and services
Additional smart meter investments for gas only customers
PKP 4

Pipeline Replacement & Safety
Garrick Rochow
Vice President of Energy Delivery
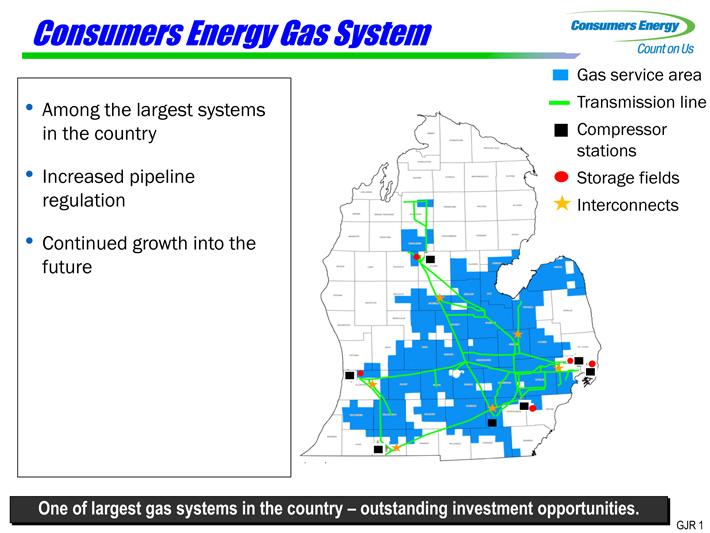
Consumers Energy Gas System
Among the largest systems in the country
Increased pipeline regulation
Continued growth into the future
Gas service area Transmission line Compressor stations Storage fields Interconnects
One of largest gas systems in the country – outstanding investment opportunities.
GJR 1
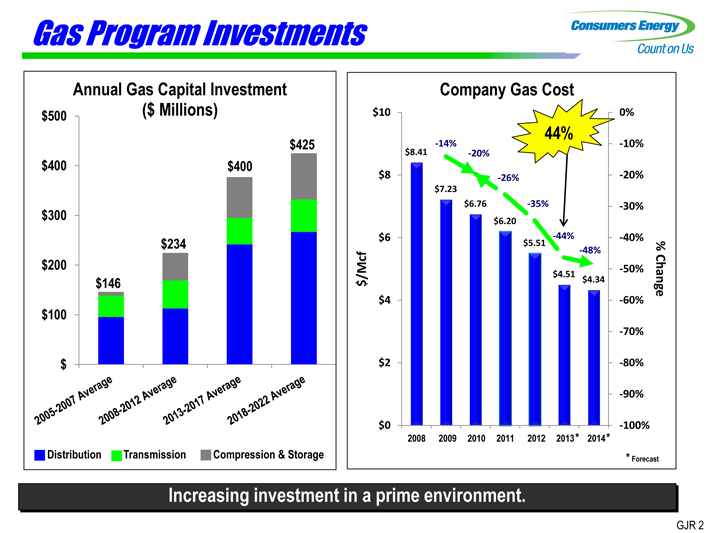
Gas Program Investments
Annual Gas Capital Investment
$500
($ Millions)
$425
$400
$400
$300
$234
$200
$146
$100
$
Distribution
Transmission
Compression & Storage
Company Gas Cost
$10 0%
44%
-14% -10%
$8.41 -20%
$8 -26% -20%
$7.23
$6.76 -35% -30%
$6.20
$6 -44% -40%
$5.51 -48%
$/Mcf $4.51 -50%
$4.34% Change
$4 -60%
-70%
$2 -80%
-90%
$0 -100%
2008 2009 2010 2011 2012 2013 * 2014 *
* Forecast 2005-2007 Average 2008-2012 Average 2013-2017 Average 2018-2022 Average
Increasing investment in a prime environment.
GJR 2
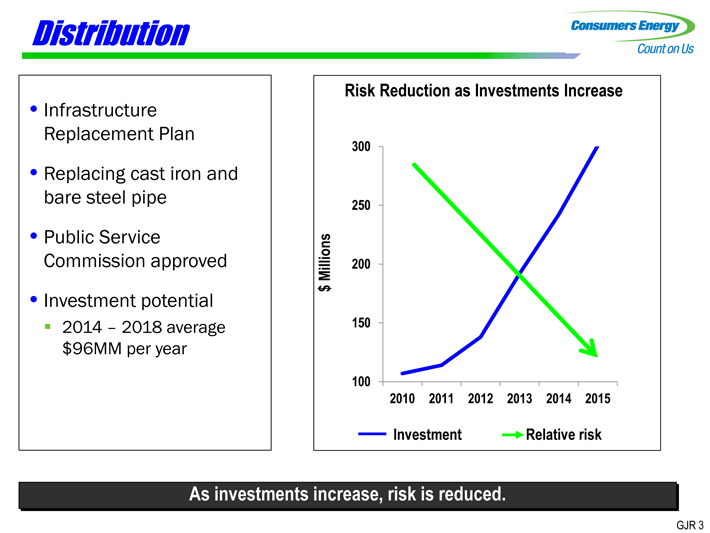
Distribution
Infrastructure Replacement Plan
Replacing cast iron and bare steel pipe
Public Service Commission approved
Investment potential
2014 – 2018 average $96MM per year
Risk Reduction as Investments Increase
300
250
Millions 200
$
150
100
2010 2011 2012 2013 2014 2015
Investment Relative risk
As investments increase, risk is reduced.
GJR 3
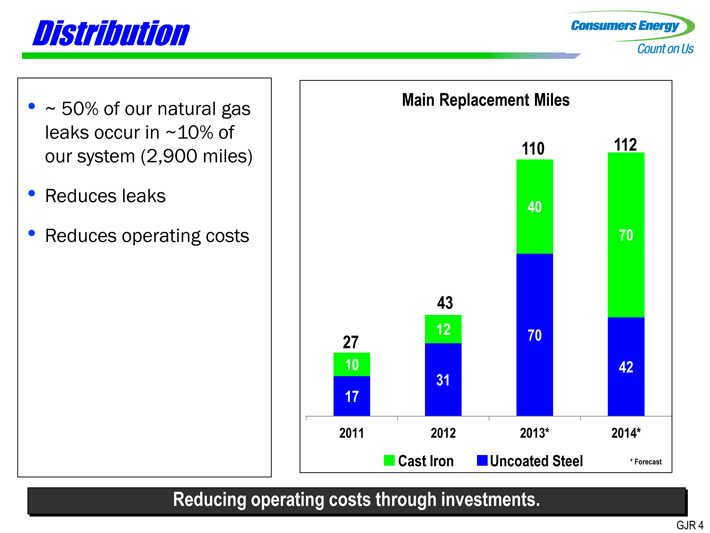
Distribution
~ 50% of our natural gas leaks occur in ~10% of our system (2,900 miles)
Reduces leaks
Reduces operating costs
Main Replacement Miles
110 112
40
70
43
27 12 70
10 42
31
17
2011 2012 2013* 2014*
Cast Iron Uncoated Steel *Forecast
Reducing operating costs through investments.
GJR 4
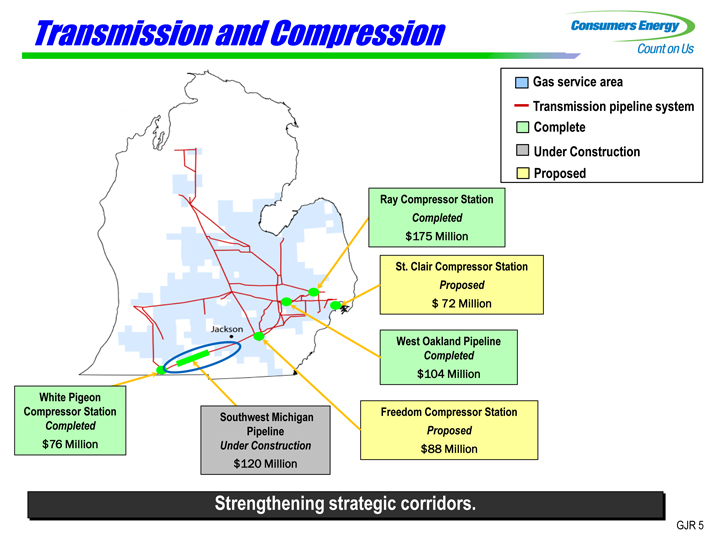
Transmission and Compression
Gas service area
Transmission pipeline system
Complete
Under Construction
Proposed
Ray Compressor Station
Completed
$175 Million
St. Clair Compressor Station
Proposed
$ 72 Million
West Oakland Pipeline
Completed
$104 Million
White Pigeon
Compressor Station Southwest Michigan Freedom Compressor Station
Completed Pipeline Proposed
$76 Million Under Construction $88 Million
$120 Million
Strengthening strategic corridors.
Jackson
GJR 5
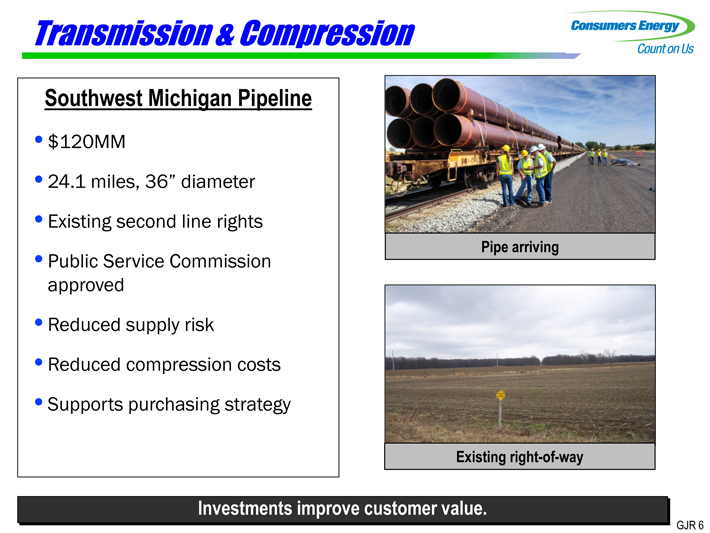
Transmission & Compression
Southwest Michigan Pipeline
$120MM
24.1 miles, 36” diameter
Existing second line rights
Public Service Commission
approved
Reduced supply risk
Reduced compression costs
Supports purchasing strategy
Pipe arriving
Existing right-of-way
Investments improve customer value.
GJR 6
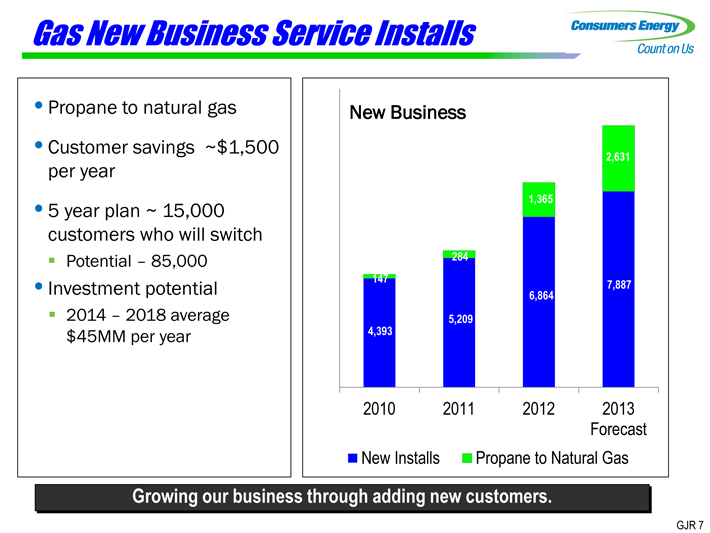
Gas New Business Service Installs
Propane to natural gas
Customer savings ~$1,500 per year
5 year plan ~ 15,000 customers who will switch
Potential – 85,000
Investment potential
2014 – 2018 average $45MM per year
New Business
2,631
1,365
284
147 7,887
6,864
5,209
4,393
2010 2011 2012 2013
Forecast
New Installs Propane to Natural Gas
Growing our business through adding new customers.
GJR 7
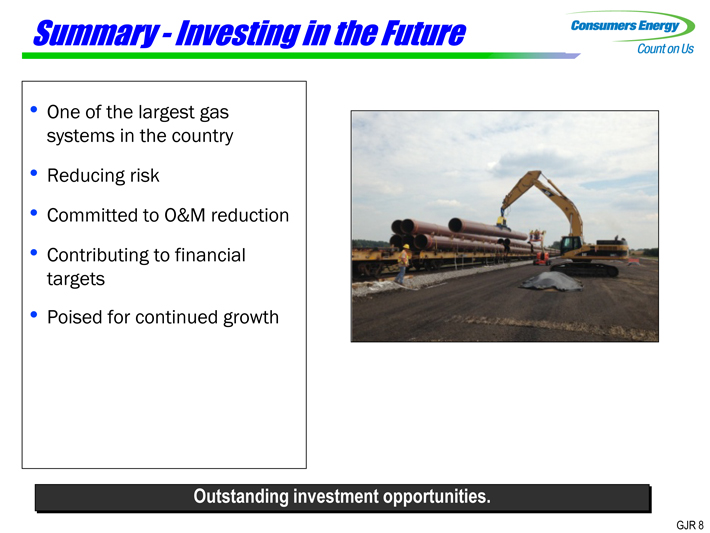
Summary - Investing in the Future
One of the largest gas systems in the country
Reducing risk
Committed to O&M reduction
Contributing to financial targets
Poised for continued growth
Outstanding investment opportunities.
GJR 8
Electric Transmission & Distribution
Dan Malone
Senior Vice President of Distribution & Customer Operations
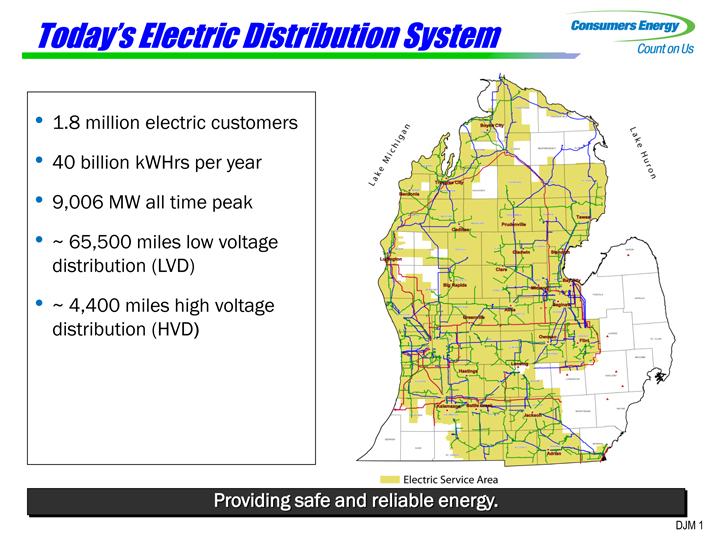
Today’s Electric Distribution System
1.8 million electric customers
40 billion kWHrs per year
9,006 MW all time peak
~ 65,500 miles low voltage distribution (LVD)
~ 4,400 miles high voltage distribution (HVD)
Providing safe and reliable energy. Lake Michigan Lake Huron Electric Service Area
DJM 1
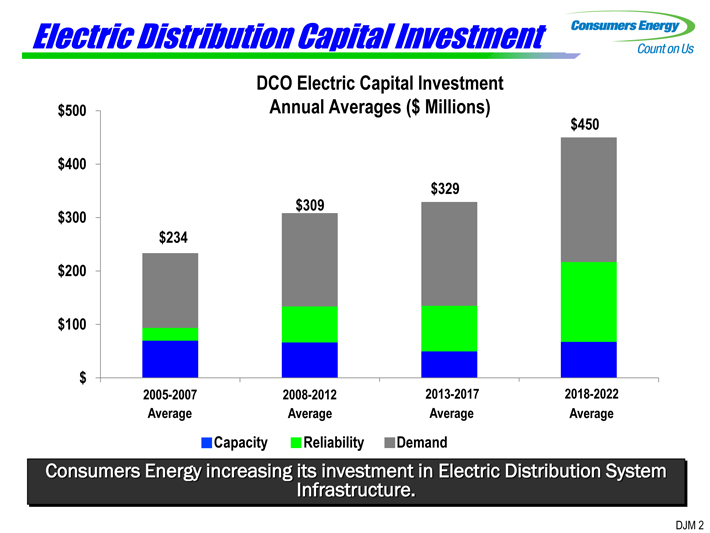
Electric Distribution Capital Investment
DCO Electric Capital Investment
$500 Annual Averages ($ Millions)
$450
$400
$329
$300 $309
$234
$200
$100
$
2005-2007 2008-2012 2013-2017 2018-2022
Average Average Average Average
Capacity Reliability Demand
Consumers Energy increasing Infrastructure. its investment in Electric Distribution System
DJM 2
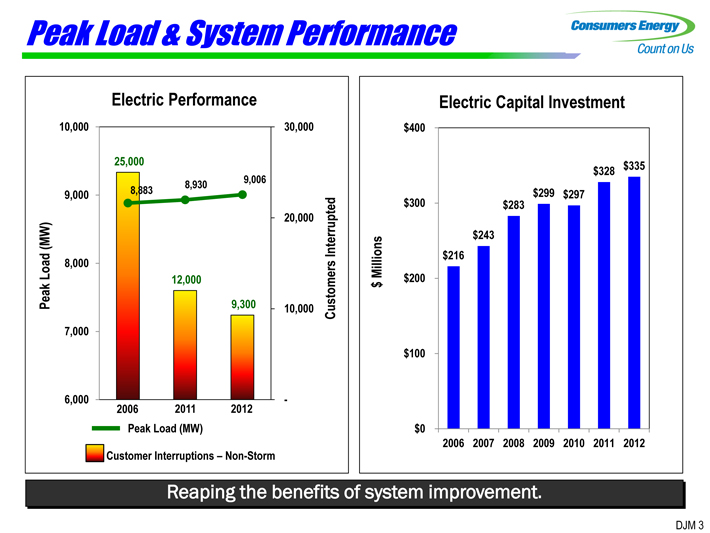
Peak Load & System Performance
Electric Performance
10,000 30,000
25,000
8,930 9,006
9,000 8,883
20,000
(MW) Interrupted
Load 8,000
12,000
Peak 9,300 10,000 Customers
7,000
6,000
2006 2011 2012
Peak Load (MW)
Customer Interruptions – Non-Storm
Electric Capital Investment
$400
$328 $335
$300 $283 $299 $297
$243
Millions $216
$200
$
$100
$0
2006 2007 2008 2009 2010 2011 2012
Reaping the benefits of system improvement.
DJM 3
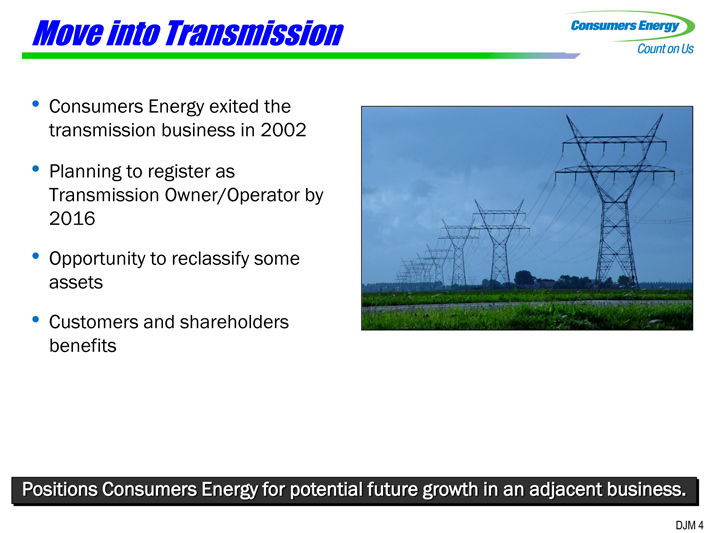
Move into Transmission
Consumers Energy exited the transmission business in 2002
Planning to register as
Transmission Owner/Operator by 2016
Opportunity to reclassify some assets
Customers and shareholders benefits
Positions Consumers Energy for potential future growth in an adjacent business.
DJM 4
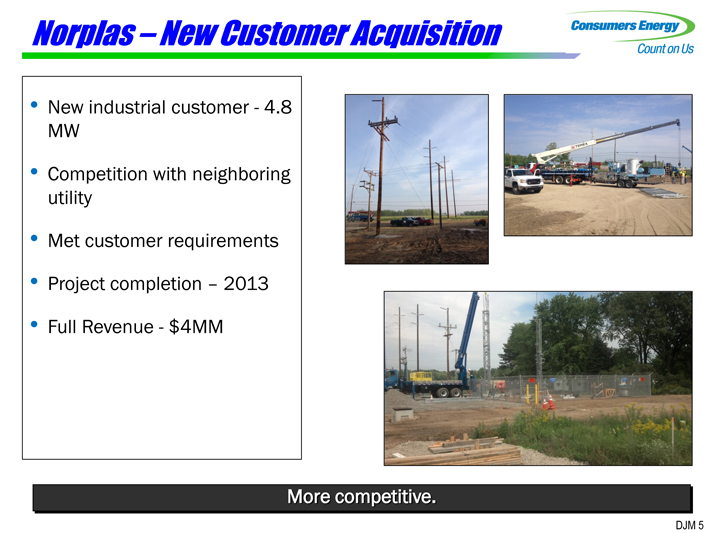
Norplas – New Customer Acquisition
New industrial customer -4.8 MW
Competition with neighboring utility
Met customer requirements
Project completion – 2013
Full Revenue -$4MM
More competitive.
DJM 5
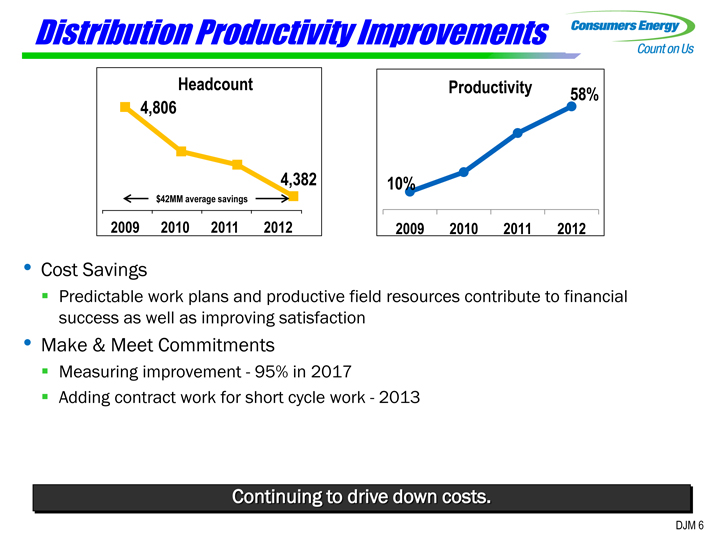
Distribution Productivity Improvements
Headcount Productivity 58%
4,806
4,382 10%
$42MM average savings
2009 2010 2011 2012 2009 2010 2011 2012
Cost Savings
Predictable work plans and productive field resources contribute to financial success as well as improving satisfaction
Make & Meet Commitments
Measuring improvement -95% in 2017
Adding contract work for short cycle work -2013
Continuing to drive down costs.
DJM 6
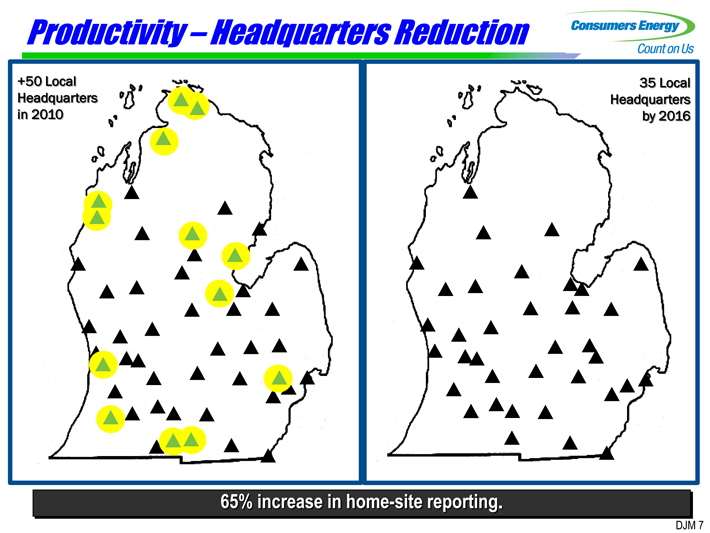
Productivity – Headquarters Reduction
+50 Local 35 Local Headquarters Headquarters in 2010 by 2016
65% increase in home-site reporting.
DJM 7
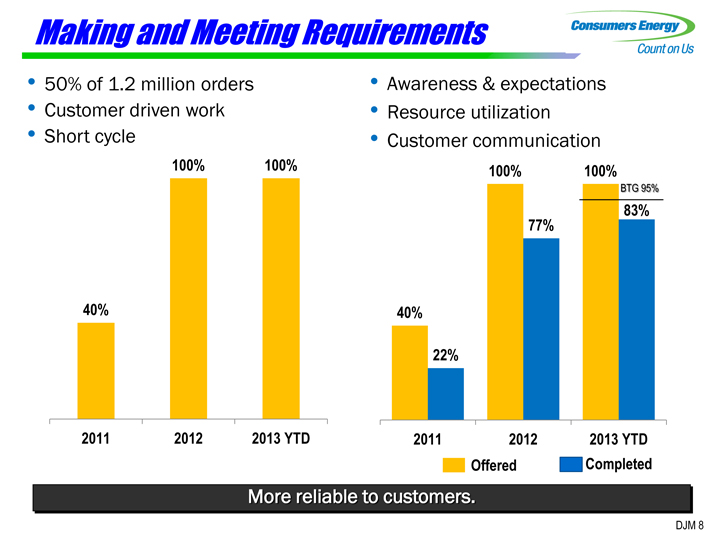
Making and Meeting Requirements
50% of 1.2 million orders • Awareness & expectations
Customer driven work • Resource utilization
Short cycle • Customer communication
100% 100% 100% 100%
BTG 95%
83%
77%
40% 40%
22%
2011 2012 2013 YTD 2011 2012 2013 YTD
Offered Completed
More reliable to customers.
DJM 8
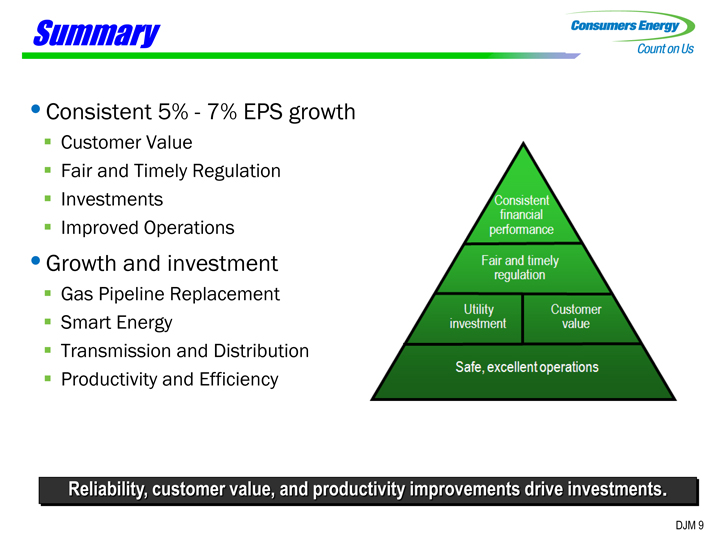
Summary
Consistent 5% -7% EPS growth
Customer Value
Fair and Timely Regulation
Investments
Improved Operations
Growth and investment
Gas Pipeline Replacement
Smart Energy
Transmission and Distribution
Productivity and Efficiency
Reliability, customer value, and productivity improvements drive investments.
Consistent financial performance Fair and timely regulation Utility investment Customer value Safe, excellent operations
DJM 9

Wrap-Up
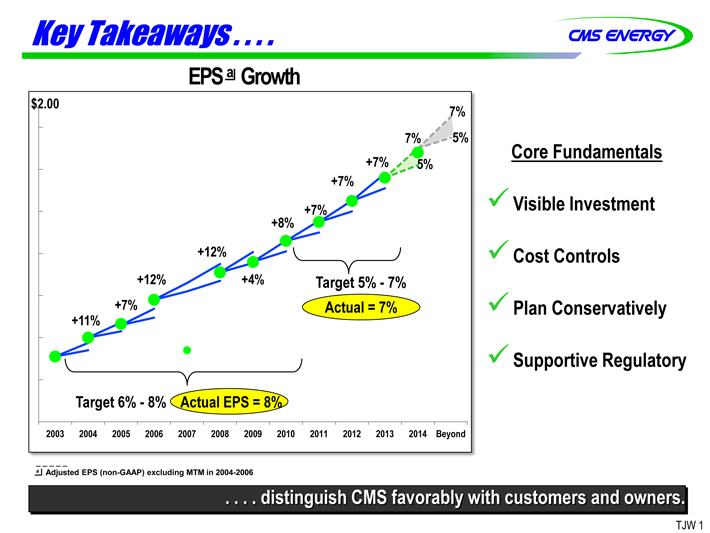
Key Takeaways . . . .
EPS a Growth
$2.00 7%
7% 5%
+7% 5%
+7%
+8% +7%
+12%
+12% +4% Target 5% -7%
+7% Actual = 7%
+11%
Target 6% -8% Actual EPS = 8%
2003 2004 2005 2006 2007 2008 2009 2010 2011 2012 2013 2014 Beyond
a Adjusted EPS (non-GAAP) excluding MTM in 2004-2006
Core Fundamentals
Visible Investment
Cost Controls
Plan Conservatively
Supportive Regulatory
. . . . distinguish CMS favorably with customers and owners.

Appendix
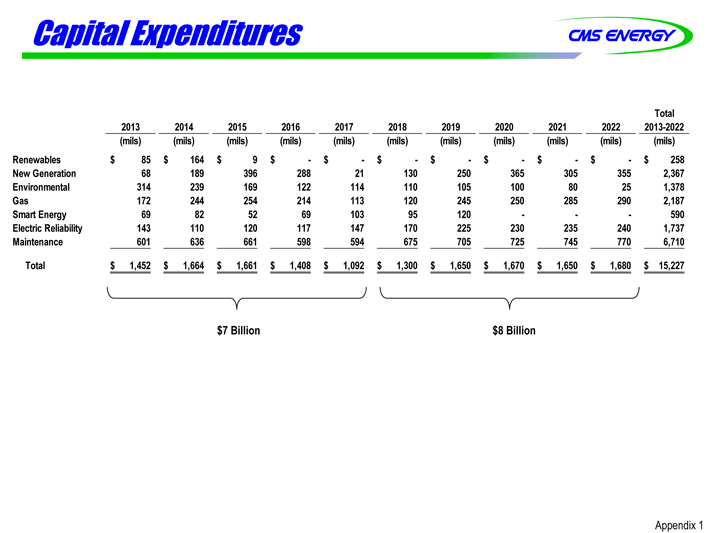
Capital Expenditures
Total
2013 2014 2015 2016 2017 2018 2019 2020 2021 2022 2013-2022
(mils) (mils) (mils) (mils) (mils) (mils) (mils) (mils) (mils) (mils) (mils)
Renewables $ 85 $ 164 $ 9 $ - $ - $ - $ - $ - $ - $ - $ 258
New Generation 68 189 396 288 21 130 250 365 305 355 2,367
Environmental 314 239 169 122 114 110 105 100 80 25 1,378
Gas 172 244 254 214 113 120 245 250 285 290 2,187
Smart Energy 69 82 52 69 103 95 120 - - - 590
Electric Reliability 143 110 120 117 147 170 225 230 235 240 1,737
Maintenance 601 636 661 598 594 675 705 725 745 770 6,710
Total $ 1,452 $ 1,664 $ 1,661 $ 1,408 $ 1,092 $ 1,300 $ 1,650 $ 1,670 $ 1,650 $ 1,680 $ 15,227
$ 7 Billion $ 8 Billion
Appendix 1

GAAP Reconciliation
CMS ENERGY CORPORATION
Earnings Per Share By Year GAAP Reconciliation
(Unaudited)
| | | | | | | | | | | | | | | | | | | | | | | | | | | | | | | | | | | | | | | | |
| | | 2003
| | | 2004
| | | 2005
| | | 2006
| | | 2007
| | | 2008
| | | 2009
| | | 2010
| | | 2011
| | | 2012
| |
Reported earnings (loss) per share - GAAP | | ($ | 0.30 | ) | | $ | 0.64 | | | ($ | 0.44 | ) | | ($ | 0.41 | ) | | ($ | 1.02 | ) | | $ | 1.20 | | | $ | 0.91 | | | $ | 1.28 | | | $ | 1.58 | | | $ | 1.42 | |
| | |
|
|
| |
|
|
| |
|
|
| |
|
|
| |
|
|
| |
|
|
| |
|
|
| |
|
|
| |
|
|
| |
|
|
|
After-tax items: | | | | | | | | | | | | | | | | | | | | | | | | | | | | | | | | | | | | | | | | |
Electric and gas utility | | | 0.21 | | | | (0.39 | ) | | | — | | | | — | | | | (0.07 | ) | | | 0.05 | | | | 0.33 | | | | 0.03 | | | | 0.00 | | | | 0.17 | |
Enterprises | | | 0.74 | | | | 0.62 | | | | 0.04 | | | | (0.02 | ) | | | 1.25 | | | | (0.02 | ) | | | 0.09 | | | | (0.03 | ) | | | (0.11 | ) | | | (0.01 | ) |
Corporate interest and other | | | 0.16 | | | | (0.03 | ) | | | 0.04 | | | | 0.27 | | | | (0.32 | ) | | | (0.02 | ) | | | 0.01 | | | | * | | | | (0.01 | ) | | | * | |
Discontinued operations (income) loss | | | (0.16 | ) | | | 0.02 | | | | (0.07 | ) | | | (0.03 | ) | | | 0.40 | | | | (* | ) | | | (0.08 | ) | | | 0.08 | | | | (0.01 | ) | | | (0.03 | ) |
Asset impairment charges, net | | | — | | | | — | | | | 1.82 | | | | 0.76 | | | | 0.60 | | | | — | | | | — | | | | — | | | | — | | | | — | |
Cumulative accounting changes | | | 0.16 | | | | 0.01 | | | | — | | | | — | | | | — | | | | — | | | | — | | | | — | | | | — | | | | — | |
| | |
|
|
| |
|
|
| |
|
|
| |
|
|
| |
|
|
| |
|
|
| |
|
|
| |
|
|
| |
|
|
| |
|
|
|
Adjusted earnings per share, including MTM - non-GAAP | | $ | 0.81 | | | $ | 0.87 | | | $ | 1.39 | | | $ | 0.57 | | | $ | 0.84 | | | $ | 1.21 | (a) | | $ | 1.26 | | | $ | 1.36 | | | $ | 1.45 | | | $ | 1.55 | |
Mark-to-market impacts | | | | | | | 0.03 | | | | (0.43 | ) | | | 0.51 | | | | | | | | | | | | | | | | | | | | | | | | | |
| | |
|
|
| |
|
|
| |
|
|
| |
|
|
| |
|
|
| |
|
|
| |
|
|
| |
|
|
| |
|
|
| |
|
|
|
Adjusted earnings per share, excluding MTM - non-GAAP | | | NA | | | $ | 0.90 | | | $ | 0.96 | | | $ | 1.08 | | | | NA | | | | NA | | | | NA | | | | NA | | | | NA | | | | NA | |
| | |
|
|
| |
|
|
| |
|
|
| |
|
|
| |
|
|
| |
|
|
| |
|
|
| |
|
|
| |
|
|
| |
|
|
|
| * | | Less than $500 thousand or $0.01 per share. |
| (a) | | $1.25 excluding discontinued Exeter operations and accounting changes related to convertible debt and restricted stock. |
CMS ENERGY CORPORATION
Earnings By Quarter and Year GAAP Reconciliation
(Unaudited)
| | | | | | | | | | | | | | | | | | | | |
(In Millions, Except Per Share Amounts)
| | 2012
| |
| | | 1Q
| | | 2Q
| | | 3Q
| | | 4Q
| | | YTD Dec
| |
Reported net income - GAAP | | $ | 67 | | | $ | 100 | | | $ | 148 | | | $ | 67 | | | $ | 382 | |
| | |
|
|
| |
|
|
| |
|
|
| |
|
|
| |
|
|
|
After-tax items: | | | | | | | | | | | | | | | | | | | | |
Electric and gas utility | | | 36 | | | | 7 | | | | * | | | | (* | ) | | | 43 | |
Enterprises | | | 1 | | | | 1 | | | | (3 | ) | | | (* | ) | | | (1 | ) |
Corporate interest and other | | | — | | | | — | | | | — | | | | * | | | | * | |
Discontinued operations income | | | (7 | ) | | | * | | | | * | | | | * | | | | (7 | ) |
| | |
|
|
| |
|
|
| |
|
|
| |
|
|
| |
|
|
|
Adjusted income - non-GAAP | | $ | 97 | | | $ | 108 | | | $ | 145 | | | $ | 67 | | | $ | 417 | |
| | |
|
|
| |
|
|
| |
|
|
| |
|
|
| |
|
|
|
Average shares outstanding, basic | | | 255.6 | | | | 261.2 | | | | 262.9 | | | | 263.0 | | | | 260.7 | |
Average shares outstanding, diluted | | | 266.8 | | | | 268.2 | | | | 269.0 | | | | 269.5 | | | | 268.6 | |
| | |
|
|
| |
|
|
| |
|
|
| |
|
|
| |
|
|
|
Reported earnings per share - GAAP | | $ | 0.25 | | | $ | 0.37 | | | $ | 0.55 | | | $ | 0.25 | | | $ | 1.42 | |
| | |
|
|
| |
|
|
| |
|
|
| |
|
|
| |
|
|
|
After-tax items: | | | | | | | | | | | | | | | | | | | | |
Electric and gas utility | | | 0.14 | | | | 0.03 | | | | * | | | | (* | ) | | | 0.17 | |
Enterprises | | | 0.01 | | | | * | | | | (0.01 | ) | | | (* | ) | | | (0.01 | ) |
Corporate interest and other | | | — | | | | — | | | | — | | | | * | | | | * | |
Discontinued operations income | | | (0.03 | ) | | | * | | | | * | | | | * | | | | (0.03 | ) |
| | |
|
|
| |
|
|
| |
|
|
| |
|
|
| |
|
|
|
Adjusted earnings per share - non-GAAP | | $ | 0.37 | | | $ | 0.40 | | | $ | 0.54 | | | $ | 0.25 | | | $ | 1.55 | |
| | |
|
|
| |
|
|
| |
|
|
| |
|
|
| |
|
|
|
| | | | | | | | | | | | |
(In Millions, Except Per Share Amounts)
| | 2013
| |
| | | 1Q
| | | 2Q
| | | 3Q
| |
Reported net income - GAAP | | $ | 144 | | | $ | 80 | | | $ | 126 | |
| | |
|
|
| |
|
|
| |
|
|
|
After-tax items: | | | | | | | | | | | | |
Electric and gas utility | | | — | | | | — | | | | — | |
Enterprises | | | * | | | | * | | | | — | |
Corporate interest and other | | | — | | | | * | | | | * | |
Discontinued operations loss | | | * | | | | * | | | | * | |
| | |
|
|
| |
|
|
| |
|
|
|
Adjusted income - non-GAAP | | $ | 144 | | | $ | 80 | | | $ | 126 | |
| | |
|
|
| |
|
|
| |
|
|
|
Average shares outstanding, basic | | | 263.6 | | | | 264.5 | | | | 264.8 | |
Average shares outstanding, diluted | | | 270.9 | | | | 272.2 | | | | 272.0 | |
| | |
|
|
| |
|
|
| |
|
|
|
Reported earnings per share - GAAP | | $ | 0.53 | | | $ | 0.29 | | | $ | 0.46 | |
| | |
|
|
| |
|
|
| |
|
|
|
After-tax items: | | | | | | | | | | | | |
Electric and gas utility | | | — | | | | — | | | | — | |
Enterprises | | | * | | | | * | | | | — | |
Corporate interest and other | | | — | | | | * | | | | * | |
Discontinued operations loss | | | * | | | | * | | | | * | |
| | |
|
|
| |
|
|
| |
|
|
|
Adjusted earnings per share - non-GAAP | | $ | 0.53 | | | $ | 0.29 | | | $ | 0.46 | |
| | |
|
|
| |
|
|
| |
|
|
|
| Note: | | Year-to-date (YTD) EPS may not equal sum of quarters due to share count differences. |
| * | | Less than $500 thousand or $0.01 per share. |
CMS Energy Corporation
Earnings Segment Results GAAP Reconciliation
(Unaudited)
| | | | | | | | | | | | | | | | |
| | | Three Months Ended
| | | Nine Months Ended
| |
September 30
| | 2013
| | | 2012
| | | 2013
| | | 2012
| |
Electric Utility | | | | | | | | | | | | | | | | |
Reported | | $ | 0.57 | | | $ | 0.61 | | | $ | 1.16 | | | $ | 1.10 | |
Electric Decoupling Court Order | | | — | | | | — | | | | — | | | | 0.14 | |
Downsizing Program | | | — | | | | * | | | | — | | | | 0.02 | |
| | |
|
|
| |
|
|
| |
|
|
| |
|
|
|
Adjusted | | $ | 0.57 | | | $ | 0.61 | | | $ | 1.16 | | | $ | 1.26 | |
| | |
|
|
| |
|
|
| |
|
|
| |
|
|
|
Gas Utility | | | | | | | | | | | | | | | | |
Reported | | $ | (0.01 | ) | | $ | (0.01 | ) | | $ | 0.36 | | | $ | 0.23 | |
Downsizing Program | | | — | | | | * | | | | — | | | | 0.01 | |
| | |
|
|
| |
|
|
| |
|
|
| |
|
|
|
Adjusted | | $ | (0.01 | ) | | $ | (0.01 | ) | | $ | 0.36 | | | $ | 0.24 | |
| | |
|
|
| |
|
|
| |
|
|
| |
|
|
|
Enterprises | | | | | | | | | | | | | | | | |
Reported | | $ | (0.01 | ) | | $ | 0.02 | | | $ | — | | | $ | 0.03 | |
Downsizing Program | | | — | | | | (* | ) | | | — | | | | * | |
Restructuring Costs and other | | | — | | | | (0.01 | ) | | | * | | | | (* | ) |
| | |
|
|
| |
|
|
| |
|
|
| |
|
|
|
Adjusted | | $ | (0.01 | ) | | $ | 0.01 | | | $ | — | | | $ | 0.03 | |
| | |
|
|
| |
|
|
| |
|
|
| |
|
|
|
Corporate Interest and Other | | | | | | | | | | | | | | | | |
Reported | | $ | (0.09 | ) | | $ | (0.07 | ) | | $ | (0.23 | ) | | $ | (0.22 | ) |
Restructuring Costs and other | | | * | | | | — | | | | * | | | | — | |
| | |
|
|
| |
|
|
| |
|
|
| |
|
|
|
Adjusted | | $ | (0.09 | ) | | $ | (0.07 | ) | | $ | (0.23 | ) | | $ | (0.22 | ) |
| | |
|
|
| |
|
|
| |
|
|
| |
|
|
|
Discontinued Operations | | | | | | | | | | | | | | | | |
Reported | | $ | (* | ) | | $ | (* | ) | | $ | (* | ) | | $ | 0.03 | |
Discontinued Operations Income | | | * | | | | * | | | | * | | | | (0.03 | ) |
| | |
|
|
| |
|
|
| |
|
|
| |
|
|
|
Adjusted | | $ | — | | | $ | — | | | $ | — | | | $ | — | |
| | |
|
|
| |
|
|
| |
|
|
| |
|
|
|
Totals | | | | | | | | | | | | | | | | |
Reported | | $ | 0.46 | | | $ | 0.55 | | | $ | 1.29 | | | $ | 1.17 | |
Discontinued Operations Income | | | * | | | | * | | | | * | | | | (0.03 | ) |
Electric Decoupling Court Order | | | — | | | | — | | | | — | | | | 0.14 | |
Downsizing Program | | | — | | | | (* | ) | | | — | | | | 0.03 | |
Restructuring Costs and other | | | * | | | | (0.01 | ) | | | * | | | | (* | ) |
| | |
|
|
| |
|
|
| |
|
|
| |
|
|
|
Adjusted | | $ | 0.46 | | | $ | 0.54 | | | $ | 1.29 | | | $ | 1.31 | |
| | |
|
|
| |
|
|
| |
|
|
| |
|
|
|
Average Common Shares Outstanding - Diluted (in millions) | | | 272.0 | | | | 269.0 | | | | 271.6 | | | | 268.1 | |
| | |
|
|
| |
|
|
| |
|
|
| |
|
|
|
| * | | Less than $0.01 per share. |
CMS Energy
Reconciliation of Gross Operating Cash Flow to GAAP Operating Activities
(unaudited)
(mils)
| | | | | | | | | | | | | | | | | | | | | | | | | | | | |
| | | 2012
| | | 2013
| | | 2014
| | | 2015
| | | 2016
| | | 2017
| | | 2018
| |
Consumers Operating Income + Depreciation & Amortization | | $ | 1,635 | | | $ | 1,729 | | | $ | 1,775 | | | $ | 1,830 | | | $ | 1,925 | | | $ | 2,020 | | | $ | 2,165 | |
Enterprises Project Cash Flows | | | 17 | | | | 20 | | | | 29 | | | | 36 | | | | 31 | | | | 39 | | | | 39 | |
| | |
|
|
| |
|
|
| |
|
|
| |
|
|
| |
|
|
| |
|
|
| |
|
|
|
Gross Operating Cash Flow | | $ | 1,652 | | | $ | 1,749 | | | $ | 1,804 | | | $ | 1,866 | | | $ | 1,956 | | | $ | 2,059 | | | $ | 2,204 | |
Other operating activities including taxes, interest payments and working capital | | | (411 | ) | | | (399 | ) | | | (354 | ) | | | (316 | ) | | | (706 | ) | | | (709 | ) | | | (754 | ) |
| | |
|
|
| |
|
|
| |
|
|
| |
|
|
| |
|
|
| |
|
|
| |
|
|
|
Net cash provided by operating activities | | $ | 1,241 | | | $ | 1,350 | | | $ | 1,450 | | | $ | 1,550 | | | $ | 1,250 | | | $ | 1,350 | | | $ | 1,450 | |
| | |
|
|
| |
|
|
| |
|
|
| |
|
|
| |
|
|
| |
|
|
| |
|
|
|

Biographies

John G. Russell is president and chief executive officer of CMS
energy and its principal subsidiary, Consumers Energy, which
serves 1.8 million electric customers and 1.7 million natural gas
customers. The company has annual revenues of $6 billion,
assets totaling $15.3 billion and 7,700 employees.
Prior to his current position, Russell was president and chief
operating officer of Consumers Energy from 2004 to 2010. He
also served as president of the electric utility until 2004.
Previously, Russell was senior vice president of electric
transmission and distribution and held several leadership
positions in customer operations, electric restructuring and
logistics management. During a break in service from 1985 to
John G. Russell 1987, Russell managed the shipping operations for Meijer Inc.
PRESIDENT AND CHIEF EXECUTIVE
OFFICER – CMS ENERGY AND Russell graduated from Michigan State University with a
CONSUMERS ENERGY bachelor’s degree in business administration in 1980. In 1994, he
completed the Program for Management Development at the
Harvard Business School.
He is a member of the board of directors for CMS Energy and
Consumers Energy, and Hubbell Incorporated.
He also serves on the boards of the Edison Electric Institute
(EEI), the American Gas Association (AGA), the Business
Leaders for Michigan, Grand Rapids-based The Right Place Inc.,
and the Michigan Chamber of Commerce.
One Energy Plaza • Jackson, MI • 49201-2276 • www.cmsenergy.com • www.consumersenergy.com

Thomas J. Webb is executive vice president and chief financial
officer of CMS Energy and its principal subsidiary, Consumers
Energy. He was named to this position in 2002.
Webb also serves as chairman of the board of EnerBank USA, a
nationwide provider of consumer loans.
Before joining CMS Energy, Webb had been executive vice
president and chief financial officer for Kellogg Co. At Kellogg,
he helped drive the purchase of Keebler Co., the largest
acquisition in Kellogg’s history. He led the financing effort
which included the largest bond offering to that date, $4.6 billion,
Thomas J. Webb in the history of the consumer-branded industry.
EXECUTIVE VICE PRESIDENT AND
CHIEF FINANCIAL OFFICER – From 1996 to 1999, Webb was senior vice president and chief
CMS ENERGY AND
CONSUMERS ENERGY financial officer of Visteon, an $18 billion automotive
components business with major production facilities in 30
countries.
Webb began his career at Ford Motor Co. in 1977, holding
increasingly responsible financial and managerial positions
internationally for more than 22 years. He earned a Bachelor of
Science degree and Master of Business Administration in finance
from George Mason University. He received the National
Distinguished Service Award from the Boy Scouts of America.
He is a member of the board of directors for the Business Leaders
for Michigan.
One Energy Plaza • Jackson, MI • 49201-2276 • www.cmsenergy.com • www.consumersenergy.com
Dennis D. Dobbs is vice president of generation engineering and
services for Consumers Energy, the principal subsidiary of CMS
Energy.
He is responsible for the engineering support of Consumers
Energy’s generating fleet along with the development of
renewable and conventional generating units.
Dobbs also oversees environmental compliance and strategy, and
administrative support and strategic planning for the generating
plants. He was named to this position in 2011.
DENNIS D. DOBBS Prior to his current position, Dobbs servesd as the site business
VICE PRESIDENT OF manager of the Karn/Weadock Generating Complex in
GENERATION ENGINEERING Essexville, Michigan from 2008 to 2011.
AND SERVICES
He joined Consumers Energy as a senior engineer in 1999 and
has held a series of increasingly responsible positions at the
company, including Karn/Weadock site production manager, and
Weadock plant business manager, site economic-based reliability
manager and economic-based reliability lead.
Dobbs began his utility career at Illinois Power in 1991 after
serving in the U.S. Army during Operation Desert Storm.
He earned a master’s of business administration degree from
Illinois State University and a bachelor’s degree in civil
engineering from the Rose-Hulman Institute of Technology.
One Energy Plaza • Jackson, MI • 49201-2276 • www.cmsenergy.com • www.consumersenergy.com

Patricia K. Poppe is vice president of customer experience and
operations for Consumers Energy, the principal subsidiary of
CMS Energy. She was elected to this position in January 2011.
Poppe leads Consumers Energy’s customer experience and
operations department, which includes customer call centers,
billing and revenue recovery, energy efficiency, the Smart Energy
program, customer insights and quality, and customer experience
design and marketing.
Before joining Consumers Energy, Poppe served as director of
regulated marketing and energy optimization at DTE Energy.
PATRICIA K. POPPE She also worked as director of DTE Energy’s North Region
VICE PRESIDENT OF Power Plants, overseeing 3000 MWs at five generating facilities.
CUSTOMER EXPERIENCE
AND OPERATIONS Prior to working for DTE Energy, Poppe held a variety of plant
management positions during her 15-year career at General
Motors Company.
Poppe earned a master’s degree in management from the Stanford
University Graduate School of Business and received a
bachelor’s degree and master’s degree in industrial engineering
from Purdue University.
One Energy Plaza • Jackson, MI • 49201-2276 • www.cmsenergy.com • www.consumersenergy.com
Garrick J. Rochow is vice president of energy delivery for
Consumers Energy, the principal subsidiary of CMS Energy. He
was named to this position in 2010.
Rochow is responsible for the engineering and planning of the
company’s electric and natural gas, transmission and distribution
systems. He heads the development and execution of plans to
maintain, upgrade and expand the distribution systems that
provide safe, reliable and affordable energy service to the
company’s 2.9 million customers.
Prior to his current position, Rochow served as the combustion
GARRICK J. ROCHOW turbine business manager and oversaw the operation and
VICE PRESIDENT OF maintenance of the 930-megawatt Zeeland generating facility and
ENERGY DELIVERY other combustion turbine units with a total capacity of 400
megawatts. He was responsible for the transition of Zeeland into
Consumers Energy’s generation fleet and strategy development
for the combustion turbine fleet.
He joined Consumers Energy in 2003 and has held several
leadership positions, including site production manager at the
Campbell Generating Complex. Rochow began his utility career
at the Holland Board of Public Works where he served as a
maintenance superintendent at that municipal utility and handled
steam turbine and boiler outage responsibilities.
Rochow graduated from Michigan Technological University with
a bachelor’s degree in environmental engineering and earned a
master’s degree in business administration from Western
Michigan University. He also has attended an Executive
Education program at the University of Wisconsin-Madison’s
Wisconsin School of Business.
One Energy Plaza • Jackson, MI • 49201-2276 • www.cmsenergy.com • www.consumersenergy.com
Daniel J. Malone is senior vice president of distribution and
customer operations for Consumers Energy, the principal
subsidiary of CMS Energy. He was elected to the position in
May 2010.
Malone has overall responsibility for the company’s electric and
gas distribution systems, energy operations, customer operations,
gas transmission and storage, Smart Energy program
implementation and industrial safety. Energy operations is
responsible for operating and maintaining the electric and natural
gas delivery systems that serve the utility’s customers. Customer
operations is responsible for the company’s revenue recovery,
Daniel J Malone customer services and energy optimization programs.
SENIOR VICE PRESIDENT OF
DISTRIBUTION AND Malone joined Consumers Energy in 1984 as a graduate health
CUSTOMER OPERATIONS physicist in the radiological services department and has spent the
majority of his career with the company. From 2001 to 2006, he
held leadership positions with Nuclear Management Co., which
operated Consumers Energy’s Palisades nuclear plan in Covert,
Michigan.
In 2006, Malone rejoined Consumers energy as manager of the
equipment services department. Later the same year, he was
named site business manager for the utility’s J.H. Campbell
Generating Complex in Port Sheldon Township, west of Grand
Rapids, Michigan.
Malone earned a bachelor’s degree in environmental science from
Purdue University and holds a nuclear senior reactor operator
certification. In 2008, he completed the Advanced Management
Program at the Harvard Business School.
One Energy Plaza • Jackson, MI • 49201-2276 • www.cmsenergy.com • www.consumersenergy.com