Exhibit 99.1
CMS ENERGY
CMS
LISTED
NYSE.
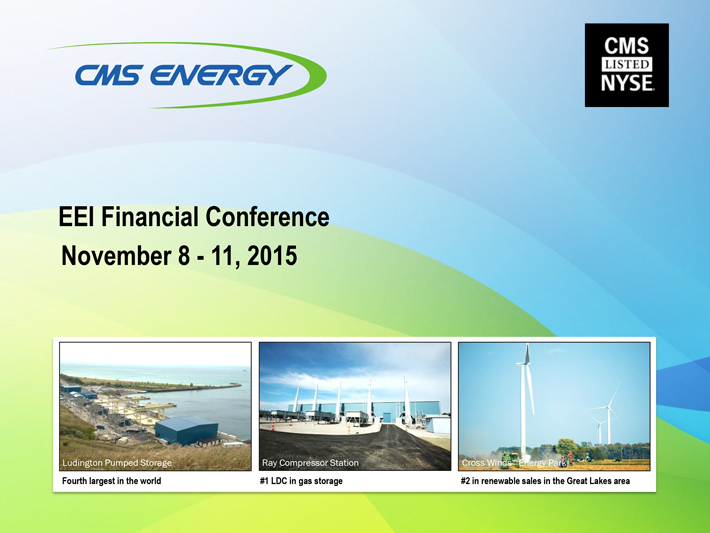
EEI Financial Conference
November 8 - 11, 2015
Ludington Pumped Storage Ray Compressor Station Cross Winds® Energy Park
Fourth largest in the world #1 LDC in gas storage #2 in renewable sales in the Great Lakes area
CMS ENERGY
This presentation is made as of the date hereof and contains “forward-looking statements” as defined in Rule 3b-6 of the Securities Exchange Act of 1934, Rule 175 of the Securities Act of 1933, and relevant legal decisions. The forward-looking statements are subject to risks and uncertainties. All forward-looking statements should be considered in the context of the risk and other factors detailed from time to time in CMS Energy’s and Consumers Energy’s Securities and Exchange Commission filings. Forward-looking statements should be read in conjunction with “FORWARD-LOOKING STATEMENTS AND INFORMATION” and “RISK FACTORS” sections of CMS Energy’s and Consumers Energy’s Form 10-K for the year ended December 31, 2014 and as updated in subsequent 10-Qs. CMS Energy’s and Consumers Energy’s “FORWARD-LOOKING STATEMENTS AND INFORMATION” and “RISK FACTORS” sections are incorporated herein by reference and discuss important factors that could cause CMS Energy’s and Consumers Energy’s results to differ materially from those anticipated in such statements. CMS Energy and Consumers Energy undertake no obligation to update any of the information presented herein to reflect facts, events or circumstances after the date hereof.
The presentation also includes non-GAAP measures when describing CMS Energy’s results of operations and financial performance. A reconciliation of each of these measures to the most directly comparable GAAP measure is included in the appendix and posted on our website at www.cmsenergy.com.
CMS Energy provides historical financial results on both a reported (Generally Accepted Accounting Principles) and adjusted (non-GAAP) basis and provides forward-looking guidance on an adjusted basis. Management views adjusted earnings as a key measure of the company’s present operating financial performance, unaffected by discontinued operations, asset sales, impairments, regulatory items from prior years, or other items. These items have the potential to impact, favorably or unfavorably, the company’s reported earnings in future periods.
Investors and others should note that CMS Energy routinely posts important information on its website and considers the Investor Relations section, www.cmsenergy.com/investor-relations, a channel of distribution.
1
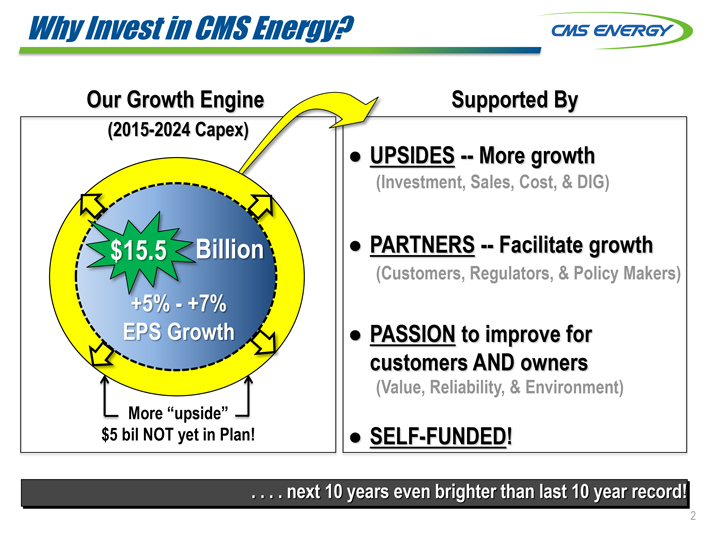
Why Invest in CMS Energy?
CMS ENERGY
Our Growth Engine
(2015-2024 Capex)
$15.5 Billion
+5% - +7%
EPS Growth
More “upside”
$5 bil NOT yet in Plan!
Supported By
UPSIDES -- More growth
(Investment, Sales, Cost, & DIG)
PARTNERS -- Facilitate growth
(Customers, Regulators, & Policy Makers)
PASSION to improve for customers AND owners
(Value, Reliability, & Environment)
SELF-FUNDED!
. . . . next 10 years even brighter than last 10 year record!
2
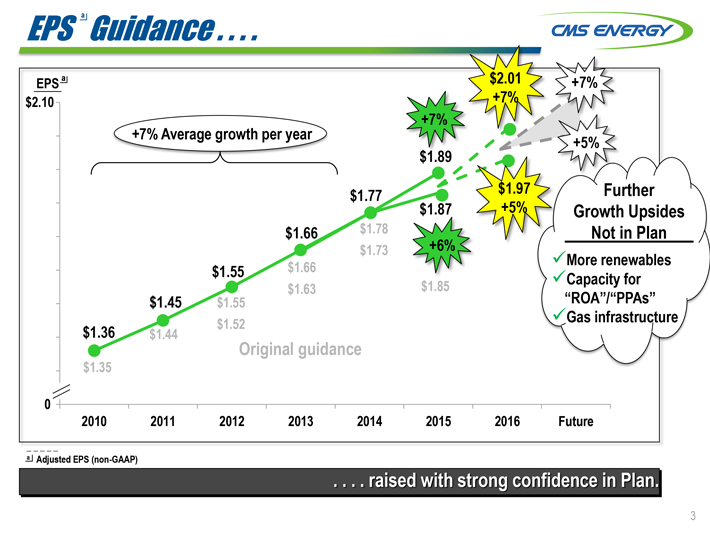
EPSa Guidance . . . .
CMS ENERGY
EPS a
$2.01
0
2010 2011 2012 2013 2014 2015 2016 Future
+7% Average growth per year
$1.36 $1.35
$1.45 $1.44
$1.55 $1.55 $1.52
$1.66 $1.66 $1.63
$1.77 $1.78 $1.73
+7% $1.89 $1.87 +6% $1.85
$2.01 +7% $1.97 +5%
+7% +5%
Further Growth Upsides Not in Plan
More renewables
Capacity for “ROA”/“PPAs”
Gas infrastructure
Original guidance
a Adjusted EPS (non-GAAP)
. . . . raised with strong confidence in Plan.
3
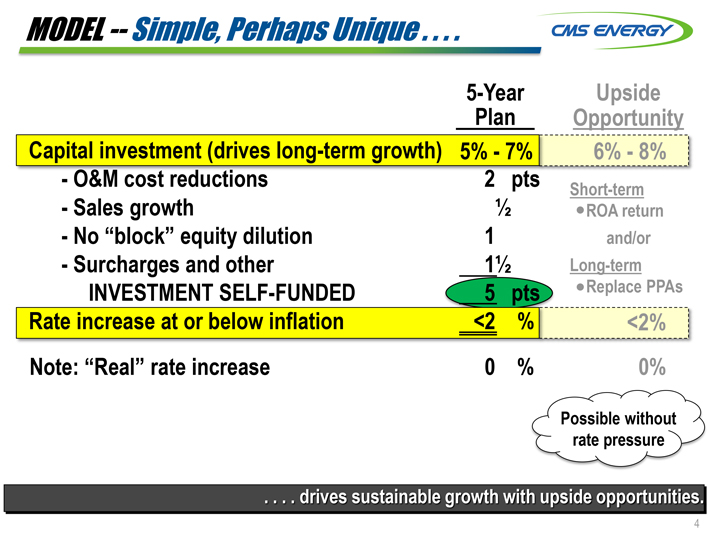
MODEL — Simple, Perhaps Unique . . . .
CMS ENERGY
5-Year Plan
Upside Opportunity
Capital investment (drives long-term growth) 5% - 7% 6% - 8%
- O&M cost reductions 2 pts Short-term ROA return and/or
- Sales growth 1/2
- No “block” equity dilution 1
- Surcharges and other1 1/2 Long-term Replace PPAs
INVESTMENT SELF-FUNDED 5pts
Rate increase at or below inflation <2 % <2%
Note: “Real” rate increase 0% 0%
Possible without rate pressure
. . . . drives sustainable growth with upside opportunities.
4
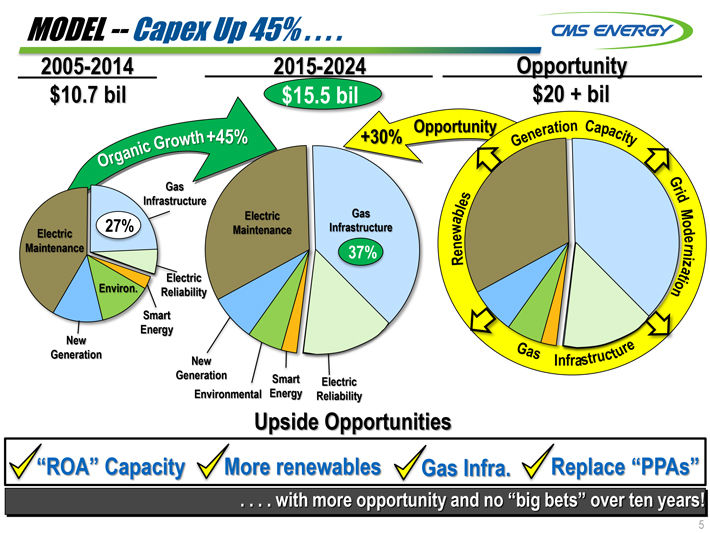
MODEL — Capex Up 45% . . . .
CMS ENERGY
2005-2014
$10.7 bil
Organic Growth +45%
Electric Maintenance 27%
Environ.
Gas Infrastructure
Electric Reliability
Smart Energy
New Generation
2015-2024
$15.5 bil
+30% Opportunity
Electric Maintenance
Gas Infrastructure 37%
New Generation
Environmental
Smart Energy
Electric Reliability
Opportunity
$20 + bil
Renewables
Generation Capacity
Grid Modernization
Gas Infrastructure
Upside Opportunities
“ROA” Capacity
More renewables
Gas Infra.
Replace “PPAs”
. . . . with more opportunity and no “big bets” over ten years!
5

MODEL — O&M Cost Reductions . . . .
CMS ENERGY
2006
Down 10%
$1.1 bil
2014
Down 7% or 2%/yr
$1.0 bil
Inflation ≈2%
2018
$0.9 bil
Inflation ≈2%
Coal to Gas Switching (Zeeland)
Smarter benefit plans
Productivity/Attrition
Coal to Gas Switching (Jackson)
“Pole Top” Hardening
Productivity/Smart Energy
. . . . provide more “headroom” for more capital investment.
6
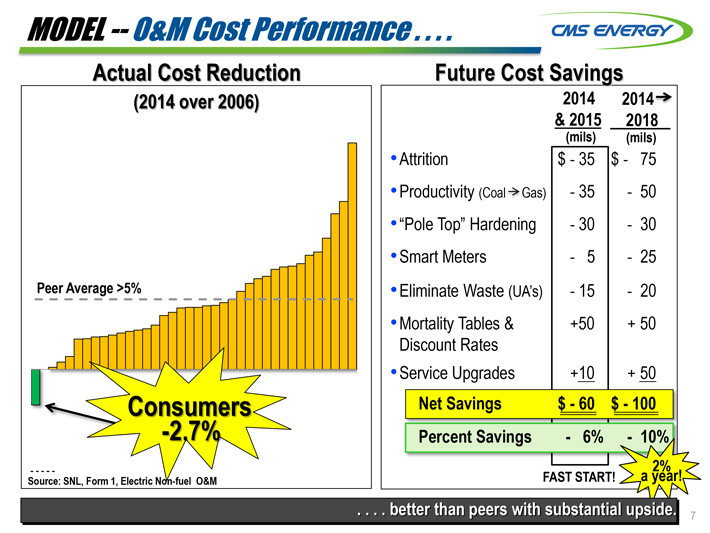
MODEL — O&M Cost Performance . . . .
CMS ENERGY
Actual Cost Reduction
(2014 over 2006)
Peer Average >5%
Consumers
-2.7%
Source: SNL, Form 1, Electric Non-fuel O&M
Future Cost Savings
2014 & 2015 (mils) 2014 2018 (mils)
Attrition $-35 $-75
Productivity (Coal Gas) -35 -50
“Pole Top” Hardening -30 -30
Smart Meters -5 -25
Eliminate Waste (UA’s) -15 -20
Mortality Tables & Discount Rates +50 +50
Service Upgrades +10 +50
Net Savings $-60 $-100
Percent Savings -6% -10%
FAST START! 2% a year!
. . . . better than peers with substantial upside.
7
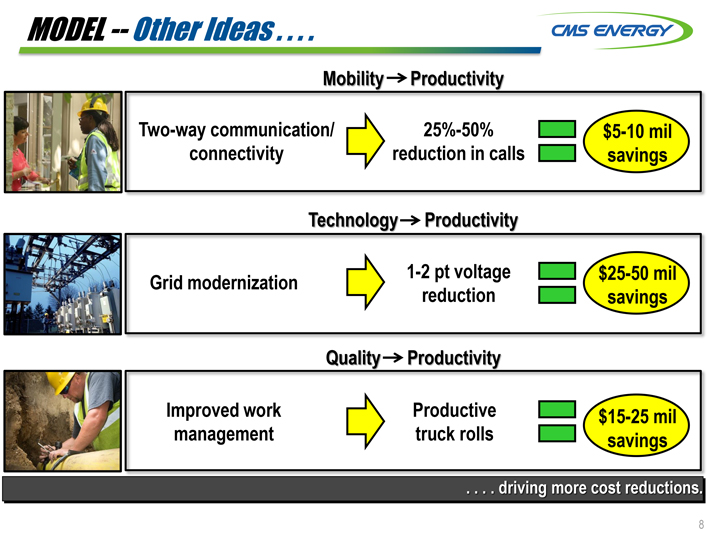
MODEL — Other Ideas . . . .
CMS ENERGY
Mobility Productivity
Two-way communication/Connectivity 25%-50% reduction in calls $5-10 mil savings
Technology Productivity
Grid modernization 1-2 pt voltage reduction $25-50 mil savings
Quality Productivity
Improved work management Productive truck rolls $15-25 mil savings
. . . . driving more cost reductions.
8
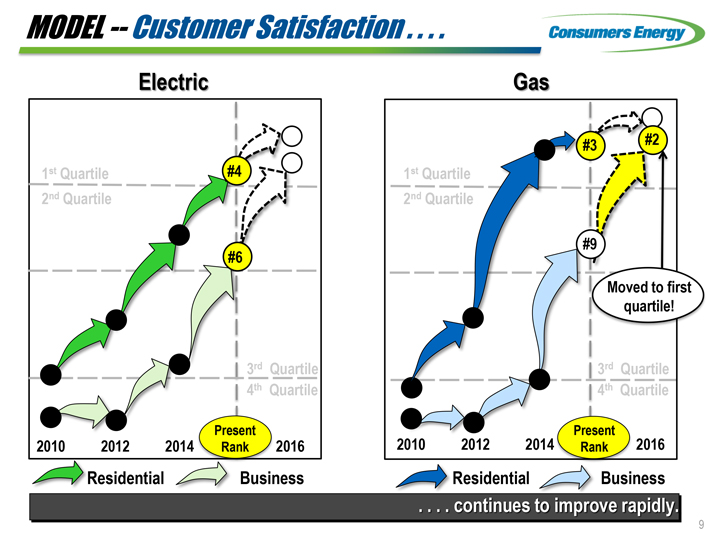
MODEL — Customer Satisfaction . . . .
Consumers Energy
Electric
1st Quartile
2nd Quartile #4 #6
3rd Quartile
4th Quartile
2010 2012 2014 Present Rank 2016
Residential
Business
Gas
1st Quartile
2nd Quartile #3 #2 #9
Moved to first quartile!
3rd Quartile
4th Quartile
2010 2012 2014 Present Rank 2016
Residential
Business
. . . . continues to improve rapidly.
9

MODEL — Interest Rates Increases . . . .
CMS ENERGY
Amount (bils) Sensitivities (bps) Pre-Tax Earnings Impact
Interest Expense $1.0 +100 (3)¢
Benefit Liability (discounted) 3.0 +100 4
Total 1¢
Note: ROE ?
. . . . mitigated.
10
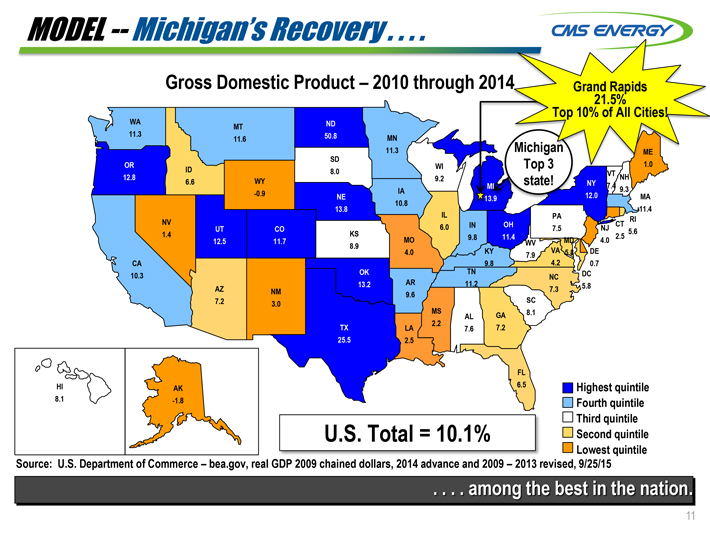
MODEL — Michigan’s Recovery . . . .
CMS ENERGY
Gross Domestic Product – 2010 through 2014
Grand Rapids 21.5%
Top 10% of All Cities!
WA 11.3 MT 11.6 ND 50.8 MN 11.3 Michigan Top 3 state! ME 1.0
OR 12.8 ID 6.6 WY -0.9 SD 8.0 WI 9.2 MI 13.9 NY 12.0 VT 7.4 NH 9.3 MA 11.4
CA 10.3 NV 1.4 UT 12.5 AZ 7.2 CO 11.7 NM 3.0 NE 13.8 KS 8.9 OK 13.2 TX 25.5 IA 10.8 MO 4.0 AR 9.6 LA 2.5
IL 6.0 MS 2.2 IN 9.8 TN 11.2 AL 7.6 KY 9.8 OH 11.4 GA 7.2 WV 7.9 SC 8.1 FL 6.5 PA 7.5 MD 5.8 VA 4.2 NC 7.3
DE 0.7 DC 5.8 NJ 4.0 CT 2.5 RI 5.6
HI 8.1 AK -1.8
U.S. Total = 10.1%
Highest quintile
Fourth quintile
Third quintile
Second quintile
Lowest quintile
Source: U.S. Department of Commerce – bea.gov, real GDP 2009 chained dollars, 2014 advance and 2009—2013 revised, 9/25/15
. . . .. among the best in the nation.
11
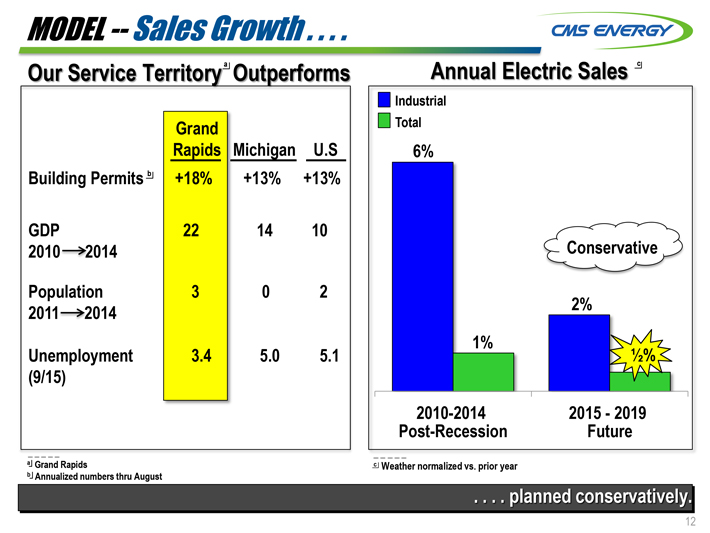
Model -- Sales Growth . . . .
CMS ENERGY
Our Service Territorya Outperforms
Grand Rapids
Michigan
U.S
Building Permitsb
+18%
+13%
+13%
GDP
2010—>2014
22
14
10
Population 2011—>2014
3
0
2
Unemployment
(9/15)
3.4
5.0
5.1
a Grand Rapids
b Annualized numbers thru August
Annual Electric Sales c
Industrial
Total
6%
2%
Conservative
1% 1/2%
2010-2014
Post-Recession
2015-2019 Future
C Weather normalized vs. prior year
. . . . planned conservatively.
12
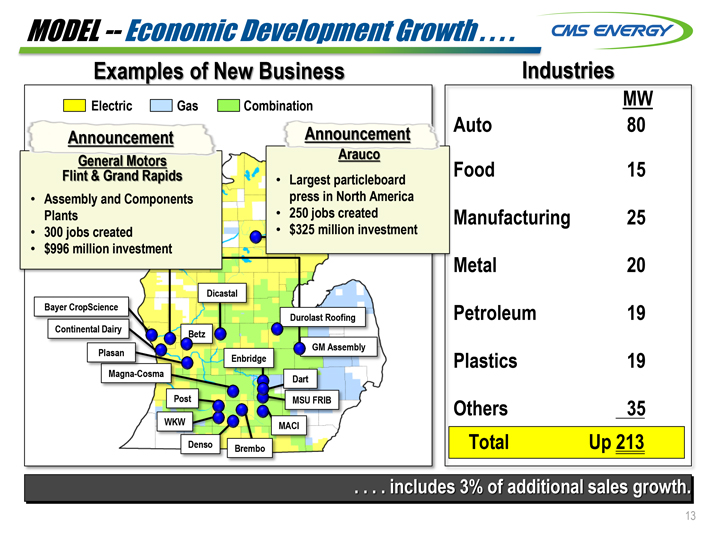
MODEL -- Economic Development Growth . . . .
CMS ENERGY
Examples of New Business
Electric Gas Combination
Announcement
General Motors
Flint & Grand Rapids
Assembly and Components
Plants
300 jobs created
$996 million investment
Announcement
Arauco
Largest particleboard
press in North America
250 jobs created
$325 million investment
Dicastal
Bayer CropScience
Durolast Roofing
Continental Dairy
Betz
GM Assembly
Plasan
Enbridge
Magna-Cosma
Dart
Post
MSU FRIB
WKW
MACI
Denso
Brembo
Industries
MW
Auto 80
Food 15
Manufacturing 25
Metal 20
Petroleum 19
Plastics 19
Others 35
Total Up 213
. . . . includes 3% of additional sales growth.
13
CLEAN POWER -- Energy Portfolio . . . .
CMS ENERGY
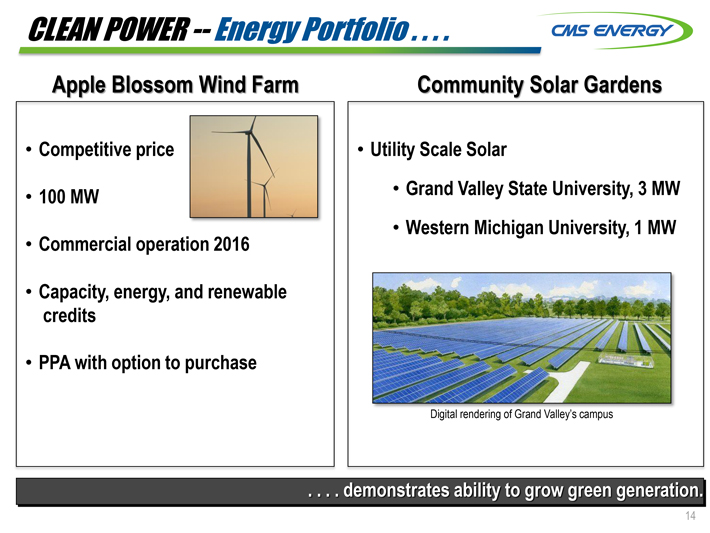
Apple Blossom Wind Farm
Competitive price
100 MW
Commercial operation 2016
Capacity, energy, and renewable credits
PPA with option to purchase
Community Solar Gardens
Utility Scale Solar
Grand Valley State University, 3 MW
Western Michigan University, 1 MW
Digital rendering of Grand Valley’s campus
. . . . demonstrates ability to grow green generation.
14
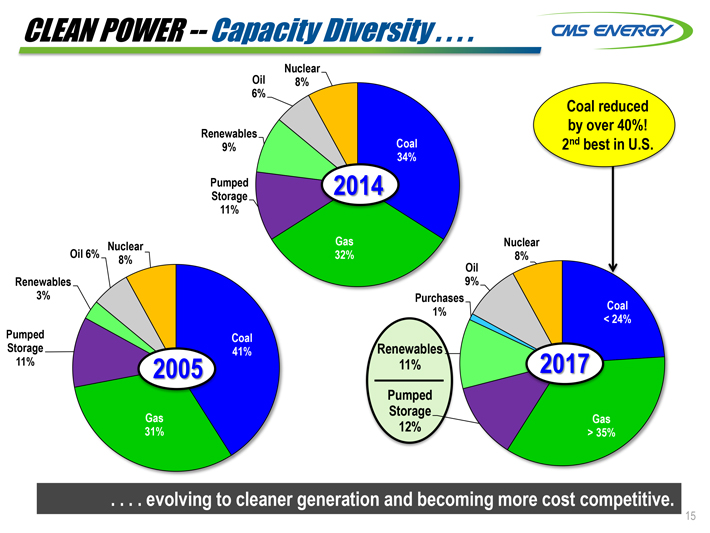
CLEAN POWER -- Capacity Diversity . . . .
CMS ENERGY
Nuclear
Oil
8%
6%
Renewables
9%
Coal
34%
Pumped Storage
2014
11%
Gas
32%
Oil 6%
Nuclear 8%
Renewables
3%
Pumped
Coal
Storage
41%
11%
2005
Gas
31%
Coal reduced
by over 40%!
2nd best in U.S.
Nuclear
8%
Oil
9%
Purchases
1%
Coal
< 24%
Renewables
11%
2017
Pumped
Storage
12%
> Gas 35%
. . . . evolving to cleaner generation and becoming more cost competitive.
15
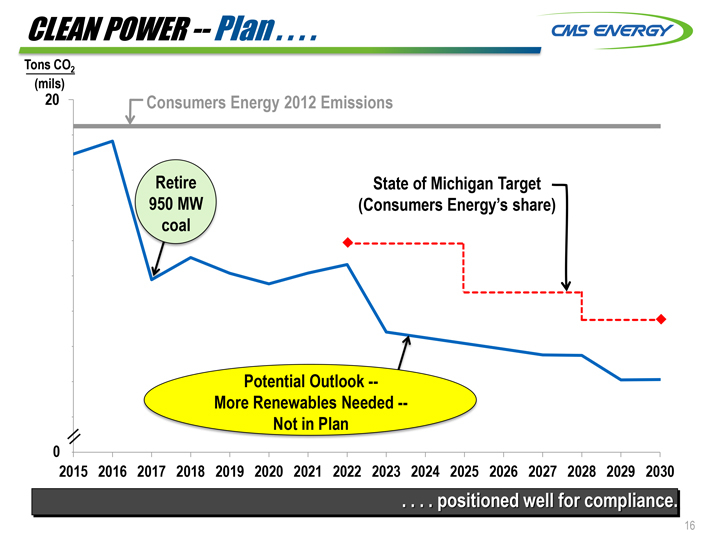
CLEAN POWER -- Plan . . . .
CMS ENERGY
Tons CO2
(mils)
20
Consumers Energy 2012 Emissions
Retire
950 MW
coal
State of Michigan Target
(Consumers Energy’s share)
Potential Outlook --
More Renewables Needed --
Not in Plan
0
2015 2016 2017 2018 2019 2020 2021 2022 2023 2024 2025 2026 2027 2028 2029 2030
. . . . positioned well for compliance.
16
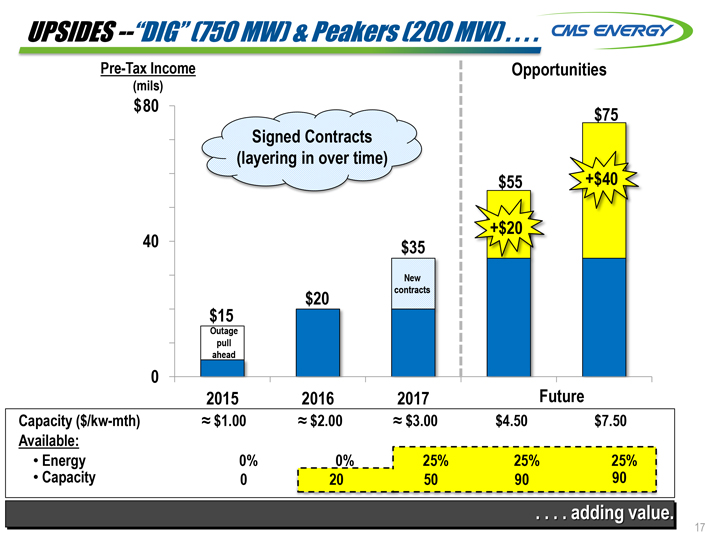
UPSIDES -- “DIG” (750 MW) & Peakers (200 MW) . . . .
CMS ENERGY
Pre-Tax Income
(mils)
$80
40
0
Opportunities
$75
Signed Contracts
(layering in over time)
$55
+$40
+$20
$35
$20
New contracts
$15
Outage pull ahead
2015
2016
2017
Future
Capacity ($/kw-mth)
≈ $1.00
≈ $2.00
≈ $3.00
$4.50
$7.50
Available:
Energy
0%
0%
25%
25%
25%
Capacity
0
20
50
90
90
. . . . adding value.
17
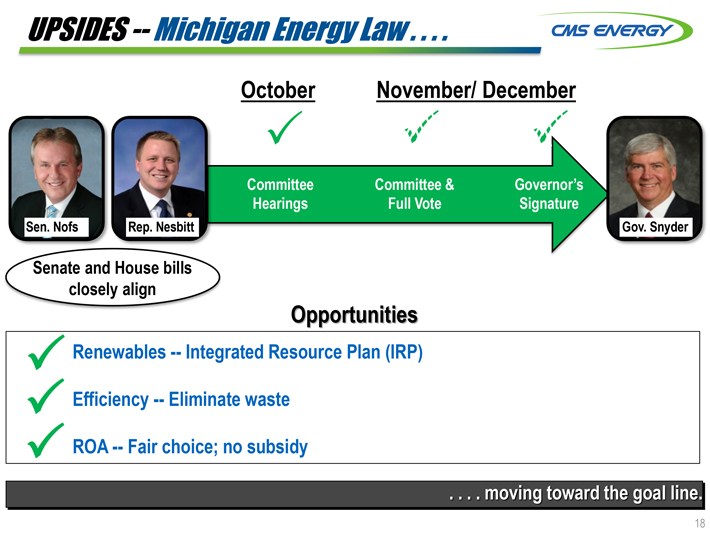
UPSIDES -- Michigan Energy Law . . . .
CMS ENERGY
October
November/ December
Committee Hearings
Committee & Full Vote
Governor’s Signature
Sen. Nofs
Rep. Nesbitt
Gov. Snyder
Senate and House bills closely align
Opportunities
Renewables -- Integrated Resource Plan (IRP)
Efficiency -- Eliminate waste
ROA -- Fair choice; no subsidy
. . . . moving toward the goal line.
18
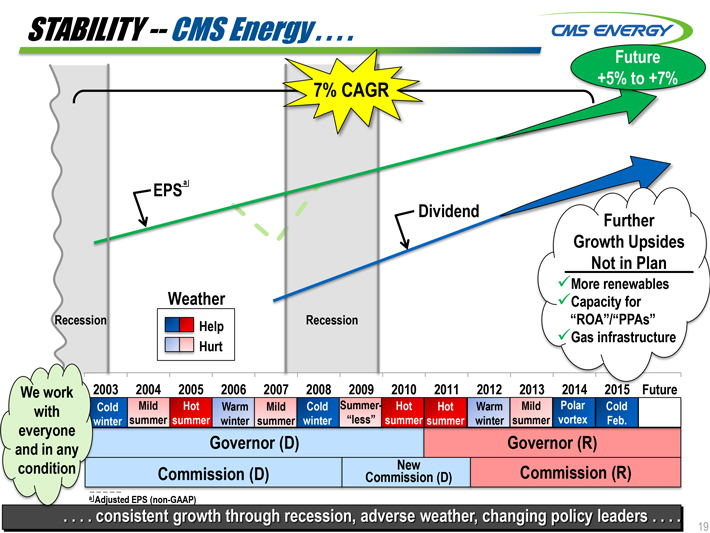
STABILITY -- CMS Energy . . . .
CMS ENERGY
7% CAGR
Future +5% to +7%
EPSa
Dividend
Further Growth Upsides Not in Plan A
Recession
Weather
Help
Hurt
Recession
More renewables Capacity for “ROA”/“PPAs” Gas infrastructure
We work with everyone and in any condition
2003
Cold winter
2004
Mild summer
2005
Hot summer
2006
Warm winter
2007
Mild summer
2008
Cold winter
2009
Summer- “less”
2010
Hot summer
2011
Hot summer
2012
Warm winter
2013
Mild summer
2014
Polar vortex
2015
Cold Feb.
Future
Governor (D)
Governor (R)
Commission (D)
New Commission (D)
Commission (R)
a Adjusted EPS (non-GAAP)
. . . . consistent growth through recession, adverse weather, changing policy leaders . . . .
19
Happy 50th Anniversary, EEI!
CMS ENERGY
THANK YOU for your support
BETTER THAN WE FOUND IT
Q & A
20

Appendix
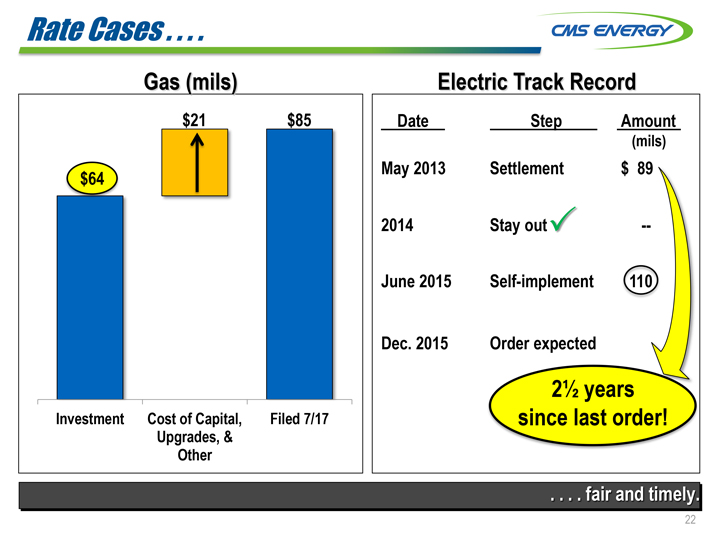
Rate Cases.... CMS ENERGY
Gas (mils) Electric Track Record
$21 $85 Date Step Amount
(mils)
$64 May 2013 Settlement $89
2014 Stay out —
June 2015 Self-implement 110
Dec. 2015 Order expected
Investment Cost of Capital, Upgrades, & Other Filed 7/17 2 1/2 since last order! years
. . . . fair and timely.
22
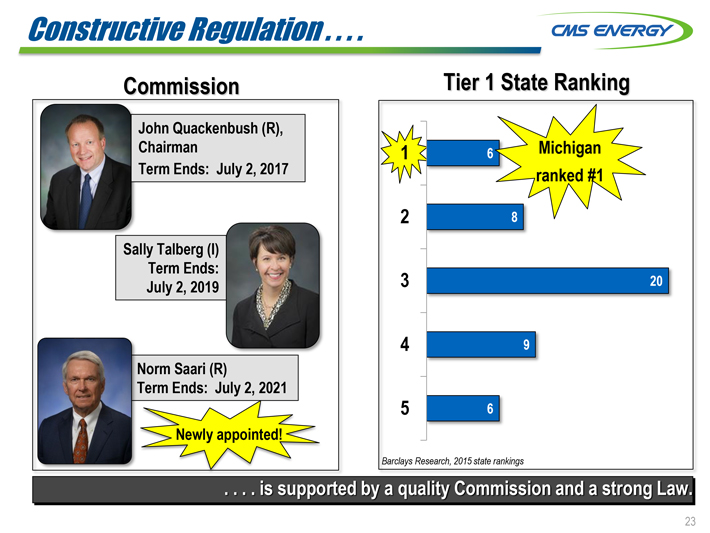
Constructive Regulation CMS ENERGY
Commission Tier 1 State Ranking
John Quackenbush (R), 1 6 Michigan ranked #1
Chairman
Term Ends: July 2, 2017 2 8
Sally Talberg (I)
Term Ends: 3 20
July 2, 2019
Norm Saari (R) 4 9
Term Ends: July 2, 2021
Newly appointed! 5 6
Baclays Research, 2015 state rankings
. . . . is supported by a quality Commission and a strong Law.
23
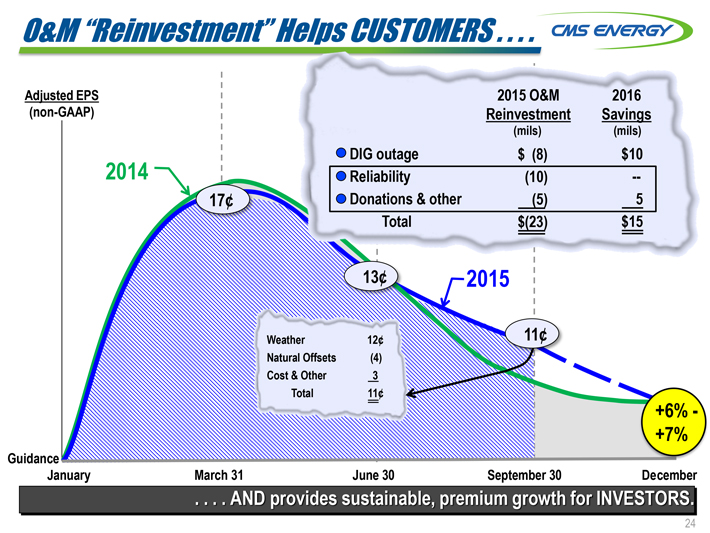
O&M “Reinvestment” Helps CUSTOMERS.... CMS ENERGY
Adjusted EPS 2015 O&M 2016
(non-GAAP) Reinvestment Savings
(mils) (mils)
DIG outage $(8) $10
2014 Reliability (10) —
17¢ Donations & other (5) 5
Total $(23) $15
Weather 12¢ 11¢ 13¢ 2015
Natural Offsets (4)
Cost & Other 3
Total 11¢
+6% -
+7%
Guidance
January March 31 June 30 September 30 December
. . . . AND provides sustainable, premium growth for INVESTORS.
24
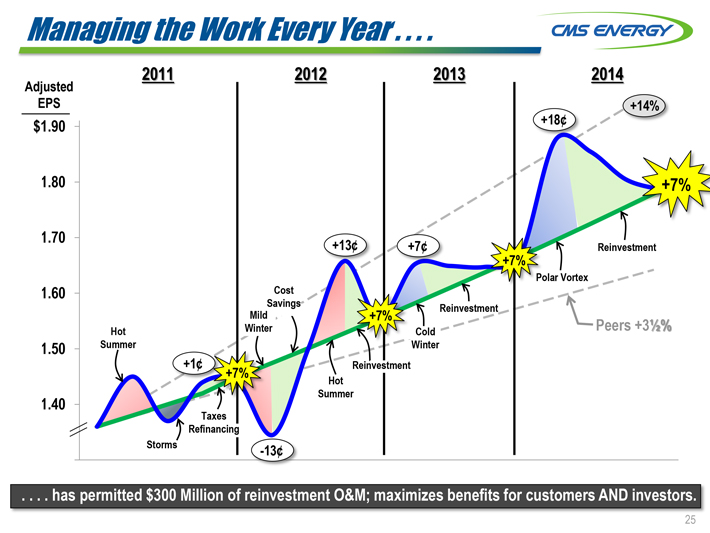
Managing the Work Every Year....
CMS ENERGY
2011 2012 2013 2014
Adjusted
EPS +14%
$1.90 +18¢
1.80 +7%
1.70 +13¢ +7¢ Reinvestment
+7%
Polar Vortex
1.60 Cost
Savings Reinvestment
Mild +7%
Hot Winter Cold Peers +3 1/2%
1.50 Summer Winter
+1¢ Reinvestment
+7% Hot Summer
1.40
Taxes
Refinancing
Storms -13¢
. . . . has permitted $300 Million of reinvestment O&M; maximizes benefits for customers AND investors.
25
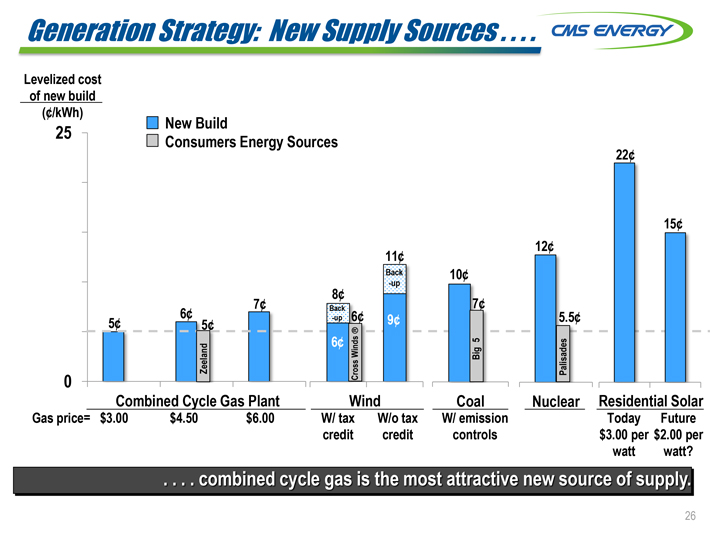
Generation Strategy: New Supply Sources....
CMS ENERGY
Levelized cost of new build
(¢/kWh)
25 New Build
Consumers Energy Sources
22¢
15¢
12¢
11¢
Back 10¢
-up
7¢8¢7¢
5¢ 6¢ 5¢ Back -up 6¢ 9¢ 5.5¢
Zeeland 6¢ Cross Winds® Big 5 Palisades
0
Combined Cycle Gas Plant Wind Coal Nuclear Residential Solar
Gas price= $3.00 $4.50 $6.00 W/ tax credit W/o tax credit W/ emission controls Today $3.00 per watt Future $2.00 per watt?
. . . . combined cycle gas is the most attractive new source of supply.
26
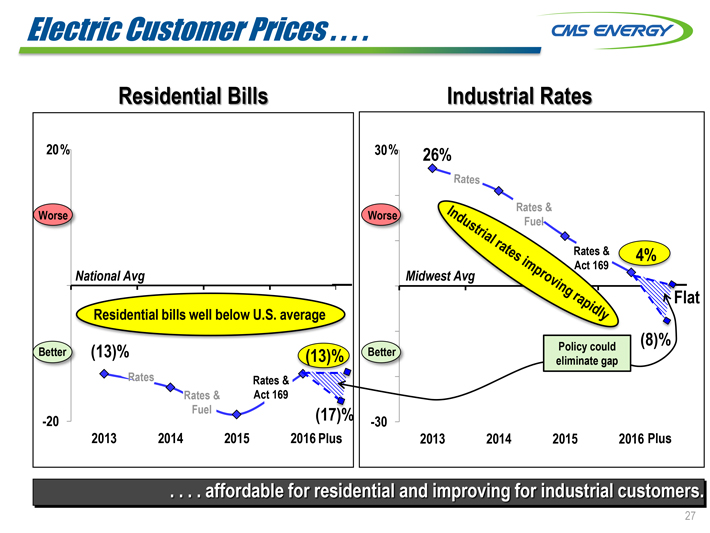
Electric Customer Prices
CMS ENERGY
Residential Bills Industrial Rates
20% 30% 26%
Worse Worse Rates
Rates & Fuel
National Avg Rates & Act 169 4%
Midwest Avg Industrial rates improving rapidly Flat
Residential bills well below U.S. average
(8)%
Better (13)% (13)% Better Policy could eliminate gap
Rates Rates & Act 169
Rates & Fuel
(17)%
-20 -30
2013 2014 2015 2016 Plus 2013 2014 2015 2016 Plus
. . . . affordable for residential and improving for industrial customers.
27
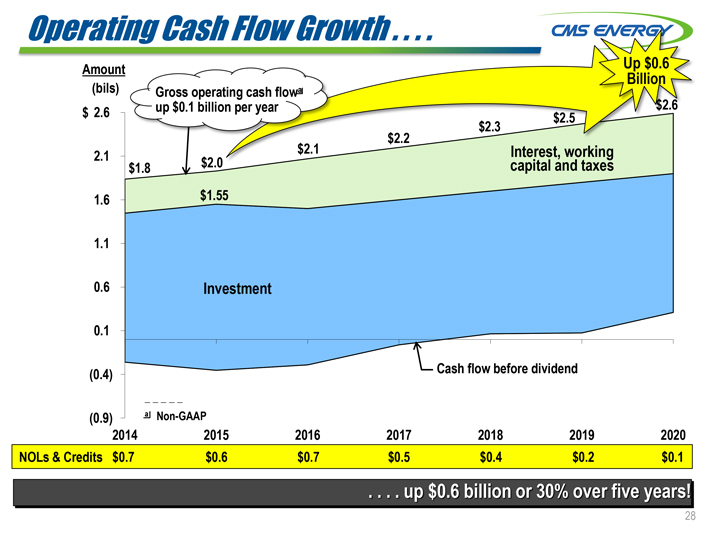
Operating Cash Flow Growth
CMS ENERGY
Amount Up $0.6 Billion
(bils) Gross operating cash flowa up $0.1 billion per year $2.6
$2.6 $2.2 $2.3 $2.5
2.1 $2.1 Interest, working capital and taxes
$1.8 $2.0
1.6 $1.55
1.1
0.6 Investment
0.1
Cash flow before dividend
(0.4)
(0.9) a Non-GAAP
2014 2015 2016 2017 2018 2019 2020
NOLs & Credits $0.7 $0.6 $0.7 $0.5 $0.4 $0.2 $0.1
. . . . up $0.6 billion or 30% over five years!
28
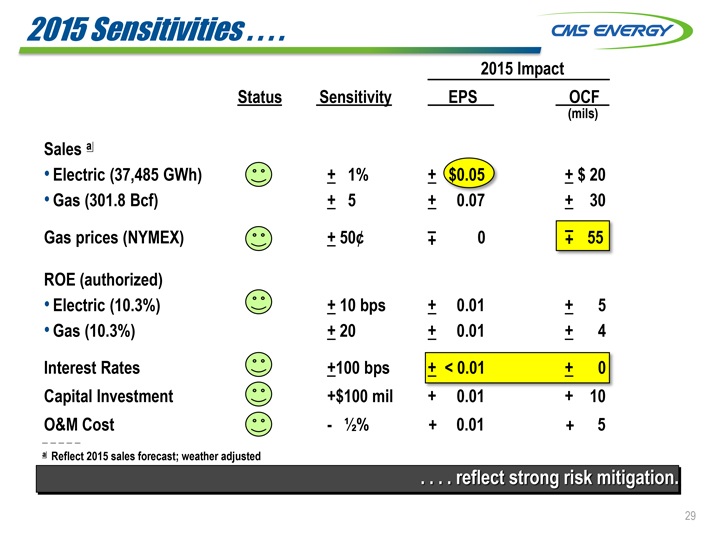
2015 Sensitivities...
CMS ENERGY
2015 Impact
Status Sensitivity EPS OCF
(mils)
Sales a
Electric (37,485 GWh) ±1% ±$0.05 ±$20
Gas (301.8 Bcf) ±5 ±0.07 ±30
Gas prices (NYMEX) ±50¢ ± 0 +55
ROE (authorized)
Electric (10.3%) ± 10 bps ± 0.01 ± 5
Gas (10.3%) ±20 ± 0.01 ± 4
Interest Rates ±100 bps ± < 0.01 ± 0
Capital Investment +$100 mil + 0.01 + 10
O&M Cost - 1/2% + 0.01 + 5
a Reflect 2015 sales forecast; weather adjusted
. . . . reflect strong risk mitigation.
29
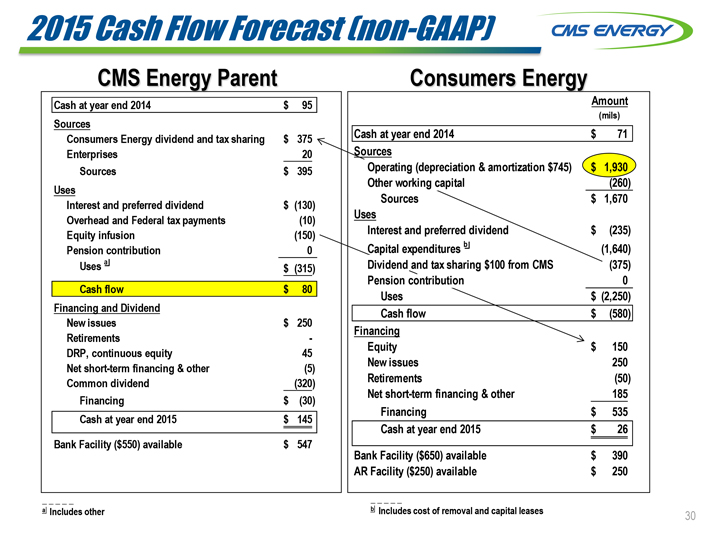
2015 Cash Flow Forecast (non-GAAP) CMS ENERGY
CMS Energy Parent
Cash at year end 2014 $95
Sources
Consumers Energy dividend and tax sharing $375
Enterprises 20
Sources $395
Uses
Interest and preferred dividend $(130)
Overhead and Federal tax payments (10)
Equity infusion (150)
Pension contribution 0
Uses a $(315)
Cash flow $80
Financing and Dividend
New issues $250
Retirements -
DRP, continuous equity 45
Net short-term financing & other (5)
Common dividend (320)
Financing $(30)
Cash at year end 2015 $145
Bank Facility ($550) available $547
Consumers Energy Amount (mils)
Cash at year end 2014 $71
Sources
Operating (depreciation & amortization $745) $1,930
Other working capital (260)
Sources $1,670
Uses
Interest and preferred dividend $(235)
Capital expenditures b (1,640)
Dividend and tax sharing $100 from CMS (375)
Pension contribution 0
Uses $(2,250)
Cash flow $(580)
Financing
Equity $150
New issues 250
Retirements (50)
Net short-term financing & other 185
Financing $535
Cash at year end 2015 $26
Bank Facility ($650) available $390
AR Facility ($250) available $250
a Includes other
b Includes cost of removal and capital leases
30
GAAP Reconciliation
CMS ENERGY
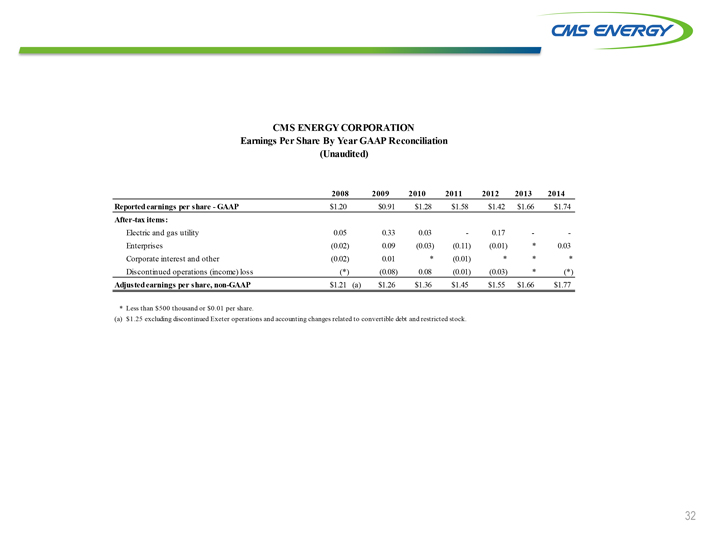
CMS ENERGY CORPORATION
Earnings Per Share By Year GAAP Reconciliation
(Unaudited)
2008 2009 2010 2011 2012 2013 2014
Reported earnings per share - GAAP $1.20 $0.91 $1.28 $1.58 $1.42 $1.66 $1.74
After-tax items:
Electric and gas utility 0.05 0.33 0.03 - 0.17 - -
Enterprises (0.02) 0.09 (0.03) (0.11) (0.01) * 0.03
Corporate interest and other (0.02) 0.01 * (0.01) * * *
Discontinued operations (income) loss (*) (0.08) 0.08 (0.01) (0.03) * (*)
Adjusted earnings per share, non-GAAP $1.21 (a) $1.26 $1.36 $1.45 $1.55 $1.66 $1.77
* Less than $500 thousand or $0.01 per share.
(a) $1.25 excluding discontinued Exeter operations and accounting changes related to convertible debt and restricted stock.
32
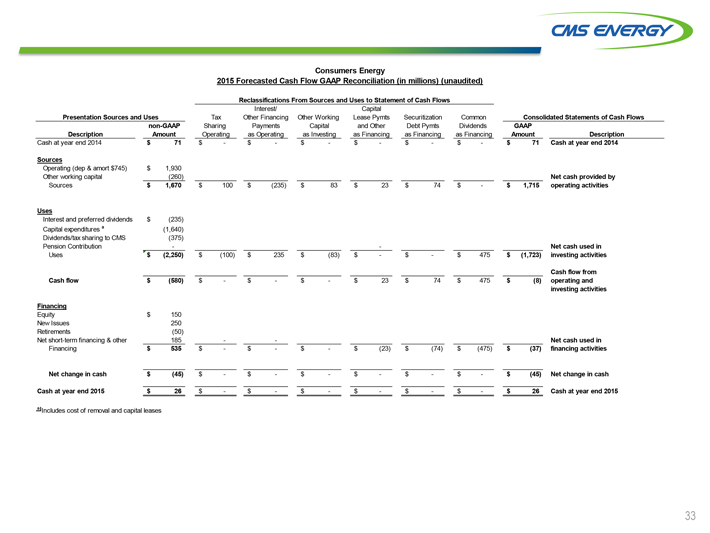
CMS ENERGY
Consumers Energy
2015 Forecasted Cash Flow GAAP Reconciliation (in millions) (unaudited)
Reclassifications From Sources and Uses to Statement of Cash Flows
Presentation Sources and Uses Tax Sharing Operating Interest/ Other Financing Payments as Operating Other Working Capital as Investing Capital Lease Pymts and Other as Financing Securitization Debt Pymts as Financing Common Dividends as Financing Consolidated Statements of Cash Flows
Description non-GAAP Amount GAAP Amount Description
Cash at year end 2014 $71 $- $- $- $- $- $- $71 Cash at year end 2014
Sources
Operating (dep & amort $745) $1,930
Other working capital (260) Net cash provided by operating activities
Sources $1,670 $100 $(235) $83 $23 $74 $- $1,715
Uses
Interest and preferred dividends $(235)
Capital expenditures a (1,640)
Dividends/tax sharing to CMS (375)
Pension Contribution - - Net cash used in investing activities
Uses $(2,250) $(100) $235 $(83) $- $- $475 $(1,723)
Cash flow from operating and investing activities
Cash flow $(580) $- $- $- $23 $74 $475 $(8)
Financing
Equity $150
New Issues 250
Retirements (50)
Net short-term financing & other 185 - - Net cash used in financing activities
Financing $535 $- $- $- $(23) $(74) $(475) $(37)
Net change in cash $(45) $- $- $- $- $- $- $(45) Net change in cash
Cash at year end 2015 $26 $- $- $- $- $- $- $26 Cash at year end 2015
a Includes cost of removal and capital leases
33
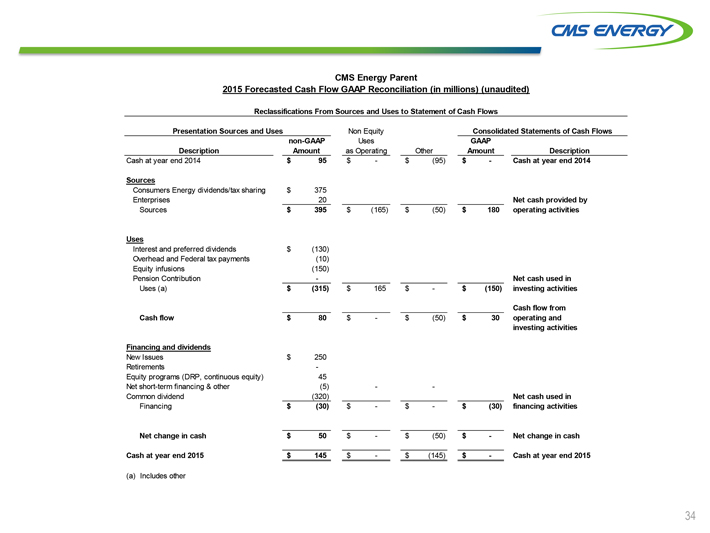
CMS ENERGY
CMS Energy Parent
2015 Forecasted Cash Flow GAAP Reconciliation (in millions) (unaudited)
Reclassifications From Sources and Uses to Statement of Cash Flows
Presentation Sources and Uses non-GAAP Amount Non Equity Uses as Operating Other Consolidated Statements of Cash Flows
Description GAAP Amount Description
Cash at year end 2014 $95 $- $(95) $- Cash at year end 2014
Sources
Consumers Energy dividends/tax sharing $375
Enterprises 20
Net cash provided by operating activities
Sources $395 $(165) $(50) $180
Uses
Interest and preferred dividends $(130)
Overhead and Federal tax payments (10)
Equity infusions (150)
Pension Contribution -
Net cash used in investing activities
Uses (a) $(315) $165 $- $(150)
Cash flow from operating and investing activities
Cash flow $80 $- $(50) $30
Financing and dividends
New Issues $250
Retirements -
Equity programs (DRP, continuous equity) 45
Net short-term financing & other (5) - -
Common dividend (320)
Net cash used in financing activities
Financing $(30) $- $- $(30)
Net change in cash $50 $- $(50) $-
Net change in cash
Cash at year end 2015 $145 $- $(145) $-
Cash at year end 2015
(a) Includes other
34
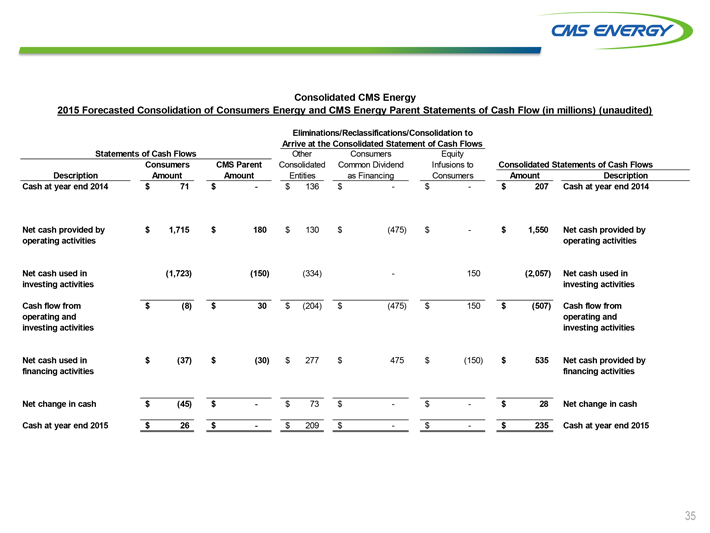
CMS ENERGY
Consolidated CMS Energy
2015 Forecasted Consolidation of Consumers Energy and CMS Energy Parent Statements of Cash Flow (in millions) (unaudited)
Eliminations/Reclassifications/Consolidation to Arrive at the Consolidated Statement of Cash Flows
Statements of Cash Flows
Other Consolidated Entities Consumers Common Dividend as Financing Equity Infusions to Consumers
Consolidated Statements of Cash Flows
Description Consumers Amount CMS Parent Amount Amount Description
Cash at year end 2014 $71 $- $136 $- $- $207 Cash at year end 2014
Net cash provided by operating activities
$1,715 $180 $130 $(475) $- $1,550
Net cash provided by operating activities
Net cash used in investing activities
(1,723) (150) (334) - 150 (2,057)
Net cash used in investing activities
Cash flow from operating and investing activities
$(8) $30 $(204) $(475) $150 $(507)
Cash flow from operating and investing activities
Net cash used in financing activities
$(37) $(30) $277 $475 $(150) $535
Net cash provided by financing activities
Net change in cash $(45) $- $73 $- $- $28
Net change in cash
Cash at year end 2015
$26 $- $209 $- $- $235
Cash at year end 2015
35
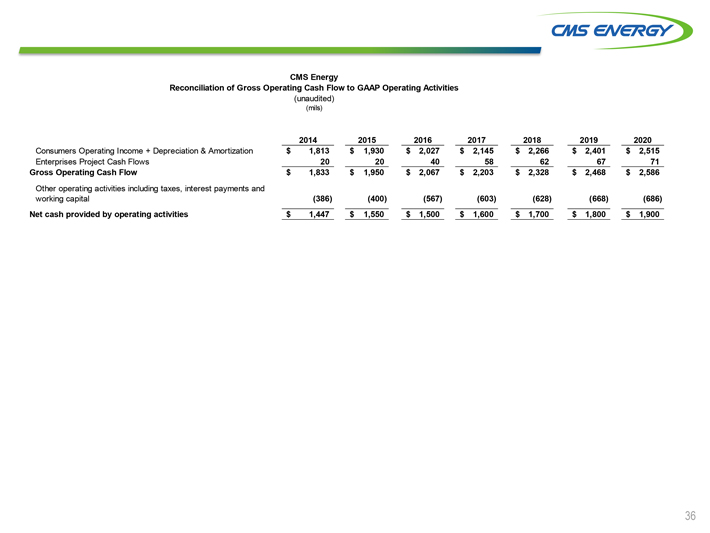
CMS ENERGY
CMS Energy
Reconciliation of Gross Operating Cash Flow to GAAP Operating Activities
(unaudited)
(mils)
2014 2015 2016 2017 2018 2019 2020
Consumers Operating Income + Depreciation & Amortization $1,813 $1,930 $2,027 $2,145 $2,266 $2,401 $2,515
Enterprises Project Cash Flows 20 20 40 58 62 67 71
Gross Operating Cash Flow $1,833 $1,950 $2,067 $2,203 $2,328 $2,468 $2,586
Other operating activities including taxes, interest payments and working capital (386) (400) (567) (603) (628) (668) (686)
Net cash provided by operating activities $1,447 $1,550 $1,500 $1,600 $1,700 $1,800 $1,900
36
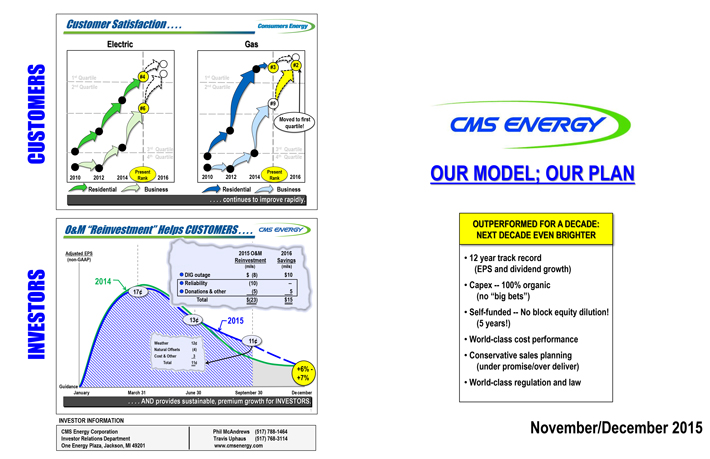
Customer Satisfaction.... Consumers Energy
Electric Gas
#3 #2
1st Quartile #4 1st Quartile
2nd Quartile 2nd Quartile
#9
#6
Moved to first quartile!
3rd Quartile 3rd Quartile
CUSTOMERS 4th Quartile 4th Quartile
2010 2012 2014 Present Rank 2016 2010 2012 2014 Present Rank 2016
Residential Business Residential Business
....continues to improve rapidly.
O&M “Reinvestment” Helps CUSTOMERS.... CMS ENERGY
Adjusted EPS (non-GAAP) 2015 O&M Reinvestment (mils) 2016 Savings (mils)
DIG outage $(8) $10
2014 Reliability (10) -
17¢ Donations & other (5) 5
Total $(23) $ 15
2015
INVESTORS 13¢ 11¢
Weather 12¢
Natural Offsets (4)
Guidance Cost & Other 3
Total 11¢
+7% +6% -
January March 31 June 30 September 30 December
....AND provides sustainable, premium growth for INVESTORS.
INVESTOR INFORMATION
CMS Energy Corporation
Phil McAndrews (517) 788-1464
Investor Relations Department
Travis Uphaus (517) 768-3114
One Energy Plaza, Jackson, MI 49201
www.cmsenergy.com
CMS ENERGY
OUR MODEL; OUR PLAN
OUTPERFORMED FOR A DECADE:
NEXT DECADE EVEN BRIGHTER
12 year track record
(EPS and dividend growth)
Capex -- 100% organic
(no “big bets”)
Self-funded -- No block equity dilution!
(5 years!)
World-class cost performance
Conservative sales planning
(under promise/over deliver)
World-class regulation and law
November/December 2015
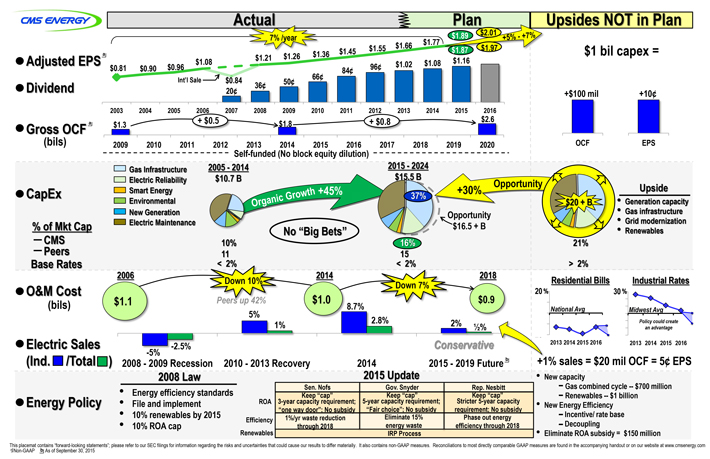
CMS ENERGY
Actual
Plan
Upsides NOT in Plan
7% /year $1.89 $2.01 +5% - +7% $1 bil capex =
$1.87 $1.97
Adjusted EPS a $0.81 $0.90 $0.96 $1.08 $1.21 $1.26 $1.36 $1.45 $1.55 1.66 $1.77
Dividend Int’l Sale $0.84
20¢ 36¢ 50¢ 66¢ 84¢ 96¢ $1.02 $1.08 $1.16 +$100 mil +10¢
2003 2004 2005 2006 2007 2008 2009 2010 2011 2012 2013 2014 2015 2016 OCF EPS
Gross OCF a (bils) $1.3 +$0.5 $1.8 +$0.8 $2.6
2009 2010 2011 2012 2013 2014 2015 2016 2017 2018 2019 2020
Self-funded (No block equity dilution)
CapEx
Gas Infrastructure
2005 - 2014 $10.7 B 2015 - 2024 $15.5 B
Electric Reliability
Smart Energy
37% +30% Opportunity
Environmental
$20 + B
New Generation
Opportunity $16.5 + B
Electric Maintenance
Organic Growth +45%
No “Big Bets”
Upside
Generation capacity
Gas infrastructure
Grid modernization
Renewables
% of Mkt Cap
— CMS
— Peers
Base Rates
10% 11 < 2% 16% 15 < 2% 21% > 2%
O&M Cost (bils)
2006 2014 2018 Residential Bills Industrial Rates
$1.1 Down 10% Peers up 42% $1.0 Down 7% 20% National Avg 30% Midwest Avg
5% 1% 8.7% 2.8% $0.9 2% 1/2% Policy could create an advantage
Electric Sales
(Ind. /Total) -2.5% -5% Conservative 2013 2014 2015 2016 2013 2014 2015 2016
2008 - 2009 Recession 2010 - 2013 Recovery 2014 2015 - 2019 Future b +1% sales = $20 mil OCF = 5¢ EPS
Energy Policy 2008 Law 2015 Update
Energy efficiency standards
File and implement
10% renewables by 2015
10% ROA cap
Sen. Nofs Gov. Snyder Rep. Nesbitt
ROA
Keep “cap” 3-year capacity requirement; “one way door”; No subsidy
Keep “cap” 5-year capacity requirement; “Fair choice”; No subsidy
Keep “cap” Stricter 5-year capacity requirement; No subsidy
Efficiency
1%/yr waste reduction through 2018
Eliminate 15% energy waste
Phase out energy efficiency through 2018
Renewables IRP Process
New capacity
– Gas combined cycle -- $700 million
– Renewables -- $1 billion
New Energy Efficiency
– Incentive/ rate base
– Decoupling
Eliminate ROA subsidy = $150 million
This placemat contains “forward-looking statements”; please refer to our SEC filings for information regarding the risks and uncertainties that could cause our results to differ materially. It also contains non-GAAP measures. Reconciliations to most directly comparable GAAP measures are found in the accompanying handout or on our website at www.cmsenergy.com
a Non-GAAP
b As of September 30, 2015