UNITED STATES
SECURITIES AND EXCHANGE COMMISSION
Washington, D.C. 20549
FORM 10-K
| | | | | |
| ☒ | ANNUAL REPORT PURSUANT TO SECTION 13 OR 15(d) OF THE SECURITIES EXCHANGE ACT OF 1934 |
For the fiscal year ended December 31, 2024
OR
| | | | | |
| ☐ | TRANSITION REPORT PURSUANT TO SECTION 13 OR 15(d) OF THE SECURITIES EXCHANGE ACT OF 1934 |
For the transition period from _____________ to ______________
Commission file number 001-42276
Everus Construction Group, Inc.
(Exact name of Registrant as specified in its charter)
| | | | | |
| Delaware | 99-1952207 |
(State or other jurisdiction
of incorporation or organization) | (I.R.S. employer
identification no.) |
| | | | | |
1730 Burnt Boat Drive Bismarck, North Dakota | 58503 |
| (Address of principal executive offices) | (Zip code) |
(701) 221-6400
(Registrant’s telephone number, including area code)
Securities registered pursuant to Section 12(b) of the Act:
| | | | | | | | |
| Title of each class | Trading Symbol(s) | Name of exchange on which registered |
| Common Stock, par value $0.01 per share | ECG | New York Stock Exchange |
Securities registered pursuant to Section 12(g) of the Act: None.
Indicate by check mark if the registrant is a well-known seasoned issuer, as defined in Rule 405 of the Securities Act. Yes ☐ No ☒.
Indicate by check mark if the registrant is not required to file reports pursuant to Section 13 or Section 15(d) of the Act. Yes ☐ No ☒.
Indicate by check mark whether the registrant (1) has filed all reports required to be filed by Section 13 or 15(d) of the Securities Exchange Act of 1934 during the preceding 12 months (or for such shorter period that the registrant was required to file such reports), and (2) has been subject to such filing requirements for the past 90 days. Yes ☒ No ☐.
Indicate by check mark whether the registrant has submitted electronically every Interactive Data File required to be submitted pursuant to Rule 405 of Regulation S-T (§232.405 of this chapter) during the preceding 12 months (or for such shorter period that the registrant was required to submit such files). Yes ☒ No ☐.
Indicate by check mark whether the registrant is a large accelerated filer, an accelerated filer, a non-accelerated filer, a smaller reporting company, or an emerging growth company. See the definitions of “large accelerated filer,” “accelerated filer,” “smaller reporting company,” and “emerging growth company” in Rule 12b-2 of the Exchange Act.
| | | | | | | | | | | |
| Large accelerated filer | ☐ | Accelerated filer | ☐ |
| Non-accelerated filer | ☒ | Smaller reporting company | ☐ |
| | Emerging growth company | ☐ |
If an emerging growth company, indicate by check mark if the registrant has elected not to use the extended transition period for complying with any new or revised financial accounting standards provided pursuant to Section 13(a) of the Exchange Act. ☐
Indicate by check mark whether the registrant has filed a report on and attestation to its management's assessment of the effectiveness of its internal control over financial reporting under Section 404(b) of the Sarbanes-Oxley Act (15 U.S.C. 7262(b)) by the registered public accounting firm that prepared or issued its audit report. ☐
If securities are registered pursuant to Section 12(b) of the Act, indicate by check mark whether the financial statements of the registrant included in the filing reflect the correction of an error to previously issued financial statements. ☒
Indicate by check mark whether any of those error corrections are restatements that required a recovery analysis of incentive-based compensation received by any of the registrant's executive officers during the relevant recovery period pursuant to §240.10D-1(b). ☐
Indicate by check mark whether the registrant is a shell company (as defined in Rule 12b-2 of the Exchange Act). Yes ☐ No ☒.
State the aggregate market value of the voting common stock held by non-affiliates of the registrant as of June 30, 2024: Not Applicable.
Indicate the number of shares outstanding of each of the issuer's classes of common stock, as of February 24, 2025: 50,999,228 shares.
DOCUMENTS INCORPORATED BY REFERENCE
Relevant portions of the registrant's 2025 Proxy Statement, to be filed no later than 120 days from December 31, 2024, are incorporated by reference in Part III, Items 10, 11, 12, 13 and 14 of this Annual Report on Form 10-K.
Index
| | | | | |
| Page |
| |
| |
| |
| Part I | |
| |
| |
| |
| |
| |
| |
| |
| Part II | |
| |
| |
| |
| |
| |
| |
| |
| |
| |
| |
| |
| |
| |
| |
| |
| |
| |
| |
| |
| |
| |
| |
| |
| |
| |
| |
| |
| |
| |
| |
| |
| |
| |
| |
| Part III | |
| |
| |
| |
| |
| |
| Part IV | |
| |
| |
| |
| |
Industry Information
Any industry data included in this Annual Report on Form 10-K (“Annual Report”) regarding industry size and/or relative industry position is derived from a variety of sources, including company research, third-party studies and surveys, industry and general publications, and estimates based on Everus Construction Group, Inc.’s (“Everus”) knowledge and experience in the industries in which it operates. Everus’ estimates, if any, have been based on information obtained from its customers, suppliers, trade and business organizations and other contacts in the industry. Everus is responsible for all the disclosures contained in this Annual Report, and Everus believes that this third-party data is generally reliable and that its estimates are accurate as of the date of this Annual Report. Further, Everus’ estimates and assumptions involve risks and uncertainties and are subject to change based on various factors, including those discussed in “Item 1A. Risk Factors” herein this Annual Report. These and other factors could cause actual results to differ materially from those expressed in the estimates and assumptions.
Cautionary Note Regarding Forward-Looking Statements
This Annual Report contains certain “forward-looking statements” within the meaning of Section 27A of the Securities Act of 1933, as amended (the “Securities Act”), and Section 21E of the Securities Exchange Act of 1934, as amended (the “Exchange Act”). All statements that reflect our expectations, assumptions or projections about the future, other than statements of historical facts, including, without limitation, statements regarding plans, trends, objectives, goals, business strategies, market potential, future financial performance and other matters are considered forward-looking statements. The words “believe,” “expect,” “estimate,” “could,” “should,” “would.” “intend,” “may,” “plan,” “predict,” “seek,” “anticipate,” “project” and similar expressions generally identify forward-looking statements, which speak only as of the date the statements were made. In particular, information included under “Item 1A. Risk Factors,” “Item 1. Business,” “Item 7. Management’s Discussion and Analysis of Financial Condition and Results of Operations” and other sections of this Annual Report contain forward-looking statements.
The matters discussed in these forward-looking statements are subject to risks, uncertainties and other factors that could cause actual results to differ materially from those projected, anticipated or implied in the forward-looking statements. Although we believe that the expectations reflected in any forward-looking statements we make are based on reasonable assumptions as of the date they are made, we can give no assurance that the expectation will be attained and it is possible that actual results may differ materially from those indicated by these forward-looking statements due to a variety of risks and uncertainties. For additional information on identifying factors that may cause actual results to vary materially from those stated in forward-looking statements, see the discussions under “Item 1A. Risk Factors” in this Annual Report.
You should read this Annual Report completely and with the understanding that actual future results may be materially different from expectations. All forward-looking statements made in this Annual Report are qualified by these cautionary statements. These forward-looking statements are made only as of the date of this Annual Report, and we do not undertake any obligation, other than as may be required by law, to update or revise any forward-looking or cautionary statements to reflect changes in assumptions, the occurrence of events, unanticipated or otherwise, and changes in future operating results over time or otherwise.
Comparisons of results for current and any prior periods are not intended to express any future trends, or indications of future performance, unless expressed as such, and should only be viewed as historical data.
Risk Factors Summary
The following is a summary of some of the material risks and uncertainties that could materially affect our business, financial condition and results of operations. You should read this summary together with the more detailed description of each risk factor described in Part I, Item 1A. Risk Factors of this Annual Report.
Operations, Growth and Competitive Risks
•We operate in a highly competitive industry.
•Our business is seasonal.
•Our operating results may vary significantly from period to period.
•Our lack of success at generating internal growth.
•Our inability to retain our current customers and obtain new customer contracts.
•The loss of, or reduction in business from, certain significant customers.
•Our dependence upon fixed-price contracts.
•Our participation in joint ventures.
•That a material portion of our business depends on our ability to provide surety bonds.
•Our backlog may not accurately represent future revenue.
•Our failure to adequately recover on contract change orders or claims.
•Our exposure to warranty claims.
•Our exposure to risk of loss resulting from the nonpayment and/or nonperformance by our customers and counterparties.
•Our pursuit of acquisitions and other strategic transactions.
•Supply chain disruptions.
•Volatility in the prices or availability of certain materials and equipment used in our business and those of our customers, including as a result of inflation, geopolitical instability and protectionist trade measures.
•The impact of severe weather events as a result of climate change or otherwise.
•Technology disruptions or cyberattacks.
•Artificial intelligence challenges.
•Pandemics, including COVID-19.
•We may incur liabilities or suffer negative financial or reputational impacts relating to health and safety matters.
•That our insurance has limits and exclusions that may not fully indemnify us against certain claims or losses.
Economic and Industry Risks
•Economic volatility.
•That we are subject to capital market and interest rate risks.
Financial and Accounting Risks
•Our financial results and projections are based upon estimates and assumptions that may cause our actual results to materially differ from such projections, which may adversely affect our future profitability, cash flows and stock price.
•That we recognize revenue for the majority of construction projects based on estimates.
•Reductions in our credit ratings.
•The debt obligations we incurred in connection with the Separation.
•Goodwill and identifiable intangible asset impairments.
Legal and Regulatory Risks
•Pending and/or future litigation, claims or investigations.
•Changes in tax law.
•Import tariffs and/or other government mandates.
•That our business is based in part on government-funded infrastructure projects and building activities, and any associated regulatory changes or requirements in these areas.
•Our failure to comply with requirements imposed by applicable law or other governmental regulations.
•That our operations are subject to environmental laws and regulations.
Human Capital and Labor Risks
•Our inability to obtain, develop and retain key personnel and skilled labor forces.
•Our unionized workforce.
•Costs related to obligations under multiemployer pension plans.
•Increasing costs associated with health care plans.
Separation and Distribution Risks
•Our minimal history of operating as an independent, public company and our historical financial information is not necessarily representative of the results that we would have achieved as a separate, publicly traded company and may not be a reliable indicator of our future results.
•The failure of the Distribution (as defined below), together with certain related transactions, to qualify as a transaction that is generally tax-free for U.S. federal income tax purposes.
•U.S. federal income tax consequences may restrict our ability to engage in certain desirable strategic or capital raising transactions after the Separation (as defined below).
•We may not enjoy the same benefits that we did as a segment of MDU Resources (as defined below).
•Our inability to achieve some or all of the expected benefits from the Separation.
•The failure by us or MDU Resources to perform under various transaction agreements that were executed as part of the Separation or that we may fail to have necessary systems and services in place when certain of the transaction agreements expire.
•Our inability to resolve favorably any disputes that arise between us and MDU Resources with respect to our past and ongoing relationships.
•The indemnification obligations related to the Separation.
•That certain members of management and directors hold our stock and stock in MDU Resources.
•Failure to maintain effective internal control over financial reporting in accordance with Section 404 of the Sarbanes-Oxley Act (as defined below).
Common Stock Risks
•The trading market of our common stock has existed only for a minimal period of time following the Separation and Distribution, and our stock price and trading volume may fluctuate significantly.
•If securities or industry analysts do not publish research or publish misleading or unfavorable research about our business.
•Your percentage of ownership in us may be diluted in the future.
•Our inability to guarantee the timing, declaration, amount or payment of dividends, if any, on our common stock.
•Exclusive forum provisions in our certificate of incorporation and bylaws could discourage lawsuits against us and our directors and officers.
•Provisions in our certificate of incorporation and bylaws and Delaware law may prevent or delay an acquisition of us.
Part I.
Item 1. BUSINESS
References in this Annual Report to the “Company”,“Everus”, “we”, “us” or “our” refer to Everus Construction Group, Inc., a Delaware corporation, and its subsidiaries. References in this Annual Report to “MDU Resources” refer to MDU Resources Group, Inc., a Delaware corporation, and its subsidiaries (other than, after the Distribution, Everus and its subsidiaries), unless the context otherwise requires. References to Everus’ historical business and operations refer to the business and operations of Everus Construction, Inc. (formerly known as MDU Construction Services Group, Inc.) (“Everus Construction”) prior to the Separation and refer to Everus after the Separation.
The Separation
On November 2, 2023, MDU Resources announced its intent to pursue a tax-free spinoff of Everus Construction (formerly known as MDU Construction Services Group, Inc.) from MDU Resources (the “Separation”). Prior to the Separation, Everus Construction was the construction services segment of MDU Resources and operated as a wholly owned subsidiary of CEHI, LLC (“Centennial”), which is a wholly owned subsidiary of MDU Resources. In anticipation of the Separation, MDU Resources formed a new wholly owned subsidiary, Everus Construction Group, Inc., that became the new parent company of Everus Construction.
On October 31, 2024, MDU Resources completed the Separation by transferring Everus Construction, inclusive of all its assets and liabilities, to Everus and distributing 100% of Everus’ outstanding common stock to holders of record of MDU Resources’ common stock as of the close of business on October 21, 2024 (the “Distribution”). The Separation was completed as a generally tax-free spin-off for U.S. federal income tax purposes. Following the Separation and Distribution, Everus became an independent, publicly traded company and is listed on the New York Stock Exchange under the ticker symbol “ECG”.
Our Company
We are a leading construction solutions provider headquartered in Bismarck, North Dakota, offering specialty contracting services to a diverse set of end markets across the United States. We operate throughout most of the United States through two operating segments, which represent our two reportable segments: Electrical & Mechanical (“E&M”) and Transmission & Distribution (“T&D”). We deliver services through our 15 wholly-owned operating companies (the “Operating Companies”), which go to market under 20 local brands allowing us to differentiate the services we provide and geographical markets we serve. Our historical business was established in 1997 and we have expanded our capabilities significantly since then through targeted entry into new geographies and more than 25 acquisitions. Our size and scale continue to be reflected in our national rankings. We were ranked 9th on Engineering News-Record magazine’s 2024 Top 600 Specialty Contractors list and ranked 5th on Electrical Construction & Maintenance magazine’s 2024 Top 50 Electrical Contractors list. Additionally, according to Solar Power World, our operating brand Bombard Renewable Energy is among the top U.S. solar installation providers.
During 2024, we served approximately 3,900 customers across more than 43,000 projects throughout the United States. The number of employees fluctuates at any given time depending on the number and scale of projects. We had approximately 8,700 employees at peak across all functions and sites in 2024, with a similar workforce count as of December 31, 2024.
Our specialty contracting services across E&M and T&D are provided to customers in the commercial, industrial, institutional, service & other, renewables, utility and transportation end markets. We go to market through an operating model that aligns with our 4 EVER Strategy—Employees, Value, Execution and Relationships. This focused strategy enhances the competitive position of our Operating Companies in their respective markets through local brand reputation and delivery, while providing corporate support across people, processes and systems to drive differentiated outcomes for our customers. Our full-service project approach emphasizes meticulous upfront planning, design-assist, construction and installation, supported by experienced project managers, foremen and a skilled workforce. With strong union relationships, a reliable labor source, and a flexible field delivery model, we adapt to project demands while maintaining safety, quality and successful execution. Our highly experienced management teams have significant experience in the industry and have transformed our business from a group of small, regional brands into a national service provider. With deep industry expertise and decades of collaboration, we regularly refine strategies, share best practices, and focus on customer relationships, safety and operational excellence.
Business Segments
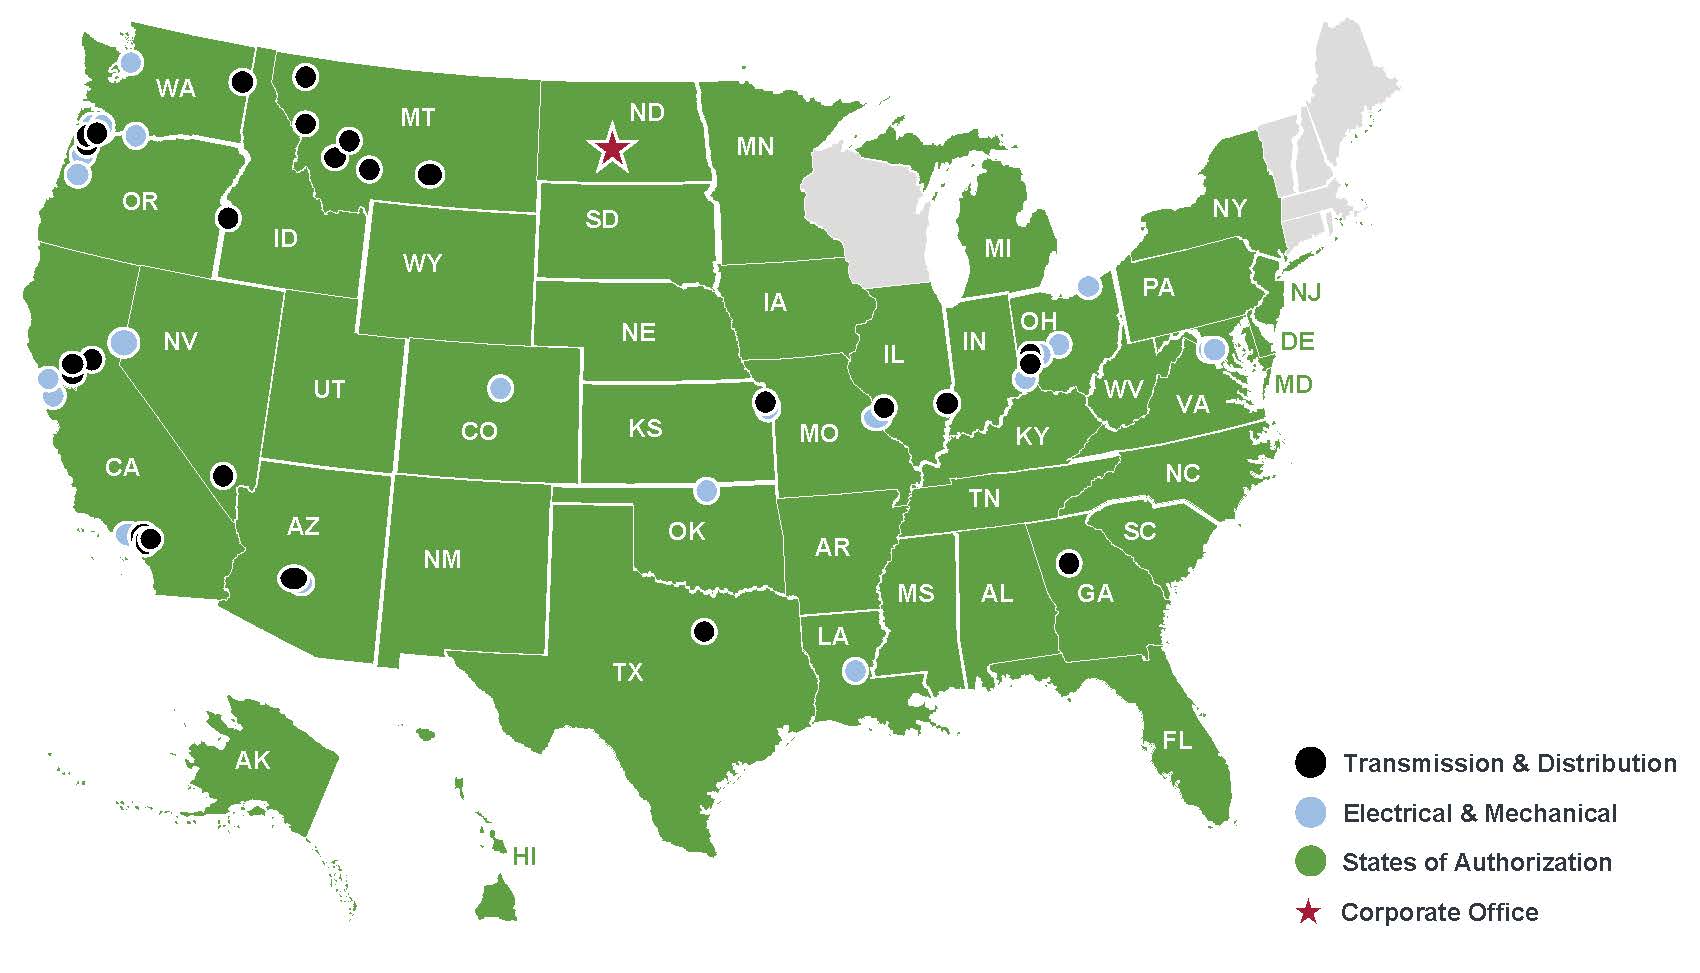
Our E&M segment primarily serves general contractor and end-use customers, with demand driven by secular tailwinds for infrastructure development and maintenance in the commercial, industrial, institutional, service & other and renewables end markets. E&M offers a wide variety of specialty contracting services, including construction and maintenance of electrical and communication wiring, fire suppression systems and mechanical piping and services, to customers in both the public and private sectors. Our work within the commercial end market leverages our deep expertise within the data center submarket, as well as hospitality and entertainment projects, in addition to more standard commercial projects. Our work within the industrial end market is driven by the need for high tech, manufacturing and industrial installations work, as well as renovations, upgrades and expansions. Within the institutional end market, work is driven by activity in the education, government and healthcare submarkets. Our service & other work is driven by smaller projects, which can be standalone engagements or recurring maintenance work. Within the renewables end market, we execute projects ranging in size from local electric vehicle charging stations to large-scale solar generation. As a result, E&M has a broad and diversified geographic presence, with a strong footprint across the United States. E&M is comprised of nine Operating Companies with approximately 6,700 employees at peak and as of December 31, 2024, offices in 24 cities and a physical presence in 13 states throughout the United States.
Our T&D segment primarily serves electric and natural gas utility customers, as well as customers in the transportation end market, in the West and Midwest regions of the United States. T&D specializes in transmission and distribution construction and offers a broad set of specialty contracting services, including the construction and maintenance of overhead and underground electrical, gas and communication infrastructure. In addition to its specialty contracting services, T&D also designs, manufactures, sells and rents overhead and underground line-stringing equipment and tools. This equipment-serving capability complements T&D’s projects of various size and scope, while providing customers with exceptional service and fast distribution and delivery. The T&D segment also provides solutions across excavation and underground boring, substations, signals and lighting, and emergency restoration. Demand for these services is driven by increased utility spend on aging infrastructure, system hardening, grid reliability initiatives, natural disasters and other weather-related events. T&D has a significant geographical presence in Missouri, California, Montana and Oregon, in addition to equipment rental and
manufacturing distribution centers in Arizona, Texas, Georgia, Illinois, Oregon and Ohio. T&D is comprised of six Operating Companies with approximately 2,000 employees at peak in 2024 and approximately 1,900 employees as of December 31, 2024, offices in 19 cities and a physical presence in 11 states throughout the United States.
For 2024, our E&M segment generated approximately 71% of our total contract revenues with 6.7% operating income as a percentage of segment contract revenues, and our T&D segment generated approximately 29% of our total contract revenues with 10.2% operating income as a percentage of segment contract revenues.
We also allocate general corporate overhead costs that we chose not to allocate directly to E&M or T&D to Corporate and Other as these costs are not considered part of management’s evaluation of reportable segment operating performance. We also allocate costs related to certain assets not directly attributable to either E&M or T&D to Corporate and Other.
Industry
The U.S. construction services industry is highly fragmented. It includes a wide spectrum of players, from small, private companies whose activities are geographically concentrated, to larger public companies with nationwide capabilities. Competition within the industry is influenced by various elements such as technical expertise, service pricing, financial and operational resources, track record for safety, industry reputation and dependability.
The U.S. construction services industry serves a diverse customer base that includes federal, state and municipal governmental agencies, commercial and residential developers and private parties. The mix of customers varies by region and economic conditions.
The main factors and trends in the U.S. construction services industry include:
•Key economic factors. Many factors affect product demand, including public spending on infrastructure projects, general economic conditions, including population growth and employment levels, imposed and proposed tariffs, and prevailing interest rates.
•Inflation. Rising inflation can increase the cost of construction materials, labor and insurance premiums, impacting project budgets and profitability.
•Industry fragmentation. There are thousands of construction services providers of varying scope and size. Market participants may enter new geographies or expand existing positions through organic growth or the acquisition of existing providers.
•Seasonality. Activity in certain areas is seasonal due to the effects of weather, which can impact safety and efficiency of operations and lead to demand for services.
•Cyclicality. The demand for construction services is significantly influenced by the cyclical nature of the economy.
•Regulations. Operations are subject to extensive laws and regulations relating to the maintenance of safe conditions in the workplace.
•Production inputs. Cost of labor, equipment and other inputs can vary over time based on macroeconomic factors and impact profitability of operations.
•Personnel. Ability to maintain productivity and operating performance is heavily dependent on the ability to employ, train and retain qualified personnel necessary to operate efficiently.
Everus participates in the following primary markets: E&M and T&D.
Electrical & Mechanical
E&M services are broadly categorized as electrical construction and contracting, mechanical contracting and fire protection turnkey solutions. Broad service offerings include low voltage services, renewable installations, packaged controls and manufacturing. These services are critical in supporting safe, reliable and timely construction across a variety of commercial, institutional, industrial and multi-family residential structures. E&M services span a variety of markets, including commercial, industrial, institutional, service and renewables, among others.
The growth in the E&M construction services industry can be attributed to several different factors such as (i) the increased intricacy and sophistication of E&M systems due to the adoption of artificial intelligence, automation and controls, cloud computing and data storage, (ii) the increased government support for manufacturing, high tech, infrastructure and reshoring, (iii) population growth, (iv) an aging base of existing buildings and equipment and (v) the ongoing energy transition and
expansion that has resulted from a growing emphasis on sustainability across the country. In addition, the key drivers of potential future E&M market growth include:
•Mission critical technologies. Global trends toward digitalization and increasing demand for capacity to support new artificial intelligence technologies are expected to drive medium- to long-term activity across the semiconductor and data center markets.
•Manufacturing and infrastructure. The institutional and industrial industries have continued to see growth and investments in the need for new and/or upgraded infrastructure and equipment and increased support for manufacturing, high tech and reshoring. These trends are expected to continue and provide near and long-term activity.
•Hospitality. The hospitality industry has seen recent growth due to a rise in domestic travel following the COVID-19 period, gradual return-to-office and business travel, an increase in local vacations, and higher disposable incomes, all of which are renewing demand for the hospitality construction market.
•Health care. Technological innovation and new regulatory requirements are driving heightened investment in and upgrades to critical life and health systems.
•Renewables. Several consumer and regulatory tailwinds are driving activity in this end market, including federal investment credits and rebates for solar energy, electric vehicle adoption and new regulations, which are collectively increasing the need for sufficient infrastructure to support renewable energy sources.
Transmission & Distribution
T&D services primarily consist of installation and maintenance services for electrical transmission and distribution infrastructure, which consists of transmission lines, distribution lines, substations, towers, poles and other essential equipment that enable the transfer and delivery of power from generators to customers. T&D construction services are critical in building and maintaining the infrastructure necessary for utilities to transmit and distribute electricity from the generation source to end residential, commercial and industrial customers. The T&D services industry also provides emergency restoration services in response to wildfires and other natural disasters, as well as the installation and maintenance of gas and communication infrastructure. Moreover, T&D construction services are essential to mitigating health and safety concerns in the operation of electrical infrastructure, which helps preserve the consistent and durable demand for such services. T&D services span a variety of markets, including electric and natural gas utilities, communications, and transportation, among others.
Growth in the T&D industry is primarily driven by electric utilities that continue to invest heavily in new capital project and maintenance programs. This increased capital expenditure spend, as well as the continued outsourcing of transmission and distribution services, benefits from a number of factors such as (i) grid modernization, (ii) build out of additional renewable power sources, (iii) rate case dynamics and (iv) increased government support and spending on infrastructure. In addition, key drivers of potential future T&D market growth include:
•Utilities. Underlying utility spend is expected to grow in the medium term at rates similar to historical growth rates, driven by aging infrastructure and required replacement, system upgrades and grid hardening.
•Excavation/underground. Underground excavation is becoming more attractive given advancements in the way construction work is completed. Increased regulatory scrutiny also has resulted in a shift toward placing utilities underground to protect against unfavorable environmental impacts.
•Communications. Renewal and development of communications infrastructure is increasing to support growing data consumption and new methods of transmission and technology advancement. The infrastructure modernization is bolstered by industry tailwinds from the investment of large, well-capitalized national companies and government policies.
Customers
Our business model fosters strong, close-knit relationships with local contractors and end customers. In 2024, we served approximately 3,900 customers across more than 43,000 projects, with our top 10 customers contributing approximately 33% of our total operating revenues of $2.85 billion, but no single customer accounting for more than 10% individually. However, at the segment level, revenue from a single customer accounted for 17.2% of total T&D segment revenues, but no single customer accounted for more than 10% of total E&M segment revenues in 2024.
We have long-standing relationships with many of our customers, serving as a testament to our customer-oriented culture and history of operational excellence. Our customer base is diverse and ranges from large technology companies to utility providers and local municipalities. Contracts with these various types of customers generally are awarded in the form of a
competitive or negotiated bid or master service agreement arrangement. A significant amount of the work we complete is competitively awarded by evaluating non-price items, such as our pre-construction and design-assist services, and our safety record. We develop strong working relationships by delivering on the key criteria that our larger customers seek, namely scale, professionalism, safety and timely project execution. Moreover, our corporate leadership allows us to strengthen local relationships, while fortifying our reputation of safety and project execution excellence, driving repeat opportunities with our best customers.
Materials and Equipment
Our operations and customers depend on the availability of certain raw materials and components for construction, including, among other things, electrical fixtures, system components, copper, aluminum, steel, and certain plastics. These raw materials and components are generally available from a variety of domestic suppliers at competitive prices.
Under some of our projects, customers will provide the necessary materials and supplies for projects and we are responsible for the installation of, but not the cost or warranty of, those materials. Under certain other projects, we are responsible for purchasing the necessary materials and supplies on behalf of our customers. We are not dependent on any one vendor for project-related materials or supplies required for the projects we manage.
However, supply chain interruptions have become increasingly common. Although supply of most raw materials normalized during fiscal 2024, we continue to experience longer lead times in sourcing certain components. Such delays may lead to project inefficiencies resulting from schedule extensions. We are also exposed to increases in the prices of certain commodities due to inflation, imposed and proposed tariffs, or other economic factors. Our strategy to reduce commodity cost exposure includes early buying of commodities for particular projects or general inventory, as well as including escalation and escape provisions in project bids, quotes and contracts wherever possible. However, such protections are not included in every contract or project, and in such cases, we may not be fully reimbursed for increases in commodity prices by our customers and may be exposed to commodity price volatility on longer-term projects where we have prepaid for commodities.
See Item 1A. Risk Factors for more discussion on risks we face relating to supply chain disruptions and commodity price risk, including imposed and proposed tariffs, that could have an adverse impact on our business, financial condition and results of operations.
Seasonality
Adverse weather conditions pose potential challenges and opportunities to our operations, particularly in our T&D segment. Seasonal variation impacts safety and efficiency in certain U.S. regions, which affects our ability to provide construction services and consequently affects our revenues and profitability. Our T&D operations can be delayed due to severe weather conditions, especially in the winter months, and can be impacted by customer restrictions limiting our ability to perform our service work when electrical demands are high, especially in the summer months, depending on location. Despite these potential challenges, our national footprint and service mix ensures exposure to a diverse set of geographies, climates and project work, mitigating the seasonality risk while providing opportunities across the United States.
Competition
We operate in a highly competitive business environment, which includes large public companies and many small privately held companies. In addition to competition from smaller independent operators, we face competition from large, publicly traded U.S. construction services companies, including Comfort Systems USA, Inc., EMCOR Group, Inc., IES Holdings, Inc., MasTec, Inc., MYR Group Inc., Primoris Services Corporation and Quanta Services, Inc., as well as large, private U.S. construction services companies, including M.C. Dean, Inc., Rosendin Electric, Pike Corporation and Archkey Solutions. The nature of our competition varies among geographies due to the generally local and regional nature of our services.
Competition is based primarily on price, reputation for quality, safety and reliability. The size and location of the services provided, as well as the state of the economy, are factors in the number of competitors that we will encounter on any particular project. We believe that our service offering, diversification and geographic footprint in the United States, along with the quality and management of our workforce, enable us to effectively operate in this competitive environment.
Bidding Arrangements and Contract Types
We win most of our projects through competitive bids or by negotiation. When competing for business, several factors are evaluated in determining the bid price for contract work. These include, but are not limited to, the complexities of the job, past history performing similar types of work, seasonal weather patterns, competition and market conditions, job site conditions,
workforce safety, reputation of the project owner, availability of labor, materials and fuel, project location and project completion dates. If awarded a project, we generally enter into a contract with the customer that defines the scope of the project, responsibility, payment structure and schedule. While there is significant variation in specific contract terms, most contracts are structured as:
•Fixed-Price Contracts. Defined scope of work for a fixed amount.
•Cost-Reimbursable Contracts. Defined scope of work for the cost of the project plus a negotiated margin.
•Unit-Price Contracts. Defined scope of work for each unit for a fixed amount per unit.
Fixed-price contracts accounted for approximately 59% of total 2024 contract revenues, including 64% of 2024 contract revenues for E&M and 46% for T&D. Cost-reimbursable contracts accounted for approximately 34% of total 2024 contract revenues, including 33% of 2024 contract revenues for E&M and 35% for T&D. Unit-price contracts accounted for approximately 7% of total 2024 revenues, including 3% of 2024 contract revenues for E&M and 19% for T&D.
We have a broad portfolio of long-term master service agreements within the T&D business, and the work performed pursuant to these agreements generally is priced on a unit-price basis. Our agreements often also cover preventive maintenance and as-needed emergency outage work.
Backlog
Backlog is a common measurement in the construction services industry. Our determination of backlog can include projects that have a written award, a letter of intent, a notice to proceed, an agreed upon work order to perform work on mutually accepted terms, and conditions and change orders or claims to the extent management believes additional contract revenues will be earned and are deemed probable of collection. Contracts are subject to delays, defaults or cancellations; changes in scope of services to be provided; and adjustments to costs. For further information on backlog, refer to Item 7. Management’s Discussion and Analysis of Financial Condition contained elsewhere in this Annual Report.
Risk Management
Insurance
Prior to the Separation, we historically benefited from coverages under certain corporate level insurance policies held by MDU Resources, including MDU Resources captive insurance program. The Separation and Distribution agreement provides for the allocation between the parties of rights and obligations under existing insurance policies with respect to claims covered by MDU Resources’ insurance prior to the Distribution and sets forth procedures for the administration of insured claims and related matters.
Following the Separation, we maintain our own standalone insurance coverages that we believe are appropriate for our business, including but not limited to: workers’ compensation, auto liability, general liability, excess liability, contractors pollution liability, legal liability, professional liability, directors and officers liability, employment practices liability, cyber insurance, terrorism insurance and property insurance.
Additionally, we have our own captive insurance arrangement, whereby we manage and maintain a portion of our casualty and operational risk, which reimburses our claims up to the amount of the applicable deductibles of certain third-party insurance program policies, as well as with respect to certain other amounts. In connection with the Separation, MDU Resources transferred assets and liabilities to us that represented our portion of the MDU Resources insurance captive program.
Bonding
In the normal course of business, we are required to post surety bonds or present other means of financial assurance for certain public and private sector contracts to secure contractual performance. Our comprehensive surety bonding program includes:
•Performance Bond. Ensures completion of the contract according to its terms, including price and time.
•Bid Bond. Guarantees commitment to a bid and execution of all contract documents if awarded.
•Payment Bond. Ensures payments to all subcontractors and suppliers.
•License Bond. Protects governments and consumers from fraudulent practices.
As of December 31, 2024, we had approximately $2.05 billion in original face amount of bonds outstanding for projects, with approximately $1.75 billion of bonding posted for E&M and approximately $296.3 million for T&D. In addition, approximately $8.2 million of bonding was posted for Corporate and other. A large portion of our existing surety bonds are expected to expire within the next 12 months; however, we will likely continue to rely on surety bonds in the future and seek to maintain the level of bonding capacity necessary to support our operations.
Regulatory and Environmental Matters
Our operations are subject to various federal, state and local laws and regulations, including, but not limited to:
•licensing, permitting, and inspection requirements applicable to construction projects, contractors, electricians, and engineers;
•worker safety regulations, including those established by the Occupational Safety and Health Administration (“OSHA”);
•environmental protection regulations, including those established by the Environmental Protection Agency and state agencies;
•building and electrical codes;
•wage and hour regulations, including those associated with collective bargaining agreements and our unionized workforce;
•transportation regulations, including licensing and permitting requirements for equipment and materials;
•anti-corruption regulations applicable in the United States;
•immigration regulations applicable in the United States;
•special bidding, procurement, and other requirements on government projects;
•regulations regarding engagement of suppliers and subcontractors that meet diversity-ownership or disadvantaged-business requirements.
We believe that we have all of the licenses and permits required to conduct our operations and that we are in substantial compliance with applicable regulatory requirements.
Our operations are subject to a wide range of federal, state and local laws and regulations that govern environmental protection, worker safety, licensing, and data security. Environmental laws regulate the handling, transportation, and disposal of hazardous and non-hazardous substances, as well as emissions into air, water, and soil. Compliance with worker safety standards, including those established by OSHA, as well as permitting, inspection, and licensing requirements for construction and mechanical services, is integral to our operations. We also adhere to regulations aimed at protecting personal and business data, requiring ongoing investments in cybersecurity and privacy safeguards.
Failure to comply with these regulations could result in substantial fines, project delays, or the revocation of operating licenses, potentially affecting ongoing operations and future opportunities. Environmental regulations, in particular, impose cleanup liabilities and may necessitate substantial investments in compliance programs to meet new standards for emissions and sustainability. Similarly, complex requirements for data protection, wage regulations and collective bargaining agreements add to the compliance landscape, requiring constant oversight and proactive adaptation.
Regulatory initiatives supporting renewable energy, infrastructure investment and clean energy technologies are expected to drive demand for our services in the long term. By maintaining robust compliance programs and continually monitoring regulatory changes, we believe we are well-positioned to address these challenges and capitalize on new opportunities as they arise. For further information regarding the effects of regulation on our business, refer to Item 1A. Risk Factors contained elsewhere in this Annual Report.
We incorporate climate-related risks and opportunities into our long-term strategic planning and enterprise risk management processes. Although the overall effects on our operations are still evolving, various dimensions of climate change, along with societal and market concerns about its future impacts, have created and are expected to continue creating both opportunities and challenges for our operations. These arise from physical risks associated with climate change, as well as advances in technology, shifts in market conditions, and increased regulatory and compliance expenses.
Climate change has already contributed to, and is anticipated to further drive, rising temperatures, higher sea levels, and alterations to meteorological and hydrological patterns. It has also affected the frequency and severity of events such as wildfires, hurricanes, floods, droughts, winter storms, and other extreme weather events or natural disasters. Our operating results are heavily influenced by the climates in which we operate and by the occurrence of severe weather events. For additional information, refer to Item 1A. Risk Factors contained elsewhere in this Annual Report.
Intellectual Property
We hold various trademarks that support the operations of our business, including our advertising and marketing activities, which are generally protected by registration in the United States.
Human Capital Resources
Employees
Our number of employees fluctuates at any given time depending on the number and scale of projects. We had approximately 8,700 employees at peak across all functions and sites in 2024, with a similar workforce count as of December 31, 2024. The Operating Companies are responsible for sourcing local labor while corporate oversight ensures appropriate staffing and on-site project leadership structures.
We maintain strong relationships with various local unions, including the International Brotherhood of Electric Workers, across our sites. As of December 31, 2024, approximately 83% of our employees were represented by labor unions. Our large, unionized workforce provides flexibility to scale both up and down with projects as needed.
Employee Compensation and Benefits
Our compensation programs are generally designed to recruit, motivate, reward, and retain employees and align employee compensation with market practices and our performance by providing the proper incentives to reflect as such. Our compensation programs consist of both fixed and variable pay components, with an emphasis on pay for performance for our executive officers and other senior leadership. For additional information regarding our executive compensation, refer to Item 11. Executive Compensation contained elsewhere in this Annual Report, which will be incorporated by reference from our definitive proxy statement related to our 2025 Annual Meeting of Stockholders.
In addition to the compensation programs, we also provide additional benefits to our employees, including health, welfare and benefit plans for employees who are not covered by collective bargaining agreements through the unions. We maintain a 401(k) plan in which eligible employees who are not provided retirement benefits through a collective bargaining agreement may participate and make contributions through payroll deductions. We have a matching contribution policy up to a defined maximum percentage.
Employee Development, Training and Safety
People are at the core of our business, and our culture encourages everyone to lead with integrity and take responsibility for ensuring a safe work environment. We offer a variety of training and development opportunities to encourage growth within the organization. Effective training is integral to employee development and is a top priority, with a specific focus on a safety-first culture and values of integrity and ethical leadership across all levels of the organization. We conduct classes as well as hands-on training to develop our employees’ skills and capabilities and utilize safety compliance metrics in employee evaluations. Our close relationship with unions also allows us to deliver effective training programs and continuous education.
Employee Code of Conduct and Ethics Code - Leading With Integrity Guide
All of our employees are subject to our code of conduct and ethics, which we refer to as the Leading With Integrity Guide, which addresses compliance with applicable laws and our policies concerning general business ethics, anti-corruption and bribery, conflicts of interest, competition, harassment and discrimination, data privacy and security, among other things. Training with respect to our Leading With Integrity Guide and other policies and procedures are conducted as part of our extensive ethics and compliance training program. The Leading With Integrity Guide provides employees, as well as third parties, the resources and confidential processes in place to detect, prevent and report illegal and/or unethical conduct.
Available Information
Our annual reports on Form 10-K, quarterly reports on Form 10-Q, current reports on Form 8-K, and any amendments to applicable reports filed or furnished pursuant to Section 13(a) or 15(d) of the Exchange Act are available free of charge at
www.everus.com as soon as reasonably practicable after they are electronically filed with, or furnished to, the Securities and Exchange Commission (the "SEC"). Copies of any materials we file with the SEC can be obtained free of charge at www.sec.gov. The foregoing website addresses are provided as inactive textual references only. The information provided on our website (or any other website referred to in this Annual Report) is not part of this Annual Report and is not incorporated by reference as part of this Annual Report.
Item 1A. RISK FACTORS
Our business and financial results are subject to a number of risks and uncertainties. The risk factors and other matters discussed herein are important factors that could cause our actual results or outcomes to differ materially from those discussed in the forward-looking statements included elsewhere in this Annual Report. If any of the risks described below actually occur, our business, prospects, financial condition or financial results could be materially impacted. The following are the most material risk factors applicable to our business and are not necessarily listed in order of importance or probability of occurrence. You should carefully consider the following risks and other information in this Annual Report in evaluating our business and common stock.
Operations, Growth and Competitive Risks
We operate in a highly competitive industry.
Our business is subject to competition. The markets we serve are highly fragmented and we compete with a number of regional, national and international companies. These companies may have greater financial and other resources than us. Certain other companies may be smaller and more specialized and may concentrate their resources in particular areas of expertise. Our results are also affected by the number of competitors in a market, the demand for services in a particular market, the pricing practices of other competitors and the entry of new competitors in a market.
In addition, construction services are marketed under highly competitive conditions and are subject to competitive forces such as price, quality, safety and reliability. Significant competition could lead to lower prices, higher wages, lower sales volumes and higher costs. Our customers make competitive determinations based upon qualifications, experience, performance, reputation, technology, customer relationships, price, quality and ability to provide the relevant services in a timely, safe and cost-efficient manner. Increased competition may result in our inability to win bids for future projects and our failure to effectively compete could negatively affect our results of operations, financial position and cash flows. Furthermore, new acquisition opportunities are subject to competitive bidding environments, which may impact prices we must pay to successfully procure new properties and acquisition opportunities to grow our business.
Our business is seasonal, which could adversely affect our operations, revenues and the timing of cash flows.
Business operations and activities in certain locations are seasonal, and operations are affected by weather conditions. Construction services and related specialty contracting services typically follow the activity in the construction industry, with heavier workloads in the spring, summer and fall. As a result, seasonality could negatively affect our results of operations, financial position and cash flows.
Operating results may vary significantly from period to period.
Demand for our services has been, and will likely continue to be, cyclical in nature and vulnerable to downturns in the general economy, as well as in the construction industry. Large construction projects often involve extended timelines and are subject to delays, cancellations, or reduced activity during economic downturns, further amplifying risks to our revenues and profitability. General concerns about the fundamental soundness of the economy may cause customers to defer projects, even if they have credit available to them. Prolonged uncertainties in the capital markets, or the returns of constrained capital market conditions, could have adverse effects on our customers, which would adversely affect our financial condition and results of operations.
We may be unsuccessful at generating internal growth, which could adversely affect operations.
Our ability to generate internal growth may be affected by, among other factors, our ability to:
•attract new customers;
•successfully bid for new projects;
•increase the number of projects performed for existing customers;
•expand geographically;
•adapt the range of services we offer to address customers’ evolving construction needs;
•secure appropriate levels of construction equipment; and
•hire and retain qualified personnel;
In addition, our customers may reduce the number or size of projects available to us due to their inability to obtain capital. Customers may also reduce projects in response to economic conditions. Many of the factors affecting our ability to generate internal growth may be beyond our control, and we cannot be certain that strategic initiatives will be successful or that we will be able to generate cash flow sufficient to fund operations and to support internal growth. If efforts are unsuccessful, we may not be able to achieve internal growth, expand operations or grow our business.
Our operations may be negatively affected if we are unable to retain our current customers and obtain new customer contracts.
The number of construction contracts we enter into is dependent on the level and timing of maintenance and construction programs undertaken by customers. Utilities and independent contractors represent our largest customer base. Accordingly, utility and subcontract work accounts for a significant portion of the work performed by us. Most of our work is obtained on the basis of competitive bids or by negotiation of either cost-reimbursable or fixed-price contracts, and we benefit from repeat customers and strive to maintain successful long-term relationships with our customers.
The loss of, or reduction in business from, certain significant customers could have a material adverse effect on our business.
Our customer base is reasonably concentrated, with the top 10 customers accounting for approximately 33% of total operating revenues in 2024, but no single customer accounting for more than 10% individually. However, at the segment level, revenue from a single customer accounted for 17.2% of total T&D segment revenues, but no single customer accounted for more than 10% of total E&M segment revenues in 2024.
Although we have longstanding relationships with many of our significant customers, a significant customer may unilaterally reduce or discontinue business at any time or merge or be acquired by a company that decides to reduce or discontinue business with us. A significant customer may also encounter financial constraints, file for bankruptcy protection or cease operations, any of which could also result in reduced or discontinued business with us. The loss of business from a significant customer could have a material adverse effect on our business, financial condition, results of operations and cash flows.
We currently generate, and expect to continue to generate, a significant portion of our revenues from fixed-price contracts. Our dependence upon fixed-price contracts could adversely affect our business, financial position, results of operations, and cash flows.
We must estimate the total costs of a particular project to bid for fixed-price contracts. Cost and scheduling estimates are based on a number of assumptions, including those about future economic conditions, commodity and other materials pricing, cost and availability of labor, equipment and materials, and supply chain efficiency, among other factors. The actual cost of labor and materials, however, may vary from the costs we originally estimated, something which we have experienced and may continue to experience due to inflationary pressures, supply chain challenges, tariffs and rising interest rates. These variations, along with other risks, inherent in the execution of projects subject to fixed-price contracts, may cause actual gross profit from projects to differ from those we originally estimated and could result in reduced profitability or losses on projects. Depending upon the size of a particular project, variations from the estimated contract costs can have a significant impact on our operating results for any fiscal quarter or year. All of these impacts could have an adverse effect on our business, financial position, results of operations, and cash flows.
Our participation in joint ventures may have a negative impact on our reputation, business operations, revenues, results of operations, liquidity and cash flows.
Our participation in joint venture contracts may have a negative impact on our reputation, business operations, revenues, results of operations, liquidity and cash flows. We enter into certain joint venture arrangements typically to bid and execute particular projects. Generally, these agreements are directly with a third-party client; however, services may be performed by the joint venture, the joint venture partners or a combination thereof. Engaging in joint venture contracts exposes us to risks and uncertainties, some of which are outside our control.
We are reliant on joint venture partners to satisfy their contractual obligations, including obligations to commit working capital and equity, and to perform the work as outlined in the agreement. Failure to do so could result in us providing additional investments or services to address such performance issues. If we are unable to satisfactorily resolve any partner performance issues, the customer could terminate the contract, exposing us to legal liability which could negatively impact our reputation, business operations, revenues, results of operations, liquidity and cash flows.
A material portion of our business depends on our ability to provide surety bonds.
We may be unable to compete for or work on certain projects if we are not able to obtain the necessary surety bonds. Our construction contracts frequently require that we obtain from surety companies, and provide to our customers, payment and performance bonds as a condition to the award of such contracts to secure our payment and performance obligations. Under standard terms in the surety market, surety companies issue bonds on a project-by-project basis and can decline to issue bonds at any time or require the posting of collateral as a condition to issuing any bonds. Current or future market conditions, as well as changes in the sureties’ assessment of our or their own operating and financial risk, may cause the surety companies to decline to issue, or substantially reduce the amount of, bonds for our work or to increase our bonding costs. An interruption or reduction in the availability of bonding could negatively affect our results of operations.
Our backlog may not accurately represent future revenue.
Backlog is a common measurement in the construction services industry. Our determination of backlog can include projects that have a written award, a letter of intent, a notice to proceed, an agreed upon work order to perform work on mutually accepted terms, and conditions and change orders or claims to the extent management believes additional contract revenues will be earned and are deemed probable of collection. Contracts are subject to delays, defaults or cancellations; changes in scope of services to be provided; and adjustments to costs. Backlog may also be affected by project delays or cancellations resulting from weather conditions, external market factors and economic factors beyond our control, among other things. Accordingly, there is no assurance that backlog will be realized. The timing of contract awards, including contracts awarded underneath Master Service Agreements (“MSAs”), duration of large new contracts and the mix of services can significantly affect backlog. Backlog at any given point in time may not accurately represent the revenue or net income that is realized in any period, and backlog as of the end of the quarter or year may not be indicative of the revenue and net income expected to be earned in the following year. Backlog should not be relied upon as a standalone indicator of future results.
We may fail to adequately recover on contract change orders or claims which could negatively affect our business.
From time to time, we may pursue claims against customers to recover costs incurred on a project in excess of the original contract amount. These additional costs may be incurred in connection with project delays including other trades, or changes in project scope or specifications. While we generally negotiate with the customer for additional compensation, we may be unable to obtain, through negotiation, arbitration, litigation or otherwise, adequate compensation for the additional work performed or expenses incurred. These claims can be the subject of lengthy and costly proceedings, making it often difficult to accurately predict when these claims will be fully resolved. When these types of events occur and unresolved claims are pending, we may invest significant working capital pending the resolution of the relevant claims. When appropriate, we establish provisions against possible exposures and adjust these provisions from time to time, but assumptions and estimates related to these exposures might prove to be inadequate or inaccurate. Failure to recover, or to recover in a timely manner, on these claims could have a material adverse effect on our liquidity and financial results.
Our business may be exposed to warranty claims.
We may provide warranties guaranteeing the work performed against defects in workmanship and material. If warranty claims occur, they may require us to re-perform the services or to repair or replace the warranted item at a cost to us and could also result in other damages if we are not able to adequately satisfy warranty obligations. In addition, we may be required under contractual arrangements with customers to warrant any defects from subcontractors or failures in materials we purchased from third parties. While we generally require suppliers to provide warranties that are consistent with those we provide to customers, if any of the suppliers default on their warranty obligations to us, we may nonetheless incur costs to repair or replace the defective materials. Costs incurred as a result of warranty claims could adversely affect our results of operations, financial condition and cash flows.
We are exposed to risk of loss resulting from the nonpayment and/or nonperformance by our customers and counterparties.
Our clients include public and private entities that have been, and may continue to be, negatively impacted by the changing landscape in the global economy. A recessionary construction economy can increase the likelihood that we will not be able to collect on all accounts receivable or may experience a delay in payment from some customers. If our customers or counterparties experience financial difficulties, which has occurred and may recur, we could experience difficulty in collecting receivables.
We face collection risk as a normal part of business where we perform services and subsequently bill clients for such services. In the event that we have concentrated credit risk from clients in a specific geographic area or industry, continuing negative trends or a worsening in financial conditions in that specific geographic area or industry could make us susceptible to
disproportionately high levels of default. Nonpayment and/or nonperformance by our customers and counterparties could have a negative impact on our results of operations and cash flows.
We may pursue acquisitions and other strategic transactions that could have a negative effect on our results of operations.
As part of our growth strategy, we may pursue acquisitions or joint ventures to expand, complement, or diversify our business. However, acquisitions carry inherent risks and challenges that could negatively impact our business, financial condition, results of operations, or cash flows. Future acquisition opportunities that align with our strategic objectives may be limited, and we may face significant competition from other potential acquirers, some of whom may have greater financial resources or offer more favorable terms. This competition could limit our ability to grow through acquisitions or increase acquisition costs, potentially reducing any anticipated financial benefits.
Acquisitions may expose us to operational challenges and risks, including, among others:
•the diversion of management’s attention from the day-to-day operations of the company;
•the complexities and difficulties associated with managing our business as it grows;
•managing a significantly larger company than before completion of an acquisition;
•the assimilation of new employees and the integration of business cultures;
•training and facilitating our internal control processes within the acquired organization;
•difficulties incorporating the operations and personnel, or inability to retain key personnel, of an acquired business;
•additional financial reporting and accounting challenges associated with an acquired business;
•challenges in combining service offerings and sales and marketing activities; and
•the assumption of unknown liabilities of the acquired business for which there are inadequate reserves and the potential impairment of acquired intangible assets.
Failure to effectively manage the integration process could adversely impact our business, financial condition, results of operations, and cash flows.
Supply chain disruptions may adversely affect our operations.
At times or in certain markets, we rely on third-party vendors and manufacturers to supply or transport many of the materials necessary for our operations. Disruptions, shortages or delays in the transportation of materials, price increases from suppliers or manufacturers, or inability to source needed materials have occurred and may continue to occur, which could adversely affect our results of operations, financial condition, cash flows and harm customer relationships. Any material disruption at our facilities or those of our customers or suppliers or otherwise within our supply chain, whether as a result of downtime, pandemic-related shutdowns, work stoppages or facility damage could prevent us from meeting customer demands or expected timelines, require us to incur unplanned capital expenditures, or cause other material disruptions to our operations, any of which could have a material adverse effect on our operations, financial position and cash flows. Further, supply chain disruptions can occur from events out of our control such as fires, floods, severe weather including wildfires and hurricanes, natural disasters, environmental incidents or other catastrophes.
Volatility in the prices or availability of certain materials and equipment used in our business and those of our customers, including as a result of inflation, geopolitical instability, and protectionist trade measures, could adversely affect our business, financial position, results of operations, and cash flows.
We are exposed to market risk of increases in certain commodity prices of materials, which are used as components of supplies or materials in our operations. We are also exposed to increases in energy prices. While we believe we can increase our prices to adjust for some price increases in commodities, there can be no assurance that price increases of commodities, if they were to occur, would be recoverable.
Further, the timing of our price increases may lag behind the timing of the underlying increases in commodity or material prices. Even if we are able to raise the prices of our products, consumers might react negatively to such price increases, which could have a material adverse effect on, among other things, our brands, reputation, and sales. If our competitors substantially lower their prices, we may lose customers and mark down prices. Our profitability may be impacted by lower prices, which may negatively impact gross profit and gross profit margin.
Additionally, our fixed-price contracts generally do not allow us to adjust our prices and, as a result, increases in material or fuel costs could reduce our profitability with respect to projects in progress. For example, in recent years, we experienced supply chain delays, including long lead times for certain materials and equipment, as well as an escalation in material and fuel prices, to varying degrees. These disruptions resulted in declines in gross profit and gross profit margin for certain of our operations. Fluctuations in the price of energy and commodity materials, whether resulting from fluctuations in market supply or demand, geopolitical conditions, including supply chain disruptions and sanctions on Russian exports as a result of Russia’s invasion of Ukraine and recent shipping lane disruptions, an increase in trade protection measures such as tariffs, or the disruption, modification, or cancellation of multilateral trade agreements, may adversely affect our customers and as a result cause them to curtail the use of our services.
On the other hand, because certain of our service offerings are designed to improve energy efficiency in our clients’ operations, or to assist in the generation of new sources of renewable energy, such as wind, solar, and geothermal generation, decreases in the costs of traditional energy sources such as oil and natural gas, including as a result of recessionary pressure and reduced demand, may lower our customers’ demand for efficiency improvements and alternative energy sources.
Furthermore, our workforce and equipment are highly mobile and service large geographic areas. Movement of our workforce and equipment within our market area could be negatively impacted by rising fuel costs, third-party freight rate increases and shortages of third-party truck drivers, among other things. We seek to mitigate some or all cost increases through including labor rate changes in project bids, securing material and subcontractor pricing in the project bids and maintaining positive relationships with numerous suppliers, but we may not be successful in our efforts to do so. All of these impacts could have an adverse effect on our business, financial position, results of operations, and cash flows.
Our operations could be adversely impacted by severe weather events as a result of climate change or otherwise.
Severe weather events, such as tornadoes, wildfires, hurricanes, rain, drought, ice and snowstorms, and high and low temperature extremes, occur in regions in which we operate and maintain infrastructure. Climate change could change the frequency and severity of these weather events, which may create physical and financial risks to us. Such risks could have an adverse effect on our financial condition, results of operations and cash flows. Increases in severe weather conditions or extreme temperatures may cause infrastructure construction projects to be delayed or canceled and limit resources available for such projects resulting in decreased revenue or increased project costs. In addition, drought conditions could restrict the availability of water supplies or limit the ability to obtain water use permits, inhibiting the ability to conduct operations.
Climate change may impact a region’s economic health, which could impact our revenues. Our financial performance is tied to the health of the regional economies served. We provide construction services and related specialty contracting services for some states and communities that are economically affected by the agriculture industry. Increases in severe weather events or significant changes in temperature and precipitation patterns could adversely affect the economies of the states and communities affected.
The insurance industry may be adversely affected by severe weather events that may impact availability of insurance coverage, insurance premiums and insurance policy terms.
The price of energy also has an impact on the economic health of communities. The cost of additional regulatory requirements to combat climate change, such as regulation of carbon dioxide emissions under the federal Clean Air Act, requirements to replace fossil fuels with renewable energy or credits, or other environmental regulation or taxes could impact the availability of goods and the prices charged by suppliers, which would normally be borne by consumers through higher prices for energy and purchased goods, and could adversely impact economic conditions of areas served by us. To the extent financial markets view climate change and emissions of greenhouse gas as a financial risk, this could negatively affect our ability to access capital markets or result in less competitive terms and conditions.
Technology disruptions or cyberattacks could adversely impact our operations.
We use technology in substantially all aspects of our business operations and require uninterrupted operation of information technology and operation technology systems, including disaster recovery and backup systems and network infrastructure. While we have policies, procedures and processes in place designed to strengthen and protect these systems, they may be vulnerable to physical and cybersecurity failures or unauthorized access due to, among other things: hacking; human error; theft; sabotage; malicious software; ransomware; third-party compromise; acts of terrorism; acts of war; or acts of nature.
Although there are manual processes in place, should a compromise or system failure occur, interdependencies to technology may disrupt our ability to fulfill critical business functions. This may include interruption of facilities for delivery of construction services or other products and services, any of which could adversely affect our reputation, business, cash flows
and results of operations or subject us to legal costs. Our accounting systems and our ability to collect information and invoice customers for products and services could be disrupted. If our operations are disrupted, it could result in decreased revenues and remediation costs that could adversely affect our results of operations and cash flows.
Through the ordinary course of business, we require access to sensitive customer, supplier, employee and our proprietary business data. While we have implemented extensive security measures, including limiting the amount of sensitive information retained, a breach of our systems could compromise sensitive data and could go unnoticed for some time. Such an event could result in negative publicity and reputational harm, remediation costs, legal claims and fines that could have an adverse effect on our financial results. Third-party service providers that perform critical business functions for us or have access to sensitive information within our systems also may be vulnerable to security breaches and information technology risks that could adversely affect us.
Cyberattacks continue to increase in frequency and sophistication, which could cause our information systems to be a target of ongoing and sophisticated cyberattacks by a variety of sources with the apparent aim to breach our cyber-defenses. Such incidents could have a material adverse effect on our business, financial condition or results of operations. We are continuously re-evaluating the need to upgrade and/or replace systems and network infrastructure. These upgrades and/or replacements could adversely impact operations by imposing substantial capital expenditures, creating delays or outages, or experiencing difficulties transitioning to new systems. System disruptions, if not anticipated and appropriately mitigated, could adversely affect us.
The SEC has adopted rules that require us to provide greater disclosures around cybersecurity risk management, strategy, and governance, as well as disclose the occurrence of material cybersecurity incidents. These rules may also require us to report a cybersecurity incident before we have been able to fully assess its impact or remediate the underlying issue. Efforts to comply with such reporting requirements could divert management’s attention from our incident response and could potentially reveal system vulnerabilities to threat actors. Failure to report incidents in a timely manner under these or other similar rules could also result in monetary fines, sanctions, or subject us to other forms of liability. This regulatory environment is increasingly challenging and may present material obligations and risks to our business, including significantly expanded compliance burdens, costs and enforcement risks.
Artificial intelligence presents risks and challenges that can impact our business by posing security risks to our confidential information, proprietary information and personal data. Failure to appropriately manage these risks could damage our reputation, result in the loss of valuable property and information, and adversely impact our business.
Issues in the development and use of artificial intelligence (“AI”), combined with an uncertain regulatory environment, may result in reputational harm, liability or other adverse consequences to our business operations. We may adopt and integrate generative AI tools into our systems for specific use cases reviewed by legal and information security. Our vendors may incorporate generative AI tools into their offerings without disclosing this to us, and the providers of these generative AI tools may not meet existing or rapidly evolving regulatory or industry standards with respect to privacy and data protection and may inhibit our or our vendors’ ability to maintain an adequate level of service and experience.
If we, our vendors, or our third-party partners experience an actual or perceived breach of privacy or a security incident because of the use of generative AI, we may lose valuable intellectual property and confidential information and our reputation and the public perception of the effectiveness of our security measures could be harmed. Further, bad actors around the world use increasingly sophisticated methods, including the use of AI, to engage in illegal activities involving the theft and misuse of personal information, confidential information and intellectual property. Any of these outcomes could damage our reputation, result in the loss of valuable property and information, and adversely impact our business.
Pandemics, including COVID-19, may have a negative impact on our business operations, revenues, results of operations, liquidity and cash flows.
Pandemics have disrupted national, state and local economies. To the extent a pandemic adversely impacts our business, operations, revenues, liquidity or cash flows, it could also have a heightened effect on other risks described in this section. The degree to which a pandemic will impact us depends on future developments, including but not limited to: the possible resurgence of COVID-19 and its variants, federal and state mandates, actions taken by governmental authorities, and the pace and extent to which the economy recovers and remains under relatively normal operating conditions.
Other factors associated with a pandemic that could impact our business and future operating results, revenues and liquidity include impacts related to the health, safety and availability of employees and contractors, extended rise in unemployment, public and private-sector budget changes and constraints, counterparty credit, costs and availability of supplies, capital construction and infrastructure operation and maintenance programs, financing plans, multiemployer pension valuations, travel
restrictions and legal matters. The economic and market disruptions resulting from a pandemic could also lead to greater than normal uncertainty with respect to the realization of estimated amounts, including estimates for backlog, revenue recognition, intangible assets, other investments and provisions for credit losses.
We may incur liabilities or suffer negative financial or reputational impacts relating to health and safety matters.
Our operations are inherently hazardous and subject to extensive laws and regulations relating to the maintenance of safe conditions in the workplace. Our business is subject to numerous safety risks, including electrocutions, fires, explosions, mechanical failures, weather-related incidents, transportation accidents and damage to equipment. While we have invested, and will continue to invest, substantial resources in occupational health and safety programs, the construction services industry involves a high degree of operational risk, and there can be no assurance that we will avoid significant liability exposure. We have suffered serious accidents, including fatalities, and anticipate that operations may result in additional serious accidents in the future. As a result of these potential safety and health risks, we could be subject to substantial penalties, revocation of operating licenses, criminal prosecution or civil litigation, including claims for bodily injury or loss of life, which could materially and adversely affect our financial condition, results of operations or cash flows, as our insurance does not cover all types or amounts of liabilities. In addition, if our safety record were to substantially deteriorate or suffer substantial penalties or criminal prosecution for violation of health and safety regulations, customers could cancel contracts and elect to procure future services from other providers. Unsafe work sites also have the potential to increase employee turnover, increase the costs of projects for clients, and raise operating costs. Any of the foregoing could result in financial losses or reputational harm, which could have a material adverse impact on our business, financial condition, results of operations and cash flows.
Our insurance has limits and exclusions that may not fully indemnify us against certain claims or losses, including claims resulting from wildfires or other natural disasters and an increase in cost, or the unavailability or cancellation of third-party insurance coverages would increase our overall risk exposure and subject us to increased liabilities that could negatively affect our business, financial condition, results of operations and cash flows.
We maintain insurance coverages from third-party insurers as part of our overall risk management strategy and most of our customer contracts require us to maintain specific insurance coverage limits. We maintain insurance policies with respect to workers’ compensation, auto liability, general liability, excess liability, contractors pollution liability, legal liability, professional liability, directors and officers liability, employment practices liability, cyber insurance, terrorism insurance, property insurance and other types of coverages. These policies are subject to deductibles, with certain policies subject to self-insured limits through our captive insurance arrangement.
Prior to the Separation we historically benefited from coverages under certain corporate level insurance policies held by MDU Resources, including MDU Resources captive insurance program. Insurance losses are accrued based upon our estimates of the ultimate liability for claims reported and an estimate of claims incurred but not yet reported. Insurance liabilities are difficult to assess and estimate due to unknown factors, including the frequency and severity of injuries, the magnitude of damage to or loss of property or the environment, the determination of our liability in proportion to other parties, estimates of incidents not reported and the effectiveness of our safety programs, and as a result, our actual losses may exceed our estimates. There can be no assurance that our current or past insurance coverages will be sufficient or effective under all circumstances or against all claims and liabilities to which we may be subject.
We generally renew our insurance policies on an annual basis; therefore, deductibles and levels of insurance coverages may change in future periods. There can be no assurance that any of our existing insurance coverages will be renewed upon the expiration of the coverage period or that future coverage will be available at reasonable and competitive rates or at the required limits. The cost of our insurance has significantly increased over time, which was experienced during our most recent renewal process following the Separation and may continue to increase in the future. In addition, insurers may fail, cancel our coverage, increase the cost of coverage, determine to exclude certain items from coverage, or otherwise be unable to provide us with adequate insurance coverage.
We may not be able to obtain certain types of insurance or incremental levels of insurance in scope or amounts sufficient to cover liabilities we may incur. For example, due to the increase in wildfire losses and related insurance claims, insurers have reduced coverage availability and increased the cost of insurance coverage for such events in recent years, and our current levels of coverage may not be sufficient to cover potential losses. If our risk exposure increases as a result of adverse changes in our insurance coverage, we could be subject to increased liabilities that could negatively affect our business, financial condition, results of operations and cash flows.
In addition, we perform work in hazardous environments and our employees are exposed to a number of hazards. In locations or environments where claims have become more frequent or severe in recent years, insurance may become difficult
or impossible to obtain. Our contracts may require us to indemnify our customers, project owners and other parties for injury, damage or loss arising out of our presence at its customers’ location, or in the performance of our work, in both cases regardless of fault, and provide for warranties for materials and workmanship.
We may also be required to name the customer and others as an additional insured party under our insurance policies. We maintain limited insurance coverage against these and other risks associated with our business. This insurance may not protect us against liability for certain events, and we cannot guarantee that our insurance will be adequate in risk coverage or policy limits to cover all losses or liabilities that we may incur. Any future damages caused by our services that are not covered by insurance or are in excess of policy limits could negatively affect our business, financial condition, results of operations and cash flows.
Economic and Industry Risks
Economic volatility affects our operations, as well as the demand for our products and services.
Unfavorable economic conditions can negatively affect the level of public and private expenditures on projects and the timing of these projects which, in turn, can negatively affect demand for our products and services. The level of demand for construction services and related specialty contracting services could be adversely impacted by the economic conditions in the industries and market areas we serve, as well as in the general economy. Local, state and federal budget limitations affect the funding available for infrastructure spending, which could have an adverse impact on our financial condition, results of operations and cash flows.
We may be required to obtain additional financing in order to fund certain strategic acquisitions, if they arise, or to refinance outstanding debt. It is possible a large strategic acquisition would require us to issue new equity and debt securities in order to maintain our credit rating and could result in a ratings downgrade notwithstanding our issuance of equity securities to fund the transaction. We are also exposed to risks from tightening credit markets, through the interest payable on any variable-rate debt, including the interest cost on future borrowings under our credit facilities. While we believe we will continue to have adequate credit available to meet our needs, there can be no assurance of that.
We are subject to capital market and interest rate risks.
The credit environment could impact our ability to borrow money in the future. Additional financing or refinancing may not be available and, if available, may not be at economically favorable terms. Further, an increase in our leverage could lead to deterioration in our credit ratings. A reduction in our credit ratings, regardless of the cause, also could limit our ability to obtain additional financing and/or increase the cost of obtaining financing. There is no guarantee we will be able to access the capital markets at financially economical interest rates, and with higher interest rates on borrowings, our business, financial condition, results of operations and cash flows could be negatively affected.
Our operations require capital investment to purchase and maintain the property and equipment required to provide our services. In addition, our operations include a significant level of fixed and semi-fixed costs. Consequently, we rely on financing sources and capital markets as sources of liquidity for capital requirements not satisfied by cash flows from operations. If we are not able to access capital at competitive rates, our ability to implement business plans, make capital expenditures or pursue acquisitions to produce future growth may be adversely affected. Market disruptions may increase the cost of borrowing or adversely affect our ability to access one or more financial markets. Such market disruptions could include:
•a significant economic downturn;
•the financial distress of unrelated industry leaders in the same line of business;
•deterioration in capital market conditions;
•turmoil in the financial services industry;
•volatility in commodity prices;
•pandemics, including COVID-19;
•terrorist attacks;
•war; and
•cyberattacks.
In addition, the issuance of a substantial amount of our common stock, whether issued in connection with an acquisition or otherwise, or the perception that such an issuance could occur, could have a dilutive effect on stockholders and/or may adversely affect the market price of our common stock.
Financial and Accounting Risks
Our financial results and projections are based upon estimates and assumptions that may cause our actual results to materially differ from such projections, which may adversely affect our future results of operations, cash flows and stock price.
The preparation of consolidated financial statements in conformity with generally accepted accounting principles in the United States (“GAAP”) requires us to make estimates and assumptions that affect the reported amounts of assets and liabilities, and disclosure of contingent assets and liabilities, at the date of the consolidated financial statements, as well as the reported amounts of revenues and expenses during the reporting period. The most significant estimates we use are for items such as long-lived assets and goodwill; property depreciable lives; tax provisions; revenue recognized using the cost-to-cost measure of progress for contracts; expected credit losses; loss contingencies; costs on construction contracts; unbilled revenues; actuarially determined benefit costs; lease classification; present value of right-of-use assets and lease liabilities; fair values of acquired assets and liabilities under the acquisition method of accounting; and the valuation of stock-based compensation. As additional information becomes available, or actual amounts are determinable, the recorded estimates are revised.
Critical accounting estimates are defined as estimates that require us to make assumptions about matters that are uncertain at the time the estimates were made, and changes in the estimates could have a material impact on our financial position or results of operations. Our critical accounting estimates are subject to judgments and uncertainties that affect the application of the significant accounting policies. As additional information becomes available, or actual amounts are determinable, the recorded estimates are revised. Consequently, our financial position or results of operations may be materially different when reported under varying conditions or when using different assumptions in the application of the following critical accounting estimates. For more information, refer to Note 2 – Basis of Presentation and Summary of Significant Accounting Policies in the audited consolidated financial statements and Critical Accounting Estimates included in Item 7. Management’s Discussion and Analysis of Financial Condition and Results of Operations contained elsewhere in this Annual Report.
In addition, our financial projections, including any guidance, long-term targets or outlook we may provide from time to time, are dependent on certain estimates and assumptions related to, among other things, our strategy, our long-term financial targets; end-market and sub-market growth; market share projections; revenue; product pricing; volume and product mix; market and economic volatility; tax rates; interest rates; commodity prices; dis-synergies; cost savings including synergies; accruals for estimated liabilities, including litigation reserves; measurement of benefit obligations for benefit plans; and our ability to generate sufficient cash flow to reinvest in our existing business, fund internal growth, make acquisitions, invest in joint ventures and meet debt obligations. In addition, our ability to achieve our projections is subject to various assumptions and uncertainties. There is no assurance that we will achieve such results in the time frames we project or at all. Our financial projections are based on historical experience and on various other estimates and assumptions that we believe to be reasonable under the circumstances and at the time they are made, and our actual results may differ materially from our financial projections. Any material variation between our financial projections and our actual results may adversely affect our profitability, cash flows and stock price.
We recognize revenue for the majority of construction projects based on estimates; therefore, variations of actual results from assumptions may reduce profitability.
As discussed in further detail in Note 2 – Basis of Presentation and Summary of Significant Accounting Policies in the audited consolidated financial statements and Critical Accounting Estimates included in Item 7. Management’s Discussion and Analysis of Financial Condition and Results of Operations contained elsewhere in this Annual Report, contract revenue is recognized over time using the input method, based on progress measured by costs incurred relative to total estimated costs for a performance obligation. Revenues are recorded proportionate to the costs incurred, reflecting progress toward the transfer of goods or services to the customer. Consequently, changes in estimates, or variations of actual results from previous projections, on an unusually large project, or on a number of average size projects, could be material and could have an adverse impact on our financial condition, results of operations, and cash flows.
Reductions in our credit ratings could increase financing costs.
There is no assurance our credit ratings will remain in effect or that a rating will not be lowered or withdrawn by a rating agency. Events affecting our financial results may impact our cash flows and credit metrics, potentially resulting in a change in
our credit ratings. Our credit ratings may also change as a result of the differing methodologies or changes in the methodologies used by the rating agencies.
In connection with the Separation from MDU Resources, we incurred debt obligations that could adversely affect our business, our profitability and our ability to meet obligations.
In connection with the Separation, we entered into a five-year senior secured credit agreement, which provides for long-term debt in an aggregate principal amount of up to $525 million. Such indebtedness consists of a $300 million term loan and a $225 million revolving credit facility. This amount of debt could potentially have important consequences to us and our debt and equity investors, including:
•requiring a substantial portion of our cash flow from operations to make interest payments on this debt;
•making it more difficult to satisfy debt service and other obligations;
•increasing the risk of a future credit ratings downgrade of our debt, which could increase future debt costs and limit the future availability of debt financing;
•increasing our vulnerability to general adverse economic and industry conditions;
•reducing the cash flow available to fund capital expenditures and other corporate purposes to grow our business;
•limiting our flexibility in planning for, or reacting to, changes in our business and the industry;
•placing us at a competitive disadvantage relative to our competitors that may not be as highly leveraged with debt; and
•limiting our ability to borrow additional funds as needed or take advantage of business opportunities as they arise, pay cash dividends or repurchase common shares.
To the extent that we incur additional indebtedness, the foregoing risks could increase. In addition, our actual cash requirements in the future may be greater than expected. Our cash flow from operations may not be sufficient to repay all of the outstanding debt as it becomes due, and we may not be able to borrow money, sell assets or otherwise raise funds on acceptable terms, or at all, to refinance our debt.
Our results of operations could be adversely affected as a result of goodwill and identifiable intangible asset impairments.
When we acquire a business, goodwill is recorded for the excess amount paid for the business over the net fair value of the tangible and identifiable intangible assets of the business acquired. As of December 31, 2024, the balance sheet included goodwill of $143.2 million and other intangible assets of $116 thousand. Fair value is determined using a combination of the discounted cash flow, market multiple and market capitalization valuation approaches. Under current accounting rules, goodwill and other identifiable intangible assets that have indefinite useful lives cannot be amortized, but instead must be tested at least annually for impairment, while identifiable intangible assets that have finite useful lives are amortized over their useful lives. Significant judgment is required in completing these tests. There can be no assurance that our estimates and assumptions will prove to be accurate predictions of the future. For further discussion of our impairment testing, refer to Note 2 – Basis of Presentation and Summary of Significant Accounting Policies and Note 5 – Goodwill and Other Intangible Assets in the audited consolidated financial statements and Critical Accounting Estimates included in Item 7. Management’s Discussion and Analysis of Financial Condition and Results of Operations, contained elsewhere in this Annual Report.
Legal and Regulatory Risks
We may be negatively impacted by pending and/or future litigation, claims or investigations.
We are, and may become party to, among other things, personal injury, commercial, contract, warranty, antitrust, tax, property entitlements, product liability, health and safety, and employment claims. The outcome of pending or future lawsuits, claims, investigations or proceedings is often difficult to predict and could be adverse and material in amount.
In addition to the monetary cost, litigation can divert management’s attention from our core business opportunities. Development of new information in these matters can often lead to changes in management’s estimated liabilities associated with these proceedings including the judge’s rulings or judgements, jury verdicts, settlements or changes in applicable law. The outcome of such matters is often difficult to predict and unfavorable outcomes could have a material impact on our financial condition, results of operations and cash flows.
Changes in tax law may negatively affect our business.
Changes to federal, state and local tax laws have the ability to benefit or adversely affect our earnings and customer costs. Significant changes to federal and state corporate tax rates could result in the impairment of deferred tax assets that are established based on existing law at the time of deferral. A number of factors may increase our future effective income tax rate, including:
•governmental authorities increasing taxes or eliminating deductions;
•the jurisdictions in which earnings are taxed;
•the resolution of issues arising from tax audits with various tax authorities;
•changes in the valuation of our deferred tax assets and liabilities;
•adjustments to estimated taxes upon finalization of various tax returns;
•changes in available tax credits;
•changes in stock-based compensation;
•other changes in tax laws; and
•the interpretation of tax laws and/or administrative practices.
Our operations could be negatively impacted by import tariffs and/or other government mandates.
We operate in or provide services to capital intensive industries in which federal trade policies could significantly impact the availability and cost of materials. Imposed and proposed tariffs could significantly increase the prices and delivery lead times on raw materials and finished products that are critical to us and our customers, such as copper, aluminum, steel, electrical components and certain plastics. Prolonged lead times on the delivery of raw materials and further tariff increases on raw materials and finished products could adversely affect our business, financial condition and results of operations.
At this time, it remains unclear what additional actions, if any, will be taken by the U.S. or other governments with respect to international trade agreements, the imposition of additional tariffs on goods imported into the U.S., tax policy related to international commerce, increased export control, sanctions and investment restrictions, or other trade matters. Other effects of these changes, including responsive or retaliatory actions from governments and the opportunity for competitors not subject to such changes to establish a presence in markets where we participate, could also have significant impacts on our results of operations. Furthermore, we may not be able to increase prices for our products enough to offset the impact of tariffs or other trade restrictions, which could negatively impact our gross profit and gross profit margin.
While we cannot predict what further action may be taken with respect to export restrictions, tariffs or trade relations between the U.S. and other governments as stated above, any further changes in U.S. or international trade policy could have an adverse impact on our business, financial condition and results of operations.
Our business is based in part on government-funded infrastructure projects and building activities, and any associated regulatory changes or requirements in these areas could have an adverse affect on us.
Certain of our customers operate in regulated industries and depend on government spending for infrastructure and other similar building activities. As a result, demand for some of our services is influenced by local, state and federal government fiscal policies, tax incentives and other subsidies, and other general macroeconomic and political factors. Projects in which we participate may be funded directly by governments or privately funded, but are otherwise tied to or impacted by government policies and spending measures.
Government spending is often approved only on a short-term basis and some of the projects in which our services are used require longer-term funding commitments. If government funding is not approved or funding is lowered as a result of poor economic conditions, lower than expected revenues, competing spending priorities, or other factors, it could limit infrastructure projects available, increase competition for projects, result in excess inventory, and decrease sales, all of which could adversely affect the profitability of our business.
Certain regions or states may require or possess the means to finance only a limited number of large infrastructure projects and periods of high demand may be followed by years of little to no activity. There can be no assurances that governments will sustain or increase current infrastructure spending and tax incentive and other subsidy levels, and any reductions thereto or delays therein could affect our business, financial condition, results of operations and cash flows.
If we fail to comply with requirements imposed by applicable law or other governmental regulations, we could become subject to lawsuits, investigations and other liabilities and restrictions on our operations that could significantly and adversely affect our business, financial condition and results of operations.
We are subject to governmental regulation at the federal, state and local levels in many areas of our business, such as employment laws, wage and hour laws, discrimination laws, immigration laws, human health and safety laws, environmental laws, false claims or whistleblower statutes, tax codes, antitrust and competition laws, customer protection statutes, procurement regulations, intellectual property laws, supply chain laws, lobbying laws, and data privacy and security laws.
From time to time, government agencies have conducted reviews and audits of certain of our practices as part of routine inquiries of providers of services under government contracts, or otherwise. Like others in our business, we also receive requests for information from government agencies in connection with these reviews and audits.
While we attempt to comply with all applicable laws and regulations, there can be no assurance that we are in full compliance with all applicable laws and regulations or interpretations of these laws and regulations at all times or that we will be able to comply with any future laws, regulations or interpretations of these laws and regulations.
Government agencies may make changes in the regulatory frameworks within which we operate that may require us to incur substantial increases in costs in order to comply with such laws and regulations. If we fail to comply with applicable laws and regulations, including those referred to above, we may be subject to investigations, criminal sanctions or civil remedies, including fines, penalties, damages, reimbursements, injunctions, seizures, disgorgements or debarments from government contracts. The cost of compliance or the consequences of non-compliance could adversely affect our business, financial condition and results of operations and cause reputational harm.
Our operations are subject to environmental laws and regulations that may increase costs of operations, impact or limit business plans, or expose us to environmental liabilities.
We are subject to some environmental laws and regulations affecting certain aspects of our operations, including the use of petroleum storage tanks. These laws and regulations generally require us to obtain and comply with a variety of environmental licenses, permits, inspections and other approvals. Although we strive to comply with all applicable environmental laws and regulations, public and private entities and private individuals may interpret our legal or regulatory requirements differently and seek injunctive relief or other remedies against us. We cannot predict the outcome, financial or operational, of any such litigation or administrative proceedings.
Existing environmental laws and regulations may be revised and new laws and regulations seeking to protect the environment may be adopted or become applicable to us. These laws and regulations could require us to limit the use or output of certain facilities, restrict the use of certain fuels, prohibit or restrict new or existing services, replace certain fuels with renewable fuels, retire and replace certain facilities, install pollution controls, remediate environmental impacts, remove or reduce environmental hazards, or forego or limit the development of resources. Revised or new laws and regulations that increase compliance and disclosure costs and/or restrict operations could adversely affect our results of operations and cash flows.
Human Capital and Labor Risks
Our operations may be negatively affected if we are unable to obtain, develop and retain key personnel and skilled labor forces.
We must attract, develop and retain executive officers and other professional, technical and labor forces with the skills and experience necessary to successfully manage, operate and grow. Competition for these employees is high, due in part to changing workforce demographics, a lack of younger employees who are qualified to replace employees as they retire, and remote work opportunities, among other things. In some cases, competition for these employees is on a regional or national basis. At times of low unemployment, it can be difficult to attract and retain qualified and affordable personnel. A shortage in the supply of skilled personnel creates competitive hiring markets, increased labor expenses, decreased productivity and potentially lost business opportunities to support our operating and growth strategies.
In addition, changes to the United States immigration policies or restrictions on immigration could limit the company's ability to hire qualified and affordable personnel. We are also subject to risks associated with labor disputes or prolonged negotiation processes, which could disrupt operations and increase costs. Additionally, if we are unable to hire employees with the requisite skills, we may be forced to incur significant training expenses. As a result, our ability to maintain productivity,
relationships with customers, competitive costs, and quality services is limited by our ability to employ, retain and train the necessary skilled personnel and could negatively affect our results of operations, financial position and cash flows.
Our unionized workforce may adversely affect operations.
As of December 31, 2024, approximately 83% of our employees were covered by collective bargaining agreements. Although the majority of these agreements prohibit strikes and work stoppages, we cannot be certain that strikes or work stoppages will not occur in the future. Strikes or work stoppages would adversely impact relationships with customers and could have an adverse effect on our business. The ability to complete future acquisitions could be adversely affected because of our union status for a variety of reasons. For instance, in certain geographic areas, our union agreements may be incompatible with the union agreements of a business we want to acquire, and some businesses may not want to become affiliated with a union company.
Costs related to obligations under multiemployer pension plans could have a material negative effect on our results of operations and cash flows.
We participate in multiemployer pension plans (“MEPPs”) for employees represented by certain unions. We are required to make contributions to these plans in amounts established under numerous collective bargaining agreements between the operating subsidiaries and those unions.
We may be obligated to increase our contributions to underfunded plans that are classified as being in endangered, seriously endangered or critical status as defined by the Pension Protection Act of 2006. Plans classified as being in one of these statuses are required to adopt Rehabilitation Plans or Funding Improvement Plans to improve their funded status through increased contributions, reduced benefits or a combination of the two.
We may also be required to increase our contributions to MEPPs if the other participating employers in such plans withdraw from the plans and are not able to contribute amounts sufficient to fund the unfunded liabilities associated with their participation in the plans. The amount and timing of any increase in our required contributions to MEPPs may depend upon one or more factors, including the outcome of collective bargaining, actions taken by trustees who manage the plans, actions taken by the plans’ other participating employers, the industry for which contributions are made, future determinations that additional plans reach endangered, seriously endangered or critical status, newly enacted government laws or regulations and the actual return on assets held in the plans, among others. We could experience increased operating expenses as a result of required contributions to MEPPs, which could have an adverse effect on our financial position, results of operations or cash flows.
In addition, pursuant to the Employee Retirement Income Security Act of 1974 (“ERISA”), as amended by the Multiemployer Pension Plan Amendments Act, we could incur a partial or complete withdrawal liability upon withdrawing from a plan, exiting a market in which we do business with a union workforce or upon termination of a plan. We could also incur additional withdrawal liability if our withdrawal from a plan is determined by that plan to be part of a mass withdrawal.
Increasing costs associated with health care plans and changes in employment laws or regulations may adversely affect our results of operations.
We are self-insured for the health care benefits for eligible employees, subject to certain deductible thresholds. However, health care costs continue to increase. Increasing quantities of large individual health care claims and an overall increase in total health care claims could have an adverse impact on our operating results, financial position and liquidity. Complying with any new legislation and regulation at both the federal and state level related to health care, unemployment tax rates and workers' compensation rates, among others, could adversely affect our results of operations as well change our benefit programs and costs.
Separation and Distribution Risks
We have minimal history of operating as an independent, public company and our historical financial information is not necessarily representative of the results that we would have achieved as a separate, publicly traded company and may not be a reliable indicator of our future results.
Our historical information in this Annual Report refers to our business as operated by and integrated with MDU Resources for periods prior to the Separation and as a standalone public company for periods following the Separation. Our historical financial information prior to the Separation included in this Annual Report is derived from the audited consolidated financial statements and accounting records of MDU Resources and Everus Construction. Accordingly, the historical financial information prior to the Separation included in this Annual Report does not necessarily reflect the financial condition, results of
operations and cash flows that we would have achieved as a separate, publicly traded company during those periods presented or those that we will achieve in the future, primarily as a result of the factors described below:
•Prior to the Separation, our business was operated by MDU Resources as part of its broader corporate organization, rather than as an independent company, and MDU Resources or one of its affiliates performed certain corporate functions for us. Our historical financial results prior to the Separation reflect allocations of corporate expenses from MDU Resources for such functions and are likely to be less than the expenses we would have incurred had we operated as a separate publicly traded company.
•Prior to the Separation, we shared economies of scope and scale in costs, employees and vendor relationships. Although we entered into a transition services agreement with MDU Resources prior to the Separation, these arrangements may not retain or fully capture the benefits that we enjoyed as a result of being integrated with MDU Resources and may result in us paying higher charges than in the past for these services. This could have a material adverse effect on our business, financial position, results of operations and cash flows for periods after the Separation.
•Our working capital requirements and capital for our general corporate purposes, including acquisitions and capital expenditures, had in the past been satisfied as part of the corporate wide cash management policies of MDU Resources for periods prior to the Separation. Following the Separation, our results of operations and cash flows are likely to be more volatile, and we may need to obtain additional financing from banks, through public offerings or private placements of debt or equity securities, strategic relationships or other arrangements, which may or may not be available and may be more costly.
•As part of MDU Resources prior to the Separation, our business benefited from MDU Resources’ overall size and scope to procure more advantageous arrangements. After the Separation, as a standalone company, we may be unable to obtain similar arrangements to the same extent as MDU Resources did, or on terms as favorable as those MDU Resources obtained prior to the Separation.
•The cost of capital for our business as a standalone company may be higher than MDU Resources’ cost of capital prior to the Separation. Our historical financial information prior to the Separation does not reflect the debt that we incurred in connection with the Separation.
•As a public company, we are subject to the reporting requirements of the Exchange Act, the Sarbanes-Oxley Act of 2022 (“Sarbanes-Oxley Act”) and the Dodd-Frank Wall Street Reform and Consumer Protection Act (“Dodd-Frank Act”) and are required to prepare our financial statements according to the rules and regulations required by the SEC. Complying with these requirements could result in significant costs and require us to divert substantial resources, including management’s time, from other activities. Moreover, to comply with these requirements, we will need to migrate our systems, including information technology systems, implement additional financial and management controls, reporting systems and procedures, and hire additional accounting and finance staff. We have incurred and expect to continue to incur additional annual expenses related to these steps, and those expenses may be significant. If we are unable to upgrade our financial and management controls, reporting systems, information technology and procedures in a timely and effective fashion, our ability to comply with financial reporting requirements and other rules that apply to reporting companies under the Exchange Act could be impaired.
Other significant changes may occur in our cost structure, management, financing and business operations as a result of now operating as a standalone company. For additional information about the past financial performance of our business and the basis of presentation of the historical audited consolidated financial statements, see Item 7. Management’s Discussion and Analysis of Financial Condition and Results of Operations and the historical financial statements and accompanying notes in Item 8. Financial Statements and Supplementary Data contained elsewhere in this Annual Report.
If the Distribution, together with certain related transactions, does not qualify as a transaction that is generally tax-free for U.S. federal income tax purposes, our stockholders could be subject to significant tax liabilities and, in certain circumstances, we could be required to indemnify MDU Resources for material taxes and other related amounts pursuant to indemnification obligations under the tax matters agreement.
In connection with the Distribution, MDU Resources received a private letter ruling from the Internal Revenue Service (“IRS”) and one or more opinions of its tax advisors, regarding certain U.S. federal income tax matters relating to the Separation and Distribution. The IRS private letter ruling was based upon and relied on, among other things, various facts and assumptions, as well as certain representations, statements and undertakings of MDU Resources and Everus, including those relating to the past and future conduct of MDU Resources and Everus. If any of these representations, statements or undertakings is, or becomes, inaccurate or incomplete, or if MDU Resources or Everus breach any of the representations or covenants contained in any of the separation-related agreements and documents or in any documents relating to the IRS private
letter ruling and/or the opinion(s) of tax advisors, the IRS private letter ruling and/or the opinion(s) of tax advisors may be invalid and the conclusions reached therein could be jeopardized.
Notwithstanding receipt of the IRS private letter ruling and the opinion(s) of tax advisors, the IRS could determine that the Distribution and/or certain related transactions should be treated as taxable transactions for U.S. federal income tax purposes if it determines that any of the representations, assumptions or undertakings upon which the IRS private letter ruling or the opinion(s) of tax advisors were based on are false or have been violated. In addition, neither the IRS private letter ruling, nor the opinion(s) of tax advisors addressed all of the issues that are relevant to determining whether the Distribution, together with certain related transactions, qualifies as a transaction that is generally tax-free for U.S. federal income tax purposes. Further, the opinion(s) of tax advisors represent the judgment of such tax advisors and are not binding on the IRS or any court, and the IRS or a court may disagree with the conclusions in the opinion(s) of tax advisors. Accordingly, notwithstanding receipt by MDU Resources of the IRS private letter ruling and the opinion(s) of tax advisors, there can be no assurance that the IRS will not assert that the Distribution and/or certain related transactions do not qualify for tax-free treatment for U.S. federal income tax purposes or that a court would not sustain such a challenge. In the event the IRS were to prevail in such challenge, MDU Resources, Everus and MDU Resources stockholders could be subject to significant U.S. federal income tax liability.
If the Distribution, together with related transactions, fails to qualify as a transaction that is generally tax-free for U.S. federal income tax purposes under Sections 355 and 368(a)(1)(D) of the Internal Revenue Code (the “Code”), in general, for U.S. federal income tax purposes, MDU Resources would recognize a taxable gain as if it had sold Everus common stock in a taxable sale for its fair market value, and MDU Resources stockholders who received our shares in the Distribution would be subject to tax as if they had received a taxable distribution equal to the fair market value of such shares.
Under the tax matters agreement we entered into with MDU Resources pursuant to the Separation and Distribution (the “tax matters agreement”), we may be required to indemnify MDU Resources against any additional taxes and related amounts resulting from the Separation and Distribution (and any related costs and other damages) to the extent such amounts resulted from (a) an acquisition of all or a portion of our equity securities or assets, whether by merger or otherwise (and regardless of whether we participated in or otherwise facilitated the acquisition), (b) other actions or failures to act by us or (c) any inaccuracy or breach of our representations, covenants or undertakings contained in any of the Separation-related agreements and documents or in any documents relating to the IRS private letter ruling and/or the opinion(s) of tax advisors. Any such indemnity obligations could be material.
U.S. federal income tax consequences may restrict our ability to engage in certain desirable strategic or capital-raising transactions after the Separation.
Under current law, a separation can be rendered taxable to the parent corporation and its stockholders as a result of certain post-separation acquisitions of shares or assets of the spun-off corporation. For example, a separation may result in taxable gain to the parent corporation under Section 355(e) of the Code if the separation were deemed to be part of a plan (or series of related transactions) pursuant to which one or more persons acquire, directly or indirectly, shares representing a 50 percent or greater interest (by vote or value) in the spun-off corporation.
To preserve the U.S. federal income tax treatment of the Separation and Distribution, and in addition to our indemnity obligation described above, the tax matters agreement will restrict us for the two-year period following the Separation and Distribution, except in specific circumstances, from:
•entering into any transaction pursuant to which all or a portion of our common stock or assets would be acquired, whether by merger or otherwise;
•issuing equity securities beyond certain thresholds;
•repurchasing shares of our capital stock other than in certain open-market transactions;
•ceasing to actively conduct certain aspects of our business; or
•taking or failing to take any other action that would jeopardize the expected U.S. federal income tax treatment of the Distribution and certain related transactions.
These restrictions may limit our ability to pursue certain strategic transactions or other transactions that we may believe to be in the best interests of our stockholders or that might increase the value of our business.
As an independent, publicly traded company, we may not enjoy the same benefits that we did as a segment of MDU Resources.
Prior to the Separation, our business operated as one of MDU Resources’ business segments, and MDU Resources performed substantially all the corporate functions for Everus Construction’s operations, including managing financial and human resources systems, internal auditing, investor relations, treasury services, financial reporting, finance and tax administration, benefits administration, legal, and regulatory functions. After the Separation, MDU Resources has provided support to us with respect to certain of these functions on a transitional basis under the transition services agreement. We have needed to replicate certain facilities, systems, infrastructure and personnel to which we no longer have access after the Separation and will likely continue to incur capital and other costs associated with developing and implementing our own support functions in these areas.
As an independent, publicly traded company, we have become more susceptible to market fluctuations and other adverse events than we would have been were we still a part of MDU Resources. As part of MDU Resources, we enjoyed certain benefits from MDU Resources’ operating diversity and available capital for investments. As an independent, publicly traded company, we do not have similar operating diversity and do not have similar access to capital markets, which could have a material adverse effect on our financial position, results of operations and cash flows.
We may not achieve some or all of the expected benefits of the Separation, and the Separation may materially and adversely affect our financial position, results of operations and cash flows.
We may be unable to achieve the full strategic and financial benefits expected to result from the Separation, or such benefits may be delayed or not occur at all. We may not achieve these and other anticipated benefits for a variety of reasons, including, among others, that: (a) management may be required to spend significant amounts of time and effort on post-Separation activities, which may divert management’s attention from operating and growing our business; (b) we may be more susceptible to market fluctuations and other adverse events than if we were still a part of MDU Resources; (c) our business will be less diversified than MDU Resources’ business prior to the Separation; and (d) other actions required to separate us from MDU Resources that could disrupt our operations. If we fail to achieve some or all of the benefits expected to result from the Separation, or if such benefits are delayed, it could have a material adverse effect on our financial position, results of operations and cash flows.
We or MDU Resources may fail to perform under various transaction agreements that were executed as part of the Separation or we may fail to have necessary systems and services in place when certain of the transaction agreements expire.
In connection with the Separation and Distribution, we entered into a separation and distribution agreement with MDU Resources and into various other agreements, including a transition services agreement, a tax matters agreement and an employee matters agreement. The separation and distribution agreement, the tax matters agreement and the employee matters agreement determined the allocation of assets and liabilities between the companies following the Separation for those respective areas and includes any necessary indemnifications related to liabilities and obligations. The transition services agreement provides for the performance of certain services by MDU Resources for our benefit, or in some cases certain services provided by us for the benefit of MDU Resources, for a limited period of time after the Separation. We will rely on MDU Resources to satisfy its obligations under these agreements. If MDU Resources is unable to satisfy its obligations under these agreements, including its indemnification obligations, we could incur operational difficulties or losses. If we do not have agreements with other providers of these services once certain transaction agreements expire or terminate, we may not be able to operate our business effectively, which may have a material adverse effect on our financial position, results of operations and cash flows.
Our inability to resolve favorably any disputes that arise between us and MDU Resources with respect to our past and ongoing relationships may adversely affect our operating results.
Disputes may arise between us and MDU Resources in a number of areas relating to our ongoing relationships, including:
•labor, tax, employee benefits, indemnification and other matters arising from our Separation from MDU Resources;
•employee retention and recruiting;
•business combinations involving us; and
•the nature, quality and pricing of services that we have agreed with MDU Resources to provide each other.
We may not be able to resolve potential conflicts, and even if we do, the resolution may be less favorable than if we were dealing with an unaffiliated party.
The agreements we entered into with MDU Resources may be amended upon mutual agreement between the parties.
In connection with the Separation from MDU Resources, MDU Resources agreed to indemnify us for certain liabilities and we agreed to indemnify MDU Resources for certain liabilities. If we are required to pay MDU Resources under these indemnities, our financial results could be negatively impacted. The MDU Resources indemnity may not be sufficient to hold us harmless from the full amount of liabilities for which MDU Resources will be allocated responsibility, and MDU Resources may not be able to satisfy its indemnification obligations in the future.
Pursuant to the separation and distribution agreement and certain other agreements with MDU Resources, MDU Resources agreed to indemnify us for certain liabilities, and we agreed to indemnify MDU Resources for certain liabilities, in each case for uncapped amounts. Indemnities that we may be required to provide MDU Resources are not subject to any cap, may be significant and could negatively impact our business, particularly with respect to indemnities provided in the tax matters agreement. Third parties could also seek to hold us responsible for any of the liabilities that MDU Resources has agreed to retain. Any amounts we are required to pay pursuant to these indemnification obligations and other liabilities could require us to divert cash that would otherwise have been used in furtherance of our operating business. Further, the indemnity from MDU Resources may not be sufficient to protect us against the full amount of such liabilities, and MDU Resources may not be able to fully satisfy its indemnification obligations. Moreover, even if we ultimately succeed in recovering from MDU Resources any amounts for which it is held liable, we may be temporarily required to bear these losses. Each of these risks could have a material adverse effect on our financial position, results of operations and cash flows.
Certain members of management and directors hold our stock and stock in MDU Resources and may face actual or potential conflicts of interest.
Following the Separation and Distribution, certain members of our management and board of directors and of MDU Resources own stock in both MDU Resources common stock and our common stock. This ownership overlap could create, or appear to create, potential conflicts of interest when our management and directors and MDU Resources’ management and directors face decisions that could have different implications for us and MDU Resources. For example, potential conflicts of interest could arise in connection with the resolution of any dispute between MDU Resources and us regarding the terms of the agreements governing the Separation and Distribution and the relationship with MDU Resources thereafter. These agreements include the separation and distribution agreement, the tax matters agreement, the employee matters agreement and the transition services agreement and any commercial agreements between the parties or their affiliates. Potential conflicts of interest may also arise out of any commercial arrangements that we or MDU Resources may enter into in the future.
Failure to maintain effective internal control over financial reporting in accordance with Section 404 of the Sarbanes-Oxley Act could materially and adversely affect us.
As a public company, we are subject to the reporting requirements of the Exchange Act, the Sarbanes-Oxley Act and the Dodd-Frank Act and are required to prepare our financial statements according to the rules and regulations required by the SEC. Our failure to prepare and disclose this information in a timely manner or to otherwise comply with applicable law could subject us to penalties under federal securities laws, expose us to lawsuits and restrict our ability to access financing. In addition, the Sarbanes-Oxley Act requires that, among other things, we establish and maintain effective internal controls and procedures for financial reporting and disclosure purposes. Internal control over financial reporting is complex and may be revised over time to adapt to changes in our business, or changes in applicable accounting rules. We cannot guarantee that our internal control over financial reporting will be effective in the future or that a material weakness will not be discovered with respect to a prior period for which we had previously believed that internal controls were effective. If we are not able to maintain or document effective internal control over financial reporting, our independent registered public accounting firm will not be able to certify as to the effectiveness of our internal control over financial reporting.
Matters affecting our internal controls may cause us to be unable to report our financial information on a timely basis, or may cause us to restate previously issued financial information, and thereby subject us to adverse regulatory consequences, including sanctions or investigations by the SEC, or violations of applicable stock exchange listing rules. There could also be a negative reaction in the financial markets due to a loss of investor confidence in us and the reliability of our financial statements. Confidence in the reliability of our financial statements is also likely to suffer if we or our independent registered public accounting firm reports a material weakness in our internal control over financial reporting. This could have a material and adverse effect on us by, for example, leading to a decline in our share price and impairing our ability to raise additional capital.
Common Stock Risks
The trading market of our common stock has existed only for a minimal period of time following the Separation and Distribution, and our stock price and trading volume may fluctuate significantly.
A public market for our common stock has only existed for a minimal period of time following the Separation and Distribution. The trading price of our common stock has been and may continue to be volatile and the trading volume may fluctuate and cause significant price variations to occur. For many reasons, including the other risks identified in this section, the market price of our common stock may be more volatile than that of our market peers. We cannot predict the prices at which our common stock may trade.
The market price of shares of our common stock may fluctuate significantly due to a number of factors, some of which may be beyond our control, including:
•actual or anticipated fluctuations in our operating results;
•declining operating revenues derived from our core business;
•the operating and stock price performance of comparable companies;
•changes in our stockholder base due to the Separation;
•changes in the regulatory and legal environment in which we operate; and
•market conditions in the construction services contracting market, and the domestic and worldwide economy as a whole.
If securities or industry analysts do not publish research or publish misleading or unfavorable research about our business, our stock price and trading volume could decline.
The trading market for our common stock depends in part on the research and reports that securities or industry analysts publish about us or our business. If one or more of the analysts downgrades our stock or publishes misleading or unfavorable research about our business, our stock price would likely decline. If one or more of the analysts ceases coverage of our common stock or fails to publish reports on us regularly, demand for our common stock could decrease, which could cause our common stock price or trading volume to decline.
Your percentage of ownership in us may be diluted in the future.
In the future, your percentage ownership in us may be diluted because of equity awards that have been and will be granted to our directors, officers and employees or otherwise as a result of equity issuances for acquisitions or capital market transactions. Our employees have stock-based awards relating to shares of our common stock after the distribution as a result of conversion of their MDU Resources stock-based awards (in whole or in part) to our stock-based awards. Any currently granted stock-based awards or awards that will be granted in future will have a dilutive effect on our earnings per share, which could adversely affect the market price of shares of our common stock. From time to time, we will issue additional stock-based awards to our employees under our employee benefits plans.
In addition, our certificate of incorporation authorizes us to issue, without the approval of our stockholders, one or more classes or series of preferred stock that have such designation, powers, preferences and relative, participating, optional and other special rights, including preferences over our common stock respecting dividends and distributions, as our board of directors generally may determine. The terms of one or more classes or series of preferred stock could dilute the voting power or reduce the value of our common stock. Similarly, the repurchase or redemption rights or liquidation preferences we could assign to holders of preferred stock could affect the residual value of the common stock.
We cannot guarantee the timing, declaration, amount or payment of dividends, if any, on our common stock.
The timing, declaration, amount and payment of any dividends to our stockholders, if any, is within the discretion of our board of directors, and will depend upon many factors, including our financial condition, earnings, capital requirements, including for our operating subsidiaries, covenants associated with certain of our debt service obligations, legal requirements, Delaware corporate surplus requirements, regulatory constraints, industry practice, ability to access capital markets, and other factors deemed relevant by our board of directors. Our ability to pay dividends will depend on our ongoing ability to generate cash flows from operations. Moreover, if we determine to pay any dividends in the future, there can be no assurance that we will continue to pay such dividends or the amount of such dividends.
Our certificate of incorporation and bylaws designate the state courts of the State of Delaware, or, if no state court located in the State of Delaware has jurisdiction, the federal court for the District of Delaware, as the sole and exclusive forum for certain types of actions and proceedings that may be initiated by our stockholders, which could discourage lawsuits against us and our directors and officers.
Our certificate of incorporation and bylaws provide that, unless the board of directors otherwise determines, the state courts of the State of Delaware, or, if no state court located in the State of Delaware has jurisdiction, the federal court for the District of Delaware, will be the sole and exclusive forum for any derivative action or proceeding brought on behalf of us, any action asserting a claim of breach of a fiduciary duty owed by any director or officer to us or our stockholders, creditors or other constituents, any action asserting a claim against us or any director or officer arising pursuant to any provision of the Delaware General Corporation Law, as amended (the “DGCL”), or our certificate of incorporation or bylaws, or any action asserting a claim against us or any director or officer governed by the internal affairs doctrine. However, these exclusive forum provisions do not apply to actions asserting only federal law claims under the Securities Act or the Exchange Act, regardless of whether the state courts in the State of Delaware have jurisdiction over those claims.
This exclusive forum provision may limit the ability of our stockholders to bring a claim in a judicial forum that such stockholders find favorable for disputes with us or our directors or officers, which may discourage such lawsuits against us and our directors and officers. Alternatively, if a court outside of Delaware were to find this exclusive forum provision inapplicable to, or unenforceable in respect of, one or more of the specified types of actions or proceedings described above, we may incur additional costs associated with resolving such matters in other jurisdictions, which could adversely affect our business, financial condition and results of operations.
Provisions in our certificate of incorporation and bylaws and Delaware law may prevent or delay an acquisition of us, which could decrease the trading price of our common stock.
Our certificate of incorporation and bylaws, and Delaware law, contain provisions that are intended to deter coercive takeover practices and inadequate takeover bids by making such practices or bids more expensive to the acquirer and to encourage prospective acquirers to negotiate with our board of directors rather than to attempt a hostile takeover. These provisions include rules regarding how stockholders may present proposals or nominate directors for election at stockholder meetings and the right of our board of directors to issue preferred stock without stockholder approval. Delaware law also imposes some restrictions on mergers and other business combinations between any holder of 15 percent or more of our outstanding common stock and us.
We believe these provisions protect our stockholders from coercive or otherwise unfair takeover tactics by requiring potential acquirers to negotiate with our board of directors and by providing our board of directors with more time to assess any acquisition proposal. These provisions are not intended to make us immune from takeovers. However, these provisions apply even if the offer may be considered beneficial by some stockholders and could delay or prevent an acquisition that our board of directors determines is not in the best interests of us and our stockholders. Accordingly, in the event that our board of directors determines that a potential business combination transaction is not in the best interests of us and our stockholders but certain stockholders believe that such a transaction would be beneficial to us and our stockholders, such stockholders may elect to sell their shares in us and the trading price of our common stock could decrease.
These and other provisions of our certificate of incorporation, bylaws and the DGCL could have the effect of delaying, deferring or preventing a proxy contest, tender offer, merger or other change in control, which may have a material adverse effect on our business, financial condition and results of operations.
Furthermore, an acquisition or further issuance of our stock could trigger the application of Section 355(e) of the Code, causing the Distribution to be taxable to MDU Resources. Under the tax matters agreement, and as described in more detail above, we would be required to indemnify MDU Resources for the resulting taxes and related amount, and this indemnity obligation might discourage, delay or prevent a change of control that stockholders may consider favorable.
Item 1B. Unresolved Staff Comments
None.
Item 1C. Cybersecurity
Risk Management and Strategy
Overall Risk Management
We have implemented a cyber risk management program to help ensure that our electronic information and information systems are protected from various threats. The cyber risk management program is maintained as part of our overall governance, enterprise risk management program and compliance program. Our information systems experience ongoing and often sophisticated cyberattacks by a variety of sources with the apparent aim to breach our cyber-defenses. We have faced, and may continue to face, increased cyber risk due to the increased use of employee-owned devices and work from home arrangements. We are continuously reevaluating the need to upgrade and/or replace systems and network infrastructure. These upgrades and/or replacements could adversely impact operations by imposing substantial capital expenditures, creating delays or outages, or experiencing difficulties transitioning to new systems. System disruptions, if not anticipated and appropriately mitigated, could adversely affect us. We continually assess risks from cybersecurity threats and adapt and enhance our controls accordingly.
Risks from Cybersecurity Threats
Any risks from previous cybersecurity threats, including as a result of any previous cybersecurity incidents, have not materially affected or are reasonably likely to materially affect our business, financial condition, or results of operations. Such risks and incidents could have a material adverse effect in the future as cyberattacks continue to increase in frequency and sophistication. We also have cyber event related insurance.
Employee Cybersecurity Training
We provide ongoing cybersecurity training and compliance programs to facilitate education for employees who may have access to our data and critical systems. Employee phishing tests are conducted on a monthly basis.
Engage Third-Parties on Risk Management
Periodic external reviews, including penetration tests and security framework assessments, are conducted by auditors, external assessors, and/or consultants to assess and ensure compliance with our information security programs and practices. Internal and external auditors assess our information technology general controls on an annual basis.
Oversee Third-Party Risk
We have implemented a third-party management risk program to help monitor and reduce risks associated with the Company's vendors, which includes processes such as completing due diligence on third party service providers before engaging with them for their services; assessing the third party’s cybersecurity posture by reviewing audit reports of the third party, completing cyber questionnaires, and reviewing applicable certification; including cybersecurity contractual language in contracts to limit risk; and monitoring and reassessing third parties to ensure ongoing compliance with their cybersecurity obligations.
Other Risk Factors
See also “Item 1A. Risk Factors–Operations, Growth and Competitive Risks–Technology disruptions or cyberattacks could adversely impact our operations.”
Governance
Board of Directors Oversight
The board, as a whole and through its committees, has responsibility for oversight of risk management. In its risk oversight role, the board of directors has the responsibility to satisfy itself that the risk management processes designed and implemented by management are adequate for identifying, assessing, and managing risk. The audit committee of the board of directors of the Company is responsible for oversight of risks from cybersecurity threats.
Management's Role Managing Risk
The Vice President of Technology (“VP of Tech”) plays a large role in informing the audit committee on cybersecurity risks. The audit committee receives presentations and reports from the VP of Tech on cybersecurity related issues which include
information security, technology risks and risk mitigation programs regularly at the quarterly board meetings. In addition to scheduled meetings, the VP of Tech and the audit committee maintain an ongoing dialogue regarding emerging or potential cybersecurity risks.
Cybersecurity Incident Response
We have an incident response plan to identify, protect, detect, respond to, and recover from cybersecurity threats and incidents that is also tested on an annual basis. The incident response plan is updated based on results of the test or as new cyber related developments occur. The VP of Tech, executive leadership, which includes the chief executive officer, chief operating officer, chief financial officer, chief accounting officer, chief legal officer, SEC financial reporting department employees, and the board of directors, are notified of any material cybersecurity incidents through a defined escalation process. The defined escalation process is a risk-based process that specifies who is to be contacted and when at each risk level.
Monitor, Manage, and Safeguard Against Cybersecurity Incidents and Risks
The VP of Tech, along with the Director of Cybersecurity and a designated security team of professionals, are responsible for assessing and managing risks as well as developing and implementing policies, procedures, and practices based on the range of threats faced by us. There are processes around access management, data security, encryption, asset management, secure system development, security operations, network and device security to provide safeguards from a cybersecurity incident along with continual monitoring of various threat intelligence feeds.
Cyber Risk Management Personnel
Our cybersecurity leadership includes the VP of Tech, the Director of Cybersecurity and the Director of IT Governance. The VP of Tech, who reports to the chief executive officer, holds a masters degree in Cybersecurity and oversees the information technology (“IT”) and cybersecurity portfolios for us with over 25 years of information technology experience in the construction services industry. The Director of Cybersecurity, who reports to the VP of Tech, holds a masters degree in Applied Information Management, holds several IT security certifications, including the Certified Information Systems Security Professional (“CISSP”) and the Certified Information Systems Auditor (“CISA”), and has over 20 years of IT and information security experience. The Director of IT Governance, who also reports to the VP of Tech, holds a masters degree in Information Assurance and Computer Security, holds several IT security certifications, including the CISSP, and has 20 years of experience in IT.
Item 2. Properties
We currently maintain our principal executive office at 1730 Burnt Boat Drive, Bismarck, North Dakota 58503 under a five-year operating lease. In addition to the principal office, we own 19 facilities, 5 of which are used by our E&M segment, and 14 of which are used by our T&D segment. We also lease other immaterial properties in 18 states throughout the United States that are used by our E&M and T&D segments. These facilities are used for offices, equipment yards, prefabrication, manufacturing, warehousing, storage and vehicle shops. We believe our facilities are adequate for our current operating needs. We do not believe that any owned or leased facility is material to our operations and, if necessary, we could obtain replacement leased facilities.
In addition to our real property, we operate a fleet of owned and leased trucks and trailers, support vehicles and specialty construction equipment, such as bucket trucks, digger derricks, line pulling and tensioning equipment, and specialty extraction equipment.
Item 3. Legal Proceedings
For a discussion of material legal proceedings, refer to Note 14 – Commitments, Contingencies and Guarantees to the Company’s audited consolidated financial statements included in Part II, Item 8 of this Annual Report, which is incorporated herein by reference.
Item 4. Mine Safety Disclosures
Not applicable.
Part II.
Item 5. Market for the Registrant’s Common Equity, Related Stockholder Matters and Issuer Purchases of Equity Securities
Market Information
Our common stock, par value $0.01, is listed on the New York Stock Exchange (“NYSE”) under the ticker symbol "ECG,” which began “regular-way” trading on November 1, 2024, immediately following the Separation.
Holders of Record
As of February 24, 2025, there were approximately 8,012 registered common shareholders of record of our common stock.
Dividend Policy
We have not paid any cash dividends on our common stock and do not anticipate declaring or paying dividends in the foreseeable future. Any future determination as to the declaration and payment of dividends will be at the discretion of our board of directors and will depend on certain conditions, including financial condition, results of operations, contractual restrictions, capital requirements, business prospects and other factors the board of directors considers relevant.
Total Stockholder Return
The following stock performance graph and table compare the cumulative total stockholder return on our common stock, the S&P SmallCap 600 Index and a peer group selected by our management that includes public companies within our industry. The companies in the peer group were selected to represent a broad group of publicly held corporations with operations similar to ours, and includes Comfort Systems USA, Inc., EMCOR Group Inc., IES Holdings, Inc., MYR Group, Inc., MasTec, Inc., Primoris Services Corporation and Quanta Services, Inc. The graph tracks the performance of a $100 investment, assuming reinvestment of dividends, if applicable, in our common stock, our peer group and in the index from November 1, 2024, the date we began “regular-way” trading on the NYSE, to December 31, 2024. The comparisons in the graph and table below are based upon historical data and are not indicative of, nor intended to forecast future performance.
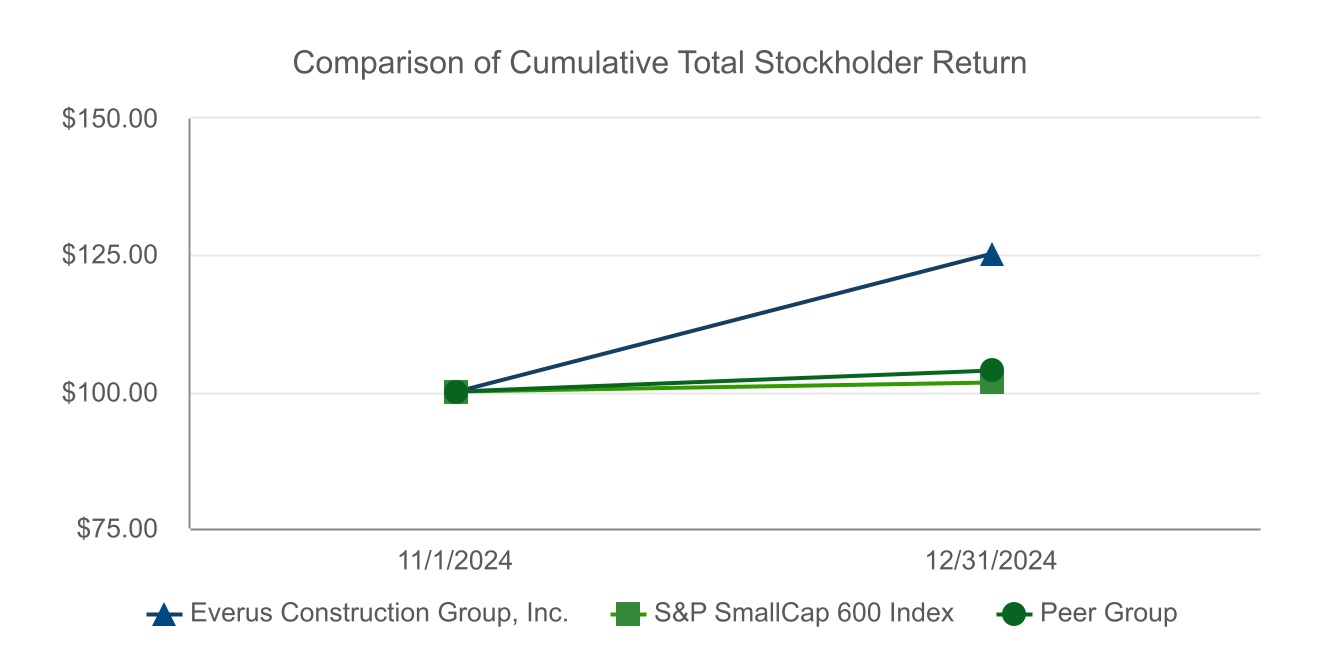
| | | | | | | | | | | | | |
| November 1, 2024 | | | | December 31, 2024 |
| Everus Construction Group, Inc. | $ | 100.00 | | | | | $ | 125.26 | |
| S&P SmallCap 600 Index | 100.00 | | | | | 101.69 | |
| Peer Group | $ | 100.00 | | | | | $ | 103.87 | |
Issuer Purchases of Equity Securities
None.
Item 6. [Reserved]
Item 7. MANAGEMENT’S DISCUSSION AND ANALYSIS OF FINANCIAL CONDITION AND RESULTS OF OPERATIONS
The following information should be read in conjunction with the audited consolidated financial statements and related notes included elsewhere in this Annual Report on Form 10-K (“Annual Report”). The following discussion may contain forward-looking statements that are based upon current expectations and are subject to uncertainty and changes in circumstances.
Our actual results could differ materially from those discussed in these forward-looking statements. Factors that could cause or contribute to these differences include those factors discussed in the following and elsewhere in this Annual Report, particularly in the sections entitled “Cautionary Note Regarding Forward-Looking Statements” and “Item 1A. Risk Factors.” References to the “Company,” “Everus,” “we,” “us,” and “our” refer to Everus Construction Group, Inc. and its consolidated subsidiaries, unless otherwise stated or indicated by context.
Overview
We are a leading construction solutions provider offering specialty contracting services through two operating segments, which represent our two reportable segments, Electrical & Mechanical and Transmission & Distribution, which provide services to a diverse set of end markets across most of the United States. We focus on safely executing projects; providing a superior return on investment by building new and strengthening existing customer relationships; ensuring quality service; effectively managing costs; retaining, developing and recruiting talented employees; growing through organic and strategic acquisition opportunities; and focusing efforts on projects that will permit higher margins while properly managing risk. The growth we have experienced in recent years is due in part to the project awards in the end markets and submarkets served and the ability to support national customers in most of the regions in which we operate. Our strong presence in the Western, Midwestern and Eastern regions has driven opportunities in high-tech, data centers, hospitality and utilities, while customer expansion nationwide continues to extend our reach through partnerships through our 15 wholly-owned operating companies (the “Operating Companies”). At Everus, people are our core, and we prioritize integrity, safety and growth through comprehensive training, hands-on development, safety compliance metrics and strong union partnerships to instill a safety-first culture and ethical leadership across all levels.
We provide specialty contracting services to commercial, industrial, institutional, service & other, renewables, utilities, transportation, manufacturing and governmental customers. We operate throughout most of the United States through two operating segments:
Electrical & Mechanical (“E&M”): Contracting services including construction and maintenance of electrical and communication wiring and infrastructure, fire suppression systems, and mechanical piping and services in both the public and private sectors.
Transmission & Distribution (“T&D"): Contracting services including construction and maintenance of overhead and underground electrical, gas and communication infrastructure, as well as design, manufacturing and distribution of overhead and underground transmission line construction equipment and tools.
Strategy and Challenges
We face challenges, which are not under direct control of the business, in the markets in which we operate, including those described in the section entitled “Item 1A. Risk Factors” included elsewhere in this Annual Report. These factors, and those noted below, have caused fluctuations in revenues, gross profit and earnings in the past and are likely to cause fluctuations in the future.
•Revenue mix and impact on gross profit. The mix of revenues based on the types of services provided can impact gross profit as certain industries and services provide higher gross profit opportunities. Larger or more complex projects typically result in higher gross profit opportunities since we assume a higher degree of performance risk and there is greater utilization of our resources for longer construction timelines. However, larger or more complex projects can have a higher risk of regulatory and seasonal or cyclical delay. Project schedules fluctuate, which can affect the amount of work performed in a given period. Smaller or less complex projects typically have a greater number of companies competing for them, and competitors at times may be more aggressive when pursuing available work. A greater percentage of smaller scale or less complex work in a given period could negatively impact gross profit due to the inefficiency of transitioning between a greater number of smaller projects versus continuous production on a few larger projects.
•Project variability and performance. Gross profit for a single project may fluctuate period to period due to changes in the volume or type of work performed, the pricing structure under the project contract or job productivity. Productivity and performance on a project can vary period to period based on a number of factors, including unexpected project difficulties; unexpected project site conditions; project location, including locations with challenging operating conditions or difficult geographic characteristics; whether the work is on an open or encumbered right of way; inclement weather or severe weather events; environmental restrictions or regulatory delays; political or legal challenges related to a project; and the performance of third parties. In addition, the type of contract can impact the gross profit on a project. Under fixed-price contracts, which are more common with larger or more complex projects, we assume risk related to project estimates versus actual execution. Revenues under this type of contract can vary, sometimes significantly, from original projects due to additional project complexity; timing uncertainty or extended bidding; extended regulatory or permitting processes; and other factors, which can result in a reduction in profit or losses on a project.
•Subcontractor work and provision of materials. Some work under project contracts is subcontracted out to other companies and gross profit on subcontractor work generally is lower than work we perform. Increased subcontractor work in a given period may therefore result in lower gross profit. In addition, inflationary or other pressures may increase the cost of materials under fixed-price contracts and may result in decreased gross profit on projects. We have worked to implement provisions in project contracts to allow for the pass-through of inflationary costs to customers where feasible and will continue to do so to mitigate the impacts.
Market Conditions and Outlook
The U.S. construction services industry is highly fragmented. It includes a wide spectrum of players, from small, private companies whose activities are geographically concentrated to larger public companies with nationwide capabilities. Competition within the industry is influenced by various elements such as technical expertise, service pricing, financial and operational resources, track record for safety, industry reputation and dependability.
The U.S. construction services industry serves a diverse customer base that includes federal, state and municipal governmental agencies, commercial and residential developers and private parties. The mix of customers varies by region and economic conditions.
The main factors and trends in the U.S. construction services industry include:
•Key economic factors. Many factors affect product demand, including public spending on infrastructure projects, general economic conditions, including population growth and employment levels, imposed and proposed tariffs, and prevailing interest rates.
•Inflation. Rising inflation can increase the cost of construction materials, labor and insurance premiums, impacting project budgets and profitability.
•Industry fragmentation. There are thousands of construction services providers of varying scope and size. Market participants may enter new geographies or expand existing positions through organic growth or the acquisition of existing providers.
•Seasonality. Activity in certain areas is seasonal due to the effects of weather, which can impact safety and efficiency of operations and lead to demand for services.
•Cyclicality. The demand for construction services is significantly influenced by the cyclical nature of the economy.
•Regulations. Operations are subject to extensive laws and regulations relating to the maintenance of safe conditions in the workplace.
•Production inputs. Costs of labor, equipment and other inputs can vary over time based on macroeconomic factors and impact profitability of operations.
•Personnel. Ability to maintain productivity and operating performance is heavily dependent on the ability to employ, train and retain qualified personnel necessary to operate efficiently.
We continued to have bidding opportunities in the specialty contracting markets we operated in during 2024, as evidenced by our backlog. Although bidding remains highly competitive in all areas, we expect relationships with existing customers, our safe and skilled workforce, quality of service and effective cost management will continue to provide a benefit in securing and executing profitable projects in the future. We also have seen rapidly growing needs for services across the electric vehicle
charging, renewable energy generation and energy storage markets that complement existing renewable projects performed by us.
The Separation and Distribution
On November 2, 2023, MDU Resources Group, Inc. (“MDU Resources” or “MDU”) announced its intention to pursue a tax-free spinoff of Everus Construction, Inc. (formerly known as MDU Construction Services Group, Inc.) (“Everus Construction”) from MDU Resources (the “Separation”). Prior to the Separation, Everus Construction was the construction services segment of MDU and operated as a wholly-owned subsidiary of CEHI, LLC (“Centennial”), which is a wholly-owned subsidiary of MDU Resources. In anticipation of the Separation, MDU Resources formed a new wholly owned subsidiary, Everus Construction Group, Inc., that became the new parent company of Everus Construction.
On October 31, 2024, MDU Resources completed the Separation by transferring Everus Construction, inclusive of all its assets and liabilities, to Everus and distributing 50,972,059 shares of Everus common stock ($0.01 par value) to MDU Resources stockholders of record as of October 21, 2024 (the “Distribution”). The Distribution was structured as a pro rata distribution of one share of Everus common stock for every four shares of MDU Resources common stock (such ratio, the “Distribution Ratio”). MDU Resources did not distribute any fractional shares of Everus common stock to its stockholders as part of the distribution. Instead, MDU Resources’ stockholders received cash in lieu of any fractional shares of Everus common stock that they would have received after application of the Distribution Ratio.
As a result of the Separation and Distribution, Everus is an independent publicly traded company and our common stock is listed under the symbol “ECG” on the New York Stock Exchange.
The Separation and Distribution was completed pursuant to a separation and distribution agreement as well as other agreements with MDU Resources, including, but not limited to, a transition services agreement, a tax matters agreement and an employee matters agreement. Refer to Note 15 – Related-Party Transactions in the audited consolidated financial statements contained elsewhere in this Annual Report for additional information on the transition services agreement. We incurred costs related to becoming an independent public entity and expect additional ongoing expenses related to continued operations as such.
For a complete discussion of the associated risks and uncertainties associated with the Separation and Distribution, see “Risk Factors—Separation and Distribution Risks” contained elsewhere in this Annual Report.
Basis of Presentation
Prior to the Separation, Everus Construction historically operated as a wholly owned subsidiary of Centennial and an indirect, wholly owned subsidiary of MDU Resources and not as a standalone company. For periods prior to the Separation, the accompanying audited consolidated financial statements and related footnotes included in this Annual Report were prepared on a "carve-out” basis in connection with the Separation and were derived from the audited consolidated financial statements of MDU Resources as if we operated on a standalone basis. However, the audited consolidated financial statements and related footnotes for periods prior to the Separation do not necessarily reflect what our results of operations, financial position and cash flows would have been had we operated as a separate, publicly traded company. For additional information related to our basis of presentation, refer to Note 2 – Basis of Presentation and Summary of Significant Accounting Policies in the audited consolidated financial statements contained elsewhere in this Annual Report.
Prior to the Separation, we historically participated in MDU Resources’ centralized cash management program through Centennial, including its overall financing arrangements. We had related-party agreements in place with Centennial for the financing of our capital needs, which were reflected as related-party notes payable on the audited consolidated balance sheets for periods prior to the Separation. Interest expense in the audited consolidated statements of income reflected the allocation of interest on borrowing and funding associated with the related-party agreements for periods prior to the Separation. Refer to Note 15 – Related-Party Transactions in the audited consolidated financial statements contained elsewhere in this Annual Report for additional information. Following the Separation, we rely on our own credit and financing arrangements and incur interest expense associated with those arrangements. For additional information related to our current financing arrangements, refer to Note 7 – Debt in the audited consolidated financial statements contained elsewhere in this Annual Report.
Cash-settled related-party transactions between Everus, MDU Resources, Centennial and other MDU Resources subsidiaries were included in the audited consolidated financial statements for periods prior to the Separation. For additional information regarding the agreements between us, MDU Resources and Centennial, refer to the section contained elsewhere in this Annual Report entitled “Certain Relationships and Related Person Transactions, and Director Independence.”
All intercompany balances and transactions between the businesses comprising Everus have been eliminated in the accompanying audited consolidated financial statements.
Consolidated Results of Operations For the Years Ended December 31, 2024, 2023 and 2022
The following table sets forth our consolidated selected statements of income data, as well as the percentage change from the comparative prior year.
| | | | | | | | | | | | | | | | | | | | | | | | | | | | | | | | |
| Years ended December 31, | | 2024 | | 2023 | | 2022 | | 2024 vs 2023 % change | | 2023 vs 2022 % change |
| | (In millions, except percentages) |
| Operating revenues | | $ | 2,849.7 | | | $ | 2,854.4 | | | $ | 2,699.2 | | | (0.2) | % | | 5.7 | % |
| Cost of sales | | 2,510.2 | | | 2,532.5 | | | 2,423.2 | | | (0.9) | | | 4.5 | |
| Gross profit | | 339.5 | | | 321.9 | | | 276.0 | | | 5.5 | | | 16.6 | |
| Selling, general and administrative expenses | | 149.6 | | | 131.4 | | | 111.4 | | | 13.9 | | | 18.0 | |
| Operating income | | 189.9 | | | 190.5 | | | 164.6 | | | (0.3) | | | 15.7 | |
| Interest expense | | 14.0 | | | 17.0 | | | 6.3 | | | (17.6) | | | NM |
| Other income | | 4.8 | | | 4.0 | | | 1.4 | | | 20.0 | | | NM |
| Income before income taxes and income from equity method investments | | 180.7 | | | 177.5 | | | 159.7 | | | 1.8 | | | 11.1 | |
| Income taxes | | 49.5 | | | 45.3 | | | 40.8 | | | 9.3 | | | 11.0 | |
| Income from equity method investments | | 12.2 | | | 5.0 | | | 5.9 | | | NM | | (15.3) | |
| Net income | | $ | 143.4 | | | $ | 137.2 | | | $ | 124.8 | | | 4.5 | % | | 9.9 | % |
__________________
*NM - Not Meaningful
Year Ended December 31, 2024, Compared to Year Ended December 31, 2023
Operating Revenues
Operating revenues for the year ended December 31, 2024, were $2,849.7 million, a decrease of $4.7 million, or 0.2%, from $2,854.4 million for the year ended December 31, 2023. E&M revenues declined $103.4 million, or 4.8%, partially offset by growth in T&D revenues of $102.5 million, or 14.0%.
E&M revenues decreased $103.4 million, or 4.8%, as a result of lower revenues for the industrial, service & other, renewables and commercial end markets, partially offset by higher revenues from the institutional end market.
•Industrial had lower revenues from reduced workloads in the general industrial, high tech and government submarkets, partially offset by higher workloads in manufacturing.
•Service & other and renewables revenues softened due to decreased repair and maintenance demand and the timing of projects within the generation submarket, respectively.
•Commercial had revenue shifts within the hospitality submarket from completion of large projects during 2023, partially offset by higher data center activity due to increased workloads.
•Institutional revenues increased, partially offsetting the decreases in other end markets, driven from higher workloads in the government and education submarkets.
T&D revenues increased $102.5 million, or 14.0%, due to higher utility and transportation end market revenues.
•Utility revenues increased from higher workloads and submarket activity across distribution, transmission, substation and telecommunication, partially offset by lower workloads due to timing of project availability in the other submarkets.
•Transportation had higher revenues due to submarket activity, with higher workloads in traffic signalization and street lighting.
Cost of Sales
Cost of sales for the year ended December 31, 2024, was $2,510.2 million, a decrease of $22.3 million, or 0.9%, from $2,532.5 million for the year ended December 31, 2023. This decrease primarily related to lower operating costs supporting decreased E&M workloads and project efficiencies, partially offset by higher T&D operating costs from increased workloads. Labor and material costs decreased by $89.0 million and $51.1 million, respectively, partially offset by higher subcontractor costs and other job expenses of $91.2 million and $26.7 million, respectively.
Selling, General and Administrative Expenses
Selling, general and administrative expenses for the year ended December 31, 2024, were $149.6 million, an increase of $18.2 million, or 13.9%, from $131.4 million for the year ended December 31, 2023. The increase was driven primarily by higher payroll expense of $10.2 million to support the operational growth of the business, higher professional service-related expenses of $6.1 million, higher insurance expenses of $1.0 million and higher general expenses of $7.2 million, including office and rent expense. There were $6.4 million of public company stand-up costs as part of the increases in expense. Partially offsetting these increases was lower provision for expected credit losses of $6.3 million.
Operating Income
Operating income for the year ended December 31, 2024, was $189.9 million, a decrease of $0.6 million, or 0.3%, from $190.5 million for the year ended December 31, 2023. The decrease was primarily driven by increased selling, general and administrative expenses as discussed above, largely offset by increased gross profit due to project efficiencies. Operating income, as a percentage of revenues, remained consistent at 6.7%.
Interest Expense
Interest expense for the year ended December 31, 2024, was $14.0 million, a decrease of $3.0 million, or 17.6%, from $17.0 million for the year ended December 31, 2023. This decrease primarily related to lower fiscal year 2024 pre-Separation related-party debt balances utilized under the MDU Resources cash management program, compared to full year 2023. Partially offsetting the lower related party interest expense was $4.1 million of third-party interest expense associated with our financing arrangements following the Separation.
Other Income
Other income for the year ended December 31, 2024, was $4.8 million, an increase of $0.8 million, or 20.0%, from $4.0 million for the year ended December 31, 2023. This increase primarily related to miscellaneous income activity, including settlements, rebates and bank fees.
Income Taxes
Income taxes for the year ended December 31, 2024, were $49.5 million, an increase of $4.1 million, or 9.3%, from $45.3 million for the year ended December 31, 2023, reflecting higher income before taxes for the year. The effective tax rate was 25.7% for the year ended December 31, 2024, compared to 24.8% for the year ended December 31, 2023.
Income from Equity Method Investments
Income from equity method investments for the year ended December 31, 2024, was $12.2 million, an increase of $7.2 million from $5.0 million for the year ended December 31, 2023. This increase primarily related to increased progress on joint venture activity.
Year Ended December 31, 2023, Compared to Year Ended December 31, 2022
Operating Revenues
Operating revenues for the year ended December 31, 2023, were $2,854.4 million, an increase of $155.2 million, or 5.7%, from $2,699.2 million for the year ended December 31, 2022. E&M revenues grew $137.1 million, or 6.9%, and T&D revenues rose $17.2 million, or 2.4%.
E&M revenues increased $137.1 million, or 6.9%, as a result of higher revenues for the commercial, industrial and institutional end markets, partially offset by lower revenues for the renewables end market.
•Commercial revenues increased due to submarket activity, including higher hospitality and data center workloads.
•Higher industrial revenues were driven by workload activity across submarkets, including increases for high tech and government.
•Higher institutional revenues were primarily the result of increased workload activity in the healthcare submarket.
•Renewables had lower revenues due to timing of project availability.
T&D revenue increased $17.2 million, or 2.4%, as a result of higher utility end market revenues, partially offset by lower transportation end market revenues.
•Utility revenues increased from higher workloads and submarket activity across distribution, transmission, gas, and underground projects, largely offset by lower electrical workloads due to timing of project availability.
•Transportation revenues were lower due to decreased submarket workloads, such as project timing in street lighting and government, partially offset by an increase in traffic signalization submarket revenues.
Cost of Sales
Cost of sales for the year ended December 31, 2023, was $2,532.5 million, an increase of $109.3 million, or 4.5%, from $2,423.2 million for the year ended December 31, 2022. This increase primarily relates to higher operating costs supporting increased E&M revenues and higher T&D operating costs from increased construction volume. Labor and subcontractor costs increased by $96.0 million and $67.1 million, respectively due to workloads, partially offset by lower material costs of $44.2 million and other job expenses of $12.1 million.
Selling, General and Administrative Expenses
Selling, general and administrative expenses for year ended December 31, 2023, were $131.4 million, an increase of $20.0 million, or 18.0%, from $111.4 million for year ended December 31, 2022. The increase was driven primarily by higher provision for expected credit losses of $6.0 million, higher payroll expenses of $7.3 million and higher professional service-related expenses of $2.8 million to support the operational growth of the business.
Operating Income
Operating income for the year ended December 31, 2023, was $190.5 million, an increase of $25.9 million, or 15.7%, from $164.6 million for the year ended December 31, 2022. The increase was primarily driven by increased revenue and gross profit, partially offset by increased selling, general and administrative expenses as discussed above. Operating income, as a percentage of revenues, increased to 6.7% for the year ended December 31, 2023, compared to 6.1% for the year ended December 31, 2022.
Interest Expense
Interest expense for the year ended December 31, 2023, was $17.0 million, an increase of $10.7 million from $6.3 million for the year ended December 31, 2022. This increase primarily relates to higher debt balances as a result of increased working capital needs during the construction season and higher overall variable interest rates.
Other Income
Other income for the year ended December 31, 2023, was $4.0 million, an increase of $2.6 million from $1.4 million for the year ended December 31, 2022. This increase primarily relates to the timing of miscellaneous sales of assets.
Income Taxes
Income taxes for the year ended December 31, 2023, were $45.3 million, an increase of $4.5 million, or 11.0%, from $40.8 million for the year ended December 31, 2022, reflecting higher income before taxes for the year. The effective tax rate was 24.8% for the year ended December 31, 2023, compared to 24.6% for the year ended December 31, 2022.
Income from Equity Method Investments
Income from equity method investments for the year ended December 31, 2023, was $5.0 million, a decrease of $0.9 million, or 15.3%, from $5.9 million for the year ended December 31, 2022. This decrease primarily relates to less progress on joint venture activity.
Segment Results of Operations For the Years Ended December 31, 2024, 2023 and 2022
We report our results under two reportable segments: Electrical & Mechanical, and Transmission & Distribution. The following table sets forth segment revenues and segment operating income for the periods indicated, as well as the percentage change from the comparative prior year:
| | | | | | | | | | | | | | | | | | | | | | | | | | | | | | | | |
| Years ended December 31, | | 2024 | | 2023 | | 2022 | | 2024 vs 2023 % change | | 2023 vs 2022 % change |
| | (In millions, except percentages) |
| Operating revenues: | | | | | | | | | | |
| Electrical & Mechanical | | $ | 2,031.5 | | | $ | 2,134.9 | | | $ | 1,997.8 | | | (4.8) | % | | 6.9 | % |
| Transmission & Distribution | | 837.1 | | | 734.6 | | | 717.4 | | | 14.0 | | | 2.4 | |
| Eliminations | | (18.9) | | | (15.1) | | | (16.0) | | | 25.2 | | | (5.6) | |
| Consolidated revenues | | $ | 2,849.7 | | | $ | 2,854.4 | | | $ | 2,699.2 | | | (0.2) | % | | 5.7 | % |
| | | | | | | | | | |
| Operating income: | | | | | | | | | | |
| Electrical & Mechanical | | $ | 137.0 | | | $ | 134.4 | | | $ | 105.0 | | | 1.9 | % | | 28.0 | % |
| Transmission & Distribution | | 85.0 | | | 73.6 | | | 72.3 | | | 15.5 | | | 1.8 | |
| Corporate and other | | (32.1) | | | (17.5) | | | (12.7) | | | (83.4) | | | (37.8) | |
| Consolidated operating income | | $ | 189.9 | | | $ | 190.5 | | | $ | 164.6 | | | (0.3) | % | | 15.7 | % |
Year Ended December 31, 2024, Compared to Year Ended December 31, 2023
Operating Revenues
E&M segment revenues for the year ended December 31, 2024, were $2,031.5 million, a decrease of $103.4 million, or 4.8%, from $2,134.9 million for the year ended December 31, 2023. The decrease primarily related to lower revenues for the industrial, service & other, renewables and commercial end markets, partially offset by higher revenues for the institutional end market.
•Industrial revenues decreased $150.7 million from reduced activity in the general industrial, high tech and government submarkets, partially offset by higher workloads in manufacturing.
•Service & other revenues dipped $30.3 million, largely the result of lower workloads due to decreased repair and maintenance demand.
•Renewables revenues were $18.4 million lower due to timing of projects within the generation submarket.
•Commercial revenues eased $6.3 million with softened activity in the hospitality submarket from completion of large projects during 2023, partially offset by increased data center activity due to higher workloads.
•Institutional revenues increased $102.3 million with higher workloads in the government and education submarkets.
T&D segment revenues for the year ended December 31, 2024, were $837.1 million, an increase of $102.5 million, or 14.0%, from $734.6 million for the year ended December 31, 2023. The increase primarily related to higher utility and transportation end market revenues.
•Utility revenues increased $76.3 million due to higher workloads and submarket activity in distribution, transmission, substation and telecommunication, partially offset by softening workloads in the other submarkets from the timing of project availability.
•Transportation revenues increased $26.3 million with higher workloads in the traffic signalization and street lighting submarkets.
Operating Income
E&M segment operating income for the year ended December 31, 2024, was $137.0 million, an increase of $2.6 million, or 1.9%, from $134.4 million for the year ended December 31, 2023. The increase was primarily driven by higher gross profit for projects in the institutional, renewables and industrial end markets due to project mix, partially offset by a dip in gross profit in the commercial and service & other end markets due to timing of projects and project availability. E&M gross profit
percentage increased from lower overall operating costs due to lower workloads and project efficiencies. Operating income was also impacted by higher selling, general and administrative expenses due to cost increases for payroll expenses of $3.3 million, professional services of $2.7 million and general expenses of $3.5 million, partially offset by lower provision for expected credit losses of $6.1 million. Operating income, as a percentage of revenues, for our E&M segment increased to 6.7% for the year ended December 31, 2024 compared to 6.3% for the year ended December 31, 2023.
T&D segment operating income for the year ended December 31, 2024, was $85.0 million, an increase of $11.4 million, or 15.5%, from $73.6 million for the year ended December 31, 2023. The increase was the result of higher gross profit in the utility and transportation end markets due to higher revenues and project mix. T&D gross profit percentage remained consistent with the prior year. Operating income was also impacted by higher Selling, general and administrative expenses due to cost increases for payroll expenses of $2.1 million, professional services of $0.4 million, and general expenses of $0.7 million, partially offset by lower provision for expected credit losses of $0.1 million. Operating income, as a percentage of revenues, for our T&D segment increased to 10.2% for the year ended December 31, 2024 compared to 10.0% for the year ended December 31, 2023.
The increase in corporate and other costs during the year ended December 31, 2024 was primarily due to higher labor costs of $4.7 million to support the operational growth of the business, higher professional services of $3.0 million, higher insurance expenses of $4.6 million and higher general expenses of $2.3 million including office expenses.
Year Ended December 31, 2023, Compared to Year Ended December 31, 2022
Operating Revenues
E&M segment revenues for the year ended December 31, 2023, were $2,134.9 million, an increase of $137.1 million, or 6.9%, from $1,997.8 million for the year ended December 31, 2022. The increase primarily related to higher revenues for the commercial, industrial, and institutional end markets, partially offset by lower revenues for the renewables end market.
•Commercial revenues grew $121.6 million with heightened activity in the hospitality and data center submarkets due to higher workloads, partially offset by easing general commercial and mechanical workloads.
•Industrial revenues rose $67.6 million from increased activity in the high tech and government submarkets, partially offset by lower general industrial and low voltage workloads.
•Institutional revenues increased $46.8 million primarily from higher workloads in the healthcare submarket.
•Renewables revenues dipped $95.7 million due to timing of project availability.
T&D segment revenues for the year ended December 31, 2023, were $734.6 million, an increase of $17.2 million, or 2.4%, from $717.4 million for the year ended December 31, 2022. The increase primarily related to higher utility end market revenues, partially offset by lower transportation end market revenues.
•Utility revenues increased $32.4 million due to higher workloads and submarket activity in distribution, transmission, and gas and underground, partially offset by softening workloads in the electrical and substation submarkets from the timing of project availability.
•Transportation revenues decreased $15.2 million with lower workloads in the street lighting and government submarkets, partially offset by higher activity in the traffic signalization submarket due to timing of projects.
Operating Income
E&M segment operating income for the year ended December 31, 2023, was $134.4 million, an increase of $29.4 million, or 28.0%, from $105.0 million for the year ended December 31, 2022. The increase was primarily driven by an increase of revenue as discussed above as well as gross profit margin improvement due to project mix and efficiency in labor and materials compared to the prior year. Operating income was also impacted by cost increases for operating expenses for labor, professional services, and office expenses of $5.6 million and allowance for credit losses of $5.9 million. Operating income, as a percentage of revenues, for the E&M segment increased to 6.3% for the year ended December 31, 2023, from 5.3% for the year ended December 31, 2022.
T&D segment operating income for the year ended December 31, 2023, was $73.6 million, an increase of $1.3 million, or 1.8%, from $72.3 million for the year ended December 31, 2022. The increase is the result of higher revenue as described above with project mix contributing to the operating income increase. Operating income was impacted from higher labor costs and
professional services of $2.0 million. Operating income, as a percentage of revenues, for our T&D segment remained consistent for the year ended December 31, 2023, compared to the year ended December 31, 2022.
The increase in corporate and other costs during the year ended December 31, 2023 was primarily due to higher labor costs to support the business operations of $3.4 million along with higher office expenses of $1.3 million, primarily due to higher charitable contributions.
Backlog
Backlog is a common measurement in the construction services industry. Our determination of backlog can include projects that have a written award, a letter of intent, a notice to proceed, an agreed upon work order to perform work on mutually accepted terms, and conditions and change orders or claims to the extent management believes additional contract revenues will be earned and are deemed probable of collection. Contracts are subject to delays, defaults or cancellations; changes in scope of services to be provided; and adjustments to costs. Backlog may also be affected by project delays or cancellations resulting from weather conditions, external market factors and economic factors beyond our control, among other things. Accordingly, there is no assurance that backlog will be realized. For the periods presented in the backlog table below, we did not experience any material impacts related to delays or cancellations of planned projects that were included in backlog. The timing of contract awards, including contracts awarded underneath Master Service Agreements (“MSAs”), duration of large new contracts and the mix of services can significantly affect backlog. Backlog at any given point in time may not accurately represent the revenue or net income that is realized in any period, and backlog as of the end of the quarter or year may not be indicative of the revenue or net income expected to be realized in the following year. Backlog should not be relied upon as a standalone indicator of future results. See “Item 1A. Risk Factors” included elsewhere within this Annual Report for factors that could cause revenues to be realized in periods and at levels that are different from originally projected.
Subject to the foregoing discussions, the following table provides estimated backlog as of the dates indicated and the amounts we reasonably estimate will be recognized within the next 12 months following December 31, 2024:
| | | | | | | | | | | | | | | | | | | | |
| | Amount estimated to be recognized within 12 months | | December 31, 2024 | | December 31, 2023 |
| | (In millions) |
| Electrical & Mechanical | | $ | 1,998.0 | | | $ | 2,507.0 | | | $ | 1,685.6 | |
| Transmission & Distribution | | 242.4 | | | 273.6 | | | 325.3 | |
| Total | | $ | 2,240.4 | | | $ | 2,780.6 | | | $ | 2,010.9 | |
Changes in backlog from period to period are primarily the result of fluctuations in the timing of revenue recognition of contracts.
The increase in E&M backlog from December 31, 2024, compared to December 31, 2023, primarily reflected additional commercial, institutional and renewables projects, partially offset by completed or near completion projects during the period.
The decrease in T&D backlog from December 31, 2024, compared to December 31, 2023, primarily reflected completed or near completed utility projects, partially offset by additional projects added during the period.
Non-GAAP Financial Measures
All financial information presented in this Annual Report has been prepared in U.S. dollars in accordance with generally accepted accounting principles in the United States (“GAAP”), except for the presentation of the following non-GAAP financial measures: EBITDA, EBITDA margin and free cash flow. We evaluate our operating performance using EBITDA and EBITDA margin, and we evaluate our liquidity using free cash flow. These non-GAAP financial measures are not intended as alternatives to GAAP financial measures and have limitations as an analytical tool and should not be considered in isolation or as a substitute for an analysis of our results as reported under GAAP. Because of these limitations, EBITDA, EBITDA margin and free cash flow should not be considered as replacements for net income, net income margin or cash provided by (used in) operating activities, the most comparable GAAP measures, respectively. Our non-GAAP financial measures are not standardized; therefore, it may not be possible to compare them with other companies’ EBITDA, EBITDA margin and free cash flow having the same or similar names.
EBITDA and EBITDA Margin
We utilize EBITDA and EBITDA margin to consistently assess our operating performance and as a basis for strategic planning and forecasting since we believe that EBITDA closely correlates to long-term enterprise value. We believe that measuring performance on an EBITDA basis is useful to investors because it enables a more consistent evaluation of our operational performance period to period. We believe these non-GAAP financial measures, in addition to the corresponding GAAP measures of net income and net income margin, are useful to investors and provide meaningful information about operational efficiency by excluding the impacts of differences in tax jurisdictions and structures, debt levels and capital investment. Investors also may use EBITDA to calculate leverage as a multiple of EBITDA. We use EBITDA and EBITDA margin in addition to GAAP metrics, to evaluate our operating results, calculate compensation packages and determine leverage as a multiple of EBITDA to establish the appropriate funding of operations.
EBITDA is calculated by adding back interest expense, income taxes and depreciation and amortization to net income. EBITDA margin is calculated by dividing EBITDA by operating revenues. EBITDA and EBITDA margin are considered non-GAAP financial measures and are comparable to the corresponding GAAP measures of net income and net income margin, respectively.
The following table reconciles net income to EBITDA and provides the calculation of EBITDA Margin.
| | | | | | | | | | | | | | | | | | | | |
| Years ended December 31, | | 2024 | | 2023 | | 2022 |
| | (In millions, except percentages) |
| Net income | | $ | 143.4 | | | $ | 137.2 | | | $ | 124.8 | |
| Interest | | 14.0 | | | 17.0 | | | 6.3 | |
| Income taxes | | 49.5 | | | 45.3 | | | 40.8 | |
| Depreciation and amortization | | 25.3 | | | 23.1 | | | 21.5 | |
| EBITDA | | $ | 232.2 | | | $ | 222.6 | | | $ | 193.4 | |
| | | | | | |
| Operating revenues | | $ | 2,849.7 | | | $ | 2,854.4 | | | $ | 2,699.2 | |
| Net income margin | | 5.0 | % | | 4.8 | % | | 4.6 | % |
| EBITDA margin | | 8.1 | % | | 7.8 | % | | 7.2 | % |
Free Cash Flow
We use free cash flow as a measure of liquidity that indicates how much cash we can produce after taking cash outflows from operations and assets into consideration. We believe this non-GAAP financial measure, in addition to the corresponding GAAP measure of cash provided by (used in) operating activities, is useful to investors because it provides meaningful information about our financial health and our ability to generate cash, support additional debt obligations, pay future dividends and fund growth. Free cash flow does not represent our residual cash flow available for discretionary purposes.
Free cash flow is defined as net cash provided by (used in) operating activities less net capital expenditures.
The following table reconciles cash provided by (used in) operating activities to free cash flow.
| | | | | | | | | | | | | | | | | | | | |
| Years ended December 31, | | 2024 | | 2023 | | 2022 |
| | (In millions) |
| Net cash used in investing activities | | $ | (37.1) | | | $ | (20.0) | | | $ | (24.6) | |
| Net cash (used in) provided by financing activities | | $ | (41.9) | | | $ | (151.9) | | | $ | 51.5 | |
| | | | | | |
| Net cash provided by (used in) operating activities | | $ | 163.4 | | | $ | 171.4 | | | $ | (25.5) | |
| Purchases of property, plant and equipment | | (48.3) | | | (35.6) | | | (35.8) | |
| Cash proceeds from sale of property, plant and equipment | | 13.7 | | | 16.2 | | | 11.3 | |
| Free cash flow | | $ | 128.8 | | | $ | 152.0 | | | $ | (50.0) | |
Liquidity and Capital Resources
As of December 31, 2024, we had $86.0 million of cash, cash equivalents and restricted cash, including $16.1 million of restricted cash held by the Captive Cell. As of December 31, 2023, we had $1.6 million of cash, cash equivalents and restricted cash, with no restricted cash.
Prior to the Separation, we historically participated in MDU Resources’ centralized cash management program through Centennial, including its overall financing arrangements. After the Separation, we no longer rely on MDU Resources’ central cash management and financing program and instead rely on our own credit. We have implemented our own centralized cash management model and will use cash on hand and third-party credit facilities to fund day-to-day operations.
Our ability to fund our cash needs will depend on the ongoing ability to generate cash from operations and obtain debt financing with competitive rates. We rely on access to capital markets as sources of liquidity for capital requirements not satisfied by cash flows from operations.
Our principal uses of cash are to fund our operations, working capital needs, capital expenditures, repayment of borrowings and strategic business development transactions.
On October 31, 2024, we entered into a five-year senior secured credit agreement (“the Credit Agreement”), whereby we have the capacity to incur indebtedness of up to $525.0 million, consisting of $300.0 million in aggregate principal amount of term loans (“Term Loan”) and a $225.0 million revolving credit facility (“Revolving Credit Facility”). Letters of credit are available under the Credit Agreement in an aggregate amount of up to $50.0 million.
The term loan and the revolving credit facility will both bear interest at an annual rate equal to adjusted term Secured Overnight Financing Rate, defined in a customary manner (“Term SOFR”) plus an applicable rate.
The Credit Agreement contains financial covenants requiring us to maintain a maximum consolidated total net leverage ratio of 3.00:1.00 and a minimum interest coverage ratio of 3.00:1.00, in each case measured as of the last day of each fiscal quarter. The consolidated total net leverage ratio may be increased at our option to 3.50:1.00 in connection with certain qualifying material acquisitions. The covenants also include restrictions on the sale of certain assets, loans and investments.
On October 31, 2024, we used $290.0 million of the net proceeds of such indebtedness, including the Term Loan and $40.0 million drawn under the Revolving Credit Facility, to repay $230.0 million of outstanding indebtedness with Centennial and to pay a $60.0 million dividend to MDU Resources, with the remaining $42.1 million being retained by us.
On November 29, 2024, we repaid the $40.0 million outstanding, plus accrued interest, under the Revolving Credit Facility.
As of December 31, 2024, we had $300.0 million outstanding under the Term Loan and $209.4 million of available capacity under the Revolving Credit Facility, net of $15.6 million of outstanding standby letters of credit.
In order to borrow under the debt instruments, we must be in compliance with the applicable covenants and certain other conditions, all of which we were in compliance with as of December 31, 2024. In the event we do not comply with the applicable covenants and other conditions, we would be in default on our agreements and alternative sources of funding may need to be pursued. For additional information on our debt arrangements, refer to Note 7 – Debt in the audited consolidated financial statements contained elsewhere in this Annual Report.
Working Capital
Working capital, as defined as current assets minus current liabilities, was $403.9 million and $335.2 million as of December 31, 2024 and 2023, respectively. Our working capital requirements may increase when we commence multiple projects or particularly large projects because labor, subcontractor, inventory and certain other costs typically become payable before the receivables resulting from work performed are collected. Working capital may also increase when we incur costs for work that is the subject of unpaid retainage, change orders and claims. The typical payment billing terms are due within 30 days but may differ depending on contract terms. Retention on receivables can impact the cash collection cycle beyond expenses incurred. The timing of billings and project completions can contribute to changes in unbilled revenue. As of December 31, 2024, we expect that substantially all unbilled receivables will be billed to customers in the normal course of business within the next 12 months.
Capital Expenditures
Our cash capital expenditures for the years ended December 31, 2024, 2023 and 2022, were $48.3 million, $35.6 million and $35.8 million, respectively, or $34.6 million, $19.4 million and $24.5 million net of proceeds from asset disposals, respectively. Capital expenditures were funded by internal sources, related-party borrowings from MDU Resources and Centennial and borrowings under our own financing arrangements and were primarily used for vehicle and equipment additions to support the growth of our business.
We expect capital expenditures and commitments for equipment purchase, lease and rental arrangements to be necessary for the foreseeable future in order to meet anticipated demand for our services. We expect gross capital expenditures for 2025 to be in the range of $65.0 million to $70.0 million. Actual capital expenditures may increase or decrease depending upon business activity levels, as well as ongoing assessments of equipment leasing versus purchasing decisions based on short- and long-term equipment requirements. We continuously monitor our capital expenditures for project delays and changes in economic viability and adjust as necessary. We anticipate that the combination of cash on hand, cash flows from operations, credit facilities and issuances of debt and equity securities, if necessary, will provide sufficient funding to enable us to meet the need of future capital expenditures.
We also continue to evaluate the potential for future acquisitions and other growth opportunities that would be incremental to our capital program; however, they are dependent on the availability of opportunities and, as a result, capital expenditures may vary significantly from the estimates provided.
Cash Flows
The following table summarizes our net cash provided by (used in) operating, investing and financing activities for the periods indicated:
| | | | | | | | | | | | | | | | | | | | |
| Years ended December 31, | | 2024 | | 2023 | | 2022 |
| | (In millions) |
| Net cash provided by (used in): | | | | | | |
| Operating activities | | $ | 163.4 | | | $ | 171.4 | | | $ | (25.5) | |
| Investing activities | | (37.1) | | | (20.0) | | | (24.6) | |
| Financing activities | | (41.9) | | | (151.9) | | | 51.5 | |
| (Decrease) increase in cash, cash equivalents and restricted cash | | 84.4 | | | (0.5) | | | 1.4 | |
| Cash, cash equivalents and restricted cash - beginning of year | | 1.6 | | | 2.1 | | | 0.7 | |
| Cash, cash equivalents and restricted cash - end of year | | $ | 86.0 | | | $ | 1.6 | | | $ | 2.1 | |
Operating Activities
Cash provided by operating activities totaled $163.4 million in 2024, compared to $171.4 million in 2023 for a decrease of $8.0 million. The change in cash provided by operating activities was the result of increased earnings, and changes in working capital components which resulted in a use of $3.4 million in 2024, compared to an increase of $19.3 million in 2023. The working capital changes were primarily driven by project timing, workload activity and billing fluctuations, with a decrease in cash from changes in accounts receivable of $169.3 million, partially offset by increases in cash from changes in contract liabilities, net, accounts payable, other current liabilities and contract assets, net of $51.5 million, $36.1 million, $27.7 million and $22.3 million, respectively.
Cash provided by operating activities totaled $171.4 million in 2023, compared to cash used in operating activities of $25.5 million in 2022 for an increase of $196.9 million. The change in cash was the result of increased earnings, and changes in working capital components which resulted in an increase of $19.3 million in 2023, compared to a use of $169.0 million in 2022. This change was driven largely by project timing, workload activity and billing fluctuations, with increases in cash from changes in accounts receivable and contract assets, net of $172.1 million and $108.5 million, respectively, partially offset by a decrease in cash from changes in accounts payable of $88.3 million.
Investing Activities
Cash used in investing activities totaled $37.1 million in 2024, compared to $20.0 million in 2023, an increase of $17.1 million in cash used for investing activities. The increase in cash used for investing activities was primarily due to higher capital expenditures of $12.7 million and lower proceeds from the sale of property of $2.5 million.
Cash used in investing activities totaled $20.0 million in 2023, compared to $24.6 million in 2022. The decrease in cash used was primarily due to higher proceeds from the sale of property of $4.9 million.
Financing Activities
Cash used in financing activities totaled $41.9 million in 2024, compared to $151.9 million in 2023, a decrease of $110.0 million in cash used for financing activities. The decrease in cash used for financing activities was primarily the result of net proceeds from the $300.0 million term loan and $72.0 million of repayments of short- and long-term related-party notes payable during 2023, partially offset by higher net cash outflows of $157.9 million from the related-party cash management program, and higher cash outflows of $109.7 million for transfers to Centennial and MDU Resources.
Cash used in financing activities totaled $151.9 million in 2023, compared to cash provided by financing activities of $51.5 million in 2022. The increase in cash used in financing activities was largely the result of higher net cash outflows of $141.7 million from the related-party cash management program, repayments of $72.0 million of long- and short-term related-party notes payable in 2023, versus the cash inflow from the issuance of short-term related-party notes payable in 2022. These decreases were partially offset by a decrease in cash outflows from transfers to Centennial of $37.2 million.
Material Cash Requirements
As of December 31, 2024, the Company’s material cash requirements were as follows:
| | | | | | | | | | | | | | | | | | | | | | | | | | | | | |
| Less than 1 year | | 1-3 years | | 3-5 years | | More than 5 years | | Total |
| (In millions) |
| Long-term debt maturities* | $ | 15.0 | | | $ | 30.0 | | | $ | 255.0 | | | $ | — | | | $ | 300.0 | |
| Estimated interest payments** | 20.4 | | | 37.7 | | | 30.9 | | | — | | | 89.0 | |
| Operating leases | $ | 29.2 | | | $ | 32.5 | | | $ | 9.0 | | | $ | 3.1 | | | $ | 73.8 | |
__________________
*Unamortized debt issuance costs are excluded from the table.
** Represents the estimated interest payments associated with our long-term debt outstanding and associated unused commitment fees on the Revolving Credit Facility as of December 31, 2024, assuming current interest rates and consistent amounts outstanding until their respective maturity dates over the periods indicated in the table above.
In the normal course of business, we enter into agreements, contracts and commitments that oblige us to make payments in the future. Information regarding our obligations under long-term debt and lease arrangements are provided in Note 7 – Debt and Note 8 – Leases, respectively, in the audited consolidated financial statements contained elsewhere in this Annual Report.
In addition, we participate in certain multiemployer defined benefit pension plans. We cannot reasonably estimate future payments for our obligation to these plans, which are dependent on a number of factors. Refer to Note 13 – Employee Benefit Plans in the audited consolidated financial statements contained elsewhere in this Annual Report.
Off-Balance Sheet Arrangements
As is common in our industry we have entered into certain off-balance sheet arrangements in the ordinary course of business that result in risks not directly reflected on our balance sheet. Our significant off-balance sheet transactions include surety guarantees, letters of credit obligations, performance guarantees and firm purchase commitments for maintenance items, materials and lease obligations.
Some of our customers require us to post performance bonds issued by a surety. Those bonds guarantee the customer that we will perform under the terms of a contract. In the event that we fail to perform under a contract, the customer may demand the surety to pay or perform under our bond. Surety bonds expire at various times ranging from final completion of a project to a period extending beyond contract completion in certain circumstances. Such amounts also can fluctuate from period to period based upon the mix and level of our bonded operating activity. Our relationship with our sureties is such that we will indemnify the sureties for any expenses they incur in connection with any of the bonds they issue on our behalf.
As of December 31, 2024 and 2023, we had approximately $2.05 billion and $1.56 billion in original face amount surety bonds outstanding for projects, respectively. As of December 31, 2024 and 2023, approximately $1.75 billion and $1.33 billion of bonding was posted for E&M, respectively, and approximately $296.3 million and $224.0 million of bonding was posted for T&D, respectively. In addition, approximately $8.2 million of bonding was posted for Corporate and other as of December 31, 2024. These amounts were not reflected on the audited consolidated balance sheets as of December 31, 2024 and 2023. As of
December 31, 2024 and 2023, the maximum potential amount of payments the Company would be required to make under the outstanding surety bonds was $717.0 million and $299.9 million, respectively.
To date, we are not aware of any losses in connection with surety bonds that have been posted on our behalf, and we do not expect to incur significant losses in the foreseeable future. If we experience changes in our bonding relationships or if there are adverse changes in the surety industry, there would be no assurance that we would be able to effectuate alternatives to providing surety bonds to our customers or to obtain, on favorable terms, sufficient additional work that does not require surety bonds. Accordingly, a reduction in the availability of surety bonds could have a material adverse effect on our financial position, financial results, and cash flows.
We also guarantee obligations of our subsidiaries under certain contracts. Generally, we are liable under such an arrangement only if our subsidiary fails to perform its obligations under the contract. As of December 31, 2024 and 2023, the fixed maximum amounts guaranteed under these agreements aggregated $542.7 million and $341.4 million, respectively. Historically, we have not incurred any substantial liabilities as a consequence of these guarantees. However, in the event of default under these guaranteed obligations, the Company would be required to make payments to satisfy its guarantees.
In addition, some of our customers and vendors may require us to post letters of credit as a means of guaranteeing performance under our contracts and ensuring payment by us to subcontractors and vendors. If our customer has reasonable cause to effect payment under a letter of credit, we would be required to reimburse our creditor for the letter of credit and we may be required to record a charge to earnings for the reimbursement. As of December 31, 2024 and 2023, the fixed maximum amounts guaranteed under these letters of credit aggregated $2.2 million and $0.2 million, respectively, all of which expire within the next 12 months. In the event of default under these letter-of-credit obligations, we would be obligated for reimbursement of payments made under the letters of credit. We believe it is unlikely that any material claims will be made under these letters of credit.
Also, as previously mentioned, there were $15.6 million of outstanding standby letters of credit under our Revolving Credit Facility as of December 31, 2024.
Furthermore, we have issued guarantees to third parties related to the routine purchase of maintenance items, materials and lease obligations for which no fixed maximum amounts have been specified and these guarantees have no scheduled maturity date. In the event we default under these obligations, we would be required to make payments to satisfy these guarantees.
We do not have any other material financial guarantees or off-balance sheet arrangements other than those disclosed herein. For more information on the circumstances regarding our off-balance sheet arrangements, refer to Note 14 – Commitments, Contingencies and Guarantees in the audited consolidated financial statements contained elsewhere in this Annual Report.
Recently Issued Accounting Pronouncements
For a discussion of recently issued accounting standards, refer to Note 2 – Basis of Presentation and Summary of Significant Accounting Policies in the audited consolidated financial statements contained elsewhere in this Annual Report.
Critical Accounting Estimates
We have prepared our audited consolidated financial statements in conformity with GAAP. The preparation of our audited consolidated financial statements requires management to make estimates and assumptions that affect the reported amounts of assets and liabilities, and disclosure of contingent assets and liabilities, at the date of the financial statements, as well as the reported amounts of revenues and expenses during the reporting periods. Management reviews these estimates and assumptions based on historical experience, changes in business conditions and other relevant factors believed to be reasonable under the circumstances.
Critical accounting estimates are defined as estimates that require management to make assumptions about matters that are uncertain at the time the estimate was made, and changes in the estimates could have a material impact on our financial position or results of operations. Our critical accounting estimates are subject to judgments and uncertainties that affect the application of our significant accounting policies. As additional information becomes available, or actual amounts are determinable, the recorded estimates are revised. Consequently, our financial position or results of operations may be materially different when reported under varying conditions or when using different assumptions in the application of the following critical accounting estimates. For more information, refer to Note 2 – Basis of Presentation and Summary of Significant Accounting Policies in the audited consolidated financial statements contained elsewhere in this Annual Report.
Revenue Recognition
Revenue is recognized to depict the transfer of promised goods or services to customers in an amount that reflects the consideration to which the entity expects to be entitled in exchange for those goods or services. The recognition of revenue requires us to make estimates and assumptions that affect the reported amounts of revenue. The accuracy of revenues reported on the audited consolidated financial statements depends on, among other things, our estimates of total costs to complete projects because we use the cost-to-cost measure of progress on construction contracts for revenue recognition.
To determine the proper revenue recognition method for contracts, we evaluate whether two or more contracts should be combined and accounted for as one single contract and whether the combined or single contract should be accounted for as more than one performance obligation. This evaluation requires significant judgment and the decision to combine a group of contracts or separate the combined or single contract into multiple performance obligations could change the amount of revenue and profit recorded in a given period. For most contracts, the customer contracts to provide a significant service of integrating a complex set of tasks and components into a single project. Hence, our contracts are generally accounted for as one performance obligation.
We recognize construction contract revenue over time using an input method based on the cost-to-cost measure of progress for contracts because it best depicts the transfer of assets to the customer which occurs as we incur costs on the contract. Under the cost-to-cost measure of progress, the costs incurred are compared with total estimated costs of a performance obligation. Revenues are recorded proportionately to the costs incurred. This method depends largely on the ability to make reasonably dependable estimates related to the extent of progress toward completion of the contract, contract revenues and contract costs. Since contract prices are generally set before the work is performed, the estimates pertaining to every project could contain significant unknown risks such as volatile labor, material and fuel costs, weather delays, adverse project site conditions, unforeseen actions by regulatory agencies, performance by subcontractors, job management and relations with project owners. Changes in estimates could have a material effect on our results of operations, financial position and cash flows.
For the years ended December 31, 2024, 2023 and 2022, we recognized a net increase in revenues of $117.5 million, $116.3 million and $127.3 million, respectively, related to previously recognized deferred revenues that were included in Contract liabilities as of December 31, 2023, 2022 and 2021, respectively. For the years ended December 31, 2024, 2023 and 2022, we recognized a net increase in revenues of $83.4 million, $45.7 million and $46.9 million, respectively, from performance obligations satisfied in prior periods.
Several factors are evaluated in determining the bid price for contract work. These include, but are not limited to, the complexities of the job, past history performing similar types of work, seasonal weather patterns, competition and market conditions, job site conditions, work force safety, reputation of the project owner, availability of labor, materials and fuel, project location and project completion dates. As a project commences, estimates are continually monitored and revised as information becomes available and actual costs and conditions surrounding the job become known. If a loss is anticipated on a contract, the loss is immediately recognized.
Contracts are often modified to account for changes in contract specifications and requirements. We consider contract modifications to exist when the modification either creates new or changes the existing enforceable rights and obligations. Generally, contract modifications are for goods or services that are not distinct from the existing contract due to the significant integration of services provided in the context of the contract and are accounted for as if they were part of that existing contract. The effect of a contract modification on the transaction price and the measure of progress for the performance obligation to which it relates is recognized as an adjustment to revenue on a cumulative catch-up basis.
Our construction contracts generally contain variable consideration including liquidated damages, performance bonuses or incentives, claims, unpriced change orders and penalties or index pricing. The variable amounts usually arise upon achievement of certain performance metrics or change in project scope. We estimate the amount of revenue to be recognized on variable consideration using one of the two prescribed estimation methods, the expected value method or the most likely amount method, depending on which method best predicts the most likely amount of consideration we expect to be entitled to or expect to incur.
Assumptions as to the occurrence of future events and the likelihood and amount of variable consideration are made during the contract performance period. Estimates of variable consideration and assessment of anticipated performance and all information (historical, current and forecasted) that is reasonably available to management. We only include variable consideration in the estimated transaction price to the extent it is probable that a significant reversal of cumulative revenue recognized will not occur or when the uncertainty associated with the variable consideration is resolved.
Changes in circumstances could impact our estimates made in determining the value of variable consideration recorded. When determining if the variable consideration is constrained, we consider if factors exist that could increase the likelihood of the magnitude of a potential reversal of revenue. We update our estimate of the transaction price each reporting period and the effect of variable consideration on the transaction price is recognized as an adjustment to revenue on a cumulative catch-up basis.
Changes in cost estimates on certain contracts may result in the issuance of change orders, which can be approved or unapproved by the customer, or the assertion of contract claims. A contract claim is an amount in excess of agreed upon contract prices that we seek to collect from our customers or others for customer-caused delays, errors in specifications and designs, contract terminations, change orders that are either in dispute or are unapproved as to both scope and price, or other causes of unanticipated additional contract costs. Claims and change orders are evaluated individually and measured based on our historical experience with individual customers and similar contracts. We recognize the associated revenue if it is probable that the contract price will be adjusted and the amount of any such adjustment can be reasonably estimated based upon our evaluation of the contract terms and the extent to which we performed in accordance therewith.
Change orders and claims are negotiated in the normal course of business and represent management’s estimates of additional contract revenues that have been earned and are probable of collection. To support these requirements, the existence of the following items must be satisfied: (i) the contract or other evidence provides a legal basis for the claim or a legal opinion has been obtained, stating that, under the circumstances, there is a reasonable basis to support the claim; (ii) additional costs are caused by circumstances that were unforeseen at the contract date and are not the result of deficiencies in our performance; (iii) costs associated with the claim are identifiable or otherwise determinable and are reasonable in view of the work performed; and (iv) the evidence supporting the claim is objective and verifiable, not based on management’s subjective evaluation of the situation or on unsupported representations.
As of December 31, 2024 and 2023, $56.2 million and $57.3 million, respectively, of unexecuted change orders were included in contract transaction price and in Contract assets on the audited consolidated balance sheets. We were in the process of negotiating execution of these change orders in the normal course of business and the recognized amounts represent our best estimates of additional contract revenues for which it is not probable that a significant reversal of the revenue amounts will occur in the future.
Revenues in excess of contract costs incurred on claims are recognized when an agreement is reached with the customer as to the value of the claim, which, in some instances, may not occur until after completion of work under the contract. As of December 31, 2024 and 2023, in the normal course of business, the Company had additional priced work not approved by the customer to begin project work of approximately $265.3 million and $187.4 million, respectively, with minimal costs incurred. These amounts were excluded from contract transaction price. In addition, claim positions of $54.9 million and $42.7 million were excluded from the contract transaction price as of December 31, 2024 and 2023, respectively. We continue to evaluate these claims.
As of December 31, 2024 and 2023, the Company recorded loss provisions of $1.0 million and $1.5 million, respectively, in Contract liabilities on the audited consolidated balance sheets related to these contracts that is still being completed and remains recorded.
We received notification in October 2023 from a customer on a large project with a contract that was billed on a time and materials basis with no stated maximum price, that it is withholding payment of approximately $31.3 million on remaining outstanding billings, including retention. We believe we have substantial defenses against these claims based upon the terms of the contract and we have performed under the terms of the contract. Therefore, we believe collection of the remaining outstanding billings, including retention, is probable and, as a result, we have recognized the revenue from this project in our results. However, there is uncertainty surrounding this matter, including the potential long-term nature of dispute resolution, filing a lien on the property and the broad range of possible consideration amounts as a result of negotiations and potential litigation to resolve the dispute.
We believe our estimates surrounding the cost-to-cost method are reasonable based on the information that is known when the estimates are made. We have contract administration, accounting and management control systems in place that allow our estimates to be updated and monitored on a regular basis. Because of the many factors that are evaluated in determining bid prices, it is inherent that our estimates have changed in the past and will continually change in the future as new information becomes available for each job.
Receivables and Allowance for Expected Credit Losses
Receivables consist primarily of trade receivables from the sale of goods and services net of expected credit losses.
Our expected credit losses are determined using historical credit loss experience, changes in asset-specific characteristics, current conditions, and reasonable and supportable future forecasts, among other specific account data. A review of our expected credit losses is performed at least quarterly. We are exposed to potential credit risk and other risk characteristics, including but not limited to, customer mix, knowledge of customers and general economic conditions of the various local economies, among others. If economic conditions or customer conditions deteriorate, we could experience an increase in our allowance for expected credit losses. Then, if management determines specific account balances are uncollectible, those receivable balances are written off. The year-to-date change in the credit loss provisions were due to outstanding receivable balances being collected that had been reserved for due to changes in economic factors related to certain customer accounts.
Goodwill
We perform our goodwill impairment testing annually in the fourth quarter. In addition, the test is performed on an interim basis whenever events or circumstances indicate that the carrying amount of goodwill may not be recoverable. Examples of such events or circumstances may include a significant adverse change in business climate, weakness in an industry in which our reporting units operate or recent significant cash or operating losses with expectations that those losses will continue.
We determined that the reporting units for our goodwill impairment test were our operating segments, or components of an operating segment, that constitute a business for which discrete financial information is available and for which segment management regularly reviews the operating results. As such, our reporting units were Electrical & Mechanical, Transmission & Distribution, and Wagner Smith Equipment (“WSE”). Goodwill impairment, if any, is measured by comparing the fair value of each reporting unit to its carrying value. If the fair value of a reporting unit exceeds its carrying value, the goodwill of the reporting unit is not impaired. If the carrying value of a reporting unit exceeds its fair value, we must record a goodwill impairment loss for the amount that the carrying value of the reporting unit, including goodwill, exceeds the fair value of the reporting unit. For the years ended December 31, 2024, 2023 and 2022, there were no goodwill impairment losses recorded. At October 31, 2024, the fair value substantially exceeded the carrying value for all reporting units.
Determining the fair value of a reporting unit requires judgment and the use of significant estimates which include assumptions about our future revenue, profitability and cash flows, long-term growth rates, amount and timing of estimated capital expenditures, inflation rates, risk adjusted cost of capital, operational plans, and current and future economic conditions, among others. Prior to the Separation under MDU Resources, for 2023 and 2022, the fair value of each reporting unit was determined using a weighted combination of income and market approaches. Following the Separation as a standalone company, for 2024, the fair value of each reporting unit was determined using an income approach. We believe that the estimates and assumptions used in our goodwill impairment assessments are reasonable and based on available market information.
We used a discounted cash flow methodology for our income approach. Under the income approach, the discounted cash flow model determined fair value based on the present value of projected cash flows over a specified period and a residual value related to future cash flows beyond the projection period. Both values were discounted using a rate which reflected the best estimate of the risk adjusted cost of capital at each reporting unit. The risk adjusted cost of capital was 7.9 percent, 9.3 percent and 9.2 percent for the goodwill impairment tests performed in 2024, 2023 and 2022, respectively.
Under the market approach, we estimated fair value using various multiples derived from enterprise value to EBITDA for comparative peer companies. These multiples were applied to operating data for each reporting unit to arrive at an indication of fair value. We added a reasonable control premium when calculating the fair value utilizing peer multiples, which was estimated as the premium that would be received in a sale in an orderly transaction between market participants. We used a 20.0 percent control premium for the goodwill impairment tests performed in 2023 and 2022, respectively.
We used significant judgment in estimating our five-year forecast. The assumptions underlying cash flow projections were in sync as applicable with our strategy and assumptions. Future projections were heavily correlated with the results of operations of the current year. Future results of operations may vary due to economic and financial impacts. The long-term growth rates were developed by management based on industry data, management’s knowledge of the industry and management’s strategic plans. The long-term growth rate used for the goodwill impairment tests was 3.0 percent in 2024, 2023 and 2022, respectively.
Insurance
We entered into an insurance arrangement in anticipation of the Separation. The insurance arrangement is subject to applicable insurance rules and regulations, and insures our exposure related to workers’ compensation, general liability and automobile liability on a primary basis. These policies are subject to certain self-insured limits up to $5.0 million. In connection with the Separation, MDU Resources transferred assets and liabilities to us that represented our portion of the MDU Resources insurance captive program.
We also purchase excess coverage from unrelated insurance carriers and obtain third-party coverage for other forms of insurance including, but not limited to, excess liability, contractors pollution liability, directors and officers liability and employment practices liability. These policies are subject to certain deductible thresholds up to $1.5 million.
For certain health benefit plans, we carry insurance policies that are subject to stop-loss limits of up to $1.0 million, for qualified individuals. Potential losses up to the deductible for each line of coverage and stop-loss amounts are accrued based on estimates of the expected liability that will be paid for known or reported claims and an estimate for claims incurred but not yet reported. The insurance claims and accruals are based on historical trends, actuarial estimates and known facts.
Income Tax
We recognize deferred federal and state income taxes on all temporary differences between the book and tax basis of our assets and liabilities by using enacted tax rates in effect for the year in which the differences are expected to reverse. Such assets and liabilities arise because of temporary differences between the financial reporting and tax bases of assets and liabilities, as well as from net operating loss. We evaluate the recoverability of these future tax deductions by assessing the adequacy of future expected taxable income from all sources, including reversal of taxable temporary differences, forecasted operating earnings, and available tax planning strategies. These sources of income rely heavily on estimates; we use our historical experience as well as our short- and long-range business forecasts to provide insight.
Valuation allowances are recorded to reduce the deferred tax assets to an amount that will more-likely-than-not be realized. In making such determinations, we consider all available evidence, including recent financial operations, projected future taxable income, scheduled reversals of deferred tax liabilities, tax planning strategies, and the length of tax asset carryforward periods. The realization of deferred tax assets is primarily dependent on our ability to generate sufficient future taxable earnings in certain jurisdictions.
If circumstances related to our deferred tax assets change in the future, we may be required to increase or decrease the valuation allowance on these assets, resulting in an increase or decrease in income tax expense and a reduction or increase in net income.
Our income tax provisions are based on calculations and assumptions that are subject to examination by U.S. federal and state tax authorities. Our provision for income taxes is subject to volatility and could be favorably or adversely affected by changes in the valuation of deferred tax assets and liabilities, expiration of or lapses in tax-related legislation and incentives, tax effects of nondeductible compensation, changes in accounting principles or by changes in tax laws and regulations.
We record uncertain tax positions in accordance with accounting guidance on accounting for income taxes on the basis of a two-step process in which (i) we determine whether it is more-likely-than-not that the tax position will be sustained on the basis of the technical merits of the position and (ii) for those tax positions that meet the more-likely-than-not recognition threshold, we recognize the largest amount of the tax benefit that is more than 50 percent likely to be realized upon ultimate settlement with the related tax authority.
Our policy is to adjust these reserves when facts and circumstances change, such as the settlement or effective settlement of positions with the relevant taxing authorities. We have provided for the amounts we believe will ultimately result from these changes; however, due to the complexity of some of these uncertainties, the ultimate resolution may result in a payment that is materially different from our current estimate of the tax liabilities. Such differences will be reflected as increases or decreases to income tax expense in the period in which they are determined.
Item 7A. Quantitative and Qualitative Disclosures About Market Risk
We are exposed to market risks in the ordinary course of our business, including the effects of interest rate changes, commodity price risk and inflation. Information relating to quantitative and qualitative disclosures about these market risks is set forth below. For more information on our risk factors, including market risk factors, that could be materially harmful to our
business, prospects, financial condition and/or results of operations if they occur, please refer to Item 1A. Risk Factors contained elsewhere in this Annual Report.
Interest Rate Risk
The primary objective of our investment activities is to maintain cash reserves to meet captive insurance obligations, employee compensation and benefit obligations and contractual obligations. A mismatch between the duration of liabilities and the duration of investments could expose us to interest rate risk. If interest rates fluctuate, the value of assets may not adequately cover liabilities. And if our investments mature during a period of lower interest rates, we may face reinvestment risk and potentially earn less income on reinvested funds. We will continue to evaluate our investments in order to ensure that we continue to meet our overall objectives. As part of the Separation, we have our own captive insurance arrangement in order to manage our casualty and operational risk.
We are exposed to interest rate volatility with regard to our long-term debt obligations, which bear interest at variable rates. As of December 31, 2024, we had $300.0 million outstanding under the Term Loan and no outstanding balances under the Revolving Credit Facility. Outstanding amounts, if any, for the Term Loan and Revolving Credit Facility both bear interest at Term SOFR plus an applicable rate exposing us to higher interest rate risk. As of December 31, 2024, the interest rates were 6.84% for the Term Loan and 6.94% for the Revolving Credit Facility. Therefore, a 1% increase to the variable interest rates would have increased the rates to 7.84% and 7.94%, respectively. The increase in interest rates would increase our Interest expense by approximately $3.0 million over the next 12 months based on the balances outstanding for these borrowings as of December 31, 2024. Going forward, the level of our interest rate risk will depend on our utilization of the Revolving Credit Facility and will be sensitive to changes in the general level of interest rates.
Commodity Price and Inflation Risk
Our operations are affected by fluctuations in commodity prices whether caused by inflation, imposed and proposed tariffs, or other economic factors. These fluctuations in commodity prices generally affect us by increasing transportation and construction costs due to higher fuel or material and/or supply prices including, but not limited to prices for copper, aluminum, steel, electrical components and certain plastics.
In addition, the cost of labor may increase due to similar factors mentioned above, such as inflation or other economic factors. While we do not believe that these factors have had a material effect on our business, financial condition, or financial results for the periods included in our audited consolidated financial statements, we continue to monitor the impact of such factors in order to minimize their effects through our pricing strategies, productivity improvements and cost reductions. If our costs were to become subject to significant economic and/or inflationary pressures, we may not be able to fully offset such higher costs through price increases. Our inability or failure to do so could harm our business, financial condition and financial results.
EVERUS CONSTRUCTION GROUP, INC. AND SUBSIDIARIES
Item 8. Financial Statements and Supplementary Data
Index to Audited Consolidated Financial Statements
REPORT OF INDEPENDENT REGISTERED PUBLIC ACCOUNTING FIRM
To the Stockholders and the Board of Directors of Everus Construction Group, Inc.
Opinion on the Financial Statements
We have audited the accompanying consolidated balance sheets of Everus Construction Group, Inc. and subsidiaries (the “Company”) as of December 31, 2024 and 2023, the related consolidated statements of income, comprehensive income, equity, and cash flows for each of the three years in the period ended December 31, 2024, and the related notes and the schedules listed in the Index at Item 15 (collectively referred to as the “financial statements”). In our opinion, the financial statements present fairly, in all material respects, the financial position of the Company as of December 31, 2024 and 2023, and the results of its operations and its cash flows for each of the three years in the period ended December 31, 2024, in conformity with accounting principles generally accepted in the United States of America.
Basis for Opinion
These financial statements are the responsibility of the Company’s management. Our responsibility is to express an opinion on the Company’s financial statements based on our audits. We are a public accounting firm registered with the Public Company Accounting Oversight Board (United States) (PCAOB) and are required to be independent with respect to the Company in accordance with the U.S. federal securities laws and the applicable rules and regulations of the Securities and Exchange Commission and the PCAOB.
We conducted our audits in accordance with the standards of the PCAOB. Those standards require that we plan and perform the audit to obtain reasonable assurance about whether the financial statements are free of material misstatement, whether due to error or fraud. The Company is not required to have, nor were we engaged to perform, an audit of its internal control over financial reporting. As part of our audits, we are required to obtain an understanding of internal control over financial reporting but not for the purpose of expressing an opinion on the effectiveness of the Company’s internal control over financial reporting. Accordingly, we express no such opinion.
Our audits included performing procedures to assess the risks of material misstatement of the financial statements, whether due to error or fraud, and performing procedures that respond to those risks. Such procedures included examining, on a test basis, evidence regarding the amounts and disclosures in the financial statements. Our audits also included evaluating the accounting principles used and significant estimates made by management, as well as evaluating the overall presentation of the financial statements. We believe that our audits provide a reasonable basis for our opinion.
Critical Audit Matter
The critical audit matter communicated below is a matter arising from the current-period audit of the financial statements that was communicated or required to be communicated to the audit committee and that (1) relates to accounts or disclosures that are material to the financial statements and (2) involved our especially challenging, subjective, or complex judgments. The communication of critical audit matters does not alter in any way our opinion on the financial statements, taken as a whole, and we are not, by communicating the critical audit matter below, providing a separate opinion on the critical audit matter or on the accounts or disclosures to which it relates.
Revenue from Contracts with Customers—Construction Contract Revenue—Refer to Notes 2 and 3 to the financial statements
Critical Audit Matter Description
The Company recognizes certain construction contract revenue over time using an input method based on the ratio of incurred costs to total estimated costs of the performance obligation (the cost-to-cost method) when this method was determined to best depict the transfer of the related performance obligation to the customer. This method depends largely on the ability of management to make reasonably dependable estimates related to the extent of progress toward completion of the contract and the contract’s transaction price, which estimates involve management’s judgment. Assumptions as to the occurrence of future events and the likelihood and amount of variable consideration, including liquidated damages, performance bonuses or incentives, claims, unpriced change orders and penalties or index pricing are made during the contract performance period. The Company estimates variable consideration at the most likely amount it expects to be entitled and included those estimated amounts in the transaction price to the extent it was probable that a significant reversal of cumulative revenue recognized will not occur when the uncertainty associated with the variable consideration is resolved.
Given the judgments necessary to account for the Company’s construction contracts including the use of estimates to determine the transaction price and total costs for the performance obligations which are used to recognize revenue for construction contracts, auditing such estimates required extensive audit effort due to the volume and complexity of construction contracts and a high degree of auditor judgment when performing audit procedures and evaluating the results of those procedures.
How the Critical Audit Matter Was Addressed in the Audit
Our audit procedures related to management’s estimates of the transaction price and total costs for the performance obligations used to recognize revenue for construction contracts included the following, among others:
•We developed an expectation of the amount of construction contract revenues for certain performance obligations based on prior year markups, and taking into account current year events, applied to the construction contract costs in the current year and compared our expectation to the amount of construction contract revenues recorded by management.
•We selected a sample of construction contracts and performed the following:
◦Evaluated whether the contracts were properly included in management’s calculation of construction contract revenue based on the terms and conditions of each contract, including whether continuous transfer of control to the customer occurred as progress was made toward fulfilling the performance obligation.
◦Observed the work sites and inspected the progress toward completion for certain construction contracts.
◦Compared the transaction prices, including estimated variable consideration, to the consideration expected to be received based on current rights and obligations under the contracts and any modifications that were agreed upon with the customers.
◦Confirmed the transaction prices with the customer.
◦Evaluated management’s identification of distinct performance obligations by evaluating whether the underlying goods and services were highly interdependent and interrelated.
◦Tested the accuracy and occurrence of the costs incurred to date for the performance obligation.
◦Evaluated the reasonableness of the estimated variable consideration in the contract revenue by evaluating the information supporting management’s judgement as to their estimate of the most likely amount it expects to receive without a significant reversal of cumulative revenue occurring when the uncertainty associated with the variable consideration is resolved.
◦Evaluated the estimates of total cost for the performance obligation by:
–Evaluating management’s ability to achieve the estimates of total cost and profit by performing corroborating inquiries with the Company’s project managers and engineers, and comparing the estimates to management’s work plans, engineering specifications, and/or supplier contracts for certain selected contracts.
–Comparing management’s estimates for the selected contracts to costs and profits of similar performance obligations, when applicable.
◦Tested the mathematical accuracy of management’s calculation of construction contract revenue for the performance obligation for certain selected contracts.
•We evaluated management’s ability to estimate total costs and profits accurately by comparing actual costs and profits to management’s historical estimates for performance obligations that have been fulfilled.
/s/ Deloitte & Touche LLP
Minneapolis, Minnesota
February 28, 2025
We have served as the Company’s auditor since 2023.
EVERUS CONSTRUCTION GROUP, INC.
Everus Construction Group, Inc.
Consolidated Statements of Income
| | | | | | | | | | | | | | | | | |
| Years ended December 31, | 2024 | | 2023 | | 2022 |
| (In thousands, except per share amounts) |
| Operating revenues | $ | 2,849,685 | | | $ | 2,854,390 | | | $ | 2,699,250 | |
| Cost of sales | 2,510,234 | | | 2,532,472 | | | 2,423,204 | |
| Gross profit | 339,451 | | | 321,918 | | | 276,046 | |
| Selling, general and administrative expenses | 149,544 | | | 131,375 | | | 111,402 | |
| Operating income | 189,907 | | | 190,543 | | | 164,644 | |
| Interest expense | 14,023 | | | 16,954 | | | 6,354 | |
| Other income | 4,875 | | | 3,981 | | | 1,379 | |
| Income before income taxes and income from equity method investments | 180,759 | | | 177,570 | | | 159,669 | |
| Income taxes | 49,523 | | | 45,286 | | | 40,788 | |
| Income from equity method investments | 12,185 | | | 4,946 | | | 5,900 | |
| Net income | $ | 143,421 | | | $ | 137,230 | | | $ | 124,781 | |
| | | | | |
| Earnings per share: | | | | | |
| Basic | $ | 2.81 | | | $ | 2.69 | | | $ | 2.45 | |
| Diluted | $ | 2.81 | | | $ | 2.69 | | | $ | 2.45 | |
| Weighted average common shares outstanding: | | | | |
| Basic | 50,973 | | | 50,972 | | | 50,972 | |
| Diluted | 51,072 | | | 50,972 | | | 50,972 | |
The accompanying notes are an integral part of these consolidated financial statements.
EVERUS CONSTRUCTION GROUP, INC.
Everus Construction Group, Inc.
Consolidated Statements of Comprehensive Income
| | | | | | | | | | | | | | | | | |
| Years ended December 31, | 2024 | | 2023 | | 2022 |
| (In thousands) |
| Net income | $ | 143,421 | | | $ | 137,230 | | | $ | 124,781 | |
| Other comprehensive income: | | | | | |
| Reclassification adjustment for loss on derivative instruments included in net income, net of tax benefit of $—, $1 and $70 in 2024, 2023 and 2022, respectively | — | | | 35 | | | 85 | |
| Other comprehensive income | — | | | 35 | | | 85 | |
| Comprehensive income attributable to common stockholders | $ | 143,421 | | | $ | 137,265 | | | $ | 124,866 | |
The accompanying notes are an integral part of these consolidated financial statements.
EVERUS CONSTRUCTION GROUP, INC.
Everus Construction Group, Inc.
Consolidated Balance Sheets
| | | | | | | | | | | |
| As of December 31, | 2024 | | 2023 |
| Assets | (In thousands, except share and per share amounts) |
| Current assets: | | | |
| Cash, cash equivalents and restricted cash | $ | 86,012 | | | $ | 1,567 | |
| Receivables, net of allowances of $7,097 and $7,967, respectively | 590,028 | | | 449,626 | |
| Contract assets, net | 167,049 | | | 206,235 | |
| Due from related-party | — | | | 11,507 | |
| Inventories | 43,750 | | | 42,709 | |
| | | |
| Prepayments and other current assets | 30,390 | | | 17,651 | |
| Total current assets | 917,229 | | | 729,295 | |
| Noncurrent assets: | | | |
| | | |
| | | |
| Property, plant and equipment, net of accumulated depreciation of $157,278 and $143,831, respectively | 134,409 | | | 116,018 | |
| Goodwill | 143,224 | | | 143,224 | |
| Other intangible assets, net of accumulated amortization of $10,334 and $8,738, respectively | 116 | | | 2,004 | |
| Operating lease right-of-use assets | 67,045 | | | 53,233 | |
| | | |
| | | |
| Investments | 21,286 | | | 8,413 | |
| Other | 5,154 | | | 272 | |
| Total noncurrent assets | 371,234 | | | 323,164 | |
| Total assets | $ | 1,288,463 | | | $ | 1,052,459 | |
| Liabilities and Stockholders’ Equity | | | |
| Current liabilities: | | | |
| Current portion of long-term debt | $ | 15,000 | | | $ | — | |
| Contract liabilities, net | 207,304 | | | 140,108 | |
| Accounts payable | 138,097 | | | 116,573 | |
| Taxes payable | 6,768 | | | 8,557 | |
| Due to related-party | — | | | 14,615 | |
| Accrued compensation | 67,815 | | | 44,721 | |
| Current portion of operating lease liabilities | 26,354 | | | 21,143 | |
| Accrued payroll-related liabilities | 38,995 | | | 35,342 | |
| Other accrued liabilities | 13,037 | | | 13,001 | |
| Total current liabilities | 513,370 | | | 394,060 | |
| Noncurrent liabilities: | | | |
| Long-term debt | 280,648 | | | — | |
| Related-party notes payable | — | | | 168,531 | |
| Deferred income taxes | 8,161 | | | 6,535 | |
| Operating lease liabilities | 41,200 | | | 32,504 | |
| Other | 22,472 | | | 1,979 | |
| Total noncurrent liabilities | 352,481 | | | 209,549 | |
| Total liabilities | $ | 865,851 | | | $ | 603,609 | |
| Commitments and contingencies | | | |
| Common stockholders’ equity: | | | |
| Common stock, 300,000,000 shares authorized, $0.01 par value, 50,980,924 shares issued and outstanding at December 31, 2024; Common stock, stated value $1, no par value; 1,000 shares authorized, issued and outstanding at December 31, 2023 | $ | 510 | | | $ | 1 | |
| Other paid-in capital | 138,130 | | | 136,184 | |
| Retained earnings | 283,972 | | | 312,665 | |
| | | |
| Total stockholders’ equity | 422,612 | | | 448,850 | |
| Total liabilities and stockholders’ equity | $ | 1,288,463 | | | $ | 1,052,459 | |
The accompanying notes are an integral part of these consolidated financial statements
EVERUS CONSTRUCTION GROUP, INC.
Everus Construction Group, Inc.
Consolidated Statements of Equity
| | | | | | | | | | | | | | | | | | | | | | | | | | | | | | | | | | | |
| Years ended December 31, 2024, 2023 and 2022 | | | | | | | | |
| Common Stock | | | | | | Accumulated Other Comprehensive Loss | | |
| (In thousands, except shares) | Shares | | Amount | | Other Paid-in Capital | | Retained Earnings | | | Total |
| Balance as of January 1, 2022 | 1,000 | | | $ | 1 | | | $ | 136,033 | | | $ | 227,023 | | | $ | (120) | | | $ | 362,937 | |
| Net income | — | | | — | | | — | | | 124,781 | | | — | | | 124,781 | |
| Other comprehensive income | — | | | — | | | — | | | — | | | 85 | | | 85 | |
| Net transfers from (to) Centennial | — | | | — | | | 294 | | | (105,850) | | | — | | | (105,556) | |
| Balance as of December 31, 2022 | 1,000 | | | 1 | | | 136,327 | | | 245,954 | | | (35) | | | 382,247 | |
| Net income | — | | | — | | | — | | | 137,230 | | | — | | | 137,230 | |
| Other comprehensive income | — | | | — | | | — | | | — | | | 35 | | | 35 | |
| Net transfers to Centennial | — | | | — | | | (143) | | | (70,519) | | | — | | | (70,662) | |
| Balance as of December 31, 2023 | 1,000 | | | 1 | | | 136,184 | | | 312,665 | | | — | | | 448,850 | |
| Net income | — | | | — | | | — | | | 143,421 | | | — | | | 143,421 | |
| | | | | | | | | | | |
| Stock-based compensation | 8,865 | | | — | | | 2,047 | | | (575) | | | — | | | 1,472 | |
| Retirement of historical common stock in connection with the Separation | (1,000) | | | (1) | | | 1 | | | — | | | — | | | — | |
| Issuance of common stock in connection with the Separation | 50,972,059 | | | 510 | | | (510) | | | — | | | — | | | — | |
| | | | | | | | | | | |
| | | | | | | | | | | |
| Net transfers from (to) Centennial and MDU Resources including Separation adjustments | — | | | — | | | 408 | | | (171,539) | | | — | | | (171,131) | |
| Balance as of December 31, 2024 | 50,980,924 | | | $ | 510 | | | $ | 138,130 | | | $ | 283,972 | | | $ | — | | | $ | 422,612 | |
The accompanying notes are an integral part of these consolidated financial statements.
EVERUS CONSTRUCTION GROUP, INC.
Everus Construction Group, Inc.
Consolidated Statements of Cash Flows
| | | | | | | | | | | | | | | | | |
| Years ended December 31, | 2024 | | 2023 | | 2022 |
| (In thousands) |
| Operating activities: | | | | | |
| Net income | $ | 143,421 | | | $ | 137,230 | | | $ | 124,781 | |
| Adjustments to reconcile net income to net cash provided by (used in) operating activities: | | | | | |
| Depreciation | 23,384 | | | 21,051 | | | 19,220 | |
| Amortization of intangible assets | 1,888 | | | 2,097 | | | 2,249 | |
| Deferred income taxes | 1,626 | | | (3,105) | | | 1,060 | |
| Provision for credit losses | (56) | | | 6,202 | | | 186 | |
| Amortization of debt issuance costs | 263 | | | — | | | — | |
| Stock-based compensation costs | 1,559 | | | 804 | | | 1,068 | |
| Unrealized gain on investments | (585) | | | — | | | — | |
| Gain on sale of assets | (7,231) | | | (8,174) | | | (6,646) | |
| Equity in earnings of unconsolidated affiliates, net of distributions | (8,055) | | | (4,946) | | | (402) | |
| Changes in current assets and liabilities, net of acquisitions: | | | | | |
| Receivables | (140,345) | | | 28,944 | | | (143,115) | |
| Due from related-party | 11,507 | | | (489) | | | (296) | |
| Contract assets, net | 39,186 | | | 16,863 | | | (91,686) | |
| Inventories | (1,041) | | | (5,865) | | | (15,798) | |
| Other current assets | (12,814) | | | (4,390) | | | (5,486) | |
| Accounts payable | 14,296 | | | (21,782) | | | 66,469 | |
| Due to related-party | (2,135) | | | (2,803) | | | (3,140) | |
| Contract liabilities, net | 67,196 | | | 15,713 | | | 8,043 | |
| Other current liabilities | 20,728 | | | (6,933) | | | 15,992 | |
| Other noncurrent changes | 10,585 | | | 921 | | | 2,006 | |
| Net cash provided by (used in) operating activities | 163,377 | | | 171,338 | | | (25,495) | |
| Investing activities: | | | | | |
| Capital expenditures | (48,278) | | | (35,590) | | | (35,844) | |
| | | | | |
| Net proceeds from sale or disposition of property | 13,706 | | | 16,214 | | | 11,337 | |
| | | | | |
| Investments | (2,489) | | | (596) | | | (58) | |
| Net cash used in investing activities | (37,061) | | | (19,972) | | | (24,565) | |
| Financing activities: | | | | | |
| Issuance of related-party short-term notes payable | — | | | — | | | 27,000 | |
| Repayment of related-party long-term notes payable | — | | | (45,000) | | | — | |
| Repayment of related-party short-term notes payable | — | | | (27,000) | | | — | |
| Issuance of long-term debt | 300,000 | | | — | | | — | |
| | | | | |
| Proceeds under the credit facility | 40,000 | | | — | | | — | |
| Repayments under the credit facility | (40,000) | | | — | | | — | |
| Payment of debt issuance costs | (7,879) | | | — | | | — | |
| Contribution from MDU Resources | 13,531 | | | — | | | — | |
| Net amounts (paid to) received from related-party cash management program | (168,531) | | | (10,584) | | | 131,077 | |
| Transfers to Centennial and MDU Resources | (178,992) | | | (69,327) | | | (106,573) | |
| Net cash (used in) provided by financing activities | (41,871) | | | (151,911) | | | 51,504 | |
| Increase (Decrease) in cash, cash equivalents and restricted cash | 84,445 | | | (545) | | | 1,444 | |
| Cash, cash equivalents and restricted cash - beginning of year | 1,567 | | | 2,112 | | | 668 | |
| Cash, cash equivalents and restricted cash - end of year | $ | 86,012 | | | $ | 1,567 | | | $ | 2,112 | |
| Supplemental Cash Flow Information: | | | | | |
| Interest paid, net | $ | 14,800 | | | $ | 16,845 | | | $ | 5,748 | |
| Income taxes paid, net | $ | 50,207 | | | $ | 52,322 | | | $ | 33,201 | |
| Noncash investing activities: | | | | | |
| Purchases of property, plant and equipment included in accounts payable | $ | 421 | | | $ | 258 | | | $ | 751 | |
The accompanying notes are an integral part of these consolidated financial statements.
EVERUS CONSTRUCTION GROUP, INC.
Notes to the Consolidated Financial Statements
Note 1 – Background and Nature of Operations
Nature of Operations
Everus Construction Group, Inc. (the “Company” or “Everus”) is a leading construction solutions provider headquartered in Bismarck, North Dakota, offering specialty contracting services to a diverse set of end markets across the United States, which are provided to utilities and manufacturing, transportation, commercial, industrial, institutional, renewables and governmental customers. The Company operates throughout most of the United States through two operating segments, which represent its two reportable segments:
Electrical & Mechanical: Contracting services including construction and maintenance of electrical and communication wiring and infrastructure, fire suppression systems, and mechanical piping and services to customers in both the public and private sectors.
Transmission & Distribution: Contracting services including construction and maintenance of overhead and underground electrical, gas and communication infrastructure, as well as design, manufacturing and distribution of overhead and underground transmission line construction equipment and tools.
Separation from MDU Resources
On November 2, 2023, MDU Resources Group, Inc. (“MDU Resources” or “MDU”) announced its intent to pursue a tax-free spinoff of Everus Construction, Inc. (formerly known as MDU Construction Services Group, Inc.) (“Everus Construction”) from MDU Resources (the “Separation”). Prior to the Separation, Everus Construction was the construction services segment of MDU Resources and operated as a wholly owned subsidiary of CEHI, LLC (“Centennial”), which is a wholly owned subsidiary of MDU Resources. In anticipation of the Separation, MDU Resources formed a new wholly owned subsidiary, Everus Construction Group, Inc., that became the new parent company of Everus Construction.
On October 31, 2024, MDU Resources completed the Separation by transferring Everus Construction, inclusive of all its assets and liabilities, to Everus and distributing 50,972,059 shares of Everus common stock ($0.01 par value) to MDU Resources stockholders of record as of October 21, 2024 (the “Distribution”). The Distribution was structured as a pro rata distribution of one share of Everus common stock for every four shares of MDU Resources common stock (such ratio, the “Distribution Ratio”). MDU Resources did not distribute any fractional shares of Everus common stock to its stockholders as part of the Distribution. Instead, MDU Resources’ stockholders received cash in lieu of any fractional shares of Everus common stock that they would have received after application of the Distribution Ratio.
As a result of the Separation and Distribution, Everus is an independent publicly traded company and its common stock is listed under the ticker symbol “ECG” on the New York Stock Exchange. More information on the Separation and Distribution, as well as the Company's historical results, can be found within the Company's Registration Statement on Form 10 (“Form 10”), which is not incorporated by reference herein.
The Separation and Distribution was completed pursuant to a separation and distribution agreement as well as other agreements with MDU Resources, including, but not limited to, a transition services agreement, a tax matters agreement and an employee matters agreement. Refer to Note 15 – Related-Party Transactions for additional information on the transition services agreement. The Company incurred costs in establishing itself as an independent public entity and expects additional ongoing expenses related to its continued operations as such.
Note 2 – Basis of Presentation and Summary of Significant Accounting Policies
Basis of Presentation
Prior to the Separation, Everus Construction historically operated as a wholly owned subsidiary of Centennial and an indirect, wholly owned subsidiary of MDU Resources and not as a standalone company. For periods prior to the Separation, the accompanying consolidated financial statements and footnotes were prepared on a “carve-out” basis in connection with the Separation and were derived from the audited consolidated financial statements of MDU Resources as if the Company operated on a standalone basis during the periods presented. However, the consolidated financial statements do not necessarily reflect what the Company’s results of operations, financial position and cash flows would have been had it operated as a separate, publicly traded company for those periods presented and may not be indicative of its future performance.
EVERUS CONSTRUCTION GROUP, INC.
The accompanying consolidated financial statements were prepared in conformity with generally accepted accounting principles in the United States (“GAAP”). The consolidated financial statements include all adjustments that are, in the opinion of management, necessary for a fair presentation of the consolidated financial statements and are of a normal recurring nature. The consolidated balance sheet as of December 31, 2023, reflected the assets and liabilities of Centennial that were specifically identifiable as being directly attributable to the Company.
All revenues and costs as well as assets and liabilities directly associated with the business activity of the Company are included in the consolidated financial statements. For periods prior to the Separation, the consolidated financial statements included allocated expenses for certain functions provided by MDU Resources and Centennial, including, but not limited to, certain general corporate expenses related to senior management, legal, human resources, finance and accounting, treasury, information technology, internal audit, risk management and other shared services. These general corporate expenses were included in the consolidated statements of income within Cost of sales and Selling, general and administrative expenses. The amounts allocated were $30.4 million, $27.1 million and $21.2 million for the years ended December 31, 2024, 2023 and 2022, respectively. These expenses were allocated to the Company on the basis of direct usage where identifiable, with the remainder principally allocated on the basis of percent of total capital invested or other allocation methodologies that were considered to be a reasonable reflection of the utilization of the services provided to the benefits received. The allocations may not, however, reflect the expenses the Company would have incurred as a standalone company for the periods presented. These costs also may not be indicative of the expenses that the Company will incur in the future or would have incurred if the Company had obtained these services from a third party. Refer to Note 15 – Related-Party Transactions for more information on the transition services agreement between the Company and MDU Resources.
Earnings per share information has been retrospectively adjusted for periods prior to the Separation on the consolidated statements of income to reflect the Distribution. Refer to Note 9 – Earnings Per Share for more information on the share counts used in the earnings per share calculations.
Prior to the Separation, the Company historically participated in MDU Resources’ centralized cash management program through Centennial, including its overall financing arrangements. The Company had related-party agreements in place with Centennial for the financing of its capital needs, which were reflected as related-party notes payable on the consolidated balance sheets for periods prior to the Separation. Interest expense in the audited consolidated statements of income for periods prior to the Separation reflected the allocation of interest on borrowing and funding associated with the related-party agreements. Following the Separation, the Company has implemented its own centralized cash management program and has access to third-party credit facilities to fund day-to-day operations. For additional information related to the Company’s current financing arrangements and related interest expense recognition, refer to Note 7 – Debt and Note 15 – Related-Party Transactions.
Prior to the Separation, MDU Resources maintained various benefit and stock-based compensation plans at a corporate level and the Company’s employees participated in these programs. The costs associated with its employees were included in the Company’s consolidated financial statements for the periods prior to the Separation. Following the Separation, the Company has its own employee benefit and stock-based compensation plans at a corporate level that its employees participate in. Refer to Note 10 – Stock-Based Compensation and Note 13 – Employee Benefit Plans for additional information.
Principles of Consolidation
The consolidated financial statements were prepared in accordance with GAAP and include the accounts of the Company and its wholly owned subsidiaries, as well as entities that the Company controls through its ownership of a majority voting interest or pursuant to control of a variable interest entity (“VIE”). All significant intercompany accounts and transactions between the businesses comprising the Company have been eliminated in the accompanying consolidated financial statements.
The Company holds a minority economic interest in a captive insurance company, which has been determined to be a VIE. The captive insurance is structured with protected cell captives for each insured party (“Captive Cells”) in which participants’ assets and liabilities are held separately from each other. The Company is the primary beneficiary of its individual Captive Cell and has the power to direct the activities that most significantly impact economic performance of its Captive Cell, as well as the obligation to absorb losses of, and receive benefits from the activities of its Captive Cell. Accordingly, the Company has prepared these consolidated financial statements in accordance with Accounting Standards Codification (“ASC”) 810, Consolidation. ASC 810 requires that if an entity is the primary beneficiary of a VIE, the assets, liabilities, and results of operations of the VIE should be included in the consolidated financial statements of such entity. As such, the consolidated financial statements include the consolidation of only the assets and liabilities of the Company’s Captive Cell.
Related-party transactions between the Company, MDU Resources, Centennial or other MDU Resources subsidiaries, for general operating activities, the Company’s participation in MDU Resources’ centralized cash management program through
EVERUS CONSTRUCTION GROUP, INC.
Centennial, and intercompany debt were included in the consolidated financial statements for periods prior to the Separation. These related-party transactions were historically settled in cash and were reflected in the consolidated balance sheets prior to the Separation as Due from related-party, Due from related-party – noncurrent, Due to related-party, or Related-party notes payable. The aggregate net effect of general related-party operating activities was reflected in the consolidated statements of cash flows within operating activities for periods prior to the Separation. The effects of the Company’s participation in MDU Resources’ centralized cash management program and intercompany debt arrangements were reflected in the consolidated statements of cash flows within investing and financing activities for periods prior to the Separation. Refer to Note 15 – Related-Party Transactions for additional information on related-party transactions.
Subsequent Events
The Company has evaluated transactions for consideration as recognized subsequent events in these consolidated financial statements through February 28, 2025, the date of issuance of these consolidated financial statements, and determined that no additional events requiring disclosure occurred.
Summary of Significant Accounting Policies
Revenue Recognition
Revenue is recognized when a performance obligation is satisfied by transferring control over a product or service to a customer. Revenue is measured based on consideration specified in a contract with a customer and excludes any sales incentives and amounts collected on behalf of third parties. The Company is considered an agent for certain taxes collected from customers. As such, the Company presents revenues net of these taxes at the time of sale to be remitted to governmental authorities, including sales and use taxes.
The Company generates revenue from specialty contracting services which also includes the sale of construction equipment and other supplies. The Company provides specialty contracting services to a customer when a contract has been signed by both the customer and a representative of the Company obligating a service to be provided in exchange for the consideration identified in the contract. The nature of the services the Company provides generally includes multiple promised goods and services in a single project to create a distinct bundle of goods and services, which the Company has determined are single performance obligations. The transaction price includes the fixed consideration required pursuant to the original contract price together with any additional consideration, to which the Company expects to be entitled to, associated with executed change orders plus the estimate of variable consideration to which the Company expects to be entitled, subject to the following constraint.
The nature of the Company’s contracts gives rise to several types of variable consideration. Examples of variable consideration include: liquidated damages; performance bonuses or incentives and penalties; claims; unpriced change orders; and index pricing. The variable amounts usually arise upon achievement of certain performance metrics or change in project scope. The Company estimates the amount of revenue to be recognized on variable consideration using one of the two prescribed estimation methods, the expected value method or the most likely amount method, depending on which method best predicts the most likely amount of consideration the Company expects to be entitled to or expects to incur.
Assumptions as to the occurrence of future events and the likelihood and amount of variable consideration are made during the contract performance period. Estimates of variable consideration and determination of whether to include estimated amounts in the transaction price are based largely on the assessment of anticipated performance and all information (historical, current, and forecasted) that is reasonably available to management. The Company only includes variable consideration in the estimated transaction price to the extent it is probable that a significant reversal of cumulative revenue recognized will not occur or when the uncertainty associated with the variable consideration is resolved.
Changes in circumstances could impact management’s estimates made in determining the value of variable consideration recorded. When determining if the variable consideration is constrained, the Company considers if factors exist that could increase the likelihood or the magnitude of a potential reversal of revenue. The Company updates its estimate of the transaction price each reporting period and the effect of variable consideration on the transaction price is recognized as an adjustment to revenue on a cumulative catch-up basis.
Contract revenue is recognized over time using the input method based on the measurement of progress on a project. This is the preferred method of measuring revenue because the costs incurred have been determined to represent the best indication of the overall progress toward the transfer of such goods or services promised to a customer. Under the cost-to-cost measure of progress, the costs incurred are compared with total estimated costs of a performance obligation. Revenues are recorded proportionately to the costs incurred.
EVERUS CONSTRUCTION GROUP, INC.
The Company also sells construction equipment and other supplies to third parties and internal customers. The contract for these sales is the use of a sales order or invoice, which includes the pricing and payment terms. All such contracts include a single performance obligation for the delivery of a single distinct product or a distinct separately identifiable bundle of products and services. Revenue is recognized at a point in time when the performance obligation has been satisfied with the delivery of the products or services. The warranties associated with the sales are those consistent with a standard warranty that the product meets certain specifications for quality or those required by law.
For most contracts, amounts billed to customers are due within 30 days of receipt. There are no material obligations for returns, refunds or other similar obligations.
The Company recognizes all other revenues when services are rendered or goods are delivered.
Consolidation of Variable Interest Entities
The Company has an ownership interest in a captive insurance entity, which has been determined to be a VIE, that holds and acts as the administrator of segregated account protected Captive Cells. The captive insurance company is structured with protected Captive Cells for each insured party and is not exposed to the insurance and investment risks that the Captive Cells are designed to create and distribute on behalf of the insured parties. The Company has a variable interest in the captive insurance company due to its ownership interest. However, as the captive insurance company is not exposed to the variability of the Captive Cells, only the activity of the Captive Cell whose activities are controlled by the Company is recorded in the Company’s consolidated financial statements.
Cash deposits held by the Captive Cell are considered restricted cash as they are to remain in the Captive Cell. After consolidation by the Company, the total carrying amount of Cash, cash equivalents and restricted cash, Other accrued liabilities, and Other noncurrent liabilities on the consolidated balance sheet held by the Captive Cell were as follows as of December 31:
| | | | | | | |
| 2024 | | |
| (In thousands) | | |
| Cash, cash equivalents and restricted cash | $ | 16,057 | | | |
| Other accrued liabilities | 1,816 | | | |
| Other noncurrent liabilities | $ | 9,271 | | | |
Legal Costs
The Company expenses external legal fees as they are incurred.
Advertising
The Company expenses advertising costs as they are incurred. Advertising costs, which are included in Selling, general and administrative expenses, were $1.1 million, $0.9 million and $0.8 million for the years ended December 31, 2024, 2023 and 2022, respectively.
Income Taxes
Prior to the Separation, the Company’s operations were historically included in the consolidated federal income tax returns and combined and separate state income tax returns filed by MDU Resources. Pursuant to the tax sharing agreement that existed between MDU Resources and its subsidiaries, federal income taxes paid by MDU Resources, as parent of the consolidated group, were allocated to the individual subsidiaries based on separate company computations of tax. MDU Resources made a similar allocation for state income taxes paid in connection with combined state filings.
Following the Separation, Everus and its subsidiaries file consolidated federal income tax returns and combined and separate state income tax returns. Pursuant to the tax sharing agreement that exists between Everus and its subsidiaries, federal income taxes paid by Everus, as parent of the consolidated group, are allocated to the individual subsidiaries based on separate company computations of tax. Everus makes a similar allocation for state income taxes paid in connection with combined state filings.
The Company recognizes deferred federal and state income taxes on all temporary differences between the book and tax basis of the Company’s assets and liabilities by using enacted tax rates in effect for the year in which the differences are expected to reverse. The effect of a change in tax rates on deferred tax assets and liabilities is recognized as income in the period that includes the enactment date.
EVERUS CONSTRUCTION GROUP, INC.
The Company records uncertain tax positions in accordance with accounting guidance on accounting for income taxes on the basis of a two-step process in which (i) the Company determines whether it is more-likely-than-not that the tax position will be sustained on the basis of the technical merits of the position and (ii) for those tax positions that meet the more-likely-than-not recognition threshold, the Company recognizes the largest amount of the tax benefit that is more than 50 percent likely to be realized upon ultimate settlement with the related tax authority. Tax positions that do not meet the more-likely-than-not criteria are reflected as a tax liability. The Company recognizes interest and penalties accrued related to unrecognized tax benefits in income taxes in the consolidated statements of income.
Joint Ventures
The Company accounts for unconsolidated joint ventures using either the equity method or proportionate consolidation. For the years ended December 31, 2024, 2023 and 2022, the Company held interests between 25 percent and 50 percent in joint ventures formed primarily for the purpose of pooling resources on construction contracts.
Proportionate consolidation is used for joint ventures that include unincorporated legal entities when we hold an undivided interest in each asset and are proportionately liable for our share of liabilities and the activities of the joint ventures that are construction related. For those joint ventures accounted for under proportionate consolidation, only the Company’s pro rata share of assets, liabilities, revenues and expenses are included in the Company’s consolidated financial statements.
For those joint ventures accounted for using proportionate consolidation, the Company recorded operating revenues of $0.6 million, $7.8 million and $14.8 million for the years ended December 31, 2024, 2023 and 2022, respectively, and $0.2 million, $2.1 million and $3.0 million of operating income for the years ended December 31, 2024, 2023 and 2022, respectively, in the consolidated statements of income. As of December 31, 2024, the Company did not have any remaining interest in assets from these joint ventures. However, as of December 31, 2023, the Company had interest in assets from these joint ventures of $1.8 million.
For those joint ventures accounted for under the equity method, the Company’s investment balances for the joint ventures are included in Investments in the consolidated balance sheets and the Company’s pro rata share of net income is included in Income from equity method investments in the consolidated statements of income. The Company’s investments in equity method joint ventures as of December 31, 2024 and 2023, were a net asset of $14.3 million and $6.2 million, respectively. For the years ended December 31, 2024, 2023 and 2022, the Company recognized income from equity method joint ventures of $12.2 million, $5.0 million and $5.9 million, respectively.
Use of Estimates
The preparation of consolidated financial statements in conformity with GAAP requires the Company to make estimates and assumptions that affect the reported amounts of assets and liabilities, and disclosure of contingent assets and liabilities, at the date of the consolidated financial statements, as well as the reported amounts of revenues and expenses during the reporting period. Estimates are used for items such as long-lived assets and goodwill; fair values of acquired assets and liabilities under the acquisition method of accounting; property depreciable lives; tax provisions; revenue recognized using the cost-to-cost measure of progress for contracts; expected credit losses; loss contingencies; costs on construction contracts; unbilled revenues; actuarially determined benefit costs; lease classification; present value of right-of-use assets and lease liabilities; and the valuation of stock-based compensation. As additional information becomes available, or actual amounts are determinable, the recorded estimates are revised. Consequently, operating results can be affected by revisions to prior accounting estimates.
Stock-Based Compensation
Prior to the Separation, eligible employees of the Company participated in MDU Resources’ stock-based compensation plans. The Company recorded compensation expense on awards granted by MDU Resources to its employees, including post-Separation compensation expense for certain Company employees who transferred from MDU Resources.
At the time of Separation, all outstanding MDU Resources restricted stock units held by Company employees were converted into Everus restricted stock units. The converted awards will continue to vest over the original vesting periods of three years from the respective grant dates. Refer to Note 10 – Stock-Based Compensation for additional information related to the conversion to Everus restricted stock unit awards.
Stock-based compensation awards are accounted for based on the estimated fair values at the grant date and compensation expense is recognized over the vesting period. The Company uses the straight-line amortization method to recognize compensation expense related to restricted stock units, which only have a service condition. This method recognizes stock compensation expense on a straight-line basis over the requisite service period for the entire award.
EVERUS CONSTRUCTION GROUP, INC.
Prior to the Separation, the Company applied a forfeiture rate estimate, consistent with MDU Resources’ accounting policy, and adjusted compensation expense accordingly. Following the Separation, the Company implemented a change in accounting policy pertaining to forfeitures and is now recognizing forfeitures when they occur and recognizes the related true-up to expense on a cumulative catch-up basis at the time of the forfeitures.
Cash, Cash Equivalents and Restricted Cash
The Company considers all highly liquid investments purchased with an original maturity of three months or less to be cash equivalents. Restricted cash represents deposits held by the Company’s Captive Cell that are to be used solely for Captive Cell’s purposes. As of December 31, 2024, the Company had $86.0 million of cash, cash equivalents, and restricted cash, including $16.1 million of restricted cash held by the Captive Cell. As of December 31, 2023, the Company had $1.6 million of cash and cash equivalents, with no restricted cash. The cash presented on the consolidated balance sheet as of December 31, 2023, represented the amounts not subjected to MDU Resources’ centralized cash management program.
Receivables and Allowance for Expected Credit Losses
Receivables consist primarily of trade receivables from the sale of goods and services, net of expected credit losses. The Company’s trade receivables are all due in 12 months or less. Receivables, net was summarized as follows as of December 31:
| | | | | | | | | | | |
| 2024 | | 2023 |
| (In thousands) |
| Trade receivables: | | | |
| Completed contracts | $ | 42,462 | | | $ | 42,467 | |
| Contracts in progress | 546,543 | | | 409,872 | |
| | | |
| Other | 8,120 | | | 5,254 | |
| Receivables, gross | 597,125 | | | 457,593 | |
| Less expected credit losses | 7,097 | | | 7,967 | |
| Receivables, net | $ | 590,028 | | | $ | 449,626 | |
The following table presents the opening and closing balances of Receivables, net, as of December 31:
| | | | | | | | | | | |
| 2024 | | 2023 |
| (In thousands) |
| Balance at beginning of period | $ | 449,626 | | | $ | 484,772 | |
| Change during period | 140,402 | | | (35,146) | |
| Balance at end of period | $ | 590,028 | | | $ | 449,626 | |
The Company’s expected credit losses are determined using historical credit loss experience, changes in asset-specific characteristics, current conditions, and reasonable and supportable future forecasts, among other specific account data. A review of the Company’s expected credit losses is performed at least quarterly. The Company develops and documents its methodology to determine its allowance for expected credit losses. Risk characteristics used by the Company may include customer mix, knowledge of customers and general economic conditions of the various local economies, among others. Specific account balances are written off when management determines the amounts to be uncollectible. The year-to-date change in the credit loss provisions were due to outstanding receivable balances being collected that had been reserved for due to changes in economic factors related to certain customer accounts.
Details of the Company’s expected credit losses were as follows:
| | | | | | | | | | | | | | | | | |
| 2024 | | 2023 | | 2022 |
| (In thousands) |
| Balance at beginning of year | $ | 7,967 | | | $ | 2,161 | | | $ | 2,533 | |
| Current expected credit loss provision | (56) | | | 6,202 | | | 186 | |
| Less: write-offs charged against the allowance | 870 | | | 455 | | | 626 | |
| Credit loss recoveries collected | 56 | | | 59 | | | 68 | |
| Balance at end of year | $ | 7,097 | | | $ | 7,967 | | | $ | 2,161 | |
EVERUS CONSTRUCTION GROUP, INC.
Inventories
As of December 31, 2024 and 2023, inventories consisted primarily of manufactured equipment held for resale and/or rental of $36.9 million and $37.2 million, respectively, and materials and supplies of $6.8 million and $5.5 million, respectively. These inventories are stated at the lower of average cost or net realizable value. The value of inventory may decrease due to obsolescence, physical deterioration, damage, costs to repair or other causes. Inventory valuation write-downs are determined based on specific facts and circumstances and were immaterial as a whole as of December 31, 2024 and 2023.
Property, Plant and Equipment
Additions to property, plant and equipment are recorded at cost. Gains or losses resulting from the retirement or disposal of assets are recognized as a component of operating income. The Company capitalizes interest, when applicable, on certain property, plant and equipment. There was no interest capitalized in 2024 or 2023. Property, plant and equipment are depreciated on a straight-line basis over the average useful lives of the assets.
Goodwill
Goodwill represents the excess of the purchase price over the fair value of identifiable net tangible and intangible assets acquired in a business combination. Goodwill is required to be tested for impairment annually, which the Company completes in the fourth quarter, or more frequently if events or changes in circumstances indicate that goodwill may be impaired.
The Company performed its annual goodwill impairment test in the fourth quarter of 2024. The Company determined that the reporting units for its goodwill impairment test were its operating segments, or components of an operating segment, that constitute a business for which discrete financial information is available and for which management regularly reviews the operating results. As such, the Company’s reporting units are Electrical & Mechanical, Transmission & Distribution, and Wagner Smith Equipment (“WSE”). For more information on the Company’s reporting units, refer to Note 5 – Goodwill and Other Intangible Assets. Goodwill impairment, if any, is measured by comparing the fair value of each reporting unit to its carrying value. If the fair value exceeds carrying value, the goodwill of the reporting unit is not impaired. If the carrying value exceeds fair value, the Company must record a goodwill impairment loss for the amount that the carrying value of the reporting unit, including goodwill, exceeds the fair value of the reporting unit. For the years ended December 31, 2024, 2023 and 2022, there were no goodwill impairment losses recorded. As of October 31, 2024, the fair value substantially exceeded the carrying value for all reporting units.
Determining the fair value of a reporting unit requires judgment and the use of significant estimates which include assumptions about the Company’s future revenue, profitability and cash flows, amount and timing of estimated capital expenditures, inflation rates, risk-adjusted cost of capital, operational plans, and current and future economic conditions, among others. Prior to the Separation under MDU Resources, for 2023 and 2022, the fair value of each reporting unit was determined using a weighted combination of income and market approaches. Following the Separation as a standalone company, for 2024, the fair value of each reporting unit was determined using an income approach. The Company believed that the estimates and assumptions used in its goodwill impairment assessments were reasonable and based on available market information.
Impairment of Long-Lived Assets, Excluding Goodwill
The Company reviews the carrying values of its long-lived assets, excluding goodwill, whenever events or changes in circumstances indicate that such carrying values may not be recoverable. The Company tests long-lived assets for impairment at a lower level than that of goodwill impairment testing. Long-lived assets or groups of assets are evaluated for impairment at the lowest level of independently identifiable cash flows for an individual operation or group of operations collectively serving a local market. The determination of whether a long-lived asset impairment has occurred is based on an estimate of undiscounted future cash flows attributable to the assets, compared to the carrying value of the assets. If impairment has occurred, the amount of the long-lived asset impairment recognized is determined by estimating the fair value of the assets and recording a loss if the carrying value is greater than the fair value.
No long-lived asset impairment losses were recorded in 2024, 2023 or 2022. Unforeseen events and changes in circumstances could require the recognition of long-lived asset impairment losses in the future.
Leases
The Company determines if an arrangement contains a lease at inception of a contract and accounts for all leases in accordance with ASC 842 - Leases. The recognition of leases requires the Company to make estimates and assumptions that affect the lease classification, and the assets and liabilities recorded. The accuracy of lease assets and liabilities reported on the
EVERUS CONSTRUCTION GROUP, INC.
consolidated balance sheets depends on, among other things, management’s estimates of interest rates used to discount the lease assets and liabilities to their present value, as well as the lease terms based on the unique facts and circumstances of each lease.
Lease liabilities and their corresponding right-of-use assets are recorded based on the present value of lease payments over the expected lease term. The Company recognizes leases with an original lease term of 12 months or less in net income on a straight-line basis over the term of the lease and does not recognize a corresponding right-of-use asset or lease liability. The Company’s lease agreements may contain variable lease payments based on inflation adjustments, property taxes and common area maintenance, all of which are expensed as incurred.
The Company determines the lease term based on the non-cancellable and cancellable periods in each contract. The non-cancellable period consists of the term of the contract that is legally enforceable and cannot be cancelled by either party without incurring a significant penalty. The cancellable period is determined by various factors that are based on who has the right to cancel a contract. If only the lessor has the right to cancel the contract, the Company will assume the contract will continue. If the lessee is the only party that has the right to cancel the contract, the Company looks to asset, entity and market-based factors. If both the lessor and the lessee have the right to cancel the contract, the Company assumes the contract will not continue.
The discount rate used to calculate the present value of the lease liabilities is based upon the implied rate within each contract. If the rate is unknown or cannot be determined, the Company uses an incremental borrowing rate, which is determined by the length of the contract, asset class and the Company’s borrowing rates, as of the commencement date of the contract.
Insurance
The Company entered into an insurance arrangement in anticipation of the Separation. The insurance arrangement is subject to applicable insurance rules and regulations, and insures the Company’s exposure related to workers’ compensation, general liability and automobile liability on a primary basis. These policies are subject to certain self-insured limits up to $5.0 million.
The insurance arrangement establishes a reserve for estimated ultimate losses on reported claims and those incurred but not yet reported utilizing actuarial projections. The reserves are classified within Other accrued liabilities or Other noncurrent liabilities on the consolidated balance sheets based on projections of when the estimated losses will be paid. The estimates that are utilized to record potential losses on claims are inherently subjective, and actual claims could differ from amounts recorded, which could result in increased or decreased expense in future periods.
The Company also purchases excess coverage from unrelated insurance carriers and obtains third-party coverage for other forms of insurance including, but not limited to, excess liability, contractors pollution liability, directors and officers liability and employment practices liability. These policies are subject to certain deductible thresholds up to $1.5 million.
For certain health benefit plans, the Company carries insurance policies that are subject to stop-loss limits of up to $1.0 million, for qualified individuals. The Company maintains a reserve for these health benefit plans that is included within Other accrued liabilities on the consolidated balance sheets. The reserve includes an estimate for losses on reported claims as well as for amounts incurred but not yet reported, based on historical trends.
Investments
The Company’s investments primarily include the cash surrender value of life insurance policies and insurance contracts. The Company measures its investments in insurance contracts at fair value with any unrealized gains and losses recorded on the consolidated statements of income. The Company’s valuation techniques used to measure fair value are designed to maximize the use of observable inputs and minimize the use of unobservable inputs.
New Accounting Standards
Changes to GAAP are typically established by the Financial Accounting Standards Board (“FASB”) in the form of an Accounting Standards Update (“ASU”) to the FASB’s Accounting Standards Codification. The Company considers the applicability and impact of all ASUs.
Recently Adopted Accounting Standards Updates
In December 2022, the FASB issued ASU 2022-06, Reference Rate Reform (Topic 848): Deferral of Sunset Date, which included a sunset provision within ASC 848 - Reference Rate Reform, based on expectations of when the London Inter-Bank Offered Rate (“LIBOR”) would cease to be published. At the time ASU 2020-04 was issued, the UK Financial Conduct Authority had established its intent to cease overnight tenors of LIBOR after December 31, 2021. In March 2021, the UK
EVERUS CONSTRUCTION GROUP, INC.
Financial Conduct Authority announced that the intended cessation date of the overnight tenors of LIBOR would be June 30, 2023, which is beyond the then-current sunset date of ASC 848. The amendments defer the sunset date of ASC 848 from December 31, 2022, to December 31, 2024, after which entities will no longer be permitted to apply the relief in ASC 848. Existing contracts referencing LIBOR or other reference rates expected to be discontinued must have identified a replacement rate by June 30, 2023. New contracts will incorporate a new reference rate, which includes the Secured Overnight Financing Rate (“SOFR”). The standard was effective upon issuance (December 21, 2022) through December 31, 2024. The Company has updated its credit agreements to include language regarding the successor or alternate rate to LIBOR. The Company determined the adoption of the guidance did not have a material impact on its audited consolidated financial statements.
In November 2023, the FASB issued ASU 2023-07, Segment Reporting (Topic 280): Improvements to Reportable Segment Disclosures, which provided guidance on improving financial reporting by requiring disclosure on incremental segment information, primarily through enhanced disclosures about significant segment expenses on an annual and interim basis for all public entities to enable investors to develop more decision-useful financial analyses. The standard was effective for annual periods beginning in the fiscal year ending December 31, 2024, and will be effective for interim periods beginning January 1, 2025, with retrospective application for prior periods disclosed. The Company adopted the standard in the fourth quarter of fiscal year 2024. Refer to Note 12 – Business Segment Data for the related disclosure-only impacts of adopting this standard. Future interim periods will also be impacted through the inclusion of required updated disclosures.
New Accounting Standards Updates Not Yet Adopted
In August 2023, the FASB issued ASU 2023-05, Business Combinations - Joint Venture Formations (Subtopic 805-60): Recognition and Initial Measurement, which provided guidance on accounting for contributions made to a joint venture, upon formation, in a joint venture’s separate financial statement in order to provide decision useful information to investors and other allocators of capital (collectively investors) in a joint venture’s financial statements and reduce diversity in practice. The new basis of accounting will require that a joint venture, upon formation, will recognize and initially measure its assets and liabilities at fair value (with the exceptions to fair value measurement that are consistent with the business combinations guidance). The standard will be effective prospectively for all joint venture formations with a formation date on or after January 1, 2025. However, a joint venture that was formed before January 1, 2025, may elect to apply the guidance retrospectively if it has sufficient information. The Company is currently evaluating the impact the guidance will have on its interim and annual disclosures for the year ended December 31, 2025.
In December 2023, the FASB issued ASU 2023-09, Income Taxes (Topic 740): Improvements to Income Tax Disclosures, which provided guidance to address investors’ requests for more transparency about income tax information through improvements to income tax disclosures primarily related to the rate reconciliation and income tax paid information and effectiveness of income tax disclosures. The standard will be effective for fiscal years beginning after December 15, 2024. The Company is currently evaluating the impact the guidance will have on its disclosures for the year ended December 31, 2025.
In November 2024, the FASB issued ASU 2024-03, Income Statement - Reporting Comprehensive Income - Expense Disaggregation Disclosures (Subtopic 220-40): Disaggregation of Income Statement Expenses, which provided guidance to address investors’ requests for more detailed information about the types of expenses including purchases of inventory, employee compensation, depreciation, amortization, and depletion in commonly presented expense captions, such as cost of sales, selling, general and administrative expenses, and research and development costs. The standard will be effective for fiscal year ending December 31, 2027, and interim periods beginning January 1, 2028. The Company is currently evaluating the impact the guidance will have on its disclosures for the year ending December 31, 2027 and future interim periods beginning in 2028.
Immaterial restatement of prior period financial statements
Subsequent to the issuance of the Company’s annual consolidated financial statements in its Form 10, errors were identified within the Consolidated Balance Sheets related to the classification of Receivables, net, Contract assets, net, Noncurrent retention receivable, and Contract liabilities, net for all prior periods presented. The errors related to the inappropriate presentation of retainage receivable on a gross basis rather than netting with contract assets and contract liabilities under ASC 606 - Revenue from Contracts with Customers, as well as the classification of short-term retainage receivable within Receivables, net. As a result, the Company has restated the prior period financial statements and related footnote disclosures in Notes 2, 3 and 12 in this Annual Report to correct the errors. The Company has also restated the line items impacted in the Consolidated Statements of Cash Flows. The errors had no impact on total cash flows from operating activities in the Consolidated Statements of Cash Flows. In addition, the errors did not impact the Consolidated Statements of Income. The overall impact of the errors on the Consolidated Balance Sheet is shown in the table below. Management evaluated the
EVERUS CONSTRUCTION GROUP, INC.
materiality of the errors and concluded that it was not material to the prior period financial statements. The Company will also correct previously reported interim financial information for such immaterial errors in future filings, as applicable.
The following table reflects the effects of the correction on all affected line items of the Company’s previously reported Consolidated Balance Sheet as of December 31, 2023, presented in this Annual Report:
| | | | | | | | | | | | | | | | | |
| As Previously Reported | | Adjustments | | As Restated |
| (In thousands) |
| Balance Sheet | | | | | |
| Receivables, net | $ | 534,100 | | | $ | (84,474) | | | $ | 449,626 | |
| Contract assets, net | 158,529 | | | 47,706 | | | 206,235 | |
| Total current assets | 766,063 | | | (36,768) | | | 729,295 | |
| Noncurrent retention receivable | 21,355 | | | (21,355) | | | — | |
| Total noncurrent assets | 344,519 | | | (21,355) | | | 323,164 | |
| Total assets | $ | 1,110,582 | | | $ | (58,123) | | | $ | 1,052,459 | |
| | | | | |
| Contract liabilities, net | $ | 198,231 | | | $ | (58,123) | | | $ | 140,108 | |
| Total current liabilities | 452,183 | | | (58,123) | | | 394,060 | |
| Total liabilities | 661,732 | | | (58,123) | | | 603,609 | |
| Total liabilities and stockholders’ equity | $ | 1,110,582 | | | $ | (58,123) | | | $ | 1,052,459 | |
Note 3 - Revenue from Contracts with Customers
Revenue is recognized when a performance obligation is satisfied by transferring control over a product or service to a customer. Revenue is measured based on consideration specified in a contract with a customer and excludes any sales incentives and amounts collected on behalf of third parties. The Company is considered an agent for certain taxes collected from customers. As such, the Company presents revenues net of these taxes at the time of sale to be remitted to governmental authorities, including sales and use taxes.
As part of the adoption of ASC 606 - Revenue from Contracts with Customers, the Company elected the practical expedient to recognize the incremental costs of obtaining a contract as an expense when incurred if the amortization period of the asset that the Company otherwise would have recognized is 12 months or less.
Contract Estimates and Changes in Estimates
Changes in cost estimates on certain contracts may result in the issuance of change orders, which can be approved or unapproved by the customer, or the assertion of contract claims. The Company recognizes amounts associated with change orders and claims as revenue if it is probable that the contract price will be adjusted and the amount of any such adjustment can be reasonably estimated. Change orders and claims are negotiated in the normal course of business and represent management’s estimates of additional contract revenues that have been earned and are probable of collection.
As of December 31, 2024 and 2023, $56.2 million and $57.3 million, respectively, of unexecuted change orders were included in contract transaction price and in Contract assets on the consolidated balance sheets. The Company was in the process of negotiating execution of these change orders in the normal course of business and the recognized amounts represent the Company’s best estimates of additional contract revenues for which it is not probable that a significant reversal of the revenue amounts will occur in the future.
As of December 31, 2024 and 2023, in the normal course of business, the Company had additional priced work not approved by the customer to begin project work of approximately $265.3 million and $187.4 million, respectively, with minimal costs incurred. These amounts were excluded from contract transaction price. In addition, claim positions of $54.9 million and $42.7 million were excluded from the contract transaction price as of December 31, 2024 and 2023, respectively. The Company continues to evaluate these claims.
As of December 31, 2024 and 2023, the Company recorded loss provisions of $1.0 million and $1.5 million, respectively, in Contract liabilities on the consolidated balance sheets related to contracts that are still being completed and remain recorded.
EVERUS CONSTRUCTION GROUP, INC.
The Company received notification in October 2023 from a customer that it was withholding payment of approximately $31.3 million on remaining outstanding billings, including retention, on a large project with a contract that was billed on a time and materials basis with no stated maximum price. The Company believes it has substantial defenses against these claims based upon the terms of the contract and it has performed under the terms of the contract. Therefore, the Company believes collection of the remaining outstanding billings, including retention, is probable and, as a result, the Company has recognized the revenue from this project in its results. However, there is uncertainty surrounding this matter, including the potential long-term nature of dispute resolution, the Company filing a lien on the property and the broad range of possible consideration amounts as a result of negotiations and potential litigation to resolve the dispute.
Disaggregation of Revenue
In the following tables, revenue is disaggregated by contract type and customer type for each reportable segment. The Company believes this level of disaggregation best depicts how the nature, amount, timing and uncertainty of revenue and cash flows are affected by economic factors. For more information on the Company’s reportable segments, refer to Note 12 – Business Segment Data.
The following tables present revenue disaggregated by contract type:
| | | | | | | | | | | | | | | | | |
| Year ended December 31, 2024 | Electrical & Mechanical | | Transmission & Distribution | | Total |
| (In thousands) |
| Fixed-price | $ | 1,299,059 | | | $ | 385,868 | | | $ | 1,684,927 | |
| Unit-price | 61,964 | | | 155,599 | | | 217,563 | |
| Cost reimbursable* | 670,424 | | | 295,679 | | | 966,103 | |
| Total contract revenues | 2,031,447 | | | 837,146 | | | 2,868,593 | |
| Eliminations | (7,536) | | | (11,372) | | | (18,908) | |
| Total operating revenues | $ | 2,023,911 | | | $ | 825,774 | | | $ | 2,849,685 | |
__________________
*Includes time and material, time and equipment, and cost reimbursable plus fee contracts.
| | | | | | | | | | | | | | | | | |
| Year ended December 31, 2023 | Electrical & Mechanical | | Transmission & Distribution | | Total |
| (In thousands) |
| Fixed-price | $ | 1,049,626 | | | $ | 353,836 | | | $ | 1,403,462 | |
| Unit-price | 81,786 | | | 94,794 | | | 176,580 | |
| Cost reimbursable* | 1,003,455 | | | 285,947 | | | 1,289,402 | |
| Total contract revenues | 2,134,867 | | | 734,577 | | | 2,869,444 | |
| Eliminations | (9,324) | | | (5,730) | | | (15,054) | |
| Total operating revenues | $ | 2,125,543 | | | $ | 728,847 | | | $ | 2,854,390 | |
__________________
*Includes time and material, time and equipment, and cost reimbursable plus fee contracts.
| | | | | | | | | | | | | | | | | |
| Year ended December 31, 2022 | Electrical & Mechanical | | Transmission & Distribution | | Total |
| (In thousands) |
| Fixed-price | $ | 1,002,117 | | | $ | 308,530 | | | $ | 1,310,647 | |
| Unit-price | 91,565 | | | 116,831 | | | 208,396 | |
| Cost reimbursable* | 904,158 | | | 292,032 | | | 1,196,190 | |
| Total contract revenues | 1,997,840 | | | 717,393 | | | 2,715,233 | |
| Eliminations | (9,111) | | | (6,872) | | | (15,983) | |
| Total operating revenues | $ | 1,988,729 | | | $ | 710,521 | | | $ | 2,699,250 | |
___________________
*Includes time and material, time and equipment, and cost reimbursable plus fee contracts.
EVERUS CONSTRUCTION GROUP, INC.
The following table presents revenue disaggregated by customer type:
| | | | | | | | | | | | | | | | | |
| Years Ended December 31, |
| 2024 | | 2023 | | 2022 |
| (In thousands) |
| Commercial | $ | 1,197,760 | | | $ | 1,204,016 | | | $ | 1,082,456 | |
| Industrial | 322,661 | | | 473,339 | | | 405,730 | |
| Institutional | 364,611 | | | 262,344 | | | 215,509 | |
| Renewables | 36,975 | | | 55,402 | | | 151,100 | |
| Service & other | 109,440 | | | 139,766 | | | 143,045 | |
| Total Electrical & Mechanical | 2,031,447 | | | 2,134,867 | | | 1,997,840 | |
| Utility | 753,725 | | | 677,434 | | | 645,077 | |
| Transportation | 83,421 | | | 57,143 | | | 72,316 | |
| Total Transmission & Distribution | 837,146 | | | 734,577 | | | 717,393 | |
| Eliminations | (18,908) | | | (15,054) | | | (15,983) | |
| Total operating revenues | $ | 2,849,685 | | | $ | 2,854,390 | | | $ | 2,699,250 | |
Uncompleted Contracts, Contract Assets and Contract Liabilities
Costs, estimated earnings and billings on uncompleted contracts were summarized as follows as of December 31:
| | | | | | | | | | | |
| 2024 | | 2023 |
| (In thousands) |
| Costs incurred on uncompleted contracts | $ | 7,034,838 | | | $ | 6,390,641 | |
| Estimated earnings | 995,766 | | | 840,994 | |
| Costs and estimated earnings on uncompleted contracts | 8,030,604 | | | 7,231,635 | |
| Less: billings to date | 8,070,859 | | | 7,165,508 | |
| Net contract assets (liabilities) | $ | (40,255) | | | $ | 66,127 | |
The timing of revenue recognition may differ from the timing of invoicing to customers. The timing of invoicing to customers does not necessarily correlate with the timing of revenues being recognized under the cost-to-cost method of accounting. Contracts from contracting services usually stipulate the timing of payment, which is defined by the terms found within the various contracts under which work was performed during the period. Contracts from contracting services are billed as work progresses in accordance with agreed upon contractual terms. Generally, billing to the customer occurs contemporaneous to revenue recognition. A variance in timing of the billings may result in contract assets or contract liabilities.
Contract assets consist of unbilled revenue and retainage. Unbilled revenue occurs when revenues are recognized under the cost-to-cost measure of progress, which exceeds amounts billed on uncompleted contracts. Such amounts will be billed as standard contract terms allow, usually based on various measures of performance or achievement. Retainage represents amounts that have been contractually invoiced to customers and where payments have been partially withheld pending the achievement of certain milestones, satisfaction of other contractual conditions, or completion of the project. Contract assets are not considered a significant financing component as they are intended to protect the customer in the event the Company does not perform on its obligations under the contract.
Contract liabilities occur when there are billings in excess of revenues recognized under the cost-to-cost measure of progress on uncompleted contracts. Contract liabilities decrease as revenue is recognized from the satisfaction of the related performance obligation. Contract liabilities are not considered to have a significant financing component as they are used to meet working capital requirements that generally are higher in the early stages of a contract and are intended to protect the Company from the other party failing to meet its obligations under the contract.
The Company classifies Contract assets and Contract liabilities that may be settled after one year from the balance sheet date as current, consistent with the timing of the Company’s project operating cycle.
EVERUS CONSTRUCTION GROUP, INC.
Contract assets and Contract liabilities consisted of the following as of December 31:
| | | | | | | | | | | |
| 2024 | | 2023 |
| (In thousands) |
| Unbilled revenue, net | $ | 124,007 | | | $ | 158,529 | |
| Retainage, net | 43,042 | | | 47,706 | |
| Contract assets, net | $ | 167,049 | | | $ | 206,235 | |
| | | |
| Deferred revenue, net | $ | 206,283 | | | $ | 138,563 | |
| Accrued loss provision | 1,021 | | | 1,545 | |
| Contract liabilities, net | $ | 207,304 | | | $ | 140,108 | |
The following table presents the opening and closing balances of net contract assets (liabilities):
| | | | | | | | | | | | | | | | | | | | | | | | | | | | | | | | | | | |
| 2024 | | 2023 |
| Contract assets | | Contract liabilities | | Net contract assets (liabilities) | | Contract assets | | Contract liabilities | | Net contract assets (liabilities) |
| (In thousands) |
| Balance at beginning of year | $ | 206,235 | | | $ | (140,108) | | | $ | 66,127 | | | $ | 223,098 | | | $ | (124,395) | | | $ | 98,703 | |
| Change during year | (39,186) | | | (67,196) | | | (106,382) | | | (16,863) | | | (15,713) | | | (32,576) | |
| Balance at end of year | $ | 167,049 | | | $ | (207,304) | | | $ | (40,255) | | | $ | 206,235 | | | $ | (140,108) | | | $ | 66,127 | |
Contract assets and contract liabilities fluctuate period to period based on various factors, including, but not limited to, changes in the number and size of projects in progress at period end; variability in billing and payment terms, such as up-front or advance billings, interim or milestone billings, or deferred billings; variability in billing of retainage and the satisfaction of the specified condition; and unapproved change orders and contract claims recognized as revenues. The primary driver of the difference between the Company’s opening and closing contract asset and contract liability balances is the timing of the Company’s billings, including retainage, in relation to its performance of work.
The Company recognized a net increase in revenues of $117.5 million, $116.3 million and $127.3 million for the years ended December 31, 2024, 2023 and 2022, respectively, related to previously recognized deferred revenues that were included in Contract liabilities, net as of December 31, 2023, 2022 and 2021, respectively. The Company recognized a net increase in revenues of $83.4 million, $45.7 million and $46.9 million for the years ended December 31, 2024, 2023 and 2022, respectively, from performance obligations satisfied in prior periods.
Remaining Performance Obligations
Remaining performance obligations include unrecognized revenues that the Company reasonably expects to be realized from the uncompleted portion of services to be performed under job-specific contracts to the extent management believes additional contract revenues will be earned and are deemed probable of collection. The majority of the Company’s contracts for contracting services have an original duration of less than one year.
As of December 31, 2024 and 2023, the aggregate amount of the transaction price allocated to the Company’s remaining performance obligations was $2.46 billion and $2.01 billion, respectively. The table below shows additional information regarding the Company’s remaining performance obligations as of December 31, 2024, including an estimate of when the Company expects to recognize its remaining performance obligations as revenue:
| | | | | | | | | | | |
| Within 12 Months | | Greater than 12 Months |
| (In thousands) |
| | | |
| Electrical & Mechanical | $ | 1,764,571 | | | $ | 435,208 | |
| Transmission & Distribution | 226,608 | | | 31,121 | |
| Total | $ | 1,991,179 | | | $ | 466,329 | |
EVERUS CONSTRUCTION GROUP, INC.
Note 4 – Property, Plant and Equipment, Net
Property, plant and equipment, net as of December 31 was as follows:
| | | | | | | | | | | | | | | | | |
| 2024 | | 2023 | | Estimated Useful Life |
| (In thousands) | | (In years) |
| Land | $ | 8,662 | | | $ | 8,662 | | | — |
| Buildings and improvements | 54,936 | | | 52,667 | | | 5 to 33 |
| Machinery and equipment | 86,689 | | | 78,019 | | | 4 to 12 |
| Vehicles | 133,437 | | | 113,783 | | | 5 to 8 |
| Other | 7,963 | | | 6,718 | | | 3 to 7 |
| Property, plant and equipment, gross | 291,687 | | | 259,849 | | | |
| Less: accumulated depreciation | 157,278 | | | 143,831 | | | |
| Property, plant and equipment, net | $ | 134,409 | | | $ | 116,018 | | | |
For the years ended December 31, 2024, 2023 and 2022, depreciation expense was $23.4 million, $21.1 million and $19.2 million, respectively.
Depreciation expense is recognized in Cost of sales and Selling, general and administrative expenses on the consolidated statements of income.
The components of certain equipment leased to third parties under operating leases, which are included within Property, plant and equipment, net in the consolidated balance sheets, were as follows as of December 31;
| | | | | | | | | | | |
| 2024 | | 2023 |
| (In thousands) |
| Machinery and equipment | $ | 59,549 | | | $ | 56,186 | |
| Less: accumulated depreciation | 29,687 | | | 29,134 | |
| Property, plant and equipment, net | $ | 29,862 | | | $ | 27,052 | |
Note 5 – Goodwill and Other Intangible Assets
Goodwill
The Company’s carrying amount of goodwill remained unchanged at $143.2 million as of both December 31, 2024 and 2023. The Company’s reporting units are Electrical & Mechanical, Transmission & Distribution, and Wagner Smith Equipment (“WSE”). WSE is within the Transmission & Distribution reportable segment. Goodwill also remained unchanged for each reportable segment as of both December 31, 2024 and 2023, with $115.9 million for Electrical & Mechanical and $27.3 million for Transmission & Distribution. No impairments of goodwill were recorded for the years ended December 31, 2024, 2023 and 2022.
Other Intangible Assets, Net
Other amortizable intangible assets as of December 31 were as follows:
| | | | | | | | | | | |
| 2024 | | 2023 |
| (In thousands) |
| Noncompete agreements | $ | — | | | $ | 292 | |
| Less: accumulated amortization | — | | | 292 | |
| Net noncompete agreements | — | | | — | |
| Customer relationships | 10,450 | | | 10,450 | |
| Less: accumulated amortization | 10,334 | | | 8,446 | |
| Net customer relationships | 116 | | | 2,004 | |
| Total | $ | 116 | | | $ | 2,004 | |
EVERUS CONSTRUCTION GROUP, INC.
Amortization expense for finite-lived intangible assets was $1.9 million, $2.1 million and $2.2 million for the years ended December 31, 2024, 2023 and 2022, respectively. Amortization expense is recognized in Selling, general and administrative expenses in the consolidated statements of income. No impairments of finite-lived intangible assets were recorded for the years ended December 31, 2024, 2023 and 2022.
Future amortization expense for finite-lived intangible assets as of December 31, 2024, is estimated to be as follows:
| | | | | | | | | | | | | | | | | | | | | | | | | | | | | | | | | | | | | |
| 2025 | | 2026 | | 2027 | | 2028 | | 2029 | | Total | | |
| (In thousands) | | |
| Amortization expense | $ | 116 | | | $ | — | | | $ | — | | | $ | — | | | $ | — | | | $ | 116 | | | |
Note 6 – Fair Value Measurements
Fair value is defined as the price that would be received to sell an asset or paid to transfer a liability (an exit price) in an orderly transaction between market participants at the measurement date. ASC 820 - Fair Value Measurement (“ASC 820”) establishes a three-tier hierarchy for grouping assets and liabilities, based on the significance and availability of inputs in active markets. The estimated fair values of the Company’s assets and liabilities measured on a recurring basis are determined using the market approach.
In general, fair values determined by Level 1 inputs use quoted prices in active markets for identical assets or liabilities. Fair values determined by Level 2 inputs use data points that are observable such as quoted prices, interest rates and yield curves. Fair values determined by Level 3 inputs are “unobservable data points” for the asset or liability and include situations where there is little, if any, market activity for the asset or liability.
Assets and Liabilities Measured at Fair Value on a Recurring Basis
The Company measured its investments in certain fixed-income and equity securities at fair value with changes in fair value recognized in the consolidated statements of income. The Company anticipates using these investments, which consist of insurance contracts, to satisfy its obligations under its unfunded, nonqualified deferred compensation plan for the Company’s executive officers and certain key management employees. The Company invests in these fixed-income and equity securities for the purpose of earning investment returns and capital appreciation. Prior to the Separation, the Company was a participant in MDU Resources’ benefit and compensation plans. These investments, which totaled $4.8 million and $5.0 million as of December 31, 2024 and 2023, respectively, were included in Investments on the consolidated balance sheets. The Company recognized net unrealized gains on these investments of $0.6 million for the year ended December 31, 2024. The net unrealized gains and losses on these investments were immaterial for the years ended December 31, 2023 and December 31, 2022, respectively. The changes in fair value were classified in Other income on the consolidated statements of income.
The Company’s Level 2 money market funds were included as a part of Investments on the consolidated balance sheets and are valued at the net asset value of shares held at the end of the period, based on published market quotations on active markets or using other known sources, including pricing from outside sources. The estimated fair value of the Company’s Level 2 insurance contracts was based on contractual cash surrender values that were determined primarily by investments in managed separate accounts of the insurer. These amounts approximated fair value. The managed separate accounts were valued based on other observable inputs or corroborated market data.
Though the Company believes the methods used to estimate fair value are consistent with those used by other market participants, the use of other methods or assumptions could result in a different estimate of fair value.
The estimated fair values of the Company’s Cash, cash equivalents and restricted cash, Receivables, Accounts payable and Other accrued liabilities approximated their carrying value due to the short-term maturities of these instruments.
The carrying value of the Company’s long-term debt as of December 31, 2023, classified as Related-party notes payable, approximated fair value based on a comparison with current prevailing market rates for borrowings of similar risks and maturities. In connection with the Separation, the Company used the net proceeds of newly issued debt to repay its Related-party notes payable, which were no longer outstanding as of December 31, 2024. Refer to Note 15 – Related-Party Transactions for additional information.
The Company has a captive insurance arrangement in which a Captive Cell within a captive insurance company holds cash, classified as restricted cash, and certain other accrued liabilities and other noncurrent liabilities in order to manage and administer insurance claims on behalf of the Company. The fair value of the assets and liabilities held by the Captive Cell
EVERUS CONSTRUCTION GROUP, INC.
approximated their fair value as of December 31, 2024. Refer to Note 2 – Basis of Presentation and Summary of Significant Accounting Policies for additional information on the Company’s captive insurance arrangement.
The Company’s assets measured at fair value on a recurring basis were as follows:
| | | | | | | | | | | | | | | | | | | | | | | |
| Fair Value Measurements as of December 31, 2024, Using |
| Quoted Prices in Active Markets for Identical Assets (Level 1) | | Significant Other Observable Inputs (Level 2) | | Significant Unobservable Inputs (Level 3) | | Balance as of December 31, 2024 |
| (In thousands) |
| Assets: | | | | | | | |
| | | | | | | |
| Insurance contracts | $ | — | | | $ | 4,766 | | | $ | — | | | $ | 4,766 | |
| Total assets measured at fair value | $ | — | | | $ | 4,766 | | | $ | — | | | $ | 4,766 | |
| | | | | | | | | | | | | | | | | | | | | | | |
| Fair Value Measurements as of December 31, 2023, Using |
| Quoted Prices in Active Markets for Identical Assets (Level 1) | | Significant Other Observable Inputs (Level 2) | | Significant Unobservable Inputs (Level 3) | | Balance as of December 31, 2023 |
| (In thousands) |
| Assets: | | | | | | | |
| Money market funds | $ | — | | | $ | 1,725 | | | $ | — | | | $ | 1,725 | |
| Insurance contracts | — | | | 5,005 | | | — | | | 5,005 | |
| Total assets measured at fair value | $ | — | | | $ | 6,730 | | | $ | — | | | $ | 6,730 | |
Assets and Liabilities Measured at Fair Value on a Nonrecurring Basis
The Company applies the provisions of ASC 820 to its nonrecurring, non-financial measurements, including long-lived asset impairments. These assets are not measured at fair value on an ongoing basis but are subject to fair value adjustments only in certain circumstances. The Company reviews the carrying value of its long-lived assets, excluding goodwill, whenever events or changes in circumstances indicate that such carrying amounts may not be recoverable. Refer to Note 2 – Basis of Presentation and Summary of Significant Accounting Policies for additional information on impairment of long-lived assets.
Assets and Liabilities Not Measured at Fair Value
The Company's long-term debt as of December 31, 2024 was not measured at fair value on the consolidated balance sheet, but the corresponding fair value is being provided for disclosure purposes only. The fair value was categorized as Level 2 in the fair value hierarchy and was based on discounted cash flows using current market interest rates. Refer to Note 7 – Debt for additional information on the Company’s long-term debt.
The estimated fair value of the Company's Level 2 long-term debt was as follows:
| | | | | | | |
| As of December 31, 2024 | | |
| (In thousands) | | |
| Carrying value | $ | 300,000 | | | |
| Fair value | $ | 298,559 | | | |
Note 7 – Debt
Certain debt instruments of the Company contain restrictive and financial covenants and cross-default provisions. In order to borrow under the debt instruments, the Company must be in compliance with the applicable covenants and certain other conditions, all of which management believes the Company, as applicable, was in compliance with as of December 31, 2024. In the event the Company does not comply with the applicable covenants and other conditions, it would be in default on its agreements and alternative sources of funding may need to be pursued.
EVERUS CONSTRUCTION GROUP, INC.
Long-Term Debt
Long-term debt outstanding was as follows:
| | | | | | | | | | | | | |
| Weighted Average Interest Rate as of December 31, 2024 | | As of December 31, 2024 | | |
| (In percentage) | | (In thousands) | | |
| Term loan due on October 31, 2029 | 6.84 | % | | $ | 300,000 | | | |
| | | | | |
| Less: unamortized debt issuance costs | | | 4,352 | | | |
| Total debt | | | 295,648 | | | |
| Less: current maturities | | | 15,000 | | | |
| Total long-term debt | | | $ | 280,648 | | | |
Term Loan and Revolving Credit Facility
On October 31, 2024, the Company entered into a five-year senior secured credit agreement (“Credit Agreement”), which provides for a $300.0 million term loan (“Term Loan”) and a $225.0 million revolving credit facility (“Revolving Credit Facility”). The Revolving Credit Facility includes letters of credit available under the Credit Agreement in an aggregate amount of up to $50.0 million. The Company drew $40.0 million under the Revolving Credit Facility on the Separation date for projected working capital needs.
On November 29, 2024, the Company repaid the $40.0 million outstanding balance, plus accrued interest, under the Revolving Credit Facility. As of December 31, 2024, there was no outstanding balance under the Revolving Credit Facility, but there were $15.6 million of outstanding standby letters of credit. As a result, the Company had a borrowing capacity of $209.4 million under the Revolving Credit Facility.
The Company incurred $4.4 million and $3.5 million of debt issuance costs for the Term Loan and Revolving Credit Facility, respectively. The costs associated with the Term Loan were capitalized and classified as a reduction to Long-term debt and the costs associated with the Revolving Credit Facility were capitalized and recorded as Other noncurrent assets. Each will be amortized to Interest expense over the term of the Credit Agreement.
The Company incurred $4.1 million of Interest expense related to the Credit Agreement for the year ended December 31, 2024, consisting of $3.7 million of interest on outstanding borrowings, $0.3 million of debt issuance costs amortization and $0.1 million of unused commitment fees. The Company did not incur any Interest expense related to the Credit Agreement for the years ended December 31, 2023 and 2022 as the agreement had not yet commenced during these periods. Refer to Note 15 – Related-Party Transactions for additional information on related-party interest expense pertaining to periods prior to the Separation.
The Term Loan requires quarterly amortization payments of 5.00% per annum of the original principal amount thereof. The Credit Agreement also requires mandatory prepayments in connection with certain asset sales, subject to certain exceptions.
Borrowings under the Credit Agreement bear interest equal to, at the Company’s option, at an annual rate equal to (a) adjusted term SOFR, defined in a customary manner (“Term SOFR”) plus an applicable rate of 2.00% to 2.75%, based on the Company’s total net leverage ratio, or (b) the base rate (determined by reference to the highest of (x) the prime rate, (y) the greater of (i) the federal funds effective rate and (ii) the overnight bank funding rate, in each case, plus 0.50% and (z) the one-month adjusted Term SOFR rate plus 1.00% per annum, subject to customary floors (clauses (x) through (z), the “Base Rate”)) plus an applicable rate of 1.00% to 1.75%, based on the Company’s total net leverage ratio. Undrawn commitment fees under the Revolving Credit Facility range from 0.30% to 0.45% based on the Company’s consolidated total net leverage ratio.
The Credit Agreement provides for incremental revolving and term facilities at the Company’s request and at the discretion of the lenders or other persons providing such incremental facilities, and also permits the Company to incur other secured or unsecured debt, in all cases subject to conditions and limitations on the amount of such incremental facility or other debt as specified in the Credit Agreement.
The Credit Agreement contains certain limitations with respect to indebtedness, liens, acquisitions and other investments, fundamental changes, restrictive agreements, dividends and redemptions or repurchases of stock, prepayments of certain subordinated indebtedness, dispositions of assets and transactions with affiliates, in each case subject to certain exceptions.
EVERUS CONSTRUCTION GROUP, INC.
The Credit Agreement contains financial covenants requiring the Company to maintain a maximum consolidated total net leverage ratio of 3.00 to 1.00 and a minimum interest coverage ratio of 3.00 to 1.00, each determined as of the end of each fiscal quarter. The consolidated total net leverage ratio may be increased at the Company’s option to 3.50 to 1.00 in connection with certain qualifying material acquisitions. The covenants also include restrictions on the sale of certain assets, loans and investments.
Schedule of Debt Maturities
The amounts of scheduled long-term debt maturities, excluding unamortized debt issuance costs, for the five years following December 31, 2024, aggregate as follows:
| | | | | | | | | | | | | | | | | | | | | | | | | | | | | | | | | | | | | |
| 2025 | | 2026 | | 2027 | | 2028 | | 2029 | | Total | | |
| (In thousands) | | |
| Long-term debt maturities, including current portion | $ | 15,000 | | | $ | 15,000 | | | $ | 15,000 | | | $ | 15,000 | | | $ | 240,000 | | | $ | 300,000 | | | |
Note 8 – Leases
Most of the leases the Company enters into are for equipment, buildings and vehicles as part of its ongoing operations. The Company also leases certain equipment to third parties.
Lessee Accounting
The leases the Company has entered into as part of its ongoing operations are considered operating leases. The corresponding lease costs are included in Cost of sales and Selling, general and administrative expenses on the consolidated statements of income.
Generally, leases for vehicles and equipment have a term of five years or less and buildings have a longer term of up to 35 years or more. For certain leases, lease terms may include the options to extend or terminate the lease. Similarly, building or property leases could include one or more options to renew, with renewal terms that could extend the lease term one to five years or more.
The Company also has guaranteed the residual value under certain of its equipment operating leases, agreeing to pay any difference between the residual value and the fair market value of the underlying asset at the date of lease termination. Historically, the fair value of the asset at the time of lease termination generally has approximated or exceeded the residual value guarantee. To date, the Company does not have any residual value guarantee amounts probable of being owed to a lessor, financing leases or material agreements with related parties.
In March 2024, in anticipation of the Separation, the Company entered into a 60 month lease for a new corporate headquarters, with a lease term of August 1, 2024 through July 31, 2029. The new corporate headquarters, which is located in Bismarck, North Dakota, is for 16,188 square feet with average annual rent payments and average annual common area maintenance charges totaling approximately $303 thousand and $102 thousand, respectively, for the duration of the lease.
The following table provides information on the Company’s lease costs for operating leases:
| | | | | | | | | | | | | | | | | |
| Years Ended December 31, |
| 2024 | | 2023 | | 2022 |
| (In thousands) |
| Lease costs: | | | | | |
| Operating lease cost | $ | 31,274 | | | $ | 26,386 | | | $ | 24,518 | |
Variable lease cost(1) | 1,232 | | | 1,215 | | | 1,228 | |
Short-term lease cost(1) | 107,421 | | | 99,964 | | | 103,075 | |
| Total lease costs | $ | 139,927 | | | $ | 127,565 | | | $ | 128,821 | |
__________________
(1)Subsequent to the filing of the audited consolidated financial statements for the year ended December 31, 2023 in the Form 10, the Company’s management determined that the Company incorrectly presented variable lease cost and short-term lease cost due to a clerical error when preparing the financial statements, including the related footnotes. The amount in the preceding table has been revised to correct the impact of this classification error for the year ended December 31, 2023. The reclassification error had no impact to results of operations, the balance sheet, or cash flows for the period described.
EVERUS CONSTRUCTION GROUP, INC.
The following is summary information of lease terms and discount rates for operating leases as of December 31:
| | | | | | | | | | | |
| 2024 | | 2023 |
| Weighted average remaining lease term (in years) | 1.38 years | | 1.34 years |
| Weighted average discount rate (in percentages) | 5.50 | % | | 4.94 | % |
The following is a summary of other information and supplemental cash flow information related to operating leases:
| | | | | | | | | | | | | | | | | |
| Years Ended December 31, |
| 2024 | | 2023 | | 2022 |
| (In thousands) |
| Cash paid for amounts included in the measurement of lease liabilities: |
| |
| |
|
| Operating cash flows used for operating lease liabilities | $ | 31,156 | | | $ | 26,810 | | | $ | 24,071 | |
| Right-of-use assets obtained in exchange for new operating lease liabilities | $ | 44,214 | | | $ | 43,917 | | | $ | 37,834 | |
The reconciliation of future undiscounted cash flows to operating lease liabilities, including current portion of operating lease liabilities, presented on the consolidated balance sheets, was as follows:
| | | | | |
| As of December 31, 2024 |
| (In thousands) |
| 2025 | $ | 29,239 | |
| 2026 | 20,086 | |
| 2027 | 12,391 | |
| 2028 | 6,088 | |
| 2029 | 2,953 | |
| Thereafter | 3,091 | |
| Total | 73,848 | |
| Less: discount | 6,294 | |
| Total operating lease liabilities | $ | 67,554 | |
The Company entered into a $4.2 million operating lease that had not yet commenced as of December 31, 2024. The operating lease has a lease term of three years and will commence in March 2025.
Lessor Accounting
The Company leases certain equipment to third parties. These leases are considered short-term operating leases with terms of less than 12 months. The Company recognizes revenue from operating leases in Operating revenues in the consolidated statements of income on a straight-line basis over the respective operating lease terms.
The Company recognized revenue from operating leases of $41.4 million, $45.3 million and $47.4 million for the years ended December 31, 2024, 2023 and 2022, respectively.
As of December 31, 2024 and 2023, the Company had $11.3 million and $9.3 million, respectively, of lease receivables in Receivables, net on the consolidated balance sheets with a majority due within 12 months or less from the respective balance sheet dates.
The Company leases components of certain equipment to third parties under operating leases, which are included within Property, plant and equipment, net. Refer to Note 4 – Property, Plant and Equipment, Net for additional information.
Note 9 – Earnings Per Share
Prior to the Separation, Everus Construction had 1,000 common shares issued and outstanding. On October 31, 2024, as part of the Distribution, 50,972,059 shares of Everus common stock were issued and outstanding. Basic and diluted earnings per share for periods prior to the Separation and Distribution have been retrospectively adjusted to incorporate the Everus shares outstanding on the Distribution date. For comparative purposes, and to provide meaningful insight into the weighted average common shares calculation, the Distribution date share count was assumed to be outstanding throughout periods prior to the
EVERUS CONSTRUCTION GROUP, INC.
Separation and Distribution in the calculation of basic weighted average common shares outstanding. In addition, for periods prior to the Separation and Distribution, it was assumed that there were no dilutive or anti-dilutive equity instruments as there were no Everus stock-based awards outstanding during those periods.
Basic earnings per share is calculated by dividing net income by the weighted average number of shares of common stock outstanding during the applicable period. The Company calculates diluted earnings per share using the treasury stock method. Diluted earnings per share is calculated by dividing net income by the total of the weighted average number of shares of common stock outstanding during the applicable period, plus the effect of any potentially dilutive securities, except in cases where the effect of such securities would be anti-dilutive.
Basic and diluted earnings per share were calculated as follows, based on a reconciliation of the weighted-average common shares outstanding on a basic and diluted basis:
| | | | | | | | | | | | | | | | | |
| Years ended December 31, |
| 2024 | | 2023 | | 2022 |
| (In thousands, except per share amounts) |
| Net income | $ | 143,421 | | | $ | 137,230 | | | $ | 124,781 | |
| | | | | |
| Weighted average common shares outstanding - basic | 50,973 | | 50,972 | | 50,972 |
| Effect of dilutive securities - share-based awards | 99 | | 0 | | 0 |
| Weighted average common shares outstanding - diluted | 51,072 | | 50,972 | | 50,972 |
| | | | | |
| Earnings per share - basic | $ | 2.81 | | | $ | 2.69 | | | $ | 2.45 | |
| Earnings per share - diluted | $ | 2.81 | | | $ | 2.69 | | | $ | 2.45 | |
| | | | | |
| | | | | |
For the year ended December 31, 2024, there were no shares excluded from the calculation of diluted earnings per share due to their anti-dilutive effect.
Note 10 – Stock-Based Compensation
Prior to the Separation, key employees of the Company participated in the stock-based compensation plans authorized and managed by MDU Resources. In connection with MDU Resources’ separation of Knife River Corporation (“Knife River”) on May 31, 2023, the provisions of the existing MDU Resources’ compensation plans required adjustments to the number and terms of outstanding employee time-vested restricted stock units and performance share awards to preserve the intrinsic value of the awards immediately prior to the Knife River separation.
However, the outstanding performance share awards would no longer be subject to performance-based vesting conditions. The performance share awards were first adjusted for performance. The combined performance factors were determined based on the performance of MDU Resources as of December 31, 2022. Then, at the time of the Knife River separation, all outstanding stock-based compensation awards of MDU Resources were converted into MDU Resources restricted stock units. Following the Knife River separation, no performance share awards existed.
In addition, similar required adjustments were needed to the number and terms of outstanding MDU Resources restricted stock units to preserve the intrinsic value of the awards immediately prior to the Separation. At the time of Separation, all outstanding MDU Resources restricted stock units held by Company employees were converted into Everus restricted stock units.
The number of restricted stock units was determined by taking the closing per share price of MDU Resources on October 31, 2024, and dividing by the closing per share price of Everus on November 1, 2024. The ratio used to convert the MDU Resources’ share-based awards was designed to preserve the aggregate intrinsic value of the award immediately after the Separation when compared to the aggregate intrinsic value of the award immediately prior to the Separation. The existing unvested stock-based awards issued through MDU Resources’ stock-based compensation plans were modified in connection with the Separation to maintain an equivalent value immediately before and after Separation. Everus did not incur any incremental compensation expenses related to the conversion of the restricted stock units. The outstanding awards will continue to vest over the original vesting periods of three years from the respective grant dates, contingent on continued employment.
Following the Separation, the Company has its own stock-based compensation plan under which it currently is authorized to grant 2.5 million restricted stock units and other stock awards. As of December 31, 2024, there were 2.5 million shares
EVERUS CONSTRUCTION GROUP, INC.
available to grant under this plan. The Company either purchases shares on the open market or issues new shares of common stock to satisfy the vesting of stock-based awards.
Total stock-based compensation expense, including Company participants and non-employee directors, was $1.6 million, $0.8 million, and $1.1 million in 2024, 2023, and 2022, respectively, and is included in Selling, general and administrative expenses in the consolidated statements of income.
Stock Awards
Non-employee directors receive shares of common stock in addition to cash payments for directors’ fees. On November 26, 2024, the Company granted 8,865 shares with a grant date fair value of $0.6 million to non-employee directors.
Restricted Stock Units
In February 2024, 2023, and 2022, key employees of the Company were granted restricted stock units under MDU Resources’ long-term performance-based incentive plan authorized by MDU Resources’ compensation committee. MDU Resources’ compensation committee had the authority to select recipients of awards, determine the type and size of awards, and establish certain terms and conditions of award grants. The restricted stock units vest over three years, contingent on continued employment. Compensation expense is recognized over the vesting period. Upon vesting, participants receive dividends that accumulate during the vesting period.
As previously discussed, adjustments were made to the number of MDU Resources restricted stock units to preserve the intrinsic value of the awards in connection with the separation of Knife River in 2023 and outstanding MDU Resources performance share awards were converted to MDU Resources restricted stock units. And at the time of Separation, MDU Resources restricted stock units were converted to Everus restricted stock units for outstanding restricted stock awards granted to Everus employees.
A summary of restricted stock units, including the conversion to Everus restricted stock units, for the year ended December 31, 2024 was as follows:
| | | | | | | | | | | | | | | | |
| | | Restricted Stock Units | |
| | | | | Number of Shares | | Weighted Average Grant-Date Fair Value** | |
| | | | | | | | |
| | | | | | | | |
| | | | | | | | |
| | | | | | | | |
| Nonvested pre-Separation | | | | | 243,327 | | | $ | 21.37 | | |
| Conversion to Everus restricted stock units* | | | | | (109,596) | | | | |
| | | | | | | | |
| Vested shares | | | | | (30,939) | | | 40.72 | | |
| | | | | | | | |
| Nonvested as of December 31, 2024 | | | | | 102,792 | | | $ | 38.33 | | |
__________________
*Includes the conversion adjustments to preserve the intrinsic value of the awards.
** Weighted average grant-date fair values represent post-separations of Knife River Corporation and the Company from MDU Resources in 2023 and 2024, respectively.
As of December 31, 2024, total remaining unrecognized compensation expense related to the restricted stock units was approximately $2.1 million, which will be amortized over a weighted average period of 1.7 years.
Historical Performance Share Awards
In February 2022, key employees of the Company were granted performance share awards under MDU Resources’ long-term performance-based incentive plan authorized by MDU Resources’ compensation committee. The compensation committee had the authority to select recipients of awards, determine the type and size of awards, and establish certain terms and conditions of award grants. Share awards were generally earned over a three-year vesting period and tied to specific financial metrics. Upon vesting, participants may receive dividends that accumulate during the vesting period. However, as previously discussed, the outstanding performance share awards were converted to restricted stock units of MDU Resources in connection with the Knife River separation. As a result, there were no outstanding performance share awards as of December 31, 2024 or 2023, respectively.
Under the market condition for these performance share awards, participants could earn from zero to 200% of the apportioned target grant of shares based on MDU Resources’ total stockholder return relative to that of the selected peer group. Compensation expense was based on the grant-date fair value as determined by a Monte Carlo simulation.
EVERUS CONSTRUCTION GROUP, INC.
Note 11 – Income Taxes
Income tax expense on the consolidated statements of income was as follows:
| | | | | | | | | | | | | | | | | |
| Years ended December 31, |
| 2024 | | 2023 | | 2022 |
| (In thousands) |
| Current: | | | | | |
| Federal | $ | 36,964 | | | $ | 39,468 | | | $ | 32,198 | |
| State | 10,933 | | | 8,923 | | | 7,530 | |
| Total current | 47,897 | | | 48,391 | | | 39,728 | |
| Deferred: | | | | | |
| Federal | 1,214 | | | (2,629) | | | 1,066 | |
| State and city | 412 | | | (476) | | | (6) | |
| Total deferred | 1,626 | | | (3,105) | | | 1,060 | |
| Total income tax expense | $ | 49,523 | | | $ | 45,286 | | | $ | 40,788 | |
Components of deferred tax assets and deferred tax liabilities as of December 31 were as follows:
| | | | | | | | | | | |
| 2024 | | 2023 |
| (In thousands) |
| Deferred tax assets: | | | |
| Operating lease liabilities | $ | 16,808 | | | $ | 13,951 | |
| Compensation-related | 13,573 | | | 10,256 | |
| Research and development costs | 5,596 | | | 3,861 | |
| Workers’ compensation reserve | 1,878 | | | 1,497 | |
| Employee benefit plans costs | 1,614 | | | 1,046 | |
| Bad debt reserve | 1,437 | | | 1,760 | |
| | | |
| Capital investment overhead on contracts | 535 | | | 458 | |
| Other | 2,764 | | | 4,076 | |
| Total deferred tax assets | 44,205 | | | 36,905 | |
| Deferred tax liabilities: | | | |
| Basis differences on property, plant and equipment | (17,664) | | | (17,173) | |
| Operating lease right-of-use-assets | (16,672) | | | (13,825) | |
| Intangible assets | (10,912) | | | (10,372) | |
| Prepaid expenses | (6,597) | | | (1,256) | |
| | | |
| | | |
| Total deferred tax liabilities | (51,845) | | | (42,626) | |
| Valuation allowance | (521) | | | (814) | |
| Net deferred income tax liabilities | $ | (8,161) | | | $ | (6,535) | |
As of both December 31, 2024 and 2023, the Company had various state income tax net operating loss carryforwards of $16.5 million. The state income tax net operating loss carryforwards are due to expire beginning in 2031. It is likely that a portion of the benefit from certain carryforwards will not be realized; therefore, valuation allowances have been provided. As of December 31, 2024 and 2023, the total valuation allowance on deferred tax assets, related to the state income tax net operating loss carryforwards, was approximately $0.5 million and $0.8 million, respectively. The decrease in the Company’s valuation allowance as of December 31, 2024, was primarily the result of a change in state tax rates. Changes in tax regulations or assumptions regarding current and future taxable income could require an adjustment to the valuation allowance in the future.
EVERUS CONSTRUCTION GROUP, INC.
Total income tax expense differs from the amount computed by applying the statutory federal income tax rate to income before taxes. The reasons for this difference were as follows:
| | | | | | | | | | | | | | | | | | | | | | | | | | | | | | | | | | | |
| Years ended December 31, |
| 2024 | | 2023 | | 2022 |
| Amount | | % | | Amount | | % | | Amount | | % |
| (In thousands, except percentages) |
| Computed tax at federal statutory rate | $ | 40,518 | | | 21.0 | % | | $ | 38,328 | | | 21.0 | % | | $ | 34,769 | | | 21.0 | % |
| Increases (reductions) resulting from: | | | | | | | | | | | |
| State income taxes, net of federal income tax | 9,085 | | | 4.7 | | | 7,714 | | | 4.2 | | | 6,423 | | | 3.9 | |
| Tax compliance and uncertain tax positions | (751) | | | (0.3) | | | (1,506) | | | (0.8) | | | (275) | | | (0.2) | |
| Other | 671 | | | 0.3 | | | 750 | | | 0.4 | | | (129) | | | (0.1) | |
| Total income tax expense | $ | 49,523 | | | 25.7 | % | | $ | 45,286 | | | 24.8 | % | | $ | 40,788 | | | 24.6 | % |
Reconciliations of unrecognized tax benefits were as follows as of December 31:
| | | | | | | | | | | | | | | | | |
| 2024 | | 2023 | | 2022 |
| (In thousands) |
| Balance at beginning of year | $ | 656 | | | $ | 570 | | | $ | 513 | |
| Additions based on tax positions related to current year | 145 | | | 145 | | | 145 | |
| Additions for tax positions of prior years | 78 | | | 279 | | | 15 | |
| Reductions for tax positions of prior years | — | | | (60) | | | (35) | |
| | | | | |
| Reductions resulting from a lapse of the applicable statute of limitations periods | (147) | | | (278) | | | (68) | |
| Balance at end of year | $ | 732 | | | $ | 656 | | | $ | 570 | |
The Company’s accrued interest and penalties and recognized interest and penalties related to unrecognized tax benefits for each of the years ended December 31, 2024, 2023, and 2022, were immaterial. The liability for all unrecognized tax benefits is recorded in Taxes payable and accrued interest and penalties is recorded in Other accrued liabilities on the consolidated balance sheets.
The Company and its subsidiaries file income tax returns in the U.S. federal jurisdiction and various state and local jurisdictions. The Company is no longer subject to U.S. federal tax examinations by tax authorities for years ending prior to 2021. With few exceptions, as of December 31, 2024, the Company is no longer subject to state and local income tax examinations by tax authorities for years ending prior to 2021.
Note 12 – Business Segment Data
The Company’s reportable segments are those that are based on the Company’s method of internal reporting and management of the business. The Company provides a full spectrum of construction services across most of the United States through two operating segments, which represent its two reportable segments:
Electrical & Mechanical: Contracting services for the construction and maintenance of electrical and communication wiring and infrastructure, fire suppression systems, and mechanical piping and services to customers in both the public and private sectors.
Transmission & Distribution: Contracting services for the construction and maintenance of overhead and underground electrical, gas and communication infrastructure, as well as design, manufacturing and distribution of overhead and underground transmission line construction equipment and tools.
The Company’s Chief Operating Decision Maker (“CODM”) is the Company’s chief executive officer (“CEO”). The Company’s CEO evaluates each reportable segments’ performance, allocates resources and makes decisions based on segment operating income, which is the segment measure of profitability. The CODM uses segment operating income to analyze the results of each reportable segment individually and by comparing the results of the segments with each other. This comparison between segments helps drive decision-making regarding resource allocation and compensation of employees. Segment
EVERUS CONSTRUCTION GROUP, INC.
operating income is also considered when creating the annual budget plan, as well as the forecasting process, including the allocation of capital for uses such as capital expenditures.
All intercompany balances and transactions between the businesses comprising the Company have been eliminated in the consolidated financial statements.
Reconciliations of reportable segment operating revenues, inclusive of the Company’s significant segment expenses of Cost of sales and Selling, general and administrative expenses, to consolidated Income before income taxes and income from equity method investments for the Company’s reportable segments and “Corporate and Other” category were as follows:
| | | | | | | | | | | | | | | | | | | | | | | |
| Year ended December 31, 2024 | E&M | | T&D | | Corporate and Other | | Consolidated Total |
| (In thousands) |
| | | | | | | |
| | | | | | | |
| Segment operating revenues | $ | 2,031,447 | | | $ | 837,146 | | | $ | — | | | $ | 2,868,593 | |
| Eliminations | (7,536) | | | (11,372) | | | — | | | (18,908) | |
| Total segment operating revenues | 2,023,911 | | | 825,774 | | | — | | | 2,849,685 | |
| | | | | | | |
| | | | | | | |
| | | | | | | |
| | | | | | | |
| | | | | | | |
| Cost of sales | 1,804,095 | | | 703,152 | | | 2,987 | | | 2,510,234 | |
| Gross profit | 219,816 | | | 122,622 | | | (2,987) | | | 339,451 | |
| | | | | | | |
| | | | | | | |
| | | | | | | |
| | | | | | | |
| | | | | | | |
| | | | | | | |
| | | | | | | |
| | | | | | | |
| | | | | | | |
| Selling, general and administrative expenses | 82,845 | | | 37,567 | | | 29,132 | | | 149,544 | |
| | | | | | | |
| Operating income | $ | 136,971 | | | $ | 85,055 | | | $ | (32,119) | | | 189,907 | |
| Interest expense | | | | | | | 14,023 | |
| Other income | | | | | | | 4,875 | |
| Total consolidated income before income taxes and income from equity method investments | | | | | | | $ | 180,759 | |
| | | | | | | | | | | | | | | | | | | | | | | |
| Year ended December 31, 2023 | E&M | | T&D | | Corporate and Other | | Consolidated Total |
| (In thousands) |
| | | | | | | |
| | | | | | | |
| Segment operating revenues | $ | 2,134,867 | | | $ | 734,577 | | | $ | — | | | $ | 2,869,444 | |
| Eliminations | (9,324) | | | (5,730) | | | — | | | (15,054) | |
| Total segment operating revenues | 2,125,543 | | | 728,847 | | | — | | | 2,854,390 | |
| | | | | | | |
| | | | | | | |
| | | | | | | |
| | | | | | | |
| | | | | | | |
| Cost of sales | 1,911,721 | | | 620,738 | | | 13 | | | 2,532,472 | |
| Gross profit | 213,822 | | | 108,109 | | | (13) | | | 321,918 | |
| | | | | | | |
| | | | | | | |
| | | | | | | |
| | | | | | | |
| | | | | | | |
| | | | | | | |
| | | | | | | |
| | | | | | | |
| | | | | | | |
| Selling, general and administrative expenses | 79,445 | | | 34,499 | | | 17,431 | | | 131,375 | |
| | | | | | | |
| Operating income | $ | 134,377 | | | $ | 73,610 | | | $ | (17,444) | | | 190,543 | |
| Interest expense | | | | | | | 16,954 | |
| Other income | | | | | | | 3,981 | |
| Total consolidated income before income taxes and income from equity method investments | | | | | | | $ | 177,570 | |
EVERUS CONSTRUCTION GROUP, INC.
| | | | | | | | | | | | | | | | | | | | | | | |
| Year ended December 31, 2022 | E&M | | T&D | | Corporate and Other | | Consolidated Total |
| (In thousands) |
| | | | | | | |
| | | | | | | |
| Segment operating revenues | $ | 1,997,840 | | | $ | 717,393 | | | $ | — | | | $ | 2,715,233 | |
| Eliminations | (9,111) | | | (6,872) | | | — | | | (15,983) | |
| Total segment operating revenues | 1,988,729 | | | 710,521 | | | — | | | 2,699,250 | |
| | | | | | | |
| | | | | | | |
| | | | | | | |
| | | | | | | |
| | | | | | | |
| Cost of sales | 1,816,938 | | | 606,097 | | | 169 | | | 2,423,204 | |
| Gross profit | 171,791 | | | 104,424 | | | (169) | | | 276,046 | |
| | | | | | | |
| | | | | | | |
| | | | | | | |
| | | | | | | |
| | | | | | | |
| | | | | | | |
| | | | | | | |
| | | | | | | |
| | | | | | | |
| Selling, general and administrative expenses | 66,830 | | | 32,089 | | | 12,483 | | | 111,402 | |
| | | | | | | |
| Operating income | $ | 104,961 | | | $ | 72,335 | | | $ | (12,652) | | | 164,644 | |
| Interest expense | | | | | | | 6,354 | |
| Other income | | | | | | | 1,379 | |
| Total consolidated income before income taxes and income from equity method investments | | | | | | | $ | 159,669 | |
Additional financial information on the Company’s reportable segments is shown below, which follows the same accounting policies as those described in Note 2 – Basis of Presentation and Summary of Significant Accounting Policies:
| | | | | | | | | | | | | | | | | | | | | | | | | | | | | | | | | | | |
| Years Ended December 31, | 2024 | | 2023 | | 2022 |
| E&M | | T&D | | E&M | | T&D | | E&M | | T&D |
| (In thousands) |
| | | | | | | | | | | |
| | | | | | | | | | | |
| Depreciation and amortization expense | $ | 6,358 | | | $ | 19,099 | | | $ | 6,200 | | | $ | 17,108 | | | $ | 5,751 | | | $ | 15,816 | |
| | | | | | | | | | | |
| Interest expense | (800) | | | 4,027 | | | 4,957 | | | 4,490 | | | 2,572 | | | 1,406 | |
| Income taxes | 38,609 | | | 20,989 | | | 33,143 | | | 17,399 | | | 26,318 | | | 17,628 | |
| | | | | | | | | | | |
| Capital expenditures* | $ | 7,944 | | | $ | 40,355 | | | $ | 4,853 | | | $ | 30,736 | | | $ | 6,373 | | | $ | 29,471 | |
| | | | | | | | | | | |
| | | | | | | |
| | | | | | | | | | | |
| | | | | |
| | | | | | | | | | | |
| | | | | | | | | | | |
| | | | | | | | | | | |
__________________
*Capital expenditures for 2024, 2023 and 2022 include noncash transactions for capital expenditure-related accounts payable.
Reconciliations of reportable segment assets to consolidated assets were as follows as of December 31:
| | | | | | | | | | | |
| 2024 | | 2023 |
| (In thousands) |
| E&M segment assets | $ | 764,470 | | | $ | 657,731 | |
| T&D segment assets | 410,887 | | | 373,617 | |
| Total reportable segment assets | 1,175,357 | | | 1,031,348 | |
| Other assets | 161,016 | | | 43,628 | |
| Elimination of intercompany receivables | (47,910) | | | (22,517) | |
| Total consolidated assets | $ | 1,288,463 | | | $ | 1,052,459 | |
For more information about the disaggregation of the Company’s revenues by contract type and customer type for each reportable segment, refer to Note 3 – Revenue from Contracts with Customers.
No single customer accounted for more than 10% of total operating revenues for the year ended December 31, 2024. However, revenue from a single customer accounted for 16.8% and 14.5% of total operating revenues for the years ended December 31, 2023 and 2022, respectively, which was included in the E&M segment.
At the segment level, no single E&M customer account for more than 10% of total E&M segment revenues for the year ended December 31, 2024. For the years ended December 31, 2023 and 2022, revenue from a single E&M customer mentioned above accounted for 22.5% and 19.6% of total E&M segment revenues, respectively.
As for T&D, for the year ended December 31, 2024, revenue from a single T&D customer accounted for 17.2% of total T&D segment revenues. For the years ended December 31, 2023 and 2022, combined revenue from two T&D customers accounted for 31.2% and 29.8% of total T&D segment revenues, respectively.
No single customer had trade receivables of 10% or more of total trade receivables as of December 31, 2024. Trade receivables from a single customer accounted for 14.1% of total trade receivables as of December 31, 2023.
EVERUS CONSTRUCTION GROUP, INC.
Note 13 – Employee Benefit Plans
Nonqualified Deferred Compensation Plans
In 2012, MDU Resources established a nonqualified deferred compensation plan for certain key management employees, including certain employees of the Company. In 2020, the plan was frozen to new participants and no new Company contributions were made to the plan after December 31, 2020. Vesting for participants not fully vested was retained. To replace the plan originally established in 2012, a new nonqualified deferred compensation plan was adopted in 2020 by MDU Resources, effective January 1, 2021.
In connection with the Separation, the Company adopted its own nonqualified deferred compensation plan, effective October 31, 2024, in which eligible employees of the Company may participate. Previous Company employee liability balances related to the MDU Resources 2020 plan were transferred to the Company. The original MDU Resources 2012 plan associated liability balances were assumed by MDU Resources.
Expenses incurred by the Company under these plans for the years ended December 31, 2024, 2023 and 2022 were $1.3 million, $1.6 million, and $1.1 million, respectively.
Defined Contribution Plans
Prior to the Separation, MDU Resources sponsored a defined contribution plan in which the Company participated. As a result of the Separation, the Company now sponsors its own defined contribution plan, effective September 1, 2024, in which its employees participate and previous Company employee liability balances were transferred from the MDU Resources sponsored plan to the Company. The costs incurred by the Company under these plans for eligible employees were $6.2 million, $4.5 million and $4.5 million for the years ended December 31, 2024, 2023 and 2022, respectively.
Multiemployer Plans
The Company also contributes to a number of multiemployer pension plans under the terms of collective bargaining agreements that cover its union-represented employees. The risks of participating in these multiemployer plans are different from single-employer plans in the following aspects:
•Assets contributed to the multiemployer plans by one employer may be used to provide benefits to employees of other participating employers.
•If a participating employer stops contributing to the plan, the unfunded obligations of the plan may be borne by the remaining participating employers.
•If the Company chooses to stop participating in some of its multiemployer plans, the Company may be required to pay those plans an amount based on the underfunded status of the plan, referred to as a withdrawal liability.
Amounts contributed to defined contribution multiemployer plans were $67.3 million, $73.3 million, and $67.6 million for the years ended December 31, 2024, 2023 and 2022, respectively.
Amounts contributed to defined benefit multiemployer plans were $82.8 million, $95.4 million, and $86.7 million for the years ended December 31, 2024, 2023 and 2022, respectively.
The Company also contributes to a number of multiemployer other postretirement plans under the terms of collective bargaining agreements that cover its union-represented employees. These plans provide benefits such as health insurance, disability insurance and life insurance to retired union employees. Many of the multiemployer other postretirement plans are combined with active multiemployer health and welfare plans. The Company’s total contributions to its multiemployer other postretirement plans, which includes contributions to active multiemployer health and welfare plans, were $91.5 million, $86.6 million, and $79.1 million for the years ended December 31, 2024, 2023 and 2022, respectively.
Approximately 83 percent of the Company’s total workforce is covered by collective bargaining agreements. Approximately 24 percent of the collective bargaining agreements are set to expire within one year.
The Company’s participation in the defined benefit multiemployer plans is outlined in the following table. Unless otherwise noted, the most recent Pension Protection Act zone status available in 2024, 2023 and 2022 is for the plan’s year-end as of December 31, 2024, 2023 and 2022, respectively. The zone status is based on information that the Company received from the plan and is certified by the plan’s actuary.
EVERUS CONSTRUCTION GROUP, INC.
Among other factors, plans in the red zone generally are less than 65 percent funded, plans in the yellow zone are between 65 percent and 80 percent funded, and plans in the green zone are at least 80 percent funded.
| | | | | | | | | | | | | | | | | | | | | | | | | | | | | | | | | | | | | | | | | | | | | | | | | | | | | | | | |
| Pension Fund | | EIN/ Pension Plan Number | | Pension Protection Act Zone Status | | FIP/RP Status Pending/ Implemented | | Contributions | | Surcharge Imposed | | Expiration Date of Collective Bargaining Agreement |
| | 2024 | | 2023 | | | 2024 | | 2023 | | 2022 | | |
| Edison Pension Plan | | 936061681-001 | | Green | | Green | | No | | $ | 23,310 | | | $ | 16,957 | | | $ | 18,750 | | | No | | 12/31/2026 |
| | | | | | | | | | | | | | | | | | |
| IBEW Local 357 Pension Plan A | | 886023284-001 | | Green | | Green | | No | | 4,376 | | | 18,936 | | | 12,876 | | | No | | 5/31/2027 |
| IBEW Local 82 Pension Plan | | 316127268-001 | | Green as of 6/30/2024 | | Green as of 6/30/2023 | | No | | 2,518 | | | 2,149 | | | 1,854 | | | No | | 12/6/2026 |
| | | | | | | | | | | | | | | | | | |
| IBEW Local 683 Pension Fund Pension Plan | | 341442087-001 | | Green | | Green | | No | | 6,650 | | | 3,986 | | | 3,362 | | | No | | 5/30/2027 |
| NEBF - National Electrical Benefit Fund | | 530181657-001 | | Green | | Green | | No | | 18,233 | | | 19,040 | | | 18,060 | | | No | | 8/25/2024-1/31/2029 |
| Pension and Retirement Plan of Plumbers and Pipefitters Local 525 | | 886003864-001 | | Green as of 6/30/2024 | | Green as of 6/30/2022 | | No | | 3,788 | | | 8,020 | | | 6,304 | | | No | | 9/30/2025 |
| Sheet Metal Workers Pension Plan of Southern CA, AZ, and NV | | 956052257-001 | | Green | | Green | | No | | 2,189 | | | 3,631 | | | 3,400 | | | No | | 6/30/2028 |
| | | | | | | | | | | | | | | | | | |
| Other Funds | | | | | | | | | | 21,722 | | | 22,639 | | | 22,060 | | | | | |
| Total Contributions | | | | | | | | | | $ | 82,786 | | | $ | 95,358 | | | $ | 86,666 | | | | | |
The Company was listed in the plans’ Forms 5500 as providing more than 5 percent of the total contributions for the following plans and plan years:
| | | | | | | | |
| Pension Fund | | Year Contributions to Plan Exceeded More Than 5 Percent of Total Contributions (as of December 31 of the Plan’s Year-End) |
| DB Pension Plan of AGC-IUOE Local 701 Pension Trust Fund | | 2023 |
| Edison Pension Plan | | 2023 and 2022 |
| Eight District Electrical Pension Fund | | 2022 |
| Electrical Workers Local No. 26 Pension Fund | | 2023 and 2022 |
| IBEW Local 82 Pension Plan | | 2023 and 2022 |
| IBEW Local 124 Pension Trust Fund | | 2023 and 2022 |
| IBEW Local 212 Pension Trust Fund | | 2023 and 2022 |
| IBEW Local 357 Pension Plan A | | 2023 and 2022 |
| IBEW Local 648 Pension Plan | | 2023 and 2022 |
| IBEW Local 683 Pension Fund Pension Plan | | 2023 and 2022 |
| National Electrical Benefit Fund | | 2023 and 2022 |
| Pension and Retirement Plan of Plumbers and Pipefitters Local 525 | | 2023 and 2022 |
| Sheet Metal Workers Pension Plan of Southern, CA AZ and NV | | 2023 and 2022 |
| Western States Insulators and Allied Workers’ Pension Plan | | 2023 and 2022 |
Note 14 – Commitments, Contingencies and Guarantees
The Company is party to claims and lawsuits arising out of its business, including that of its consolidated subsidiaries, which may include, but are not limited to, matters involving property damage, personal injury, and environmental, contractual, statutory and regulatory obligations. The Company accrues a liability for loss contingencies when the incurrence of a loss is probable and the amount can be reasonably estimated. If a range of amounts can be reasonably estimated and no amount within the range is a better estimate than any other amount, then the minimum of the range is accrued. The Company does not accrue liabilities when the likelihood that the liability has been incurred is probable but the amount cannot be reasonably estimated, or when the liability is believed to be only reasonably possible or remote. For contingencies where an unfavorable outcome is probable or reasonably possible and which are material, the Company discloses the nature of the loss contingency and, in some circumstances, an estimate of the possible loss.
EVERUS CONSTRUCTION GROUP, INC.
Litigation
As of December 31, 2024 and 2023, the Company accrued $4.5 million and $0.1 million, respectively, for litigation-related contingent liabilities that have not been discounted, which were included in Other accrued liabilities on the consolidated balance sheets. As of December 31, 2024 and 2023, the Company also recorded $1.0 million and $0.1 million, respectively, of corresponding insurance claim receivables related to certain of the accrued liabilities in Other current assets on the consolidated balance sheets. For such cases where the Company determined that the outcome of the outstanding litigation cases will be covered by the Company’s insurance carrier, any amounts due related to the litigation will be paid directly by the Company’s insurance carrier. Therefore, any excess contingency liabilities over insurance claim receivables as of December 31, 2024 and 2023 reflect amounts that the Company would be responsible for resulting from litigation.
The Company will continue to monitor each matter and adjust accruals as necessary based on new information and further developments. Management believes that the outcomes with respect to probable and reasonably possible losses in excess of the amounts accrued, net of insurance recoveries, while uncertain, either cannot be estimated or will not have a material effect upon the Company’s financial position, results of operations or cash flows. Unless otherwise required by GAAP, legal costs are expensed as they are incurred and are included in Selling, general and administrative expenses on the consolidated statements of income.
Guarantees
In the normal course of business, the Company has surety bonds related to construction contracts of its subsidiaries. These bonds relate to certain public and private sector contracts to secure contractual performance, including completion of agreed upon contract terms, timing and price, payments to subcontractors and suppliers, and protection for customers from fraudulent practices. In the event a subsidiary of the Company does not fulfill a bonded obligation, the Company would be responsible to the surety bond company for completion of the bonded contract or obligation. A large portion of the surety bonds are expected to expire within the next 12 months; however, the Company likely will continue to enter into surety bonds for its subsidiaries in the future. As of December 31, 2024 and 2023, the maximum potential amount of payments the Company would be required to make under the outstanding surety bonds was approximately $717.0 million and $299.9 million, respectively, which were not reflected on the consolidated balance sheets.
The Company has outstanding guarantees to third parties that guarantee the performance of certain subsidiaries of the Company. These guarantees are related to contracts for contracting services. As of December 31, 2024 and 2023, the fixed maximum amounts guaranteed under these agreements aggregated to $542.7 million and $341.4 million, respectively. The scheduled expiration of the maximum amounts guaranteed as of December 31, 2024, aggregate to $172.4 million in 2025, $307.7 million in 2026, $43.0 million in 2027, $19.2 million in 2028 and $0.4 million in 2029. There were no amounts outstanding under the previously mentioned guarantees and the maximum amounts guaranteed were not reflected on the consolidated balance sheets as of December 31, 2024 or 2023. However, in the event of default under these guaranteed obligations, the Company would be required to make payments to satisfy its guarantees.
The Company also has outstanding letters of credit to third parties for certain guarantees, excluding standby letters of credit tied to our Revolving Credit Facility. As of December 31, 2024 and 2023, the fixed maximum amounts guaranteed under these letters of credit aggregated to $2.2 million and $0.2 million, respectively, all of which expire within the next 12 months. There were no amounts outstanding under the previously mentioned letters of credit as of December 31, 2024 or 2023. In the event of default under these letter-of-credit obligations, the Company would be obligated for reimbursement of payments made under the letters of credit.
Refer to Note 7 – Debt for more information on the outstanding standby letters of credit under the Company’s Revolving Credit Facility.
In addition, the Company has issued guarantees to third parties related to the routine purchase of maintenance items, materials and lease obligations for which no fixed maximum amounts have been specified. These guarantees have no scheduled maturity date. In the event a subsidiary of the Company defaults under these obligations, the Company would be required to make payments to satisfy these guarantees. The Company had an immaterial amount of outstanding guarantees reflected on the consolidated balance sheets in Operating lease right-of-use assets, Current portion of operating lease liabilities and/or Operating lease liabilities as of December 31, 2024 and 2023.
EVERUS CONSTRUCTION GROUP, INC.
Note 15 – Related-Party Transactions
Allocation of Corporate Expenses
Prior to the Separation, Centennial and MDU Resources allocated expenses for corporate services provided to the Company, including costs related to senior management, legal, human resources, finance and accounting, treasury, information technology, internal audit, risk management and other shared services. For the years ended December 31, 2024, 2023 and 2022, the Company was allocated $30.4 million, $27.1 million and $21.2 million, respectively, for these corporate services. These expenses were allocated to the Company on the basis of direct usage where identifiable, with the remainder allocated on the basis of percent of total capital invested, the percent of total average cash management program borrowings with MDU Resources, the percent of total average commercial paper borrowings with Centennial or other allocation methodologies that were considered to be a reasonable reflection of the utilization of the services provided to the benefits received. Some of the utilization factors considered included the following: number of employees paid and stated as cost per check; number of employees served; weighted factor of travel, managed units, national account spending, equipment and fleet acquisitions; purchase order dollars spent and purchase order line count; number of payments, vouchers or unclaimed property reports; labor hours; time tracked; and projected workload.
These cost allocations were a reasonable reflection of the utilization of services provided to, or the benefit derived by, the Company during the periods presented prior to the Separation. However, the allocations may not be indicative of the actual expenses that would have been incurred had the Company operated as a standalone company. Actual costs as a standalone company depend on a number of factors, including the chosen organizational structure, whether functions are outsourced or performed by Company employees, and strategic decisions made in areas such as selling and marketing, information technology and infrastructure. Refer to Note 2 – Basis of Presentation and Summary of Significant Accounting Policies for additional information.
Transition Services Agreement
On October 31, 2024, as part of the Separation, the Company and MDU Resources entered into a transition services agreement whereby the Company and MDU Resources will provide certain transition services to each other. The transition services agreement outlines services that are expected to be provided between parties related to tax, legal, treasury, human resources, information technology, risk management and other general and administrative functions. For the year ended December 31, 2024, the Company paid $0.7 million related to these activities, which was reflected in Selling, general and administrative expenses on the consolidated statements of income. For the year ended December 31, 2024, the Company received $47 thousand related to these activities, which was reflected in Other income on the consolidated statements of income. The majority of the transition services are expected to be completed over a period of 20 months, but no longer than two years, after the Separation.
Cash Management and Financing
Prior to the second quarter of 2023, Centennial had a commercial paper program and long-term borrowing arrangements in which the Company and certain of its subsidiaries participated. Centennial repaid all of its outstanding debt in the second quarter of 2023, and subsequently MDU Resources supported the Company’s borrowing needs through Centennial. The Company accounted for cash receipts and disbursements from MDU Resources and Centennial, through related-party receivables and payables. Until the Separation, the Company had related-party agreements in place with Centennial, via MDU Resources, for the financing of its capital needs. Following the Separation, the Company relies on its own credit and financing arrangements.
Related-Party Notes Payable
Prior to the Separation, during the periods in which the Company was utilizing MDU Resources financing arrangements, MDU Resources was required to be in compliance with certain financial covenants, cross-default provisions and other conditions. MDU Resources was in compliance with all requirements until the Separation. Also, the borrowings under the commercial paper program with Centennial did not have stated maturities. Therefore, MDU Resources committed to continue funding the Company through Centennial using its cash management program and revolving credit facility to allow the Company to meet its obligations as they became due prior to the Separation.
As part of the Separation, the Company repaid $230.0 million of outstanding cash management program borrowings to Centennial using a portion of the net proceeds of indebtedness incurred by the Company. The repayment amount represented the total Related-party notes payable balance outstanding as of October 31, 2024, and thus, there were no amounts outstanding as of December 31, 2024. Also, as a result of the Separation, a portion of the net proceeds of the indebtedness was used to pay a
EVERUS CONSTRUCTION GROUP, INC.
$60.0 million dividend to MDU Resources and is included in Net transfers to Centennial and MDU Resources including Separation adjustments in the consolidated statements of equity for the year ended December 31, 2024. Refer to Note 7 – Debt for more information.
Related-party notes payable as of December 31, 2023, was as follows:
| | | | | | | | | | | | | | | | | |
| | | | | | | Weighted Average Interest Rate as of December 31, 2023 | | December 31, 2023 |
| | | | | | | (In percentage) | | (in thousands) |
| Borrowing arrangements with MDU Resources | | | | | | | 5.94 | % | | $ | 168,531 | |
| Total related-party notes payable | | | | | | | | | $ | 168,531 | |
| | | | | | | | | |
| | | | | | | | | |
The Company repaid $27.0 million and $45.0 million of short- and long-term Related-party notes payable, respectively, during the year ended December 31, 2023, in connection with the Knife River separation.
The Company issued $27.0 million of short-term Related-party notes payable during the year ended December 31, 2022.
The Company was allocated interest based on borrowings from or lending to the cash management and financing program as well as the funding related to these agreements as described above. The related-party interest expense associated with the Company’s participation in the cash management and financing program was $10.2 million, $17.0 million and $6.4 million for the years ended December 31, 2024, 2023 and 2022, respectively.
EVERUS CONSTRUCTION GROUP, INC.
Item 9. Changes in and Disagreements with Accountants on Accounting and Financial Disclosure
None.
Item 9A. Controls and Procedures
The following information includes the evaluation of disclosure controls and procedures by the Company's chief executive officer and chief financial officer, along with any significant changes in internal controls of the Company.
Evaluation of Disclosure Controls and Procedures
The term "disclosure controls and procedures" is defined in Rules 13a-15(e) and 15d-15(e) under the Exchange Act. The Company's disclosure controls and other procedures are designed to provide reasonable assurance that information required to be disclosed in the reports that the Company files or submits under the Exchange Act is recorded, processed, summarized and reported within the time periods specified in the SEC's rules and forms. The Company's disclosure controls and other procedures are designed to provide reasonable assurance that information required to be disclosed is accumulated and communicated to management, including the Company's chief executive officer and chief financial officer, to allow timely decisions regarding required disclosure. The Company's management, with the participation of the Company's chief executive officer and chief financial officer, has evaluated the effectiveness of the Company's disclosure controls and other procedures as of the end of the period covered by this report. Based upon that evaluation, the chief executive officer and the chief financial officer have concluded that, as of the end of the period covered by this report, such controls and procedures were effective at a reasonable assurance level.
Changes in Internal Controls
There have been no changes in the Company's internal control over financial reporting (as defined in Rules 13a-15(f) and 15d-15(f) under the Exchange Act) during the three months ended December 31, 2024, that have materially affected, or are reasonably likely to materially affect, the Company's internal control over financial reporting.
Limitations on the Effectiveness of Internal Controls
Our management, including our chief executive officer and chief financial officer, does not expect that our disclosure controls and procedures or our internal control over financial reporting will detect or prevent all errors and all fraud. A control system, no matter how well designed and operated, can provide only reasonable, not absolute, assurance that the objectives of the control system are met. Further, the design of a control system must reflect the fact that there are resource constraints, and the benefits of controls must be considered relative to their costs. Because of its inherent limitations, internal control over financial reporting may not prevent or detect misstatements and cannot guarantee that misstatements due to error or fraud will not occur or that all control issues and instances of fraud, if any, within the Company have been detected. These inherent limitations include the realities that judgments in decision-making can be faulty, and breakdowns can occur because of simple errors or mistakes. Additionally, controls can be circumvented by the individual acts of some persons, by collusion of two or more people, or by management override of the controls. The design of any system of controls is based in part on certain assumptions about the likelihood of future events, and there can be no assurance that any design will succeed in achieving its stated goals under all potential future conditions. Over time, controls may become inadequate because of changes in conditions or deterioration in the degree of compliance with policies or procedures.
Management's Annual Report on Internal Control Over Financial Reporting
This Annual Report does not include a report of management’s assessment regarding internal control over financial reporting due to a transition period established by the rules of the SEC for newly public companies.
Attestation Report of the Registered Public Accounting Firm
This Annual Report does not include an attestation report of the Company’s independent registered public accounting firm due to a transition period established by the rules of the SEC for newly public companies.
Item 9B. Other Information
During the three months ended December 31, 2024, no director or officer of the Company adopted or terminated a "Rule 10b5-1 trading arrangement" or "non-Rule 10b5-1 trading arrangement," as each term is defined in Item 408(a) of Regulation S-K.
EVERUS CONSTRUCTION GROUP, INC.
Item 9C. Disclosure Regarding Foreign Jurisdictions that Prevent Inspections
None.
EVERUS CONSTRUCTION GROUP, INC.
Part III.
Item 10. Directors, Executive Officers and Corporate Governance
Information required by this item, except as disclosed below, will be included in the Company’s Proxy Statement, which is incorporated herein by reference.
The Company has adopted an insider trading policy, which governs the purchase, sale and/or other dispositions of the Company's securities by directors, officers, employees and other covered persons, which is reasonably designed to promote compliance with insider trading laws, rules and regulations, and NYSE listing standards. A copy of the insider trading policy is filed as Exhibit 19.1 to this Annual Report.
Item 11. Executive Compensation
Information required by this item will be included in the Company’s Proxy Statement, which is incorporated herein by reference.
Item 12. Security Ownership of Certain Beneficial Owners and Management and Related Stockholder Matters
Equity Compensation Plan Information
The following table includes information about the Company’s equity compensation plans as of December 31, 2024:
| | | | | | | | | | | | | | | | | | | | |
| Plan Category | (a) Number of securities to be issued upon exercise of outstanding options, warrants and rights | | (b) Weighted average exercise price of outstanding options, warrants and rights | | (c) Number of securities remaining available for future issuance under equity compensation plans excluding securities reflected in column (a) | |
Equity compensation plans approved by stockholders(1) | 133,731 | (2) | 0.00 | (3) | 2,357,404 | (4) |
| Equity compensation plans not approved by stockholders | N/A | | N/A | | N/A | |
| Total | 133,731 | | 0.00 | | 2,357,404 | |
__________________
(1)Consists of the Everus Construction Group, Inc. Long-Term Performance-Based Incentive Plan. For more information, see Item 8 - Note 10 – Stock-Based Compensation.
(2)Consists of restricted stock unit awards, including 30,939 restricted stock unit awards that vested on December 31, 2024, which were issued in common stock, net of tax withholding, in February 2025.
(3)No weighted average exercise price is shown for the restricted stock unit awards because such awards have no exercise price.
(4) This amount is part of the 2,491,135 shares that were available for future issuance under the Long-Term Performance-Based Incentive Plan as of December 31, 2024, in connection with grants of restricted stock units or other equity-based awards.
The remaining information required by this item will be included in the Company’s Proxy Statement, which is incorporated herein by reference.
Item 13. Certain Relationships and Related Transactions, and Director Independence
Information required by this item will be included in the Company’s Proxy Statement, which is incorporated herein by reference.
Item 14. Principal Accountant Fees and Services
Information required by this item will be included in the Company’s Proxy Statement, which is incorporated herein by reference.
EVERUS CONSTRUCTION GROUP, INC.
Part IV.
Item 15. Financial Statements, Financial Statement Schedules and Exhibits
A. The following documents are filed as part of this Annual Report:
1. Financial Statements
Reference is made to the Index to Financial Statements under Item 8. Financial Statements and Supplementary Data in Part II hereof, where these documents are listed.
2. Schedules
All schedules are omitted because they are not required or not applicable, or the information is shown in the financial statements or the notes to audited consolidated financial statements.
3. Exhibits
The Exhibits listed in the accompanying Exhibit Index are filed or incorporated by reference as part of, or furnished with, this Annual Report.
EVERUS CONSTRUCTION GROUP, INC.
Exhibit Index
| | | | | | | | | | | | | | | | | | | | | | | | |
| | | | Incorporated by Reference |
| Exhibit Number | Exhibit Description | Filed
Herewith | Furnished Herewith | Form | | Exhibit | Filing
Date | File Number |
| 2.1 | | | | 8-K | | 2.1 | 11/1/24 | 001-42276 |
| 3.1 | | | | 8-K | | 3.1 | 11/1/24 | 001-42276 |
| 3.2 | | | | 8-K | | 3.2 | 11/1/24 | 001-42276 |
| 4.1 | | X | | | | | | |
| 10.1 | | | | 10-12B | | 10.9 | 9/12/24 | 001-42276 |
| 10.2 | | | | 10-12B | | 10.10 | 9/12/24 | 001-42276 |
| 10.3 | | | | 10-12B | | 10.11 | 9/12/24 | 001-42276 |
| 10.4 | | | | 10-12B | | 10.12 | 9/12/24 | 001-42276 |
| 10.5 | | | | 10-12B | | 10.13 | 9/12/24 | 001-42276 |
| 10.6 | | | | 10-12B | | 10.14 | 9/12/24 | 001-42276 |
| 10.7 | | | | 10-12B | | 10.15 | 9/12/24 | 001-42276 |
| 10.8 | | | | 8-K | | 10.1 | 11/1/24 | 001-42276 |
| 10.9 | | | | 8-K | | 10.2 | 11/1/24 | 001-42276 |
| 10.1 | | | | 8-K | | 10.3 | 11/1/24 | 001-42276 |
| 10.11 | | | | 8-K | | 10.4 | 11/1/24 | 001-42276 |
| 10.12 | | | | 8-K | | 10.5 | 11/1/24 | 001-42276 |
| 10.13 | | | | 8-K | | 10.6 | 11/1/24 | 001-42276 |
| 10.14 | | | | 8-K | | 10.7 | 11/1/24 | 001-42276 |
| 10.15 | | | | 8-K | | 10.8 | 11/1/24 | 001-42276 |
| 10.16 | | | | 8-K | | 10.9 | 11/1/24 | 001-42276 |
| 10.17 | | | | 10-Q | | 10.17 | 11/21/24 | 001-42276 |
| 10.18 | | | | 8-K | | 10.1 | 11/22/24 | 001-42276 |
| | | | | | | | |
| | | | | | | | |
| | | | | | | | |
| 19.1 | | X | | | | | | |
EVERUS CONSTRUCTION GROUP, INC.
| | | | | | | | | | | | | | | | | | | | | | | | |
| | | | Incorporated by Reference |
| Exhibit Number | Exhibit Description | Filed
Herewith | Furnished Herewith | Form | | Exhibit | Filing
Date | File Number |
| 21.1 | | X | | | | | | |
| 23.1 | | X | | | | | | |
| 31.1 | | X | | | | | | |
| 31.2 | | X | | | | | | |
| 32.1 | | | X | | | | | |
| 32.2 | | | X | | | | | |
| 97.1 | | X | | | | | | |
| 101.INS | XBRL Instance Document - the instance document does not appear in the Interactive Data File because its XBRL tags are embedded within the Inline XBRL document | X | | | | | | |
| 101.SCH | XBRL Taxonomy Extension Schema Document | X | | | | | | |
| 101.CAL | XBRL Taxonomy Extension Calculation Linkbase Document | X | | | | | | |
| 101.DEF | XBRL Taxonomy Extension Definition Linkbase Document | X | | | | | | |
| 101.LAB | XBRL Taxonomy Extension Label Linkbase Document | X | | | | | | |
| 101.PRE | XBRL Taxonomy Extension Presentation Linkbase Document | X | | | | | | |
| 104 | Cover Page Interactive Data File (formatted as Inline XBRL and contained in Exhibit 101) | X | | | | | | |
| | |
| + Management contract, compensatory plan or arrangement. |
| † Certain schedules and exhibits have been omitted pursuant to Item 601(b)(2) of Regulation S-K. The Company agrees to furnish supplementally a copy of any omitted schedule or exhibit to the SEC upon its request |
Item 16. Form 10-K Summary
None.
EVERUS CONSTRUCTION GROUP, INC.
Signatures
Pursuant to the requirements of Section 13 or 15(d) of the Securities Exchange Act of 1934, the registrant has duly caused this report to be signed on its behalf by the undersigned, thereunto duly authorized.
| | | | | | | | | | | | | | |
| | | Everus Construction Group, Inc. |
| | | | | |
| Dated: | February 28, 2025 | By: | /s/ Jeffrey S. Thiede |
| | | | Name: | Jeffrey S. Thiede |
| | | Title: | President and Chief Executive Officer |
Pursuant to the requirements of the Securities Exchange Act of 1934, this report has been signed below by the following persons on behalf of the registrant in the capacities and on the date indicated.
| | | | | | | | |
| Signature | Title | Date |
| | |
| /s/ Jeffrey S. Thiede | President and Chief Executive Officer | February 28, 2025 |
| Jeffrey S. Thiede | (Principal Executive Officer) | |
| | |
| /s/ Maximillian J Marcy | Vice President, Chief Financial Officer and Treasurer | February 28, 2025 |
| Maximillian J Marcy | (Principal Financial Officer) | |
| | |
| /s/ Jon B. Hunke | Vice President and Chief Accounting Officer | February 28, 2025 |
| Jon B. Hunke | (Principal Accounting Officer) | |
| | |
| /s/ Dale S. Rosenthal | Director | February 28, 2025 |
| Dale S. Rosenthal | (Chair of the Board) | |
| | |
| /s/ Michael S. Della Rocca | Director | February 28, 2025 |
| Michael S. Della Rocca | | |
| | |
| /s/ Edward A. Ryan | Director | February 28, 2025 |
| Edward A. Ryan | | |
| | |
| /s/ David M. Sparby | Director | February 28, 2025 |
| David M. Sparby | | |
| | |
| /s/ Clark A. Wood | Director | February 28, 2025 |
| Clark A. Wood | | |
| | |
| /s/ Betty R. Wynn | Director | February 28, 2025 |
| Betty R. Wynn | | |