UNITED STATES SECURITIES AND EXCHANGE COMMISSION
Washington, D.C. 20549
FORM N-CSR
CERTIFIED SHAREHOLDER REPORT OF REGISTERED MANAGEMENT
INVESTMENT COMPANIES
| Investment Company Act file number: | | 811-02715 |
| | |
| Exact name of registrant as specified in charter: | | Delaware Group® State Tax-Free Income Trust |
| | |
| Address of principal executive offices: | | 2005 Market Street |
| | Philadelphia, PA 19103 |
| | |
| Name and address of agent for service: | | David F. Connor, Esq. |
| | 2005 Market Street |
| | Philadelphia, PA 19103 |
| | |
| Registrant’s telephone number, including area code: | | (800) 523-1918 |
| | |
| Date of fiscal year end: | | February 29 |
| | |
| Date of reporting period: | | February 29, 2012 |
Item 1. Reports to Stockholders

Annual report Delaware Tax-Free Pennsylvania Fund
February 29, 2012 Fixed income mutual fund |
| Carefully consider the Fund’s investment objectives, risk factors, charges, and expenses before investing. This and other information can be found in the Fund’s prospectus and, if available, its summary prospectus, which may be obtained by visiting www.delawareinvestments.com or calling 800 523-1918. Investors should read the prospectus and, if available, the summary prospectus carefully before investing. |
You can obtain shareholder reports and prospectuses online instead of in the mail.
Visit www.delawareinvestments.com/edelivery. |
Experience Delaware Investments
Delaware Investments is committed to the pursuit of consistently superior asset management and unparalleled client service. We believe in our investment processes, which seek to deliver consistent results, and in convenient services that help add value for our clients.
If you are interested in learning more about creating an investment plan, contact your financial advisor.
You can learn more about Delaware Investments or obtain a prospectus for Delaware Tax-Free Pennsylvania Fund at www.delawareinvestments.com.
Manage your investments online
- 24-hour access to your account information
- Obtain share prices
- Check your account balance and recent transactions
- Request statements or literature
- Make purchases and redemptions
Delaware Management Holdings, Inc. and its subsidiaries (collectively known by the marketing name of Delaware Investments) are wholly owned subsidiaries of Macquarie Group Limited, a global provider of banking, financial, advisory, investment and funds management services.
Investments in Delaware Tax-Free Pennsylvania Fund are not and will not be deposits with or liabilities of Macquarie Bank Limited ABN 46 008 583 542 and its holding companies, including their subsidiaries or related companies (Macquarie Group), and are subject to investment risk, including possible delays in repayment and loss of income and capital invested. No Macquarie Group company guarantees or will guarantee the performance of the Fund, the repayment of capital from the Fund, or any particular rate of return.
| Table of contents | | |
| Portfolio management review | | 1 |
| Performance summary | | 4 |
| Disclosure of Fund expenses | | 8 |
| Security type/sector allocation | | 10 |
| Statement of net assets | | 11 |
| Statement of operations | | 23 |
| Statements of changes in net assets | | 24 |
| Financial highlights | | 26 |
| Notes to financial statements | | 32 |
| Report of independent registered | | |
| public accounting firm | | 42 |
| Other Fund information | | 43 |
| Board of trustees/directors and | | |
| officers addendum | | 44 |
| About the organization | | 54 |
Unless otherwise noted, views expressed herein are current as of Feb. 29, 2012, and subject to change.
Funds are not FDIC insured and are not guaranteed. It is possible to lose the principal amount invested.
Mutual fund advisory services provided by Delaware Management Company, a series of Delaware Management Business Trust, which is a registered investment advisor. Delaware Investments, a member of Macquarie Group, refers to Delaware Management Holdings, Inc. and its subsidiaries, including the Fund’s distributor, Delaware Distributors, L.P. Macquarie Group refers to Macquarie Group Limited and its subsidiaries and affiliates worldwide.
© 2012 Delaware Management Holdings, Inc.
All third-party trademarks cited are the property of their respective owners.
| Portfolio management review |
| Delaware Tax-Free Pennsylvania Fund | | March 6, 2012 |
| Performance preview (for the year ended February 29, 2012) | | | | |
| Delaware Tax-Free Pennsylvania Fund (Class A shares) | | 1-year return | | +14.06% |
| Barclays Capital Municipal Bond Index (benchmark) | | 1-year return | | +12.42% |
| Lipper Pennsylvania Municipal Debt Funds | | 1-year return | | +13.33% |
Past performance does not guarantee future results.
For complete, annualized performance for Delaware Tax-Free Pennsylvania Fund, please see the table on page 4.
The performance of Class A shares excludes the applicable sales charge and reflects the reinvestment of all distributions. Index performance returns do not reflect any management fees, transaction costs, or expenses. Indices are unmanaged and one cannot invest directly in an index.
The Lipper Pennsylvania Municipal Debt Funds average compares funds that limit assets to those securities that are exempt from taxation in Pennsylvania (double tax-exempt) or a city in Pennsylvania (triple tax-exempt).
Economic backdrop
As the Fund’s fiscal year got under way, investors were generally concerned about a U.S. economy that continued to grow slowly and suffer through a historically high unemployment rate. Moving into summer, additional challenges rattled many investors, including Washington’s political battles over government spending and the decision by credit-rating agency Standard & Poor’s to issue a downgrade of U.S. Treasury bonds. Starting in late 2011 and continuing into early 2012, however, the macroeconomic backdrop began to show mild signs of improvement. The U.S. job market, while still weak, appeared to be moving in a better direction, with the unemployment rate falling from 9.0% in September 2011 to 8.3% by January 2012 — the lowest level since February 2009. At the same time, fourth-quarter economic growth reached an estimated rate of 3.0%, up from 1.8% in the prior quarter.
(Unemployment data: U.S. Labor Department; Economic growth rates: U.S. Commerce Department.)
Pennsylvania’s economic environment
Pennsylvania continued to show economic resilience during the Fund’s fiscal year. The state continued to benefit from a diverse, broad, and relatively stable economy, buttressed by its large healthcare and higher education sectors. Its monthly unemployment rate remained below the U.S. average throughout the recession and, at 7.7% in December 2011, compared favorably to the 8.5% national figure. Wealth levels tracked slightly above the rest of the U.S., with per capita personal income equal to 103% of the national average. Pennsylvania’s tax revenues grew by 6.2% from fiscal 2010 to fiscal 2011, and ended 2.9% above original estimates. The Commonwealth’s lawmakers passed a $27.2 billion general fund budget for fiscal 2012, closing the $4.2 billion budget gap with $2.6 billion of expenditure cuts, $1 billion of revenue growth, and approximately $500 million of budgetary surplus from fiscal 2011. The budget cuts came primarily from K-12 education, higher education, economic development services, medical assistance, and welfare programs. (Data: Pennsylvania Office of the Budget.)
1
Portfolio management review
Delaware Tax-Free Pennsylvania Fund
Municipal bond market conditions
In our view, driven by significant risk aversion, many investors were drawn toward U.S. Treasury securities, pushing interest rates to historically low levels. This development was among the prominent factors that helped drive municipal bond prices upward during the Fund’s fiscal year, as municipal bonds increasingly appealed to income-oriented investors seeking relatively high yields in an environment of low interest rates.
Municipal bond markets also benefited from a substantial easing of credit fears. Early in the Fund’s fiscal year, municipal markets were weighed down by media reports of pending defaults; as the fiscal year progressed, however, these dire predictions were shown to be unwarranted.
A favorable supply-demand imbalance was a third source of support for municipal bond prices. On the supply side, the availability of municipal bonds in 2011 was significantly lower than in 2010. According to Municipal Bond Buyer, issuance of tax-exempt debt was about $295 billion during 2011, almost one-third below the level of debt seen in 2010. At the same time, demand for the municipal bond asset class was strengthening, due in part to increased attention from individual investors as well as hedge funds and other nontraditional institutional investors.
Generally speaking, the longer a bond’s maturity, the more likely it was to outperform during the fiscal year. As a result, the municipal yield curve flattened during this period, indicating that yields on long-term bonds were falling faster than those of short-term bonds. The same was true of credit ratings; lower-rated bonds tended to outperform their higher-rated counterparts as investors generally became comfortable accepting slightly more credit risk in exchange for the potential for additional income.
Within the Fund’s portfolio
At the start of the fiscal year, the Fund’s portfolio was positioned somewhat less aggressively in lower-rated credits when compared to the Fund’s more typical allocation levels. At that time, we expected the 2010 conclusion of the federal Build America Bond program (which had been diverting supply away from the municipal bond market) to precipitate an increase in 2011 municipal bond supply, putting pressure on bond prices. We believed the Fund’s relatively conservative stance would more effectively accommodate this steadier stream of supply.
As the Fund’s fiscal year progressed, this increase in bond supply failed to materialize, we believe in part because state and municipal governments had become more reluctant to add to their debt burdens. The prevailing environment of reduced supply and strong investor demand led us to gradually increase the Fund’s allocation to securities at the lower end of the investment grade spectrum, and we generally maintained this stance throughout the rest of the fiscal year. (It’s important to note that these allocation changes took place primarily at the margins of the Fund’s portfolio. They did not represent a meaningful departure from the Fund’s longstanding risk-reward profile.)
2
Notable sectors and securities
For the fiscal year ended Feb. 29, 2012, Delaware Tax-Free Pennsylvania Fund returned +14.06% for Class A shares at net asset value and +8.87% at maximum offer price (both figures reflect all distributions reinvested). For the same period, the Fund’s benchmark, the Barclays Capital Municipal Bond Index, returned +12.42%. For complete, annualized performance of Delaware Tax-Free Pennsylvania Fund, please see the table on page 4.
Overall, the Fund’s best-performing bonds tended to have lower credit ratings and longer maturity dates, as was the performance trend in the broad municipal market.
All market sectors enjoyed strong returns on an absolute basis, with even the two weakest-performing groups — housing and resource-recovery bonds — still providing double-digit gains. The two sectors generating the strongest results in absolute terms were hospital bonds and corporate-backed industrial development revenue bonds. Both sectors generally offer a sizable amount of lower-rated securities, which were favored by many investors during the fiscal year and thus enjoyed good results.
The Fund’s top-performing individual security was the Washington County Redevelopment Authority revenue bond issue for Tanger Factory Outlet Malls, with a maturity date of 2035. Other notable performers included Cumberland County Municipal Authority revenue bonds with a 2036 maturity date. Based on our analysis and fundamental research, both securities had favorable credit characteristics, and they benefited from their longer maturity dates as well as their relatively lower ratings within the official credit rating spectrum.
Given the favorable environment for municipal securities, all of the bonds in the Fund’s portfolio provided a positive return during its fiscal year. In general, bonds with the weakest gains tended to have opposite profiles from bonds that performed strongly — they were more conservative, had higher credit ratings, and had shorter maturities. For example, the weakest-performing issue in the Fund’s portfolio holdings was a Pennsylvania general obligation bond with a 5% coupon and a 2017 maturity date. It posted a rate of return of slightly more than 2% for the Fund’s fiscal year. We sold this holding in December 2011 as we found better opportunities.
3
| Performance summary |
| Delaware Tax-Free Pennsylvania Fund | | February 29, 2012 |
The performance data quoted represent past performance; past performance does not guarantee future results. Investment return and principal value will fluctuate so your shares, when redeemed, may be worth more or less than their original cost. Please obtain the performance data current for the most recent month end by calling 800 523-1918 or visiting our website at www.delawareinvestments.com/performance. Current performance may be lower or higher than the performance data quoted.
| Fund performance1,2 | Average annual total returns through February 29, 2012 |
| | 1 year | | 5 years | | 10 years | |
| Class A (Est. March 23, 1977) | | | | | | | |
| Excluding sales charge | | +14.06% | | +5.17% | | +5.10% | |
| Including sales charge | | +8.87% | | +4.21% | | +4.62% | |
| Class B (Est. May 2, 1994) | | | | | | | |
| Excluding sales charge | | +13.20% | | +4.40% | | +4.45% | |
| Including sales charge | | +9.20% | | +4.14% | | +4.45% | |
| Class C (Est. Nov. 29, 1995) | | | | | | | |
| Excluding sales charge | | +13.05% | | +4.37% | | +4.29% | |
| Including sales charge | | +12.05% | | +4.37% | | +4.29% | |
1 Returns reflect the reinvestment of all distributions and are presented both with and without the applicable sales charges described below. Returns do not reflect the deduction of taxes the shareholder would pay on Fund distributions or redemptions of Fund shares.
Expense limitations were in effect for certain classes during some or all of the periods shown in the “Fund performance” chart. The current expenses for each class are listed on the “Fund expense ratios” table on page 6. Performance would have been lower had expense limitations not been in effect.
Class A shares are sold with a maximum front-end sales charge of up to 4.50%, and have an annual distribution and service fee of up to 0.29% of average daily net assets. This fee has been contractually limited to 0.25% of average daily net assets from June 28, 2011, through June 28, 2012. However, the Fund’s Class A shares are currently subject to a blended 12b-1 fee of 0.10% of average daily net assets on all shares acquired prior to June 1, 1992, and 0.30% of average daily net assets on all shares acquired on or after June 1, 1992. Based on this formula for calculating its 12b-1 fee, all Class A shares currently bear 12b-1 fees of 0.29% of average daily net assets. Performance for Class A shares, excluding sales charges, assumes that no front-end sales charge applied.
Class B shares may be purchased only through dividend reinvestment and certain permitted exchanges as described in the prospectus. Please see the prospectus for additional information on Class B shares. Class B shares have a contingent deferred sales charge that declines from 4.00% to zero depending on the period of time the shares are held. They are also subject to an annual distribution and service fee of up to 1.00% of average daily net assets. Class B shares will automatically convert to Class A shares on a quarterly basis
4
approximately eight years after purchase. Ten-year and lifetime performance figures for Class B shares reflect conversion to Class A shares after approximately eight years.
Class C shares are sold with a contingent deferred sales charge of 1.00% if redeemed during the first 12 months. They are also subject to an annual distribution and service fee of up to 1.00% of average daily net assets.
Performance for Class B and C shares, excluding sales charges, assumes either that contingent deferred sales charges did not apply or that the investment was not redeemed.
The “Fund performance” table and the “Performance of a $10,000 investment” graph do not reflect the deduction of taxes the shareholder would pay on Fund distributions or redemptions of Fund shares.
Fixed income securities and bond funds can lose value, and investors can lose principal, as interest rates rise. They also may be affected by economic conditions that hinder an issuer’s ability to make interest and principal payments on its debt.
The Fund may also be subject to prepayment risk, the risk that the principal of a fixed income security that is held by the Fund may be prepaid prior to maturity, potentially forcing the Fund to reinvest that money at a lower interest rate.
Substantially all dividend income derived from tax-free funds is exempt from federal income tax. Some income may be subject to the federal alternative minimum tax (AMT) that applies to certain investors. Capital gains, if any, are taxable.
Funds that invest primarily in one state may be more susceptible to the economic, regulatory, and other factors of that state than funds that invest more broadly.
5
Performance summary
Delaware Tax-Free Pennsylvania Fund
2 The Fund’s expense ratios, as described in the most recent prospectus, are disclosed in the following “Fund expense ratios” table. Delaware Investments has agreed to reimburse certain expenses and/or waive certain fees in order to prevent total fund operating expenses (excluding certain fees and expenses) from exceeding 0.64% of the Fund’s average daily net assets from June 28, 2011, through June 28, 2012. Please see the most recent prospectus and any applicable supplement(s) for additional information on these fee waivers and/or reimbursements.
| Fund expense ratios | | Class A | | Class B | | Class C |
| Total annual operating expenses | | 0.98% | | 1.69% | | 1.69% |
| (without fee waivers) | | | | | | |
| Net expenses | | 0.88% | | 1.64% | | 1.64% |
| (including fee waivers, if any) | | | | | | |
| Type of waiver | | Contractual | | Contractual | | Contractual |
Performance of a $10,000 investment1
Average annual total returns from Feb. 28, 2002, through Feb. 29, 2012
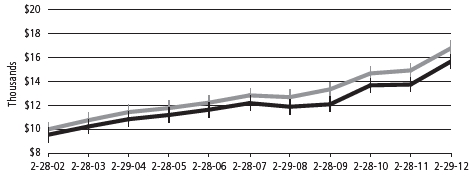
| For period beginning Feb. 28, 2002, through Feb. 29, 2012 | Starting value | Ending value |
| | Barclays Capital Municipal Bond Index | | $10,000 | | $16,794 |
| | Delaware Tax-Free Pennsylvania Fund — Class A Shares | | $9,550 | | $15,688 |
6
1 The “Performance of a $10,000 investment” graph assumes $10,000 invested in Class A shares of the Fund on Feb. 28, 2002, and includes the effect of a 4.50% front-end sales charge and the reinvestment of all distributions. The graph does not reflect the deduction of taxes the shareholders would pay on Fund distributions or redemptions of Fund shares. Expense limitations were in effect for some or all of the periods shown. Performance would have been lower had expense limitations not been in effect. Current expenses are listed in the “Fund expense ratios” table on page 6. Please note additional details on pages 6 through 7.
The chart also assumes $10,000 invested in the Barclays Capital Municipal Bond Index as of Feb. 28, 2002. The Barclays Capital Municipal Bond Index measures the total return performance of the long-term, investment grade tax-exempt bond market.
Index performance returns do not reflect any management fees, transaction costs, or expenses. Indices are unmanaged and one cannot invest directly in an index. Past performance is not a guarantee of future results.
Performance of other Fund classes will vary due to different charges and expenses.
| | Nasdaq symbols | | CUSIPs | |
| Class A | | | DELIX | | | 233216100 | |
| Class B | | | DPTBX | | | 233216209 | |
| Class C | | | DPTCX | | | 233216308 | |
7
Disclosure of Fund expenses
For the six-month period from September 1, 2011 to February 29, 2012
As a shareholder of the Fund, you incur two types of costs: (1) transaction costs, including sales charges (loads) on purchase payments, reinvested dividends, or other distributions; redemption fees; and exchange fees; and (2) ongoing costs, including management fees; distribution and/or service (12b-1) fees; and other Fund expenses. This example is intended to help you understand your ongoing costs (in dollars) of investing in the Fund and to compare these costs with the ongoing costs of investing in other mutual funds.
The example is based on an investment of $1,000 invested at the beginning of the period and held for the entire six-month period from September 1, 2011 to February 29, 2012.
Actual expenses
The first section of the table shown, “Actual Fund return,” provides information about actual account values and actual expenses. You may use the information in this section of the table, together with the amount you invested, to estimate the expenses that you paid over the period. Simply divide your account value by $1,000 (for example, an $8,600 account value divided by $1,000 = 8.6), then multiply the result by the number in the first section under the heading entitled “Expenses Paid During Period” to estimate the expenses you paid on your account during this period.
Hypothetical example for comparison purposes
The second section of the table shown, “Hypothetical 5% return,” provides information about hypothetical account values and hypothetical expenses based on the Fund’s actual expense ratio and an assumed rate of return of 5% per year before expenses, which is not the Fund’s actual return. The hypothetical account values and expenses may not be used to estimate the actual ending account balance or expenses you paid for the period. You may use this information to compare the ongoing costs of investing in the Fund and other funds. To do so, compare this 5% hypothetical example with the 5% hypothetical examples that appear in the shareholder reports of the other funds.
Please note that the expenses shown in the table are meant to highlight your ongoing costs only and do not reflect any transactional costs, such as sales charges (loads), redemption fees, or exchange fees. Therefore, the second section of the table is useful in comparing ongoing costs only, and will not help you determine the relative total costs of owning different funds. In addition, if these transactional costs were included, your costs would have been higher. The Fund’s expenses shown in the table reflect fee waivers in effect. The expenses shown in the table assume reinvestment of all dividends and distributions.
8
Delaware Tax-Free Pennsylvania Fund
Expense analysis of an investment of $1,000
| | Beginning | | Ending | | | | Expenses |
| | Account Value | | Account Value | | Annualized | | Paid During Period |
| | 9/1/11 | | 2/29/12 | | Expense Ratio | | 9/1/11 to 2/29/12* |
| Actual Fund return | | | | | | | | | | | | | | | | | |
| Class A | | | $ | 1,000.00 | | | | $ | 1,069.60 | | | 0.88% | | | $ | 4.53 | |
| Class B | | | | 1,000.00 | | | | | 1,067.00 | | | 1.64% | | | | 8.43 | |
| Class C | | | | 1,000.00 | | | | | 1,065.60 | | | 1.64% | | | | 8.42 | |
| Hypothetical 5% return (5% return before expenses) | | | | | | | | |
| Class A | | | $ | 1,000.00 | | | | $ | 1,020.49 | | | 0.88% | | | $ | 4.42 | |
| Class B | | | | 1,000.00 | | | | | 1,016.71 | | | 1.64% | | | | 8.22 | |
| Class C | | | | 1,000.00 | | | | | 1,016.71 | | | 1.64% | | | | 8.22 | |
*“Expenses Paid During Period” are equal to the Fund’s annualized expense ratio, multiplied by the average account value over the period, multiplied by 182/366 (to reflect the one-half year period).
9
| Security type/sector allocation |
| Delaware Tax-Free Pennsylvania Fund | | As of February 29, 2012 |
Sector designations may be different than the sector designations presented in other Fund materials.
| Security type/sector | | Percentage of net assets |
| Municipal Bonds | | | 98.67 | % | |
| Corporate Revenue Bonds | | | 7.23 | % | |
| Education Revenue Bonds | | | 18.20 | % | |
| Electric Revenue Bonds | | | 2.12 | % | |
| Escrowed to Maturity Bonds | | | 6.33 | % | |
| Healthcare Revenue Bonds | | | 20.28 | % | |
| Housing Revenue Bonds | | | 3.83 | % | |
| Lease Revenue Bonds | | | 8.44 | % | |
| Local General Obligation Bonds | | | 5.44 | % | |
| Pre-Refunded Bonds | | | 0.97 | % | |
| Special Tax Revenue Bonds | | | 5.97 | % | |
| State & Territory General Obligation Bonds | | | 8.22 | % | |
| Transportation Revenue Bonds | | | 10.54 | % | |
| Water & Sewer Revenue Bonds | | | 1.10 | % | |
| Short-Term Investments | | | 0.76 | % | |
| Total Value of Securities | | | 99.43 | % | |
| Receivables and Other Assets Net of Liabilities | | | 0.57 | % | |
| Total Net Assets | | | 100.00 | % | |
10
| Statement of net assets |
| Delaware Tax-Free Pennsylvania Fund | | February 29, 2012 |
| | | | Principal amount | | Value |
| Municipal Bonds – 98.67% | | | | | | | |
| Corporate Revenue Bonds – 7.23% | | | | | | | |
| Allegheny County Industrial Development Authority | | | | | | | |
| Environmental Improvement Revenue | | | | | | | |
| (U.S. Steel Corp.) 6.75% 11/1/24 | | | $ | 2,475,000 | | $ | 2,690,795 |
| Butler County Industrial Development Authority | | | | | | | |
| Consolidated Water Supply Series B 6.25% 6/1/20 | | | | 1,750,000 | | | 1,782,515 |
| Dauphin County Industrial Development Authority Water | | | | | | | |
| Revenue (Dauphin Consolidated Water Supply Project) | | | | | | | |
| Series B 6.70% 6/1/17 | | | | 1,750,000 | | | 2,096,815 |
| Indiana County Industrial Development Authority | | | | | | | |
| Pollution Control Revenue (PSE&G Power Project) | | | | | | | |
| 5.85% 6/1/27 (AMT) | | | | 3,000,000 | | | 3,038,850 |
| Pennsylvania Economic Development Financing Authority | | | | | | | |
| Exempt Facilities Revenue | | | | | | | |
| (Allegheny Energy Supply) 7.00% 7/15/39 | | | | 6,500,000 | | | 7,492,550 |
| •(Exelon Generation Project) Series A 5.00% 12/1/42 | | | | 2,000,000 | | | 2,021,480 |
| Pennsylvania Economic Development Financing | | | | | | | |
| Authority Sewer Sludge Disposal Revenue | | | | | | | |
| (Philadelphia Biosolids Facility) 6.25% 1/1/32 | | | | 2,500,000 | | | 2,754,900 |
| Pennsylvania Economic Development Financing | | | | | | | |
| Authority Solid Waste Disposal Revenue | | | | | | | |
| (Proctor & Gamble Paper Project) 5.375% 3/1/31 (AMT) | | | | 11,000,000 | | | 13,662,000 |
| Pennsylvania Economic Development Financing | | | | | | | |
| Authority Water Facility Revenue | | | | | | | |
| (Pennsylvania-American Water Project) 6.20% 4/1/39 | | | | 2,850,000 | | | 3,295,398 |
| | | | | | | | 38,835,303 |
| Education Revenue Bonds – 18.20% | | | | | | | |
| Allegheny County Higher Education Building | | | | | | | |
| Authority Revenue | | | | | | | |
| (Carlow University Project) | | | | | | | |
| 6.75% 11/1/31 | | | | 750,000 | | | 807,570 |
| 7.00% 11/1/40 | | | | 1,000,000 | | | 1,083,920 |
| (Carnegie Mellon University Project) | | | | | | | |
| 5.25% 3/1/32 | | | | 1,900,000 | | | 1,906,213 |
| Series A 5.00% 3/1/24 | | | | 500,000 | | | 614,375 |
| (Chatham College Project) | | | | | | | |
| Series A 5.85% 3/1/22 | | | | 490,000 | | | 490,769 |
| Series A 5.95% 3/1/32 | | | | 1,000,000 | | | 1,000,990 |
| Series B 5.75% 11/15/35 | | | | 4,000,000 | | | 4,026,480 |
11
Statement of net assets
Delaware Tax-Free Pennsylvania Fund
| | | | Principal amount | | Value |
| Municipal Bonds (continued) | | | | | | |
| Education Revenue Bonds (continued) | | | | | | |
| Allegheny County Higher Education Building | | | | | | |
| Authority Revenue (continued) | | | | | | |
| (Robert Morris University Project) Series A | | | | | | |
| 5.50% 10/15/30 | | $ | 1,275,000 | | $ | 1,356,358 |
| 5.75% 10/15/40 | | | 2,200,000 | | | 2,323,024 |
| Bucks County Industrial Development Authority Revenue | | | | | | |
| (George School Project) 5.00% 9/15/36 | | | 4,455,000 | | | 4,847,885 |
| Delaware County Authority College Revenue | | | | | | |
| (Eastern College Project) Series B | | | | | | |
| 5.50% 10/1/19 | | | 2,995,000 | | | 2,997,067 |
| 5.50% 10/1/24 | | | 2,850,000 | | | 2,850,599 |
| Delaware County Industrial Development | | | | | | |
| Authority Revenue (Chester Community Charter | | | | | | |
| School Project) Series A 6.125% 8/15/40 | | | 1,700,000 | | | 1,663,008 |
| Erie Higher Education Building Authority College | | | | | | |
| Revenue (Mercyhurst College Project) | | | | | | |
| Series B 5.00% 3/15/23 | | | 750,000 | | | 775,523 |
| Huntingdon County General Authority Revenue | | | | | | |
| (Juniata College) Series A 5.00% 5/1/30 | | | 2,650,000 | | | 2,927,243 |
| Lehigh County General Purpose Authority Revenue | | | | | | |
| (Muhlenberg College Project) | | | | | | |
| 5.00% 2/1/29 | | | 740,000 | | | 819,439 |
| 5.25% 2/1/34 | | | 1,000,000 | | | 1,102,530 |
| 5.25% 2/1/39 | | | 2,750,000 | | | 2,972,365 |
| Montgomery County Higher Education & Health | | | | | | |
| Authority Revenue (Arcadia University) | | | | | | |
| 5.625% 4/1/40 | | | 2,375,000 | | | 2,551,890 |
| Northampton County General Purpose Authority Revenue | | | | | | |
| (Higher Education-Lehigh University) | | | | | | |
| 5.00% 11/15/39 | | | 4,000,000 | | | 4,332,840 |
| Pennsylvania Higher Educational Facilities Authority | | | | | | |
| College & University Revenue | | | | | | |
| (Drexel University Project) Series A 5.20% 5/1/29 | | | 1,500,000 | | | 1,516,965 |
| (Edinboro University Foundation) | | | | | | |
| 5.875% 7/1/38 | | | 3,500,000 | | | 3,645,075 |
| 6.00% 7/1/42 | | | 1,400,000 | | | 1,467,410 |
| 6.00% 7/1/43 | | | 2,500,000 | | | 2,651,075 |
| (Philadelphia University Project) 5.00% 6/1/35 | | | 1,665,000 | | | 1,675,639 |
| (Shippensburg University) 6.25% 10/1/43 | | | 2,000,000 | | | 2,118,140 |
12
| | | | Principal amount | | Value |
| Municipal Bonds (continued) | | | | | | |
| Education Revenue Bonds (continued) | | | | | | |
| Pennsylvania Higher Educational Facilities Authority | | | | | | |
| College & University Revenue (continued) | | | | | | |
| (St. Francis University) Series JJ2 6.25% 11/1/41 | | $ | 2,355,000 | | $ | 2,482,288 |
| (Slippery Rock University Foundation) | | | | | | |
| Series A 5.00% 7/1/39 (SGI) | | | 4,000,000 | | | 4,058,640 |
| (Thomas Jefferson University Project) | | | | | | |
| | Series B 4.125% 9/1/26 (AMBAC) | | | 1,000,000 | | | 1,031,620 |
| Un-Refunded Balance 5.00% 1/1/29 | | | 1,610,000 | | | 1,631,252 |
| (Trustees of the University of Pennsylvania) | | | | | | |
| 5.00% 9/1/41 | | | 5,000,000 | | | 5,676,299 |
| Series A 5.00% 9/1/29 | | | 2,000,000 | | | 2,347,310 |
| (University of Pennsylvania) Series B | | | | | | |
| 5.00% 9/1/26 | | | 1,450,000 | | | 1,696,457 |
| 5.00% 9/1/27 | | | 1,550,000 | | | 1,801,937 |
| 5.00% 9/1/30 | | | 1,000,000 | | | 1,146,170 |
| 5.00% 9/1/31 | | | 250,000 | | | 285,093 |
| 5.00% 9/1/32 | | | 1,000,000 | | | 1,134,600 |
| (Ursinus College Project) 5.125% 1/1/33 (RADIAN) | | | 2,000,000 | | | 2,030,900 |
| (Widener University) | | | | | | |
| 5.00% 7/15/39 | | | 3,000,000 | | | 3,067,590 |
| 5.375% 7/15/29 | | | 650,000 | | | 664,859 |
| Pennsylvania Higher Educational Facilities Authority | | | | | | |
| Student Housing Revenue University Properties | | | | | | |
| (East Stroudsburg University of Pennsylvania) | | | | | | |
| 5.00% 7/1/42 | | | 1,750,000 | | | 1,688,995 |
| Philadelphia Authority for Industrial Development Revenue | | | | | | |
| (First Philadelphia Charter) Series A 5.75% 8/15/32 | | | 4,000,000 | | | 3,869,200 |
| (International Apartments Temple University) | | | | | | |
| Series A 5.375% 6/15/30 | | | 1,500,000 | | | 1,579,830 |
| Series A 5.625% 6/15/42 | | | 3,000,000 | | | 3,083,730 |
| (Master Charter School Project) 6.00% 8/1/35 | | | 1,610,000 | | | 1,773,528 |
| Philadelphia Redevelopment Authority Revenue | | | | | | |
| (Beech Student Housing Complex Project) Series A | | | | | | |
| 5.50% 7/1/35 (ACA) | | | 1,525,000 | | | 1,294,527 |
| 5.625% 7/1/28 (ACA) | | | 1,000,000 | | | 903,310 |
| | | | | | | 97,772,527 |
13
Statement of net assets
Delaware Tax-Free Pennsylvania Fund
| | | | Principal amount | | Value |
| Municipal Bonds (continued) | | | | | | |
| Electric Revenue Bonds – 2.12% | | | | | | |
| Philadelphia Gas Works Revenue | | | | | | |
| | (8th-1998 General Ordinance) Series A | | | | | | |
| 5.00% 8/1/15 | | $ | 2,640,000 | | $ | 2,908,594 |
| 5.00% 8/1/16 | | | 3,000,000 | | | 3,369,030 |
| Puerto Rico Electric Power Authority Revenue | | | | | | |
| Series WW 5.00% 7/1/28 | | | 4,800,000 | | | 5,114,592 |
| | | | | | | 11,392,216 |
| Escrowed to Maturity Bonds – 6.33% | | | | | | |
| Delaware County Authority Health Facilities Revenue | | | | | | |
| (Mercy Health Project) 6.00% 12/15/26 | | | 3,500,000 | | | 4,095,280 |
| Pennsylvania Higher Educational Facilities Authority | | | | | | |
| Revenue (University of the Arts Project) | | | | | | |
| 5.20% 3/15/25 (RADIAN) | | | 4,490,000 | | | 5,415,299 |
| Philadelphia Hospitals & Higher Education Facilities | | | | | | |
| Authority Revenue (Presbyterian Medical Center Project) | | | | | | |
| 6.65% 12/1/19 | | | 13,000,000 | | | 15,949,700 |
| Pittsburgh Water & Sewer Authority Revenue | | | | | | |
| 7.25% 9/1/14 (FGIC) | | | 3,370,000 | | | 3,690,824 |
| Puerto Rico Highway & Transportation Authority Revenue | | | | | | |
| Pre-Refunded Series AA 5.50% 7/1/18 (NATL-RE) | | | 3,835,000 | | | 4,872,099 |
| | | | | | | 34,023,202 |
| Healthcare Revenue Bonds – 20.28% | | | | | | |
| Allegheny County Hospital Development Authority | | | | | | |
| Revenue (University of Pittsburgh Medical Center) | | | | | | |
| 5.50% 8/15/34 | | | 3,980,000 | | | 4,406,377 |
| Berks County Municipal Authority Revenue | | | | | | |
| (Reading Hospital & Medical Center Project) | | | | | | |
| Series A-3 5.50% 11/1/31 | | | 10,000,000 | | | 11,309,799 |
| Butler County Hospital Authority Revenue | | | | | | |
| (Butler Health System Project) 7.25% 7/1/39 | | | 8,000,000 | | | 9,336,960 |
| Central Bradford Progress Authority | | | | | | |
| (Guthrie Healthcare System) 5.375% 12/1/41 | | | 1,000,000 | | | 1,100,340 |
| Cumberland County Municipal Authority Revenue | | | | | | |
| (Diakon Lutheran Ministries Project) | | | | | | |
| 5.00% 1/1/36 | | | 2,500,000 | | | 2,511,550 |
| 6.375% 1/1/39 | | | 5,000,000 | | | 5,387,650 |
14
| | | | Principal amount | | Value |
| Municipal Bonds (continued) | | | | | | |
| Healthcare Revenue Bonds (continued) | | | | | | |
| Dauphin County General Authority Health System | | | | | | |
| Revenue (Pinnacle Health System Project) | | | | | | |
| Series A 6.00% 6/1/36 | | $ | 5,000,000 | | $ | 5,496,800 |
| | Franklin County Industrial Development Authority | | | | | | |
| Revenue (Chambersburg Hospital Project) | | | | | | |
| 5.375% 7/1/42 | | | 4,980,000 | | | 5,235,673 |
| Geisinger Authority Health System | | | | | | |
| Series A-1 5.125% 6/1/41 | | | 4,000,000 | | | 4,362,800 |
| Lancaster County Hospital Authority Revenue | | | | | | |
| (Brethren Village Project) Series A 6.50% 7/1/40 | | | 3,000,000 | | | 3,093,570 |
| Montgomery County Higher Education & Health Authority | | | | | | |
| Revenue (Abington Memorial Hospital) Series A | | | | | | |
| 5.125% 6/1/32 | | | 3,975,000 | | | 4,030,372 |
| 5.125% 6/1/33 | | | 5,000,000 | | | 5,230,650 |
| Montgomery County Industrial Development | | | | | | |
| Authority Retirement Community Revenue | | | | | | |
| (ACTS Retirement-Life Communities) | | | | | | |
| Series A-1 6.25% 11/15/29 | | | 700,000 | | | 782,152 |
| (ACTS Retirement Communities) | | | | | | |
| Series B 5.00% 11/15/22 | | | 3,000,000 | | | 3,118,200 |
| (Foulkeways at Gwynedd Project) Series A | | | | | | |
| 5.00% 12/1/24 | | | 1,000,000 | | | 1,039,510 |
| 5.00% 12/1/30 | | | 1,500,000 | | | 1,528,650 |
| Montgomery County Industrial Development | | | | | | |
| Authority Revenue | | | | | | |
| (Continuing Care Project) 6.125% 2/1/28 | | | 3,000,000 | | | 2,869,200 |
| (New Regional Medical Center Project) | | | | | | |
| 5.375% 8/1/38 (FHA) | | | 1,000,000 | | | 1,091,110 |
| Pennsylvania Economic Development Financing | | | | | | |
| Authority Health System Revenue | | | | | | |
| (Albert Einstein Healthcare) Series A 6.25% 10/15/23 | | | 5,000,000 | | | 5,678,850 |
| Pennsylvania Economic Development Financing Authority | | | | | | |
| Revenue (Dr. Gertrude A. Barber Center Project) | | | | | | |
| 5.90% 12/1/30 (RADIAN) | | | 2,250,000 | | | 2,252,205 |
15
Statement of net assets
Delaware Tax-Free Pennsylvania Fund
| | | | Principal amount | | Value |
| Municipal Bonds (continued) | | | | | | |
| Healthcare Revenue Bonds (continued) | | | | | | |
| Pennsylvania Higher Educational Facilities | | | | | | |
| Authority Revenue | | | | | | |
| (University of Pennsylvania Health System) | | | | | | |
| 5.00% 8/15/24 | | $ | 4,850,000 | | $ | 5,672,075 |
| 5.25% 8/15/26 | | | 3,910,000 | | | 4,561,562 |
| | 5.75% 8/15/23 | | | 2,500,000 | | | 3,096,325 |
| Philadelphia Hospitals & Higher Education Facilities | | | | | | |
| Authority Revenue (Temple University Health System) | | | | | | |
| Series A 5.50% 7/1/30 | | | 5,000,000 | | | 5,112,000 |
| South Fork Municipal Hospital Authority Revenue | | | | | | |
| (Conemaugh Health Systems Project) | | | | | | |
| 5.50% 7/1/29 | | | 3,500,000 | | | 3,739,645 |
| St. Mary Hospital Authority Health System Revenue | | | | | | |
| (Catholic Health East) 6.25% 11/15/34 | | | 4,915,000 | | | 5,676,334 |
| Westmoreland County Industrial Development Authority | | | | | | |
| Revenue (Health System-Excela Health Project) | | | | | | |
| Series A 5.125% 7/1/30 | | | 1,200,000 | | | 1,263,960 |
| | | | | | | 108,984,319 |
| Housing Revenue Bonds – 3.83% | | | | | | |
| Allegheny County Residential Finance Authority Single | | | | | | |
| Family Mortgage Revenue | | | | | | |
| Series KK 2 5.40% 5/1/26 (AMT) (GNMA) | | | 2,510,000 | | | 2,512,460 |
| Bucks County Industrial Development Authority | | | | | | |
| Multi-Family Housing Revenue Guaranteed | | | | | | |
| (New Hope Manor Project) Series A | | | | | | |
| 5.40% 3/1/22 (AMT) | | | 1,265,000 | | | 1,266,417 |
| 5.50% 3/1/41 (AMT) | | | 5,340,000 | | | 5,343,097 |
| Pennsylvania Housing Finance Agency | | | | | | |
| Single Family Mortgage Revenue | | | | | | |
| Series 94A 5.15% 10/1/37 (AMT) | | | 3,705,000 | | | 3,772,172 |
| Series 106B 4.80% 4/1/28 | | | 5,200,000 | | | 5,516,368 |
| Philadelphia Authority for Industrial Development Revenue | | | | | | |
| (Germantown Senior Living Presbyterian Homes Project) | | | | | | |
| Series A 5.625% 7/1/35 | | | 2,295,000 | | | 2,176,417 |
| | | | | | | 20,586,931 |
16
| | | | Principal amount | | Value |
| Municipal Bonds (continued) | | | | | | |
| Lease Revenue Bonds – 8.44% | | | | | | |
| Allegheny County Industrial Development Authority | | | | | | |
| Lease Revenue (Residential Resource Project) | | | | | | |
| 5.10% 9/1/26 | | $ | 1,335,000 | | $ | 1,343,531 |
| 5.125% 9/1/31 | | | 1,270,000 | | | 1,237,158 |
| | Pennsylvania Commonwealth Financing Authority | | | | | | |
| Revenue Series B 5.00% 6/1/31 (ASSURED GTY) | | | 10,000,000 | | | 11,051,100 |
| Pennsylvania Industrial Development Authority Revenue | | | | | | |
| (Economic Development) 5.50% 7/1/23 | | | 5,000,000 | | | 5,808,850 |
| Philadelphia Authority for Industrial Development | | | | | | |
| Revenue (Sub-Air Cargo Project) | | | | | | |
| Series A 7.50% 1/1/25 (AMT) | | | 2,500,000 | | | 2,448,350 |
| Philadelphia Municipal Authority Lease Revenue | | | | | | |
| 6.50% 4/1/39 | | | 4,000,000 | | | 4,421,480 |
| Puerto Rico Public Buildings Authority Revenue | | | | | | |
| (Government Facilities) | | | | | | |
| •Series M-2 5.50% 7/1/35 (AMBAC) | | | 2,100,000 | | | 2,310,315 |
| Series N 5.00% 7/1/37 | | | 2,300,000 | | | 2,356,649 |
| Un-Refunded Balance Series I 5.25% 7/1/33 | | | 14,000,000 | | | 14,387,799 |
| | | | | | | 45,365,232 |
| Local General Obligation Bonds – 5.44% | | | | | | |
| Allegheny County Series C-65 5.00% 5/1/18 | | | 3,765,000 | | | 4,369,960 |
| Bethel Park School District 5.10% 8/1/33 | | | 3,000,000 | | | 3,393,960 |
| Central Bucks School District Series B 5.00% 5/15/20 | | | 2,295,000 | | | 2,869,278 |
| Centre County Series B 4.00% 7/1/26 | | | 915,000 | | | 999,683 |
| Chester County | | | | | | |
| 5.00% 11/15/32 | | | 5,725,000 | | | 6,754,527 |
| 5.00% 11/15/33 | | | 2,625,000 | | | 3,075,188 |
| Series C 5.00% 7/15/29 | | | 3,000,000 | | | 3,477,180 |
| City of Pittsburgh Series B 5.00% 9/1/26 | | | 3,000,000 | | | 3,379,230 |
| Mount Lebanon School District Series A 5.00% 2/15/34 | | | 800,000 | | | 888,952 |
| | | | | | | 29,207,958 |
| §Pre-Refunded Bonds – 0.97% | | | | | | |
| Lehigh County General Purpose Authority Revenue | | | | | | |
| (Desales University Project) | | | | | | |
| 5.125% 12/15/23-12 (RADIAN) | | | 5,000,000 | | | 5,196,950 |
| Puerto Rico Highway & Transportation Authority Revenue | | | | | | |
| Pre-Refunded 2011 Series G 5.00% 7/1/33-13 | | | 10,000 | | | 10,634 |
| | | | | | | 5,207,584 |
17
Statement of net assets
Delaware Tax-Free Pennsylvania Fund
| | | | Principal amount | | Value |
| Municipal Bonds (continued) | | | | | | |
| Special Tax Revenue Bonds – 5.97% | | | | | | |
| Guam Government Limited Obligation Revenue | | | | | | |
| | (Section 30) Series A | | | | | | |
| 5.625% 12/1/29 | | $ | 90,000 | | $ | 96,287 |
| 5.75% 12/1/34 | | | 3,050,000 | | | 3,248,738 |
| Pennsylvania Intergovernmental Cooperation Authority | | | | | | |
| 5.00% 6/15/21 | | | 2,000,000 | | | 2,430,840 |
| Pittsburgh & Allegheny County Sports & | | | | | | |
| Exhibition Authority | | | | | | |
| 5.00% 2/1/35 (AGM) | | | 4,750,000 | | | 5,001,560 |
| Puerto Rico Sales Tax Financing Revenue | | | | | | |
| Series C 5.25% 8/1/40 | | | 3,000,000 | | | 3,337,950 |
| First Subordinate | | | | | | |
| Ω(Convertible Capital Appreciation | | | | | | |
| Bonds) Series A 6.75% 8/1/32 | | | 3,275,000 | | | 3,206,487 |
| Series A 5.50% 8/1/42 | | | 5,080,000 | | | 5,537,047 |
| Series A 6.50% 8/1/44 | | | 3,750,000 | | | 4,416,600 |
| Series A-1 5.00% 8/1/43 | | | 3,555,000 | | | 3,784,262 |
| • | Washington County Redevelopment Authority Revenue | | | | | | |
| (Victory Centre Project-Tanger) | | | | | | |
| Series A 5.45% 7/1/35 | | | 1,000,000 | | | 1,005,900 |
| | | | | | | 32,065,671 |
| State & Territory General Obligation Bonds – 8.22% | | | | | | |
| Pennsylvania | | | | | | |
| First Series | | | | | | |
| 5.00% 3/15/28 | | | 5,000,000 | | | 5,900,000 |
| 5.00% 11/15/29 | | | 6,000,000 | | | 7,185,840 |
| Second Series | | | | | | |
| 5.00% 4/15/18 | | | 4,335,000 | | | 5,333,871 |
| 5.00% 1/1/22 | | | 10,000,000 | | | 11,403,200 |
| Puerto Rico Commonwealth Public Improvement Series A | | | | | | |
| 5.25% 7/1/15 | | | 3,250,000 | | | 3,580,005 |
| 5.50% 7/1/19 (NATL-RE) (IBC) | | | 4,650,000 | | | 5,303,604 |
| 5.75% 7/1/41 | | | 5,000,000 | | | 5,481,950 |
| | | | | | | 44,188,470 |
18
| | | | Principal amount | | Value |
| Municipal Bonds (continued) | | | | | | |
| Transportation Revenue Bonds – 10.54% | | | | | | |
| Allegheny County Airport Revenue (Pittsburgh | | | | | | |
| International Airport Project) Series A | | | | | | |
| 5.75% 1/1/14 (AMT) (NATL-RE) | | $ | 6,910,000 | | $ | 7,312,852 |
| Delaware River Port Authority (Port District Project) | | | | | | |
| Series B 5.70% 1/1/21 (AGM) | | | 8,560,000 | | | 8,584,224 |
| Lehigh Northampton Airport Authority Revenue Series A | | | | | | |
| 6.00% 5/15/25 (AMT) (NATL-RE) | | | 1,525,000 | | | 1,526,952 |
| 6.00% 5/15/30 (AMT) (NATL-RE) | | | 2,700,000 | | | 2,701,377 |
| Pennsylvania Economic Development Financing Authority | | | | | | |
| Exempt Facilities Revenue | | | | | | |
| (Amtrak Project) Series A 6.375% 11/1/41 (AMT) | | | 5,000,000 | | | 5,021,150 |
| Pennsylvania Economic Development Financing Authority | | | | | | |
| Revenue (30th Street Station Garage Project) | | | | | | |
| 5.875% 6/1/33 (AMT) (ACA) | | | 4,500,000 | | | 4,577,805 |
| Pennsylvania Turnpike Commission Revenue | | | | | | |
| (Motor License Fund) Sub-Series B 5.00% 12/1/41 | | | 6,500,000 | | | 7,161,115 |
| Series A 5.00% 12/1/22 | | | 2,550,000 | | | 3,123,852 |
| Series A 5.00% 12/1/23 | | | 2,450,000 | | | 3,014,260 |
| Series E 5.00% 12/1/29 | | | 5,000,000 | | | 5,674,800 |
| Series E 5.00% 12/1/30 | | | 2,000,000 | | | 2,253,960 |
| Philadelphia Airport Revenue Series A 5.375% 6/15/29 | | | | | | |
| (ASSURED GTY) | | | 4,030,000 | | | 4,436,063 |
| Puerto Rico Commonwealth Highway & Transportation | | | | | | |
| Authority Revenue | | | | | | |
| Series AA 5.50% 7/1/18 (NATL-RE) | | | 165,000 | | | 190,394 |
| Un-Refunded Balance Series G 5.00% 7/1/33 | | | 1,020,000 | | | 1,026,559 |
| | | | | | | 56,605,363 |
| Water & Sewer Revenue Bonds – 1.10% | | | | | | |
| Cambridge Area Joint Authority Guaranteed | | | | | | |
| Sewer Revenue | | | | | | |
| 5.625% 12/1/28 | | | 1,150,000 | | | 1,270,175 |
| 6.00% 12/1/37 | | | 1,000,000 | | | 1,100,640 |
| Philadelphia Water & Waste Revenue | | | | | | |
| 5.25% 12/15/14 (AMBAC) | | | 3,150,000 | | | 3,535,529 |
| | | | | | | 5,906,344 |
| Total Municipal Bonds (cost $486,333,999) | | | | | | 530,141,120 |
19
Statement of net assets
Delaware Tax-Free Pennsylvania Fund
| | | | Principal amount | | Value | |
| Short-Term Investments – 0.76% | | | | | | | |
| ¤Variable Rate Demand Notes – 0.76% | | | | | | | |
| Philadelphia Authority for Industrial Development | | | | | | | |
| Revenue (Newcourtland Elder Services Project) | | | | | | | |
| 0.12% 3/1/27 (LOC – PNC Bank, N.A.) | | $ | 2,100,000 | | $ | 2,100,000 | |
| Southeastern Transportation Authority Revenue | | | | | | | |
| 0.12% 3/1/22 (LOC – PNC Bank, N.A.) | | | 2,000,000 | | | 2,000,000 | |
| Total Short-Term Investments (cost $4,100,000) | | | | | | 4,100,000 | |
| |
| Total Value of Securities – 99.43% | | | | | | | |
| (cost $490,433,999) | | | | | | 534,241,120 | |
| Receivables and Other Assets | | | | | | | |
| Net of Liabilities – 0.57% | | | | | | 3,063,841 | |
| Net Assets Applicable to 65,057,072 | | | | | | | |
| Shares Outstanding – 100.00% | | | | | $ | 537,304,961 | |
| |
| Net Asset Value – Delaware Tax-Free Pennsylvania Fund | | | | | | | |
| Class A ($508,504,758 / 61,571,079 Shares) | | | | | | $8.26 | |
| Net Asset Value – Delaware Tax-Free Pennsylvania Fund | | | | | | | |
| Class B ($1,488,723 / 180,323 Shares) | | | | | | $8.26 | |
| Net Asset Value – Delaware Tax-Free Pennsylvania Fund | | | | | | | |
| Class C ($27,311,480 / 3,305,670 Shares) | | | | | | $8.26 | |
| |
| Components of Net Assets at February 29, 2012: | | | | | | | |
| Shares of beneficial interest (unlimited authorization – no par) | | | | | $ | 494,860,056 | |
| Distributions in excess of net investment income | | | | | | (65,571 | ) |
| Accumulated net realized loss on investments | | | | | | (1,296,645 | ) |
| Net unrealized appreciation of investments | | | | | | 43,807,121 | |
| Total net assets | | | | | $ | 537,304,961 | |
20
| | |
| • | Variable rate security. The rate shown is the rate as of February 29, 2012. Interest rates reset periodically. |
| Ω | Step coupon bond. Indicates security that has a zero coupon that remains in effect until a predetermined date at which time the stated interest rate becomes effective. |
| § | Pre-Refunded bonds. Municipal bonds that are generally backed or secured by U.S. Treasury bonds. For pre-refunded bonds, the stated maturity is followed by the year in which the bond is pre-refunded. See Note 9 in “Notes to financial statements.” |
| ¤ | Tax-exempt obligations that contain a floating or variable interest rate adjustment formula and an unconditional right of demand to receive payment of the unpaid principal balance plus accrued interest upon a short notice period (generally up to 30 days) prior to specified dates either from the issuer or by drawing on a bank letter of credit, a guarantee or insurance issued with respect to such instrument. The rate shown is the rate as of February 29, 2012. |
Summary of abbreviations:
ACA — Insured by American Capital Access
AGM — Insured by Assured Guaranty Municipal Corporation
AMBAC — Insured by AMBAC Assurance Corporation
AMT — Subject to Alternative Minimum Tax
ASSURED GTY — Insured by Assured Guaranty Corporation
FGIC — Insured by Financial Guaranty Insurance Company
FHA — Federal Housing Administration
GNMA — Government National Mortgage Association collateral
IBC — Insured Bond Certificate
LOC — Letter of Credit
NATL-RE — Insured by National Public Finance Guarantee Corporation
RADIAN — Insured by Radian Asset Assurance
SGI — Insured by Syncora Guarantee Inc.
| Net Asset Value and Offering Price Per Share – | | | |
| Delaware Tax-Free Pennsylvania Fund | | | |
| Net asset value Class A (A) | | $ | 8.26 |
| Sales charge (4.50% of offering price) (B) | | | 0.39 |
| Offering price | | $ | 8.65 |
| (A) | | Net asset value per share, as illustrated, is the amount which would be paid upon redemption or repurchase of shares. |
| |
| (B) | | See the current prospectus for purchases of $100,000 or more. |
See accompanying notes, which are an integral part of the financial statements.
21
| Statement of operations | |
| Delaware Tax-Free Pennsylvania Fund | Year Ended February 29, 2012 |
| Investment Income: | | | | | | | |
| Interest | | | | | $ | 25,794,579 | |
| |
| Expenses: | | | | | | | |
| Management fees | | $ | 2,794,600 | | | | |
| Distribution expenses – Class A | | | 1,373,088 | | | | |
| Distribution expenses – Class B | | | 17,894 | | | | |
| Distribution expenses – Class C | | | 237,088 | | | | |
| Dividend disbursing and transfer agent fees and expenses | | | 272,759 | | | | |
| Accounting and administration expenses | | | 200,320 | | | | |
| Legal fees | | | 63,499 | | | | |
| Reports and statements to shareholders | | | 38,187 | | | | |
| Audit and tax | | | 32,638 | | | | |
| Trustees’ fees | | | 26,418 | | | | |
| Registration fees | | | 19,091 | | | | |
| Pricing fees | | | 14,211 | | | | |
| Insurance fees | | | 10,541 | | | | |
| Custodian fees | | | 8,988 | | | | |
| Dues and services | | | 4,944 | | | | |
| Consulting fees | | | 4,536 | | | | |
| Trustees’ expenses | | | 1,752 | | | 5,120,554 | |
| Less fees waived | | | | | | (235,484 | ) |
| Less waived distribution expenses – Class A | | | | | | (223,125 | ) |
| Less expense paid indirectly | | | | | | (186 | ) |
| Total operating expenses | | | | | | 4,661,759 | |
| Net Investment Income | | | | | | 21,132,820 | |
| |
| Net Realized and Unrealized Gain: | | | | | | | |
| Net realized gain on investments | | | | | | 2,395,291 | |
| Net change in unrealized appreciation (depreciation) of investments | | | | | | 43,159,238 | |
| Net Realized and Unrealized Gain | | | | | | 45,554,529 | |
| |
| Net Increase in Net Assets Resulting from Operations | | | | | $ | 66,687,349 | |
See accompanying notes, which are an integral part of the financial statements.
23
Statements of changes in net assets
Delaware Tax-Free Pennsylvania Fund
| | Year Ended |
| | 2/29/12 | | 2/28/11 |
| Increase (Decrease) in Net Assets from Operations: | | | | | | | | |
| Net investment income | | $ | 21,132,820 | | | $ | 23,074,024 | |
| Net realized gain (loss) | | | 2,395,291 | | | | (1,757,787 | ) |
| Net change in unrealized | | | | | | | | |
| appreciation (depreciation) | | | 43,159,238 | | | | (18,427,639 | ) |
| Net increase in net assets resulting from operations | | | 66,687,349 | | | | 2,888,598 | |
| |
| Dividends and Distributions to Shareholders from: | | | | | | | | |
| Net investment income: | | | | | | | | |
| Class A | | | (20,259,534 | ) | | | (22,217,374 | ) |
| Class B | | | (61,774 | ) | | | (121,830 | ) |
| Class C | | | (811,512 | ) | | | (734,820 | ) |
| |
| Net realized gain: | | | | | | | | |
| Class A | | | — | | | | (4,203,113 | ) |
| Class B | | | — | | | | (27,480 | ) |
| Class C | | | — | | | | (169,260 | ) |
| | | (21,132,820 | ) | | | (27,473,877 | ) |
| |
| Capital Share Transactions: | | | | | | | | |
| Proceeds from shares sold: | | | | | | | | |
| Class A | | | 25,344,134 | | | | 38,802,304 | |
| Class B | | | — | | | | 54,121 | |
| Class C | | | 5,710,071 | | | | 9,423,831 | |
| |
| Net asset value of shares issued upon reinvestment of | | | | | | | | |
| dividends and distributions: | | | | | | | | |
| Class A | | | 13,150,649 | | | | 16,896,305 | |
| Class B | | | 50,424 | | | | 105,860 | |
| Class C | | | 644,387 | | | | 735,859 | |
| | | 44,899,665 | | | | 66,018,280 | |
24
| | Year Ended |
| | 2/29/12 | | 2/28/11 |
| Capital Share Transactions (continued): | | | | | | | | |
| Cost of shares repurchased: | | | | | | | | |
| Class A | | $ | (43,595,978 | ) | | $ | (65,581,343 | ) |
| Class B | | | (1,266,257 | ) | | | (1,749,983 | ) |
| Class C | | | (2,775,838 | ) | | | (3,272,992 | ) |
| | | (47,638,073 | ) | | | (70,604,318 | ) |
| Decrease in net assets derived from capital share transactions | | | (2,738,408 | ) | | | (4,586,038 | ) |
| Net Increase (Decrease) in Net Assets | | | 42,816,121 | | | | (29,171,317 | ) |
| |
| Net Assets: | | | | | | | | |
| Beginning of year | | | 494,488,840 | | | | 523,660,157 | |
| End of year (including distributions in excess of net | | | | | | | | |
| investment income of $65,571 and $—, respectively) | | $ | 537,304,961 | | | $ | 494,488,840 | |
See accompanying notes, which are an integral part of the financial statements.
25
Financial highlights
Delaware Tax-Free Pennsylvania Fund Class A
Selected data for each share of the Fund outstanding throughout each period were as follows:
| | |
| Net asset value, beginning of period | |
| |
| Income (loss) from investment operations: | |
| Net investment income | |
| Net realized and unrealized gain (loss) | |
| Total from investment operations | |
| |
| Less dividends and distributions from: | |
| Net investment income | |
| Net realized gain on investments | |
| Total dividends and distributions | |
| |
| Net asset value, end of period | |
| |
| Total return1 | |
| |
| Ratios and supplemental data: | |
| Net assets, end of period (000 omitted) | |
Ratio of expenses to average net assets excluding interest and fees on short-term
floating rate notes issued | |
| Interest and fees on short-term floating rate notes issued | |
| Total expenses2 | |
Ratio of expenses to average net assets excluding interest and fees on short-term
floating rate notes issued prior to fees waived and expense paid indirectly | |
| Interest and fees on short-term floating rate notes issued | |
| Total expenses prior to fees waived and expense paid indirectly2 | |
| Ratio of net investment income to average net assets | |
Ratio of net investment income to average net assets
prior to fees waived and expense paid indirectly | |
| Portfolio turnover | |
1 Total investment return is based on the change in net asset value of a share during the period and assumes reinvestment of dividends and distributions at net asset value and does not reflect the impact of a sales charge. Total investment return during all of the periods shown reflects waivers by the manager and distributor. Performance would have been lower had the waivers not been in effect. |
| 2 Total expenses and total expenses prior to fees waived and expense paid indirectly include interest and related expenses which include, but are not limited to, interest expense, remarketing fees, liquidity fees, and trustees’ fees in connection with the Fund’s participation in inverse floater programs. See Notes 1 and 8 in “Notes to financial statements.” |
See accompanying notes, which are an integral part of the financial statements.
26
| | Year Ended |
| | 2/29/12 | | 2/28/11 | | 2/28/10 | | 2/28/09 | | 2/29/08 | |
| | $7.550 | | | $7.920 | | | $7.410 | | | $7.610 | | | $8.140 | | |
| | |
| | |
| | 0.329 | | | 0.349 | | | 0.346 | | | 0.329 | | | 0.327 | | |
| | 0.710 | | | (0.304 | ) | | 0.609 | | | (0.200 | ) | | (0.517 | ) | |
| | 1.039 | | | 0.045 | | | 0.955 | | | 0.129 | | | (0.190 | ) | |
| | |
| | |
| | (0.329 | ) | | (0.349 | ) | | (0.346 | ) | | (0.329 | ) | | (0.340 | ) | |
| | — | | | (0.066 | ) | | (0.099 | ) | | — | | | — | | |
| | (0.329 | ) | | (0.415 | ) | | (0.445 | ) | | (0.329 | ) | | (0.340 | ) | |
| | |
| | $8.260 | | | $7.550 | | | $7.920 | | | $7.410 | | | $7.610 | | |
| | |
| | 14.06% | | | 0.48% | | | 13.15% | | | 1.70% | | | (2.44% | ) | |
| | |
| | |
| | $508,505 | | | $470,369 | | | $503,534 | | | $468,737 | | | $498,583 | | |
| | |
| | 0.88% | | | 0.90% | | | 0.93% | | | 0.90% | | | 0.90% | | |
| | 0.00% | | | 0.00% | | | 0.00% | | | 0.00% | | | 0.11% | | |
| | 0.88% | | | 0.90% | | | 0.93% | | | 0.90% | | | 1.01% | | |
| | |
| | 0.98% | | | 0.98% | | | 0.98% | | | 0.96% | | | 0.96% | | |
| | 0.00% | | | 0.00% | | | 0.00% | | | 0.00% | | | 0.11% | | |
| | 0.98% | | | 0.98% | | | 0.98% | | | 0.96% | | | 1.07% | | |
| | 4.19% | | | 4.42% | | | 4.46% | | | 4.34% | | | 4.21% | | |
| | |
| | 4.09% | | | 4.34% | | | 4.41% | | | 4.28% | | | 4.15% | | |
| | 21% | | | 31% | | | 43% | | | 24% | | | 7% | | |
27
Financial highlights
Delaware Tax-Free Pennsylvania Fund Class B
Selected data for each share of the Fund outstanding throughout each period were as follows:
| Net asset value, beginning of period |
| |
| Income (loss) from investment operations: |
| Net investment income |
| Net realized and unrealized gain (loss) |
| Total from investment operations |
| |
| Less dividends and distributions from: |
| Net investment income |
| Net realized gain on investments |
| Total dividends and distributions |
| |
| Net asset value, end of period |
| |
| Total return1 |
| |
| Ratios and supplemental data: |
| Net assets, end of period (000 omitted) |
| Ratio of expenses to average net assets excluding interest and fees on short-term |
| floating rate notes issued |
| Interest and fees on short-term floating rate notes issued |
| Total expenses2 |
| Ratio of expenses to average net assets excluding interest and fees on short-term |
| floating rate notes issued prior to fees waived and expense paid indirectly |
| Interest and fees on short-term floating rate notes issued |
| Total expenses prior to fees waived and expense paid indirectly2 |
| Ratio of net investment income to average net assets |
| Ratio of net investment income to average net assets |
| prior to fees waived and expense paid indirectly |
| Portfolio turnover |
| 1 Total investment return is based on the change in net asset value of a share during the period and assumes reinvestment of dividends and distributions at net asset value and does not reflect the impact of a sales charge. Total investment return during all of the periods shown reflects a waiver by the manager. Performance would have been lower had the waiver not been in effect. |
| 2 Total expenses and total expenses prior to fees waived and expense paid indirectly include interest and related expenses which include, but are not limited to, interest expense, remarketing fees, liquidity fees, and trustees’ fees in connection with the Fund’s participation in inverse floater programs. See Notes 1 and 8 in “Notes to financial statements.” |
See accompanying notes, which are an integral part of the financial statements.
28
| | Year Ended |
| | 2/29/12 | | 2/28/11 | | 2/28/10 | | 2/28/09 | | 2/29/08 | |
| | $7.550 | | | $7.910 | | | $7.410 | | | $7.610 | | | $8.130 | | |
| | |
| | |
| | 0.269 | | | 0.289 | | | 0.287 | | | 0.271 | | | 0.276 | | |
| | 0.710 | | | (0.294 | ) | | 0.598 | | | (0.200 | ) | | (0.517 | ) | |
| | 0.979 | | | (0.005 | ) | | 0.885 | | | 0.071 | | | (0.241 | ) | |
| | |
| | |
| | (0.269 | ) | | (0.289 | ) | | (0.286 | ) | | (0.271 | ) | | (0.279 | ) | |
| | — | | | (0.066 | ) | | (0.099 | ) | | — | | | — | | |
| | (0.269 | ) | | (0.355 | ) | | (0.385 | ) | | (0.271 | ) | | (0.279 | ) | |
| | |
| | $8.260 | | | $7.550 | | | $7.910 | | | $7.410 | | | $7.610 | | |
| | |
| | 13.20% | | | (0.16% | ) | | 12.15% | | | 0.92% | | | (3.07% | ) | |
| | |
| | |
| | $1,489 | | | $2,549 | | | $4,259 | | | $5,543 | | | $7,540 | | |
| | |
| | 1.64% | | | 1.66% | | | 1.69% | | | 1.67% | | | 1.67% | | |
| | 0.00% | | | 0.00% | | | 0.00% | | | 0.00% | | | 0.11% | | |
| | 1.64% | | | 1.66% | | | 1.69% | | | 1.67% | | | 1.78% | | |
| | |
| | 1.69% | | | 1.69% | | | 1.70% | | | 1.69% | | | 1.69% | | |
| | 0.00% | | | 0.00% | | | 0.00% | | | 0.00% | | | 0.11% | | |
| | 1.69% | | | 1.69% | | | 1.70% | | | 1.69% | | | 1.80% | | |
| | 3.43% | | | 3.66% | | | 3.70% | | | 3.57% | | | 3.44% | | |
| | |
| | 3.38% | | | 3.63% | | | 3.69% | | | 3.55% | | | 3.42% | | |
| | 21% | | | 31% | | | 43% | | | 24% | | | 7% | | |
29
Financial highlights
Delaware Tax-Free Pennsylvania Fund Class C
Selected data for each share of the Fund outstanding throughout each period were as follows:
| Net asset value, beginning of period |
| |
| Income (loss) from investment operations: |
| Net investment income |
| Net realized and unrealized gain (loss) |
| Total from investment operations |
| |
| Less dividends and distributions from: |
| Net investment income |
| Net realized gain on investments |
| Total dividends and distributions |
| |
| Net asset value, end of period |
| |
| Total return1 |
| |
| Ratios and supplemental data: |
| Net assets, end of period (000 omitted) |
| Ratio of expenses to average net assets excluding interest and fees on short-term |
| floating rate notes issued |
| Interest and fees on short-term floating rate notes issued |
| Total expenses2 |
| Ratio of expenses to average net assets excluding interest and fees on short-term |
| floating rate notes issued prior to fees waived and expense paid indirectly |
| Interest and fees on short-term floating rate notes issued |
| Total expenses prior to fees waived and expense paid indirectly2 |
| Ratio of net investment income to average net assets |
| Ratio of net investment income to average net assets |
| prior to fees waived and expense paid indirectly |
| Portfolio turnover |
| 1 Total investment return is based on the change in net asset value of a share during the period and assumes reinvestment of dividends and distributions at net asset value and does not reflect the impact of a sales charge. Total investment return during all of the periods shown reflects a waiver by the manager. Performance would have been lower had the waiver not been in effect. |
| 2 Total expenses and total expenses prior to fees waived and expense paid indirectly include interest and related expenses which include, but are not limited to, interest expense, remarketing fees, liquidity fees, and trustees’ fees in connection with the Fund’s participation in inverse floater programs. See Notes 1 and 8 in “Notes to financial statements.” |
See accompanying notes, which are an integral part of the financial statements.
30
| | Year Ended |
| | 2/29/12 | | 2/28/11 | | 2/28/10 | | 2/28/09 | | 2/29/08 | |
| | $7.560 | | | $7.920 | | | $7.420 | | | $7.610 | | | $8.140 | | |
| | |
| | |
| | 0.269 | | | 0.289 | | | 0.287 | | | 0.271 | | | 0.276 | | |
| | 0.700 | | | (0.294 | ) | | 0.598 | | | (0.190 | ) | | (0.527 | ) | |
| | 0.969 | | | (0.005 | ) | | 0.885 | | | 0.081 | | | (0.251 | ) | |
| | |
| | |
| | (0.269 | ) | | (0.289 | ) | | (0.286 | ) | | (0.271 | ) | | (0.279 | ) | |
| | — | | | (0.066 | ) | | (0.099 | ) | | — | | | — | | |
| | (0.269 | ) | | (0.355 | ) | | (0.385 | ) | | (0.271 | ) | | (0.279 | ) | |
| | |
| | $8.260 | | | $7.560 | | | $7.920 | | | $7.420 | | | $7.610 | | |
| | |
| | 13.05% | | | (0.15% | ) | | 12.14% | | | 1.06% | | | (3.19% | ) | |
| | |
| | |
| | $27,311 | | | $21,571 | | | $15,867 | | | $11,632 | | | $9,761 | | |
| | |
| | 1.64% | | | 1.66% | | | 1.69% | | | 1.67% | | | 1.67% | | |
| | 0.00% | | | 0.00% | | | 0.00% | | | 0.00% | | | 0.11% | | |
| | 1.64% | | | 1.66% | | | 1.69% | | | 1.67% | | | 1.78% | | |
| | |
| | 1.69% | | | 1.69% | | | 1.70% | | | 1.69% | | | 1.69% | | |
| | 0.00% | | | 0.00% | | | 0.00% | | | 0.00% | | | 0.11% | | |
| | 1.69% | | | 1.69% | | | 1.70% | | | 1.69% | | | 1.80% | | |
| | 3.43% | | | 3.66% | | | 3.70% | | | 3.57% | | | 3.44% | | |
| | |
| | 3.38% | | | 3.63% | | | 3.69% | | | 3.55% | | | 3.42% | | |
| | 21% | | | 31% | | | 43% | | | 24% | | | 7% | | |
31
| Notes to financial statements | |
| Delaware Tax-Free Pennsylvania Fund | February 29, 2012 |
Delaware Group® State Tax-Free Income Trust (Trust) is organized as a Delaware statutory trust and offers one series: Delaware Tax-Free Pennsylvania Fund (Fund). The Trust is an open-end investment company. The Fund is considered diversified under the Investment Company Act of 1940, as amended, and offers Class A, Class B and Class C shares. Class A shares are sold with a maximum front-end sales charge of up to 4.50%. Class A share purchases of $1,000,000 or more will incur a contingent deferred sales charge (CDSC) of 1% if redeemed during the first year and 0.50% during the second year, provided that Delaware Distributors, L.P. (DDLP) paid a financial advisor a commission on the purchase of those shares. Class B shares may be purchased only through dividend reinvestment and certain permitted exchanges. Prior to June 1, 2007, Class B shares were sold with a CDSC that declined from 4% to zero depending upon the period of time the shares were held. Class B shares will automatically convert to Class A shares on a quarterly basis approximately eight years after purchase. Class C shares are sold with a CDSC of 1%, if redeemed during the first twelve months.
The investment objective of the Fund is to seek a high level of current interest income exempt from federal income tax and Pennsylvania state personal income tax, consistent with preservation of capital.
1. Significant Accounting Policies
The following accounting policies are in accordance with U.S. generally accepted accounting principles (U.S. GAAP) and are consistently followed by the Fund.
Security Valuation — Debt securities are valued based upon valuations provided by an independent pricing service or broker and reviewed by management. To the extent current market prices are not available, the pricing service may take into account developments related to the specific security, as well as transactions in comparable securities. Valuations for fixed income securities utilize matrix systems, which reflect such factors as security prices, yields, maturities, and ratings, and are supplemented by dealer and exchange quotations. Short-term debt securities are valued at market value. Generally, other securities and assets for which market quotations are not readily available are valued at fair value as determined in good faith under the direction of the Fund’s Board of Trustees (Board). In determining whether market quotations are readily available or fair valuation will be used, various factors will be taken into consideration, such as market closures or suspension of trading in a security.
Federal Income Taxes — No provision for federal income taxes has been made as the Fund intends to continue to qualify for federal income tax purposes as a regulated investment company under Subchapter M of the Internal Revenue Code of 1986, as amended, and make the requisite distributions to shareholders. The Fund evaluates tax positions taken or expected to be taken in the course of preparing the Fund’s tax returns to determine whether the tax positions are “more-likely-than-not” of being sustained by the applicable tax authority. Tax positions not deemed to meet the more-likely-than-not threshold are recorded as a tax benefit or expense in the current
32
year. Management has analyzed the Fund’s tax positions taken on federal income tax returns for all open tax years (February 28, 2009 – February 29, 2012), and has concluded that no provision for federal income tax is required in the Fund’s financial statements.
Class Accounting — Investment income and common expenses are allocated to the various classes of the Fund on the basis of “settled shares” of each class in relation to the net assets of the Fund. Realized and unrealized gain (loss) on investments are allocated to the various classes of the Fund on the basis of daily net assets of each class. Distribution expenses relating to a specific class are charged directly to that class.
Interest and Related Expenses — Interest and related expenses include, but are not limited to, interest expense, remarketing fees, liquidity fees, and trustees’ fees from the Fund’s participation in inverse floater programs where the Fund has transferred its own bonds to a trust that issues floating rate securities with an aggregate principal amount equal to the principal of the transferred bonds. In conveyance of the bond, the Fund receives the inverse floating rate securities and cash from the trust. As a result of certain rights retained by the Fund, the transfer of the bond is not considered a sale, but rather a form of financing for accounting purposes whereby the cash received is recorded as a liability and interest expense is recorded based on the interest rate of the floating rate securities. Remarketing fees, liquidity fees, and trustees’ fees expenses are recorded on the accrual basis.
The Fund sold out of its inverse floater position on March 14, 2008.
Use of Estimates — The preparation of financial statements in conformity with U.S. GAAP requires management to make estimates and assumptions that affect the fair value of investments, the reported amounts of assets and liabilities and disclosure of contingent assets and liabilities at the date of the financial statements and the reported amounts of revenues and expenses during the reporting period. Actual results could differ from those estimates and the differences could be material.
Other — Expenses directly attributable to the Fund are charged directly to the Fund. Other expenses common to various funds within the Delaware Investments® Family of Funds are generally allocated amongst the funds on the basis of average net assets. Management fees and some other expenses are paid monthly. Security transactions are recorded on the date the securities are purchased or sold (trade date) for financial reporting purposes. Costs used in calculating realized gains and losses on the sale of investment securities are those of the specific securities sold. Interest income is recorded on the accrual basis. Discounts and premiums are amortized to interest income over the lives of the respective securities. The Fund declares dividends daily from net investment income and pays such dividends monthly and declares and pays distributions from net realized gain on investments, if any, annually. The Fund may distribute income dividends and capital gains more frequently, if necessary for tax purposes. Dividends and distributions, if any, are recorded on the ex-dividend date.
33
Notes to financial statements
Delaware Tax-Free Pennsylvania Fund
1. Significant Accounting Policies (continued)
The Fund may receive earnings credits from its custodian when positive cash balances are maintained, which are used to offset custody fees. There were no earnings credits for the year ended February 29, 2012.
The Fund receives earnings credits from its transfer agent when positive cash balances are maintained, which are used to offset transfer agent fees. The expense paid under this arrangement is included in dividend disbursing and transfer agent fees and expenses on the statement of operations with the corresponding expense offset shown as “expense paid indirectly.” For the year ended February 29, 2012, the Fund earned $186 under this agreement.
2. Investment Management, Administration Agreements and Other Transactions with Affiliates
In accordance with the terms of its investment management agreement, the Fund pays Delaware Management Company (DMC), a series of Delaware Management Business Trust and the investment manager, an annual fee which is calculated daily at the rate of 0.55% on the first $500 million of average daily net assets of the Fund, 0.50% on the next $500 million, 0.45% on the next $1.5 billion, and 0.425% on average daily net assets in excess of $2.5 billion.
DMC has contractually agreed to waive that portion, if any, of its management fee and reimburse the Fund to the extent necessary to ensure that total annual operating expenses, (excluding any 12b-1 plan and certain other expenses) do not exceed 0.64% of the Fund’s average daily net assets through June 28, 2012. For purposes of these waivers and reimbursement, nonroutine expenses may also include such additional costs and expenses, as may be agreed upon from time to time by the Fund’s Board and DMC. These expense waivers and reimbursements apply only to expenses paid directly by the Fund.
Delaware Service Company, Inc. (DSC), an affiliate of DMC, provides fund accounting and financial administration oversight services to the Fund. For these services, the Fund pays DSC fees based on the aggregate daily net assets of the Delaware Investments® Family of Funds at the following annual rate: 0.0050% of the first $30 billion; 0.0045% of the next $10 billion; 0.0040% of the next $10 billion; and 0.0025% of aggregate average daily net assets in excess of $50 billion. The fees payable to DSC under the service agreement described above are allocated among all Funds in the Delaware Investments Family of Funds on a relative net asset value basis. For the year ended February 29, 2012, the Fund was charged $ 25,193 for these services.
DSC also provides dividend disbursing and transfer agency services. Effective July 18, 2011, the Fund pays DSC a monthly asset-based fee for these services. Prior to July 18, 2011, the Fund paid DSC a monthly fee based on the number of shareholder accounts for dividend disbursing and transfer agent services.
Pursuant to a distribution agreement and distribution plan, the Fund pays DDLP, the distributor and an affiliate of DMC, an annual distribution and service fee not to exceed 0.30% of the average daily net assets of the Class A shares and 1.00% of the average daily net assets of the
34
Class B and C shares. The Board has adopted a formula for calculating 12b-1 plan fees for the Fund’s Class A shares that went into effect on June 1, 1992. The total 12b-1 expenses to be paid by Class A shareholders of the Fund will be sum of 0.10% of the average daily net assets representing shares that were acquired prior to June 1, 1992 and 0.30% of the average daily net assets representing shares that were acquired on or after June 1, 1992. All Class A shareholders will bear 12b-1 fees at the same rate, the blended rate based upon the allocation of the 0.10% and 0.30% rates described above. DDLP has contracted to limit distribution and service fees through June 28, 2012, in order to prevent distribution and service fees of the Class A shares from exceeding 0.25% of average daily net assets. This contractual waiver is applied to the shares of the Fund that were acquired on or after June 1, 1992 in calculating the applicable 12b-1 fee rate.
At February 29, 2012, the Fund had receivables due from or liabilities payable to affiliates as follows:
| Investment management fees payable to DMC | $ | (221,371 | ) |
| Dividend disbursing, transfer agent and fund accounting | | | |
| oversight fees and other expenses payable to DSC | | (11,934 | ) |
| Distribution fees payable to DDLP | | (118,593 | ) |
| Receivable from DMC under expense limitation agreement* | | 31,515 | |
*DMC, as part of its administrative services, pays operating expenses on behalf of the Fund and is reimbursed on a periodic basis. Expenses include items such as printing of shareholder reports, fees for audit, legal and tax services, registration fees and trustees’ fees.
As provided in the investment management agreement, the Fund bears the cost of certain legal and tax services, including internal legal and tax services provided to the Fund by DMC and/or its affiliates’ employees. For the year ended February 29, 2012, the Fund was charged $16,100 for internal legal and tax services provided by DMC and/or its affiliates’ employees.
For the year ended February 29, 2012, DDLP earned $50,020 for commissions on sales of the Fund’s Class A shares. For the year ended February 29, 2012, DDLP received gross CDSC commissions of $0, $573 and $2,299 on redemption of the Fund’s Class A, Class B and Class C shares, respectively, and these commissions were entirely used to offset up-front commissions previously paid by DDLP to broker/dealers on sales of those shares.
Trustees’ fees include expenses accrued by the Fund for each Trustee’s retainer and meeting fees. Certain officers of DMC, DSC and DDLP are officers and/or Trustees of the Trust. These officers and Trustees are paid no compensation by the Fund.
3. Investments
For the year ended February 29, 2012, the Fund made purchases of $ 112,892,799 and sales of $ 106,545,785 of investment securities other than short-term investments.
At February 29, 2012, the cost of investments for federal income tax purposes was $490,433,999. At February 29, 2012, net unrealized appreciation was $43,807,121, of which $44,429,907 related to unrealized appreciation of investments and $622,786 related to unrealized depreciation of investments.
35
Notes to financial statements
Delaware Tax-Free Pennsylvania Fund
3. Investments (continued)
U.S. GAAP defines fair value as the price that the Fund would receive to sell an asset or pay to transfer a liability in an orderly transaction between market participants at the measurement date under current market conditions. A three level hierarchy for fair value measurements has been established based upon the transparency of inputs to the valuation of an asset or liability. Inputs may be observable or unobservable and refer broadly to the assumptions that market participants would use in pricing the asset or liability. Observable inputs reflect the assumptions market participants would use in pricing the asset or liability based on market data obtained from sources independent of the reporting entity. Unobservable inputs reflect the reporting entity’s own assumptions about the assumptions that market participants would use in pricing the asset or liability developed based on the best information available under the circumstances. The Fund’s investment in its entirety is assigned a level based upon the observability of the inputs which are significant to the overall valuation. The three level hierarchy of inputs is summarized below.
| Level 1 – | inputs are quoted prices in active markets for identical investments (e.g., equity securities, open-end investment companies, futures contracts, options contracts) |
| | |
| Level 2 – | other observable inputs (including, but not limited to: quoted prices for similar assets or liabilities in markets that are active, quoted prices for identical or similar assets or liabilities in markets that are not active, inputs other than quoted prices that are observable for the assets or liabilities (such as interest rates, yield curves, volatilities, prepayment speeds, loss severities, credit risks and default rates) or other market-corroborated inputs) (e.g., debt securities, government securities, swap contracts, foreign currency exchange contracts, foreign securities utilizing international fair value pricing) |
| |
| Level 3 – | inputs are significant unobservable inputs (including the Fund’s own assumptions used to determine the fair value of investments) (e.g., broker-quoted securities, fair valued securities) |
The following table summarizes the valuation of the Fund’s investments by fair value hierarchy levels as of February 29, 2012:
| Level 2 |
| Municipal Bonds | $ | 530,141,120 |
| Short-Term Investments | | 4,100,000 |
| Total | $ | 534,241,120 |
There were no unobservable inputs used to value investments at the beginning or end of the year.
During the year ended February 29, 2012, there were no transfers between Level 1 investments, Level 2 investments or Level 3 investments that had a material impact to the Fund. The Fund’s policy is to recognize transfers between levels at the end of the reporting period.
36
4. Dividend and Distribution Information
Income and long-term capital gain distributions are determined in accordance with federal income tax regulations, which may differ from U.S. GAAP. Additionally, distributions from net short-term gains on sales of investment securities are treated as ordinary income for federal income tax purposes. The tax character of dividends and distributions paid during the years ended February 29, 2012 and February 28, 2011 was as follows:
| | Year Ended |
| | 2/29/12 | | 2/28/11 |
| Ordinary income | | $ | 29,669 | | $ | 1,193,250 |
| Tax-exempt income | | | 21,103,151 | | | 22,675,584 |
| Long-term capital gain | | | — | | | 3,605,043 |
| Total | | $ | 21,132,820 | | $ | 27,473,877 |
5. Components of Net Assets on a Tax Basis
As of February 29, 2012, the components of net assets on a tax basis were as follows:
| Shares of beneficial interest | | $ | 494,860,056 | |
| Distributions payable | | | (399,272 | ) |
| Undistributed tax-exempt Income | | | 333,701 | |
| Capital loss carryforwards | | | (1,296,645 | ) |
| Unrealized appreciation of investments | | | 43,807,121 | |
| Net assets | | $ | 537,304,961 | |
For financial reporting purposes, capital accounts are adjusted to reflect the tax character of permanent book/tax differences. Reclassifications are primarily due to tax treatment of dividends and distributions. Results of operations and net assets were not affected by these reclassifications. For the year ended February 29, 2012, the Fund recorded the following reclassifications.
| Undistributed net investment income | | $ | (65,571 | ) |
| Paid-in-capital | | | 65,571 | |
On December 22, 2010, the Regulated Investment Company Modernization Act of 2010 (the Act) was enacted, which changed various technical rules governing the tax treatment of regulated investment companies. The changes are generally effective for taxable years beginning after the date of enactment. Under the Act, the Fund will be permitted to carry forward capital losses incurred in taxable years beginning after the date of enactment for an unlimited period. However, any losses incurred during those future taxable years will be required to be utilized prior to the losses incurred in pre-enactment taxable years, which carry an expiration date. As a result of this ordering rule, pre-enactment capital loss carryforwards may be more likely to expire unused. Additionally, post-enactment capital loss carryforwards will retain their character as either short-term or long-term capital losses rather than being considered all short-term as permitted under previous regulation.
37
Notes to financial statements
Delaware Tax-Free Pennsylvania Fund
5. Components of Net Assets on a Tax Basis (continued)
Losses incurred that will be carried forward under the Act are as follows:
| Loss Carryforward Character |
| | Short Term | | Long Term |
| $1,296,645 | | $— |
6. Capital Shares
Transactions in capital shares were as follows:
| | Year Ended |
| | 2/29/12 | | 2/28/11 |
| Shares sold: | | | | | | |
| Class A | | 3,219,090 | | | 4,950,129 | |
| Class B | | — | | | 6,791 | |
| Class C | | 724,829 | | | 1,181,507 | |
| |
| Shares issued upon reinvestment of dividends and distributions: | | | | | | |
| Class A | | 1,667,648 | | | 2,147,276 | |
| Class B | | 6,419 | | | 13,436 | |
| Class C | | 81,642 | | | 93,666 | |
| | 5,699,628 | | | 8,392,805 | |
| |
| Shares repurchased: | | | | | | |
| Class A | | (5,580,614 | ) | | (8,441,567 | ) |
| Class B | | (163,646 | ) | | (220,868 | ) |
| Class C | | (355,099 | ) | | (424,611 | ) |
| | (6,099,359 | ) | | (9,087,046 | ) |
| Net decrease | | (399,731 | ) | | (694,241 | ) |
For the years ended February 29, 2012 and February 28, 2011, 72,586 Class B shares were converted to 72,613 Class A shares valued at $563,077 and 165,535 Class B shares were converted to 165,535 Class A shares valued at $1,311,824, respectively. The respective amounts are included in Class B redemptions and Class A subscriptions in the table above and the statements of changes in net assets.
7. Line of Credit
The Fund, along with certain other funds in the Delaware Investments® Family of Funds (Participants), was a participant in a $50,000,000 revolving line of credit to be used for temporary or emergency purposes as an additional source of liquidity to fund redemptions of investor shares. Under the agreement, the Participants were charged an annual commitment fee, which was allocated across the Participants on the basis of each Participant’s allocation of the entire facility.
38
The Participants were permitted to borrow up to a maximum of one third of their net assets under the agreement. On August 1, 2011, the Fund, along with the other Participants, entered into an amendment for a $100,000,000 revolving line of credit. The line of credit expired on November 15, 2011.
On November 15, 2011, the Fund, along with the other Participants, entered into an amendment to the agreement for a $125,000,000 revolving line of credit. The agreement is to be used as described above and operates in substantially the same manner as the original agreement. The agreement expires on November 13, 2012. The Fund had no amounts outstanding as of February 29, 2012, or at any time during the year then ended.
8. Derivatives
U.S. GAAP requires disclosures that enable investors to understand: 1) how and why an entity uses derivatives; 2) how they are accounted for; and 3) how they affect an entity’s results of operations and financial position.
Inverse Floaters — The Fund may participate in inverse floater programs where the Fund transfers its own bonds to a trust that issues floating rate securities and inverse floating rate securities (inverse floaters) with an aggregate principal amount equal to the principal of the transferred bonds. The inverse floaters received by the Fund are derivative tax-exempt obligations with floating or variable interest rates that move in the opposite direction of short-term interest rates, usually at an accelerated speed. Consequently, the market values of the inverse floaters will generally be more volatile than other tax-exempt investments. The Fund typically uses inverse floaters to adjust the duration of its portfolio. Duration measures a portfolio’s sensitivity to changes in interest rates. By holding inverse floaters with a different duration than the underlying bonds that the Fund transferred to the trust, the Fund seeks to adjust its portfolio’s sensitivity to changes in interest rates. The Fund may also invest in inverse floaters to add additional income to the Fund or to adjust the Fund’s exposure to a specific segment of the yield curve. At February 29, 2012, the Fund held no inverse floaters.
9. Credit and Market Risk
The Fund concentrates its investments in securities issued by Pennsylvania municipalities. The value of these investments may be adversely affected by new legislation within Pennsylvania, regional or local economic conditions, as applicable, and differing levels of supply and demand for municipal bonds. Many municipalities insure repayment for their obligations. Although bond insurance reduces the risk of loss due to default by an issuer, such bonds remain subject to the risk that value may fluctuate for other reasons and there is no assurance that the insurance company will meet its obligations. A real or perceived decline in creditworthiness of a bond insurer can have an adverse impact on the value of insured bonds held in the Fund. At February 29, 2012, 16.24% of the Fund’s net assets were insured by bond insurers. These securities have been identified in the statement of net assets.
39
Notes to financial statements
Delaware Tax-Free Pennsylvania Fund
9. Credit and Market Risk (continued)
The Fund may invest in advanced refunded bonds, escrow secured bonds or defeased bonds. Under current federal tax laws and regulations, state and local government borrowers are permitted to refinance outstanding bonds by issuing new bonds. The issuer refinances the outstanding debt to either reduce interest costs or to remove or alter restrictive covenants imposed by the bonds being refinanced. A refunding transaction where the municipal securities are being refunded within 90 days from the issuance of the refunding issue is known as a “current refunding.” Advance refunded bonds are bonds in which the refunded bond issue remains outstanding for more than 90 days following the issuance of the refunding issue. In an advance refunding, the issuer will use the proceeds of a new bond issue to purchase high grade interest bearing debt securities which are then deposited in an irrevocable escrow account held by an escrow agent to secure all future payments of principal and interest and bond premium of the advance refunded bond. Bonds are “escrowed to maturity” when the proceeds of the refunding issue are deposited in an escrow account for investment sufficient to pay all of the principal and interest on the original interest payment and maturity dates.
Bonds are considered “pre-refunded” when the refunding issue’s proceeds are escrowed only until a permitted call date or dates on the refunded issue with the refunded issue being redeemed at the time, including any required premium. Bonds become “defeased” when the rights and interests of the bondholders and their lien on the pledged revenues or other security under the terms of the bond contract are substituted with an alternative source of revenues (the escrow securities) sufficient to meet payments of principal and interest to maturity or to the first call dates. Escrowed secured bonds will often receive a rating of AAA from Moody’s Investors Service, Inc., Standard & Poor’s Ratings Group, and/or Fitch Ratings due to the strong credit quality of the escrow securities and the irrevocable nature of the escrow deposit agreement.
The Fund may invest up to 15% of its net assets in illiquid securities, which may include securities with contractual restrictions on resale, securities exempt from registration under Rule 144A of the Securities Act of 1933, as amended, and other securities which may not be readily marketable. The relative illiquidity of these securities may impair the Fund from disposing of them in a timely manner and at a fair price when it is necessary or desirable to do so. While maintaining oversight, the Fund’s Board has delegated to DMC the day-to-day functions of determining whether individual securities are liquid for purposes of the Fund’s limitation on investments in illiquid securities. Securities eligible for resale pursuant to Rule 144A, which are determined to be liquid, are not subject to the Fund’s 15% limit on investments in illiquid securities. As of February 29, 2012, there were no Rule 144A securities and no securities have been determined to be illiquid under the Fund’s Liquidity Procedures.
40
10. Contractual Obligations
The Fund enters into contracts in the normal course of business that contain a variety of indemnifications. The Fund’s maximum exposure under these arrangements is unknown. However, the Fund has not had prior claims or losses pursuant to these contracts. Management has reviewed the Fund’s existing contracts and expects the risk of loss to be remote.
11. Subsequent Events
Management has determined no material events or transactions occurred subsequent to February 29, 2012 that would require recognition or disclosure in the Fund’s financial statements.
12. Tax Information (Unaudited)
The information set forth below is for the Fund’s fiscal year as required by federal laws. Shareholders, however, must report distributions on a calendar year basis for income tax purposes, which may include distributions for portions of two fiscal years of a fund. Accordingly, the information needed by shareholders for income tax purposes will be sent to them in January of each year. Please consult your tax advisor for proper treatment of this information. All designations are based on financial information available as of the date of this annual report and, accordingly are subject to change. For any and all items requiring designation, it is the intention of the Fund to designate the maximum amount permitted under the Internal Revenue Code and the regulations thereunder.
For the fiscal year ended February 29, 2012, the Fund designates distributions paid during the year as follows:
| (A) | Ordinary income distributions (Tax Basis) | | 0.14 | % |
| (B) | Tax-Exempt Distributions (Tax Basis) | | 99.86 | % |
| (C) | Long-Term Capital Gain Distributions (Tax Basis) | | — | % |
| Total Distributions (Tax Basis) | | 100.00 | % |
(A), (B), and (C) are based on a percentage of the Fund’s total distributions.
41
Report of independent
registered public accounting firm
To the Board of Trustees of Delaware Group State Tax-Free Income Trust
and the Shareholders of Delaware Tax-Free Pennsylvania Fund:
In our opinion, the accompanying statement of net assets and the related statements of operations and of changes in net assets and the financial highlights present fairly, in all material respects, the financial position of Delaware Tax-Free Pennsylvania Fund (constituting Delaware Group State Tax-Free Income Trust, hereafter referred to as the “Fund”) at February 29, 2012, the results of its operations for the year then ended and the changes in its net assets and the financial highlights for each of the two years in the period then ended, in conformity with accounting principles generally accepted in the United States of America. These financial statements and financial highlights (hereafter referred to as “financial statements”) are the responsibility of the Fund’s management; our responsibility is to express an opinion on these financial statements based on our audits. We conducted our audits of these financial statements in accordance with the standards of the Public Company Accounting Oversight Board (United States). Those standards require that we plan and perform the audit to obtain reasonable assurance about whether the financial statements are free of material misstatement. An audit includes examining, on a test basis, evidence supporting the amounts and disclosures in the financial statements, assessing the accounting principles used and significant estimates made by management, and evaluating the overall financial statement presentation. We believe that our audits, which included confirmation of securities at February 29, 2012 by correspondence with the custodian and broker, provide a reasonable basis for our opinion. The financial highlights for each of the three years in the period ended February 28, 2010 were audited by other independent accountants whose report dated April 21, 2010 expressed an unqualified opinion on those statements.
Philadelphia, Pennsylvania
April 16, 2012
42
Other Fund information
(Unaudited)
Delaware Tax-Free Pennsylvania Fund
Change in Independent Registered Public Accounting Firm
Due to independence matters under the Securities and Exchange Commission’s auditor independence rules relating to the January 4, 2010 acquisition of Delaware Investments (including DMC, DDLP and DSC) by Macquarie Group, Ernst & Young LLP (E&Y) has resigned as the independent registered public accounting firm for Delaware Group® State Tax-Free Income Trust (the Trust) effective April 28, 2010. At a meeting held on February 18, 2010, the Board of Trustees of the Trust, upon recommendation of the Audit Committee, selected PricewaterhouseCoopers LLP (PwC) to serve as the independent registered public accounting firm for the Trust for the fiscal year ending February 28, 2011. During the fiscal years ended February 28, 2010 and 2009, E&Y’s audit reports on the financial statements of the Trust did not contain any adverse opinion or disclaimer of opinion, nor were they qualified or modified as to uncertainty, audit scope, or accounting principles. In addition, there were no disagreements between the Trust and E&Y on accounting principles, financial statements disclosures or audit scope, which, if not resolved to the satisfaction of E&Y, would have caused them to make reference to the disagreement in their reports. Neither the Trust nor anyone on its behalf has consulted with PwC at any time prior to their selection with respect to the application of accounting principles to a specified transaction, either completed or proposed, or the type of audit opinion that might be rendered on the Trust’s financial statements.
43
Board of trustees/directors and officers addendum
Delaware Investments® Family of Funds
A mutual fund is governed by a Board of Trustees/Directors (“Trustees”), which has oversight responsibility for the management of a fund’s business affairs. Trustees establish procedures and oversee and review the performance of the investment manager, the distributor, and others who perform services for the fund. The independent fund trustees, in particular, are advocates
| Name, Address, | | Position(s) | | Length of |
| and Birth Date | | Held with Fund(s) | | Time Served |
| Interested Trustees |
| |
| Patrick P. Coyne1 | | Chairman, President, | | Chairman and Trustee |
| 2005 Market Street | | Chief Executive Officer, | | since August 16, 2006 |
| Philadelphia, PA 19103 | | and Trustee | | |
| April 1963 | | | | President and |
| | | | Chief Executive Officer |
| | | | since August 1, 2006 |
| | | | | |
| | | | | |
| | | | | |
| | | | | |
| | | | | |
| | | | | |
| | | | | |
| | | | | |
| | | | | |
| | | | | |
| | | | | |
| | | | | |
| | | | | |
| | | | | |
| | | | | |
| | | | | |
| | | | | |
| | | | | |
| | | | | |
| | | | | |
| | | | | |
| | | | | |
| | | | | |
| | | | | |
| | | | | |
| | | | | |
| | | | | |
| | | | | |
| | | | | |
| | | | | |
| | | | | |
| | | | | |
| | | | | |
1 Patrick P. Coyne is considered to be an “Interested Trustee” because he is an executive officer of the Fund’s(s’) investment advisor.
44
for shareholder interests. Each trustee has served in that capacity since he or she was elected to or appointed to the Board of Trustees, and will continue to serve until his or her retirement or the election of a new trustee in his or her place. The following is a list of the Trustees and Officers with certain background and related information.
| | Number of Portfolios in | | |
| Principal Occupation(s) | | Fund Complex Overseen | | Other Directorships |
| During Past 5 Years | | by Trustee or Officer | | Held by Trustee or Officer |
| | | | | |
| | | | | |
| Patrick P. Coyne has served in | | 74 | | Director and Audit |
| various executive capacities | | | | Committee Member |
| at different times at | | | | Kaydon Corp. |
| Delaware Investments.2 | | | | |
| | | | Board of Governors Member |
| | | | Investment Company |
| | | | Institute (ICI) |
| | | | |
| | | | Finance Committee Member |
| | | | St. John Vianney Roman |
| | | | Catholic Church |
| | | | |
| | | | Board of Trustees |
| | | | Agnes Irwin School |
| | | | |
| | | | Member of Investment |
| | | | Committee |
| | | | Cradle of Liberty Council, |
| | | | BSA |
| | | | (2007–2010) |
| | | | | |
| | | | | |
| | | | | |
| | | | | |
| | | | | |
| | | | | |
| | | | | |
| | | | | |
| | | | | |
| | | | | |
| | | | | |
| | | | | |
| | | | | |
| | | | | |
| | | | | |
| | | | | |
| | | | | |
| | | | | |
| | | | | |
2 Delaware Investments is the marketing name for Delaware Management Holdings, Inc. and its subsidiaries, including the Fund’s(s’) investment advisor, principal underwriter, and its transfer agent.
45
Board of trustees/directors and officers addendum
Delaware Investments® Family of Funds
| Name, Address, | | Position(s) | | Length of |
| and Birth Date | | Held with Fund(s) | | Time Served |
| Independent Trustees |
| | | | | |
| Thomas L. Bennett | | Trustee | | Since March 2005 |
| 2005 Market Street | | | | |
| Philadelphia, PA 19103 | | | | |
| October 1947 | | | | |
| | | | | |
| | | | | |
| | | | | |
| | | | | |
| | | | | |
| | | | | |
| | | | | |
| | | | | |
| | | | | |
| | | | | |
| | | | | |
| John A. Fry | | Trustee | | Since January 2001 |
| 2005 Market Street | | | | |
| Philadelphia, PA 19103 | | | | |
| May 1960 | | | | |
| | | | | |
| | | | | |
| | | | | |
| | | | |
| | | | |
| | | | | |
| | | | | |
| | | | | |
| | | | | |
| | | | | |
| | | | | |
| | | | | |
| | | | | |
| Anthony D. Knerr | | Trustee | | Since April 1990 |
| 2005 Market Street | | | | |
| Philadelphia, PA 19103 | | | | |
| December 1938 | | | | |
| | | | | |
| Lucinda S. Landreth | | Trustee | | Since March 2005 |
| 2005 Market Street | | | | |
| Philadelphia, PA 19103 | | | | |
| June 1947 | | | | |
| | | | | |
46
| Number of Portfolios in |
| Principal Occupation(s) | | Fund Complex Overseen | | Other Directorships |
| During Past 5 Years | | by Trustee or Officer | | Held by Trustee or Officer |
| | | | | |
| | | | | |
| Private Investor | | 74 | | Chairman of Investment |
| (March 2004–Present) | | | | Committee |
| | | | | Pennsylvania Academy of |
| Investment Manager | | | | Fine Arts |
| Morgan Stanley & Co. | | | | |
| (January 1984–March 2004) | | | | Investment Committee and |
| | | | | Governance Committee |
| | | | | Member |
| | | | | Pennsylvania Horticultural |
| | | | | Society |
| | | | | |
| | | | | Director |
| | | | | Bryn Mawr Bank Corp. (BMTC) |
| | | | | (2007–2011) |
| | | | | |
| President | | 74 | | Board of Governors Member — |
| Drexel University | | | | NASDAQ OMX PHLX LLC |
| (August 2010–Present) | | | | |
| | | | | Director and Audit |
| President | | | | Committee Member |
| Franklin & Marshall College | | | | Community Health Systems |
| (July 2002–July 2010) | | | | |
| | | | Director — U.S. SQUASH |
| | | | | |
| | | | | Director — Ecore |
| | | | | International |
| | | | | (2009–2010) |
| | | | | |
| | | | | Director — Allied |
| | | | | Barton Securities Holdings |
| | | | | (2005–2008) |
| | | | | |
| Managing Director | | 74 | | None |
| Anthony Knerr & Associates | | | | |
| (Strategic Consulting) | | | | |
| (1990–Present) | | | | |
| | | | |
| Chief Investment Officer | | 74 | | None |
| Assurant, Inc. (Insurance) | | | | |
| (2002–2004) | | | | |
| | | | | |
| | | | | |
47
Board of trustees/directors and officers addendum
Delaware Investments® Family of Funds
| Name, Address, | | Position(s) | | Length of |
| and Birth Date | | Held with Fund(s) | | Time Served |
| Independent Trustees (continued) | | | | |
| | | | | |
| Ann R. Leven | | Trustee | | Since October 1989 |
| 2005 Market Street | | | | |
| Philadelphia, PA 19103 | | | | |
| November 1940 | | | | |
| | | | | |
| | | | | |
| | | | | |
| | | | | |
| | | | | |
| | | | | |
| Frances A. Sevilla-Sacasa | | Trustee | | Since September 2011 |
| 2005 Market Street | | | | |
| Philadelphia, PA 19103 | | | | |
| January 1956 | | | | |
| | | | | |
| | | | |
| | | | | |
| | | | | |
| | | | | |
| | | | | |
| | | | |
| | | | | |
| | | | | |
| | | | | |
| | | | | |
| | | | |
| | | | | |
| | | | | |
| | | | | |
| | | | | |
| | | | |
| | | | | |
| | | | | |
| | | | | |
| | | | | |
| | | | |
| | | | | |
| | | | | |
| | | | | |
| | | | | |
48
| | Number of Portfolios in | | |
| Principal Occupation(s) | | Fund Complex Overseen | | Other Directorships |
| During Past 5 Years | | by Trustee or Officer | | Held by Trustee or Officer |
| | | | | |
| | | | |
| Consultant | | 74 | | Director and Audit |
| ARL Associates | | | | Committee Chair |
| (Financial Planning) | | | | Systemax Inc. |
| (1983–Present) | | | | (2001–2009) |
| | | | |
| | | | Director and Audit |
| | | | Committee Chairperson |
| | | | Andy Warhol Foundation |
| | | | (1999–2007) |
| | | | |
| Executive Advisor to Dean | | 74 | | Trust Manager — Camden |
| (since August 2011) and | | | | Property Trust |
| Interim Dean | | | | (since August 2011) |
| (January 2011–July 2011) — | | | | |
| University of Miami School of | | | | Board of Trustees |
| Business Administration | | | | Thunderbird School of |
| | | | Global Management |
| President — U.S. Trust, | | | | (2007–2011) |
| Bank of America Private | | | | |
| Wealth Management | | | | Board of Trustees |
| (Private Banking) | | | | Carrollton School of the |
| (July 2007–December 2008) | | | | Sacred Heart |
| | | | (since 2007) |
| President and Director | | | | |
| (November 2005–June 2007) and | | | | Board Member |
| Chief Executive Officer | | | | Foreign Policy Association |
| (April 2007–June 2007) — | | | | (since 2006) |
| U.S. Trust Company | | | | |
| (Private Banking) | | | | Board of Trustees |
| | | | Georgetown Preparatory School |
| | | | (2005–2011) |
| | | | |
| | | | Board of Governors |
| | | | Miami City Ballet |
| | | | (2000–2011) |
| | | | |
| | | | Board of Trustees |
| | | | St. Thomas University |
| | | | (2005–2011) |
| | | | |
49
Board of trustees/directors and officers addendum
Delaware Investments® Family of Funds
| Name, Address, | | Position(s) | | Length of |
| and Birth Date | | Held with Fund(s) | | Time Served |
| Independent Trustees (continued) | | | | |
| | | | | |
| Janet L. Yeomans | | Trustee | | Since April 1999 |
| 2005 Market Street | | | | |
| Philadelphia, PA 19103 | | | | |
| July 1948 | | | | |
| | | | | |
| | | | | |
| | | | | |
| | | | | |
| J. Richard Zecher | | Trustee | | Since March 2005 |
| 2005 Market Street | | | | |
| Philadelphia, PA 19103 | | | | |
| July 1940 | | | | |
| | | | | |
| | | | | |
| | | | | |
| | | | | |
| | | | | |
| | | | | |
| | | | | |
| | | | | |
| | | | | |
| | | | | |
| | | | | |
| | | | | |
| | | | | |
| | | | | |
| | | | | |
| | | | | |
| | | | | |
| | | | | |
| | | | | |
| | | | | |
| | | | | |
| | | | | |
| | | | | |
| | | | | |
| | | | | |
| | | | | |
| | | | | |
| | | | | |
| | | | | |
| | | | | |
| | | | | |
| | | | | |
| | | | | |
50
| | Number of Portfolios in | | |
| Principal Occupation(s) | | Fund Complex Overseen | | Other Directorships |
| During Past 5 Years | | by Trustee or Officer | | Held by Trustee or Officer |
| | | | | |
| | | | | |
| Vice President and Treasurer | | 74 | | Director and Audit |
| (January 2006–Present) | | | | Committee Member |
| Vice President — Mergers & Acquisitions | | | | Okabena Company |
| (January 2003–January 2006), and | | | | |
| Vice President and Treasurer | | | | Chair — 3M |
| (July 1995–January 2003) | | | | Investment Management |
| 3M Corporation | | | | Company |
| | | | | |
| Founder | | 74 | | Director and Compensation |
| Investor Analytics | | | | Committee Member |
| (Risk Management) | | | | Investor Analytics |
| (May 1999–Present) | | | | |
| | | | Director |
| Founder | | | | Oxigene, Inc. |
| Sutton Asset Management | | | | (2003–2008) |
| (Hedge Fund) | | | | |
| (September 1996–Present) | | | | |
| | | | | |
| | | | | |
| | | | | |
| | | | | |
| | | | | |
| | | | | |
| | | | | |
| | | | | |
| | | | | |
| | | | | |
| | | | | |
| | | | | |
| | | | | |
| | | | | |
| | | | | |
| | | | | |
| | | | | |
| | | | | |
| | | | | |
| | | | | |
| | | | | |
| | | | | |
| | | | | |
51
Board of trustees/directors and officers addendum
Delaware Investments® Family of Funds
| Name, Address, | | Position(s) | | Length of |
| and Birth Date | | Held with Fund(s) | | Time Served |
| Officers | | | | |
| | | | | |
| David F. Connor | | Vice President, | | Vice President since |
| 2005 Market Street | | Deputy General | | September 2000 |
| Philadelphia, PA 19103 | | Counsel, and Secretary | | and Secretary since |
| December 1963 | | | | October 2005 |
| | | | |
| | | | | |
| Daniel V. Geatens | | Vice President | | Treasurer |
| 2005 Market Street | | and Treasurer | | since October 2007 |
| Philadelphia, PA 19103 | | | | |
| October 1972 | | | | |
| | | | | |
| David P. O’Connor | | Senior Vice President, | | Senior Vice President, |
| 2005 Market Street | | General Counsel, | | General Counsel, and |
| Philadelphia, PA 19103 | | and Chief Legal Officer | | Chief Legal Officer |
| February 1966 | | | | since October 2005 |
| | | | | |
| Richard Salus | | Senior Vice President | | Chief Financial Officer |
| 2005 Market Street | | and Chief Financial Officer | | since November 2006 |
| Philadelphia, PA 19103 | | | | |
| October 1963 | | | | |
| | | | | |
The Statement of Additional Information for the Fund(s) includes additional information about the Trustees and Officers and is available, without charge, upon request by calling 800 523-1918.
52
| | Number of Portfolios in | | |
| Principal Occupation(s) | | Fund Complex Overseen | | Other Directorships |
| During Past 5 Years | | by Trustee or Officer | | Held by Trustee or Officer |
| | | | | |
| | | | | |
| David F. Connor has served as | | 74 | | None3 |
| Vice President and Deputy | | | | |
| General Counsel of | | | | |
| Delaware Investments | | | | |
| since 2000. | | | | |
| | | | | |
| Daniel V. Geatens has served | | 74 | | None3 |
| in various capacities at | | | | |
| different times at | | | | |
| Delaware Investments. | | | | |
| | | | | |
| David P. O’Connor has served in | | 74 | | None3 |
| various executive and legal | | | | |
| capacities at different times | | | | |
| at Delaware Investments. | | | | |
| | | | | |
| Richard Salus has served in | | 74 | | None3 |
| various executive capacities | | | | |
| at different times at | | | | |
| Delaware Investments. | | | | |
| | | | | |
3 David F. Connor, Daniel V. Geatens, David P. O’Connor, and Richard Salus serve in similar capacities for the six portfolios of the Optimum Fund Trust, which have the same investment advisor, principal underwriter, and transfer agent as the registrant.
53
About the organization
| Board of trustees |
Patrick P. Coyne
Chairman, President, and
Chief Executive Officer
Delaware Investments®
Family of Funds
Philadelphia, PA Thomas L. Bennett
Private Investor
Rosemont, PA John A. Fry
President
Drexel University
Philadelphia, PA | Anthony D. Knerr
Founder and Managing
Director
Anthony Knerr &
Associates
New York, NY Lucinda S. Landreth
Former Chief Investment
Officer
Assurant, Inc.
Philadelphia, PA | Ann R. Leven
Consultant
ARL Associates
New York, NY Frances A.
Sevilla-Sacasa
Executive Advisor
to Dean, University of
Miami School of
Business Administration
Coral Gables, FL | Janet L. Yeomans
Vice President and
Treasurer
3M Corporation
St. Paul, MN J. Richard Zecher
Founder
Investor Analytics
Scottsdale, AZ |
| | | | |
| Affiliated officers |
David F. Connor
Vice President, Deputy
General Counsel, and
Secretary
Delaware Investments
Family of Funds
Philadelphia, PA | Daniel V. Geatens
Vice President and
Treasurer
Delaware Investments
Family of Funds
Philadelphia, PA | David P. O’Connor
Senior Vice President,
General Counsel,
and Chief Legal Officer
Delaware Investments
Family of Funds
Philadelphia, PA | Richard Salus
Senior Vice President and
Chief Financial Officer
Delaware Investments
Family of Funds
Philadelphia, PA |
| This annual report is for the information of Delaware Tax-Free Pennsylvania Fund shareholders, but it may be used with prospective investors when preceded or accompanied by the Delaware Investments Fund fact sheet for the most recently completed calendar quarter. These documents are available at www.delawareinvestments.com. |
Delaware Investments is the marketing name of Delaware Management Holdings, Inc. and its subsidiaries. The Fund files its complete schedule of portfolio holdings with the Securities and Exchange Commission (SEC) for the first and third quarters of each fiscal year on Form N-Q. The Fund’s Forms N-Q, as well as a description of the policies and procedures that the Fund uses to determine how to vote proxies (if any) relating to portfolio securities are available without charge (i) upon request, by calling 800 523-1918; and (ii) on the SEC’s website at www.sec.gov. In addition, a description of the policies and procedures that the Fund uses to determine how to vote proxies (if any) relating to portfolio securities and the Fund’s Schedule of Investments are available without charge on the Fund’s website at www.delawareinvestments.com. The Fund’s Forms N-Q may be reviewed and copied at the SEC’s Public Reference Room in Washington, D.C.; information on the operation of the Public Reference Room may be obtained by calling 800 SEC-0330. Information (if any) regarding how the Fund voted proxies relating to portfolio securities during the most recently disclosed 12-month period ended June 30 is available without charge (i) through the Fund’s website at www.delawareinvestments.com; and (ii) on the SEC’s website at www.sec.gov. |
54
Item 2. Code of Ethics
The registrant has adopted a code of ethics that applies to the registrant’s principal executive officer, principal financial officer, principal accounting officer or controller, or persons performing similar functions, regardless of whether these individuals are employed by the registrant or a third party. A copy of the registrant’s Code of Business Ethics has been posted on the Delaware Investments Internet Web site at www.delawareinvestments.com. Any amendments to the Code of Business Ethics, and information on any waiver from its provisions granted by the registrant, will also be posted on this Web site within five business days of such amendment or waiver and will remain on the Web site for at least 12 months.
Item 3. Audit Committee Financial Expert
The registrant’s Board of Trustees/Directors has determined that certain members of the registrant’s Audit Committee are audit committee financial experts, as defined below. For purposes of this item, an “audit committee financial expert” is a person who has the following attributes:
a. An understanding of generally accepted accounting principles and financial statements;
b. The ability to assess the general application of such principles in connection with the accounting for estimates, accruals, and reserves;
c. Experience preparing, auditing, analyzing, or evaluating financial statements that present a breadth and level of complexity of accounting issues that are generally comparable to the breadth and complexity of issues that can reasonably be expected to be raised by the registrant’s financial statements, or experience actively supervising one or more persons engaged in such activities;
d. An understanding of internal controls and procedures for financial reporting; and
e. An understanding of audit committee functions.
An “audit committee financial expert” shall have acquired such attributes through:
a. Education and experience as a principal financial officer, principal accounting officer, controller, public accountant, or auditor or experience in one or more positions that involve the performance of similar functions;
b. Experience actively supervising a principal financial officer, principal accounting officer, controller, public accountant, auditor, or person performing similar functions;
c. Experience overseeing or assessing the performance of companies or public accountants with respect to the preparation, auditing, or evaluation of financial statements; or
d. Other relevant experience.
The registrant’s Board of Trustees/Directors has also determined that each member of the registrant’s Audit Committee is independent. In order to be “independent” for purposes of this item, the Audit Committee member may not: (i) other than in his or her capacity as a member of the Board of Trustees/Directors or any committee thereof, accept directly or indirectly any consulting, advisory or other compensatory fee from the issuer; or (ii) be an “interested person” of the registrant as defined in Section 2(a)(19) of the Investment Company Act of 1940.
The names of the audit committee financial experts on the registrant’s Audit Committee are set forth below:
Thomas L. Bennett1
John A. Fry
Frances A. Sevilla-Sacasa
Janet L. Yeomans
Item 4. Principal Accountant Fees and Services
(a) Audit fees.
The aggregate fees billed for services provided to the registrant by its independent auditors for the audit of the registrant’s annual financial statements and for services normally provided by the independent auditors in connection with statutory and regulatory filings or engagements were $23,834 for the fiscal year ended February 29, 2012.
____________________
1 The instructions to Form N-CSR require disclosure on the relevant experience of persons who qualify as audit committee financial experts based on “other relevant experience.” The Board of Trustees/Directors has determined that Mr. Bennett qualifies as an audit committee financial expert by virtue of: his education and Chartered Financial Analyst designation; his experience as a credit analyst, portfolio manager and the manager of other credit analysts and portfolio managers; and his prior service on the audit committees of public companies.
The aggregate fees billed for services provided to the registrant by its independent auditors for the audit of the registrant’s annual financial statements and for services normally provided by the independent auditors in connection with statutory and regulatory filings or engagements were $30,900 for the fiscal year ended February 28, 2011.
(b) Audit-related fees.
The aggregate fees billed by the registrant’s independent auditors for services relating to the performance of the audit of the registrant’s financial statements and not reported under paragraph (a) of this Item were $0 for the fiscal year ended February 29, 2012.
The aggregate fees billed by the registrant’s independent auditors for services relating to the performance of the audit of the financial statements of the registrant’s investment adviser and other service providers under common control with the adviser and that relate directly to the operations or financial reporting of the registrant were $536,500 for the registrant’s fiscal year ended February 29, 2012. The percentage of these fees relating to services approved by the registrant’s Audit Committee pursuant to the de minimis exception from the pre-approval requirement in Rule 2-01(c)(7)(i)(C) of Regulation S-X was 0%. These audit-related services were as follows: year end audit procedures; reporting up and subsidiary statutory audits.
The aggregate fees billed by the registrant’s independent auditors for services relating to the performance of the audit of the registrant’s financial statements and not reported under paragraph (a) of this Item were $0 for the fiscal year ended February 28, 2011.
The aggregate fees billed by the registrant’s independent auditors for services relating to the performance of the audit of the financial statements of the registrant’s investment adviser and other service providers under common control with the adviser and that relate directly to the operations or financial reporting of the registrant were $380,500 for the registrant’s fiscal year ended February 28, 2011. The percentage of these fees relating to services approved by the registrant’s Audit Committee pursuant to the de minimis exception from the pre-approval requirement in Rule 2-01(c)(7)(i)(C) of Regulation S-X was 0%. These audit-related services were as follows: Audit procedures performed on Delaware Investments for its consolidation into Macquarie's group financial statements as of March 31, 2010, as well as billings for the year end March 31, 2011 audit procedures for consolidation into the group's financial statements and Delaware subsidiary audit procedures.
(c) Tax fees.
The aggregate fees billed by the registrant’s independent auditors for tax-related services provided to the registrant were $4,650 for the fiscal year ended February 29, 2012. The percentage of these fees relating to services approved by the registrant’s Audit Committee pursuant to the de minimis exception from the pre-approval requirement in Rule 2-01(c)(7)(i)(C) of Regulation S-X was 0%. These tax-related services were as follows: review of income tax returns and review of annual excise distribution calculations.
The aggregate fees billed by the registrant’s independent auditors for tax-related services provided to the registrant’s investment adviser and other service providers under common control with the adviser and that relate directly to the operations or financial reporting of the registrant were $0 for the registrant’s fiscal year ended February 29, 2012.
The aggregate fees billed by the registrant’s independent auditors for tax-related services provided to the registrant were $5,750 for the fiscal year ended February 28, 2011. The percentage of these fees relating to services approved by the registrant’s Audit Committee pursuant to the de minimis exception from the pre-approval requirement in Rule 2-01(c)(7)(i)(C) of Regulation S-X was 0%. These tax-related services were as follows: review of income tax returns and review of annual excise distribution calculations.
The aggregate fees billed by the registrant’s independent auditors for tax-related services provided to the registrant’s investment adviser and other service providers under common control with the adviser and that relate directly to the operations or financial reporting of the registrant were $10,000 for the registrant’s fiscal year ended February 28, 2011. The percentage of these fees relating to services approved by the registrant’s Audit Committee pursuant to the de minimis exception from the pre-approval requirement in Rule 2-01(c)(7)(i)(C) of Regulation S-X was 0%. These tax-related services were as follows: state and local tax services.
(d) All other fees.
The aggregate fees billed for all services provided by the independent auditors to the registrant other than those set forth in paragraphs (a), (b) and (c) of this Item were $0 for the fiscal year ended February 29, 2012.
The aggregate fees billed for all services other than those set forth in paragraphs (b) and (c) of this Item provided by the registrant’s independent auditors to the registrant’s adviser and other service providers under common control with the adviser and that relate directly to the operations or financial reporting of the registrant were $25,000 for the registrant’s fiscal year ended February 29, 2012. The percentage of these fees relating to services approved by the registrant’s Audit Committee pursuant to the de minimis exception from the pre-approval requirement in Rule 2-01(c)(7)(i)(C) of Regulation S-X was 0%. These other services were as follows: attest examination of management's assertion to the controls in place at the transfer agent to be in compliance with Rule 17ad-13(a)(3) of the Securities Exchange Act of 1934.
The aggregate fees billed for all services provided by the independent auditors to the registrant other than those set forth in paragraphs (a), (b) and (c) of this Item were $0 for the fiscal year ended February 28, 2011.
The aggregate fees billed for all services other than those set forth in paragraphs (b) and (c) of this Item provided by the registrant’s independent auditors to the registrant’s adviser and other service providers under common control with the adviser and that relate directly to the operations or financial reporting of the registrant were $0 for the registrant’s fiscal year ended February 28, 2011.
(e) The registrant’s Audit Committee has established pre-approval policies and procedures as permitted by Rule 2-01(c)(7)(i)(B) of Regulation S-X (the “Pre-Approval Policy”) with respect to services provided by the registrant’s independent auditors. Pursuant to the Pre-Approval Policy, the Audit Committee has pre-approved the services set forth in the table below with respect to the registrant up to the specified fee limits. Certain fee limits are based on aggregate fees to the registrant and other registrants within the Delaware Investments Family of Funds.
| Service | Range of Fees |
| Audit Services | |
| Statutory audits or financial audits for new Funds | up to $25,000 per Fund |
| Services associated with SEC registration statements (e.g., Form N-1A, Form N-14, etc.), periodic reports and other documents filed with the SEC or other documents issued in connection with securities offerings (e.g., comfort letters for closed-end Fund offerings, consents), and assistance in responding to SEC comment letters | up to $10,000 per Fund |
| Consultations by Fund management as to the accounting or disclosure treatment of transactions or events and/or the actual or potential impact of final or proposed rules, standards or interpretations by the SEC, FASB, or other regulatory or standard-setting bodies (Note: Under SEC rules, some consultations may be considered “audit-related services” rather than “audit services”) | up to $25,000 in the aggregate |
| Audit-Related Services | |
| Consultations by Fund management as to the accounting or disclosure treatment of transactions or events and/or the actual or potential impact of final or proposed rules, standards or interpretations by the SEC, FASB, or other regulatory or standard-setting bodies (Note: Under SEC rules, some consultations may be considered “audit services” rather than “audit-related services”) | up to $25,000 in the aggregate |
| Tax Services | |
| U.S. federal, state and local and international tax planning and advice (e.g., consulting on statutory, regulatory or administrative developments, evaluation of Funds’ tax compliance function, etc.) | up to $25,000 in the aggregate |
| U.S. federal, state and local tax compliance (e.g., excise distribution reviews, etc.) | up to $5,000 per Fund |
| Review of federal, state, local and international income, franchise and other tax returns | up to $5,000 per Fund |
Under the Pre-Approval Policy, the Audit Committee has also pre-approved the services set forth in the table below with respect to the registrant’s investment adviser and other entities controlling, controlled by or under common control with the investment adviser that provide ongoing services to the registrant (the “Control Affiliates”) up to the specified fee limit. This fee limit is based on aggregate fees to the investment adviser and its Control Affiliates.
| Service | Range of Fees |
| Non-Audit Services | |
| Services associated with periodic reports and other documents filed with the SEC and assistance in responding to SEC comment letters | up to $10,000 in the aggregate |
The Pre-Approval Policy requires the registrant’s independent auditors to report to the Audit Committee at each of its regular meetings regarding all services initiated since the last such report was rendered, including those services authorized by the Pre-Approval Policy.
(f) Not applicable.
(g) The aggregate non-audit fees billed by the registrant’s independent auditors for services rendered to the registrant and to its investment adviser and other service providers under common control with the adviser were $5,228,766 and $0 for the registrant’s fiscal years ended February 29, 2012 and February 28, 2011, respectively.
(h) In connection with its selection of the independent auditors, the registrant’s Audit Committee has considered the independent auditors’ provision of non-audit services to the registrant’s investment adviser and other service providers under common control with the adviser that were not required to be pre-approved pursuant to Rule 2-01(c)(7)(ii) of Regulation S-X. The Audit Committee has determined that the independent auditors’ provision of these services is compatible with maintaining the auditors’ independence.
Item 5. Audit Committee of Listed Registrants
Not applicable.
Item 6. Investments
(a) Included as part of report to shareholders filed under Item 1 of this Form N-CSR.
(b) Divestment of securities in accordance with Section 13(c) of the Investment Company Act of 1940.
Not applicable.
Item 7. Disclosure of Proxy Voting Policies and Procedures for Closed-End Management Investment Companies
Not applicable.
Item 8. Portfolio Managers of Closed-End Management Investment Companies
Not applicable.
Item 9. Purchases of Equity Securities by Closed-End Management Investment Company and Affiliated Purchasers
Not applicable.
Item 10. Submission of Matters to a Vote of Security Holders
Not applicable.
Item 11. Controls and Procedures
The registrant’s principal executive officer and principal financial officer have evaluated the registrant’s disclosure controls and procedures within 90 days of the filing of this report and have concluded that they are effective in providing reasonable assurance that the information required to be disclosed by the registrant in its reports or statements filed under the Securities Exchange Act of 1934 is recorded, processed, summarized and reported within the time periods specified in the rules and forms of the Securities and Exchange Commission.
There were no significant changes in the registrant’s internal control over financial reporting that occurred during the second fiscal quarter of the period covered by the report to stockholders included herein (i.e., the registrant’s fourth fiscal quarter) that have materially affected, or are reasonably likely to materially affect, the registrant’s internal control over financial reporting.
Item 12. Exhibits
(a) (1) Code of Ethics
Not applicable.
(2) Certifications of Principal Executive Officer and Principal Financial Officer pursuant to Rule 30a-2 under the Investment Company Act of 1940 are attached hereto as Exhibit 99.CERT.
(3) Written solicitations to purchase securities pursuant to Rule 23c-1 under the Securities Exchange Act of 1934.
Not applicable.
(b) Certifications pursuant to Section 906 of the Sarbanes-Oxley Act of 2002 are furnished herewith as Exhibit 99.906CERT.
SIGNATURES
Pursuant to the requirements of the Securities Exchange Act of 1934 and the Investment Company Act of 1940, the registrant has duly caused this report to be signed on its behalf, by the undersigned, thereunto duly authorized.
Name of Registrant: DELAWARE GROUP® STATE TAX-FREE INCOME TRUST
| /s/ PATRICK P. COYNE |
| By: | Patrick P. Coyne |
| Title: | Chief Executive Officer |
| Date: | May 2, 2012 |
Pursuant to the requirements of the Securities Exchange Act of 1934 and the Investment Company Act of 1940, this report has been signed below by the following persons on behalf of the registrant and in the capacities and on the dates indicated.
| /s/ PATRICK P. COYNE |
| By: | Patrick P. Coyne |
| Title: | Chief Executive Officer |
| Date: | May 2, 2012 |
| |
| /s/ RICHARD SALUS |
| By: | Richard Salus |
| Title: | Chief Financial Officer |
| Date: | May 2, 2012 |