Fixed income mutual funds
Delaware Tax-Free Arizona Fund
Delaware Tax-Free California Fund
Delaware Tax-Free Colorado Fund
Delaware Tax-Free Idaho Fund
Delaware Tax-Free New York Fund
Delaware Tax-Free Pennsylvania Fund
August 31, 2018
Carefully consider the Funds’ investment objectives, risk factors, charges, and expenses before investing. This and other information can be found in the Funds’ prospectus and their summary prospectuses, which may be obtained by visiting delawarefunds.com/literature or calling 800 523-1918. Investors should read the prospectus and the summary prospectus carefully before investing.
You can obtain shareholder reports and prospectuses online instead of in the mail.
Visit delawarefunds.com/edelivery.

Experience Delaware Funds® by Macquarie
Macquarie Investment Management (MIM) is a global asset manager with offices throughout the United States, Europe, Asia, and Australia. We are active managers who prioritize autonomy and accountability at the investment team level in pursuit of opportunities that matter for our clients. Delaware Funds is one of the longest-standing mutual fund families, with more than 75 years in existence.
If you are interested in learning more about creating an investment plan, contact your financial advisor.
You can learn more about Delaware Funds or obtain a prospectus for Delaware Tax-Free Arizona Fund, Delaware Tax-Free California Fund, Delaware Tax-Free Colorado Fund, Delaware Tax-Free Idaho Fund, Delaware Tax-Free New York Fund, and Delaware Tax-Free Pennsylvania Fund at delawarefunds.com/literature.
Manage your account online
| ● | | Check your account balance and transactions |
| ● | | View statements and tax forms |
| ● | | Make purchases and redemptions |
Visit delawarefunds.com/account-access.
Macquarie Asset Management (MAM) offers a diverse range of products including securities investment management, infrastructure and real asset management, and fund and equity-based structured products. Macquarie Investment Management (MIM) is the marketing name for certain companies comprising the asset management division of Macquarie Group. This includes the following registered investment advisers: Macquarie Investment Management Business Trust (MIMBT), Macquarie Funds Management Hong Kong Limited, Macquarie Investment Management Austria Kapitalanlage AG, Macquarie Investment Management Global Limited, Macquarie Investment Management Europe Limited, and Macquarie Capital Investment Management LLC.
The Funds are distributed by Delaware Distributors, L.P.
(DDLP), an affiliate of MIMBT and Macquarie Group Limited.
Other than Macquarie Bank Limited (MBL), none of the entities noted are authorized deposit-taking institutions for the purposes of the Banking Act 1959 (Commonwealth of Australia). The obligations of these entities do not represent deposits or other liabilities of MBL. MBL does not guarantee or otherwise provide assurance in respect of the obligations of these entities, unless noted otherwise. The Funds are governed by US laws and regulations.
Unless otherwise noted, views expressed herein are current as of Aug. 31, 2018, and subject to change for events occurring after such date.
The Funds are not FDIC insured and are not guaranteed. It is possible to lose the principal amount invested.
Advisory services provided by Delaware Management Company, a series of MIMBT, a US registered investment advisor.
All third-party marks cited are the property of their respective owners.
© 2018 Macquarie Management Holdings, Inc.
Portfolio management review
| | |
| Delaware Funds® by Macquarie state tax-free funds | | September 11, 2018 |
| | | | | | | | |
Performance preview (for the year ended August 31, 2018) | | | | | | | | |
| Delaware Tax-Free Arizona Fund (Institutional Class shares) | | | 1-year return | | | | +1.36% | |
| Delaware Tax-Free Arizona Fund (Class A shares) | | | 1-year return | | | | +1.11% | |
| Bloomberg Barclays Municipal Bond Index (benchmark) | | | 1-year return | | | | +0.49% | |
| Lipper Other States Municipal Debt Funds Average | | | 1-year return | | | | +0.17% | |
Past performance does not guarantee future results.
For complete, annualized performance for Delaware Tax-Free Arizona Fund, please see the table on page 9. Institutional Class shares are not subject to a sales charge and are offered for sale exclusively to certain eligible investors. In addition, Institutional Class shares pay no distribution and service fee.
The performance of Class A shares excludes the applicable sales charge. Both Institutional Class shares and Class A shares reflect the reinvestment of all distributions.
The Lipper Other States Municipal Debt Funds Average compares funds that limit assets to those securities that are exempt from taxation on a specified city or state basis.
Please see page 12 for a description of the index. Index performance returns do not reflect any management fees, transaction costs, or expenses. Indices are unmanaged and one cannot invest directly in an index.
| | | | | | | | |
Delaware Tax-Free California Fund (Institutional Class shares) | | | 1-year return | | | | +1.26% | |
Delaware Tax-Free California Fund (Class A shares) | | | 1-year return | | | | +1.00% | |
Bloomberg Barclays Municipal Bond Index (benchmark) | | | 1-year return | | | | +0.49% | |
Lipper California Municipal Debt Funds Average | | | 1-year return | | | | +0.99% | |
Past performance does not guarantee future results.
For complete, annualized performance for Delaware Tax-Free California Fund, please see the table on page 13. Institutional Class shares are not subject to a sales charge and are offered for sale exclusively to certain eligible investors. In addition, Institutional Class shares pay no distribution and service fee.
The performance of Class A shares excludes the applicable sales charge. Both Institutional Class shares and Class A shares reflect the reinvestment of all distributions.
The Lipper California Municipal Debt Funds Average compares funds that limit assets to those securities that are exempt from taxation in California (double tax-exempt) or a city in California (triple tax-exempt).
Please see page 16 for a description of the index. Index performance returns do not reflect any management fees, transaction costs, or expenses. Indices are unmanaged and one cannot invest directly in an index.
| | | | | | | | |
Delaware Tax-Free Colorado Fund (Institutional Class shares) | | | 1-year return | | | | +1.47% | |
Delaware Tax-Free Colorado Fund (Class A shares) | | | 1-year return | | | | +1.22% | |
Bloomberg Barclays Municipal Bond Index (benchmark) | | | 1-year return | | | | +0.49% | |
Lipper Other States Municipal Debt Funds Average | | | 1-year return | | | | +0.17% | |
Past performance does not guarantee future results.
For complete, annualized performance for Delaware Tax-Free Colorado Fund, please see the table on page 17. Institutional Class shares are not subject to a sales charge and are offered for sale exclusively to certain eligible investors. In addition, Institutional Class shares pay no distribution and service fee.
The performance of Class A shares excludes the applicable sales charge. Both Institutional Class shares and Class A shares reflect the reinvestment of all distributions.
The Lipper Other States Municipal Debt Funds Average compares funds that limit assets to those securities that are exempt from taxation on a specified city or state basis.
Please see page 20 for a description of the index. Index performance returns do not reflect any management fees, transaction costs, or expenses. Indices are unmanaged and one cannot invest directly in an index.
1
Portfolio management review
Delaware Funds® by Macquarie state tax-free funds
| | | | | | | | |
Delaware Tax-Free Idaho Fund (Institutional Class shares) | | | 1-year return | | | | +0.82% | |
Delaware Tax-Free Idaho Fund (Class A shares) | | | 1-year return | | | | +0.56% | |
Bloomberg Barclays Municipal Bond Index (benchmark) | | | 1-year return | | | | +0.49% | |
Lipper Other States Municipal Debt Funds Average | | | 1-year return | | | | +0.17% | |
Past performance does not guarantee future results.
For complete, annualized performance for Delaware Tax-Free Idaho Fund, please see the table on page 21. Institutional Class shares are not subject to a sales charge and are offered for sale exclusively to certain eligible investors. In addition, Institutional Class shares pay no distribution and service fee.
The performance of Class A shares excludes the applicable sales charge. Both Institutional Class shares and Class A shares reflect the reinvestment of all distributions.
The Lipper Other States Municipal Debt Funds Average compares funds that limit assets to those securities that are exempt from taxation on a specified city or state basis.
Please see page 24 for a description of the index. Index performance returns do not reflect any management fees, transaction costs, or expenses. Indices are unmanaged and one cannot invest directly in an index.
| | | | | | | | |
Delaware Tax-Free New York Fund (Institutional Class shares) | | | 1-year return | | | | +0.93% | |
Delaware Tax-Free New York Fund (Class A shares) | | | 1-year return | | | | +0.60% | |
Bloomberg Barclays Municipal Bond Index (benchmark) | | | 1-year return | | | | +0.49% | |
Lipper New York Municipal Debt Funds Average | | | 1-year return | | | | +0.55% | |
Past performance does not guarantee future results.
For complete, annualized performance for Delaware Tax-Free New York Fund, please see the table on page 25. Institutional Class shares are not subject to a sales charge and are offered for sale exclusively to certain eligible investors. In addition, Institutional Class shares pay no distribution and service fee.
The performance of Class A shares excludes the applicable sales charge. Both Institutional Class shares and Class A shares reflect the reinvestment of all distributions.
The Lipper New York Municipal Debt Funds Average compares funds that limit assets to those securities that are exempt from taxation in New York (double tax-exempt) or a city in New York (triple tax-exempt).
Please see page 28 for a description of the index. Index performance returns do not reflect any management fees, transaction costs, or expenses. Indices are unmanaged and one cannot invest directly in an index.
| | | | | | | | |
Delaware Tax-Free Pennsylvania Fund (Institutional Class shares) | | | 1-year return | | | | +1.16% | |
Delaware Tax-Free Pennsylvania Fund (Class A shares) | | | 1-year return | | | | +0.93% | |
Bloomberg Barclays Municipal Bond Index (benchmark) | | | 1-year return | | | | +0.49% | |
Lipper Pennsylvania Municipal Debt Funds Average | | | 1-year return | | | | +0.82% | |
Past performance does not guarantee future results.
For complete, annualized performance for Delaware Tax-Free Pennsylvania Fund, please see the table on page 29. Institutional Class shares are not subject to a sales charge and are offered for sale exclusively to certain eligible investors. In addition, Institutional Class shares pay no distribution and service fee.
The performance of Class A shares excludes the applicable sales charge. Both Institutional Class shares and Class A shares reflect the reinvestment of all distributions.
The Lipper Pennsylvania Municipal Debt Funds Average compares funds that limit assets to those securities that are exempt from taxation in Pennsylvania (double tax-exempt) or a city in Pennsylvania (triple tax-exempt).
Please see page 32 for a description of the index. Index performance returns do not reflect any management fees, transaction costs, or expenses. Indices are unmanaged and one cannot invest directly in an index.
2
Economic backdrop
US economic data remained healthy throughout the Funds’ fiscal year ended Aug. 31, 2018, although concern about the longer-term impact of global trade conflict emerged toward period end.
US gross domestic product (GDP), a measure of the goods and services the nation produces, increased throughout the 12-month time frame. In the third quarter of 2017, for example, US GDP expanded by an annualized 2.8% rate, followed by a 2.3% increase in the final three months of 2017. US GDP grew by 2.2% in the first quarter of 2018 and an estimated 4.2% in the second quarter. That 4.2% annual pace was the largest quarterly gain in nearly four years. Employment trends also remained healthy, with the US jobless rate finishing August 2018 at 3.9%, down half a percentage point from a year earlier. (Sources: US Bureau of Economic Analysis and US Bureau of Labor Statistics.)
Against this backdrop of steady economic expansion, job growth, and manageable inflation, the US Federal Reserve continued to gradually raise interest rates. The Fed increased its target short-term interest rate by 0.25 percentage points on three separate occasions during the Funds’ fiscal year – in December 2017 and in March and June 2018. On Aug. 31, 2018, the federal funds rate ranged from 1.75% to 2.00%, up from 1.00% to 1.25% a year earlier. (Source: Bloomberg.)
Municipal bond market conditions
In this strong economic environment, the US municipal bond market, as measured by the Bloomberg Barclays Municipal Bond Index, returned +0.49% for the year ended Aug. 31, 2018. Longer-term municipal bonds outpaced their shorter-term counterparts as the yield curve flattened, meaning yields on short-term bonds rose more than those on long-term issues. Short-term yields rose in line with the Fed’s interest rate increases, while fairly benign inflation kept a lid on long-term municipal yields.
To indicate the outperformance of longer-dated municipal debt relative to shorter-maturity municipal debt, the following table shows municipal bond returns by maturity for the 12 months ended Aug. 31, 2018:
Returns by maturity
| | | | |
5 years | | | – 0.74 | % |
10 years | | | – 0.10 | % |
22+ years | | | 1.28 | % |
Source: Bloomberg.
Much of the yield curve’s flattening took place in the fourth quarter of 2017, as investors sought to understand the potential market impact of federal tax reform legislation, which ultimately passed in late December. During this time, the supply of municipal bonds increased sharply, as issuers, anticipating unfavorable tax-policy changes, rushed debt to market. One of these expected changes – the ability to issue so-called private-activity bonds, a broad category that includes healthcare, private education, and toll road bonds, among others – didn’t make it into the final legislation.
However, another proposed change did come to pass: the elimination of advance refundings. Under the new legislation, issuers wishing to refinance bonds through the issuance of newer debt must do so within 90 days of the bonds’ call dates. Many issuers ultimately opted to bring their debt to market ahead of the law’s passage. This led to tighter bond supply in the second half of the Funds’ fiscal year, which, coupled with solid investor demand, provided a tailwind for the municipal bond market.
Continuing a trend in place for several years, bonds of lower-rated municipal issuers again outperformed bonds of higher-quality issuers – a situation known as credit spread narrowing. As investors anticipated that interest rates would continue to rise slowly, lower-rated, higher yielding municipal bonds remained attractive to investors in a continued low-rate environment. Bonds rated
3
Portfolio management review
Delaware Funds® by Macquarie state tax-free funds
below investment grade (below BBB) performed especially well amid strong demand coupled with limited supply of the securities.
The following table, which provides municipal bond performance by credit quality rating for the Funds’ fiscal year, further highlights this trend:
Returns by credit rating
| | | | |
AAA | | | – 0.23 | % |
AA | | | 0.22 | % |
A | | | 0.78 | % |
BBB | | | 2.76 | % |
BB and below | | | 6.21 | % |
Source: Bloomberg. | | | | |
Economic backdrop in the states
Arizona’s diverse state economy is still recovering from the global financial crisis. The rise in population overly exposed its real estate market and construction industry. July 2018 nonfarm employment of 2.78 million grew 2.7% from a year earlier. Despite improvement over prior years, the state’s unemployment rate as of July 2018 remained elevated at 4.6%, above the national average rate of 3.9%. Arizona’s per capita personal income levels are also well below average at only 82% of the national level. Fiscal 2018 General Fund revenues totaled $10.1 billion, which were 6.4% higher than 2017 and 4.2% above budget estimates. Individual income tax revenue grew 10.0% in 2018, sales tax revenue increased 6.2%, and corporate tax revenue rose 1.3%. The state ended fiscal 2018 with an operating fund balance of $2.8 billion and Budget Stabilization Fund balance of $457 million. Arizona enacted a $10.4 billion fiscal 2019 General Fund budget, a 5.5% increase over 2018. Revenues are expected to grow 3.4 % to total $10.2 billion. The budget includes increased funding for education and healthcare. (Sources: bls.gov, bea.gov, ncsl.org, Arizona Office of Strategic Planning Budgeting, Arizona Joint Legislative Budget Committee.)
California enjoys a large, diverse, and wealthy economy that mirrors that of the US. In 2015, California’s real GDP was $2.6 trillion, making California the sixth largest economy in the world. The July 2018 nonfarm employment of 17.1 million grew 2.0% from a year earlier. The unemployment rate fell to 4.2% in July 2018 but remains slightly above the national rate of 3.9%. California’s per capita personal income remained strong at 10% higher than the national average. Fiscal 2018 General Fund revenues rose by 11.5% year over year to total $136 billion, which was 1.1% above the budget forecasts. Personal income taxes rose 13.1% in fiscal 2018 to total $93.5 billion and were 1.3% above budget. Sales-and-use tax receipts were 1.5% below budget, but corporate income tax revenues were 4.4% above budget. California ended fiscal 2018 with a $8.4 billion General Fund balance and a $9.4 billion Rainy Day Fund. The California legislature enacted a $138.7 billion General Fund budget for fiscal 2019, a 9.2% increase over 2018. General Fund revenues are expected to total $133.3 billion, 2.7% more than 2018. The budget calls for personal income and corporate taxes to rise 3.3% and 9.0%, respectively. It calls for a 5.1% increase in sales tax revenues. The state expects to end fiscal 2018 with a General Fund balance of $3.1 billion and a Rainy Day Fund of $13.8 billion. (Sources: bls.gov, bea.gov, ncsl.org, ebudget.ca.gov.)
Colorado’s economy is diverse, with below-average employment concentration in manufacturing and a variety of service sector strengths. July 2018 nonfarm employment of 2.75 million grew 3.1% from a year earlier. Colorado’s unemployment rate in July 2018 was 2.8%, far below the national rate of 3.9% but up slightly from a year earlier. Colorado is a relatively wealthy state, with per capita personal income levels equal to 106% of the US average. Total estimated General Fund revenues for fiscal year 2018 were $11.6 billion, a 12.6% increase over fiscal 2017. Individual income tax revenues rose
4
by 11.5% in fiscal 2018. Corporate income taxes increased 44.6% while sales and use taxes rose 9.8%. Colorado’s legislature enacted a $11.4 billion General Fund budget for 2019, a 7.6% increase over the prior year. Income tax collections are expected to increase at a more moderate rate of 4.3% in 2019, while sales-and-use tax revenue is forecast to increase 4.8%. The budget includes increased funding for education, healthcare, and transportation. The budget estimates an ending fund balance in the General Fund reserve of $943.8 million – $130.6 million above the statutory required reserve. (Sources: bls.gov, bea.gov, ncsl.org, Colorado Office of State Planning and Budgeting, Colorado Joint Budget Committee.)
Idaho’s economy has expanded and diversified in recent years, benefiting from population growth. However, an above-average dependence on the natural resource sector remains. The July 2018 nonfarm employment of 746,000 was up 3.3% from a year earlier. The unemployment rate in July 2018 held steady at 2.9%, well below the national rate of 3.9%. Per capita income levels are 79% of national levels. Idaho’s General Fund fiscal 2018 revenues totaled $3.73 billion. Total revenues came in 2.8% above budget and 8.2% higher than the prior year. Individual income taxes were 3.9% above budget while corporate and sales taxes were 10.6% and 1.3% above budget, respectively. The Idaho legislature enacted a $3.65 billion fiscal 2019 General Fund budget, a 5.9% increase over fiscal 2018. The three largest portions of the budget are public school support, Medicaid, and higher education. Total General Fund revenues are expected to rise by 4.6% to total $3.8 billion in fiscal 2019. (Sources: bls.gov, bea.gov, ncsl.org, Idaho Division of Financial Management.)
New York has a mature, broad-based, and wealthy economy that attracts a highly educated and global workforce. July 2018 nonfarm employment of 9.7 million grew 1.6% from a year earlier. The unemployment rate in July 2018 was
4.3%, slightly above the national rate of 3.9%. Per capita income levels are among the highest in the nation, 21% above national levels. Total receipts for the General Fund for fiscal 2018 were $71.4 billion, up 6.7% from fiscal 2017 but 0.02% below budget. Personal income tax receipts were $46.9 billion in fiscal 2018, 0.7% above budget forecasts. Sales tax revenues totaled $13.2 billion in 2018, about 0.08% below consensus projections. Corporate income taxes were the largest drag on General Fund revenues, coming in at $4.9 billion in fiscal 2018, short of budget projections of $5.1 billion. General Fund expenditures totaled $69.7 billion in fiscal 2018, 0.4% below the revised budget forecast. The state ended fiscal 2018 with a Budgetary General Fund balance of $9.4 billion, up from $7.7 billion in fiscal 2017. New York’s legislature enacted a $76.6 billion General Fund budget for 2019, a 9% increase over the prior year’s budget. Through the first four months of fiscal 2019, revenues totaled $31.9 billion, which was 0.2% above estimates.
Expenditures ran 0.2% below budget. (Sources: bls.gov, bea.gov, ncsl.org, New York Division of the Budget, Office of the New York State Comptroller.)
Pennsylvania has a diverse, broad, and relatively stable economy, with per capita personal income levels slightly above the national average (103%), supported by its large health and higher education sectors. July 2018 nonfarm employment of 6.02 million grew 1.7% from a year earlier. The monthly unemployment rate in July 2018 was 4.2%, higher than the national rate of 3.9% but down from the prior year. Per capital personal income levels have averaged 103% of national levels. Pennsylvania’s General Fund tax collections totaled $34.6 billion in fiscal 2018, 9.1% above the prior year. Sales tax receipts were 0.4% above budget, personal income collections were 0.7% above budget, and corporate tax revenues were 4.3% below budget projections. For the first time in a decade, the commonwealth
5
Portfolio management review
Delaware Funds® by Macquarie state tax-free funds
is projected to make a $22 million deposit into the Budget Stabilization Reserve Fund. Pennsylvania enacted a $32.7 billion fiscal 2019 budget, a 2.2% increase over 2018. It includes increases in spending for education, higher education, the corrective system, and healthcare. (Sources: bls.gov, bea.gov, ncsl.org, Pennsylvania Office of the Budget, Pennsylvania Department of Revenue.)
Focused on credit research
For all six Funds discussed in this report, we maintained a consistent management strategy, which we do regardless of market conditions. We have a bottom-up investment approach, meaning we evaluate individual securities one at a time. We rely on individual credit research to find securities that we believe provide a desirable risk-reward balance.
This approach often leads to substantial allocations within the Funds to bonds in the lower-investment-grade or below-investment-grade credit tiers, where we seek to add value for shareholders through higher yielding bonds that, in our view, display solid underlying credit.
As of the fiscal year end on Aug. 31, 2018, approximately 41% of the net assets of
Delaware Tax-Free Arizona Fund was invested in bonds with credit ratings of A and BBB, the two lowest credit tiers of the investment grade bond universe. Roughly 47% of the net assets of Delaware Tax-Free California Fund was held in these credit segments, while Delaware Tax-Free Colorado Fund’s allocation to bonds with lower-investment-grade credit ratings stood at about 46% of net assets. Meanwhile, Delaware Tax-Free Idaho Fund’s lower-investment-grade bond allocation was just 34%, as Idaho is a relatively small municipal bond market offering fewer opportunities to buy lower-rated, higher yielding bonds. In Delaware Tax-Free New York Fund and Delaware Tax-Free Pennsylvania Fund, whose investment universes include a greater
variety of lower-rated bonds, we allocated to these types of securities as of fiscal year end.
In addition, all of the Funds had allocations to high yield municipal bonds, securities with credit ratings below BBB. By prospectus, all six Funds have the latitude to invest a portion of the portfolio in these credit tiers. When investing in high yield bonds, we pay close attention to credit risk, focusing on securities that offer sufficiently attractive income, in our view, relative to the added risk.
Portfolio positioning
We entered this fiscal year generally comfortable with the Funds’ positioning. As a result, we were highly selective about making new purchases, seeking securities that provided what we saw as a compelling risk-reward trade-off.
In all six Funds, many of our holdings were originally purchased a decade or more ago when significantly higher yields were available. Thus, we have tended not to replace many existing positions with newer bonds, unless we believe they offer sufficient value to justify such an exchange. Once again, that remained our strategy over the past 12 months, and we expect to continue this approach as long as most of the Funds’ existing holdings remain more attractive to us than the new bonds available for purchase.
During the fiscal year, we periodically saw bonds exit the portfolios, either via bond calls or advance refundings. Some of these bonds were of lower credit quality, and we sought to replace them with other lower-quality issues. However, because we remained highly selective in our purchases – we will not invest in higher yielding bonds that we do not find sufficiently creditworthy – we sometimes found this strategy difficult to execute, particularly in smaller municipal bond markets with limited supply of lower-rated bonds. (Larger municipal markets, such as California, regularly offer portfolio managers a wider assortment of
6
lower- and below-investment-grade investment opportunities.)
Accordingly, our approach was to temporarily invest in higher-quality, liquid municipal bonds offering maturities comparable to the bonds exiting the portfolios. We expect that when suitable lower-rated bonds become available, these higher-rated issues will become attractive sales candidates to finance new purchases more suited to our long-term criteria.
Individual performance contributors
As we indicated earlier, bonds with longer maturities tended to outperform shorter-maturity bonds, while lower-rated issues generally performed better than bonds of higher credit quality. Accordingly, many of our strongest- and weakest-performing securities this fiscal year followed this trend.
In Delaware Tax-Free Arizona Fund, for example, the leading individual performer was a position in Pima County Arizona Industrial Development Authority bonds for Edkey charter schools. These securities gained close to 19% for the fiscal year, benefiting from their below-investment-grade credit ratings and 30-year maturities. Bonds for Christian Care Surprise, a Phoenix-based operator of senior-housing facilities also lifted performance. These nonrated bonds with a 30-year maturity returned close to 8% for the Fund.
The strongest performer for Delaware Tax-Free California Fund was a position in zero-coupon Golden State tobacco-securitization bonds. These below-investment-grade issues returned 37%, benefiting from continued strong demand coupled with a shrinking national supply of tobacco bonds as several states opted to refund their tobacco-securitization issues during the period. Investors began to anticipate that the Golden State tobacco bonds would be refunded, boosting their price. Another strong performer for this Fund was a
position in nonrated education bonds for the Creative Center of Los Altos.
In Delaware Tax-Free Colorado Fund, BB+ rated bonds of the Colorado Educational and Cultural Facilities Authority for the University Lab School, maturing in 2045, performed well, returning near 8%, as did a position in nonrated water-and-sewer bonds for the Dominion Water and Sanitation District, returning more than 7.5%.
In Delaware Tax-Free Idaho Fund, zero-coupon bonds for the North Star Charter School in Eagle, Idaho, performed well, benefiting from their long maturities and lower credit rating, as well as the school’s improved financial performance relative to past years. Corporate-backed industrial development revenue bonds for chemical manufacturer FMC Corporation also contributed. The lower-investment-grade credit rating of these bonds and their relatively high yield proved attractive to investors.
In Delaware Tax-Free New York Fund, the leading individual performers were BBB-rated airport bonds for JFK International Terminal and nonrated Glen Cove Local Economic Assistance Corporation tax-increment-financing bonds.
The strongest-performing securities in Delaware Tax-Free Pennsylvania Fund consisted of similarly structured higher-education bond issues for Carlow University and St. Francis University. Both featured a BBB credit rating, relatively high yields and long-term maturities.
Individual performance detractors
In Delaware Tax-Free Arizona Fund, the biggest individual detractors were high-quality, shorter-maturity bonds: dedicated-tax issues of the Regional Public Transportation Authority for Maricopa County and water-and-sewer bonds for the City of Phoenix Civic Improvement Corporation. Both bonds declined more than 1.5%.
7
Portfolio management review
Delaware Funds® by Macquarie state tax-free funds
Performance for Delaware Tax-Free California Fund was hampered by a position in Encore Education charter school bonds. Despite their relatively lower credit rating and longer maturity, the issuer fell short of meeting certain academic standards, causing the bonds to lag during the period, declining more than 3%. We continued to see the issuer as creditworthy, however, and maintained the Fund’s position, anticipating better results in the future. Anaheim City School District bonds, whose credit rating of AA- and near-term maturity date proved less attractive to investors, also detracted from performance.
In Delaware Tax-Free Colorado Fund, a pair of highly rated, short-maturity issues detracted from performance: Jefferson County School District bonds (rated AA- and maturing in 2024) and Platte River Power Authority public power bonds (rated AA and maturing in 2027).
In Delaware Tax-Free Idaho Fund, a pair of highly rated, short-maturity school district bonds for Canyon County School District 131 and Madison County School District 321 declined modestly.
A couple of higher-quality, shorter-maturity bonds were notable laggards for Delaware Tax-Free New York Fund: New York State Dormitory Authority bonds and pre-refunded Onondaga Civic Development Corporation bonds for the St. Joseph’s Hospital Health Center.
Of final note, bonds for the University of Pittsburgh Medical Center, whose relatively high credit rating and 2025 maturity proved unattractive to investors, hampered performance for
Delaware Tax-Free Pennsylvania Fund.In addition, the Fund’s position in pre-refunded bonds for the Pocono Medical Center detracted from performance.
8
| | |
| Performance summaries | | |
| Delaware Tax-Free Arizona Fund | | August 31, 2018 |
The performance quoted represents past performance and does not guarantee future results. Investment return and principal value of an investment will fluctuate so that shares, when redeemed, may be worth more or less than their original cost. Current performance may be lower or higher than the performance quoted. Performance data current to the most recent month end may be obtained by calling 800 523-1918 or visiting delawarefunds.com/performance.
| | | | | | | | | | | | | | | | |
| Fund and benchmark performance1,2 | | Average annual total returns through August 31, 2018 | |
| | | | |
| | | 1 year | | | 5 years | | | 10 years | | | Lifetime | |
Class A (Est. April 1, 1991) | | | | | | | | | | | | | | | | |
Excluding sales charge | | | +1.11% | | | | +4.50% | | | | +4.15% | | | | +5.16% | |
Including sales charge | | | -3.43% | | | | +3.55% | | | | +3.67% | | | | +4.98% | |
Class C (Est. May 26, 1994) | | | | | | | | | | | | | | | | |
Excluding sales charge | | | +0.36% | | | | +3.72% | | | | +3.37% | | | | +3.95% | |
Including sales charge | | | -0.62% | | | | +3.72% | | | | +3.37% | | | | +3.95% | |
Institutional Class (Est. Dec. 31, 2013) | | | | | | | | | | | | | | | | |
Excluding sales charge | | | +1.36% | | | | n/a | | | | n/a | | | | +4.62% | |
Including sales charge | | | +1.36% | | | | n/a | | | | n/a | | | | +4.62% | |
Bloomberg Barclays Municipal Bond Index | | | +0.49% | | | | +4.12% | | | | +4.32% | | | | +3.87%* | |
*The benchmark lifetime return is for Institutional Class share comparison only and is calculated using the last business day in the month of the Fund’s Institutional Class inception date.
1Returns reflect the reinvestment of all distributions and are presented both with and without the applicable sales charges described below. Returns do not reflect the deduction of taxes the shareholder would pay on Fund distributions or redemptions of Fund shares.
Expense limitations were in effect for certain classes during some or all of the periods shown in the “Fund and benchmark performance” table. Expenses for each class are listed on the “Fund expense ratios” table on page 10. Performance would have been lower had expense limitations not been in effect.
Institutional Class shares are not subject to a sales charge and are offered for sale exclusively to certain eligible investors. In addition, Institutional Class shares pay no distribution and service fee.
Class A shares are sold with a maximum front-end sales charge of 4.50%, and have an annual distribution and service fee of 0.25% of average daily net assets. Performance for Class A shares,
excluding sales charges, assumes that no front-end sales charge applied.
Class C shares are sold with a contingent deferred sales charge of 1.00% if redeemed during the first 12 months. They are also subject to an annual distribution and service fee of 1.00% of average daily net assets. Performance for Class C shares, excluding sales charges, assumes either that contingent deferred sales charges did not apply or that the investment was not redeemed.
Fixed income securities and bond funds can lose value, and investors can lose principal, as interest rates rise. They also may be affected by economic conditions that hinder an issuer’s ability to make interest and principal payments on its debt.
The Fund may also be subject to prepayment risk, the risk that the principal of a bond that is held by a portfolio will be prepaid prior to maturity, at the time when interest rates are lower than what the bond was paying. A portfolio may then have to reinvest that money at a lower interest rate.
9
Performance summaries
Delaware Tax-Free Arizona Fund
Funds that invest primarily in one state may be more susceptible to the economic, regulatory, regional, and other factors of that state than geographically diversified funds.
Substantially all dividend income derived from tax-free funds is exempt from federal income tax. Some income may be subject to state or local and/or the federal alternative minimum tax (AMT) that applies to certain investors. Capital gains, if any, are taxable.
Duration number will change as market conditions change. Therefore, duration should not be solely relied upon to indicate a municipal bond fund’s potential volatility.
This document may mention bond ratings published by nationally recognized statistical rating organizations (NRSROs) Standard & Poor’s,
Moody’s Investors Service, and Fitch, Inc. For securities rated by an NRSRO other than S&P, the rating is converted to the equivalent S&P credit rating. Bonds rated AAA are rated as having the highest quality and are generally considered to have the lowest degree of investment risk. Bonds rated AA are considered to be of high quality, but with a slightly higher degree of risk than bonds rated AAA. Bonds rated A are considered to have many favorable investment qualities, though they are somewhat more susceptible to adverse economic conditions. Bonds rated BBB are believed to be of medium-grade quality and generally riskier over the long term. Bonds rated BB, B, and CCC are regarded as having significant speculative characteristics, with BB indicating the least degree of speculation of the three.
2The Fund’s expense ratios, as described in the most recent prospectus, are disclosed in the following “Fund expense ratios” table. Delaware Management Company has agreed to reimburse certain expenses and/or waive certain fees in order to prevent total annual fund operating expenses (excluding any 12b-1 fees, acquired fund fees and expenses, taxes, interest, short sale and dividend and interest expenses, brokerage fees, certain insurance costs, and nonroutine expenses or costs, including, but not limited to, those relating to reorganizations, litigation, conducting shareholder meetings, and liquidations (collectively, nonroutine expenses)) from exceeding 0.59% of the Fund’s average daily net assets during the period from Sept. 1, 2017 to Aug. 31, 2018.* Please see the most recent prospectus and any applicable supplement(s) for additional information on these fee waivers and/or reimbursements. Please see the “Financial highlights” section in this report for the most recent expense ratios.
| | | | | | | | | | |
| Fund expense ratios | | Class A | | | | Class C | | | | Institutional Class |
Total annual operating expenses | | 0.97% | | | | 1.72% | | | | 0.72% |
(without fee waivers) | | | | | | | | | | |
Net expenses | | 0.84% | | | | 1.59% | | | | 0.59% |
(including fee waivers, if any) | | | | | | | | | | |
Type of waiver | | Contractual | | | | Contractual | | | | Contractual |
*The aggregate contractual waiver period covering this report is from Dec. 29, 2016 through Dec. 29, 2018.
10
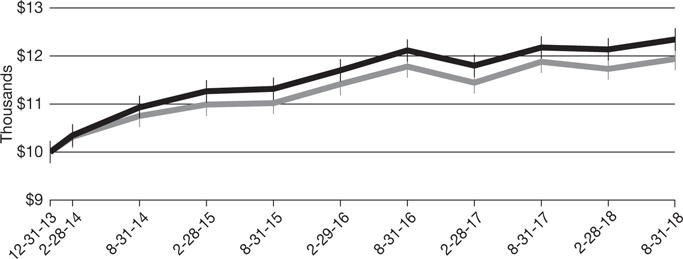
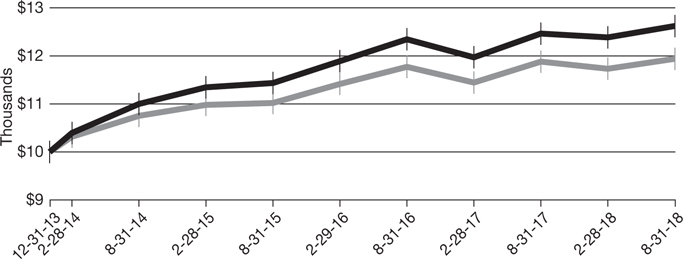
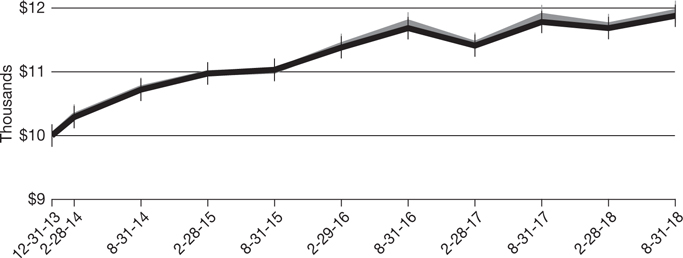
Performance of a $10,000 investment1
Class A shares
Average annual total returns from Aug. 31, 2008 through Aug. 31, 2018
| | | | | | | | |
For period beginning Aug. 31, 2008 through Aug. 31, 2018 | | Starting value | | | Ending value | |
 Bloomberg Barclays Municipal Bond Index Bloomberg Barclays Municipal Bond Index
| | | $10,000 | | | | $15,263 | |
 Delaware Tax-Free Arizona Fund — Class A shares Delaware Tax-Free Arizona Fund — Class A shares
| | | $9,550 | | | | $14,336 | |
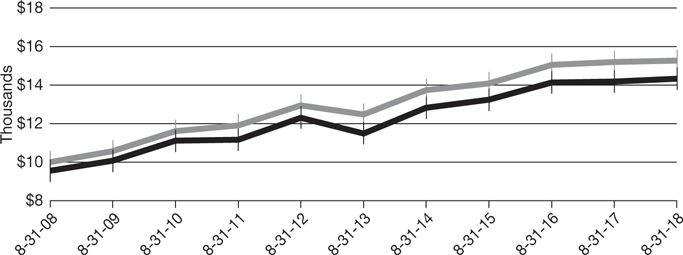
Institutional Class shares
Average annual total returns from Dec. 31, 2013 (inception date) through Aug. 31, 2018
| | | | | | | | |
For period beginning Dec. 31, 2013 through Aug. 31, 2018 | | Starting value | | | Ending value | |
Delaware Tax-Free Arizona Fund — Institutional Class shares | | | $10,000 | | | | $12,344 | |
Bloomberg Barclays Municipal Bond Index | | | $10,000 | | | | $11,936 | |
11
Performance summaries
Delaware Tax-Free Arizona Fund
1The “Performance of a $10,000 investment” graph for Class A shares assumes $10,000 invested in Class A shares of the Fund on Aug. 31, 2008, and includes the effect of a 4.50% front-end sales charge and the reinvestment of all distributions. The graph also assumes $10,000 invested in the Bloomberg Barclays Municipal Bond Index as of Aug. 31, 2008.
The “Performance of a $10,000 investment” graph for Institutional Class shares assumes $10,000 invested in Institutional Class shares of the Fund on Dec. 31, 2013, and includes the reinvestment of all distributions. The graph also assumes $10,000 invested in the Bloomberg Barclays Municipal Bond Index as of Dec. 31, 2013.
The graphs do not reflect the deduction of taxes the shareholders would pay on Fund distributions or redemptions of Fund shares. Expense limitations were in
effect for some or all of the periods shown. Performance would have been lower had expense limitations not been in effect. Expenses are listed in the “Fund expense ratios” table on page 10. Please note additional details on pages 9 through 12.
The Bloomberg Barclays Municipal Bond Index measures the total return performance of the long-term, investment grade tax-exempt bond market.
Index performance returns do not reflect any management fees, transaction costs, or expenses. Indices are unmanaged and one cannot invest directly in an index. Past performance is not a guarantee of future results.
Performance of other Fund share classes will vary due to different charges and expenses.
| | | | | | |
| | | Nasdaq symbols | | CUSIPs | | |
Class A | | VAZIX | | 928916204 | | |
Class C | | DVACX | | 928916501 | | |
Institutional Class | | DAZIX | | 928916873 | | |
|
|
12
| | |
| Performance summaries | | |
| Delaware Tax-Free California Fund | | August 31, 2018 |
The performance quoted represents past performance and does not guarantee future results. Investment return and principal value of an investment will fluctuate so that shares, when redeemed, may be worth more or less than their original cost. Current performance may be lower or higher than the performance quoted. Performance data current to the most recent month end may be obtained by calling 800 523-1918 or visiting delawarefunds.com/performance.
| | | | | | | | | | | | | | | | |
| Fund and benchmark performance1,2 | | Average annual total returns through August 31, 2018 | |
| | | | |
| | | 1 year | | | 5 years | | | 10 years | | | Lifetime | |
Class A (Est. March 2, 1995) | | | | | | | | | | | | | | | | |
Excluding sales charge | | | +1.00% | | | | +5.07% | | | | +4.97% | | | | +5.38% | |
Including sales charge | | | -3.56% | | | | +4.11% | | | | +4.48% | | | | +5.18% | |
Class C (Est. April 9, 1996) | | | | | | | | | | | | | | | | |
Excluding sales charge | | | +0.25% | | | | +4.30% | | | | +4.19% | | | | +4.52% | |
Including sales charge | | | -0.72% | | | | +4.30% | | | | +4.19% | | | | +4.52% | |
Institutional Class (Est. Dec. 31, 2013) | | | | | | | | | | | | | | | | |
Excluding sales charge | | | +1.26% | | | | n/a | | | | n/a | | | | +5.12% | |
Including sales charge | | | +1.26% | | | | n/a | | | | n/a | | | | +5.12% | |
Bloomberg Barclays Municipal Bond Index | | | +0.49% | | | | +4.12% | | | | +4.32% | | | | +3.87%* | |
*The benchmark lifetime return is for Institutional Class share comparison only and is calculated using the last business day in the month of the Fund’s Institutional Class inception date.
1Returns reflect the reinvestment of all distributions and are presented both with and without the applicable sales charges described below. Returns do not reflect the deduction of taxes the shareholder would pay on Fund distributions or redemptions of Fund shares.
Expense limitations were in effect for certain classes during some or all of the periods shown in the “Fund and benchmark performance” table. Expenses for each class are listed on the “Fund expense ratios” table on page 14. Performance would have been lower had expense limitations not been in effect.
Institutional Class shares are not subject to a sales charge and are offered for sale exclusively to certain eligible investors. In addition, Institutional Class shares pay no distribution and service fee.
Class A shares are sold with a maximum front-end sales charge of 4.50%, and have an annual distribution and service fee of 0.25% of average daily net assets.
Performance for Class A shares, excluding sales charges, assumes that no front-end sales charge applied.
Class C shares are sold with a contingent deferred sales charge of 1.00% if redeemed during the first 12 months. They are also subject to an annual distribution and service fee of 1.00% of average daily net assets. Performance for Class C shares, excluding sales charges, assumes either that contingent deferred sales charges did not apply or that the investment was not redeemed.
Fixed income securities and bond funds can lose value, and investors can lose principal, as interest rates rise. They also may be affected by economic conditions that hinder an issuer’s ability to make interest and principal payments on its debt.
The Fund may also be subject to prepayment risk, the risk that the principal of a bond that is held by a portfolio will be prepaid prior to maturity, at the time when interest rates are lower than what the bond was paying. A portfolio may then have to reinvest that money at a lower interest rate.
13
Performance summaries
Delaware Tax-Free California Fund
Funds that invest primarily in one state may be more susceptible to the economic, regulatory, regional, and other factors of that state than geographically diversified funds.
Substantially all dividend income derived from tax-free funds is exempt from federal income tax. Some income may be subject to state or local and/or the federal alternative minimum tax (AMT) that applies to certain investors. Capital gains, if any, are taxable.
Duration number will change as market conditions change. Therefore, duration should not be solely relied upon to indicate a municipal bond fund’s potential volatility.
This document may mention bond ratings published by nationally recognized statistical rating organizations (NRSROs) Standard & Poor’s,
Moody’s Investors Service, and Fitch, Inc. For securities rated by an NRSRO other than S&P, the rating is converted to the equivalent S&P credit rating. Bonds rated AAA are rated as having the highest quality and are generally considered to have the lowest degree of investment risk. Bonds rated AA are considered to be of high quality, but with a slightly higher degree of risk than bonds rated AAA. Bonds rated A are considered to have many favorable investment qualities, though they are somewhat more susceptible to adverse economic conditions. Bonds rated BBB are believed to be of medium-grade quality and generally riskier over the long term. Bonds rated BB, B, and CCC are regarded as having significant speculative characteristics, with BB indicating the least degree of speculation of the three.
2The Fund’s expense ratios, as described in the most recent prospectus, are disclosed in the following “Fund expense ratios” table. Delaware Management Company has agreed to reimburse certain expenses and/or waive certain fees in order to prevent total annual fund operating expenses (excluding any 12b-1 fees, acquired fund fees and expenses, taxes, interest, short sale and dividend and interest expenses, brokerage fees, certain insurance costs, and nonroutine expenses or costs, including, but not limited to, those relating to reorganizations, litigation, conducting shareholder meetings, and liquidations (collectively, nonroutine expenses)) from exceeding 0.57% of the Fund’s average daily net assets during the period from Sept. 1, 2017 to Aug. 31, 2018.* Please see the most recent prospectus and any applicable supplement(s) for additional information on these fee waivers and/or reimbursements. Please see the “Financial highlights” section in this report for the most recent expense ratios.
| | | | | | | | | | |
| Fund expense ratios | | Class A | | | | Class C | | | | Institutional Class |
Total annual operating expenses (without fee waivers) | | 1.01% | | | | 1.76% | | | | 0.76% |
Net expenses (including fee waivers, if any) | | 0.82% | | | | 1.57% | | | | 0.57% |
Type of waiver | | Contractual | | | | Contractual | | | | Contractual |
*The aggregate contractual waiver period covering this report is from Dec. 29, 2016 through Dec. 29, 2018.
14
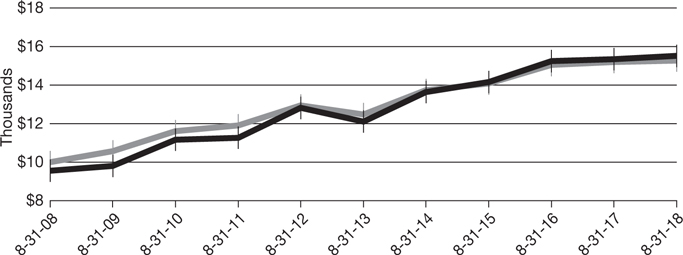
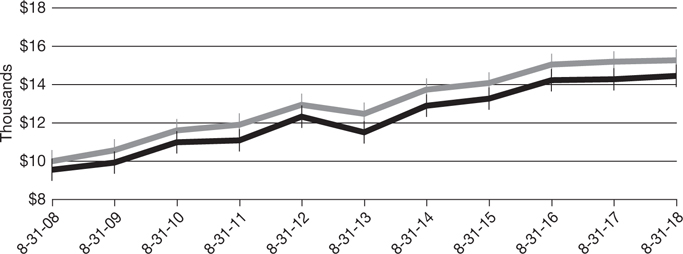
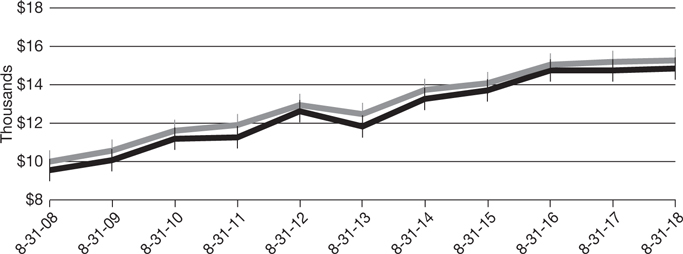
Performance of a $10,000 investment1
Class A shares
Average annual total returns from Aug. 31, 2008 through Aug. 31, 2018
| | | | | | | | |
For period beginning Aug. 31, 2008 through Aug. 31, 2018 | | Starting value | | | Ending value | |
Delaware Tax-Free California Fund — Class A shares | | | $9,550 | | | | $15,505 | |
Bloomberg Barclays Municipal Bond Index | | | $10,000 | | | | $15,263 | |
Institutional Class shares
Average annual total returns from Dec. 31, 2013 (inception date) through Aug. 31, 2018
| | | | | | | | |
For period beginning Dec. 31, 2013 through Aug. 31, 2018 | | Starting value | | | Ending value | |
Delaware Tax-Free California Fund — Institutional Class shares | | | $10,000 | | | | $12,623 | |
Bloomberg Barclays Municipal Bond Index | | | $10,000 | | | | $11,936 | |
15
Performance summaries
Delaware Tax-Free California Fund
1The “Performance of a $10,000 investment” graph for Class A shares assumes $10,000 invested in Class A shares of the Fund on Aug. 31, 2008, and includes the effect of a 4.50% front-end sales charge and the reinvestment of all distributions. The graph also assumes $10,000 invested in the Bloomberg Barclays Municipal Bond Index as of Aug. 31, 2008.
The “Performance of a $10,000 investment” graph for Institutional Class shares assumes $10,000 invested in Institutional Class shares of the Fund on Dec. 31, 2013, and includes the reinvestment of all distributions. The graph also assumes $10,000 invested in the Bloomberg Barclays Municipal Bond Index as of Dec. 31, 2013.
The graphs do not reflect the deduction of taxes the shareholders would pay on Fund distributions or
redemptions of Fund shares. Expense limitations were in effect for some or all of the periods shown. Performance would have been lower had expense limitations not been in effect. Expenses are listed in the “Fund expense ratios” table on page 14. Please note additional details on pages 13 through 16.
The Bloomberg Barclays Municipal Bond Index measures the total return performance of the long-term, investment grade tax-exempt bond market.
Index performance returns do not reflect any management fees, transaction costs, or expenses. Indices are unmanaged and one cannot invest directly in an index. Past performance is not a guarantee of future results.
Performance of other Fund share classes will vary due to different charges and expenses.
| | | | | | |
| | | Nasdaq symbols | | CUSIPs | | |
Class A | | DVTAX | | 928928829 | | |
Class C | | DVFTX | | 928928795 | | |
Institutional Class | | DCTIX | | 928928167 | | |
16
| | |
| Performance summaries | | |
| Delaware Tax-Free Colorado Fund | | August 31, 2018 |
The performance quoted represents past performance and does not guarantee future results. Investment return and principal value of an investment will fluctuate so that shares, when redeemed, may be worth more or less than their original cost. Current performance may be lower or higher than the performance quoted. Performance data current to the most recent month end may be obtained by calling 800 523-1918 or visiting delawarefunds.com/performance.
| | | | | | | | | | | | | | | | |
| Fund and benchmark performance1,2 | | Average annual total returns through August 31, 2018 | |
| | | | |
| | | 1 year | | | 5 years | | | 10 years | | | Lifetime | |
Class A (Est. April 23, 1987) | | | | | | | | | | | | | | | | |
Excluding sales charge | | | +1.22% | | | | +4.64% | | | | +4.23% | | | | +5.62% | |
Including sales charge | | | -3.32% | | | | +3.68% | | | | +3.75% | | | | +5.47% | |
Class C (Est. May 6, 1994) | | | | | | | | | | | | | | | | |
Excluding sales charge | | | +0.47% | | | | +3.85% | | | | +3.46% | | | | +4.04% | |
Including sales charge | | | -0.51% | | | | +3.85% | | | | +3.46% | | | | +4.04% | |
Institutional Class (Est. Dec. 31, 2013) | | | | | | | | | | | | | | | | |
Excluding sales charge | | | +1.47% | | | | n/a | | | | n/a | | | | +4.78% | |
Including sales charge | | | +1.47% | | | | n/a | | | | n/a | | | | +4.78% | |
Bloomberg Barclays Municipal Bond Index | | | +0.49% | | | | +4.12% | | | | +4.32% | | | | +3.87%* | |
*The benchmark lifetime return is for Institutional Class share comparison only and is calculated using the last business day in the month of the Fund’s Institutional Class inception date.
1Returns reflect the reinvestment of all distributions and are presented both with and without the applicable sales charges described below. Returns do not reflect the deduction of taxes the shareholder would pay on Fund distributions or redemptions of Fund shares.
Expense limitations were in effect for certain classes during some or all of the periods shown in the “Fund and benchmark performance” table. Expenses for each class are listed on the “Fund expense ratios” table on page 18. Performance would have been lower had expense limitations not been in effect.
Institutional Class shares are not subject to a sales charge and are offered for sale exclusively to certain eligible investors. In addition, Institutional Class shares pay no distribution and service fee.
Class A shares are sold with a maximum front-end sales charge of 4.50%, and have an annual distribution and service fee of 0.25% of average daily net assets. Performance for Class A shares,
excluding sales charges, assumes that no front-end sales charge applied.
Class C shares are sold with a contingent deferred sales charge of 1.00% if redeemed during the first 12 months. They are also subject to an annual distribution and service fee of 1.00% of average daily net assets. Performance for Class C shares, excluding sales charges, assumes either that contingent deferred sales charges did not apply or that the investment was not redeemed.
Fixed income securities and bond funds can lose value, and investors can lose principal, as interest rates rise. They also may be affected by economic conditions that hinder an issuer’s ability to make interest and principal payments on its debt.
The Fund may also be subject to prepayment risk, the risk that the principal of a bond that is held by a portfolio will be prepaid prior to maturity, at the time when interest rates are lower than what the bond was paying. A portfolio may then have to reinvest that money at a lower interest rate.
17
Performance summaries
Delaware Tax-Free Colorado Fund
Funds that invest primarily in one state may be more susceptible to the economic, regulatory, regional, and other factors of that state than geographically diversified funds.
Substantially all dividend income derived from tax-free funds is exempt from federal income tax. Some income may be subject to state or local and/or the federal alternative minimum tax (AMT) that applies to certain investors. Capital gains, if any, are taxable.
Duration number will change as market conditions change. Therefore, duration should not be solely relied upon to indicate a municipal bond fund’s potential volatility.
This document may mention bond ratings published by nationally recognized statistical rating organizations (NRSROs) Standard & Poor’s,
Moody’s Investors Service, and Fitch, Inc. For securities rated by an NRSRO other than S&P, the rating is converted to the equivalent S&P credit rating. Bonds rated AAA are rated as having the highest quality and are generally considered to have the lowest degree of investment risk. Bonds rated AA are considered to be of high quality, but with a slightly higher degree of risk than bonds rated AAA. Bonds rated A are considered to have many favorable investment qualities, though they are somewhat more susceptible to adverse economic conditions. Bonds rated BBB are believed to be of medium-grade quality and generally riskier over the long term. Bonds rated BB, B, and CCC are regarded as having significant speculative characteristics, with BB indicating the least degree of speculation of the three.
2The Fund’s expense ratios, as described in the most recent prospectus, are disclosed in the following “Fund expense ratios” table. Delaware Management Company has agreed to reimburse certain expenses and/or waive certain fees in order to prevent total annual fund operating expenses (excluding any 12b-1 fees, acquired fund fees and expenses, taxes, interest, short sale and dividend and interest expenses, brokerage fees, certain insurance costs, and nonroutine expenses or costs, including, but not limited to, those relating to reorganizations, litigation, conducting shareholder meetings, and liquidations (collectively, nonroutine expenses)) from exceeding 0.59% of the Fund’s average daily net assets during the period from Sept. 1, 2017 to Aug. 31, 2018.* Please see the most recent prospectus and any applicable supplement(s) for additional information on these fee waivers and/or reimbursements. Please see the “Financial highlights” section in this report for the most recent expense ratios.
| | | | | | | | | | | | | | | | |
| Fund expense ratios | | Class A | | | | | Class C | | | | | Institutional Class | |
Total annual operating expenses | | | 0.96% | | | | | | 1.71% | | | | | | 0.71% | |
(without fee waivers) | | | | | | | | | | | | | | | | |
Net expenses | | | 0.84% | | | | | | 1.59% | | | | | | 0.59% | |
(including fee waivers, if any) | | | | | | | | | | | | | | | | |
Type of waiver | | | Contractual | | | | | | Contractual | | | | | | Contractual | |
*The aggregate contractual waiver period covering this report is from Dec. 29, 2016 through Dec. 29, 2018.
18
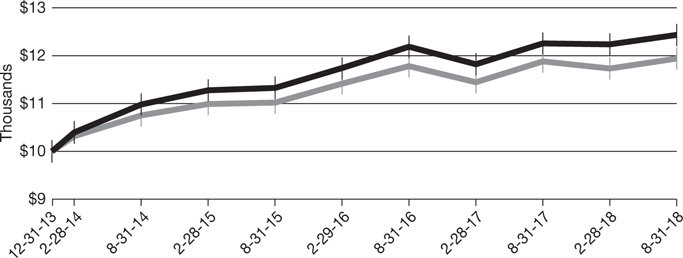
Performance of a $10,000 investment1
Class A shares
Average annual total returns from Aug. 31, 2008 through Aug. 31, 2018
| | | | | | | | |
For period beginning Aug. 31, 2008 through Aug. 31, 2018 | | Starting value | | | Ending value | |
Bloomberg Barclays Municipal Bond Index | | | $10,000 | | | | $15,263 | |
Delaware Tax-Free Colorado Fund — Class A shares | | | $9,550 | | | | $14,456 | |
Institutional Class shares
Average annual total returns from Dec. 31, 2013 (inception date) through Aug. 31, 2018
| | | | | | | | |
For period beginning Dec. 31, 2013 through Aug. 31, 2018 | | Starting value | | | Ending value | |
Delaware Tax-Free Colorado Fund — Institutional Class shares | | | $10,000 | | | | $12,436 | |
Bloomberg Barclays Municipal Bond Index | | | $10,000 | | | | $11,936 | |
19
Performance summaries
Delaware Tax-Free Colorado Fund
1The “Performance of a $10,000 investment” graph for Class A shares assumes $10,000 invested in Class A shares of the Fund on Aug. 31, 2008, and includes the effect of a 4.50% front-end sales charge and the reinvestment of all distributions. The graph also assumes $10,000 invested in the Bloomberg Barclays Municipal Bond Index as of Aug. 31, 2008.
The “Performance of a $10,000 investment” graph for Institutional Class shares assumes $10,000 invested in Institutional Class shares of the Fund on Dec. 31, 2013, and includes the reinvestment of all distributions. The graph also assumes $10,000 invested in the Bloomberg Barclays Municipal Bond Index as of Dec. 31, 2013.
The graphs do not reflect the deduction of taxes the shareholders would pay on Fund distributions or redemptions of Fund shares. Expense
limitations were in effect for some or all of the periods shown. Performance would have been lower had expense limitations not been in effect. Expenses are listed in the “Fund expense ratios” table on page 18. Please note additional details on pages 17 through 20.
The Bloomberg Barclays Municipal Bond Index measures the total return performance of the long-term, investment grade tax-exempt bond market.
Index performance returns do not reflect any management fees, transaction costs, or expenses. Indices are unmanaged and one cannot invest directly in an index. Past performance is not a guarantee of future results.
Performance of other Fund share classes will vary due to different charges and expenses.
| | | | | | |
| | | Nasdaq symbols | | CUSIPs | | |
Class A | | VCTFX | | 928920107 | | |
Class C | | DVCTX | | 92907R101 | | |
Institutional Class | | DCOIX | | 92907R200 | | |
|
|
20
| | |
| Performance summaries | | |
| Delaware Tax-Free Idaho Fund | | August 31, 2018 |
The performance quoted represents past performance and does not guarantee future results. Investment return and principal value of an investment will fluctuate so that shares, when redeemed, may be worth more or less than their original cost. Current performance may be lower or higher than the performance quoted. Performance data current to the most recent month end may be obtained by calling 800 523-1918 or visiting delawarefunds.com/performance.
| | | | | | | | | | | | | | | | |
| Fund and benchmark performance1,2 | | Average annual total returns through August 31, 2018 | |
| | | | |
| | | 1 year | | | 5 years | | | 10 years | | | Lifetime | |
Class A (Est. Jan. 4, 1995) | | | | | | | | | | | | | | | | |
Excluding sales charge | | | +0.56% | | | | +3.58% | | | | +3.43% | | | | +4.71% | |
Including sales charge | | | -3.95% | | | | +2.63% | | | | +2.96% | | | | +4.51% | |
Class C (Est. Jan. 11, 1995) | | | | | | | | | | | | | | | | |
Excluding sales charge | | | -0.19% | | | | +2.81% | | | | +2.66% | | | | +3.90% | |
Including sales charge | | | -1.17% | | | | +2.81% | | | | +2.66% | | | | +3.90% | |
Institutional Class (Est. Dec. 31, 2013) | | | | | | | | | | | | | | | | |
Excluding sales charge | | | +0.82% | | | | n/a | | | | n/a | | | | +3.76% | |
Including sales charge | | | +0.82% | | | | n/a | | | | n/a | | | | +3.76% | |
Bloomberg Barclays Municipal Bond Index | | | +0.49% | | | | +4.12% | | | | +4.32% | | | | +3.87%* | |
*The benchmark lifetime return is for Institutional Class share comparison only and is calculated using the last business day in the month of the Fund’s Institutional Class inception date.
1Returns reflect the reinvestment of all distributions and are presented both with and without the applicable sales charges described below. Returns do not reflect the deduction of taxes the shareholder would pay on Fund distributions or redemptions of Fund shares.
Expense limitations were in effect for certain classes during some or all of the periods shown in the “Fund and benchmark performance” table. Expenses for each class are listed on the “Fund expense ratios” table on page 22. Performance would have been lower had expense limitations not been in effect.
Institutional Class shares are not subject to a sales charge and are offered for sale exclusively to certain eligible investors. In addition, Institutional Class shares pay no distribution and service fee.
Class A shares are sold with a maximum front-end sales charge of 4.50%, and have an annual distribution and service fee of 0.25% of average daily net assets. Performance for Class A shares,
excluding sales charges, assumes that no front-end sales charge applied.
Class C shares are sold with a contingent deferred sales charge of 1.00% if redeemed during the first 12 months. They are also subject to an annual distribution and service fee of 1.00% of average daily net assets. Performance for Class C shares, excluding sales charges, assumes either that contingent deferred sales charges did not apply or that the investment was not redeemed.
Fixed income securities and bond funds can lose value, and investors can lose principal, as interest rates rise. They also may be affected by economic conditions that hinder an issuer’s ability to make interest and principal payments on its debt.
The Fund may also be subject to prepayment risk, the risk that the principal of a bond that is held by a portfolio will be prepaid prior to maturity, at the time when interest rates are lower than what the bond was paying. A portfolio may then have to reinvest that money at a lower interest rate.
21
Performance summaries
Delaware Tax-Free Idaho Fund
Funds that invest primarily in one state may be more susceptible to the economic, regulatory, regional, and other factors of that state than geographically diversified funds.
Substantially all dividend income derived from tax-free funds is exempt from federal income tax. Some income may be subject to state or local and/or the federal alternative minimum tax (AMT) that applies to certain investors. Capital gains, if any, are taxable.
Duration number will change as market conditions change. Therefore, duration should not be solely relied upon to indicate a municipal bond fund’s potential volatility.
This document may mention bond ratings published by nationally recognized statistical rating organizations (NRSROs) Standard & Poor’s,
Moody’s Investors Service, and Fitch, Inc. For securities rated by an NRSRO other than S&P, the rating is converted to the equivalent S&P credit rating. Bonds rated AAA are rated as having the highest quality and are generally considered to have the lowest degree of investment risk. Bonds rated AA are considered to be of high quality, but with a slightly higher degree of risk than bonds rated AAA. Bonds rated A are considered to have many favorable investment qualities, though they are somewhat more susceptible to adverse economic conditions. Bonds rated BBB are believed to be of medium-grade quality and generally riskier over the long term. Bonds rated BB, B, and CCC are regarded as having significant speculative characteristics, with BB indicating the least degree of speculation of the three.
2The Fund’s expense ratios, as described in the most recent prospectus, are disclosed in the following “Fund expense ratios” table. Delaware Management Company has agreed to reimburse certain expenses and/or waive certain fees in order to prevent total annual fund operating expenses (excluding any 12b-1 fees, acquired fund fees and expenses, taxes, interest, short sale and dividend and interest expenses, brokerage fees, certain insurance costs, and nonroutine expenses or costs, including, but not limited to, those relating to reorganizations, litigation, conducting shareholder meetings, and liquidations (collectively, nonroutine expenses)) from exceeding 0.61% of the Fund’s average daily net assets during the period from Sept. 1, 2017 to Aug. 31, 2018.* Please see the most recent prospectus and any applicable supplement(s) for additional information on these fee waivers and/or reimbursements. Please see the “Financial highlights” section in this report for the most recent expense ratios.
| | | | | | | | | | |
| Fund expense ratios | | Class A | | | | Class C | | | | Institutional Class |
Total annual operating expenses (without fee waivers) | | 1.00% | | | | 1.75% | | | | 0.75% |
Net expenses (including fee waivers, if any) | | 0.86% | | | | 1.61% | | | | 0.61% |
Type of waiver | | Contractual | | | | Contractual | | | | Contractual |
*The aggregate contractual waiver period covering this report is from Dec. 29, 2016 through Dec. 29, 2018.
22
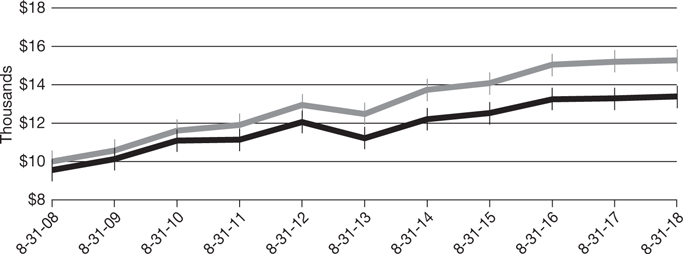
Performance of a $10,000 investment1
Class A shares
Average annual total returns from Aug. 31, 2008 through Aug. 31, 2018
| | | | | | | | |
For period beginning Aug. 31, 2008 through Aug. 31, 2018 | | Starting value | | | Ending value | |
Bloomberg Barclays Municipal Bond Index | | | $10,000 | | | | $15,263 | |
Delaware Tax-Free Idaho Fund — Class A shares | | | $9,550 | | | | $13,384 | |
Institutional Class shares
Average annual total returns from Dec. 31, 2013 (inception date) through Aug. 31, 2018
| | | | | | | | |
For period beginning Dec. 31, 2013 through Aug. 31, 2018 | | Starting value | | | Ending value | |
Bloomberg Barclays Municipal Bond Index | | | $10,000 | | | | $11,936 | |
Delaware Tax-Free Idaho Fund — Institutional Class shares | | | $10,000 | | | | $11,878 | |
23
Performance summaries
Delaware Tax-Free Idaho Fund
1The “Performance of a $10,000 investment” graph for Class A shares assumes $10,000 invested in Class A shares of the Fund on Aug. 31, 2008, and includes the effect of a 4.50% front-end sales charge and the reinvestment of all distributions. The graph also assumes $10,000 invested in the Bloomberg Barclays Municipal Bond Index as of Aug. 31, 2008.
The “Performance of a $10,000 investment” graph for Institutional Class shares assumes $10,000 invested in Institutional Class shares of the Fund on Dec. 31, 2013, and includes the reinvestment of all distributions. The graph also assumes $10,000 invested in the Bloomberg Barclays Municipal Bond Index as of Dec. 31, 2013.
The graphs do not reflect the deduction of taxes the shareholders would pay on Fund distributions or redemptions of Fund shares. Expense
limitations were in effect for some or all of the periods shown. Performance would have been lower had expense limitations not been in effect. Expenses are listed in the “Fund expense ratios” table on page 22. Please note additional details on pages 21 through 24.
The Bloomberg Barclays Municipal Bond Index measures the total return performance of the long-term, investment grade tax-exempt bond market.
Index performance returns do not reflect any management fees, transaction costs, or expenses. Indices are unmanaged and one cannot invest directly in an index. Past performance is not a guarantee of future results.
Performance of other Fund share classes will vary due to different charges and expenses.
| | | | | | |
| | | Nasdaq symbols | | CUSIPs | | |
Class A | | VIDAX | | 928928704 | | |
Class C | | DVICX | | 928928803 | | |
Institutional Class | | DTIDX | | 928928159 | | |
24
| | |
| Performance summaries | | |
| Delaware Tax-Free New York Fund | | August 31, 2018 |
The performance quoted represents past performance and does not guarantee future results. Investment return and principal value of an investment will fluctuate so that shares, when redeemed, may be worth more or less than their original cost. Current performance may be lower or higher than the performance quoted. Performance data current to the most recent month end may be obtained by calling 800 523-1918 or visiting delawarefunds.com/performance.
| | | | | | | | | | | | | | | | |
| Fund and benchmark performance1,2 | | Average annual total returns through August 31, 2018 | |
| | | | |
| | | 1 year | | | 5 years | | | 10 years | | | Lifetime | |
Class A (Est. Nov. 6, 1987) | | | | | | | | | | | | | | | | |
Excluding sales charge | | | +0.60% | | | | +4.64% | | | | +4.53% | | | | +5.50% | |
Including sales charge | | | -3.95% | | | | +3.68% | | | | +4.04% | | | | +5.34% | |
Class C (Est. April 26, 1995) | | | | | | | | | | | | | | | | |
Excluding sales charge | | | -0.16% | | | | +3.86% | | | | +3.75% | | | | +3.87% | |
Including sales charge | | | -1.14% | | | | +3.86% | | | | +3.75% | | | | +3.87% | |
Institutional Class (Est. Dec. 31, 2013) | | | | | | | | | | | | | | | | |
Excluding sales charge | | | +0.93% | | | | n/a | | | | n/a | | | | +4.72% | |
Including sales charge | | | +0.93% | | | | n/a | | | | n/a | | | | +4.72% | |
Bloomberg Barclays Municipal Bond Index | | | +0.49% | | | | +4.12% | | | | +4.32% | | | | +3.87%* | |
*The benchmark lifetime return is for Institutional Class share comparison only and is calculated using the last business day in the month of the Fund’s Institutional Class inception date.
1Returns reflect the reinvestment of all distributions and are presented both with and without the applicable sales charges described below. Returns do not reflect the deduction of taxes the shareholder would pay on Fund distributions or redemptions of Fund shares.
Expense limitations were in effect for certain classes during some or all of the periods shown in the “Fund and benchmark performance” table. Expenses for each class are listed on the “Fund expense ratios” table on page 26. Performance would have been lower had expense limitations not been in effect.
Institutional Class shares are not subject to a sales charge and are offered for sale exclusively to certain eligible investors. In addition, Institutional Class shares pay no distribution and service fee.
Class A shares are sold with a maximum front-end sales charge of 4.50%, and have an annual distribution and service fee of 0.25% of average daily net assets. Performance for Class A shares,
excluding sales charges, assumes that no front-end sales charge applied.
Class C shares are sold with a contingent deferred sales charge of 1.00% if redeemed during the first 12 months. They are also subject to an annual distribution and service fee of 1.00% of average daily net assets. Performance for Class C shares, excluding sales charges, assumes either that contingent deferred sales charges did not apply or that the investment was not redeemed.
Fixed income securities and bond funds can lose value, and investors can lose principal, as interest rates rise. They also may be affected by economic conditions that hinder an issuer’s ability to make interest and principal payments on its debt.
The Fund may also be subject to prepayment risk, the risk that the principal of a bond that is held by a portfolio will be prepaid prior to maturity, at the time when interest rates are lower than what the bond was paying. A portfolio may then have to reinvest that money at a lower interest rate.
25
Performance summaries
Delaware Tax-Free New York Fund
Funds that invest primarily in one state may be more susceptible to the economic, regulatory, regional, and other factors of that state than geographically diversified funds.
Substantially all dividend income derived from tax-free funds is exempt from federal income tax. Some income may be subject to state or local and/or the federal alternative minimum tax (AMT) that applies to certain investors. Capital gains, if any, are taxable.
Duration number will change as market conditions change. Therefore, duration should not be solely relied upon to indicate a municipal bond fund’s potential volatility.
This document may mention bond ratings published by nationally recognized statistical rating organizations (NRSROs) Standard & Poor’s,
Moody’s Investors Service, and Fitch, Inc. For securities rated by an NRSRO other than S&P, the rating is converted to the equivalent S&P credit rating. Bonds rated AAA are rated as having the highest quality and are generally considered to have the lowest degree of investment risk. Bonds rated AA are considered to be of high quality, but with a slightly higher degree of risk than bonds rated AAA. Bonds rated A are considered to have many favorable investment qualities, though they are somewhat more susceptible to adverse economic conditions. Bonds rated BBB are believed to be of medium-grade quality and generally riskier over the long term. Bonds rated BB, B, and CCC are regarded as having significant speculative characteristics, with BB indicating the least degree of speculation of the three.
2The Fund’s expense ratios, as described in the most recent prospectus, are disclosed in the following “Fund expense ratios” table. Delaware Management Company has agreed to reimburse certain expenses and/or waive certain fees in order to prevent total annual fund operating expenses (excluding any 12b-1 fees, acquired fund fees and expenses, taxes, interest, short sale and dividend and interest expenses, brokerage fees, certain insurance costs, and nonroutine expenses or costs, including, but not limited to, those relating to reorganizations, litigation, conducting shareholder meetings, and liquidations (collectively, nonroutine expenses)) from exceeding 0.55% of the Fund’s average daily net assets during the period from Sept. 1, 2017 to Aug. 31, 2018.* Please see the most recent prospectus and any applicable supplement(s) for additional information on these fee waivers and/or reimbursements. Please see the “Financial highlights” section in this report for the most recent expense ratios.
| | | | | | | | | | | | | | | | |
| Fund expense ratios | | Class A | | | | | Class C | | | | | Institutional Class | |
Total annual operating expenses | | | 1.03% | | | | | | 1.78% | | | | | | 0.78% | |
(without fee waivers) | | | | | | | | | | | | | | | | |
Net expenses | | | 0.80% | | | | | | 1.55% | | | | | | 0.55% | |
(including fee waivers, if any) | | | | | | | | | | | | | | | | |
Type of waiver | | | Contractual | | | | | | Contractual | | | | | | Contractual | |
*The aggregate contractual waiver period covering this report is from Dec. 29, 2016 through Dec. 29, 2018.
26
Performance of a $10,000 investment1
Class A shares
Average annual total returns from Aug. 31, 2008 through Aug. 31, 2018
| | | | | | | | |
For period beginning Aug. 31, 2008 through Aug. 31, 2018 | | Starting value | | | Ending value | |
Bloomberg Barclays Municipal Bond Index | | | $10,000 | | | | $15,263 | |
Delaware Tax-Free New York Fund — Class A shares | | | $9,550 | | | | $14,860 | |
Institutional Class shares
Average annual total returns from Dec. 31, 2013 (inception date) through Aug. 31, 2018
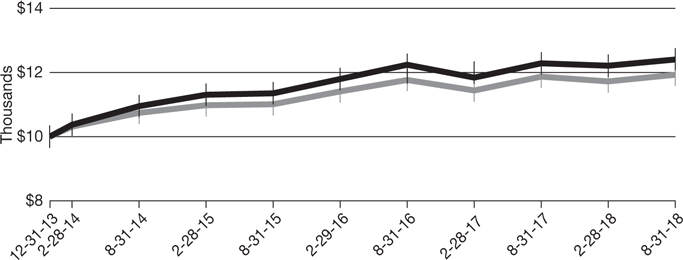
| | | | | | | | |
For period beginning Dec. 31, 2013 through Aug. 31, 2018 | | Starting value | | | Ending value | |
Delaware Tax-Free New York Fund — Institutional Class shares | | | $10,000 | | | | $12,404 | |
Bloomberg Barclays Municipal Bond Index | | | $10,000 | | | | $11,936 | |
27
Performance summaries
Delaware Tax-Free New York Fund
1The “Performance of a $10,000 investment” graph for Class A shares assumes $10,000 invested in Class A shares of the Fund on Aug. 31, 2008, and includes the effect of a 4.50% front-end sales charge and the reinvestment of all distributions. The graph also assumes $10,000 invested in the Bloomberg Barclays Municipal Bond Index as of Aug. 31, 2008.
The “Performance of a $10,000 investment” graph for Institutional Class shares assumes $10,000 invested in Institutional Class shares of the Fund on Dec. 31, 2013, and includes the reinvestment of all distributions. The graph also assumes $10,000 invested in the Bloomberg Barclays Municipal Bond Index as of Dec. 31, 2013.
The graphs do not reflect the deduction of taxes the shareholders would pay on Fund distributions or redemptions of Fund shares. Expense
limitations were in effect for some or all of the periods shown. Performance would have been lower had expense limitations not been in effect. Expenses are listed in the “Fund expense ratios” table on page 26. Please note additional details on pages 25 through 28.
The Bloomberg Barclays Municipal Bond Index measures the total return performance of the long-term, investment grade tax-exempt bond market.
Index performance returns do not reflect any management fees, transaction costs, or expenses. Indices are unmanaged and one cannot invest directly in an index. Past performance is not a guarantee of future results.
Performance of other Fund share classes will vary due to different charges and expenses.
| | | | | | |
| | | Nasdaq symbols | | CUSIPs | | |
Class A | | FTNYX | | 928928274 | | |
Class C | | DVFNX | | 928928258 | | |
Institutional Class | | DTNIX | | 928928142 | | |
|
|
28
| | |
| Performance summaries | | |
| Delaware Tax-Free Pennsylvania Fund | | August 31, 2018 |
The performance quoted represents past performance and does not guarantee future results. Investment return and principal value of an investment will fluctuate so that shares, when redeemed, may be worth more or less than their original cost. Current performance may be lower or higher than the performance quoted. Performance data current to the most recent month end may be obtained by calling 800 523-1918 or visiting delawarefunds.com/performance.
| | | | | | | | | | | | | | | | |
| Fund and benchmark performance1,2 | | Average annual total returns through August 31, 2018 | |
| | | | |
| | | 1 year | | | 5 years | | | 10 years | | | Lifetime | |
Class A (Est. March 23, 1977) | | | | | | | | | | | | | | | | |
Excluding sales charge | | | +0.93% | | | | +4.53% | | | | +4.36% | | | | +5.47% | |
Including sales charge | | | -3.58% | | | | +3.56% | | | | +3.88% | | | | +5.35% | |
Class C (Est. Nov. 29, 1995) | | | | | | | | | | | | | | | | |
Excluding sales charge | | | +0.16% | | | | +3.74% | | | | +3.57% | | | | +3.60% | |
Including sales charge | | | -0.81% | | | | +3.74% | | | | +3.57% | | | | +3.60% | |
Institutional Class (Est. Dec. 31, 2013) | | | | | | | | | | | | | | | | |
Excluding sales charge | | | +1.16% | | | | n/a | | | | n/a | | | | +4.61% | |
Including sales charge | | | +1.16% | | | | n/a | | | | n/a | | | | +4.61% | |
Bloomberg Barclays Municipal Bond Index | | | +0.49% | | | | +4.12% | | | | +4.32% | | | | +3.87%* | |
*The benchmark lifetime return is for Institutional Class share comparison only and is calculated using the last business day in the month of the Fund’s Institutional Class inception date.
1Returns reflect the reinvestment of all distributions and are presented both with and without the applicable sales charges described below. Returns do not reflect the deduction of taxes the shareholder would pay on Fund distributions or redemptions of Fund shares.
Expense limitations were in effect for certain classes during some or all of the periods shown in the “Fund and benchmark performance” table. Expenses for each class are listed on the “Fund expense ratios” table on page 30. Performance would have been lower had expense limitations not been in effect.
Institutional Class shares are not subject to a sales charge and are offered for sale exclusively to certain eligible investors. In addition, Institutional Class shares pay no distribution and service fee.
Class A shares are sold with a maximum front-end sales charge of 4.50%, and have an annual distribution and service fee of 0.25% of average daily net assets. The Board has adopted a formula
for calculating 12b-1 plan fees for the Fund’s Class A shares. The Fund’s Class A shares are currently subject to a blended 12b-1 fee equal to the sum of: (i) 0.10% of average daily net assets representing shares acquired prior to June 1, 1992, and (ii) 0.25% of average daily net assets representing shares acquired on or after June 1, 1992. All Class A shares currently bear 12b-1 fees at the same rate, the blended rate, currently 0.24% of average daily net assets, based on the formula described above. This method of calculating Class A 12b-1 fees may be discontinued at the sole discretion of the Board. Performance for Class A shares, excluding sales charges, assumes that no front-end sales charge applied.
Class C shares are sold with a contingent deferred sales charge of 1.00% if redeemed during the first 12 months. They are also subject to an annual distribution and service fee of 1.00% of average daily net assets. Performance for Class C shares, excluding sales charges, assumes either that
29
Performance summaries
Delaware Tax-Free Pennsylvania Fund
contingent deferred sales charges did not apply or that the investment was not redeemed.
Fixed income securities and bond funds can lose value, and investors can lose principal, as interest rates rise. They also may be affected by economic conditions that hinder an issuer’s ability to make interest and principal payments on its debt.
The Fund may also be subject to prepayment risk, the risk that the principal of a bond that is held by a portfolio will be prepaid prior to maturity, at the time when interest rates are lower than what the bond was paying. A portfolio may then have to reinvest that money at a lower interest rate.
Funds that invest primarily in one state may be more susceptible to the economic, regulatory, regional, and other factors of that state than geographically diversified funds.
Substantially all dividend income derived from tax-free funds is exempt from federal income tax. Some income may be subject to state or local and/or the federal alternative minimum tax (AMT) that applies to certain investors. Capital gains, if any, are taxable.
Duration number will change as market conditions change. Therefore, duration should not be solely relied upon to indicate a municipal bond fund’s potential volatility.
This document may mention bond ratings published by nationally recognized statistical rating organizations (NRSROs) Standard & Poor’s, Moody’s Investors Service, and Fitch, Inc. For securities rated by an NRSRO other than S&P, the rating is converted to the equivalent S&P credit rating. Bonds rated AAA are rated as having the highest quality and are generally considered to have the lowest degree of investment risk. Bonds rated AA are considered to be of high quality, but with a slightly higher degree of risk than bonds rated AAA. Bonds rated A are considered to have many favorable investment qualities, though they are somewhat more susceptible to adverse economic conditions. Bonds rated BBB are believed to be of medium-grade quality and generally riskier over the long term. Bonds rated BB, B, and CCC are regarded as having significant speculative characteristics, with BB indicating the least degree of speculation of the three.
2The Fund’s expense ratios, as described in the most recent prospectus, are disclosed in the following “Fund expense ratios” table. Delaware Management Company has agreed to reimburse certain expenses and/or waive certain fees in order to prevent total annual fund operating expenses (excluding any 12b-1 fees, acquired fund fees and expenses, taxes, interest, short sale and dividend and interest expenses, brokerage fees, certain insurance costs, and nonroutine expenses or costs, including, but not limited to, those relating to reorganizations, litigation, conducting shareholder meetings, and liquidations (collectively, nonroutine expenses)) from exceeding 0.64% of the Fund’s average daily net assets during the period from Sept. 1, 2017 to Aug. 31, 2018.* Please see the most recent prospectus and any applicable supplement(s) for additional information on these fee waivers and/or reimbursements. Please see the “Financial highlights” section in this report for the most recent expense ratios.
| | | | | | | | | | | | | | | | |
| Fund expense ratios | | Class A | | | | | Class C | | | | | Institutional Class | |
Total annual operating expenses | | | 0.94% | | | | | | 1.70% | | | | | | 0.70% | |
(without fee waivers) | | | | | | | | | | | | | | | | |
Net expenses | | | 0.88% | | | | | | 1.64% | | | | | | 0.64% | |
(including fee waivers, if any) | | | | | | | | | | | | | | | | |
Type of waiver | | | Contractual | | | | | | Contractual | | | | | | Contractual | |
*The aggregate contractual waiver period covering this report is from Dec. 29, 2016 through Dec. 29, 2018.
30
Performance of a $10,000 investment1
Class A shares
Average annual total returns from Aug. 31, 2008 through Aug. 31, 2018
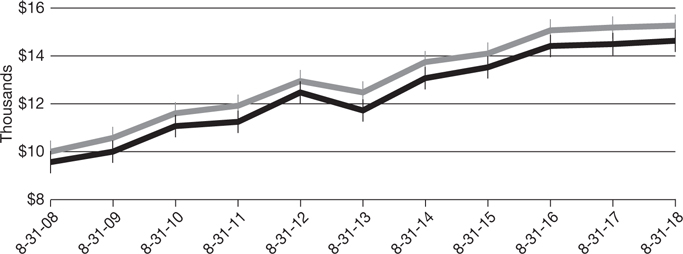
| | | | | | | | |
For period beginning Aug. 31, 2008 through Aug. 31, 2018 | | Starting value | | | Ending value | |
Bloomberg Barclays Municipal Bond Index | | | $10,000 | | | | $15,263 | |
Delaware Tax-Free Pennsylvania Fund — Class A shares | | | $9,550 | | | | $14,627 | |
Institutional Class shares
Average annual total returns from Dec. 31, 2013 (inception date) through Aug. 31, 2018
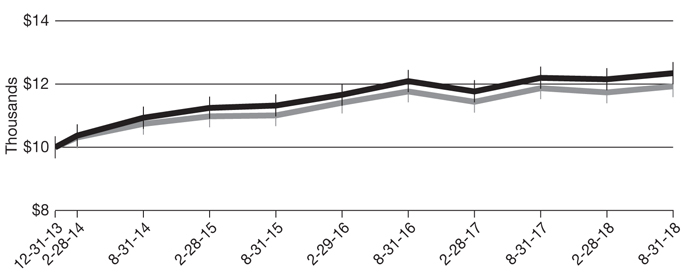
| | | | | | | | |
For period beginning Dec. 31, 2013 through Aug. 31, 2018 | | Starting value | | | Ending value | |
Delaware Tax-Free Pennsylvania Fund — Institutional Class shares | | | $10,000 | | | | $12,342 | |
Bloomberg Barclays Municipal Bond Index | | | $10,000 | | | | $11,936 | |
31
Performance summaries
Delaware Tax-Free Pennsylvania Fund
1The “Performance of a $10,000 investment” graph for Class A shares assumes $10,000 invested in Class A shares of the Fund on Aug. 31, 2008, and includes the effect of a 4.50% front-end sales charge and the reinvestment of all distributions. The graph also assumes $10,000 invested in the Bloomberg Barclays Municipal Bond Index as of Aug. 31, 2008.
The “Performance of a $10,000 investment” graph for Institutional Class shares assumes $10,000 invested in Institutional Class shares of the Fund on Dec. 31, 2013, and includes the reinvestment of all distributions. The graph also assumes $10,000 invested in the Bloomberg Barclays Municipal Bond Index as of Dec. 31, 2013.
The graphs do not reflect the deduction of taxes the shareholders would pay on Fund distributions or redemptions of Fund shares. Expense limitations were in
effect for some or all of the periods shown. Performance would have been lower had expense limitations not been in effect. Expenses are listed in the “Fund expense ratios” table on page 30. Please note additional details on pages 29 through 32.
The Bloomberg Barclays Municipal Bond Index measures the total return performance of the long-term, investment grade tax-exempt bond market.
Index performance returns do not reflect any management fees, transaction costs, or expenses. Indices are unmanaged and one cannot invest directly in an index. Past performance is not a guarantee of future results.
Performance of other Fund share classes will vary due to different charges and expenses.
| | | | | | |
| | | Nasdaq symbols | | CUSIPs | | |
Class A | | DELIX | | 233216100 | | |
Class C | | DPTCX | | 233216308 | | |
Institutional Class | | DTPIX | | 24609H701 | | |
32
Disclosure of Fund expenses
For the six-month period from March 1, 2018 to August 31, 2018 (Unaudited)
As a shareholder of a Fund, you incur two types of costs: (1) transaction costs, including sales charges (loads) on purchase payments, reinvested dividends, or other distributions; redemption fees; and exchange fees; and (2) ongoing costs, including management fees; distribution and service (12b-1) fees; and other Fund expenses. These following examples are intended to help you understand your ongoing costs (in dollars) of investing in a Fund and to compare these costs with the ongoing costs of investing in other mutual funds.
The examples are based on an investment of $1,000 invested at the beginning of the period and held for the entire six-month period from March 1, 2018 to Aug. 31, 2018.
Actual expenses
The first section of the tables shown, “Actual Fund return,” provides information about actual account values and actual expenses. You may use the information in this section of the table, together with the amount you invested, to estimate the expenses that you paid over the period. Simply divide your account value by $1,000 (for example, an $8,600 account value divided by $1,000 = 8.6), then multiply the result by the number in the first section under the heading entitled “Expenses Paid During Period” to estimate the expenses you paid on your account during this period.
Hypothetical example for comparison purposes
The second section of the tables shown, “Hypothetical 5% return,” provides information about hypothetical account values and hypothetical expenses based on the Funds’ actual expense ratios and an assumed rate of return of 5% per year before expenses, which is not the Funds’ actual return. The hypothetical account values and expenses may not be used to estimate the actual ending account balance or expenses you paid for the period. You may use this information to compare the ongoing costs of investing in each Fund and other funds. To do so, compare this 5% hypothetical example with the 5% hypothetical examples that appear in the shareholder reports of the other funds.
Please note that the expenses shown in the tables are meant to highlight your ongoing costs only and do not reflect any transactional costs, such as sales charges (loads), redemption fees, or exchange fees. Therefore, the second section of each table is useful in comparing ongoing costs only, and will not help you determine the relative total costs of owning different funds. In addition, if these transactional costs were included, your costs would have been higher. The Funds’ expenses shown in the tables reflect fee waivers in effect. The expenses shown in each table assume reinvestment of all dividends and distributions.
33
Disclosure of Fund expenses
For the six-month period from March 1, 2018 to August 31, 2018 (Unaudited)
Delaware Tax-Free Arizona Fund
Expense analysis of an investment of $1,000
| | | | | | | | | | |
| | | Beginning
Account Value
3/1/18 | | Ending
Account Value
8/31/18 | | Annualized
Expense Ratio | | Expenses
Paid During Period
3/1/18 to 8/31/18* | |
| |
Actual Fund return† | | | | |
Class A | | $1,000.00 | | $1,016.50 | | 0.84% | | | $4.27 | |
Class C | | 1,000.00 | | 1,012.60 | | 1.59% | | | 8.07 | |
Institutional Class | | 1,000.00 | | 1,016.90 | | 0.59% | | | 3.00 | |
| |
Hypothetical 5% return (5% return before expenses) | | | | |
Class A | | $1,000.00 | | $1,020.97 | | 0.84% | | | $4.28 | |
Class C | | 1,000.00 | | 1,017.19 | | 1.59% | | | 8.08 | |
Institutional Class | | 1,000.00 | | 1,022.23 | | 0.59% | | | 3.01 | |
Delaware Tax-Free California Fund
Expense analysis of an investment of $1,000
| | | | | | | | | | |
| | | Beginning
Account Value
3/1/18 | | Ending
Account Value
8/31/18 | | Annualized
Expense Ratio | | Expenses
Paid During Period
3/1/18 to 8/31/18* | |
| |
Actual Fund return† | | | | |
Class A | | $1,000.00 | | $1,017.10 | | 0.82% | | | $4.17 | |
Class C | | 1,000.00 | | 1,013.30 | | 1.57% | | | 7.97 | |
Institutional Class | | 1,000.00 | | 1,018.40 | | 0.57% | | | 2.90 | |
| |
Hypothetical 5% return (5% return before expenses) | | | | |
Class A | | $1,000.00 | | $1,021.07 | | 0.82% | | | $4.18 | |
Class C | | 1,000.00 | | 1,017.29 | | 1.57% | | | 7.98 | |
Institutional Class | | 1,000.00 | | 1,022.33 | | 0.57% | | | 2.91 | |
34
Delaware Tax-Free Colorado Fund
Expense analysis of an investment of $1,000
| | | | | | | | | | |
| | | Beginning
Account Value
3/1/18 | | Ending
Account Value
8/31/18 | | Annualized
Expense Ratio | | Expenses
Paid During Period
3/1/18 to 8/31/18* | |
| |
Actual Fund return† | | | | |
Class A | | $1,000.00 | | $1,014.40 | | 0.84% | | | $4.27 | |
Class C | | 1,000.00 | | 1,010.60 | | 1.59% | | | 8.06 | |
Institutional Class | | 1,000.00 | | 1,015.70 | | 0.59% | | | 3.00 | |
| |
Hypothetical 5% return (5% return before expenses) | | | | |
Class A | | $1,000.00 | | $1,020.97 | | 0.84% | | | $4.28 | |
Class C | | 1,000.00 | | 1,017.19 | | 1.59% | | | 8.08 | |
Institutional Class | | 1,000.00 | | 1,022.23 | | 0.59% | | | 3.01 | |
Delaware Tax-Free Idaho Fund
Expense analysis of an investment of $1,000
| | | | | | | | | | |
| | | Beginning
Account Value
3/1/18 | | Ending
Account Value
8/31/18 | | Annualized
Expense Ratio | | Expenses
Paid During Period
3/1/18 to 8/31/18* | |
| |
Actual Fund return† | | | | |
Class A | | $1,000.00 | | $1,014.70 | | 0.86% | | | $4.37 | |
Class C | | 1,000.00 | | 1,010.90 | | 1.61% | | | 8.16 | |
Institutional Class | | 1,000.00 | | 1,016.00 | | 0.61% | | | 3.10 | |
| |
Hypothetical 5% return (5% return before expenses) | | | | |
Class A | | $1,000.00 | | $1,020.87 | | 0.86% | | | $4.38 | |
Class C | | 1,000.00 | | 1,017.09 | | 1.61% | | | 8.19 | |
Institutional Class | | 1,000.00 | | 1,022.13 | | 0.61% | | | 3.11 | |
35
Disclosure of Fund expenses
For the six-month period from March 1, 2018 to August 31, 2018 (Unaudited)
Delaware Tax-Free New York Fund
Expense analysis of an investment of $1,000
| | | | | | | | | | |
| | | Beginning
Account Value
3/1/18 | | Ending
Account Value
8/31/18 | | Annualized
Expense Ratio | | Expenses
Paid During Period
3/1/18 to 8/31/18* | |
| |
Actual Fund return† | | | | |
Class A | | $1,000.00 | | $1,013.50 | | 0.80% | | | $4.06 | |
Class C | | 1,000.00 | | 1,009.60 | | 1.55% | | | 7.85 | |
Institutional Class | | 1,000.00 | | 1,014.70 | | 0.55% | | | 2.79 | |
| |
Hypothetical 5% return (5% return before expenses) | | | | |
Class A | | $1,000.00 | | $1,021.17 | | 0.80% | | | $4.08 | |
Class C | | 1,000.00 | | 1,017.39 | | 1.55% | | | 7.88 | |
Institutional Class | | 1,000.00 | | 1,022.43 | | 0.55% | | | 2.80 | |
Delaware Tax-Free Pennsylvania Fund
Expense analysis of an investment of $1,000
| | | | | | | | | | |
| | | Beginning
Account Value
3/1/18 | | Ending
Account Value
8/31/18 | | Annualized
Expense Ratio | | Expenses
Paid During Period
3/1/18 to 8/31/18* | |
| |
Actual Fund return† | | | | |
Class A | | $1,000.00 | | $1,015.30 | | 0.88% | | | $4.47 | |
Class C | | 1,000.00 | | 1,010.10 | | 1.64% | | | 8.31 | |
Institutional Class | | 1,000.00 | | 1,015.20 | | 0.64% | | | 3.25 | |
| |
Hypothetical 5% return (5% return before expenses) | | | | |
Class A | | $1,000.00 | | $1,020.77 | | 0.88% | | | $4.48 | |
Class C | | 1,000.00 | | 1,016.94 | | 1.64% | | | 8.34 | |
Institutional Class | | 1,000.00 | | 1,021.98 | | 0.64% | | | 3.26 | |
| *“ | Expenses Paid During Period” are equal to the relevant Fund’s annualized expense ratio, multiplied by the average account value over the period, multiplied by 184/365 (to reflect the one-half year period). |
| † | Because actual returns reflect only the most recent six-month period, the returns shown may differ significantly from fiscal year returns. |
36
| | |
| Security type / sector / state / territory allocations |
| Delaware Tax-Free Arizona Fund | | As of August 31, 2018 (Unaudited) |
Sector designations may be different than the sector designations presented in other Fund materials.
| | | | | | | |
| Security type / sector | | Percentage of net assets | | |
Municipal Bonds* | | | | 98.09 | % | | |
Corporate Revenue Bonds | | | | 10.77 | % | | |
Education Revenue Bonds | | | | 28.80 | % | | |
Electric Revenue Bonds | | | | 2.90 | % | | |
Healthcare Revenue Bonds | | | | 18.82 | % | | |
Lease Revenue Bonds | | | | 5.13 | % | | |
Local General Obligation Bond | | | | 0.35 | % | | |
Pre-Refunded Bonds | | | | 9.63 | % | | |
Special Tax Revenue Bonds | | | | 6.23 | % | | |
Transportation Revenue Bonds | | | | 8.43 | % | | |
Water & Sewer Revenue Bonds | | | | 7.03 | % | | |
Short-Term Investment | | | | 0.39 | % | | |
Total Value of Securities | | | | 98.48 | % | | |
Receivables and Other Assets Net of Liabilities | | | | 1.52 | % | | |
Total Net Assets | | | | 100.00 | % | | |
*As of the date of this report, Delaware Tax-Free Arizona Fund held bonds issued by or on behalf of territories and the states of the US as follows:
| | | | | | | |
| State / territory | | Percentage of net assets | | |
Arizona | | | | 95.33 | % | | |
Guam | | | | 2.08 | % | | |
Puerto Rico | | | | 1.07 | % | | |
Total Value of Securities | | | | 98.48 | % | | |
37
| | |
| Security type / sector allocations |
| Delaware Tax-Free California Fund | | As of August 31, 2018 (Unaudited) |
Sector designations may be different than the sector designations presented in other Fund materials.
| | | | | | | |
| Security type / sector | | Percentage of net assets | | |
Municipal Bonds | | | | 99.70 | % | | |
Corporate Revenue Bonds | | | | 5.81 | % | | |
Education Revenue Bonds | | | | 19.24 | % | | |
Electric Revenue Bond | | | | 0.58 | % | | |
Healthcare Revenue Bonds | | | | 21.37 | % | | |
Housing Revenue Bonds | | | | 4.21 | % | | |
Lease Revenue Bonds | | | | 10.70 | % | | |
Local General Obligation Bonds | | | | 2.94 | % | | |
Pre-Refunded Bonds | | | | 10.05 | % | | |
Resource Recovery Revenue Bond | | | | 1.05 | % | | |
Special Tax Revenue Bonds | | | | 1.11 | % | | |
State General Obligation Bonds | | | | 8.50 | % | | |
Transportation Revenue Bonds | | | | 11.96 | % | | |
Water & Sewer Revenue Bonds | | | | 2.18 | % | | |
Short-Term Investment | | | | 0.33 | % | | |
Total Value of Securities | | | | 100.03 | % | | |
Liabilities Net of Receivables and Other Assets | | | | (0.03 | %) | | |
Total Net Assets | | | | 100.00 | % | | |
38
| | |
| Security type / sector / state / territory allocations |
| Delaware Tax-Free Colorado Fund | | As of August 31, 2018 (Unaudited) |
Sector designations may be different than the sector designations presented in other Fund materials.
| | | | | | | |
| Security type / sector | | Percentage of net assets | | |
Municipal Bonds* | | | | 98.84 | % | | |
Corporate Revenue Bonds | | | | 1.41 | % | | |
Education Revenue Bonds | | | | 11.15 | % | | |
Electric Revenue Bonds | | | | 3.74 | % | | |
Healthcare Revenue Bonds | | | | 24.16 | % | | |
Housing Revenue Bonds | | | | 0.09 | % | | |
Lease Revenue Bonds | | | | 3.35 | % | | |
Local General Obligation Bonds | | | | 14.02 | % | | |
Pre-Refunded Bonds | | | | 7.21 | % | | |
Special Tax Revenue Bonds | | | | 19.44 | % | | |
Transportation Revenue Bonds | | | | 12.94 | % | | |
Water & Sewer Revenue Bonds | | | | 1.33 | % | | |
Short-Term Investments | | | | 0.59 | % | | |
Total Value of Securities | | | | 99.43 | % | | |
Receivables and Other Assets Net of Liabilities | | | | 0.57 | % | | |
Total Net Assets | | | | 100.00 | % | | |
*As of the date of this report, Delaware Tax-Free Colorado Fund held bonds issued by or on behalf of territories and the states of the US as follows:
| | | | | | | |
| State / territory | | Percentage of net assets | | |
Colorado | | | | 96.02 | % | | |
Guam | | | | 1.89 | % | | |
Puerto Rico | | | | 1.00 | % | | |
US Virgin Islands | | | | 0.52 | % | | |
Total | | | | 99.43 | % | | |
39
| | |
| Security type / sector / state / territory allocations |
| Delaware Tax-Free Idaho Fund | | As of August 31, 2018 (Unaudited) |
Sector designations may be different than the sector designations presented in other Fund materials.
| | | | | | | |
| Security type / sector | | Percentage of net assets | | |
Municipal Bonds* | | | | 98.53 | % | | |
Corporate Revenue Bonds | | | | 3.31 | % | | |
Education Revenue Bonds | | | | 16.10 | % | | |
Electric Revenue Bonds | | | | 3.36 | % | | |
Healthcare Revenue Bonds | | | | 12.76 | % | | |
Housing Revenue Bonds | | | | 1.03 | % | | |
Lease Revenue Bonds | | | | 9.95 | % | | |
Local General Obligation Bonds | | | | 25.76 | % | | |
Pre-Refunded Bonds | | | | 6.91 | % | | |
Special Tax Revenue Bonds | | | | 14.14 | % | | |
Transportation Revenue Bonds | | | | 4.42 | % | | |
Water & Sewer Revenue Bonds | | | | 0.79 | % | | |
Short-Term Investment | | | | 0.88 | % | | |
Total Value of Securities | | | | 99.41 | % | | |
Receivables and Other Assets Net of Liabilities | | | | 0.59 | % | | |
Total Net Assets | | | | 100.00 | % | | |
*As of the date of this report, Delaware Tax-Free Idaho Fund held bonds issued by or on behalf of territories and the states of the US as follows:
| | | | | | | |
| State / territory | | Percentage of net assets | | |
Guam | | | | 4.74 | % | | |
Idaho | | | | 91.97 | % | | |
Puerto Rico | | | | 1.10 | % | | |
US Virgin Islands | | | | 1.60 | % | | |
Total | | | | 99.41 | % | | |
40
| | |
| Security type / sector / state / territory allocations |
| Delaware Tax-Free New York Fund | | As of August 31, 2018 (Unaudited) |
Sector designations may be different than the sector designations presented in other Fund materials.
| | | | | | | |
| Security type / sector | | Percentage of net assets | | |
Municipal Bonds* | | | | 100.48 | % | | |
Corporate Revenue Bonds | | | | 8.43 | % | | |
Education Revenue Bonds | | | | 22.68 | % | | |
Electric Revenue Bonds | | | | 3.58 | % | | |
Healthcare Revenue Bonds | | | | 15.16 | % | | |
Lease Revenue Bonds | | | | 8.68 | % | | |
Local General Obligation Bonds | | | | 2.24 | % | | |
Pre-Refunded Bonds | | | | 11.38 | % | | |
Resource Recovery Revenue Bond | | | | 1.75 | % | | |
Special Tax Revenue Bonds | | | | 16.56 | % | | |
State General Obligation Bond | | | | 0.58 | % | | |
Transportation Revenue Bonds | | | | 6.56 | % | | |
Water & Sewer Revenue Bonds | | | | 2.88 | % | | |
Short-Term Investments | | | | 0.29 | % | | |
Total Value of Securities | | | | 100.77 | % | | |
Liabilities Net of Receivables and Other Assets | | | | (0.77 | %) | | |
Total Net Assets | | | | 100.00 | % | | |
*As of the date of this report, Delaware Tax-Free New York Fund held bonds issued by or on behalf of territories and the states of the US as follows:
| | | | | | | |
| State / territory | | Percentage of net assets | | |
Guam | | | | 0.29 | % | | |
New York | | | | 100.48 | % | | |
Total Value of Securities | | | | 100.77 | % | | |
41
| | |
| Security type / sector / state / territory allocations |
| Delaware Tax-Free Pennsylvania Fund | | As of August 31, 2018 (Unaudited) |
Sector designations may be different than the sector designations presented in other Fund materials.
| | | | | | | |
| Security type / sector | | Percentage of net assets | | |
Municipal Bonds* | | | | 98.77 | % | | |
Corporate Revenue Bonds | | | | 5.72 | % | | |
Education Revenue Bonds | | | | 14.42 | % | | |
Healthcare Revenue Bonds | | | | 29.26 | % | | |
Housing Revenue Bond | | | | 0.48 | % | | |
Lease Revenue Bonds | | | | 3.63 | % | | |
Local General Obligation Bonds | | | | 4.27 | % | | |
Pre-Refunded/Escrowed to Maturity Bonds | | | | 21.81 | % | | |
Resource Recovery Revenue Bonds | | | | 0.62 | % | | |
Special Tax Revenue Bonds | | | | 3.71 | % | | |
State General Obligation Bond | | | | 0.64 | % | | |
Transportation Revenue Bonds | | | | 10.14 | % | | |
Water & Sewer Revenue Bonds | | | | 4.07 | % | | |
Short-Term Investments | | | | 0.60 | % | | |
Total Value of Securities | | | | 99.37 | % | | |
Receivables and Other Assets Net of Liabilities | | | | 0.63 | % | | |
Total Net Assets | | | | 100.00 | % | | |
*As of the date of this report, Delaware Tax-Free Pennsylvania Fund held bonds issued by or on behalf of territories and the states of the US as follows:
| | | | | | | |
| State / territory | | Percentage of net assets | | |
Guam | | | | 0.79 | % | | |
Pennsylvania | | | | 98.58 | % | | |
Total Value of Securities | | | | 99.37 | % | | |
42
| | |
| Schedules of investments |
| Delaware Tax-Free Arizona Fund | | August 31, 2018 |
| | | | | | | | |
| | | Principal amount° | | | Value (US $) | |
| |
Municipal Bonds – 98.09% | | | | | | | | |
| |
Corporate Revenue Bonds – 10.77% | | | | | | | | |
Chandler Industrial Development Authority Revenue | | | | | | | | |
(Intel Corporation Project) 2.70% 12/1/37 (AMT) ● | | | 1,000,000 | | | $ | 1,003,210 | |
Maricopa County Pollution Control | | | | | | | | |
(Public Service - Palo Verde Project) Series B 5.20% 6/1/43 ● | | | 1,500,000 | | | | 1,572,885 | |
(Southern California Education Co.) Series A 5.00% 6/1/35 | | | 2,400,000 | | | | 2,510,184 | |
Pima County Industrial Development Authority Pollution Control Revenue | | | | | | | | |
(Tucson Electric Power) Series A 5.25% 10/1/40 | | | 2,000,000 | | | | 2,121,620 | |
Salt Verde Financial Senior Gas Revenue | | | | | | | | |
5.00% 12/1/37 | | | 870,000 | | | | 1,033,952 | |
| | | | | | | | |
| | | | | | | 8,241,851 | |
| | | | | | | | |
Education Revenue Bonds – 28.80% | | | | | | | | |
Arizona Health Facilities Authority Healthcare Education Revenue | | | | | | | | |
(Kirksville College) 5.125% 1/1/30 | | | 1,500,000 | | | | 1,557,615 | |
Arizona Industrial Development Authority Revenue | | | | | | | | |
(Academies of Math & Science Projects) Series A 5.00% 7/1/51 | | | 1,000,000 | | | | 1,092,320 | |
(ACCEL Schools Project) Series A 144A 5.25% 8/1/48 # | | | 350,000 | | | | 350,518 | |
(American Charter Schools Foundation Project) 144A 6.00% 7/1/47 # | | | 400,000 | | | | 420,932 | |
Arizona State University Energy Management Revenue | | | | | | | | |
(Arizona State University Tempe Campus II Project) | | | | | | | | |
4.50% 7/1/24 | | | 1,000,000 | | | | 1,021,830 | |
Glendale Industrial Development Authority Revenue | | | | | | | | |
(Midwestern University) | | | | | | | | |
5.00% 5/15/31 | | | 645,000 | | | | 700,115 | |
5.125% 5/15/40 | | | 1,305,000 | | | | 1,366,100 | |
La Paz County Industrial Development Authority Revenue | | | | | | | | |
(Charter School Solutions-Harmony Public Schools Project) Series A 5.00% 2/15/48 | | | 100,000 | | | | 106,422 | |
Maricopa County Industrial Development Authority Revenue | | | | | | | | |
(Greathearts Arizona Projects) Series A 5.00% 7/1/52 | | | 725,000 | | | | 804,576 | |
(Paradise Schools Projects) 144A 5.00% 7/1/36 # | | | 500,000 | | | | 523,010 | |
(Reid Traditional Schools Projects) 5.00% 7/1/47 | | | 785,000 | | | | 817,931 | |
McAllister Academic Village Revenue | | | | | | | | |
(Arizona State University Hassayampa Academic Village Project) 5.00% 7/1/31 | | | 1,000,000 | | | | 1,153,550 | |
Northern Arizona University | | | | | | | | |
5.00% 6/1/36 | | | 475,000 | | | | 507,271 | |
43
| | |
| Schedules of investments |
Delaware Tax-Free Arizona Fund | | |
| | | | | | | | |
| | | Principal amount° | | | Value (US $) | |
| |
Municipal Bonds (continued) | | | | | | | | |
| |
Education Revenue Bonds (continued) | | | | | | | | |
Northern Arizona University | | | | | | | | |
5.00% 6/1/41 | | | 1,240,000 | | | $ | 1,321,530 | |
Phoenix Industrial Development Authority | | | | | | | | |
(Basis School Projects) 144A 5.00% 7/1/35 # | | | 1,000,000 | | | | 1,032,590 | |
(Choice Academies Project) 5.625% 9/1/42 | | | 1,250,000 | | | | 1,299,900 | |
(Eagle College Preparatory Project) Series A 5.00% 7/1/43 | | | 500,000 | | | | 500,825 | |
(Great Hearts Academic Project) 5.00% 7/1/46 | | | 1,000,000 | | | | 1,053,160 | |
(Rowan University Project) 5.00% 6/1/42 | | | 2,000,000 | | | | 2,144,040 | |
Pima County Industrial Development Authority Education Revenue | | | | | | | | |
(American Leadership Academy Project) | | | | | | | | |
144A 5.00% 6/15/47 # | | | 100,000 | | | | 100,986 | |
144A 5.00% 6/15/52 # | | | 90,000 | | | | 90,578 | |
(Edkey Charter School Project) 6.00% 7/1/48 | | | 1,000,000 | | | | 944,270 | |
(Tucson Country Day School Project) 5.00% 6/1/37 | | | 750,000 | | | | 685,920 | |
Tucson Industrial Development Authority Lease Revenue | | | | | | | | |
(University of Arizona-Marshall Foundation) Series A 5.00% 7/15/27 (AMBAC) | | | 980,000 | | | | 981,372 | |
University of Arizona Board of Regents | | | | | | | | |
Series A 5.00% 6/1/38 | | | 1,000,000 | | | | 1,103,500 | |
Unrefunded Balance Series A 5.00% 6/1/25 | | | 335,000 | | | | 369,240 | |
| | | | | | | | |
| | | | | | | 22,050,101 | |
| | | | | | | | |
Electric Revenue Bonds – 2.90% | | | | | | | | |
Salt River Project Agricultural Improvement & Power | | | | | | | | |
District Electric System Revenue | | | | | | | | |
Series A 5.00% 12/1/30 | | | 1,000,000 | | | | 1,089,660 | |
Series A 5.00% 12/1/45 | | | 1,000,000 | | | | 1,130,930 | |
| | | | | | | | |
| | | | | | | 2,220,590 | |
| | | | | | | | |
Healthcare Revenue Bonds – 18.82% | | | | | | | | |
Arizona Health Facilities Authority Hospital System Revenue | | | | | | | | |
(Banner Health) | | | | | | | | |
Series A 5.00% 1/1/43 | | | 1,500,000 | | | | 1,615,305 | |
Series A 5.00% 1/1/44 | | | 1,000,000 | | | | 1,093,550 | |
(Phoenix Children’s Hospital) Series A 5.00% 2/1/34 | | | 995,000 | | | | 1,057,277 | |
(Scottsdale Lincoln Hospital Project) 5.00% 12/1/42 | | | 1,000,000 | | | | 1,099,830 | |
Glendale Industrial Development Authority Revenue | | | | | | | | |
(Glencroft Retirement Community Project) 5.00% 11/15/36 | | | 270,000 | | | | 273,605 | |
Maricopa County Industrial Development Authority Health Facilities Revenue | | | | | | | | |
(Banner Health) Series A 4.00% 1/1/41 | | | 1,000,000 | | | | 1,031,400 | |
44
| | | | | | | | |
| | | Principal amount° | | | Value (US $) | |
| |
Municipal Bonds (continued) | | | | | | | | |
| |
Healthcare Revenue Bonds (continued) | | | | | | | | |
Maricopa County Industrial Development Authority Health Facilities Revenue | | | | | | | | |
(Catholic Healthcare West) Series A 6.00% 7/1/39 | | | 2,500,000 | | | $ | 2,580,425 | |
Maricopa County Industrial Development Authority Senior Living Facility Revenue | | | | | | | | |
(Christian Care Surprise Project) 144A 6.00% 1/1/48 # | | | 405,000 | | | | 413,732 | |
Puerto Rico Industrial Tourist Educational Medical & Environmental Control Facilities Financing Authority | | | | | | | | |
(Hospital Auxilio Mutuo Obligated Group Project) Series A 6.00% 7/1/33 | | | 790,000 | | | | 821,655 | |
Tempe Industrial Development Authority Revenue | | | | | | | | |
(Friendship Village) Series A 6.25% 12/1/42 | | | 1,200,000 | | | | 1,283,424 | |
(Mirabella at ASU Project) Series A 144A 6.125% 10/1/52 # | | | 250,000 | | | | 275,668 | |
Yavapai County Industrial Development Authority Hospital Facility | | | | | | | | |
(Yavapai Regional Medical Center) Series A 5.25% 8/1/33 | | | 2,000,000 | | | | 2,190,420 | |
Yuma Industrial Development Authority Hospital Revenue | | | | | | | | |
(Yuma Regional Medical Center) | | | | | | | | |
Series A 5.00% 8/1/32 | | | 295,000 | | | | 329,751 | |
Series A 5.25% 8/1/32 | | | 300,000 | | | | 339,744 | |
| | | | | | | | |
| | | | | | | 14,405,786 | |
| | | | | | | | |
Lease Revenue Bonds – 5.13% | | | | | | | | |
Arizona Certificates of Participation Department Administration | | | | | | | | |
Series A 5.25% 10/1/25 (AGM) | | | 1,500,000 | | | | 1,553,055 | |
Arizona Game & Fish Department & Community Beneficial Interest Certificates | | | | | | | | |
(Administration Building Project) 5.00% 7/1/32 | | | 1,000,000 | | | | 1,002,220 | |
Arizona Sports & Tourism Authority Senior Revenue | | | | | | | | |
(Multipurpose Stadium Facility) Series A 5.00% 7/1/36 | | | 350,000 | | | | 368,483 | |
Maricopa County Industrial Development Authority | | | | | | | | |
Correctional Contract Revenue | | | | | | | | |
(Phoenix West Prison) Series B 5.375% 7/1/22 (ACA) | | | 1,000,000 | | | | 1,002,300 | |
| | | | | | | | |
| | | | | | | 3,926,058 | |
| | | | | | | | |
Local General Obligation Bond – 0.35% | | | | | | | | |
Pinal County Community College District | | | | | | | | |
4.00% 7/1/31 | | | 250,000 | | | | 265,157 | |
| | | | | | | | |
| | | | | | | 265,157 | |
| | | | | | | | |
Pre-Refunded Bonds – 9.63% | | | | | | | | |
Gilbert Public Facilities Municipal Property Revenue | | | | | | | | |
5.00% 7/1/25-19 § | | | 1,250,000 | | | | 1,284,550 | |
45
| | |
| Schedules of investments |
| Delaware Tax-Free Arizona Fund | | |
| | | | | | | | |
| | | Principal amount° | | | Value (US $) | |
| |
Municipal Bonds (continued) | | | | | | | | |
| |
Pre-Refunded Bonds (continued) | | | | | | | | |
Phoenix Civic Improvement Airport Revenue | | | | | | | | |
(Junior Lien) Series A 5.25% 7/1/33-20 § | | | 1,250,000 | | | $ | 1,329,263 | |
Phoenix Industrial Development Authority | | | | | | | | |
(Great Hearts Academic Project) | | | | | | | | |
6.30% 7/1/42-21 § | | | 500,000 | | | | 560,010 | |
6.40% 7/1/47-21 § | | | 500,000 | | | | 561,380 | |
Pinal County Electric District No. 3 | | | | | | | | |
5.25% 7/1/41-21 § | | | 750,000 | | | | 819,570 | |
University Medical Center Hospital Revenue | | | | | | | | |
6.50% 7/1/39-19 § | | | 2,000,000 | | | | 2,078,000 | |
University of Arizona Board of Regents | | | | | | | | |
Series A 5.00% 6/1/25-22 § | | | 665,000 | | | | 738,788 | |
| | | | | | | | |
| | | | | | | 7,371,561 | |
| | | | | | | | |
Special Tax Revenue Bonds – 6.23% | | | | | | | | |
Glendale Municipal Property Excise Tax Revenue | | | | | | | | |
(Senior Lien) Series B 5.00% 7/1/33 | | | 570,000 | | | | 629,497 | |
Glendale Transportation Excise Tax Revenue | | | | | | | | |
5.00% 7/1/30 (AGM) | | | 1,000,000 | | | | 1,143,070 | |
Guam Government Business Privilege Tax Revenue | | | | | | | | |
Series A 5.125% 1/1/42 | | | 545,000 | | | | 572,174 | |
Series A 5.25% 1/1/36 | | | 705,000 | | | | 746,292 | |
Mesa Excise Tax Revenue | | | | | | | | |
5.00% 7/1/32 | | | 1,000,000 | | | | 1,093,620 | |
Regional Public Transportation Authority | | | | | | | | |
(Maricopa County Public Transportation) 5.25% 7/1/24 | | | 500,000 | | | | 582,895 | |
| | | | | | | | |
| | | | | | | 4,767,548 | |
| | | | | | | | |
Transportation Revenue Bonds – 8.43% | | | | | | | | |
Arizona Department of Transportation State Highway Fund Revenue | | | | | | | | |
5.00% 7/1/32 | | | 1,500,000 | | | | 1,705,440 | |
5.00% 7/1/35 | | | 500,000 | | | | 575,260 | |
Phoenix Civic Improvement Airport Revenue | | | | | | | | |
Series B 5.00% 7/1/37 | | | 1,000,000 | | | | 1,145,630 | |
(Junior Lien) Series A 5.00% 7/1/45 | | | 1,000,000 | | | | 1,109,490 | |
(Senior Lien) 5.00% 7/1/32 (AMT) | | | 1,750,000 | | | | 1,920,817 | |
| | | | | | | | |
| | | | | | | 6,456,637 | |
| | | | | | | | |
Water & Sewer Revenue Bonds – 7.03% | | | | | | | | |
Arizona Water Infrastructure Finance Authority | | | | | | | | |
(Water Quality Revenue) Series A 5.00% 10/1/26 | | | 1,000,000 | | | | 1,156,480 | |
Central Arizona Water Conservation District | | | | | | | | |
(Central Arizona Project) 5.00% 1/1/31 | | | 600,000 | | | | 691,110 | |
46
| | | | | | | | |
| | | Principal amount° | | | Value (US $) | |
| |
Municipal Bonds (continued) | | | | | | | | |
| |
Water & Sewer Revenue Bonds (continued) | | | | | | | | |
Guam Government Waterworks Authority Revenue | | | | | | | | |
5.00% 7/1/37 | | | 250,000 | | | $ | 276,840 | |
Mesa Utility System Revenue | | | | | | | | |
4.00% 7/1/31 | | | 850,000 | | | | 910,681 | |
Phoenix Civic Improvement Corporation | | | | | | | | |
(Junior Lien) | | | | | | | | |
5.00% 7/1/27 | | | 1,000,000 | | | | 1,178,140 | |
5.00% 7/1/31 | | | 1,000,000 | | | | 1,165,770 | |
| | | | | | | | |
| | | | | | | 5,379,021 | |
| | | | | | | | |
Total Municipal Bonds (cost $72,592,697) | | | | | | | 75,084,310 | |
| | | | | | | | |
| | | | | | | | |
| |
Short-Term Investment – 0.39% | | | | | | | | |
| |
Variable Rate Demand Note – 0.39%¤ | | | | | | | | |
Arizona Health Facilities Authority (Banner Health) Series B | | | | | | | | |
1.45% 1/1/46 (LOC - BK TOKYO-MITSUBISHI UFJ) | | | 300,000 | | | | 300,000 | |
| | | | | | | | |
Total Short-Term Investment (cost $300,000) | | | | | | | 300,000 | |
| | | | | | | | |
| | |
Total Value of Securities – 98.48%
(cost $72,892,697) | | | | | | $ | 75,384,310 | |
| | | | | | | | |
| # | Security exempt from registration under Rule 144A of the Securities Act of 1933, as amended. At Aug. 31, 2018, the aggregate value of Rule 144A securities was $3,208,014, which represents 4.19% of the Fund’s net assets. See Note 8 in “Notes to financial statements.” |
| ¤ | Tax-exempt obligations that contain a floating or variable interest rate adjustment formula and an unconditional right of demand to receive payment of the unpaid principal balance plus accrued interest upon a short notice period (generally up to 30 days) prior to specified dates either from the issuer or by drawing on a bank letter of credit, a guarantee, or insurance issued with respect to such instrument. Each rate shown is as of Aug. 31, 2018. |
| § | Pre-refunded bonds. Municipal bonds that are generally backed or secured by US Treasury bonds. For pre-refunded bonds, the stated maturity is followed by the year in which the bond will be pre-refunded. See Note 8 in “Notes to financial statements.” |
| ° | Principal amount shown is stated in US Dollars unless noted that the security is denominated in another currency. |
| ● | Variable rate investment. Rates reset periodically. Rate shown reflects the rate in effect at Aug. 31, 2018. For securities based on a published reference rate and spread, the reference rate and spread are indicated in their description above. The reference rate descriptions (i.e. LIBOR03M, LIBOR06M, etc.) used in this report are identical for different securities, but the underlying reference rates may differ due to the timing of the reset period. Certain variable rate securities are not based on a published reference rate and spread but are determined by the issuer or agent and are based on |
47
Schedules of investments
Delaware Tax-Free Arizona Fund
| | current market conditions, or for mortgage-backed securities, are impacted by the individual mortgages which are paying off over time. These securities do not indicate a reference rate and spread in their description above. |
Summary of abbreviations:
ACA – Insured by American Capital Access
AGM – Insured by Assured Guaranty Municipal Corporation
AMBAC – Insured by AMBAC Assurance Corporation
AMT – Subject to Alternative Minimum Tax
LOC – Letter of Credit
See accompanying notes, which are an integral part of the financial statements.
48
| | |
| Schedules of investments |
| Delaware Tax-Free California Fund | | August 31, 2018 |
| | | | | | | | |
| | | Principal amount° | | | Value (US $) | |
| |
Municipal Bonds – 99.70% | |
| |
Corporate Revenue Bonds – 5.81% | | | | | | | | |
Chula Vista Industrial Development Revenue | | | | | | | | |
(San Diego Gas & Electric) Series D 5.875% 1/1/34
| | | 1,000,000 | | | $ | 1,030,120 | |
Golden State Tobacco Securitization Settlement Revenue (Asset-Backed) | | | | | | | | |
Series A-1 5.00% 6/1/29 | | | 1,000,000 | | | | 1,148,550 | |
Series A-1 5.00% 6/1/47 | | | 1,000,000 | | | | 1,028,050 | |
Series A-1 5.25% 6/1/47 | | | 1,500,000 | | | | 1,564,950 | |
(Capital Appreciation Asset-Backed) Subordinate Series B 1.548% 6/1/47 ^ | | | 1,615,000 | | | | 286,711 | |
M-S-R Energy Authority Revenue | | | | | | | | |
Series B 6.50% 11/1/39 | | | 500,000 | | | | 702,295 | |
| | | | | | | | |
| | | | | | | 5,760,676 | |
| | | | | | | | |
Education Revenue Bonds – 19.24% | | | | | | | | |
California Educational Facilities Authority | | | | | | | | |
(Loma Linda University) Series A 5.00% 4/1/47 | | | 1,000,000 | | | | 1,118,880 | |
California Municipal Finance Authority | | | | | | | | |
(Bella Mente Montessori Academy Project) Series A 144A 5.00% 6/1/48 # | | | 500,000 | | | | 527,580 | |
(Biola University) 5.00% 10/1/39 | | | 1,000,000 | | | | 1,130,650 | |
(California Baptist University) Series A 144A 5.375% 11/1/40 # | | | 1,000,000 | | | | 1,117,060 | |
(Creative Center of Los Altos Project – Pinewood School & Oakwood School) Series B 144A 4.50% 11/1/46 # | | | 500,000 | | | | 500,990 | |
(Julian Charter School Project) Series A 144A 5.625% 3/1/45 # | | | 500,000 | | | | 504,180 | |
(Palmdale Aerospace Academy Project) Series A 144A 5.00% 7/1/46 # | | | 500,000 | | | | 512,985 | |
(Southwestern Law School) 6.50% 11/1/41 | | | 1,140,000 | | | | 1,274,908 | |
California Public Finance Authority University Housing Revenue | | | | | | | | |
(NCCD – Claremont Properties LLC – Claremont Colleges Project) Series A 144A 5.00% 7/1/32 # | | | 500,000 | | | | 531,845 | |
California School Finance Authority | | | | | | | | |
(Aspire Public Schools – Obligated Group) Series A 144A 5.00% 8/1/45 # | | | 715,000 | | | | 763,527 | |
(Encore Education Obligated Group) Series A 144A 5.00% 6/1/42 # | | | 500,000 | | | | 452,915 | |
(Escuela Popular Project) 144A 6.50% 7/1/50 # | | | 250,000 | | | | 250,967 | |
(Green Dot Public Schools Project) Series A 144A 5.00% 8/1/35 # | | | 1,000,000 | | | | 1,074,770 | |
(Grimmway Schools – Obligated Group) Series A 144A 5.00% 7/1/36 # | | | 500,000 | | | | 514,970 | |
49
Schedules of investments
Delaware Tax-Free California Fund
| | | | | | | | |
| | | Principal amount° | | | Value (US $) | |
| |
Municipal Bonds (continued) | | | | | | | | |
| |
Education Revenue Bonds (continued) | | | | | | | | |
California School Finance Authority | | | | | | | | |
(ICEF - View Park Elementary & Middle Schools) Series A 5.625% 10/1/34 | | | 575,000 | | | $ | 609,017 | |
(KIPP LA Projects) Series A 5.125% 7/1/44 | | | 1,000,000 | | | | 1,083,780 | |
(Partnerships to Uplift Communities Valley Project) Series A 144A 6.75% 8/1/44 # | | | 1,000,000 | | | | 1,075,570 | |
California State University Systemwide Revenue Series A 5.00% 11/1/47 | | | 1,000,000 | | | | 1,150,610 | |
California Statewide Communities Development Authority Charter School Revenue | | | | | | | | |
(Green Dot Public Schools - Animo Inglewood Charter High School Project) Series A 7.25% 8/1/41 | | | 800,000 | | | | 892,952 | |
California Statewide Communities Development Authority Revenue | | | | | | | | |
(California Baptist University) Series A 6.125% 11/1/33 | | | 750,000 | | | | 866,573 | |
(Culinary Institute of America Project) Series B 5.00% 7/1/46 | | | 425,000 | | | | 464,925 | |
California Statewide Communities Development Authority Student Housing Revenue | | | | | | | | |
(University of California Irvine East Campus Apartments) | | | | | | | | |
5.00% 5/15/24 | | | 40,000 | | | | 45,412 | |
5.375% 5/15/38 | | | 1,000,000 | | | | 1,061,520 | |
Mt. San Antonio Community College District Convertible | | | | | | | | |
Capital Appreciation Election 2008 | | | | | | | | |
Series A 0.00% 8/1/28 ~ | | | 1,000,000 | | | | 971,030 | |
University of California General Revenue | | | | | | | | |
Series AZ 5.25% 5/15/58 | | | 490,000 | | | | 576,260 | |
| | | | | | | | |
| | | | | | | 19,073,876 | |
| | | | | | | | |
Electric Revenue Bond – 0.58% | | | | | | | | |
Imperial Irrigation District Electric System Revenue | | | | | | | | |
Series C 5.00% 11/1/36 | | | 500,000 | | | | 573,080 | |
| | | | | | | | |
| | | | | | | 573,080 | |
| | | | | | | | |
Healthcare Revenue Bonds – 21.37% | | | | | | | | |
Abag Finance Authority for Nonprofit Corporations | | | | | | | | |
(Episcopal Senior Communities) 6.125% 7/1/41 | | | 850,000 | | | | 926,381 | |
(Sharp HealthCare) Series A 5.00% 8/1/28 | | | 250,000 | | | | 273,185 | |
California Health Facilities Financing Authority Revenue | | | | | | | | |
(Cedars-Sinai Medical Center) Series B 4.00% 8/15/36 | | | 1,000,000 | | | | 1,048,550 | |
(Children’s Hospital Los Angeles) | | | | | | | | |
Series A 5.00% 11/15/34 | | | 500,000 | | | | 536,260 | |
Series A 5.00% 8/15/47 | | | 500,000 | | | | 557,160 | |
(Dignity Health) Series E 5.625% 7/1/25 | | | 1,000,000 | | | | 1,030,220 | |
50
| | | | | | | | |
| | | Principal amount° | | | Value (US $) | |
| |
Municipal Bonds (continued) | | | | | | | | |
| |
Healthcare Revenue Bonds (continued) | | | | | | | | |
California Health Facilities Financing Authority Revenue | | | | | | | | |
(Kaiser Permanente) Subordinate Series A-2 4.00% 11/1/44 | | | 1,005,000 | | | $ | 1,036,868 | |
(Lucile Salter Packard Children’s Hospital at Stanford) | | | | | | | | |
Series A 5.00% 8/15/33 | | | 1,000,000 | | | | 1,151,870 | |
Series A 5.00% 11/15/56 | | | 1,000,000 | | | | 1,128,750 | |
(St. Joseph Health System) Series A 5.75% 7/1/39 | | | 1,000,000 | | | | 1,034,070 | |
(Sutter Health) Series D 5.25% 8/15/31 | | | 1,000,000 | | | | 1,093,970 | |
California Municipal Finance Authority Revenue | | | | | | | | |
(Community Medical Centers) | | | | | | | | |
Series A 5.00% 2/1/42 | | | 750,000 | | | | 830,707 | |
Series A 5.00% 2/1/47 | | | 250,000 | | | | 275,945 | |
(Northbay Healthcare Group) Series A 5.25% 11/1/47 | | | 500,000 | | | | 544,190 | |
California Statewide Communities Development Authority Revenue | | | | | | | | |
(Adventist Health System/West) Series A 4.00% 3/1/48 | | | 1,000,000 | | | | 1,021,270 | |
(BE.Group) 144A 7.25% 11/15/41 # | | | 500,000 | | | | 528,970 | |
(Covenant Retirement Communities) Series C 5.625% 12/1/36 | | | 1,000,000 | | | | 1,128,920 | |
(Episcopal Communities & Services) 5.00% 5/15/32 | | | 600,000 | | | | 645,126 | |
(Huntington Memorial Hospital) 4.00% 7/1/48 | | | 500,000 | | | | 512,240 | |
(Loma Linda University Medical Center) | | | | | | | | |
Series A 144A 5.25% 12/1/48 # | | | 100,000 | | | | 110,334 | |
Series A 144A 5.25% 12/1/56 # | | | 725,000 | | | | 782,761 | |
Series A 144A 5.50% 12/1/58 # | | | 400,000 | | | | 441,524 | |
(Marin General Hospital - Green Bonds) Series A 4.00% 8/1/45 | | | 500,000 | | | | 508,230 | |
(Rady Children’s Hospital - San Diego) Series B 5.00% 8/15/28 | | | 600,000 | | | | 726,636 | |
(Redlands Community Hospital) 5.00% 10/1/46 | | | 1,000,000 | | | | 1,097,290 | |
La Verne | | | | | | | | |
(Brethren Hillcrest Homes) 5.00% 5/15/36 | | | 750,000 | | | | 786,173 | |
Palomar Health | | | | | | | | |
5.00% 11/1/47 (AGM) | | | 500,000 | | | | 561,630 | |
San Buenaventura | | | | | | | | |
(Community Memorial Health Systems) 7.50% 12/1/41 | | | 785,000 | | | | 871,656 | |
| | | | | | | | |
| | | | | | | 21,190,886 | |
| | | | | | | | |
Housing Revenue Bonds – 4.21% | | | | | | | | |
California Municipal Finance Authority Mobile Home Park Revenue | | | | | | | | |
(Caritas Projects) | | | | | | | | |
Series A 4.00% 8/15/42 | | | 1,270,000 | | | | 1,281,405 | |
Series A 5.50% 8/15/47 | | | 750,000 | | | | 807,397 | |
51
Schedules of investments
Delaware Tax-Free California Fund
| | | | | | | | |
| | | Principal amount° | | | Value (US $) | |
| |
Municipal Bonds (continued) | | | | | | | | |
| |
Housing Revenue Bonds (continued) | | | | | | | | |
Independent Cities Finance Authority Mobile Home Park Revenue | | | | | | | | |
(Pillar Ridge) Series A 5.25% 5/15/44 | | | 1,000,000 | | | $ | 1,085,820 | |
Santa Clara County Multifamily Housing Authority Revenue | | | | | | | | |
(RiverTown Apartments Project) Series A 5.85% 8/1/31 (AMT) | | | 1,000,000 | | | | 1,000,850 | |
| | | | | | | | |
| | | | | | | 4,175,472 | |
| | | | | | | | |
Lease Revenue Bonds – 10.70% | | | | | | | | |
Abag Finance Authority for Nonprofit Corporations | | | | | | | | |
(Jackson Laboratory) 5.00% 7/1/37 | | | 1,000,000 | | | | 1,084,090 | |
California Infrastructure & Economic Development Bank | | | | | | | | |
(Academy of Motion Picture Arts & Sciences Obligated Group) Series A 5.00% 11/1/41 | | | 1,000,000 | | | | 1,114,560 | |
(Infrastructure State Revolving Fund) Series A 5.00% 10/1/29 | | | 1,000,000 | | | | 1,178,860 | |
California Municipal Finance Authority | | | | | | | | |
(Goodwill Industry of Sacramento Valley & Northern Nevada Project) 5.00% 1/1/35 | | | 635,000 | | | | 625,215 | |
California State Public Works Board Lease Revenue | | | | | | | | |
(Department of Corrections and Rehabilitation) Series C 5.00% 10/1/26 | | | 1,000,000 | | | | 1,097,420 | |
California Statewide Communities Development Authority Revenue | | | | | | | | |
(Lancer Plaza Project) 5.625% 11/1/33 | | | 1,000,000 | | | | 1,121,430 | |
Golden State Tobacco Securitization Settlement Revenue | | | | | | | | |
(Enhanced Asset-Backed) Series A 5.00% 6/1/29 | | | 1,000,000 | | | | 1,112,920 | |
San Diego County | | | | | | | | |
(Sanford Burnham Prebys Medical Discovery Institute) | | | | | | | | |
Series A 5.00% 11/1/28 | | | 500,000 | | | | 571,560 | |
Series A 5.00% 11/1/30 | | | 475,000 | | | | 539,353 | |
San Jose Financing Authority Lease Revenue | | | | | | | | |
(Civic Center Project) Series A 5.00% 6/1/33 | | | 1,000,000 | | | | 1,117,670 | |
San Mateo Joint Powers Financing Authority Lease Revenue | | | | | | | | |
(Capital Projects) Series A 5.25% 7/15/26 | | | 1,000,000 | | | | 1,047,270 | |
| | | | | | | | |
| | | | | | | 10,610,348 | |
| | | | | | | | |
Local General Obligation Bonds – 2.94% | | | | | | | | |
Anaheim School District Capital Appreciation Election 2002 | | | | | | | | |
4.58% 8/1/25 (NATL) ^ | | | 1,000,000 | | | | 823,610 | |
Marin Healthcare District Election 2013 | | | | | | | | |
Series A 4.00% 8/1/47 | | | 1,000,000 | | | | 1,043,400 | |
52
| | | | | | | | |
| | | Principal amount° | | | Value (US $) | |
| |
Municipal Bonds (continued) | | | | | | | | |
| |
Local General Obligation Bonds (continued) | | | | | | | | |
West Contra Costa Unified School District 2012 Election | | | | | | | | |
Series C 4.00% 8/1/41 | | | 1,000,000 | | | $ | 1,042,890 | |
| | | | | | | | |
| | | | | | | 2,909,900 | |
| | | | | | | | |
Pre-Refunded Bonds – 10.05% | | | | | | | | |
Abag Finance Authority for Nonprofit Corporations | | | | | | | | |
(Sharp HealthCare) Series B 6.25% 8/1/39-19 § | | | 1,000,000 | | | | 1,043,660 | |
Anaheim Public Financing Authority Revenue | | | | | | | | |
(Anaheim Electric System Distribution Facilities) Series A 5.00% 10/1/25-21 § | | | 800,000 | | | | 869,744 | |
California | | | | | | | | |
(Various Purpose) 6.00% 4/1/38-19 § | | | 185,000 | | | | 189,939 | |
California Department of Water Resources | | | | | | | | |
(Central Valley Project) Unrefunded Series AG 5.00% 12/1/28-19 § | | | 75,000 | | | | 78,293 | |
California Health Facilities Financing Authority Revenue | | | | | | | | |
(Dignity Health) Series A 6.00% 7/1/39-19 § | | | 855,000 | | | | 886,592 | |
California Municipal Finance Authority Mobile Home Park Revenue | | | | | | | | |
(Caritas Projects) Series A 6.40% 8/15/45-20 § | | | 950,000 | | | | 1,026,494 | |
Imperial Irrigation District Electric System Revenue | | | | | | | | |
Series B 5.00% 11/1/36-20 § | | | 250,000 | | | | 268,597 | |
Lancaster Redevelopment Agency | | | | | | | | |
(Combined Redevelopment Project Areas) 6.875% 8/1/39-19 § | | | 285,000 | | | | 298,774 | |
Unrefunded 6.875% 8/1/39-19 § | | | 215,000 | | | | 225,391 | |
Pittsburg Unified School District Financing Authority Revenue | | | | | | | | |
(Pittsburg Unified School District Bond Program) 5.50% 9/1/46-21 (AGM) § | | | 800,000 | | | | 890,952 | |
Rancho Santa Fe Community Services District Financing Authority Revenue | | | | | | | | |
(Superior Lien Bonds) Series A 5.75% 9/1/30-21 § | | | 800,000 | | | | 894,280 | |
Riverside County Redevelopment Agency Tax Allocation Housing | | | | | | | | |
Series A 6.00% 10/1/39-20 § | | | 1,000,000 | | | | 1,091,890 | |
San Diego Public Facilities Financing Authority Lease Revenue | | | | | | | | |
(Master Refunding Project) Series A 5.25% 3/1/40-20 § | | | 1,000,000 | | | | 1,073,620 | |
San Francisco City & County Public Utilities Commission Water Revenue | | | | | | | | |
(Water System Improvement Program) Subordinate Series A 5.00% 11/1/32-21 § | | | 1,015,000 | | | | 1,120,763 | |
| | | | | | | | |
| | | | | | | 9,958,989 | |
| | | | | | | | |
53
Schedules of investments
Delaware Tax-Free California Fund
| | | | | | | | |
| | | Principal amount° | | | Value (US $) | |
| |
Municipal Bonds (continued) | | | | | | | | |
| |
Resource Recovery Revenue Bond – 1.05% | | | | | | | | |
South Bayside Waste Management Authority Revenue | | | | | | | | |
(Shoreway Environmental Center) Series A 6.00% 9/1/36 | | | 1,000,000 | | | $ | 1,040,280 | |
| | | | | | | | |
| | | | | | | 1,040,280 | |
| | | | | | | | |
Special Tax Revenue Bonds – 1.11% | | | | | | | | |
San Francisco City & County Redevelopment Successor Agency | | | | | | | | |
(Mission Bay South Redevelopment Project) Series B 5.00% 8/1/43 (NATL) | | | 500,000 | | | | 564,275 | |
Yucaipa Special Tax Community Facilities District No. 98-1 | | | | | | | | |
(Chapman Heights) 5.375% 9/1/30 | | | 500,000 | | | | 533,555 | |
| | | | | | | | |
| | | | | | | 1,097,830 | |
| | | | | | | | |
State General Obligation Bonds – 8.50% | | | | | | | | |
California | | | | | | | | |
(Various Purpose) | | | | | | | | |
5.00% 9/1/26 | | | 500,000 | | | | 601,645 | |
5.00% 8/1/27 | | | 750,000 | | | | 894,405 | |
5.00% 8/1/46 | | | 1,000,000 | | | | 1,142,830 | |
5.00% 11/1/47 | | | 1,000,000 | | | | 1,154,710 | |
5.25% 3/1/30 | | | 1,000,000 | | | | 1,053,030 | |
5.25% 4/1/35 | | | 1,000,000 | | | | 1,108,570 | |
5.25% 11/1/40 | | | 1,000,000 | | | | 1,073,260 | |
6.00% 3/1/33 | | | 1,000,000 | | | | 1,065,090 | |
Unrefunded 6.00% 4/1/38 | | | 330,000 | | | | 338,174 | |
| | | | | | | | |
| | | | | | | 8,431,714 | |
| | | | | | | | |
Transportation Revenue Bonds – 11.96% | | | | | | | | |
Alameda Corridor Transportation Authority | | | | | | | | |
(2nd Subordinate Lien) Series B 5.00% 10/1/37 | | | 500,000 | | | | 558,665 | |
California Municipal Finance Authority Senior Lien | | | | | | | | |
(LINXS APM Project) Series A 5.00% 12/31/47 (AMT) | | | 1,000,000 | | | | 1,114,890 | |
Long Beach Marina Revenue | | | | | | | | |
(Alamitos Bay Marina Project) 5.00% 5/15/45 | | | 500,000 | | | | 548,770 | |
Los Angeles Department of Airports | | | | | | | | |
(Los Angeles International Airport) | | | | | | | | |
Senior Series D 5.00% 5/15/36 (AMT) | | | 1,000,000 | | | | 1,125,610 | |
Subordinate Series B 5.00% 5/15/33 | | | 1,000,000 | | | | 1,055,210 | |
Riverside County Transportation Commission Senior Lien | | | | | | | | |
(Current Interest Obligations) Series A 5.75% 6/1/44 | | | 500,000 | | | | 554,000 | |
Sacramento County Airport System Revenue | | | | | | | | |
Series C 5.00% 7/1/39 (AMT) | | | 1,000,000 | | | | 1,141,580 | |
Subordinate Series B 5.00% 7/1/41 | | | 500,000 | | | | 566,630 | |
54
| | | | | | | | |
| | | Principal amount° | | | Value (US $) | |
| |
Municipal Bonds (continued) | | | | | | | | |
| |
Transportation Revenue Bonds (continued) | | | | | | | | |
San Diego Association of Governments South Bay Expressway Revenue | | | | | | | | |
(1st Senior Lien) Series A 5.00% 7/1/42 | | | 1,000,000 | | | $ | 1,148,130 | |
San Diego County Regional Airport Authority Revenue | | | | | | | | |
Subordinate Series A 5.00% 7/1/47 | | | 375,000 | | | | 426,510 | |
San Diego Redevelopment Agency | | | | | | | | |
(Centre City Redevelopment Project) Series A 6.40% 9/1/25 | | | 870,000 | | | | 873,228 | |
San Francisco City & County Airports Commission | | | | | | | | |
(San Francisco International Airport) Second Series B 5.00% 5/1/46 (AMT) | | | 1,000,000 | | | | 1,107,720 | |
San Francisco Municipal Transportation Agency Revenue | | | | | | | | |
Series B 5.00% 3/1/37 | | | 1,500,000 | | | | 1,636,080 | |
| | | | | | | | |
| | | | | | | 11,857,023 | |
| | | | | | | | |
Water & Sewer Revenue Bonds – 2.18% | | | | | | | | |
San Diego Public Facilities Financing Authority Water Revenue | | | | | | | | |
Subordinate Series A 5.00% 8/1/29 | | | 1,000,000 | | | | 1,116,140 | |
San Francisco City & County Public Utilities Commission Water Revenue | | | | | | | | |
Subordinate Series A 4.00% 11/1/39 | | | 1,000,000 | | | | 1,048,200 | |
| | | | | | | | |
| | | | | | | 2,164,340 | |
| | | | | | | | |
Total Municipal Bonds (cost $94,779,545) | | | | | | | 98,844,414 | |
| | | | | | | | |
| | | | | | | | |
| |
Short-Term Investment – 0.33% | | | | | | | | |
| |
Variable Rate Demand Note – 0.33%¤ | | | | | | | | |
California Municipal Finance Authority | | | | | | | | |
(Chevron USA – Recovery Zone Project) | | | | | | | | |
Series A 1.29% 11/1/35 | | | 325,000 | | | | 325,000 | |
| | | | | | | | |
Total Short-Term Investment (cost $325,000) | | | | | | | 325,000 | |
| | | | | | | | |
| | |
Total Value of Securities – 100.03%
(cost $95,104,545) | | | | | | $ | 99,169,414 | |
| | | | | | | | |
| # | Security exempt from registration under Rule 144A of the Securities Act of 1933, as amended. At Aug. 31, 2018, the aggregate value of Rule 144A securities was $9,690,948, which represents 9.78% of the Fund’s net assets. See Note 8 in “Notes to financial statements.” |
| ¤ | Tax-exempt obligations that contain a floating or variable interest rate adjustment formula and an unconditional right of demand to receive payment of the unpaid principal balance plus accrued interest upon a short notice period (generally up to 30 days) prior to specified dates either from the issuer or by drawing on a bank letter of credit, a guarantee, or insurance issued with respect to such instrument. Each rate shown is as of Aug. 31, 2018. |
55
Schedules of investments
Delaware Tax-Free California Fund
| § | Pre-refunded bonds. Municipal bonds that are generally backed or secured by US Treasury bonds. For pre-refunded bonds, the stated maturity is followed by the year in which the bond will be pre-refunded. See Note 8 in “Notes to financial statements.” |
| ° | Principal amount shown is stated in US Dollars unless noted that the security is denominated in another currency. |
| ^ | Zero coupon security. The rate shown is the effective yield at the time of purchase. |
| ~ | Step-up bond that pays an initial coupon rate for the first period and then a higher coupon rate for the following periods. Stated rate in effect at Aug. 31, 2018. |
Summary of abbreviations:
AGM – Insured by Assured Guaranty Municipal Corporation
AMT – Subject to Alternative Minimum Tax
ICEF – Inner City Education Foundation
NATL – Insured by National Public Finance Guarantee Corporation
See accompanying notes, which are an integral part of the financial statements.
56
| | |
| Schedules of investments |
| Delaware Tax-Free Colorado Fund | | August 31, 2018 |
| | | | | | | | |
| | | Principal amount° | | | Value (US $) | |
| |
Municipal Bonds – 98.84% | | | | | | | | |
| |
Corporate Revenue Bonds – 1.41% | | | | | | | | |
Denver City & County | | | | | | | | |
(United Airlines Project) 5.00% 10/1/32 (AMT) | | | 415,000 | | | $ | 444,888 | |
Public Authority for Colorado Energy Natural Gas Revenue | | | | | | | | |
Series 2008 6.50% 11/15/38 | | | 1,750,000 | | | | 2,408,857 | |
| | | | | | | | |
| | | | | | | 2,853,745 | |
| | | | | | | | |
Education Revenue Bonds – 11.15% | | | | | | | | |
Colorado Educational & Cultural Facilities Authority Revenue | | | | | | | | |
144A 5.00% 7/1/36 # | | | 500,000 | | | | 505,435 | |
5.00% 11/1/44 | | | 890,000 | | | | 894,156 | |
144A 5.25% 7/1/46 # | | | 1,350,000 | | | | 1,362,987 | |
(Academy Charter School Project) 5.50% 5/1/36 (SGI) | | | 2,280,000 | | | | 2,284,606 | |
7.45% 8/1/48 | | | 1,000,000 | | | | 1,143,630 | |
(Alexander Dawson School-Nevada Project) 5.00% 5/15/29 | | | 1,490,000 | | | | 1,698,823 | |
(Atlas Preparatory Charter School) 144A 5.25% 4/1/45 # | | | 1,300,000 | | | | 1,281,618 | |
(Charter School Project) 5.00% 7/15/37 | | | 1,150,000 | | | | 1,231,052 | |
(Johnson & Wales University) Series A 5.25% 4/1/37 | | | 1,790,000 | | | | 1,948,057 | |
(Liberty Common Charter School Project) Series A 5.00% 1/15/39 | | | 1,000,000 | | | | 1,067,160 | |
(Littleton Preparatory Charter School Project) | | | | | | | | |
5.00% 12/1/33 | | | 450,000 | | | | 458,739 | |
5.00% 12/1/42 | | | 540,000 | | | | 541,183 | |
(Loveland Classical Schools Project) | | | | | | | | |
144A 5.00% 7/1/36 # | | | 625,000 | | | | 640,400 | |
144A 5.00% 7/1/46 # | | | 500,000 | | | | 507,730 | |
(Pinnacle Charter School Project) 5.00% 6/1/26 | | | 700,000 | | | | 767,221 | |
(Skyview Charter School) | | | | | | | | |
144A 5.375% 7/1/44 # | | | 860,000 | | | | 883,039 | |
144A 5.50% 7/1/49 # | | | 870,000 | | | | 896,544 | |
(University of Denver Project) | | | | | | | | |
Series A 4.00% 3/1/35 | | | 400,000 | | | | 421,188 | |
Series A 4.00% 3/1/36 | | | 550,000 | | | | 576,637 | |
(University of Lab Charter School) 5.00% 12/15/45 | | | 500,000 | | | | 523,870 | |
(Vail Mountain School Project) 4.00% 5/1/46 | | | 80,000 | | | | 78,276 | |
(Windsor Charter Academy Project) 144A 5.00% 9/1/46 # | | | 890,000 | | | | 891,460 | |
(Woodrow Wilson Charter School Project) | | | | | | | | |
5.25% 12/1/34 (SGI) | | | 1,960,000 | | | | 1,962,195 | |
| | | | | | | | |
| | | | | | | 22,566,006 | |
| | | | | | | | |
57
Schedules of investments
Delaware Tax-Free Colorado Fund
| | | | | | | | |
| | | Principal amount° | | | Value (US $) | |
| |
Municipal Bonds (continued) | | | | | | | | |
| |
Electric Revenue Bonds – 3.74% | | | | | | | | |
Colorado Springs Utilities System Revenue | | | | | | | | |
Series A 5.00% 11/15/40 | | | 1,500,000 | | | $ | 1,700,040 | |
Series A 5.00% 11/15/45 | | | 750,000 | | | | 845,865 | |
Fort Collins City Electric Utility Enterprise Revenue | | | | | | | | |
Series A 5.00% 12/1/42 | | | 1,000,000 | | | | 1,151,350 | |
Platte River Power Authority Revenue | | | | | | | | |
Series JJ 5.00% 6/1/27 | | | 3,300,000 | | | | 3,872,022 | |
| | | | | | | | |
| | | | | | | 7,569,277 | |
| | | | | | | | |
Healthcare Revenue Bonds – 24.16% | | | | | | | | |
Colorado Health Facilities Authority Revenue | | | | | | | | |
(American Baptist) | | | | | | | | |
7.625% 8/1/33 | | | 150,000 | | | | 169,121 | |
8.00% 8/1/43 | | | 1,000,000 | | | | 1,141,520 | |
(Catholic Health Initiatives) | | | | | | | | |
Series A 5.00% 7/1/39 | | | 1,540,000 | | | | 1,565,148 | |
Series A 5.00% 2/1/41 | | | 2,250,000 | | | | 2,324,520 | |
Series A 5.25% 2/1/33 | | | 1,000,000 | | | | 1,048,020 | |
Series A 5.25% 1/1/45 | | | 3,000,000 | | | | 3,210,000 | |
Series D 6.25% 10/1/33 | | | 2,000,000 | | | | 2,006,960 | |
(Christian Living Community Project) | | | | | | | | |
5.25% 1/1/37 | | | 1,500,000 | | | | 1,547,805 | |
6.375% 1/1/41 | | | 1,000,000 | | | | 1,073,130 | |
(Covenant Retirement Communities) | | | | | | | | |
Series A 5.00% 12/1/33 | | | 4,000,000 | | | | 4,268,360 | |
Series A 5.00% 12/1/35 | | | 1,000,000 | | | | 1,081,810 | |
(Craig Hospital Project) 5.00% 12/1/32 | | | 3,500,000 | | | | 3,798,305 | |
(Evangelical Lutheran) | | | | | | | | |
5.00% 12/1/42 | | | 2,500,000 | | | | 2,639,200 | |
5.625% 6/1/43 | | | 1,150,000 | | | | 1,262,113 | |
(Frasier Meadows Retirement Community Project) | | | | | | | | |
Series A 5.25% 5/15/37 | | | 485,000 | | | | 529,867 | |
Series B 5.00% 5/15/48 | | | 660,000 | | | | 694,881 | |
(Mental Health Center Denver Project) | | | | | | | | |
Series A 5.75% 2/1/44 | | | 2,000,000 | | | | 2,213,580 | |
(National Jewish Health Project) 5.00% 1/1/27 | | | 300,000 | | | | 308,007 | |
(NCMC Project) 4.00% 5/15/32 | | | 2,000,000 | | | | 2,094,380 | |
(SCL Health Systems) Series A 5.00% 1/1/44 | | | 3,050,000 | | | | 3,313,459 | |
(Sisters of Charity of Leavenworth Health System) | | | | | | | | |
Series B 5.25% 1/1/25 | | | 2,500,000 | | | | 2,609,450 | |
(Sunny Vista Living Center) | | | | | | | | |
Series A 144A 6.25% 12/1/50 # | | | 935,000 | | | | 990,614 | |
(Vail Valley Medical Center Project) 5.00% 1/15/35 | | | 1,000,000 | | | | 1,117,880 | |
58
| | | | | | | | |
| | | Principal amount° | | | Value (US $) | |
| |
Municipal Bonds (continued) | | | | | | | | |
| |
Healthcare Revenue Bonds (continued) | | | | | | | | |
Colorado Health Facilities Authority Revenue | | | | | | | | |
(Valley View Hospital Association Project) Series A 4.00% 5/15/35 | | | 685,000 | | | $ | 700,638 | |
Denver Health & Hospital Authority Health Care Revenue | | | | | | | | |
(Recovery Zone Facilities) 5.625% 12/1/40 | | | 2,500,000 | | | | 2,608,350 | |
Puerto Rico Industrial Tourist Educational Medical & Environmental Control Facilities Financing Authority | | | | | | | | |
(Auxilio Mutuo) Series A 6.00% 7/1/33 | | | 1,945,000 | | | | 2,022,936 | |
University of Colorado Hospital Authority Revenue | | | | | | | | |
Series A 6.00% 11/15/29 | | | 2,460,000 | | | | 2,576,383 | |
| | | | | | | | |
| | | | | | | 48,916,437 | |
| | | | | | | | |
Housing Revenue Bonds – 0.09% | | | | | | | | |
Colorado Housing & Finance Authority | | | | | | | | |
(Single Family Program Class 1) | | | | | | | | |
Series AA 4.50% 5/1/23 (GNMA) | | | 95,000 | | | | 95,423 | |
Series AA 4.50% 11/1/23 (GNMA) | | | 95,000 | | | | 95,286 | |
| | | | | | | | |
| | | | | | | 190,709 | |
| | | | | | | | |
Lease Revenue Bonds – 3.35% | | | | | | | | |
Aurora Certificates of Participation | | | | | | | | |
Series A 5.00% 12/1/30 | | | 2,370,000 | | | | 2,457,690 | |
Colorado Department of Transportation Certificates of Participation | | | | | | | | |
5.00% 6/15/34 | | | 660,000 | | | | 748,486 | |
5.00% 6/15/36 | | | 1,055,000 | | | | 1,186,337 | |
Denver Health & Hospital Authority | | | | | | | | |
4.00% 12/1/38 | | | 750,000 | | | | 747,900 | |
Regional Transportation District Certificates of Participation | | | | | | | | |
Series A 5.00% 6/1/33 | | | 1,500,000 | | | | 1,647,540 | |
| | | | | | | | |
| | | | | | | 6,787,953 | |
| | | | | | | | |
Local General Obligation Bonds – 14.02% | | | | | | | | |
Adams & Weld Counties School District No. 27J Brighton | | | | | | | | |
4.00% 12/1/30 | | | 300,000 | | | | 321,804 | |
4.00% 12/1/31 | | | 1,000,000 | | | | 1,069,300 | |
5.00% 12/1/32 | | | 500,000 | | | | 586,315 | |
Arapahoe County School District No. 1 Englewood | | | | | | | | |
4.00% 12/1/30 | | | 1,500,000 | | | | 1,603,950 | |
Beacon Point Metropolitan District | | | | | | | | |
5.00% 12/1/30 (AGM) | | | 1,130,000 | | | | 1,283,104 | |
Central Colorado Water Conservancy District | | | | | | | | |
(Limited Tax) 5.00% 12/1/33 | | | 1,000,000 | | | | 1,110,590 | |
59
Schedules of investments
Delaware Tax-Free Colorado Fund
| | | | | | | | |
| | | Principal amount° | | | Value (US $) | |
| |
Municipal Bonds (continued) | | | | | | | | |
| |
Local General Obligation Bonds (continued) | | | | | | | | |
Commerce City Northern Infrastructure General Improvement District | | | | | | | | |
5.00% 12/1/32 (AGM) | | | 2,125,000 | | | $ | 2,343,641 | |
Denver City & County | | | | | | | | |
(Better Denver & Zoo) Series A 5.00% 8/1/25 | | | 3,215,000 | | | | 3,309,007 | |
Denver International Business Center Metropolitan District No. 1 | | | | | | | | |
5.00% 12/1/30 | | | 350,000 | | | | 358,383 | |
Douglas County School District No. 1 | | | | | | | | |
(Douglas & Elbert Counties) 5.00% 12/15/22 | | | 1,175,000 | | | | 1,289,398 | |
Eaton Area Park & Recreation District | | | | | | | | |
5.25% 12/1/34 | | | 360,000 | | | | 378,796 | |
5.50% 12/1/38 | | | 455,000 | | | | 483,160 | |
Garfield Pitkin & Eagle Counties School District No. RE-1 Roaring Fork | | | | | | | | |
Series 1 4.00% 12/15/31 | | | 1,300,000 | | | | 1,386,138 | |
Grand River Hospital District | | | | | | | | |
5.25% 12/1/35 (AGM) | | | 1,000,000 | | | | 1,155,040 | |
5.25% 12/1/37 (AGM) | | | 325,000 | | | | 373,269 | |
Jefferson County School District No. R-1 | | | | | | | | |
5.25% 12/15/24 | | | 1,250,000 | | | | 1,469,963 | |
Leyden Rock Metropolitan District No 10 | | | | | | | | |
Series A 5.00% 12/1/45 | | | 1,000,000 | | | | 1,026,320 | |
Rangely Hospital District | | | | | | | | |
6.00% 11/1/26 | | | 2,250,000 | | | | 2,459,497 | |
Sierra Ridge Metropolitan District No. 2 | | | | | | | | |
Series A 5.50% 12/1/46 | | | 1,000,000 | | | | 1,023,740 | |
Weld County Reorganized School District No. RE-8 | | | | | | | | |
5.00% 12/1/31 | | | 990,000 | | | | 1,150,796 | |
5.00% 12/1/32 | | | 660,000 | | | | 765,620 | |
Weld County School District No. RE-1 | | | | | | | | |
5.00% 12/15/31 (AGM) | | | 1,000,000 | | | | 1,151,130 | |
Weld County School District No. RE-3J | | | | | | | | |
5.00% 12/15/34 (BAM) | | | 2,000,000 | | | | 2,291,180 | |
| | | | | | | | |
| | | | | | | 28,390,141 | |
| | | | | | | | |
Pre-Refunded Bonds – 7.21% | | | | | | | | |
Adams & Arapahoe Counties Joint School District No. 28J | | | | | | | | |
(Aurora) 6.00% 12/1/28-18 § | | | 2,500,000 | | | | 2,526,700 | |
Colorado Building Excellent Schools Today Certificates of Participation | | | | | | | | |
Series G 5.00% 3/15/32-21 § | | | 2,000,000 | | | | 2,156,940 | |
60
| | | | | | | | |
| | | Principal amount° | | | Value (US $) | |
| |
Municipal Bonds (continued) | | | | | | | | |
| |
Pre-Refunded Bonds (continued) | | | | | | | | |
Colorado Health Facilities Authority Revenue | | | | | | | | |
(Total Long-Term Care) | | | | | | | | |
Series A 6.00% 11/15/30-20 § | | | 2,365,000 | | | $ | 2,573,971 | |
Series A 6.25% 11/15/40-20 § | | | 750,000 | | | | 820,283 | |
Platte River Power Authority Revenue | | | | | | | | |
Series HH 5.00% 6/1/27-19 § | | | 1,795,000 | | | | 1,838,672 | |
Series HH 5.00% 6/1/29-19 § | | | 2,355,000 | | | | 2,412,297 | |
University of Colorado | | | | | | | | |
Series A 5.00% 6/1/33-23 § | | | 2,000,000 | | | | 2,263,160 | |
| | | | | | | | |
| | | | | | | 14,592,023 | |
| | | | | | | | |
Special Tax Revenue Bonds – 19.44% | | | | | | | | |
Broomfield Colorado Sales & USE Tax Revenue | | | | | | | | |
5.00% 12/1/33 | | | 1,000,000 | | | | 1,165,560 | |
Canyons Metropolitan District No. 5 | | | | | | | | |
Series A 6.125% 12/1/47 | | | 500,000 | | | | 510,330 | |
Central Platte Valley Metropolitan District | | | | | | | | |
5.00% 12/1/43 | | | 725,000 | | | | 768,406 | |
Commerce City | | | | | | | | |
5.00% 8/1/44 (AGM) | | | 1,500,000 | | | | 1,643,355 | |
Denver City & County | | | | | | | | |
Series A 5.00% 8/1/26 | | | 500,000 | | | | 588,760 | |
Denver Convention Center Hotel Authority Revenue | | | | | | | | |
5.00% 12/1/40 | | | 2,660,000 | | | | 2,897,591 | |
Denver International Business Center | | | | | | | | |
Metropolitan District No. 1 | | | | | | | | |
5.375% 12/1/35 | | | 1,750,000 | | | | 1,797,145 | |
Denver Urban Renewal Authority | | | | | | | | |
(Stapleton) Senior Subordinated Series B 5.00% 12/1/25 | | | 1,250,000 | | | | 1,457,513 | |
Fountain Urban Renewal Authority Tax Increment Revenue | | | | | | | | |
(Academy Highlands Project) Series A 5.50% 11/1/44 | | | 2,525,000 | | | | 2,592,342 | |
Guam Government Business Privilege Tax Revenue | | | | | | | | |
Series A 5.125% 1/1/42 | | | 1,250,000 | | | | 1,312,325 | |
Series A 5.25% 1/1/36 | | | 1,675,000 | | | | 1,773,105 | |
Lincoln Park Metropolitan District | | | | | | | | |
5.00% 12/1/46 (AGM) | | | 1,000,000 | | | | 1,119,160 | |
Plaza Metropolitan District No. 1 | | | | | | | | |
144A 5.00% 12/1/40 # | | | 1,265,000 | | | | 1,304,835 | |
Prairie Center Metropolitan District No. 3 | | | | | | | | |
Series A 144A 5.00% 12/15/41 # | | | 1,000,000 | | | | 1,023,750 | |
Regional Transportation District | | | | | | | | |
(Fastracks Project) | | | | | | | | |
61
Schedules of investments
Delaware Tax-Free Colorado Fund
| | | | | | | | |
| | | Principal amount° | | | Value (US $) | |
| |
Municipal Bonds (continued) | | | | | | | | |
| |
Special Tax Revenue Bonds (continued) | | | | | | | | |
Regional Transportation District | | | | | | | | |
Series A 5.00% 11/1/30 | | | 670,000 | | | $ | 784,778 | |
Series A 5.00% 11/1/31 | | | 1,495,000 | | | | 1,745,143 | |
Series A 5.00% 11/1/36 | | | 2,750,000 | | | | 3,160,190 | |
Series B 5.00% 11/1/33 | | | 1,865,000 | | | | 2,189,342 | |
Certificates of Participation | | | | | | | | |
Series A 5.375% 6/1/31 | | | 1,540,000 | | | | 1,625,085 | |
Regional Transportation District Sales Revenue | | | | | | | | |
(Denver Transit Partners) | | | | | | | | |
6.00% 1/15/34 | | | 1,450,000 | | | | 1,516,294 | |
6.00% 1/15/41 | | | 2,400,000 | | | | 2,507,088 | |
Solaris Metropolitan District No. 3 | | | | | | | | |
(Limited Tax Convertible) Series A 5.00% 12/1/46 | | | 500,000 | | | | 515,080 | |
Southlands Metropolitan District No. 1 | | | | | | | | |
Series A-1 5.00% 12/1/37 | | | 300,000 | | | | 322,485 | |
Series A-1 5.00% 12/1/47 | | | 700,000 | | | | 745,787 | |
Sterling Ranch Community Authority Board | | | | | | | | |
Series A 5.75% 12/1/45 | | | 975,000 | | | | 1,001,929 | |
Tallyns Reach Metropolitan District No. 3 | | | | | | | | |
(Limited Tax Convertible) 5.125% 11/1/38 | | | 740,000 | | | | 780,737 | |
Thornton Development Authority | | | | | | | | |
(East 144th Avenue & I-25 Project) | | | | | | | | |
Series B 5.00% 12/1/35 | | | 485,000 | | | | 543,311 | |
Series B 5.00% 12/1/36 | | | 810,000 | | | | 905,426 | |
Virgin Islands Public Finance Authority | | | | | | | | |
(Matching Fund Loan Senior Lien) | | | | | | | | |
5.00% 10/1/29 (AGM) | | | 1,000,000 | | | | 1,048,300 | |
| | | | | | | | |
| | | | | | | 39,345,152 | |
| | | | | | | | |
Transportation Revenue Bonds – 12.94% | | | | | | | | |
Colorado High Performance Transportation Enterprise Revenue | | | | | | | | |
(C-470 Express Lanes) 5.00% 12/31/56 | | | 2,000,000 | | | | 2,156,960 | |
(Senior U.S. 36 & I-25 Managed Lanes) | | | | | | | | |
5.75% 1/1/44 (AMT) | | | 2,140,000 | | | | 2,346,767 | |
Denver City & County Airport System Revenue | | | | | | | | |
Series A 4.00% 12/1/48 (AMT) | | | 1,000,000 | | | | 1,002,450 | |
Series A 5.00% 11/15/30 (AMT) | | | 1,750,000 | | | | 2,017,190 | |
Series A 5.00% 12/1/48 (AMT) | | | 2,000,000 | | | | 2,236,100 | |
Series A 5.25% 11/15/36 | | | 2,500,000 | | | | 2,598,675 | |
Series B 5.00% 11/15/30 | | | 1,000,000 | | | | 1,101,440 | |
Series B 5.00% 11/15/32 | | | 1,000,000 | | | | 1,099,770 | |
Series B 5.00% 11/15/37 | | | 8,000,000 | | | | 8,764,720 | |
62
| | | | | | | | |
| | | Principal amount° | | | Value (US $) | |
| |
Municipal Bonds (continued) | | | | | | | | |
| |
Transportation Revenue Bonds (continued) | | | | | | | | |
E-470 Public Highway Authority | | | | | | | | |
Series C 5.25% 9/1/25 | | | 690,000 | | | $ | 734,484 | |
Series C 5.375% 9/1/26 | | | 2,000,000 | | | | 2,131,780 | |
| | | | | | | | |
| | | | | | | 26,190,336 | |
| | | | | | | | |
Water & Sewer Revenue Bonds – 1.33% | | | | | | | | |
Dominion Water & Sanitation District | | | | | | | | |
6.00% 12/1/46 | | | 750,000 | | | | 796,013 | |
Guam Government Waterworks Authority Water & Wastewater System Revenue | | | | | | | | |
5.00% 7/1/37 | | | 675,000 | | | | 747,468 | |
Parker Water & Sanitation District | | | | | | | | |
5.00% 11/1/42 | | | 1,000,000 | | | | 1,146,970 | |
| | | | | | | | |
| | | | | | | 2,690,451 | |
| | | | | | | | |
Total Municipal Bonds (cost $192,617,496) | | | | | | | 200,092,230 | |
| | | | | | | | |
| | | Number of shares | | | | |
| |
Short-Term Investments – 0.59% | | | | | | | | |
| |
Money Market Mutual Fund – 0.07% | | | | | | | | |
Dreyfus AMT-Free Tax Exempt Cash Management Fund - Institutional Shares (seven-day effective yield 1.40%) | | | 146,537 | | | | 146,537 | |
| | | | | | | | |
| | | | | | | 146,537 | |
| | | | | | | | |
| | | Principal amount° | | | | |
Variable Rate Demand Note – 0.52%¤ | | | | | | | | |
Denver City & County Series A2 1.43% 12/1/29 | | | | | | | | |
(SPA-JPMorgan Chase Bank N.A.) | | | 1,050,000 | | | | 1,050,000 | |
| | | | | | | | |
| | | | | | | 1,050,000 | |
| | | | | | | | |
Total Short-Term Investments (cost $1,196,537) | | | | | | | 1,196,537 | |
| | | | | | | | |
| | |
Total Value of Securities – 99.43%
(cost $193,814,033) | | | | | | $ | 201,288,767 | |
| | | | | | | | |
| # | Security exempt from registration under Rule 144A of the Securities Act of 1933, as amended. At Aug. 31, 2018, the aggregate value of Rule 144A securities was $10,288,412, which represents 5.08% of the Fund’s net assets. See Note 8 in “Notes to financial statements.” |
| ¤ | Tax-exempt obligations that contain a floating or variable interest rate adjustment formula and an unconditional right of demand to receive payment of the unpaid principal balance plus accrued interest upon a short notice period (generally up to 30 days) prior to specified dates either from the issuer or by drawing on a bank letter of credit, a guarantee, or insurance issued with respect to such instrument. Each rate shown is as of Aug. 31, 2018. |
63
Schedules of investments
Delaware Tax-Free Colorado Fund
| § | Pre-refunded bonds. Municipal bonds that are generally backed or secured by US Treasury bonds. For pre-refunded bonds, the stated maturity is followed by the year in which the bond will be pre-refunded. See Note 8 in “Notes to financial statements.” |
| ° | Principal amount shown is stated in US Dollars unless noted that the security is denominated in another currency. |
Summary of abbreviations:
AGM – Insured by Assured Guaranty Municipal Corporation
AMT – Subject to Alternative Minimum Tax
BAM – Insured by Build America Mutual Assurance
GNMA – Government National Mortgage Association collateral
N.A. – National Association
SGI – Insured by Syncora Guarantee Inc.
SPA – Stand-by Purchase Agreement
See accompanying notes, which are an integral part of the financial statements.
64
| | |
| Schedules of investments |
| Delaware Tax-Free Idaho Fund | | August 31, 2018 |
| | | | | | | | |
| | | Principal amount° | | | Value (US $) | |
| |
Municipal Bonds – 98.53% | | | | | | | | |
| |
Corporate Revenue Bonds – 3.31% | | | | | | | | |
Nez Perce County Pollution Control Revenue | | | | | | | | |
(Potlatch Project) 2.75% 10/1/24 | | | 1,250,000 | | | $ | 1,247,900 | |
Power County Industrial Development Revenue | | | | | | | | |
(FMC Project) 6.45% 8/1/32 (AMT) | | | 2,000,000 | | | | 2,007,300 | |
| | | | | | | | |
| | | | | | | 3,255,200 | |
| | | | | | | | |
Education Revenue Bonds – 16.10% | | | | | | | | |
Boise State University Revenue | | | | | | | | |
(General Project) | | | | | | | | |
Series A 4.00% 4/1/37 | | | 1,250,000 | | | | 1,270,787 | |
Series A 5.00% 4/1/42 | | | 1,350,000 | | | | 1,458,864 | |
Series A 5.00% 4/1/47 | | | 500,000 | | | | 564,595 | |
Series A 5.00% 4/1/48 | | | 750,000 | | | | 850,605 | |
Idaho Housing & Finance Association | | | | | | | | |
(Compass Public Charter School Project) | | | | | | | | |
Series A 144A 6.00% 7/1/39 # | | | 370,000 | | | | 395,301 | |
Series A 144A 6.00% 7/1/49 # | | | 595,000 | | | | 629,790 | |
Series A 144A 6.00% 7/1/54 # | | | 570,000 | | | | 601,088 | |
(Idaho Arts Charter School Project) | | | | | | | | |
Series A 5.00% 12/1/38 | | | 1,000,000 | | | | 1,063,760 | |
Series A 144A 5.00% 12/1/46 # | | | 1,000,000 | | | | 1,044,980 | |
(North Star Charter School Project) | | | | | | | | |
Capital Appreciation Subordinate Series B 144A 4.88% 7/1/49 #^ | | | 2,888,155 | | | | 383,402 | |
Series A 6.75% 7/1/48 | | | 529,151 | | | | 550,095 | |
(Victory Charter School Project) Series B 5.00% 7/1/39 | | | 1,000,000 | | | | 1,061,000 | |
(Xavier Charter School Project) Series A 5.00% 6/1/50 | | | 1,275,000 | | | | 1,352,686 | |
University of Idaho | | | | | | | | |
Series 2011 5.25% 4/1/41 ● | | | 1,755,000 | | | | 1,885,835 | |
Series A 5.00% 4/1/41 | | | 1,000,000 | | | | 1,153,620 | |
Series B 5.00% 4/1/28 | | | 1,000,000 | | | | 1,046,350 | |
Series B 5.00% 4/1/32 | | | 500,000 | | | | 522,780 | |
| | | | | | | | |
| | | | | | | 15,835,538 | |
| | | | | | | | |
Electric Revenue Bonds – 3.36% | | | | | | | | |
Boise-Kuna Irrigation District Revenue | | | | | | | | |
(Idaho Arrowrock Hydroelectric Project) 5.00% 6/1/34 | | | 2,000,000 | | | | 2,219,960 | |
Guam Power Authority Revenue | | | | | | | | |
Series A 5.00% 10/1/40 | | | 1,000,000 | | | | 1,083,340 | |
| | | | | | | | |
| | | | | | | 3,303,300 | |
| | | | | | | | |
Healthcare Revenue Bonds – 12.76% | | | | | | | | |
Idaho Health Facilities Authority Revenue | | | | | | | | |
(Madison Memorial Hospital Project) 5.00% 9/1/37 | | | 2,350,000 | | | | 2,497,768 | |
(St. Luke’s Health System Project) | | | | | | | | |
65
Schedules of investments
Delaware Tax-Free Idaho Fund
| | | | | | | | |
| | | Principal amount° | | | Value (US $) | |
| |
Municipal Bonds (continued) | | | | | | | | |
| |
Healthcare Revenue Bonds (continued) | | | | | | | | |
Idaho Health Facilities Authority Revenue | | | | | | | | |
Series A 5.00% 3/1/47 | | | 1,500,000 | | | $ | 1,584,900 | |
Series A 6.75% 11/1/37 | | | 1,250,000 | | | | 1,260,100 | |
(Trinity Health Center Group) | | | | | | | | |
Series D 4.50% 12/1/37 | | | 1,385,000 | | | | 1,454,181 | |
Series D 5.00% 12/1/32 | | | 1,500,000 | | | | 1,635,810 | |
Series D 5.00% 12/1/46 | | | 750,000 | | | | 841,230 | |
(Valley Vista Care Corporation) | | | | | | | | |
Series A 5.25% 11/15/37 | | | 1,005,000 | | | | 1,051,923 | |
Series A 5.25% 11/15/47 | | | 1,130,000 | | | | 1,164,815 | |
Puerto Rico Industrial Tourist Educational Medical & Environmental Control Facilities Financing Authority | | | | | | | | |
(Hospital Auxilio Mutuo Obligated Group Project) Series A 6.00% 7/1/33 | | | 1,020,000 | | | | 1,060,871 | |
| | | | | | | | |
| | | | | | | 12,551,598 | |
| | | | | | | | |
Housing Revenue Bonds – 1.03% | | | | | | | | |
Idaho Housing & Finance Association Single Family Mortgage Revenue | | | | | | | | |
Series A Class II 4.375% 7/1/32 | | | 635,000 | | | | 646,385 | |
Series C Class II 4.95% 7/1/31 | | | 360,000 | | | | 364,500 | |
| | | | | | | | |
| | | | | | | 1,010,885 | |
| | | | | | | | |
Lease Revenue Bonds – 9.95% | | | | | | | | |
Boise Urban Renewal Agency | | | | | | | | |
5.00% 12/15/31 | | | 750,000 | | | | 842,813 | |
5.00% 12/15/32 | | | 750,000 | | | | 841,080 | |
Idaho Fish & Wildlife Foundation | | | | | | | | |
5.00% 12/1/41 | | | 200,000 | | | | 231,178 | |
Idaho Housing & Finance Association Revenue | | | | | | | | |
(Grant & Revenue Anticipation Bonds) Series A 5.00% 7/15/27 | | | 1,500,000 | | | | 1,766,340 | |
(TDF Facilities Project-Recovery Zone) | | | | | | | | |
Series A 6.50% 2/1/26 | | | 1,370,000 | | | | 1,508,274 | |
Series A 7.00% 2/1/36 | | | 1,500,000 | | | | 1,641,120 | |
Idaho State Building Authority Revenue | | | | | | | | |
Series B 5.00% 9/1/40 | | | 1,250,000 | | | | 1,365,950 | |
(Capitol Mall Parking Project) | | | | | | | | |
Series A 4.50% 9/1/25 | | | 455,000 | | | | 503,507 | |
Series A 4.50% 9/1/26 | | | 485,000 | | | | 533,578 | |
Series A 4.50% 9/1/27 | | | 505,000 | | | | 553,339 | |
| | | | | | | | |
| | | | | | | 9,787,179 | |
| | | | | | | | |
66
| | | | | | | | |
| | | Principal amount° | | | Value (US $) | |
| |
Municipal Bonds (continued) | | | | | | | | |
| |
Local General Obligation Bonds – 25.76% | | | | | | | | |
Ada & Boise Counties Independent School District Boise City | | | | | | | | |
5.00% 8/1/33 | | | 1,010,000 | | | $ | 1,182,791 | |
5.00% 8/1/34 | | | 1,500,000 | | | | 1,751,715 | |
5.00% 8/1/35 | | | 1,160,000 | | | | 1,350,878 | |
5.00% 8/1/36 | | | 500,000 | | | | 580,645 | |
Ada & Canyon Counties Joint School District No. 2 Meridian | | | | | | | | |
4.50% 7/30/22 | | | 1,500,000 | | | | 1,573,665 | |
Ada & Canyon Counties Joint School District No. 3 Kuna | | | | | | | | |
(Sales Tax & Credit Enhancement) 5.00% 9/15/35 | | | 1,100,000 | | | | 1,269,818 | |
Canyon County School District No. 131 Nampa | | | | | | | | |
(School Board Guaranteed) | | | | | | | | |
Series B 5.00% 8/15/23 | | | 1,295,000 | | | | 1,473,749 | |
Canyon County School District No. 132 Caldwell | | | | | | | | |
Series A 5.00% 9/15/22 (AGM) | | | 1,725,000 | | | | 1,729,261 | |
Series A 5.00% 9/15/23 (AGM) | | | 1,810,000 | | | | 1,814,471 | |
Canyon County School District No. 139 Vallivue | | | | | | | | |
(School Board Guaranteed) | | | | | | | | |
5.00% 9/15/33 | | | 1,000,000 | | | | 1,121,940 | |
Series B 5.00% 9/15/24 | | | 1,480,000 | | | | 1,646,130 | |
Idaho Bond Bank Authority Revenue | | | | | | | | |
Series A 4.00% 9/15/33 | | | 530,000 | | | | 565,091 | |
Series A 4.00% 9/15/37 | | | 1,000,000 | | | | 1,054,700 | |
Series A 5.00% 9/15/33 | | | 1,125,000 | | | | 1,227,746 | |
Series C 5.00% 9/15/42 | | | 500,000 | | | | 574,730 | |
Madison County School District No. 321 Rexburg | | | | | | | | |
(Sales Tax & Credit Enhancement) | | | | | | | | |
Series B 5.00% 8/15/25 | | | 1,080,000 | | | | 1,261,624 | |
Series B 5.00% 8/15/26 | | | 710,000 | | | | 839,412 | |
Nez Perce County Independent School District No. 1 | | | | | | | | |
(Sales Tax & Credit Enhancement) | | | | | | | | |
Series B 5.00% 9/15/36 | | | 1,500,000 | | | | 1,720,590 | |
Series B 5.00% 9/15/37 | | | 1,300,000 | | | | 1,488,032 | |
Twin Falls County School District No. 411 | | | | | | | | |
(School Board Guaranteed) Series A 4.75% 9/15/37 | | | 1,000,000 | | | | 1,098,150 | |
| | | | | | | | |
| | | | | | | 25,325,138 | |
| | | | | | | | |
Pre-Refunded Bonds – 6.91% | | | | | | | | |
Boise State University Revenue | | | | | | | | |
(General Project) Series A 5.00% 4/1/39-19 § | | | 1,000,000 | | | | 1,019,620 | |
67
Schedules of investments
Delaware Tax-Free Idaho Fund
| | | | | | | | |
| | | Principal amount° | | | Value (US $) | |
| |
Municipal Bonds (continued) | | | | | | | | |
| |
Pre-Refunded Bonds (continued) | | | | | | | | |
Idaho Bond Bank Authority Revenue | | | | | | | | |
(State Intercept) | | | | | | | | |
Series A 5.25% 9/15/26-19 § | | | 570,000 | | | $ | 580,950 | |
Unrefunded Series A 5.00% 9/15/28-19 § | | | 890,000 | | | | 906,171 | |
Unrefunded Series A 5.25% 9/15/26-19 § | | | 500,000 | | | | 509,735 | |
Idaho Health Facilities Authority Revenue | | | | | | | | |
(St. Luke’s Regional Medical Center Project) 5.00% 7/1/35-20 (AGM) § | | | 2,500,000 | | | | 2,642,725 | |
(Trinity Health Center Group) Series B 6.125% 12/1/28-18 § | | | 1,110,000 | | | | 1,122,188 | |
Puerto Rico Sales Tax Financing Revenue First | | | | | | | | |
Subordinate | | | | | | | | |
Series A 5.50% 8/1/28-19 § | | | 15,000 | | | | 15,511 | |
| | | | | | | | |
| | | | | | | 6,796,900 | |
| | | | | | | | |
Special Tax Revenue Bonds – 14.14% | | | | | | | | |
Guam Government Business Privilege Tax Revenue | | | | | | | | |
Series A 5.125% 1/1/42 | | | 545,000 | | | | 572,174 | |
Series A 5.25% 1/1/36 | | | 705,000 | | | | 746,292 | |
Series B-1 5.00% 1/1/42 | | | 1,425,000 | | | | 1,487,329 | |
Idaho Water Resource Board | | | | | | | | |
(Ground Water Rights Mitigation) Series A 5.00% 9/1/32 | | | 3,565,000 | | | | 3,882,962 | |
Ketchum Urban Renewal Agency Tax Increment Revenue | | | | | | | | |
5.50% 10/15/34 | | | 1,500,000 | | | | 1,537,095 | |
Nampa Development Tax Increment Revenue | | | | | | | | |
144A 5.00% 9/1/31 # | | | 1,000,000 | | | | 1,041,910 | |
5.90% 3/1/30 | | | 3,000,000 | | | | 3,066,750 | |
Virgin Islands Public Finance Authority Revenue | | | | | | | | |
(Senior Lien-Matching Fund Loan Note) 5.00% 10/1/29 (AGM) | | | 1,500,000 | | | | 1,572,450 | |
| | | | | | | | |
| | | | | | | 13,906,962 | |
| | | | | | | | |
Transportation Revenue Bonds – 4.42% | | | | | | | | |
Boise City Airport Revenue | | | | | | | | |
(Air Terminal Facilities Project) | | | | | | | | |
5.75% 9/1/19 (AGM) (AMT) | | | 1,000,000 | | | | 1,038,240 | |
5.75% 9/1/20 (AGM) (AMT) | | | 1,000,000 | | | | 1,072,960 | |
(Parking Facilities Project) 4.00% 9/1/32 | | | 2,180,000 | | | | 2,230,576 | |
| | | | | | | | |
| | | | | | | 4,341,776 | |
| | | | | | | | |
Water & Sewer Revenue Bonds – 0.79% | | | | | | | | |
Guam Government Waterworks Authority | | | | | | | | |
5.00% 7/1/40 | | | 370,000 | | | | 408,543 | |
68
| | | | | | | | |
| | | Principal amount° | | | Value (US $) | |
| |
Municipal Bonds (continued) | | | | | | | | |
| |
Water & Sewer Revenue Bonds (continued) | | | | | | | | |
Guam Government Waterworks Authority | | | | | | | | |
5.00% 1/1/46 | | | 335,000 | | | $ | 365,039 | |
| | | | | | | | |
| | | | | | | 773,582 | |
| | | | | | | | |
Total Municipal Bonds (cost $94,504,301) | | | | | | | 96,888,058 | |
| | | | | | | | |
| | |
| | | Number of shares | | | | |
| |
Short-Term Investment – 0.88% | | | | | | | | |
| |
Money Market Mutual Fund – 0.88% | | | | | | | | |
Dreyfus AMT-Free Tax Exempt Cash Management Fund - Institutional Shares
(seven-day effective yield 1.40%) | | | 861,413 | | | | 861,413 | |
| | | | | | | | |
Total Short-Term Investment (cost $861,413) | | | | | | | 861,413 | |
| | | | | | | | |
| | |
Total Value of Securities – 99.41% | | | | | | | | |
(cost $95,365,714) | | | | | | $ | 97,749,471 | |
| | | | | | | | |
| # | Security exempt from registration under Rule 144A of the Securities Act of 1933, as amended. At Aug. 31, 2018, the aggregate value of Rule 144A securities was $4,096,471, which represents 4.17% of the Fund’s net assets. See Note 8 in “Notes to financial statements.” |
| § | Pre-refunded bonds. Municipal bonds that are generally backed or secured by US Treasury bonds. For pre-refunded bonds, the stated maturity is followed by the year in which the bond will be pre-refunded. See Note 8 in “Notes to financial statements.” |
| ° | Principal amount shown is stated in US Dollars unless noted that the security is denominated in another currency. |
| ● | Variable rate investment. Rates reset periodically. Rate shown reflects the rate in effect at Aug. 31, 2018. For securities based on a published reference rate and spread, the reference rate and spread are indicated in their description above. The reference rate descriptions (i.e. LIBOR03M, LIBOR06M, etc.) used in this report are identical for different securities, but the underlying reference rates may differ due to the timing of the reset period. Certain variable rate securities are not based on a published reference rate and spread but are determined by the issuer or agent and are based on current market conditions, or for mortgage-backed securities, are impacted by the individual mortgages which are paying off over time. These securities do not indicate a reference rate and spread in their description above. |
| ^ | Zero coupon security. The rate shown is the effective yield at the time of purchase. |
Summary of abbreviations:
AGM – Insured by Assured Guaranty Municipal Corporation
AMT – Subject to Alternative Minimum Tax
See accompanying notes, which are an integral part of the financial statements.
69
| | |
| Schedules of investments |
| Delaware Tax-Free New York Fund | | August 31, 2018 |
| | | | | | | | |
| | | Principal amount° | | | Value (US $) | |
| |
Municipal Bonds – 100.48% | | | | | | | | |
| |
Corporate Revenue Bonds – 8.43% | | | | | | | | |
Nassau County Tobacco Settlement | | | | | | | | |
(Asset-Backed) Series A-3 5.125% 6/1/46 | | | 1,055,000 | | | $ | 1,043,743 | |
New York City Industrial Development Agency | | | | | | | | |
(Brooklyn Navy Yard Cogeneration Partners Project) 5.75% 10/1/36 (AMT) | | | 350,000 | | | | 353,237 | |
New York Counties Tobacco Trust VI | | | | | | | | |
(Tobacco Settlement Pass Through) Series C 5.00% 6/1/51 | | | 500,000 | | | | 523,470 | |
New York Liberty Development Revenue | | | | | | | | |
(Second Priority - Bank of America Tower at One Bryant Park Project) | | | | | | | | |
Class 2 5.625% 7/15/47 | | | 500,000 | | | | 525,520 | |
Class 3 6.375% 7/15/49 | | | 865,000 | | | | 907,757 | |
New York Transportation Development Corporation Special Facilities Revenue | | | | | | | | |
(Delta Air Lines - LaGuardia Airport Terminals C&D | | | | | | | | |
Redevelopment Project) 5.00% 1/1/36 (AMT) | | | 1,000,000 | | | | 1,109,150 | |
Niagara Area Development Revenue | | | | | | | | |
(Covanta Energy Project) Series B 144A 4.00% 11/1/24 # | | | 1,060,000 | | | | 1,060,572 | |
Suffolk Tobacco Asset Securitization | | | | | | | | |
Series B 5.25% 6/1/37 | | | 700,000 | | | | 757,085 | |
TSASC Revenue | | | | | | | | |
(Senior) Series A 5.00% 6/1/41 | | | 900,000 | | | | 971,973 | |
| | | | | | | | |
| | | | | | | 7,252,507 | |
| | | | | | | | |
Education Revenue Bonds – 22.68% | | | | | | | | |
Albany Industrial Development Agency Civic Facilities Revenue | | | | | | | | |
(Brighter Choice Charter School) Series A 5.00% 4/1/37 | | | 250,000 | | | | 226,903 | |
Buffalo & Erie County Industrial Land Development | | | | | | | | |
(Buffalo State College Foundation Housing Project) | | | | | | | | |
Series A 6.00% 10/1/31 | | | 525,000 | | | | 578,083 | |
(Tapestry Charter School Project) Series A 5.00% 8/1/52 | | | 500,000 | | | | 522,635 | |
Build NYC Resource | | | | | | | | |
(Bronx Charter School for Excellence Project) | | | | | | | | |
Series A 5.00% 4/1/33 | | | 500,000 | | | | 525,380 | |
Series A 5.50% 4/1/43 | | | 500,000 | | | | 529,970 | |
(Inwood Academy for Leadership Charter School Project) Series A 144A 5.50% 5/1/48 # | | | 500,000 | | | | 522,040 | |
(Manhattan College Project) 5.00% 8/1/47 | | | 500,000 | | | | 557,755 | |
70
| | | | | | | | |
| | | Principal amount° | | | Value (US $) | |
| |
Municipal Bonds (continued) | | | | | | | | |
| |
Education Revenue Bonds (continued) | | | | | | | | |
Build NYC Resource | | | | | | | | |
(Metropolitan College of New York Project) 5.50% 11/1/44 | | | 1,100,000 | | | $ | 1,144,110 | |
(Metropolitan Lighthouse Charter School Project) Series A 144A 5.00% 6/1/52 # | | | 250,000 | | | | 261,693 | |
(The Packer Collegiate Institute Project) 5.00% 6/1/40 | | | 750,000 | | | | 825,007 | |
Dutchess County Local Development | | | | | | | | |
(The Culinary Institute of America Project) | | | | | | | | |
Series A-1 5.00% 7/1/41 | | | 200,000 | | | | 219,504 | |
Series A-1 5.00% 7/1/46 | | | 300,000 | | | | 328,182 | |
Hempstead Town Local Development | | | | | | | | |
(Hofstra University Project) 5.00% 7/1/42 | | | 500,000 | | | | 562,540 | |
Madison County Capital Resource Revenue | | | | | | | | |
(Colgate University Project) Series A 5.00% 7/1/28 | | | 400,000 | | | | 422,540 | |
Monroe County Industrial Development Revenue | | | | | | | | |
(Nazareth College of Rochester Project) | | | | | | | | |
Series A 5.00% 10/1/22 | | | 340,000 | | | | 372,711 | |
Series A 5.00% 10/1/23 | | | 470,000 | | | | 522,090 | |
(St. John Fisher College Project) Series A 5.50% 6/1/39 | | | 300,000 | | | | 340,611 | |
(University of Rochester Project) Series C 4.00% 7/1/43 | | | 500,000 | | | | 519,200 | |
New York City Trust for Cultural Resources | | | | | | | | |
(Alvin Ailey Dance Foundation) Series A 4.00% 7/1/46 | | | 1,000,000 | | | | 1,022,900 | |
(Whitney Museum of American Art) 5.00% 7/1/31 | | | 500,000 | | | | 531,160 | |
New York State Dormitory Authority | | | | | | | | |
(Barnard College) Series A 5.00% 7/1/35 | | | 400,000 | | | | 451,376 | |
(Brooklyn Law School) 5.75% 7/1/33 | | | 340,000 | | | | 348,643 | |
(Cornell University) Series A 5.00% 7/1/34 | | | 170,000 | | | | 174,529 | |
(Fordham University) 5.00% 7/1/44 | | | 650,000 | | | | 718,581 | |
(Marymount Manhattan College) 5.00% 7/1/24 | | | 350,000 | | | | 357,815 | |
(Pratt Institute) Series A 5.00% 7/1/34 | | | 1,000,000 | | | | 1,106,640 | |
(Rockefeller University) Series A 5.00% 7/1/27 | | | 250,000 | | | | 256,910 | |
(Skidmore College) Series A 5.00% 7/1/21 | | | 325,000 | | | | 353,015 | |
(Touro College & University) Series A 5.50% 1/1/44 | | | 1,000,000 | | | | 1,096,190 | |
(University of Rochester Project) Unrefunded Series A 5.125% 7/1/39 | | | 20,000 | | | | 20,533 | |
Onondaga Civic Development Revenue | | | | | | | | |
(Le Moyne College Project) 5.20% 7/1/29 | | | 500,000 | | | | 524,065 | |
St. Lawrence County Industrial Development Agency Civic Development Revenue | | | | | | | | |
(St. Lawrence University Project) Series A 4.00% 7/1/43 | | | 1,000,000 | | | | 1,010,680 | |
71
Schedules of investments
Delaware Tax-Free New York Fund
| | | | | | | | |
| | | Principal amount° | | | Value (US $) | |
| |
Municipal Bonds (continued) | | | | | | | | |
| |
Education Revenue Bonds (continued) | | | | | | | | |
Tompkins County Development | | | | | | | | |
(Ithaca College Project) | | | | | | | | |
5.00% 7/1/34 | | | 750,000 | | | $ | 837,967 | |
5.00% 7/1/41 | | | 500,000 | | | | 567,710 | |
Troy Industrial Development Authority | | | | | | | | |
(Rensselaer Polytechnic Institute Project) Series E 5.20% 4/1/37 | | | 500,000 | | | | 538,345 | |
Yonkers Economic Development Educational Revenue | | | | | | | | |
(Charter School of Educational Excellence Project) | | | | | | | | |
Series A 6.25% 10/15/40 | | | 600,000 | | | | 621,744 | |
| | | | | | | | |
| | | | | | | 19,519,757 | |
| | | | | | | | |
Electric Revenue Bonds – 3.58% | | | | | | | | |
Long Island Power Authority Electric System Revenue | | | | | | | | |
5.00% 9/1/47 | | | 500,000 | | | | 564,405 | |
Series A 5.00% 9/1/44 | | | 750,000 | | | | 830,363 | |
New York State Power Authority Revenue | | | | | | | | |
Series A 5.00% 11/15/38 | | | 500,000 | | | | 544,560 | |
Utility Debt Securitization Authority | | | | | | | | |
(Restructuring Bonds) 5.00% 12/15/37 | | | 1,000,000 | | | | 1,142,490 | |
| | | | | | | | |
| | | | | | | 3,081,818 | |
| | | | | | | | |
Healthcare Revenue Bonds – 15.16% | | | | | | | | |
Buffalo & Erie County Industrial Land Development | | | | | | | | |
(Catholic Health System Project) 5.25% 7/1/35 | | | 250,000 | | | | 274,903 | |
Dutchess County Local Development | | | | | | | | |
(Health Quest Systems Project) | | | | | | | | |
Series A 5.00% 7/1/34 | | | 350,000 | | | | 385,357 | |
Series A 5.00% 7/1/44 | | | 1,000,000 | | | | 1,087,680 | |
Guilderland Industrial Development Agency | | | | | | | | |
(Albany Place Development Project) Series A 144A 5.875% 1/1/52 # | | | 500,000 | | | | 495,255 | |
Monroe County Industrial Development | | | | | | | | |
(The Rochester General Hospital Project) | | | | | | | | |
5.00% 12/1/36 | | | 405,000 | | | | 452,745 | |
5.00% 12/1/46 | | | 540,000 | | | | 591,840 | |
Series A 5.00% 12/1/27 | | | 330,000 | | | | 361,165 | |
Series A 5.00% 12/1/28 | | | 655,000 | | | | 715,483 | |
(The Unity Hospital of Rochester Project) 5.50% 8/15/40 (FHA) | | | 585,000 | | | | 632,870 | |
Nassau County Local Economic Assistance | | | | | | | | |
(Catholic Health Services of Long Island Obligated Group Project) | | | | | | | | |
5.00% 7/1/29 | | | 375,000 | | | | 413,933 | |
72
| | | | | | | | |
| | | Principal amount° | | | Value (US $) | |
| |
Municipal Bonds (continued) | | | | | | | | |
| |
Healthcare Revenue Bonds (continued) | | | | | | | | |
Nassau County Local Economic Assistance | | | | | | | | |
(Catholic Health Services of Long Island Obligated Group Project) | | | | | | | | |
5.00% 7/1/33 | | | 725,000 | | | $ | 788,568 | |
New York City Health & Hospital Revenue | | | | | | | | |
(Health System) Series A 5.00% 2/15/30 | | | 500,000 | | | | 520,590 | |
New York State Dormitory Authority Revenue | | | | | | | | |
(Montefiore Obligated Group) Series A 4.00% 8/1/38 | | | 1,000,000 | | | | 1,005,670 | |
New York State Dormitory Authority Revenue Non-State Supported Debt | | | | | | | | |
(Mt. Sinai Hospital) Series A 5.00% 7/1/26 | | | 600,000 | | | | 632,370 | |
(New York University Hospitals Center) Series A 4.00% 7/1/40 | | | 465,000 | | | | 476,286 | |
(Orange Regional Medical Center Obligated Group) | | | | | | | | |
144A 5.00% 12/1/34 # | | | 500,000 | | | | 552,455 | |
144A 5.00% 12/1/45 # | | | 700,000 | | | | 755,965 | |
Orange County Funding Assisted Living Residence Revenue | | | | | | | | |
(The Hamlet at Wallkill Assisted Living Project) 6.50% 1/1/46 | | | 400,000 | | | | 408,692 | |
Saratoga County Capital Resource Revenue | | | | | | | | |
(The Saratoga Hospital Project) Series A 5.00% 12/1/26 | | | 500,000 | | | | 557,100 | |
Southold Local Development Revenue | | | | | | | | |
(Peconic Landing at Southold Project) 5.00% 12/1/45 | | | 750,000 | | | | 780,915 | |
Suffolk County Economic Development Revenue | | | | | | | | |
(Catholic Health Services) Unrefunded 5.00% 7/1/28 | | | 430,000 | | | | 461,657 | |
(Peconic Landing at Southhold Project) 6.00% 12/1/40 | | | 650,000 | | | | 694,070 | |
| | | | | | | | |
| | | | | | | 13,045,569 | |
| | | | | | | | |
Lease Revenue Bonds – 8.68% | | | | | | | | |
Hudson Yards Infrastructure | | | | | | | | |
Unrefunded Fiscal 2012 Series A 5.75% 2/15/47 | | | 385,000 | | | | 417,540 | |
MTA Hudson Rail Yards Trust Obligations | | | | | | | | |
(The Metropolitan Transportation Authority) Series A 5.00% 11/15/56 | | | 710,000 | | | | 768,561 | |
New York City Industrial Development Agency | | | | | | | | |
(Senior Trips) | | | | | | | | |
Series A 5.00% 7/1/22 (AMT) | | | 1,085,000 | | | | 1,187,402 | |
Series A 5.00% 7/1/28 (AMT) | | | 1,500,000 | | | | 1,598,580 | |
New York Liberty Development | | | | | | | | |
(4 World Trade Center Project) 5.00% 11/15/31 | | | 500,000 | | | | 542,620 | |
(Class 1 - 3 World Trade Center Project) 144A 5.00% 11/15/44 # | | | 1,800,000 | | | | 1,894,770 | |
73
Schedules of investments
Delaware Tax-Free New York Fund
| | | | | | | | |
| | | Principal amount° | | | Value (US $) | |
| |
Municipal Bonds (continued) | | | | | | | | |
| |
Lease Revenue Bonds (continued) | | | | | | | | |
New York Liberty Development | | | | | | | | |
(Class 2 - 3 World Trade Center Project) 144A 5.375% 11/15/40 # | | | 500,000 | | | $ | 551,210 | |
United Nations Development Revenue | | | | | | | | |
(Senior Lien) Series A 5.00% 7/1/26 | | | 500,000 | | | | 513,070 | |
| | | | | | | | |
| | | | | | | 7,473,753 | |
| | | | | | | | |
Local General Obligation Bonds – 2.24% | | | | | | | | |
New York City | | | | | | | | |
Fiscal 2011 Series E 5.00% 8/1/28 | | | 125,000 | | | | 132,313 | |
Fiscal 2014 Subordinate Series D-1 5.00% 8/1/31 | | | 1,000,000 | | | | 1,117,170 | |
Subordinate Series E-1 5.25% 3/1/35 | | | 500,000 | | | | 593,665 | |
Unrefunded Subordinate Series I-1 5.375% 4/1/36 | | | 25,000 | | | | 25,512 | |
New York State Dormitory Authority | | | | | | | | |
(School District Financing Program) | | | | | | | | |
Unrefunded Series A 5.00% 10/1/23 | | | 25,000 | | | | 27,302 | |
Unrefunded Series A 5.00% 10/1/25 (AGM) | | | 30,000 | | | | 31,843 | |
| | | | | | | | |
| | | | | | | 1,927,805 | |
| | | | | | | | |
Pre-Refunded Bonds – 11.38% | | | | | | | | |
Brooklyn Arena Local Development | | | | | | | | |
(Barclays Center Project) | | | | | | | | |
6.25% 7/15/40-20 § | | | 500,000 | | | | 531,450 | |
6.375% 7/15/43-20 § | | | 500,000 | | | | 532,285 | |
6.50% 7/15/30-20 § | | | 500,000 | | | | 533,125 | |
Hudson Yards Infrastructure | | | | | | | | |
Fiscal 2012 Series A 5.75% 2/15/47-21 § | | | 615,000 | | | | 674,384 | |
Long Island Power Authority Electric System Revenue | | | | | | | | |
Series A 5.75% 4/1/39-19 § | | | 350,000 | | | | 358,540 | |
Series B 5.75% 4/1/33-19 § | | | 250,000 | | | | 256,100 | |
Metropolitan Transportation Authority Revenue | | | | | | | | |
Series C 5.00% 11/15/32-22 § | | | 500,000 | | | | 563,485 | |
Series C 6.50% 11/15/28-18 § | | | 5,000 | | | | 5,049 | |
Series D 5.25% 11/15/27-20 § | | | 500,000 | | | | 538,850 | |
Monroe County Industrial Development Revenue | | | | | | | | |
(Nazareth College of Rochester Project) | | | | | | | | |
5.25% 10/1/31-21 § | | | 500,000 | | | | 550,535 | |
5.50% 10/1/41-21 § | | | 500,000 | | | | 554,255 | |
New York City | | | | | | | | |
Subordinate Series I-1 5.375% 4/1/36-19 § | | | 475,000 | | | | 485,578 | |
New York City Transitional Finance Authority Revenue | | | | | | | | |
(Future Tax Secured) | | | | | | | | |
Fiscal 2011 Subordinate Series C 5.25% 11/1/25-20 § | | | 190,000 | | | | 203,878 | |
Fiscal 2011 Subordinate Series D-1 5.25% 2/1/29-21 § | | | 305,000 | | | | 329,659 | |
74
| | | | | | | | |
| | | Principal amount° | | | Value (US $) | |
| |
Municipal Bonds (continued) | | | | | | | | |
| |
Pre-Refunded Bonds (continued) | | | | | | | | |
New York State Dormitory Authority | �� | | | | | | | |
(School District Financing Program) Series A 5.00% 10/1/23-21 § | | | 475,000 | | | $ | 520,225 | |
New York State Dormitory Authority Revenue Non-State Supported Debt | | | | | | | | |
(Teachers College) 5.50% 3/1/39-19 § | | | 250,000 | | | | 254,803 | |
(The Northwell Health Obligated Group) | | | | | | | | |
Series A 5.00% 5/1/41-21 § | | | 500,000 | | | | 542,110 | |
Series A 5.50% 5/1/37-19 § | | | 500,000 | | | | 513,085 | |
Onondaga Civic Development Revenue | | | | | | | | |
(St. Joseph’s Hospital Health Center Project) | | | | | | | | |
4.50% 7/1/32-22 § | | | 380,000 | | | | 415,956 | |
5.00% 7/1/42-22 § | | | 750,000 | | | | 834,720 | |
Series A 5.125% 7/1/31-19 § | | | 500,000 | | | | 514,705 | |
Suffolk County Economic Development Revenue | | | | | | | | |
(Catholic Health Services) 5.00% 7/1/28-21 § | | | 70,000 | | | | 76,095 | |
| | | | | | | | |
| | | | | | | 9,788,872 | |
| | | | | | | | |
Resource Recovery Revenue Bond – 1.75% | | | | | | | | |
Niagara Area Development Revenue | | | | | | | | |
(Covanta Project) Series A 144A 4.75% 11/1/42 (AMT) # | | | 1,500,000 | | | | 1,507,515 | |
| | | | | | | | |
| | | | | | | 1,507,515 | |
| | | | | | | | |
Special Tax Revenue Bonds – 16.56% | | | | | | | | |
Build NYC Resource | | | | | | | | |
(YMCA of Greater New York Project) 5.00% 8/1/40 | | | 450,000 | | | | 489,924 | |
Glen Cove Local Economic Assistance | | | | | | | | |
(Garvies Point Public Improvement Project) Series A 5.00% 1/1/56 | | | 250,000 | | | | 259,637 | |
Guam Government Business Privilege Tax Revenue | | | | | | | | |
Series A 5.25% 1/1/36 | | | 240,000 | | | | 254,057 | |
New York City Transitional Finance Authority Revenue | | | | | | | | |
(Building Aid) | | | | | | | | |
Fiscal 2012 Subordinate Series S-1A 5.25% 7/15/37 | | | 1,000,000 | | | | 1,087,000 | |
Fiscal 2015 Series S-1 5.00% 7/15/43 | | | 1,000,000 | | | | 1,109,500 | |
(Future Tax Secured) | | | | | | | | |
Fiscal 2011 Subordinate Series D-1 5.00% 2/1/26 | | | 250,000 | | | | 268,135 | |
Fiscal 2014 Subordinate Series A-1 5.00% 11/1/42 | | | 750,000 | | | | 834,000 | |
Fiscal 2014 Subordinate Series B-1 5.00% 11/1/40 | | | 750,000 | | | | 837,803 | |
Fiscal 2015 Subordinate Series E-1 5.00% 2/1/41 | | | 1,000,000 | | | | 1,113,270 | |
Fiscal 2016 Subordinate Series A-1 5.00% 8/1/33 | | | 670,000 | | | | 763,304 | |
Fiscal 2016 Subordinate Series A-1 5.00% 8/1/34 | | | 1,500,000 | | | | 1,703,850 | |
Fiscal 2017 Subordinate Series A-1 4.00% 5/1/42 | | | 500,000 | | | | 518,685 | |
Fiscal 2017 Subordinate Series E-1 5.00% 2/1/43 | | | 1,000,000 | | | | 1,132,500 | |
75
Schedules of investments
Delaware Tax-Free New York Fund
| | | | | | | | |
| | | Principal amount° | | | Value (US $) | |
| |
Municipal Bonds (continued) | | | | | | | | |
| |
Special Tax Revenue Bonds (continued) | | | | | | | | |
New York City Transitional Finance Authority Revenue | | | | | | | | |
(Future Tax Secured) | | | | | | | | |
Unrefunded Fiscal 2011 Subordinate Series C 5.25% 11/1/25 | | | 310,000 | | | $ | 333,188 | |
Unrefunded Fiscal 2011 Subordinate Series D-1 5.25% 2/1/29 | | | 195,000 | | | | 209,570 | |
New York Convention Center Development Revenue | | | | | | | | |
(Hotel Unit Fee Secured) 5.00% 11/15/35 | | | 1,000,000 | | | | 1,135,440 | |
New York State Dormitory Authority Revenue | | | | | | | | |
(General Purpose) | | | | | | | | |
Series C 5.00% 3/15/34 | | | 500,000 | | | | 534,490 | |
Series E 5.00% 3/15/32 | | | 1,000,000 | | | | 1,144,950 | |
New York State Urban Development Revenue | | | | | | | | |
(General Purpose) Series A 4.00% 3/15/36 | | | 500,000 | | | | 522,820 | |
| | | | | | | | |
| | | | | | | 14,252,123 | |
| | | | | | | | |
State General Obligation Bond – 0.58% | | | | | | | | |
New York State | | | | | | | | |
Series A 5.00% 3/1/38 | | | 500,000 | | | | 501,235 | |
| | | | | | | | |
| | | | | | | 501,235 | |
| | | | | | | | |
Transportation Revenue Bonds – 6.56% | | | | | | | | |
Buffalo & Fort Erie Public Bridge Authority | | | | | | | | |
5.00% 1/1/47 | | | 435,000 | | | | 489,423 | |
Metropolitan Transportation Authority Revenue | | | | | | | | |
Series D 5.00% 11/15/32 | | | 500,000 | | | | 549,885 | |
Unrefunded Series C 6.50% 11/15/28 | | | 45,000 | | | | 45,440 | |
New York State Thruway Authority General Revenue | | | | | | | | |
Series I 5.00% 1/1/32 | | | 700,000 | | | | 761,502 | |
Series L 5.00% 1/1/35 | | | 100,000 | | | | 115,276 | |
(Junior Indebtedness Obligation) Series A 5.25% 1/1/56 | | | 1,000,000 | | | | 1,127,960 | |
Port Authority of New York & New Jersey | | | | | | | | |
(JFK International Air Terminal Project) | | | | | | | | |
Series 8 6.00% 12/1/42 | | | 700,000 | | | | 762,433 | |
Series 8 6.50% 12/1/28 | | | 550,000 | | | | 574,948 | |
Triborough Bridge & Tunnel Authority | | | | | | | | |
Unrefunded Series C 5.00% 11/15/24 | | | 80,000 | | | | 80,550 | |
(MTA Bridges and Tunnels) Series A 5.00% 11/15/47 | | | 1,000,000 | | | | 1,136,440 | |
| | | | | | | | |
| | | | | | | 5,643,857 | |
| | | | | | | | |
76
| | | | | | | | |
| | | Principal amount° | | | Value (US $) | |
| |
Municipal Bonds (continued) | | | | | | | | |
| |
Water & Sewer Revenue Bonds – 2.88% | | | | | | | | |
New York City Municipal Water Finance Authority Water & Sewer System Revenue | | | | | | | | |
(Second General Resolution) | | | | | | | | |
Fiscal 2009 Series FF-2 5.50% 6/15/40 | | | 250,000 | | | $ | 257,243 | |
Fiscal 2012 Series BB 5.25% 6/15/44 | | | 500,000 | | | | 548,955 | |
Fiscal 2017 Series DD 5.00% 6/15/47 | | | 1,000,000 | | | | 1,133,830 | |
New York State Environmental Facilities Revenue | | | | | | | | |
(New York City Municipal Water Finance Authority | | | | | | | | |
Projects - Second Resolution) Series B 5.00% 6/15/30 | | | 500,000 | | | | 541,310 | |
| | | | | | | | |
| | | | | | | 2,481,338 | |
| | | | | | | | |
Total Municipal Bonds (cost $84,092,297) | | | | | | | 86,476,149 | |
| | | | | | | | |
| | | | | | | | |
| |
Short-Term Investments – 0.29% | | | | | | | | |
| |
Variable Rate Demand Notes – 0.29%¤ | | | | | | | | |
New York City Series l-2 | | | | | | | | |
1.47% 3/1/40 (SPA - JPMorgan Chase Bank N.A.) | | | 100,000 | | | | 100,000 | |
New York City Transitional Finance Authority Revenue | | | | | | | | |
(Future Tax Secured) Series E-3 | | | | | | | | |
1.47% 2/1/45 (SPA - JPMorgan Chase Bank N.A.) | | | 150,000 | | | | 150,000 | |
| | | | | | | | |
Total Short-Term Investments (cost $250,000) | | | | | | | 250,000 | |
| | | | | | | | |
| | |
Total Value of Securities – 100.77%
(cost $84,342,297) | | | | | | $ | 86,726,149 | |
| | | | | | | | |
| | # | Security exempt from registration under Rule 144A of the Securities Act of 1933, as amended. At Aug. 31, 2018, the aggregate value of Rule 144A securities was $7,601,475, which represents 8.83% of the Fund’s net assets. See Note 8 in “Notes to financial statements.” |
| | ¤ | Tax-exempt obligations that contain a floating or variable interest rate adjustment formula and an unconditional right of demand to receive payment of the unpaid principal balance plus accrued interest upon a short notice period (generally up to 30 days) prior to specified dates either from the issuer or by drawing on a bank letter of credit, a guarantee, or insurance issued with respect to such instrument. Each rate shown is as of Aug. 31, 2018. |
| | § | Pre-refunded bonds. Municipal bonds that are generally backed or secured by US Treasury bonds. For pre-refunded bonds, the stated maturity is followed by the year in which the bond will be pre-refunded. See Note 8 in “Notes to financial statements.” |
| | ° | Principal amount shown is stated in US Dollars unless noted that the security is denominated in another currency. |
77
Schedules of investments
Delaware Tax-Free New York Fund
Summary of abbreviations:
AGM – Insured by Assured Guaranty Municipal Corporation
AMT – Subject to Alternative Minimum Tax
FHA – Federal Housing Administration
N.A. – National Association
SPA – Stand-by Purchase Agreement
See accompanying notes, which are an integral part of the financial statements.
78
| | |
| Schedules of investments |
| Delaware Tax-Free Pennsylvania Fund | | August 31, 2018 |
| | | | | | | | |
| | | Principal amount° | | | Value (US $) | |
| |
Municipal Bonds – 98.77% | | | | | | | | |
| |
Corporate Revenue Bonds – 5.72% | | | | | | | | |
Pennsylvania Commonwealth Financing Authority Revenue | | | | | | | | |
(Tobacco Master Settlement Payment Revenue) | | | | | | | | |
4.00% 6/1/39 (AGM) | | | 5,045,000 | | | $ | 5,163,457 | |
Pennsylvania Economic Development Financing Authority | | | | | | | | |
(National Gypsum) 5.50% 11/1/44 (AMT) | | | 4,000,000 | | | | 4,219,320 | |
Pennsylvania Economic Development Financing Authority Solid Waste Disposal Revenue | | | | | | | | |
(Proctor & Gamble Paper Project) 5.375% 3/1/31 (AMT) | | | 11,000,000 | | | | 13,183,280 | |
Pennsylvania Economic Development Financing Authority Water Facility Revenue | | | | | | | | |
(Pennsylvania-American Water Project) 6.20% 4/1/39 | | | 2,850,000 | | | | 2,917,716 | |
| | | | | | | | |
| | | | | | | 25,483,773 | |
| | | | | | | | |
Education Revenue Bonds – 14.42% | | | | | | | | |
Allegheny County Higher Education Building Authority Revenue | | | | | | | | |
(Carnegie Mellon University) | | | | | | | | |
5.00% 3/1/28 | | | 2,000,000 | | | | 2,235,400 | |
Series A 5.00% 3/1/24 | | | 1,000,000 | | | | 1,099,190 | |
(Chatham University) Series A 5.00% 9/1/30 | | | 1,500,000 | | | | 1,577,940 | |
(Robert Morris University) | | | | | | | | |
5.00% 10/15/47 | | | 1,500,000 | | | | 1,620,660 | |
Series A 5.50% 10/15/30 | | | 1,275,000 | | | | 1,342,371 | |
Series A 5.75% 10/15/40 | | | 2,200,000 | | | | 2,316,776 | |
Bucks County Industrial Development Authority Revenue | | | | | | | | |
(George School Project) 5.00% 9/15/36 | | | 4,455,000 | | | | 4,791,308 | |
(School Lane Charter School Project) Series A | | | | | | | | |
5.125% 3/15/46 | | | 2,500,000 | | | | 2,660,600 | |
Chester County Industrial Development Authority Revenue | | | | | | | | |
(Avon Grove Charter School Project) | | | | | | | | |
Series A 5.00% 12/15/47 | | | 1,160,000 | | | | 1,208,882 | |
Series A 5.00% 12/15/51 | | | 770,000 | | | | 796,527 | |
(Renaissance Academy Charter School Project) | | | | | | | | |
5.00% 10/1/34 | | | 1,000,000 | | | | 1,069,530 | |
5.00% 10/1/39 | | | 1,250,000 | | | | 1,327,137 | |
5.00% 10/1/44 | | | 1,000,000 | | | | 1,057,830 | |
Chester County Industrial Development Authority Student Housing Revenue | | | | | | | | |
(West Chester University Project) | | | | | | | | |
Series A 5.00% 8/1/30 | | | 1,100,000 | | | | 1,188,165 | |
Series A 5.00% 8/1/45 | | | 1,250,000 | | | | 1,311,375 | |
Delaware County Authority Revenue | | | | | | | | |
(Cabrini University) 5.00% 7/1/47 | | | 2,000,000 | | | | 2,124,400 | |
79
Schedules of investments
Delaware Tax-Free Pennsylvania Fund
| | | | | | | | |
| | | Principal amount° | | | Value (US $) | |
| |
Municipal Bonds (continued) | | | | | | | | |
| |
Education Revenue Bonds (continued) | | | | | | | | |
East Hempfield Township Industrial Development Authority | | | | | | | | |
(Student Services - Student Housing Project at Millersville University) | | | | | | | | |
5.00% 7/1/39 | | | 875,000 | | | $ | 929,337 | |
5.00% 7/1/45 | | | 2,500,000 | | | | 2,635,425 | |
5.00% 7/1/46 | | | 1,425,000 | | | | 1,508,149 | |
5.00% 7/1/47 | | | 1,000,000 | | | | 1,062,200 | |
Montgomery County Higher Education & Health Authority Revenue | | | | | | | | |
(Arcadia University) | | | | | | | | |
5.625% 4/1/40 | | | 2,375,000 | | | | 2,456,273 | |
5.75% 4/1/40 | | | 2,000,000 | | | | 2,180,240 | |
Pennsylvania Higher Educational Facilities Authority College & University Revenue | | | | | | | | |
(Drexel University) 5.00% 5/1/41 | | | 1,000,000 | | | | 1,117,420 | |
(Shippensburg University - Student Housing Project) | | | | | | | | |
5.00% 10/1/44 | | | 1,500,000 | | | | 1,556,385 | |
6.25% 10/1/43 | | | 2,000,000 | | | | 2,176,100 | |
Philadelphia Authority for Industrial Development Revenue | | | | | | | | |
(First Philadelphia Preparatory Charter School Project) | | | | | | | | |
Series A 7.25% 6/15/43 | | | 2,500,000 | | | | 2,832,550 | |
(Green Woods Charter School Project) | | | | | | | | |
Series A 5.50% 6/15/22 | | | 735,000 | | | | 764,951 | |
Series A 5.75% 6/15/42 | | | 2,500,000 | | | | 2,582,825 | |
(International Apartments of Temple University) | | | | | | | | |
Series A 5.375% 6/15/30 | | | 1,500,000 | | | | 1,556,925 | |
Series A 5.625% 6/15/42 | | | 3,000,000 | | | | 3,088,380 | |
(New Foundations Charter School Project) | | | | | | | | |
6.625% 12/15/41 | | | 1,000,000 | | | | 1,099,390 | |
(Philadelphia Performing Arts Charter School Project) | | | | | | | | |
144A 6.75% 6/15/43 # | | | 2,550,000 | | | | 2,663,169 | |
(Tacony Academy Charter School Project) | | | | | | | | |
Series A-1 6.75% 6/15/33 | | | 1,020,000 | | | | 1,110,729 | |
Series A-1 7.00% 6/15/43 | | | 1,535,000 | | | | 1,678,185 | |
(Temple University Second Series) 5.00% 4/1/36 | | | 1,145,000 | | | | 1,279,205 | |
State Public School Building Authority | | | | | | | | |
(Montgomery County Community College) | | | | | | | | |
5.00% 5/1/28 | | | 2,000,000 | | | | 2,286,300 | |
| | | | | | | | |
| | | | | | | 64,292,229 | |
| | | | | | | | |
80
| | | | | | | | |
| | | Principal amount° | | | Value (US $) | |
| |
Municipal Bonds (continued) | | | | | | | | |
| |
Healthcare Revenue Bonds – 29.26% | | | | | | | | |
Allegheny County Hospital Development Authority Revenue | | | | | | | | |
(Allegheny Health Network Obligated Group Issue) | | | | | | | | |
Series A 4.00% 4/1/44 | | | 1,350,000 | | | $ | 1,335,029 | |
(University of Pittsburgh Medical Center) Series A | | | | | | | | |
5.50% 8/15/34 | | | 3,980,000 | | | | 4,102,027 | |
Berks County Industrial Development Authority Revenue | | | | | | | | |
(The Highlands At Wyomissing) | | | | | | | | |
5.00% 5/15/38 | | | 415,000 | | | | 451,653 | |
5.00% 5/15/43 | | | 500,000 | | | | 542,295 | |
5.00% 5/15/48 | | | 1,000,000 | | | | 1,081,500 | |
Series A 5.00% 5/15/37 | | | 1,365,000 | | | | 1,485,243 | |
Series A 5.00% 5/15/42 | | | 500,000 | | | | 541,735 | |
Series A 5.00% 5/15/47 | | | 600,000 | | | | 647,778 | |
Series C 5.00% 5/15/42 | | | 1,000,000 | | | | 1,089,950 | |
Series C 5.00% 5/15/47 | | | 1,000,000 | | | | 1,087,240 | |
(Tower Health Project) | | | | | | | | |
4.00% 11/1/47 | | | 2,500,000 | | | | 2,503,700 | |
5.00% 11/1/50 | | | 2,000,000 | | | | 2,185,640 | |
Berks County Municipal Authority Revenue | | | | | | | | |
(Reading Hospital & Medical Center Project) Unrefunded | | | | | | | | |
Series A-3 5.50% 11/1/31 | | | 5,005,000 | | | | 5,209,254 | |
Butler County Hospital Authority Revenue | | | | | | | | |
(Butler Health System Project) Series A 5.00% 7/1/39 | | | 1,625,000 | | | | 1,761,451 | |
Central Bradford Progress Authority | | | | | | | | |
(Guthrie Health Issue) 5.375% 12/1/41 | | | 1,000,000 | | | | 1,091,480 | |
Centre County Hospital Authority Revenue | | | | | | | | |
(Mount Nittany Medical Center Project) Series A | | | | | | | | |
4.00% 11/15/47 | | | 1,400,000 | | | | 1,403,150 | |
Chester County Health & Education Facilities Authority Revenue | | | | | | | | |
(Simpson Senior Services Project) | | | | | | | | |
Series A 5.00% 12/1/35 | | | 775,000 | | | | 793,848 | |
Series A 5.25% 12/1/45 | | | 1,360,000 | | | | 1,409,572 | |
Cumberland County Municipal Authority Revenue | | | | | | | | |
(Diakon Lutheran Social Ministries Project) | | | | | | | | |
5.00% 1/1/38 | | | 2,000,000 | | | | 2,165,200 | |
Unrefunded 6.375% 1/1/39 | | | 495,000 | | | | 500,668 | |
Dauphin County General Authority Health System Revenue | | | | | | | | |
(Pinnacle Health System Project) Unrefunded | | | | | | | | |
6.00% 6/1/36 | | | 795,000 | | | | 816,099 | |
DuBois Hospital Authority | | | | | | | | |
(Penn Highlands Healthcare) 4.00% 7/15/48 | | | 2,000,000 | | | | 1,996,460 | |
81
Schedules of investments
Delaware Tax-Free Pennsylvania Fund
| | | | | | | | |
| | | Principal amount° | | | Value (US $) | |
| |
Municipal Bonds (continued) | | | | | | | | |
| |
Healthcare Revenue Bonds (continued) | | | | | | | | |
Franklin County Industrial Development Authority Revenue | | | | | | | | |
(Chambersburg Hospital Project) 5.375% 7/1/42 | | | 4,980,000 | | | $ | 5,251,559 | |
(Menno-Haven Project) 5.00% 12/1/53 | | | 1,900,000 | | | | 1,950,369 | |
Geisinger Authority Health System Revenue | | | | | | | | |
(Geisinger Health System) | | | | | | | | |
Series A-1 5.00% 2/15/45 | | | 5,000,000 | | | | 5,618,000 | |
Series A-1 5.125% 6/1/41 | | | 4,000,000 | | | | 4,249,920 | |
Indiana County Hospital Authority Revenue | | | | | | | | |
(Indiana Regional Medical Center) Series A | | | | | | | | |
6.00% 6/1/39 | | | 1,625,000 | | | | 1,752,286 | |
Lancaster County Hospital Authority Revenue | | | | | | | | |
(Brethren Village Project) | | | | | | | | |
5.25% 7/1/35 | | | 250,000 | | | | 271,593 | |
5.25% 7/1/41 | | | 1,000,000 | | | | 1,099,120 | |
5.50% 7/1/45 | | | 1,000,000 | | | | 1,098,110 | |
(Landis Homes Retirement Community Project) Series A | | | | | | | | |
5.00% 7/1/45 | | | 2,000,000 | | | | 2,119,500 | |
(Masonic Villages Project) | | | | | | | | |
5.00% 11/1/35 | | | 1,000,000 | | | | 1,120,750 | |
5.00% 11/1/36 | | | 510,000 | | | | 570,313 | |
5.00% 11/1/37 | | | 250,000 | | | | 278,940 | |
(St. Anne’s Retirement Community Project) | | | | | | | | |
5.00% 4/1/27 | | | 1,425,000 | | | | 1,476,271 | |
5.00% 4/1/33 | | | 1,830,000 | | | | 1,873,151 | |
Lehigh County General Purpose Authority Revenue | | | | | | | | |
(Bible Fellowship Church Homes Project) | | | | | | | | |
5.125% 7/1/32 | | | 1,000,000 | | | | 1,013,600 | |
5.25% 7/1/42 | | | 1,500,000 | | | | 1,520,595 | |
Monroe County Hospital Authority Revenue | | | | | | | | |
(Pocono Medical Center) | | | | | | | | |
5.00% 7/1/36 | | | 1,710,000 | | | | 1,893,979 | |
5.00% 7/1/41 | | | 1,000,000 | | | | 1,099,660 | |
Monroeville Finance Authority | | | | | | | | |
5.00% 2/15/25 | | | 1,000,000 | | | | 1,150,510 | |
Montgomery County Higher Education & Health Authority Revenue | | | | | | | | |
(Thomas Jefferson University) Series A 4.00% 9/1/49 | | | 2,500,000 | | | | 2,502,025 | |
Montgomery County Industrial Development Authority Retirement Community Revenue | | | | | | | | |
(ACTS Retirement Life Communities Obligated Group) | | | | | | | | |
5.00% 11/15/27 | | | 1,250,000 | | | | 1,342,188 | |
5.00% 11/15/28 | | | 1,600,000 | | | | 1,713,952 | |
82
| | | | | | | | |
| | | Principal amount° | | | Value (US $) | |
| |
Municipal Bonds (continued) | | | | | | | | |
| |
Healthcare Revenue Bonds (continued) | | | | | | | | |
Montgomery County Industrial Development Authority Retirement Community Revenue | | | | | | | | |
(ACTS Retirement Life Communities Obligated Group) | | | | | | | | |
5.00% 11/15/29 | | | 680,000 | | | $ | 726,947 | |
Montgomery County Industrial Development Authority Revenue | | | | | | | | |
(Albert Einstein Healthcare Network) Series A | | | | | | | | |
5.25% 1/15/45 | | | 2,500,000 | | | | 2,663,750 | |
(Whitemarsh Continuing Care Retirement Community Project) 5.375% 1/1/50 | | | 4,000,000 | | | | 4,045,600 | |
Moon Industrial Development Authority Revenue | | | | | | | | |
(Baptist Homes Society) 6.125% 7/1/50 | | | 4,000,000 | | | | 4,285,720 | |
Northampton County Industrial Development Authority | | | | | | | | |
(Morningstar Senior Living Project) | | | | | | | | |
5.00% 7/1/27 | | | 1,400,000 | | | | 1,453,620 | |
5.00% 7/1/32 | | | 1,275,000 | | | | 1,307,882 | |
Pennsylvania Economic Development Financing Authority First Mortgage Revenue | | | | | | | | |
(Tapestry Moon Senior Housing Project) Series A 144A | | | | | | | | |
6.75% 12/1/53 # | | | 2,250,000 | | | | 2,328,683 | |
Pennsylvania Economic Development Financing Authority Revenue | | | | | | | | |
(University of Pittsburgh Medical Center) Series A | | | | | | | | |
5.00% 7/1/43 | | | 1,265,000 | | | | 1,363,012 | |
Pennsylvania Higher Educational Facilities Authority College & University Revenue | | | | | | | | |
(Thomas Jefferson University) | | | | | | | | |
Series A 5.00% 9/1/45 | | | 7,000,000 | | | | 7,677,110 | |
Series A 5.25% 9/1/50 | | | 2,500,000 | | | | 2,770,350 | |
Pennsylvania Higher Educational Facilities Authority Revenue | | | | | | | | |
(University of Pennsylvania Health System) | | | | | | | | |
5.00% 8/15/40 | | | 2,000,000 | | | | 2,233,100 | |
Series A 4.00% 8/15/42 | | | 4,000,000 | | | | 4,099,800 | |
Philadelphia Authority for Industrial Development Revenue | | | | | | | | |
(Children’s Hospital of Philadelphia Project) | | | | | | | | |
5.00% 7/1/34 | | | 5,000,000 | | | | 5,765,700 | |
(Thomas Jefferson University) Series A | | | | | | | | |
5.00% 9/1/47 | | | 2,500,000 | | | | 2,761,750 | |
(Wesley Enhanced Living Obligated Group) Series A | | | | | | | | |
5.00% 7/1/49 | | | 2,500,000 | | | | 2,644,150 | |
Pocono Mountains Industrial Park Authority Revenue | | | | | | | | |
(St. Luke’s Hospital - Monroe Project) Series A | | | | | | | | |
5.00% 8/15/40 | | | 4,000,000 | | | | 4,333,800 | |
83
Schedules of investments
Delaware Tax-Free Pennsylvania Fund
| | | | | | | | |
| | | Principal amount° | | | Value (US $) | |
| |
Municipal Bonds (continued) | | | | | | | | |
| |
Healthcare Revenue Bonds (continued) | | | | | | | | |
St. Mary Hospital Authority Health System Revenue | | | | | | | | |
(Catholic Health East) 6.25% 11/15/34 | | | 4,675,000 | | | $ | 4,815,811 | |
| | | | | | | | |
| | | | | | | 130,444,148 | |
| | | | | | | | |
Housing Revenue Bond – 0.48% | | | | | | | | |
Philadelphia Authority for Industrial Development Revenue | | | | | | | | |
(The PresbyHomes Germantown Project) Series A | | | | | | | | |
5.625% 7/1/35 (HUD) | | | 2,140,000 | | | | 2,141,969 | |
| | | | | | | | |
| | | | | | | 2,141,969 | |
| | | | | | | | |
Lease Revenue Bonds – 3.63% | | | | | | | | |
Allegheny County Industrial Development Authority Revenue | | | | | | | | |
(Residential Resource Project) 5.10% 9/1/26 | | | 1,335,000 | | | | 1,337,083 | |
5.125% 9/1/31 | | | 540,000 | | | | 540,464 | |
Pennsylvania Commonwealth Financing Authority Revenue | | | | | | | | |
Series B 5.00% 6/1/31 (AGC) | | | 10,000,000 | | | | 10,211,200 | |
Philadelphia Municipal Authority Revenue | | | | | | | | |
(Juvenile Justice Services Center) | | | | | | | | |
5.00% 4/1/37 | | | 1,250,000 | | | | 1,373,225 | |
5.00% 4/1/38 | | | 1,000,000 | | | | 1,096,260 | |
5.00% 4/1/39 | | | 1,500,000 | | | | 1,642,080 | |
| | | | | | | | |
| | | | | | | 16,200,312 | |
| | | | | | | | |
Local General Obligation Bonds – 4.27% | | | | | | | | |
Allegheny County | | | | | | | | |
Series C-69 5.00% 12/1/28 | | | 1,000,000 | | | | 1,103,740 | |
Series C-70 5.00% 12/1/33 | | | 2,205,000 | | | | 2,416,945 | |
City of Philadelphia | | | | | | | | |
5.00% 8/1/41 | | | 1,260,000 | | | | 1,395,362 | |
Series A 5.00% 8/1/37 | | | 1,750,000 | | | | 1,949,308 | |
Series A 5.25% 7/15/29 | | | 2,500,000 | | | | 2,797,575 | |
City of Pittsburgh | | | | | | | | |
Series B 5.00% 9/1/26 | | | 3,000,000 | | | | 3,315,480 | |
Philadelphia School District | | | | | | | | |
Series F 5.00% 9/1/36 | | | 2,000,000 | | | | 2,206,040 | |
Series F 5.00% 9/1/37 | | | 1,500,000 | | | | 1,651,230 | |
Series F 5.00% 9/1/38 | | | 2,000,000 | | | | 2,197,260 | |
| | | | | | | | |
| | | | | | | 19,032,940 | |
| | | | | | | | |
Pre-Refunded/Escrowed to Maturity Bonds – 21.81% | | | | | | | | |
Allegheny County Higher Education Building Authority Revenue | | | | | | | | |
(Carlow University Project) | | | | | | | | |
6.75% 11/1/31-21§ | | | 750,000 | | | | 858,637 | |
84
| | | | | | | | |
| | | Principal amount° | | | Value (US $) | |
| |
Municipal Bonds (continued) | | | | | | | | |
| |
Pre-Refunded/Escrowed to Maturity Bonds (continued) | | | | | | | | |
Allegheny County Higher Education Building Authority Revenue | | | | | | | | |
(Carlow University Project) | | | | | | | | |
7.00% 11/1/40-21§ | | | 1,000,000 | | | $ | 1,152,460 | |
Butler County Hospital Authority Revenue | | | | | | | | |
(Butler Health System Project) Series B 7.25% 7/1/39-19§ | | | 8,000,000 | | | | 8,360,720 | |
Chester County | | | | | | | | |
5.00% 11/15/32-21§ | | | 5,725,000 | | | | 6,283,588 | |
5.00% 11/15/33-21§ | | | 2,625,000 | | | | 2,881,121 | |
Cumberland County Municipal Authority Revenue | | | | | | | | |
(Diakon Lutheran Social Ministries Project) | | | | | | | | |
6.375% 1/1/39-19§ | | | 4,505,000 | | | | 4,573,566 | |
Dauphin County General Authority Health System Revenue | | | | | | | | |
(Pinnacle Health System Project) 6.00% 6/1/36-19§ | | | 4,205,000 | | | | 4,339,602 | |
Delaware County Regional Water Quality Control Authority | | | | | | | | |
5.00% 5/1/32-23§ | | | 2,000,000 | | | | 2,259,700 | |
Guam Government Limited Obligation Revenue | | | | | | | | |
(Section 30) Series A 5.625% 12/1/29-19§ | | | 90,000 | | | | 94,287 | |
Huntingdon County General Authority Revenue | | | | | | | | |
(Juniata College) Series A 5.00% 5/1/30-20§ | | | 2,650,000 | | | | 2,827,285 | |
Monroe County Hospital Authority | | | | | | | | |
(Pocono Medical Center) | | | | | | | | |
Series A 5.00% 1/1/32-22§ | | | 1,150,000 | | | | 1,261,101 | |
Series A 5.00% 1/1/41-22§ | | | 1,500,000 | | | | 1,644,915 | |
Montgomery County Higher Education & Health Authority Revenue | | | | | | | | |
(Abington Memorial Hospital Obligated Group) | | | | | | | | |
Series A 5.00% 6/1/31-22§ | | | 4,000,000 | | | | 4,428,600 | |
Montgomery County Industrial Development Authority Retirement Community Revenue | | | | | | | | |
(ACTS Retirement Life Communities) | | | | | | | | |
Series A-1 6.25% 11/15/29-19§ | | | 700,000 | | | | 737,996 | |
Montgomery County Industrial Development Authority Revenue | | | | | | | | |
(New Regional Medical Center Project) | | | | | | | | |
5.375% 8/1/38-20 (FHA)§ | | | 995,000 | | | | 1,062,869 | |
Pennsylvania Economic Development Financing Authority Health System Revenue | | | | | | | | |
(Albert Einstein Healthcare) Series A | | | | | | | | |
6.25% 10/15/23-19§ | | | 3,930,000 | | | | 4,080,205 | |
85
Schedules of investments
Delaware Tax-Free Pennsylvania Fund
| | | | | | | | |
| | | Principal amount° | | | Value (US $) | |
| |
Municipal Bonds (continued) | | | | | | | | |
| |
Pre-Refunded/Escrowed to Maturity Bonds (continued) | | | | | | | | |
Pennsylvania Higher Educational Facilities Authority College & University Revenue | | | | | | | | |
(AICUP Financing Program - St. Francis University Project) | | | | | | | | |
Series JJ2 6.25% 11/1/41-21§ | | | 2,355,000 | | | $ | 2,664,164 | |
(Edinboro University Foundation Student Housing Project) 6.00% 7/1/43-20§ | | | 1,000,000 | | | | 1,073,990 | |
(Indiana University - Student Housing Project) | | | | | | | | |
Series A 5.00% 7/1/27-22§ | | | 1,740,000 | | | | 1,929,086 | |
Series A 5.00% 7/1/41-22§ | | | 1,500,000 | | | | 1,663,005 | |
(Philadelphia University) 5.00% 6/1/32-23§ | | | 2,000,000 | | | | 2,263,160 | |
(University of the Arts) 5.20% 3/15/25 (AGC) | | | 4,490,000 | | | | 5,014,746 | |
Pennsylvania Higher Educational Facilities Authority Revenue | | | | | | | | |
(Trustees of the University of Pennsylvania) | | | | | | | | |
5.00% 9/1/29-20§ | | | 1,000,000 | | | | 1,063,860 | |
Series A 5.00% 9/1/29-21§ | | | 1,000,000 | | | | 1,078,560 | |
(University of Pennsylvania Health System) | | | | | | | | |
Series A 5.00% 8/15/24-21§ | | | 4,850,000 | | | | 5,288,731 | |
Series A 5.25% 8/15/26-21§ | | | 3,910,000 | | | | 4,291,577 | |
Series A 5.75% 8/15/23-21§ | | | 2,500,000 | | | | 2,779,650 | |
Pennsylvania Turnpike Commission Revenue | | | | | | | | |
Series E 5.00% 12/1/29-21§ | | | 5,000,000 | | | | 5,461,450 | |
Series E 5.00% 12/1/30-21§ | | | 2,000,000 | | | | 2,184,580 | |
Philadelphia Authority for Industrial Development Revenue | | | | | | | | |
(MaST Charter School Project) 6.00% 8/1/35-20§ | | | 1,610,000 | | | | 1,732,296 | |
Philadelphia Hospitals & Higher Education Facilities Authority Revenue | | | | | | | | |
(Presbyterian Medical Center) 6.65% 12/1/19 | | | 3,915,000 | | | | 4,062,478 | |
Philadelphia Municipal Authority Revenue | | | | | | | | |
6.50% 4/1/39-19§ | | | 4,000,000 | | | | 4,112,520 | |
South Fork Municipal Hospital Authority Revenue | | | | | | | | |
(Conemaugh Health System Project) 5.50% 7/1/29-20§ | | | 3,500,000 | | | | 3,727,780 | |
| | | | | | | | |
| | | | | | | 97,238,285 | |
| | | | | | | | |
Resource Recovery Revenue Bonds – 0.62% | | | | | | | | |
Delaware County Industrial Development Authority | | | | | | | | |
(Covanta Project) Series A 5.00% 7/1/43 | | | 2,155,000 | | | | 2,178,770 | |
Pennsylvania Economic Development Financing Authority | | | | | | | | |
(Colver Project) Series F | | | | | | | | |
4.625% 12/1/18 (AMBAC) (AMT) | | | 560,000 | | | | 564,138 | |
| | | | | | | | |
| | | | | | | 2,742,908 | |
| | | | | | | | |
86
| | | | | | | | |
| | | Principal amount° | | | Value (US $) | |
| |
Municipal Bonds (continued) | | | | | | | | |
| |
Special Tax Revenue Bonds – 3.71% | | | | | | | | |
Allentown Neighborhood Improvement Zone Development Authority Revenue | | | | | | | | |
Series A 5.00% 5/1/42 | | | 2,500,000 | | | $ | 2,584,100 | |
(City Center Project) 144A 5.00% 5/1/42 # | | | 2,500,000 | | | | 2,715,175 | |
(City Center Refunding Project) 144A 5.00% 5/1/42 # | | | 2,500,000 | | | | 2,694,525 | |
Chester County Industrial Development Authority Special Obligation Revenue | | | | | | | | |
(Woodlands at Greystone Project) | | | | | | | | |
144A 5.00% 3/1/38 # | | | 560,000 | | | | 572,309 | |
144A 5.125% 3/1/48 # | | | 1,000,000 | | | | 1,023,000 | |
Northampton County Industrial Development Authority | | | | | | | | |
(Route 33 Project) 7.00% 7/1/32 | | | 2,000,000 | | | | 2,271,880 | |
Sports & Exhibition Authority of Pittsburgh & Allegheny County | | | | | | | | |
(Hotel Room Excise Tax) 5.00% 2/1/35 (AGM) | | | 3,000,000 | | | | 3,148,380 | |
Washington County Redevelopment Authority Revenue | | | | | | | | |
(Victory Centre Tax Increment Financing Project) | | | | | | | | |
5.00% 7/1/35 | | | 1,500,000 | | | | 1,536,975 | |
| | | | | | | | |
| | | | | | | 16,546,344 | |
| | | | | | | | |
State General Obligation Bond – 0.64% | | | | | | | | |
Commonwealth of Pennsylvania | | | | | | | | |
(First Refunding Series) 5.00% 1/1/26 | | | 2,500,000 | | | | 2,874,250 | |
| | | | | | | | |
| | | | | | | 2,874,250 | |
| | | | | | | | |
Transportation Revenue Bonds – 10.14% | | | | | | | | |
Delaware River Joint Toll Bridge Commission | | | | | | | | |
(Pennsylvania - New Jersey) 5.00% 7/1/47 | | | 5,000,000 | | | | 5,686,800 | |
Pennsylvania Economic Development Financing Authority Exempt Facilities Revenue | | | | | | | | |
(Amtrak Project) | | | | | | | | |
Series A 5.00% 11/1/32 (AMT) | | | 3,500,000 | | | | 3,737,545 | |
Series A 5.00% 11/1/41 (AMT) | | | 5,000,000 | | | | 5,313,350 | |
Pennsylvania Turnpike Commission Revenue | | | | | | | | |
Series A 5.00% 12/1/22 | | | 2,550,000 | | | | 2,852,736 | |
Series A 5.00% 12/1/23 | | | 2,450,000 | | | | 2,790,232 | |
Series C 5.00% 12/1/44 | | | 5,000,000 | | | | 5,496,200 | |
Subordinate Series B-1 5.25% 6/1/47 | | | 5,000,000 | | | | 5,593,700 | |
Subordinate Third Series 5.00% 12/1/40 | | | 2,500,000 | | | | 2,752,225 | |
Philadelphia Airport Revenue | | | | | | | | |
Series B 5.00% 7/1/47 (AMT) | | | 3,000,000 | | | | 3,326,880 | |
Port Authority of Allegheny County | | | | | | | | |
5.75% 3/1/29 | | | 5,200,000 | | | | 5,668,468 | |
87
Schedules of investments
Delaware Tax-Free Pennsylvania Fund
| | | | | | | | |
| | | Principal amount° | | | Value (US $) | |
| |
Municipal Bonds (continued) | | | | | | | | |
| |
Transportation Revenue Bonds (continued) | | | | | | | | |
Susquehanna Area Regional Airport Authority Revenue | | | | | | | | |
5.00% 1/1/35 (AMT) | | | 800,000 | | | $ | 883,984 | |
5.00% 1/1/38 (AMT) | | | 1,000,000 | | | | 1,095,050 | |
| | | | | | | | |
| | | | | | | 45,197,170 | |
| | | | | | | | |
Water & Sewer Revenue Bonds – 4.07% | | | | | | | | |
Allegheny County Sanitary Authority | | | | | | | | |
5.00% 12/1/28 (BAM) | | | 2,345,000 | | | | 2,687,440 | |
Bucks County Water & Sewer Authority | | | | | | | | |
5.00% 12/1/28 (AGM) | | | 1,000,000 | | | | 1,182,430 | |
Series A 5.00% 12/1/37 (AGM) | | | 780,000 | | | | 875,199 | |
Series A 5.00% 12/1/40 (AGM) | | | 1,000,000 | | | | 1,118,410 | |
Guam Government Waterworks Authority | | | | | | | | |
5.00% 7/1/35 | | | 670,000 | | | | 745,147 | |
5.00% 7/1/36 | | | 1,000,000 | | | | 1,109,760 | |
5.00% 1/1/46 | | | 1,450,000 | | | | 1,580,021 | |
Philadelphia Water & Wastewater Revenue | | | | | | | | |
5.00% 11/1/28 | | | 4,500,000 | | | | 4,967,460 | |
Series A 5.00% 7/1/45 | | | 2,500,000 | | | | 2,748,350 | |
Series A 5.25% 10/1/52 | | | 1,000,000 | | | | 1,145,030 | |
| | | | | | | | |
| | | | | | | 18,159,247 | |
| | | | | | | | |
Total Municipal Bonds (cost $421,351,721) | | | | | | | 440,353,575 | |
| | | | | | | | |
| | | | | | | | |
| |
Short-Term Investments – 0.60% | | | | | | | | |
| |
Variable Rate Demand Notes – 0.60%¤ | | | | | | | | |
Philadelphia Hospitals & Higher Education Facilities Authority Revenue | | | | | | | | |
(Children’s Hospital of Philadelphia Project) | | | | | | | | |
Series B 1.43% 7/1/25 (SPA - Wells Fargo Bank N.A.) | | | 2,500,000 | | | | 2,500,000 | |
Series B 1.43% 7/1/41 (SPA - Wells Fargo Bank N.A.) | | | 200,000 | | | | 200,000 | |
| | | | | | | | |
Total Short-Term Investments (cost $2,700,000) | | | | | | | 2,700,000 | |
| | | | | | | | |
| | |
Total Value of Securities – 99.37% (cost $424,051,721) | | | | | | $ | 443,053,575 | |
| | | | | | | | |
| # | Security exempt from registration under Rule 144A of the Securities Act of 1933, as amended. At Aug. 31, 2018, the aggregate value of Rule 144A securities was $11,996,861, which represents 2.69% of the Fund’s net assets. See Note 8 in “Notes to financial statements.” |
| ¤ | Tax-exempt obligations that contain a floating or variable interest rate adjustment formula and an unconditional right of demand to receive payment of the unpaid principal balance plus accrued interest upon a short notice period (generally up to 30 days) prior to specified dates either from the issuer or by drawing on a bank letter of credit, a guarantee, or insurance issued with respect to such instrument. Each rate shown is as of Aug. 31, 2018. |
88
| § | Pre-refunded bonds. Municipal bonds that are generally backed or secured by US Treasury bonds. For pre-refunded bonds, the stated maturity is followed by the year in which the bond will be pre-refunded. See Note 8 in “Notes to financial statements.” |
| ° | Principal amount shown is stated in US Dollars unless noted that the security is denominated in another currency. |
Summary of abbreviations:
AGC – Insured by Assured Guaranty Corporation
AGM – Insured by Assured Guaranty Municipal Corporation
AMBAC – Insured by AMBAC Assurance Corporation
AMT – Subject to Alternative Minimum Tax
BAM – Insured by Build America Mutual Assurance
FHA – Federal Housing Administration
HUD – Housing and Urban Development Section 8
N.A. – National Association
SPA – Stand-by Purchase Agreement
See accompanying notes, which are an integral part of the financial statements.
89
Statements of assets and liabilities
August 31, 2018
| | | | | | | | | | | | | | | |
| | | Delaware Tax-Free
Arizona Fund | | Delaware Tax-Free
California Fund | | Delaware Tax-Free
Colorado Fund |
Assets: | | | | | | | | | | | | | | | |
Investments, at value1 | | | $ | 75,384,310 | | | | $ | 99,169,414 | | | | $ | 201,288,767 | |
Interest receivable | | | | 744,585 | | | | | 1,208,086 | | | | | 2,359,863 | |
Receivable for securities sold | | | | 578,560 | | | | | 1,063,715 | | | | | — | |
Receivable for fund shares sold | | | | — | | | | | 6,205 | | | | | 40,076 | |
| | | | | | | | | | | | | | | |
Total assets | | | | 76,707,455 | | | | | 101,447,420 | | | | | 203,688,706 | |
| | | | | | | | | | | | | | | |
Liabilities: | | | | | | | | | | | | | | | |
Cash due to custodian | | | | 19,439 | | | | | 42,771 | | | | | 142,475 | |
Distribution payable | | | | 61,847 | | | | | 81,050 | | | | | 166,988 | |
Payable for fund shares redeemed | | | | 13,196 | | | | | 15,007 | | | | | 20,667 | |
Payable for securities purchased | | | | — | | | | | 2,083,125 | | | | | 739,718 | |
Investment management fees payable to affiliates | | | | 24,178 | | | | | 32,545 | | | | | 77,994 | |
Other accrued expenses | | | | 19,114 | | | | | 23,637 | | | | | 42,653 | |
Distribution fees payable to affiliates | | | | 16,192 | | | | | 22,337 | | | | | 44,175 | |
Audit and tax fees payable | | | | 4,727 | | | | | 4,727 | | | | | 4,727 | |
Dividend disbursing and transfer agent fees and expenses payable to affiliates | | | | 1,252 | | | | | 1,608 | | | | | 3,298 | |
Accounting and administration expenses payable to affiliates | | | | 584 | | | | | 654 | | | | | 984 | |
Trustees’ fees and expenses payable | | | | 445 | | | | | 571 | | | | | 1,167 | |
Legal fees payable to affiliates | | | | 129 | | | | | 166 | | | | | 333 | |
Reports and statements to shareholders expenses payable to affiliates | | | | 49 | | | | | 64 | | | | | 130 | |
| | | | | | | | | | | | | | | |
Total liabilities | | | | 161,152 | | | | | 2,308,262 | | | | | 1,245,309 | |
| | | | | | | | | | | | | | | |
Total Net Assets | | | $ | 76,546,303 | | | | $ | 99,139,158 | | | | $ | 202,443,397 | |
| | | | | | | | | | | | | | | |
| | | |
Net Assets Consist of: | | | | | | | | | | | | | | | |
Paid-in capital | | | $ | 74,512,531 | | | | $ | 94,913,852 | | | | $ | 198,495,296 | |
Undistributed net investment income | | | | 19,881 | | | | | 18,763 | | | | | 352,558 | |
Accumulated net realized gain (loss) on investments | | | | (477,722 | ) | | | | 141,674 | | | | | (3,879,191 | ) |
Net unrealized appreciation of investments | | | | 2,491,613 | | | | | 4,064,869 | | | | | 7,474,734 | |
| | | | | | | | | | | | | | | |
Total Net Assets | | | $ | 76,546,303 | | | | $ | 99,139,158 | | | | $ | 202,443,397 | |
| | | | | | | | | | | | | | | |
90
| | | | | | | | | | | | |
| | | Delaware Tax-Free
Arizona Fund | | Delaware Tax-Free
California Fund | | Delaware Tax-Free
Colorado Fund |
Net Asset Value | | | | | | | | | | | | |
Class A: | | | | | | | | | | | | |
Net assets | | $ | 63,326,707 | | | $ | 53,170,908 | | | $ | 164,087,320 | |
Shares of beneficial interest outstanding, unlimited authorization, no par | | | 5,635,615 | | | | 4,439,311 | | | | 14,865,299 | |
Net asset value per share | | $ | 11.24 | | | $ | 11.98 | | | $ | 11.04 | |
Sales charge | | | 4.50 | % | | | 4.50 | % | | | 4.50 | % |
Offering price per share, equal to net asset value per share / (1 – sales charge) | | $ | 11.77 | | | $ | 12.54 | | | $ | 11.56 | |
| | | |
Class C: | | | | | | | | | | | | |
Net assets | | $ | 3,122,304 | | | $ | 13,014,938 | | | $ | 10,922,948 | |
Shares of beneficial interest outstanding, unlimited authorization, no par | | | 277,141 | | | | 1,084,700 | | | | 986,888 | |
Net asset value per share | | $ | 11.27 | | | $ | 12.00 | | | $ | 11.07 | |
| | | |
Institutional Class: | | | | | | | | | | | | |
Net assets | | $ | 10,097,292 | | | $ | 32,953,312 | | | $ | 27,433,129 | |
Shares of beneficial interest outstanding, unlimited authorization, no par | | | 898,502 | | | | 2,751,186 | | | | 2,485,345 | |
Net asset value per share | | $ | 11.24 | | | $ | 11.98 | | | $ | 11.04 | |
1Investments, at cost | | $ | 72,892,697 | | | $ | 95,104,545 | | | $ | 193,814,033 | |
See accompanying notes, which are an integral part of the financial statements.
91
Statements of assets and liabilities
| | | | | | | | | | | | | | | |
| | | Delaware Tax-Free
Idaho Fund | | Delaware Tax-Free
New York Fund | | Delaware Tax-Free
Pennsylvania Fund |
Assets: | | | | | | | | | | | | | | | |
Investments, at value1 | | | $ | 97,749,471 | | | | $ | 86,726,149 | | | | $ | 443,053,575 | |
Cash | | | | — | | | | | 32,811 | | | | | — | |
Interest receivable | | | | 1,464,117 | | | | | 938,841 | | | | | 5,790,592 | |
Receivable for securities sold | | | | 932,348 | | | | | — | | | | | — | |
Receivable for fund shares sold | | | | 416,699 | | | | | 10,753 | | | | | 66,573 | |
| | | | | | | | | | | | | | | |
Total assets | | | | 100,562,635 | | | | | 87,708,554 | | | | | 448,910,740 | |
| | | | | | | | | | | | | | | |
Liabilities: | | | | | | | | | | | | | | | |
Cash due to custodian | | | | 376,544 | | | | | — | | | | | 44,054 | |
Payable for securities purchased | | | | 1,623,772 | | | | | 1,500,000 | | | | | 1,930,267 | |
Distribution payable | | | | 73,239 | | | | | 66,203 | | | | | 386,697 | |
Payable for fund shares redeemed | | | | 61,345 | | | | | 122 | | | | | 305,795 | |
Investment management fees payable to affiliates | | | | 36,097 | | | | | 28,235 | | | | | 202,050 | |
Distribution fees payable to affiliates | | | | 27,876 | | | | | 20,940 | | | | | 100,729 | |
Other accrued expenses | | | | 24,138 | | | | | 24,830 | | | | | 82,623 | |
Audit and tax fees payable | | | | 4,727 | | | | | 4,727 | | | | | 4,727 | |
Dividend disbursing and transfer agent fees and expenses payable to affiliates | | | | 1,606 | | | | | 1,402 | | | | | 7,274 | |
Accounting and administration expenses payable to affiliates | | | | 654 | | | | | 614 | | | | | 1,761 | |
Trustees’ fees and expenses payable | | | | 567 | | | | | 495 | | | | | 3,183 | |
Legal fees payable to affiliates | | | | 166 | | | | | 138 | | | | | 739 | |
Reports and statements to shareholders expenses payable to affiliates | | | | 63 | | | | | 55 | | | | | 287 | |
| | | | | | | | | | | | | | | |
Total liabilities | | | | 2,230,794 | | | | | 1,647,761 | | | | | 3,070,186 | |
| | | | | | | | | | | | | | | |
Total Net Assets | | | $ | 98,331,841 | | | | $ | 86,060,793 | | | | $ | 445,840,554 | |
| | | | | | | | | | | | | | | |
| | | |
Net Assets Consist of: | | | | | | | | | | | | | | | |
Paid-in capital | | | $ | 100,557,328 | | | | $ | 84,223,048 | | | | $ | 426,971,162 | |
Distributions in excess of net investment income | | | | (16,709 | ) | | | | (650 | ) | | | | (108,965 | ) |
Accumulated net realized loss on investments | | | | (4,592,535 | ) | | | | (545,457 | ) | | | | (23,497 | ) |
Net unrealized appreciation of investments | | | | 2,383,757 | | | | | 2,383,852 | | | | | 19,001,854 | |
| | | | | | | | | | | | | | | |
Total Net Assets | | | $ | 98,331,841 | | | | $ | 86,060,793 | | | | $ | 445,840,554 | |
| | | | | | | | | | | | | | | |
92
| | | | | | | | | | | | | | | |
| | | Delaware Tax-Free
Idaho Fund | | Delaware Tax-Free
New York Fund | | Delaware Tax-Free
Pennsylvania Fund |
Net Asset Value | | | | | | | | | | | | | | | |
Class A: | | | | | | | | | | | | | | | |
Net assets | | | $ | 59,424,766 | | | | $ | 38,139,243 | | | | $ | 378,037,766 | |
Shares of beneficial interest outstanding, unlimited authorization, no par | | | | 5,300,490 | | | | | 3,365,190 | | | | | 47,680,217 | |
Net asset value per share | | | $ | 11.21 | | | | $ | 11.33 | | | | $ | 7.93 | |
Sales charge | | | | 4.50 | % | | | | 4.50 | % | | | | 4.50 | % |
Offering price per share, equal to net asset value per share / (1 – sales charge) | | | $ | 11.74 | | | | $ | 11.86 | | | | $ | 8.30 | |
| | | |
Class C: | | | | | | | | | | | | | | | |
Net assets | | | $ | 17,596,961 | | | | $ | 14,940,368 | | | | $ | 26,375,882 | |
Shares of beneficial interest outstanding, unlimited authorization, no par | | | | 1,570,854 | | | | | 1,321,591 | | | | | 3,325,473 | |
Net asset value per share | | | $ | 11.20 | | | | $ | 11.30 | | | | $ | 7.93 | |
| | | |
Institutional Class: | | | | | | | | | | | | | | | |
Net assets | | | $ | 21,310,114 | | | | $ | 32,981,182 | | | | $ | 41,426,906 | |
Shares of beneficial interest outstanding, unlimited authorization, no par | | | | 1,900,393 | | | | | 2,911,545 | | | | | 5,228,628 | |
Net asset value per share | | | $ | 11.21 | | | | $ | 11.33 | | | | $ | 7.92 | |
1Investments, at cost | | | $ | 95,365,714 | | | | $ | 84,342,297 | | | | $ | 424,051,721 | |
See accompanying notes, which are an integral part of the financial statements.
93
Statements of operations
Year ended August 31, 2018
| | | | | | | | | | | | | | | |
| | | Delaware Tax-Free
Arizona Fund | | Delaware Tax-Free
California Fund | | Delaware Tax-Free
Colorado Fund |
| | | |
Investment Income: | | | | | | | | | | | | | | | |
Interest | | | $ | 3,156,478 | | | | $ | 4,090,782 | | | | $ | 8,462,147 | |
| | | | | | | | | | | | | | | |
Expenses: | | | | | | | | | | | | | | | |
Management fees | | | | 387,661 | | | | | 545,959 | | | | | 1,106,850 | |
Distribution expenses – Class A | | | | 161,345 | | | | | 131,817 | | | | | 409,562 | |
Distribution expenses – Class C | | | | 47,111 | | | | | 156,639 | | | | | 144,175 | |
Dividend disbursing and transfer agent fees and expenses | | | | 48,528 | | | | | 66,320 | | | | | 132,305 | |
Audit and tax fees | | | | 44,480 | | | | | 44,480 | | | | | 44,480 | |
Accounting and administration expenses | | | | 42,860 | | | | | 46,785 | | | | | 64,974 | |
Registration fees | | | | 16,094 | | | | | 12,601 | | | | | 12,160 | |
Reports and statements to shareholders expenses | | | | 15,381 | | | | | 16,390 | | | | | 26,578 | |
Legal fees | | | | 6,410 | | | | | 7,814 | | | | | 15,605 | |
Trustees’ fees and expenses | | | | 3,623 | | | | | 4,637 | | | | | 9,404 | |
Custodian fees | | | | 2,139 | | | | | 2,135 | | | | | 6,086 | |
Other | | | | 14,818 | | | | | 17,394 | | | | | 23,062 | |
| | | | | | | | | | | | | | | |
| | | | 790,450 | | | | | 1,052,971 | | | | | 1,995,241 | |
Less expenses waived | | | | (123,282 | ) | | | | (197,425 | ) | | | | (253,572 | ) |
Less expenses paid indirectly | | | | (1,090 | ) | | | | (1,128 | ) | | | | (197 | ) |
| | | | | | | | | | | | | | | |
Total operating expenses | | | | 666,078 | | | | | 854,418 | | | | | 1,741,472 | |
| | | | | | | | | | | | | | | |
Net Investment Income | | | | 2,490,400 | | | | | 3,236,364 | | | | | 6,720,675 | |
| | | | | | | | | | | | | | | |
| | | |
Net Realized and Unrealized Gain (Loss): | | | | | | | | | | | | | | | |
Net realized gain | | | | 379,155 | | | | | 507,199 | | | | | 124,725 | |
Net change in unrealized appreciation (depreciation) of investments | | | | (2,032,054 | ) | | | | (2,807,521 | ) | | | | (4,554,837 | ) |
| | | | | | | | | | | | | | | |
Net Realized and Unrealized Loss | | | | (1,652,899 | ) | | | | (2,300,322 | ) | | | | (4,430,112 | ) |
| | | | | | | | | | | | | | | |
Net Increase in Net Assets Resulting from Operations | | | $ | 837,501 | | | | $ | 936,042 | | | | $ | 2,290,563 | |
| | | | | | | | | | | | | | | |
See accompanying notes, which are an integral part of the financial statements.
94
| | | | | | | | | | | | | | | |
| | | Delaware Tax-Free | | Delaware Tax-Free | | Delaware Tax-Free |
| | | Idaho Fund | | New York Fund | | Pennsylvania Fund |
| | | |
Investment Income: | | | | | | | | | | | | | | | |
Interest | | | $ | 4,043,919 | | | | $ | 3,448,682 | | | | $ | 19,984,197 | |
| | | | | | | | | | | | | | | |
Expenses: | | | | | | | | | | | | | | | |
Management fees | | | | 570,975 | | | | | 486,138 | | | | | 2,523,191 | |
Distribution expenses – Class A | | | | 155,902 | | | | | 98,913 | | | | | 942,567 | |
Distribution expenses – Class C | | | | 239,625 | | | | | 164,351 | | | | | 315,971 | |
Dividend disbursing and transfer agent fees and expenses | | | | 71,950 | | | | | 66,956 | | | | | 314,643 | |
Accounting and administration expenses | | | | 47,563 | | | | | 44,843 | | | | | 111,018 | |
Audit and tax fees | | | | 44,480 | | | | | 44,480 | | | | | 44,480 | |
Reports and statements to shareholders expenses | | | | 15,581 | | | | | 22,435 | | | | | 48,759 | |
Registration fees | | | | 11,507 | | | | | 15,683 | | | | | 20,765 | |
Legal fees | | | | 8,198 | | | | | 23,795 | | | | | 35,606 | |
Trustees’ fees and expenses | | | | 4,858 | | | | | 4,141 | | | | | 21,457 | |
Custodian fees | | | | 3,593 | | | | | 2,786 | | | | | 11,283 | |
Other | | | | 14,915 | | | | | 21,435 | | | | | 34,790 | |
| | | | | | | | | | | | | | | |
| | | | 1,189,147 | | | | | 995,956 | | | | | 4,424,530 | |
Less expenses waived | | | | (159,869 | ) | | | | (245,313 | ) | | | | (223,878 | ) |
Less expenses paid indirectly | | | | (61 | ) | | | | (1,035 | ) | | | | (4,745 | ) |
| | | | | | | | | | | | | | | |
Total operating expenses | | | | 1,029,217 | | | | | 749,608 | | | | | 4,195,907 | |
| | | | | | | | | | | | | | | |
Net Investment Income | | | | 3,014,702 | | | | | 2,699,074 | | | | | 15,788,290 | |
| | | | | | | | | | | | | | | |
| | | |
Net Realized and Unrealized Gain (Loss): | | | | | | | | | | | | | | | |
Net realized gain | | | | 294,775 | | | | | 176,041 | | | | | 469,560 | |
Net change in unrealized appreciation (depreciation) of investments | | | | (2,885,211 | ) | | | | (2,366,192 | ) | | | | (12,352,389 | ) |
| | | | | | | | | | | | | | | |
Net Realized and Unrealized Loss | | | | (2,590,436 | ) | | | | (2,190,151 | ) | | | | (11,882,829 | ) |
| | | | | | | | | | | | | | | |
Net Increase in Net Assets Resulting from Operations | | | $ | 424,266 | | | | $ | 508,923 | | | | $ | 3,905,461 | |
| | | | | | | | | | | | | | | |
See accompanying notes, which are an integral part of the financial statements.
95
Statements of changes in net assets
Delaware Tax-Free Arizona Fund
| | | | | | | | | | |
| | | Year ended |
| | | 8/31/18 | | 8/31/17 |
Increase (Decrease) in Net Assets from Operations: | | | | | | | | | | |
Net investment income | | | $ | 2,490,400 | | | | $ | 2,589,599 | |
Net realized gain | | | | 379,155 | | | | | 379,223 | |
Net change in unrealized appreciation (depreciation) | | | | (2,032,054 | ) | | | | (2,986,610 | ) |
| | | | | | | | | | |
Net increase (decrease) in net assets resulting from operations | | | | 837,501 | | | | | (17,788 | ) |
| | | | | | | | | | |
| | |
Dividends and Distributions to Shareholders from: | | | | | | | | | | |
Net investment income: | | | | | | | | | | |
Class A | | | | (2,075,708 | ) | | | | (2,238,019 | ) |
Class C | | | | (115,956 | ) | | | | (151,025 | ) |
Institutional Class | | | | (287,750 | ) | | | | (189,980 | ) |
| | | | | | | | | | |
| | | | (2,479,414 | ) | | | | (2,579,024 | ) |
| | | | | | | | | | |
| | |
Capital Share Transactions: | | | | | | | | | | |
Proceeds from shares sold: | | | | | | | | | | |
Class A | | | | 4,543,493 | | | | | 4,104,481 | |
Class C | | | | 428,738 | | | | | 375,483 | |
Institutional Class | | | | 5,486,278 | | | | | 6,254,164 | |
| | |
Net asset value of shares issued upon reinvestment of dividends and distributions: | | | | | | | | | | |
Class A | | | | 1,649,081 | | | | | 1,713,625 | |
Class C | | | | 106,674 | | | | | 131,071 | |
Institutional Class | | | | 266,147 | | | | | 122,627 | |
| | | | | | | | | | |
| | | | 12,480,411 | | | | | 12,701,451 | |
| | | | | | | | | | |
96
| | | | | | | | | | |
| | | Year ended |
| | | 8/31/18 | | 8/31/17 |
Capital Share Transactions (continued): | | | | | | | | | | |
Cost of shares redeemed: | | | | | | | | | | |
Class A | | | $ | (8,330,769 | ) | | | $ | (11,210,912 | ) |
Class C | | | | (2,522,165 | ) | | | | (1,895,123 | ) |
Institutional Class | | | | (2,573,565 | ) | | | | (2,881,200 | ) |
| | | | | | | | | | |
| | | | (13,426,499 | ) | | | | (15,987,235 | ) |
| | | | | | | | | | |
Decrease in net assets derived from capital share transactions | | | | (946,088 | ) | | | | (3,285,784 | ) |
| | | | | | | | | | |
Net Decrease in Net Assets | | | | (2,588,001 | ) | | | | (5,882,596 | ) |
| | |
Net Assets: | | | | | | | | | | |
Beginning of year | | | | 79,134,304 | | | | | 85,016,900 | |
| | | | | | | | | | |
End of year | | | $ | 76,546,303 | | | | $ | 79,134,304 | |
| | | | | | | | | | |
Undistributed net investment income | | | $ | 19,881 | | | | $ | 19,968 | |
| | | | | | | | | | |
See accompanying notes, which are an integral part of the financial statements.
97
Statements of changes in net assets
Delaware Tax-Free California Fund
| | | | | | | | | | |
| | | Year ended |
| | | 8/31/18 | | 8/31/17 |
Increase (Decrease) in Net Assets from Operations: | | | | | | | | | | |
Net investment income | | | $ | 3,236,364 | | | | $ | 3,096,204 | |
Net realized gain | | | | 507,199 | | | | | 1,329,284 | |
Net change in unrealized appreciation (depreciation) | | | | (2,807,521 | ) | | | | (3,898,022 | ) |
| | | | | | | | | | |
Net increase in net assets resulting from operations | | | | 936,042 | | | | | 527,466 | |
| | | | | | | | | | |
| | |
Dividends and Distributions to Shareholders from: | | | | | | | | | | |
Net investment income: | | | | | | | | | | |
Class A | | | | (1,745,468 | ) | | | | (1,911,923 | ) |
Class C | | | | (400,194 | ) | | | | (449,450 | ) |
Institutional Class | | | | (1,100,024 | ) | | | | (740,915 | ) |
| | | | | | | | | | |
| | | | (3,245,686 | ) | | | | (3,102,288 | ) |
| | | | | | | | | | |
| | |
Capital Share Transactions: | | | | | | | | | | |
Proceeds from shares sold: | | | | | | | | | | |
Class A | | | | 5,808,059 | | | | | 4,625,825 | |
Class C | | | | 1,122,941 | | | | | 2,019,263 | |
Institutional Class | | | | 11,785,738 | | | | | 22,253,751 | |
| | |
Net asset value of shares issued upon reinvestment of dividends and distributions: | | | | | | | | | | |
Class A | | | | 1,550,043 | | | | | 1,691,220 | |
Class C | | | | 344,098 | | | | | 372,126 | |
Institutional Class | | | | 680,219 | | | | | 474,246 | |
| | | | | | | | | | |
| | | | 21,291,098 | | | | | 31,436,431 | |
| | | | | | | | | | |
98
| | | | | | | | | | |
| | | Year ended |
| | | 8/31/18 | | 8/31/17 |
Capital Share Transactions (continued): | | | | | | | | | | |
Cost of shares redeemed: | | | | | | | | | | |
Class A | | | $ | (7,031,840 | ) | | | $ | (13,693,334 | ) |
Class C | | | | (4,542,970 | ) | | | | (4,192,525 | ) |
Institutional Class | | | | (7,025,452 | ) | | | | (11,739,212 | ) |
| | | | | | | | | | |
| | | | (18,600,262 | ) | | | | (29,625,071 | ) |
| | | | | | | | | | |
Increase in net assets derived from capital share transactions | | | | 2,690,836 | | | | | 1,811,360 | |
| | | | | | | | | | |
Net Increase (Decrease) in Net Assets | | | | 381,192 | | | | | (763,462 | ) |
| | |
Net Assets: | | | | | | | | | | |
Beginning of year | | | | 98,757,966 | | | | | 99,521,428 | |
| | | | | | | | | | |
End of year | | | $ | 99,139,158 | | | | $ | 98,757,966 | |
| | | | | | | | | | |
Undistributed net investment income | | | $ | 18,763 | | | | $ | 18,763 | |
| | | | | | | | | | |
See accompanying notes, which are an integral part of the financial statements.
99
Statements of changes in net assets
Delaware Tax-Free Colorado Fund
| | | | | | | | | | |
| | | Year ended |
| | | 8/31/18 | | 8/31/17 |
Increase (Decrease) in Net Assets from Operations: | | | | | | | | | | |
Net investment income | | | $ | 6,720,675 | | | | $ | 6,830,501 | |
Net realized gain | | | | 124,725 | | | | | 1,027,304 | |
Net change in unrealized appreciation (depreciation) | | | | (4,554,837 | ) | | | | (7,785,591 | ) |
| | | | | | | | | | |
Net increase in net assets resulting from operations | | | | 2,290,563 | | | | | 72,214 | |
| | | | | | | | | | |
| | |
Dividends and Distributions to Shareholders from: | | | | | | | | | | |
Net investment income: | | | | | | | | | | |
Class A | | | | (5,512,421 | ) | | | | (5,874,195 | ) |
Class C | | | | (376,689 | ) | | | | (437,092 | ) |
Institutional Class | | | | (831,565 | ) | | | | (583,320 | ) |
| | | | | | | | | | |
| | | | (6,720,675 | ) | | | | (6,894,607 | ) |
| | | | | | | | | | |
| | |
Capital Share Transactions: | | | | | | | | | | |
Proceeds from shares sold: | | | | | | | | | | |
Class A | | | | 16,867,445 | | | | | 11,066,431 | |
Class C | | | | 1,730,260 | | | | | 1,981,732 | |
Institutional Class | | | | 12,748,594 | | | | | 10,757,917 | |
| | |
Net asset value of shares issued upon reinvestment of dividends and distributions: | | | | | | | | | | |
Class A | | | | 4,746,976 | | | | | 5,009,118 | |
Class C | | | | 353,393 | | | | | 403,660 | |
Institutional Class | | | | 731,288 | | | | | 513,776 | |
| | | | | | | | | | |
| | | | 37,177,956 | | | | | 29,732,634 | |
| | | | | | | | | | |
100
| | | | | | | | |
| | | Year ended | |
| | | 8/31/18 | | | 8/31/17 | |
Capital Share Transactions (continued): | | | | | | | | |
Cost of shares redeemed: | | | | | | | | |
Class A | | $ | (19,482,166 | ) | | $ | (27,295,950 | ) |
Class C | | | (6,807,914 | ) | | | (2,336,234 | ) |
Institutional Class | | | (5,330,875 | ) | | | (3,397,468 | ) |
| | | | | | | | |
| | | (31,620,955 | ) | | | (33,029,652 | ) |
| | | | | | | | |
Increase (decrease) in net assets derived from capital share transactions | | | 5,557,001 | | | | (3,297,018 | ) |
| | | | | | | | |
Net Increase (Decrease) in Net Assets | | | 1,126,889 | | | | (10,119,411 | ) |
| | |
Net Assets: | | | | | | | | |
Beginning of year | | | 201,316,508 | | | | 211,435,919 | |
| | | | | | | | |
End of year | | $ | 202,443,397 | | | $ | 201,316,508 | |
| | | | | | | | |
Undistributed net investment income | | $ | 352,558 | | | $ | 352,558 | |
| | | | | | | | |
See accompanying notes, which are an integral part of the financial statements.
101
Statements of changes in net assets
Delaware Tax-Free Idaho Fund
| | | | | | | | |
| | | Year ended | |
| | | 8/31/18 | | | 8/31/17 | |
Increase (Decrease) in Net Assets from Operations: | | | | | | | | |
Net investment income | | $ | 3,014,702 | | | $ | 3,036,599 | |
Net realized gain | | | 294,775 | | | | 147,991 | |
Net change in unrealized appreciation (depreciation) | | | (2,885,211 | ) | | | (2,998,287 | ) |
| | | | | | | | |
Net increase in net assets resulting from operations | | | 424,266 | | | | 186,303 | |
| | | | | | | | |
| | |
Dividends and Distributions to Shareholders from: | | | | | | | | |
Net investment income: | | | | | | | | |
Class A | | | (1,888,287 | ) | | | (2,056,914 | ) |
Class C | | | (543,768 | ) | | | (675,436 | ) |
Institutional Class | | | (576,813 | ) | | | (312,269 | ) |
| | | | | | | | |
| | | (3,008,868 | ) | | | (3,044,619 | ) |
| | | | | | | | |
| | |
Capital Share Transactions: | | | | | | | | |
Proceeds from shares sold: | | | | | | | | |
Class A | | | 5,531,468 | | | | 8,130,467 | |
Class C | | | 1,325,139 | | | | 4,827,778 | |
Institutional Class | | | 14,737,822 | | | | 5,875,252 | |
| | |
Net asset value of shares issued upon reinvestment of dividends and distributions: | | | | | | | | |
Class A | | | 1,651,109 | | | | 1,786,007 | |
Class C | | | 512,413 | | | | 635,053 | |
Institutional Class | | | 496,728 | | | | 287,267 | |
| | | | | | | | |
| | | 24,254,679 | | | | 21,541,824 | |
| | | | | | | | |
102
| | | | | | | | |
| | | Year ended | |
| | | 8/31/18 | | | 8/31/17 | |
Capital Share Transactions (continued): | | | | | | | | |
Cost of shares redeemed: | | | | | | | | |
Class A | | $ | (14,113,035 | ) | | $ | (10,487,311 | ) |
Class C | | | (12,991,897 | ) | | | (6,112,419 | ) |
Institutional Class | | | (5,605,597 | ) | | | (4,099,476 | ) |
| | | | | | | | |
| | | (32,710,529 | ) | | | (20,699,206 | ) |
| | | | | | | | |
Increase (decrease) in net assets derived from capital share transactions | | | (8,455,850 | ) | | | 842,618 | |
| | | | | | | | |
Net Decrease in Net Assets | | | (11,040,452 | ) | | | (2,015,698 | ) |
| | |
Net Assets: | | | | | | | | |
Beginning of year | | | 109,372,293 | | | | 111,387,991 | |
| | | | | | | | |
End of year | | $ | 98,331,841 | | | $ | 109,372,293 | |
| | | | | | | | |
Distributions in excess of net investment income | | $ | (16,709 | ) | | $ | (16,644 | ) |
| | | | | | | | |
See accompanying notes, which are an integral part of the financial statements.
103
Statements of changes in net assets
Delaware Tax-Free New York Fund
| | | | | | | | |
| | | Year ended | |
| | | 8/31/18 | | | 8/31/17 | |
Increase (Decrease) in Net Assets from Operations: | | | | | | | | |
Net investment income | | $ | 2,699,074 | | | $ | 2,695,412 | |
Net realized gain | | | 176,041 | | | | 704,914 | |
Net change in unrealized appreciation (depreciation) | | | (2,366,192 | ) | | | (3,669,487 | ) |
| | | | | | | | |
Net increase (decrease) in net assets resulting from operations | | | 508,923 | | | | (269,161 | ) |
| | | | | | | | |
| | |
Dividends and Distributions to Shareholders from: | | | | | | | | |
Net investment income: | | | | | | | | |
Class A | | | (1,233,582 | ) | | | (1,433,902 | ) |
Class C | | | (388,892 | ) | | | (436,795 | ) |
Institutional Class | | | (1,091,556 | ) | | | (879,292 | ) |
| | | | | | | | |
| | | (2,714,030 | ) | | | (2,749,989 | ) |
| | | | | | | | |
| | |
Capital Share Transactions: | | | | | | | | |
Proceeds from shares sold: | | | | | | | | |
Class A | | | 5,120,312 | | | | 4,718,080 | |
Class C | | | 2,254,999 | | | | 1,645,311 | |
Institutional Class | | | 8,726,165 | | | | 18,813,396 | |
| | |
Net asset value of shares issued upon reinvestment of dividends and distributions: | | | | | | | | |
Class A | | | 1,130,238 | | | | 1,299,997 | |
Class C | | | 299,712 | | | | 326,960 | |
Institutional Class | | | 968,692 | | | | 775,993 | |
| | | | | | | | |
| | | 18,500,118 | | | | 27,579,737 | |
| | | | | | | | |
104
| | | | | | | | |
| | | Year ended | |
| | | 8/31/18 | | | 8/31/17 | |
Capital Share Transactions (continued): | | | | | | | | |
Cost of shares redeemed: | | | | | | | | |
Class A | | $ | (7,776,362 | ) | | $ | (18,909,422 | ) |
Class C | | | (4,270,778 | ) | | | (5,120,573 | ) |
Institutional Class | | | (8,099,299 | ) | | | (6,864,314 | ) |
| | | | | | | | |
| | | (20,146,439 | ) | | | (30,894,309 | ) |
| | | | | | | | |
Decrease in net assets derived from capital share transactions | | | (1,646,321 | ) | | | (3,314,572 | ) |
| | | | | | | | |
Net Decrease in Net Assets | | | (3,851,428 | ) | | | (6,333,722 | ) |
| | |
Net Assets: | | | | | | | | |
Beginning of year | | | 89,912,221 | | | | 96,245,943 | |
| | | | | | | | |
End of year | | $ | 86,060,793 | | | $ | 89,912,221 | |
| | | | | | | | |
Distributions in excess of net investment income | | $ | (650 | ) | | $ | (650 | ) |
| | | | | | | | |
See accompanying notes, which are an integral part of the financial statements.
105
Statements of changes in net assets
Delaware Tax-Free Pennsylvania Fund
| | | | | | | | | | |
| | | Year ended |
| | | 8/31/18 | | 8/31/17 |
Increase (Decrease) in Net Assets from Operations: | | | | | | | | | | |
Net investment income | | | $ | 15,788,290 | | | | $ | 16,375,469 | |
Net realized gain | | | | 469,560 | | | | | 1,944,064 | |
Net change in unrealized appreciation (depreciation) | | | | (12,352,389 | ) | | | | (17,162,875 | ) |
| | | | | | | | | | |
Net increase in net assets resulting from operations | | | | 3,905,461 | | | | | 1,156,658 | |
| | | | | | | | | | |
| | |
Dividends and Distributions to Shareholders from: | | | | | | | | | | |
Net investment income: | | | | | | | | | | |
Class A | | | | (13,512,474 | ) | | | | (14,365,845 | ) |
Class C | | | | (857,030 | ) | | | | (953,417 | ) |
Institutional Class | | | | (1,418,785 | ) | | | | (1,056,207 | ) |
| | |
Net realized gain: | | | | | | | | | | |
Class A | | | | (243,116 | ) | | | | — | |
Class C | | | | (20,552 | ) | | | | — | |
Institutional Class | | | | (23,146 | ) | | | | — | |
| | | | | | | | | | |
| | | | (16,075,103 | ) | | | | (16,375,469 | ) |
| | | | | | | | | | |
| | |
Capital Share Transactions: | | | | | | | | | | |
Proceeds from shares sold: | | | | | | | | | | |
Class A | | | | 28,325,061 | | | | | 24,022,727 | |
Class C | | | | 2,076,171 | | | | | 4,234,154 | |
Institutional Class | | | | 16,590,343 | | | | | 19,470,435 | |
| | |
Net asset value of shares issued upon reinvestment of dividends and distributions: | | | | | | | | | | |
Class A | | | | 11,749,727 | | | | | 12,019,460 | |
Class C | | | | 840,401 | | | | | 882,040 | |
Institutional Class | | | | 1,235,791 | | | | | 921,495 | |
| | | | | | | | | | |
| | | | 60,817,494 | | | | | 61,550,311 | |
| | | | | | | | | | |
106
| | | | | | | | |
| | | Year ended | |
| | | 8/31/18 | | | 8/31/17 | |
Capital Share Transactions (continued): | | | | | | | | |
Cost of shares redeemed: | | | | | | | | |
Class A | | $ | (50,721,030 | ) | | $ | (63,127,978 | ) |
Class C | | | (8,984,224 | ) | | | (6,923,286 | ) |
Institutional Class | | | (8,774,119 | ) | | | (12,573,989 | ) |
| | | | | | | | |
| | | (68,479,373 | ) | | | (82,625,253 | ) |
| | | | | | | | |
Decrease in net assets derived from capital share transactions | | | (7,661,879 | ) | | | (21,074,942 | ) |
| | | | | | | | |
Net Decrease in Net Assets | | | (19,831,521 | ) | | | (36,293,753 | ) |
| | |
Net Assets: | | | | | | | | |
Beginning of year | | | 465,672,075 | | | | 501,965,828 | |
| | | | | | | | |
End of year | | $ | 445,840,554 | | | $ | 465,672,075 | |
| | | | | | | | |
Distributions in excess of net investment income | | $ | (108,965 | ) | | $ | (108,966 | ) |
| | | | | | | | |
See accompanying notes, which are an integral part of the financial statements.
107
Financial highlights
Delaware Tax-Free Arizona Fund Class A
Selected data for each share of the Fund outstanding throughout each period were as follows:
|
Net asset value, beginning of period |
|
Income (loss) from investment operations: |
Net investment income1 |
Net realized and unrealized gain (loss) |
Total from investment operations |
|
Less dividends and distributions from: |
Net investment income |
Net realized gain |
Total dividends and distributions |
|
Net asset value, end of period |
|
Total return2 |
|
Ratios and supplemental data: |
Net assets, end of period (000 omitted) |
Ratio of expenses to average net assets |
Ratio of expenses to average net assets prior to fees waived3 |
Ratio of net investment income to average net assets |
Ratio of net investment income to average net assets prior to fees waived3 |
Portfolio turnover |
| 1 | The average shares outstanding have been applied for per share information. |
| 2 | Total investment return is based on the change in net asset value of a share during the period and assumes reinvestment of dividends and distributions at net asset value and does not reflect the impact of a sales charge. Total investment return during all of the periods shown reflects a waiver by the manager. Performance would have been lower had the waiver not been in effect. |
| 3 | Expenses paid indirectly were not material and had no impact on the ratios disclosed. Expenses paid indirectly for the year ended Aug. 31, 2018 are reflected on the “Statements of operations.” |
See accompanying notes, which are an integral part of the financial statements.
108
| | | | | | | | | | | | | | | | | | | | | | | | | | | | |
| | | Year ended | |
| | | | |
| | | 8/31/18 | | | | | 8/31/17 | | | | | 8/31/16 | | | | | 8/31/15 | | | | | 8/31/14 | |
| |
| | $ | 11.48 | | | | | $ | 11.83 | | | | | $ | 11.44 | | | | | $ | 11.45 | | | | | $ | 10.69 | |
| | | | | | | | | |
| | | 0.36 | | | | | | 0.37 | | | | | | 0.38 | | | | | | 0.38 | | | | | | 0.43 | |
| | | (0.24 | ) | | | | | (0.35 | ) | | | | | 0.39 | | | | | | (0.01 | ) | | | | | 0.79 | |
| | | | | | | | | | | | | | | | | | | | | | | | | | | | |
| | | 0.12 | | | | | | 0.02 | | | | | | 0.77 | | | | | | 0.37 | | | | | | 1.22 | |
| | | | | | | | | | | | | | | | | | | | | | | | | | | | |
| | | | | | | | | |
| | | (0.36 | ) | | | | | (0.37 | ) | | | | | (0.38 | ) | | | | | (0.38 | ) | | | | | (0.43 | ) |
| | | — | | | | | | — | | | | | | — | | | | | | — | | | | | | (0.03 | ) |
| | | | | | | | | | | | | | | | | | | | | | | | | | | | |
| | | (0.36 | ) | | | | | (0.37 | ) | | | | | (0.38 | ) | | | | | (0.38 | ) | | | | | (0.46 | ) |
| | | | | | | | | | | | | | | | | | | | | | | | | | | | |
| | | | | | | | | |
| | $ | 11.24 | | | | | $ | 11.48 | | | | | $ | 11.83 | | | | | $ | 11.44 | | | | | $ | 11.45 | |
| | | | | | | | | | | | | | | | | | | | | | | | | | | | |
| | | | | | | | | |
| | | 1.11% | | | | | | 0.24% | | | | | | 6.79% | | | | | | 3.24% | | | | | | 11.56% | |
| | | | | | | | | |
| | $ | 63,327 | | | | | $ | 66,839 | | | | | $ | 74,556 | | | | | $ | 77,085 | | | | | $ | 81,592 | |
| | | 0.84% | | | | | | 0.84% | | | | | | 0.84% | | | | | | 0.85% | | | | | | 0.84% | |
| | | | | | | | | |
| | | 1.00% | | | | | | 0.97% | | | | | | 0.96% | | | | | | 0.97% | | | | | | 0.96% | |
| | | 3.23% | | | | | | 3.25% | | | | | | 3.23% | | | | | | 3.28% | | | | | | 3.86% | |
| | | | | | | | | |
| | | 3.07% | | | | | | 3.12% | | | | | | 3.11% | | | | | | 3.16% | | | | | | 3.74% | |
| | | 6% | | | | | | 9% | | | | | | 14% | | | | | | 12% | | | | | | 11% | |
| | | | | | | | | | | | | | | | | | | | | | | | | | | | |
| |
109
Financial highlights
Delaware Tax-Free Arizona Fund Class C
Selected data for each share of the Fund outstanding throughout each period were as follows:
|
Net asset value, beginning of period |
|
Income (loss) from investment operations: |
Net investment income1 |
Net realized and unrealized gain (loss) |
Total from investment operations |
|
Less dividends and distributions from: |
Net investment income |
Net realized gain |
Total dividends and distributions |
|
Net asset value, end of period |
|
Total return2 |
|
Ratios and supplemental data: |
Net assets, end of period (000 omitted) |
Ratio of expenses to average net assets |
Ratio of expenses to average net assets prior to fees waived3 |
Ratio of net investment income to average net assets |
Ratio of net investment income to average net assets prior to fees waived3 |
Portfolio turnover |
| 1 | The average shares outstanding have been applied for per share information. |
| 2 | Total investment return is based on the change in net asset value of a share during the period and assumes reinvestment of dividends and distributions at net asset value and does not reflect the impact of a sales charge. Total investment return during all of the periods shown reflects a waiver by the manager. Performance would have been lower had the waiver not been in effect. |
| 3 | Expenses paid indirectly were not material and had no impact on the ratios disclosed. Expenses paid indirectly for the year ended Aug. 31, 2018 are reflected on the “Statements of operations.” |
See accompanying notes, which are an integral part of the financial statements.
110
| | | | | | | | | | | | | | | | | | | | | | | | | | | | |
| | | Year ended | |
| | | | |
| | | 8/31/18 | | | | | 8/31/17 | | | | | 8/31/16 | | | | | 8/31/15 | | | | | 8/31/14 | |
| |
| | $ | 11.51 | | | | | $ | 11.87 | | | | | $ | 11.47 | | | | | $ | 11.48 | | | | | $ | 10.72 | |
| | | | | | | | | |
| | | 0.28 | | | | | | 0.29 | | | | | | 0.29 | | | | | | 0.29 | | | | | | 0.35 | |
| | | (0.24 | ) | | | | | (0.37 | ) | | | | | 0.40 | | | | | | (0.01 | ) | | | | | 0.78 | |
| | | | | | | | | | | | | | | | | | | | | | | | | | | | |
| | | 0.04 | | | | | | (0.08 | ) | | | | | 0.69 | | | | | | 0.28 | | | | | | 1.13 | |
| | | | | | | | | | | | | | | | | | | | | | | | | | | | |
| | | | | | | | | |
| | | (0.28 | ) | | | | | (0.28 | ) | | | | | (0.29 | ) | | | | | (0.29 | ) | | | | | (0.34 | ) |
| | | — | | | | | | — | | | | | | — | | | | | | — | | | | | | (0.03 | ) |
| | | | | | | | | | | | | | | | | | | | | | | | | | | | |
| | | (0.28 | ) | | | | | (0.28 | ) | | | | | (0.29 | ) | | | | | (0.29 | ) | | | | | (0.37 | ) |
| | | | | | | | | | | | | | | | | | | | | | | | | | | | |
| | | | | | | | | |
| | $ | 11.27 | | | | | $ | 11.51 | | | | | $ | 11.87 | | | | | $ | 11.47 | | | | | $ | 11.48 | |
| | | | | | | | | | | | | | | | | | | | | | | | | | | | |
| | | | | | | | | |
| | | 0.36% | | | | | | (0.59% | ) | | | | | 6.07% | | | | | | 2.47% | | | | | | 10.72% | |
| | | | | | | | | |
| | $ | 3,122 | | | | | $ | 5,215 | | | | | $ | 6,816 | | | | | $ | 6,747 | | | | | $ | 6,238 | |
| | | 1.59% | | | | | | 1.59% | | | | | | 1.59% | | | | | | 1.60% | | | | | | 1.59% | |
| | | | | | | | | |
| | | 1.75% | | | | | | 1.72% | | | | | | 1.71% | | | | | | 1.72% | | | | | | 1.71% | |
| | | 2.48% | | | | | | 2.50% | | | | | | 2.48% | | | | | | 2.54% | | | | | | 3.11% | |
| | | | | | | | | |
| | | 2.32% | | | | | | 2.37% | | | | | | 2.36% | | | | | | 2.42% | | | | | | 2.99% | |
| | | 6% | | | | | | 9% | | | | | | 14% | | | | | | 12% | | | | | | 11% | |
| | | | | | | | | | | | | | | | | | | | | | | | | | | | |
| |
111
Financial highlights
Delaware Tax-Free Arizona Fund Institutional Class
Selected data for each share of the Fund outstanding throughout each period were as follows:
|
Net asset value, beginning of period |
|
Income (loss) from investment operations: |
Net investment income2 |
Net realized and unrealized gain (loss) |
Total from investment operations |
|
Less dividends and distributions from: |
Net investment income |
Total dividends and distributions |
|
Net asset value, end of period |
|
Total return3 |
|
Ratios and supplemental data: |
Net assets, end of period (000 omitted) |
Ratio of expenses to average net assets |
Ratio of expenses to average net assets prior to fees waived4 |
Ratio of net investment income to average net assets |
Ratio of net investment income to average net assets prior to fees waived4 |
Portfolio turnover |
| 1 | Date of commencement of operations; ratios have been annualized and total return has not been annualized. |
| 2 | The average shares outstanding have been applied for per share information. |
| 3 | Total investment return is based on the change in net asset value of a share during the period and assumes reinvestment of dividends and distributions at net asset value. Total investment return during all of the periods shown reflects a waiver by the manager. Performance would have been lower had the waiver not been in effect. |
| 4 | Expenses paid indirectly were not material and had no impact on the ratios disclosed. Expenses paid indirectly for the year ended Aug. 31, 2018 are reflected on the “Statements of operations.” |
| 5 | Portfolio turnover is representative of the Fund for the entire annual period. |
See accompanying notes, which are an integral part of the financial statements.
112
| | | | | | | | | | | | | | | | | | | | | | | | | | | | |
| | | | | | | | | | | | | | | | | | | | | | | 12/31/131 | |
| | | Year ended | | | | | to | |
| | | | | | | | | | |
| | | 8/31/18 | | | | | 8/31/17 | | | | | 8/31/16 | | | | | 8/31/15 | | | | | 8/31/14 | |
| |
| | $ | 11.48 | | | | | $ | 11.84 | | | | | $ | 11.44 | | | | | $ | 11.45 | | | | | $ | 10.77 | |
| | | | | | | | | |
| | | 0.39 | | | | | | 0.40 | | | | | | 0.41 | | | | | | 0.41 | | | | | | 0.33 | |
| | | (0.24 | ) | | | | | (0.36 | ) | | | | | 0.39 | | | | | | (0.01 | ) | | | | | 0.67 | |
| | | | | | | | | | | | | | | | | | | | | | | | | | | | |
| | | 0.15 | | | | | | 0.04 | | | | | | 0.80 | | | | | | 0.40 | | | | | | 1.00 | |
| | | | | | | | | | | | | | | | | | | | | | | | | | | | |
| | | | | | | | | |
| | | (0.39 | ) | | | | | (0.40 | ) | | | | | (0.40 | ) | | | | | (0.41 | ) | | | | | (0.32 | ) |
| | | | | | | | | | | | | | | | | | | | | | | | | | | | |
| | | (0.39 | ) | | | | | (0.40 | ) | | | | | (0.40 | ) | | | | | (0.41 | ) | | | | | (0.32 | ) |
| | | | | | | | | | | | | | | | | | | | | | | | | | | | |
| | | | | | | | | |
| | $ | 11.24 | | | | | $ | 11.48 | | | | | $ | 11.84 | | | | | $ | 11.44 | | | | | $ | 11.45 | |
| | | | | | | | | | | | | | | | | | | | | | | | | | | | |
| | | | | | | | | |
| | | 1.36% | | | | | | 0.40% | | | | | | 7.14% | | | | | | 3.49% | | | | | | 9.39% | |
| | | | | | | | | |
| | $ | 10,097 | | | | | $ | 7,080 | | | | | $ | 3,645 | | | | | $ | 744 | | | | | $ | 219 | |
| | | 0.59% | | | | | | 0.59% | | | | | | 0.59% | | | | | | 0.60% | | | | | | 0.59% | |
| | | | | | | | | |
| | | 0.75% | | | | | | 0.72% | | | | | | 0.71% | | | | | | 0.72% | | | | | | 0.71% | |
| | | 3.48% | | | | | | 3.50% | | | | | | 3.48% | | | | | | 3.54% | | | | | | 4.06% | |
| | | | | | | | | |
| | | 3.32% | | | | | | 3.37% | | | | | | 3.36% | | | | | | 3.42% | | | | | | 3.94% | |
| | | 6% | | | | | | 9% | | | | | | 14% | | | | | | 12% | | | | | | 11% | 5 |
| | | | | | | | | | | | | | | | | | | | | | | | | | | | |
| |
113
Financial highlights
Delaware Tax-Free California Fund Class A
Selected data for each share of the Fund outstanding throughout each period were as follows:
|
Net asset value, beginning of period |
|
Income (loss) from investment operations: |
Net investment income1 |
Net realized and unrealized gain (loss) |
Total from investment operations |
|
Less dividends and distributions from: |
Net investment income |
Total dividends and distributions |
|
Net asset value, end of period |
|
Total return2 |
|
Ratios and supplemental data: |
Net assets, end of period (000 omitted) |
Ratio of expenses to average net assets |
Ratio of expenses to average net assets prior to fees waived3 |
Ratio of net investment income to average net assets |
Ratio of net investment income to average net assets prior to fees waived3 |
Portfolio turnover |
| 1 | The average shares outstanding have been applied for per share information. |
| 2 | Total investment return is based on the change in net asset value of a share during the period and assumes reinvestment of dividends and distributions at net asset value and does not reflect the impact of a sales charge. Total investment return during all of the periods shown reflects a waiver by the manager. Performance would have been lower had the waiver not been in effect. |
| 3 | Expenses paid indirectly were not material and had no impact on the ratios disclosed. Expenses paid indirectly for the year ended Aug. 31, 2018 are reflected on the “Statements of operations.” |
See accompanying notes, which are an integral part of the financial statements.
114
| | | | | | | | | | | | | | | | | | | | | | | | | | | | |
| | | | | | | | | | | | | Year ended | | | | | | | | | | | |
| | | | |
| | | 8/31/18 | | | | | 8/31/17 | | | | | 8/31/16 | | | | | 8/31/15 | | | | | 8/31/14 | |
| |
| | $ | 12.26 | | | | | $ | 12.60 | | | | | $ | 12.11 | | | | | $ | 12.08 | | | | | $ | 11.11 | |
| | | | | | | | | |
| | | 0.40 | | | | | | 0.41 | | | | | | 0.43 | | | | | | 0.42 | | | | | | 0.43 | |
| | | (0.28 | ) | | | | | (0.34 | ) | | | | | 0.48 | | | | | | 0.03 | | | | | | 0.97 | |
| | | | | | | | | | | | | | | | | | | | | | | | | | | | |
| | | 0.12 | | | | | | 0.07 | | | | | | 0.91 | | | | | | 0.45 | | | | | | 1.40 | |
| | | | | | | | | | | | | | | | | | | | | | | | | | | | |
| | | | | | | | | |
| | | (0.40 | ) | | | | | (0.41 | ) | | | | | (0.42 | ) | | | | | (0.42 | ) | | | | | (0.43 | ) |
| | | | | | | | | | | | | | | | | | | | | | | | | | | | |
| | | (0.40 | ) | | | | | (0.41 | ) | | | | | (0.42 | ) | | | | | (0.42 | ) | | | | | (0.43 | ) |
| | | | | | | | | | | | | | | | | | | | | | | | | | | | |
| | | | | | | | | |
| | $ | 11.98 | | | | | $ | 12.26 | | | | | $ | 12.60 | | | | | $ | 12.11 | | | | | $ | 12.08 | |
| | | | | | | | | | | | | | | | | | | | | | | | | | | | |
| | | | | | | | | |
| | | 1.00% | | | | | | 0.63% | | | | | | 7.67% | | | | | | 3.73% | | | | | | 12.79% | |
| | | | | | | | | |
| | $ | 53,171 | | | | | $ | 54,076 | | | | | $ | 63,284 | | | | | $ | 60,550 | | | | | $ | 73,955 | |
| | | 0.82% | | | | | | 0.82% | | | | | | 0.82% | | | | | | 0.83% | | | | | | 0.82% | |
| | | | | | | | | |
| | | 1.02% | | | | | | 1.01% | | | | | | 1.01% | | | | | | 1.01% | | | | | | 1.00% | |
| | | 3.30% | | | | | | 3.36% | | | | | | 3.43% | | | | | | 3.42% | | | | | | 3.69% | |
| | | | | | | | | |
| | | 3.10% | | | | | | 3.17% | | | | | | 3.24% | | | | | | 3.24% | | | | | | 3.51% | |
| | | 16% | | | | | | 27% | | | | | | 18% | | | | | | 24% | | | | | | 13% | |
| | | | | | | | | | | | | | | | | | | | | | | | | | | | |
| |
115
Financial highlights
Delaware Tax-Free California Fund Class C
Selected data for each share of the Fund outstanding throughout each period were as follows:
|
| Net asset value, beginning of period |
|
Income (loss) from investment operations: |
Net investment income1 |
Net realized and unrealized gain (loss) |
Total from investment operations |
|
Less dividends and distributions from: |
Net investment income |
Total dividends and distributions |
|
Net asset value, end of period |
|
Total return2 |
|
Ratios and supplemental data: |
Net assets, end of period (000 omitted) |
Ratio of expenses to average net assets |
Ratio of expenses to average net assets prior to fees waived3 |
Ratio of net investment income to average net assets |
Ratio of net investment income to average net assets prior to fees waived3 |
Portfolio turnover |
| 1 | The average shares outstanding have been applied for per share information. |
| 2 | Total investment return is based on the change in net asset value of a share during the period and assumes reinvestment of dividends and distributions at net asset value and does not reflect the impact of a sales charge. Total investment return during all of the periods shown reflects a waiver by the manager. Performance would have been lower had the waiver not been in effect. |
| 3 | Expenses paid indirectly were not material and had no impact on the ratios disclosed. Expenses paid indirectly for the year ended Aug. 31, 2018 are reflected on the “Statements of operations.” |
See accompanying notes, which are an integral part of the financial statements.
116
| | | | | | | | | | | | | | | | | | | | | | | | | | | | |
| | | Year ended | |
| | | | |
| | | 8/31/18 | | | | | 8/31/17 | | | | | 8/31/16 | | | | | 8/31/15 | | | | | 8/31/14 | |
| |
| | $ | 12.28 | | | | | $ | 12.62 | | | | | $ | 12.13 | | | | | $ | 12.10 | | | | | $ | 11.12 | |
| | | | | | | | | |
| | | 0.31 | | | | | | 0.32 | | | | | | 0.33 | | | | | | 0.33 | | | | | | 0.34 | |
| | | (0.28 | ) | | | | | (0.34 | ) | | | | | 0.49 | | | | | | 0.02 | | | | | | 0.98 | |
| | | | | | | | | | | | | | | | | | | | | | | | | | | | |
| | | 0.03 | | | | | | (0.02 | ) | | | | | 0.82 | | | | | | 0.35 | | | | | | 1.32 | |
| | | | | | | | | | | | | | | | | | | | | | | | | | | | |
| | | | | | | | | |
| | | (0.31 | ) | | | | | (0.32 | ) | | | | | (0.33 | ) | | | | | (0.32 | ) | | | | | (0.34 | ) |
| | | | | | | | | | | | | | | | | | | | | | | | | | | | |
| | | (0.31 | ) | | | | | (0.32 | ) | | | | | (0.33 | ) | | | | | (0.32 | ) | | | | | (0.34 | ) |
| | | | | | | | | | | | | | | | | | | | | | | | | | | | |
| | | | | | | | | |
| | $ | 12.00 | | | | | $ | 12.28 | | | | | $ | 12.62 | | | | | $ | 12.13 | | | | | $ | 12.10 | |
| | | | | | | | | | | | | | | | | | | | | | | | | | | | |
| | | | | | | | | |
| | | 0.25% | | | | | | (0.12% | ) | | | | | 6.86% | | | | | | 2.95% | | | | | | 12.04% | |
| | | | | | | | | |
| | $ | 13,015 | | | | | $ | 16,473 | | | | | $ | 18,827 | | | | | $ | 15,853 | | | | | $ | 15,473 | |
| | | 1.57% | | | | | | 1.57% | | | | | | 1.57% | | | | | | 1.58% | | | | | | 1.57% | |
| | | | | | | | | |
| | | 1.77% | | | | | | 1.76% | | | | | | 1.76% | | | | | | 1.76% | | | | | | 1.75% | |
| | | 2.55% | | | | | | 2.61% | | | | | | 2.68% | | | | | | 2.67% | | | | | | 2.94% | |
| | | | | | | | | |
| | | 2.35% | | | | | | 2.42% | | | | | | 2.49% | | | | | | 2.49% | | | | | | 2.76% | |
| | | 16% | | | | | | 27% | | | | | | 18% | | | | | | 24% | | | | | | 13% | |
| | | | | | | | | | | | | | | | | | | | | | | | | | | | |
| |
117
Financial highlights
Delaware Tax-Free California Fund Institutional Class
Selected data for each share of the Fund outstanding throughout each period were as follows:
|
| Net asset value, beginning of period |
|
Income (loss) from investment operations: |
Net investment income2 |
Net realized and unrealized gain (loss) |
Total from investment operations |
|
Less dividends and distributions from: |
Net investment income |
Total dividends and distributions |
|
Net asset value, end of period |
|
Total return3 |
|
Ratios and supplemental data: |
Net assets, end of period (000 omitted) |
Ratio of expenses to average net assets |
Ratio of expenses to average net assets prior to fees waived4 |
Ratio of net investment income to average net assets |
Ratio of net investment income to average net assets prior to fees waived4 |
Portfolio turnover |
| 1 | Date of commencement of operations; ratios have been annualized and total return has not been annualized. |
| 2 | The average shares outstanding have been applied for per share information. |
| 3 | Total investment return is based on the change in net asset value of a share during the period and assumes reinvestment of dividends and distributions at net asset value. Total investment return during all of the periods shown reflects a waiver by the manager. Performance would have been lower had the waiver not been in effect. |
| 4 | Expenses paid indirectly were not material and had no impact on the ratios disclosed. Expenses paid indirectly for the year ended Aug. 31, 2018 are reflected on the “Statements of operations.” |
| 5 | Portfolio turnover is representative of the Fund for the entire annual period. |
See accompanying notes, which are an integral part of the financial statements.
118
| | | | | | | | | | | | | | | | | | | | | | | | | | | | |
| | | | | 12/31/131 to | |
| | | Year ended | | | |
| | | | | | | | | | |
| | | 8/31/18 | | | | | 8/31/17 | | | | | 8/31/16 | | | | | 8/31/15 | | | | | 8/31/14 | |
| |
| | $ | 12.26 | | | | | $ | 12.60 | | | | | $ | 12.11 | | | | | $ | 12.08 | | | | | $ | 11.27 | |
| | | | | | | | | |
| | | 0.43 | | | | | | 0.44 | | | | | | 0.46 | | | | | | 0.45 | | | | | | 0.32 | |
| | | (0.28 | ) | | | | | (0.34 | ) | | | | | 0.49 | | | | | | 0.03 | | | | | | 0.81 | |
| | | | | | | | | | | | | | | | | | | | | | | | | | | | |
| | | 0.15 | | | | | | 0.10 | | | | | | 0.95 | | | | | | 0.48 | | | | | | 1.13 | |
| | | | | | | | | | | | | | | | | | | | | | | | | | | | |
| | | | | | | | | |
| | | (0.43 | ) | | | | | (0.44 | ) | | | | | (0.46 | ) | | | | | (0.45 | ) | | | | | (0.32 | ) |
| | | | | | | | | | | | | | | | | | | | | | | | | | | | |
| | | (0.43 | ) | | | | | (0.44 | ) | | | | | (0.46 | ) | | | | | (0.45 | ) | | | | | (0.32 | ) |
| | | | | | | | | | | | | | | | | | | | | | | | | | | | |
| | | | | | | | | |
| | $ | 11.98 | | | | | $ | 12.26 | | | | | $ | 12.60 | | | | | $ | 12.11 | | | | | $ | 12.08 | |
| | | | | | | | | | | | | | | | | | | | | | | | | | | | |
| | | | | | | | | |
| | | 1.26% | | | | | | 0.89% | | | | | | 7.94% | | | | | | 3.98% | | | | | | 10.10% | |
| | | | | | | | | |
| | $ | 32,953 | | | | | $ | 28,209 | | | | | $ | 17,410 | | | | | $ | 10,308 | | | | | $ | 5,983 | |
| | | 0.57% | | | | | | 0.57% | | | | | | 0.57% | | | | | | 0.58% | | | | | | 0.57% | |
| | | | | | | | | |
| | | 0.77% | | | | | | 0.76% | | | | | | 0.76% | | | | | | 0.76% | | | | | | 0.75% | |
| | | 3.55% | | | | | | 3.61% | | | | | | 3.68% | | | | | | 3.67% | | | | | | 3.89% | |
| | | | | | | | | |
| | | 3.35% | | | | | | 3.42% | | | | | | 3.49% | | | | | | 3.49% | | | | | | 3.71% | |
| | | 16% | | | | | | 27% | | | | | | 18% | | | | | | 24% | | | | | | 13% | 5 |
| | | | | | | | | | | | | | | | | | | | | | | | | | | | |
| |
119
Financial highlights
Delaware Tax-Free Colorado Fund Class A
Selected data for each share of the Fund outstanding throughout each period were as follows:
|
| Net asset value, beginning of period |
|
Income (loss) from investment operations: |
Net investment income1 |
Net realized and unrealized gain (loss) |
Total from investment operations |
|
Less dividends and distributions from: |
Net investment income |
Total dividends and distributions |
|
Net asset value, end of period |
|
Total return2 |
|
Ratios and supplemental data: |
Net assets, end of period (000 omitted) |
Ratio of expenses to average net assets |
Ratio of expenses to average net assets prior to fees waived3 |
Ratio of net investment income to average net assets |
Ratio of net investment income to average net assets prior to fees waived3 |
Portfolio turnover |
| 1 | The average shares outstanding have been applied for per share information. |
| 2 | Total investment return is based on the change in net asset value of a share during the period and assumes reinvestment of dividends and distributions at net asset value and does not reflect the impact of a sales charge. Total investment return during all of the periods shown reflects a waiver by the manager. Performance would have been lower had the waiver not been in effect. |
| 3 | Expenses paid indirectly were not material and had no impact on the ratios disclosed. Expenses paid indirectly for the year ended Aug. 31, 2018 are reflected on the “Statements of operations.” |
See accompanying notes, which are an integral part of the financial statements.
120
| | | | | | | | | | | | | | | | | | | | | | | | | | | | |
| | | Year ended | |
| | | | |
| | | 8/31/18 | | | | | 8/31/17 | | | | | 8/31/16 | | | | | 8/31/15 | | | | | 8/31/14 | |
| |
| | $ | 11.28 | | | | | $ | 11.65 | | | | | $ | 11.24 | | | | | $ | 11.32 | | | | | $ | 10.49 | |
| | | | | | | | | |
| | | | | | | | | | | | | | | | | | | | | | | | | | | | |
| | | 0.37 | | | | | | 0.39 | | | | | | 0.40 | | | | | | 0.40 | | | | | | 0.41 | |
| | | (0.24 | ) | | | | | (0.37 | ) | | | | | 0.41 | | | | | | (0.08 | ) | | | | | 0.82 | |
| | | | | | | | | | | | | | | | | | | | | | | | | | | | |
| | | 0.13 | | | | | | 0.02 | | | | | | 0.81 | | | | | | 0.32 | | | | | | 1.23 | |
| | | | | | | | | | | | | | | | | | | | | | | | | | | | |
| | | | | | | | | |
| | | | | | | | | | | | | | | | | | | | | | | | | | | | |
| | | (0.37 | ) | | | | | (0.39 | ) | | | | | (0.40 | ) | | | | | (0.40 | ) | | | | | (0.40 | ) |
| | | | | | | | | | | | | | | | | | | | | | | | | | | | |
| | | (0.37 | ) | | | | | (0.39 | ) | | | | | (0.40 | ) | | | | | (0.40 | ) | | | | | (0.40 | ) |
| | | | | | | | | | | | | | | | | | | | | | | | | | | | |
| | | | | | | | | | | | | | | | | | | | | | | | | | | | |
| | $ | 11.04 | | | | | $ | 11.28 | | | | | $ | 11.65 | | | | | $ | 11.24 | | | | | $ | 11.32 | |
| | | | | | | | | | | | | | | | | | | | | | | | | | | | |
| | | | | | | | | |
| | | 1.22% | | | | | | 0.26% | | | | | | 7.33% | | | | | | 2.87% | | | | | | 11.94% | |
| | | | | | | | | |
| | | | | | | | | | | | | | | | | | | | | | | | | | | | |
| | $ | 164,087 | | | | | $ | 165,554 | | | | | $ | 182,764 | | | | | $ | 174,078 | | | | | $ | 183,560 | |
| | | 0.84% | | | | | | 0.84% | | | | | | 0.84% | | | | | | 0.85% | | | | | | 0.84% | |
| | | | | | | | | | | | | | | | | | | | | | | | | | | | |
| | | 0.97% | | | | | | 0.96% | | | | | | 0.96% | | | | | | 0.97% | | | | | | 0.97% | |
| | | 3.36% | | | | | | 3.48% | | | | | | 3.50% | | | | | | 3.54% | | | | | | 3.69% | |
| | | | | | | | | | | | | | | | | | | | | | | | | | | | |
| | | 3.23% | | | | | | 3.36% | | | | | | 3.38% | | | | | | 3.42% | | | | | | 3.56% | |
| | | 6% | | | | | | 17% | | | | | | 6% | | | | | | 10% | | | | | | 22% | |
| | | | | | | | | | | | | | | | | | | | | | | | | | | | | |
| |
121
Financial highlights
Delaware Tax-Free Colorado Fund Class C
Selected data for each share of the Fund outstanding throughout each period were as follows:
|
| |
|
| |
|
Net asset value, beginning of period |
|
Income (loss) from investment operations: |
Net investment income1 |
Net realized and unrealized gain (loss) |
| |
Total from investment operations |
| |
|
Less dividends and distributions from: |
Net investment income |
| |
Total dividends and distributions |
| |
|
Net asset value, end of period. |
|
|
Total return2 |
|
Ratios and supplemental data: |
Net assets, end of period (000 omitted) |
Ratio of expenses to average net assets |
Ratio of expenses to average net assets prior to fees waived3 |
Ratio of net investment income to average net assets |
Ratio of net investment income to average net assets prior to fees waived3 |
Portfolio turnover |
|
|
| 1 | The average shares outstanding have been applied for per share information. |
| 2 | Total investment return is based on the change in net asset value of a share during the period and assumes reinvestment of dividends and distributions at net asset value and does not reflect the impact of a sales charge. Total investment return during all of the periods shown reflects a waiver by the manager. Performance would have been lower had the waiver not been in effect. |
| 3 | Expenses paid indirectly were not material and had no impact on the ratios disclosed. Expenses paid indirectly for the year ended Aug. 31, 2018 are reflected on the “Statements of operations.” |
| See | accompanying notes, which are an integral part of the financial statements. |
122
| | | | | | | | | | | | | | | | | | | | | | | | | | | | |
| | | Year ended | |
| | | | |
| | | 8/31/18 | | | | | 8/31/17 | | | | | 8/31/16 | | | | | 8/31/15 | | | | | 8/31/14 | |
| |
| | $ | 11.31 | | | | | $ | 11.68 | | | | | $ | 11.27 | | | | | $ | 11.35 | | | | | $ | 10.52 | |
| | | | | | | | | |
| | | | | | | | | | | | | | | | | | | | | | | | | | | | |
| | | 0.29 | | | | | | 0.31 | | | | | | 0.32 | | | | | | 0.32 | | | | | | 0.32 | |
| | | (0.24 | ) | | | | | (0.37 | ) | | | | | 0.41 | | | | | | (0.08 | ) | | | | | 0.83 | |
| | | | | | | | | | | | | | | | | | | | | | | | | | | | |
| | | 0.05 | | | | | | (0.06 | ) | | | | | 0.73 | | | | | | 0.24 | | | | | | 1.15 | |
| | | | | | | | | | | | | | | | | | | | | | | | | | | | |
| | | | | | | | | |
| | | | | | | | | | | | | | | | | | | | | | | | | | | | |
| | | (0.29 | ) | | | | | (0.31 | ) | | | | | (0.32 | ) | | | | | (0.32 | ) | | | | | (0.32 | ) |
| | | | | | | | | | | | | | | | | | | | | | | | | | | | |
| | | (0.29 | ) | | | | | (0.31 | ) | | | | | (0.32 | ) | | | | | (0.32 | ) | | | | | (0.32 | ) |
| | | | | | | | | | | | | | | | | | | | | | | | | | | | |
| | | | | | | | | |
| | $ | 11.07 | | | | | $ | 11.31 | | | | | $ | 11.68 | | | | | $ | 11.27 | | | | | $ | 11.35 | |
| | | | | | | | | | | | | | | | | | | | | | | | | | | | |
| | | | | | | | | |
| | | 0.47% | | | | | | (0.48% | ) | | | | | 6.52% | | | | | | 2.10% | | | | | | 11.09% | |
| | | | | | | | | |
| | | | | | | | | | | | | | | | | | | | | | | | | | | | |
| | $ | 10,923 | | | | | $ | 15,975 | | | | | $ | 16,461 | | | | | $ | 12,192 | | | | | $ | 12,029 | |
| | | 1.59% | | | | | | 1.59% | | | | | | 1.59% | | | | | | 1.60% | | | | | | 1.59% | |
| | | 1.72% | | | | | | 1.71% | | | | | | 1.71% | | | | | | 1.72% | | | | | | 1.72% | |
| | | 2.61% | | | | | | 2.73% | | | | | | 2.75% | | | | | | 2.79% | | | | | | 2.94% | |
| | | 2.48% | | | | | | 2.61% | | | | | | 2.63% | | | | | | 2.67% | | | | | | 2.81% | |
| | | 6% | | | | | | 17% | | | | | | 6% | | | | | | 10% | | | | | | 22% | |
| |
| |
123
Financial highlights
Delaware Tax-Free Colorado Fund Institutional Class
Selected data for each share of the Fund outstanding throughout each period were as follows:
|
|
|
| |
|
Net asset value, beginning of period |
|
Income (loss) from investment operations: |
Net investment income2 |
Net realized and unrealized gain (loss) |
| |
Total from investment operations |
| |
|
Less dividends and distributions from: |
Net investment income |
| |
Total dividends and distributions |
| |
|
Net asset value, end of period. |
| |
|
Total return3 |
|
Ratios and supplemental data: |
Net assets, end of period (000 omitted) |
Ratio of expenses to average net assets |
Ratio of expenses to average net assets prior to fees waived4 |
Ratio of net investment income to average net assets |
Ratio of net investment income to average net assets prior to fees waived4 |
Portfolio turnover |
|
|
| 1 | Date of commencement of operations; ratios have been annualized and total return has not been annualized. |
| 2 | The average shares outstanding have been applied for per share information. |
| 3 | Total investment return is based on the change in net asset value of a share during the period and assumes reinvestment of dividends and distributions at net asset value. Total investment return during all of the periods shown reflects a waiver by the manager. Performance would have been lower had the waiver not been in effect. |
| 4 | Expenses paid indirectly were not material and had no impact on the ratios disclosed. Expenses paid indirectly for the year ended Aug. 31, 2018 are reflected on the “Statements of operations.” |
| 5 | Portfolio turnover is representative of the Fund for the entire annual period. |
See accompanying notes, which are an integral part of the financial statements.
124
| | | | | | | | | | | | | | | | | | | | | | | | | | | | |
| | | Year ended | | 12/31/131
to | |
| | | | | | |
| | | 8/31/18 | | | | | 8/31/17 | | | | | 8/31/16 | | | | | 8/31/15 | | | | | 8/31/14 | |
| |
| | $ | 11.28 | | | | | $ | 11.65 | | | | | $ | 11.24 | | | | | $ | 11.32 | | | | | $ | 10.59 | |
| | | | | | | | | |
| | | | | | | | | | | | | | | | | | | | | | | | | | | | |
| | | 0.40 | | | | | | 0.42 | | | | | | 0.43 | | | | | | 0.43 | | | | | | 0.33 | |
| | | (0.24 | ) | | | | | (0.37 | ) | | | | | 0.41 | | | | | | (0.08 | ) | | | | | 0.71 | |
| | | | | | | | | | | | | | | | | | | | | | | | | | | | |
| | | 0.16 | | | | | | 0.05 | | | | | | 0.84 | | | | | | 0.35 | | | | | | 1.04 | |
| | | | | | | | | | | | | | | | | | | | | | | | | | | | |
| | | | | | | | | |
| | | | | | | | | | | | | | | | | | | | | | | | | | | | |
| | | (0.40 | ) | | | | | (0.42 | ) | | | | | (0.43 | ) | | | | | (0.43 | ) | | | | | (0.31 | ) |
| | | | | | | | | | | | | | | | | | | | | | | | | | | | |
| | | (0.40 | ) | | | | | (0.42 | ) | | | | | (0.43 | ) | | | | | (0.43 | ) | | | | | (0.31 | ) |
| | | | | | | | | | | | | | | | | | | | | | | | | | | | |
| | | | | | | | | | | | | | | | | | | | | | | | | | | | |
| | $ | 11.04 | | | | | $ | 11.28 | | | | | $ | 11.65 | | | | | $ | 11.24 | | | | | $ | 11.32 | |
| | | | | | | | | | | | | | | | | | | | | | | | | | | | |
| | | | | | | | | | | | | | | | | | | | | | | | | | | | |
| | | 1.47% | | | | | | 0.51% | | | | | | 7.60% | | | | | | 3.13% | | | | | | 9.89% | |
| | | | | | | | | |
| | | | | | | | | | | | | | | | | | | | | | | | | | | | |
| | $ | 27,433 | | | | | $ | 19,788 | | | | | $ | 12,211 | | | | | $ | 5,102 | | | | | $ | 3,077 | |
| | | 0.59% | | | | | | 0.59% | | | | | | 0.59% | | | | | | 0.60% | | | | | | 0.59% | |
| | | 0.72% | | | | | | 0.71% | | | | | | 0.71% | | | | | | 0.72% | | | | | | 0.72% | |
| | | 3.61% | | | | | | 3.73% | | | | | | 3.75% | | | | | | 3.79% | | | | | | 3.91% | |
| | | 3.48% | | | | | | 3.61% | | | | | | 3.63% | | | | | | 3.67% | | | | | | 3.78% | |
| | | 6% | | | | | | 17% | | | | | | 6% | | | | | | 10% | | | | | | 22% | 5 |
| | | | | | | | | | | | | | | | | | | | | | | | | | | | | |
| |
125
Financial highlights
Delaware Tax-Free Idaho Fund Class A
Selected data for each share of the Fund outstanding throughout each period were as follows:
|
| |
|
| |
|
Net asset value, beginning of period |
|
Income (loss) from investment operations: |
Net investment income1 |
Net realized and unrealized gain (loss) |
| |
Total from investment operations |
| |
|
Less dividends and distributions from: |
Net investment income |
| |
Total dividends and distributions |
| |
|
Net asset value, end of period. |
| |
|
Total return2 |
|
Ratios and supplemental data: |
Net assets, end of period (000 omitted) |
Ratio of expenses to average net assets |
Ratio of expenses to average net assets prior to fees waived3 |
Ratio of net investment income to average net assets |
Ratio of net investment income to average net assets prior to fees waived3 |
Portfolio turnover |
|
|
| 1 | The average shares outstanding have been applied for per share information. |
| 2 | Total investment return is based on the change in net asset value of a share during the period and assumes reinvestment of dividends and distributions at net asset value and does not reflect the impact of a sales charge. Total investment return during all of the periods shown reflects a waiver by the manager. Performance would have been lower had the waiver not been in effect. |
| 3 | Expenses paid indirectly were not material and had no impact on the ratios disclosed. Expenses paid indirectly for the year ended Aug. 31, 2018 are reflected on the “Statements of operations.” |
See accompanying notes, which are an integral part of the financial statements.
126
| | | | | | | | | | | | | | | | | | | | | | | | | | | | |
| | | Year ended | |
| | | | |
| | | 8/31/18 | | | | | 8/31/17 | | | | | 8/31/16 | | | | | 8/31/15 | | | | | 8/31/14 | |
| |
| | $ | 11.49 | | | | | $ | 11.79 | | | | | $ | 11.51 | | | | | $ | 11.56 | | | | | $ | 10.99 | |
| | | | | | | | | |
| | | | | | | | | | | | | | | | | | | | | | | | | | | | |
| | | 0.34 | | | | | | 0.35 | | | | | | 0.36 | | | | | | 0.37 | | | | | | 0.37 | |
| | | (0.28 | ) | | | | | (0.30 | ) | | | | | 0.28 | | | | | | (0.06 | ) | | | | | 0.57 | |
| | | | | | | | | | | | | | | | | | | | | | | | | | | | |
| | | 0.06 | | | | | | 0.05 | | | | | | 0.64 | | | | | | 0.31 | | | | | | 0.94 | |
| | | | | | | | | | | | | | | | | | | | | | | | | | | | |
| | | | | | | | | |
| | | | | | | | | | | | | | | | | | | | | | | | | | | | |
| | | (0.34 | ) | | | | | (0.35 | ) | | | | | (0.36 | ) | | | | | (0.36 | ) | | | | | (0.37 | ) |
| | | | | | | | | | | | | | | | | | | | | | | | | | | | |
| | | (0.34 | ) | | | | | (0.35 | ) | | | | | (0.36 | ) | | | | | (0.36 | ) | | | | | (0.37 | ) |
| | | | | | | | | | | | | | | | | | | | | | | | | | | | |
| | | | | | | | | |
| | $ | 11.21 | | | | | $ | 11.49 | | | | | $ | 11.79 | | | | | $ | 11.51 | | | | | $ | 11.56 | |
| | | | | | | | | | | | | | | | | | | | | | | | | | | | |
| | | | | | | | | |
| | | 0.56% | | | | | | 0.47% | | | | | | 5.66% | | | | | | 2.76% | | | | | | 8.71% | |
| | | | | | | | | |
| | | | | | | | | | | | | | | | | | | | | | | | | | | | |
| | $ | 59,425 | | | | | $ | 67,907 | | | | | $ | 70,306 | | | | | $ | 75,163 | | | | | $ | 80,600 | |
| | | 0.86% | | | | | | 0.86% | | | | | | 0.86% | | | | | | 0.88% | | | | | | 0.88% | |
| | | 1.01% | | | | | | 1.00% | | | | | | 0.99% | | | | | | 1.00% | | | | | | 0.99% | |
| | | 3.04% | | | | | | 3.03% | | | | | | 3.11% | | | | | | 3.17% | | | | | | 3.32% | |
| | | 2.89% | | | | | | 2.89% | | | | | | 2.98% | | | | | | 3.05% | | | | | | 3.21% | |
| | | 11% | | | | | | 10% | | | | | | 11% | | | | | | 7% | | | | | | 16% | |
| | | | | | | | | | | | | | | | | | | | | | | | | | | | |
| |
127
Financial highlights
Delaware Tax-Free Idaho Fund Class C
Selected data for each share of the Fund outstanding throughout each period were as follows:
|
| |
|
| |
|
Net asset value, beginning of period |
|
Income (loss) from investment operations: |
Net investment income1 |
Net realized and unrealized gain (loss) |
|
Total from investment operations |
|
|
Less dividends and distributions from: |
Net investment income |
|
Total dividends and distributions |
|
|
Net asset value, end of period. |
|
|
Total return2 |
|
Ratios and supplemental data: |
Net assets, end of period (000 omitted) |
Ratio of expenses to average net assets |
Ratio of expenses to average net assets prior to fees waived3 |
Ratio of net investment income to average net assets |
Ratio of net investment income to average net assets prior to fees waived3 |
Portfolio turnover |
|
|
| 1 | The average shares outstanding have been applied for per share information. |
| 2 | Total investment return is based on the change in net asset value of a share during the period and assumes reinvestment of dividends and distributions at net asset value and does not reflect the impact of a sales charge. Total investment return during all of the periods shown reflects a waiver by the manager. Performance would have been lower had the waiver not been in effect. |
| 3 | Expenses paid indirectly were not material and had no impact on the ratios disclosed. Expenses paid indirectly for the year ended Aug. 31, 2018 are reflected on the “Statements of operations.” |
See accompanying notes, which are an integral part of the financial statements.
128
| | | | | | | | | | | | | | | | | | | | | | | | | | | | |
| | | Year ended | |
| | | 8/31/18 | | | | | 8/31/17 | | | | | 8/31/16 | | | | | 8/31/15 | | | | | 8/31/14 | |
| |
| | $ | 11.48 | | | | | $ | 11.78 | | | | | $ | 11.50 | | | | | $ | 11.55 | | | | | $ | 10.98 | |
| | | | | | | | | |
| | | | | | | | | | | | | | | | | | | | | | | | | | | | |
| | | 0.26 | | | | | | 0.26 | | | | | | 0.27 | | | | | | 0.28 | | | | | | 0.29 | |
| | | (0.28 | ) | | | | | (0.30 | ) | | | | | 0.28 | | | | | | (0.05 | ) | | | | | 0.57 | |
| | | | | | | | | | | | | | | | | | | | | | | | | | | | |
| | | (0.02 | ) | | | | | (0.04 | ) | | | | | 0.55 | | | | | | 0.23 | | | | | | 0.86 | |
| | | | | | | | | | | | | | | | | | | | | | | | | | | | |
| | | | | | | | | |
| | | | | | | | | | | | | | | | | | | | | | | | | | | | |
| | | (0.26 | ) | | | | | (0.26 | ) | | | | | (0.27 | ) | | | | | (0.28 | ) | | | | | (0.29 | ) |
| | | | | | | | | | | | | | | | | | | | | | | | | | | | |
| | | (0.26 | ) | | | | | (0.26 | ) | | | | | (0.27 | ) | | | | | (0.28 | ) | | | | | (0.29 | ) |
| | | | | | | | | | | | | | | | | | | | | | | | | | | | |
| | | | | | | | | |
| | $ | 11.20 | | | | | $ | 11.48 | | | | | $ | 11.78 | | | | | $ | 11.50 | | | | | $ | 11.55 | |
| | | | | | | | | | | | | | | | | | | | | | | | | | | | |
| | | | | | | | | |
| | | (0.19% | ) | | | | | (0.29% | ) | | | | | 4.88% | | | | | | 1.99% | | | | | | 7.91% | |
| | | | | | | | | |
| | | | | | | | | | | | | | | | | | | | | | | | | | | | |
| | $ | 17,597 | | | | | $ | 29,375 | | | | | $ | 30,834 | | | | | $ | 28,557 | | | | | $ | 31,178 | |
| | | 1.61% | | | | | | 1.61% | | | | | | 1.61% | | | | | | 1.63% | | | | | | 1.63% | |
| | | 1.76% | | | | | | 1.75% | | | | | | 1.74% | | | | | | 1.75% | | | | | | 1.74% | |
| | | 2.29% | | | | | | 2.28% | | | | | | 2.36% | | | | | | 2.42% | | | | | | 2.57% | |
| | | 2.14% | | | | | | 2.14% | | | | | | 2.23% | | | | | | 2.30% | | | | | | 2.46% | |
| | | 11% | | | | | | 10% | | | | | | 11% | | | | | | 7% | | | | | | 16% | |
| | | | | | | | | | | | | | | | | | | | | | | | | | | | |
| |
129
Financial highlights
Delaware Tax-Free Idaho Fund Institutional Class
Selected data for each share of the Fund outstanding throughout each period were as follows:
|
|
|
| |
|
Net asset value, beginning of period |
|
Income (loss) from investment operations: |
Net investment income2 |
Net realized and unrealized gain (loss) |
|
Total from investment operations |
|
|
Less dividends and distributions from: |
Net investment income |
|
Total dividends and distributions |
|
|
Net asset value, end of period. |
|
|
Total return3 |
|
Ratios and supplemental data: |
Net assets, end of period (000 omitted) |
Ratio of expenses to average net assets |
Ratio of expenses to average net assets prior to fees waived4 |
Ratio of net investment income to average net assets |
Ratio of net investment income to average net assets prior to fees waived4 |
Portfolio turnover |
|
|
| 1 | Date of commencement of operations; ratios have been annualized and total return has not been annualized. |
| 2 | The average shares outstanding have been applied for per share information. |
| 3 | Total investment return is based on the change in net asset value of a share during the period and assumes reinvestment of dividends and distributions at net asset value. Total investment return during all of the periods shown reflects a waiver by the manager. Performance would have been lower had the waiver not been in effect. |
| 4 | Expenses paid indirectly were not material and had no impact on the ratios disclosed. Expenses paid indirectly for the year ended Aug. 31, 2018 are reflected on the “Statements of operations.” |
| 5 | Portfolio turnover is representative of the Fund for the entire annual period. |
See accompanying notes, which are an integral part of the financial statements.
130
| | | | | | | | | | | | | | | | | | | | | | | | | | | | |
| | | Year ended | | 12/31/131
to 8/31/14 | |
| | | | | | |
| | | 8/31/18 | | | | | 8/31/17 | | | | | 8/31/16 | | | | | 8/31/15 | | | |
| |
| | $ | 11.49 | | | | | $ | 11.79 | | | | | $ | 11.51 | | | | | $ | 11.57 | | | | | $ | 11.06 | |
| | | | | | | | | |
| | | | | | | | | | | | | | | | | | | | | | | | | | | | |
| | | 0.37 | | | | | | 0.37 | | | | | | 0.39 | | | | | | 0.40 | | | | | | 0.29 | |
| | | (0.28 | ) | | | | | (0.29 | ) | | | | | 0.28 | | | | | | (0.07 | ) | | | | | 0.51 | |
| | | | | | | | | | | | | | | | | | | | | | | | | | | | |
| | | 0.09 | | | | | | 0.08 | | | | | | 0.67 | | | | | | 0.33 | | | | | | 0.80 | |
| | | | | | | | | | | | | | | | | | | | | | | | | | | | |
| | | | | | | | | |
| | | | | | | | | | | | | | | | | | | | | | | | | | | | |
| | | (0.37 | ) | | | | | (0.38 | ) | | | | | (0.39 | ) | | | | | (0.39 | ) | | | | | (0.29 | ) |
| | | | | | | | | | | | | | | | | | | | | | | | | | | | |
| | | (0.37 | ) | | | | | (0.38 | ) | | | | | (0.39 | ) | | | | | (0.39 | ) | | | | | (0.29 | ) |
| | | | | | | | | | | | | | | | | | | | | | | | | | | | |
| | | | | | | | | |
| | $ | 11.21 | | | | | $ | 11.49 | | | | | $ | 11.79 | | | | | $ | 11.51 | | | | | $ | 11.57 | |
| | | | | | | | | | | | | | | | | | | | | | | | | | | | |
| | | | | | | | | |
| | | 0.82% | | | | | | 0.71% | | | | | | 5.92% | | | | | | 2.92% | | | | | | 7.31% | |
| | | | | | | | | |
| | | | | | | | | | | | | | | | | | | | | | | | | | | | |
| | $ | 21,310 | | | | | $ | 12,090 | | | | | $ | 10,248 | | | | | $ | 2,588 | | | | | $ | 1,080 | |
| | | 0.61% | | | | | | 0.61% | | | | | | 0.61% | | | | | | 0.63% | | | | | | 0.63% | |
| | | 0.76% | | | | | | 0.75% | | | | | | 0.74% | | | | | | 0.75% | | | | | | 0.74% | |
| | | 3.29% | | | | | | 3.28% | | | | | | 3.36% | | | | | | 3.42% | | | | | | 3.46% | |
| | | 3.14% | | | | | | 3.14% | | | | | | 3.23% | | | | | | 3.30% | | | | | | 3.35% | |
| | | 11% | | | | | | 10% | | | | | | 11% | | | | | | 7% | | | | | | 16% | 5 |
| | | | | | | | | | | | | | | | | | | | | | | | | | | | |
| |
131
Financial highlights
Delaware Tax-Free New York Fund Class A
Selected data for each share of the Fund outstanding throughout each period were as follows:
|
| |
|
| |
|
Net asset value, beginning of period |
|
Income (loss) from investment operations: |
Net investment income1 |
Net realized and unrealized gain (loss) |
|
Total from investment operations |
|
|
Less dividends and distributions from: |
Net investment income |
|
Total dividends and distributions |
|
|
Net asset value, end of period |
|
|
Total return2 |
|
Ratios and supplemental data: |
Net assets, end of period (000 omitted) |
Ratio of expenses to average net assets |
Ratio of expenses to average net assets prior to fees waived3 |
Ratio of net investment income to average net assets |
Ratio of net investment income to average net assets prior to fees waived3 |
Portfolio turnover |
|
|
| 1 | The average shares outstanding have been applied for per share information. |
| 2 | Total investment return is based on the change in net asset value of a share during the period and assumes reinvestment of dividends and distributions at net asset value and does not reflect the impact of a sales charge. Total investment return during all of the periods shown reflects a waiver by the manager. Performance would have been lower had the waiver not been in effect. |
| 3 | Expenses paid indirectly were not material and had no impact on the ratios disclosed. Expenses paid indirectly for the year ended Aug. 31, 2018 are reflected on the “Statements of operations.” |
See accompanying notes, which are an integral part of the financial statements.
132
| | | | | | | | | | | | | | | | | | | | | | | | | | | | |
| | | Year ended | |
| | | | |
| | | 8/31/18 | | | | | 8/31/17 | | | | | 8/31/16 | | | | | 8/31/15 | | | | | 8/31/14 | |
| |
| | $ | 11.62 | | | | | $ | 11.98 | | | | | $ | 11.48 | | | | | $ | 11.46 | | | | | $ | 10.57 | |
| | | | | | | | | |
| | | | | | | | | | | | | | | | | | | | | | | | | | | | |
| | | 0.36 | | | | | | 0.35 | | | | | | 0.36 | | | | | | 0.37 | | | | | | 0.37 | |
| | | (0.29 | ) | | | | | (0.35 | ) | | | | | 0.50 | | | | | | 0.02 | | | | | | 0.89 | |
| | | | | | | | | | | | | | | | | | | | | | | | | | | | |
| | | 0.07 | | | | | | — | | | | | | 0.86 | | | | | | 0.39 | | | | | | 1.26 | |
| | | | | | | | | | | | | | | | | | | | | | | | | | | | |
| | | | | | | | | |
| | | | | | | | | | | | | | | | | | | | | | | | | | | | |
| | | (0.36 | ) | | | | | (0.36 | ) | | | | | (0.36 | ) | | | | | (0.37 | ) | | | | | (0.37 | ) |
| | | | | | | | | | | | | | | | | | | | | | | | | | | | |
| | | (0.36 | ) | | | | | (0.36 | ) | | | | | (0.36 | ) | | | | | (0.37 | ) | | | | | (0.37 | ) |
| | | | | | | | | | | | | | | | | | | | | | | | | | | | |
| | | | | | | | | |
| | $ | 11.33 | | | | | $ | 11.62 | | | | | $ | 11.98 | | | | | $ | 11.48 | | | | | $ | 11.46 | |
| | | | | | | | | | | | | | | | | | | | | | | | | | | | |
| | | | | | | | | |
| | | 0.60% | | | | | | 0.05% | | | | | | 7.57% | | | | | | 3.41% | | | | | | 12.06% | |
| | | | | | | | | |
| | | | | | | | | | | | | | | | | | | | | | | | | | | | |
| | $ | 38,139 | | | | | $ | 40,647 | | | | | $ | 55,418 | | | | | $ | 51,708 | | | | | $ | 52,589 | |
| | | 0.80% | | | | | | 0.80% | | | | | | 0.80% | | | | | | 0.83% | | | | | | 0.80% | |
| | | 1.08% | | | | | | 1.03% | | | | | | 1.02% | | | | | | 1.07% | | | | | | 1.06% | |
| | | 3.10% | | | | | | 3.04% | | | | | | 3.06% | | | | | | 3.18% | | | | | | 3.32% | |
| | | 2.82% | | | | | | 2.81% | | | | | | 2.84% | | | | | | 2.94% | | | | | | 3.06% | |
| | | 10% | | | | | | 14% | | | | | | 8% | | | | | | 6% | | | | | | 20% | |
| | | | | | | | | | | | | | | | | | | | | | | | | | | | |
| |
133
Financial highlights
Delaware Tax-Free New York Fund Class C
Selected data for each share of the Fund outstanding throughout each period were as follows:
|
| |
|
| |
|
Net asset value, beginning of period |
|
Income (loss) from investment operations: |
Net investment income1 |
Net realized and unrealized gain (loss) |
|
Total from investment operations |
|
|
Less dividends and distributions from: |
Net investment income |
|
Total dividends and distributions |
|
|
Net asset value, end of period |
|
|
Total return2 |
|
Ratios and supplemental data: |
Net assets, end of period (000 omitted) |
Ratio of expenses to average net assets |
Ratio of expenses to average net assets prior to fees waived3 |
Ratio of net investment income to average net assets |
Ratio of net investment income to average net assets prior to fees waived3 |
Portfolio turnover |
|
|
| 1 | The average shares outstanding have been applied for per share information. |
| 2 | Total investment return is based on the change in net asset value of a share during the period and assumes reinvestment of dividends and distributions at net asset value and does not reflect the impact of a sales charge. Total investment return during all of the periods shown reflects a waiver by the manager. Performance would have been lower had the waiver not been in effect. |
| 3 | Expenses paid indirectly were not material and had no impact on the ratios disclosed. Expenses paid indirectly for the year ended Aug. 31, 2018 are reflected on the “Statements of operations.” |
See accompanying notes, which are an integral part of the financial statements.
134
| | | | | | | | | | | | | | | | | | | | | | | | | | | | |
| | | Year ended | |
| | | | |
| | | 8/31/18 | | | | | 8/31/17 | | | | | 8/31/16 | | | | | 8/31/15 | | | | | 8/31/14 | |
| |
| | $ | 11.59 | | | | | $ | 11.95 | | | | | $ | 11.45 | | | | | $ | 11.44 | | | | | $ | 10.54 | |
| | | | | | | | | |
| | | | | | | | | | | | | | | | | | | | | | | | | | | | |
| | | 0.27 | | | | | | 0.26 | | | | | | 0.27 | | | | | | 0.28 | | | | | | 0.28 | |
| | | (0.29 | ) | | | | | (0.35 | ) | | | | | 0.50 | | | | | | 0.01 | | | | | | 0.90 | |
| | | | | | | | | | | | | | | | | | | | | | | | | | | | |
| | | (0.02 | ) | | | | | (0.09 | ) | | | | | 0.77 | | | | | | 0.29 | | | | | | 1.18 | |
| | | | | | | | | | | | | | | | | | | | | | | | | | | | |
| | | | | | | | | |
| | | | | | | | | | | | | | | | | | | | | | | | | | | | |
| | | (0.27 | ) | | | | | (0.27 | ) | | | | | (0.27 | ) | | | | | (0.28 | ) | | | | | (0.28 | ) |
| | | | | | | | | | | | | | | | | | | | | | | | | | | | |
| | | (0.27 | ) | | | | | (0.27 | ) | | | | | (0.27 | ) | | | | | (0.28 | ) | | | | | (0.28 | ) |
| | | | | | | | | | | | | | | | | | | | | | | | | | | | |
| | | | | | | | | |
| | $ | 11.30 | | | | | $ | 11.59 | | | | | $ | 11.95 | | | | | $ | 11.45 | | | | | $ | 11.44 | |
| | | | | | | | | | | | | | | | | | | | | | | | | | | | |
| | | | | | | | | |
| | | (0.16% | ) | | | | | (0.71% | ) | | | | | 6.78% | | | | | | 2.55% | | | | | | 11.35% | |
| | | | | | | | | |
| | | | | | | | | | | | | | | | | | | | | | | | | | | | |
| | $ | 14,941 | | | | | $ | 17,073 | | | | | $ | 20,899 | | | | | $ | 17,825 | | | | | $ | 18,491 | |
| | | 1.55% | | | | | | 1.55% | | | | | | 1.55% | | | | | | 1.58% | | | | | | 1.55% | |
| | | 1.83% | | | | | | 1.78% | | | | | | 1.77% | | | | | | 1.82% | | | | | | 1.81% | |
| | | 2.35% | | | | | | 2.29% | | | | | | 2.31% | | | | | | 2.43% | | | | | | 2.57% | |
| | | 2.07% | | | | | | 2.06% | | | | | | 2.09% | | | | | | 2.19% | | | | | | 2.31% | |
| | | 10% | | | | | | 14% | | | | | | 8% | | | | | | 6% | | | | | | 20% | |
| | | | | | | | | | | | | | | | | | | | | | | | | | | | |
| |
135
Financial highlights
Delaware Tax-Free New York Fund Institutional Class
Selected data for each share of the Fund outstanding throughout each period were as follows:
|
|
|
| |
|
Net asset value, beginning of period |
|
Income (loss) from investment operations: |
Net investment income2 |
Net realized and unrealized gain (loss) |
|
Total from investment operations |
|
|
Less dividends and distributions from: |
Net investment income |
|
Total dividends and distributions |
|
|
Net asset value, end of period |
|
|
Total return3 |
|
Ratios and supplemental data: |
Net assets, end of period (000 omitted) |
Ratio of expenses to average net assets |
Ratio of expenses to average net assets prior to fees waived4 |
Ratio of net investment income to average net assets |
Ratio of net investment income to average net assets prior to fees waived4 |
Portfolio turnover |
|
|
| 1 | Date of commencement of operations; ratios have been annualized and total return has not been annualized. |
| 2 | The average shares outstanding have been applied for per share information. |
| 3 | Total investment return is based on the change in net asset value of a share during the period and assumes reinvestment of dividends and distributions at net asset value. Total investment return during all of the periods shown reflects a waiver by the manager. Performance would have been lower had the waiver not been in effect. |
| 4 | Expenses paid indirectly were not material and had no impact on the ratios disclosed. Expenses paid indirectly for the year ended Aug. 31, 2018 are reflected on the “Statements of operations.” |
| 5 | Portfolio turnover is representative of the Fund for the entire annual period. |
See accompanying notes, which are an integral part of the financial statements.
136
| | | | | | | | | | | | | | | | | | | | | | | | | | | | |
| | | Year ended | | 12/31/131
to | |
| | | | | | |
| | | 8/31/18 | | | | | 8/31/17 | | | | | 8/31/16 | | | | | 8/31/15 | | | | | 8/31/14 | |
| |
| | $ | 11.61 | | | | | $ | 11.97 | | | | | $ | 11.47 | | | | | $ | 11.46 | | | | | $ | 10.71 | |
| | | | | | | | | |
| | | | | | | | | | | | | | | | | | | | | | | | | | | | |
| | | 0.39 | | | | | | 0.38 | | | | | | 0.39 | | | | | | 0.40 | | | | | | 0.28 | |
| | | (0.28 | ) | | | | | (0.35 | ) | | | | | 0.50 | | | | | | 0.01 | | | | | | 0.75 | |
| | | | | | | | | | | | | | | | | | | | | | | | | | | | |
| | | 0.11 | | | | | | 0.03 | | | | | | 0.89 | | | | | | 0.41 | | | | | | 1.03 | |
| | | | | | | | | | | | | | | | | | | | | | | | | | | | |
| | | | | | | | | |
| | | | | | | | | | | | | | | | | | | | | | | | | | | | |
| | | (0.39 | ) | | | | | (0.39 | ) | | | | | (0.39 | ) | | | | | (0.40 | ) | | | | | (0.28 | ) |
| | | | | | | | | | | | | | | | | | | | | | | | | | | | |
| | | (0.39 | ) | | | | | (0.39 | ) | | | | | (0.39 | ) | | | | | (0.40 | ) | | | | | (0.28 | ) |
| | | | | | | | | | | | | | | | | | | | | | | | | | | | |
| | | | | | | | | |
| | $ | 11.33 | | | | | $ | 11.61 | | | | | $ | 11.97 | | | | | $ | 11.47 | | | | | $ | 11.46 | |
| | | | | | | | | | | | | | | | | | | | | | | | | | | | |
| | | | | | | | | |
| | | 0.93% | | | | | | 0.29% | | | | | | 7.84% | | | | | | 3.58% | | | | | | 9.69% | |
| | | | | | | | | |
| | | | | | | | | | | | | | | | | | | | | | | | | | | | |
| | $ | 32,981 | | | | | $ | 32,192 | | | | | $ | 19,929 | | | | | $ | 12,667 | | | | | $ | 1,769 | |
| | | 0.55% | | | | | | 0.55% | | | | | | 0.55% | | | | | | 0.58% | | | | | | 0.55% | |
| | | 0.83% | | | | | | 0.78% | | | | | | 0.77% | | | | | | 0.82% | | | | | | 0.80% | |
| | | 3.35% | | | | | | 3.29% | | | | | | 3.31% | | | | | | 3.43% | | | | | | 3.55% | |
| | | 3.07% | | | | | | 3.06% | | | | | | 3.09% | | | | | | 3.19% | | | | | | 3.30% | |
| | | 10% | | | | | | 14% | | | | | | 8% | | | | | | 6% | | | | | | 20% | 5 |
| | | | | | | | | | | | | | | | | | | | | | | | | | | | |
| |
137
Financial highlights
Delaware Tax-Free Pennsylvania Fund Class A
Selected data for each share of the Fund outstanding throughout each period were as follows:
|
| |
|
| |
|
Net asset value, beginning of period |
|
Income (loss) from investment operations: |
Net investment income1 |
Net realized and unrealized gain (loss) |
|
Total from investment operations |
|
|
Less dividends and distributions from: |
Net investment income |
Net realized gain |
|
Total dividends and distributions |
|
|
Net asset value, end of period |
|
|
Total return2 |
|
Ratios and supplemental data: |
Net assets, end of period (000 omitted) |
Ratio of expenses to average net assets |
Ratio of expenses to average net assets prior to fees waived3 |
Ratio of net investment income to average net assets |
Ratio of net investment income to average net assets prior to fees waived3 |
Portfolio turnover |
|
|
| 1 | The average shares outstanding have been applied for per share information. |
| 2 | Total investment return is based on the change in net asset value of a share during the period and assumes reinvestment of dividends and distributions at net asset value and does not reflect the impact of a sales charge. Total investment return during all of the periods shown reflects waivers by the manager and/or distributor. Performance would have been lower had the waivers not been in effect. |
| 3 | Expenses paid indirectly were not material and had no impact on the ratios disclosed. Expenses paid indirectly for the year ended Aug. 31, 2018 are reflected on the “Statements of operations.” |
See accompanying notes, which are an integral part of the financial statements.
138
| | | | | | | | | | | | | | | | | | | | | | | | | | | | |
| | | Year ended | |
| | | | |
| | | 8/31/18 | | | | | 8/31/17 | | | | | 8/31/16 | | | | | 8/31/15 | | | | | 8/31/14 | |
| |
| | $ | 8.14 | | | | | $ | 8.39 | | | | | $ | 8.15 | | | | | $ | 8.16 | | | | | $ | 7.59 | |
| | | | | | | | | |
| | | | | | | | | | | | | | | | | | | | | | | | | | | | |
| | | 0.28 | | | | | | 0.28 | | | | | | 0.29 | | | | | | 0.29 | | | | | | 0.29 | |
| | | (0.20 | ) | | | | | (0.25 | ) | | | | | 0.24 | | | | | | (0.01 | ) | | | | | 0.57 | |
| | | | | | | | | | | | | | | | | | | | | | | | | | | | |
| | | 0.08 | | | | | | 0.03 | | | | | | 0.53 | | | | | | 0.28 | | | | | | 0.86 | |
| | | | | | | | | | | | | | | | | | | | | | | | | | | | |
| | | | | | | | | |
| | | | | | | | | | | | | | | | | | | | | | | | | | | | |
| | | (0.28 | ) | | | | | (0.28 | ) | | | | | (0.29 | ) | | | | | (0.29 | ) | | | | | (0.29 | ) |
| | | (0.01 | ) | | | | | — | | | | | | — | | | | | | — | | | | | | — | |
| | | | | | | | | | | | | | | | | | | | | | | | | | | | |
| | | (0.29 | ) | | | | | (0.28 | ) | | | | | (0.29 | ) | | | | | (0.29 | ) | | | | | (0.29 | ) |
| | | | | | | | | | | | | | | | | | | | | | | | | | | | |
| | | | | | | | | |
| | $ | 7.93 | | | | | $ | 8.14 | | | | | $ | 8.39 | | | | | $ | 8.15 | | | | | $ | 8.16 | |
| | | | | | | | | | | | | | | | | | | | | | | | | | | | |
| | | | | | | | | |
| | | 0.93% | | | | | | 0.48% | | | | | | 6.60% | | | | | | 3.45% | | | | | | 11.58% | |
| | | | | | | | | |
| | | | | | | | | | | | | | | | | | | | | | | | | | | | |
| | $ | 378,038 | | | | | $ | 399,001 | | | | | $ | 439,379 | | | | | $ | 441,904 | | | | | $ | 451,301 | |
| | | 0.88% | | | | | | 0.88% | | | | | | 0.88% | | | | | | 0.89% | | | | | | 0.88% | |
| | | 0.93% | | | | | | 0.94% | | | | | | 0.94% | | | | | | 0.95% | | | | | | 0.95% | |
| | | 3.48% | | | | | | 3.51% | | | | | | 3.50% | | | | | | 3.51% | | | | | | 3.73% | |
| | | 3.43% | | | | | | 3.45% | | | | | | 3.44% | | | | | | 3.45% | | | | | | 3.66% | |
| | | 19% | | | | | | 15% | | | | | | 14% | | | | | | 13% | | | | | | 7% | |
| | | | | | | | | | | | | | | | | | | | | | | | | | | | | |
| |
139
Financial highlights
Delaware Tax-Free Pennsylvania Fund Class C
Selected data for each share of the Fund outstanding throughout each period were as follows:
|
| |
|
| |
|
Net asset value, beginning of period |
|
Income (loss) from investment operations: |
Net investment income1 |
Net realized and unrealized gain (loss) |
|
Total from investment operations |
|
|
Less dividends and distributions from: |
Net investment income |
Net realized gain |
|
Total dividends and distributions |
|
|
Net asset value, end of period |
|
|
Total return2 |
|
Ratios and supplemental data: |
Net assets, end of period (000 omitted) |
Ratio of expenses to average net assets |
Ratio of expenses to average net assets prior to fees waived3 |
Ratio of net investment income to average net assets |
Ratio of net investment income to average net assets prior to fees waived3 |
Portfolio turnover |
|
|
| 1 | The average shares outstanding have been applied for per share information. |
| 2 | Total investment return is based on the change in net asset value of a share during the period and assumes reinvestment of dividends and distributions at net asset value and does not reflect the impact of a sales charge. Total investment return during all of the periods shown reflects a waiver by the manager. Performance would have been lower had the waiver not been in effect. |
| 3 | Expenses paid indirectly were not material and had no impact on the ratios disclosed. Expenses paid indirectly for the year ended Aug. 31, 2018 are reflected on the “Statements of operations.” |
See accompanying notes, which are an integral part of the financial statements.
140
| | | | | | | | | | | | | | | | | | | | | | | | | | | | |
| | | Year ended | |
| | | | |
| | | 8/31/18 | | | | | 8/31/17 | | | | | 8/31/16 | | | | | 8/31/15 | | | | | 8/31/14 | |
| |
| | $ | 8.14 | | | | | $ | 8.39 | | | | | $ | 8.15 | | | | | $ | 8.16 | | | | | $ | 7.59 | |
| | | | | | | | | |
| | | | | | | | | | | | | | | | | | | | | | | | | | | | |
| | | 0.22 | | | | | | 0.22 | | | | | | 0.23 | | | | | | 0.23 | | | | | | 0.23 | |
| | | (0.20 | ) | | | | | (0.25 | ) | | | | | 0.24 | | | | | | (0.01 | ) | | | | | 0.57 | �� |
| | | | | | | | | | | | | | | | | | | | | | | | | | | | |
| | | 0.02 | | | | | | (0.03 | ) | | | | | 0.47 | | | | | | 0.22 | | | | | | 0.80 | |
| | | | | | | | | | | | | | | | | | | | | | | | | | | | |
| | | | | | | | | |
| | | | | | | | | | | | | | | | | | | | | | | | | | | | |
| | | (0.22 | ) | | | | | (0.22 | ) | | | | | (0.23 | ) | | | | | (0.23 | ) | | | | | (0.23 | ) |
| | | (0.01 | ) | | | | | — | | | | | | — | | | | | | — | | | | | | — | |
| | | | | | | | | | | | | | | | | | | | | | | | | | | | |
| | | (0.23 | ) | | | | | (0.22 | ) | | | | | (0.23 | ) | | | | | (0.23 | ) | | | | | (0.23 | ) |
| | | | | | | | | | | | | | | | | | | | | | | | | | | | |
| | | | | | | | | |
| | $ | 7.93 | | | | | $ | 8.14 | | | | | $ | 8.39 | | | | | $ | 8.15 | | | | | $ | 8.16 | |
| | | | | | | | | | | | | | | | | | | | | | | | | | | | |
| | | | | | | | | |
| | | 0.16% | | | | | | (0.27% | ) | | | | | 5.79% | | | | | | 2.67% | | | | | | 10.74% | |
| | | | | | | | | |
| | | | | | | | | | | | | | | | | | | | | | | | | | | | |
| | $ | 26,376 | | | | | $ | 33,298 | | | | | $ | 36,215 | | | | | $ | 32,799 | | | | | $ | 32,096 | |
| | | 1.64% | | | | | | 1.64% | | | | | | 1.64% | | | | | | 1.65% | | | | | | 1.64% | |
| | | 1.69% | | | | | | 1.70% | | | | | | 1.70% | | | | | | 1.71% | | | | | | 1.71% | |
| | | 2.72% | | | | | | 2.75% | | | | | | 2.74% | | | | | | 2.75% | | | | | | 2.97% | |
| | | 2.67% | | | | | | 2.69% | | | | | | 2.68% | | | | | | 2.69% | | | | | | 2.90% | |
| | | 19% | | | | | | 15% | | | | | | 14% | | | | | | 13% | | | | | | 7% | |
| | | | | | | | | | | | | | | | | | | | | | | | | | | | | |
| |
141
Financial highlights
Delaware Tax-Free Pennsylvania Fund Institutional Class
Selected data for each share of the Fund outstanding throughout each period were as follows:
|
|
|
| |
|
Net asset value, beginning of period |
|
Income (loss) from investment operations: |
Net investment income2 |
Net realized and unrealized gain (loss) |
|
Total from investment operations |
|
|
Less dividends and distributions from: |
Net investment income |
Net realized gain |
|
Total dividends and distributions |
|
|
Net asset value, end of period |
|
|
Total return3 |
|
Ratios and supplemental data: |
Net assets, end of period (000 omitted) |
Ratio of expenses to average net assets |
Ratio of expenses to average net assets prior to fees waived4 |
Ratio of net investment income to average net assets |
Ratio of net investment income to average net assets prior to fees waived4 |
Portfolio turnover |
|
|
| 1 | Date of commencement of operations; ratios have been annualized and total return has not been annualized. |
| 2 | The average shares outstanding have been applied for per share information. |
| 3 | Total investment return is based on the change in net asset value of a share during the period and assumes reinvestment of dividends and distributions at net asset value. Total investment return during all of the periods shown reflects a waiver by the manager. Performance would have been lower had the waiver not been in effect. |
| 4 | Expenses paid indirectly were not material and had no impact on the ratios disclosed. Expenses paid indirectly for the year ended Aug. 31, 2018 are reflected on the “Statements of operations.” |
| 5 | Portfolio turnover is representative of the Fund for the entire annual period. |
See accompanying notes, which are an integral part of the financial statements.
142
| | | | | | | | | | | | | | | | | | | | | | | | | | | | |
| | | Year ended | | 12/31/131
to | |
| | | | | | |
| | | 8/31/18 | | | | | 8/31/17 | | | | | 8/31/16 | | | | | 8/31/15 | | | | | 8/31/14 | |
| |
| | $ | 8.13 | | | | | $ | 8.38 | | | | | $ | 8.14 | | | | | $ | 8.16 | | | | | $ | 7.67 | |
| | | | | | | | | |
| | | | | | | | | | | | | | | | | | | | | | | | | | | | |
| | | 0.30 | | | | | | 0.30 | | | | | | 0.31 | | | | | | 0.31 | | | | | | 0.23 | |
| | | (0.20 | ) | | | | | (0.25 | ) | | | | | 0.24 | | | | | | (0.02 | ) | | | | | 0.49 | |
| | | | | | | | | | | | | | | | | | | | | | | | | | | | |
| | | 0.10 | | | | | | 0.05 | | | | | | 0.55 | | | | | | 0.29 | | | | | | 0.72 | |
| | | | | | | | | | | | | | | | | | | | | | | | | | | | |
| | | | | | | | | |
| | | | | | | | | | | | | | | | | | | | | | | | | | | | |
| | | (0.30 | ) | | | | | (0.30 | ) | | | | | (0.31 | ) | | | | | (0.31 | ) | | | | | (0.23 | ) |
| | | (0.01 | ) | | | | | — | | | | | | — | | | | | | — | | | | | | — | |
| | | | | | | | | | | | | | | | | | | | | | | | | | | | |
| | | (0.31 | ) | | | | | (0.30 | ) | | | | | (0.31 | ) | | | | | (0.31 | ) | | | | | (0.23 | ) |
| | | | | | | | | | | | | | | | | | | | | | | | | | | | |
| | | | | | | | | |
| | $ | 7.92 | | | | | $ | 8.13 | | | | | $ | 8.38 | | | | | $ | 8.14 | | | | | $ | 8.16 | |
| | | | | | | | | | | | | | | | | | | | | | | | | | | | |
| | | | | | | | | |
| | | 1.16% | | | | | | 0.73% | | | | | | 6.86% | | | | | | 3.57% | | | | | | 9.44% | |
| | | | | | | | | |
| | | | | | | | | | | | | | | | | | | | | | | | | | | | |
| | $ | 41,427 | | | | | $ | 33,373 | | | | | $ | 26,372 | | | | | $ | 16,740 | | | | | $ | 3,733 | |
| | | 0.64% | | | | | | 0.64% | | | | | | 0.64% | | | | | | 0.65% | | | | | | 0.64% | |
| | | 0.69% | | | | | | 0.70% | | | | | | 0.70% | | | | | | 0.71% | | | | | | 0.71% | |
| | | 3.72% | | | | | | 3.75% | | | | | | 3.74% | | | | | | 3.75% | | | | | | 3.89% | |
| | | 3.67% | | | | | | 3.69% | | | | | | 3.68% | | | | | | 3.69% | | | | | | 3.82% | |
| | | 19% | | | | | | 15% | | | | | | 14% | | | | | | 13% | | | | | | 7% | 5 |
| | | | | | | | | | | | | | | | | | | | | | | | | | | | | |
| |
143
| | |
| Notes to financial statements |
| Delaware Funds® by Macquarie state tax-free funds | | August 31, 2018 |
Voyageur Insured Funds is organized as a Delaware statutory trust and offers one series:
Delaware Tax-Free Arizona Fund. Voyageur Mutual Funds is organized as a Delaware statutory trust and offers five series: Delaware Minnesota High-Yield Municipal Bond Fund, Delaware National High-Yield Municipal Bond Fund, Delaware Tax-Free California Fund, Delaware Tax-Free Idaho Fund, and Delaware Tax-Free New York Fund. Voyageur Mutual Funds II is organized as a Delaware statutory trust and offers one series: Delaware Tax-Free Colorado Fund. Delaware Group® State Tax-Free Income Trust is organized as a Delaware statutory trust and offers one series: Delaware Tax-Free Pennsylvania Fund. Voyageur Insured Funds, Voyageur Mutual Funds, Voyageur Mutual Funds II, and Delaware Group State Tax-Free Income Trust are each referred to as a Trust, or collectively as the Trusts. These financial statements and the related notes pertain to Delaware Tax-Free Arizona Fund, Delaware Tax-Free California Fund, Delaware Tax-Free Colorado Fund, Delaware Tax-Free Idaho Fund, Delaware Tax-Free New York Fund, and Delaware Tax-Free Pennsylvania Fund (each a Fund, or collectively, the Funds). Each Fund is an open-end investment company. The Funds are considered diversified under the Investment Company Act of 1940, as amended (1940 Act), and offer Class A, Class C, and Institutional Class shares. Class A shares are sold with a maximum front-end sales charge of 4.50%. Class A share purchases of $1,000,000 or more will incur a contingent deferred sales charge (CDSC) instead of a front-end sales charge of 1.00%, which will be incurred if redeemed during the first year and 0.50% during the second year, provided that Delaware Distributors, L.P. (DDLP) paid a financial advisor a commission on the purchase of those shares. Class C shares are sold with a CDSC of 1.00%, if redeemed during the first 12 months. Institutional Class shares are not subject to a sales charge and are offered for sale exclusively to certain eligible investors.
The investment objective of each Fund is to seek as high a level of current income exempt from federal income tax and from personal income taxes in the respective applicable state, as is consistent with preservation of capital.
1. Significant Accounting Policies
The following accounting policies are in accordance with US generally accepted accounting principles (US GAAP) and are consistently followed by the Funds. Each Fund is an investment company and follows accounting and reporting guidance under Financial Accounting Standards Board (FASB) Accounting Standards Codification (ASC) Topic 946, Financial Services - Investment Companies.
Security Valuation — Debt securities are valued based upon valuations provided by an independent pricing service or broker and reviewed by management. To the extent current market prices are not available, the pricing service may take into account developments related to the specific security, as well as transactions in comparable securities. Valuations for fixed income securities utilize matrix systems, which reflect such factors as security prices, yields, maturities, and ratings, and are supplemented by dealer and exchange quotations. Open-end investment companies are valued at their published net asset value (NAV) per share. Generally, other securities and assets for which market quotations are not readily available are valued at fair value as determined in good faith under the direction of each Trust’s Board of Trustees (each, a Board or, collectively, the Boards). In determining whether market quotations are readily available or fair valuation will be used, various factors will be taken into consideration, such as market closures or suspension of trading in a security. Restricted securities are valued at fair value using methods approved by the Boards.
144
Federal Income Taxes — No provision for federal income taxes has been made as each Fund intends to continue to qualify for federal income tax purposes as a regulated investment company under Subchapter M of the Internal Revenue Code of 1986, as amended, and make the requisite distributions to shareholders. Each Fund evaluates tax positions taken or expected to be taken in the course of preparing each Fund’s tax returns to determine whether the tax positions are “more-likely-than-not” of being sustained by the applicable tax authority. Tax positions not deemed to meet the “more-likely-than-not” threshold are recorded as a tax benefit or expense in the current year. Management has analyzed each Fund’s tax positions taken or expected to be taken on each Fund’s federal income tax returns through the year ended Aug. 31, 2018 and for all open tax years (years ended Aug. 31, 2015–Aug. 31, 2017), and has concluded that no provision for federal income tax is required in each Fund’s financial statements. If applicable, each Fund recognizes interest accrued on unrecognized tax benefits in interest expense and penalties in other expenses on the “Statements of operations.” During the year ended Aug. 31, 2018, the Funds did not incur any interest or tax penalties.
Class Accounting — Investment income and common expenses are allocated to the various classes of each Fund on the basis of “settled shares” of each class in relation to the net assets of each Fund. Realized and unrealized gain (loss) on investments are allocated to the various classes of each Fund on the basis of daily net assets of each class. Distribution expenses relating to a specific class are charged directly to that class.
Use of Estimates — Each Fund is an investment company, whose financial statements are prepared in conformity with US GAAP. Therefore, each Fund follows the accounting and reporting guidelines for investment companies. The preparation of financial statements in conformity with US GAAP requires management to make estimates and assumptions that affect the fair value of investments, the reported amounts of assets and liabilities and disclosure of contingent assets and liabilities at the date of the financial statements, and the reported amounts of revenues and expenses during the reporting period. Actual results could differ from those estimates and the differences could be material.
Other — Expenses directly attributable to each Fund are charged directly to the Fund. Other expenses common to various funds within the Delaware Funds® by Macquarie (Delaware Funds) are generally allocated among such funds on the basis of average net assets. Management fees and certain other expenses are paid monthly. Security transactions are recorded on the date the securities are purchased or sold (trade date) for financial reporting purposes. Costs used in calculating realized gains and losses on the sale of investment securities are those of the specific securities sold. Interest income is recorded on the accrual basis. Discounts and premiums on debt securities are accreted or amortized to interest income, respectively, over the lives of the respective securities using the effective interest method. Each Fund declares dividends daily from net investment income and pays the dividends monthly and declares and pays distributions from net realized gain on investments, if any, annually. Each Fund may distribute more frequently, if necessary for tax purposes. Dividends and distributions, if any, are recorded on the ex-dividend date.
Each Fund receives earnings credits from its custodian when positive cash balances are maintained, which may be used to offset custody fees. The expense paid under this arrangement is included on the “Statements of operations” under “Custodian fees” with the corresponding expense offset included under “Less expenses paid indirectly.”
145
Notes to financial statements
Delaware Funds® by Macquarie state tax-free funds
1. Significant Accounting Policies (continued)
For the year ended Aug. 31, 2018, each Fund earned the following amounts under this agreement:
| | | | | | | | | | |
Delaware Tax-Free
Arizona Fund | | Delaware
Tax-Free
California Fund | | Delaware
Tax-Free
Colorado Fund | | Delaware
Tax-Free
Idaho Fund | | Delaware
Tax-Free
New York Fund | | Delaware
Tax-Free
Pennsylvania
Fund |
$1,037 | | $1,085 | | $68 | | $3 | | $995 | | $4,378 |
Each Fund receives earnings credits from its transfer agent when positive cash balances are maintained, which may be used to offset transfer agent fees. If the amount earned is greater than $1, the expense paid under this arrangement is included on the “Statements of operations” under “Dividend disbursing and transfer agent fees and expenses” with the corresponding expense offset included under “Less expenses paid indirectly.” For the year ended Aug. 31, 2018, each Fund earned the following amounts under this agreement:
| | | | | | | | | | |
Delaware
Tax-Free
Arizona Fund | | Delaware
Tax-Free
California Fund | | Delaware
Tax-Free
Colorado Fund | | Delaware
Tax-Free
Idaho Fund | | Delaware
Tax-Free
New York Fund | | Delaware
Tax-Free
Pennsylvania
Fund |
$53 | | $43 | | $129 | | $58 | | $40 | | $367 |
2. Investment Management, Administration Agreements, and Other Transactions with Affiliates
In accordance with the terms of its respective investment management agreement, each Fund pays Delaware Management Company (DMC), a series of Macquarie Investment Management Business Trust and the investment manager, an annual fee which is calculated daily and paid monthly based on each Fund’s average daily net assets as follows:
| | | | | | | | | | | | | | | | | | | | | | | | |
| | | Delaware
Tax-Free
Arizona Fund | | | Delaware
Tax-Free
California Fund | | | Delaware
Tax-Free
Colorado Fund | | | Delaware
Tax-Free Idaho
Fund | | | Delaware
Tax-Free
New York
Fund | | | Delaware
Tax-Free
Pennsylvania
Fund | |
On the first $500 million | | | 0.500% | | | | 0.550% | | | | 0.550% | | | | 0.550% | | | | 0.550% | | | | 0.550% | |
On the next $500 million | | | 0.475% | | | | 0.500% | | | | 0.500% | | | | 0.500% | | | | 0.500% | | | | 0.500% | |
On the next $1.5 billion | | | 0.450% | | | | 0.450% | | | | 0.450% | | | | 0.450% | | | | 0.450% | | | | 0.450% | |
In excess of $2.5 billion | | | 0.425% | | | | 0.425% | | | | 0.425% | | | | 0.425% | | | | 0.425% | | | | 0.425% | |
DMC has contractually agreed to waive that portion, if any, of its management fee and/or pay/reimburse each Fund to the extent necessary to ensure that total annual operating expenses (excluding any distribution and service (12b-1) fees, acquired fund fees and expenses, taxes, interest, inverse floater program expenses, short sale and dividend interest expenses, brokerage fees, certain insurance costs, and nonroutine expenses or costs, including, but not limited to, those relating to reorganizations, litigation, conducting shareholder meetings, and liquidations), do not exceed specified percentages of each Fund’s average daily net assets from Sept. 1, 2017 through Aug. 31, 2018* as shown on the next page. For purposes of these waivers and reimbursements, nonroutine expenses may also include such additional costs and expenses as may be agreed upon from time to time by the Boards and DMC. These expense waivers and reimbursements apply only to expenses paid directly by each Fund and may only
146
be terminated by agreement of DMC and each Fund. The waivers and reimbursements are accrued daily and received monthly.
| | | | | | | | | | | | | | | | | | | | | | | | |
| | | Delaware
Tax-Free
Arizona
Fund | | | Delaware
Tax-Free
California
Fund | | | Delaware
Tax-Free
Colorado
Fund | | | Delaware
Tax-Free
Idaho
Fund | | | Delaware
Tax-Free
New York
Fund | | | Delaware
Tax-Free
Pennsylvania
Fund | |
Operating expense limitation as a percentage of average daily net assets (per annum) | | | 0.59% | | | | 0.57% | | | | 0.59% | | | | 0.61% | | | | 0.55% | | | | 0.64% | |
Delaware Investments Fund Services Company (DIFSC), an affiliate of DMC, provides fund accounting and financial administration oversight services to the Funds. For these services, DIFSC’s fees are calculated daily and paid monthly based on the aggregate daily net assets of all Funds within the Delaware Funds at the following annual rate: 0.00475% of the first $35 billion; 0.0040% of the next $10 billion; and 0.0025% of aggregate average daily net assets in excess of $45 billion (Total Fee). Each Fund in the Delaware Funds pays a minimum of $4,000, which, in aggregate, is subtracted from the Total Fee. Each Fund then pays its portion of the remainder of the Total Fee on a relative NAV basis. These amounts are included on the “Statements of operations” under “Accounting and administration expenses.” For the year ended Aug. 31, 2018, each Fund was charged for these services as follows:
| | | | | | | | | | |
Delaware
Tax-Free
Arizona Fund | | Delaware
Tax-Free
California Fund | | Delaware
Tax-Free
Colorado Fund | | Delaware
Tax-Free
Idaho Fund | | Delaware
Tax-Free
New York Fund | | Delaware
Tax-Free
Pennsylvania
Fund |
| $6,931 | | $7,752 | | $11,606 | | $7,924 | | $7,341 | | $21,341 |
DIFSC is also the transfer agent and dividend disbursing agent of each Fund. For these services, DIFSC’s fees were calculated daily and paid monthly based on the aggregate daily net assets of the retail funds within the Delaware Funds from Sept. 1, 2017 through June 30, 2018 at the following annual rate: 0.025% of the first $20 billion; 0.020% of the next $5 billion; 0.015% of the next $5 billion; and 0.013% of average daily net assets in excess of $30 billion. Effective July 1, 2018, each Fund as well as the other Delaware Funds entered into an amendment to the DIFSC agreement. Under the amendment to the DIFSC agreement, DIFSC’s fees are calculated daily and paid monthly based on the aggregate daily net assets of the retail funds within the Delaware Funds at the following annual rate: 0.014% of the first $20 billion; 0.011% of the next $5 billion; 0.007% of the next $5 billion; 0.005% of the next $20 billion; and 0.0025% of average daily net assets in excess of $50 billion. The fees payable to DIFSC under the transfer agent agreement described above are allocated among all retail funds in the Delaware Funds on a relative NAV basis. These amounts are included on the “Statements of operations” under “Dividend disbursing and transfer agent fees and expenses.” For the year ended Aug. 31, 2018, each Fund was charged for these services as follows:
| | | | | | | | | | |
Delaware
Tax-Free
Arizona Fund | | Delaware
Tax-Free
California Fund | | Delaware
Tax-Free
Colorado Fund | | Delaware
Tax-Free
Idaho Fund | | Delaware
Tax-Free
New York Fund | | Delaware
Tax-Free
Pennsylvania
Fund |
| $15,093 | | $19,324 | | $39,175 | | $20,214 | | $17,208 | | $89,294 |
147
Notes to financial statements
Delaware Funds® by Macquarie state tax-free funds
2. Investment Management, Administration Agreements, and Other Transactions with Affiliates (continued)
Pursuant to a sub-transfer agency agreement between DIFSC and BNY Mellon Investment Servicing (US) Inc. (BNYMIS), BNYMIS provides certain sub-transfer agency services to each Fund. Sub-transfer agency fees are paid by each Fund and are also included on the “Statement of operations” under “Dividend disbursing and transfer agent fees and expenses.”
Pursuant to a distribution agreement and distribution plan, each Fund pays DDLP, the distributor and an affiliate of DMC, an annual 12b-1 fee of 0.25% of the average daily net assets of the Class A shares (except for Delaware Tax-Free Pennsylvania Fund). The Board for Delaware Tax-Free Pennsylvania Fund has adopted a formula for calculating 12b-1 fees for the Fund’s Class A shares that went into effect on June 1, 1992. The Fund’s Class A shares are currently subject to a blended 12b-1 fee equal to the sum of: (1) 0.10% of average daily net assets representing shares acquired prior to June 1, 1992, and (2) 0.25% of average daily net assets representing shares acquired on or after June 1, 1992. All of the Fund’s Class A shareholders bear 12b-1 fees at the same blended rate, currently 0.24% of average daily net assets, based on the formula described above. This method of calculating Class A 12b-1 fees may be discontinued at the sole discretion of the Board. Each Fund pays 1.00% of the average daily net assets of the Class C shares. The fees are calculated daily and paid monthly. Institutional Class shares pay no 12b-1 fees.
As provided in the investment management agreement, each Fund bears a portion of the cost of certain resources shared with DMC, including the cost of internal personnel of DMC and/or its affiliates that provide legal, tax, and regulatory reporting services to each Fund. These amounts are included on the “Statements of operations” under “Legal fees.” For the year ended Aug. 31, 2018, each Fund was charged for internal legal, tax, and regulatory reporting services provided by DMC and/or its affiliates’ employees as follows:
| | | | | | | | | | |
Delaware
Tax-Free
Arizona Fund | | Delaware
Tax-Free
California Fund | | Delaware
Tax-Free
Colorado Fund | | Delaware
Tax-Free
Idaho Fund | | Delaware
Tax-Free
New York Fund | | Delaware
Tax-Free
Pennsylvania
Fund |
| $1,533 | | $1,969 | | $3,981 | | $2,063 | | $17,711 | | $8,991 |
For the year ended Aug. 31, 2018, DDLP earned commissions on sales of Class A shares for each Fund as follows:
| | | | | | | | | | |
Delaware
Tax-Free
Arizona Fund | | Delaware
Tax-Free
California Fund | | Delaware
Tax-Free
Colorado Fund | | Delaware
Tax-Free
Idaho Fund | | Delaware
Tax-Free
New York Fund | | Delaware
Tax-Free
Pennsylvania
Fund |
| $3,931 | | $4,924 | | $24,952 | | $7,317 | | $9,156 | | $30,188 |
For the year ended Aug. 31, 2018, DDLP received gross CDSC commissions on redemptions of each Fund’s Class A and Class C shares, respectively, and these commissions were entirely used to offset upfront commissions previously paid by DDLP to broker/dealers on sales of those shares. For the year
148
ended Aug. 31, 2018, Delaware Tax-Free Arizona Fund did not receive gross CDSC commissions on redemptions for Class A and Class C shares. The amounts received were as follows:
| | | | | | | | | | | | | | | | |
| | | Delaware
Tax-Free
California Fund | | Delaware
Tax-Free
Colorado Fund | | Delaware
Tax-Free
Idaho Fund | | | Delaware
Tax-Free
New York Fund | | | Delaware
Tax-Free
Pennsylvania Fund | |
Class A | | $— | | $238 | | | $ — | | | | $ — | | | | $ — | |
Class C | | 89 | | 401 | | | 4,476 | | | | 544 | | | | 2,954 | |
Trustees’ fees include expenses accrued by each Fund for each Trustee’s retainer and meeting fees. Certain officers of DMC, DIFSC, and DDLP are officers and/or Trustees of the Trusts. These officers and Trustees are paid no compensation by the Funds.
Cross trades for the year ended Aug. 31, 2018, were executed by the Funds pursuant to procedures adopted by the Board designed to ensure compliance with Rule 17a-7 under the 1940 Act. Cross trading is the buying or selling of portfolio securities between funds of investment companies, or between a fund of an investment company and another entity, that are or could be considered affiliates by virtue of having a common investment advisor (or affiliated investment advisors), common directors/trustees and/ or common officers. At their regularly scheduled meetings, the Boards review such transactions for compliance with the procedures adopted by the Boards. Delaware Tax-Free California Fund and Delaware Tax-Free Idaho Fund did not engage in securities cross trades for the year ended Aug. 31, 2018. Pursuant to these procedures, for the year ended Aug. 31, 2018, the following Funds engaged in 17a-7 securities purchases and 17a-7 securities sales, which resulted in net realized gains (losses) as follows:
| | | | | | | | | | | | | | | | |
| | | Delaware
Tax-Free
Arizona Fund | | | Delaware
Tax-Free
Colorado Fund | | | Delaware
Tax-Free
New York Fund | | | Delaware
Tax-Free
Pennsylvania Fund | |
Purchases | | | $ — | | | | $5,786,628 | | | | $ — | | | | $2,700,728 | |
Sales | | | 100,108 | | | | 7,438,401 | | | | 800,262 | | | | 7,142,857 | |
Net realized gain (loss) | | | — | | | | — | | | | — | | | | (86,923) | |
*The aggregate contractual waiver period covering this report is from Dec. 29, 2016 through Dec. 29, 2018.
3. Investments
For the year ended Aug. 31, 2018, each Fund made purchases and sales of investment securities other than short-term investments as follows:
| | | | | | | | | | | | | | | | | | | | | | | | |
| | | Delaware
Tax-Free
Arizona
Fund | | | Delaware
Tax-Free
California Fund | | | Delaware
Tax-Free
Colorado Fund | | | Delaware
Tax-Free
Idaho
Fund | | | Delaware
Tax-Free
New York Fund
| | | Delaware
Tax-Free
Pennsylvania Fund | |
Purchases | | $ | 4,378,216 | | | $ | 19,581,020 | | | $ | 20,453,303 | | | $ | 11,766,921 | | | | $9,081,356 | | | | $88,108,829 | |
Sales | | | 5,634,110 | | | | 15,181,627 | | | | 12,826,046 | | | | 19,129,021 | | | | 8,520,866 | | | | 94,414,872 | |
149
Notes to financial statements
Delaware Funds® by Macquarie state tax-free funds
3. Investments (continued)
The tax cost of investments includes adjustments to net unrealized appreciation (depreciation) which may not necessarily be final tax cost basis adjustments, but approximate the tax basis unrealized gains and losses that may be realized and distributed to shareholders. At Aug. 31, 2018, the cost and unrealized appreciation (depreciation) of investments for federal income tax purposes for each Fund were as follows:
| | | | | | | | | | | | | | | | | | | | | | | | |
| | | Delaware
Tax-Free Arizona
Fund | | | Delaware
Tax-Free
California
Fund | | | Delaware
Tax-Free Colorado
Fund | | | Delaware
Tax-Free
Idaho
Fund | | | Delaware
Tax-Free
New York
Fund | | | Delaware
Tax-Free
Pennsylvania
Fund | |
Cost of investments | | $ | 72,748,059 | | | $ | 95,098,903 | | | $ | 193,814,033 | | | $ | 95,342,082 | | | $ | 84,338,397 | | | $ | 424,051,721 | |
| | | | | | | | | | | | | | | | | | | | | | | | |
Aggregate unrealized appreciation of investments | | $ | 2,833,893 | | | $ | 4,318,060 | | | $ | 7,862,495 | | | $ | 2,794,396 | | | $ | 2,803,859 | | | $ | 19,175,949 | |
Aggregate unrealized depreciation of investments | | | (197,642 | ) | | | (247,549 | ) | | | (387,761 | ) | | | (387,007 | ) | | | (416,107 | ) | | | (174,095 | ) |
| | | | | | | | | | | | | | | | | | | | | | | | |
Net unrealized appreciation of investments | | $ | 2,636,251 | | | $ | 4,070,511 | | | $ | 7,474,734 | | | $ | 2,407,389 | | | $ | 2,387,752 | | | $ | 19,001,854 | |
| | | | | | | | | | | | | | | | | | | | | | | | |
US GAAP defines fair value as the price that each Fund would receive to sell an asset or pay to transfer a liability in an orderly transaction between market participants at the measurement date under current market conditions. A three-level hierarchy for fair value measurements has been established based upon the transparency of inputs to the valuation of an asset or liability. Inputs may be observable or unobservable and refer broadly to the assumptions that market participants would use in pricing the asset or liability. Observable inputs reflect the assumptions market participants would use in pricing the asset or liability based on market data obtained from sources independent of the reporting entity. Unobservable inputs reflect the reporting entity’s own assumptions about the assumptions that market participants would use in pricing the asset or liability based on the best information available under the circumstances. Each Fund’s investment in its entirety is assigned a level based upon the observability of the inputs which are significant to the overall valuation. The three-level hierarchy of inputs is summarized below and on the next page.
Level 1 – Inputs are quoted prices in active markets for identical investments. (Examples: equity securities, open-end investment companies, futures contracts, and exchange-traded options contracts)
Level 2 – Other observable inputs, including, but not limited to: quoted prices for similar assets or liabilities in markets that are active, quoted prices for identical or similar assets or liabilities in markets that are not active, inputs other than quoted prices that are observable for the assets or liabilities (such as interest rates, yield curves, volatilities, prepayment speeds, loss severities,
150
credit risks, and default rates), or other market-corroborated inputs. (Examples: debt securities, government securities, swap contracts, foreign currency exchange contracts, foreign securities utilizing international fair value pricing, broker-quoted securities, fair valued securities)
Level 3 – Significant unobservable inputs, including each Fund’s own assumptions used to determine the fair value of investments. (Examples: broker-quoted securities, fair valued securities)
Level 3 investments are valued using significant unobservable inputs. Each Fund may also use an income-based valuation approach in which the anticipated future cash flows of the investment are discounted to calculate fair value. Discounts may also be applied due to the nature or duration of any restrictions on the disposition of the investments. Valuations may also be based upon current market prices of securities that are comparable in coupon, rating, maturity, and industry. The derived value of a Level 3 investment may not represent the value which is received upon disposition and this could impact the results of operations.
The following tables summarize the valuation of each Fund’s investments by fair value hierarchy levels as of Aug. 31, 2018:
| | | | |
| | | Delaware Tax-Free Arizona Fund | |
| |
| | | Level 2 | |
Securities | | | | |
| |
Assets: | | | | |
Municipal Bonds | | | $75,084,310 | |
Short-Term Investments | | | 300,000 | |
Total Value of Securities | | | $75,384,310 | |
| | | | |
| |
| | | Delaware Tax-Free California Fund | |
| |
| | | Level 2 | |
Securities | | | | |
| |
Assets: | | | | |
Municipal Bonds | | | $98,844,414 | |
Short-Term Investments | | | 325,000 | |
Total Value of Securities | | | $99,169,414 | |
| | | | | | | | | | | | |
| |
| | | Delaware Tax-Free Colorado Fund | |
| | | |
| | | Level 1 | | | Level 2 | | | Total | |
Securities | | | | | | | | | | | | |
| | | |
Assets: | | | | | | | | | | | | |
Municipal Bonds | | | $ — | | | | $200,092,230 | | | | $200,092,230 | |
Short-Term Investments1 | | | 146,537 | | | | 1,050,000 | | | | 1,196,537 | |
Total Value of Securities | | | $146,537 | | | | $201,142,230 | | | | $201,288,767 | |
151
Notes to financial statements
Delaware Funds® by Macquarie state tax-free funds
3. Investments (continued)
| | | | | | | | | | | | |
| | | Delaware Tax-Free Idaho Fund | |
| | | |
| | | Level 1 | | | Level 2 | | | Total | |
Securities | | | | | | | | | | | | |
| | | |
Assets: | | | | | | | | | | | | |
Municipal Bonds | | | $ — | | | | $96,888,058 | | | | $96,888,058 | |
Short-Term Investments | | | 861,413 | | | | — | | | | 861,413 | |
Total Value of Securities | | | $861,413 | | | | $96,888,058 | | | | $97,749,471 | |
| |
| | | Delaware Tax-Free New York Fund | |
| | | |
| | | | | | Level 2 | | | | |
Securities | | | | | | | | | | | | |
| | | |
Assets: | | | | | | | | | | | | |
Municipal Bonds | | | | | | | $86,476,149 | | | | | |
Short-Term Investments | | | | | | | 250,000 | | | | | |
Total Value of Securities | | | | | | | $86,726,149 | | | | | |
| |
| | | Delaware Tax-Free Pennsylvania Fund | |
| | | |
| | | | | | Level 2 | | | | |
Securities | | | | | | | | | | | | |
| | | |
Assets: | | | | | | | | | | | | |
Municipal Bonds | | | | | | | $440,353,575 | | | | | |
Short-Term Investments | | | | | | | 2,700,000 | | | | | |
Total Value of Securities | | | | | | | $443,053,575 | | | | | |
| 1 | Security type is valued across multiple levels. Level 1 investments represent open-end investment company investments while Level 2 investments represent matrix-priced investments. The amounts attributed to Level 1 investments and Level 2 investments represent the following percentages of the total market value of this security type for the Funds: |
| | | | |
Short-Term Investments | | Delaware Tax-Free Colorado Fund | |
Level 1 | | | 12.25 | % |
Level 2 | | | 87.75 | % |
| | | | |
Total | | | 100.00 | % |
| | | | |
During the year ended Aug. 31, 2018, there were no transfers between Level 1 investments, Level 2 investments, or Level 3 investments that had a significant impact to each Fund. Each Fund’s policy is to recognize transfers between levels based on fair value at the beginning of the reporting period.
A reconciliation of Level 3 investments is presented when each Fund has a significant amount of Level 3 investments at the beginning, interim, or end of the period in relation to net assets. During the year ended Aug. 31, 2018, there were no Level 3 investments.
152
4. Dividend and Distribution Information
Income and long-term capital gain distributions are determined in accordance with federal income tax regulations, which may differ from US GAAP. Additionally, distributions from net short-term gains on sales of investment securities are treated as ordinary income for federal income tax purposes. The tax character of dividends and distributions paid during the years ended Aug. 31, 2018 and 2017 were as follows:
| | | | | | | | | | | | | | | | | | | | | | | | |
| | | Delaware
Tax-Free
Arizona
Fund | | | Delaware
Tax-Free
California
Fund | | | Delaware
Tax-Free
Colorado
Fund | | | Delaware
Tax-Free
Idaho
Fund | | | Delaware
Tax-Free
New York
Fund | | | Delaware
Tax-Free
Pennsylvania
Fund | |
Year ended 8/31/18 | | | | | | | | | | | | | | | | | | | | | | | | |
Tax-exempt income | | $ | 2,479,414 | | | $ | 3,234,507 | | | $ | 6,719,815 | | | $ | 3,008,868 | | | $ | 2,707,774 | | | $ | 15,788,289 | |
Ordinary income | | | — | | | | 11,179 | | | | 860 | | | | — | | | | 6,256 | | | | — | |
Long-term capital gains | | | — | | | | — | | | | — | | | | — | | | | — | | | | 286,814 | |
| | | | | | | | | | | | | | | | | | | | | | | | |
Total | | $ | 2,479,414 | | | $ | 3,245,686 | | | $ | 6,720,675 | | | $ | 3,008,868 | | | $ | 2,714,030 | | | $ | 16,075,103 | |
| | | | | | | | | | | | | | | | | | | | | | | | |
| | | | | | |
Year ended 8/31/17 | | | | | | | | | | | | | | | | | | | | | | | | |
Tax-exempt income | | $ | 2,575,526 | | | $ | 3,091,037 | | | $ | 6,839,347 | | | $ | 3,044,565 | | | $ | 2,697,749 | | | $ | 16,370,050 | |
Ordinary income | | | 3,498 | | | | 11,251 | | | | 55,260 | | | | 54 | | | | 52,240 | | | | 5,419 | |
| | | | | | | | | | | | | | | | | | | | | | | | |
Total | | $ | 2,579,024 | | | $ | 3,102,288 | | | $ | 6,894,607 | | | $ | 3,044,619 | | | $ | 2,749,989 | | | $ | 16,375,469 | |
| | | | | | | | | | | | | | | | | | | | | | | | |
153
Notes to financial statements
Delaware Funds® by Macquarie state tax-free funds
5. Components of Net Assets on a Tax Basis
As of Aug. 31, 2018, the components of net assets on a tax basis were as follows:
| | | | | | | | | | | | | | | | | | | | | | | | |
| | | Delaware
Tax-Free
Arizona
Fund | | | Delaware
Tax-Free
California
Fund | | | Delaware
Tax-Free
Colorado
Fund | | | Delaware
Tax-Free
Idaho Fund | | | Delaware
Tax-Free
New York
Fund | | | Delaware
Tax-Free
Pennsylvania
Fund | |
Shares of beneficial interest | | $ | 74,512,531 | | | $ | 94,913,852 | | | $ | 198,495,296 | | | $ | 100,557,328 | | | $ | 84,223,048 | | | $ | 426,971,162 | |
Undistributed tax-exempt income | | | 81,729 | | | | 99,813 | | | | 519,546 | | | | 56,530 | | | | 65,553 | | | | 277,732 | |
Undistributed long-term capital gains | | | — | | | | 136,032 | | | | — | | | | — | | | | — | | | | — | |
Distributions payable | | | (61,848 | ) | | | (81,050 | ) | | | (166,988 | ) | | | (73,239 | ) | | | (66,203 | ) | | | (386,697 | ) |
Qualified late year loss deferrals | | | — | | | | — | | | | — | | | | — | | | | — | | | | (23,497 | ) |
Capital loss carryforwards | | | (622,360 | ) | | | — | | | | (3,879,191 | ) | | | (4,616,167 | ) | | | (549,357 | ) | | | — | |
Unrealized appreciation of investments | | | 2,636,251 | | | | 4,070,511 | | | | 7,474,734 | | | | 2,407,389 | | | | 2,387,752 | | | | 19,001,854 | |
| | | | | | | | | | | | | | | | | | | | | | | | |
Net assets | | $ | 76,546,303 | | | $ | 99,139,158 | | | $ | 202,443,397 | | | $ | 98,331,841 | | | $ | 86,060,793 | | | $ | 445,840,554 | |
| | | | | | | | | | | | | | | | | | | | | | | | |
The differences between book basis and tax basis components of net assets are primarily attributable to tax treatment of market discount and premium on certain debt instruments and dividends payable, as applicable.
Qualified late year losses represent losses realized on investment transactions from Nov. 1, 2017 through Aug. 31, 2018 that, in accordance with federal income tax regulations, Delaware Tax-Free Pennsylvania Fund has elected to defer and treat as having arisen in the following fiscal year.
For financial reporting purposes, capital accounts are adjusted to reflect the tax character of permanent book/tax differences. Reclassifications are primarily due to tax treatment of market discount and premium on certain debt instruments. Results of operations and net assets were not affected by these reclassifications.
154
For the year ended Aug. 31, 2018, the Funds recorded the following reclassifications:
| | | | | | | | | | | | | | | | |
| | | Delaware
Tax-Free
Arizona
Fund | | | Delaware
Tax-Free
California Fund | | | Delaware
Tax-Free
Idaho
Fund | | | Delaware
Tax-Free
New York Fund | |
Undistributed (distributions in excess of) net investment income | | $ | (11,073 | ) | | | $ 9,322 | | | $ | (5,899 | ) | | | $ 14,956 | |
Accumulated net realized loss on investments | | | 11,073 | | | | (9,322 | ) | | | 5,899 | | | | (14,956 | ) |
For federal income tax purposes, capital loss carryforwards may be carried forward and applied against future capital gains. In 2018, the Funds utilized capital loss carryforwards as follows:
| | | | | | | | | | |
Delaware
Tax-Free
Arizona Fund | | Delaware
Tax-Free
California Fund | | Delaware
Tax-Free
Colorado Fund | | Delaware
Tax-Free
Idaho Fund | | Delaware
Tax-Free
New York Fund | | Delaware
Tax-Free
Pennsylvania
Fund |
| $379,155 | | $275,180 | | $124,725 | | $294,641 | | $167,422 | | $206,243 |
Under the Regulated Investment Company Modernization Act of 2010 (Act), net capital losses recognized for tax years beginning after Dec. 22, 2010 may be carried forward indefinitely, and their character is retained as short-term and/or long-term losses. At Aug. 31, 2018, capital loss carryforwards available to offset future realized capital gains, were as follows:
| | | | | | |
| | | No expiration
Post-enactment capital loss character | | |
| | | Short-term | | Long-term | | Total |
Delaware Tax-Free Arizona Fund | | $ 122,999 | | $ 499,361 | | $ 622,360 |
Delaware Tax-Free Colorado Fund | | 2,984,098 | | 895,093 | | 3,879,191 |
Delaware Tax-Free Idaho Fund | | 1,843,008 | | 2,773,159 | | 4,616,167 |
Delaware Tax-Free New York Fund | | 549,357 | | — | | 549,357 |
At Aug. 31, 2018, there were no capital loss carryforwards for Delaware Tax-Free California Fund and Delaware Tax-Free Pennsylvania Fund.
155
Notes to financial statements
Delaware Funds® by Macquarie state tax-free funds
6. Capital Shares
Transactions in capital shares were as follows:
| | | | | | | | | | | | | | | | | | | | | | | | |
| | | Delaware Tax-Free
Arizona Fund | | | Delaware Tax-Free
California Fund | | | Delaware Tax-Free
Colorado Fund | |
| | | Year ended | | | Year ended | | | Year ended | |
| | | 8/31/18 | | | 8/31/17 | | | 8/31/18 | | | 8/31/17 | | | 8/31/18 | | | 8/31/17 | |
Shares sold: | | | | | | | | | | | | | | | | | | | | | | | | |
Class A | | | 401,414 | | | | 359,663 | | | | 481,529 | | | | 383,352 | | | | 1,516,496 | | | | 985,610 | |
Class C | | | 37,968 | | | | 33,021 | | | | 92,304 | | | | 165,912 | | | | 154,631 | | | | 175,888 | |
Institutional Class | | | 484,339 | | | | 551,220 | | | | 976,452 | | | | 1,850,334 | | | | 1,145,931 | | | | 966,015 | |
Shares issued upon reinvestment of dividends and distributions: | | | | | | | | | | | | | |
Class A | | | 145,750 | | | | 150,218 | | | | 128,458 | | | | 139,705 | | | | 426,365 | | | | 447,177 | |
Class C | | | 9,402 | | | | 11,462 | | | | 28,460 | | | | 30,683 | | | | 31,641 | | | | 35,948 | |
Institutional Class | | | 23,553 | | | | 10,753 | | | | 56,412 | | | | 39,148 | | | | 65,726 | | | | 45,871 | |
| | | | | | | | | | | | | | | | | | | | | | | | |
| | | 1,102,426 | | | | 1,116,337 | | | | 1,763,615 | | | | 2,609,134 | | | | 3,340,790 | | | | 2,656,509 | |
| | | | | | | | | | | | | | | | | | | | | | | | |
Shares redeemed: | | | | | | | | | | | | | | | | | | | | | | | | |
Class A | | | (735,408 | ) | | | (985,974 | ) | | | (581,599 | ) | | | (1,135,425 | ) | | | (1,750,927 | ) | | | (2,444,547 | ) |
Class C | | | (223,437 | ) | | | (165,678 | ) | | | (377,386 | ) | | | (347,130 | ) | | | (611,405 | ) | | | (208,668 | ) |
Institutional Class | | | (226,311 | ) | | | (253,082 | ) | | | (582,597 | ) | | | (970,674 | ) | | | (480,166 | ) | | | (306,096 | ) |
| | | | | | | | | | | | | | | | | | | | | | | | |
| | | (1,185,156 | ) | | | (1,404,734 | ) | | | (1,541,582 | ) | | | (2,453,229 | ) | | | (2,842,498 | ) | | | (2,959,311 | ) |
| | | | | | | | | | | | | | | | | | | | | | | | |
Net increase (decrease) | | | (82,730 | ) | | | (288,397 | ) | | | 222,033 | | | | 155,905 | | | | 498,292 | | | | (302,802 | ) |
| | | | | | | | | | | | | | | | | | | | | | | | |
| | | | | | | | | | | | | | | | | | | | | | | | |
| | | Delaware Tax-Free
Idaho Fund | | | Delaware Tax-Free
New York Fund | | | Delaware Tax-Free
Pennsylvania Fund | |
| | | Year ended | | | Year ended | | | Year ended | |
| | | 8/31/18 | | | 8/31/17 | | | 8/31/18 | | | 8/31/17 | | | 8/31/18 | | | 8/31/17 | |
Shares sold: | | | | | | | | | | | | | | | | | | | | | | | | |
Class A | | | 491,709 | | | | 712,236 | | | | 446,716 | | | | 408,454 | | | | 3,540,085 | | | | 2,984,986 | |
Class C | | | 116,633 | | | | 421,970 | | | | 196,498 | | | | 143,125 | | | | 257,821 | | | | 520,671 | |
Institutional Class | | | 1,301,911 | | | | 514,605 | | | | 762,592 | | | | 1,640,607 | | | | 2,068,244 | | | | 2,422,421 | |
Shares issued upon reinvestment of dividends and distributions: | | | | | | | | | | | | | |
Class A | | | 146,253 | | | | 156,594 | | | | 98,908 | | | | 112,866 | | | | 1,467,605 | | | | 1,487,678 | |
Class C | | | 45,404 | | | | 55,720 | | | | 26,286 | | | | 28,463 | | | | 104,907 | | | | 109,128 | |
Institutional Class | | | 44,060 | | | | 25,155 | | | | 84,790 | | | | 67,421 | | | | 154,540 | | | | 114,073 | |
| | | | | | | | | | | | | | | | | | | | | | | | |
| | | 2,145,970 | | | | 1,886,280 | | | | 1,615,790 | | | | 2,400,936 | | | | 7,593,202 | | | | 7,638,957 | |
| | | | | | | | | | | | | | | | | | | | | | | | |
Shares redeemed: | | | | | | | | | | | | | | | | | | | | | | | | |
Class A | | | (1,248,164 | ) | | | (921,199 | ) | | | (679,446 | ) | | | (1,648,934 | ) | | | (6,343,711 | ) | | | (7,851,159 | ) |
Class C | | | (1,149,919 | ) | | | (536,178 | ) | | | (374,553 | ) | | | (447,347 | ) | | | (1,126,446 | ) | | | (857,681 | ) |
Institutional Class | | | (497,691 | ) | | | (356,651 | ) | | | (708,326 | ) | | | (600,075 | ) | | | (1,096,801 | ) | | | (1,580,938 | ) |
| | | | | | | | | | | | | | | | | | | | | | | | |
| | | (2,895,774 | ) | | | (1,814,028 | ) | | | (1,762,325 | ) | | | (2,696,356 | ) | | | (8,566,958 | ) | | | (10,289,778 | ) |
| | | | | | | | | | | | | | | | | | | | | | | | |
Net increase (decrease) | | | (749,804 | ) | | | 72,252 | | | | (146,535 | ) | | | (295,420 | ) | | | (973,756 | ) | | | (2,650,821 | ) |
| | | | | | | | | | | | | | | | | | | | | | | | |
156
Certain shareholders may exchange shares of one class for shares of another class in the same Fund. These exchange transactions are included as subscriptions and redemptions in the tables on the previous pages and the “Statements of changes in net assets.” For the years ended Aug. 31, 2018 and 2017, the Funds had the following exchange transactions.
| | | | | | | | | | | | | | | | | | | | |
| | | Year ended 8/31/18 | |
| | | Exchange Redemptions | | | Exchange Subscriptions | | | | |
| | | Class A
Shares | | | Class C
Shares | | | Class A
Shares | | | Institutional
Class
Shares | | | Value | |
Delaware Tax-Free Arizona Fund | | | — | | | | 35,940 | | | | 36,057 | | | | — | | | | $ 405,639 | |
Delaware Tax-Free California Fund | | | — | | | | 31,170 | | | | 31,265 | | | | — | | | | 374,556 | |
Delaware Tax-Free Colorado Fund | | | 25,842 | | | | 65,040 | | | | 65,280 | | | | 25,862 | | | | 1,012,424 | |
Delaware Tax-Free Idaho Fund | | | 70,345 | | | | 75,131 | | | | 75,134 | | | | 70,345 | | | | 1,632,222 | |
Delaware Tax-Free New York Fund | | | — | | | | 2,096 | | | | 2,095 | | | | — | | | | 23,755 | |
Delaware Tax-Free Pennsylvania Fund | | | 234,332 | | | | 340,876 | | | | 331,960 | | | | 243,871 | | | | 4,583,905 | |
| |
| | | Year ended 8/31/17 | |
| | | Exchange Redemptions | | | Exchange Subscriptions | | | | |
| | | Class A
Shares | | | Class C
Shares | | | Class A
Shares | | | Institutional
Class
Shares | | | Value | |
Delaware Tax-Free Arizona Fund | | | 352,645 | | | | 8,623 | | | | 8,661 | | | | 353,311 | | | | $4,090,914 | |
Delaware Tax-Free California Fund | | | 207,994 | | | | — | | | | — | | | | 208,391 | | | | 2,491,064 | |
Delaware Tax-Free Colorado Fund | | | 231,508 | | | | 4,796 | | | | — | | | | 236,773 | | | | 2,621,378 | |
Delaware Tax-Free Idaho Fund | | | 41,681 | | | | 2,629 | | | | — | | | | 44,359 | | | | 504,209 | |
Delaware Tax-Free New York Fund | | | 434,101 | | | | — | | | | — | | | | 434,952 | | | | 4,952,348 | |
Delaware Tax-Free Pennsylvania Fund | | | 700,054 | | | | 64,109 | | | | 2,538 | | | | 763,686 | | | | 6,134,831 | |
157
Notes to financial statements
Delaware Funds® by Macquarie state tax-free funds
7. Line of Credit
Each Fund, along with certain other funds in the Delaware Funds (Participants), was a participant in a $155,000,000 revolving line of credit intended to be used for temporary or emergency purposes as an additional source of liquidity to fund redemptions of investor shares. Under the agreement, the Participants were charged an annual commitment fee of 0.15%, which was generally allocated across the Participants based on a weighted average of the respective net assets of each Participant. The Participants were permitted to borrow up to a maximum of one-third of their net assets under the agreement. Each Participant was individually, and not jointly, liable for its particular advances, if any, under the line of credit. The line of credit available under the agreement expired on Nov. 6, 2017.
On Nov. 6, 2017, each Fund, along with the other Participants, entered into an amendment to the agreement for a $155,000,000 revolving line of credit. The line of credit is to be used as described above and operates in substantially the same manner as the original agreement. The line of credit available under the agreement expires on Nov. 5, 2018.
The Funds had no amounts outstanding as of Aug. 31, 2018, or at any time during the year then ended.
8. Geographic, Credit, and Market Risks
The Funds concentrate their investments in securities issued by each corresponding state’s municipalities. The Funds invest primarily in a specific state and may be subject to geographic concentration risk. In addition, the Funds have the flexibility to invest in issuers in US territories and possessions such as the Commonwealth of Puerto Rico, the US Virgin Islands, and Guam whose bonds are also free of federal and individual state income taxes. The value of the Funds’ investments may be adversely affected by new legislation within the states or US territories, regional or local economic conditions, and differing levels of supply and demand for municipal bonds. Many municipalities insure repayment for their obligations. Although bond insurance reduces the risk of loss due to default by an issuer, such bonds remain subject to the risk that value may fluctuate for other reasons and there is no certainty that the insurance company will meet its obligations. A real or perceived decline in creditworthiness of a bond insurer can have an adverse impact on the value of insured bonds held in each Fund.
158
At Aug. 31, 2018, the percentages of each Fund’s net assets insured by bond insurers are listed below and these securities have been identified on the “Schedules of investments.”
| | | | | | | | | | | | | | |
| | | Delaware
Tax-Free
Arizona Fund | | Delaware
Tax-Free
California Fund | | Delaware
Tax-Free
Colorado Fund | | Delaware
Tax-Free
Idaho Fund | | | Delaware
Tax-Free
New York Fund | | Delaware
Tax-Free
Pennsylvania Fund |
American Capital Access | | 1.31% | | — | | — | | | — | | | — | | — |
Assured Guaranty Corporation | | — | | — | | — | | | — | | | — | | 3.42% |
Assured Guaranty Municipal Corporation | | 3.52% | | 1.47% | | 5.00% | | | 10.04% | | | 0.04% | | 2.58% |
AMBAC Assurance Corporation | | 1.28% | | — | | — | | | — | | | — | | 0.13% |
Build America Mutual Assurance | | — | | — | | 1.13% | | | — | | | — | | 0.60% |
National Public Finance Guarantee Corporation | | — | | 1.40% | | — | | | — | | | — | | — |
Syncora Guarantee Inc. | | — | | — | | 2.10% | | | — | | | — | | — |
| | | | | | | | | | | | | | |
| | 6.11% | | 2.87% | | 8.23% | | | 10.04% | | | 0.04% | | 6.73% |
| | | | | | | | | | | | | | |
Each Fund invests a portion of its assets in high yield fixed income securities, which are securities rated lower than BBB- by Standard & Poor’s Financial Services LLC (S&P), lower than Baa3 by Moody’s Investors Service, Inc. (Moody’s), or similarly rated by another nationally recognized statistical rating organization. Investments in these higher yielding securities are generally accompanied by a greater degree of credit risk than higher-rated securities. Additionally, lower-rated securities may be more susceptible to adverse economic and competitive industry conditions than investment grade securities.
When interest rates rise, fixed income securities (i.e., debt obligations) generally will decline in value. These declines in value are greater for fixed income securities with longer maturities or durations.
Each Fund invests in certain obligations that may have liquidity protection designed to ensure that the receipt of payments due on the underlying security is timely. Such protection may be provided through guarantees, insurance policies, or letters of credit obtained by the issuer or sponsor through third parties, through various means of structuring the transaction, or through a combination of such approaches. Each Fund will not pay any additional fees for such credit support, although the existence of credit support may increase the price of a security.
Each Fund may invest in advanced refunded bonds, escrow secured bonds, or defeased bonds. Under current federal tax laws and regulations, state and local government borrowers are permitted to refinance outstanding bonds by issuing new bonds. The issuer refinances the outstanding debt to either reduce interest costs or to remove or alter restrictive covenants imposed by the bonds being refinanced. A refunding transaction where the municipal securities are being refunded within 90 days from the
159
Notes to financial statements
Delaware Funds® by Macquarie state tax-free funds
8. Geographic, Credit, and Market Risks (continued)
issuance of the refunding issue is known as a “current refunding.” “Advance refunded bonds” are bonds in which the refunded bond issue remains outstanding for more than 90 days following the issuance of the refunding issue. In an advance refunding, the issuer will use the proceeds of a new bond issue to purchase high grade interest bearing debt securities, which are then deposited in an irrevocable escrow account held by an escrow agent to secure all future payments of principal and interest and bond premium of the advance refunded bond. Bonds are “escrowed to maturity” when the proceeds of the refunding issue are deposited in an escrow account for investment sufficient to pay all of the principal and interest on the original interest payment and maturity dates.
Bonds are considered “pre-refunded” when the refunding issue’s proceeds are escrowed only until a permitted call date or dates on the refunded issue with the refunded issue being redeemed at the time, including any required premium. Bonds become “defeased” when the rights and interests of the bondholders and of their lien on the pledged revenues or other security under the terms of the bond contract are substituted with an alternative source of revenues (the escrow securities) sufficient to meet payments of principal and interest to maturity or to the first call dates. Escrowed secured bonds will often receive a rating of AAA from Moody’s, S&P, and/or Fitch Ratings due to the strong credit quality of the escrow securities and the irrevocable nature of the escrow deposit agreement.
Each Fund may invest up to 15% of its net assets in illiquid securities, which may include securities with contractual restrictions on resale, securities exempt from registration under Rule 144A promulgated under the Securities Act of 1933, as amended, and other securities which may not be readily marketable. The relative illiquidity of these securities may impair each Fund from disposing of them in a timely manner and at a fair price when it is necessary or desirable to do so. While maintaining oversight, each Board has delegated to DMC, the day-to-day functions of determining whether individual securities are liquid for purposes of the Fund’s limitation on investments in illiquid securities. Securities eligible for resale pursuant to Rule 144A, which are determined to be liquid, are not subject to each Fund’s 15% limit on investments in illiquid securities. Rule 144A securities held by the Funds have been identified on the “Schedules of investments.” Restricted securities are valued pursuant to the security valuation procedures described in Note 1.
9. Contractual Obligations
Each Fund enters into contracts in the normal course of business that contain a variety of indemnifications. The Funds’ maximum exposure under these arrangements is unknown. However, each Fund has not had prior claims or losses pursuant to these contracts. Management has reviewed the Funds’ existing contracts and expects the risk of loss to be remote.
10. Recent Accounting Pronouncements
In August 2018, the FASB issued an Accounting Standards Update, ASU 2018-13, which changes certain fair value measurement disclosure requirements. The ASU includes additions and modifications to disclosures for Level 3 fair value measurements. The ASU 2018-13 is effective for fiscal years, and interim periods within those fiscal years, beginning after Dec. 15, 2019. At this time, management is evaluating the implications of these changes on the financial statements.
160
In March 2017, the FASB issued an Accounting Standards Update, ASU 2017-08, Receivables — Nonrefundable Fees and Other Costs (Subtopic 310-20), Premium Amortization on Purchased Callable Debt Securities which amends the amortization period for certain purchased callable debt securities held at a premium, shortening such period to the earliest call date. The ASU 2017-08 does not require any accounting change for debt securities held at a discount; the discount continues to be amortized to maturity. The ASU 2017-08 is effective for fiscal years, and interim periods within those fiscal years, beginning after Dec. 15, 2018. At this time, management is evaluating the implications of these changes on the financial statements.
11. Subsequent Events
On Sept. 6, 2018, the credit facility that each Fund participates in was reduced from a $155,000,000 to a $130,000,000 revolving line of credit. This line of credit will expire on Nov. 5, 2018.
Management has determined that no other material events or transactions occurred subsequent to Aug. 31, 2018, that would require recognition or disclosure in the Funds’ financial statements.
161
Report of independent
registered public accounting firm
To the Board of Trustees of Voyageur Insured Funds, Voyageur Mutual Funds, Voyageur Mutual Funds II and Delaware Group® State Tax-Free Income Trust and Shareholders of Delaware Tax-Free Arizona Fund, Delaware Tax-Free California Fund, Delaware Tax-Free Idaho Fund, Delaware Tax-Free New York Fund, Delaware Tax-Free Colorado Fund and Delaware Tax-Free Pennsylvania Fund
Opinions on the Financial Statements
We have audited the accompanying statements of assets and liabilities, including the schedules of investments, of Delaware Tax-Free Arizona Fund (constituting Voyageur Insured Funds), Delaware Tax-Free California Fund, Delaware Tax-Free Idaho Fund, Delaware Tax-Free New York Fund (three of the funds constituting Voyageur Mutual Funds), Delaware Tax-Free Colorado Fund (constituting Voyageur Mutual Funds II) and Delaware Tax-Free Pennsylvania Fund (constituting Delaware Group® State Tax-Free Income Trust) (hereafter collectively referred to as the “Funds”) as of August 31, 2018, the related statements of operations for the year ended August 31, 2018, the statements of changes in net assets for each of the two years in the period ended August 31, 2018, including the related notes, and the financial highlights for each of the periods indicated therein (collectively referred to as the “financial statements”). In our opinion, the financial statements present fairly, in all material respects, the financial position of each of the Funds as of August 31, 2018, the results of each of their operations for the year then ended, the changes in each of their net assets for each of the two years in the period ended August 31, 2018 and each of the financial highlights for each of the periods indicated therein in conformity with accounting principles generally accepted in the United States of America.
Basis for Opinions
These financial statements are the responsibility of the Funds’ management. Our responsibility is to express an opinion on the Funds’ financial statements based on our audits. We are a public accounting firm registered with the Public Company Accounting Oversight Board (United States) (“PCAOB”) and are required to be independent with respect to the Funds in accordance with the U.S. federal securities laws and the applicable rules and regulations of the Securities and Exchange Commission and the PCAOB.
We conducted our audits of these financial statements in accordance with the standards of the PCAOB. Those standards require that we plan and perform the audit to obtain reasonable assurance about whether the financial statements are free of material misstatement, whether due to error or fraud.
Our audits included performing procedures to assess the risks of material misstatement of the financial statements, whether due to error or fraud, and performing procedures that respond to those risks. Such procedures included examining, on a test basis, evidence regarding the amounts and disclosures in the financial statements. Our audits also included evaluating the accounting principles used and significant estimates made by management, as well as evaluating the overall presentation of the financial statements. Our procedures included confirmation of securities owned as of August 31, 2018 by correspondence with the custodian and brokers; when replies were not received from brokers, we performed other auditing procedures. We believe that our audits provide a reasonable basis for our opinions.
PricewaterhouseCoopers LLP
Philadelphia, Pennsylvania
October 17, 2018
We have served as the auditor of one or more investment companies in Delaware Funds® by Macquarie since 2010.
162
Other Fund information (Unaudited)
Delaware Funds® by Macquarie state tax-free funds
Tax Information
The information set forth below is for the Funds’ fiscal year as required by federal income tax laws. Shareholders, however, must report distributions on a calendar year basis for income tax purposes, which may include distributions for portions of two fiscal years of the Funds. Accordingly, the information needed by shareholders for income tax purposes will be sent to them in January of each year. Please consult your tax advisor for proper treatment of this information.
All disclosures are based on financial information available as of the date of this annual report and, accordingly are subject to change. For any and all items requiring reporting, it is the intention of each Fund to report the maximum amount permitted under the Internal Revenue Code and the regulations thereunder.
For the fiscal year ended Aug. 31, 2018, each Fund reports distributions paid during the year as follows:
| | | | | | | | |
| | | (A)
Long-Term Capital
Gains Distributions
(Tax Basis) | | (B)
Ordinary Income
Distributions
(Tax Basis) | | (C)
Tax-Exempt Income
Distributions
(Tax Basis) | | Total Distributions
(Tax Basis) |
Delaware Tax-Free Arizona Fund | | — | | — | | 100.00% | | 100.00% |
Delaware Tax-Free California Fund | | — | | 0.34% | | 99.66% | | 100.00% |
Delaware Tax-Free Colorado Fund | | — | | 0.01% | | 99.99% | | 100.00% |
Delaware Tax-Free Idaho Fund | | — | | — | | 100.00% | | 100.00% |
Delaware Tax-Free New York Fund | | — | | 0.23% | | 99.77% | | 100.00% |
Delaware Tax-Free Pennsylvania Fund | | 1.78% | | — | | 98.22% | | 100.00% |
(A), (B) and (C) are based on a percentage of each Fund’s total distributions.
Board consideration of advisory agreements for Delaware Tax-Free Arizona Fund, Delaware Tax-Free California Fund, Delaware Tax-Free Colorado Fund, Delaware Tax-Free Idaho Fund, Delaware Tax-Free New York Fund, and Delaware Tax-Free Pennsylvania Fund
At a meeting held on Aug. 15–16, 2018 (the “Annual Meeting”), the Board of Trustees (the “Board”), including a majority of disinterested or independent Trustees, approved the renewal of the Investment Advisory Agreements for Delaware Tax-Free Arizona Fund, Delaware Tax-Free California Fund, Delaware Tax-Free Colorado Fund, Delaware Tax-Free Idaho Fund, Delaware Tax-Free New York Fund, and Delaware Tax-Free Pennsylvania Fund (each, a “Fund” and together, the “Funds”). In making its decision, the Board considered information furnished at regular quarterly Board meetings, including reports detailing Fund performance, investment strategies, and expenses, as well as information
163
Other Fund information (Unaudited)
Delaware Funds® by Macquarie state tax-free funds
Board consideration of advisory agreements for Delaware Tax-Free Arizona Fund, Delaware Tax-Free California Fund, Delaware Tax-Free Colorado Fund, Delaware Tax-Free Idaho Fund, Delaware Tax-Free New York Fund, and Delaware Tax-Free Pennsylvania Fund (continued)
prepared specifically in connection with the renewal of the investment advisory contracts. Information furnished specifically in connection with the renewal of the Investment Management Agreement with Delaware Management Company (“DMC”), a series of Macquarie Investment Management Business Trust (“MIMBT”) included materials provided by DMC and its affiliates (collectively, “Macquarie Investment Management”) concerning, among other things, the nature, extent, and quality of services provided to the Funds; the costs of such services to the Funds; economies of scale; and the investment manager’s financial condition and profitability. In addition, in connection with the Annual Meeting, materials were provided to the Trustees in May 2018, including reports provided by Broadridge Financial Solutions (“Broadridge”). The Broadridge reports compared each Fund’s investment performance and expenses with those of other comparable mutual funds. The Independent Trustees reviewed and discussed the Broadridge reports with independent legal counsel to the Independent Trustees. In addition to the information noted above, the Board also requested and received information regarding DMC’s policy with respect to advisory fee levels and its breakpoint philosophy; the structure of portfolio manager compensation; comparative client fee information; and any constraints or limitations on the availability of securities for certain investment styles, which had in the past year inhibited, or which were likely in the future to inhibit, the investment manager’s ability to invest fully in accordance with Fund policies.
In considering information relating to the approval of each Fund’s advisory agreement, the Independent Trustees received assistance and advice from and met separately with independent legal counsel to the Independent Trustees and also from an experienced and knowledgeable independent fund consultant, JDL Consultants, LLC (“JDL”). Although the Board gave attention to all information furnished, the following discussion identifies, under separate headings, the primary factors taken into account by the Board during its contract renewal considerations.
Nature, extent, and quality of service. The Board considered the services provided by DMC to the Funds and their shareholders. In reviewing the nature, extent, and quality of services, the Board considered reports furnished to it throughout the year, which covered matters such as the relative performance of the Funds; compliance of portfolio managers with the investment policies, strategies, and restrictions for the Funds; compliance by DMC and Delaware Distributors, L.P. (together, “Management”) personnel with the Code of Ethics adopted throughout the Delaware Funds® by Macquarie (“Delaware Funds”); and adherence to fair value pricing procedures as established by the Board. The Board was pleased with the current staffing of DMC and the emphasis placed on research in the investment process. The Board recognized DMC’s receipt of certain favorable industry distinctions during the past several years. The Board gave favorable consideration to DMC’s efforts to control expenses while maintaining service levels committed to Fund matters. The Board also noted the benefits provided to Fund shareholders (a) through each shareholder’s ability to: (i) exchange an investment in one Delaware Fund for the same class of shares in another Delaware Fund without a sales charge, or (ii) to reinvest Fund dividends into additional shares of the Fund or into additional shares of other Delaware
164
Funds, and (b) the privilege to combine holdings in other Delaware Funds to obtain a reduced sales charge. The Board was satisfied with the nature, extent, and quality of the overall services provided by DMC.
Investment performance. The Board placed significant emphasis on the investment performance of the Funds in view of the importance of investment performance to shareholders. Although the Board considered performance reports and discussions with portfolio managers at Investment Committee meetings throughout the year, the Board gave particular weight to the Broadridge reports furnished for the Annual Meeting. The Broadridge reports prepared for each Fund showed the investment performance of its Class A shares in comparison to a group of similar funds as selected by Broadridge (the “Performance Universe”). A fund with the best performance ranked first, and a fund with the poorest performance ranked last. The highest/best performing 25% of funds in the Performance Universe make up the first quartile; the next 25%, the second quartile; the next 25%, the third quartile; and the poorest/ worst performing 25% of funds in the Performance Universe make up the fourth quartile. Comparative annualized performance for each Fund was shown for the past 1-, 3-, 5-, and 10-year periods, to the extent applicable, ended Jan. 31, 2018. The Board’s objective is that each Fund’s performance for the 1-, 3-, and 5-year periods be at or above the median of its Performance Universe.
Delaware Tax-Free Arizona Fund — The Performance Universe for the Fund consisted of the Fund and all retail and institutional “other states” municipal debt funds as selected by Broadridge. The Broadridge report comparison showed that the Fund’s total return for the 1-, 3-, 5-, and 10-year periods was in the first quartile of its Performance Universe. The Board was satisfied with performance.
Delaware Tax-Free California Fund — The Performance Universe for the Fund consisted of the Fund and all retail and institutional California municipal debt funds as selected by Broadridge. The Broadridge report comparison showed that the Fund’s total return for the 1- and 3-year periods was in the second quartile of its Performance Universe. The report further showed that the Fund’s total return for the 5-year period was in the third quartile of its Performance Universe and the Fund’s total return for the 10-year period was in the first quartile of its Performance Universe. The Board was satisfied with performance.
Delaware Tax-Free Colorado Fund — The Performance Universe for the Fund consisted of the Fund and all retail and institutional “other states” municipal debt funds as selected by Broadridge. The Broadridge report comparison showed that the Fund’s total return for the 1-, 3-, 5-, and 10-year periods was in the first quartile of its Performance Universe. The Board was satisfied with performance.
Delaware Tax-Free Idaho Fund — The Performance Universe for the Fund consisted of the Fund and all retail and institutional “other states” municipal debt funds as selected by Broadridge. The Broadridge report comparison showed that the Fund’s total return for the 1- and 3-year periods was in the first quartile of its Performance Universe. The report further showed that the Fund’s total return for the 5- and 10-year periods was in the third quartile of its Performance Universe. The Board was satisfied with performance.
Delaware Tax-Free New York Fund — The Performance Universe for the Fund consisted of the Fund and all retail and institutional New York municipal debt funds as selected by Broadridge. The Broadridge report comparison showed that the Fund’s total return for the 1-, 5-, and 10-year periods was in the first
165
Other Fund information (Unaudited)
Delaware Funds® by Macquarie state tax-free funds
Board consideration of advisory agreements for Delaware Tax-Free Arizona Fund, Delaware Tax-Free California Fund, Delaware Tax-Free Colorado Fund, Delaware Tax-Free Idaho Fund, Delaware Tax-Free New York Fund, and Delaware Tax-Free Pennsylvania Fund (continued)
quartile of its Performance Universe. The report further showed that the Fund’s total return for the 3-year period was in the second quartile of its Performance Universe. The Board was satisfied with performance.
Delaware Tax-Free Pennsylvania Fund — The Performance Universe for the Fund consisted of the Fund and all retail and institutional Pennsylvania municipal debt funds as selected by Broadridge. The Broadridge report comparison showed that the Fund’s total return for the 1- and 3-year periods was in the second quartile of its Performance Universe. The report further showed that the Fund’s total return for the 3- and 10-year periods was in the first quartile of its Performance Universe. The Board was satisfied with performance.
Comparative expenses. The Board considered expense data for the Delaware Funds. Management provided the Board with information on pricing levels and fee structures for each Fund as of its most recently completed fiscal year. The Board also focused on the comparative analysis of effective management fees and total expense ratios of each Fund versus effective management fees and total expense ratios of a group of similar funds as selected by Broadridge (the “Expense Group”). In reviewing comparative costs, each Fund’s contractual management fee and the actual management fee incurred by the Fund were compared with the contractual management fees (assuming all funds in the Expense Group were similar in size to the Fund) and actual management fees (as reported by each fund) within the Expense Group, taking into account any applicable breakpoints and fee waivers. Each Fund’s total expenses were also compared with those of its Expense Group. The Broadridge total expenses, for comparative consistency, were shown by Broadridge for Class A shares and comparative total expenses including 12b-1 and non-12b-1 service fees. The Board’s objective is for each Fund’s total expense ratio to be competitive with those of the peer funds within its Expense Group.
Delaware Tax-Free Arizona Fund — The expense comparisons for the Fund showed that its actual management fee was in the quartile with the second lowest expenses of its Expense Group and its total expenses were in the quartile with the second highest expenses of its Expense Group. The Board gave favorable consideration to the Fund’s management fee, but noted that the Fund’s total expenses were not in line with the Board’s objective. In evaluating the total expenses, the Board considered fee waivers in place through December 2018 and various initiatives implemented by Management, such as the negotiation of lower fees for fund accounting, fund accounting oversight services, and custody, which had created an opportunity for a further reduction in expenses. The Board was satisfied with Management’s efforts to improve the Fund’s total expense ratio and to bring it in line with the Board’s objective.
Delaware Tax-Free California Fund — The expense comparisons for the Fund showed that its actual management fee was in the quartile with the lowest expenses of its Expense Group and its total expenses were in the quartile with the second lowest expenses of its Expense Group. The Board was satisfied with the management fee and total expenses of the Fund in comparison to those of its Expense Group as shown in the Broadridge report.
166
Delaware Tax-Free Colorado Fund — The expense comparisons for the Fund showed that its actual management fee was in the quartile with the second lowest expenses of its Expense Group and its total expenses were in the quartile with the second highest expenses of its Expense Group. The Board gave favorable consideration to the Fund’s management fee, but noted that the Fund’s total expenses were not in line with the Board’s objective. In evaluating the total expenses, the Board considered favorably fee waivers in place through December 2018 and various initiatives implemented by Management, such as a negotiation of lower fees for fund accounting, fund accounting oversight services, and custody, which had created an opportunity for a further reduction in expenses. The Board was satisfied with Management’s efforts to improve the Fund’s total expense ratio and to bring it in line with the Board’s objective.
Delaware Tax-Free Idaho Fund — The expense comparisons for the Fund showed that its actual management fee was in the quartile with the second lowest expenses of its Expense Group and its total expenses were in the quartile with the second highest expenses of its Expense Group. The Board gave favorable consideration to the Fund’s management fee, but noted that the Fund’s total expenses were not in line with the Board’s objective. In evaluating the total expenses, the Board considered waivers in place through December 2018 and various initiatives implemented by Management, such as the negotiation of lower fees for fund accounting, fund accounting oversight services, and custody, which had created an opportunity for a further reduction in expenses. The Board was satisfied with Management’s efforts to improve the Fund’s total expense ratio and to bring it in line with the Board’s objective.
Delaware Tax-Free New York Fund — The expense comparisons for the Fund showed that its actual management fee was in the quartile with the lowest expenses of its Expense Group and its total expenses were in the quartile with the second lowest expenses of its Expense Group. The Board was satisfied with the management fee and total expenses of the Fund in comparison to those of its Expense Group as shown in the Broadridge report.
Delaware Tax-Free Pennsylvania Fund — The expense comparisons for the Fund showed that its actual management fee was in the quartile with the second highest expenses of its Expense Group and its total expenses were in the quartile with the highest expenses of its Expense Group. The Board noted that the Fund’s management fee and total expenses were not in line with the Board’s objective. In evaluating the total expenses, the Board considered fee waivers in place through December 2018 and various initiatives implemented by Management, such as the negotiation of lower fees for fund accounting, fund accounting oversight services, and custody, which had created an opportunity for a further reduction in expenses. The Board was satisfied with Management’s efforts to improve the Fund’s total expense ratio and to bring it in line with the Board’s objective.
Management profitability. The Board considered the level of profits realized by DMC in connection with the operation of the Funds. In this respect, the Board reviewed the Investment Management Profitability Analysis that addressed the overall profitability of DMC’s business in providing management and other services to each of the individual funds and the Delaware Funds as a whole. Specific attention was given to the methodology used by DMC in allocating costs for the purpose of determining profitability. Management stated that the level of profits of DMC, to a certain extent, reflects recent operational cost savings and efficiencies initiated by DMC. The Board considered DMC’s efforts to improve services
167
Other Fund information (Unaudited)
Delaware Funds® by Macquarie state tax-free funds
Board consideration of advisory agreements for Delaware Tax-Free Arizona Fund, Delaware Tax-Free California Fund, Delaware Tax-Free Colorado Fund, Delaware Tax-Free Idaho Fund, Delaware Tax-Free New York Fund, and Delaware Tax-Free Pennsylvania Fund (continued)
provided to Fund shareholders and to meet additional regulatory and compliance requirements resulting from recent industry-wide Securities and Exchange Commission initiatives. The Board also considered the extent to which DMC might derive ancillary benefits from fund operations, including the potential for procuring additional business as a result of the prestige and visibility associated with its role as service provider to the Delaware Funds and the benefits from allocation of fund brokerage to improve trading efficiencies. As part of its work, the Board also reviewed a report prepared by JDL regarding MIMBT profitability as compared to certain peer fund complexes and the Independent Trustees met with JDL personnel to discuss DMC’s profitability in such context. The Board found that the management fees were reasonable in light of the services rendered and the level of profitability of DMC.
Economies of scale. The Trustees considered whether economies of scale are realized by DMC as each Fund’s assets increase and the extent to which any economies of scale are reflected in the level of management fees charged. The Trustees reviewed the Funds’ advisory fee pricing and structure, approved by the Board and shareholders, which includes breakpoints, and which applies to most funds in the Delaware Funds complex. Breakpoints in the advisory fee occur when the advisory fee rate is reduced on assets in excess of specified levels. Breakpoints result in a lower advisory fee than would otherwise be the case in the absence of breakpoints, when the asset levels specified in the breakpoints are exceeded. Although, as of March 31, 2018, the Funds had not reached a size at which they could take advantage of any breakpoints in the applicable fee schedule, the Board recognized that the fee was structured so that if the Funds increase sufficiently in size, then economies of scale may be shared.
168
This page intentionally left blank.
Board of trustees / directors and officers addendum
Delaware Funds® by Macquarie
A mutual fund is governed by a Board of Trustees/Directors (“Trustees”), which has oversight responsibility for the management of a fund’s business affairs. Trustees establish procedures and oversee and review the performance of the investment manager, the distributor, and others who perform services for the fund. The independent fund trustees, in particular, are advocates
| | | | | | |
Name, Address, and Birth Date | | Position(s) Held with Fund(s) | | Length of Time Served | | |
Interested Trustee | | | | |
Shawn K. Lytle1, 2 | | President, | | Trustee since | | |
2005 Market Street | | Chief Executive Officer, | | September 2015 | | |
Philadelphia, PA 19103 | | and Trustee | | | | |
February 1970 | | | | President and | | |
| | | | Chief Executive Officer | | |
| | | | since August 2015 | | |
| | | | | | |
| | | | | | |
Independent Trustees | | | | |
Thomas L. Bennett | | Chair and Trustee | | Trustee since | | |
2005 Market Street | | | | March 2005 | | |
Philadelphia, PA 19103 | | | | | | |
October 1947 | | | | Chair since | | |
| | | | March 2015 | | |
| | | | | | | |
Ann D. Borowiec | | Trustee | | Since March 2015 | | |
2005 Market Street | | | | | | |
Philadelphia, PA 19103 | | | | | | |
November 1958 | | | | | | |
| | | | | | |
| | | | | | |
| | | | | | | |
Joseph W. Chow | | Trustee | | Since January 2013 | | |
2005 Market Street | | | | | | |
Philadelphia, PA 19103 | | | | | | |
January 1953 | | | | | | |
| | | | | | |
| | | | | | | |
| 1 | Shawn K. Lytle is considered to be an “Interested Trustee” because he is an executive officer of the Fund’s(s’) investment advisor. |
| 2 | Shawn K. Lytle, David F. Connor, Daniel V. Geatens, and Richard Salus serve in similar capacities for the six portfolios of the Optimum Fund Trust, which have the same investment advisor, principal underwriter, and transfer agent as the registrant. Mr. Geatens also serves as the Chief Financial Officer and Treasurer for Macquarie Global Infrastructure Total Return Fund Inc., which has an affiliated investment manager. |
170
for shareholder interests. Each trustee has served in that capacity since he or she was elected to or appointed to the Board of Trustees, and will continue to serve until his or her retirement or the election of a new trustee in his or her place. The following is a list of the Trustees and Officers with certain background and related information.
| | | | |
Principal Occupation(s) During the Past Five Years | | Number of Portfolios in Fund Complex Overseen by Trustee or Officer | | Other Directorships Held by Trustee or Officer |
| | | | |
President — Macquarie | | 59 | | Trustee — UBS |
Investment Management3 | | | | Relationship Funds, |
(June 2015–Present) | | | | SMA Relationship |
| | | | Trust, and UBS Funds |
Regional Head of | | | | (May 2010–April 2015) |
Americas — UBS Global | | | | |
Asset Management | | | | |
(April 2010–May 2015) | | | | |
| | | | |
| | | | |
Private Investor | | 59 | | None |
(March 2004–Present) | | | | |
| | | | |
| | | | |
| | | | | |
Chief Executive Officer, | | 59 | | Director — |
Private Wealth Management | | | | Banco Santander International |
(2011–2013) and | | | | (October 2016–Present) |
Market Manager, | | | | |
New Jersey Private | | | | Director — |
Bank (2005–2011) — | | | | Santander Bank, N.A. |
J.P. Morgan Chase & Co. | | | | (December 2016–Present) |
| | | | | |
Private Investor | | 59 | | Director and Audit Committee |
(April 2011–Present) | | | | Member — Hercules |
| | | | Technology Growth |
| | | | Capital, Inc. |
| | | | (July 2004–July 2014) |
| | | | | |
| 3 | Macquarie Investment Management is the marketing name for Macquarie Management Holdings, Inc. and its subsidiaries, including the Fund’s(s’) investment advisor, principal underwriter, and its transfer agent. |
171
Board of trustees / directors and officers addendum
Delaware Funds® by Macquarie
| | | | | | |
Name, Address, and Birth Date | | Position(s) Held with Fund(s) | | Length of Time Served | | |
Independent Trustees (continued) | | | | |
John A. Fry | | Trustee | | Since January 2001 | | |
2005 Market Street | | | | | | |
Philadelphia, PA 19103 | | | | | | |
May 1960 | | | | | | |
| | | | | | |
| | | | | | |
| | | | | | |
| | | | | | |
| | | | | | |
| | | | | | |
| | | | | | |
| | | | | | |
| | | | | | |
| | | | | | |
| | | | | | |
| | | | | | |
| | | | | | |
| | | | | | | |
Lucinda S. Landreth | | Trustee | | Since March 2005 | | |
2005 Market Street | | | | | | |
Philadelphia, PA 19103 | | | | | | |
June 1947 | | | | | | |
Frances A. Sevilla-Sacasa | | Trustee | | Since September 2011 | | |
| 2005 Market Street | | | | | | |
| Philadelphia, PA 19103 | | | | | | |
| January 1956 | | | | | | |
| | | | | | |
| | | | | | |
| | | | | | |
| | | | | | |
| | | | | | |
| | | | | | |
| | | | | | |
| | | | | | |
| | | | | | |
| | | | | | |
| | | | | | |
| | | | | | |
| | | | | | |
| | | | | | | |
172
| | | | |
Principal Occupation(s)
During the Past Five Years | | Number of Portfolios in Fund Complex Overseen by Trustee or Officer | | Other Directorships Held by Trustee or Officer |
| | | | |
President — | | 59 | | Director; Compensation |
Drexel University | | | | Committee and |
(August 2010–Present) | | | | Governance Committee |
| | | | Member — Community |
| | | | Health Systems |
President — | | | | |
Franklin & Marshall College | | | | Director — Drexel |
(July 2002–July 2010) | | | | Morgan & Co. |
| | | | |
| | | | Director; Audit Committee |
| | | | Member — vTv |
| | | | Therapeutics LLC |
| | | | |
| | | | Director; Audit Committee Member — FS Credit Real |
| | | | | Estate Income Trust, Inc. |
| Private Investor | | 59 | | None |
| (2004–Present) | | | | |
| | | | |
| | | | | |
| Private Investor | | 59 | | Trust Manager and |
| (January 2017–Present) | | | | Audit Committee |
| | | | Chair — Camden |
Chief Executive Officer — | | | | Property Trust |
Banco Itaú | | | | (August 2011–Present) |
International | | | | |
(April 2012–December 2016) | | | | |
| | | | |
| | | | Director — |
Executive Advisor to Dean | | | | Carrizo Oil & Gas, Inc. |
(August 2011–March 2012) | | | | (March 2018–Present) |
and Interim Dean | | | | |
(January 2011–July 2011) — | | | | |
University of Miami School of | | | | |
Business Administration | | | | |
| | |
President — U.S. Trust, | | | | |
Bank of America Private | | | | |
Wealth Management | | | | |
(Private Banking) | | | | |
(July 2007–December 2008) | | | | |
173
Board of trustees / directors and officers addendum
Delaware Funds® by Macquarie
| | | | | | |
Name, Address, and Birth Date | | Position(s) Held with Fund(s) | | Length of Time Served | | |
Independent Trustees (continued) | | | | |
Thomas K. Whitford | | Trustee | | Since January 2013 | | |
2005 Market Street | | | | | | |
Philadelphia, PA 19103 | | | | | | |
March 1956 | | | | | | |
| | | |
| | | | | | | |
Janet L. Yeomans | | Trustee | | Since April 1999 | | |
2005 Market Street | | | | | | |
Philadelphia, PA 19103 | | | | | | |
July 1948 | | | | | | |
| | | |
| | | | | | |
Officers | | | | |
| David F. Connor | | Senior Vice President, | | Senior Vice President | | |
| 2005 Market Street | | General Counsel, | | since May 2013; | | |
| Philadelphia, PA 19103 | | and Secretary | | General Counsel | | |
| December 1963 | | | | since May 2015; | | |
| | | | Secretary since | | |
| | | | October 2005 | | |
| | | | | | | |
| Daniel V. Geatens | | Vice President | | Vice President and | | |
| 2005 Market Street | | and Treasurer | | Treasurer since October 2007 | | |
| Philadelphia, PA 19103 | | | | | | |
| October 1972 | | | | | | |
| | | | | | | |
| Richard Salus | | Senior Vice President | | Senior Vice President and | | |
| 2005 Market Street | | and Chief Financial Officer | | Chief Financial Officer | | |
| Philadelphia, PA 19103 | | | | since November 2006 | | |
| October 1963 | | | | | | |
| | | | | | | |
The Statement of Additional Information for the Fund(s) includes additional information about the Trustees and Officers and is available, without charge, upon request by calling 800 523-1918.
174
| | | | | | |
Principal Occupation(s) During the Past Five Years | | Number of Portfolios in Fund Complex Overseen by Trustee or Officer | | Other Directorships Held by Trustee or Officer | | |
| | | | |
Vice Chairman | | 59 | | Director — HSBC Finance | | |
(2010–April 2013) — | | | | Corporation and HSBC | | |
PNC Financial | | | | North America Holdings Inc. | | |
Services Group | | | | (December 2013–Present) | | |
| | | |
| | | | Director — | | |
| | | | HSBC USA Inc. | | |
| | | | (July 2014–March 2017) | | |
| | | | | | | |
Vice President and Treasurer | | 59 | | Director (2009–2017); | | |
(January 2006–July 2012), | | | | Personnel and Compensation | | |
Vice President — | | | | Committee Chair; Member of | | |
Mergers & Acquisitions | | | | Nominating, Investments, and | | |
(January 2003–January 2006), | | | | Audit Committees for various | | |
and Vice President | | | | periods throughout | | |
and Treasurer | | | | directorship — | | |
(July 1995–January 2003) — | | | | Okabena Company | | |
3M Company | | | | | | |
| | | | | | |
| | | | |
David F. Connor has served | | 59 | | None2 | | |
in various capacities at | | | | | | |
different times at | | | | | | |
Macquarie Investment | | | | | | |
Management. | | | | | | |
| | | |
| | | | | | | |
Daniel V. Geatens has served | | 59 | | None2 | | |
in various capacities at | | | | | | |
different times at | | | | | | |
Macquarie Investment | | | | | | |
Management. | | | | | | |
| | | | | | | |
Richard Salus has served | | 59 | | None2 | | |
in various executive capacities | | | | | | |
at different times at | | | | | | |
Macquarie Investment | | | | | | |
Management. | | | | | | |
| | | |
| | | | | | | |
175
About the organization
| | | | | | |
Board of trustees | | | | | | |
Shawn K. Lytle President and Chief Executive Officer Delaware Funds® by Macquarie Philadelphia, PA Thomas L. Bennett Chairman of the Board Delaware Funds by Macquarie Private Investor Rosemont, PA | | Ann D. Borowiec Former Chief Executive Officer Private Wealth Management J.P. Morgan Chase & Co. New York, NY Joseph W. Chow Former Executive Vice President State Street Corporation Boston, MA | | John A. Fry President Drexel University Philadelphia, PA Lucinda S. Landreth Former Chief Investment Officer Assurant, Inc. New York, NY | | Frances A. Sevilla-Sacasa Former Chief Executive Officer Banco Itaú International Miami, FL Thomas K. Whitford Former Vice Chairman PNC Financial Services Group Pittsburgh, PA Janet L. Yeomans Former Vice President and Treasurer 3M Company St. Paul, MN |
| | | |
Affiliated officers | | | | | | |
David F. Connor Senior Vice President, General Counsel, and Secretary Delaware Funds by Macquarie Philadelphia, PA | | Daniel V. Geatens Vice President and Treasurer Delaware Funds by Macquarie Philadelphia, PA | | Richard Salus Senior Vice President and Chief Financial Officer Delaware Funds by Macquarie Philadelphia, PA | | |
This annual report is for the information of Delaware Tax-Free Arizona Fund, Delaware Tax-Free California Fund, Delaware Tax-Free Colorado Fund, Delaware Tax-Free Idaho Fund, Delaware Tax-Free New York Fund, and Delaware Tax-Free Pennsylvania Fund shareholders, but it may be used with prospective investors when preceded or accompanied by the Delaware Fund fact sheet for the most recently completed calendar quarter. These documents are available at delawarefunds.com/literature.
Each Fund files its complete schedule of portfolio holdings with the Securities and Exchange Commission (SEC) for the first and third quarters of each fiscal year on Form N-Q. Each Fund’s Forms N-Q, as well as a description of the policies and procedures that the Funds use to determine how to vote proxies (if any) relating to portfolio securities are available without charge (i) upon request, by calling 800 523-1918; and (ii) on the SEC’s website at sec.gov. In addition, a description of the policies and procedures that the Funds use to determine how to vote proxies (if any) relating to portfolio securities and the Schedules of Investments included in the Funds’ most recent Forms N-Q are available without charge on the Funds’ website at delawarefunds.com/literature. Each Fund’s Forms N-Q may be reviewed and copied at the SEC’s Public Reference Room in Washington, D.C.; information on the operation of the Public Reference Room may be obtained by calling 800 SEC-0330.
Information (if any) regarding how the Funds voted proxies relating to portfolio securities during the most recently disclosed 12-month period ended June 30 is available without charge (i) through the Funds’ website at delawarefunds.com/proxy; and (ii) on the SEC’s website at sec.gov.
176