UNITED STATES SECURITIES AND EXCHANGE COMMISSION
Washington, D.C. 20549
FORM N-CSR
CERTIFIED SHAREHOLDER REPORT OF REGISTERED MANAGEMENT
INVESTMENT COMPANIES
| Investment Company Act file number: | 811-02715 |
| | |
| Exact name of registrant as specified in charter: | Delaware Group® State Tax-Free Income Trust |
| | |
| Address of principal executive offices: | 610 Market Street
Philadelphia, PA 19106 |
| | |
| Name and address of agent for service: | David F. Connor, Esq.
610 Market Street
Philadelphia, PA 19106 |
| | |
| Registrant’s telephone number, including area code: | (800) 523-1918 |
| | |
| Date of fiscal year end: | August 31 |
| | |
| Date of reporting period: | August 31, 2023 |
Table of Contents
Item 1. Reports to Stockholders
Annual report
Fixed income mutual funds
Delaware Tax-Free Arizona Fund
Delaware Tax-Free California Fund
Delaware Tax-Free Colorado Fund
Delaware Tax-Free Idaho Fund
Delaware Tax-Free New York Fund
Delaware Tax-Free Pennsylvania Fund
August 31, 2023
Carefully consider the Funds’ investment objectives, risk factors, charges, and expenses before investing. This and other information can be found in the Funds’ prospectus and their summary prospectuses, which may be obtained by visiting delawarefunds.com/literature or calling 800 523-1918. Investors should read the prospectus and the summary prospectus carefully before investing.
You can obtain shareholder reports and prospectuses online instead of in the mail. Visit delawarefunds.com/edelivery.
Experience Delaware Funds by Macquarie®
Macquarie Asset Management (MAM) is a global asset manager that aims to deliver positive impact for everyone. MAM Public Investments traces its roots to 1929 and partners with institutional and individual clients to deliver specialist active investment capabilities across global equities, fixed income, and multi-asset solutions using a conviction-based, long-term approach to investing. In the US, retail investors recognize our Delaware Funds by Macquarie family of funds as one of the oldest mutual fund families.
If you are interested in learning more about creating an investment plan, contact your financial advisor.
You can learn more about Delaware Funds or obtain a prospectus for Delaware Tax-Free Arizona Fund, Delaware Tax-Free California Fund, Delaware Tax-Free Colorado Fund, Delaware Tax-Free Idaho Fund, Delaware Tax-Free New York Fund, and Delaware Tax-Free Pennsylvania Fund at delawarefunds.com/literature.
Manage your account online
| ● | Check your account balance and transactions |
| ● | View statements and tax forms |
| ● | Make purchases and redemptions |
Visit delawarefunds.com/account-access.
Macquarie Asset Management (MAM) is the asset management division of Macquarie Group. MAM is a full-service asset manager offering a diverse range of products across public and private markets including fixed income, equities, multi-asset solutions, private credit, infrastructure, renewables, natural assets, real estate, and asset finance. The Public Investments business is a part of MAM and includes the following investment advisers: Macquarie Investment Management Business Trust (MIMBT), Macquarie Investment Management Austria Kapitalanlage AG, Macquarie Investment Management Global Limited, Macquarie Investment Management Europe Limited, and Macquarie Investment Management Europe S.A.
The Funds are distributed by Delaware Distributors, L.P. (DDLP), an affiliate of MIMBT and Macquarie Group Limited.
Other than Macquarie Bank Limited ABN 46 008 583 542 (“Macquarie Bank”), any Macquarie Group entity noted in this document is not an authorized deposit-taking institution for the purposes of the Banking Act 1959 (Commonwealth of Australia). The obligations of these other Macquarie Group entities do not represent deposits or other liabilities of Macquarie Bank. Macquarie Bank does not guarantee or otherwise provide assurance in respect of the obligations of these other Macquarie Group entities. In addition, if this document relates to an investment, (a) the investor is subject to investment risk including possible delays in repayment and loss of income and principal invested and (b) none of Macquarie Bank or any other Macquarie Group entity guarantees any particular rate of return on or the performance of the investment, nor do they guarantee repayment of capital in respect of the investment.
The Funds are governed by US laws and regulations.
Table of contents
This annual report is for the information of Delaware Tax-Free Arizona Fund, Delaware Tax-Free California Fund, Delaware Tax-Free Colorado Fund, Delaware Tax-Free Idaho Fund, Delaware Tax-Free New York Fund, and Delaware Tax-Free Pennsylvania Fund shareholders, but it may be used with prospective investors when preceded or accompanied by the Delaware Fund fact sheet for the most recently completed calendar quarter. These documents are available at delawarefunds.com/literature.
Unless otherwise noted, views expressed herein are current as of August 31, 2023, and subject to change for events occurring after such date.
The Funds are not FDIC insured and are not guaranteed. It is possible to lose the principal amount invested.
Advisory services provided by Delaware Management Company, a series of MIMBT, a US registered investment advisor.
All third-party marks cited are the property of their respective owners.
© 2023 Macquarie Management Holdings, Inc.
Portfolio management reviews
| Delaware Funds by Macquarie® state tax-free funds | August 31, 2023 (Unaudited) |
| Performance preview (for the year ended August 31, 2023) | | |
| Delaware Tax-Free Arizona Fund (Institutional Class shares) | 1-year return | -2.60% |
| Delaware Tax-Free Arizona Fund (Class A shares) | 1-year return | -2.84% |
| Bloomberg Municipal Bond Index (benchmark) | 1-year return | +1.70% |
Past performance does not guarantee future results.
For complete, annualized performance for Delaware Tax-Free Arizona Fund, please see the table on page 10.
Institutional Class shares are not subject to a sales charge and are offered for sale exclusively to certain eligible investors. In addition, Institutional Class shares pay no distribution and service fee.
The performance of Class A shares excludes the applicable sales charge. The performance of both Institutional Class shares and Class A shares reflects the reinvestment of all distributions.
Please see page 13 for a description of the index. Index performance returns do not reflect any management fees, transaction costs, or expenses. Indices are unmanaged and one cannot invest directly in an index.
| Delaware Tax-Free California Fund (Institutional Class shares) | 1-year return | +1.22% |
| Delaware Tax-Free California Fund (Class A shares) | 1-year return | +0.87% |
| Bloomberg Municipal Bond Index (benchmark) | 1-year return | +1.70% |
Past performance does not guarantee future results.
For complete, annualized performance for Delaware Tax-Free California Fund, please see the table on page 14.
Institutional Class shares are not subject to a sales charge and are offered for sale exclusively to certain eligible investors. In addition, Institutional Class shares pay no distribution and service fee.
The performance of Class A shares excludes the applicable sales charge. The performance of both Institutional Class shares and Class A shares reflects the reinvestment of all distributions.
Please see page 17 for a description of the index. Index performance returns do not reflect any management fees, transaction costs, or expenses. Indices are unmanaged and one cannot invest directly in an index.
| Delaware Tax-Free Colorado Fund (Institutional Class shares) | 1-year return | -0.14% |
| Delaware Tax-Free Colorado Fund (Class A shares) | 1-year return | -0.39% |
| Bloomberg Municipal Bond Index (benchmark) | 1-year return | +1.70% |
Past performance does not guarantee future results.
For complete, annualized performance for Delaware Tax-Free Colorado Fund, please see the table on page 18.
Institutional Class shares are not subject to a sales charge and are offered for sale exclusively to certain eligible investors. In addition, Institutional Class shares pay no distribution and service fee.
The performance of Class A shares excludes the applicable sales charge. The performance of both Institutional Class shares and Class A shares reflects the reinvestment of all distributions.
Please see page 21 for a description of the index. Index performance returns do not reflect any management fees, transaction costs, or expenses. Indices are unmanaged and one cannot invest directly in an index.
Portfolio management reviews
Delaware Funds by Macquarie® state tax-free funds
| Delaware Tax-Free Idaho Fund (Institutional Class shares) | 1-year return | -0.17% |
| Delaware Tax-Free Idaho Fund (Class A shares) | 1-year return | -0.51% |
| Bloomberg Municipal Bond Index (benchmark) | 1-year return | +1.70% |
Past performance does not guarantee future results.
For complete, annualized performance for Delaware Tax-Free Idaho Fund, please see the table on page 22.
Institutional Class shares are not subject to a sales charge and are offered for sale exclusively to certain eligible investors. In addition, Institutional Class shares pay no distribution and service fee.
The performance of Class A shares excludes the applicable sales charge. The performance of both Institutional Class shares and Class A shares reflects the reinvestment of all distributions.
Please see page 25 for a description of the index. Index performance returns do not reflect any management fees, transaction costs, or expenses. Indices are unmanaged and one cannot invest directly in an index.
| Delaware Tax-Free New York Fund (Institutional Class shares) | 1-year return | +0.54% |
| Delaware Tax-Free New York Fund (Class A shares) | 1-year return | +0.29% |
| Bloomberg Municipal Bond Index (benchmark) | 1-year return | +1.70% |
Past performance does not guarantee future results.
For complete, annualized performance for Delaware Tax-Free New York Fund, please see the table on page 26.
Institutional Class shares are not subject to a sales charge and are offered for sale exclusively to certain eligible investors. In addition, Institutional Class shares pay no distribution and service fee.
The performance of Class A shares excludes the applicable sales charge. The performance of both Institutional Class shares and Class A shares reflects the reinvestment of all distributions.
Please see page 29 for a description of the index. Index performance returns do not reflect any management fees, transaction costs, or expenses. Indices are unmanaged and one cannot invest directly in an index.
| Delaware Tax-Free Pennsylvania Fund (Institutional Class shares) | 1-year return | +0.53% |
| Delaware Tax-Free Pennsylvania Fund (Class A shares) | 1-year return | +0.29% |
| Bloomberg Municipal Bond Index (benchmark) | 1-year return | +1.70% |
Past performance does not guarantee future results.
For complete, annualized performance for Delaware Tax-Free Pennsylvania Fund, please see the table on page 30.
Institutional Class shares are not subject to a sales charge and are offered for sale exclusively to certain eligible investors. In addition, Institutional Class shares pay no distribution and service fee.
The performance of Class A shares excludes the applicable sales charge. The performance of both Institutional Class shares and Class A shares reflects the reinvestment of all distributions.
Please see page 34 for a description of the index. Index performance returns do not reflect any management fees, transaction costs, or expenses. Indices are unmanaged and one cannot invest directly in an index.
Investment objectives
Delaware Tax-Free Arizona Fund seeks as high a level of current income exempt from federal income tax and from the Arizona state personal income tax as is consistent with preservation of capital.
Delaware Tax-Free California Fund seeks as high a level of current income exempt from federal income tax and from the California state personal income tax as is consistent with preservation of capital.
Delaware Tax-Free Colorado Fund seeks as high a level of current income exempt from federal income tax and from the personal income tax in Colorado as is consistent with preservation of capital.
Delaware Tax-Free Idaho Fund seeks as high a level of current income exempt from federal income tax and from Idaho personal income taxes as is consistent with preservation of capital.
Delaware Tax-Free New York Fund seeks as high a level of current income exempt from federal income tax and from New York state personal income taxes as is consistent with preservation of capital.
Delaware Tax-Free Pennsylvania Fund seeks as high a level of current income exempt from federal income tax and from Pennsylvania state personal income tax as is consistent with preservation of capital.
Economic backdrop
During the fiscal year ended August 31, 2023, there was a growing consensus that the US economy could continue to expand and potentially even achieve a “soft landing,” despite various challenges that investors anticipated could lead to a recession. These challenges included the US Federal Reserve’s cycle of rate hikes, a regional banking crisis, and concerns about the impact of China’s slowdown on the global economy.
When the fiscal year began in September 2022, the US inflation rate was down from its peak of several months earlier, but still higher than at any point since the early 1980s. Investors were concerned about the Fed’s plan to battle inflation by continuing to raise its benchmark short-term interest rate.
The Fed, which had begun sharply raising rates earlier in 2022, announced four consecutive 75-basis-point (or 0.75-percentage-point) rate increases between June and November, and signaled in November that it would start to slow the pace of rate hikes to avoid undue pressure on the US economy.
Although the central bank reiterated that more rate increases would be needed amid continued strong employment and higher-than-desired inflation, its efforts to battle inflation appeared to take root, as the pace of rising prices continued to decline throughout the rest of the fiscal period.
The Fed downshifted to a rate increase of 50 basis points in December 2022, followed by increases of 25 basis points in February, March, May, and – after pausing in June – July 2023. The central bank cited progress in slowing down inflation, which stood at an annual rate of 3.2% for the 12 months ended July 31, 2023, down from 8.3% in August 2022, as measured by the US Consumer Price Index (CPI). However, the Fed reiterated its readiness to continue raising rates, if necessary, to further slow inflation. At fiscal year end, the federal funds rate stood within a range of 5.25% to 5.50%, more than double the rate of a year earlier.
Portfolio management reviews
Delaware Funds by Macquarie® state tax-free funds
Municipal bond market conditions
Overall, the municipal bond market, as measured by the Bloomberg Municipal Bond Index, returned 1.70% for the fiscal year ended August 31, 2023.
The municipal bond market experienced up-and-down performance during the fiscal year and finished in modestly positive territory.
At the start of the 12-month period, yields on municipal bonds were rising, and bond prices correspondingly falling, amid steady outflows from municipal bond mutual funds. Late in 2022 and into early 2023, however, the backdrop for municipal bonds improved. Inflation eased, and expectations grew that the Fed would begin to slow the pace of interest rate hikes. This led to an improvement in the technical backdrop and a better balance between demand and supply for municipal securities.
In the final few months of the Funds’ fiscal year, as economic growth exceeded expectations and investors saw hope for a soft landing, the market’s expectations for a rate cut diminished. This led to a somewhat less favorable environment for investors.
Against this backdrop, bonds with longer and intermediate maturities, especially those with maturities ranging from 10 to 20 years, generally performed the best, outpacing their shorter- and longer-term counterparts. Meanwhile, bonds with lower-investment-grade credit ratings generally outperformed higher-quality issues. High-yield municipal debt (bonds with credit ratings below BBB-) lagged overall, partly from the negative impact of two underperforming categories during the fiscal year: Puerto Rico and hospital debt.
The following tables show municipal bond returns by maturity length and by credit quality for the fiscal year ended August 31, 2023.
| Returns by maturity | |
| 1 year | 1.83% |
| 3 years | 1.12% |
| 5 years | 0.98% |
| 10 years | 2.01% |
| 22+ years | 1.45% |
| | |
| Returns by credit rating | |
| AAA | 1.21% |
| AA | 1.62% |
| A | 2.19% |
| BBB | 2.29% |
Source: Bloomberg.
Economic backdrop in the states
In the 2023 fiscal year, Arizona saw its non-farm employment increase to 3.2 million, up 2.1% from the prior fiscal year. The state reported a preliminary July 2023 unemployment rate of 3.6%, a 0.3% improvement from a year earlier but slightly above the national average of 3.5%. The state’s general fund revenues totaled $13.5 billion for fiscal 2023, 0.6% above forecast but 19.2% below the level attained in the prior fiscal year. Meanwhile, Arizona’s sales and use tax collections for fiscal 2023 were $7.7 billion, 0.8% below forecast yet 6.5% above the state’s fiscal 2022 collections. Individual income-tax collections were $5.2 billion for fiscal 2023, 4.3% below forecast and 30.4% below collections for fiscal 2022. The decline in individual income-tax collection was due to phased-in tax reductions and higher refunds. Of final note, corporate income-tax collections for fiscal 2023 totaled $1.8 billion, 6.0% above forecast and 55.3% above the prior fiscal year’s collections. Arizona’s budget for the 2024 fiscal year totals
$64.8 billion, with $17.8 billion of that composed of general fund spending.
California saw its non-farm employment increase by 2.2% to 18.1 million during this fiscal year. The state’s preliminary unemployment rate of 4.6% in July 2023 was 0.8% percentage points higher than a year earlier and worse than the national average of 3.5%. California’s general fund revenues totaled $168.6 billion, above forecast by 0.6%. Meanwhile, the state’s personal income-tax collections for fiscal 2023 were $95.0 billion, 0.8% below forecast, while California’s corporate income-tax collections were 3.4% above forecast, totaling $30.0 billion. Of final note, the state’s sales and use tax collections totaled $34.7 billion in fiscal 2023, 0.2% above forecast. The budget California enacted for fiscal 2024 calls for $225.9 billion in general fund spending, representing a 3.7% fiscal-year-over-year decline.
For the 2023 fiscal year, non-farm employment in Colorado increased 1.4% to 2.90 million. For July 2023, the state reported a preliminary unemployment rate of 2.9%, above the 2.7% rate of a year earlier but better than the national average of 3.5%. Colorado’s general fund revenues for fiscal 2023 were $17.4 billion, 2.5% below revenue collections for the prior fiscal year. Meanwhile, net individual income-tax collections for fiscal 2023 totaled $10.3 billion, 13.4% below fiscal 2022 collections. Net sales, use, and excise tax collections for the 2023 fiscal year totaled $4.6 billion, a 7.3% increase over fiscal 2022 collections, while net corporate income-tax collections for fiscal 2023 totaled $2.4 billion, 57.0% above the level seen in fiscal 2022. The state’s fiscal 2024 operating budget totals $40.5 billion.
In Idaho, non-farm employment grew by 3.4% to 851,000 in the 2023 fiscal year. In July 2023, the state reported a preliminary unemployment rate of 2.8%, a 0.1 percentage point increase from a year earlier but significantly better than the 3.5% national average. For fiscal 2023, the state’s general fund revenues were $5.9 billion, 1.4% higher than forecast but 4.0% below the prior fiscal year’s revenue collections. Meanwhile, individual income-tax collections totaled $2.4 billion for fiscal 2023, 0.1% lower than forecast and 17.4% lower than in fiscal 2022. Sales tax collections in Idaho for the 2023 fiscal year totaled $2.3 billion, 0.9% lower than forecast but 4.7% above fiscal 2022 collections. Of final note, the state’s corporate income-tax collections for fiscal 2023 totaled $1.0 billion, 7.5% above forecast but 0.7% lower than collections in the prior fiscal year. For fiscal 2024, Idaho’s budget calls for $5.18 billion in general fund appropriations, a 12.0% increase.
For fiscal 2023, New York’s labor market saw a 2.0% increase in non-farm employment, which stood at 9.7 million. According to preliminary figures, the state’s jobless rate for July 2023 was 3.9%, an incremental improvement from a year earlier but still above the national average of 3.5%. New York’s general fund receipts for fiscal 2023 were $60.9 billion, a decline of 3.7% relative to the prior fiscal year’s receipts. Meanwhile, the state’s personal income-tax collections for fiscal 2023 totaled $27.6 billion, a 17.5% reduction from the prior year. Business-tax receipts for fiscal 2023 totaled $16.7 billion, a 6.9% year-over-year increase, while consumption and use tax receipts for fiscal 2023 totaled $7.2 billion, a 53.4% increase. New York’s fiscal 2024 budget, enacted in May, totals $229.0 billion, an increase of 4.1%.
Pennsylvania’s labor market saw a 2.6% increase in non-farm employment, reaching 6.13 million in the 2023 fiscal year. The state
Portfolio management reviews
Delaware Funds by Macquarie® state tax-free funds
finished July 2023 with an unemployment rate of 3.5%, well ahead of the 4.3% rate it reported a year earlier and matching the national average. Pennsylvania closed fiscal 2023 with $44.9 billion in general fund collections, 3.1% above estimates but 6.7% below collections for the prior fiscal year. The state’s sales-tax receipts for fiscal 2023 totaled $14.0 billion, 1.5% above estimates and 0.8% higher than collections in fiscal 2022. Meanwhile, personal income tax revenue totaled $17.6 billion, 2.9% below estimates and 2.7% below collections in the prior fiscal year, while corporate tax revenues were $8.3 billion, 19.8% above estimates and 12.8% higher than collections in fiscal year 2022. As of period end, the state’s “rainy day” fund balance held $5.0 billion. Pennsylvania’s budget for fiscal 2024 totaled $45.0 billion in general fund spending.
Maintaining our management approach
Regardless of the underlying market environment, our investment approach remains consistent across all six Funds profiled in this report. We follow a bottom-up investment approach, meaning we rely on our team’s in-depth credit research to select securities on an issuer-by-issuer basis. In choosing tax-exempt bonds for the Funds, we prioritize securities we believe may provide the Funds’ shareholders with favorable trade-offs between their risk and upside opportunity.
In pursuing our strategy, we typically maintain relatively less exposure to highly rated, lower yielding bonds, as we believe these types of securities provide less value for shareholders. Instead, we generally see better opportunity from lower-rated, higher yielding bonds of issuers with what we believe is solid underlying credit quality.
For some of these Funds, particularly in states that have large municipal bond marketplaces, it can be relatively straightforward to find the lower-rated, credit-oriented securities we regularly favor for investment. In other state marketplaces, however, the supply of municipal debt, especially lower-rated municipal debt, can be more limited. When investing in these marketplaces, our approach typically involves buying the bonds that we see as the most attractive opportunities at any given time, while we monitor supply in the new-issue and secondary municipal bond markets as we seek to find suitable lower-rated bonds to satisfy our management objectives. Following this approach, as of the end of the fiscal year on August 31, 2023, roughly 37% of the net assets of Delaware Tax-Free Arizona Fund were invested in bonds with lower-investment-grade credit ratings (A and BBB), while about 41% of the net assets of Delaware Tax-Free California Fund were invested in these same credit tiers. Roughly 35% of Delaware Tax-Free Colorado Fund were invested in bonds rated lower investment grade, compared with about 37% of Delaware Tax-Free Idaho Fund, 42% of Delaware Tax-Free New York Fund, and 55% of Delaware Tax-Free Pennsylvania Fund.
All these Funds also maintained allocations to high yield municipal debt (bonds with credit ratings below BBB-). By prospectus, each Fund may hold up to 20% of its net assets in high yield debt.
Responding to market conditions
Amid volatile conditions in the municipal bond market for much of this 12-month reporting period, we held a bit more cash in the Funds’ portfolios than we normally do. Our rationale was to maintain sufficient liquidity both to satisfy potential shareholder redemptions if market conditions weakened further and to have proceeds available to take advantage
of opportunities to buy bonds we found attractive at prices we believed were temporarily depressed.
At the start of the fiscal year in September 2022, the municipal bond market was close to its bottom. Bond prices had significantly fallen, while their yields were relatively high. Over the next few months, we acquired certain lower-rated, longer-duration bonds that had underperformed and, in our opinion, offered particularly attractive yields relative to their underlying credit quality.
As we entered calendar year 2023, finding these types of compelling value opportunities became more challenging as inflation slowed and economic growth eased. We gradually began to see more opportunities in April and May, as the US regional bank crisis led the market to anticipate a rise in municipal bond supply. Although these market dynamics were short-lived, they did create opportunities for us to invest in bonds trading at valuations we considered attractive.
When purchasing new bonds for the Funds, we uncovered opportunities across various sectors. Two particularly fruitful areas of opportunity, especially in some of the larger state municipal bond markets, included high yield charter school and healthcare bonds. When possible, we also focused on lower-coupon bonds trading at discounts, which we believed offered similar downside to higher-coupon issues but better upside opportunity.
Proceeds for these opportunistic bond purchases came from bond calls and maturities, as well as from the cash balances we maintained in the Funds. Likewise, when appropriate, we engaged in relative-value trades, selling certain lower yielding bonds and using the proceeds to buy other bonds we thought provided better long-term opportunities for shareholders.
Engaging in tax-loss swaps was another strategy we employed at times throughout the reporting period. This entailed exchanging lower yielding bonds for similar issues offering higher prevailing yields. With these swaps, we secured higher income for the Funds at a comparable level of risk while generating tax losses we could apply against future capital gains.
Individual performance effects
During the reporting period, longer-intermediate bonds were among the strongest performers in the municipal bond marketplace, while bonds with lower-investment-grade credit ratings tended to outperform their more highly rated counterparts. Accordingly, many of the strongest and weakest performers in the Funds reflected these trends.
In Delaware Tax-Free Arizona Fund, Phoenix Civic Improvement Corporation airport bonds led performance. These holdings, which gained more than 6% for the 12-month period, benefited from their favorable positioning on the yield curve. Another holding that also outperformed was in zero-coupon Puerto Rico dedicated-tax bonds, whose favorable duration characteristics and relatively low valuation coming into the fiscal year allowed the securities to gain about 6%. Further boosting the Fund’s return were Arizona Game and Fish Department state appropriations bonds, which gained about 5%, as a result of their favorable structures.
On the negative side, this Fund – and the other five Funds profiled in this report – saw a significantly negative performance impact from tax-exempt bonds issued by the Puerto Rico Electric Power Authority, often referred to as PREPA. These bonds, which declined more
Portfolio management reviews
Delaware Funds by Macquarie® state tax-free funds
than 65% for the 12-month period, lost significant value when PREPA, which is going through a restructuring, received an unfavorable ruling in bankruptcy court over the summer, which dragged down the securities’ prices. Bonds of Mirabella at ASU, a retirement community on the campus of Arizona State University in Tempe, also detracted from performance. This relatively new senior-housing facility has seen its occupancy rate fall short of investors’ expectations. This led the securities to significantly underperform. The bonds declined nearly 30% for the 12-month time frame.
In Delaware Tax-Free California Fund, holdings in Inland Empire tobacco securitization bonds were the strongest performers during this fiscal year. These California zero-coupon bonds gained more than 15%. Student-housing bonds for Napa Valley College, which benefited from their relatively high yield and longer duration, as well as investors’ apparently increased comfort with the issuer’s underlying creditworthiness also contributed to performance. On the negative side, besides the PREPA bonds mentioned earlier, the Fund saw a negative effect from bonds for San Antonio Gardens senior apartments, a continuing care retirement community in California whose debt declined close to 10% for the fiscal year.
In Delaware Tax-Free Colorado Fund, the strongest performing holding was a bond investment in the Eagle P3 commuter rail-line project. These bonds benefited from their lower-investment-grade credit rating and desirable structure, returning more than 6% for the Fund’s fiscal year. Additional performance contributors included the Fund’s holding in the same Puerto Rico dedicated-tax bonds mentioned earlier for Delaware Tax-Free Arizona Fund, as well as Valley View Hospital Association bonds, which gained more than 5% for the fiscal year. In contrast, the Fund’s largest individual detractor, after the PREPA bonds previously discussed, was a holding in Verve Metropolitan District No. 1 bonds. The issuer’s underlying credit quality appeared to lag investors’ expectations, causing the bonds to decline more than 13% for the fiscal year. A weak-performing continuing care retirement community bond issue for Aberdeen Ridge in Colorado Springs, which declined more than 9% for the period, was another notable detractor.
In Delaware Tax-Free Idaho Fund, Idaho Housing and Finance Association recovery zone revenue bonds gained approximately 7% for the Fund, while solid waste disposal bonds issued on behalf of FMC Corporation also outperformed, returning more than 6%. Both issues benefited from their relatively high coupon and currently callable status. On the negative side, in addition to the PREPA bonds previously cited, bonds for the North Star Charter School in Eagle, Idaho, fell more than 8%, as the school’s lagging enrollment weighed on the debt. Another detractor included IDAWY solid waste district bonds, which declined roughly 6%.
The strongest performing holding for Delaware Tax-Free New York Fund was an issue of non-rated zero-coupon tobacco-securitization bonds. These New York County securities, which benefited from their high coupon and low dollar price, gained more than 15% for the Fund over the 12-month period. Triborough Bridge and Tunnel Authority sales-tax revenue bonds, whose attractive structures benefited these holdings, also added to Fund performance, gaining more than 6% for the fiscal year. In contrast, besides the PREPA bonds discussed earlier, bonds for Metropolitan College of New York meaningfully struggled, declining more than 20% for the fiscal year on investors’ concerns about
enrollment. Bonds for the Catholic Health System in the Buffalo area, which declined roughly 10% on concerns about the issuer’s credit quality, also detracted from performance.
Delaware Tax-Free Pennsylvania Fund saw favorable results from Pennsylvania Economic Development Financing Authority parking system revenue bonds. Besides benefiting from their relatively long duration, these bonds gained off a relatively low valuation in October 2022, when we purchased the securities. The timing of our purchase was favorable since we acquired the securities at a relative low point in the market. The bonds gained about 11% during the fiscal year. The Fund’s holding in The Highlands at Wyomissing senior housing community bonds also contributed to performance. These bonds benefited from being pre-refunded this period and gained more than 8%. The Puerto Rico zero-coupon dedicated-tax bonds discussed earlier also added value, returning about 6% for the Fund.
On the negative side, the formerly mentioned PREPA bonds similarly weighed on performance. Two weak-performing continuing care retirement community bonds also detracted from results. These underperformers included bonds of Moon Industrial Development Authority for the Baptist Homes Society, which has struggled with occupancies, and those of Montgomery County for The Hill at Whitemarsh, which announced its need for additional funds for upgrades and refurbishing of its facility. These bonds declined roughly 16% and 11%, respectively, for the fiscal year.
| Performance summaries | |
| Delaware Tax-Free Arizona Fund | August 31, 2023 (Unaudited) |
The performance quoted represents past performance and does not guarantee future results. Investment return and principal value of an investment will fluctuate so that shares, when redeemed, may be worth more or less than their original cost. Current performance may be lower or higher than the performance quoted. Performance data current to the most recent month end may be obtained by calling 800 523-1918 or visiting delawarefunds.com/performance.
| Fund and benchmark performance1,2 | Average annual total returns through August 31, 2023 |
| | 1 year | 5 year | 10 year | Lifetime |
| Class A (Est. April 1, 1991) | | | | |
| Excluding sales charge | -2.84% | +0.33% | +2.40% | — |
| Including sales charge | -7.22% | -0.59% | +1.93% | — |
| Class C (Est. May 25, 1994) | | | | |
| Excluding sales charge | -3.65% | -0.43% | +1.62% | — |
| Including sales charge | -4.59% | -0.43% | +1.62% | — |
| Institutional Class (Est. December 31, 2013) | | | | |
| Excluding sales charge | -2.60% | +0.58% | — | +2.51% |
| Including sales charge | -2.60% | +0.58% | — | +2.51% |
| Bloomberg Municipal Bond Index | +1.70% | +1.52% | +2.81% | — |
1Returns reflect the reinvestment of all distributions and are presented both with and without the applicable sales charges described below. Returns do not reflect the deduction of taxes the shareholder would pay on Fund distributions or redemptions of Fund shares.
Expense limitations were in effect for certain classes during some or all of the periods shown in the “Fund and benchmark performance” table. Expenses for each class are listed in the “Fund expense ratios” table on page 11. Performance would have been lower had expense limitations not been in effect.
Class A shares are sold with a maximum front-end sales charge of 4.50%, and have an annual distribution and service (12b-1) fee of 0.25% of average daily net assets. Performance for Class A shares, excluding sales charges, assumes that no front-end sales charge applied.
Class C shares are sold with a contingent deferred sales charge (CDSC) of 1.00% if redeemed within one year of purchase. They are also subject to an annual 12b-1 fee of 1.00% of average daily net assets. Performance for Class C shares, excluding sales charges, assumes either that CDSCs did not apply or that the investment was not redeemed.
Institutional Class shares are not subject to a sales charge and are offered for sale exclusively to certain eligible investors. In addition, Institutional Class shares pay no 12b-1 fee.
Fixed income securities and bond funds can lose value, and investors can lose principal, as interest rates rise. They also may be affected by economic conditions that hinder an issuer’s ability to make interest and principal payments on its debt. This includes prepayment risk, the risk that the principal of a bond that is held by a portfolio will be prepaid prior to maturity, at
the time when interest rates are lower than what the bond was paying. A portfolio may then have to reinvest that money at a lower interest rate.
Funds that invest primarily in one state may be more susceptible to the economic, regulatory, regional, and other factors of that state than geographically diversified funds.
Substantially all dividend income derived from tax-free funds is exempt from federal income tax. Some income may be subject to state or local and/or the federal alternative minimum tax (AMT) that applies to certain investors. Capital gains, if any, are taxable.
Duration number will change as market conditions change. Therefore, duration should not be solely relied upon to indicate a municipal bond fund’s potential volatility.
The disruptions caused by natural disasters, pandemics, or similar events could prevent the Fund from executing advantageous investment decisions in a timely manner and could negatively impact the Fund’s ability to achieve its investment objective and the value of the Fund’s investments.
This document may mention bond ratings published by nationally recognized statistical rating organizations (NRSROs) Standard & Poor’s, Moody’s Investors Service, and Fitch, Inc. For securities rated by an NRSRO other than S&P, the rating is converted to the equivalent S&P credit rating. Bonds rated AAA are rated as having the highest quality and are generally considered to have the lowest degree of investment risk. Bonds rated AA are considered to be of high quality, but with a slightly higher degree of risk than bonds rated AAA. Bonds rated A are considered to have many favorable investment qualities, though they are somewhat more susceptible to adverse economic conditions. Bonds rated BBB are believed to be of medium-grade quality and generally riskier over the long term. Bonds rated BB, B, and CCC are regarded as having significant speculative characteristics, with BB indicating the least degree of speculation of the three.
2The Fund’s expense ratios, as described in the most recent prospectus, are disclosed in the following “Fund expense ratios” table. The expense ratios below may differ from the expense ratios in the “Financial highlights” since they are based on different time periods and the expense ratios in the prospectus include acquired fund fees and expenses, if any. See Note 2 in “Notes to financial statements” for additional details. Please see the “Financial highlights” section in this report for the most recent expense ratios.
| Fund expense ratios | Class A | Class C | Institutional Class |
| Total annual operating expenses (without fee waivers) | 1.01% | 1.76% | 0.76% |
| Net expenses (including fee waivers, if any) | 0.84% | 1.59% | 0.59% |
| | | | |
| Type of waiver | Contractual | Contractual | Contractual |
Performance summaries
Delaware Tax-Free Arizona Fund
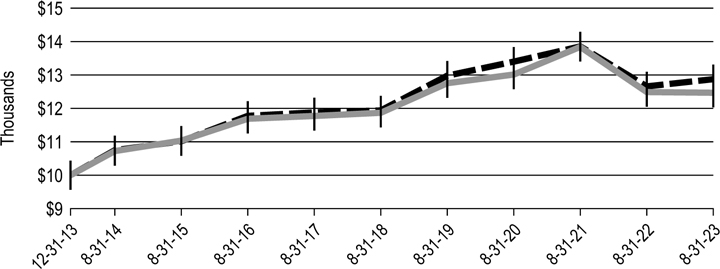
Performance of a $10,000 investment1
Class A shares
For the period August 31, 2013 through August 31, 2023
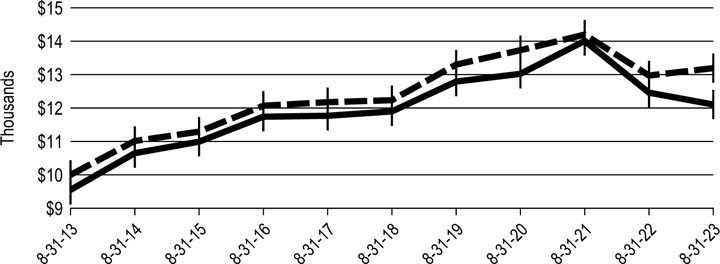
| | | | Starting value | | Ending value |
 | Bloomberg Municipal Bond Index | | $ | 10,000 | | | $ | 13,194 | |
 | Delaware Tax-Free Arizona Fund - Class A shares | | $ | 9,550 | | | $ | 12,106 | |
Institutional Class shares
For the period December 31, 2013 (inception date) through August 31, 2023
| | | | Starting value | | Ending value |
| Bloomberg Municipal Bond Index | | $ | 10,000 | | | $ | 12,874 | |
 | Delaware Tax-Free Arizona Fund - Institutional Class shares | | $ | 10,000 | | | $ | 12,707 | |
1The “Performance of a $10,000 investment” graph for Class A shares assumes $10,000 invested in Class A shares of the Fund on August 31, 2013, and includes the effect of a 4.50% front-end sales charge and the reinvestment of all distributions. The graph also assumes $10,000 invested in the Bloomberg Municipal Bond Index as of August 31, 2013.
The “Performance of a $10,000 investment” graph for Institutional Class shares assumes $10,000 invested in Institutional Class shares of the Fund on December 31, 2013, and includes the reinvestment of all distributions. The graph also assumes $10,000 invested in the Bloomberg Municipal Bond Index as of December 31, 2013.
The graphs do not reflect the deduction of taxes the shareholders would pay on Fund distributions or redemptions of Fund shares. Expense limitations were in effect for some or all of the periods shown. Performance would have been lower had expense limitations not been in effect. Expenses are listed in the “Fund expense ratios” table on page 11. Please note additional details on pages 10 through 13.
The Bloomberg Municipal Bond Index measures the total return performance of the long-term, investment grade tax-exempt bond market.
The US Consumer Price Index (CPI), mentioned on page 3, is a measure of inflation that is calculated by the US Department of Labor, representing changes in prices of all goods and services purchased for consumption by urban households.
Index performance returns do not reflect any management fees, transaction costs, or expenses. Indices are unmanaged and one cannot invest directly in an index. Past performance does not guarantee future results.
Performance of other Fund classes will vary due to different charges and expenses.
| | Nasdaq symbols | CUSIPs |
| Class A | VAZIX | 928916204 |
| Class C | DVACX | 928916501 |
| Institutional Class | DAZIX | 928916873 |
| Performance summaries | |
| Delaware Tax-Free California Fund | August 31, 2023 (Unaudited) |
The performance quoted represents past performance and does not guarantee future results. Investment return and principal value of an investment will fluctuate so that shares, when redeemed, may be worth more or less than their original cost. Current performance may be lower or higher than the performance quoted. Performance data current to the most recent month end may be obtained by calling 800 523-1918 or visiting delawarefunds.com/performance.
| Fund and benchmark performance1,2 | Average annual total returns through August 31, 2023 |
| | 1 year | 5 year | 10 year | Lifetime |
| Class A (Est. March 2, 1995) | | | | |
| Excluding sales charge | +0.87% | +1.15% | +3.09% | — |
| Including sales charge | -3.70% | +0.23% | +2.62% | — |
| Class C (Est. April 9, 1996) | | | | |
| Excluding sales charge | +0.12% | +0.79% | +2.11% | — |
| Including sales charge | -0.85% | +0.79% | +2.11% | — |
| Institutional Class (Est. December 31, 2013) | | | | |
| Excluding sales charge | +1.22% | +1.42% | — | +3.19% |
| Including sales charge | +1.22% | +1.42% | — | +3.19% |
| Bloomberg Municipal Bond Index | +1.70% | -1.32% | +2.81% | — |
1Returns reflect the reinvestment of all distributions and are presented both with and without the applicable sales charges described below. Returns do not reflect the deduction of taxes the shareholder would pay on Fund distributions or redemptions of Fund shares.
Expense limitations were in effect for certain classes during some or all of the periods shown in the “Fund and benchmark performance” table. Expenses for each class are listed in the “Fund expense ratios” table on page 15. Performance would have been lower had expense limitations not been in effect.
Class A shares are sold with a maximum front-end sales charge of 4.50%, and have an annual distribution and service (12b-1) fee of 0.25% of average daily net assets. Performance for Class A shares, excluding sales charges, assumes that no front-end sales charge applied.
Class C shares are sold with a contingent deferred sales charge (CDSC) of 1.00% if redeemed within one year of purchase. They are also subject to an annual 12b-1 fee of 1.00% of average daily net assets. Performance for Class C shares, excluding sales charges, assumes either that CDSCs did not apply or that the investment was not redeemed.
Institutional Class shares are not subject to a sales charge and are offered for sale exclusively to certain eligible investors. In addition, Institutional Class shares pay no 12b-1 fee.
Fixed income securities and bond funds can lose value, and investors can lose principal, as interest rates rise. They also may be affected by economic conditions that hinder an issuer’s ability to make interest and principal payments on its debt. This includes prepayment risk, the risk that the principal of a bond that is held by a portfolio will be prepaid prior to maturity, at
the time when interest rates are lower than what the bond was paying. A portfolio may then have to reinvest that money at a lower interest rate.
Funds that invest primarily in one state may be more susceptible to the economic, regulatory, regional, and other factors of that state than geographically diversified funds.
Substantially all dividend income derived from tax-free funds is exempt from federal income tax. Some income may be subject to state or local and/or the federal alternative minimum tax (AMT) that applies to certain investors. Capital gains, if any, are taxable.
Duration number will change as market conditions change. Therefore, duration should not be solely relied upon to indicate a municipal bond fund’s potential volatility.
The disruptions caused by natural disasters, pandemics, or similar events could prevent the Fund from executing advantageous investment decisions in a timely manner and could negatively impact the Fund’s ability to achieve its investment objective and the value of the Fund’s investments.
This document may mention bond ratings published by nationally recognized statistical rating organizations (NRSROs) Standard & Poor’s, Moody’s Investors Service, and Fitch, Inc. For securities rated by an NRSRO other than S&P, the rating is converted to the equivalent S&P credit rating. Bonds rated AAA are rated as having the highest quality and are generally considered to have the lowest degree of investment risk. Bonds rated AA are considered to be of high quality, but with a slightly higher degree of risk than bonds rated AAA. Bonds rated A are considered to have many favorable investment qualities, though they are somewhat more susceptible to adverse economic conditions. Bonds rated BBB are believed to be of medium-grade quality and generally riskier over the long term. Bonds rated BB, B, and CCC are regarded as having significant speculative characteristics, with BB indicating the least degree of speculation of the three.
2The Fund’s expense ratios, as described in the most recent prospectus, are disclosed in the following “Fund expense ratios” table. The expense ratios below may differ from the expense ratios in the “Financial highlights” since they are based on different time periods and the expense ratios in the prospectus include acquired fund fees and expenses, if any. See Note 2 in “Notes to financial statements” for additional details. Please see the “Financial highlights” section in this report for the most recent expense ratios.
| Fund expense ratios | Class A | Class C | Institutional Class |
| Total annual operating expenses (without fee waivers) | 0.99% | 1.74% | 0.74% |
| Net expenses (including fee waivers, if any) | 0.80% | 1.55% | 0.55% |
| | | | |
| Type of waiver | Contractual | Contractual | Contractual |
Performance summaries
Delaware Tax-Free California Fund
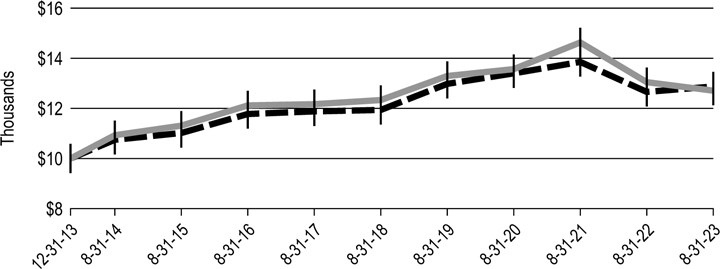
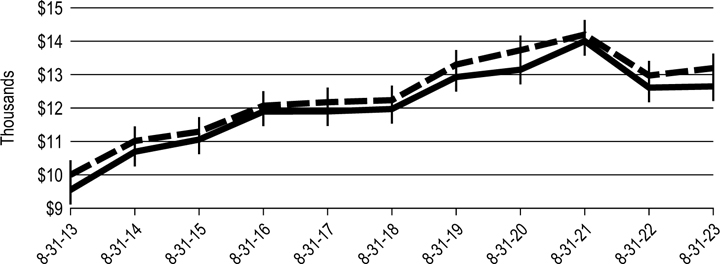
Performance of a $10,000 investment1
Class A shares
For the period August 31, 2013 through August 31, 2023

| | | | Starting value | | Ending value |
| Bloomberg Municipal Bond Index | | $ | 10,000 | | | $ | 13,194 | |
| Delaware Tax-Free California Fund - Class A shares | | $ | 9,550 | | | $ | 12,949 | |
Institutional Class shares
For the period December 31, 2013 (inception date) through August 31, 2023
| | | | Starting value | | Ending value |
| Delaware Tax-Free California Fund - Institutional Class shares | | $ | 10,000 | | | $ | 13,544 | |
| Bloomberg Municipal Bond Index | | $ | 10,000 | | | $ | 12,874 | |
1The “Performance of a $10,000 investment” graph for Class A shares assumes $10,000 invested in Class A shares of the Fund on August 31, 2013, and includes the effect of a 4.50% front-end sales charge and the reinvestment of all distributions. The graph also assumes $10,000 invested in the Bloomberg Municipal Bond Index as of August 31, 2013.
The “Performance of a $10,000 investment” graph for Institutional Class shares assumes $10,000 invested in Institutional Class shares of the Fund on December 31, 2013, and includes the reinvestment of all distributions. The graph also assumes $10,000 invested in the Bloomberg Municipal Bond Index as of December 31, 2013.
The graphs do not reflect the deduction of taxes the shareholders would pay on Fund distributions or redemptions of Fund shares. Expense limitations were in effect for some or all of the periods shown. Performance would have been lower had expense limitations not been in effect. Expenses are listed in the “Fund expense ratios” table on page 15. Please note additional details on pages 14 through 17.
The Bloomberg Municipal Bond Index measures the total return performance of the long-term, investment grade tax-exempt bond market.
The US Consumer Price Index (CPI), mentioned on page 3, is a measure of inflation that is calculated by the US Department of Labor, representing changes in prices of all goods and services purchased for consumption by urban households.
Index performance returns do not reflect any management fees, transaction costs, or expenses. Indices are unmanaged and one cannot invest directly in an index. Past performance does not guarantee future results.
Performance of other Fund classes will vary due to different charges and expenses.
| | Nasdaq symbols | CUSIPs |
| Class A | DVTAX | 928928829 |
| Class C | DVFTX | 928928795 |
| Institutional Class | DCTIX | 928928167 |
| Performance summaries | |
| Delaware Tax-Free Colorado Fund | August 31, 2023 (Unaudited) |
The performance quoted represents past performance and does not guarantee future results. Investment return and principal value of an investment will fluctuate so that shares, when redeemed, may be worth more or less than their original cost. Current performance may be lower or higher than the performance quoted. Performance data current to the most recent month end may be obtained by calling 800 523-1918 or visiting delawarefunds.com/performance.
| Fund and benchmark performance1,2 | Average annual total returns through August 31, 2023 |
| | 1 year | 5 year | 10 year | Lifetime |
| Class A (Est. April 23, 1987) | | | | |
| Excluding sales charge | -0.39% | +0.85% | +2.72% | — |
| Including sales charge | -4.92% | -0.08% | +2.25% | — |
| Class C (Est. May 5, 1994) | | | | |
| Excluding sales charge | -1.14% | +0.08% | +1.95% | — |
| Including sales charge | -2.10% | +0.08% | +1.95% | — |
| Institutional Class (Est. December 31, 2013) | | | | |
| Excluding sales charge | -0.14% | +1.10% | — | +2.86% |
| Including sales charge | -0.14% | +1.10% | — | +2.86% |
| Bloomberg Municipal Bond Index | +1.70% | +1.52% | +2.81% | — |
1Returns reflect the reinvestment of all distributions and are presented both with and without the applicable sales charges described below. Returns do not reflect the deduction of taxes the shareholder would pay on Fund distributions or redemptions of Fund shares.
Expense limitations were in effect for certain classes during some or all of the periods shown in the “Fund and benchmark performance” table. Expenses for each class are listed in the “Fund expense ratios” table on page 19. Performance would have been lower had expense limitations not been in effect.
Class A shares are sold with a maximum front-end sales charge of 4.50%, and have an annual distribution and service (12b-1) fee of 0.25% of average daily net assets. Performance for Class A shares, excluding sales charges, assumes that no front-end sales charge applied.
Class C shares are sold with a contingent deferred sales (CDSC) charge of 1.00% if redeemed within one year of purchase. They are also subject to an annual 12b-1 fee of 1.00% of average daily net assets. Performance for Class C shares, excluding sales charges, assumes either that CDSCs did not apply or that the investment was not redeemed.
Institutional Class shares are not subject to a sales charge and are offered for sale exclusively to certain eligible investors. In addition, Institutional Class shares pay no 12b-1 fee.
Fixed income securities and bond funds can lose value, and investors can lose principal, as interest rates rise. They also may be affected by economic conditions that hinder an issuer’s ability to make interest and principal payments on its debt. This includes prepayment risk, the risk that the principal of a bond that is held by a portfolio will be prepaid prior to maturity, at
the time when interest rates are lower than what the bond was paying. A portfolio may then have to reinvest that money at a lower interest rate.
Funds that invest primarily in one state may be more susceptible to the economic, regulatory, regional, and other factors of that state than geographically diversified funds.
Substantially all dividend income derived from tax-free funds is exempt from federal income tax. Some income may be subject to state or local and/or the federal alternative minimum tax (AMT) that applies to certain investors. Capital gains, if any, are taxable.
Duration number will change as market conditions change. Therefore, duration should not be solely relied upon to indicate a municipal bond fund’s potential volatility.
The disruptions caused by natural disasters, pandemics, or similar events could prevent the Fund from executing advantageous investment decisions in a timely manner and could negatively impact the Fund’s ability to achieve its investment objective and the value of the Fund’s investments.
This document may mention bond ratings published by nationally recognized statistical rating organizations (NRSROs) Standard & Poor’s, Moody’s Investors Service, and Fitch, Inc. For securities rated by an NRSRO other than S&P, the rating is converted to the equivalent S&P credit rating. Bonds rated AAA are rated as having the highest quality and are generally considered to have the lowest degree of investment risk. Bonds rated AA are considered to be of high quality, but with a slightly higher degree of risk than bonds rated AAA. Bonds rated A are considered to have many favorable investment qualities, though they are somewhat more susceptible to adverse economic conditions. Bonds rated BBB are believed to be of medium-grade quality and generally riskier over the long term. Bonds rated BB, B, and CCC are regarded as having significant speculative characteristics, with BB indicating the least degree of speculation of the three.
2The Fund’s expense ratios, as described in the most recent prospectus, are disclosed in the following “Fund expense ratios” table. The expense ratios below may differ from the expense ratios in the “Financial highlights” since they are based on different time periods and the expense ratios in the prospectus include acquired fund fees and expenses, if any. See Note 2 in “Notes to financial statements” for additional details. Please see the “Financial highlights” section in this report for the most recent expense ratios.
| Fund expense ratios | Class A | Class C | Institutional Class |
| Total annual operating expenses (without fee waivers) | 0.96% | 1.71% | 0.71% |
| Net expenses (including fee waivers, if any) | 0.82% | 1.57% | 0.57% |
| | | | |
| Type of waiver | Contractual | Contractual | Contractual |
Performance summaries
Delaware Tax-Free Colorado Fund
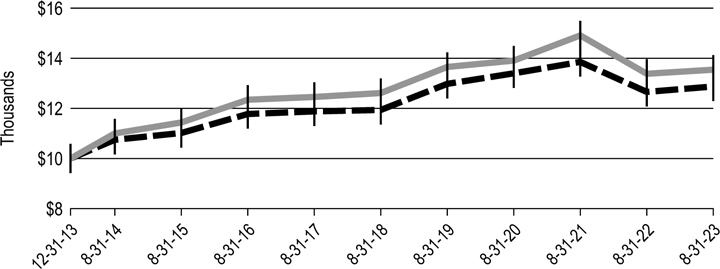
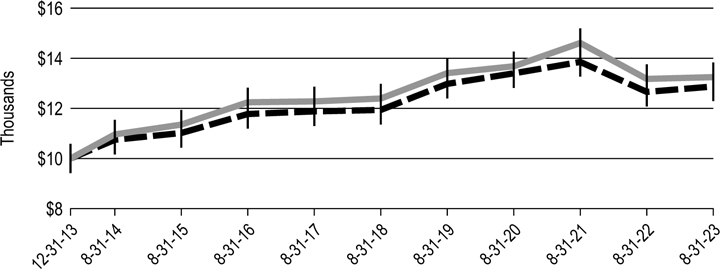
Performance of a $10,000 investment1
Class A shares
For the period August 31, 2013 through August 31, 2023

| | | | Starting value | | Ending value |
| Bloomberg Municipal Bond Index | | $ | 10,000 | | | $ | 13,194 | |
| Delaware Tax-Free Colorado Fund - Class A shares | | $ | 9,550 | | | $ | 12,498 | |
Institutional Class shares
For the period December 31, 2013 (inception date) through August 31, 2023
| | | | Starting value | | Ending value |
| Delaware Tax-Free Colorado Fund - Institutional Class shares | | $ | 10,000 | | | $ | 13,133 | |
| Bloomberg Municipal Bond Index | | $ | 10,000 | | | $ | 12,874 | |
1The “Performance of a $10,000 investment” graph for Class A shares assumes $10,000 invested in Class A shares of the Fund on August 31, 2013, and includes the effect of a 4.50% front-end sales charge and the reinvestment of all distributions. The graph also assumes $10,000 invested in the Bloomberg Municipal Bond Index as of August 31, 2013.
The “Performance of a $10,000 investment” graph for Institutional Class shares assumes $10,000 invested in Institutional Class shares of the Fund on December 31, 2013, and includes the reinvestment of all distributions. The graph also assumes $10,000 invested in the Bloomberg Municipal Bond Index as of December 31, 2013.
The graphs do not reflect the deduction of taxes the shareholders would pay on Fund distributions or redemptions of Fund shares. Expense limitations were in effect for some or all of the periods shown. Performance would have been lower had expense limitations not been in effect. Expenses are listed in the “Fund expense ratios” table on page 19. Please note additional details on pages 18 through 21.
The Bloomberg Municipal Bond Index measures the total return performance of the long-term, investment grade tax-exempt bond market.
The US Consumer Price Index (CPI), mentioned on page 3, is a measure of inflation that is calculated by the US Department of Labor, representing changes in prices of all goods and services purchased for consumption by urban households.
Index performance returns do not reflect any management fees, transaction costs, or expenses. Indices are unmanaged and one cannot invest directly in an index. Past performance does not guarantee future results.
Performance of other Fund classes will vary due to different charges and expenses.
| | Nasdaq symbols | CUSIPs |
| Class A | VCTFX | 928920107 |
| Class C | DVCTX | 92907R101 |
| Institutional Class | DCOIX | 92907R200 |
| Performance summaries | |
| Delaware Tax-Free Idaho Fund | August 31, 2023 (Unaudited) |
The performance quoted represents past performance and does not guarantee future results. Investment return and principal value of an investment will fluctuate so that shares, when redeemed, may be worth more or less than their original cost. Current performance may be lower or higher than the performance quoted. Performance data current to the most recent month end may be obtained by calling 800 523-1918 or visiting delawarefunds.com/performance.
| Fund and benchmark performance1,2 | Average annual total returns through August 31, 2023 |
| | 1 year | 5 year | 10 year | Lifetime |
| Class A (Est. January 4, 1995) | | | | |
| Excluding sales charge | -0.51% | +0.70% | +2.13% | — |
| Including sales charge | -4.97% | -0.22% | +1.66% | — |
| Class C (Est. January 10, 1995) | | | | |
| Excluding sales charge | -1.26% | +0.03% | +1.38% | — |
| Including sales charge | -2.22% | +0.03% | +1.38% | — |
| Institutional Class (Est. December 31, 2013) | | | | |
| Excluding sales charge | -0.17% | +0.98% | — | +2.31% |
| Including sales charge | -0.17% | +0.98% | — | +2.31% |
| Bloomberg Municipal Bond Index | +1.70% | +1.52% | +2.81% | — |
1Returns reflect the reinvestment of all distributions and are presented both with and without the applicable sales charges described below. Returns do not reflect the deduction of taxes the shareholder would pay on Fund distributions or redemptions of Fund shares.
Expense limitations were in effect for certain classes during some or all of the periods shown in the “Fund and benchmark performance” table. Expenses for each class are listed in the “Fund expense ratios” table on page 23. Performance would have been lower had expense limitations not been in effect.
Class A shares are sold with a maximum front-end sales charge of 4.50%, and have an annual distribution and service (12b-1) fee of 0.25% of average daily net assets. Performance for Class A shares, excluding sales charges, assumes that no front-end sales charge applied.
Class C shares are sold with a contingent deferred sales charge (CDSC) of 1.00% if redeemed within one year of purchase. They are also subject to an annual 12b-1 fee of 1.00% of average daily net assets. Performance for Class C shares, excluding sales charges, assumes either that CDSCs did not apply or that the investment was not redeemed.
Institutional Class shares are not subject to a sales charge and are offered for sale exclusively to certain eligible investors. In addition, Institutional Class shares pay no 12b-1 fee.
Fixed income securities and bond funds can lose value, and investors can lose principal, as interest rates rise. They also may be affected by economic conditions that hinder an issuer’s ability to make interest and principal payments on its debt. This includes prepayment risk, the risk that the principal of a bond that is held by a portfolio will be prepaid prior to maturity, at
the time when interest rates are lower than what the bond was paying. A portfolio may then have to reinvest that money at a lower interest rate. Funds that invest primarily in one state may be more susceptible to the economic, regulatory, regional, and other factors of that state than geographically diversified funds.
Substantially all dividend income derived from tax-free funds is exempt from federal income tax. Some income may be subject to state or local and/or the federal alternative minimum tax (AMT) that applies to certain investors. Capital gains, if any, are taxable.
Duration number will change as market conditions change. Therefore, duration should not be solely relied upon to indicate a municipal bond fund’s potential volatility.
The disruptions caused by natural disasters, pandemics, or similar events could prevent the Fund from executing advantageous investment decisions in a timely manner and could negatively impact the Fund’s ability to achieve its investment objective and the value of the Fund’s investments.
This document may mention bond ratings published by nationally recognized statistical rating organizations (NRSROs) Standard & Poor’s, Moody’s Investors Service, and Fitch, Inc. For securities rated by an NRSRO other than S&P, the rating is converted to the equivalent S&P credit rating. Bonds rated AAA are rated as having the highest quality and are generally considered to have the lowest degree of investment risk. Bonds rated AA are considered to be of high quality, but with a slightly higher degree of risk than bonds rated AAA. Bonds rated A are considered to have many favorable investment qualities, though they are somewhat more susceptible to adverse economic conditions. Bonds rated BBB are believed to be of medium-grade quality and generally riskier over the long term. Bonds rated BB, B, and CCC are regarded as having significant speculative characteristics, with BB indicating the least degree of speculation of the three.
2The Fund’s expense ratios, as described in the most recent prospectus, are disclosed in the following “Fund expense ratios” table. The expense ratios below may differ from the expense ratios in the “Financial highlights” since they are based on different time periods and the expense ratios in the prospectus include acquired fund fees and expenses, if any. See Note 2 in “Notes to financial statements” for additional details. Please see the “Financial highlights” section in this report for the most recent expense ratios.
| Fund expense ratios | Class A | Class C | Institutional Class |
| Total annual operating expenses (without fee waivers) | 1.01% | 1.76% | 0.76% |
| Net expenses (including fee waivers, if any) | 0.86% | 1.61% | 0.61% |
| | | | |
| Type of waiver | Contractual | Contractual | Contractual |
Performance summaries
Delaware Tax-Free Idaho Fund
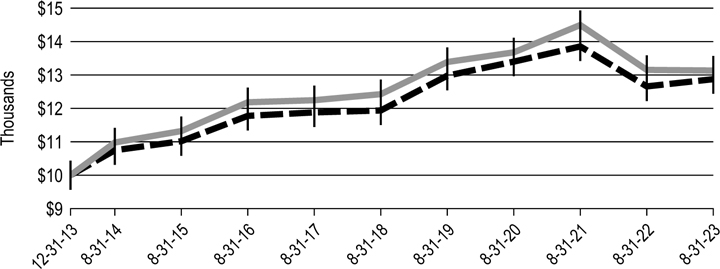
Performance of a $10,000 investment1
Class A shares
For the period August 31, 2013 through August 31, 2023

| | | | Starting value | | Ending value |
| Bloomberg Municipal Bond Index | | $ | 10,000 | | | $ | 13,194 | |
| Delaware Tax-Free Idaho Fund - Class A shares | | $ | 9,550 | | | $ | 11,791 | |
Institutional Class shares
For the period December 31, 2013 (inception date) through August 31, 2023
| | | | Starting value | | Ending value |
| Bloomberg Municipal Bond Index | | $ | 10,000 | | | $ | 12,874 | |
| Delaware Tax-Free Idaho Fund - Institutional Class shares | | $ | 10,000 | | | $ | 12,468 | |
1The “Performance of a $10,000 investment” graph for Class A shares assumes $10,000 invested in Class A shares of the Fund on August 31, 2013, and includes the effect of a 4.50% front-end sales charge and the reinvestment of all distributions. The graph also assumes $10,000 invested in the Bloomberg Municipal Bond Index as of August 31, 2013.
The “Performance of a $10,000 investment” graph for Institutional Class shares assumes $10,000 invested in Institutional Class shares of the Fund on December 31, 2013, and includes the reinvestment of all distributions. The graph also assumes $10,000 invested in the Bloomberg Municipal Bond Index as of December 31, 2013.
The graphs do not reflect the deduction of taxes the shareholders would pay on Fund distributions or redemptions of Fund shares. Expense limitations were in effect for some or all of the periods shown. Performance would have been lower had expense limitations not been in effect. Expenses are listed in the “Fund expense ratios” table on page 23. Please note additional details on pages 22 through 25.
The Bloomberg Municipal Bond Index measures the total return performance of the long-term, investment grade tax-exempt bond market.
The US Consumer Price Index (CPI), mentioned on page 3, is a measure of inflation that is calculated by the US Department of Labor, representing changes in prices of all goods and services purchased for consumption by urban households.
Index performance returns do not reflect any management fees, transaction costs, or expenses. Indices are unmanaged and one cannot invest directly in an index. Past performance does not guarantee future results.
Performance of other Fund classes will vary due to different charges and expenses.
| | Nasdaq symbols | CUSIPs |
| Class A | VIDAX | 928928704 |
| Class C | DVICX | 928928803 |
| Institutional Class | DTIDX | 928928159 |
| Performance summaries | |
| Delaware Tax-Free New York Fund | August 31, 2023 (Unaudited) |
The performance quoted represents past performance and does not guarantee future results. Investment return and principal value of an investment will fluctuate so that shares, when redeemed, may be worth more or less than their original cost. Current performance may be lower or higher than the performance quoted. Performance data current to the most recent month end may be obtained by calling 800 523-1918 or visiting delawarefunds.com/performance.
| Fund and benchmark performance1,2 | Average annual total returns through August 31, 2023 |
| | 1 year | 5 year | 10 year | Lifetime |
| Class A (Est. November 6, 1987) | | | | |
| Excluding sales charge | +0.29% | +1.09% | +2.85% | — |
| Including sales charge | -4.24% | +0.17% | +2.38% | — |
| Class C (Est. April 26, 1995) | | | | |
| Excluding sales charge | -0.37% | +0.35% | +2.09% | — |
| Including sales charge | -1.34% | +0.35% | +2.09% | — |
| Institutional Class (Est. December 31, 2013) | | | | |
| Excluding sales charge | +0.54% | +1.32% | — | +2.95% |
| Including sales charge | +0.54% | +1.32% | — | +2.95% |
| Bloomberg Municipal Bond Index | +1.70% | +1.52% | +2.81% | — |
1Returns reflect the reinvestment of all distributions and are presented both with and without the applicable sales charges described below. Returns do not reflect the deduction of taxes the shareholder would pay on Fund distributions or redemptions of Fund shares.
Expense limitations were in effect for certain classes during some or all of the periods shown in the “Fund and benchmark performance” table. Expenses for each class are listed in the “Fund expense ratios” table on page 27. Performance would have been lower had expense limitations not been in effect.
Class A shares are sold with a maximum front-end sales charge of 4.50%, and have an annual distribution and service (12b-1) fee of 0.25% of average daily net assets. Performance for Class A shares, excluding sales charges, assumes that no front-end sales charge applied.
Class C shares are sold with a contingent deferred sales charge (CDSC) of 1.00% if redeemed within one year of purchase. They are also subject to an annual 12b-1 fee of 1.00% of average daily net assets. Performance for Class C shares, excluding sales charges, assumes either that CDSCs did not apply or that the investment was not redeemed.
Institutional Class shares are not subject to a sales charge and are offered for sale exclusively to certain eligible investors. In addition, Institutional Class shares pay no 12b-1 fee.
Fixed income securities and bond funds can lose value, and investors can lose principal, as interest rates rise. They also may be affected by economic conditions that hinder an issuer’s ability to make interest and principal payments on its debt. This includes prepayment risk, the risk that the principal of a bond that is held by a portfolio will be prepaid prior to maturity, at
the time when interest rates are lower than what the bond was paying. A portfolio may then have to reinvest that money at a lower interest rate.
Funds that invest primarily in one state may be more susceptible to the economic, regulatory, regional, and other factors of that state than geographically diversified funds.
Substantially all dividend income derived from tax-free funds is exempt from federal income tax. Some income may be subject to state or local and/or the federal alternative minimum tax (AMT) that applies to certain investors. Capital gains, if any, are taxable.
Duration number will change as market conditions change. Therefore, duration should not be solely relied upon to indicate a municipal bond fund’s potential volatility.
The disruptions caused by natural disasters, pandemics, or similar events could prevent the Fund from executing advantageous investment decisions in a timely manner and could negatively impact the Fund’s ability to achieve its investment objective and the value of the Fund’s investments.
This document may mention bond ratings published by nationally recognized statistical rating organizations (NRSROs) Standard & Poor’s, Moody’s Investors Service, and Fitch, Inc. For securities rated by an NRSRO other than S&P, the rating is converted to the equivalent S&P credit rating. Bonds rated AAA are rated as having the highest quality and are generally considered to have the lowest degree of investment risk. Bonds rated AA are considered to be of high quality, but with a slightly higher degree of risk than bonds rated AAA. Bonds rated A are considered to have many favorable investment qualities, though they are somewhat more susceptible to adverse economic conditions. Bonds rated BBB are believed to be of medium-grade quality and generally riskier over the long term. Bonds rated BB, B, and CCC are regarded as having significant speculative characteristics, with BB indicating the least degree of speculation of the three.
2The Fund’s expense ratios, as described in the most recent prospectus, are disclosed in the following “Fund expense ratios” table. The expense ratios below may differ from the expense ratios in the “Financial highlights” since they are based on different time periods and the expense ratios in the prospectus include acquired fund fees and expenses, if any. See Note 2 in “Notes to financial statements” for additional details. Please see the “Financial highlights” section in this report for the most recent expense ratios.
| Fund expense ratios | Class A | Class C | Institutional Class |
| Total annual operating expenses (without fee waivers) | 0.97% | 1.72% | 0.72% |
| Net expenses (including fee waivers, if any) | 0.80% | 1.55% | 0.55% |
| | | | |
| Type of waiver | Contractual | Contractual | Contractual |
Performance summaries
Delaware Tax-Free New York Fund
Performance of a $10,000 investment1
Class A shares
For the period August 31, 2013 through August 31, 2023
| | | | Starting value | | Ending value |
| Bloomberg Municipal Bond Index | | $ | 10,000 | | | $ | 13,194 | |
| Delaware Tax-Free New York Fund - Class A shares | | $ | 9,550 | | | $ | 12,647 | |
Institutional Class shares
For the period December 31, 2013 (inception date) through August 31, 2023
| | | | Starting value | | Ending value |
| Delaware Tax-Free New York Fund - Institutional Class shares | | $ | 10,000 | | | $ | 13,247 | |
| Bloomberg Municipal Bond Index | | $ | 10,000 | | | $ | 12,874 | |
1The “Performance of a $10,000 investment” graph for Class A shares assumes $10,000 invested in Class A shares of the Fund on August 31, 2013, and includes the effect of a 4.50% front-end sales charge and the reinvestment of all distributions. The graph also assumes $10,000 invested in the Bloomberg Municipal Bond Index as of August 31, 2013.
The “Performance of a $10,000 investment” graph for Institutional Class shares assumes $10,000 invested in Institutional Class shares of the Fund on December 31, 2013, and includes the reinvestment of all distributions. The graph also assumes $10,000 invested in the Bloomberg Municipal Bond Index as of December 31, 2013.
The graphs do not reflect the deduction of taxes the shareholders would pay on Fund distributions or redemptions of Fund shares. Expense limitations were in effect for some or all of the periods shown. Performance would have been lower had expense limitations not been in effect. Expenses are listed in the “Fund expense ratios” table on page 27. Please note additional details on pages 26 through 29.
The Bloomberg Municipal Bond Index measures the total return performance of the long-term, investment grade tax-exempt bond market.
The US Consumer Price Index (CPI), mentioned on page 3, is a measure of inflation that is calculated by the US Department of Labor, representing changes in prices of all goods and services purchased for consumption by urban households.
Index performance returns do not reflect any management fees, transaction costs, or expenses. Indices are unmanaged and one cannot invest directly in an index. Past performance does not guarantee future results.
Performance of other Fund classes will vary due to different charges and expenses.
| | Nasdaq symbols | CUSIPs |
| Class A | FTNYX | 928928274 |
| Class C | DVFNX | 928928258 |
| Institutional Class | DTNIX | 928928142 |
| Performance summaries | |
| Delaware Tax-Free Pennsylvania Fund | August 31, 2023 (Unaudited) |
The performance quoted represents past performance and does not guarantee future results. Investment return and principal value of an investment will fluctuate so that shares, when redeemed, may be worth more or less than their original cost. Current performance may be lower or higher than the performance quoted. Performance data current to the most recent month end may be obtained by calling 800 523-1918 or visiting delawarefunds.com/performance.
| Fund and benchmark performance1,2 | Average annual total returns through August 31, 2023 |
| | 1 year | 5 year | 10 year | Lifetime |
| Class A (Est. March 23, 1977) | | | | |
| Excluding sales charge | +0.29% | +1.24% | +2.87% | — |
| Including sales charge | -4.17% | +0.32% | +2.40% | — |
| Class C (Est. November 29, 1995) | | | | |
| Excluding sales charge | -0.33% | +0.50% | +2.11% | — |
| Including sales charge | -1.30% | +0.50% | +2.11% | — |
| Institutional Class (Est. December 31, 2013) | | | | |
| Excluding sales charge | +0.53% | +1.51% | — | +3.00% |
| Including sales charge | +0.53% | +1.51% | — | +3.00% |
| Bloomberg Municipal Bond Index | +1.70% | +1.52% | +2.81% | — |
1Returns reflect the reinvestment of all distributions and are presented both with and without the applicable sales charges described below. Returns do not reflect the deduction of taxes the shareholder would pay on Fund distributions or redemptions of Fund shares.
Expense limitations were in effect for certain classes during some or all of the periods shown in the “Fund and benchmark performance” table. Expenses for each class are listed in the “Fund expense ratios” table on page 32. Performance would have been lower had expense limitations not been in effect.
Class A shares are sold with a maximum front-end sales charge of 4.50%, and have an annual distribution and service (12b-1) fee of 0.25% of average daily net assets. The Board has adopted a formula for calculating 12b-1 plan fees for the Fund’s Class A shares. The Fund’s Class A shares are currently subject to a blended 12b-1 fee equal to the sum of: (i) 0.10% of average daily net assets representing shares acquired prior to June 1, 1992, and (ii) 0.25% of average daily net assets representing shares acquired on or after June 1, 1992. All Class A shares currently bear 12b-1 fees at the same rate, the blended rate, currently 0.25% of average daily net assets, based on the formula described above. This method of calculating Class A 12b-1 fees may be discontinued at the sole discretion of the Board. Performance for Class A shares, excluding sales charges, assumes that no front-end sales charge applied.
Class C shares are sold with a contingent deferred sales charge (CDSC) of 1.00% if redeemed within one year of purchase. They are also subject to an annual 12b-1 fee of 1.00% of average daily net assets. Performance for Class C shares, excluding sales charges, assumes either that CDSCs did not apply or that the investment was not redeemed.
Institutional Class shares are not subject to a sales charge and are offered for sale exclusively to certain eligible investors. In addition, Institutional Class shares pay no 12b-1 fee.
Fixed income securities and bond funds can lose value, and investors can lose principal, as interest rates rise. They also may be affected by economic conditions that hinder an issuer’s ability to make interest and principal payments on its debt. This includes prepayment risk, the risk that the principal of a bond that is held by a portfolio will be prepaid prior to maturity, at the time when interest rates are lower than what the bond was paying. A portfolio may then have to reinvest that money at a lower interest rate.
Funds that invest primarily in one state may be more susceptible to the economic, regulatory, regional, and other factors of that state than geographically diversified funds.
Substantially all dividend income derived from tax-free funds is exempt from federal income tax. Some income may be subject to state or local and/or the federal alternative minimum tax (AMT) that applies to certain investors. Capital gains, if any, are taxable.
Duration number will change as market conditions change. Therefore, duration should not be solely relied upon to indicate a municipal bond fund’s potential volatility.
The disruptions caused by natural disasters, pandemics, or similar events could prevent the Fund from executing advantageous investment decisions in a timely manner and could negatively impact the Fund’s ability to achieve its investment objective and the value of the Fund’s investments.
This document may mention bond ratings published by nationally recognized statistical rating organizations (NRSROs) Standard & Poor’s, Moody’s Investors Service, and Fitch, Inc. For securities rated by an NRSRO other than S&P, the rating is converted to the equivalent S&P credit rating. Bonds rated AAA are rated as having the highest quality and are generally considered to have the lowest degree of investment risk. Bonds rated AA are considered to be of high quality, but with a slightly higher degree of risk than bonds rated AAA. Bonds rated A are considered to have many favorable investment qualities, though they are somewhat more susceptible to adverse economic conditions. Bonds rated BBB are believed to be of medium-grade quality and generally riskier over the long term. Bonds rated BB, B, and CCC are regarded as having significant speculative characteristics, with BB indicating the least degree of speculation of the three.
Performance summaries
Delaware Tax-Free Pennsylvania Fund
2The Fund’s expense ratios, as described in the most recent prospectus, are disclosed in the following “Fund expense ratios” table. The expense ratios below may differ from the expense ratios in the “Financial highlights” since they are based on different time periods and the expense ratios in the prospectus include acquired fund fees and expenses, if any. See Note 2 in “Notes to financial statements” for additional details. Please see the “Financial highlights” section in this report for the most recent expense ratios.
| Fund expense ratios | Class A | Class C | Institutional Class |
| Total annual operating expenses (without fee waivers) | 0.94% | 1.69% | 0.69% |
| Net expenses (including fee waivers, if any) | 0.84% | 1.59% | 0.59% |
| | | | |
| Type of waiver | Contractual | Contractual | Contractual |
Performance of a $10,000 investment1
Class A shares
For the period August 31, 2013 through August 31, 2023
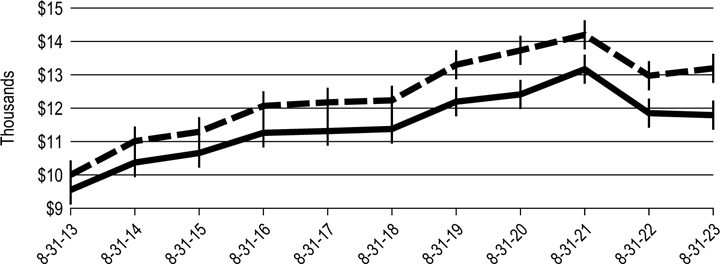
| | | | Starting value | | Ending value |
| Bloomberg Municipal Bond Index | | $ | 10,000 | | | $ | 13,194 | |
| Delaware Tax-Free Pennsylvania Fund - Class A shares | | $ | 9,550 | | | $ | 12,671 | |
Institutional Class shares
For the period December 31, 2013 (inception date) through August 31, 2023
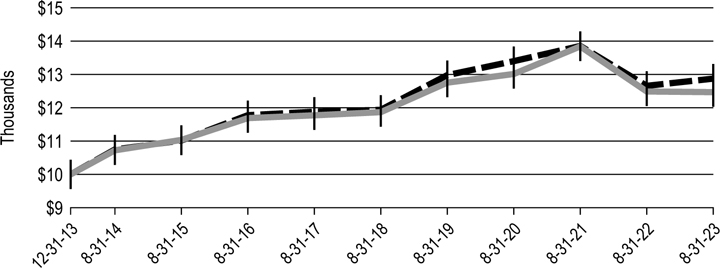
| | | | Starting value | | Ending value |
| Delaware Tax-Free Pennsylvania Fund - Institutional Class shares | | $ | 10,000 | | | $ | 13,304 | |
| Bloomberg Municipal Bond Index | | $ | 10,000 | | | $ | 12,874 | |
Performance summaries
Delaware Tax-Free Pennsylvania Fund
1The “Performance of a $10,000 investment” graph for Class A shares assumes $10,000 invested in Class A shares of the Fund on August 31, 2013, and includes the effect of a 4.50% front-end sales charge and the reinvestment of all distributions. The graph also assumes $10,000 invested in the Bloomberg Municipal Bond Index as of August 31, 2013.
The “Performance of a $10,000 investment” graph for Institutional Class shares assumes $10,000 invested in Institutional Class shares of the Fund on December 31, 2013, and includes the reinvestment of all distributions. The graph also assumes $10,000 invested in the Bloomberg Municipal Bond Index as of December 31, 2013.
The graphs do not reflect the deduction of taxes the shareholders would pay on Fund distributions or redemptions of Fund shares. Expense limitations were in effect for some or all of the periods shown. Performance would have been lower had expense limitations not been in effect. Expenses are listed in the “Fund expense ratios” table on page 32. Please note additional details on pages 30 through 34.
The Bloomberg Municipal Bond Index measures the total return performance of the long-term, investment grade tax-exempt bond market.
The US Consumer Price Index (CPI), mentioned on page 3, is a measure of inflation that is calculated by the US Department of Labor, representing changes in prices of all goods and services purchased for consumption by urban households.
Index performance returns do not reflect any management fees, transaction costs, or expenses. Indices are unmanaged and one cannot invest directly in an index. Past performance does not guarantee future results.
Performance of other Fund classes will vary due to different charges and expenses.
| | Nasdaq symbols | CUSIPs |
| Class A | DELIX | 233216100 |
| Class C | DPTCX | 233216308 |
| Institutional Class | DTPIX | 24609H701 |
Disclosure of Fund expenses
For the six-month period from March 1, 2023 to August 31, 2023 (Unaudited)
As a shareholder of a Fund, you incur two types of costs: (1) transaction costs, including sales charges (loads) on purchase payments, reinvested dividends, or other distributions; redemption fees; and exchange fees; and (2) ongoing costs, including management fees; distribution and service (12b-1) fees; and other Fund expenses. The following examples are intended to help you understand your ongoing costs (in dollars) of investing in a Fund and to compare these costs with the ongoing costs of investing in other mutual funds.
The examples are based on an investment of $1,000 invested at the beginning of the period and held for the entire six-month period from March 1, 2023 to August 31, 2023.
Actual expenses
The first section of the tables shown, “Actual Fund return,” provides information about actual account values and actual expenses. You may use the information in this section of the table, together with the amount you invested, to estimate the expenses that you paid over the period. Simply divide your account value by $1,000 (for example, an $8,600 account value divided by $1,000 = 8.6), then multiply the result by the number in the first section under the heading entitled “Expenses Paid During Period” to estimate the expenses you paid on your account during this period.
Hypothetical example for comparison purposes
The second section of the tables shown, “Hypothetical 5% return,” provides information about hypothetical account values and hypothetical expenses based on the Funds’ actual expense ratio and an assumed rate of return of 5% per year before expenses, which is not the Funds’ actual return. The hypothetical account values and expenses may not be used to estimate the actual ending account balance or expenses you paid for the period. You may use this information to compare the ongoing costs of investing in each Fund and other funds. To do so, compare this 5% hypothetical example with the 5% hypothetical examples that appear in the shareholder reports of the other funds.
Please note that the expenses shown in the tables are meant to highlight your ongoing costs only and do not reflect any transactional costs, such as sales charges (loads), redemption fees, or exchange fees. Therefore, the second section of each table is useful in comparing ongoing costs only, and will not help you determine the relative total costs of owning different funds. In addition, if these transactional costs were included, your costs would have been higher. The Funds’ expenses shown in the tables reflect fee waivers in effect and assume reinvestment of all dividends and distributions.
Disclosure of Fund expenses
For the six-month period from March 1, 2023 to August 31, 2023 (Unaudited)
Delaware Tax-Free Arizona Fund
Expense analysis of an investment of $1,000
| | | Beginning | | Ending | | | | Expenses |
| | | Account Value | | Account Value | | Annualized | | Paid During Period |
| | | 3/1/23 | | 8/31/23 | | Expense Ratio | | 3/1/23 to 8/31/23* |
| Actual Fund return† | | | | | | | | | | | | | | |
| Class A | | $ | 1,000.00 | | | $ | 996.10 | | | 0.84% | | $ | 4.23 | |
| Class C | | | 1,000.00 | | | | 991.40 | | | 1.59% | | | 7.98 | |
| Institutional Class | | | 1,000.00 | | | | 997.30 | | | 0.59% | | | 2.97 | |
| Hypothetical 5% return (5% return before expenses) | | | | | | | |
| Class A | | $ | 1,000.00 | | | $ | 1,020.97 | | | 0.84% | | $ | 4.28 | |
| Class C | | | 1,000.00 | | | | 1,017.19 | | | 1.59% | | | 8.08 | |
| Institutional Class | | | 1,000.00 | | | | 1,022.23 | | | 0.59% | | | 3.01 | |
Delaware Tax-Free California Fund
Expense analysis of an investment of $1,000
| | | Beginning | | Ending | | | | Expenses |
| | | Account Value | | Account Value | | Annualized | | Paid During Period |
| | | 3/1/23 | | 8/31/23 | | Expense Ratio | | 3/1/23 to 8/31/23* |
| Actual Fund return† | | | | | | | | | | | | | | |
| Class A | | $ | 1,000.00 | | | $ | 1,016.40 | | | 0.80% | | $ | 4.07 | |
| Class C | | | 1,000.00 | | | | 1,013.50 | | | 1.55% | | | 7.87 | |
| Institutional Class | | | 1,000.00 | | | | 1,018.60 | | | 0.55% | | | 2.80 | |
| Hypothetical 5% return (5% return before expenses) | | | | | | | |
| Class A | | $ | 1,000.00 | | | $ | 1,021.17 | | | 0.80% | | $ | 4.08 | |
| Class C | | | 1,000.00 | | | | 1,017.39 | | | 1.55% | | | 7.88 | |
| Institutional Class | | | 1,000.00 | | | | 1,022.43 | | | 0.55% | | | 2.80 | |
Delaware Tax-Free Colorado Fund
Expense analysis of an investment of $1,000
| | | Beginning | | Ending | | | | Expenses |
| | | Account Value | | Account Value | | Annualized | | Paid During Period |
| | | 3/1/23 | | 8/31/23 | | Expense Ratio | | 3/1/23 to 8/31/23* |
| Actual Fund return† | | | | | | | | | | | | | | |
| Class A | | $ | 1,000.00 | | | $ | 1,008.30 | | | 0.82% | | $ | 4.15 | |
| Class C | | | 1,000.00 | | | | 1,003.60 | | | 1.57% | | | 7.93 | |
| Institutional Class | | | 1,000.00 | | | | 1,009.60 | | | 0.57% | | | 2.89 | |
| Hypothetical 5% return (5% return before expenses) | | | | | | | |
| Class A | | $ | 1,000.00 | | | $ | 1,021.07 | | | 0.82% | | $ | 4.18 | |
| Class C | | | 1,000.00 | | | | 1,017.29 | | | 1.57% | | | 7.98 | |
| Institutional Class | | | 1,000.00 | | | | 1,022.33 | | | 0.57% | | | 2.91 | |
Delaware Tax-Free Idaho Fund
Expense analysis of an investment of $1,000
| | | Beginning | | Ending | | | | Expenses |
| | | Account Value | | Account Value | | Annualized | | Paid During Period |
| | | 3/1/23 | | 8/31/23 | | Expense Ratio | | 3/1/23 to 8/31/23* |
| Actual Fund return† | | | | | | | | | | | | | | |
| Class A | | $ | 1,000.00 | | | $ | 1,004.40 | | | 0.86% | | $ | 4.34 | |
| Class C | | | 1,000.00 | | | | 1,001.60 | | | 1.61% | | | 8.12 | |
| Institutional Class | | | 1,000.00 | | | | 1,006.70 | | | 0.61% | | | 3.09 | |
| Hypothetical 5% return (5% return before expenses) | | | | | | | |
| Class A | | $ | 1,000.00 | | | $ | 1,020.87 | | | 0.86% | | $ | 4.38 | |
| Class C | | | 1,000.00 | | | | 1,017.09 | | | 1.61% | | | 8.19 | |
| Institutional Class | | | 1,000.00 | | | | 1,022.13 | | | 0.61% | | | 3.11 | |
Disclosure of Fund expenses
For the six-month period from March 1, 2023 to August 31, 2023 (Unaudited)
Delaware Tax-Free New York Fund
Expense analysis of an investment of $1,000
| | | Beginning | | Ending | | | | Expenses |
| | | Account Value | | Account Value | | Annualized | | Paid During Period |
| | | 3/1/23 | | 8/31/23 | | Expense Ratio | | 3/1/23 to 8/31/23* |
| Actual Fund return† | | | | | | | | | | | | | | |
| Class A | | $ | 1,000.00 | | | $ | 1,013.80 | | | 0.80% | | $ | 4.06 | |
| Class C | | | 1,000.00 | | | | 1,010.00 | | | 1.55% | | | 7.85 | |
| Institutional Class | | | 1,000.00 | | | | 1,015.10 | | | 0.55% | | | 2.79 | |
| Hypothetical 5% return (5% return before expenses) | | | | | | | |
| Class A | | $ | 1,000.00 | | | $ | 1,021.17 | | | 0.80% | | $ | 4.08 | |
| Class C | | | 1,000.00 | | | | 1,017.39 | | | 1.55% | | | 7.88 | |
| Institutional Class | | | 1,000.00 | | | | 1,022.43 | | | 0.55% | | | 2.80 | |
Delaware Tax-Free Pennsylvania Fund
Expense analysis of an investment of $1,000
| | | Beginning | | Ending | | | | Expenses |
| | | Account Value | | Account Value | | Annualized | | Paid During Period |
| | | 3/1/23 | | 8/31/23 | | Expense Ratio | | 3/1/23 to 8/31/23* |
| Actual Fund return† | | | | | | | | | | | | | | |
| Class A | | $ | 1,000.00 | | | $ | 1,015.10 | | | 0.84% | | $ | 4.27 | |
| Class C | | | 1,000.00 | | | | 1,011.20 | | | 1.59% | | | 8.06 | |
| Institutional Class | | | 1,000.00 | | | | 1,016.30 | | | 0.59% | | | 3.00 | |
| Hypothetical 5% return (5% return before expenses) | | | | | | | |
| Class A | | $ | 1,000.00 | | | $ | 1,020.97 | | | 0.84% | | $ | 4.28 | |
| Class C | | | 1,000.00 | | | | 1,017.19 | | | 1.59% | | | 8.08 | |
| Institutional Class | | | 1,000.00 | | | | 1,022.23 | | | 0.59% | | | 3.01 | |
*“Expenses Paid During Period” are equal to the relevant Fund’s annualized expense ratio, multiplied by the average account value over the period, multiplied by 184/365 (to reflect the one-half year period).
†Because actual returns reflect only the most recent six-month period, the returns shown may differ significantly from fiscal year returns.
In addition to the Funds’ expenses reflected above and on the previous pages, each Fund also indirectly bears its portion of the fees and expenses of any investment companies (Underlying Funds), in which it invests. The tables above and on the previous pages do not reflect the expenses of any Underlying Funds.
| Security type / sector / state / territory allocations |
| Delaware Tax-Free Arizona Fund | As of August 31, 2023 (Unaudited) |
Sector designations may be different from the sector designations presented in other Fund materials.
| Security type / sector | Percentage of net assets |
| Municipal Bonds* | 98.66% | |
| Education Revenue Bonds | 28.38% | |
| Electric Revenue Bonds | 6.28% | |
| Healthcare Revenue Bonds | 23.27% | |
| Industrial Development Revenue/Pollution Control Revenue Bonds | 7.08% | |
| Lease Revenue Bonds | 2.54% | |
| Local General Obligation Bonds | 4.06% | |
| Special Tax Revenue Bonds | 15.84% | |
| State General Obligation Bonds | 0.55% | |
| Transportation Revenue Bonds | 6.58% | |
| Water & Sewer Revenue Bonds | 4.08% | |
| Short-Term Investments | 0.67% | |
| Total Value of Securities | 99.33% | |
| Receivables and Other Assets Net of Liabilities | 0.67% | |
| Total Net Assets | 100.00% | |
*As of the date of this report, Delaware Tax-Free Arizona Fund held bonds issued by or on behalf of territories and the states of the US as follows:
| State / territory | Percentage of net assets |
| Arizona | 82.02% | |
| Puerto Rico | 16.13% | |
| US Virgin Islands | 0.51% | |
| Total Value of Securities | 98.66% | |
| Security type / sector / state / territory allocations |
| Delaware Tax-Free California Fund | As of August 31, 2023 (Unaudited) |
Sector designations may be different from the sector designations presented in other Fund materials.
| Security type / sector | Percentage of net assets |
| Municipal Bonds* | 98.43% | |
| Education Revenue Bonds | 18.75% | |
| Electric Revenue Bonds | 3.51% | |
| Healthcare Revenue Bonds | 13.20% | |
| Housing Revenue Bonds | 3.43% | |
| Industrial Development Revenue/Pollution Control Revenue Bonds | 12.01% | |
| Lease Revenue Bonds | 4.89% | |
| Local General Obligation Bonds | 1.84% | |
| Pre-Refunded Bonds | 2.84% | |
| Special Tax Revenue Bonds | 15.10% | |
| State General Obligation Bonds | 7.78% | |
| Transportation Revenue Bonds | 13.29% | |
| Water & Sewer Revenue Bonds | 1.79% | |
| Short-Term Investments | 1.35% | |
| Total Value of Securities | 99.78% | |
| Receivables and Other Assets Net of Liabilities | 0.22% | |
| Total Net Assets | 100.00% | |
*As of the date of this report, Delaware Tax-Free California Fund held bonds issued by or on behalf of territories and the states of the US as follows:
| State / territory | Percentage of net assets |
| California | 82.27% | |
| Guam | 0.67% | |
| Puerto Rico | 15.24% | |
| US Virgin Islands | 0.25% | |
| Total Value of Securities | 98.43% | |
| Security type / sector / state / territory allocations |
| Delaware Tax-Free Colorado Fund | As of August 31, 2023 (Unaudited) |
Sector designations may be different from the sector designations presented in other Fund materials.
| Security type / sector | Percentage of net assets |
| Municipal Bonds* | 98.52% | |
| Education Revenue Bonds | 13.64% | |
| Electric Revenue Bonds | 5.14% | |
| Healthcare Revenue Bonds | 21.04% | |
| Housing Revenue Bond | 1.16% | |
| Industrial Development Revenue/Pollution Control Revenue Bonds | 4.14% | |
| Lease Revenue Bonds | 2.31% | |
| Local General Obligation Bonds | 9.78% | |
| Pre-Refunded Bonds | 4.09% | |
| Special Tax Revenue Bonds | 19.51% | |
| State General Obligation Bonds | 1.03% | |
| Transportation Revenue Bonds | 12.35% | |
| Water & Sewer Revenue Bonds | 4.33% | |
| Short-Term Investments | 0.82% | |
| Total Value of Securities | 99.34% | |
| Receivables and Other Assets Net of Liabilities | 0.66% | |
| Total Net Assets | 100.00% | |
*As of the date of this report, Delaware Tax-Free Colorado Fund held bonds issued by or on behalf of territories and the states of the US as follows:
| State / territory | Percentage of net assets |
| Colorado | 79.91% | |
| Guam | 1.09% | |
| Puerto Rico | 17.31% | |
| US Virgin Islands | 0.21% | |
| Total Value of Securities | 98.52% | |
| Security type / sector / state / territory allocations |
| Delaware Tax-Free Idaho Fund | As of August 31, 2023 (Unaudited) |
Sector designations may be different from the sector designations presented in other Fund materials.
| Security type / sector | Percentage of net assets |
| Municipal Bonds* | 98.36% | |
| Education Revenue Bonds | 22.80% | |
| Electric Revenue Bonds | 2.42% | |
| Healthcare Revenue Bonds | 12.47% | |
| Housing Revenue Bonds | 4.82% | |
| Industrial Development Revenue/Pollution Control Revenue Bonds | 4.42% | |
| Lease Revenue Bonds | 11.70% | |
| Local General Obligation Bonds | 6.95% | |
| Pre-Refunded Bonds | 2.27% | |
| Resource Recovery Revenue Bond | 0.32% | |
| Special Tax Revenue Bonds | 23.15% | |
| State General Obligation Bond | 0.16% | |
| Transportation Revenue Bonds | 5.12% | |
| Water & Sewer Revenue Bond | 1.76% | |
| Short-Term Investments | 0.66% | |
| Total Value of Securities | 99.02% | |
| Receivables and Other Assets Net of Liabilities | 0.98% | |
| Total Net Assets | 100.00% | |
*As of the date of this report, Delaware Tax-Free Idaho Fund held bonds issued by or on behalf of territories and the states of the US as follows:
| State / territory | Percentage of net assets |
| Idaho | 81.04% | |
| Puerto Rico | 17.32% | |
| Total Value of Securities | 98.36% | |
| Security type / sector / state / territory allocations |
| Delaware Tax-Free New York Fund | As of August 31, 2023 (Unaudited) |
Sector designations may be different from the sector designations presented in other Fund materials.
| Security type / sector | Percentage of net assets |
| Municipal Bonds* | 96.53% | |
| Education Revenue Bonds | 18.88% | |
| Electric Revenue Bonds | 5.88% | |
| Healthcare Revenue Bonds | 9.41% | |
| Housing Revenue Bonds | 2.43% | |
| Industrial Development Revenue/Pollution Control Revenue Bonds | 9.17% | |
| Lease Revenue Bonds | 7.33% | |
| Local General Obligation Bonds | 2.84% | |
| Pre-Refunded Bonds | 1.01% | |
| Resource Recovery Revenue Bond | 0.65% | |
| Special Tax Revenue Bonds | 23.90% | |
| State General Obligation Bonds | 1.34% | |
| Transportation Revenue Bonds | 10.93% | |
| Water & Sewer Revenue Bonds | 2.76% | |
| Short-Term Investments | 1.90% | |
| Total Value of Securities | 98.43% | |
| Receivables and Other Assets Net of Liabilities | 1.57% | |
| Total Net Assets | 100.00% | |
*As of the date of this report, Delaware Tax-Free New York Fund held bonds issued by or on behalf of territories and the states of the US as follows:
| State / territory | Percentage of net assets |
| Guam | 0.69% | |
| New York | 79.04% | |
| Puerto Rico | 16.55% | |
| US Virgin Islands | 0.25% | |
| Total Value of Securities | 96.53% | |
| Security type / sector / state / territory allocations |
| Delaware Tax-Free Pennsylvania Fund | As of August 31, 2023 (Unaudited) |
Sector designations may be different from the sector designations presented in other Fund materials.
| Security type / sector | Percentage of net assets |
| Municipal Bonds* | 98.49% | |
| Education Revenue Bonds | 9.57% | |
| Electric Revenue Bonds | 1.09% | |
| Healthcare Revenue Bonds | 33.19% | |
| Housing Revenue Bond | 1.34% | |
| Industrial Development Revenue/Pollution Control Revenue Bonds | 9.28% | |
| Lease Revenue Bonds | 1.20% | |
| Local General Obligation Bonds | 4.34% | |
| Pre-Refunded/Escrowed to Maturity Bonds | 1.06% | |
| Special Tax Revenue Bonds | 17.99% | |
| State General Obligation Bonds | 0.96% | |
| Transportation Revenue Bonds | 17.56% | |
| Water & Sewer Revenue Bonds | 0.91% | |
| Short-Term Investments | 0.52% | |
| Total Value of Securities | 99.01% | |
| Receivables and Other Assets Net of Liabilities | 0.99% | |
| Total Net Assets | 100.00% | |
*As of the date of this report, Delaware Tax-Free Pennsylvania Fund held bonds issued by or on behalf of territories and the states of the US as follows:
| State / territory | Percentage of net assets |
| Pennsylvania | 79.95% | |
| Puerto Rico | 17.22% | |
| US Virgin Islands | 1.32% | |
| Total Value of Securities | 98.49% | |
| Schedules of investments | |
| Delaware Tax-Free Arizona Fund | August 31, 2023 |
| | | Principal | | | | |
| | | amount° | | | Value (US $) | |
| Municipal Bonds — 98.66% | | | | | | | | |
| Education Revenue Bonds — 28.38% | | | | | | | | |
| Arizona Industrial Development Authority Revenue | | | | | | | | |
| (Academies of Math & Science Projects) | | | | | | | | |
| Series A 5.00% 7/1/51 | | | 1,000,000 | | | $ | 975,630 | |
| (ACCEL Schools Project) | | | | | | | | |
| Series A 144A 5.25% 8/1/48 # | | | 350,000 | | | | 310,089 | |
| (American Charter Schools Foundation Project) | | | | | | | | |
| 144A 6.00% 7/1/37 # | | | 250,000 | | | | 254,835 | |
| 144A 6.00% 7/1/47 # | | | 800,000 | | | | 805,064 | |
| (Doral Academy of Nevada - Fire Mesa and Red Rock | | | | | | | | |
| Campus Projects) | | | | | | | | |
| Series A 5.00% 7/15/49 | | | 375,000 | | | | 341,719 | |
| (Empower College Prep Project) | | | | | | | | |
| 144A 6.00% 7/1/49 # | | | 500,000 | | | | 480,320 | |
| (Great Hearts Arizona Projects) | | | | | | | | |
| Series A 2.25% 7/1/46 | | | 1,000,000 | | | | 609,130 | |
| Series A 2.375% 7/1/52 | | | 1,205,000 | | | | 687,465 | |
| (KIPP NYC Public Charter Schools - Macombs Facility Project) | | | | | | | | |
| Series A 4.00% 7/1/61 | | | 1,980,000 | | | | 1,542,796 | |
| (Odyssey Preparatory Academy Project) | | | | | | | | |
| Series A 144A 5.50% 7/1/52 # | | | 375,000 | | | | 355,290 | |
| (Social Bonds - Equitable School) | | | | | | | | |
| Series A 4.00% 11/1/50 | | | 1,600,000 | | | | 1,365,392 | |
| Arizona State University Revenue System | | | | | | | | |
| Series A 5.00% 7/1/43 | | | 1,000,000 | | | | 1,064,070 | |
| Maricopa County, Arizona Industrial Development Authority Education Revenue | | | | | | | | |
| (Choice Academies, Inc. Project) | | | | | | | | |
| 144A 5.75% 9/1/45 # | | | 1,250,000 | | | | 1,193,037 | |
| Maricopa County, Arizona Industrial Development Authority Revenue | | | | | | | | |
| (Arizona Autism Charter Schools Project) | | | | | | | | |
| Series A 144A 5.00% 7/1/40 # | | | 250,000 | | | | 238,485 | |
| (Creighton University Project) | | | | | | | | |
| 4.00% 7/1/50 | | | 1,000,000 | | | | 868,530 | |
| (Great Hearts Arizona Projects) | | | | | | | | |
| Series A 5.00% 7/1/52 | | | 725,000 | | | | 728,763 | |
| (Highland Prep Projects) | | | | | | | | |
| Series A 4.00% 7/1/56 | | | 2,000,000 | | | | 1,678,860 | |
| (Reid Traditional Schools Projects) | | | | | | | | |
| 5.00% 7/1/47 | | | 785,000 | | | | 767,070 | |
Schedules of investments
Delaware Tax-Free Arizona Fund
| | | Principal | | | | |
| | | amount° | | | Value (US $) | |
| Municipal Bonds (continued) | | | | | | |
| Education Revenue Bonds (continued) | | | | | | | | |
| McAllister, Arizona Academic Village Revenue | | | | | | | | |
| (Arizona State University Hassayampa Academic Village Project) | | | | | | | | |
| 5.00% 7/1/31 | | | 500,000 | | | $ | 519,895 | |
| Phoenix, Arizona Industrial Development Authority Revenue | | | | | | | | |
| (Great Hearts Academic Project) | | | | | | | | |
| 5.00% 7/1/46 | | | 1,000,000 | | | | 941,180 | |
| Pima County, Arizona Industrial Development Authority Education Revenue | | | | | | | | |
| (Edkey Charter Schools Project) | | | | | | | | |
| 144A 5.00% 7/1/55 # | | | 750,000 | | | | 635,183 | |
| University of Arizona Board of Regents | | | | | | | | |
| Series A 4.00% 6/1/44 | | | 475,000 | | | | 454,067 | |
| | | | | | | | 16,816,870 | |
| Electric Revenue Bonds — 6.28% | | | | | | | | |
| Mesa, Arizona Utility System Revenue | | | | | | | | |
| 4.00% 7/1/42 | | | 550,000 | | | | 531,597 | |
| Puerto Rico Electric Power Authority Revenue | | | | | | | | |
| Series A 5.05% 7/1/42 ‡ | | | 55,000 | | | | 15,125 | |
| Series AAA 5.25% 7/1/25 ‡ | | | 35,000 | | | | 9,625 | |
| Series WW 5.00% 7/1/28 ‡ | | | 550,000 | | | | 151,250 | |
| Series WW 5.50% 7/1/38 ‡ | | | 710,000 | | | | 195,250 | |
| Series XX 4.75% 7/1/26 ‡ | | | 35,000 | | | | 9,625 | |
| Series XX 5.25% 7/1/40 ‡ | | | 355,000 | | | | 97,625 | |
| Series XX 5.75% 7/1/36 ‡ | | | 125,000 | | | | 34,375 | |
| Series ZZ 4.75% 7/1/27 ‡ | | | 30,000 | | | | 8,250 | |
| Series ZZ 5.25% 7/1/24 ‡ | | | 45,000 | | | | 12,375 | |
| Salt River, Arizona Project Agricultural Improvement & Power District Electric System Revenue | | | | | | | | |
| Series A 5.00% 1/1/39 | | | 1,000,000 | | | | 1,053,600 | |
| (Salt River Project) | | | | | | | | |
| Series A 5.00% 1/1/50 | | | 1,500,000 | | | | 1,604,610 | |
| | | | | | | | 3,723,307 | |
| Healthcare Revenue Bonds — 23.27% | | | | | | | | |
| Arizona Health Facilities Authority Hospital System Revenue | | | | | | | | |
| (Scottsdale Lincoln Hospital Project) | | | | | | | | |
| 5.00% 12/1/42 | | | 1,000,000 | | | | 999,960 | |
| | | Principal | | | | |
| | | amount° | | | Value (US $) | |
| Municipal Bonds (continued) | | | | | | |
| Healthcare Revenue Bonds (continued) | | | | | | | | |
| Arizona Industrial Development Authority Revenue | | | | | | | | |
| (Children’s National Prince George’s County Regional Medical Center) | | | | | | | | |
| Series A 4.00% 9/1/46 | | | 2,250,000 | | | $ | 1,989,247 | |
| (Great Lakes Senior Living Communities LLC Project First Tier) | | | | | | | | |
| Series A 5.00% 1/1/54 | | | 145,000 | | | | 86,551 | |
| (Great Lakes Senior Living Communities LLC Project Fourth Tier) | | | | | | | | |
| 144A 7.75% 1/1/54 # | | | 150,000 | | | | 76,031 | |
| (Great Lakes Senior Living Communities LLC Project Second Tier) | | | | | | | | |
| Series B 5.00% 1/1/49 | | | 55,000 | | | | 28,629 | |
| Series B 5.125% 1/1/54 | | | 65,000 | | | | 32,649 | |
| (Great Lakes Senior Living Communities LLC Project Third Tier) | | | | | | | | |
| Series C 144A 5.00% 1/1/49 # | | | 500,000 | | | | 235,590 | |
| (Phoenix Children’s Hospital) | | | | | | | | |
| Series A 4.00% 2/1/50 | | | 1,000,000 | | | | 899,870 | |
| Glendale, Arizona Industrial Development Authority Revenue | | | | | | | | |
| (Glencroft Retirement Community Project) | | | | | | | | |
| 5.00% 11/15/36 | | | 150,000 | | | | 117,846 | |
| 5.25% 11/15/46 | | | 415,000 | | | | 296,771 | |
| (Royal Oaks Inspirita Pointe Project) | | | | | | | | |
| Series A 5.00% 5/15/56 | | | 1,000,000 | | | | 841,170 | |
| (Sun Health Services) | | | | | | | | |
| Series A 5.00% 11/15/48 | | | 1,000,000 | | | | 943,900 | |
| (The Beatitudes Campus Project) | | | | | | | | |
| 5.00% 11/15/45 | | | 200,000 | | | | 160,986 | |
| (The Terraces of Phoenix Project) | | | | | | | | |
| Series A 5.00% 7/1/48 | | | 275,000 | | | | 217,676 | |
| Maricopa County, Arizona Industrial Development Authority Health Facilities Revenue | | | | | | | | |
| (Banner Health) | | | | | | | | |
| Series A 4.00% 1/1/41 | | | 1,000,000 | | | | 965,390 | |
| Series F 4.00% 1/1/45 | | | 1,750,000 | | | | 1,638,998 | |
| Maricopa County, Arizona Industrial Development Authority Hospital Revenue | | | | | | | | |
| (HonorHealth) | | | | | | | | |
| Series A 3.00% 9/1/51 | | | 975,000 | | | | 674,320 | |
Schedules of investments
Delaware Tax-Free Arizona Fund
| | | Principal | | | | |
| | | amount° | | | Value (US $) | |
| Municipal Bonds (continued) | | | | | | |
| Healthcare Revenue Bonds (continued) | | | | | | | | |
| Maricopa County, Arizona Industrial Development Authority Senior Living Facility Revenue | | | | | | | | |
| (Christian Care Surprise Project) | | | | | | | | |
| 144A 6.00% 1/1/48 # | | | 405,000 | | | $ | 284,897 | |
| Puerto Rico Industrial Tourist Educational Medical & Environmental Control Facilities Financing Authority Revenue | | | | | | | | |
| (Hospital Auxilio Mutuo Obligated Group Project) | | | | | | | | |
| 4.00% 7/1/39 | | | 325,000 | | | | 290,394 | |
| 5.00% 7/1/30 | | | 105,000 | | | | 111,915 | |
| Tempe, Arizona Industrial Development Authority Revenue | | | | | | | | |
| (Mirabella at ASU Project) | | | | | | | | |
| Series A 144A 6.125% 10/1/52 # | | | 800,000 | | | | 480,800 | |
| Yavapai County, Arizona Industrial Development Authority Hospital Facility | | | | | | | | |
| (Yavapai Regional Medical Center) | | | | | | | | |
| 4.00% 8/1/43 | | | 1,500,000 | | | | 1,314,450 | |
| Series A 5.25% 8/1/33 | | | 500,000 | | | | 500,195 | |
| Yuma, Arizona Industrial Development Authority Hospital Revenue | | | | | | | | |
| (Yuma Regional Medical Center) | | | | | | | | |
| Series A 5.00% 8/1/32 | | | 295,000 | | | | 297,224 | |
| Series A 5.25% 8/1/32 | | | 300,000 | | | | 303,696 | |
| | | | | | | | 13,789,155 | |
| Industrial Development Revenue/Pollution Control | | | | | | | | |
| Revenue Bonds — 7.08% | | | | | | | | |
| Arizona Industrial Development Authority Revenue | | | | | | | | |
| (Legacy Cares, Inc. Project) | | | | | | | | |
| Series A 144A 6.00% 7/1/51 #, ‡ | | | 450,000 | | | | 45,000 | |
| Series A 144A 7.75% 7/1/50 #, ‡ | | | 285,000 | | | | 28,500 | |
| Chandler, Arizona Industrial Development Authority Revenue | | | | | | | | |
| (Intel Corporation Project) | | | | | | | | |
| 5.00% 9/1/42 (AMT) • | | | 1,000,000 | | | | 1,029,360 | |
| Children’s Trust Fund Revenue, Commonwealth of Puerto Rico | | | | | | | | |
| (Tobacco Settlement Asset-Backed) | | | | | | | | |
| Series A 8.21% 5/15/57 ^ | | | 15,000,000 | | | | 1,043,100 | |
| Salt Verde, Arizona Financial Senior Gas Revenue | | | | | | | | |
| 5.00% 12/1/37 | | | 2,000,000 | | | | 2,049,820 | |
| | | | | | | | 4,195,780 | |
| | | Principal | | | | |
| | | amount° | | | Value (US $) | |
| Municipal Bonds (continued) | | | | | | |
| Lease Revenue Bonds — 2.54% | | | | | | | | |
| Arizona Game & Fish Department & Community Beneficial Interest Certificates | | | | | | | | |
| (Administration Building Project) | | | | | | | | |
| 5.00% 7/1/32 | | | 1,000,000 | | | $ | 1,001,010 | |
| Tucson and Pima County, Arizona Industrial Development Authority Revenue | | | | | | | | |
| Series A 4.70% 7/1/43 | | | 500,000 | | | | 502,075 | |
| | | | | | | | 1,503,085 | |
| Local General Obligation Bonds — 4.06% | | | | | | | | |
| City of Goodyear, Arizona | | | | | | | | |
| 3.00% 7/1/39 | | | 750,000 | | | | 629,730 | |
| Maricopa County, Arizona High School District No. 214 Tolleson Union High School | | | | | | | | |
| (School Improvement Project) | | | | | | | | |
| Series B 4.00% 7/1/37 | | | 1,000,000 | | | | 1,005,590 | |
| Maricopa County, Arizona Unified School District No. 95 Queen Creek | | | | | | | | |
| (School Improvement Project) | | | | | | | | |
| 4.00% 7/1/35 | | | 500,000 | | | | 513,465 | |
| Pinal County, Arizona Community College District | | | | | | | | |
| 4.00% 7/1/31 | | | 250,000 | | | | 255,503 | |
| | | | | | | | 2,404,288 | |
| Special Tax Revenue Bonds — 15.84% | | | | | | | | |
| Arizona Regional Public Transportation Authority Revenue | | | | | | | | |
| (Maricopa County Public Transportation) | | | | | | | | |
| 5.25% 7/1/24 | | | 500,000 | | | | 507,830 | |
| Bullhead City, Arizona Excise Taxes Revenue | | | | | | | | |
| 2.55% 7/1/46 | | | 1,000,000 | | | | 673,450 | |
| 4.00% 7/1/52 | | | 1,035,000 | | | | 936,841 | |
| Commonwealth of Puerto Rico | | | | | | | | |
| (Restructured) | | | | | | | | |
| 2.949% 11/1/43 • | | | 1,238,703 | | | | 639,480 | |
| GDB Debt Recovery Authority of Puerto Rico Revenue | | | | | | | | |
| (Taxable) | | | | | | | | |
| 7.50% 8/20/40 | | | 2,360,762 | | | | 1,929,923 | |
| Matching Fund Special Purpose Securitization, Virgin Islands | | | | | | | | |
| Series A 5.00% 10/1/32 | | | 300,000 | | | | 301,074 | |
Schedules of investments
Delaware Tax-Free Arizona Fund
| | | Principal | | | | |
| | | amount° | | | Value (US $) | |
| Municipal Bonds (continued) | | | | | | |
| Special Tax Revenue Bonds (continued) | | | | | | | | |
| Puerto Rico Sales Tax Financing Revenue | | | | | | | | |
| (Capital Appreciation - Restructured) | | | | | | | | |
| Series A-1 4.697% 7/1/46 ^ | | | 1,180,000 | | | $ | 328,654 | |
| Series A-1 5.509% 7/1/51 ^ | | | 3,814,000 | | | | 788,277 | |
| (Restructured) | | | | | | | | |
| Series A-1 4.75% 7/1/53 | | | 2,485,000 | | | | 2,329,613 | |
| Series A-2 4.329% 7/1/40 | | | 1,000,000 | | | | 948,540 | |
| | | | | | | | 9,383,682 | |
| State General Obligation Bonds — 0.55% | | | | | | | | |
| Commonwealth of Puerto Rico | | | | | | | | |
| (Restructured) | | | | | | | | |
| Series A-1 4.00% 7/1/41 | | | 185,336 | | | | 160,269 | |
| Series A-1 4.00% 7/1/46 | | | 200,000 | | | | 166,494 | |
| | | | | | | | 326,763 | |
| Transportation Revenue Bonds — 6.58% | | | | | | | | |
| Arizona Department of Transportation State Highway Fund Revenue | | | | | | | | |
| 5.00% 7/1/35 | | | 500,000 | | | | 522,675 | |
| Phoenix, Arizona Civic Improvement Airport Revenue | | | | | | | | |
| (Junior Lien) | | | | | | | | |
| Series B 4.00% 7/1/37 (AMT) | | | 2,250,000 | | | | 2,220,727 | |
| Series B 5.00% 7/1/49 (AMT) | | | 400,000 | | | | 407,312 | |
| (Senior Lien) | | | | | | | | |
| 4.00% 7/1/48 (AMT) | | | 500,000 | | | | 457,935 | |
| Puerto Rico Highway & Transportation Authority Revenue | | | | | | | | |
| (Restructured) | | | | | | | | |
| Series A 5.00% 7/1/62 | | | 100,000 | | | | 98,625 | |
| Series C 0.000% 7/1/53 ~ | | | 305,000 | | | | 193,294 | |
| | | | | | | | 3,900,568 | |
| Water & Sewer Revenue Bonds — 4.08% | | | | | | | | |
| Central Arizona Water Conservation District | | | | | | | | |
| (Central Arizona Project) | | | | | | | | |
| 5.00% 1/1/31 | | | 600,000 | | | | 619,872 | |
| Goodyear, Arizona Water & Sewer Revenue | | | | | | | | |
| Second Series 4.00% 7/1/45 (AGM) | | | 1,000,000 | | | | 936,970 | |
| Mesa, Arizona Utility System Revenue | | | | | | | | |
| 4.00% 7/1/31 | | | 850,000 | | | | 861,135 | |
| | | | | | | | 2,417,977 | |
| Total Municipal Bonds (cost $65,580,200) | | | | | | | 58,461,475 | |
| | | Principal | | | | |
| | | amount° | | | Value (US $) | |
| Short-Term Investments — 0.67% | | | | | | |
| Variable Rate Demand Note — 0.67%¤ | | | | | | | | |
| Arizona Industrial Development Authority Revenue | | | | | | | | |
| (Mayo Clinic) Series B 3.80% 11/15/52 (SPA - Northern Trust) | | | 400,000 | | | $ | 400,000 | |
| Total Short-Term Investments (cost $400,000) | | | | | | | 400,000 | |
| Total Value of Securities—99.33% | | | | | | | | |
| (cost $65,980,200) | | | | | | $ | 58,861,475 | |
| ° | Principal amount shown is stated in USD unless noted that the security is denominated in another currency. |
| # | Security exempt from registration under Rule 144A of the Securities Act of 1933, as amended. At August 31, 2023, the aggregate value of Rule 144A securities was $5,423,121, which represents 9.15% of the Fund’s net assets. See Note 8 in “Notes to financial statements.” |
| ‡ | Non-income producing security. Security is currently in default. |
| • | Variable rate investment. Rates reset periodically. Rate shown reflects the rate in effect at August 31, 2023. For securities based on a published reference rate and spread, the reference rate and spread are indicated in their descriptions. The reference rate descriptions (i.e. SOFR01M, SOFR03M, etc.) used in this report are identical for different securities, but the underlying reference rates may differ due to the timing of the reset period. Certain variable rate securities are not based on a published reference rate and spread but are determined by the issuer or agent and are based on current market conditions, or for mortgage-backed securities, are impacted by the individual mortgages which are paying off over time. These securities do not indicate a reference rate and spread in their descriptions. |
| ^ | Zero-coupon security. The rate shown is the effective yield at the time of purchase. |
| ~ | Step-up bond that pays an initial coupon rate for the first period and then a higher coupon rate for the following periods. Stated rate in effect at August 31, 2023. |
| ¤ | Tax-exempt obligations that contain a floating or variable interest rate adjustment formula and an unconditional right of demand to receive payment of the unpaid principal balance plus accrued interest upon a short notice period (generally up to 30 days) prior to specified dates either from the issuer or by drawing on a bank letter of credit, a guarantee, or insurance issued with respect to such instrument. Each rate shown is as of August 31, 2023. |
Summary of abbreviations:
AGM – Insured by Assured Guaranty Municipal Corporation
AMT – Subject to Alternative Minimum Tax
KIPP – Knowledge is Power Program
LLC – Limited Liability Corporation
SOFR01M – Secured Overnight Financing Rate 1 Month
Schedules of investments
Delaware Tax-Free Arizona Fund
Summary of abbreviations: (continued)
SOFR03M – Secured Overnight Financing Rate 3 Month
SPA – Stand-by Purchase Agreement
USD – US Dollar
See accompanying notes, which are an integral part of the financial statements.
| Schedules of investments | |
| Delaware Tax-Free California Fund | August 31, 2023 |
| | | Principal | | | | |
| | | amount° | | | Value (US $) | |
| Municipal Bonds — 98.43% | | | | | | |
| Education Revenue Bonds — 18.75% | | | | | | | | |
| California Community College Financing Authority Student Housing Revenue | | | | | | | | |
| (Napa Valley College Project) | | | | | | | | |
| Series A 144A 5.75% 7/1/60 # | | | 1,500,000 | | | $ | 1,477,275 | |
| California Educational Facilities Authority Revenue | | | | | | | | |
| (Loma Linda University) | | | | | | | | |
| Series A 5.00% 4/1/47 | | | 1,700,000 | | | | 1,727,846 | |
| (Stanford University - Green Bonds) | | | | | | | | |
| Series V-2 2.25% 4/1/51 | | | 300,000 | | | | 187,107 | |
| (Stanford University) | | | | | | | | |
| Series U-1 5.25% 4/1/40 | | | 1,840,000 | | | | 2,168,882 | |
| Series V-1 5.00% 5/1/49 | | | 4,455,000 | | | | 5,074,512 | |
| California Enterprise Development Authority Revenue | | | | | | | | |
| (Heights Christian Schools Project) | | | | | | | | |
| Series A 144A 6.375% 6/1/63 # | | | 1,480,000 | | | | 1,427,134 | |
| California Municipal Finance Authority Revenue | | | | | | | | |
| (Bella Mente Montessori Academy Project) | | | | | | | | |
| Series A 144A 5.00% 6/1/48 # | | | 500,000 | | | | 444,750 | |
| (California Baptist University) | | | | | | | | |
| Series A 144A 5.375% 11/1/40 # | | | 1,000,000 | | | | 1,006,080 | |
| (CHF - Davis I, LLC - West Village Student Housing Project) | | | | | | | | |
| 5.00% 5/15/48 | | | 1,000,000 | | | | 997,110 | |
| (Literacy First Charter Schools Project) | | | | | | | | |
| Series A 5.00% 12/1/49 | | | 750,000 | | | | 725,798 | |
| (Southwestern Law School) | | | | | | | | |
| 4.00% 11/1/41 | | | 575,000 | | | | 511,411 | |
| (The Creative Center of Los Altos Project - Pinewood School and Oakwood School) | | | | | | | | |
| Series B 144A 4.50% 11/1/46 # | | | 500,000 | | | | 405,150 | |
| (Biola University) | | | | | | | | |
| 5.00% 10/1/39 | | | 1,000,000 | | | | 1,015,030 | |
| (Emerson College) | | | | | | | | |
| Series B 5.00% 1/1/32 | | | 1,000,000 | | | | 1,029,310 | |
| (Julian Charter School Project) | | | | | | | | |
| Series A 144A 5.625% 3/1/45 # | | | 850,000 | | | | 776,415 | |
| (Palmdale Aerospace Academy Project) | | | | | | | | |
| Series A 144A 5.00% 7/1/46 # | | | 670,000 | | | | 612,072 | |
| California School Finance Authority Revenue | | | | | | | | |
| (Aspire Public School) | | | | | | | | |
| 144A 5.00% 8/1/41 # | | | 225,000 | | | | 224,996 | |
| (Aspire Public Schools-Obligated Group) | | | | | | | | |
| Series A 144A 5.00% 8/1/45 # | | | 715,000 | | | | 700,464 | |
Schedules of investments
Delaware Tax-Free California Fund
| | | Principal | | | | |
| | | amount° | | | Value (US $) | |
| Municipal Bonds (continued) | | | | | | |
| Education Revenue Bonds (continued) | | | | | | | | |
| California School Finance Authority Revenue | | | | | | | | |
| (Aspire Public Schools-Obligated Group-Issue Number 3) | | | | | | | | |
| Series A 144A 5.00% 8/1/40 # | | | 1,000,000 | | | $ | 1,002,210 | |
| (Camino Nuevo Charter Academy - Obligated Group) | | | | | | | | |
| Series A 144A 5.25% 6/1/53 # | | | 1,000,000 | | | | 955,010 | |
| (Classical Academies Project) | | | | | | | | |
| Series A 144A 5.00% 10/1/50 # | | | 250,000 | | | | 234,780 | |
| (Encore Education Obligated Group) | | | | | | | | |
| Series A 144A 5.00% 6/1/42 # | | | 500,000 | | | | 399,545 | |
| (Escuela Popular Project) | | | | | | | | |
| 144A 6.50% 7/1/50 # | | | 250,000 | | | | 250,890 | |
| (Granada Hills Charter Obligated Group) | | | | | | | | |
| 144A 5.00% 7/1/49 # | | | 1,725,000 | | | | 1,660,312 | |
| (Green Dot Public Schools Project) | | | | | | | | |
| Series A 144A 5.00% 8/1/35 # | | | 1,000,000 | | | | 1,010,910 | |
| (Grimmway Schools - Obligated Group) | | | | | | | | |
| Series A 144A 5.00% 7/1/36 # | | | 500,000 | | | | 500,355 | |
| (Hawking Steam Charter School Project) | | | | | | | | |
| Series A 144A 5.50% 7/1/62 # | | | 775,000 | | | | 736,909 | |
| (ICEF - View Park Elementary & Middle Schools) | | | | | | | | |
| Series A 5.625% 10/1/34 | | | 575,000 | | | | 576,535 | |
| (John Adams Academies - Obligated Group) | | | | | | | | |
| Series A 144A 5.00% 7/1/52 # | | | 1,000,000 | | | | 887,250 | |
| (KIPP LA Projects) | | | | | | | | |
| Series A 144A 5.125% 7/1/44 # | | | 1,000,000 | | | | 1,003,050 | |
| (KIPP SoCal Projects) | | | | | | | | |
| Series A 144A 5.00% 7/1/49 # | | | 1,000,000 | | | | 1,002,090 | |
| (Partnerships To Uplift Communities Project) | | | | | | | | |
| 144A 5.25% 8/1/38 # | | | 500,000 | | | | 494,880 | |
| 144A 5.50% 8/1/47 # | | | 525,000 | | | | 516,737 | |
| (Stem Preparatory Schools - Obligated Group) | | | | | | | | |
| Series A 144A 5.00% 6/1/43 # | | | 280,000 | | | | 270,589 | |
| Series A 144A 5.125% 6/1/53 # | | | 500,000 | | | | 474,025 | |
| Series A 144A 5.375% 5/1/63 # | | | 1,000,000 | | | | 958,050 | |
| California State University Systemwide Revenue | | | | | | | | |
| Series A 3.00% 11/1/52 | | | 2,400,000 | | | | 1,743,744 | |
| California Statewide Communities Development Authority Revenue | | | | | | | | |
| (California Baptist University) | | | | | | | | |
| Series A 144A 6.125% 11/1/33 # | | | 750,000 | | | | 752,280 | |
| Regents of the University of California General Revenue | | | | | | | | |
| Series BE 4.00% 5/15/50 | | | 1,500,000 | | | | 1,469,205 | |
| | | Principal | | | | |
| | | amount° | | | Value (US $) | |
| Municipal Bonds (continued) | | | | | | |
| Education Revenue Bonds (continued) | | | | | | | | |
| Regents of the University of California Limited Project Revenue | | | | | | | | |
| Series Q 3.00% 5/15/51 | | | 1,000,000 | | | $ | 740,930 | |
| | | | | | | | 38,151,628 | |
| Electric Revenue Bonds — 3.51% | | | | | | | | |
| California Community Choice Financing Authority Revenue | | | | | | | | |
| (Clean Energy Project) | | | | | | | | |
| Series C 5.25% 1/1/54 • | | | 2,000,000 | | | | 2,074,420 | |
| Guam Power Authority Revenue | | | | | | | | |
| (Tax-Exempt Forward Delivery) | | | | | | | | |
| Series A 5.00% 10/1/41 | | | 970,000 | | | | 989,225 | |
| Los Angeles, California Department of Water & Power Revenue | | | | | | | | |
| (Power System) | | | | | | | | |
| Series A 5.00% 7/1/42 | | | 1,000,000 | | | | 1,041,460 | |
| Series D 5.00% 7/1/26 | | | 2,000,000 | | | | 2,110,700 | |
| Puerto Rico Electric Power Authority Revenue | | | | | | | | |
| Series A 5.00% 7/1/42 ‡ | | | 350,000 | | | | 96,250 | |
| Series A 5.05% 7/1/42 ‡ | | | 70,000 | | | | 19,250 | |
| Series A 6.75% 7/1/36 ‡ | | | 185,000 | | | | 50,875 | |
| Series AAA 5.25% 7/1/25 ‡ | | | 40,000 | | | | 11,000 | |
| Series CCC 5.25% 7/1/27 ‡ | | | 325,000 | | | | 89,375 | |
| Series TT 5.00% 7/1/32 ‡ | | | 340,000 | | | | 93,500 | |
| Series WW 5.00% 7/1/28 ‡ | | | 470,000 | | | | 129,250 | |
| Series WW 5.25% 7/1/33 ‡ | | | 335,000 | | | | 92,125 | |
| Series WW 5.50% 7/1/38 ‡ | | | 730,000 | | | | 200,750 | |
| Series XX 4.75% 7/1/26 ‡ | | | 45,000 | | | | 12,375 | |
| Series XX 5.25% 7/1/40 ‡ | | | 230,000 | | | | 63,250 | |
| Series XX 5.75% 7/1/36 ‡ | | | 150,000 | | | | 41,250 | |
| Series ZZ 4.75% 7/1/27 ‡ | | | 35,000 | | | | 9,625 | |
| Series ZZ 5.25% 7/1/24 ‡ | | | 55,000 | | | | 15,125 | |
| | | | | | | | 7,139,805 | |
| Healthcare Revenue Bonds — 13.20% | | | | | | | | |
| California Educational Facilities Authority Revenue | | | | | | | | |
| (Stanford University) | | | | | | | | |
| Series V-2 5.00% 4/1/51 | | | 500,000 | | | | 569,795 | |
| California Health Facilities Financing Authority Revenue | | | | | | | | |
| (Cedars-Sinai Health System) | | | | | | | | |
| Series A 3.00% 8/15/51 | | | 1,900,000 | | | | 1,420,877 | |
| Series A 3.00% 8/15/51 (BAM) | | | 1,910,000 | | | | 1,468,274 | |
Schedules of investments
Delaware Tax-Free California Fund
| | | Principal | | | | |
| | | amount° | | | Value (US $) | |
| Municipal Bonds (continued) | | | | | | |
| Healthcare Revenue Bonds (continued) | | | | | | | | |
| California Health Facilities Financing Authority Revenue | | | | | | | | |
| (Children’s Hospital Los Angeles) | | | | | | | | |
| Series A 5.00% 8/15/47 | | | 500,000 | | | $ | 500,385 | |
| (Children’s Hospital of Orange County) | | | | | | | | |
| Series A 2.125% 11/1/41 | | | 2,500,000 | | | | 1,652,825 | |
| (CommonSpirit Health) | | | | | | | | |
| Series A 4.00% 4/1/45 | | | 1,280,000 | | | | 1,157,363 | |
| Series A 4.00% 4/1/49 | | | 1,000,000 | | | | 881,540 | |
| (Kaiser Permanente) | | | | | | | | |
| Subordinate Series A-2 5.00% 11/1/47 | | | 2,500,000 | | | | 2,730,575 | |
| Subordinate Series A-2 4.00% 11/1/44 | | | 1,005,000 | | | | 988,257 | |
| (Lucile Salter Packard Children’s Hospital At Stanford) | | | | | | | | |
| Series A 4.00% 5/15/51 | | | 1,000,000 | | | | 929,990 | |
| California Municipal Finance Authority Revenue | | | | | | | | |
| (Community Medical Centers) | | | | | | | | |
| Series A 5.00% 2/1/47 | | | 1,000,000 | | | | 1,010,450 | |
| (Goodwill Industry of Sacramento Valley & Northern Nevada Project) | | | | | | | | |
| 5.00% 1/1/35 | | | 635,000 | | | | 537,693 | |
| (Humangood California Obligated Group) | | | | | | | | |
| Series A 4.00% 10/1/28 | | | 290,000 | | | | 290,403 | |
| (Northbay Healthcare Group) | | | | | | | | |
| Series A 5.25% 11/1/47 | | | 500,000 | | | | 456,165 | |
| (Palomar Health Certificates) | | | | | | | | |
| Series A 5.25% 11/1/52 (AGM) | | | 500,000 | | | | 534,140 | |
| California Municipal Finance Authority Senior Living Revenue | | | | | | | | |
| (Mt. San Antonio Gardens Project) | | | | | | | | |
| Series A 4.00% 11/15/52 | | | 750,000 | | | | 542,018 | |
| Series A 4.00% 11/15/56 | | | 1,075,000 | | | | 758,692 | |
| California Public Finance Authority Senior Living Revenue | | | | | | | | |
| (Enso Village Project - Green Bonds) | | | | | | | | |
| Series A 144A 5.00% 11/15/51 # | | | 500,000 | | | | 436,635 | |
| California Statewide Communities Development Authority Revenue | | | | | | | | |
| (Adventist Health System/West) | | | | | | | | |
| Series A 4.00% 3/1/48 | | | 1,000,000 | | | | 853,170 | |
| (Emanate Health) | | | | | | | | |
| Series A 4.00% 4/1/45 | | | 825,000 | | | | 758,554 | |
| (Huntington Memorial Hospital) | | | | | | | | |
| 4.00% 7/1/48 | | | 500,000 | | | | 451,270 | |
| (John Muir Health) | | | | | | | | |
| Series A 5.00% 8/15/51 | | | 1,500,000 | | | | 1,524,765 | |
| | | Principal | | | | |
| | | amount° | | | Value (US $) | |
| Municipal Bonds (continued) | | | | | | |
| Healthcare Revenue Bonds (continued) | | | | | | | | |
| California Statewide Communities Development Authority Revenue | | | | | | | | |
| (Marin General Hospital - Green Bonds) | | | | | | | | |
| Series A 4.00% 8/1/45 | | | 500,000 | | | $ | 422,910 | |
| (Redlands Community Hospital) | | | | | | | | |
| 5.00% 10/1/46 | | | 1,000,000 | | | | 1,004,900 | |
| (Enloe Medical Center) | | | | | | | | |
| Series A 5.25% 8/15/52 (AGM) | | | 2,000,000 | | | | 2,141,700 | |
| (Front Porch Communities and Services) | | | | | | | | |
| 4.00% 4/1/51 | | | 1,000,000 | | | | 877,600 | |
| Palomar Health, California | | | | | | | | |
| 5.00% 11/1/47 (AGM) | | | 500,000 | | | | 512,830 | |
| Puerto Rico Industrial Tourist Educational Medical & Environmental Control Facilities Financing Authority Revenue | | | | | | | | |
| (Hospital Auxilio Mutuo Obligated Group Project) | | | | | | | | |
| 5.00% 7/1/30 | | | 445,000 | | | | 474,308 | |
| 5.00% 7/1/32 | | | 900,000 | | | | 964,971 | |
| | | | | | | | 26,853,055 | |
| Housing Revenue Bonds — 3.43% | | | | | | | | |
| California Housing Finance Agency Revenue | | | | | | | | |
| Series 2019-2 Class A 4.00% 3/20/33 | | | 470,421 | | | | 454,210 | |
| CSCDA Community Improvement Authority Essential Housing Revenue | | | | | | | | |
| (Jefferson-Anaheim) | | | | | | | | |
| Series A-2 144A 3.125% 8/1/56 # | | | 1,500,000 | | | | 1,015,470 | |
| (Pasadena Portfolio) | | | | | | | | |
| Series A-2 144A 3.00% 12/1/56 # | | | 3,510,000 | | | | 2,310,703 | |
| Independent Cities, California Finance Authority Mobile Home Park Revenue | | | | | | | | |
| (Pillar Ridge) | | | | | | | | |
| Series A 5.25% 5/15/44 | | | 1,000,000 | | | | 1,004,770 | |
| Series A 5.25% 5/15/49 | | | 1,200,000 | | | | 1,205,124 | |
| Los Angeles, California Housing Authority Revenue | | | | | | | | |
| (Union Portfolio Project) | | | | | | | | |
| Series A 4.00% 6/1/30 | | | 135,000 | | | | 138,429 | |
| Santa Clara County, California Multifamily Housing Authority Revenue | | | | | | | | |
| (RiverTown Apartments Project) | | | | | | | | |
| Series A 5.85% 8/1/31 (AMT) | | | 845,000 | | | | 846,471 | |
| | | | | | | | 6,975,177 | |
Schedules of investments
Delaware Tax-Free California Fund
| | | Principal | | | | |
| | | amount° | | | Value (US $) | |
| Municipal Bonds (continued) | | | | | | |
| Industrial Development Revenue/Pollution Control | | | | | | | | |
| Revenue Bonds — 12.01% | | | | | | | | |
| California Community Choice Financing Authority Revenue | | | | | | | | |
| (Clean Energy Project- Green Bonds) | | | | | | | | |
| Series A-1 5.00% 12/1/53 • | | | 1,500,000 | | | $ | 1,545,480 | |
| Series D 5.50% 5/1/54 • | | | 2,000,000 | | | | 2,099,860 | |
| California Infrastructure & Economic Development Bank Revenue | | | | | | | | |
| (Brightline West Passenger Rail Project) | | | | | | | | |
| 144A 8.08% 1/1/50 (AMT) #, • | | | 1,250,000 | | | | 1,250,188 | |
| California M-S-R Energy Authority Revenue | | | | | | | | |
| Series B 6.50% 11/1/39 | | | 750,000 | | | | 891,180 | |
| Series C 6.50% 11/1/39 | | | 1,905,000 | | | | 2,263,597 | |
| California Pollution Control Financing Authority Revenue | | | | | | | | |
| (Calplant I Project - Green Bonds) | | | | | | | | |
| 144A 8.00% 7/1/39 (AMT) #, ‡ | | | 300,000 | | | | 15,000 | |
| (Poseidon Resources (ChannelSide) LP Desalination Project) | | | | | | | | |
| 144A 5.00% 11/21/45 (AMT) # | | | 940,000 | | | | 917,750 | |
| (Waste Management Project) | | | | | | | | |
| Series A1 3.375% 7/1/25 (AMT) | | | 300,000 | | | | 295,689 | |
| Children’s Trust Fund Revenue, Commonwealth of Puerto Rico | | | | | | | | |
| (Tobacco Settlement Asset-Backed) | | | | | | | | |
| Series A 8.21% 5/15/57 ^ | | | 47,000,000 | | | | 3,268,380 | |
| Golden State, California Tobacco Securitization Settlement Revenue | | | | | | | | |
| (Capital Appreciation) | | | | | | | | |
| Subordinate Series B-2 0.915% 6/1/66 ^ | | | 14,450,000 | | | | 1,436,908 | |
| (Tobacco Settlement Asset-Backed) | | | | | | | | |
| Series A-1 5.00% 6/1/51 | | | 3,500,000 | | | | 3,636,220 | |
| Inland, California Empire Tobacco Securitization Revenue | | | | | | | | |
| (Capital Appreciation Turbo Asset-Backed) | | | | | | | | |
| Series E 144A 0.935% 6/1/57 #, ^ | | | 8,500,000 | | | | 575,875 | |
| Series F 144A 1.386% 6/1/57 #, ^ | | | 29,440,000 | | | | 1,626,560 | |
| Tobacco Securitization Authority of Northern California | | | | | | | | |
| (Sacramento County) | | | | | | | | |
| Series A Class 1 Senior 4.00% 6/1/49 | | | 1,000,000 | | | | 896,050 | |
| Tobacco Securitization Authority of Southern California | | | | | | | | |
| (San Diego County) | | | | | | | | |
| Capital Appreciation Second Subordinate | | | | | | | | |
| Series C 0.603% 6/1/46 ^ | | | 16,770,000 | | | | 2,988,246 | |
| | | Principal | | | | |
| | | amount° | | | Value (US $) | |
| Municipal Bonds (continued) | | | | | | |
| Industrial Development Revenue/Pollution Control | | | | | | | | |
| Revenue Bonds (continued) | | | | | | | | |
| Tobacco Securitization Authority of Southern California | | | | | | | | |
| (San Diego County) | | | | | | | | |
| Capital Appreciation Third Subordinate | | | | | | | | |
| Series D 0.317% 6/1/46 ^ | | | 4,965,000 | | | $ | 734,324 | |
| | | | | | | | 24,441,307 | |
| Lease Revenue Bonds — 4.89% | | | | | | | | |
| California Infrastructure & Economic Development Bank Revenue | | | | | | | | |
| (Academy of Motion Picture Arts & Sciences Obligated Group) | | | | | | | | |
| Series A 5.00% 11/1/41 | | | 1,000,000 | | | | 1,002,340 | |
| California Municipal Finance Authority Revenue | | | | | | | | |
| (Orange County Civic Center Infrastructure Improvement Program - Phase II) | | | | | | | | |
| Series A 5.00% 6/1/43 | | | 750,000 | | | | 785,115 | |
| California State Public Works Board Revenue | | | | | | | | |
| Series E 3.00% 10/1/36 (AGM) | | | 1,525,000 | | | | 1,344,043 | |
| (Various Capital Projects) | | | | | | | | |
| Series I 5.50% 11/1/30 | | | 1,000,000 | | | | 1,002,950 | |
| (Green Bonds) | | | | | | | | |
| Series D 4.00% 5/1/47 | | | 2,520,000 | | | | 2,394,958 | |
| Irvine, California Facilities Financing Authority Revenue | | | | | | | | |
| (Gateway Preserve Land Acquisition Project) | | | | | | | | |
| 4.25% 5/1/53 | | | 2,500,000 | | | | 2,484,775 | |
| Oceanside, California Public Financing Authority Revenue | | | | | | | | |
| (EL Corazon Aquatics Center Project) | | | | | | | | |
| 4.00% 11/1/49 | | | 1,000,000 | | | | 925,560 | |
| | | | | | | | 9,939,741 | |
| Local General Obligation Bonds — 1.84% | | | | | | | | |
| Anaheim, California School District Capital Appreciation | | | | | | | | |
| Election of 2002 | | | | | | | | |
| 5.00% 8/1/25 (NATL) ^ | | | 1,000,000 | | | | 934,270 | |
| Long Beach, California Community College District | | | | | | | | |
| Series D 3.00% 8/1/38 | | | 1,250,000 | | | | 1,065,500 | |
| Palomar Health, California | | | | | | | | |
| Series B 4.00% 8/1/37 | | | 1,000,000 | | | | 962,910 | |
| San Bernardino County, California Oro Grande Elementary School District | | | | | | | | |
| 4.00% 9/15/32 | | | 300,000 | | | | 285,537 | |
Schedules of investments
Delaware Tax-Free California Fund
| | | Principal | | | | |
| | | amount° | | | Value (US $) | |
| Municipal Bonds (continued) | | | | | | |
| Local General Obligation Bonds (continued) | | | | | | | | |
| San Francisco Bay Area, California Rapid Transit District Election of 2016 | | | | | | | | |
| (Green Bonds) | | | | | | | | |
| Series B-1 4.00% 8/1/44 | | | 500,000 | | | $ | 486,170 | |
| | | | | | | | 3,734,387 | |
| Pre-Refunded Bonds — 2.84% | | | | | | | | |
| Bay Area, California Toll Authority | | | | | | | | |
| Series S-H 5.00% 4/1/44-29 § | | | 1,000,000 | | | | 1,119,510 | |
| California Health Facilities Financing Authority Revenue | | | | | | | | |
| (Sutter Health) | | | | | | | | |
| Series A 5.00% 8/15/43-25 § | | | 1,000,000 | | | | 1,037,760 | |
| California School Finance Authority Revenue | | | | | | | | |
| (Partnerships to Uplift Communities Valley Project) | | | | | | | | |
| Series A 144A 6.75% 8/1/44-24 #, § | | | 1,000,000 | | | | 1,012,160 | |
| Fresno, California Unified School District Election of 2016 | | | | | | | | |
| Series A 5.00% 8/1/41-26 § | | | 500,000 | | | | 528,690 | |
| Golden State, California Tobacco Securitization Settlement Revenue | | | | | | | | |
| (Enhanced Asset-Backed) | | | | | | | | |
| Series A 5.00% 6/1/45-25 § | | | 1,000,000 | | | | 1,035,190 | |
| New Haven, California Unified School District Election of 2014 | | | | | | | | |
| Series A 5.00% 8/1/40-25 § | | | 1,000,000 | | | | 1,035,890 | |
| | | | | | | | 5,769,200 | |
| Special Tax Revenue Bonds — 15.10% | | | | | | | | |
| California State Public Works Board Revenue | | | | | | | | |
| (Various Capital Projects) | | | | | | | | |
| Series B 4.00% 5/1/39 | | | 1,555,000 | | | | 1,568,217 | |
| Series B 4.00% 5/1/46 | | | 1,000,000 | | | | 954,980 | |
| Commonwealth of Puerto Rico | | | | | | | | |
| (Restructured) | | | | | | | | |
| 3.371% 11/1/43 • | | | 2,504,562 | | | | 1,292,980 | |
| GDB Debt Recovery Authority of Puerto Rico Revenue | | | | | | | | |
| 7.50% 8/20/40 | | | 7,342,826 | | | | 6,002,760 | |
| Irvine, California Community Facilities District | | | | | | | | |
| (Great Park) | | | | | | | | |
| 4.00% 9/1/58 (BAM) | | | 750,000 | | | | 706,837 | |
| 5.25% 9/1/53 (BAM) | | | 1,000,000 | | | | 1,102,060 | |
| | | Principal | | | | |
| | | amount° | | | Value (US $) | |
| Municipal Bonds (continued) | | | | | | |
| Special Tax Revenue Bonds (continued) | | | | | | | | |
| Irvine, California Facilities Financing Authority Revenue | | | | | | | | |
| (Irvine Great Park Infrastructure Project) | | | | | | | | |
| Series A 5.00% 9/1/48 (BAM) | | | 1,000,000 | | | $ | 1,081,690 | |
| Matching Fund Special Purpose Securitization, Virgin Islands | | | | | | | | |
| Series A 5.00% 10/1/32 | | | 500,000 | | | | 501,790 | |
| Newport Beach, California | | | | | | | | |
| Series A 5.00% 9/2/43 | | | 650,000 | | | | 667,206 | |
| Puerto Rico Sales Tax Financing Revenue | | | | | | | | |
| (Restructured) | | | | | | | | |
| Series A-1 4.75% 7/1/53 | | | 2,780,000 | | | | 2,606,167 | |
| Series A-1 4.863% 7/1/51 ^ | | | 28,678,000 | | | | 5,927,169 | |
| Series A-1 5.00% 7/1/58 | | | 1,975,000 | | | | 1,916,540 | |
| Series A-1 5.634% 7/1/46 ^ | | | 10,100,000 | | | | 2,813,052 | |
| Series A-2 4.329% 7/1/40 | | | 1,595,000 | | | | 1,513,817 | |
| Sacramento County, California Transient Occupancy Tax Revenue | | | | | | | | |
| (Convention Center Complex) | | | | | | | | |
| Senior Series A 5.00% 6/1/38 | | | 500,000 | | | | 526,305 | |
| Senior Series A 5.00% 6/1/48 | | | 1,000,000 | | | | 1,035,100 | |
| Yucaipa, California Special Tax Community Facilities District No. 98-1 Revenue | | | | | | | | |
| (Chapman Heights) | | | | | | | | |
| 5.375% 9/1/30 | | | 500,000 | | | | 501,765 | |
| | | | | | | | 30,718,435 | |
| State General Obligation Bonds — 7.78% | | | | | | | | |
| Commonwealth of Puerto Rico | | | | | | | | |
| (Restructured) | | | | | | | | |
| Series A-1 4.00% 7/1/41 | | | 1,785,743 | | | | 1,544,221 | |
| Series A-1 4.00% 7/1/46 | | | 1,550,000 | | | | 1,290,329 | |
| State of California | | | | | | | | |
| (Various Purpose) | | | | | | | | |
| 3.00% 3/1/46 | | | 3,000,000 | | | | 2,395,200 | |
| 4.00% 10/1/36 | | | 500,000 | | | | 513,275 | |
| 4.00% 9/1/42 | | | 1,750,000 | | | | 1,751,312 | |
| 5.00% 9/1/31 | | | 1,000,000 | | | | 1,001,780 | |
| 5.00% 4/1/32 | | | 2,520,000 | | | | 2,930,735 | |
| 5.00% 8/1/46 | | | 1,000,000 | | | | 1,037,060 | |
| 5.25% 10/1/45 | | | 3,000,000 | | | | 3,362,730 | |
| | | | | | | | 15,826,642 | |
Schedules of investments
Delaware Tax-Free California Fund
| | | Principal | | | | |
| | | amount° | | | Value (US $) | |
| Municipal Bonds (continued) | | | | | | |
| Transportation Revenue Bonds — 13.29% | | | | | | | | |
| California Municipal Finance Authority Senior Lien Revenue | | | | | | | | |
| (LINXS APM Project) | | | | | | | | |
| Series A 4.00% 12/31/47 (AMT) | | | 1,750,000 | | | $ | 1,492,628 | |
| Series A 5.00% 12/31/43 (AMT) | | | 1,995,000 | | | | 1,996,077 | |
| Series A 5.00% 12/31/47 (AMT) | | | 615,000 | | | | 607,515 | |
| Foothill-Eastern, California Transportation Corridor Agency Revenue | | | | | | | | |
| Series A 4.00% 1/15/46 | | | 2,000,000 | | | | 1,877,840 | |
| Series B-2 3.50% 1/15/53 (AGM) | | | 500,000 | | | | 416,780 | |
| Series C 4.00% 1/15/43 | | | 2,275,000 | | | | 2,158,429 | |
| Long Beach, California Marina Revenue | | | | | | | | |
| (Alamitos Bay Marina Project) | | | | | | | | |
| 5.00% 5/15/45 | | | 500,000 | | | | 500,480 | |
| Los Angeles, California Department of Airports Revenue | | | | | | | | |
| Series A 5.00% 5/15/33 (AMT) | | | 1,390,000 | | | | 1,521,980 | |
| Series B 5.00% 5/15/46 (AMT) | | | 300,000 | | | | 303,420 | |
| Series D 4.00% 5/15/41 (AMT) | | | 3,000,000 | | | | 2,871,810 | |
| Series D 5.00% 5/15/36 (AMT) | | | 1,000,000 | | | | 1,015,070 | |
| Series F 4.00% 5/15/49 (AMT) | | | 2,000,000 | | | | 1,821,000 | |
| Series H 4.00% 5/15/47 (AMT) | | | 1,500,000 | | | | 1,389,825 | |
| Port Authority of Guam Revenue | | | | | | | | |
| (Governmental) | | | | | | | | |
| Series A 5.00% 7/1/48 | | | 375,000 | | | | 377,209 | |
| Puerto Rico Highway & Transportation Authority Revenue | | | | | | | | |
| (Restructured) | | | | | | | | |
| Series A 5.00% 7/1/62 | | | 500,000 | | | | 493,125 | |
| Sacramento County, California Airport System Revenue | | | | | | | | |
| Series C 5.00% 7/1/39 (AMT) | | | 500,000 | | | | 514,190 | |
| Subordinate Series B 5.00% 7/1/41 | | | 500,000 | | | | 515,775 | |
| San Diego County, California Redevelopment Agency Revenue | | | | | | | | |
| (Centre City Redevelopment Project) | | | | | | | | |
| Series A 6.40% 9/1/25 | | | 475,000 | | | | 476,083 | |
| San Diego County, California Regional Airport Authority Revenue | | | | | | | | |
| Series A 4.00% 7/1/56 | | | 2,000,000 | | | | 1,835,540 | |
| Series B 4.00% 7/1/56 (AMT) (BAM) | | | 690,000 | | | | 606,386 | |
| Series B 5.00% 7/1/51 (AMT) | | | 1,500,000 | | | | 1,528,530 | |
| | | Principal | | | | |
| | | amount° | | | Value (US $) | |
| Municipal Bonds (continued) | | | | | | |
| Transportation Revenue Bonds (continued) | | | | | | | | |
| San Francisco City & County, California Airports Commission Revenue | | | | | | | | |
| (San Francisco International Airport) Second Series A 5.00% 5/1/34 (AMT) | | | 1,000,000 | | | $ | 1,069,510 | |
| San Jose, California Airport Revenue | | | | | | | | |
| Series B 5.00% 3/1/36 | | | 575,000 | | | | 607,982 | |
| Series B 5.00% 3/1/42 | | | 1,000,000 | | | | 1,036,540 | |
| | | | | | | | 27,033,724 | |
| Water & Sewer Revenue Bonds — 1.79% | | | | | | | | |
| Arvin-Edison, California Water Storage District Revenue | | | | | | | | |
| 4.00% 5/1/40 | | | 315,000 | | | | 301,950 | |
| California Pollution Control Financing Authority Water Furnishing Revenue Refunding Bonds | | | | | | | | |
| (San Diego County Water Authority Desalination Project Pipeline) | | | | | | | | |
| 144A 5.00% 11/21/45 # | | | 250,000 | | | | 250,792 | |
| Irvine, California Facilities Financing Authority Revenue | | | | | | | | |
| (Irvine Great Park Infrastructure Project) | | | | | | | | |
| Series A 4.00% 9/1/58 (BAM) | | | 1,000,000 | | | | 937,320 | |
| San Diego County, California Water Authority Financing Agency Revenue | | | | | | | | |
| Series A 5.00% 5/1/52 | | | 2,000,000 | | | | 2,156,600 | |
| | | | | | | | 3,646,662 | |
| Total Municipal Bonds (cost $210,990,691) | | | | | | | 200,229,763 | |
| | | | | | | | | |
| Short-Term Investments — 1.35% | | | | | | | | |
| Variable Rate Demand Note — 1.35%¤ | | | | | | | | |
| Los Angeles, California Department of Water & Power Revenue | | | | | | | | |
| Subordinate Series A-2 2.75% 7/1/45 | | | | | | | | |
| (SPA - Barclays Bank) | | | 2,750,000 | | | | 2,750,000 | |
| Total Short-Term Investments (cost $2,750,000) | | | | | | | 2,750,000 | |
| Total Value of Securities—99.78% | | | | | | | | |
| (cost $213,740,691) | | | | | | $ | 202,979,763 | |
| ° | Principal amount shown is stated in USD unless noted that the security is denominated in another currency. |
| # | Security exempt from registration under Rule 144A of the Securities Act of 1933, as amended. At August 31, 2023, the aggregate value of Rule 144A securities was $29,595,341, which represents 14.55% of the Fund’s net assets. See Note 8 in “Notes to financial statements.” |
Schedules of investments
Delaware Tax-Free California Fund
| • | Variable rate investment. Rates reset periodically. Rate shown reflects the rate in effect at August 31, 2023. For securities based on a published reference rate and spread, the reference rate and spread are indicated in their descriptions. The reference rate descriptions (i.e. SOFR01M, SOFR03M, etc.) used in this report are identical for different securities, but the underlying reference rates may differ due to the timing of the reset period. Certain variable rate securities are not based on a published reference rate and spread but are determined by the issuer or agent and are based on current market conditions, or for mortgage-backed securities, are impacted by the individual mortgages which are paying off over time. These securities do not indicate a reference rate and spread in their descriptions. |
| ‡ | Non-income producing security. Security is currently in default. |
| ^ | Zero-coupon security. The rate shown is the effective yield at the time of purchase. |
| § | Pre-refunded bonds. Municipal bonds that are generally backed or secured by US Treasury bonds. For pre-refunded bonds, the stated maturity is followed by the year in which the bond will be pre-refunded. See Note 8 in “Notes to financial statements.” |
| ¤ | Tax-exempt obligations that contain a floating or variable interest rate adjustment formula and an unconditional right of demand to receive payment of the unpaid principal balance plus accrued interest upon a short notice period (generally up to 30 days) prior to specified dates either from the issuer or by drawing on a bank letter of credit, a guarantee, or insurance issued with respect to such instrument. Each rate shown is as of August 31, 2023. |
Summary of abbreviations:
AGM – Insured by Assured Guaranty Municipal Corporation
AMT – Subject to Alternative Minimum Tax
BAM – Insured by Build America Mutual Assurance
CHF – Collegiate Housing Foundation
CSCDA – California Statewide Communities Development Authority
ICEF – Inner City Education Foundation
KIPP – Knowledge is Power Program
LLC – Limited Liability Corporation
NATL – Insured by National Public Finance Guarantee Corporation
SOFR01M – Secured Overnight Financing Rate 1 Month
SOFR03M – Secured Overnight Financing Rate 3 Month
SPA – Stand-by Purchase Agreement
USD – US Dollar
See accompanying notes, which are an integral part of the financial statements.
| Schedules of investments | |
| Delaware Tax-Free Colorado Fund | August 31, 2023 |
| | | Principal | | | | |
| | | amount° | | | Value (US $) | |
| Municipal Bonds — 98.52% | | | | | | |
| Education Revenue Bonds — 13.64% | | | | | | | | |
| Board of Governors of the Colorado State University System Enterprise Revenue | | | | | | | | |
| Series A 5.00% 3/1/43 | | | 4,990,000 | | | $ | 5,597,632 | |
| Colorado Educational & Cultural Facilities Authority Revenue | | | | | | | | |
| (Loveland Classical Schools Project) | | | | | | | | |
| 144A 5.00% 7/1/36 # | | | 1,250,000 | | | | 1,222,725 | |
| (Science Technology Engineering and Math School Project) | | | | | | | | |
| 5.00% 11/1/54 | | | 1,500,000 | | | | 1,355,625 | |
| (Alexander Dawson School-Nevada Project) | | | | | | | | |
| 5.00% 5/15/29 | | | 1,230,000 | | | | 1,265,941 | |
| (Aspen View Academy Project) | | | | | | | | |
| 4.00% 5/1/51 | | | 500,000 | | | | 387,805 | |
| 4.00% 5/1/61 | | | 750,000 | | | | 554,093 | |
| (Charter School - Aspen Ridge School Project) | | | | | | | | |
| Series A 144A 5.00% 7/1/36 # | | | 500,000 | | | | 481,180 | |
| Series A 144A 5.25% 7/1/46 # | | | 1,350,000 | | | | 1,266,313 | |
| (Charter School - Skyview Academy Project) | | | | | | | | |
| 144A 5.50% 7/1/49 # | | | 870,000 | | | | 848,842 | |
| (Charter School Project) | | | | | | | | |
| 5.00% 7/15/37 | | | 1,150,000 | | | | 1,151,000 | |
| (Community Leadership Academy, Inc. Second Campus Project) | | | | | | | | |
| 7.45% 8/1/48 | | | 1,000,000 | | | | 1,000,770 | |
| (Global Village Academy - Northglenn Project) | | | | | | | | |
| 144A 5.00% 12/1/50 # | | | 950,000 | | | | 797,610 | |
| 144A 5.00% 12/1/55 # | | | 1,000,000 | | | | 823,840 | |
| (Liberty Common Charter School Project) | | | | | | | | |
| Series A 5.00% 1/15/39 | | | 1,000,000 | | | | 1,000,230 | |
| (Littleton Preparatory Charter School Project) | | | | | | | | |
| 5.00% 12/1/33 | | | 450,000 | | | | 450,041 | |
| 5.00% 12/1/42 | | | 540,000 | | | | 513,686 | |
| (Loveland Classical Schools Project) | | | | | | | | |
| 144A 5.00% 7/1/46 # | | | 500,000 | | | | 453,630 | |
| (Pinnacle Charter School Project) | | | | | | | | |
| 5.00% 6/1/26 | | | 700,000 | | | | 705,019 | |
| (Science Technology Engineering and Math School Project) | | | | | | | | |
| 5.00% 11/1/44 | | | 890,000 | | | | 830,183 | |
| (Skyview Academy Project) | | | | | | | | |
| 144A 5.375% 7/1/44 # | | | 860,000 | | | | 841,476 | |
Schedules of investments
Delaware Tax-Free Colorado Fund
| | | Principal | | | | |
| | | amount° | | | Value (US $) | |
| Municipal Bonds (continued) | | | | | | |
| Education Revenue Bonds (continued) | | | | | | | | |
| Colorado Educational & Cultural Facilities Authority Revenue | | | | | | | | |
| (University of Denver Project) | | | | | | | | |
| Series A 4.00% 3/1/35 | | | 400,000 | | | $ | 399,092 | |
| Series A 4.00% 3/1/36 | | | 550,000 | | | | 540,837 | |
| (University of Lab Charter School) | | | | | | | | |
| 144A 5.00% 12/15/45 # | | | 500,000 | | | | 501,180 | |
| (Vail Mountain School Project) | | | | | | | | |
| 4.00% 5/1/46 | | | 80,000 | | | | 65,702 | |
| 5.00% 5/1/31 | | | 1,000,000 | | | | 1,015,630 | |
| Colorado Mesa University Enterprise Revenue | | | | | | | | |
| Series B 5.00% 5/15/44 | | | 1,000,000 | | | | 1,043,070 | |
| University of Colorado | | | | | | | | |
| (University Enterprise Refunding Revenue) | | | | | | | | |
| Series C-4 4.00% 6/1/51 | | | 4,250,000 | | | | 3,903,370 | |
| | | | | | | | 29,016,522 | |
| Electric Revenue Bonds — 5.14% | | | | | | | | |
| Colorado Utilities System Refunding Revenue | | | | | | | | |
| Series A 4.00% 11/15/50 | | | 2,035,000 | | | | 1,917,458 | |
| Guam Power Authority Revenue | | | | | | | | |
| (Tax-Exempt Forward Delivery) | | | | | | | | |
| Series A 5.00% 10/1/35 | | | 1,640,000 | | | | 1,734,530 | |
| Loveland, Colorado Electric & Communications Enterprise Revenue | | | | | | | | |
| Series A 5.00% 12/1/44 | | | 2,185,000 | | | | 2,243,427 | |
| Platte River, Colorado Power Authority Revenue | | | | | | | | |
| Series JJ 5.00% 6/1/27 | | | 3,300,000 | | | | 3,455,166 | |
| Puerto Rico Electric Power Authority Revenue | | | | | | | | |
| Series A 5.05% 7/1/42 ‡ | | | 170,000 | | | | 46,750 | |
| Series AAA 5.25% 7/1/25 ‡ | | | 95,000 | | | | 26,125 | |
| Series CCC 5.25% 7/1/27 ‡ | | | 705,000 | | | | 193,875 | |
| Series WW 5.00% 7/1/28 ‡ | | | 660,000 | | | | 181,500 | |
| Series WW 5.25% 7/1/33 ‡ | | | 210,000 | | | | 57,750 | |
| Series WW 5.50% 7/1/17 ‡ | | | 460,000 | | | | 125,350 | |
| Series WW 5.50% 7/1/19 ‡ | | | 360,000 | | | | 98,100 | |
| Series XX 4.75% 7/1/26 ‡ | | | 105,000 | | | | 28,875 | |
| Series XX 5.25% 7/1/40 ‡ | | | 1,840,000 | | | | 506,000 | |
| Series XX 5.75% 7/1/36 ‡ | | | 365,000 | | | | 100,375 | |
| Series ZZ 4.75% 7/1/27 ‡ | | | 85,000 | | | | 23,375 | |
| Series ZZ 5.00% 7/1/19 ‡ | | | 620,000 | | | | 168,950 | |
| | | Principal | | | | |
| | | amount° | | | Value (US $) | |
| Municipal Bonds (continued) | | | | | | |
| Electric Revenue Bonds (continued) | | | | | | | | |
| Puerto Rico Electric Power Authority Revenue | | | | | | | | |
| Series ZZ 5.25% 7/1/24 ‡ | | | 140,000 | | | $ | 38,500 | |
| | | | | | | | 10,946,106 | |
| Healthcare Revenue Bonds — 21.04% | | | | | | | | |
| Colorado Health Facilities Authority Revenue | | | | | | | | |
| (Aberdeen Ridge) | | | | | | | | |
| Series A 5.00% 5/15/58 | | | 1,500,000 | | | | 1,045,530 | |
| (AdventHealth Obligated Group) | | | | | | | | |
| Series A 3.00% 11/15/51 | | | 6,325,000 | | | | 4,532,242 | |
| Series A 4.00% 11/15/43 | | | 2,290,000 | | | | 2,196,797 | |
| Series A 4.00% 11/15/50 | | | 6,015,000 | | | | 5,515,093 | |
| (American Baptist) | | | | | | | | |
| 7.625% 8/1/33 | | | 150,000 | | | | 150,221 | |
| 8.00% 8/1/43 | | | 1,000,000 | | | | 999,880 | |
| (Bethesda Project) | | | | | | | | |
| Series A-1 5.00% 9/15/48 | | | 2,250,000 | | | | 1,973,520 | |
| (Cappella of Grand Junction Project) | | | | | | | | |
| 144A 5.00% 12/1/54 # | | | 2,220,000 | | | | 1,422,021 | |
| (CommonSpirit Health) | | | | | | | | |
| Series A-1 4.00% 8/1/37 | | | 1,885,000 | | | | 1,800,552 | |
| Series A-1 4.00% 8/1/38 | | | 120,000 | | | | 113,172 | |
| Series A-1 4.00% 8/1/44 | | | 300,000 | | | | 267,087 | |
| Series A-2 4.00% 8/1/49 (BAM) | | | 3,670,000 | | | | 3,315,111 | |
| Series A-2 5.00% 8/1/37 | | | 1,500,000 | | | | 1,555,455 | |
| Series A-2 5.00% 8/1/39 | | | 5,000 | | | | 5,142 | |
| (Covenant Living Communities and Services) | | | | | | | | |
| Series A 4.00% 12/1/40 | | | 1,250,000 | | | | 1,087,275 | |
| (Covenant Retirement Communities, Inc.) | | | | | | | | |
| Series A 5.00% 12/1/35 | | | 1,000,000 | | | | 1,002,530 | |
| (Craig Hospital Project) | | | | | | | | |
| Series A 5.00% 12/1/47 | | | 1,830,000 | | | | 1,859,243 | |
| (Frasier Project) | | | | | | | | |
| Series A 4.00% 5/15/48 | | | 1,000,000 | | | | 757,690 | |
| (Mental Health Center Denver Project) | | | | | | | | |
| Series A 5.75% 2/1/44 | | | 2,000,000 | | | | 2,006,060 | |
| (National Jewish Health Project) | | | | | | | | |
| 5.00% 1/1/27 | | | 300,000 | | | | 294,540 | |
| (Parkview Medical Center, Inc. Project) | | | | | | | | |
| Series A 4.00% 9/1/50 | | | 1,750,000 | | | | 1,469,125 | |
| (Sanford) | | | | | | | | |
| Series A 5.00% 11/1/44 | | | 3,410,000 | | | | 3,444,236 | |
Schedules of investments
Delaware Tax-Free Colorado Fund
| | | Principal | | | | |
| | | amount° | | | Value (US $) | |
| Municipal Bonds (continued) | | | | | | |
| Healthcare Revenue Bonds (continued) | | | | | | | | |
| Colorado Health Facilities Authority Revenue | | | | | | | | |
| (SCL Health System) | | | | | | | | |
| Series A 4.00% 1/1/37 | | | 4,470,000 | | | $ | 4,470,224 | |
| (Sunny Vista Living Center) | | | | | | | | |
| Series A 144A 6.25% 12/1/50 # | | | 935,000 | | | | 620,803 | |
| (Vail Valley Medical Center Project) | | | | | | | | |
| 5.00% 1/15/35 | | | 1,000,000 | | | | 1,027,310 | |
| (Valley View Hospital Association Project) | | | | | | | | |
| Series A 4.00% 5/15/35 | | | 685,000 | | | | 685,370 | |
| Denver, Colorado Health & Hospital Authority Revenue | | | | | | | | |
| Series A 4.00% 12/1/39 | | | 1,000,000 | | | | 881,480 | |
| Series A 4.00% 12/1/40 | | | 250,000 | | | | 217,975 | |
| Puerto Rico Industrial Tourist Educational Medical & Environmental Control Facilities Financing Authority Revenue | | | | | | | | |
| (Hospital Auxilio Mutuo Obligated Group Project) | | | | | | | | |
| 4.00% 7/1/39 | | | 75,000 | | | | 67,014 | |
| | | | | | | | 44,782,698 | |
| Housing Revenue Bond — 1.16% | | | | | | | | |
| Denver City & County, Colorado Housing Authority Revenue | | | | | | | | |
| (Flo Senior Apartments Project) | | | | | | | | |
| 4.50% 7/1/41 | | | 2,500,000 | | | | 2,469,675 | |
| | | | | | | | 2,469,675 | |
| Industrial Development Revenue/Pollution Control | | | | | | | | |
| Revenue Bonds — 4.14% | | | | | | | | |
| Children’s Trust Fund Revenue, Commonwealth of Puerto Rico | | | | | | | | |
| (Tobacco Settlement Asset-Backed) | | | | | | | | |
| Series A 8.21% 5/15/57 ^ | | | 52,100,000 | | | | 3,623,034 | |
| Denver City & County, Colorado Special Facilities Airport Revenue | | | | | | | | |
| (United Airlines, Inc. Project) | | | | | | | | |
| 5.00% 10/1/32 (AMT) | | | 215,000 | | | | 213,753 | |
| Public Authority for Colorado Energy Natural Gas Revenue | | | | | | | | |
| 6.50% 11/15/38 | | | 4,250,000 | | | | 4,984,782 | |
| | | | | | | | 8,821,569 | |
| Lease Revenue Bonds — 2.31% | | | | | | | | |
| Colorado Department of Transportation Revenue | | | | | | | | |
| 5.00% 6/15/34 | | | 660,000 | | | | 683,001 | |
| | | Principal | | | | |
| | | amount° | | | Value (US $) | |
| Municipal Bonds (continued) | | | | | | |
| Lease Revenue Bonds (continued) | | | | | | | | |
| Colorado Department of Transportation Revenue | | | | | | | | |
| 5.00% 6/15/36 | | | 1,055,000 | | | $ | 1,086,144 | |
| Colorado Higher Education Lease Purchase Financing Program | | | | | | | | |
| 4.00% 9/1/41 | | | 1,000,000 | | | | 970,190 | |
| Denver, Colorado Health & Hospital Authority Revenue | | | | | | | | |
| (550 Acoma, Inc.) | | | | | | | | |
| 4.00% 12/1/38 | | | 750,000 | | | | 669,510 | |
| State of Colorado | | | | | | | | |
| 4.00% 3/15/37 | | | 1,500,000 | | | | 1,505,235 | |
| | | | | | | | 4,914,080 | |
| Local General Obligation Bonds — 9.78% | | | | | | | | |
| Adams & Weld Counties, Colorado School District No. 27J Brighton | | | | | | | | |
| 4.00% 12/1/30 | | | 300,000 | | | | 303,405 | |
| 4.00% 12/1/31 | | | 1,000,000 | | | | 1,011,820 | |
| 4.00% 12/1/46 | | | 1,370,000 | | | | 1,286,800 | |
| Arapahoe County, Colorado School District No. 6 Littleton | | | | | | | | |
| (Littleton Public Schools) | | | | | | | | |
| Series A 5.50% 12/1/33 | | | 1,000,000 | | | | 1,117,490 | |
| Series A 5.50% 12/1/38 | | | 350,000 | | | | 381,969 | |
| Beacon Point, Colorado Metropolitan District | | | | | | | | |
| 5.00% 12/1/30 (AGM) | | | 1,130,000 | | | | 1,161,459 | |
| Commerce City, Colorado Northern Infrastructure General Improvement District | | | | | | | | |
| 5.00% 12/1/32 (AGM) | | | 2,125,000 | | | | 2,127,040 | |
| Denver City & County, Colorado School District No 1 | | | | | | | | |
| Series A 5.00% 12/1/45 | | | 5,000,000 | | | | 5,398,850 | |
| El Paso County, Colorado School District No. 2 Harrison | | | | | | | | |
| 5.00% 12/1/38 | | | 1,000,000 | | | | 1,064,210 | |
| Grand River, Colorado Hospital District | | | | | | | | |
| 5.25% 12/1/35 (AGM) | | | 1,000,000 | | | | 1,048,640 | |
| Jefferson County, Colorado School District No. R-1 | | | | | | | | |
| 5.25% 12/15/24 | | | 1,250,000 | | | | 1,279,713 | |
| Verve Metropolitan District No. 1, Colorado | | | | | | | | |
| 5.00% 12/1/51 | | | 2,000,000 | | | | 1,494,580 | |
| Weld County, Colorado School District No. Re-1 | | | | | | | | |
| 5.00% 12/15/31 (AGM) | | | 1,000,000 | | | | 1,049,640 | |
| Weld County, Colorado School District No. Re-3J | | | | | | | | |
| 5.00% 12/15/34 (BAM) | | | 2,000,000 | | | | 2,078,480 | |
| | | | | | | | 20,804,096 | |
Schedules of investments
Delaware Tax-Free Colorado Fund
| | | Principal | | | | |
| | | amount° | | | Value (US $) | |
| Municipal Bonds (continued) | | | | | | |
| Pre-Refunded Bonds — 4.09% | | | | | | | | |
| Colorado Educational & Cultural Facilities Authority Revenue | | | | | | | | |
| (Atlas Preparatory Charter School) | | | | | | | | |
| 144A 5.25% 4/1/45-25 #, § | | | 1,300,000 | | | $ | 1,335,087 | |
| Colorado Health Facilities Authority Revenue | | | | | | | | |
| (NCMC Project) | | | | | | | | |
| 4.00% 5/15/32-26 § | | | 2,000,000 | | | | 2,038,240 | |
| (SCL Health System) | | | | | | | | |
| Series A 5.00% 1/1/44-24 § | | | 3,050,000 | | | | 3,065,189 | |
| Commerce City, Colorado Sales and Use Tax Revenue | | | | | | | | |
| 5.00% 8/1/44-24 (AGM) § | | | 1,500,000 | | | | 1,519,905 | |
| Tallyn’s Reach Metropolitan District No. 3, Colorado | | | | | | | | |
| 144A 5.125% 11/1/38-23 #, § | | | 740,000 | | | | 742,575 | |
| | | | | | | | 8,700,996 | |
| Special Tax Revenue Bonds — 19.51% | | | | | | | | |
| Broomfield Colorado Sales & Use Tax Revenue | | | | | | | | |
| 5.00% 12/1/33 | | | 1,000,000 | | | | 1,061,770 | |
| Colorado Regional Transportation District Sales Tax Revenue | | | | | | | | |
| (FasTracks Project) | | | | | | | | |
| Series A 5.00% 11/1/30 | | | 670,000 | | | | 706,113 | |
| Series A 5.00% 11/1/31 | | | 1,495,000 | | | | 1,575,581 | |
| Series A 5.00% 11/1/36 | | | 930,000 | | | | 968,195 | |
| Commonwealth of Puerto Rico | | | | | | | | |
| 3.325% 11/1/43 • | | | 4,557,792 | | | | 2,352,960 | |
| 3.799% 11/1/51 • | | | 1,361,097 | | | | 566,557 | |
| Denver City & County, Colorado Dedicated Excise Tax Revenue | | | | | | | | |
| Series A 4.00% 8/1/51 | | | 1,000,000 | | | | 916,250 | |
| Denver, Colorado Convention Center Hotel Authority Revenue | | | | | | | | |
| 5.00% 12/1/40 | | | 2,660,000 | | | | 2,582,700 | |
| Fountain, Colorado Urban Renewal Authority Tax Increment Revenue | | | | | | | | |
| (South Academy Highlands Project) | | | | | | | | |
| Series A 5.50% 11/1/44 | | | 1,375,000 | | | | 1,294,659 | |
| GDB Debt Recovery Authority of Puerto Rico | | | | | | | | |
| 7.50% 8/20/40 | | | 9,100,763 | | | | 7,439,874 | |
| Lincoln Park Metropolitan District Douglas County, Colorado Revenue | | | | | | | | |
| 5.00% 12/1/46 (AGM) | | | 1,000,000 | | | | 1,033,030 | |
| | | Principal | | | | |
| | | amount° | | | Value (US $) | |
| Municipal Bonds (continued) | | | | | | |
| Special Tax Revenue Bonds (continued) | | | | | | | | |
| Matching Fund Special Purpose Securitization, Virgin Islands | | | | | | | | |
| Series A 5.00% 10/1/32 | | | 450,000 | | | $ | 451,611 | |
| Plaza Metropolitan District No. 1, Colorado | | | | | | | | |
| 144A 5.00% 12/1/40 # | | | 1,265,000 | | | | 1,189,517 | |
| Prairie Center Metropolitan District No. 3, Colorado | | | | | | | | |
| Series A 144A 5.00% 12/15/41 # | | | 1,000,000 | | | | 971,560 | |
| Puerto Rico Sales Tax Financing Revenue | | | | | | | | |
| (Capital Appreciation - Restructured) | | | | | | | | |
| Series A-1 5.696% 7/1/46 ^ | | | 10,000,000 | | | | 2,785,200 | |
| Series A-1 6.018% 7/1/51 ^ | | | 20,624,000 | | | | 4,262,568 | |
| (Restructured) | | | | | | | | |
| Series A-1 4.75% 7/1/53 | | | 3,986,000 | | | | 3,736,756 | |
| Series A-1 5.00% 7/1/58 | | | 2,910,000 | | | | 2,823,864 | |
| Series A-2 4.536% 7/1/53 | | | 3,000,000 | | | | 2,715,120 | |
| Southlands Metropolitan District No. 1, Colorado | | | | | | | | |
| Series A-1 5.00% 12/1/37 | | | 500,000 | | | | 487,140 | |
| Series A-1 5.00% 12/1/47 | | | 300,000 | | | | 277,050 | |
| Thornton, Colorado Development Authority Revenue | | | | | | | | |
| (East 144th Avenue & I-25 Project) | | | | | | | | |
| Series B 5.00% 12/1/35 | | | 485,000 | | | | 490,611 | |
| Series B 5.00% 12/1/36 | | | 810,000 | | | | 819,275 | |
| | | | | | | | 41,507,961 | |
| State General Obligation Bonds — 1.03% | | | | | | | | |
| Commonwealth of Puerto Rico | | | | | | | | |
| (Restructured) | | | | | | | | |
| Series A-1 4.00% 7/1/37 | | | 295,740 | | | | 266,077 | |
| Series A-1 4.00% 7/1/41 | | | 1,834,787 | | | | 1,586,632 | |
| Series A-1 4.00% 7/1/46 | | | 400,000 | | | | 332,988 | |
| | | | | | | | 2,185,697 | |
| Transportation Revenue Bonds — 12.35% | | | | | | | | |
| Colorado High Performance Transportation Enterprise Revenue | | | | | | | | |
| (C-470 Express Lanes) | | | | | | | | |
| 5.00% 12/31/56 | | | 3,250,000 | | | | 3,177,557 | |
| (U.S. 36 & I-25 Managed Lanes) | | | | | | | | |
| 5.75% 1/1/44 (AMT) | | | 2,140,000 | | | | 2,142,547 | |
| Colorado Regional Transportation District | | | | | | | | |
| (Denver Transit Partners Eagle P3 Project) | | | | | | | | |
| Series A 4.00% 7/15/34 | | | 1,100,000 | | | | 1,114,146 | |
| Series A 4.00% 7/15/38 | | | 700,000 | | | | 677,453 | |
Schedules of investments
Delaware Tax-Free Colorado Fund
| | | Principal | | | | |
| | | amount° | | | Value (US $) | |
| Municipal Bonds (continued) | | | | | | |
| Transportation Revenue Bonds (continued) | | | | | | | | |
| Colorado Regional Transportation District | | | | | | | | |
| (Denver Transit Partners Eagle P3 Project) | | | | | | | | |
| Series A 4.00% 7/15/39 | | | 1,500,000 | | | $ | 1,438,575 | |
| Series A 4.00% 7/15/40 | | | 2,815,000 | | | | 2,676,136 | |
| Series A 5.00% 7/15/31 | | | 1,050,000 | | | | 1,139,712 | |
| Colorado, E-470 Public Highway Authority Revenue | | | | | | | | |
| Series A 5.00% 9/1/36 | | | 1,300,000 | | | | 1,419,223 | |
| Denver City & County, Colorado Airport System Revenue | | | | | | | | |
| Series A 4.00% 11/15/41 (AMT) | | | 710,000 | | | | 679,094 | |
| Series A 4.00% 12/1/43 (AMT) | | | 4,445,000 | | | | 4,109,491 | |
| Series A 4.00% 12/1/48 (AMT) | | | 400,000 | | | | 357,764 | |
| Series A 5.00% 11/15/30 (AMT) | | | 1,500,000 | | | | 1,571,190 | |
| Series A 5.00% 11/15/47 (AMT) | | | 1,000,000 | | | | 1,029,860 | |
| Series A 5.25% 12/1/43 (AMT) | | | 2,000,000 | | | | 2,059,240 | |
| Puerto Rico Highway & Transportation Authority Revenue | | | | | | | | |
| (Restructured) | | | | | | | | |
| Series A 5.00% 7/1/62 | | | 2,720,000 | | | | 2,682,600 | |
| | | | | | | | 26,274,588 | |
| Water & Sewer Revenue Bonds — 4.33% | | | | | | | | |
| Arapahoe County, Colorado Water & Wastewater Authority Revenue | | | | | | | | |
| 4.00% 12/1/36 | | | 3,000,000 | | | | 3,025,290 | |
| Central Weld County, Colorado Water District | | | | | | | | |
| 4.00% 12/1/39 (AGM) | | | 1,150,000 | | | | 1,134,107 | |
| Douglas County, Colorado Centennial Water & Sanitation District | | | | | | | | |
| 4.00% 12/1/38 | | | 500,000 | | | | 498,615 | |
| Guam Government Waterworks Authority Water & Wastewater System Revenue | | | | | | | | |
| 5.00% 7/1/37 | | | 575,000 | | | | 582,055 | |
| Johnstown, Colorado Wastewater Revenue | | | | | | | | |
| 4.00% 12/1/51 (AGM) | | | 2,875,000 | | | | 2,584,366 | |
| Metro Wastewater Reclamation District, Colorado | | | | | | | | |
| Series A 3.00% 4/1/38 | | | 1,620,000 | | | | 1,394,950 | |
| | | | | | | | 9,219,383 | |
| Total Municipal Bonds (cost $224,133,776) | | | | | | | 209,643,371 | |
| | | Number of | | | | |
| | | shares | | | Value (US $) | |
| Short-Term Investments — 0.82% | | | | | | |
| Money Market Mutual Funds — 0.18% | | | | | | | | |
| Dreyfus Tax Exempt Cash Management - Institutional Shares (seven-day effective yield 4.13%) | | | 375,648 | | | $ | 375,648 | |
| | | | | | | | 375,648 | |
| | | | | | | | | |
| | | Principal | | | | | |
| | | amount° | | | | | |
| Variable Rate Demand Note — 0.64%¤ | | | | | | | | |
| Colorado Educational & Cultural Facilities Authority Revenue | | | | | | | | |
| (National Jewish Federation Bond Program) Series F-2 | | | | | | | | |
| 3.93% 7/1/41 (LOC - TD Bank, N.A.) | | | 1,375,000 | | | | 1,375,000 | |
| | | | | | | | 1,375,000 | |
| Total Short-Term Investments (cost $1,750,648) | | | | | | | 1,750,648 | |
| Total Value of Securities—99.34% | | | | | | | | |
| (cost $225,884,424) | | | | | | $ | 211,394,019 | |
| ° | Principal amount shown is stated in USD unless noted that the security is denominated in another currency. |
| # | Security exempt from registration under Rule 144A of the Securities Act of 1933, as amended. At August 31, 2023, the aggregate value of Rule 144A securities was $13,518,359, which represents 6.35% of the Fund’s net assets. See Note 8 in “Notes to financial statements.” |
| ‡ | Non-income producing security. Security is currently in default. |
| ^ | Zero-coupon security. The rate shown is the effective yield at the time of purchase. |
| § | Pre-refunded bonds. Municipal bonds that are generally backed or secured by US Treasury bonds. For pre-refunded bonds, the stated maturity is followed by the year in which the bond will be pre-refunded. See Note 8 in “Notes to financial statements.” |
| • | Variable rate investment. Rates reset periodically. Rate shown reflects the rate in effect at August 31, 2023. For securities based on a published reference rate and spread, the reference rate and spread are indicated in their descriptions. The reference rate descriptions (i.e. SOFR01M, SOFR03M, etc.) used in this report are identical for different securities, but the underlying reference rates may differ due to the timing of the reset period. Certain variable rate securities are not based on a published reference rate and spread but are determined by the issuer or agent and are based on current market conditions, or for mortgage-backed securities, are impacted by the individual mortgages which are paying off over time. These securities do not indicate a reference rate and spread in their descriptions. |
Schedules of investments
Delaware Tax-Free Colorado Fund
| ¤ | Tax-exempt obligations that contain a floating or variable interest rate adjustment formula and an unconditional right of demand to receive payment of the unpaid principal balance plus accrued interest upon a short notice period (generally up to 30 days) prior to specified dates either from the issuer or by drawing on a bank letter of credit, a guarantee, or insurance issued with respect to such instrument. Each rate shown is as of August 31, 2023. |
Summary of abbreviations:
AGM – Insured by Assured Guaranty Municipal Corporation
AMT – Subject to Alternative Minimum Tax
BAM – Insured by Build America Mutual Assurance
LOC – Letter of Credit
N.A. – National Association
SOFR – Secured Overnight Financing Rate
SOFR01M – Secured Overnight Financing Rate 1 Month
SOFR03M – Secured Overnight Financing Rate 3 Month
USD – US Dollar
See accompanying notes, which are an integral part of the financial statements.
| Schedules of investments | |
| Delaware Tax-Free Idaho Fund | August 31, 2023 |
| | | Principal | | | | |
| | | amount° | | | Value (US $) | |
| Municipal Bonds — 98.36% | | | | | | |
| Education Revenue Bonds — 22.80% | | | | | | | | |
| Boise city, Idaho State University Revenue | | | | | | | | |
| (General Project) | | | | | | | | |
| Series A 5.00% 4/1/47 | | | 500,000 | | | $ | 511,405 | |
| Series A 5.00% 4/1/48 | | | 435,000 | | | | 446,949 | |
| Idaho Housing & Finance Association Revenue | | | | | | | | |
| (Alturas International Academy Project) | | | | | | | | |
| 4.00% 5/1/52 | | | 1,500,000 | | | | 1,227,945 | |
| (Anser of Idaho Project) | | | | | | | | |
| Series A 2.25% 5/1/51 | | | 1,165,000 | | | | 655,114 | |
| Series A 3.00% 5/1/41 | | | 3,150,000 | | | | 2,420,366 | |
| Series A 4.00% 5/1/56 | | | 1,585,000 | | | | 1,281,124 | |
| (Compass Public Charter School Project) | | | | | | | | |
| Series A 144A 6.00% 7/1/39 # | | | 370,000 | | | | 385,325 | |
| Series A 144A 6.00% 7/1/49 # | | | 595,000 | | | | 613,231 | |
| Series A 144A 6.00% 7/1/54 # | | | 570,000 | | | | 586,245 | |
| (Compass Public Charter School) | | | | | | | | |
| Series A 144A 5.00% 7/1/54 # | | | 1,000,000 | | | | 902,840 | |
| (Gem Prep: Meridian Project) | | | | | | | | |
| Series A 4.00% 5/1/57 | | | 1,000,000 | | | | 792,850 | |
| (Idaho Arts Charter School Project) | | | | | | | | |
| Series A 4.00% 5/1/41 | | | 330,000 | | | | 307,425 | |
| Series A 4.00% 5/1/50 | | | 520,000 | | | | 459,092 | |
| Series A 4.00% 5/1/55 | | | 305,000 | | | | 263,239 | |
| Series A 144A 5.00% 12/1/38 # | | | 2,050,000 | | | | 2,053,772 | |
| Series A 144A 5.00% 12/1/46 # | | | 1,000,000 | | | | 998,150 | |
| (Meridian South Charter School Project) | | | | | | | | |
| 144A 4.00% 5/1/46 # | | | 1,000,000 | | | | 715,860 | |
| (North Star Charter School) | | | | | | | | |
| Capital Appreciation Subordinate Series B | | | | | | | | |
| 144A 4.88% 7/1/49 #, ^ | | | 2,888,155 | | | | 482,611 | |
| Series A 6.75% 7/1/48 | | | 529,151 | | | | 549,740 | |
| (Sage International School of Boise Project) | | | | | | | | |
| Series A 4.00% 5/1/50 | | | 3,000,000 | | | | 2,644,500 | |
| Series A 4.00% 5/1/55 | | | 1,100,000 | | | | 949,388 | |
| (Victory Charter School Project) | | | | | | | | |
| Series A 144A 5.00% 7/1/39 # | | | 1,000,000 | | | | 1,003,840 | |
| (Xavier Charter School Project) | | | | | | | | |
| Series A 5.00% 6/1/50 | | | 1,275,000 | | | | 1,241,595 | |
| Idaho State University General Revenue | | | | | | | | |
| Series A 4.00% 4/1/37 | | | 350,000 | | | | 345,828 | |
| Series A 4.50% 4/1/52 | | | 1,750,000 | | | | 1,713,390 | |
| Series A 5.25% 4/1/42 | | | 605,000 | | | | 656,008 | |
Schedules of investments
Delaware Tax-Free Idaho Fund
| | | Principal | | | | |
| | | amount° | | | Value (US $) | |
| Municipal Bonds (continued) | | | | | | |
| Education Revenue Bonds (continued) | | | | | | | | |
| Idaho State University Revenue | | | | | | | | |
| 3.00% 4/1/49 | | | 1,700,000 | | | $ | 1,222,436 | |
| The Regents of The University of Idaho General Revenue | | | | | | | | |
| Series A 4.00% 4/1/45 (BAM) | | | 700,000 | | | | 664,783 | |
| Series A 5.00% 4/1/35 (AGM) | | | 580,000 | | | | 648,353 | |
| University of Idaho Revenue | | | | | | | | |
| Unrefunded Series A 5.00% 4/1/41 | | | 680,000 | | | | 713,014 | |
| | | | | | | | 27,456,418 | |
| Electric Revenue Bonds — 2.42% | | | | | | | | |
| Boise-Kuna, Idaho Irrigation District Revenue | | | | | | | | |
| (Idaho Arrowrock Hydroelectric Project) | | | | | | | | |
| 5.00% 6/1/34 | | | 2,000,000 | | | | 2,027,980 | |
| Puerto Rico Electric Power Authority Revenue | | | | | | | | |
| Series A 5.05% 7/1/42 ‡ | | | 75,000 | | | | 20,625 | |
| Series AAA 5.25% 7/1/25 ‡ | | | 45,000 | | | | 12,375 | |
| Series CCC 5.25% 7/1/27 ‡ | | | 345,000 | | | | 94,875 | |
| Series WW 5.00% 7/1/28 ‡ | | | 320,000 | | | | 88,000 | |
| Series WW 5.50% 7/1/38 ‡ | | | 1,500,000 | | | | 412,500 | |
| Series XX 4.75% 7/1/26 ‡ | | | 50,000 | | | | 13,750 | |
| Series XX 5.25% 7/1/40 ‡ | | | 595,000 | | | | 163,625 | |
| Series XX 5.75% 7/1/36 ‡ | | | 175,000 | | | | 48,125 | |
| Series ZZ 4.75% 7/1/27 ‡ | | | 40,000 | | | | 11,000 | |
| Series ZZ 5.25% 7/1/24 ‡ | | | 60,000 | | | | 16,500 | |
| | | | | | | | 2,909,355 | |
| Healthcare Revenue Bonds — 12.47% | | | | | | | | |
| Idaho Health Facilities Authority Revenue | | | | | | | | |
| (Madison Memorial Hospital Project) | | | | | | | | |
| 5.00% 9/1/37 | | | 1,350,000 | | | | 1,322,487 | |
| (St. Luke’s Health System Project) | | | | | | | | |
| 3.00% 3/1/51 (BAM) | | | 3,300,000 | | | | 2,374,944 | |
| 4.00% 3/1/51 (BAM) | | | 2,210,000 | | | | 2,011,166 | |
| Series A 3.00% 3/1/51 | | | 3,000,000 | | | | 2,074,590 | |
| Series A 4.00% 3/1/46 | | | 500,000 | | | | 449,835 | |
| (Trinity Health Credit Group) | | | | | | | | |
| Series ID 4.00% 12/1/43 | | | 3,900,000 | | | | 3,674,736 | |
| Series ID 5.00% 12/1/46 | | | 750,000 | | | | 761,385 | |
| (Valley Vista Care Corporation) | | | | | | | | |
| Series A 4.00% 11/15/27 | | | 705,000 | | | | 690,435 | |
| Series A 5.25% 11/15/37 | | | 1,005,000 | | | | 832,421 | |
| | | Principal | | | | |
| | | amount° | | | Value (US $) | |
| Municipal Bonds (continued) | | | | | | |
| Healthcare Revenue Bonds (continued) | | | | | | | | |
| Idaho Health Facilities Authority Revenue | | | | | | | | |
| (Valley Vista Care Corporation) | | | | | | | | |
| Series A 5.25% 11/15/47 | | | 1,130,000 | | | $ | 831,036 | |
| | | | | | | | 15,023,035 | |
| Housing Revenue Bonds — 4.82% | | | | | | | | |
| Idaho Housing & Finance Association Multifamily Housing Revenue | | | | | | | | |
| (Sunset Landing Apartments Project) | | | | | | | | |
| Series A 2.75% 7/1/40 | | | 1,300,000 | | | | 1,001,377 | |
| Series A 3.125% 7/1/54 | | | 2,000,000 | | | | 1,389,320 | |
| Idaho Housing & Finance Association Revenue | | | | | | | | |
| Series A 4.50% 1/21/49 (GNMA) | | | 222,560 | | | | 222,565 | |
| Idaho Housing & Finance Association Single Family Mortgage Revenue | | | | | | | | |
| Series A 4.75% 1/1/48 (GNMA) | | | 1,000,000 | | | | 1,003,160 | |
| Series C 3.00% 1/1/43 (FHA) | | | 425,000 | | | | 376,971 | |
| Series C 4.80% 7/1/53 (GNMA) | | | 1,800,000 | | | | 1,808,172 | |
| | | | | | | | 5,801,565 | |
| Industrial Development Revenue/Pollution Control | | | | | | | | |
| Revenue Bonds — 4.42% | | | | | | | | |
| Children’s Trust Fund Revenue, Commonwealth of Puerto Rico | | | | | | | | |
| (Tobacco Settlement Asset-Backed) | | | | | | | | |
| Series A 8.21% 5/15/57 ^ | | | 30,000,000 | | | | 2,086,200 | |
| Nez Perce County, Idaho Pollution Control Revenue | | | | | | | | |
| (Potlatch Project) | | | | | | | | |
| 2.75% 10/1/24 | | | 1,250,000 | | | | 1,236,188 | |
| Power County, Idaho Industrial Development Revenue | | | | | | | | |
| (FMC Project) | | | | | | | | |
| 6.45% 8/1/32 (AMT) | | | 2,000,000 | | | | 2,005,920 | |
| | | | | | | | 5,328,308 | |
| Lease Revenue Bonds — 11.70% | | | | | | | | |
| Boise City, Idaho Urban Renewal Agency Revenue | | | | | | | | |
| 5.00% 12/15/31 | | | 750,000 | | | | 775,980 | |
| 5.00% 12/15/32 | | | 750,000 | | | | 775,283 | |
| Idaho Falls City, Annual Appropriation Certificates of Participation Revenue | | | | | | | | |
| 4.00% 9/15/39 | | | 1,050,000 | | | | 1,014,604 | |
| 144A 5.25% 5/15/51 # | | | 2,000,000 | | | | 1,880,500 | |
Schedules of investments
Delaware Tax-Free Idaho Fund
| | | Principal | | | | |
| | | amount° | | | Value (US $) | |
| Municipal Bonds (continued) | | | | | | | | |
| Lease Revenue Bonds (continued) | | | | | | | | |
| Idaho Fish & Wildlife Foundation Revenue | | | | | | | | |
| (Idaho Department of Fish & Game Headquarters Office Project) | | | | | | | | |
| 4.00% 12/1/36 | | | 525,000 | | | $ | 528,843 | |
| 4.00% 12/1/39 | | | 1,540,000 | | | | 1,505,766 | |
| 4.00% 12/1/42 | | | 1,300,000 | | | | 1,246,544 | |
| 4.00% 12/1/44 | | | 250,000 | | | | 235,405 | |
| (Idaho Department of Fish & Game Nampa Regional Office Project) | | | | | | | | |
| 5.00% 12/1/41 | | | 200,000 | | | | 211,628 | |
| Idaho Housing & Finance Association Economic Development Facilities Revenue | | | | | | | | |
| (TDF Facilities Project) | | | | | | | | |
| Series A 6.50% 2/1/26 | | | 595,000 | | | | 595,726 | |
| Series A 7.00% 2/1/36 | | | 1,500,000 | | | | 1,502,400 | |
| Idaho Housing & Finance Association Revenue | | | | | | | | |
| Series A 4.00% 7/15/39 | | | 2,735,000 | | | | 2,608,260 | |
| Idaho State Building Authority Revenue | | | | | | | | |
| (Department of Health & Welfare Project) | | | | | | | | |
| Series B 4.00% 9/1/48 | | | 1,290,000 | | | | 1,208,549 | |
| | | | | | | | 14,089,488 | |
| Local General Obligation Bonds — 6.95% | | | | | | | | |
| Ada & Boise Counties, Idaho Independent School District Boise City | | | | | | | | |
| 5.00% 8/1/35 | | | 1,160,000 | | | | 1,218,742 | |
| 5.00% 8/1/34 | | | 1,000,000 | | | | 1,054,920 | |
| 5.00% 8/1/36 | | | 500,000 | | | | 522,210 | |
| Canyon County, Idaho School District No. 139 Vallivue | | | | | | | | |
| (School Board Guaranteed) | | | | | | | | |
| Series B 5.00% 9/15/24 | | | 1,480,000 | | | | 1,481,806 | |
| Idaho Bond Bank Authority Revenue | | | | | | | | |
| Series A 4.00% 9/15/33 | | | 530,000 | | | | 545,253 | |
| Series A 4.00% 9/15/37 | | | 1,000,000 | | | | 1,003,230 | |
| Series C 5.00% 9/15/42 | | | 500,000 | | | | 518,015 | |
| Ketchum City, Idaho | | | | | | | | |
| 2.125% 9/15/41 | | | 500,000 | | | | 336,650 | |
| Madison County, Idaho School District No. 321 Rexburg | | | | | | | | |
| (Sales Tax & Credit Enhancement Guaranty) | | | | | | | | |
| Series B 5.00% 9/15/31 | | | 600,000 | | | | 636,978 | |
| | | Principal | | | | |
| | | amount° | | | Value (US $) | |
| Municipal Bonds (continued) | | | | | | |
| Local General Obligation Bonds (continued) | | | | | | | | |
| Nez Perce County, Idaho Independent School District No. 1 | | | | | | | | |
| (Sales Tax & Credit Enhancement Guaranty) | | | | | | | | |
| Series B 5.00% 9/15/36 | | | 1,000,000 | | | $ | 1,046,010 | |
| | | | | | | | 8,363,814 | |
| Pre-Refunded Bonds — 2.27% | | | | | | | | |
| Ada & Canyon Counties, Idaho Joint School District No. 3 Kuna | | | | | | | | |
| (Sales Tax & Credit Enhancement Guaranty) | | | | | | | | |
| Series B 5.00% 9/15/35-27 § | | | 1,100,000 | | | | 1,173,183 | |
| Idaho State Building Authority Revenue | | | | | | | | |
| (State Office Campus Project) | | | | | | | | |
| Series A 4.00% 9/1/48-27 § | | | 500,000 | | | | 519,735 | |
| Nampa city, Idaho Development Corporation Revenue | | | | | | | | |
| (Library Square Project) | | | | | | | | |
| 144A 5.00% 9/1/31-24 #, § | | | 1,000,000 | | | | 1,035,710 | |
| | | | | | | | 2,728,628 | |
| Resource Recovery Revenue Bond — 0.32% | | | | | | | | |
| Idawy, Idaho Solid Waste District Revenue | | | | | | | | |
| Series A 3.00% 1/1/50 | | | 550,000 | | | | 381,095 | |
| | | | | | | | 381,095 | |
| Special Tax Revenue Bonds — 23.15% | | | | | | | | |
| Commonwealth of Puerto Rico Revenue | | | | | | | | |
| 3.799% 11/1/51 • | | | 3,469,212 | | | | 1,444,059 | |
| (Restructured) | | | | | | | | |
| 3.35% 11/1/43 • | | | 2,473,832 | | | | 1,277,116 | |
| GDB Debt Recovery Authority of Puerto Rico Revenue | | | | | | | | |
| 7.50% 8/20/40 | | | 5,620,130 | | | | 4,594,456 | |
| Idaho Bond Bank Authority Revenue | | | | | | | | |
| Series A 4.00% 9/15/39 | | | 230,000 | | | | 226,173 | |
| Idaho Housing & Finance Association Sales Tax Revenue | | | | | | | | |
| (Transportation Expansion And Congestion Mitigation) | | | | | | | | |
| 5.00% 8/15/47 | | | 5,295,000 | | | | 5,609,682 | |
| Series A 4.00% 8/15/48 | | | 2,370,000 | | | | 2,234,484 | |
| Series A 5.00% 8/15/42 | | | 1,325,000 | | | | 1,423,010 | |
| Idaho Water Resource Board Loan Program Revenue | | | | | | | | |
| (Ground Water Rights Mitigation) | | | | | | | | |
| Series A 5.00% 9/1/32 | | | 3,565,000 | | | | 3,566,747 | |
| Puerto Rico Sales Tax Financing Revenue | | | | | | | | |
| (Capital Appreciation - Restructured) | | | | | | | | |
| Series A-1 5.462% 7/1/46 ^ | | | 3,320,000 | | | | 924,686 | |
Schedules of investments
Delaware Tax-Free Idaho Fund
| | | Principal | | | | |
| | | amount° | | | Value (US $) | |
| Municipal Bonds (continued) | | | | | | |
| Special Tax Revenue Bonds (continued) | | | | | | | | |
| Puerto Rico Sales Tax Financing Revenue | | | | | | | | |
| (Capital Appreciation - Restructured) | | | | | | | | |
| Series A-1 5.733% 7/1/51 ^ | | | 10,663,000 | | | $ | 2,203,829 | |
| (Restructured) | | | | | | | | |
| Series A-1 4.55% 7/1/40 | | | 875,000 | | | | 853,143 | |
| Series A-1 4.75% 7/1/53 | | | 3,045,000 | | | | 2,854,596 | |
| Series A-1 5.00% 7/1/58 | | | 691,000 | | | | 670,546 | |
| | | | | | | | 27,882,527 | |
| State General Obligation Bond — 0.16% | | | | | | | | |
| Commonwealth of Puerto Rico | | | | | | | | |
| (Restructured) | | | | | | | | |
| Series A-1 4.00% 7/1/41 | | | 221,605 | | | | 191,633 | |
| | | | | | | | 191,633 | |
| Transportation Revenue Bonds — 5.12% | | | | | | | | |
| Boise City, Idaho Airport Revenue | | | | | | | | |
| (Employee Parking Facilities Project) Series B 4.00% 9/1/51 (AMT) | | | 1,955,000 | | | | 1,716,764 | |
| (Public Parking Facilities Project) | | | | | | | | |
| Series A 5.00% 9/1/51 | | | 1,500,000 | | | | 1,562,565 | |
| Puerto Rico Highway & Transportation Authority Revenue | | | | | | | | |
| (Restructured) | | | | | | | | |
| Series A 5.00% 7/1/62 | | | 1,940,000 | | | | 1,913,325 | |
| Series C 5.259% 7/1/53 | | | 1,540,000 | | | | 975,975 | |
| | | | | | | | 6,168,629 | |
| Water & Sewer Revenue Bond — 1.76% | | | | | | | | |
| Boise City, Idaho Water Renewal Revenue | | | | | | | | |
| 5.00% 9/1/51 | | | 2,000,000 | | | | 2,125,600 | |
| | | | | | | | 2,125,600 | |
| Total Municipal Bonds (cost $128,296,218) | | | | | | | 118,450,095 | |
| | | Number of | | | | |
| | | shares | | | Value (US $) | |
| Short-Term Investments — 0.66% | | | | | | |
| Money Market Mutual Funds — 0.66% | | | | | | | | |
| Dreyfus Tax Exempt Cash Management - Institutional Shares (seven-day effective yield 4.13%) | | | 793,110 | | | $ | 793,110 | |
| Total Short-Term Investments (cost $793,110) | | | | | | | 793,110 | |
| Total Value of Securities—99.02% | | | | | | | | |
| (cost $129,089,328) | | | | | | $ | 119,243,205 | |
| ° | Principal amount shown is stated in USD unless noted that the security is denominated in another currency. |
| # | Security exempt from registration under Rule 144A of the Securities Act of 1933, as amended. At August 31, 2023, the aggregate value of Rule 144A securities was $10,658,084, which represents 8.85% of the Fund’s net assets. See Note 8 in “Notes to financial statements.” |
| ^ | Zero-coupon security. The rate shown is the effective yield at the time of purchase. |
| ‡ | Non-income producing security. Security is currently in default. |
| § | Pre-refunded bonds. Municipal bonds that are generally backed or secured by US Treasury bonds. For pre-refunded bonds, the stated maturity is followed by the year in which the bond will be pre-refunded. See Note 8 in “Notes to financial statements.” |
| • | Variable rate investment. Rates reset periodically. Rate shown reflects the rate in effect at August 31, 2023. For securities based on a published reference rate and spread, the reference rate and spread are indicated in their descriptions. The reference rate descriptions (i.e. SOFR01M, SOFR03M, etc.) used in this report are identical for different securities, but the underlying reference rates may differ due to the timing of the reset period. Certain variable rate securities are not based on a published reference rate and spread but are determined by the issuer or agent and are based on current market conditions, or for mortgage-backed securities, are impacted by the individual mortgages which are paying off over time. These securities do not indicate a reference rate and spread in their descriptions. |
Summary of abbreviations:
AGM – Insured by Assured Guaranty Municipal Corporation
AMT – Subject to Alternative Minimum Tax
BAM – Insured by Build America Mutual Assurance
FHA – Federal Housing Administration
GNMA – Government National Mortgage Association
SOFR01M – Secured Overnight Financing Rate 1 Month
SOFR03M – Secured Overnight Financing Rate 3 Month
USD – US Dollar
See accompanying notes, which are an integral part of the financial statements.
| Schedules of investments | |
| Delaware Tax-Free New York Fund | August 31, 2023 |
| | | Principal | | | | |
| | | amount° | | | Value (US $) | |
| Municipal Bonds — 96.53% | | | | | | |
| Education Revenue Bonds — 18.88% | | | | | | | | |
| Buffalo & Erie County, New York Industrial Land Development Revenue | | | | | | | | |
| (Tapestry Charter School Project) | | | | | | | | |
| Series A 5.00% 8/1/52 | | | 500,000 | | | $ | 443,575 | |
| Build NYC, New York Resource Revenue | | | | | | | | |
| (Classical Charter Schools Project) | | | | | | | | |
| Series A 4.75% 6/15/53 | | | 1,700,000 | | | | 1,572,466 | |
| (East Harlem Scholars Academy Charter School Project) | | | | | | | | |
| 144A 5.75% 6/1/62 # | | | 1,000,000 | | | | 1,002,660 | |
| (Inwood Academy for Leadership Charter School Project) | | | | | | | | |
| Series A 144A 5.50% 5/1/48 # | | | 500,000 | | | | 484,230 | |
| (KIPP NYC Public School Facilities - Canal West Project) | | | | | | | | |
| 5.00% 7/1/35 | | | 530,000 | | | | 556,479 | |
| 5.00% 7/1/42 | | | 1,365,000 | | | | 1,371,675 | |
| (Manhattan College Project) | | | | | | | | |
| 5.00% 8/1/47 | | | 500,000 | | | | 503,015 | |
| (Metropolitan College of New York Project) | | | | | | | | |
| 5.50% 11/1/44 | | | 600,000 | | | | 450,000 | |
| (Metropolitan Lighthouse Charter School Project) | | | | | | | | |
| Series A 144A 5.00% 6/1/52 # | | | 250,000 | | | | 221,210 | |
| (New Dawn Charter Schools Project) | | | | | | | | |
| 144A 5.75% 2/1/49 # | | | 500,000 | | | | 456,515 | |
| (New World Preparatory Charter School Project) | | | | | | | | |
| Series A 144A 4.00% 6/15/51 # | | | 315,000 | | | | 226,964 | |
| Series A 144A 4.00% 6/15/56 # | | | 450,000 | | | | 315,211 | |
| (The Packer Collegiate Institute Project) | | | | | | | | |
| 5.00% 6/1/40 | | | 750,000 | | | | 755,932 | |
| Dutchess County, New York Local Development Revenue | | | | | | | | |
| (Vassar College Project) | | | | | | | | |
| 5.00% 7/1/36 | | | 1,000,000 | | | | 1,047,580 | |
| 5.00% 7/1/37 | | | 1,000,000 | | | | 1,042,480 | |
| Hempstead Town, New York Local Development Revenue | | | | | | | | |
| (Hofstra University Project) | | | | | | | | |
| 5.00% 7/1/42 | | | 500,000 | | | | 515,565 | |
| Madison County, New York Capital Resource Revenue | | | | | | | | |
| (Colgate University Refunding Project) | | | | | | | | |
| Series B 5.00% 7/1/39 | | | 1,000,000 | | | | 1,015,500 | |
| | | Principal | | | | |
| | | amount° | | | Value (US $) | |
| Municipal Bonds (continued) | | | | | | |
| Education Revenue Bonds (continued) | | | | | | | | |
| Monroe County, New York Industrial Development Revenue | | | | | | | | |
| (St. John Fisher College Project) | | | | | | | | |
| Series A 5.50% 6/1/39 | | | 300,000 | | | $ | 302,697 | |
| (True North Rochester Preparatory Charter School Project) | | | | | | | | |
| Series A 144A 5.00% 6/1/40 # | | | 1,000,000 | | | | 986,800 | |
| Series A 144A 5.00% 6/1/59 # | | | 1,000,000 | | | | 926,420 | |
| (University of Rochester Project) | | | | | | | | |
| Series A 5.00% 7/1/37 | | | 1,000,000 | | | | 1,043,200 | |
| Nassau County, New York Local Economic Assistance Revenue | | | | | | | | |
| (Roosevelt Children’s Academy Charter School Project) | | | | | | | | |
| Series A 5.00% 7/1/55 | | | 1,750,000 | | | | 1,661,730 | |
| New York City, New York Trust for Cultural Resources Revenue | | | | | | | | |
| (Alvin Ailey Dance Foundation) | | | | | | | | |
| Series A 4.00% 7/1/46 | | | 1,000,000 | | | | 891,200 | |
| New York State Dormitory Authority Revenue | | | | | | | | |
| (Columbia University) | | | | | | | | |
| Series A 5.00% 10/1/50 | | | 2,325,000 | | | | 2,603,163 | |
| (Fordham University) | | | | | | | | |
| 5.00% 7/1/44 | �� | | 650,000 | | | | 653,790 | |
| (New York University) | | | | | | | | |
| 5.50% 7/1/40 (AMBAC) | | | 740,000 | | | | 859,591 | |
| New York State Dormitory Authority Revenue Non-State Supported Debt | | | | | | | | |
| (Hudson City School District) | | | | | | | | |
| Unrefunded Series A 5.625% 10/1/29 (AGC) | | | 375,000 | | | | 375,649 | |
| (New York State University Dormitory Facilities) | | | | | | | | |
| Series A 5.00% 7/1/37 | | | 2,200,000 | | | | 2,325,730 | |
| (New York University) | | | | | | | | |
| Series A 5.00% 7/1/36 | | | 2,000,000 | | | | 2,076,760 | |
| Series A 5.00% 7/1/39 | | | 2,000,000 | | | | 2,064,800 | |
| (Vaughn College of Aeronautics and Technology) | | | | | | | | |
| Series A 144A 5.50% 12/1/46 # | | | 300,000 | | | | 271,899 | |
| Saratoga County, New York Capital Resource Revenue | | | | | | | | |
| (Skidmore College Project) | | | | | | | | |
| 5.00% 7/1/43 | | | 3,570,000 | | | | 3,712,050 | |
| 5.00% 7/1/48 | | | 1,000,000 | | | | 1,035,140 | |
Schedules of investments
Delaware Tax-Free New York Fund
| | | Principal | | | | |
| | | amount° | | | Value (US $) | |
| Municipal Bonds (continued) | | | | | | |
| Education Revenue Bonds (continued) | | | | | | | | |
| St. Lawrence County, New York Industrial Development Agency Civic Development Revenue | | | | | | | | |
| (St. Lawrence University Project) | | | | | | | | |
| Series A 4.00% 7/1/43 | | | 1,000,000 | | | $ | 933,720 | |
| Tompkins County, New York Development Revenue | | | | | | | | |
| (Ithaca College Project) | | | | | | | | |
| 5.00% 7/1/34 | | | 750,000 | | | | 765,518 | |
| Westchester County, New York Local Development Revenue | | | | | | | | |
| (Pace University) | | | | | | | | |
| Series A 5.00% 5/1/34 | | | 1,725,000 | | | | 1,732,297 | |
| Yonkers, New York Economic Development Educational Revenue | | | | | | | | |
| (Lamartine/Warburton LLC - Charter School of Educational Excellence Project) | | | | | | | | |
| Series A 5.00% 10/15/49 | | | 640,000 | | | | 563,718 | |
| Series A 5.00% 10/15/50 | | | 250,000 | | | | 219,120 | |
| | | | | | | | 37,986,049 | |
| Electric Revenue Bonds — 5.88% | | | | | | | | |
| Build NYC, New York Resource Revenue | | | | | | | | |
| (Brooklyn Navy Yard Cogeneration Partners, L.P. Project) | | | | | | | | |
| 144A 5.25% 12/31/33 (AMT) # | | | 1,000,000 | | | | 913,990 | |
| Guam Power Authority Revenue | | | | | | | | |
| (Tax-Exempt Forward Delivery) | | | | | | | | |
| Series A 5.00% 10/1/35 | | | 1,310,000 | | | | 1,385,508 | |
| Long Island, New York Power Authority Electric System Revenue | | | | | | | | |
| 5.00% 9/1/37 | | | 450,000 | | | | 478,175 | |
| 5.00% 9/1/39 | | | 2,000,000 | | | | 2,104,400 | |
| 5.00% 9/1/47 | | | 1,500,000 | | | | 1,547,130 | |
| Series B 5.00% 9/1/41 | | | 2,065,000 | | | | 2,131,286 | |
| New York State Power Authority Revenue | | | | | | | | |
| Series A 4.00% 11/15/50 | | | 1,000,000 | | | | 954,510 | |
| (Green Transmission Project) | | | | | | | | |
| 4.00% 11/15/42 (AGM) | | | 1,000,000 | | | | 966,690 | |
| Puerto Rico Electric Power Authority Revenue | | | | | | | | |
| Series A 5.05% 7/1/42 ‡ | | | 65,000 | | | | 17,875 | |
| Series A 6.75% 7/1/36 ‡ | | | 625,000 | | | | 171,875 | |
| Series AAA 5.25% 7/1/25 ‡ | | | 35,000 | | | | 9,625 | |
| Series TT 5.00% 7/1/32 ‡ | | | 1,120,000 | | | | 308,000 | |
| Series WW 5.25% 7/1/33 ‡ | | | 195,000 | | | | 53,625 | |
| | | Principal | | | | |
| | | amount° | | | Value (US $) | |
| Municipal Bonds (continued) | | | | | | |
| Electric Revenue Bonds (continued) | | | | | | | | |
| Puerto Rico Electric Power Authority Revenue | | | | | | | | |
| Series WW 5.50% 7/1/17 ‡ | | | 420,000 | | | $ | 114,450 | |
| Series WW 5.50% 7/1/19 ‡ | | | 330,000 | | | | 89,925 | |
| Series XX 4.75% 7/1/26 ‡ | | | 40,000 | | | | 11,000 | |
| Series XX 5.25% 7/1/40 ‡ | | | 1,430,000 | | | | 393,250 | |
| Series ZZ 4.75% 7/1/27 ‡ | | | 30,000 | | | | 8,250 | |
| Series ZZ 5.00% 7/1/19 ‡ | | | 570,000 | | | | 155,325 | |
| Series ZZ 5.25% 7/1/24 ‡ | | | 50,000 | | | | 13,750 | |
| | | | | | | | 11,828,639 | |
| Healthcare Revenue Bonds — 9.41% | | | | | | | | |
| Buffalo & Erie County, New York Industrial Land Development Revenue | | | | | | | | |
| (Catholic Health System Project) | | | | | | | | |
| Series N 5.25% 7/1/35 | | | 250,000 | | | | 215,362 | |
| Build NYC, New York Resource Revenue | | | | | | | | |
| (The Children’s Aid Society Project) | | | | | | | | |
| 4.00% 7/1/49 | | | 1,000,000 | | | | 895,170 | |
| Dutchess County, New York Local Development Revenue | | | | | | | | |
| (Nuvance Health) | | | | | | | | |
| Series B 4.00% 7/1/49 | | | 1,000,000 | | | | 834,600 | |
| Guilderland, New York Industrial Development Agency Revenue | | | | | | | | |
| (Albany Place Development Project) | | | | | | | | |
| Series A 144A 5.875% 1/1/52 #, ‡ | | | 500,000 | | | | 325,000 | |
| Monroe County, New York Industrial Development Revenue | | | | | | | | |
| (Rochester General Hospital Project) | | | | | | | | |
| 5.00% 12/1/36 | | | 405,000 | | | | 409,390 | |
| 5.00% 12/1/46 | | | 540,000 | | | | 519,637 | |
| (Rochester Regional Health Project) | | | | | | | | |
| Series D 4.00% 12/1/38 | | | 2,550,000 | | | | 2,314,380 | |
| Nassau County, New York Local Economic Assistance Revenue | | | | | | | | |
| (Catholic Health Services of Long Island Obligated Group Project) | | | | | | | | |
| 5.00% 7/1/33 | | | 725,000 | | | | 730,133 | |
| New York State Dormitory Authority Revenue | | | | | | | | |
| (Maimonides Medical Center) | | | | | | | | |
| 3.00% 2/1/50 (FHA) | | | 3,135,000 | | | | 2,234,722 | |
| (Montefiore Obligated Group) | | | | | | | | |
| Series A 4.00% 8/1/38 | | | 1,000,000 | | | | 889,450 | |
| Series A 4.00% 9/1/50 | | | 2,500,000 | | | | 2,041,900 | |
Schedules of investments
Delaware Tax-Free New York Fund
| | | Principal | | | | |
| | | amount° | | | Value (US $) | |
| Municipal Bonds (continued) | | | | | | |
| Healthcare Revenue Bonds (continued) | | | | | | | | |
| New York State Dormitory Authority Revenue | | | | | | | | |
| (Northwell Health Obligated Group) | | | | | | | | |
| Series A 5.00% 5/1/52 | | | 3,000,000 | | | $ | 3,086,070 | |
| New York State Dormitory Authority Revenue Non-State Supported Debt | | | | | | | | |
| (NYU Hospitals Center) | | | | | | | | |
| Series A 4.00% 7/1/40 | | | 465,000 | | | | 441,769 | |
| (Orange Regional Medical Center Obligated Group) | | | | | | | | |
| 144A 5.00% 12/1/34 # | | | 800,000 | | | | 792,544 | |
| 144A 5.00% 12/1/45 # | | | 700,000 | | | | 642,271 | |
| Orange County, New York Funding Assisted Living Residence Revenue | | | | | | | | |
| (The Hamlet at Wallkill Assisted Living Project) | | | | | | | | |
| 6.50% 1/1/46 | | | 300,000 | | | | 236,400 | |
| Puerto Rico Industrial, Tourist, Educational, Medical & Environmental Control Facilities Financing Authority Revenue | | | | | | | | |
| (Hospital Auxilio Mutuo Obligated Group Project) | | | | | | | | |
| 4.00% 7/1/36 | | | 400,000 | | | | 366,184 | |
| Southold, New York Local Development Revenue | | | | | | | | |
| (Peconic Landing at Southold Project) | | | | | | | | |
| 5.00% 12/1/45 | | | 750,000 | | | | 692,205 | |
| Westchester County, New York Local Development Revenue | | | | | | | | |
| (Purchase Senior Learning Community, Inc. Project) | | | | | | | | |
| Series A 144A 5.00% 7/1/46 # | | | 615,000 | | | | 499,103 | |
| Series A 144A 5.00% 7/1/56 # | | | 1,000,000 | | | | 773,180 | |
| | | | | | | | 18,939,470 | |
| Housing Revenue Bonds — 2.43% | | | | | | | | |
| New York City, New York Housing Development Revenue | | | | | | | | |
| (Sustainable Development Bonds) | | | | | | | | |
| 4.80% 2/1/53 | | | 1,750,000 | | | | 1,756,440 | |
| Series A 5.00% 5/1/63 | | | 2,125,000 | | | | 2,138,324 | |
| New York State Mortgage Agency Homeowner Revenue | | | | | | | | |
| (Social Bonds) | | | | | | | | |
| Series 250 4.80% 10/1/48 | | | 1,000,000 | | | | 1,004,760 | |
| | | | | | | | 4,899,524 | |
| | | Principal | | | | |
| | | amount° | | | Value (US $) | |
| Municipal Bonds (continued) | | | | | | |
| Industrial Development Revenue/Pollution Control | | | | | | | | |
| Revenue Bonds — 9.17% | | | | | | | | |
| Children’s Trust Fund Revenue, Commonwealth of Puerto Rico | | | | | | | | |
| (Tobacco Settlement Asset-Backed) | | | | | | | | |
| Series A 8.21% 5/15/57 ^ | | | 48,900,000 | | | $ | 3,400,506 | |
| Erie County, New York Tobacco Asset Securitization Revenue | | | | | | | | |
| (Asset-Backed) | | | | | | | | |
| Series A 144A 5.84% 6/1/60 #, ^ | | | 65,350,000 | | | | 3,766,120 | |
| New York City, New York Industrial Development Agency Revenue | | | | | | | | |
| (Queens Baseball Stadium Project) | | | | | | | | |
| Series A 3.00% 1/1/46 (AGM) | | | 2,000,000 | | | | 1,478,420 | |
| (Yankee Stadium Project) | | | | | | | | |
| Series A 3.00% 3/1/40 (AGM) | | | 1,000,000 | | | | 803,010 | |
| Series A 4.00% 3/1/45 (AGM) | | | 1,000,000 | | | | 934,290 | |
| New York Counties Tobacco Trust V Pass-Through Revenue | | | | | | | | |
| (Subordinate Turbo CABs) | | | | | | | | |
| Series S4B 144A 0.971% 6/1/60 #, t, ^ | | | 39,000,000 | | | | 1,602,120 | |
| New York Transportation Development Special Facilities Revenue | | | | | | | | |
| (Delta Airlines - LaGuardia Airport Terminals C&D Redevelopment Project) | | | | | | | | |
| 5.00% 1/1/36 (AMT) | | | 2,015,000 | | | | 2,054,574 | |
| (Terminal 4 John F. Kennedy International Airport Project) | | | | | | | | |
| 5.00% 12/1/37 (AMT) | | | 340,000 | | | | 353,325 | |
| Suffolk County, New York Tobacco Asset Securitization Revenue | | | | | | | | |
| Senior Series A-2 4.00% 6/1/50 | | | 1,595,000 | | | | 1,397,316 | |
| TSASC, New York | | | | | | | | |
| Fiscal 2017 Senior Series A 5.00% 6/1/41 | | | 1,900,000 | | | | 1,923,731 | |
| Westchester County, New York Tobacco Asset Securitization Revenue | | | | | | | | |
| Subordinate Series C 5.00% 6/1/45 | | | 750,000 | | | | 750,030 | |
| | | | | | | | 18,463,442 | |
| Lease Revenue Bonds — 7.33% | | | | | | | | |
| Hudson Yards, New York Infrastructure Revenue | | | | | | | | |
| (Tax-Exempt) | | | | | | | | |
| Series A 4.00% 2/15/44 | | | 2,875,000 | | | | 2,681,110 | |
Schedules of investments
Delaware Tax-Free New York Fund
| | | Principal | | | | |
| | | amount° | | | Value (US $) | |
| Municipal Bonds (continued) | | | | | | |
| Lease Revenue Bonds (continued) | | | | | | | | |
| New York City, New York Industrial Development Agency Revenue | | | | | | | | |
| (Senior Trips) | | | | | | | | |
| Series A 5.00% 7/1/28 (AMT) | | | 1,290,000 | | | $ | 1,290,077 | |
| New York Liberty Development Revenue | | | | | | | | |
| (4 World Trade Center - Green Bond) | | | | | | | | |
| Series A 2.875% 11/15/46 (BAM) | | | 1,620,000 | | | | 1,193,244 | |
| (Class 1 - 3 World Trade Center Project) | | | | | | | | |
| 144A 5.00% 11/15/44 # | | | 4,000,000 | | | | 3,828,320 | |
| (Class 2 - 3 World Trade Center Project) | | | | | | | | |
| 144A 5.375% 11/15/40 # | | | 500,000 | | | | 496,355 | |
| (Class 3 - 3 World Trade Center Project) | | | | | | | | |
| 144A 7.25% 11/15/44 # | | | 1,500,000 | | | | 1,513,545 | |
| New York State Dormitory Authority Revenue Non-State Supported Debt | | | | | | | | |
| (Court Facility) | | | | | | | | |
| Series A 5.50% 5/15/27 (AMBAC) | | | 2,500,000 | | | | 2,697,300 | |
| New York State Environmental Facilities Clean Water and Drinking Water Revenue | | | | | | | | |
| (New York City Municipal Water Finance Authority Projects - Second Resolution) | | | | | | | | |
| Series B 5.00% 6/15/43 | | | 1,000,000 | | | | 1,059,750 | |
| | | | | | | | 14,759,701 | |
| Local General Obligation Bonds — 2.84% | | | | | | | | |
| New York City, New York | | | | | | | | |
| Fiscal 2018 Subordinate Series F-1 5.00% 4/1/35 | | | 1,895,000 | | | | 2,022,609 | |
| Fiscal 2018 Subordinate Series F-1 5.00% 4/1/39 | | | 1,000,000 | | | | 1,046,910 | |
| Fiscal 2023 Subordinate Series B-1 5.25% 10/1/47 | | | 1,500,000 | | | | 1,626,315 | |
| Series F-1 3.00% 3/1/51 (BAM) | | | 1,360,000 | | | | 1,015,526 | |
| | | | | | | | 5,711,360 | |
| Pre-Refunded Bonds — 1.01% | | | | | | | | |
| Dutchess County, New York Local Development | | | | | | | | |
| (Health Quest Systems Project) | | | | | | | | |
| Series A 5.00% 7/1/44-24 § | | | 1,000,000 | | | | 1,013,650 | |
| New York State Dormitory Authority | | | | | | | | |
| (Touro College & University) | | | | | | | | |
| Series A 5.50% 1/1/44-24 § | | | 1,000,000 | | | | 1,017,670 | |
| | | | | | | | 2,031,320 | |
| | | Principal | | | | |
| | | amount° | | | Value (US $) | |
| Municipal Bonds (continued) | | | | | | |
| Resource Recovery Revenue Bond — 0.65% | | | | | | | | |
| Niagara Area, New York Development Revenue | | | | | | | | |
| (Covanta Project) | | | | | | | | |
| Series A 144A 4.75% 11/1/42 (AMT) # | | | 1,500,000 | | | $ | 1,311,300 | |
| | | | | | | | 1,311,300 | |
| Special Tax Revenue Bonds — 23.90% | | | | | | | | |
| Commonwealth of Puerto Rico Revenue | | | | | | | | |
| 3.799% 11/1/51 • | | | 995,550 | | | | 414,398 | |
| (Restructured) | | | | | | | | |
| 3.154% 11/1/43 • | | | 4,048,909 | | | | 2,090,249 | |
| GDB Debt Recovery Authority of Puerto Rico Revenue | | | | | | | | |
| (Taxable) | | | | | | | | |
| 7.50% 8/20/40 | | | 6,563,763 | | | | 5,365,876 | |
| Glen Cove, New York Local Economic Assistance Revenue | | | | | | | | |
| (Garvies Point Public Improvement Project) | | | | | | | | |
| Series A 5.00% 1/1/56 | | | 250,000 | | | | 213,848 | |
| Matching Fund Special Purpose Securitization, Virgin Islands | | | | | | | | |
| Series A 5.00% 10/1/32 | | | 500,000 | | | | 501,790 | |
| New York City, New York Transitional Finance Authority Building Aid Revenue | | | | | | | | |
| Fiscal 2019 Subordinate Series S-3A 5.00% 7/15/37 | | | 1,000,000 | | | | 1,060,060 | |
| New York City, New York Transitional Finance Authority Future Tax Secured Revenue | | | | | | | | |
| Fiscal 2015 Subordinate Series B-1 5.00% 8/1/42 | | | 2,000,000 | | | | 2,014,080 | |
| Fiscal 2016 Subordinate Series C-1 4.00% 11/1/42 | | | 500,000 | | | | 487,920 | |
| Fiscal 2020 Subordinate Series A-3 3.00% 5/1/45 | | | 2,000,000 | | | | 1,541,020 | |
| New York Convention Center Development Revenue | | | | | | | | |
| (Hotel Unit Fee Secured) | | | | | | | | |
| 5.00% 11/15/35 | | | 1,000,000 | | | | 1,019,150 | |
| 5.00% 11/15/40 | | | 1,000,000 | | | | 1,013,660 | |
| New York Metropolitan Transportation Authority Revenue | | | | | | | | |
| (Climate Bond Certified - Green Bonds) | | | | | | | | |
| Subordinate Series B-2 5.00% 11/15/36 | | | 1,500,000 | | | | 1,567,200 | |
| New York State Dormitory Authority Personal Income Tax Revenue | | | | | | | | |
| (General Purpose) | | | | | | | | |
| Series A 4.00% 3/15/49 | | | 1,000,000 | | | | 940,610 | |
| Series A 5.00% 3/15/40 | | | 5,000,000 | | | | 5,272,750 | |
| Series E 3.00% 3/15/50 | | | 1,500,000 | | | | 1,098,645 | |
| Series E 4.00% 3/15/48 | | | 1,000,000 | | | | 943,280 | |
Schedules of investments
Delaware Tax-Free New York Fund
| | | Principal | | | | |
| | | amount° | | | Value (US $) | |
| Municipal Bonds (continued) | | | | | | |
| Special Tax Revenue Bonds (continued) | | | | | | | | |
| New York State Dormitory Authority Revenue Non-State Supported Debt | | | | | | | | |
| (New York State University Dormitory Facilities) | | | | | | | | |
| Series A 5.00% 7/1/42 | | | 1,300,000 | | | $ | 1,347,450 | |
| New York State Thruway Authority State Personal Income Tax Revenue | | | | | | | | |
| (Climate Bond Certified - Green Bonds) | | | | | | | | |
| Series C 5.00% 3/15/55 | | | 1,000,000 | | | | 1,051,110 | |
| New York Triborough Bridge & Tunnel Authority Sales Tax Revenue | | | | | | | | |
| (TBTA Capital Lockbox - City Sales Tax) | | | | | | | | |
| Series A 4.00% 5/15/48 | | | 2,000,000 | | | | 1,905,280 | |
| Series A 4.00% 5/15/57 | | | 1,000,000 | | | | 933,270 | |
| Puerto Rico Sales Tax Financing Revenue | | | | | | | | |
| (Restructured) | | | | | | | | |
| Series A-1 1.941% 7/1/51 ^ | | | 6,855,000 | | | | 1,416,791 | |
| Series A-1 4.55% 7/1/40 | | | 444,000 | | | | 432,909 | |
| Series A-1 4.75% 7/1/53 | | | 6,805,000 | | | | 6,379,483 | |
| Series A-1 5.00% 7/1/58 | | | 3,665,000 | | | | 3,556,516 | |
| Series A-1 5.791% 7/1/46 ^ | | | 13,880,000 | | | | 3,865,858 | |
| Series A-2 4.329% 7/1/40 | | | 480,000 | | | | 455,808 | |
| Series A-2 4.536% 7/1/53 | | | 1,330,000 | | | | 1,203,703 | |
| | | | | | | | 48,092,714 | |
| State General Obligation Bonds — 1.34% | | | | | | | | |
| Commonwealth of Puerto Rico | | | | | | | | |
| (Restructured) | | | | | | | | |
| Series A-1 4.00% 7/1/41 | | | 1,445,926 | | | | 1,250,365 | |
| Series A-1 4.00% 7/1/46 | | | 1,730,000 | | | | 1,440,173 | |
| | | | | | | | 2,690,538 | |
| Transportation Revenue Bonds — 10.93% | | | | | | | | |
| New York Metropolitan Transportation Authority Revenue | | | | | | | | |
| Series A-2 4.00% 11/15/43 | | | 2,500,000 | | | | 2,316,425 | |
| (Climate Bond Certified - Green Bonds) | | | | | | | | |
| Series 1 4.00% 11/15/46 | | | 3,250,000 | | | | 2,957,565 | |
| Series B 4.00% 11/15/50 | | | 1,000,000 | | | | 892,640 | |
| Series E 4.00% 11/15/45 | | | 1,500,000 | | | | 1,373,625 | |
| Subordinate Series C-1 5.25% 11/15/55 | | | 1,500,000 | | | | 1,543,305 | |
| New York State Thruway Authority General Revenue | | | | | | | | |
| Series B 4.00% 1/1/50 | | | 1,000,000 | | | | 915,800 | |
| (Junior Indebtedness Obligation) | | | | | | | | |
| Series B 4.00% 1/1/45 | | | 1,500,000 | | | | 1,398,990 | |
| | | Principal | | | | |
| | | amount° | | | Value (US $) | |
| Municipal Bonds (continued) | | | | | | |
| Transportation Revenue Bonds (continued) | | | | | | | | |
| New York Transportation Development Special Facilities Revenue | | | | | | | | |
| (Delta Airlines - LaGuardia Airport Terminals C&D Redevelopment Project) | | | | | | | | |
| 4.00% 1/1/36 (AMT) | | | 750,000 | | | $ | 719,183 | |
| (LaGuardia Airport Terminal B Redevelopment Project) | | | | | | | | |
| Series A 5.25% 1/1/50 (AMT) | | | 1,000,000 | | | | 999,980 | |
| (Terminal 4 John F. Kennedy International Airport Project) | | | | | | | | |
| 5.00% 12/1/32 (AMT) | | | 2,000,000 | | | | 2,152,520 | |
| Series A 4.00% 12/1/40 (AMT) | | | 335,000 | | | | 310,568 | |
| New York Triborough Bridge & Tunnel Authority Revenue | | | | | | | | |
| (MTA Bridges and Tunnels Climate Bond Certified - Green Bonds) | | | | | | | | |
| Series D-2 5.50% 5/15/52 | | | 1,000,000 | | | | 1,104,050 | |
| (MTA Bridges and Tunnels) | | | | | | | | |
| Series A 5.00% 11/15/41 | | | 2,000,000 | | | | 2,057,420 | |
| Niagara, New York Frontier Transportation Authority Revenue | | | | | | | | |
| (Buffalo Niagara International Airport) | | | | | | | | |
| Series A 5.00% 4/1/35 (AMT) | | | 775,000 | | | | 807,186 | |
| Series A 5.00% 4/1/37 (AMT) | | | 750,000 | | | | 772,395 | |
| Series A 5.00% 4/1/39 (AMT) | | | 350,000 | | | | 356,972 | |
| Port Authority of New York & New Jersey | | | | | | | | |
| Two Hundred Twenty-First Series 4.00% | | | | | | | | |
| 7/15/60 (AMT) | | | 1,130,000 | | | | 992,061 | |
| Puerto Rico Highway & Transportation Authority Revenue | | | | | | | | |
| (Restructured) | | | | | | | | |
| Series C 0.00% 7/1/53 ~ | | | 500,000 | | | | 316,875 | |
| | | | | | | | 21,987,560 | |
| Water & Sewer Revenue Bonds — 2.76% | | | | | | | | |
| New York City, New York Municipal Water Finance Authority Revenue | | | | | | | | |
| (Second General Resolution) | | | | | | | | |
| Series GG 4.00% 6/15/50 | | | 1,000,000 | | | | 946,630 | |
| New York City, New York Municipal Water Finance Authority Water & Sewer System Revenue | | | | | | | | |
| (Second General Resolution) | | | | | | | | |
| Fiscal 2017 Series DD 5.00% 6/15/47 | | | 1,000,000 | | | | 1,033,450 | |
| Fiscal 2018 Series EE 5.00% 6/15/40 | | | 2,500,000 | | | | 2,617,500 | |
Schedules of investments
Delaware Tax-Free New York Fund
| | | Principal | | | | |
| | | amount° | | | Value (US $) | |
| Municipal Bonds (continued) | | | | | | |
| Water & Sewer Revenue Bonds (continued) | | | | | | | | |
| New York City, New York Municipal Water Finance Authority Water & Sewer System Revenue | | | | | | | | |
| (Second General Resolution) | | | | | | | | |
| Fiscal 2019 Subordinate Series FF-1 4.00% 6/15/49 | | | 1,000,000 | | | $ | 949,990 | |
| | | | | | | | 5,547,570 | |
| Total Municipal Bonds (cost $204,505,531) | | | | | | | 194,249,187 | |
| | | | | | | | | |
| Short-Term Investments — 1.90% | | | | | | | | |
| Variable Rate Demand Notes — 1.90%¤ | | | | | | | | |
| New York City, New York | | | | | | | | |
| Fiscal 2006 Subordinate Series I-4 3.90% 4/1/36 (LOC - TD Bank, N.A.) | | | 550,000 | | | | 550,000 | |
| Fiscal 2014 Subordinate Series D-4 3.90% 8/1/40 (LOC - TD Bank, N.A.) | | | 200,000 | | | | 200,000 | |
| Fiscal 2015 Subordinate Series F-5 3.95% 6/1/44 (SPA - Barclays Bank) | | | 500,000 | | | | 500,000 | |
| Fiscal 2023 Subordinate Series A-4 3.90% 9/1/49 (SPA - TD Bank, N.A.) | | | 800,000 | | | | 800,000 | |
| New York City, New York Municipal Water Finance Authority Water & Sewer System Revenue | | | | | | | | |
| (Second General Resolution) Fiscal 2011 Series DD | | | | | | | | |
| 3.90% 6/15/43 | | | | | | | | |
| (SPA - TD Bank, N.A.) | | | 680,000 | | | | 680,000 | |
| (Second General Resolution) Fiscal 2023 Subordinate | | | | | | | | |
| Series BB-2 3.85% 6/15/44 | | | | | | | | |
| (SPA - Mizuho Bank) | | | 1,100,000 | | | | 1,100,000 | |
| Total Short-Term Investments (cost $3,830,000) | | | | | | | 3,830,000 | |
| Total Value of Securities—98.43% | | | | | | | | |
| (cost $208,335,531) | | | | | | $ | 198,079,187 | |
| ° | Principal amount shown is stated in USD unless noted that the security is denominated in another currency. |
| # | Security exempt from registration under Rule 144A of the Securities Act of 1933, as amended. At August 31, 2023, the aggregate value of Rule 144A securities was $21,355,757, which represents 10.61% of the Fund’s net assets. See Note 8 in “Notes to financial statements.” |
| ‡ | Non-income producing security. Security is currently in default. |
| ^ | Zero-coupon security. The rate shown is the effective yield at the time of purchase. |
| t | Pass Through Agreement. Security represents the contractual right to receive a proportionate amount of underlying payments due to the counterparty pursuant to various agreements related to the rescheduling of obligations and the exchange of certain notes. |
| § | Pre-refunded bonds. Municipal bonds that are generally backed or secured by US Treasury bonds. For pre-refunded bonds, the stated maturity is followed by the year in which the bond will be pre-refunded. See Note 8 in “Notes to financial statements.” |
| • | Variable rate investment. Rates reset periodically. Rate shown reflects the rate in effect at August 31, 2023. For securities based on a published reference rate and spread, the reference rate and spread are indicated in their descriptions. The reference rate descriptions (i.e. SOFR01M, SOFR03M, etc.) used in this report are identical for different securities, but the underlying reference rates may differ due to the timing of the reset period. Certain variable rate securities are not based on a published reference rate and spread but are determined by the issuer or agent and are based on current market conditions, or for mortgage-backed securities, are impacted by the individual mortgages which are paying off over time. These securities do not indicate a reference rate and spread in their descriptions. |
| ~ | Step-up bond that pays an initial coupon rate for the first period and then a higher coupon rate for the following periods. Stated rate in effect at August 31, 2023. |
| ¤ | Tax-exempt obligations that contain a floating or variable interest rate adjustment formula and an unconditional right of demand to receive payment of the unpaid principal balance plus accrued interest upon a short notice period (generally up to 30 days) prior to specified dates either from the issuer or by drawing on a bank letter of credit, a guarantee, or insurance issued with respect to such instrument. Each rate shown is as of August 31, 2023. |
Schedules of investments
Delaware Tax-Free New York Fund
Summary of abbreviations:
AGC – Insured by Assured Guaranty Corporation
AGM – Insured by Assured Guaranty Municipal Corporation
AMBAC – Insured by AMBAC Assurance Corporation
AMT – Subject to Alternative Minimum Tax
BAM – Insured by Build America Mutual Assurance
FHA – Federal Housing Administration
KIPP – Knowledge is Power Program
LLC – Limited Liability Corporation
LOC – Letter of Credit
N.A. – National Association
SOFR01M – Secured Overnight Financing Rate 1 Month
SOFR03M – Secured Overnight Financing Rate 3 Month
SPA – Stand-by Purchase Agreement
USD – US Dollar
See accompanying notes, which are an integral part of the financial statements.
| Schedules of investments | |
| Delaware Tax-Free Pennsylvania Fund | August 31, 2023 |
| | | Principal | | | | |
| | | amount° | | | Value (US $) | |
| Municipal Bonds — 98.49% | | | | | | |
| Education Revenue Bonds — 9.57% | | | | | | | | |
| Allegheny County, Pennsylvania Higher Education Building Authority Revenue | | | | | | | | |
| (Robert Morris University) | | | | | | | | |
| 5.00% 10/15/47 | | | 1,500,000 | | | $ | 1,360,065 | |
| Bucks County, Pennsylvania Industrial Development Authority Revenue | | | | | | | | |
| (School Lane Charter School Project) | | | | | | | | |
| Series A 5.125% 3/15/46 | | | 2,500,000 | | | | 2,410,025 | |
| Chester County, Pennsylvania Industrial Development Authority Revenue | | | | | | | | |
| (Avon Grove Charter School Project) | | | | | | | | |
| Series A 5.00% 12/15/47 | | | 1,160,000 | | | | 1,084,577 | |
| Series A 5.00% 12/15/51 | | | 770,000 | | | | 709,285 | |
| (Renaissance Academy Charter School Project) | | | | | | | | |
| 5.00% 10/1/34 | | | 1,000,000 | | | | 996,150 | |
| 5.00% 10/1/39 | | | 1,250,000 | | | | 1,172,400 | |
| 5.00% 10/1/44 | | | 1,000,000 | | | | 912,110 | |
| (Westtown School) | | | | | | | | |
| Series A 4.00% 1/1/52 | | | 2,250,000 | | | | 2,062,305 | |
| City of Erie, Pennsylvania Higher Education Building Authority Revenue | | | | | | | | |
| (AICUP Financing Program - Gannon University Project) | | | | | | | | |
| Series TT1 4.00% 5/1/41 | | | 475,000 | | | | 394,269 | |
| City of Philadelphia, Pennsylvania Authority for Industrial Development Revenue | | | | | | | | |
| (First Philadelphia Preparatory Charter School Project) | | | | | | | | |
| Series A 7.25% 6/15/43 | | | 2,870,000 | | | | 2,928,691 | |
| (International Apartments of Temple University) | | | | | | | | |
| Series A 5.375% 6/15/30 | | | 1,145,000 | | | | 1,124,837 | |
| Series A 5.625% 6/15/42 | | | 3,000,000 | | | | 2,750,730 | |
| (Saint Joseph’s University Project) | | | | | | | | |
| 5.50% 11/1/60 | | | 6,000,000 | | | | 6,307,620 | |
| Montgomery County, Pennsylvania Higher Education and Health Authority Revenue | | | | | | | | |
| (AICUP Financing Program - Gwynedd Mercy University Project) | | | | | | | | |
| 5.00% 5/1/42 | | | 2,500,000 | | | | 2,313,925 | |
| (Arcadia University) | | | | | | | | |
| 5.75% 4/1/40 | | | 2,000,000 | | | | 2,000,300 | |
Schedules of investments
Delaware Tax-Free Pennsylvania Fund
| | | Principal | | | | |
| | | amount° | | | Value (US $) | |
| Municipal Bonds (continued) | | | | | | |
| Education Revenue Bonds (continued) | | | | | | | | |
| Montgomery County, Pennsylvania Industrial Development Authority Revenue | | | | | | | | |
| (Germantown Academy Project) | | | | | | | | |
| Series A 4.00% 10/1/51 | | | 1,430,000 | | | $ | 1,084,083 | |
| Northeastern Pennsylvania Hospital and Education Authority Revenue | | | | | | | | |
| (King’s College Project) | | | | | | | | |
| 5.00% 5/1/44 | | | 1,000,000 | | | | 918,670 | |
| Pennsylvania Higher Educational Facilities Authority Revenue | | | | | | | | |
| (Ursinus College Project) | | | | | | | | |
| Series A 5.00% 11/1/32 | | | 1,130,000 | | | | 1,181,189 | |
| Pennsylvania State University | | | | | | | | |
| Series A 5.25% 9/1/52 | | | 2,000,000 | | | | 2,167,140 | |
| Upper Dauphin, Pennsylvania Industrial Development Authority Revenue | | | | | | | | |
| (Pennsylvania Steam Academy Charter School Project) | | | | | | | | |
| Series A 144A 6.25% 7/1/57 # | | | 2,500,000 | | | | 2,270,850 | |
| Series B 144A 6.00% 7/1/29 # | | | 235,000 | | | | 224,888 | |
| | | | | | | | 36,374,109 | |
| Electric Revenue Bonds — 1.09% | | | | | | | | |
| City of Philadelphia, Pennsylvania Gas Works Revenue | | | | | | | | |
| (1998 General Ordinance) | | | | | | | | |
| Sixteenth Series A 4.00% 8/1/45 (AGM) | | | 1,950,000 | | | | 1,839,533 | |
| Sixteenth Series B 4.00% 8/1/39 (AGM) | | | 1,300,000 | | | | 1,270,789 | |
| Puerto Rico Electric Power Authority Revenue | | | | | | | | |
| Series A 5.00% 7/1/42 ‡ | | | 1,110,000 | | | | 305,250 | |
| Series A 5.05% 7/1/42 ‡ | | | 400,000 | | | | 110,000 | |
| Series WW 5.25% 7/1/33 ‡ | | | 1,055,000 | | | | 290,125 | |
| Series WW 5.50% 7/1/38 ‡ | | | 1,190,000 | | | | 327,250 | |
| | | | | | | | 4,142,947 | |
| Healthcare Revenue Bonds — 33.19% | | | | | | | | |
| Allegheny County, Pennsylvania Hospital Development Authority Revenue | | | | | | | | |
| (Allegheny Health Network Obligated Group Issue) | | | | | | | | |
| Series A 4.00% 4/1/44 | | | 2,300,000 | | | | 1,991,156 | |
| Series A 5.00% 4/1/47 | | | 13,240,000 | | | | 13,240,927 | |
| (University of Pittsburgh Medical Center) | | | | | | | | |
| Series A 4.00% 7/15/38 | | | 1,125,000 | | | | 1,074,611 | |
| Series A 4.00% 7/15/39 | | | 2,000,000 | | | | 1,894,040 | |
| | | Principal | | | | |
| | | amount° | | | Value (US $) | |
| Municipal Bonds (continued) | | | | | | |
| Healthcare Revenue Bonds (continued) | | | | | | | | |
| Berks County, Pennsylvania Industrial Development Authority Revenue | | | | | | | | |
| (The Highlands at Wyomissing) | | | | | | | | |
| Series A 5.00% 5/15/37 | | | 1,365,000 | | | $ | 1,320,214 | |
| Series A 5.00% 5/15/42 | | | 470,000 | | | | 433,439 | |
| Series A 5.00% 5/15/47 | | | 600,000 | | | | 535,710 | |
| Series C 5.00% 5/15/42 | | | 1,000,000 | | | | 922,210 | |
| Series C 5.00% 5/15/47 | | | 1,000,000 | | | | 892,850 | |
| Bucks County, Pennsylvania Industrial Development Authority Revenue | | | | | | | | |
| (St. Luke’s University Health Network Project) | | | | | | | | |
| 4.00% 8/15/44 (BAM) | | | 2,400,000 | | | | 2,215,488 | |
| 4.00% 8/15/50 | | | 1,400,000 | | | | 1,197,476 | |
| 4.00% 8/15/50 (BAM) | | | 1,600,000 | | | | 1,452,320 | |
| Butler County, Pennsylvania Hospital Authority Revenue | | | | | | | | |
| (Butler Health System Project) | | | | | | | | |
| Series A 5.00% 7/1/39 | | | 1,625,000 | | | | 1,485,136 | |
| Centre County, Pennsylvania Hospital Authority Revenue | | | | | | | | |
| (Mount Nittany Medical Center Project) | | | | | | | | |
| Series A 4.00% 11/15/47 | | | 1,400,000 | | | | 1,275,792 | |
| Chester County, Pennsylvania Health and Education Facilities Authority Revenue | | | | | | | | |
| (Main Line Health System) | | | | | | | | |
| Series A 4.00% 9/1/50 | | | 2,060,000 | | | | 1,837,376 | |
| Chester County, Pennsylvania Industrial Development Authority Revenue | | | | | | | | |
| (Longwood Gardens, Inc. Project) | | | | | | | | |
| 4.00% 12/1/46 | | | 1,330,000 | | | | 1,258,712 | |
| City of DuBois, Pennsylvania Hospital Authority Revenue | | | | | | | | |
| (Penn Highlands Healthcare) | | | | | | | | |
| 4.00% 7/15/45 | | | 1,495,000 | | | | 1,324,540 | |
| 4.00% 7/15/48 | | | 2,000,000 | | | | 1,743,580 | |
| City of Philadelphia, Pennsylvania Authority for Industrial Development Revenue | | | | | | | | |
| (Thomas Jefferson University) | | | | | | | | |
| Series A 5.00% 9/1/47 | | | 2,500,000 | | | | 2,510,500 | |
| (Wesley Enhanced Living Obligated Group) | | | | | | | | |
| Series A 5.00% 7/1/49 | | | 2,500,000 | | | | 1,972,050 | |
| Cumberland County, Pennsylvania Municipal Authority Revenue | | | | | | | | |
| (Asbury Pennsylvania Obligated Group) | | | | | | | | |
| 5.00% 1/1/45 | | | 3,000,000 | | | | 2,539,410 | |
Schedules of investments
Delaware Tax-Free Pennsylvania Fund
| | | Principal | | | | |
| | | amount° | | | Value (US $) | |
| Municipal Bonds (continued) | | | | | | |
| Healthcare Revenue Bonds (continued) | | | | | | | | |
| Cumberland County, Pennsylvania Municipal Authority Revenue | | | | | | | | |
| (Diakon Lutheran Social Ministries) | | | | | | | | |
| 5.00% 1/1/38 | | | 995,000 | | | $ | 994,920 | |
| (Penn State Health) | | | | | | | | |
| Series A 4.00% 11/1/44 | | | 5,000,000 | | | | 4,528,550 | |
| Geisinger Authority, Pennsylvania Health System Revenue | | | | | | | | |
| (Geisinger Health System) | | | | | | | | |
| Series A-2 5.00% 2/15/39 | | | 1,150,000 | | | | 1,172,712 | |
| Lancaster County, Pennsylvania Hospital Authority Revenue | | | | | | | | |
| (Brethren Village Project) | | | | | | | | |
| 5.00% 7/1/31 | | | 130,000 | | | | 122,975 | |
| 5.25% 7/1/35 | | | 250,000 | | | | 238,535 | |
| 5.50% 7/1/45 | | | 1,000,000 | | | | 920,140 | |
| (Landis Homes Retirement Community Project) | | | | | | | | |
| Series A 5.00% 7/1/45 | | | 2,000,000 | | | | 1,796,340 | |
| (Masonic Villages Project) | | | | | | | | |
| 5.00% 11/1/35 | | | 1,000,000 | | | | 1,022,500 | |
| 5.00% 11/1/36 | | | 510,000 | | | | 518,532 | |
| 5.00% 11/1/37 | | | 250,000 | | | | 252,880 | |
| Lehigh County, Pennsylvania General Purpose Hospital Authority Revenue | | | | | | | | |
| (Lehigh Valley Health Network) | | | | | | | | |
| Series A 4.00% 7/1/49 | | | 11,105,000 | | | | 10,035,033 | |
| Maxatawny Township, Pennsylvania Municipal Authority Revenue | | | | | | | | |
| (Diakon Lutheran Social Ministries Project) | | | | | | | | |
| Series A 4.50% 1/1/45 | | | 2,000,000 | | | | 1,721,300 | |
| Monroe County, Pennsylvania Hospital Authority Revenue | | | | | | | | |
| (Pocono Medical Center) | | | | | | | | |
| 5.00% 7/1/41 | | | 1,000,000 | | | | 1,001,230 | |
| Monroeville, Pennsylvania Finance Authority Revenue | | | | | | | | |
| Series B 4.00% 2/15/41 | | | 2,100,000 | | | | 1,967,574 | |
| Montgomery County, Pennsylvania Higher Education and Health Authority Revenue | | | | | | | | |
| (Thomas Jefferson University) | | | | | | | | |
| Series A 4.00% 9/1/49 | | | 2,500,000 | | | | 2,233,150 | |
| Series B 4.00% 5/1/47 | | | 4,000,000 | | | | 3,613,560 | |
| Series B 4.00% 5/1/52 | | | 5,950,000 | | | | 5,184,651 | |
| Series B 4.00% 5/1/56 | | | 2,550,000 | | | | 2,185,121 | |
| | | Principal | | | | |
| | | amount° | | | Value (US $) | |
| Municipal Bonds (continued) | | | | | | |
| Healthcare Revenue Bonds (continued) | | | | | | | | |
| Montgomery County, Pennsylvania Higher Education and Health Authority Revenue | | | | | | | | |
| (Thomas Jefferson University) | | | | | | | | |
| Series B 5.00% 5/1/57 | | | 3,000,000 | | | $ | 3,031,200 | |
| Montgomery County, Pennsylvania Industrial Development Authority Revenue | | | | | | | | |
| (Foulkeways at Gwynedd Project) | | | | | | | | |
| 5.00% 12/1/46 | | | 1,500,000 | | | | 1,393,425 | |
| (Waverly Heights Project) | | | | | | | | |
| 5.00% 12/1/44 | | | 500,000 | | | | 501,495 | |
| 5.00% 12/1/49 | | | 1,250,000 | | | | 1,245,050 | |
| (Whitemarsh Continuing Care Retirement Community Project) | | | | | | | | |
| 4.00% 1/1/25 | | | 145,000 | | | | 142,361 | |
| 5.375% 1/1/50 | | | 4,000,000 | | | | 3,404,720 | |
| Series A 5.25% 1/1/48 | | | 1,000,000 | | | | 844,950 | |
| Series A 5.375% 1/1/51 | | | 1,600,000 | | | | 1,355,008 | |
| Moon, Pennsylvania Industrial Development Authority Revenue | | | | | | | | |
| (Baptist Homes Society) | | | | | | | | |
| 6.125% 7/1/50 | | | 4,090,000 | | | | 2,934,330 | |
| Northampton County, Pennsylvania Industrial Development Authority Revenue | | | | | | | | |
| (Morningstar Senior Living, Inc. Project) | | | | | | | | |
| 5.00% 11/1/44 | | | 1,000,000 | | | | 852,230 | |
| Pennsylvania Economic Development Financing Authority First Mortgage Revenue | | | | | | | | |
| (Tapestry Moon Senior Housing Project) | | | | | | | | |
| Series A 144A 6.50% 12/1/38 #, ‡ | | | 715,000 | | | | 272,594 | |
| Series A 144A 6.75% 12/1/53 #, ‡ | | | 5,400,000 | | | | 2,058,750 | |
| Pennsylvania Economic Development Financing Authority Revenue | | | | | | | | |
| (Presbyterian Senior Living Project) | | | | | | | | |
| Series B-1 5.25% 7/1/49 | | | 2,500,000 | | | | 2,482,325 | |
| Series B-2 5.25% 7/1/46 | | | 2,500,000 | | | | 2,503,300 | |
| (University of Pittsburgh Medical Center) | | | | | | | | |
| Series A 4.00% 11/15/42 | | | 5,200,000 | | | | 4,839,120 | |
| Subordinate Series A-2 4.00% 5/15/48 | | | 2,250,000 | | | | 2,035,440 | |
| Pennsylvania Higher Educational Facilities Authority Revenue | | | | | | | | |
| (Thomas Jefferson University) | | | | | | | | |
| Series A 5.00% 9/1/45 | | | 5,000,000 | | | | 5,008,050 | |
Schedules of investments
Delaware Tax-Free Pennsylvania Fund
| | | Principal | | | | |
| | | amount° | | | Value (US $) | |
| Municipal Bonds (continued) | | | | | | |
| Healthcare Revenue Bonds (continued) | | | | | | | | |
| Pennsylvania Higher Educational Facilities Authority Revenue | | | | | | | | |
| (Thomas Jefferson University) | | | | | | | | |
| Series A 5.25% 9/1/50 | | | 2,500,000 | | | $ | 2,503,800 | |
| (University of Pennsylvania Health System) | | | | | | | | |
| 4.00% 8/15/49 | | | 110,000 | | | | 99,040 | |
| Series A 4.00% 8/15/42 | | | 4,000,000 | | | | 3,767,520 | |
| Pocono Mountains, Pennsylvania Industrial Park Authority Revenue | | | | | | | | |
| (St. Luke’s Hospital - Monroe Project) | | | | | | | | |
| Series A 5.00% 8/15/40 | | | 2,245,000 | | | | 2,245,045 | |
| | | | | | | | 126,146,993 | |
| Housing Revenue Bond — 1.34% | | | | | | | | |
| Pennsylvania Housing Finance Agency Single Family Mortgage Revenue | | | | | | | | |
| (Social Bonds) | | | | | | | | |
| Series 142-A 5.00% 10/1/50 | | | 5,000,000 | | | | 5,079,000 | |
| | | | | | | | 5,079,000 | |
| Industrial Development Revenue/Pollution Control | | | | | | | | |
| Revenue Bonds — 9.28% | | | | | | | | |
| Allegheny County, Pennsylvania Industrial Development Authority Revenue | | | | | | | | |
| (United States Steel Corporation Project) | | | | | | | | |
| 4.875% 11/1/24 | | | 2,650,000 | | | | 2,660,017 | |
| 5.125% 5/1/30 | | | 750,000 | | | | 764,978 | |
| 5.75% 8/1/42 (AMT) | | | 725,000 | | | | 727,980 | |
| Chester County, Pennsylvania Industrial Development Authority Revenue | | | | | | | | |
| (Longwood Gardens, Inc. Project) | | | | | | | | |
| 4.00% 12/1/51 | | | 2,635,000 | | | | 2,420,221 | |
| Children’s Trust Fund Revenue, Commonwealth of Puerto Rico | | | | | | | | |
| (Tobacco Settlement Asset-Backed) | | | | | | | | |
| Series A 8.21% 5/15/57 ^ | | | 95,000,000 | | | | 6,606,300 | |
| Pennsylvania Commonwealth Financing Authority Revenue | | | | | | | | |
| (Tobacco Master Settlement Payment Revenue) | | | | | | | | |
| 4.00% 6/1/39 (AGM) | | | 5,045,000 | | | | 4,806,220 | |
| Pennsylvania Economic Development Financing Authority Revenue | | | | | | | | |
| (National Gypsum) | | | | | | | | |
| 5.50% 11/1/44 (AMT) | | | 4,000,000 | | | | 4,006,760 | |
| | | Principal | | | | |
| | | amount° | | | Value (US $) | |
| Municipal Bonds (continued) | | | | | | |
| Industrial Development Revenue/Pollution Control | | | | | | | | |
| Revenue Bonds (continued) | | | | | | | | |
| Pennsylvania Economic Development Financing Authority Solid Waste Disposal Revenue | | | | | | | | |
| (Proctor & Gamble Paper Project) | | | | | | | | |
| 5.375% 3/1/31 (AMT) | | | 11,000,000 | | | $ | 12,302,070 | |
| Washington County, Pennsylvania Redevelopment Authority Revenue | | | | | | | | |
| (Victory Centre Tax Increment Financing Project) | | | | | | | | |
| 5.00% 7/1/35 | | | 1,000,000 | | | | 972,960 | |
| | | | | | | | 35,267,506 | |
| Lease Revenue Bonds — 1.20% | | | | | | | | |
| City of Philadelphia, Pennsylvania Municipal Authority Revenue | | | | | | | | |
| (Juvenile Justice Services Center) | | | | | | | | |
| 5.00% 4/1/37 | | | 1,250,000 | | | | 1,317,525 | |
| 5.00% 4/1/38 | | | 1,000,000 | | | | 1,047,780 | |
| 5.00% 4/1/39 | | | 1,600,000 | | | | 1,674,016 | |
| Pennsylvania Economic Development Financing Authority Tax-Exempt Private Activity Revenue | | | | | | | | |
| (Pennsylvania Rapid Bridge Replacement Project) | | | | | | | | |
| 5.00% 12/31/29 (AMT) | | | 500,000 | | | | 508,930 | |
| | | | | | | | 4,548,251 | |
| Local General Obligation Bonds — 4.34% | | | | | | | | |
| City of Philadelphia, Pennsylvania | | | | | | | | |
| 5.00% 8/1/41 | | | 1,260,000 | | | | 1,307,628 | |
| Series A 4.00% 5/1/42 | | | 500,000 | | | | 475,140 | |
| Series A 5.00% 8/1/37 | | | 1,750,000 | | | | 1,832,355 | |
| City of Pittsburgh, Pennsylvania | | | | | | | | |
| 5.00% 9/1/41 | | | 1,000,000 | | | | 1,060,190 | |
| 5.00% 9/1/42 | | | 1,000,000 | | | | 1,055,890 | |
| 5.00% 9/1/43 | | | 500,000 | | | | 527,060 | |
| Council Rock, Pennsylvania School District | | | | | | | | |
| 4.00% 11/15/52 | | | 2,975,000 | | | | 2,770,885 | |
| Marple Newtown, Pennsylvania School District | | | | | | | | |
| 3.00% 6/1/40 | | | 3,740,000 | | | | 3,093,092 | |
| Punxsutawney Area, Pennsylvania School District | | | | | | | | |
| 2.00% 10/15/28 (AGM) | | | 225,000 | | | | 202,972 | |
| 2.00% 10/15/29 (AGM) | | | 700,000 | | | | 613,697 | |
| 2.00% 10/15/30 (AGM) | | | 190,000 | | | | 163,066 | |
| Township of Lower Paxton, Pennsylvania | | | | | | | | |
| Series A 4.00% 4/1/50 | | | 1,100,000 | | | | 1,018,325 | |
Schedules of investments
Delaware Tax-Free Pennsylvania Fund
| | | Principal | | | | |
| | | amount° | | | Value (US $) | |
| Municipal Bonds (continued) | | | | | | |
| Local General Obligation Bonds (continued) | | | | | | | | |
| West Branch Area School District, Pennsylvania | | | | | | | | |
| 4.00% 5/15/41 (AGM) | | | 930,000 | | | $ | 896,939 | |
| 4.00% 5/15/44 (AGM) | | | 1,595,000 | | | | 1,494,770 | |
| | | | | | | | 16,512,009 | |
| Pre-Refunded/Escrowed to Maturity Bonds — 1.06% | | | | | | | | |
| Berks County, Pennsylvania Industrial Development Authority Revenue | | | | | | | | |
| (The Highlands at Wyomissing) | | | | | | | | |
| 5.00% 5/15/38-25 § | | | 415,000 | | | | 433,567 | |
| 5.00% 5/15/43-25 § | | | 500,000 | | | | 522,370 | |
| 5.00% 5/15/48-25 § | | | 1,000,000 | | | | 1,044,740 | |
| City of Philadelphia, Pennsylvania School District | | | | | | | | |
| Series F 5.00% 9/1/38-26 § | | | 5,000 | | | | 5,269 | |
| Cumberland County, Pennsylvania Municipal Authority Revenue | | | | | | | | |
| (Diakon Lutheran Social Ministries) | | | | | | | | |
| 5.00% 1/1/38-25 § | | | 1,005,000 | | | | 1,025,743 | |
| Pennsylvania Higher Educational Facilities Authority Revenue | | | | | | | | |
| (University of the Arts) | | | | | | | | |
| 5.20% 3/15/25 (AGC) | | | 1,000,000 | | | | 1,014,390 | |
| | | | | | | | 4,046,079 | |
| Special Tax Revenue Bonds — 17.99% | | | | | | | | |
| Allentown, Pennsylvania Neighborhood Improvement Zone Development Authority Revenue | | | | | | | | |
| (City Center Project) | | | | | | | | |
| 144A 5.25% 5/1/42 # | | | 4,500,000 | | | | 4,467,915 | |
| (Forward Delivery) | | | | | | | | |
| 5.00% 5/1/26 | | | 60,000 | | | | 61,219 | |
| 5.00% 5/1/27 | | | 185,000 | | | | 190,147 | |
| 5.00% 5/1/29 | | | 230,000 | | | | 239,094 | |
| 5.00% 5/1/42 | | | 2,000,000 | | | | 1,973,620 | |
| Chester County, Pennsylvania Industrial Development Authority Revenue | | | | | | | | |
| (Woodlands at Greystone Project) | | | | | | | | |
| 144A 5.125% 3/1/48 # | | | 802,000 | | | | 736,958 | |
| Commonwealth of Puerto Rico | | | | | | | | |
| (Restructured) | | | | | | | | |
| 3.186% 11/1/43 • | | | 2,148,258 | | | | 1,109,038 | |
| GDB Debt Recovery Authority of Puerto Rico Revenue | | | | | | | | |
| 7.50% 8/20/40 | | | 22,353,254 | | | | 18,273,785 | |
| | | Principal | | | | |
| | | amount° | | | Value (US $) | |
| Municipal Bonds (continued) | | | | | | |
| Special Tax Revenue Bonds (continued) | | | | | | | | |
| Matching Fund Special Purpose Securitization | | | | | | | | |
| Series A 5.00% 10/1/39 | | | 5,040,000 | | | $ | 5,012,280 | |
| Northampton County, Pennsylvania Industrial Development Authority Revenue | | | | | | | | |
| (Route 33 Project) | | | | | | | | |
| 7.00% 7/1/32 | | | 1,710,000 | | | | 1,712,377 | |
| Puerto Rico Sales Tax Financing Revenue | | | | | | | | |
| (Restructured) | | | | | | | | |
| Series A-1 4.75% 7/1/53 | | | 7,858,000 | | | | 7,366,639 | |
| Series A-1 5.00% 7/1/58 | | | 5,000,000 | | | | 4,852,000 | |
| Series A-1 5.588% 7/1/51 ^ | | | 22,294,000 | | | | 4,607,724 | |
| Series A-1 5.614% 7/1/46 ^ | | | 26,050,000 | | | | 7,255,446 | |
| Series A-2 4.329% 7/1/40 | | | 10,150,000 | | | | 9,636,904 | |
| Series A-2 4.536% 7/1/53 | | | 1,000,000 | | | | 905,040 | |
| | | | | | | | 68,400,186 | |
| State General Obligation Bonds — 0.96% | | | | | | | | |
| Commonwealth of Pennsylvania | | | | | | | | |
| 4.00% 10/1/39 | | | 1,000,000 | | | | 982,990 | |
| Series D 4.00% 8/15/34 | | | 1,370,000 | | | | 1,381,686 | |
| Commonwealth of Puerto Rico | | | | | | | | |
| (Restructured) | | | | | | | | |
| Series A-1 4.00% 7/1/41 | | | 1,169,072 | | | | 1,010,955 | |
| Series A-1 4.00% 7/1/46 | | | 330,000 | | | | 274,715 | |
| | | | | | | | 3,650,346 | |
| Transportation Revenue Bonds — 17.56% | | | | | | | | |
| City of Philadelphia, Pennsylvania Airport Revenue | | | | | | | | |
| 4.00% 7/1/46 (AGM) (AMT) | | | 3,125,000 | | | | 2,847,969 | |
| 5.00% 7/1/51 (AMT) | | | 3,000,000 | | | | 3,043,320 | |
| Series A 4.00% 7/1/33 | | | 11,420,000 | | | | 11,591,642 | |
| Series B 5.00% 7/1/47 (AMT) | | | 3,000,000 | | | | 3,022,890 | |
| Delaware River Joint Toll Bridge Commission Revenue | | | | | | | | |
| (Pennsylvania - New Jersey) | | | | | | | | |
| 5.00% 7/1/42 | | | 5,000,000 | | | | 5,171,750 | |
| Pennsylvania Economic Development Financing Authority Revenue | | | | | | | | |
| Series B-2 4.859% 1/1/45 (BAM) ^ | | | 3,345,000 | | | | 1,160,815 | |
| Series B-2 5.52% 1/1/46 (BAM) ^ | | | 1,885,000 | | | | 618,770 | |
| Series B-2 5.54% 1/1/47 (BAM) ^ | | | 2,050,000 | | | | 636,669 | |
Schedules of investments
Delaware Tax-Free Pennsylvania Fund
| | | Principal | | | | |
| | | amount° | | | Value (US $) | |
| Municipal Bonds (continued) | | | | | | |
| Transportation Revenue Bonds (continued) | | | | | | | | |
| Pennsylvania Economic Development Financing Authority Tax-Exempt Private Activity Revenue | | | | | | | | |
| (Pennsylvania Rapid Bridge Replacement Project) | | | | | | | | |
| 5.00% 12/31/34 (AMT) | | | 2,115,000 | | | $ | 2,144,758 | |
| Pennsylvania Turnpike Commission Oil Franchise Tax Revenue | | | | | | | | |
| Series A 5.00% 12/1/46 | | | 2,750,000 | | | | 2,895,503 | |
| Pennsylvania Turnpike Commission Revenue | | | | | | | | |
| Series A 4.00% 12/1/38 | | | 2,250,000 | | | | 2,239,335 | |
| Series A 5.00% 12/1/44 | | | 2,000,000 | | | | 2,090,100 | |
| Series A-1 5.00% 12/1/45 | | | 1,000,000 | | | | 1,013,170 | |
| Series C 3.00% 12/1/51 | | | 2,825,000 | | | | 2,020,638 | |
| Series C 5.00% 12/1/44 | | | 2,500,000 | | | | 2,528,300 | |
| Subordinate Series A 4.00% 12/1/49 (AGM) | | | 2,375,000 | | | | 2,208,513 | |
| Subordinate Series B 3.00% 12/1/51 | | | 7,550,000 | | | | 5,289,152 | |
| Subordinate Series B 4.00% 12/1/51 | | | 1,200,000 | | | | 1,103,004 | |
| Puerto Rico Highway & Transportation Authority Revenue | | | | | | | | |
| (Restructured) | | | | | | | | |
| Series A 5.00% 7/1/62 | | | 2,545,000 | | | | 2,510,006 | |
| Southeastern Pennsylvania Transportation Authority Revenue | | | | | | | | |
| (Asset Improvement Program) | | | | | | | | |
| 5.25% 6/1/52 | | | 10,000,000 | | | | 10,818,000 | |
| Susquehanna Area, Pennsylvania Regional Airport Authority Revenue | | | | | | | | |
| 5.00% 1/1/35 (AMT) | | | 800,000 | | | | 807,024 | |
| 5.00% 1/1/38 (AMT) | | | 1,000,000 | | | | 987,350 | |
| | | | | | | | 66,748,678 | |
| Water & Sewer Revenue Bonds — 0.91% | | | | | | | | |
| Allegheny County, Pennsylvania Sanitary Authority Revenue | | | | | | | | |
| 5.00% 6/1/53 | | | 1,750,000 | | | | 1,837,395 | |
| Pennsylvania Economic Development Financing Authority Revenue | | | | | | | | |
| (Pennsylvania-American Water Company Project) | | | | | | | | |
| 3.00% 4/1/39 | | | 2,000,000 | | | | 1,613,640 | |
| | | | | | | | 3,451,035 | |
| Total Municipal Bonds (cost $390,788,696) | | | | | | | 374,367,139 | |
| | | Principal | | | | |
| | | amount° | | | Value (US $) | |
| Short-Term Investments — 0.52% | | | | | | |
| Variable Rate Demand Note — 0.52%¤ | | | | | | | | |
| Allegheny County, Pennsylvania Higher Education Building Authority Revenue | | | | | | | | |
| (Carnegie Mellon University) 4.00% 12/1/37 | | | | | | | | |
| (SPA - Bank of New York) | | | 2,000,000 | | | $ | 2,000,000 | |
| Total Short-Term Investments (cost $2,000,000) | | | | | | | 2,000,000 | |
| Total Value of Securities—99.01% | | | | | | | | |
| (cost $392,788,696) | | | | | | $ | 376,367,139 | |
| ° | Principal amount shown is stated in USD unless noted that the security is denominated in another currency. |
| # | Security exempt from registration under Rule 144A of the Securities Act of 1933, as amended. At August 31, 2023, the aggregate value of Rule 144A securities was $10,031,955, which represents 2.64% of the Fund’s net assets. See Note 8 in “Notes to financial statements.” |
| ‡ | Non-income producing security. Security is currently in default. |
| ^ | Zero-coupon security. The rate shown is the effective yield at the time of purchase. |
| § | Pre-refunded bonds. Municipal bonds that are generally backed or secured by US Treasury bonds. For pre-refunded bonds, the stated maturity is followed by the year in which the bond will be pre-refunded. See Note 8 in “Notes to financial statements.” |
| • | Variable rate investment. Rates reset periodically. Rate shown reflects the rate in effect at August 31, 2023. For securities based on a published reference rate and spread, the reference rate and spread are indicated in their descriptions. The reference rate descriptions (i.e. SOFR01M, SOFR03M, etc.) used in this report are identical for different securities, but the underlying reference rates may differ due to the timing of the reset period. Certain variable rate securities are not based on a published reference rate and spread but are determined by the issuer or agent and are based on current market conditions, or for mortgage-backed securities, are impacted by the individual mortgages which are paying off over time. These securities do not indicate a reference rate and spread in their descriptions. |
| ¤ | Tax-exempt obligations that contain a floating or variable interest rate adjustment formula and an unconditional right of demand to receive payment of the unpaid principal balance plus accrued interest upon a short notice period (generally up to 30 days) prior to specified dates either from the issuer or by drawing on a bank letter of credit, a guarantee, or insurance issued with respect to such instrument. Each rate shown is as of August 31, 2023. |
Summary of abbreviations:
AGC – Insured by Assured Guaranty Corporation
AGM – Insured by Assured Guaranty Municipal Corporation
AICUP – Association of Independent Colleges & Universities of Pennsylvania
Schedules of investments
Delaware Tax-Free Pennsylvania Fund
Summary of abbreviations: (continued)
AMT – Subject to Alternative Minimum Tax
BAM – Insured by Build America Mutual Assurance
SOFR01M – Secured Overnight Financing Rate 1 Month
SOFR03M – Secured Overnight Financing Rate 3 Month
SPA – Stand-by Purchase Agreement
USD – US Dollar
See accompanying notes, which are an integral part of the financial statements.
Statements of assets and liabilities
August 31, 2023
| | | Delaware Tax-Free | | | Delaware Tax-Free | | | Delaware Tax-Free | |
| | | Arizona Fund | | | California Fund | | | Colorado Fund | |
| Assets: | | | | | | | | | | | | |
| Investments, at value* | | $ | 58,861,475 | | | $ | 202,979,763 | | | $ | 211,394,019 | |
| Cash | | | 62,936 | | | | 318,327 | | | | — | |
| Dividend and interest receivable | | | 558,979 | | | | 2,103,809 | | | | 2,272,492 | |
| Prepaid expenses | | | 46,847 | | | | 46,351 | | | | 45,954 | |
| Receivable for fund shares sold | | | 9,727 | | | | 244,682 | | | | 551,354 | |
| Receivable from investment manager | | | — | | | | 4,213 | | | | — | |
| Other assets | | | 617 | | | | 958 | | | | 1,740 | |
| Total Assets | | | 59,540,581 | | | | 205,698,103 | | | | 214,265,559 | |
| Liabilities: | | | | | | | | | | | | |
| Due to custodian | | | — | | | | — | | | | 285,340 | |
| Payable for fund shares redeemed | | | 183,548 | | | | 898,062 | | | | 943,577 | |
| Other accrued expenses | | | 59,198 | | | | 34,907 | | | | 102,223 | |
| Distribution payable | | | 15,944 | | | | 56,965 | | | | 47,661 | |
| Distribution fees payable to affiliates | | | 10,532 | | | | 16,205 | | | | 29,938 | |
| Administration expenses payable to affiliates | | | 10,321 | | | | 10,403 | | | | 10,559 | |
| Investment management fees payable to affiliates | | | 2,694 | | | | — | | | | 49,393 | |
| Payable for securities purchased | | | — | | | | 1,250,000 | | | | — | |
| Total Liabilities | | | 282,237 | | | | 2,266,542 | | | | 1,468,691 | |
| Total Net Assets | | $ | 59,258,344 | | | $ | 203,431,561 | | | $ | 212,796,868 | |
| | | | | | | | | | | | | |
| Net Assets Consist of: | | | | | | | | | | | | |
| Paid-in capital | | $ | 68,390,897 | | | $ | 216,982,528 | | | $ | 235,965,388 | |
| Total distributable earnings (loss) | | | (9,132,553 | ) | | | (13,550,967 | ) | | | (23,168,520 | ) |
| Total Net Assets | | $ | 59,258,344 | | | $ | 203,431,561 | | | $ | 212,796,868 | |
Statements of assets and liabilities
| | | Delaware Tax-Free | | | Delaware Tax-Free | | | Delaware Tax-Free | |
| | | Arizona Fund | | | California Fund | | | Colorado Fund | |
| Net Asset Value | | | | | | | | | | | | |
| | | | | | | | | | | | | |
| Class A: | | | | | | | | | | | | |
| Net assets | | $ | 45,650,314 | | | $ | 69,092,626 | | | $ | 127,477,211 | |
| Shares of beneficial interest outstanding, unlimited authorization, no par | | | 4,669,039 | | | | 6,467,107 | | | | 12,851,708 | |
| Net asset value per share | | $ | 9.78 | | | $ | 10.68 | | | $ | 9.92 | |
| Sales charge | | | 4.50 | % | | | 4.50 | % | | | 4.50 | % |
| Offering price per share, equal to net asset value per share / (1 - sales charge) | | $ | 10.24 | | | $ | 11.18 | | | $ | 10.39 | |
| | | | | | | | | | | | | |
| Class C: | | | | | | | | | | | | |
| Net assets | | $ | 833,939 | | | $ | 2,000,809 | | | $ | 3,110,868 | |
| Shares of beneficial interest outstanding, unlimited authorization, no par | | | 85,077 | | | | 186,893 | | | | 312,831 | |
| Net asset value per share | | $ | 9.80 | | | $ | 10.71 | | | $ | 9.94 | |
| | | | | | | | | | | | | |
| Institutional Class: | | | | | | | | | | | | |
| Net assets | | $ | 12,774,091 | | | $ | 132,338,126 | | | $ | 82,208,789 | |
| Shares of beneficial interest outstanding, unlimited authorization, no par | | | 1,306,646 | | | | 12,384,422 | | | | 8,287,994 | |
| Net asset value per share | | $ | 9.78 | | | $ | 10.69 | | | $ | 9.92 | |
| | | | | | | | | | | | | |
| *Investments, at cost | | $ | 65,980,200 | | | $ | 213,740,691 | | | $ | 225,884,424 | |
See accompanying notes, which are an integral part of the financial statements.
| | | Delaware Tax-Free | | | Delaware Tax-Free | | | Delaware Tax-Free | |
| | | Idaho Fund | | | New York Fund | | | Pennsylvania Fund | |
| Assets: | | | | | | | | | | | | |
| Investments, at value* | | $ | 119,243,205 | | | $ | 198,079,187 | | | $ | 376,367,139 | |
| Cash | | | — | | | | 1,278,665 | | | | 342,737 | |
| Dividend and interest receivable | | | 1,413,153 | | | | 2,185,252 | | | | 4,318,383 | |
| Receivable for fund shares sold | | | 190,742 | | | | 360,432 | | | | 311,711 | |
| Prepaid expenses | | | 62,258 | | | | 44,646 | | | | 46,566 | |
| Other assets | | | 967 | | | | 1,461 | | | | 3,181 | |
| Total Assets | | | 120,910,325 | | | | 201,949,643 | | | | 381,389,717 | |
| Liabilities: | | | | | | | | | | | | |
| Due to custodian | | | 108,321 | | | | — | | | | — | |
| Payable for fund shares redeemed | | | 230,256 | | | | 430,111 | | | | 794,744 | |
| Other accrued expenses | | | 69,001 | | | | 93,593 | | | | 172,564 | |
| Investment management fees payable to affiliates | | | 32,908 | | | | 46,464 | | | | 105,437 | |
| Distribution fees payable to affiliates | | | 17,771 | | | | 30,043 | | | | 73,235 | |
| Distribution payable | | | 14,019 | | | | 92,778 | | | | 115,923 | |
| Administration expenses payable to affiliates | | | 10,398 | | | | 10,493 | | | | 10,866 | |
| Total Liabilities | | | 482,674 | | | | 703,482 | | | | 1,272,769 | |
| Total Net Assets | | $ | 120,427,651 | | | $ | 201,246,161 | | | $ | 380,116,948 | |
| | | | | | | | | | | | | |
| Net Assets Consist of: | | | | | | | | | | | | |
| Paid-in capital | | $ | 138,992,113 | | | $ | 214,213,000 | | | $ | 412,452,379 | |
| Total distributable earnings (loss) | | | (18,564,462 | ) | | | (12,966,839 | ) | | | (32,335,431 | ) |
| Total Net Assets | | $ | 120,427,651 | | | $ | 201,246,161 | | | $ | 380,116,948 | |
Statements of assets and liabilities
| | | Delaware Tax-Free | | | Delaware Tax-Free | | | Delaware Tax-Free | |
| | | Idaho Fund | | | New York Fund | | | Pennsylvania Fund | |
| Net Asset Value | | | | | | | | | | | | |
| | | | | | | | �� | | | | | |
| Class A: | | | | | | | | | | | | |
| Net assets | | $ | 64,691,064 | | | $ | 130,791,392 | | | $ | 307,781,074 | |
| Shares of beneficial interest outstanding, unlimited authorization, no par | | | 6,427,622 | | | | 12,784,474 | | | | 43,574,315 | |
| Net asset value per share | | $ | 10.06 | | | $ | 10.23 | | | $ | 7.06 | |
| Sales charge | | | 4.50 | % | | | 4.50 | % | | | 4.50 | % |
| Offering price per share, equal to net asset value per share / (1 - sales charge) | | $ | 10.53 | | | $ | 10.71 | | | $ | 7.39 | |
| | | | | | | | | | | | | |
| Class C: | | | | | | | | | | | | |
| Net assets | | $ | 4,531,500 | | | $ | 2,757,355 | | | $ | 8,853,932 | |
| Shares of beneficial interest outstanding, unlimited authorization, no par | | | 450,511 | | | | 270,166 | | | | 1,253,172 | |
| Net asset value per share | | $ | 10.06 | | | $ | 10.21 | | | $ | 7.07 | |
| | | | | | | | | | | | | |
| Institutional Class: | | | | | | | | | | | | |
| Net assets | | $ | 51,205,087 | | | $ | 67,697,414 | | | $ | 63,481,942 | |
| Shares of beneficial interest outstanding, unlimited authorization, no par | | | 5,086,418 | | | | 6,622,757 | | | | 8,994,275 | |
| Net asset value per share | | $ | 10.07 | | | $ | 10.22 | | | $ | 7.06 | |
| | | | | | | | | | | | | |
| *Investments, at cost | | $ | 129,089,328 | | | $ | 208,335,531 | | | $ | 392,788,696 | |
See accompanying notes, which are an integral part of the financial statements.
Statements of operations
Year ended August 31, 2023
| | | Delaware Tax-Free | | | Delaware Tax-Free | | | Delaware Tax-Free | |
| | | Arizona Fund | | | California Fund | | | Colorado Fund | |
| Investment Income: | | | | | | | | | | | | |
| Interest | | $ | 2,727,363 | | | $ | 7,825,398 | | | $ | 9,202,767 | |
| | | | | | | | | | | | | |
| Expenses: | | | | | | | | | | | | |
| Management fees | | | 328,969 | | | | 972,747 | | | | 1,191,018 | |
| Distribution expenses — Class A | | | 126,380 | | | | 171,930 | | | | 333,035 | |
| Distribution expenses — Class C | | | 9,395 | | | | 21,469 | | | | 38,455 | |
| Dividend disbursing and transfer agent fees and expenses | | | 59,660 | | | | 134,592 | | | | 174,867 | |
| Accounting and administration expenses | | | 43,450 | | | | 55,703 | | | | 59,290 | |
| Audit and tax fees | | | 40,625 | | | | 47,183 | | | | 40,625 | |
| Registration fees | | | 20,268 | | | | 25,652 | | | | 13,272 | |
| Custodian fees | | | 15,063 | | | | 18,014 | | | | 23,955 | |
| Reports and statements to shareholders expenses | | | 14,184 | | | | 16,016 | | | | 24,685 | |
| Legal fees | | | 9,418 | | | | 13,152 | | | | 14,538 | |
| Trustees’ fees and expenses | | | 3,617 | | | | 6,566 | | | | 10,074 | |
| Other | | | 21,421 | | | | 28,622 | | | | 30,349 | |
| | | | 692,450 | | | | 1,511,646 | | | | 1,954,163 | |
| Less expenses waived | | | (168,369 | ) | | | (335,373 | ) | | | (347,995 | ) |
| Less expenses paid indirectly | | | (7 | ) | | | (25 | ) | | | (21 | ) |
| Total operating expenses | | | 524,074 | | | | 1,176,248 | | | | 1,606,147 | |
| Net Investment Income (Loss) | | | 2,203,289 | | | | 6,649,150 | | | | 7,596,620 | |
| | | | | | | | | | | | | |
| Net Realized and Unrealized Gain (Loss): | | | | | | | | | | | | |
| Net realized gain (loss) on investments | | | (1,651,704 | ) | | | (1,542,727 | ) | | | (5,137,100 | ) |
| Net change in unrealized appreciation (depreciation) on investments | | | (2,578,957 | ) | | | (3,894,500 | ) | | | (3,603,204 | ) |
| Net Realized and Unrealized Gain (Loss) | | | (4,230,661 | ) | | | (5,437,227 | ) | | | (8,740,304 | ) |
| Net Increase (Decrease) in Net Assets Resulting from Operations | | $ | (2,027,372 | ) | | $ | 1,211,923 | | | $ | (1,143,684 | ) |
See accompanying notes, which are an integral part of the financial statements.
Statements of operations
| | | Delaware Tax-Free | | | Delaware Tax-Free | | | Delaware Tax-Free | |
| | | Idaho Fund | | | New York Fund | | | Pennsylvania Fund | |
| Investment Income: | | | | | | | | | | | | |
| Interest | | $ | 4,904,146 | | | $ | 8,376,790 | | | $ | 18,008,599 | |
| | | | | | | | | | | | | |
| Expenses: | | | | | | | | | | | | |
| Management fees | | | 652,559 | | | | 1,057,586 | | | | 2,157,539 | |
| Distribution expenses — Class A | | | 161,007 | | | | 314,878 | | | | 775,368 | |
| Distribution expenses — Class C | | | 48,155 | | | | 29,185 | | | | 93,572 | |
| Dividend disbursing and transfer agent fees and expenses | | | 98,929 | | | | 135,438 | | | | 323,116 | |
| Accounting and administration expenses | | | 48,723 | | | | 56,623 | | | | 82,955 | |
| Audit and tax fees | | | 40,624 | | | | 40,624 | | | | 40,625 | |
| Custodian fees | | | 20,164 | | | | 16,070 | | | | 13,027 | |
| Reports and statements to shareholders expenses | | | 15,450 | | | | 23,002 | | | | 47,632 | |
| Registration fees | | | 10,056 | | | | 25,053 | | | | 19,268 | |
| Legal fees | | | 9,941 | | | | 12,965 | | | | 27,685 | |
| Trustees’ fees and expenses | | | 5,778 | | | | 8,220 | | | | 18,422 | |
| Other | | | 23,038 | | | | 34,029 | | | | 35,670 | |
| | | | 1,134,424 | | | | 1,753,673 | | | | 3,634,879 | |
| Less expenses waived | | | (201,333 | ) | | | (351,681 | ) | | | (450,820 | ) |
| Less expenses paid indirectly | | | (7 | ) | | | (67 | ) | | | (70 | ) |
| Total operating expenses | | | 933,084 | | | | 1,401,925 | | | | 3,183,989 | |
| Net Investment Income (Loss) | | | 3,971,062 | | | | 6,974,865 | | | | 14,824,610 | |
| | | | | | | | | | | | | |
| Net Realized and Unrealized Gain (Loss): | | | | | | | | | | | | |
| Net realized gain (loss) on investments | | | (2,376,811 | ) | | | (2,131,943 | ) | | | (10,953,077 | ) |
| Net change in unrealized appreciation (depreciation) on investments | | | (2,403,529 | ) | | | (4,834,624 | ) | | | (3,634,903 | ) |
| Net Realized and Unrealized Gain (Loss) | | | (4,780,340 | ) | | | (6,966,567 | ) | | | (14,587,980 | ) |
| Net Increase (Decrease) in Net Assets Resulting from Operations | | $ | (809,278 | ) | | $ | 8,298 | | | $ | 236,630 | |
See accompanying notes, which are an integral part of the financial statements.
Statements of changes in net assets
Delaware Tax-Free Arizona Fund
| | | Year ended | |
| | | 8/31/23 | | | 8/31/22 | |
| Increase (Decrease) in Net Assets from Operations: | | | | | | | | |
| Net investment income (loss) | | $ | 2,203,289 | | | $ | 2,351,650 | |
| Net realized gain (loss) | | | (1,651,704 | ) | | | (457,665 | ) |
| Net change in unrealized appreciation (depreciation) | | | (2,578,957 | ) | | | (11,758,111 | ) |
| Net increase (decrease) in net assets resulting from operations | | | (2,027,372 | ) | | | (9,864,126 | ) |
| | | | | | | | | |
| Dividends and Distributions to Shareholders from: | | | | | | | | |
| Distributable earnings: | | | | | | | | |
| Class A | | | (1,643,098 | ) | | | (2,089,058 | ) |
| Class C | | | (23,479 | ) | | | (33,764 | ) |
| Institutional Class | | | (500,798 | ) | | | (767,658 | ) |
| | | | (2,167,375 | ) | | | (2,890,480 | ) |
| | | | | | | | | |
| Capital Share Transactions: | | | | | | | | |
| Proceeds from shares sold: | | | | | | | | |
| Class A | | | 3,574,099 | | | | 3,450,236 | |
| Class C | | | 203,897 | | | | 265,951 | |
| Institutional Class | | | 4,382,454 | | | | 11,245,008 | |
| | | | | | | | | |
| Net asset value of shares issued upon reinvestment of dividends and distributions: | | | | | | | | |
| Class A | | | 1,466,847 | | | | 1,904,687 | |
| Class C | | | 23,475 | | | | 32,694 | |
| Institutional Class | | | 479,748 | | | | 736,314 | |
| | | | 10,130,520 | | | | 17,634,890 | |
Statements of changes in net assets
Delaware Tax-Free Arizona Fund
| | | Year ended | |
| | | 8/31/23 | | | 8/31/22 | |
| Capital Share Transactions (continued): | | | | | | | | |
| Cost of shares redeemed: | | | | | | | | |
| Class A | | $ | (13,153,564 | ) | | $ | (5,846,661 | ) |
| Class C | | | (448,544 | ) | | | (514,815 | ) |
| Institutional Class | | | (9,951,656 | ) | | | (12,026,164 | ) |
| | | | (23,553,764 | ) | | | (18,387,640 | ) |
| Decrease in net assets derived from capital share transactions | | | (13,423,244 | ) | | | (752,750 | ) |
| Net Decrease in Net Assets | | | (17,617,991 | ) | | | (13,507,356 | ) |
| | | | | | | | | |
| Net Assets: | | | | | | | | |
| Beginning of year | | | 76,876,335 | | | | 90,383,691 | |
| End of year | | $ | 59,258,344 | | | $ | 76,876,335 | |
See accompanying notes, which are an integral part of the financial statements.
Statements of changes in net assets
Delaware Tax-Free California Fund
| | | Year ended | |
| | | 8/31/23 | | | 8/31/22 | |
| Increase (Decrease) in Net Assets from Operations: | | | | | | | | |
| Net investment income (loss) | | $ | 6,649,150 | | | $ | 4,229,613 | |
| Net realized gain (loss) | | | (1,542,727 | ) | | | (1,460,722 | ) |
| Net change in unrealized appreciation (depreciation) | | | (3,894,500 | ) | | | (18,215,437 | ) |
| Net increase (decrease) in net assets resulting from operations | | | 1,211,923 | | | | (15,446,546 | ) |
| | | | | | | | | |
| Dividends and Distributions to Shareholders from: | | | | | | | | |
| Distributable earnings: | | | | | | | | |
| Class A | | | (2,431,975 | ) | | | (2,432,541 | ) |
| Class C | | | (59,702 | ) | | | (76,340 | ) |
| Institutional Class | | | (4,027,340 | ) | | | (1,926,235 | ) |
| | | | (6,519,017 | ) | | | (4,435,116 | ) |
| | | | | | | | | |
| Capital Share Transactions: | | | | | | | | |
| Proceeds from shares sold: | | | | | | | | |
| Class A | | | 12,292,940 | | | | 20,137,487 | |
| Class C | | | 375,687 | | | | 454,010 | |
| Institutional Class | | | 90,167,613 | | | | 71,643,689 | |
| | | | | | | | | |
| Net asset value of shares issued upon reinvestment of dividends and distributions: | | | | | | | | |
| Class A | | | 2,227,676 | | | | 2,220,247 | |
| Class C | | | 58,605 | | | | 73,058 | |
| Institutional Class | | | 3,500,222 | | | | 1,525,423 | |
| | | | 108,622,743 | | | | 96,053,914 | |
Statements of changes in net assets
Delaware Tax-Free California Fund
| | | Year ended | |
| | | 8/31/23 | | | 8/31/22 | |
| Capital Share Transactions (continued): | | | | | | | | |
| Cost of shares redeemed: | | | | | | | | |
| Class A | | $ | (14,852,977 | ) | | $ | (25,977,701 | ) |
| Class C | | | (844,429 | ) | | | (1,431,105 | ) |
| Institutional Class | | | (37,873,243 | ) | | | (30,974,449 | ) |
| | | | (53,570,649 | ) | | | (58,383,255 | ) |
| Increase in net assets derived from capital share transactions | | | 55,052,094 | | | | 37,670,659 | |
| Net Increase in Net Assets | | | 49,745,000 | | | | 17,788,997 | |
| | | | | | | | | |
| Net Assets: | | | | | | | | |
| Beginning of year | | | 153,686,561 | | | | 135,897,564 | |
| End of year | | $ | 203,431,561 | | | $ | 153,686,561 | |
See accompanying notes, which are an integral part of the financial statements.
Statements of changes in net assets
Delaware Tax-Free Colorado Fund
| | | Year ended | |
| | | 8/31/23 | | | 8/31/22 | |
| Increase (Decrease) in Net Assets from Operations: | | | | | | | | |
| Net investment income (loss) | | $ | 7,596,620 | | | $ | 6,853,984 | |
| Net realized gain (loss) | | | (5,137,100 | ) | | | (2,049,598 | ) |
| Net change in unrealized appreciation (depreciation) | | | (3,603,204 | ) | | | (28,878,750 | ) |
| Net increase (decrease) in net assets resulting from operations | | | (1,143,684 | ) | | | (24,074,364 | ) |
| | | | | | | | | |
| Dividends and Distributions to Shareholders from: | | | | | | | | |
| Distributable earnings: | | | | | | | | |
| Class A | | | (4,466,012 | ) | | | (4,285,002 | ) |
| Class C | | | (99,573 | ) | | | (121,908 | ) |
| Institutional Class | | | (2,867,680 | ) | | | (2,423,301 | ) |
| | | | (7,433,265 | ) | | | (6,830,211 | ) |
| | | | | | | | | |
| Capital Share Transactions: | | | | | | | | |
| Proceeds from shares sold: | | | | | | | | |
| Class A | | | 7,142,609 | | | | 14,671,622 | |
| Class C | | | 265,872 | | | | 624,715 | |
| Institutional Class | | | 32,457,083 | | | | 48,683,482 | |
| | | | | | | | | |
| Net asset value of shares issued upon reinvestment of dividends and distributions: | | | | | | | | |
| Class A | | | 4,097,868 | | | | 3,898,619 | |
| Class C | | | 97,526 | | | | 120,257 | |
| Institutional Class | | | 2,685,949 | | | | 2,295,028 | |
| | | | 46,746,907 | | | | 70,293,723 | |
Statements of changes in net assets
Delaware Tax-Free Colorado Fund
| | | Year ended | |
| | | 8/31/23 | | | 8/31/22 | |
| Capital Share Transactions (continued): | | | | | | | | |
| Cost of shares redeemed: | | | | | | | | |
| Class A | | $ | (21,503,738 | ) | | $ | (20,207,612 | ) |
| Class C | | | (1,948,138 | ) | | | (1,856,539 | ) |
| Institutional Class | | | (32,101,650 | ) | | | (34,252,508 | ) |
| | | | (55,553,526 | ) | | | (56,316,659 | ) |
| Increase (decrease) in net assets derived from capital share transactions | | | (8,806,619 | ) | | | 13,977,064 | |
| Net Decrease in Net Assets | | | (17,383,568 | ) | | | (16,927,511 | ) |
| | | | | | | | | |
| Net Assets: | | | | | | | | |
| Beginning of year | | | 230,180,436 | | | | 247,107,947 | |
| End of year | | $ | 212,796,868 | | | $ | 230,180,436 | |
See accompanying notes, which are an integral part of the financial statements.
Statements of changes in net assets
Delaware Tax-Free Idaho Fund
| | | Year ended | |
| | | 8/31/23 | | | 8/31/22 | |
| Increase (Decrease) in Net Assets from Operations: | | | | | | | | |
| Net investment income (loss) | | $ | 3,971,062 | | | $ | 3,528,605 | |
| Net realized gain (loss) | | | (2,376,811 | ) | | | (2,007,208 | ) |
| Net change in unrealized appreciation (depreciation) | | | (2,403,529 | ) | | | (15,656,297 | ) |
| Net increase (decrease) in net assets resulting from operations | | | (809,278 | ) | | | (14,134,900 | ) |
| | | | | | | | | |
| Dividends and Distributions to Shareholders from: | | | | | | | | |
| Distributable earnings: | | | | | | | | |
| Class A | | | (2,049,712 | ) | | | (1,825,616 | ) |
| Class C | | | (117,116 | ) | | | (112,483 | ) |
| Institutional Class | | | (1,697,616 | ) | | | (1,570,088 | ) |
| | | | (3,864,444 | ) | | | (3,508,187 | ) |
| | | | | | | | | |
| Capital Share Transactions: | | | | | | | | |
| Proceeds from shares sold: | | | | | | | | |
| Class A | | | 16,995,143 | | | | 13,572,945 | |
| Class C | | | 705,381 | | | | 873,521 | |
| Institutional Class | | | 21,898,695 | | | | 28,883,730 | |
| | | | | | | | | |
| Net asset value of shares issued upon reinvestment of dividends and distributions: | | | | | | | | |
| Class A | | | 1,953,262 | | | | 1,745,380 | |
| Class C | | | 116,674 | | | | 109,662 | |
| Institutional Class | | | 1,607,629 | | | | 1,491,925 | |
| | | | 43,276,784 | | | | 46,677,163 | |
Statements of changes in net assets
Delaware Tax-Free Idaho Fund
| | | Year ended | |
| | | 8/31/23 | | | 8/31/22 | |
| Capital Share Transactions (continued): | | | | | | | | |
| Cost of shares redeemed: | | | | | | | | |
| Class A | | $ | (18,952,998 | ) | | $ | (10,298,057 | ) |
| Class C | | | (1,109,842 | ) | | | (1,623,624 | ) |
| Institutional Class | | | (19,749,321 | ) | | | (24,398,399 | ) |
| | | | (39,812,161 | ) | | | (36,320,080 | ) |
| Increase in net assets derived from capital share transactions | | | 3,464,623 | | | | 10,357,083 | |
| Net Decrease in Net Assets | | | (1,209,099 | ) | | | (7,286,004 | ) |
| | | | | | | | | |
| Net Assets: | | | | | | | | |
| Beginning of year | | | 121,636,750 | | | | 128,922,754 | |
| End of year | | $ | 120,427,651 | | | $ | 121,636,750 | |
See accompanying notes, which are an integral part of the financial statements.
Statements of changes in net assets
Delaware Tax-Free New York Fund
| | | Year ended | |
| | | 8/31/23 | | | 8/31/22 | |
| Increase (Decrease) in Net Assets from Operations: | | | | | | | | |
| Net investment income (loss) | | $ | 6,974,865 | | | $ | 5,752,659 | |
| Net realized gain (loss) | | | (2,131,943 | ) | | | (413,164 | ) |
| Net change in unrealized appreciation (depreciation) | | | (4,834,624 | ) | | | (26,046,535 | ) |
| Net increase (decrease) in net assets resulting from operations | | | 8,298 | | | | (20,707,040 | ) |
| | | | | | | | | |
| Dividends and Distributions to Shareholders from: | | | | | | | | |
| Distributable earnings: | | | | | | | | |
| Class A | | | (4,350,900 | ) | | | (4,051,766 | ) |
| Class C | | | (78,647 | ) | | | (86,390 | ) |
| Institutional Class | | | (2,350,712 | ) | | | (1,607,905 | ) |
| | | | (6,780,259 | ) | | | (5,746,061 | ) |
| | | | | | | | | |
| Capital Share Transactions: | | | | | | | | |
| Proceeds from shares sold: | | | | | | | | |
| Class A | | | 25,930,760 | | | | 10,730,406 | |
| Class C | | | 548,305 | | | | 727,697 | |
| Institutional Class | | | 36,258,510 | | | | 46,697,915 | |
| | | | | | | | | |
| Net asset value of shares issued upon reinvestment of dividends and distributions: | | | | | | | | |
| Class A | | | 3,637,579 | | | | 3,353,448 | |
| Class C | | | 65,957 | | | | 60,731 | |
| Institutional Class | | | 2,018,704 | | | | 1,436,549 | |
| | | | 68,459,815 | | | | 63,006,746 | |
Statements of changes in net assets
Delaware Tax-Free New York Fund
| | | Year ended | |
| | | 8/31/23 | | | 8/31/22 | |
| Capital Share Transactions (continued): | | | | | | | | |
| Cost of shares redeemed: | | | | | | | | |
| Class A | | $ | (25,172,845 | ) | | $ | (25,585,926 | ) |
| Class C | | | (1,546,228 | ) | | | (1,126,545 | ) |
| Institutional Class | | | (32,708,869 | ) | | | (28,165,210 | ) |
| | | | (59,427,942 | ) | | | (54,877,681 | ) |
| Increase in net assets derived from capital share transactions | | | 9,031,873 | | | | 8,129,065 | |
| Net Increase (Decrease) in Net Assets | | | 2,259,912 | | | | (18,324,036 | ) |
| | | | | | | | | |
| Net Assets: | | | | | | | | |
| Beginning of year | | | 198,986,249 | | | | 217,310,285 | |
| End of year | | $ | 201,246,161 | | | $ | 198,986,249 | |
See accompanying notes, which are an integral part of the financial statements.
Statements of changes in net assets
Delaware Tax-Free Pennsylvania Fund
| | | Year ended | |
| | | 8/31/23 | | | 8/31/22 | |
| Increase (Decrease) in Net Assets from Operations: | | | | | | | | |
| Net investment income (loss) | | $ | 14,824,610 | | | $ | 12,352,695 | |
| Net realized gain (loss) | | | (10,953,077 | ) | | | (4,807,510 | ) |
| Net change in unrealized appreciation (depreciation) | | | (3,634,903 | ) | | | (52,099,049 | ) |
| Net increase (decrease) in net assets resulting from operations | | | 236,630 | | | | (44,553,864 | ) |
| | | | | | | | | |
| Dividends and Distributions to Shareholders from: | | | | | | | | |
| Distributable earnings: | | | | | | | | |
| Class A | | | (11,855,458 | ) | | | (11,150,166 | ) |
| Class C | | | (280,340 | ) | | | (292,574 | ) |
| Institutional Class | | | (2,688,812 | ) | | | (2,439,217 | ) |
| | | | (14,824,610 | ) | | | (13,881,957 | ) |
| | | | | | | | | |
| Capital Share Transactions: | | | | | | | | |
| Proceeds from shares sold: | | | | | | | | |
| Class A | | | 90,808,169 | | | | 109,442,517 | |
| Class C | | | 1,929,675 | | | | 1,733,363 | |
| Institutional Class | | | 30,568,725 | | | | 41,965,797 | |
| | | | | | | | | |
| Net asset value of shares issued upon reinvestment of dividends and distributions: | | | | | | | | |
| Class A | | | 10,596,263 | | | | 10,037,495 | |
| Class C | | | 271,565 | | | | 285,547 | |
| Institutional Class | | | 2,610,502 | | | | 2,360,450 | |
| | | | 136,784,899 | | | | 165,825,169 | |
Statements of changes in net assets
Delaware Tax-Free Pennsylvania Fund
| | | Year ended | |
| | | 8/31/23 | | | 8/31/22 | |
| Capital Share Transactions (continued): | | | | | | | | |
| Cost of shares redeemed: | | | | | | | | |
| Class A | | $ | (120,653,920 | ) | | $ | (118,594,370 | ) |
| Class C | | | (3,528,529 | ) | | | (3,825,938 | ) |
| Institutional Class | | | (39,578,290 | ) | | | (34,576,771 | ) |
| | | | (163,760,739 | ) | | | (156,997,079 | ) |
| Increase (decrease) in net assets derived from capital share transactions | | | (26,975,840 | ) | | | 8,828,090 | |
| Net Decrease in Net Assets | | | (41,563,820 | ) | | | (49,607,731 | ) |
| | | | | | | | | |
| Net Assets: | | | | | | | | |
| Beginning of year | | | 421,680,768 | | | | 471,288,499 | |
| End of year | | $ | 380,116,948 | | | $ | 421,680,768 | |
See accompanying notes, which are an integral part of the financial statements.
Financial highlights
Delaware Tax-Free Arizona Fund Class A
Selected data for each share of the Fund outstanding throughout each period were as follows:
| |
| Net asset value, beginning of period |
| |
| Income (loss) from investment operations: |
| Net investment income1 |
| Net realized and unrealized gain (loss) |
| Total from investment operations |
| |
| Less dividends and distributions from: |
| Net investment income |
| Net realized gain |
| Total dividends and distributions |
| |
| Net asset value, end of period |
| |
| Total return3 |
| |
| Ratios and supplemental data: |
| Net assets, end of period (000 omitted) |
| Ratio of expenses to average net assets |
| Ratio of expenses to average net assets prior to fees waived |
| Ratio of net investment income to average net assets |
| Ratio of net investment income to average net assets prior to fees waived |
| Portfolio turnover |
| 1 | Calculated using average shares outstanding. |
| 2 | Amount is less than $(0.005) per share. |
| 3 | Total return is based on the change in net asset value of a share during the period and assumes reinvestment of dividends and distributions at net asset value and does not reflect the impact of a sales charge. Total return during the period reflects waivers by the manager and/or distributor. Performance would have been lower had the waivers not been in effect. |
See accompanying notes, which are an integral part of the financial statements.
| | Year ended | |
| | 8/31/23 | | | 8/31/22 | | | 8/31/21 | | | 8/31/20 | | | 8/31/19 | |
| | $ | 10.40 | | | $ | 12.09 | | | $ | 11.55 | | | $ | 11.70 | | | $ | 11.24 | |
| | | | | | | | | | | | | | | | | | | | |
| | | | | | | | | | | | | | | | | | | | |
| | | 0.33 | | | | 0.30 | | | | 0.31 | | | | 0.33 | | | | 0.37 | |
| | | (0.63 | ) | | | (1.61 | ) | | | 0.55 | | | | (0.13 | ) | | | 0.46 | |
| | | (0.30 | ) | | | (1.31 | ) | | | 0.86 | | | | 0.20 | | | | 0.83 | |
| | | | | | | | | | | | | | | | | | | | |
| | | | | | | | | | | | | | | | | | | | |
| | | (0.32 | ) | | | (0.30 | ) | | | (0.31 | ) | | | (0.35 | ) | | | (0.37 | ) |
| | | — | 2 | | | (0.08 | ) | | | (0.01 | ) | | | — | | | | — | |
| | | (0.32 | ) | | | (0.38 | ) | | | (0.32 | ) | | | (0.35 | ) | | | (0.37 | ) |
| | | | | | | | | | | | | | | | | | | | |
| | $ | 9.78 | | | $ | 10.40 | | | $ | 12.09 | | | $ | 11.55 | | | $ | 11.70 | |
| | | | | | | | | | | | | | | | | | | | |
| | | (2.84 | )% | | | (11.06 | )% | | | 7.51 | % | | | 1.79 | % | | | 7.51 | % |
| | | | | | | | | | | | | | | | | | | | |
| | | | | | | | | | | | | | | | | | | | |
| | $ | 45,650 | | | $ | 56,882 | | | $ | 66,710 | | | $ | 62,186 | | | $ | 62,033 | |
| | | 0.84 | % | | | 0.84 | % | | | 0.84 | % | | | 0.84 | % | | | 0.84 | % |
| | | 1.10 | % | | | 1.01 | % | | | 1.00 | % | | | 1.01 | % | | | 1.02 | % |
| | | 3.31 | % | | | 2.70 | % | | | 2.60 | % | | | 2.87 | % | | | 3.29 | % |
| | | 3.05 | % | | | 2.53 | % | | | 2.44 | % | | | 2.70 | % | | | 3.11 | % |
| | | 22 | % | | | 30 | % | | | 19 | % | | | 36 | % | | | 31 | % |
Financial highlights
Delaware Tax-Free Arizona Fund Class C
Selected data for each share of the Fund outstanding throughout each period were as follows:
| |
| Net asset value, beginning of period |
| |
| Income (loss) from investment operations: |
| Net investment income1 |
| Net realized and unrealized gain (loss) |
| Total from investment operations |
| |
| Less dividends and distributions from: |
| Net investment income |
| Net realized gain |
| Total dividends and distributions |
| |
| Net asset value, end of period |
| |
| Total return3 |
| |
| Ratios and supplemental data: |
| Net assets, end of period (000 omitted) |
| Ratio of expenses to average net assets |
| Ratio of expenses to average net assets prior to fees waived |
| Ratio of net investment income to average net assets |
| Ratio of net investment income to average net assets prior to fees waived |
| Portfolio turnover |
| 1 | Calculated using average shares outstanding. |
| 2 | Amount is less than $(0.005) per share. |
| 3 | Total return is based on the change in net asset value of a share during the period and assumes reinvestment of dividends and distributions at net asset value and does not reflect the impact of a sales charge. Total return during the period reflects waivers by the manager and/or distributor. Performance would have been lower had the waivers not been in effect. |
See accompanying notes, which are an integral part of the financial statements.
| | Year ended | |
| | 8/31/23 | | | 8/31/22 | | | 8/31/21 | | | 8/31/20 | | | 8/31/19 | |
| | $ | 10.43 | | | $ | 12.12 | | | $ | 11.58 | | | $ | 11.73 | | | $ | 11.27 | |
| | | | | | | | | | | | | | | | | | | | |
| | | | | | | | | | | | | | | | | | | | |
| | | 0.26 | | | | 0.22 | | | | 0.22 | | | | 0.24 | | | | 0.28 | |
| | | (0.64 | ) | | | (1.61 | ) | | | 0.55 | | | | (0.12 | ) | | | 0.46 | |
| | | (0.38 | ) | | | (1.39 | ) | | | 0.77 | | | | 0.12 | | | | 0.74 | |
| | | | | | | | | | | | | | | | | | | | |
| | | | | | | | | | | | | | | | | | | | |
| | | (0.25 | ) | | | (0.22 | ) | | | (0.22 | ) | | | (0.27 | ) | | | (0.28 | ) |
| | | — | 2 | | | (0.08 | ) | | | (0.01 | ) | | | — | | | | — | |
| | | (0.25 | ) | | | (0.30 | ) | | | (0.23 | ) | | | (0.27 | ) | | | (0.28 | ) |
| | | | | | | | | | | | | | | | | | | | |
| | $ | 9.80 | | | $ | 10.43 | | | $ | 12.12 | | | $ | 11.58 | | | $ | 11.73 | |
| | | | | | | | | | | | | | | | | | | | |
| | | (3.65 | )% | | | (11.70 | )% | | | 6.70 | % | | | 1.03 | % | | | 6.70 | % |
| | | | | | | | | | | | | | | | �� | | | | |
| | | | | | | | | | | | | | | | | | | | |
| | $ | 834 | | | $ | 1,119 | | | $ | 1,527 | | | $ | 2,561 | | | $ | 3,100 | |
| | | 1.59 | % | | | 1.59 | % | | | 1.59 | % | | | 1.59 | % | | | 1.59 | % |
| | | 1.85 | % | | | 1.76 | % | | | 1.75 | % | | | 1.76 | % | | | 1.77 | % |
| | | 2.56 | % | | | 1.95 | % | | | 1.85 | % | | | 2.12 | % | | | 2.54 | % |
| | | 2.30 | % | | | 1.78 | % | | | 1.69 | % | | | 1.95 | % | | | 2.36 | % |
| | | 22 | % | | | 30 | % | | | 19 | % | | | 36 | % | | | 31 | % |
Financial highlights
Delaware Tax-Free Arizona Fund Institutional Class
Selected data for each share of the Fund outstanding throughout each period were as follows:
| |
| Net asset value, beginning of period |
| |
| Income (loss) from investment operations: |
| Net investment income1 |
| Net realized and unrealized gain (loss) |
| Total from investment operations |
| |
| Less dividends and distributions from: |
| Net investment income |
| Net realized gain |
| Total dividends and distributions |
| |
| Net asset value, end of period |
| |
| Total return3 |
| |
| Ratios and supplemental data: |
| Net assets, end of period (000 omitted) |
| Ratio of expenses to average net assets |
| Ratio of expenses to average net assets prior to fees waived |
| Ratio of net investment income to average net assets |
| Ratio of net investment income to average net assets prior to fees waived |
| Portfolio turnover |
| 1 | Calculated using average shares outstanding. |
| 2 | Amount is less than $(0.005) per share. |
| 3 | Total return is based on the change in net asset value of a share during the period and assumes reinvestment of dividends and distributions at net asset value. Total return during the period reflects waivers by the manager. Performance would have been lower had the waivers not been in effect. |
See accompanying notes, which are an integral part of the financial statements.
| | Year ended | |
| | 8/31/23 | | | 8/31/22 | | | 8/31/21 | | | 8/31/20 | | | 8/31/19 | |
| | $ | 10.40 | | | $ | 12.09 | | | $ | 11.55 | | | $ | 11.70 | | | $ | 11.24 | |
| | | | | | | | | | | | | | | | | | | | |
| | | | | | | | | | | | | | | | | | | | |
| | | 0.36 | | | | 0.33 | | | | 0.34 | | | | 0.36 | | | | 0.39 | |
| | | (0.63 | ) | | | (1.61 | ) | | | 0.55 | | | | (0.13 | ) | | | 0.46 | |
| | | (0.27 | ) | | | (1.28 | ) | | | 0.89 | | | | 0.23 | | | | 0.85 | |
| | | | | | | | | | | | | | | | | | | | |
| | | | | | | | | | | | | | | | | | | | |
| | | (0.35 | ) | | | (0.33 | ) | | | (0.34 | ) | | | (0.38 | ) | | | (0.39 | ) |
| | | — | 2 | | | (0.08 | ) | | | (0.01 | ) | | | — | | | | — | |
| | | (0.35 | ) | | | (0.41 | ) | | | (0.35 | ) | | | (0.38 | ) | | | (0.39 | ) |
| | | | | | | | | | | | | | | | | | | | |
| | $ | 9.78 | | | $ | 10.40 | | | $ | 12.09 | | | $ | 11.55 | | | $ | 11.70 | |
| | | | | | | | | | | | | | | | | | | | |
| | | (2.60 | )% | | | (10.84 | )% | | | 7.78 | % | | | 2.05 | % | | | 7.78 | % |
| | | | | | | | | | | | | | | | | | | | |
| | | | | | | | | | | | | | | | | | | | |
| | $ | 12,774 | | | $ | 18,875 | | | $ | 22,147 | | | $ | 15,072 | | | $ | 14,136 | |
| | | 0.59 | % | | | 0.59 | % | | | 0.59 | % | | | 0.59 | % | | | 0.59 | % |
| | | 0.85 | % | | | 0.76 | % | | | 0.75 | % | | | 0.76 | % | | | 0.77 | % |
| | | 3.56 | % | | | 2.95 | % | | | 2.85 | % | | | 3.12 | % | | | 3.54 | % |
| | | 3.30 | % | | | 2.78 | % | | | 2.69 | % | | | 2.95 | % | | | 3.36 | % |
| | | 22 | % | | | 30 | % | | | 19 | % | | | 36 | % | | | 31 | % |
Financial highlights
Delaware Tax-Free California Fund Class A
Selected data for each share of the Fund outstanding throughout each period were as follows:
| |
| Net asset value, beginning of period |
| |
| Income (loss) from investment operations: |
| Net investment income1 |
| Net realized and unrealized gain (loss) |
| Total from investment operations |
| |
| Less dividends and distributions from: |
| Net investment income |
| Net realized gain |
| Total dividends and distributions |
| |
| Net asset value, end of period |
| |
| Total return2 |
| |
| Ratios and supplemental data: |
| Net assets, end of period (000 omitted) |
| Ratio of expenses to average net assets |
| Ratio of expenses to average net assets prior to fees waived |
| Ratio of net investment income to average net assets |
| Ratio of net investment income to average net assets prior to fees waived |
| Portfolio turnover |
| 1 | Calculated using average shares outstanding. |
| 2 | Total return is based on the change in net asset value of a share during the period and assumes reinvestment of dividends and distributions at net asset value and does not reflect the impact of a sales charge. Total return during the period reflects waivers by the manager and/or distributor. Performance would have been lower had the waivers not been in effect. |
See accompanying notes, which are an integral part of the financial statements.
| | Year ended | |
| | 8/31/23 | | | 8/31/22 | | | 8/31/21 | | | 8/31/20 | | | 8/31/19 | |
| | $ | 10.97 | | | $ | 12.64 | | | $ | 12.18 | | | $ | 12.49 | | | $ | 11.98 | |
| | | | | | | | | | | | | | | | | | | | |
| | | | | | | | | | | | | | | | | | | | |
| | | 0.39 | | | | 0.35 | | | | 0.37 | | | | 0.38 | | | | 0.40 | |
| | | (0.30 | ) | | | (1.65 | ) | | | 0.46 | | | | (0.20 | ) | | | 0.53 | |
| | | 0.09 | | | | (1.30 | ) | | | 0.83 | | | | 0.18 | | | | 0.93 | |
| | | | | | | | | | | | | | | | | | | | |
| | | | | | | | | | | | | | | | | | | | |
| | | (0.38 | ) | | | (0.35 | ) | | | (0.37 | ) | | | (0.38 | ) | | | (0.40 | ) |
| | | — | | | | (0.02 | ) | | | — | | | | (0.11 | ) | | | (0.02 | ) |
| | | (0.38 | ) | | | (0.37 | ) | | | (0.37 | ) | | | (0.49 | ) | | | (0.42 | ) |
| | | | | | | | | | | | | | | | | | | | |
| | $ | 10.68 | | | $ | 10.97 | | | $ | 12.64 | | | $ | 12.18 | | | $ | 12.49 | |
| | | | | | | | | | | | | | | | | | | | |
| | | 0.87 | % | | | (10.48 | )% | | | 6.88 | % | | | 1.59 | % | | | 7.99 | % |
| | | | | | | | | | | | | | | | | | | | |
| | | | | | | | | | | | | | | | | | | | |
| | $ | 69,093 | | | $ | 71,308 | | | $ | 86,059 | | | $ | 44,059 | | | $ | 42,203 | |
| | | 0.81 | % | | | 0.82 | % | | | 0.86 | % | | | 0.82 | % | | | 0.82 | % |
| | | 1.00 | % | | | 0.99 | % | | | 1.06 | % | | | 1.03 | % | | | 1.03 | % |
| | | 3.62 | % | | | 2.94 | % | | | 2.95 | % | | | 3.17 | % | | | 3.36 | % |
| | | 3.43 | % | | | 2.77 | % | | | 2.75 | % | | | 2.96 | % | | | 3.15 | % |
| | | 22 | % | | | 31 | % | | | 14 | % | | | 36 | % | | | 32 | % |
Financial highlights
Delaware Tax-Free California Fund Class C
Selected data for each share of the Fund outstanding throughout each period were as follows:
| |
| Net asset value, beginning of period |
| |
| Income (loss) from investment operations: |
| Net investment income1 |
| Net realized and unrealized gain (loss) |
| Total from investment operations |
| |
| Less dividends and distributions from: |
| Net investment income |
| Net realized gain |
| Total dividends and distributions |
| |
| Net asset value, end of period |
| |
| Total return2 |
| |
| Ratios and supplemental data: |
| Net assets, end of period (000 omitted) |
| Ratio of expenses to average net assets |
| Ratio of expenses to average net assets prior to fees waived |
| Ratio of net investment income to average net assets |
| Ratio of net investment income to average net assets prior to fees waived |
| Portfolio turnover |
| 1 | Calculated using average shares outstanding. |
| 2 | Total return is based on the change in net asset value of a share during the period and assumes reinvestment of dividends and distributions at net asset value and does not reflect the impact of a sales charge. Total return during the period reflects waivers by the manager and/or distributor. Performance would have been lower had the waivers not been in effect. |
See accompanying notes, which are an integral part of the financial statements.
| | Year ended | |
| | 8/31/23 | | | 8/31/22 | | | 8/31/21 | | | 8/31/20 | | | 8/31/19 | |
| | $ | 11.00 | | | $ | 12.66 | | | $ | 12.21 | | | $ | 12.52 | | | $ | 12.00 | |
| | | | | | | | | | | | | | | | | | | | |
| | | | | | | | | | | | | | | | | | | | |
| | | 0.31 | | | | 0.26 | | | | 0.27 | | | | 0.29 | | | | 0.32 | |
| | | (0.30 | ) | | | (1.64 | ) | | | 0.45 | | | | (0.20 | ) | | | 0.54 | |
| | | 0.01 | | | | (1.38 | ) | | | 0.72 | | | | 0.09 | | | | 0.86 | |
| | | | | | | | | | | | | | | | | | | | |
| | | | | | | | | | | | | | | | | | | | |
| | | (0.30 | ) | | | (0.26 | ) | | | (0.27 | ) | | | (0.29 | ) | | | (0.32 | ) |
| | | — | | | | (0.02 | ) | | | — | | | | (0.11 | ) | | | (0.02 | ) |
| | | (0.30 | ) | | | (0.28 | ) | | | (0.27 | ) | | | (0.40 | ) | | | (0.34 | ) |
| | | | | | | | | | | | | | | | | | | | |
| | $ | 10.71 | | | $ | 11.00 | | | $ | 12.66 | | | $ | 12.21 | | | $ | 12.52 | |
| | | | | | | | | | | | | | | | | | | | |
| | | 0.12 | % | | | (11.05 | )% | | | 5.99 | % | | | 0.83 | % | | | 7.26 | % |
| | | | | | | | | | | | | | | | | | | | |
| | | | | | | | | | | | | | | | | | | | |
| | $ | 2,001 | | | $ | 2,479 | | | $ | 3,843 | | | $ | 6,829 | | | $ | 11,551 | |
| | | 1.56 | % | | | 1.57 | % | | | 1.61 | % | | | 1.57 | % | | | 1.57 | % |
| | | 1.75 | % | | | 1.74 | % | | | 1.81 | % | | | 1.78 | % | | | 1.78 | % |
| | | 2.87 | % | | | 2.19 | % | | | 2.20 | % | | | 2.42 | % | | | 2.61 | % |
| | | 2.68 | % | | | 2.02 | % | | | 2.00 | % | | | 2.21 | % | | | 2.40 | % |
| | | 22 | % | | | 31 | % | | | 14 | % | | | 36 | % | | | 32 | % |
Financial highlights
Delaware Tax-Free California Fund Institutional Class
Selected data for each share of the Fund outstanding throughout each period were as follows:
| |
| Net asset value, beginning of period |
| |
| Income (loss) from investment operations: |
| Net investment income1 |
| Net realized and unrealized gain (loss) |
| Total from investment operations |
| |
| Less dividends and distributions from: |
| Net investment income |
| Net realized gain |
| Total dividends and distributions |
| |
| Net asset value, end of period |
| |
| Total return2 |
| |
| Ratios and supplemental data: |
| Net assets, end of period (000 omitted) |
| Ratio of expenses to average net assets |
| Ratio of expenses to average net assets prior to fees waived |
| Ratio of net investment income to average net assets |
| Ratio of net investment income to average net assets prior to fees waived |
| Portfolio turnover |
| 1 | Calculated using average shares outstanding. |
| 2 | Total return is based on the change in net asset value of a share during the period and assumes reinvestment of dividends and distributions at net asset value. Total return during the period reflects waivers by the manager. Performance would have been lower had the waivers not been in effect. |
See accompanying notes, which are an integral part of the financial statements.
| | Year ended | |
| | 8/31/23 | | | 8/31/22 | | | 8/31/21 | | | 8/31/20 | | | 8/31/19 | |
| | $ | 10.97 | | | $ | 12.64 | | | $ | 12.18 | | | $ | 12.49 | | | $ | 11.98 | |
| | | | | | | | | | | | | | | | | | | | |
| | | | | | | | | | | | | | | | | | | | |
| | | 0.42 | | | | 0.38 | | | | 0.40 | | | | 0.41 | | | | 0.43 | |
| | | (0.29 | ) | | | (1.65 | ) | | | 0.46 | | | | (0.20 | ) | | | 0.53 | |
| | | 0.13 | | | | (1.27 | ) | | | 0.86 | | | | 0.21 | | | | 0.96 | |
| | | | | | | | | | | | | | | | | | | | |
| | | | | | | | | | | | | | | | | | | | |
| | | (0.41 | ) | | | (0.38 | ) | | | (0.40 | ) | | | (0.41 | ) | | | (0.43 | ) |
| | | — | | | | (0.02 | ) | | | — | | | | (0.11 | ) | | | (0.02 | ) |
| | | (0.41 | ) | | | (0.40 | ) | | | (0.40 | ) | | | (0.52 | ) | | | (0.45 | ) |
| | | | | | | | | | | | | | | | | | | | |
| | $ | 10.69 | | | $ | 10.97 | | | $ | 12.64 | | | $ | 12.18 | | | $ | 12.49 | |
| | | | | | | | | | | | | | | | | | | | |
| | | 1.22 | % | | | (10.26 | )% | | | 7.14 | % | | | 1.84 | % | | | 8.25 | % |
| | | | | | | | | | | | | | | | | | | | |
| | | | | | | | | | | | | | | | | | | | |
| | $ | 132,338 | | | $ | 79,900 | | | $ | 45,996 | | | $ | 34,098 | | | $ | 44,646 | |
| | | 0.56 | % | | | 0.57 | % | | | 0.61 | % | | | 0.57 | % | | | 0.57 | % |
| | | 0.75 | % | | | 0.74 | % | | | 0.81 | % | | | 0.78 | % | | | 0.78 | % |
| | | 3.87 | % | | | 3.19 | % | | | 3.20 | % | | | 3.42 | % | | | 3.61 | % |
| | | 3.68 | % | | | 3.02 | % | | | 3.00 | % | | | 3.21 | % | | | 3.40 | % |
| | | 22 | % | | | 31 | % | | | 14 | % | | | 36 | % | | | 32 | % |
Financial highlights
Delaware Tax-Free Colorado Fund Class A
Selected data for each share of the Fund outstanding throughout each period were as follows:
| |
| Net asset value, beginning of period |
| |
| Income (loss) from investment operations: |
| Net investment income1 |
| Net realized and unrealized gain (loss) |
| Total from investment operations |
| |
| Less dividends and distributions from: |
| Net investment income |
| Total dividends and distributions |
| |
| Net asset value, end of period |
| |
| Total return2 |
| |
| Ratios and supplemental data: |
| Net assets, end of period (000 omitted) |
| Ratio of expenses to average net assets3 |
| Ratio of expenses to average net assets prior to fees waived3 |
| Ratio of net investment income to average net assets |
| Ratio of net investment income to average net assets prior to fees waived |
| Portfolio turnover |
| 1 | Calculated using average shares outstanding. |
| 2 | Total return is based on the change in net asset value of a share during the period and assumes reinvestment of dividends and distributions at net asset value and does not reflect the impact of a sales charge. Total return during the period reflects waivers by the manager and/or distributor. Performance would have been lower had the waivers not been in effect. |
| 3 | Expense ratios do not include expenses of any investment companies in which the Fund invests. |
See accompanying notes, which are an integral part of the financial statements.
| | Year ended | |
| | 8/31/23 | | | 8/31/22 | | | 8/31/21 | | | 8/31/20 | | | 8/31/19 | |
| | $ | 10.30 | | | $ | 11.70 | | | $ | 11.36 | | | $ | 11.48 | | | $ | 11.04 | |
| | | | | | | | | | | | | | | | | | | | |
| | | | | | | | | | | | | | | | | | | | |
| | | 0.35 | | | | 0.30 | | | | 0.29 | | | | 0.33 | | | | 0.37 | |
| | | (0.39 | ) | | | (1.40 | ) | | | 0.34 | | | | (0.12 | ) | | | 0.44 | |
| | | (0.04 | ) | | | (1.10 | ) | | | 0.63 | | | | 0.21 | | | | 0.81 | |
| | | | | | | | | | | | | | | | | | | | |
| | | | | | | | | | | | | | | | | | | | |
| | | (0.34 | ) | | | (0.30 | ) | | | (0.29 | ) | | | (0.33 | ) | | | (0.37 | ) |
| | | (0.34 | ) | | | (0.30 | ) | | | (0.29 | ) | | | (0.33 | ) | | | (0.37 | ) |
| | | | | | | | | | | | | | | | | | | | |
| | $ | 9.92 | | | $ | 10.30 | | | $ | 11.70 | | | $ | 11.36 | | | $ | 11.48 | |
| | | | | | | | | | | | | | | | | | | | |
| | | (0.39 | )% | | | (9.49 | )% | | | 5.64 | % | | | 1.88 | % | | | 7.48 | % |
| | | | | | | | | | | | | | | | | | | | |
| | | | | | | | | | | | | | | | | | | | |
| | $ | 127,477 | | | $ | 142,904 | | | $ | 164,258 | | | $ | 162,955 | | | $ | 167,136 | |
| | | 0.82 | % | | | 0.82 | % | | | 0.83 | % | | | 0.84 | % | | | 0.84 | % |
| | | 0.98 | % | | | 0.96 | % | | | 0.96 | % | | | 0.96 | % | | | 0.97 | % |
| | | 3.43 | % | | | 2.76 | % | | | 2.54 | % | | | 2.91 | % | | | 3.31 | % |
| | | 3.27 | % | | | 2.62 | % | | | 2.41 | % | | | 2.79 | % | | | 3.18 | % |
| | | 34 | % | | | 24 | % | | | 10 | % | | | 18 | % | | | 16 | % |
Financial highlights
Delaware Tax-Free Colorado Fund Class C
Selected data for each share of the Fund outstanding throughout each period were as follows:
| |
| Net asset value, beginning of period |
| |
| Income (loss) from investment operations: |
| Net investment income1 |
| Net realized and unrealized gain (loss) |
| Total from investment operations |
| |
| Less dividends and distributions from: |
| Net investment income |
| Total dividends and distributions |
| |
| Net asset value, end of period |
| |
| Total return2 |
| |
| Ratios and supplemental data: |
| Net assets, end of period (000 omitted) |
| Ratio of expenses to average net assets3 |
| Ratio of expenses to average net assets prior to fees waived3 |
| Ratio of net investment income to average net assets |
| Ratio of net investment income to average net assets prior to fees waived |
| Portfolio turnover |
| 1 | Calculated using average shares outstanding. |
| 2 | Total return is based on the change in net asset value of a share during the period and assumes reinvestment of dividends and distributions at net asset value and does not reflect the impact of a sales charge. Total return during the period reflects waivers by the manager and/or distributor. Performance would have been lower had the waivers not been in effect. |
| 3 | Expense ratios do not include expenses of any investment companies in which the Fund invests. |
See accompanying notes, which are an integral part of the financial statements.
| | Year ended | |
| | 8/31/23 | | | 8/31/22 | | | 8/31/21 | | | 8/31/20 | | | 8/31/19 | |
| | $ | 10.32 | | | $ | 11.73 | | | $ | 11.39 | | | $ | 11.51 | | | $ | 11.07 | |
| | | | | | | | | | | | | | | | | | | | |
| | | | | | | | | | | | | | | | | | | | |
| | | 0.27 | | | | 0.22 | | | | 0.21 | | | | 0.24 | | | | 0.29 | |
| | | (0.39 | ) | | | (1.41 | ) | | | 0.34 | | | | (0.12 | ) | | | 0.44 | |
| | | (0.12 | ) | | | (1.19 | ) | | | 0.55 | | | | 0.12 | | | | 0.73 | |
| | | | | | | | | | | | | | | | | | | | |
| | | | | | | | | | | | | | | | | | | | |
| | | (0.26 | ) | | | (0.22 | ) | | | (0.21 | ) | | | (0.24 | ) | | | (0.29 | ) |
| | | (0.26 | ) | | | (0.22 | ) | | | (0.21 | ) | | | (0.24 | ) | | | (0.29 | ) |
| | | | | | | | | | | | | | | | | | | | |
| | $ | 9.94 | | | $ | 10.32 | | | $ | 11.73 | | | $ | 11.39 | | | $ | 11.51 | |
| | | | | | | | | | | | | | | | | | | | |
| | | (1.14 | )% | | | (10.22 | )% | | | 4.85 | % | | | 1.12 | % | | | 6.67 | % |
| | | | | | | | | | | | | | | | | | | | |
| | | | | | | | | | | | | | | | | | | | |
| | $ | 3,111 | | | $ | 4,845 | | | $ | 6,758 | | | $ | 8,121 | | | $ | 10,364 | |
| | | 1.57 | % | | | 1.57 | % | | | 1.58 | % | | | 1.59 | % | | | 1.59 | % |
| | | 1.73 | % | | | 1.71 | % | | | 1.71 | % | | | 1.71 | % | | | 1.72 | % |
| | | 2.68 | % | | | 2.01 | % | | | 1.79 | % | | | 2.16 | % | | | 2.56 | % |
| | | 2.52 | % | | | 1.87 | % | | | 1.66 | % | | | 2.04 | % | | | 2.43 | % |
| | | 34 | % | | | 24 | % | | | 10 | % | | | 18 | % | | | 16 | % |
Financial highlights
Delaware Tax-Free Colorado Fund Institutional Class
Selected data for each share of the Fund outstanding throughout each period were as follows:
| |
| Net asset value, beginning of period |
| |
| Income (loss) from investment operations: |
| Net investment income1 |
| Net realized and unrealized gain (loss) |
| Total from investment operations |
| |
| Less dividends and distributions from: |
| Net investment income |
| Total dividends and distributions |
| |
| Net asset value, end of period |
| |
| Total return2 |
| |
| Ratios and supplemental data: |
| Net assets, end of period (000 omitted) |
| Ratio of expenses to average net assets3 |
| Ratio of expenses to average net assets prior to fees waived3 |
| Ratio of net investment income to average net assets |
| Ratio of net investment income to average net assets prior to fees waived |
| Portfolio turnover |
| 1 | Calculated using average shares outstanding. |
| 2 | Total return is based on the change in net asset value of a share during the period and assumes reinvestment of dividends and distributions at net asset value. Total return during the period reflects waivers by the manager. Performance would have been lower had the waivers not been in effect. |
| 3 | Expense ratios do not include expenses of any investment companies in which the Fund invests. |
See accompanying notes, which are an integral part of the financial statements.
| | Year ended | |
| | 8/31/23 | | | 8/31/22 | | | 8/31/21 | | | 8/31/20 | | | 8/31/19 | |
| | $ | 10.30 | | | $ | 11.70 | | | $ | 11.36 | | | $ | 11.48 | | | $ | 11.04 | |
| | | | | | | | | | | | | | | | | | | | |
| | | | | | | | | | | | | | | | | | | | |
| | | 0.37 | | | | 0.33 | | | | 0.32 | | | | 0.36 | | | | 0.40 | |
| | | (0.39 | ) | | | (1.40 | ) | | | 0.34 | | | | (0.12 | ) | | | 0.44 | |
| | | (0.02 | ) | | | (1.07 | ) | | | 0.66 | | | | 0.24 | | | | 0.84 | |
| | | | | | | | | | | | | | | | | | | | |
| | | | | | | | | | | | | | | | | | | | |
| | | (0.36 | ) | | | (0.33 | ) | | | (0.32 | ) | | | (0.36 | ) | | | (0.40 | ) |
| | | (0.36 | ) | | | (0.33 | ) | | | (0.32 | ) | | | (0.36 | ) | | | (0.40 | ) |
| | | | | | | | | | | | | | | | | | | | |
| | $ | 9.92 | | | $ | 10.30 | | | $ | 11.70 | | | $ | 11.36 | | | $ | 11.48 | |
| | | | | | | | | | | | | | | | | | | | |
| | | (0.14 | )% | | | (9.27 | )% | | | 5.91 | % | | | 2.14 | % | | | 7.74 | % |
| | | | | | | | | | | | | | | | | | | | |
| | | | | | | | | | | | | | | | | | | | |
| | $ | 82,209 | | | $ | 82,431 | | | $ | 76,092 | | | $ | 51,941 | | | $ | 42,317 | |
| | | 0.57 | % | | | 0.57 | % | | | 0.58 | % | | | 0.59 | % | | | 0.59 | % |
| | | 0.73 | % | | | 0.71 | % | | | 0.71 | % | | | 0.71 | % | | | 0.72 | % |
| | | 3.68 | % | | | 3.01 | % | | | 2.79 | % | | | 3.16 | % | | | 3.56 | % |
| | | 3.52 | % | | | 2.87 | % | | | 2.66 | % | | | 3.04 | % | | | 3.43 | % |
| | | 34 | % | | | 24 | % | | | 10 | % | | | 18 | % | | | 16 | % |
Financial highlights
Delaware Tax-Free Idaho Fund Class A
Selected data for each share of the Fund outstanding throughout each period were as follows:
| |
| Net asset value, beginning of period |
| |
| Income (loss) from investment operations: |
| Net investment income1 |
| Net realized and unrealized gain (loss) |
| Total from investment operations |
| |
| Less dividends and distributions from: |
| Net investment income |
| Total dividends and distributions |
| |
| Net asset value, end of period |
| |
| Total return2 |
| |
| Ratios and supplemental data: |
| Net assets, end of period (000 omitted) |
| Ratio of expenses to average net assets3 |
| Ratio of expenses to average net assets prior to fees waived3 |
| Ratio of net investment income to average net assets |
| Ratio of net investment income to average net assets prior to fees waived |
| Portfolio turnover |
| 1 | Calculated using average shares outstanding. |
| 2 | Total return is based on the change in net asset value of a share during the period and assumes reinvestment of dividends and distributions at net asset value and does not reflect the impact of a sales charge. Total return during the period reflects waivers by the manager and/or distributor. Performance would have been lower had the waivers not been in effect. |
| 3 | Expense ratios do not include expenses of any investment companies in which the Fund invests. |
See accompanying notes, which are an integral part of the financial statements.
| | Year ended | |
| | 8/31/23 | | | 8/31/22 | | | 8/31/21 | | | 8/31/20 | | | 8/31/19 | |
| | $ | 10.44 | | | $ | 11.91 | | | $ | 11.52 | | | $ | 11.65 | | | $ | 11.21 | |
| | | | | | | | | | | | | | | | | | | | |
| | | | | | | | | | | | | | | | | | | | |
| | | 0.34 | | | | 0.30 | | | | 0.30 | | | | 0.33 | | | | 0.35 | |
| | | (0.39 | ) | | | (1.47 | ) | | | 0.39 | | | | (0.13 | ) | | | 0.44 | |
| | | (0.05 | ) | | | (1.17 | ) | | | 0.69 | | | | 0.20 | | | | 0.79 | |
| | | | | | | | | | | | | | | | | | | | |
| | | | | | | | | | | | | | | | | | | | |
| | | (0.33 | ) | | | (0.30 | ) | | | (0.30 | ) | | | (0.33 | ) | | | (0.35 | ) |
| | | (0.33 | ) | | | (0.30 | ) | | | (0.30 | ) | | | (0.33 | ) | | | (0.35 | ) |
| | | | | | | | | | | | | | | | | | | | |
| | $ | 10.06 | | | $ | 10.44 | | | $ | 11.91 | | | $ | 11.52 | | | $ | 11.65 | |
| | | | | | | | | | | | | | | | | | | | |
| | | (0.51 | )% | | | (10.00 | )% | | | 6.03 | % | | | 1.77 | % | | | 7.19 | % |
| | | | | | | | | | | | | | | | | | | | |
| | | | | | | | | | | | | | | | | | | | |
| | $ | 64,691 | | | $ | 67,247 | | | $ | 71,345 | | | $ | 60,667 | | | $ | 55,480 | |
| | | 0.86 | % | | | 0.86 | % | | | 0.86 | % | | | 0.86 | % | | | 0.86 | % |
| | | 1.03 | % | | | 1.01 | % | | | 1.01 | % | | | 1.02 | % | | | 1.03 | % |
| | | 3.27 | % | | | 2.62 | % | | | 2.53 | % | | | 2.87 | % | | | 3.11 | % |
| | | 3.10 | % | | | 2.47 | % | | | 2.38 | % | | | 2.71 | % | | | 2.94 | % |
| | | 25 | % | | | 38 | % | | | 17 | % | | | 22 | % | | | 14 | % |
Financial highlights
Delaware Tax-Free Idaho Fund Class C
Selected data for each share of the Fund outstanding throughout each period were as follows:
| |
| Net asset value, beginning of period |
| |
| Income (loss) from investment operations: |
| Net investment income1 |
| Net realized and unrealized gain (loss) |
| Total from investment operations |
| |
| Less dividends and distributions from: |
| Net investment income |
| Total dividends and distributions |
| |
| Net asset value, end of period |
| |
| Total return2 |
| |
| Ratios and supplemental data: |
| Net assets, end of period (000 omitted) |
| Ratio of expenses to average net assets3 |
| Ratio of expenses to average net assets prior to fees waived3 |
| Ratio of net investment income to average net assets |
| Ratio of net investment income to average net assets prior to fees waived |
| Portfolio turnover |
| 1 | Calculated using average shares outstanding. |
| 2 | Total return is based on the change in net asset value of a share during the period and assumes reinvestment of dividends and distributions at net asset value and does not reflect the impact of a sales charge. Total return during the period reflects waivers by the manager and/or distributor. Performance would have been lower had the waivers not been in effect. |
| 3 | Expense ratios do not include expenses of any investment companies in which the Fund invests. |
See accompanying notes, which are an integral part of the financial statements.
| | Year ended | |
| | 8/31/23 | | | 8/31/22 | | | 8/31/21 | | | 8/31/20 | | | 8/31/19 | |
| | $ | 10.44 | | | $ | 11.90 | | | $ | 11.51 | | | $ | 11.64 | | | $ | 11.20 | |
| | | | | | | | | | | | | | | | | | | | |
| | | | | | | | | | | | | | | | | | | | |
| | | 0.26 | | | | 0.21 | | | | 0.21 | | | | 0.24 | | | | 0.27 | |
| | | (0.39 | ) | | | (1.46 | ) | | | 0.39 | | | | (0.13 | ) | | | 0.44 | |
| | | (0.13 | ) | | | (1.25 | ) | | | 0.60 | | | | 0.11 | | | | 0.71 | |
| | | | | | | | | | | | | | | | | | | | |
| | | | | | | | | | | | | | | | | | | | |
| | | (0.25 | ) | | | (0.21 | ) | | | (0.21 | ) | | | (0.24 | ) | | | (0.27 | ) |
| | | (0.25 | ) | | | (0.21 | ) | | | (0.21 | ) | | | (0.24 | ) | | | (0.27 | ) |
| | | | | | | | | | | | | | | | | | | | |
| | $ | 10.06 | | | $ | 10.44 | | | $ | 11.90 | | | $ | 11.51 | | | $ | 11.64 | |
| | | | | | | | | | | | | | | | | | | | |
| | | (1.26 | )% | | | (10.59 | )% | | | 5.24 | % | | | 1.00 | % | | | 6.40 | % |
| | | | | | | | | | | | | | | | | | | | |
| | | | | | | | | | | | | | | | | | | | |
| | $ | 4,532 | | | $ | 4,997 | | | $ | 6,453 | | | $ | 8,819 | | | $ | 12,875 | |
| | | 1.61 | % | | | 1.61 | % | | | 1.61 | % | | | 1.61 | % | | | 1.61 | % |
| | | 1.78 | % | | | 1.76 | % | | | 1.76 | % | | | 1.77 | % | | | 1.78 | % |
| | | 2.52 | % | | | 1.87 | % | | | 1.78 | % | | | 2.12 | % | | | 2.36 | % |
| | | 2.35 | % | | | 1.72 | % | | | 1.63 | % | | | 1.96 | % | | | 2.19 | % |
| | | 25 | % | | | 38 | % | | | 17 | % | | | 22 | % | | | 14 | % |
Financial highlights
Delaware Tax-Free Idaho Fund Institutional Class
Selected data for each share of the Fund outstanding throughout each period were as follows:
| |
| Net asset value, beginning of period |
| |
| Income (loss) from investment operations: |
| Net investment income1 |
| Net realized and unrealized gain (loss) |
| Total from investment operations |
| |
| Less dividends and distributions from: |
| Net investment income |
| Total dividends and distributions |
| |
| Net asset value, end of period |
| |
| Total return2 |
| |
| Ratios and supplemental data: |
| Net assets, end of period (000 omitted) |
| Ratio of expenses to average net assets3 |
| Ratio of expenses to average net assets prior to fees waived3 |
| Ratio of net investment income to average net assets |
| Ratio of net investment income to average net assets prior to fees waived |
| Portfolio turnover |
| 1 | Calculated using average shares outstanding. |
| 2 | Total return is based on the change in net asset value of a share during the period and assumes reinvestment of dividends and distributions at net asset value. Total return during the period reflects waivers by the manager. Performance would have been lower had the waivers not been in effect. |
| 3 | Expense ratios do not include expenses of any investment companies in which the Fund invests. |
See accompanying notes, which are an integral part of the financial statements.
| | Year ended |
| | 8/31/23 | | | 8/31/22 | | | 8/31/21 | | | 8/31/20 | | | 8/31/19 | |
| | $ | 10.44 | | | $ | 11.91 | | | $ | 11.52 | | | $ | 11.65 | | | $ | 11.21 | |
| | | | | | | | | | | | | | | | | | | | |
| | | | | | | | | | | | | | | | | | | | |
| | | 0.36 | | | | 0.32 | | | | 0.33 | | | | 0.36 | | | | 0.38 | |
| | | (0.38 | ) | | | (1.47 | ) | | | 0.39 | | | | (0.13 | ) | | | 0.44 | |
| | | (0.02 | ) | | | (1.15 | ) | | | 0.72 | | | | 0.23 | | | | 0.82 | |
| | | | | | | | | | | | | | | | | | | | |
| | | | | | | | | | | | | | | | | | | | |
| | | (0.35 | ) | | | (0.32 | ) | | | (0.33 | ) | | | (0.36 | ) | | | (0.38 | ) |
| | | (0.35 | ) | | | (0.32 | ) | | | (0.33 | ) | | | (0.36 | ) | | | (0.38 | ) |
| | | | | | | | | | | | | | | | | | | | |
| | $ | 10.07 | | | $ | 10.44 | | | $ | 11.91 | | | $ | 11.52 | | | $ | 11.65 | |
| | | | | | | | | | | | | | | | | | | | |
| | | (0.17 | )% | | | (9.77 | )% | | | 6.29 | % | | | 2.02 | % | | | 7.46 | % |
| | | | | | | | | | | | | | | | | | | | |
| | | | | | | | | | | | | | | | | | | | |
| | $ | 51,205 | | | $ | 49,393 | | | $ | 51,125 | | | $ | 36,057 | | | $ | 35,157 | |
| | | 0.61 | % | | | 0.61 | % | | | 0.61 | % | | | 0.61 | % | | | 0.61 | % |
| | | 0.78 | % | | | 0.76 | % | | | 0.76 | % | | | 0.77 | % | | | 0.78 | % |
| | | 3.52 | % | | | 2.87 | % | | | 2.78 | % | | | 3.12 | % | | | 3.36 | % |
| | | 3.35 | % | | | 2.72 | % | | | 2.63 | % | | | 2.96 | % | | | 3.19 | % |
| | | 25 | % | | | 38 | % | | | 17 | % | | | 22 | % | | | 14 | % |
Financial highlights
Delaware Tax-Free New York Fund Class A
Selected data for each share of the Fund outstanding throughout each period were as follows:
| |
| Net asset value, beginning of period |
| |
| Income (loss) from investment operations: |
| Net investment income1 |
| Net realized and unrealized gain (loss) |
| Total from investment operations |
| |
| Less dividends and distributions from: |
| Net investment income |
| Net realized gain |
| Total dividends and distributions |
| |
| Net asset value, end of period |
| |
| Total return3 |
| |
| Ratios and supplemental data: |
| Net assets, end of period (000 omitted) |
| Ratio of expenses to average net assets |
| Ratio of expenses to average net assets prior to fees waived |
| Ratio of net investment income to average net assets |
| Ratio of net investment income to average net assets prior to fees waived |
| Portfolio turnover |
| 1 | Calculated using average shares outstanding. |
| 2 | Amount is less than $(0.005) per share. |
| 3 | Total return is based on the change in net asset value of a share during the period and assumes reinvestment of dividends and distributions at net asset value and does not reflect the impact of a sales charge. Total return during the period reflects waivers by the manager and/or distributor. Performance would have been lower had the waivers not been in effect. |
See accompanying notes, which are an integral part of the financial statements.
| | Year ended |
| | 8/31/23 | | | 8/31/22 | | | 8/31/21 | | | 8/31/20 | | | 8/31/19 | |
| | $ | 10.56 | | | $ | 12.06 | | | $ | 11.66 | | | $ | 11.86 | | | $ | 11.33 | |
| | | | | | | | | | | | | | | | | | | | |
| | | | | | | | | | | | | | | | | | | | |
| | | 0.37 | | | | 0.31 | | | | 0.29 | | | | 0.33 | | | | 0.36 | |
| | | (0.34 | ) | | | (1.50 | ) | | | 0.45 | | | | (0.14 | ) | | | 0.53 | |
| | | 0.03 | | | | (1.19 | ) | | | 0.74 | | | | 0.19 | | | | 0.89 | |
| | | | | | | | | | | | | | | | | | | | |
| | | | | | | | | | | | | | | | | | | | |
| | | (0.36 | ) | | | (0.31 | ) | | | (0.29 | ) | | | (0.33 | ) | | | (0.36 | ) |
| | | — | | | | — | 2 | | | (0.05 | ) | | | (0.06 | ) | | | — | |
| | | (0.36 | ) | | | (0.31 | ) | | | (0.34 | ) | | | (0.39 | ) | | | (0.36 | ) |
| | | | | | | | | | | | | | | | | | | | |
| | $ | 10.23 | | | $ | 10.56 | | | $ | 12.06 | | | $ | 11.66 | | | $ | 11.86 | |
| | | | | | | | | | | | | | | | | | | | |
| | | 0.29 | % | | | (9.96 | )% | | | 6.46 | % | | | 1.68 | % | | | 8.00 | % |
| | | | | | | | | | | | | | | | | | | | |
| | | | | | | | | | | | | | | | | | | | |
| | $ | 130,791 | | | $ | 130,721 | | | $ | 161,593 | | | $ | 42,514 | | | $ | 36,058 | |
| | | 0.80 | % | | | 0.80 | % | | | 0.83 | % | | | 0.80 | % | | | 0.80 | % |
| | | 0.98 | % | | | 0.97 | % | | | 1.01 | % | | | 1.05 | % | | | 1.07 | % |
| | | 3.56 | % | | | 2.78 | % | | | 2.47 | % | | | 2.86 | % | | | 3.12 | % |
| | | 3.38 | % | | | 2.61 | % | | | 2.29 | % | | | 2.61 | % | | | 2.85 | % |
| | | 24 | % | | | 30 | % | | | 13 | % | | | 31 | % | | | 21 | % |
Financial highlights
Delaware Tax-Free New York Fund Class C
Selected data for each share of the Fund outstanding throughout each period were as follows:
| |
| Net asset value, beginning of period |
| |
| Income (loss) from investment operations: |
| Net investment income1 |
| Net realized and unrealized gain (loss) |
| Total from investment operations |
| |
| Less dividends and distributions from: |
| Net investment income |
| Net realized gain |
| Total dividends and distributions |
| |
| Net asset value, end of period |
| |
| Total return3 |
| |
| Ratios and supplemental data: |
| Net assets, end of period (000 omitted) |
| Ratio of expenses to average net assets |
| Ratio of expenses to average net assets prior to fees waived |
| Ratio of net investment income to average net assets |
| Ratio of net investment income to average net assets prior to fees waived |
| Portfolio turnover |
| 1 | Calculated using average shares outstanding. |
| 2 | Amount is less than $(0.005) per share. |
| 3 | Total return is based on the change in net asset value of a share during the period and assumes reinvestment of dividends and distributions at net asset value and does not reflect the impact of a sales charge. Total return during the period reflects waivers by the manager and/or distributor. Performance would have been lower had the waivers not been in effect. |
See accompanying notes, which are an integral part of the financial statements.
| | Year ended | |
| | 8/31/23 | | | 8/31/22 | | | 8/31/21 | | | 8/31/20 | | | 8/31/19 | |
| | $ | 10.53 | | | $ | 12.03 | | | $ | 11.63 | | | $ | 11.83 | | | $ | 11.30 | |
| | | | | | | | | | | | | | | | | | | | |
| | | | | | | | | | | | | | | | | | | | |
| | | 0.29 | | | | 0.23 | | | | 0.21 | | | | 0.24 | | | | 0.27 | |
| | | (0.33 | ) | | | (1.50 | ) | | | 0.45 | | | | (0.14 | ) | | | 0.53 | |
| | | (0.04 | ) | | | (1.27 | ) | | | 0.66 | | | | 0.10 | | | | 0.80 | |
| | | | | | | | | | | | | | | | | | | | |
| | | | | | | | | | | | | | | | | | | | |
| | | (0.28 | ) | | | (0.23 | ) | | | (0.21 | ) | | | (0.24 | ) | | | (0.27 | ) |
| | | — | | | | — | 2 | | | (0.05 | ) | | | (0.06 | ) | | | — | |
| | | (0.28 | ) | | | (0.23 | ) | | | (0.26 | ) | | | (0.30 | ) | | | (0.27 | ) |
| | | | | | | | | | | | | | | | | | | | |
| | $ | 10.21 | | | $ | 10.53 | | | $ | 12.03 | | | $ | 11.63 | | | $ | 11.83 | |
| | | | | | | | | | | | | | | | | | | | |
| | | (0.37 | )% | | | (10.66 | )% | | | 5.68 | % | | | 0.92 | % | | | 7.20 | % |
| | | | | | | | | | | | | | | | | | | | |
| | | | | | | | | | | | | | | | | | | | |
| | $ | 2,757 | | | $ | 3,818 | | | $ | 4,720 | | | $ | 7,037 | | | $ | 13,459 | |
| | | 1.55 | % | | | 1.55 | % | | | 1.58 | % | | | 1.55 | % | | | 1.55 | % |
| | | 1.73 | % | | | 1.72 | % | | | 1.76 | % | | | 1.80 | % | | | 1.82 | % |
| | | 2.81 | % | | | 2.02 | % | | | 1.72 | % | | | 2.11 | % | | | 2.37 | % |
| | | 2.63 | % | | | 1.85 | % | | | 1.54 | % | | | 1.86 | % | | | 2.10 | % |
| | | 24 | % | | | 30 | % | | | 13 | % | | | 31 | % | | | 21 | % |
Financial highlights
Delaware Tax-Free New York Fund Institutional Class
Selected data for each share of the Fund outstanding throughout each period were as follows:
| |
| Net asset value, beginning of period |
| |
| Income (loss) from investment operations: |
| Net investment income1 |
| Net realized and unrealized gain (loss) |
| Total from investment operations |
| |
| Less dividends and distributions from: |
| Net investment income |
| Net realized gain |
| Total dividends and distributions |
| |
| Net asset value, end of period |
| |
| Total return3 |
| |
| Ratios and supplemental data: |
| Net assets, end of period (000 omitted) |
| Ratio of expenses to average net assets |
| Ratio of expenses to average net assets prior to fees waived |
| Ratio of net investment income to average net assets |
| Ratio of net investment income to average net assets prior to fees waived |
| Portfolio turnover |
| 1 | Calculated using average shares outstanding. |
| 2 | Amount is less than $(0.005) per share. |
| 3 | Total return is based on the change in net asset value of a share during the period and assumes reinvestment of dividends and distributions at net asset value. Total return during the period reflects waivers by the manager. Performance would have been lower had the waivers not been in effect. |
See accompanying notes, which are an integral part of the financial statements.
| | Year ended | |
| | 8/31/23 | | | 8/31/22 | | | 8/31/21 | | | 8/31/20 | | | 8/31/19 | |
| | $ | 10.55 | | | $ | 12.06 | | | $ | 11.66 | | | $ | 11.85 | | | $ | 11.33 | |
| | | | | | | | | | | | | | | | | | | | |
| | | | | | | | | | | | | | | | | | | | |
| | | 0.39 | | | | 0.34 | | | | 0.32 | | | | 0.36 | | | | 0.38 | |
| | | (0.34 | ) | | | (1.51 | ) | | | 0.45 | | | | (0.13 | ) | | | 0.52 | |
| | | 0.05 | | | | (1.17 | ) | | | 0.77 | | | | 0.23 | | | | 0.90 | |
| | | | | | | | | | | | | | | | | | | | |
| | | | | | | | | | | | | | | | | | | | |
| | | (0.38 | ) | | | (0.34 | ) | | | (0.32 | ) | | | (0.36 | ) | | | (0.38 | ) |
| | | — | | | | — | 2 | | | (0.05 | ) | | | (0.06 | ) | | | — | |
| | | (0.38 | ) | | | (0.34 | ) | | | (0.37 | ) | | | (0.42 | ) | | | (0.38 | ) |
| | | | | | | | | | | | | | | | | | | | |
| | $ | 10.22 | | | $ | 10.55 | | | $ | 12.06 | | | $ | 11.66 | | | $ | 11.85 | |
| | | | | | | | | | | | | | | | | | | | |
| | | 0.54 | % | | | (9.82 | )% | | | 6.73 | % | | | 2.03 | % | | | 8.17 | % |
| | | | | | | | | | | | | | | | | | | | |
| | | | | | | | | | | | | | | | | | | | |
| | $ | 67,698 | | | $ | 64,447 | | | $ | 50,997 | | | $ | 38,394 | | | $ | 39,363 | |
| | | 0.55 | % | | | 0.55 | % | | | 0.58 | % | | | 0.55 | % | | | 0.55 | % |
| | | 0.73 | % | | | 0.72 | % | | | 0.76 | % | | | 0.80 | % | | | 0.82 | % |
| | | 3.81 | % | | | 3.03 | % | | | 2.72 | % | | | 3.11 | % | | | 3.37 | % |
| | | 3.63 | % | | | 2.86 | % | | | 2.54 | % | | | 2.86 | % | | | 3.10 | % |
| | | 24 | % | | | 30 | % | | | 13 | % | | | 31 | % | | | 21 | % |
Financial highlights
Delaware Tax-Free Pennsylvania Fund Class A
Selected data for each share of the Fund outstanding throughout each period were as follows:
| |
| Net asset value, beginning of period |
| |
| Income (loss) from investment operations: |
| Net investment income1 |
| Net realized and unrealized gain (loss) |
| Total from investment operations |
| |
| Less dividends and distributions from: |
| Net investment income |
| Net realized gain |
| Total dividends and distributions |
| |
| Net asset value, end of period |
| |
| Total return2 |
| |
| Ratios and supplemental data: |
| Net assets, end of period (000 omitted) |
| Ratio of expenses to average net assets |
| Ratio of expenses to average net assets prior to fees waived |
| Ratio of net investment income to average net assets |
| Ratio of net investment income to average net assets prior to fees waived |
| Portfolio turnover |
| 1 | Calculated using average shares outstanding. |
| 2 | Total return is based on the change in net asset value of a share during the period and assumes reinvestment of dividends and distributions at net asset value and does not reflect the impact of a sales charge. Total return during the period reflects waivers by the manager and/or distributor. Performance would have been lower had the waivers not been in effect. |
See accompanying notes, which are an integral part of the financial statements.
| | Year ended | |
| | 8/31/23 | | | 8/31/22 | | | 8/31/21 | | | 8/31/20 | | | 8/31/19 | |
| | $ | 7.31 | | | $ | 8.34 | | | $ | 8.06 | | | $ | 8.25 | | | $ | 7.93 | |
| | | | | | | | | | | | | | | | | | | | |
| | | | | | | | | | | | | | | | | | | | |
| | | 0.27 | | | | 0.22 | | | | 0.23 | | | | 0.25 | | | | 0.28 | |
| | | (0.25 | ) | | | (1.00 | ) | | | 0.32 | | | | (0.11 | ) | | | 0.32 | |
| | | 0.02 | | | | (0.78 | ) | | | 0.55 | | | | 0.14 | | | | 0.60 | |
| | | | | | | | | | | | | | | | | | | | |
| | | | | | | | | | | | | | | | | | | | |
| | | (0.27 | ) | | | (0.22 | ) | | | (0.23 | ) | | | (0.25 | ) | | | (0.28 | ) |
| | | — | | | | (0.03 | ) | | | (0.04 | ) | | | (0.08 | ) | | | — | |
| | | (0.27 | ) | | | (0.25 | ) | | | (0.27 | ) | | | (0.33 | ) | | | (0.28 | ) |
| | | | | | | | | | | | | | | | | | | | |
| | $ | 7.06 | | | $ | 7.31 | | | $ | 8.34 | | | $ | 8.06 | | | $ | 8.25 | |
| | | | | | | | | | | | | | | | | | | | |
| | | 0.29 | % | | | (9.59 | )% | | | 7.04 | % | | | 1.72 | % | | | 7.72 | % |
| | | | | | | | | | | | | | | | | | | | |
| | | | | | | | | | | | | | | | | | | | |
| | $ | 307,781 | | | $ | 338,811 | | | $ | 384,915 | | | $ | 364,480 | | | $ | 376,965 | |
| | | 0.84 | % | | | 0.84 | % | | | 0.83 | % | | | 0.83 | % | | | 0.85 | % |
| | | 0.95 | % | | | 0.94 | % | | | 0.92 | % | | | 0.92 | % | | | 0.93 | % |
| | | 3.75 | % | | | 2.75 | % | | | 2.86 | % | | | 3.09 | % | | | 3.49 | % |
| | | 3.64 | % | | | 2.65 | % | | | 2.77 | % | | | 3.00 | % | | | 3.41 | % |
| | | 35 | % | | | 47 | % | | | 32 | % | | | 40 | % | | | 23 | % |
Financial highlights
Delaware Tax-Free Pennsylvania Fund Class C
Selected data for each share of the Fund outstanding throughout each period were as follows:
| |
| Net asset value, beginning of period |
| |
| Income (loss) from investment operations: |
| Net investment income1 |
| Net realized and unrealized gain (loss) |
| Total from investment operations |
| |
| Less dividends and distributions from: |
| Net investment income |
| Net realized gain |
| Total dividends and distributions |
| |
| Net asset value, end of period |
| |
| Total return2 |
| |
| Ratios and supplemental data: |
| Net assets, end of period (000 omitted) |
| Ratio of expenses to average net assets |
| Ratio of expenses to average net assets prior to fees waived |
| Ratio of net investment income to average net assets |
| Ratio of net investment income to average net assets prior to fees waived |
| Portfolio turnover |
| 1 | Calculated using average shares outstanding. |
| 2 | Total return is based on the change in net asset value of a share during the period and assumes reinvestment of dividends and distributions at net asset value and does not reflect the impact of a sales charge. Total return during the period reflects waivers by the manager and/or distributor. Performance would have been lower had the waivers not been in effect. |
See accompanying notes, which are an integral part of the financial statements.
| | Year ended | |
| | 8/31/23 | | | 8/31/22 | | | 8/31/21 | | | 8/31/20 | | | 8/31/19 | |
| | $ | 7.31 | | | $ | 8.34 | | | $ | 8.06 | | | $ | 8.25 | | | $ | 7.93 | |
| | | | | | | | | | | | | | | | | | | | |
| | | | | | | | | | | | | | | | | | | | |
| | | 0.21 | | | | 0.16 | | | | 0.17 | | | | 0.19 | | | | 0.22 | |
| | | (0.24 | ) | | | (1.00 | ) | | | 0.32 | | | | (0.11 | ) | | | 0.32 | |
| | | (0.03 | ) | | | (0.84 | ) | | | 0.49 | | | | 0.08 | | | | 0.54 | |
| | | | | | | | | | | | | | | | | | | | |
| | | | | | | | | | | | | | | | | | | | |
| | | (0.21 | ) | | | (0.16 | ) | | | (0.17 | ) | | | (0.19 | ) | | | (0.22 | ) |
| | | — | | | | (0.03 | ) | | | (0.04 | ) | | | (0.08 | ) | | | — | |
| | | (0.21 | ) | | | (0.19 | ) | | | (0.21 | ) | | | (0.27 | ) | | | (0.22 | ) |
| | | | | | | | | | | | | | | | | | | | |
| | $ | 7.07 | | | $ | 7.31 | | | $ | 8.34 | | | $ | 8.06 | | | $ | 8.25 | |
| | | | | | | | | | | | | | | | | | | | |
| | | (0.33 | )% | | | (10.27 | )% | | | 6.24 | % | | | 0.95 | % | | | 6.91 | % |
| | | | | | | | | | | | | | | | | | | | |
| | | | | | | | | | | | | | | | | | | | |
| | $ | 8,854 | | | $ | 10,540 | | | $ | 14,040 | | | $ | 19,009 | | | $ | 25,065 | |
| | | 1.59 | % | | | 1.59 | % | | | 1.59 | % | | | 1.59 | % | | | 1.61 | % |
| | | 1.70 | % | | | 1.69 | % | | | 1.68 | % | | | 1.68 | % | | | 1.69 | % |
| | | 3.00 | % | | | 1.99 | % | | | 2.10 | % | | | 2.33 | % | | | 2.73 | % |
| | | 2.89 | % | | | 1.89 | % | | | 2.01 | % | | | 2.24 | % | | | 2.65 | % |
| | | 35 | % | | | 47 | % | | | 32 | % | | | 40 | % | | | 23 | % |
Financial highlights
Delaware Tax-Free Pennsylvania Fund Institutional Class
Selected data for each share of the Fund outstanding throughout each period were as follows:
| |
| Net asset value, beginning of period |
| |
| Income (loss) from investment operations: |
| Net investment income1 |
| Net realized and unrealized gain (loss) |
| Total from investment operations |
| |
| Less dividends and distributions from: |
| Net investment income |
| Net realized gain |
| Total dividends and distributions |
| |
| Net asset value, end of period |
| |
| Total return2 |
| |
| Ratios and supplemental data: |
| Net assets, end of period (000 omitted) |
| Ratio of expenses to average net assets |
| Ratio of expenses to average net assets prior to fees waived |
| Ratio of net investment income to average net assets |
| Ratio of net investment income to average net assets prior to fees waived |
| Portfolio turnover |
| 1 | Calculated using average shares outstanding. |
| 2 | Total return is based on the change in net asset value of a share during the period and assumes reinvestment of dividends and distributions at net asset value. Total return during the period reflects waivers by the manager. Performance would have been lower had the waivers not been in effect. |
See accompanying notes, which are an integral part of the financial statements.
| | Year ended | |
| | 8/31/23 | | | 8/31/22 | | | 8/31/21 | | | 8/31/20 | | | 8/31/19 | |
| | $ | 7.31 | | | $ | 8.33 | | | $ | 8.05 | | | $ | 8.25 | | | $ | 7.92 | |
| | | | | | | | | | | | | | | | | | | | |
| | | | | | | | | | | | | | | | | | | | |
| | | 0.29 | | | | 0.24 | | | | 0.25 | | | | 0.27 | | | | 0.30 | |
| | | (0.25 | ) | | | (0.99 | ) | | | 0.32 | | | | (0.12 | ) | | | 0.33 | |
| | | 0.04 | | | | (0.75 | ) | | | 0.57 | | | | 0.15 | | | | 0.63 | |
| | | | | | | | | | | | | | | | | | | | |
| | | | | | | | | | | | | | | | | | | | |
| | | (0.29 | ) | | | (0.24 | ) | | | (0.25 | ) | | | (0.27 | ) | | | (0.30 | ) |
| | | — | | | | (0.03 | ) | | | (0.04 | ) | | | (0.08 | ) | | | — | |
| | | (0.29 | ) | | | (0.27 | ) | | | (0.29 | ) | | | (0.35 | ) | | | (0.30 | ) |
| | | | | | | | | | | | | | | | | | | | |
| | $ | 7.06 | | | $ | 7.31 | | | $ | 8.33 | | | $ | 8.05 | | | $ | 8.25 | |
| | | | | | | | | | | | | | | | | | | | |
| | | 0.53 | % | | | (9.26 | )% | | | 7.31 | % | | | 1.84 | % | | | 8.12 | % |
| | | | | | | | | | | | | | | | | | | | |
| | | | | | | | | | | | | | | | | | | | |
| | $ | 63,482 | | | $ | 72,330 | | | $ | 72,333 | | | $ | 55,919 | | | $ | 47,241 | |
| | | 0.59 | % | | | 0.59 | % | | | 0.59 | % | | | 0.59 | % | | | 0.61 | % |
| | | 0.70 | % | | | 0.69 | % | | | 0.68 | % | | | 0.68 | % | | | 0.69 | % |
| | | 4.00 | % | | | 2.99 | % | | | 3.10 | % | | | 3.33 | % | | | 3.73 | % |
| | | 3.89 | % | | | 2.89 | % | | | 3.01 | % | | | 3.24 | % | | | 3.65 | % |
| | | 35 | % | | | 47 | % | | | 32 | % | | | 40 | % | | | 23 | % |
| Notes to financial statements | |
| Delaware Funds by Macquarie® state tax-free funds | August 31, 2023 |
Voyageur Insured Funds is organized as a Delaware statutory trust and offers one series: Delaware Tax-Free Arizona Fund. Voyageur Mutual Funds is organized as a Delaware statutory trust and offers five series: Delaware Minnesota High-Yield Municipal Bond Fund, Delaware National High-Yield Municipal Bond Fund, Delaware Tax-Free California Fund, Delaware Tax-Free Idaho Fund, and Delaware Tax-Free New York Fund. Voyageur Mutual Funds II is organized as a Delaware statutory trust and offers one series: Delaware Tax-Free Colorado Fund. Delaware Group® State Tax-Free Income Trust is organized as a Delaware statutory trust and offers one series: Delaware Tax-Free Pennsylvania Fund. Voyageur Insured Funds, Voyageur Mutual Funds, Voyageur Mutual Funds II, and Delaware Group State Tax-Free Income Trust are each referred to as a Trust, or collectively as the Trusts. These financial statements and the related notes pertain to Delaware Tax-Free Arizona Fund, Delaware Tax-Free California Fund, Delaware Tax-Free Colorado Fund, Delaware Tax-Free Idaho Fund, Delaware Tax-Free New York Fund, and Delaware Tax-Free Pennsylvania Fund (each a Fund or collectively, the Funds). Each Trust is an open-end investment company. Each Fund is considered diversified under the Investment Company Act of 1940, as amended (1940 Act), and offers Class A, Class C, and Institutional Class shares. Class A shares are sold with a maximum front-end sales charge of 4.50%. There is no front-end sales charge when you purchase $250,000 or more of Class A shares. However, if Delaware Distributors, L.P. (DDLP) paid your financial intermediary a commission on your purchase of $1 million or more of Class A shares, for shares of Delaware Tax-Free Arizona Fund, Delaware Tax-Free Colorado Fund, Delaware Tax-Free Idaho Fund, or Delaware Tax-Free Pennsylvania Fund prior to December 2, 2019, or for shares of Delaware Tax-Free California Fund or Delaware Tax-Free New York Fund prior to July 1, 2020, you will have to pay a limited contingent deferred sales charge (Limited CDSC) of 1.00% if you redeem these shares within the first year after your purchase and 0.50% if you redeem these shares within the second year. If DDLP paid your financial intermediary a commission on your purchase of $250,000 or more of Class A shares, for shares of Delaware Tax-Free Arizona Fund, Delaware Tax-Free California Fund, Delaware Tax-Free Colorado Fund, Delaware Tax-Free Idaho Fund, Delaware Tax-Free New York Fund or Delaware Tax-Free Pennsylvania Fund you will have to pay a Limited CDSC of 1.00% if you redeem these shares within the first 18 months after your purchase, unless a specific waiver of the Limited CDSC applies. Class C shares have no upfront sales charge, but are sold with a contingent deferred sales charge (CDSC) of 1.00%, which will be incurred if redeemed during the first 12 months. Institutional Class shares are not subject to a sales charge and are offered for sale exclusively to certain eligible investors.
1. Significant Accounting Policies
Each Fund follows accounting and reporting guidance under Financial Accounting Standards Board (FASB) Accounting Standards Codification Topic 946, Financial Services — Investment Companies. The following accounting policies are in accordance with US generally accepted accounting principles (US GAAP) and are consistently followed by the Funds.
Security Valuation — Fixed income securities are generally priced based upon valuations provided by an independent pricing service or broker in accordance with methodologies included
within Delaware Management Company (DMC)’s Pricing Policy (the Policy). Fixed income security valuations are then reviewed by DMC as part of its duties as the Fund’s valuation designee and, to the extent required by the Policy and applicable regulation, fair valued consistent with the Policy. To the extent current market prices are not available, the pricing service may take into account developments related to the specific security, as well as transactions in comparable securities. Valuations for fixed income securities utilize matrix systems, which reflect such factors as security prices, yields, maturities, and ratings, and are supplemented by dealer and exchange quotations. Open-end investment companies, other than exchange-traded funds (ETFs), are valued at their published net asset value (NAV). Generally, other securities and assets for which market quotations are not readily available are valued at fair value as determined in good faith by DMC. Subject to the oversight of each Trust’s Board of Trustees (each, a Board, or collectively, the Boards), DMC, as valuation designee, has adopted policies and procedures to fair value securities for which market quotations are not readily available consistent with the requirements of Rule 2a-5 under the 1940 Act. In determining whether market quotations are readily available or fair valuation will be used, various factors will be taken into consideration, such as market closures or suspension of trading in a security. Restricted securities and private placements are valued at fair value.
Federal Income Taxes — No provision for federal income taxes has been made as each Fund intends to continue to qualify for federal income tax purposes as a regulated investment company under Subchapter M of the Internal Revenue Code of 1986, as amended, and make the requisite distributions to shareholders. Each Fund evaluates tax positions taken or expected to be taken in the course of preparing each Fund’s tax returns to determine whether the tax positions are “more-likely-than-not” of being sustained by the applicable tax authority. Tax positions not deemed to meet the “more-likely-than-not” threshold are recorded as a tax benefit or expense in the current year. Management has analyzed each Fund’s tax positions taken or expected to be taken on each Fund’s federal income tax returns through the year ended August 31, 2023, and for all open tax years (years ended August 31, 2020–August 31, 2022), and has concluded that no provision for federal income tax is required in each Fund’s financial statements. If applicable, each Fund recognizes interest accrued on unrecognized tax benefits in interest expense and penalties in “Other” on the “Statements of operations.” During the year ended August 31, 2023, the Funds did not incur any interest or tax penalties.
Class Accounting — Investment income and common expenses are allocated to the various classes of each Fund on the basis of “settled shares” of each class in relation to the net assets of each Fund. Realized and unrealized gain (loss) on investments are allocated to the various classes of each Fund on the basis of daily net assets of each class. Distribution expenses relating to a specific class are charged directly to that class.
Use of Estimates — The preparation of financial statements in conformity with US GAAP requires management to make estimates and assumptions that affect the fair value of investments, the reported amounts of assets and liabilities and disclosure of contingent assets and liabilities at the date of the financial statements, and the reported amounts of revenues and
Notes to financial statements
Delaware Funds by Macquarie® state tax-free funds
1. Significant Accounting Policies (continued)
expenses during the reporting period. Actual results could differ from those estimates and the differences could be material.
Other — Expenses directly attributable to a Fund are charged directly to that Fund. Other expenses common to various funds within the Delaware Funds by Macquarie® (Delaware Funds) are generally allocated among such funds on the basis of average net assets. Management fees and certain other expenses are paid monthly. Security transactions are recorded on the date the securities are purchased or sold (trade date) for financial reporting purposes. Costs used in calculating realized gains and losses on the sale of investment securities are those of the specific securities sold. Interest income is recorded on an accrual basis. Income and capital gain distributions from any investment companies (Underlying Funds) in which the Fund invests are recorded on the ex-dividend date. Discounts and premiums on debt securities are accreted or amortized to interest income, respectively, over the lives of the respective securities using the effective interest method. Premiums on callable debt securities are amortized to interest income to the earliest call date using the effective interest method. Each Fund declares dividends daily from net investment income and pays the dividends monthly and declares and pays distributions from net realized gain on investments, if any, at least annually. Each Fund may distribute more frequently, if necessary for tax purposes. Dividends and distributions, if any, are recorded on the ex-dividend date.
Each Fund receives earnings credits from its transfer agent when positive cash balances are maintained, which may be used to offset transfer agent fees. If the amount earned is greater than $1, the expenses paid under this arrangement are included on the “Statements of operations” under “Dividend disbursing and transfer agent fees and expenses” with the corresponding expenses offset included under “Less expenses paid indirectly.”
2. Investment Management, Administration Agreements, and Other Transactions with Affiliates
In accordance with the terms of its respective investment management agreement, each Fund pays DMC, a series of Macquarie Investment Management Business Trust and the investment managers, an annual fee which is calculated daily and paid monthly based on each Fund’s average daily net assets as follows:
| | | Delaware | | | Delaware | | | Delaware | | | | | | Delaware | | | Delaware | |
| | | Tax-Free | | | Tax-Free | | | Tax-Free | | | Delaware | | | Tax-Free | | | Tax-Free | |
| | | Arizona | | | California | | | Colorado | | | Tax-Free | | | New York | | | Pennsylvania | |
| | | Fund | | | Fund | | | Fund | | | Idaho Fund | | | Fund | | | Fund | |
| On the first $500 million | | 0.5000% | | | 0.5500% | | | 0.5500% | | | 0.5500% | | | 0.5500% | | | 0.5500% | |
| On the next $500 million | | 0.4750% | | | 0.5000% | | | 0.5000% | | | 0.5000% | | | 0.5000% | | | 0.5000% | |
| On the next $1.5 billion | | 0.4500% | | | 0.4500% | | | 0.4500% | | | 0.4500% | | | 0.4500% | | | 0.4500% | |
| In excess of $2.5 billion | | 0.4250% | | | 0.4250% | | | 0.4250% | | | 0.4250% | | | 0.4250% | | | 0.4250% | |
DMC has contractually agreed to waive all or a portion of its management fee and/or pay/reimburse expenses (excluding any distribution and service (12b-1) fees, acquired fund fees and expenses, taxes, interest, inverse floater program expenses, short sale dividend and interest expenses, brokerage fees, certain insurance costs, and nonroutine expenses or costs, including, but not limited to, those relating to reorganizations, litigation, conducting shareholder meetings, and liquidations), in order to prevent total annual fund operating expenses from exceeding the following percentages of each Fund’s average daily net assets from September 1, 2022 (except as noted) through December 29, 2023. These waivers and reimbursements may only be terminated by agreement of DMC and the Funds. The waivers and reimbursements are accrued daily and received monthly.
| | | Operating expense | |
| | | limitation as | |
| | | a percentage | |
| | | of average | |
| Fund | | daily net assets | |
| Delaware Tax-Free Arizona Fund | | 0.59% | |
| Delaware Tax-Free California Fund | | 0.55%* | |
| Delaware Tax-Free Colorado Fund | | 0.57% | |
| Delaware Tax-Free Idaho Fund | | 0.61% | |
| Delaware Tax-Free New York Fund | | 0.55% | |
| Delaware Tax-Free Pennsylvania Fund | | 0.59% | |
*Effective December 29, 2022. For the period September 1, 2022 through December 28, 2022, the expense limitation for Delaware Tax-Free California Fund was 0.57%.
After consideration of class specific expenses, including 12b-1 fees, the class level operating expense limitation as a percentage of average daily net assets for the period September 1, 2022 (except as noted) through December 29, 2023 is as follows:
| | | Operating expense limitation as a percentage of average daily net assets |
| Fund | | Class A | | Class C | | Institutional Class |
| Delaware Tax-Free Arizona Fund | | 0.84 | % | | 1.59 | % | | 0.59 | % |
| Delaware Tax-Free California Fund | | 0.80 | %** | | 1.55 | %** | | 0.55 | %** |
| Delaware Tax-Free Colorado Fund | | 0.82 | % | | 1.57 | % | | 0.57 | % |
| Delaware Tax-Free Idaho Fund | | 0.86 | % | | 1.61 | % | | 0.61 | % |
| Delaware Tax-Free New York Fund | | 0.80 | % | | 1.55 | % | | 0.55 | % |
| Delaware Tax-Free Pennsylvania Fund | | 0.84 | % | | 1.59 | % | | 0.59 | % |
Notes to financial statements
Delaware Funds by Macquarie® state tax-free funds
2. Investment Management, Administration Agreements, and Other Transactions with Affiliates (continued)
**Effective December 29, 2022. For the period September 1, 2022 through December 28, 2022, the expense limitation were as follows for Class A, Class C and Institutional Class, respectively: 0.82%, 1.57% and 0.57%.
Delaware Investments Fund Services Company (DIFSC), an affiliate of DMC, provides fund accounting and financial administrative oversight services to each Fund. For these services, DIFSC’s fees are calculated daily and paid monthly, based on the aggregate daily net assets of all funds within the Delaware Funds at the following annual rates: 0.00475% of the first $35 billion; 0.0040% of the next $10 billion; 0.0025% of the next $45 billion; and 0.0015% of aggregate average daily net assets in excess of $90 billion (Total Fee). Each fund in the Delaware Funds pays a minimum of $4,000, which, in aggregate, is subtracted from the Total Fee. Each fund then pays its portion of the remainder of the Total Fee on a relative NAV basis. These amounts are included on the “Statements of operations” under “Accounting and administration expenses.” For the year ended August 31, 2023, each Fund paid for these services as follows:
| Fund | | Fees | |
| Delaware Tax-Free Arizona Fund | | $ | 5,938 | |
| Delaware Tax-Free California Fund | | | 9,231 | |
| Delaware Tax-Free Colorado Fund | | | 10,388 | |
| Delaware Tax-Free Idaho Fund | | | 7,503 | |
| Delaware Tax-Free New York Fund | | | 9,675 | |
| Delaware Tax-Free Pennsylvania Fund | | | 15,571 | |
DIFSC is also the transfer agent and dividend disbursing agent of each Fund. For these services, DIFSC’s fees are calculated daily and paid monthly, based on the aggregate daily net assets of the retail funds within the Delaware Funds at the following annual rates: 0.014% of the first $20 billion; 0.011% of the next $5 billion; 0.007% of the next $5 billion; 0.004% of the next $20 billion; 0.002% of the next $25 billion; and 0.0015% of average daily net assets in excess of $75 billion. The fees payable to DIFSC under the shareholder services agreement described above are allocated among all retail funds in the Delaware Funds on a relative NAV basis. These amounts are included on the “Statements of operations” under “Dividend disbursing and transfer agent fees and expenses.” For the year ended August 31, 2023, each Fund paid for these services as follows:
| Fund | | Fees | |
| Delaware Tax-Free Arizona Fund | | $ | 4,149 | |
| Delaware Tax-Free California Fund | | | 11,195 | |
| Delaware Tax-Free Colorado Fund | | | 13,675 | |
| Delaware Tax-Free Idaho Fund | | | 7,497 | |
| Delaware Tax-Free New York Fund | | | 12,147 | |
| Fund | | Fees | |
| Delaware Tax-Free Pennsylvania Fund | | $ | 24,771 | |
Pursuant to a sub-transfer agency agreement between DIFSC and BNY Mellon Investment Servicing (US) Inc. (BNYMIS), BNYMIS provides certain sub-transfer agency services to the Funds. Sub-transfer agency fees are paid by each Fund and are also included on the “Statements of operations” under “Dividend disbursing and transfer agent fees and expenses.” The fees that are calculated daily and paid as invoices are received on a monthly or quarterly basis.
Pursuant to a distribution agreement and distribution plan, each Fund pays DDLP, the distributor and an affiliate of DMC, an annual 12b-1 fee of 0.25% of the average daily net assets of the Class A shares (except for Delaware Tax-Free Pennsylvania Fund). The Board for Delaware Tax-Free Pennsylvania Fund has adopted a formula for calculating 12b-1 fees for the Fund’s Class A shares that went into effect on June 1, 1992. The Fund’s Class A shares are currently subject to a blended 12b-1 fee equal to the sum of: (i) 0.10% of average daily net assets representing shares acquired prior to June 1, 1992, and (ii) 0.25% of average daily net assets representing shares acquired on or after June 1, 1992. All of the Fund’s Class A shareholders bear 12b-1 fees at the same blended rate, currently 0.25% of average daily net assets, based on the formula described above. This method of calculating Class A 12b-1 fees may be discontinued at the sole discretion of the Board. Each Fund pays 1.00% of the average daily net assets of the Class C shares. The fees are calculated daily and paid monthly. Institutional Class shares do not pay 12b-1 fee.
As provided in the investment management agreement, each Fund bears a portion of the cost of certain resources shared with DMC, including the cost of internal personnel of DMC and/or its affiliates that provide legal and regulatory reporting services to the Funds. These amounts are included on the “Statements of operations” under “Legal fees.” For the year ended August 31, 2023, each Fund paid for internal legal and regulatory reporting services provided by DMC and/or its affiliates’ employees as follows:
| Fund | | Fees | |
| Delaware Tax-Free Arizona Fund | | $ | 1,911 | |
| Delaware Tax-Free California Fund | | | 5,586 | |
| Delaware Tax-Free Colorado Fund | | | 6,568 | |
| Delaware Tax-Free Idaho Fund | | | 6,291 | |
| Delaware Tax-Free New York Fund | | | 6,085 | |
| Delaware Tax-Free Pennsylvania Fund | | | 11,371 | |
For the year ended August 31, 2023, DDLP earned commissions on sales of Class A shares for each Fund as follows:
| Fund | | Class A | |
| Delaware Tax-Free Arizona Fund | | $ | 320 | |
| Delaware Tax-Free California Fund | | | 2,738 | |
Notes to financial statements
Delaware Funds by Macquarie® state tax-free funds
2. Investment Management, Administration Agreements, and Other Transactions with Affiliates (continued)
| Fund | | Class A | |
| Delaware Tax-Free Colorado Fund | | $ | 2,943 | |
| Delaware Tax-Free Idaho Fund | | | 4,663 | |
| Delaware Tax-Free New York Fund | | | 4,632 | |
| Delaware Tax-Free Pennsylvania Fund | | | 5,825 | |
For the year ended August 31, 2023, DDLP received gross CDSC commissions on redemptions of each Fund’s Class A and Class C shares, and these commissions were entirely used to offset upfront commissions previously paid by DDLP to broker/dealers on sales of those shares. The amounts received were as follows:
| Fund | | Class A | | | Class C | |
| Delaware Tax-Free Arizona Fund | | $ | 3,848 | | | $ | — | |
| Delaware Tax-Free California Fund | | | 1,132 | | | | 323 | |
| Delaware Tax-Free Colorado Fund | | | 21,766 | | | | 415 | |
| Delaware Tax-Free Idaho Fund | | | 3,593 | | | | 539 | |
| Delaware Tax-Free New York Fund | | | 2,143 | | | | 340 | |
| Delaware Tax-Free Pennsylvania Fund | | | 10,346 | | | | 225 | |
Trustees’ fees include expenses accrued by each Fund for each Trustee’s retainer and meeting fees. Certain officers of DMC, DIFSC, and DDLP are officers and/or Trustees of the Trust. These officers and Trustees are paid no compensation by the Funds.
Cross trades for the year ended August 31, 2023, were executed by the Funds pursuant to procedures adopted by the Boards designed to ensure compliance with Rule 17a-7 under the 1940 Act. Cross trading is the buying or selling of portfolio securities between funds of investment companies, or between a fund of an investment company and another entity, that are or could be considered affiliates by virtue of having a common investment advisor (or affiliated investment advisors), common directors/trustees and/or common officers. At their regularly scheduled meetings, the Boards review a report related to the Funds’ compliance with the procedures adopted by the Boards. Pursuant to these procedures, for the year ended August 31, 2023, the following Funds engaged in Rule 17a-7 securities purchases and securities sales, which resulted in net gains or losses as follows:
| | | Purchases | | | Sales | | | Net realized gain (loss) | |
| Delaware Tax-Free Arizona Fund | | $ | 1,000,000 | | | $ | — | | | $ | — | |
| Delaware Tax-Free California Fund | | | 1,000,022 | | | | 2,300,266 | | | | — | |
| Delaware Tax-Free Colorado Fund | | | 100,003 | | | | — | | | | — | |
| Delaware Tax-Free New York Fund | | | — | | | | 850,107 | | | | — | |
Delaware Tax-Free Idaho Fund and Delaware Tax-Free Pennsylvania Fund did not engage in Rule 17a-7 securities purchases and/or securities sales for the year ended August 31, 2023.
In addition to the management fees and other expenses of a Fund, a Fund indirectly bears the investment management fees and other expenses of any Underlying Funds, including ETFs in which it invests. The amount of these fees and expenses incurred indirectly by a Fund will vary based upon the expense and fee levels of any Underlying Funds and the number of shares that are owned of any Underlying Funds at different times.
3. Investments
For the year ended August 31, 2023, each Fund made purchases and sales of investment securities other than short-term investments and US government securities as follows:
| Fund | | Purchases | | | Sales | |
| Delaware Tax-Free Arizona Fund | | $ | 14,113,779 | | | $ | 27,129,063 | |
| Delaware Tax-Free California Fund | | | 98,467,252 | | | | 36,900,296 | |
| Delaware Tax-Free Colorado Fund | | | 72,068,498 | | | | 77,424,877 | |
| Delaware Tax-Free Idaho Fund | | | 35,979,334 | | | | 28,906,521 | |
| Delaware Tax-Free New York Fund | | | 53,838,114 | | | | 45,460,515 | |
| Delaware Tax-Free Pennsylvania Fund | | | 134,214,466 | | | | 165,314,483 | |
Notes to financial statements
Delaware Funds by Macquarie® state tax-free funds
3. Investments (continued)
The tax cost of investments includes adjustments to net unrealized appreciation (depreciation) which may not necessarily be the final tax cost basis adjustments but which approximate the tax basis unrealized gains and losses that may be realized and distributed to shareholders. At August 31, 2023, the cost and unrealized appreciation (depreciation) of investments for federal income tax purposes for each Fund were as follows:
| | | | | | Aggregate | | | Aggregate | | | Net unrealized | |
| | | | | | unrealized | | | unrealized | | | appreciation | |
| | | Cost of | | | appreciation | | | depreciation | | | (depreciation) | |
| Fund | | investments | | | of investments | | | of investments | | | of investments | |
| Delaware Tax-Free Arizona Fund | | $ | 65,912,022 | | | $ | 282,204 | | | $ | (7,332,751 | ) | | $ | (7,050,547 | ) |
| Delaware Tax-Free California Fund | | | 213,864,204 | | | | 1,581,893 | | | | (12,466,334 | ) | | | (10,884,441 | ) |
| Delaware Tax-Free Colorado Fund | | | 226,542,790 | | | | 1,789,138 | | | | (16,937,909 | ) | | | (15,148,771 | ) |
| Delaware Tax-Free Idaho Fund | | | 129,492,165 | | | | 808,947 | | | | (11,057,907 | ) | | | (10,248,960 | ) |
| Delaware Tax-Free New York Fund | | | 208,512,729 | | | | 2,371,771 | | | | (12,805,313 | ) | | | (10,433,542 | ) |
| Delaware Tax-Free Pennsylvania Fund | | | 392,833,927 | | | | 4,278,476 | | | | (20,745,264 | ) | | | (16,466,788 | ) |
US GAAP defines fair value as the price that each Fund would receive to sell an asset or pay to transfer a liability in an orderly transaction between market participants at the measurement date under current market conditions. A three-level hierarchy for fair value measurements has been established based upon the transparency of inputs to the valuation of an asset or liability. Inputs may be observable or unobservable and refer broadly to the assumptions that market participants would use in pricing the asset or liability. Observable inputs reflect the assumptions market participants would use in pricing the asset or liability based on market data obtained from sources independent of the reporting entity. Unobservable inputs reflect the reporting entity’s own assumptions about the assumptions that market participants would use in pricing the asset or liability based on the best information available under the circumstances. Each Fund’s
investment in its entirety is assigned a level based upon the observability of the inputs which are significant to the overall valuation. The three-level hierarchy of inputs is summarized as follows:
| Level 1 — | Inputs are quoted prices in active markets for identical investments. (Examples: equity securities, open-end investment companies, futures contracts, and exchange-traded options contracts) |
| Level 2 — | Other observable inputs, including, but not limited to: quoted prices for similar assets or liabilities in markets that are active, quoted prices for identical or similar assets or liabilities in markets that are not active, inputs other than quoted prices that are observable for the assets or liabilities (such as interest rates, yield curves, volatilities, prepayment speeds, loss severities, credit risks, and default rates) or other market-corroborated inputs. (Examples: debt securities, government securities, swap contracts, foreign currency exchange contracts, foreign securities utilizing international fair value pricing, broker-quoted securities, and fair valued securities) |
| Level 3 — | Significant unobservable inputs, including each Fund’s own assumptions used to determine the fair value of investments. (Examples: broker-quoted securities and fair valued securities) |
Level 3 investments are valued using significant unobservable inputs. Each Fund may also use an income-based valuation approach in which the anticipated future cash flows of the investment are discounted to calculate fair value. Discounts may also be applied due to the nature or duration of any restrictions on the disposition of the investments. Valuations may also be based upon current market prices of securities that are comparable in coupon, rating, maturity, and industry. The derived value of a Level 3 investment may not represent the value which is received upon disposition and this could impact the results of operations.
The following tables summarize the valuation of each Fund’s investments by fair value hierarchy levels as of August 31, 2023:
| | | Delaware Tax-Free Arizona Fund | |
| | | Level 2 | |
| Securities | | | | |
| Assets: | | | | |
| Municipal Bonds | | $ | 58,461,475 | |
| Short-Term Investments | | | 400,000 | |
| Total Value of Securities | | $ | 58,861,475 | |
Notes to financial statements
Delaware Funds by Macquarie® state tax-free funds
3. Investments (continued)
| | | Delaware Tax-Free California Fund | |
| | | Level 2 | |
| Securities | | | | |
| Assets: | | | | |
| Municipal Bonds | | $ | 200,229,763 | |
| Short-Term Investments | | | 2,750,000 | |
| Total Value of Securities | | $ | 202,979,763 | |
| | | Delaware Tax-Free Colorado Fund | |
| | | Level 1 | | | Level 2 | | | Total | |
| Securities | | | | | | | | | | | | |
| Assets: | | | | | | | | | | | | |
| Municipal Bonds | | $ | — | | | $ | 209,643,371 | | | $ | 209,643,371 | |
| Short-Term Investments | | | 375,648 | | | | 1,375,000 | | | | 1,750,648 | |
| Total Value of Securities | | $ | 375,648 | | | $ | 211,018,371 | | | $ | 211,394,019 | |
| | | Delaware Tax-Free Idaho Fund | |
| | | Level 1 | | | Level 2 | | | Total | |
| Securities | | | | | | | | | | | | |
| Assets: | | | | | | | | | | | | |
| Municipal Bonds | | $ | — | | | $ | 118,450,095 | | | $ | 118,450,095 | |
| Short-Term Investments | | | 793,110 | | | | — | | | | 793,110 | |
| Total Value of Securities | | $ | 793,110 | | | $ | 118,450,095 | | | $ | 119,243,205 | |
| | | Delaware Tax-Free New York Fund | |
| | | Level 2 | |
| Securities | | | | |
| Assets: | | | | |
| Municipal Bonds | | $ | 194,249,187 | |
| Short-Term Investments | | | 3,830,000 | |
| Total Value of Securities | | $ | 198,079,187 | |
| | | Delaware Tax-Free Pennsylvania Fund | |
| | | Level 2 | |
| Securities | | | | |
| Assets: | | | | |
| Municipal Bonds | | $ | 374,367,139 | |
| Short-Term Investments | | | 2,000,000 | |
| Total Value of Securities | | $ | 376,367,139 | |
During the year ended August 31, 2023, there were no transfers into or out of Level 3 investments. Each Fund’s policy is to recognize transfers into or out of Level 3 investments based on fair value at the beginning of the reporting year.
A reconciliation of Level 3 investments is presented when each Fund has a significant amount of Level 3 investments at the beginning or end of the year in relation to each Fund’s net assets. As of August 31, 2023, there were no Level 3 investments.
4. Dividend and Distribution Information
Income and long-term capital gain distributions are determined in accordance with federal income tax regulations, which may differ from US GAAP. Additionally, distributions from net short-term gains on sales of investment securities are treated as ordinary income for federal income tax purposes. The tax character of dividends and distributions paid during the years ended August 31, 2023 and 2022 were as follows:
| | | | | | | | | Long-term | | | | | | | |
| | | Tax-exempt | | | Ordinary | | | capital | | | Distributions in | | | | |
| | | income | | | income | | | gains | | | excess of income | | | Total | |
| Year ended August 31, 2023: | | | | | | | | | | | | | | | | | | | | |
| Delaware Tax-Free Arizona Fund | | $ | 2,159,007 | | | $ | 8,368 | | | $ | — | | | $ | — | | | $ | 2,167,375 | |
| Delaware Tax-Free California Fund | | | 6,497,314 | | | | 21,703 | | | | — | | | | — | | | | 6,519,017 | |
| Delaware Tax-Free Colorado Fund | | | 7,420,640 | | | | 12,625 | | | | — | | | | — | | | | 7,433,265 | |
| Delaware Tax-Free Idaho Fund | | | 3,861,880 | | | | 2,564 | | | | — | | | | — | | | | 3,864,444 | |
| Delaware Tax-Free New York Fund | | | 6,617,949 | | | | 162,310 | | | | — | | | | — | | | | 6,780,259 | |
| Delaware Tax-Free Pennsylvania Fund | | | 14,540,382 | | | | 284,228 | | | | — | | | | — | | | | 14,824,610 | |
Notes to financial statements
Delaware Funds by Macquarie® state tax-free funds
4. Dividend and Distribution Information (continued)
| | | | | | | | | Long-term | | | | | | | |
| | | Tax-exempt | | | Ordinary | | | capital | | | Distributions in | | | | |
| | | income | | | income | | | gains | | | excess of income | | | Total | |
| Year ended August 31, 2022: | | | | | | | | | | | | | | | | | | | | |
| Delaware Tax-Free Arizona Fund | | $ | 2,345,122 | | | $ | 107,751 | | | $ | 437,607 | | | $ | — | | | $ | 2,890,480 | |
| Delaware Tax-Free California Fund | | | 4,206,176 | | | | 15,908 | | | | 213,032 | | | | — | | | | 4,435,116 | |
| Delaware Tax-Free Colorado Fund | | | 6,829,954 | | | | 257 | | | | — | | | | — | | | | 6,830,211 | |
| Delaware Tax-Free Idaho Fund | | | 3,504,976 | | | | — | | | | — | | | | 3,211 | | | | 3,508,187 | |
| Delaware Tax-Free New York Fund | | | 5,691,604 | | | | 887 | | | | 53,570 | | | | — | | | | 5,746,061 | |
| Delaware Tax-Free Pennsylvania Fund | | | 12,165,258 | | | | 1,663,148 | | | | — | | | | 53,551 | | | | 13,881,957 | |
5. Components of Net Assets on a Tax Basis
As of August 31, 2023, the components of net assets on a tax basis were as follows:
| | | Delaware Tax-Free | | | Delaware Tax-Free | | | Delaware Tax-Free | |
| | | Arizona Fund | | | California Fund | | | Colorado Fund | |
| Shares of beneficial interest | | $ | 68,390,897 | | | $ | 216,982,528 | | | $ | 235,965,388 | |
| Undistributed tax-exempt income | | | 7,275 | | | | 88,132 | | | | 400,217 | |
| Distributions payable | | | (15,944 | ) | | | (56,965 | ) | | | (47,661 | ) |
| Capital loss carryforwards | | | (2,073,337 | ) | | | (2,697,693 | ) | | | (8,372,305 | ) |
| Unrealized appreciation (depreciation) of investments | | | (7,050,547 | ) | | | (10,884,441 | ) | | | (15,148,771 | ) |
| Net assets | | $ | 59,258,344 | | | $ | 203,431,561 | | | $ | 212,796,868 | |
| | | Delaware Tax-Free | | | Delaware Tax-Free | | | Delaware Tax-Free | |
| | | Idaho Fund | | | New York Fund | | | Pennsylvania Fund | |
| Shares of beneficial interest | | $ | 138,992,113 | | | $ | 214,213,000 | | | $ | 412,452,379 | |
| Undistributed tax-exempt income | | | 486 | | | | 359,804 | | | | 7,868 | |
| Distributions payable | | | (14,019 | ) | | | (92,778 | ) | | | (115,923 | ) |
| Capital loss carryforwards | | | (8,301,969 | ) | | | (2,800,323 | )* | | | (15,760,588 | ) |
| Unrealized appreciation (depreciation) of investments | | | (10,248,960 | ) | | | (10,433,542 | ) | | | (16,466,788 | ) |
| Net assets | | $ | 120,427,651 | | | $ | 201,246,161 | | | $ | 380,116,948 | |
* A portion of the Fund’s capital loss carryforward is subject to limitation under the Internal Revenue Code and related regulations.
The differences between book basis and tax basis components of net assets are primarily attributable to tax treatment of market discount and premium on debt instruments and tax deferral of losses due to wash sales, as applicable.
For financial reporting purposes, capital accounts are adjusted to reflect the tax character of permanent book/tax differences. Results of operations and net assets were not affected by these reclassifications. For the year ended August 31, 2023, the Funds had no reclassifications.
For federal income tax purposes, capital loss carryforwards may be carried forward and applied against future capital gains. At August 31, 2023, each Fund has capital loss carryforwards available to offset future realized capital gains as follows:
| | | Loss carryforward character | | | | |
| | | Short-term | | | Long-term | | | Total | |
| Delaware Tax-Free Arizona Fund | | $ | 716,403 | | | $ | 1,356,934 | | | $ | 2,073,337 | |
| Delaware Tax-Free California Fund | | | 1,683,951 | | | | 1,013,742 | | | | 2,697,693 | |
| Delaware Tax-Free Colorado Fund | | | 5,164,789 | | | | 3,207,516 | | | | 8,372,305 | |
| Delaware Tax-Free Idaho Fund | | | 4,816,396 | | | | 3,485,573 | | | | 8,301,969 | |
| Delaware Tax-Free New York Fund | | | 1,445,209 | | | | 1,355,114 | | | | 2,800,323 | |
| Delaware Tax-Free Pennsylvania Fund | | | 7,316,673 | | | | 8,443,915 | | | | 15,760,588 | |
Notes to financial statements
Delaware Funds by Macquarie® state tax-free funds
6. Capital Shares
Transactions in capital shares were as follows:
| | | Delaware Tax-Free | | | Delaware Tax-Free | | | Delaware Tax-Free | |
| | | Arizona Fund | | | California Fund | | | Colorado Fund | |
| | | Year ended | | | Year ended | | | Year ended | |
| | | 8/31/23 | | | 8/31/22 | | | 8/31/23 | | | 8/31/22 | | | 8/31/23 | | | 8/31/22 | |
| Shares sold: | | | | | | | | | | | | | | | | | | | | | | | | |
| Class A | | | 355,524 | | | | 300,220 | | | | 1,148,802 | | | | 1,745,483 | | | | 708,020 | | | | 1,335,477 | |
| Class C | | | 19,939 | | | | 24,116 | | | | 34,458 | | | | 38,036 | | | | 26,393 | | | | 55,260 | |
| Institutional Class | | | 439,574 | | | | 1,007,938 | | | | 8,325,544 | | | | 6,229,536 | | | | 3,225,993 | | | | 4,468,748 | |
| | | | | | | | | | | | | | | | | | | | | | | | | |
| Shares issued upon reinvestment of dividends and distributions: |
| Class A | | | 146,699 | | | | 168,065 | | | | 207,624 | | | | 187,969 | | | | 408,205 | | | | 355,561 | |
| Class C | | | 2,342 | | | | 2,871 | | | | 5,457 | | | | 6,147 | | | | 9,701 | | | | 10,933 | |
| Institutional Class | | | 48,027 | | | | 64,976 | | | | 325,448 | | | | 130,790 | | | | 267,560 | | | | 209,604 | |
| | | | 1,012,105 | | | | 1,568,186 | | | | 10,047,333 | | | | 8,337,961 | | | | 4,645,872 | | | | 6,435,583 | |
| | | | | | | | | | | | | | | | | | | | | | | | | |
| Shares redeemed: | | | | | | | | | | | | | | | | | | | | | | | | |
| Class A | | | (1,301,114 | ) | | | (519,951 | ) | | | (1,387,649 | ) | | | (2,244,604 | ) | | | (2,142,669 | ) | | | (1,850,043 | ) |
| Class C | | | (44,564 | ) | | | (45,692 | ) | | | (78,456 | ) | | | (122,243 | ) | | | (192,575 | ) | | | (172,957 | ) |
| Institutional Class | | | (995,521 | ) | | | (1,090,512 | ) | | | (3,546,840 | ) | | | (2,718,798 | ) | | | (3,210,723 | ) | | | (3,176,192 | ) |
| | | | (2,341,199 | ) | | | (1,656,155 | ) | | | (5,012,945 | ) | | | (5,085,645 | ) | | | (5,545,967 | ) | | | (5,199,192 | ) |
| Net increase (decrease) | | | (1,329,094 | ) | | | (87,969 | ) | | | 5,034,388 | | | | 3,252,316 | | | | (900,095 | ) | | | 1,236,391 | |
| | | Delaware Tax-Free | | | Delaware Tax-Free | | | Delaware Tax-Free | |
| | | Idaho Fund | | | New York Fund | | | Pennsylvania Fund | |
| | | Year ended | | | Year ended | | | Year ended | |
| | | 8/31/23 | | | 8/31/22 | | | 8/31/23 | | | 8/31/22 | | | 8/31/23 | | | 8/31/22 | |
| Shares sold: | | | | | | | | | | | | | | | | | | | | | | | | |
| Class A | | | 1,656,764 | | | | 1,222,948 | | | | 2,493,095 | | | | 967,256 | | | | 12,904,727 | | | | 14,365,895 | |
| Class C | | | 68,969 | | | | 74,579 | | | | 52,421 | | | | 65,179 | | | | 269,783 | | | | 217,372 | |
| Institutional Class | | | 2,147,615 | | | | 2,537,889 | | | | 3,512,151 | | | | 4,263,727 | | | | 4,359,438 | | | | 5,473,407 | |
| | | | | | | | | | | | | | | | | | | | | | | | | |
| Shares issued upon reinvestment of dividends and distributions: | | | | | | |
| Class A | | | 191,593 | | | | 156,483 | | | | 353,002 | | | | 297,179 | | | | 1,490,669 | | | | 1,283,255 | |
| Class C | | | 11,454 | | | | 9,851 | | | | 6,418 | | | | 5,413 | | | | 38,195 | | | | 36,449 | |
| Institutional Class | | | 157,640 | | | | 133,514 | | | | 195,980 | | | | 127,769 | | | | 367,405 | | | | 302,064 | |
| | | | 4,234,035 | | | | 4,135,264 | | | | 6,613,067 | | | | 5,726,523 | | | | 19,430,217 | | | | 21,678,442 | |
| | | | | | | | | | | | | | | | | | | | | | | | | |
| Shares redeemed: | | | | | | | | | | | | | | | | | | | | | | | | |
| Class A | | | (1,861,186 | ) | | | (930,517 | ) | | | (2,443,964 | ) | | | (2,279,699 | ) | | | (17,159,399 | ) | | | (15,469,049 | ) |
| Class C | | | (108,766 | ) | | | (147,945 | ) | | | (151,146 | ) | | | (100,403 | ) | | | (495,977 | ) | | | (495,841 | ) |
| Institutional Class | | | (1,948,199 | ) | | | (2,234,652 | ) | | | (3,195,136 | ) | | | (2,511,065 | ) | | | (5,632,202 | ) | | | (4,556,076 | ) |
| | | | (3,918,151 | ) | | | (3,313,114 | ) | | | (5,790,246 | ) | | | (4,891,167 | ) | | | (23,287,578 | ) | | | (20,520,966 | ) |
| Net increase (decrease) | | | 315,884 | | | | 822,150 | | | | 822,821 | | | | 835,356 | | | | (3,857,361 | ) | | | 1,157,476 | |
Certain shareholders may exchange shares of one class for shares of another class in the same Fund. These exchange transactions are included as subscriptions and redemptions in the tables on the previous page and above and on the “Statements of changes in net assets.” For the years ended August 31, 2023 and 2022, each Fund had the following exchange transactions:
| | | Exchange Redemptions | | | Exchange Subscriptions | | | | |
| | | | | | | | | Institutional | | | | | | Institutional | | | | |
| | | Class A | | | Class C | | | Class | | | Class A | | | Class | | | | |
| | | Shares | | | Shares | | | Shares | | | Shares | | | Shares | | | Value | |
| Delaware Tax-Free Arizona Fund |
| Year ended | | | | | | | | | | | | | | | | | | | | | | | | |
| 8/31/23 | | | — | | | | — | | | | 29,308 | | | | 29,308 | | | | — | | | $ | 287,804 | |
| 8/31/22 | | | 8,660 | | | | 4,736 | | | | — | | | | — | | | | 13,404 | | | | 157,073 | |
| Delaware Tax-Free California Fund |
| Year ended | | | | | | | | | | | | | | | | | | | | | | | | |
| 8/31/23 | | | 2,606 | | | | — | | | | — | | | | — | | | | 2,606 | | | | 28,713 | |
Notes to financial statements
Delaware Funds by Macquarie® state tax-free funds
6. Capital Shares (continued)
| | | Exchange Redemptions | | | Exchange Subscriptions | | | | |
| | | | | | | | | Institutional | | | | | | Institutional | | | | |
| | | Class A | | | Class C | | | Class | | | Class A | | | Class | | | | |
| | | Shares | | | Shares | | | Shares | | | Shares | | | Shares | | | Value | |
| Delaware Tax-Free Colorado Fund |
| Year ended | | | | | | | | | | | | | | | | | | | | | | | | |
| 8/31/23 | | | 74,673 | | | | 2,690 | | | | 2,116 | | | | 4,815 | | | | 74,673 | | | $ | 798,445 | |
| 8/31/22 | | | 28,759 | | | | 29,958 | | | | — | | | | — | | | | 58,786 | | | | 624,114 | |
| | | | | | | | | | | | | | | | | | | | | | | | | |
| Delaware Tax-Free Idaho Fund* |
| Year ended | | | | | | | | | | | | | | | | | | | | | | | | |
| 8/31/22 | | | — | | | | 2,774 | | | | — | | | | 868 | | | | 1,906 | | | | 31,924 | |
| | | | | | | | | | | | | | | | | | | | | | | | | |
| Delaware Tax-Free New York Fund | | | | | | | | | | | | | | | | | | | | | | | | |
| Year ended | | | | | | | | | | | | | | | | | | | | | | | | |
| 8/31/23 | | | 20,232 | | | | 6,789 | | | | — | | | | 6,785 | | | | 20,252 | | | | 273,391 | |
| 8/31/22 | | | 2,825 | | | | 299 | | | | — | | | | 298 | | | | 2,833 | | | | 37,182 | |
| | | | | | | | | | | | | | | | | | | | | | | | | |
| Delaware Tax-Free Pennsylvania Fund |
| Year ended | | | | | | | | | | | | | | | | | | | | | | | | |
| 8/31/23 | | | 105,897 | | | | 28,025 | | | | — | | | | 28,056 | | | | 105,970 | | | | 955,662 | |
| 8/31/22 | | | 59,419 | | | | 9,495 | | | | — | | | | 9,502 | | | | 59,480 | | | | 539,221 | |
*Delaware Tax-Free Idaho Fund did not have any exchange transactions for the year ended August 31, 2023.
7. Line of Credit
Each Fund, along with certain other funds in the Delaware Funds (Participants), was a participant in a $355,000,000 revolving line of credit (Agreement) intended to be used for temporary or emergency purposes as an additional source of liquidity to fund redemptions of investor shares. Under the Agreement, the Participants were charged an annual commitment fee of 0.15%, which was allocated across the Participants based on a weighted average of the respective net assets of each Participant. The Participants were permitted to borrow up to a maximum of one-third of their net assets under the Agreement. Each Participant was individually, and not jointly, liable for its particular advances, if any, under the line of credit. The line of credit available under the Agreement expired on October 31, 2022. The Agreement was extended to October 30, 2023.
Each Fund had no amounts outstanding as of August 31, 2023, or at any time during the year then ended.
8. Geographic, Credit, and Market Risks
The global outbreak of COVID-19 resulted in travel restrictions, closed international borders, enhanced health screenings at ports of entry and elsewhere, disruption of and delays in
healthcare service preparation and delivery, prolonged quarantines, cancellations, supply chain disruptions, and lower consumer demand, as well as general concern and uncertainty. The impact of COVID-19, and other infectious illness outbreaks that may arise in the future, could adversely affect the economies of many nations or the entire global economy, individual issuers and capital markets in ways that cannot necessarily be foreseen. In addition, the impact of infectious illnesses in emerging market countries may be greater due to generally less established healthcare systems. Public health crises caused by the COVID-19 outbreak may exacerbate other pre-existing political, social and economic risks in certain countries or globally. The duration of the outbreak, its full economic impact and ongoing effects at the macro-level and on individual businesses are unpredictable and may result in significant and prolonged effects on a Fund’s performance.
When interest rates rise, fixed income securities (i.e. debt obligations) generally will decline in value. These declines in value are greater for fixed income securities with longer maturities or durations. Interest rate changes are influenced by a number of factors, such as government policy, monetary policy, inflation expectations, and the supply and demand of bonds. A Fund may be subject to a greater risk of rising interest rates when interest rates are low or inflation rates are high or rising.
The Funds concentrate their investments in securities issued by each corresponding state’s municipalities. The Funds invest primarily in a specific state and may be subject to geographic concentration risk. In addition, the Funds have the flexibility to invest in issuers in US territories and possessions such as the Commonwealth of Puerto Rico, the US Virgin Islands, and Guam whose bonds are also free of federal and individual state income taxes. The value of the Funds’ investments may be adversely affected by new legislation within the states or US territories, regional or local economic conditions, and differing levels of supply and demand for municipal bonds. Many municipalities insure repayment for their obligations. Although bond insurance reduces the risk of loss due to default by an issuer, such bonds remain subject to the risk that value may fluctuate for other reasons and there is no certainty that the insurance company will meet its obligations. A real or perceived decline in creditworthiness of a bond insurer can have an adverse impact on the value of insured bonds held in each Fund.
Each Fund invests a portion of its assets in high yield fixed income securities, which are securities rated lower than BBB- by Standard & Poor’s Financial Services LLC (S&P), lower than Baa3 by Moody’s Investors Service, Inc. (Moody’s), or similarly rated by another nationally recognized statistical rating organization. Investments in these higher yielding securities are generally accompanied by a greater degree of credit risk than higher rated securities. Additionally, lower rated securities may be more susceptible to adverse economic and competitive industry conditions than investment grade securities.
Each Fund invests in certain obligations that may have liquidity protection designed to ensure that the receipt of payments due on the underlying security is timely. Such protection may be provided through guarantees, insurance policies, or letters of credit obtained by the issuer or sponsor through third parties, through various means of structuring the transaction, or through a
Notes to financial statements
Delaware Funds by Macquarie® state tax-free funds
8. Geographic, Credit, and Market Risks (continued)
combination of such approaches. Each Fund will usually not pay any additional fees for such credit support, although the existence of credit support may increase the price of a security.
From time to time, each Fund may invest in industrial development bonds (IDBs) or pollution control revenue (PCR) bonds that are issued by a conduit authority on behalf of a corporation that is either foreign owned or has international affiliates or operations. While the bonds may be issued to finance a facility located in the US, the bonds may be secured by a payment obligation or guaranty of the corporation. To the extent each Fund invests in such securities, that Fund may be exposed to risks associated with international investments. The risk of international investments not ordinarily associated with US investments includes fluctuation in currency values, differences in accounting principles, and/or economic or political instability in other nations.
Each Fund may invest in advance refunded bonds, escrow secured bonds, or defeased bonds. Under current federal tax laws and regulations, state and local government borrowers are permitted to refinance outstanding bonds by issuing new bonds. The issuer refinances the outstanding debt to either reduce interest costs or to remove or alter restrictive covenants imposed by the bonds being refinanced. A refunding transaction where the municipal securities are being refunded within 90 days from the issuance of the refunding issue is known as a “current refunding.” “Advance refunded bonds” are bonds in which the refunded bond issue remains outstanding for more than 90 days following the issuance of the refunding issue. In an advance refunding, the issuer will use the proceeds of a new bond issue to purchase high grade interest-bearing debt securities, which are then deposited in an irrevocable escrow account held by an escrow agent to secure all future payments of principal and interest and bond premium of the advance refunded bond. Bonds are “escrowed to maturity” when the proceeds of the refunding issue are deposited in an escrow account for investment sufficient to pay all of the principal and interest on the original interest payment and maturity dates.
Bonds are considered “pre-refunded” when the refunding issuer’s proceeds are escrowed only until a permitted call date or dates on the refunded issue with the refunded issue being redeemed at the time, including any required premium. Bonds become “defeased” when the rights and interests of the bondholders and of their lien on the pledged revenues or other security under the terms of the bond contract are substituted with an alternative source of revenues (the escrow securities) sufficient to meet payments of principal and interest to maturity or to the first call dates. Escrowed secured bonds will often receive a rating of AAA from Moody’s, S&P, and/or Fitch Ratings due to the strong credit quality of the escrow securities and the irrevocable nature of the escrow deposit agreement.
Each Fund may invest up to 15% of its net assets in illiquid securities, which may include securities with contractual restrictions on resale, securities exempt from registration under Rule 144A promulgated under the Securities Act of 1933, as amended, and other securities which may not be readily marketable. The relative illiquidity of these securities may impair each Fund from disposing of them in a timely manner and at a fair price when it is necessary or
desirable to do so. While maintaining oversight, each Board has delegated to DMC, the day-to-day functions of determining whether individual securities are liquid for purposes of each Fund’s limitation on investments in illiquid securities. Securities eligible for resale pursuant to Rule 144A, which are determined to be liquid, are not subject to each Fund’s 15% limit on investments in illiquid securities. Rule 144A securities have been identified on the “Schedules of investments.”
9. Contractual Obligations
Each Fund enters into contracts in the normal course of business that contain a variety of indemnifications. Each Fund’s maximum exposure under these arrangements is unknown. However, each Fund has not had prior claims or losses pursuant to these contracts. Management has reviewed each Fund’s existing contracts and expects the risk of loss to be remote.
10. Subsequent Events
Management has determined that no material events or transactions occurred subsequent to August 31, 2023, that would require recognition or disclosure in the Funds’ financial statements.
Report of independent
registered public accounting firm
To the Board of Trustees of Voyageur Insured Funds, Voyageur Mutual Funds, Voyageur Mutual Funds II and Delaware Group® State Tax-Free Income Trust and Shareholders of Delaware Tax-Free Arizona Fund, Delaware Tax-Free California Fund, Delaware Tax-Free Colorado Fund, Delaware Tax-Free Idaho Fund, Delaware Tax-Free New York Fund and Delaware Tax-Free Pennsylvania Fund
Opinions on the Financial Statements
We have audited the accompanying statements of assets and liabilities, including the schedules of investments, of Delaware Tax-Free Arizona Fund (constituting Voyageur Insured Funds), Delaware Tax-Free California Fund, Delaware Tax-Free Idaho Fund, Delaware Tax-Free New York Fund (three of the funds constituting Voyageur Mutual Funds), Delaware Tax-Free Colorado Fund (constituting Voyageur Mutual Funds II) and Delaware Tax-Free Pennsylvania Fund (constituting Delaware Group® State Tax-Free Income Trust) (hereafter collectively referred to as the “Funds”) as of August 31, 2023, the related statements of operations for the year ended August 31, 2023, the statements of changes in net assets for each of the two years in the period ended August 31, 2023, including the related notes, and the financial highlights for each of the five years in the period ended August 31, 2023 (collectively referred to as the “financial statements”). In our opinion, the financial statements present fairly, in all material respects, the financial position of each of the Funds as of August 31, 2023, the results of each of their operations for the year then ended, the changes in each of their net assets for each of the two years in the period ended August 31, 2023 and each of the financial highlights for each of the five years in the period ended August 31, 2023 in conformity with accounting principles generally accepted in the United States of America.
Basis for Opinions
These financial statements are the responsibility of the Funds’ management. Our responsibility is to express an opinion on the Funds’ financial statements based on our audits. We are a public accounting firm registered with the Public Company Accounting Oversight Board (United States) (PCAOB) and are required to be independent with respect to the Funds in accordance with the U.S. federal securities laws and the applicable rules and regulations of the Securities and Exchange Commission and the PCAOB.
We conducted our audits of these financial statements in accordance with the standards of the PCAOB. Those standards require that we plan and perform the audit to obtain reasonable assurance about whether the financial statements are free of material misstatement, whether due to error or fraud.
Our audits included performing procedures to assess the risks of material misstatement of the financial statements, whether due to error or fraud, and performing procedures that respond to those risks. Such procedures included examining, on a test basis, evidence regarding the amounts and disclosures in the financial statements. Our audits also included evaluating the accounting principles used and significant estimates made by management, as well as evaluating the overall presentation of the financial statements. Our procedures included confirmation of securities owned as of August 31, 2023 by correspondence with the custodian, transfer agent and brokers. We believe that our audits provide a reasonable basis for our opinions.
/s/PricewaterhouseCoopers LLP
Philadelphia, Pennsylvania
October 20, 2023
We have served as the auditor of one or more investment companies in Delaware Funds by Macquarie® since 2010.
Other Fund information (Unaudited)
Delaware Funds by Macquarie® state tax-free funds
Liquidity Risk Management Program
The Securities and Exchange Commission (the “SEC”) has adopted Rule 22e-4 under the Investment Company Act of 1940 (the “Liquidity Rule”), which requires all open-end funds (other than money market funds) to adopt and implement a program reasonably designed to assess and manage the fund’s “liquidity risk,” defined as the risk that the fund could not meet requests to redeem shares issued by the fund without significant dilution of remaining investors’ interests in the fund.
The Funds have adopted and implemented a liquidity risk management program in accordance with the Liquidity Rule (the “Program”). The Board has designated a member of the US Operational Risk Group of Macquarie Asset Management as the Program Administrator for each Fund in the Trust.
As required by the Liquidity Rule, the Program includes policies and procedures that provide for: (1) assessment, management, and review (no less frequently than annually) of each Fund’s liquidity risk; (2) classification of each of the Fund’s portfolio holdings into one of four liquidity categories (Highly Liquid, Moderately Liquid, Less Liquid, and Illiquid); (3) for funds that do not primarily hold assets that are Highly Liquid, establishing and maintaining a minimum percentage of the Fund’s net assets in Highly Liquid investments (called a “Highly Liquid Investment Minimum” or “HLIM”); and (4) prohibiting each Fund’s acquisition of Illiquid investments if, immediately after the acquisition, each Fund would hold more than 15% of its net assets in Illiquid assets. The Program also requires reporting to the SEC (on a non-public basis) and to the Board if each Fund’s holdings of Illiquid assets exceed 15% of the Fund’s net assets. Funds with HLIMs must have procedures for addressing HLIM shortfalls, including reporting to the Board and, with respect to HLIM shortfalls lasting more than seven consecutive calendar days, reporting to the SEC (on a non-public basis).
In assessing and managing each Fund’s liquidity risk, the Program Administrator considers, as relevant, a variety of factors, including: (1) each Fund’s investment strategy and liquidity of portfolio investments during both normal and reasonably foreseeable stressed conditions; (2) short-term and long-term cash flow projections for the Funds during both normal and reasonably foreseeable stressed conditions; and (3) each Fund’s holdings of cash and cash equivalents and any borrowing arrangements. Classification of each Fund’s portfolio holdings in the four liquidity categories is based on the number of days it is reasonably expected to take to convert the investment to cash (for Highly Liquid and Moderately Liquid holdings) or to sell or dispose of the investment (for Less Liquid and Illiquid investments), in current market conditions without significantly changing the investment’s market value. Each Fund primarily holds assets that are classified as Highly Liquid, and therefore is not required to establish an HLIM.
At a meeting of the Board held on May 23-25, 2023, the Program Administrator provided a written report to the Board addressing the Program’s operation and assessing the adequacy and effectiveness of its implementation for the period from April 1, 2022 through March 31, 2023. The report concluded that the Program is appropriately designed and effectively implemented and that it meets the requirements of Rule 22e-4 and each Fund’s liquidity needs. Each Fund’s HLIM is set at an appropriate level and the Funds complied with their HLIM at all times during the reporting period.
Other Fund information (Unaudited)
Delaware Funds by Macquarie® state tax-free funds
Tax Information
The information set forth below is for each Fund’s fiscal year as required by federal income tax laws. Shareholders, however, must report distributions on a calendar year basis for income tax purposes, which may include distributions for portions of two fiscal years of each Fund. Accordingly, the information needed by shareholders for income tax purposes will be sent to them in January of each year. Please consult your tax advisor for proper treatment of this information.
All disclosures are based on financial information available as of the date of this annual report and, accordingly are subject to change. For any and all items requiring reporting, it is the intention of each Fund to report the maximum amount permitted under the Internal Revenue Code and the regulations thereunder.
For the fiscal year ended August 31, 2023, each Fund reports distributions paid during the year as follows:
| | | (A) | | | (B) | | | | |
| | | Ordinary Income | | | Tax-Exempt | | | Total | |
| | | Distributions | | | Distributions | | | Distributions | |
| | | (Tax Basis) | | | (Tax Basis) | | | (Tax Basis) | |
| Delaware Tax-Free Arizona Fund | | 0.39% | | | 99.61% | | | 100.00% | |
| Delaware Tax-Free California Fund | | 0.33% | | | 99.67% | | | 100.00% | |
| Delaware Tax-Free Colorado Fund | | 0.17% | | | 99.83% | | | 100.00% | |
| Delaware Tax-Free Idaho Fund | | 0.07% | | | 99.93% | | | 100.00% | |
| Delaware Tax-Free New York Fund | | 2.39% | | | 97.61% | | | 100.00% | |
| Delaware Tax-Free Pennsylvania Fund | | 1.92% | | | 98.08% | | | 100.00% | |
(A) and (B) are based on a percentage of each Fund’s total distributions.
Board Consideration of Investment Management Agreements at a Meeting Held on August 8-10, 2023
At a meeting held on August 8-10, 2023 (the “Annual Contract Renewal Meeting”), the Board of Trustees (the “Board”), including a majority of Trustees each of whom is not an “interested person” as defined under the Investment Company Act of 1940 (the “Independent Trustees”), approved the renewal of the Delaware Tax-Free Arizona Fund, Delaware Tax-Free California Fund, Delaware Tax-Free Colorado Fund, Delaware Tax-Free Idaho Fund, Delaware Tax-Free New York Fund and Delaware Tax-Free Pennsylvania Fund (each, a “Fund” and together, the “Funds”) Investment Management Agreements with Delaware Management Company (“DMC”).
Prior to the Annual Contract Renewal Meeting, including at a Board meeting held in May 2023, the Trustees conferred extensively among themselves and with representatives of DMC about these matters. Also, the Board was assisted by the Equity Investments Committee and the Fixed Income Multi-Asset Sub-Advised Funds Investments Committee (each an “Investment Committee” and together, the “Investment Committees”), with each Investment Committee assisting the full Board in reviewing investment performance and other matters throughout the year. The Independent Trustees were also assisted in their evaluation of the Investment Management Agreements by independent legal counsel, from whom they received separate legal advice and with whom they met separately.
In providing information to the Board, DMC was guided by a detailed set of requests for information submitted to them by independent legal counsel on behalf of the Independent Trustees at the start of the Board’s annual contract renewal process earlier in 2023. Prior to the Annual Contract Renewal Meeting, and in response to the requests, the Board received and reviewed materials specifically relating to the renewal of the Investment Management Agreements. In considering and approving the Investment Management Agreements, the Trustees considered the information they believed relevant, including but not limited to the information discussed below. The Board considered not only the specific information presented in connection with the Annual Contract Renewal Meeting and the review process for the Investment Management Agreements, but also the knowledge gained over time through interaction with DMC about various topics. In this regard, the Board reviewed reports of DMC at each of its quarterly meetings, which included information about, among other things, Fund performance, investment strategies, and expenses. In addition, the Investment Committees confer with portfolio managers at various times throughout the year. In considering information relating to the approval of the Funds’ Investment Management Agreements, the Independent Trustees also received information from an independent fund consultant, JDL Consultants, LLC (“JDL”).
The Board did not identify any particular information or consideration that was all-important or controlling, and each individual Trustee may have attributed different weights to various factors.
After its deliberations, the Board, including the Independent Trustees, unanimously approved the continuation of the Investment Management Agreements for a one-year term ending January 30, 2024. The following summarizes a number of important, but not necessarily all, factors considered by the Board in support of its approval.
Other Fund information (Unaudited)
Delaware Funds by Macquarie® state tax-free funds
Board Consideration of Investment Management Agreements at a Meeting Held on August 8-10, 2023 (continued)
Nature, extent, and quality of services. The Board received and considered various information regarding the nature, extent, and quality of the advisory services provided to the Funds by DMC under its Investment Management Agreements and the experience of the officers and employees of DMC who provide these services, including each Fund’s portfolio managers. The Board’s review included consideration of DMC’s investment process and oversight and research and analysis capabilities, and its ability to attract and retain skilled investment professionals. The Board also considered information regarding DMC’s programs for risk management, including investment, operational, liquidity, derivatives (as applicable), valuation, and compliance risks. The Board received information with respect to the cybersecurity program and business continuity plans of DMC and its affiliates.
In addition, the Board considered certain non-advisory services that DMC and its affiliates provide to the Delaware Funds by Macquarie complex (the “Delaware Funds”). Among other things, these services include third party service provider oversight, transfer agency, internal audit, valuation, portfolio trading, and legal and compliance functions. The Board noted DMC’s responsibility for overseeing the preparation of the Delaware Funds’ registration statement and supplements thereto and shareholder reports; responsibility for periodic filings with regulators; organizing Board meetings and preparing materials for such Board meetings; and furnishing analytical and other support to assist the Board. The Board took into account the benefits to shareholders of investing in a Fund that is part of a family of funds managed by an affiliate of Macquarie Group Ltd. (“Macquarie”), the parent company of DMC, and the resources available to DMC as part of Macquarie’s global asset management business.
The Board also received and considered information about the nature and extent of services offered and fee rates charged by DMC to other types of clients with investment strategies similar to those of the Funds. In this regard, the Board received information about the significantly greater scope of services, and compliance, reporting and other legal and regulatory obligations and risks of managing registered investment companies compared with those associated with managing assets of other types of clients, including third-party sub-advised fund clients, unregistered funds and separately managed accounts.
The Board concluded that, overall, it was satisfied with the nature, extent and quality of services provided (and expected to be provided) to the Funds by DMC.
Investment performance. The Board received and considered information with respect to the investment performance of the Funds, including performance reports and discussions with portfolio managers at meetings of the Board’s Investment Committees throughout the year as well as reports provided by Broadridge Financial Solutions, Inc., an independent investment company data provider (“Broadridge”), furnished for the Annual Contract Renewal Meeting. The Broadridge reports prepared for each Fund’s institutional share class showed its investment performance in comparison to the institutional share class of a group of similar funds (the “Performance Universe”). The Board received a description of the methodology used by Broadridge to select the peer funds in the Performance Universe. Comparative annualized
performance for each Fund was shown for the past 1-, 3-, 5- and 10-year or since inception periods, as applicable, ended December 31, 2022.
Delaware Tax-Free Arizona Fund. The Performance Universe for the Fund consisted of the Fund and all retail and institutional “other states” municipal debt funds, regardless of asset size or primary channel of distribution. The Board noted that the Broadridge report comparison showed that the Fund’s total return for the 1-, 3-, 5- and 10-year periods was in the fourth, third, second, and first quartile, respectively, of its Performance Universe. The Broadridge report comparison showed that the Fund’s total return for the 1- and 3-year periods was below the median of its Performance Universe and for the 5- and 10-year periods was above the median of its Performance Universe. The Board also noted that the Fund slightly outperformed its benchmark index for the 10-year period and underperformed its benchmark index for the 1-, 3- and 5-year periods. The Board noted the explanations from DMC concerning the reasons for the Fund’s relative performance versus its Performance Universe and benchmark index for the various periods.
Delaware Tax-Free California Fund. The Performance Universe for the Fund consisted of the Fund and all retail and institutional California municipal debt funds, regardless of asset size or primary channel of distribution. The Board noted that the Broadridge report comparison showed that the Fund’s total return for the 1-year period was in the fourth quartile of its Performance Universe and for the 3- and 5-year and since inception periods was in the second quartile of its Performance Universe. The Broadridge report comparison showed that the Fund’s total return for the 3- and 5-year and since inception periods was above the median of its Performance Universe and for the 1-year period was below the median of its Performance Universe. The Board also noted that the Fund outperformed its benchmark index for the since inception period and underperformed its benchmark index for the 1-, 3- and 5-year periods. The Board noted that the Fund was generally performing in line with its Performance Universe during the periods under review. The Board noted the explanations from DMC concerning the reasons for the Fund’s relative performance versus its benchmark index for the various periods.
Delaware Tax-Free Colorado Fund. The Performance Universe for the Fund consisted of the Fund and all retail and institutional “other states” municipal debt funds, regardless of asset size or primary channel of distribution. The Board noted that the Broadridge report comparison showed that the Fund’s total return for the 1- and 3-year periods was in the fourth and second quartile, respectively, of its Performance Universe and for the 5-year and since inception periods was in the first quartile of its Performance Universe. The Broadridge report comparison showed that the Fund’s total return for the 3- and 5-year and since inception periods was above the median of its Performance Universe and for the 1-year period was below the median of its Performance Universe. The Board also noted that the Fund outperformed its benchmark index for the since inception period and underperformed its benchmark index for the 1-, 3- and 5-year periods. The Board noted that the Fund was generally performing in line with its Performance Universe during the periods under review. The Board noted the explanations from DMC concerning the reasons for the Fund’s relative performance versus its benchmark index for the various periods.
Other Fund information (Unaudited)
Delaware Funds by Macquarie® state tax-free funds
Board Consideration of Investment Management Agreements at a Meeting Held on August 8-10, 2023 (continued)
Delaware Tax-Free Idaho Fund. The Performance Universe for the Fund consisted of the Fund all retail and institutional “other states” municipal debt funds, regardless of asset size or primary channel of distribution. The Board noted that the Broadridge report comparison showed that the Fund’s total return for the 1- and 5-year periods was in the fourth and first quartile, respectively, and for the 3-year and since inception periods was in the second quartile of its Performance Universe. The Broadridge report comparison showed that the Fund’s total return for the 1-year period was below the median of its Performance Universe and for the 3- and 5-year and since inception periods was above the median of its Performance Universe. The Board also noted that the Fund underperformed its benchmark index for the 1-, 3- and 5-year and since inception periods. The Board noted the explanations from DMC concerning the reasons for the Fund’s relative performance versus its benchmark index for the various periods and its Performance Universe for the 1-year period.
Delaware Tax-Free New York Fund. The Performance Universe for the Fund consisted of the Fund all retail and institutional New York municipal debt funds, regardless of asset size or primary channel of distribution. The Board noted that the Broadridge report comparison showed that the Fund’s total return for the 1-year period was in the third quartile of its Performance Universe and for the 3- and 5-year and since inception periods was in the first quartile of its Performance Universe. The Broadridge report comparison showed that the Fund’s total return for the 1-year period was below the median of its Performance Universe and for the 3- and 5-year and since inception periods was above the median of its Performance Universe. The Board also noted that the Fund underperformed its benchmark index for the 1-, 3- and 5-year periods and outperformed its benchmark index for the since inception period. The Board noted that the Fund was generally performing in line with its Performance Universe during the periods under review. The Board also noted that the Fund added a portfolio manager in May 2023. The Board noted the explanations from DMC concerning the reasons for the Fund’s relative performance versus its benchmark index for the various periods.
Delaware Tax-Free Pennsylvania Fund. The Performance Universe for the Fund consisted of the Fund and all retail and institutional Pennsylvania municipal debt funds, regardless of asset size or primary channel of distribution. The Board noted that the Broadridge report comparison showed that the Fund’s total return for the 1-year period was in the third quartile of its Performance Universe and for the 3- and 5-year and since inception periods was in the first quartile of its Performance Universe. The Broadridge report comparison showed that the Fund’s total return for the 1-year period was below the median of its Performance Universe and for the 3- and 5-year and since inception periods was above the median of its Performance Universe. The Board also noted that the Fund underperformed its benchmark index for the 1-, 3- and 5-year periods and outperformed its benchmark index for the since inception periods. The Board noted that the Fund was generally performing in line with its Performance Universe during the periods under review. The Board noted the explanations from DMC concerning the reasons for the Fund’s relative performance versus its benchmark index for the various periods.
Comparative expenses. The Board received and considered expense data for the Funds. DMC provided the Board with information on pricing levels and fee structures for each Fund as of its most recently completed fiscal year. The Broadridge total expenses, for comparative consistency, were shown by Broadridge for Institutional Class shares and comparative total expenses including 12b-1 and non-12b-1 service fees. The Board also considered the comparative analysis of contractual management fees and actual total expense ratios of each Fund versus contractual management fees and actual total expense ratios of a group of peer funds as selected by Broadridge (the “Expense Group”). In reviewing comparative costs, each Fund’s contractual management fee and the actual management fee incurred by each Fund were compared with the contractual management fees (assuming all funds in the Expense Group were similar in size to each Fund) and actual management fees, taking into account any applicable breakpoints and fee waivers, with a Fund’s expense universe, which is comprised of the Fund, its Expense Group and all other similar institutional funds, excluding outliers (the “Expense Universe”). Each Fund’s total expenses were also compared with those of its Expense Universe. The Board also received and considered information regarding the Fund’s net operating expense ratios and their various components, including actual management fees, custodian and other non-management fees, and Rule 12b-1 and non-Rule 12b-1 shareholder service fees.
Delaware Tax-Free Arizona Fund. The expense comparisons for the Fund showed that its actual management fee was below the median of its Expense Universe and its actual total expenses were above its Expense Group average. It was noted that consistent with DMC’s waiver methodology, its advisory fee waivers, if any, were at the fund level and not class level.
Delaware Tax-Free California Fund. The expense comparisons for the Fund showed that its actual management fee was below the median of its Expense Universe and its actual total expenses were above its Expense Group average. It was noted that consistent with DMC’s waiver methodology, its advisory fee waivers, if any, were at the fund level and not class level.
Delaware Tax-Free Colorado Fund. The expense comparisons for the Fund showed that its actual management fee was below the median of its Expense Universe and its actual total expenses were above its Expense Group average. It was noted that consistent with DMC’s waiver methodology, its advisory fee waivers, if any, were at the fund level and not class level.
Delaware Tax-Free Idaho Fund. The expense comparisons for the Fund showed that its actual management fee was below the median of its Expense Universe and its actual total expenses were above its Expense Group average. It was noted that consistent with DMC’s waiver methodology, its advisory fee waivers, if any, were at the fund level and not class level.
Delaware Tax-Free New York Fund. The expense comparisons for the Fund showed that its actual management fee below the median of its Expense Universe and its actual total expenses were above its Expense Group average. It was noted that consistent with DMC’s waiver methodology, its advisory fee waivers, if any, were at the fund level and not class level.
Delaware Tax-Free Pennsylvania Fund. The expense comparisons for the Fund showed that its actual management fee above the median of its Expense Universe and its actual total expenses were above its Expense Group average. It was noted that consistent with DMC’s waiver methodology, its advisory fee waivers, if any, were at the fund level and not class level.
Other Fund information (Unaudited)
Delaware Funds by Macquarie® state tax-free funds
Board Consideration of Investment Management Agreements at a Meeting Held on August 8-10, 2023 (continued)
Based on its consideration of the factors and information it deemed relevant, including those described here, the Board determined that the compensation payable to DMC under the Investment Management Agreements was reasonable.
Economies of scale. The Board received and considered information about the potential for DMC to realize economies of scale in the provision of management services to the Funds, the difficulties of calculating economies of scale at an individual Fund level, and the extent to which potential scale benefits are shared with shareholders, including the extent to which any economies of scale are reflected in the level of management fees charged. DMC discussed its advisory fee pricing and structure for the Delaware Funds, including the current breakpoints. The Board noted that each Fund may also benefit from economies of scale through initial fee setting, fee waivers and expense reimbursements, as well as DMC’s investment in its business, including investments in business infrastructure, technology and cybersecurity.
Management profitability. The Board received and considered the Investment Management Profitability Analysis that addressed the overall profitability of DMC’s business in providing management and other services to each Fund and the Delaware Funds as a whole, including the methodology used by DMC in allocating costs for the purpose of determining profitability. The Board noted DMC’s changes to its cost allocation methodology for its profitability analysis and the explanations for such changes. The Board also reviewed a report prepared by JDL regarding DMC’s profitability as compared to certain peer fund complexes and the Independent Trustees discussed DMC’s profitability in such context with representatives from JDL. The Board recognized that calculating and comparing profitability at the individual fund level is difficult; that DMC’s profit, if any, can vary significantly depending on the particular fund; and that DMC’s support for, and commitment to, a fund are not solely dependent on the profits realized as to that fund.
Based on its review, the Board determined that DMC’s profitability was not excessive in light of the nature, extent and quality of the services provided to each Fund.
Ancillary benefits. The Board received and considered information regarding the extent to which DMC and its affiliates might derive ancillary benefits from fund operations, including the potential for procuring additional business as a result of the prestige and visibility associated with its role as investment manager to the Delaware Funds; the benefits from allocation of fund brokerage to improve trading efficiencies; the portfolio transactions executed through “soft dollar” arrangements; and the fees that various affiliates received for serving as transfer agent and for overseeing fund accounting and financial administration services to the Delaware Funds. The Board considered that it receives periodic reports from DMC that include a representation that any soft dollar arrangements are consistent with regulatory requirements. The Board received information from DMC regarding its view of the performance of its affiliates in providing transfer agent and fund accounting and financial administration oversight services and the organizational structure employed to provide these services pursuant to their contracts with the Funds.
Based on its consideration of the factors and information it deemed relevant, including the costs of providing investment management and other services to the Funds and the ongoing commitment of DMC and its affiliates to the Funds, the Board did not find that any ancillary benefits received by DMC and its affiliates were unreasonable.
Conclusion. Based on its review, consideration and evaluation of all factors it believed relevant, including the above-described factors and conclusions, the Board, including all of the Independent Trustees, approved the continuation of DMC’s Investment Management Agreements for an additional one-year period.
Form N-PORT and proxy voting information
Each Fund files its complete schedule of portfolio holdings with the Securities and Exchange Commission (SEC) for the first and third quarters of each fiscal year on Form N-PORT. Each Fund’s Forms N-PORT, as well as a description of the policies and procedures that the Funds use to determine how to vote proxies (if any) relating to portfolio securities, are available without charge (i) upon request, by calling 800 523-1918; and (ii) on the SEC’s website at sec.gov. In addition, a description of the policies and procedures that the Funds use to determine how to vote proxies (if any) relating to portfolio securities and the Schedule of Investments included in the Funds’ most recent Form N-PORT are available without charge on the Funds’ website at delawarefunds.com/literature.
Information (if any) regarding how the Funds voted proxies relating to portfolio securities during the most recently disclosed 12-month period ended June 30 is available without charge (i) through the Funds’ website at delawarefunds.com/proxy; and (ii) on the SEC’s website at sec.gov.
Board of trustees and officers addendum
Delaware Funds by Macquarie®
A mutual fund is governed by a Board of Trustees (“Trustees”), which has oversight responsibility for the management of a fund’s business affairs. Trustees establish procedures and oversee and review the performance of the investment manager, the distributor, and others who perform services for the fund. The independent fund trustees, in particular, are advocates for shareholder interests. Each trustee has served in that capacity since he or she was elected to or appointed to the Board of Trustees, and will continue to serve until his or her retirement or the election of a new trustee in his or her place. The following is a list of the Trustees and Officers with certain background and related information.
| | | | | | Other |
| | | | Number of | Principal | Directorships |
| Name, | Position(s) | | Funds in Fund | Occupation(s) | Held by Trustee |
| Address, | Held with | Length of Time | Complex Overseen | During the | During the |
| and Birth Year | the Trust | Served1 | by Trustee | Past Five Years | Past Five Years |
| Interested Trustee | | |
| | | | | | |
Shawn K. Lytle2
100 Independence
610 Market Street
Philadelphia, PA
19106-2354
1970 | President, Chief Executive Officer, and Trustee | President and Chief Executive Officer since August 2015 Trustee since September 2015 | 105 | Macquarie Asset Management3 (2015–Present) -Global Head of
Macquarie Asset Management Public Investments (2019–Present) -Head of Americas of Macquarie Group
(2017–Present) | None |
| | | | | | Other |
| | | | Number of | Principal | Directorships |
| Name, | Position(s) | | Funds in Fund | Occupation(s) | Held by Trustee |
| Address, | Held with | Length of Time | Complex Overseen | During the | During the |
| and Birth Year | the Trust | Served1 | by Trustee | Past Five Years | Past Five Years |
| Independent Trustees | | | |
| | | | | | |
Jerome D.
Abernathy
100 Independence
610 Market Street
Philadelphia, PA
19106-2354
1959 | Trustee | Since January 2019 | 105 | Stonebrook Capital
Management, LLC
(financial
technology: macro
factors and databases)
-Managing Member
(1993-Present) | None |
| | | | | | |
Ann D. Borowiec
100 Independence
610 Market Street
Philadelphia, PA
19106-2354
1958 | Trustee | Since March 2015 | 105 | J.P. Morgan Chase & Co.
(1987-2013)
-Chief Executive Officer,
Private Wealth
Management
(2011–2013) | Banco Santander International
(2016–2019) Santander Bank, N.A.
(2016-2019) |
Board of trustees and officers addendum
Delaware Funds by Macquarie®
| | | | | | Other |
| | | | Number of | Principal | Directorships |
| Name, | Position(s) | | Funds in Fund | Occupation(s) | Held by Trustee |
| Address, | Held with | Length of Time | Complex Overseen | During the | During the |
| and Birth Year | the Trust | Served1 | by Trustee | Past Five Years | Past Five Years |
| | | | | | |
Joseph W. Chow
100 Independence
610 Market Street
Philadelphia, PA
19106-2354
1953 | Trustee | Since January 2013 | 105 | Private Investor
(2011–Present) State Street Bank and Trust Company (1996-2011) -Executive Vice President of Enterprise Risk Management and Emerging Economies Strategy; and Chief Risk and Corporate Administration Officer | None |
| | | | | | |
H. Jeffrey Dobbs 100 Independence 610 Market Street Philadelphia, PA 19106-2354
1955 | Trustee | Since April 20194 | 105 | KPMG LLP
(2002-2015) -Global Sector Chairman, Industrial Manufacturing
(2010-2015) | TechAccel LLC (2015–Present) PatientsVoices, Inc. (2018–Present) Valparaiso University Board (2012-Present) Ivy Funds Complex (2019-2021) |
| | | | | | Other |
| | | | Number of | Principal | Directorships |
| Name, | Position(s) | | Funds in Fund | Occupation(s) | Held by Trustee |
| Address, | Held with | Length of Time | Complex Overseen | During the | During the |
| and Birth Year | the Trust | Served1 | by Trustee | Past Five Years | Past Five Years |
| |
John A. Fry
100 Independence 610 Market Street Philadelphia, PA 19106-2354 1960 | Trustee | Since January 2001 | 105 | Drexel University -President
(2010–Present) | Federal Reserve Bank of Philadelphia (2020–Present) Kresge Foundation (2018-Present) FS Credit Real Estate Income Trust, Inc. (2018–Present) vTv Therapeutics Inc.
(2017–Present) Community Health Systems (2004–Present) Drexel Morgan & Co.
(2015–2019) |
Board of trustees and officers addendum
Delaware Funds by Macquarie®
| | | | | | Other |
| | | | Number of | Principal | Directorships |
| Name, | Position(s) | | Funds in Fund | Occupation(s) | Held by Trustee |
| Address, | Held with | Length of Time | Complex Overseen | During the | During the |
| and Birth Year | the Trust | Served1 | by Trustee | Past Five Years | Past Five Years |
| |
Joseph Harroz, Jr. 100 Independence 610 Market Street Philadelphia, PA 19106-2354
1967 | Trustee | Since November 19984 | 105 | University of Oklahoma -President
(2020–Present) -Interim President (2019–2020) -Vice President and Dean, College of Law (2010–2019) Brookhaven Investments LLC (commercial enterprises) -Managing Member
(2019–Present) St. Clair, LLC (commercial enterprises) -Managing Member
(2019–Present) | OU Medicine, Inc. (2020–Present) Big 12 Athletic Conference
(2019-Present) Valliance Bank
(2007–Present) Ivy Funds Complex
(1998-2021) |
| | | | | | Other |
| | | | Number of | Principal | Directorships |
| Name, | Position(s) | | Funds in Fund | Occupation(s) | Held by Trustee |
| Address, | Held with | Length of Time | Complex Overseen | During the | During the |
| and Birth Year | the Trust | Served1 | by Trustee | Past Five Years | Past Five Years |
| | | | | | |
| Sandra A.J. | Trustee | Since April 20194 | 105 | Children’s Mercy | Brixmor Property |
Lawrence
100 Independence
610 Market Street Philadelphia, PA 19106-2354
1957 | | | | Hospitals and Clinics (2005–2019) -Chief Administrative Officer (2016–2019) | Group Inc.
(2021-Present) Sera Prognostics Inc. (biotechnology) (2021-Present) Recology (resource recovery)
(2021-2023) Evergy, Inc., Kansas City Power & Light Company, KCP&L Greater Missouri Operations Company, Westar Energy, Inc. and Kansas Gas and Electric Company (related utility companies)
(2018-Present) National Association of Corporate
Directors (2017-Present) American Shared Hospital Services (medical device) (2017-2021) Ivy Funds Complex (2019-2021) |
Board of trustees and officers addendum
Delaware Funds by Macquarie®
| | | | | | Other |
| | | | Number of | Principal | Directorships |
| Name, | Position(s) | | Funds in Fund | Occupation(s) | Held by Trustee |
| Address, | Held with | Length of Time | Complex Overseen | During the | During the |
| and Birth Year | the Trust | Served1 | by Trustee | Past Five Years | Past Five Years |
| |
Frances A. Sevilla-Sacasa
100 Independence
610 Market Street Philadelphia, PA 19106-2354
1956 | Trustee | Since September 2011 | 105 | Banco Itaú International -Chief Executive Officer (2012–2016) Bank of America, U.S. Trust Private Wealth -President (2007-2008) U.S. Trust Corp. -President & CEO (2005-2007) | Invitation Homes Inc. (2023-Present) Florida Chapter of National Association of Corporate Directors
(2021-Present) Callon Petroleum Company
(2019-Present) Camden Property Trust (2011-Present) New Senior Investment Group Inc. (REIT) (2021) Carrizo Oil & Gas, Inc.
(2018-2019) |
| | | | | | |
Thomas K. Whitford
100 Independence
610 Market Street Philadelphia, PA 19106-2354
1956 | Chair and Trustee | Trustee since January 2013 Chair since January 2023 | 105 | PNC Financial Services Group
(1983–2013) -Vice Chairman
(2009-2013) | HSBC USA Inc. (2014–2022) HSBC North America Holdings Inc.
(2013–2022) |
| | | | | | Other |
| | | | Number of | Principal | Directorships |
| Name, | Position(s) | | Funds in Fund | Occupation(s) | Held by Trustee |
| Address, | Held with | Length of Time | Complex Overseen | During the | During the |
| and Birth Year | the Trust | Served1 | by Trustee | Past Five Years | Past Five Years |
| | | | | | |
Christianna Wood 100 Independence 610 Market Street Philadelphia, PA 19106-2354
1959 | Trustee | Since January 2019 | 105 | Gore Creek Capital, Ltd. -Chief Executive Officer and President
(2009–Present) Capital Z Asset Management -Chief Executive Officer
(2008-2009) California Public Employees’ Retirement System (CalPERS) -Senior Investment Officer of Global Equity
6(2002-2008) | The Merger Fund (2013–2021), The Merger Fund VL (2013–2021), WCM Alternatives: Event-Driven Fund
(2013–2021), and WCM Alternatives: Credit Event Fund
(2017–2021) Grange Insurance
(2013–Present) H&R Block Corporation
(2008–2022) International Securities Exchange (2010-2018) Vassar College Trustee (2006-2018) |
Board of trustees and officers addendum
Delaware Funds by Macquarie®
| | | | | | Other |
| | | | Number of | Principal | Directorships |
| Name, | Position(s) | | Funds in Fund | Occupation(s) | Held by Trustee |
| Address, | Held with | Length of Time | Complex Overseen | During the | During the |
| and Birth Year | the Trust | Served1 | by Trustee | Past Five Years | Past Five Years |
| | | | | | |
Janet L. Yeomans 100 Independence 610 Market Street Philadelphia, PA 19106-2354
1948 | Trustee | Since April 1999 | 105 | 3M Company
(1995-2012) -Vice President and Treasurer
(2006–2012) | Temple University Hospital
(2017-Present) Pennsylvania State System of Higher Education
(2018-Present) |
| Officers | | | | | |
David F. Connor
100 Independence
610 Market Street Philadelphia, PA 19106-2354
1963 | Senior Vice President, General Counsel, and Secretary | Senior Vice President, since May 2013; General Counsel since May 2015; Secretary since October 2005 | 105 | David F. Connor has served in various capacities at different times at Macquarie Asset Management. | None5 |
| | | | | | |
Daniel V. Geatens 100 Independence 610 Market Street Philadelphia, PA 19106-2354
1972 | Senior Vice President and Treasurer | Senior Vice President and Treasurer since October 2007 | 105 | Daniel V. Geatens has served in various capacities at different times at Macquarie Asset Management. | None5 |
| | | | | | Other |
| | | | Number of | Principal | Directorships |
| Name, | Position(s) | | Funds in Fund | Occupation(s) | Held by Trustee |
| Address, | Held with | Length of Time | Complex Overseen | During the | During the |
| and Birth Year | the Trust | Served1 | by Trustee | Past Five Years | Past Five Years |
| | | | | | |
Richard Salus
100 Independence
610 Market Street Philadelphia, PA 19106-2354
1963 | Senior Vice President and Chief Financial Officer | Senior Vice President and Chief Financial Officer since November 2006 | 105 | Richard Salus has served in various capacities at different times at Macquarie Asset Management. | None |
1 “Length of Time Served” refers to the time since the Trustee or officer began serving one or more of the Trusts in the Delaware Funds complex.
2 Shawn K. Lytle is considered to be an “Interested Trustee” because he is an executive officer of the Funds’ investment advisor.
3 Macquarie Asset Management is the marketing name for certain companies comprising the asset management division of Macquarie Group, including the Funds’ investment advisor, principal underwriter, and transfer agent.
4 Includes time served on the Board of the Ivy Funds complex prior to the date when the Ivy Funds joined the Delaware Funds complex.
5 David F. Connor and Daniel V. Geatens serve in similar capacities for the six portfolios of the Optimum Fund Trust, which have the same investment manager, principal underwriter, and transfer agent as the Funds. Mr. Geatens also serves as the Chief Financial Officer of the Optimum Fund Trust.
The Statement of Additional Information for the Fund(s) includes additional information about the Trustees and Officers and is available, without charge, upon request by calling 800 523-1918.
Item 2. Code of Ethics
The registrant has adopted a code of ethics that applies to the registrant’s principal executive officer, principal financial officer, principal accounting officer or controller, or persons performing similar functions, regardless of whether these individuals are employed by the registrant or a third party. A copy of the registrant’s Code of Business Ethics has been posted on the Delaware Funds by Macquarie® Internet Web site at www.delawarefunds.com. Any amendments to the Code of Business Ethics, and information on any waiver from its provisions granted by the registrant, will also be posted on this Web site within five business days of such amendment or waiver and will remain on the Web site for at least 12 months.
Item 3. Audit Committee Financial Expert
The registrant’s Board of Trustees has determined that certain members of the registrant’s Audit Committee are audit committee financial experts, as defined below. For purposes of this item, an “audit committee financial expert” is a person who has the following attributes:
a. An understanding of generally accepted accounting principles and financial statements;
b. The ability to assess the general application of such principles in connection with the accounting for estimates, accruals, and reserves;
c. Experience preparing, auditing, analyzing, or evaluating financial statements that present a breadth and level of complexity of accounting issues that are generally comparable to the breadth and complexity of issues that can reasonably be expected to be raised by the registrant’s financial statements, or experience actively supervising one or more persons engaged in such activities;
d. An understanding of internal controls and procedures for financial reporting; and
e. An understanding of audit committee functions.
An “audit committee financial expert” shall have acquired such attributes through:
a. Education and experience as a principal financial officer, principal accounting officer, controller, public accountant, or auditor or experience in one or more positions that involve the performance of similar functions;
b. Experience actively supervising a principal financial officer, principal accounting officer, controller, public accountant, auditor, or person performing similar functions;
c. Experience overseeing or assessing the performance of companies or public accountants with respect to the preparation, auditing, or evaluation of financial statements; or
d. Other relevant experience.
The registrant’s Board of Trustees has also determined that each member of the registrant’s Audit Committee is independent. In order to be “independent” for purposes of this item, the Audit Committee member may not: (i) other than in his or her capacity as a member of the Board of Trustees or any committee thereof, accept directly or indirectly any consulting,
advisory or other compensatory fee from the issuer; or (ii) be an “interested person” of the registrant as defined in Section 2(a)(19) of the Investment Company Act of 1940.
The names of the audit committee financial experts on the registrant’s Audit Committee are set forth below:
H. Jeffrey Dobbs
Sandra A.J. Lawrence
Frances Sevilla-Sacasa, Chair
Item 4. Principal Accountant Fees and Services
(a) Audit fees.
The aggregate fees billed for services provided to the registrant by its independent auditors for the audit of the registrant’s annual financial statements and for services normally provided by the independent auditors in connection with statutory and regulatory filings or engagements were $38,887 for the fiscal year ended August 31, 2023.
The aggregate fees billed for services provided to the registrant by its independent auditors for the audit of the registrant’s annual financial statements and for services normally provided by the independent auditors in connection with statutory and regulatory filings or engagements were $38,887 for the fiscal year ended August 31, 2022.
(b) Audit-related fees.
The aggregate fees billed by the registrant’s independent auditors for services relating to the performance of the audit of the registrant’s financial statements and not reported under paragraph (a) of this Item were $0 for the fiscal year ended August 31, 2023.
The aggregate fees billed by the registrant’s independent auditors for services relating to the performance of the audit of the financial statements of the registrant’s investment adviser and other service providers under common control with the adviser and that relate directly to the operations or financial reporting of the registrant were $1,362,878 for the registrant’s fiscal year ended August 31, 2023. The percentage of these fees relating to services approved by the registrant’s Audit Committee pursuant to the de minimis exception from the pre-approval requirement in Rule 2-01(c)(7)(i)(C) of Regulation S-X was 0%. These audit-related services were as follows: year end audit procedures; group reporting and subsidiary statutory audits.
The aggregate fees billed by the registrant’s independent auditors for services relating to the performance of the audit of the registrant’s financial statements and not reported under paragraph (a) of this Item were $0 for the fiscal year ended August 31, 2022.
The aggregate fees billed by the registrant’s independent auditors for services relating to the performance of the audit of the financial statements of the registrant’s investment adviser and other service providers under common control with the adviser and that relate directly to the operations or financial reporting of the registrant were $2,050,189 for the registrant’s fiscal year ended August 31, 2022. The percentage of these fees relating to services approved by the registrant’s Audit Committee pursuant to the de minimis exception from the pre-approval requirement in Rule 2-01(c)(7)(i)(C) of Regulation S-X was 0%. These audit-related services were as follows: year end audit procedures; group reporting and subsidiary statutory audits.
(c) Tax fees.
The aggregate fees billed by the registrant’s independent auditors for tax-related services provided to the registrant were $5,297 for the fiscal year ended August 31, 2023. The percentage of these fees relating to services approved by the registrant’s Audit Committee pursuant to the de minimis exception from the pre-approval requirement in Rule 2-01(c)(7)(i)(C) of Regulation S-X was 0%. These tax-related services were as follows: review of income tax returns and review of annual excise distribution calculations.
The aggregate fees billed by the registrant’s independent auditors for tax-related services provided to the registrant’s investment adviser and other service providers under common control with the adviser and that relate directly to the operations or financial reporting of the registrant were $0 for the registrant’s fiscal year ended August 31, 2023. The percentage of these fees relating to services approved by the registrant’s Audit Committee pursuant to the de minimis exception from the pre-approval requirement in Rule 2-01(c)(7)(i)(C) of Regulation S-X was 0%.
The aggregate fees billed by the registrant’s independent auditors for tax-related services provided to the registrant were $5,297 for the fiscal year ended August 31, 2022. The percentage of these fees relating to services approved by the registrant’s Audit Committee pursuant to the de minimis exception from the pre-approval requirement in Rule 2-01(c)(7)(i)(C) of Regulation S-X was 0%. These tax-related services were as follows: review of income tax returns and review of annual excise distribution calculations.
The aggregate fees billed by the registrant’s independent auditors for tax-related services provided to the registrant’s investment adviser and other service providers under common control with the adviser and that relate directly to the operations or financial reporting of the registrant were $0 for the registrant’s fiscal year ended August 31, 2022. The percentage of these fees relating to services approved by the registrant’s Audit Committee pursuant to the de minimis exception from the pre-approval requirement in Rule 2-01(c)(7)(i)(C) of Regulation S-X was 0%.
(d) All other fees.
The aggregate fees billed for all services provided by the independent auditors to the registrant other than those set forth in paragraphs (a), (b) and (c) of this Item were $0 for the fiscal year ended August 31, 2023.
The aggregate fees billed for all services other than those set forth in paragraphs (b) and (c) of this Item provided by the registrant’s independent auditors to the registrant’s adviser and other service providers under common control with the adviser and that relate directly to the operations or financial reporting of the registrant were $0 for the registrant’s fiscal year ended August 31, 2023. The percentage of these fees relating to services approved by the registrant’s Audit Committee pursuant to the de minimis exception from the pre-approval requirement in Rule 2-01(c)(7)(i)(C) of Regulation S-X was 0%.
The aggregate fees billed for all services provided by the independent auditors to the registrant other than those set forth in paragraphs (a), (b) and (c) of this Item were $0 for the fiscal year ended August 31, 2022.
The aggregate fees billed for all services other than those set forth in paragraphs (b) and (c) of this Item provided by the registrant’s independent auditors to the registrant’s adviser and
other service providers under common control with the adviser and that relate directly to the operations or financial reporting of the registrant were $0 for the registrant’s fiscal year ended August 31, 2022. The percentage of these fees relating to services approved by the registrant’s Audit Committee pursuant to the de minimis exception from the pre-approval requirement in Rule 2-01(c)(7)(i)(C) of Regulation S-X was 0%.
(e) The registrant’s Audit Committee has established pre-approval policies and procedures as permitted by Rule 2-01(c)(7)(i)(B) of Regulation S-X (the “Pre-Approval Policy”) with respect to services provided by the registrant’s independent auditors. Pursuant to the Pre-Approval Policy, the Audit Committee has pre-approved the services set forth in the table below with respect to the registrant up to the specified fee limits. Certain fee limits are based on aggregate fees to the registrant and other registrants within the Delaware Funds by Macquarie®.
| Service | Range of Fees |
| Audit Services | |
| Statutory audits or financial audits for new Funds | up to $50,000 per Fund |
| Services associated with SEC registration statements (e.g., Form N-1A, Form N-14, etc.), periodic reports and other documents filed with the SEC or other documents issued in connection with securities offerings (e.g., comfort letters for closed-end Fund offerings, consents), and assistance in responding to SEC comment letters | up to $10,000 per Fund |
| Consultations by Fund management as to the accounting or disclosure treatment of transactions or events and/or the actual or potential impact of final or proposed rules, standards or interpretations by the SEC, FASB, or other regulatory or standard-setting bodies (Note: Under SEC rules, some consultations may be considered “audit-related services” rather than “audit services”) | up to $25,000 in the aggregate |
| Audit-Related Services | |
| Consultations by Fund management as to the accounting or disclosure treatment of transactions or events and /or the actual or potential impact of final or proposed rules, standards or interpretations by the SEC, FASB, or other regulatory or standard-setting bodies (Note: Under SEC rules, some consultations may be considered “audit services” rather than “audit-related services”) | up to $25,000 in the aggregate |
| Tax Services | |
| U.S. federal, state and local and international tax planning and advice (e.g., consulting on statutory, regulatory or administrative developments, evaluation of Funds’ tax compliance function, etc.) | up to $25,000 in the aggregate |
| U.S. federal, state and local tax compliance (e.g., excise distribution reviews, etc.) | up to $5,000 per Fund |
| Review of federal, state, local and international income, franchise and other tax returns | up to $5,000 per Fund |
Under the Pre-Approval Policy, the Audit Committee has also pre-approved the services set forth in the table below with respect to the registrant’s investment adviser and other entities controlling, controlled by or under common control with the investment adviser that provide ongoing services to the registrant (the “Control Affiliates”) up to the specified fee limit. This fee limit is based on aggregate fees to the investment adviser and its Control Affiliates.
| Service | Range of Fees |
| Non-Audit Services | |
| Services associated with periodic reports and other documents filed with the SEC and assistance in responding to SEC comment letters | up to $10,000 in the aggregate |
The Pre-Approval Policy requires the registrant’s independent auditors to report to the Audit Committee at each of its regular meetings regarding all services initiated since the last such report was rendered, including those services authorized by the Pre-Approval Policy.
(f) Not applicable.
(g) The aggregate non-audit fees billed by the registrant’s independent auditors for services rendered to the registrant and to its investment adviser and other service providers under common control with the adviser were $24,428,000 and $9,044,000 for the registrant’s fiscal years ended August 31, 2023 and August 31, 2022, respectively.
(h) In connection with its selection of the independent auditors, the registrant’s Audit Committee has considered the independent auditors’ provision of non-audit services to the registrant’s investment adviser and other service providers under common control with the adviser that were not required to be pre-approved pursuant to Rule 2-01(c)(7)(ii) of Regulation S-X. The Audit Committee has determined that the independent auditors’ provision of these services is compatible with maintaining the auditors’ independence.
(i) Not applicable.
(j) Not applicable.
Item 5. Audit Committee of Listed Registrants
Not applicable.
Item 6. Investments
(a) Included as part of report to shareholders filed under Item 1 of this Form N-CSR.
(b) Divestment of securities in accordance with Section 13(c) of the Investment Company Act of 1940.
Not applicable.
Item 7. Disclosure of Proxy Voting Policies and Procedures for Closed-End Management Investment Companies
Not applicable.
Item 8. Portfolio Managers of Closed-End Management Investment Companies
Not applicable.
Item 9. Purchases of Equity Securities by Closed-End Management Investment Companies and Affiliated Purchasers
Not applicable.
Item 10. Submission of Matters to a Vote of Security Holders
Not applicable.
Item 11. Controls and Procedures
The registrant’s principal executive officer and principal financial officers, or persons performing similar functions, have concluded that the registrant’s disclosure controls and procedures (as defined in Rule 30a-3(c) under the Investment Company Act of 1940, as amended (17 CFR 270.30a-3(c))) are effective, as of a date within 90 days of the filing of this report, based on their evaluation of these controls and procedures required by Rule 30a-3(b) under the Investment Company Act of 1940 (17 CFR 270.30a-3(b)) and Rules 13a-15(b) or 15d-15(b) under the Securities Exchange Act of 1934, as amended (17 CFR 240.13a-15(b) or 240.15d-15(b)) and provide reasonable assurance that the information required to be disclosed by the registrant in its reports or statements filed under the Securities Exchange Act of 1934 is recorded, processed, summarized and reported within the time periods specified in the rules and forms of the Securities and Exchange Commission.
There were no significant changes in the registrant’s internal control over financial reporting (as defined in Rule 30a-3(d) under the Investment Company Act of 1940 (17 CFR 270.30a-3(d)) that occurred during the period covered by the report to stockholders included herein that have materially affected, or are reasonably likely to materially affect, the registrant’s internal control over financial reporting.
Item 12. Disclosure of Securities Lending Activities for Closed-End Management Investment Companies
Not applicable.
Item 13. Exhibits
Not applicable.
(2) Certifications of Principal Executive Officer and Principal Financial Officer pursuant to Rule 30a-2 under the Investment Company Act of 1940 are attached hereto as Exhibit 99.CERT.
(3) Written solicitations to purchase securities pursuant to Rule 23c-1 under the Securities Exchange Act of 1934.
Not applicable.
SIGNATURES
Pursuant to the requirements of the Securities Exchange Act of 1934 and the Investment Company Act of 1940, the registrant has duly caused this report to be signed on its behalf, by the undersigned, thereunto duly authorized.
DELAWARE GROUP® STATE TAX-FREE INCOME TRUST
| /s/ SHAWN K. LYTLE | |
| By: | Shawn K. Lytle | |
| Title: | President and Chief Executive Officer |
| Date: | November 3, 2023 | |
Pursuant to the requirements of the Securities Exchange Act of 1934 and the Investment Company Act of 1940, this report has been signed below by the following persons on behalf of the registrant and in the capacities and on the dates indicated.
| /s/ SHAWN K. LYTLE | |
| By: | Shawn K. Lytle | |
| Title: | President and Chief Executive Officer |
| Date: | November 3, 2023 | |
| /s/ RICHARD SALUS | |
| By: | Richard Salus | |
| Title: | Chief Financial Officer | |
| Date: | November 3, 2023 | |