United States
Securities and Exchange Commission
Washington, D.C. 20549
Form N-CSR
Certified Shareholder Report of Registered Management Investment Companies
811-2677
(Investment Company Act File Number)
Federated Municipal Securities Fund, Inc.
_______________________________________________________________
(Exact Name of Registrant as Specified in Charter)
Federated Investors Funds
4000 Ericsson Drive
Warrendale, Pennsylvania 15086-7561
(Address of Principal Executive Offices)
(412) 288-1900
(Registrant's Telephone Number)
John W. McGonigle, Esquire
Federated Investors Tower
1001 Liberty Avenue
Pittsburgh, Pennsylvania 15222-3779
(Name and Address of Agent for Service)
(Notices should be sent to the Agent for Service)
Date of Fiscal Year End: 03/31/2011
Date of Reporting Period: 03/31/2011
Item 1. Reports to Stockholders
Federated Municipal Securities Fund, Inc.Fund Established 1976
ANNUAL SHAREHOLDER REPORTMarch 31, 2011
Class A Shares
Class B Shares
Class C Shares
Class F Shares
FINANCIAL HIGHLIGHTS
SHAREHOLDER EXPENSE EXAMPLE
MANAGEMENT'S DISCUSSION OF FUND PERFORMANCE
PORTFOLIO OF INVESTMENTS SUMMARY TABLE
PORTFOLIO OF INVESTMENTS
STATEMENT OF ASSETS AND LIABILITIES
STATEMENT OF OPERATIONS
STATEMENT OF CHANGES IN NET ASSETS
NOTES TO FINANCIAL STATEMENTS
REPORT OF INDEPENDENT REGISTERED PUBLIC ACCOUNTING FIRM
BOARD OF DIRECTORS AND FUND OFFICERS
EVALUATION AND APPROVAL OF ADVISORY CONTRACT
VOTING PROXIES ON FUND PORTFOLIO SECURITIES
QUARTERLY PORTFOLIO SCHEDULE
Financial Highlights – Class A Shares
(For a Share Outstanding Throughout Each Period)
| Year Ended March 31 | 2011 | 2010 | 2009 | 2008 | 2007 |
| Net Asset Value, Beginning of Period | $9.99 | $9.41 | $10.05 | $10.65 | $10.59 |
| Income From Investment Operations: | | | | | |
| Net investment income 1 | 0.42 | 0.41 | 0.43 | 0.44 | 0.46 |
| Net realized and unrealized gain (loss) on investments, futures contracts and swap contracts | (0.44) | 0.59 | (0.64) | (0.59) | 0.06 |
| TOTAL FROM INVESTMENT OPERATIONS | (0.02) | 1.00 | (0.21) | (0.15) | 0.52 |
| Less Distributions: | | | | | |
| Distributions from net investment income | (0.41) | (0.42) | (0.43) | (0.45) | (0.46) |
| Net Asset Value, End of Period | $9.56 | $9.99 | $9.41 | $10.05 | $10.65 |
| Total Return 2 | (0.24)% | 10.78% | (2.14)% | (1.48)% | 5.05% |
| Ratios to Average Net Assets: | | | | | |
| Net expenses | 0.87% | 0.87% | 0.87% 3 | 0.88% 4 | 1.15% 4 |
| Net investment income | 4.16% | 4.20% | 4.40% | 4.28% | 4.31% |
| Expense waiver/reimbursement 5 | 0.10% | 0.09% | 0.15% | 0.13% | 0.14% |
| Supplemental Data: | | | | | |
| Net assets, end of period (000 omitted) | $438,344 | $511,709 | $396,603 | $431,074 | $436,073 |
| Portfolio turnover | 21% | 23% | 52% | 37% | 23% |
| 1 | Per share numbers have been calculated using the average shares method. |
| 2 | Based on net asset value, which does not reflect the sales charge, redemption fee or contingent deferred sales charge, if applicable. |
| 3 | The net expense ratio is calculated without reduction for expense offset arrangements. The net expense ratio for the year ended March 31, 2009, is 0.87% after taking into account this expense reduction. |
| 4 | Includes interest and trust expenses related to the Fund's participation in certain inverse floater structures of less than 0.01% and 0.30% for the years ended March 31, 2008 and 2007, respectively. |
| 5 | This expense decrease is reflected in both the net expense and net investment income ratios shown above. |
See Notes which are an integral part of the Financial Statements
Annual Shareholder Report1
Financial Highlights – Class B Shares
(For a Share Outstanding Throughout Each Period)
| Year Ended March 31 | 2011 | 2010 | 2009 | 2008 | 2007 |
| Net Asset Value, Beginning of Period | $9.99 | $9.41 | $10.05 | $10.65 | $10.59 |
| Income From Investment Operations: | | | | | |
| Net investment income 1 | 0.33 | 0.33 | 0.34 | 0.35 | 0.36 |
| Net realized and unrealized gain (loss) on investments, futures contracts and swap contracts | (0.43) | 0.58 | (0.64) | (0.60) | 0.07 |
| TOTAL FROM INVESTMENT OPERATIONS | (0.10) | 0.91 | (0.30) | (0.25) | 0.43 |
| Less Distributions: | | | | | |
| Distributions from net investment income | (0.33) | (0.33) | (0.34) | (0.35) | (0.37) |
| Net Asset Value, End of Period | $9.56 | $9.99 | $9.41 | $10.05 | $10.65 |
| Total Return 2 | (1.12)% | 9.81% | (3.01)% | (2.35)% | 4.12% |
| Ratios to Average Net Assets: | | | | | |
| Net expenses | 1.73% | 1.73% | 1.76% 3 | 1.76% 4 | 2.04% 4 |
| Net investment income | 3.31% | 3.35% | 3.52% | 3.39% | 3.42% |
| Expense waiver/reimbursement 5 | 0.00% 6 | 0.00% 6 | 0.01% | 0.00% 6 | 0.00% 6 |
| Supplemental Data: | | | | | |
| Net assets, end of period (000 omitted) | $13,402 | $19,606 | $15,105 | $18,246 | $25,129 |
| Portfolio turnover | 21% | 23% | 52% | 37% | 23% |
| 1 | Per share numbers have been calculated using the average shares method. |
| 2 | Based on net asset value, which does not reflect the sales charge, redemption fee or contingent deferred sales charge, if applicable. |
| 3 | The net expense ratio is calculated without reduction for expense offset arrangements. The net expense ratio for the year ended March 31, 2009, is 1.76% after taking into account this expense reduction. |
| 4 | Includes interest and trust expenses related to the Fund's participation in certain inverse floater structures of less than 0.01% and 0.30% for the years ended March 31, 2008 and 2007, respectively. |
| 5 | This expense decrease is reflected in both the net expense and net investment income ratios shown above. |
| 6 | Represents less than 0.01%. |
See Notes which are an integral part of the Financial Statements
Annual Shareholder Report2
Financial Highlights – Class C Shares
(For a Share Outstanding Throughout Each Period)
| Year Ended March 31 | 2011 | 2010 | 2009 | 2008 | 2007 |
| Net Asset Value, Beginning of Period | $9.99 | $9.41 | $10.05 | $10.65 | $10.59 |
| Income From Investment Operations: | | | | | |
| Net investment income 1 | 0.33 | 0.33 | 0.34 | 0.35 | 0.36 |
| Net realized and unrealized gain (loss) on investments, futures contracts and swap contracts | (0.43) | 0.58 | (0.64) | (0.59) | 0.07 |
| TOTAL FROM INVESTMENT OPERATIONS | (0.10) | 0.91 | (0.30) | (0.24) | 0.43 |
| Less Distributions: | | | | | |
| Distributions from net investment income | (0.33) | (0.33) | (0.34) | (0.36) | (0.37) |
| Net Asset Value, End of Period | $9.56 | $9.99 | $9.41 | $10.05 | $10.65 |
| Total Return 2 | (1.12)% | 9.81% | (3.00)% | (2.34)% | 4.13% |
| Ratios to Average Net Assets: | | | | | |
| Net expenses | 1.73% | 1.73% | 1.76% 3 | 1.75% 4 | 2.03% 4 |
| Net investment income | 3.31% | 3.35% | 3.54% | 3.42% | 3.43% |
| Expense waiver/reimbursement 5 | 0.00% 6 | 0.00% 6 | 0.01% | 0.00% 6 | 0.00% 6 |
| Supplemental Data: | | | | | |
| Net assets, end of period (000 omitted) | $24,635 | $26,570 | $20,376 | $15,434 | $12,510 |
| Portfolio turnover | 21% | 23% | 52% | 37% | 23% |
| 1 | Per share numbers have been calculated using the average shares method. |
| 2 | Based on net asset value, which does not reflect the sales charge, redemption fee or contingent deferred sales charge, if applicable. |
| 3 | The net expense ratio is calculated without reduction for expense offset arrangements. The net expense ratio for the year ended March 31, 2009, is 1.76% after taking into account this expense reduction. |
| 4 | Includes interest and trust expenses related to the Fund's participation in certain inverse floater structures of less than 0.01% and 0.30% for the years ended March 31, 2008 and 2007, respectively. |
| 5 | This expense decrease is reflected in both the net expense and net investment income ratios shown above. |
| 6 | Represents less than 0.01%. |
See Notes which are an integral part of the Financial Statements
Annual Shareholder Report3
Financial Highlights – Class F Shares
(For a Share Outstanding Throughout Each Period)
| Year Ended March 31, | Period
Ended
3/31/2008 1 |
| 2011 | 2010 | 2009 |
| Net Asset Value, Beginning of Period | $9.99 | $9.41 | $10.05 | $10.56 |
| Income From Investment Operations: | | | | |
| Net investment income 2 | 0.42 | 0.41 | 0.43 | 0.37 |
| Net realized and unrealized gain (loss) on investments, futures contracts and swap contracts | (0.44) | 0.59 | (0.64) | (0.51) |
| TOTAL FROM INVESTMENT OPERATIONS | (0.02) | 1.00 | (0.21) | (0.14) |
| Less Distributions: | | | | |
| Distributions from net investment income | (0.41) | (0.42) | (0.43) | (0.37) |
| Net Asset Value, End of Period | $9.56 | $9.99 | $9.41 | $10.05 |
| Total Return 3 | (0.24)% | 10.78% | (2.14)% | (1.33)% |
| Ratios to Average Net Assets: | | | | |
| Net expenses | 0.87% | 0.87% | 0.87% 4 | 0.87% 5 |
| Net investment income | 4.17% | 4.20% | 4.46% | 4.42% 5 |
| Expense waiver/reimbursement 6 | 0.11% | 0.11% | 0.11% | 0.13% 5 |
| Supplemental Data: | | | | |
| Net assets, end of period (000 omitted) | $17,739 | $18,298 | $11,361 | $4,292 |
| Portfolio turnover | 21% | 23% | 52% | 37% 7 |
| 1 | Reflects operations for the period from May 31, 2007 (date of initial investment) to March 31, 2008. |
| 2 | Per share numbers have been calculated using the average shares method. |
| 3 | Based on net asset value, which does not reflect the sales charge, redemption fee or contingent deferred sales charge, if applicable. Total returns for periods of less than one year are not annualized. |
| 4 | The net expense ratio is calculated without reduction for expense offset arrangements. The net expense ratio for the year ended March 31, 2009, is 0.87% after taking into account this expense reduction. |
| 5 | Computed on an annualized basis. |
| 6 | This expense decrease is reflected in both the net expense and net investment income ratios shown above. |
| 7 | Portfolio turnover is calculated at the Fund level. Percentage indicated was calculated for the fiscal year ended March 31, 2008. |
See Notes which are an integral part of the Financial Statements
Annual Shareholder Report4
Shareholder Expense Example (unaudited)
As a shareholder of the Fund, you incur two types of costs: (1) transaction costs, including sales charges (loads) on purchase or redemption payments; and (2) ongoing costs, including management fees and to the extent applicable, distribution (12b-1) fees and/or shareholder services fees and other Fund expenses. This Example is intended to help you to understand your ongoing costs (in dollars) of investing in the Fund and to compare these costs with the ongoing costs of investing in other mutual funds. It is based on an investment of $1,000 invested at the beginning of the period and held for the entire period from October 1, 2010 to March 31, 2011.
ACTUAL EXPENSES
The first section of the table below provides information about actual account values and actual expenses. You may use the information in this section, together with the amount you invested, to estimate the expenses that you incurred over the period. Simply divide your account value by $1,000 (for example, an $8,600 account value divided by $1,000 = 8.6), then multiply the result by the number in the first section under the heading entitled “Expenses Paid During Period” to estimate the expenses attributable to your investment during this period.
HYPOTHETICAL EXAMPLE FOR COMPARISON PURPOSES
The second section of the table below provides information about hypothetical account values and hypothetical expenses based on the Fund's actual expense ratio and an assumed rate of return of 5% per year before expenses, which is not the Fund's actual return. Thus, you should not use the hypothetical account values and expenses to estimate the actual ending account balance or your expenses for the period. Rather, these figures are required to be provided to enable you to compare the ongoing costs of investing in the Fund with other funds. To do so, compare this 5% hypothetical example with the 5% hypothetical examples that appear in the shareholder reports of the other funds.
Annual Shareholder Report
5
Please note that the expenses shown in the table are meant to highlight your ongoing costs only and do not reflect any transaction costs, such as sales charges (loads) on purchase or redemption payments. Therefore, the second section of the table is useful in comparing ongoing costs only, and will not help you determine the relative total costs of owning different funds. In addition, if these transaction costs were included, your costs would have been higher. | Beginning
Account Value
10/1/2010 | Ending
Account Value
3/31/2011 | Expenses Paid
During Period 1 |
| Actual: | | | |
| Class A Shares | $1,000 | $948.00 | $4.23 |
| Class B Shares | $1,000 | $943.80 | $8.43 | | |
| Class C Shares | $1,000 | $943.80 | $8.43 | | |
| Class F Shares | $1,000 | $948.00 | $4.23 | | |
Hypothetical (assuming a 5% return
before expenses): | | | |
| Class A Shares | $1,000 | $1,020.59 | $4.38 |
| Class B Shares | $1,000 | $1,016.26 | $8.75 | | |
| Class C Shares | $1,000 | $1,016.26 | $8.75 | | |
| Class F Shares | $1,000 | $1,020.59 | $4.38 |
| 1 | Expenses are equal to the Fund's annualized net expense ratios, multiplied by the average account value over the period, multiplied by 182/365 (to reflect the one-half-year period). The annualized net expense ratios are as follows: |
| Class A Shares | 0.87% |
| Class B Shares | 1.74% |
| Class C Shares | 1.74% |
| Class F Shares | 0.87% |
Annual Shareholder Report6
Performance data quoted represents past performance which is no guarantee of future results. Investment return and principal value will fluctuate so that an investor's shares, when redeemed, may be worth more or less than their original cost. Mutual fund performance changes over time and current performance may be lower or higher than what is stated. For current to the most recent month-end performance and after-tax returns, visit FederatedInvestors.com or call 1-800-341-7400.
Management's Discussion of Fund Performance (unaudited)
The Fund's total return, based on net asset value, for the 12-month reporting period ended March 31, 2011, was -0.24% for the Fund's Class A Shares and Class F Shares and -1.12% for the Fund's Class B Shares and Class C Shares. The total return of the Fund's benchmark, the S&P/Investortools Municipal Bond Investment Grade Index (SPIMBIGI), 1 a broad-based securities market index, was 1.45% during the same period. The Fund's total return for the most recently completed fiscal year reflected actual cash flows, transaction costs and other expenses, which were not reflected in the total return of the SPIMBIGI.
The Fund's investment strategy focused on: (a) the effective duration of its portfolio (which indicates the portfolio's sensitivity to changes in interest rates); 2 (b) the allocation of the portfolio among securities of similar issuers (referred to as sectors); and (c) the credit rating of portfolio securities. These were the most significant factors affecting the Fund's performance relative to the SPIMBIGI.
| 1 | The Fund's investment adviser has elected to change the Fund's broad-based securities market index to the SPIMBIGI from the Barclays Capital Municipal Bond Index (BCMB). The SPIMBIGI is more representative of the securities in which the Fund invests. The total return of the BCMB was 1.63% for the 12-month reporting period. The SPIMBIGI is the investment-grade component of the S&P/Investortools Municipal Bond Index (Main Index). The Main Index is a broad, comprehensive, market value-weighted index composed of approximately 55,000 bond issues that are exempt from U.S. federal income taxes or subject to the alternative minimum tax (“AMT”). Eligibility criteria for inclusion in the Main Index include, but are not limited to: the bond issuer must be a state (including the Commonwealth of Puerto Rico and U.S. territories) or a local government or a state or local government entity where interest on the bond is exempt from U.S. federal income taxes or subject to the AMT; the bond must be held by a mutual fund for which Standard & Poor's Securities Evaluations, Inc. provides prices; it must be denominated in U.S. dollars and have a minimum par amount of $2 million; and the bond must have a minimum term to maturity and/or call date greater than or equal to one calendar month. The Main Index is rebalanced monthly. The BCMB is an unmanaged market value-weighted index for the long-term, tax-exempt bond market. To be included in the BCMB, bonds must have a minimum credit rating of at least Baa3/BBB-, an outstanding par value of at least $7 million and be issued as part of a transaction of at least $75 million. The bonds must be fixed rate, have an issue date after December 31, 1990, and must be at least one year from their maturity date. The BCMB includes both zero-coupon bonds and bonds subject to the AMT. The SPIMBIGI and BCMB are not adjusted to reflect sales charges, expenses and other fees that the Securities and Exchange Commission (SEC) requires to be reflected in the fund's performance. Unlike the Fund, the SPIMBIGI and BCMB are unmanaged and are not affected by cash flows. It is not possible to invest directly in these indexes. |
| 2 | Bond prices are sensitive to changes in interest rates and a rise in interest rates can cause a decline in their prices. |
Annual Shareholder Report
7
The following discussion will focus on the performance of the Fund's Class A Shares. The -0.24% total return for the Class A Shares for the reporting period consisted of 4.06% of tax-exempt dividends and reinvestments, and -4.30% depreciation in the net asset value of the shares. 3
Market Overview
During the 12-month reporting period economic recovery showed signs of firming, though the expansion was not sufficient to bring about a significant improvement in labor market conditions. Despite further increases in commodity prices, measures of underlying inflation remained subdued, although the markets began to become concerned over the expectations for long run inflation and the ability of the Federal Reserve (Fed) to combat it. The Fed maintained the federal funds rate in a range from 0.00% to 0.25% during the entire reporting period while keeping the “extended period” language concerning the low levels for the federal funds rate within Federal Open Market Committee (FOMC) statements. Activity in the housing market also remained weak in an environment characterized by soft demand and a large inventory of foreclosed or distressed properties. Financial market strains in the euro area (an economic and monetary union of 17 European Union member states that have adopted the euro (€) as their common currency and sole legal tender) continued as the credit rating agencies downgraded the sovereign debt of Ireland and Portugal. This news had some negative crossover effects on the municipal markets as some investors incorrectly linked financial problems in Europe with troubles of states in the United States.
Headlines concerning underfunded municipal pensions, state budget shortfalls and newly elected Republican governors led to an increase in price volatility and risk premiums for tax-exempt municipal bonds. This caused a steepening of the municipal yield curve and a flight to quality towards higher quality State general obligation bonds and highly rated essential service revenue bonds. A steepening yield curve means the yields on longer maturity bonds increased while yields on shorter maturity bonds actually declined. The financial condition of many local governments continued to erode as federal stimuli ended and state governments struggled to balance their budgets. The impact on property tax collections for local governments was felt as a result of the lag between property reassessments and a number of recent years of real estate market declines.
| 3 | Income may be subject to state and local taxes. The investment adviser normally (except as disclosed in the Fund's Prospectus) will invest the Fund's assets entirely in securities whose interest is not subject to the alternative minimum tax for individuals and corporations (AMT), such that, normally, distributions of annual interest income are exempt from the AMT (in addition to the federal regular income tax). However, in certain circumstances (such as, for example, when there is a lack of supply of non-AMT securities or there are advantageous market conditions, or there is a change in law relating to the AMT), to pursue the Fund's investment objective, the Fund's adviser may invest the Fund's assets in securities that may be subject to the AMT. When there is a lack of supply of non-AMT securities and/or other circumstances that exist, such circumstances may result in the fund acquiring AMT securities that are consistent with the Fund's investment objective. These acquisitions may occur in the ordinary course or in connection with fund reorganization transactions (i.e., transactions in which the Fund acquires the portfolio securities of other mutual funds), an issuer bankruptcy or another event or circumstance. In such circumstances, interest from the Fund's investments may be subject to the AMT. |
Annual Shareholder Report
8
Duration 4As determined at the end of the 12-month reporting period, the Fund's dollar-weighted average duration for the reporting period was 6.33 years. Duration management continued to be a significant component of the Fund's investment strategy. The shorter a fund's duration relative to an index, the less its net asset value will react as interest rates change. The Fund adjusted duration relative to the SPIMBIGI several times during the reporting period. Tax-exempt municipal bond yields declined inside of 10 years to maturity and increased for bonds with longer maturities as the yield curve significantly steepened over the period. Bonds with a longer duration underperformed bonds with a shorter duration due to their differences in interest rate volatility. As a result of the Fund's allocation to bonds with longer durations than those included in the SPIMBIGI, duration detracted from Fund performance relative to the SPIMBIGI.
Sector
During the course of the reporting period, the Fund maintained a higher portfolio allocation, relative to the SPIMBIGI, to securities issued by water and sewer projects and single family housing bonds. These allocations helped the Fund's performance due to the narrowing of credit spreads within the essential service revenue bond sectors. The Fund increased its exposure to highly rated general obligation bonds issued by states and this allocation to higher quality municipal debt had a positive performance impact over the period. The Fund also allocated a portion of the portfolio to pre-refunded, tax-exempt municipal bonds (bonds for which the principal and interest payments are secured or guaranteed by cash or U.S. Treasury securities held in an escrow account). The exposure to pre-refunded bonds aided performance due to lower price volatility exhibited by pre-refunded bonds as compared to other sectors. The Fund was also underweight Tobacco Settlement bonds which helped performance, due to the underperformance in this riskier sector.
| 4 | Duration is a measure of a security's price sensitivity to changes in interest rates. Securities with longer durations are more sensitive to changes in interest rates than securities with shorter durations. For purposes of this Management's Discussion of Fund Performance, duration is determined using a third-party analytical system. |
Annual Shareholder Report
9
Credit Quality 5Risk-aversion returned for investors during the reporting period as the financial markets reacted to negative headline risk concerning municipal credit quality. This resulted in underperformance of bonds rated BBB (or unrated bonds of comparable quality) relative to bonds rated in the higher rating categories (or unrated bonds of comparable quality). With the increased credit spreads over the reporting period, and the widening of credit spreads to a lesser extent for AAA and AA rated (or unrated comparable quality) debt, the Fund's overweight, relative to the SPIMBIGI, in BBB-rated (or unrated comparable quality) debt during the 12-month reporting period hurt the Fund's performance, as the yield on BBB-rated (or unrated comparable quality) debt increased to a greater extent than for other investment-grade securities. 6
| 5 | Credit ratings pertain only to the securities in the portfolio and do not protect fund shares against market risk. |
| 6 | Investment-grade securities are securities that are rated at least BBB or unrated securities of a comparable quality. Noninvestment-grade securities are securities that are not rated at least BBB or unrated securities of a comparable quality. Credit ratings are an indication of the risk that a security will default. They do not protect a security from credit risk. Lower-rated bonds typically offer higher yields to help compensate investors for the increased risk associated with them. Among these risks are lower creditworthiness, greater price volatility, more risk to principal and income than with higher-rated securities and increased possibilities of default. |
Annual Shareholder Report10
GROWTH OF A $10,000 INVESTMENT – CLASS A SHARES
The graph below illustrates the hypothetical investment of $10,000 1 in Federated Municipal Securities Fund, Inc. (Class A Shares) (the “Fund”) from March 31, 2001 to March 31, 2011, compared to the S&P/Investortools Municipal Bond Investment Grade Index (SPIMBIGI), Barclays Capital Municipal Bond Index (BCMB), 2 S&P/Investortools Municipal Bond Investment Grade, 3-year plus, Non-AMT (SPIMBIG3) 3 and the Morningstar Municipal National Long Funds Category Average (MNLFCA). 4
| Average Annual Total Returns 5 for the Period Ended 3/31/2011 |
| 1 Year | -4.72% |
| 5 Years | 1.34% |
| 10 Years | 3.01% |
| FMSF | FMSF Class A Shares | BCMB | LGMFA | SPIMBIGI | MNLFCA | SPIMBIG3 |
| 3/31/2001 | 9,550 | 10,000 | 10,000 | 10,000 | 10,000 | 10,000 |
| 3/31/2002 | 9,771 | 10,381 | 10,292 | 10,373 | 10,279 | 10,374 |
| 3/31/2003 | 10,739 | 11,408 | 11,125 | 11,395 | 11,137 | 11,488 |
| 3/31/2004 | 11,263 | 12,077 | 11,760 | 12,094 | 11,760 | 12,249 |
| 3/31/2005 | 11,560 | 12,398 | 12,035 | 12,458 | 12,014 | 12,639 |
| 3/31/2006 | 12,015 | 12,870 | 12,469 | 12,982 | 12,440 | 13,197 |
| 3/31/2007 | 12,622 | 13,569 | 13,084 | 13,705 | 13,047 | 13,962 |
| 3/31/2008 | 12,434 | 13,827 | 12,968 | 13,897 | 12,933 | 14,113 |
| 3/31/2009 | 12,167 | 14,142 | 12,542 | 14,058 | 12,552 | 14,237 |
| 3/31/2010 | 13,479 | 15,512 | 14,170 | 15,531 | 14,206 | 15,892 |
| 3/31/2011 | 13,447 | 15,765 | 14,229 | 15,752 | 14,233 | 16,100 |
41 graphic description end -->
Performance data quoted represents past performance which is no guarantee of future results. Investment return and principal value will fluctuate so that an investor's shares, when redeemed, may be worth more or less than their original cost. Mutual fund performance changes over time and current performance may be lower or higher than what is stated. For current to the most recent month-end performance and after-tax returns, visit FederatedInvestors.com or call 1-800-341-7400. Returns shown do not reflect the deduction of taxes that a shareholder would pay on Fund distributions or the redemption of Fund shares. Mutual funds are not obligations of or guaranteed by any bank and are not federally insured. Total returns shown include the maximum sales charge of 4.50%.
Annual Shareholder Report
11
| 1 | Represents a hypothetical investment of $10,000 in the Fund after deducting the maximum sales charge of 4.50% ($10,000 investment minus $450 sales charge = $9,550). The Fund's performance assumes the reinvestment of all dividends and distributions. The SPIMBIGI, BCMB, SPIMBIG3 and the MNLFCA have been adjusted to reflect reinvestment of dividends on securities in the index and average. |
| 2 | The Fund's investment adviser has elected to change the Fund's broad-based securities market index to the SPIMBIGI from the BCMB. The SPIMBIGI is more representative of the securities in which the Fund invests. The total return of the BCMB was 1.63% for the 12-month reporting period. The SPIMBIGI is the investment-grade component of the S&P/Investortools Municipal Bond Index (Main Index). The Main Index is a broad, comprehensive, market value-weighted index composed of approximately 55,000 bond issues that are exempt from U.S. federal income taxes or subject to the alternative minimum tax (AMT). Eligibility criteria for inclusion in the Main Index include, but are not limited to: the bond issuer must be a state (including the Commonwealth of Puerto Rico and U.S. territories) or a local government or a state or local government entity where interest on the bond is exempt from U.S. federal income taxes or subject to the AMT; the bond must be held by a mutual fund for which Standard & Poor's Securities Evaluations, Inc. provides prices; it must be denominated in U.S. dollars and have a minimum par amount of $2 million; and the bond must have a minimum term to maturity and/or call date greater than or equal to one calendar month. The Main Index is rebalanced monthly. The BCMB is an unmanaged market value-weighted index for the long-term, tax-exempt bond market. To be included in the BCMB, bonds must have a minimum credit rating of at least Baa3/BBB-, an outstanding par value of at least $7 million and be issued as part of a transaction of at least $75 million. The bonds must be fixed rate, have an issue date after December 31, 1990, and must be at least one year from their maturity date. The BCMB includes both zero-coupon bonds and bonds subject to the AMT. The SPIMBIGI and BCMB are not adjusted to reflect sales charges, expenses and other fees that the Securities and Exchange Commission (SEC) requires to be reflected in the fund's performance. Unlike the Fund, the SPIMBIGI and BCMB are unmanaged and are not affected by cash flows. It is not possible to invest directly in these indexes. |
| 3 | The S&P/Investortools Investment Grade, 3-year plus, non-AMT sub-index (SPIMBIG3) represents, the portion of the SPIMBIGI composed solely of bonds with remaining maturities of 3 years or more that are not subject to AMT. The SPIMBIG3 is not adjusted to reflect sales charges, expenses and other fees that the Securities and Exchange Commission (SEC) requires to be reflected in the Fund's performance. Unlike the Fund, the SPIMBIG3 is unmanaged and is not affected by cash flows. It is not possible to invest directly in this index. |
| 4 | Morningstar figures represent the average of the total returns reported by all the mutual funds designated by Morningstar as falling into the respective category indicated. |
| 5 | Total returns quoted reflect all applicable sales charges. |
Annual Shareholder Report12
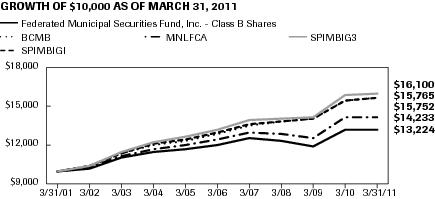
GROWTH OF A $10,000 INVESTMENT – CLASS B SHARES
The graph below illustrates the hypothetical investment of $10,000 1 in Federated Municipal Securities Fund, Inc. (Class B Shares) (the “Fund”) from March 31, 2001 to March 31, 2011, compared to the S&P/Investortools Municipal Bond Investment Grade Index (SPIMBIGI), Barclays Capital Municipal Bond Index (BCMB), 2 S&P/Investortools Municipal Bond Investment Grade, 3-year plus, Non-AMT (SPIMBIG3) 3 and the Morningstar Municipal National Long Funds Category Average (MNLFCA). 4
| Average Annual Total Returns 5 for the Period Ended 3/31/2011 |
| 1 Year | -6.38% |
| 5 Years | 1.03% |
| 10 Years | 2.74% |
| FMSF | FMSF Class B Shares | BCMB | LGMFA | SPIMBIGI | MNLFCA | SPIMBIG3 |
| 3/31/2001 | 10,000 | 10,000 | 10,000 | 10,000 | 10,000 | 10,000 |
| 3/31/2002 | 10,141 | 10,381 | 10,292 | 10,373 | 10,279 | 10,374 |
| 3/31/2003 | 11,048 | 11,408 | 11,125 | 11,395 | 11,137 | 11,488 |
| 3/31/2004 | 11,484 | 12,077 | 11,760 | 12,094 | 11,760 | 12,249 |
| 3/31/2005 | 11,683 | 12,398 | 12,035 | 12,458 | 12,014 | 12,639 |
| 3/31/2006 | 12,034 | 12,870 | 12,469 | 12,982 | 12,440 | 13,197 |
| 3/31/2007 | 12,530 | 13,569 | 13,084 | 13,705 | 13,047 | 13,962 |
| 3/31/2008 | 12,336 | 13,827 | 12,968 | 13,897 | 12,933 | 14,113 |
| 3/31/2009 | 11,965 | 14,142 | 12,542 | 14,058 | 12,552 | 14,237 |
| 3/31/2010 | 13,255 | 15,512 | 14,170 | 15,531 | 14,206 | 15,892 |
| 3/31/2011 | 13,224 | 15,765 | 14,229 | 15,752 | 14,233 | 16,100 |
41 graphic description end -->
Performance data quoted represents past performance which is no guarantee of future results. Investment return and principal value will fluctuate so that an investor's shares, when redeemed, may be worth more or less than their original cost. Mutual fund performance changes over time and current performance may be lower or higher than what is stated. For current to the most recent month-end performance and after-tax returns, visit FederatedInvestors.com or call 1-800-341-7400. Returns shown do not reflect the deduction of taxes that a shareholder would pay on Fund distributions or the redemption of Fund shares. Mutual funds are not obligations of or guaranteed by any bank and are not federally insured. Total returns shown include the maximum contingent deferred sales charge of 5.50% as applicable.
Annual Shareholder Report
13
| 1 | Represents a hypothetical investment of $10,000 in the Fund. The maximum contingent deferred sales charge is 5.50% on any redemption less than one year from the purchase date. The Fund's performance assumes the reinvestment of all dividends and distributions. The SPIMBIGI, BCMB, SPIMBIG3 and the MNLFCA have been adjusted to reflect reinvestment of dividends on securities in the index and average. |
| 2 | The Fund's investment adviser has elected to change the Fund's broad-based securities market index to the SPIMBIGI from the BCMB. The SPIMBIGI is more representative of the securities in which the Fund invests. The total return of the BCMB was 1.63% for the 12-month reporting period. The SPIMBIGI is the investment-grade component of the S&P/Investortools Municipal Bond Index (Main Index). The Main Index is a broad, comprehensive, market value-weighted index composed of approximately 55,000 bond issues that are exempt from U.S. federal income taxes or subject to the alternative minimum tax (AMT). Eligibility criteria for inclusion in the Main Index include, but are not limited to: the bond issuer must be a state (including the Commonwealth of Puerto Rico and U.S. territories) or a local government or a state or local government entity where interest on the bond is exempt from U.S. federal income taxes or subject to the AMT; the bond must be held by a mutual fund for which Standard & Poor's Securities Evaluations, Inc. provides prices; it must be denominated in U.S. dollars and have a minimum par amount of $2 million; and the bond must have a minimum term to maturity and/or call date greater than or equal to one calendar month. The Main Index is rebalanced monthly. The BCMB is an unmanaged market value-weighted index for the long-term, tax-exempt bond market. To be included in the BCMB, bonds must have a minimum credit rating of at least Baa3/BBB-, an outstanding par value of at least $7 million and be issued as part of a transaction of at least $75 million. The bonds must be fixed rate, have an issue date after December 31, 1990, and must be at least one year from their maturity date. The BCMB includes both zero-coupon bonds and bonds subject to the AMT. The SPIMBIGI and BCMB are not adjusted to reflect sales charges, expenses and other fees that the SEC requires to be reflected in the Fund's performance. Unlike the Fund, the SPIMBIGI and BCMB are unmanaged and are not affected by cash flows. It is not possible to invest directly in these indexes. |
| 3 | The SPIMBIG3 represents, the portion of the SPIMBIGI composed solely of bonds with remaining maturities of 3 years or more that are not subject to AMT. The SPIMBIG3 is not adjusted to reflect sales charges, expenses and other fees that the SEC requires to be reflected in the fund's performance. Unlike the Fund, the SPIMBIG3 is unmanaged and is not affected by cash flows. It is not possible to invest directly in this index. |
| 4 | Morningstar figures represent the average of the total returns reported by all the mutual funds designated by Morningstar as falling into the respective category indicated. |
| 5 | Total returns quoted reflect all applicable contingent deferred sales charges. |
Annual Shareholder Report14
GROWTH OF A $10,000 INVESTMENT – CLASS C SHARES
The graph below illustrates the hypothetical investment of $10,000 1 in Federated Municipal Securities Fund, Inc. (Class C Shares) (the “Fund”) from March 31, 2001 to March 31, 2011, compared to the S&P/Investortools Municipal Bond Investment Grade Index (SPIMBIGI), Barclays Capital Municipal Bond Index (BCMB), 2 S&P/Investortools Municipal Bond Investment Grade, 3-year plus, Non-AMT (SPIMBIG3) 3 and the Morningstar Municipal National Long Funds Category Average (MNLFCA). 4
| Average Annual Total Returns 5 for the Period Ended 3/31/2011 |
| 1 Year | -2.08% |
| 5 Years | 1.38% |
| 10 Years | 2.57% |
| FMSF | FMSF Class C Shares | BCMB | LGMFA | SPIMBIGI | MNLFCA | SPIMBIG3 |
| 3/31/2001 | 10,000 | 10,000 | 10,000 | 10,000 | 10,000 | 10,000 |
| 3/31/2002 | 10,141 | 10,381 | 10,292 | 10,373 | 10,279 | 10,374 |
| 3/31/2003 | 11,047 | 11,408 | 11,125 | 11,395 | 11,137 | 11,488 |
| 3/31/2004 | 11,484 | 12,077 | 11,760 | 12,094 | 11,760 | 12,249 |
| 3/31/2005 | 11,682 | 12,398 | 12,035 | 12,458 | 12,014 | 12,639 |
| 3/31/2006 | 12,034 | 12,870 | 12,469 | 12,982 | 12,440 | 13,197 |
| 3/31/2007 | 12,532 | 13,569 | 13,084 | 13,705 | 13,047 | 13,962 |
| 3/31/2008 | 12,238 | 13,827 | 12,968 | 13,897 | 12,933 | 14,113 |
| 3/31/2009 | 11,871 | 14,142 | 12,542 | 14,058 | 12,552 | 14,237 |
| 3/31/2010 | 13,036 | 15,512 | 14,170 | 15,531 | 14,206 | 15,892 |
| 3/31/2011 | 12,890 | 15,765 | 14,229 | 15,752 | 14,233 | 16,100 |
41 graphic description end -->
Performance data quoted represents past performance which is no guarantee of future results. Investment return and principal value will fluctuate so that an investor's shares, when redeemed, may be worth more or less than their original cost. Mutual fund performance changes over time and current performance may be lower or higher than what is stated. For current to the most recent month-end performance and after-tax returns, visit FederatedInvestors.com or call 1-800-341-7400. Returns shown do not reflect the deduction of taxes that a shareholder would pay on Fund distributions or the redemption of Fund shares. Mutual funds are not obligations of or guaranteed by any bank and are not federally insured. Total returns shown include the maximum contingent deferred sales charge of 1.00% as applicable.
Annual Shareholder Report
15
| 1 | Represents a hypothetical investment of $10,000 in the Fund. A 1.00% contingent deferred sales charge would be applied to any redemption less than one year from the purchase date. The Fund's performance assumes the reinvestment of all dividends and distributions. The SPIMBIGI, BCMB, SPIMBIG3 and the MNLFCA have been adjusted to reflect reinvestment of dividends on securities in the index and average. |
| 2 | The Fund's investment adviser has elected to change the Fund's broad-based securities market index to the SPIMBIGI from the BCMB. The SPIMBIGI is more representative of the securities in which the Fund invests. The total return of the BCMB was 1.63% for the 12-month reporting period. The SPIMBIGI is the investment-grade component of the S&P/Investortools Municipal Bond Index (Main Index). The Main Index is a broad, comprehensive, market value-weighted index composed of approximately 55,000 bond issues that are exempt from U.S. federal income taxes or subject to the alternative minimum tax (AMT). Eligibility criteria for inclusion in the Main Index include, but are not limited to: the bond issuer must be a state (including the Commonwealth of Puerto Rico and U.S. territories) or a local government or a state or local government entity where interest on the bond is exempt from U.S. federal income taxes or subject to the AMT; the bond must be held by a mutual fund for which Standard & Poor's Securities Evaluations, Inc. provides prices; it must be denominated in U.S. dollars and have a minimum par amount of $2 million; and the bond must have a minimum term to maturity and/or call date greater than or equal to one calendar month. The Main Index is rebalanced monthly. The BCMB is an unmanaged market value-weighted index for the long-term, tax-exempt bond market. To be included in the BCMB, bonds must have a minimum credit rating of at least Baa3/BBB-, an outstanding par value of at least $7 million and be issued as part of a transaction of at least $75 million. The bonds must be fixed rate, have an issue date after December 31, 1990, and must be at least one year from their maturity date. The BCMB includes both zero-coupon bonds and bonds subject to the AMT. The SPIMBIGI and BCMB are not adjusted to reflect sales charges, expenses and other fees that the SEC requires to be reflected in the Fund's performance. Unlike the Fund, the SPIMBIGI and BCMB are unmanaged and are not affected by cash flows. It is not possible to invest directly in these indexes. |
| 3 | The SPIMBIG3 represents, the portion of the SPIMBIGI composed solely of bonds with remaining maturities of 3 years or more that are not subject to AMT. The SPIMBIG3 is not adjusted to reflect sales charges, expenses and other fees that the SEC requires to be reflected in the fund's performance. Unlike the Fund, the SPIMBIG3 is unmanaged and is not affected by cash flows. It is not possible to invest directly in this index. |
| 4 | Morningstar figures represent the average of the total returns reported by all the mutual funds designated by Morningstar as falling into the respective category indicated. |
| 5 | Total returns quoted reflect all applicable contingent deferred sales charges. |
Annual Shareholder Report16
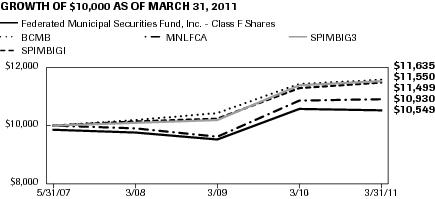
GROWTH OF A $10,000 INVESTMENT – CLASS F SHARES
The graph below illustrates the hypothetical investment of $10,000 1 in Federated Municipal Securities Fund, Inc. (Class F Shares) (the “Fund”) from May 31, 2007 (start of performance) to March 31, 2011, compared to the S&P/Investortools Municipal Bond Investment Grade Index (SPIMBIGI), Barclays Capital Municipal Bond Index (BCMB), 2 S&P/Investortools Municipal Bond Investment Grade, 3-year plus, Non-AMT (SPIMBIG3) 3 and the Morningstar Municipal National Long Funds Category Average (MNLFCA). 4
| Average Annual Total Returns 5 for the Period Ended 3/31/2011 |
| 1 Year | -2.18% |
| Start of Performance (5/31/2007) | 1.21% |
| FMSF | FMSF Class F Shares | BCMB | LGMFA | SPIMBIGI | MNLFCA | SPIMBIG3 |
| 5/31/2007 | 9,900 | 10,000 | 10,000 | 10,000 | 10,000 | 10,000 |
| 9/30/2007 | 9,872 | 10,130 | 10,035 | 10,111 | | 10,109 |
| 12/31/2007 | 9,892 | 10,268 | 10,071 | 10,232 | | 10,233 |
| 3/31/2008 | 9,769 | 10,205 | 9,923 | 10,145 | 9,932 | 10,121 |
| 6/30/2008 | 9,805 | 10,270 | 9,996 | 10,221 | | 10,205 |
| 9/30/2008 | 9,356 | 9,940 | 9,535 | 9,854 | | 9,785 |
| 12/31/2008 | 9,225 | 10,014 | 9,153 | 9,839 | | 9,775 |
| 3/31/2009 | 9,560 | 10,437 | 9,599 | 10,262 | 9,640 | 10,210 |
| 6/30/2009 | 9,840 | 10,657 | 9,964 | 10,530 | | 10,498 |
| 9/30/2009 | 10,617 | 11,416 | 10,826 | 11,324 | | 11,411 |
| 12/31/2009 | 10,468 | 11,307 | 10,684 | 11,202 | | 11,251 |
| 3/31/2010 | 10,589 | 11,449 | 10,832 | 11,338 | 10,910 | 11,400 |
| 6/30/2010 | 10,752 | 11,682 | 11,017 | 11,557 | | 11,645 |
| 9/30/2010 | 11,143 | 12,080 | 11,424 | 11,962 | | 12,118 |
| 12/31/2010 | 10,529 | 11,576 | 10,868 | 11,455 | | 11,511 |
| 3/31/2011 | 10,549 | 11,635 | 10,876 | 11,499 | 10,930 | 11,550 |
41 graphic description end -->
Performance data quoted represents past performance which is no guarantee of future results. Investment return and principal value will fluctuate so that an investor's shares, when redeemed, may be worth more or less than their original cost. Mutual fund performance changes over time and current performance may be lower or higher than what is stated. For current to the most recent month-end performance and after-tax returns, visit FederatedInvestors.com or call 1-800-341-7400. Returns shown do not reflect the deduction of taxes that a shareholder would pay on Fund distributions or the redemption of Fund shares. Mutual funds are not obligations of or guaranteed by any bank and are not federally insured. Total returns shown include the maximum sales charge of 1.00% and the maximum contingent deferred sales charge of 1.00% as applicable.
Annual Shareholder Report
17
| 1 | Represents a hypothetical investment of $10,000 in the Fund after deducting the maximum sales charge of 1.00% ($10,000 investment minus $100 sales charge = $9,900). A 1.00% contingent deferred sales charge would be applied to any redemption less than four years from the purchase date. The Fund's performance assumes the reinvestment of all dividends and distributions. The SPIMBIGI, BCMB, SPIMBIG3 and the MNLFCA have been adjusted to reflect reinvestment of dividends on securities in the index and average. |
| 2 | The Fund's investment adviser has elected to change the Fund's broad-based securities market index to the SPIMBIGI from the BCMB. The SPIMBIGI is more representative of the securities in which the Fund invests. The total return of the BCMB was 1.63% for the 12-month reporting period. The SPIMBIGI is the investment-grade component of the S&P/Investortools Municipal Bond Index (Main Index). The Main Index is a broad, comprehensive, market value-weighted index composed of approximately 55,000 bond issues that are exempt from U.S. federal income taxes or subject to the alternative minimum tax (AMT). Eligibility criteria for inclusion in the Main Index include, but are not limited to: the bond issuer must be a state (including the Commonwealth of Puerto Rico and U.S. territories) or a local government or a state or local government entity where interest on the bond is exempt from U.S. federal income taxes or subject to the AMT; the bond must be held by a mutual fund for which Standard & Poor's Securities Evaluations, Inc. provides prices; it must be denominated in U.S. dollars and have a minimum par amount of $2 million; and the bond must have a minimum term to maturity and/or call date greater than or equal to one calendar month. The Main Index is rebalanced monthly. The BCMB is an unmanaged market value-weighted index for the long-term, tax-exempt bond market. To be included in the BCMB, bonds must have a minimum credit rating of at least Baa3/BBB-, an outstanding par value of at least $7 million and be issued as part of a transaction of at least $75 million. The bonds must be fixed rate, have an issue date after December 31, 1990, and must be at least one year from their maturity date. The BCMB includes both zero-coupon bonds and bonds subject to the AMT. The SPIMBIGI and BCMB are not adjusted to reflect sales charges, expenses and other fees that the SEC requires to be reflected in the fund's performance. Unlike the Fund, the SPIMBIGI and BCMB are unmanaged and are not affected by cash flows. It is not possible to invest directly in these indexes. |
| 3 | The SPIMBIG3 represents, the portion of the SPIMBIGI composed solely of bonds with remaining maturities of 3 years or more that are not subject to AMT. The SPIMBIG3 is not adjusted to reflect sales charges, expenses and other fees that the SEC requires to be reflected in the Fund's performance. Unlike the Fund, the SPIMBIG3 is unmanaged and is not affected by cash flows. It is not possible to invest directly in this index. |
| 4 | Morningstar figures represent the average of the total returns reported by all the mutual funds designated by Morningstar as falling into the respective category indicated. |
| 5 | Total returns quoted reflect all applicable sales charges and contingent deferred sales charges. |
Annual Shareholder Report18
Portfolio of Investments Summary Table (unaudited)
At March 31, 2011, the Fund's sector composition 1 was as follows:
| Sector Composition | Percentage of
Total Net Assets |
| General Obligation — State | 16.0% |
| Hospital | 13.6% |
| Transportation | 11.3% |
| Public Power | 9.5% |
| Water & Sewer | 9.3% |
| General Obligation-Local | 7.4% |
| Education | 6.4% |
| Special Tax | 6.1% |
| Industrial Development Bond/Pollution Control Revenue | 3.9% |
| Single Family Housing | 3.8% |
| Other 2 | 11.7% |
| Other Assets and Liabilities — Net 3 | 1.0% |
| TOTAL | 100.0% |
| 1 | Sector classifications, and the assignment of holdings to such sectors, are based upon the economic sector and/or revenue source of the underlying obligor, as determined by the Fund's Adviser. For securities that have been enhanced by a third party, including bond insurers and banks, sector classifications are based upon the economic sector and/or revenue source of the underlying obligor, as determined by the Fund's Adviser. |
| 2 | For purposes of this table, sector classifications constitute 87.3% of the Fund's total net assets. Remaining sectors have been aggregated under the designation “Other.” |
| 3 | Assets, other than investments in securities, less liabilities. See Statement of Assets and Liabilities. |
Annual Shareholder Report19
Portfolio of Investments
March 31, 2011
Principal
Amount | | | Value |
| | MUNICIPAL BONDS – 98.9% | |
| | Alabama – 0.3% | |
| $1,250,000 | | Selma, AL IDB, Gulf Opportunity Zone Bonds (Series 2010A), 5.80% (International Paper Co.), 5/1/2034 | 1,228,087 |
| | Arizona – 2.6% | |
| 1,000,000 | | Arizona Board of Regents, System Revenue Bonds (Series 2008C), 6.00% (Arizona State University)/(Original Issue
Yield: 6.12%), 7/1/2028 | 1,080,920 |
| 2,000,000 | | Arizona Transportation Board, Transportation Excise Tax Revenue Bonds (Series 2009), 5.00% (Maricopa County, AZ Regional Area Road Fund), 7/1/2023 | 2,140,700 |
| 2,000,000 | | Phoenix, AZ Civic Improvement Corp. — Wastewater System, Senior Lien Wastewater System Revenue Bonds (Series 2008), 5.50%, 7/1/2024 | 2,156,380 |
| 2,000,000 | | Pima County, AZ IDA, Revenue Bonds (Series 2008B), 5.75% (Tucson Electric Power Co.), 9/1/2029 | 1,970,660 |
| 4,000,000 | | Salt River Project, AZ Agricultural Improvement & Power District, Electric System Revenue Bonds (Series 2009A), 5.00% (Original Issue Yield: 5.03%), 1/1/2034 | 3,994,280 |
| 1,810,000 | | Show Low, AZ IDA, Hospital Revenue Bonds , 5.00% (Navapache Regional Medical Center)/(Radian Asset Assurance, Inc. INS), 12/1/2030 | 1,576,094 |
| | TOTAL | 12,919,034 |
| | Arkansas – 0.2% | |
| 1,000,000 | | Jefferson County, AR, Hospital Revenue Improvement and Refunding Bonds (Series 2001), 5.80% (Jefferson Regional Medical Center, AR)/(Original Issue Yield: 5.90%), 6/1/2021 | 1,001,820 |
| | California – 13.9% | |
| 500,000 | | ABAG Finance Authority for Non-Profit Corporations, CA, Revenue Bonds, 6.125% (Southern California Presbyterian Homes)/(Original Issue Yield: 6.25%), 11/15/2032 | 451,055 |
| 500,000 | | Anaheim, CA Public Financing Authority, Lease Revenue Bonds (Series 1997C), 6.00% (Anaheim Public Improvements Project)/(Assured Guaranty Municipal Corp. INS), 9/1/2016 | 552,515 |
| 1,000,000 | | Anaheim, CA Public Financing Authority, Revenue Bonds (Series 2009-A), 5.00% (Anaheim, CA Electric System), 10/1/2027 | 1,007,210 |
| 3,000,000 | | Bay Area Toll Authority, CA, San Francisco Bay Area Subordinate Toll Bridge Revenue Bonds (Series 2010 S-2), 5.00%, 10/1/2042 | 2,607,990 |
| 1,000,000 | | Bay Area Toll Authority, CA, San Francisco Bay Area Toll Bridge Revenue Bonds (Series 2009F-1), 5.625%, 4/1/2044 | 1,014,460 |
| 550,000 | | Blythe, CA Financing Authority, Sewer Revenue Bonds (Series 1998), 5.75%, 4/1/2028 | 460,224 |
Annual Shareholder Report20
Principal
Amount | | | Value |
| $1,000,000 | | California Educational Facilities Authority, Revenue Bonds (Series 2005A), 5.00% (Pomona College), 7/1/2045 | 958,840 |
| 425,000 | | California Health Facilities Financing Authority, Health Facility Revenue Bonds (Series 2004I), 4.95% TOBs (Catholic Healthcare West), Mandatory Tender 7/1/2014 | 455,094 |
| 1,000,000 | | California Health Facilities Financing Authority, Revenue Bonds (Series 1998), 5.40% (Northern California Presbyterian Homes, Inc.)/(Original Issue Yield: 5.417%), 7/1/2028 | 901,180 |
| 500,000 | | California Infrastructure & Economic Development Bank, Revenue Bonds (Series 2000A), 5.75% (Scripps Research Institute)/(Original Issue Yield: 5.85%), 7/1/2030 | 500,030 |
| 1,000,000 | | California Infrastructure & Economic Development Bank, Revenue Bonds (Series 2001B), 5.50% (Kaiser Permanente), 8/1/2031 | 940,510 |
| 1,000,000 | | California Infrastructure & Economic Development Bank, Revenue Bonds (Series 2008), 5.25% (Walt Disney Family Museum)/(Original Issue Yield: 5.50%), 2/1/2038 | 939,750 |
| 1,000,000 | | California State Department of Water Resources, Water System Revenue Bonds (Series 2008AE), 5.00% (Central Valley Project), 12/1/2029 | 1,033,990 |
| 950,000 | | California State Public Works Board, Lease Revenue Bonds (Series 2007B), 4.75% (California Community Colleges)/(National Public Finance Guarantee Corporation INS), 3/1/2032 | 792,651 |
| 2,000,000 | | California State, Various Purpose GO Bonds, 6.00%, 11/1/2039 | 2,045,620 |
| 3,500,000 | | California State, Various Purpose UT GO Bonds (Series 2010, 5.25% (Original Issue Yield: 5.50%), 11/1/2040 | 3,224,445 |
| 4,000,000 | | California State, Various Purpose UT GO Bonds, 5.75% (Original Issue Yield: 5.85%), 4/1/2029 | 4,137,200 |
| 1,000,000 | | California State, Various Purpose UT GO Bonds, 6.50%, 4/1/2033 | 1,072,710 |
| 1,000,000 | | California Statewide CDA, COP, 5.50% (Sutter Health)/
(Assured Guaranty Municipal Corp. INS)/(Original Issue
Yield: 5.77%), 8/15/2018 | 1,003,390 |
| 1,000,000 | | California Statewide CDA, Revenue Bonds (Series 2005A), 5.25% (Daughters of Charity Health System), 7/1/2035 | 764,720 |
| 810,000 | | California Statewide CDA, Revenue Bonds, 5.75% (Los Angeles Orthopedic Hospital Foundation)/(AMBAC Assurance Corporation INS), 6/1/2030 | 749,720 |
| 1,000,000 | | Eastern Municipal Water District of Riverside County, CA, Water & Sewer Revenue Fixed Rate COP (Series 2008H), 5.00% (Original Issue Yield: 5.11%), 7/1/2033 | 952,210 |
| 1,000,000 | | El Centro, CA Financing Authority, INS Hospital Revenue Bonds (Series 2001), 5.25% (El Centro Regional Medical Center)/(California Mortgage Insurance GTD)/(Original Issue Yield: 5.32%), 3/1/2018 | 1,000,680 |
| 1,000,000 | | Foothill/Eastern Transportation Corridor Agency, CA, Toll Road Refunding Revenue Bonds , 5.75% (Original Issue
Yield: 5.774%), 1/15/2040 | 827,370 |
Annual Shareholder Report21
Principal
Amount | | | Value |
| $1,000,000 | | Fresno, CA Joint Powers Financing Authority, Lease Revenue Bonds (Series 2008C), 5.00% (Assured Guaranty Corp. INS), 4/1/2038 | 906,670 |
| 1,800,000 | | Golden State Tobacco Securitization Corp., CA, Tobacco Settlement Asset-Backed Bonds (Series 2007A-1), 5.75%, 6/1/2047 | 1,196,748 |
| 1,000,000 | | Long Beach, CA Bond Financing Authority, Plaza Parking Facility Lease Revenue Bonds, 5.25% (Original Issue Yield: 5.54%), 11/1/2021 | 1,004,650 |
| 1,000,000 | | Long Beach, CA USD, UT GO Bonds (Series 2008A), 5.75%, 8/1/2033 | 1,046,090 |
| 5,000,000 | | Los Angeles, CA Department of Airports, Senior Revenue Bonds (Series 2010D), 5.25%, 5/15/2026 | 5,194,300 |
| 1,000,000 | | Los Angeles, CA Department of Water & Power, Power System Revenue Bonds (Series 2009A), 5.00% (Original Issue
Yield: 5.07%), 7/1/2034 | 965,270 |
| 1,000,000 | | Los Angeles, CA Department of Water & Power, Power System Revenue Bonds (Series 2009A), 5.00% (Original Issue
Yield: 5.10%), 7/1/2039 | 936,790 |
| 2,000,000 | | Los Angeles, CA USD, UT GO Bonds (Series 2009D), 5.20%, 7/1/2029 | 2,005,160 |
| 1,000,000 | | Los Angeles, CA Wastewater System, Refunding Revenue Bonds (Series 2009A), 5.75%, 6/1/2034 | 1,055,330 |
| 1,000,000 | | Metropolitan Water District of Southern California, Water Revenue Refunding Bonds (Series 2009C), 5.00%, 7/1/2031 | 1,018,190 |
| 500,000 | | Perris, CA Public Financing Authority, Tax Allocation Revenue Bonds (Series 2001A), 5.75% (Original Issue Yield: 5.85%), 10/1/2031 | 477,805 |
| 1,950,000 | | Poway, CA USD, Special Tax Bonds (Series 2005), 5.125%
(Community Facilities District No. 6 (4S Ranch))/(Original Issue
Yield: 5.21%), 9/1/2035 | 1,543,991 |
| 6,000,000 | | Regents of the University of California Medical Center, Pooled Revenue Bonds (Series 2008D), 5.00%, 5/15/2024 | 6,140,940 |
| 1,000,000 | | Regents of University of California, General Revenue Bonds (Series 2009O), 5.75%, 5/15/2034 | 1,046,780 |
| 1,260,000 | | Regents of University of California, Revenue Bonds (Series A), 5.125% (AMBAC Assurance Corporation INS), 5/15/2020 | 1,340,161 |
| 240,000 | | Regents of University of California, Revenue Bonds (Series A), 5.125% (United States Treasury PRF 5/15/2013@100), 5/15/2020 | 261,398 |
| 3,000,000 | | Roseville, CA Natural Gas Financing Authority, Gas Revenue Bonds, 5.00% (Merrill Lynch & Co., Inc. GTD), 2/15/2025 | 2,730,000 |
| 1,500,000 | | Sacramento County, CA Airport System, Airport System Senior Revenue Bonds (Series 2009B), 5.50% (Assured Guaranty Corp. INS)/(Original Issue Yield: 5.60%), 7/1/2034 | 1,482,405 |
| 1,000,000 | | San Bernardino County, CA Housing Authority, Multifamily Mortgage Revenue Bonds (Series 2001A), 6.70% (Glen Aire Park)/(GNMA COL Home Mortgage Program GTD), 12/20/2041 | 1,053,640 |
| 349,000 | | San Bernardino County, CA Housing Authority, Subordinated Revenue Bonds, 7.25% (Glen Aire Park & Pacific Palms), 4/15/2042 | 167,255 |
Annual Shareholder Report22
Principal
Amount | | | Value |
| $1,000,000 | | San Diego County, CA, COP, 5.25% (University of San Diego)/(Original Issue Yield: 5.47%), 10/1/2021 | 998,400 |
| 200,000 | | San Francisco, CA City & County Airport Commission, Revenue Refunding Bonds (Issue 34D), 5.25% (Assured Guaranty Corp. INS), 5/1/2025 | 205,946 |
| 1,000,000 | | Santa Barbara CCD, CA, UT GO Bonds (Series 2008A), 5.25%, 8/1/2028 | 1,028,720 |
| 3,000,000 | | Southern California Public Power Authority (Southern Transmission System), Transmission Project Revenue Bonds (2009 Subordinate Refunding Series A), 5.00%, 7/1/2023 | 3,131,940 |
| 400,000 | | Stockton, CA Community Facilities District No. 2001-1, Special Tax Revenue Bonds, 6.375% (Spanos Park West)/(United States Treasury PRF 9/1/2012@102)/(Original Issue Yield: 6.43%), 9/1/2032 | 440,020 |
| 1,000,000 | | Torrance, CA Hospital Revenue Bonds, (Series 2001 A), 5.50% (Torrance Memorial Medical Center)/(Original Issue
Yield: 5.65%), 6/1/2031 | 934,120 |
| 1,000,000 | | Trustees of the California State University, Systemwide Revenue Bonds (Series 2009A), 6.00%, 11/1/2040 | 1,023,710 |
| 1,000,000 | | Vista, CA Community Development Commission, Tax Allocation Bonds (Series 2001), 5.80% (Vista Redevelopment Project Area)/(Original Issue Yield: 5.85%), 9/1/2030 | 905,980 |
| | TOTAL | 68,635,973 |
| | Colorado – 0.6% | |
| 710,000 | | Colorado Health Facilities Authority, Health Facilities Revenue Bonds (Series 2004A), 5.25% (Evangelical Lutheran Good Samaritan Society)/(Original Issue Yield: 5.48%), 6/1/2034 | 635,592 |
| 710,000 | | Colorado Health Facilities Authority, Health Facilities Revenue Bonds (Series 2005), 5.25% (Evangelical Lutheran Good Samaritan Society), 6/1/2023 | 711,853 |
| 1,175,000 | | Colorado State Higher Education Capital Construction Lease Purchase Financing Program, COP (Series 2008), 5.50% (Original Issue
Yield: 5.60%), 11/1/2027 | 1,214,644 |
| 415,000 | | Colorado State Higher Education Capital Construction Lease Purchase Financing Program, COP (Series 2008), 5.50% (United States Treasury PRF 11/1/2018@100)/(Original Issue Yield: 5.60%), 11/1/2027 | 496,581 |
| | TOTAL | 3,058,670 |
| | Connecticut – 0.9% | |
| 4,000,000 | | Connecticut State, Refunding UT GO Bonds (Series 2010C), 5.00%, 12/1/2019 | 4,539,720 |
| | Delaware – 0.5% | |
| 2,380,000 | | Delaware EDA, Gas Facilities Refunding Bonds, 5.40% (Delmarva Power and Light Co.), 2/1/2031 | 2,284,705 |
Annual Shareholder Report23
Principal
Amount | | | Value |
| | District of Columbia – 0.6% | |
| $3,000,000 | | District of Columbia Hospital Authority, Hospital Revenue Bonds (Series 2008), 5.25% (Children's Hospital Obligated Group)/(Assured Guaranty Corp. INS)/(Original Issue Yield: 5.45%), 7/15/2038 | 2,775,000 |
| | Florida – 3.6% | |
| 1,445,000 | | Broward County, FL Airport System, Airport System Revenue Refunding Bonds (Series 2009O), 5.375% (Original Issue
Yield: 5.48%), 10/1/2029 | 1,446,459 |
| 2,645,000 | | Florida State Board of Education Administration, UT GO Capital Outlay Bonds, 9.125% (Florida State)/(Original Issue
Yield: 9.173%), 6/1/2014 | 2,864,403 |
| 5,000,000 | | Miami-Dade County, FL Aviation, Revenue Bonds (Series 2008B), 5.00% (Assured Guaranty Corp. INS), 10/1/2028 | 5,003,100 |
| 1,250,000 | | Miami-Dade County, FL Expressway Authority, Toll System Revenue Bonds (Series 2010), 5.00% (Original Issue Yield: 5.10%), 7/1/2040 | 1,114,675 |
| 5,000,000 | | Orlando & Orange County Expressway Authority, FL, Revenue Bonds (Series 2010A), 5.00%, 7/1/2035 | 4,598,000 |
| 1,000,000 | | Orlando, FL Utilities Commission, System Revenue Refunding Bonds (Series 2009B), 5.00%, 10/1/2033 | 1,000,000 |
| 2,000,000 | | St. Johns County, FL IDA, Revenue Bonds (Series 2010A), 5.875% (Presbyterian Retirement Communities)/(Original Issue
Yield: 5.98%), 8/1/2040 | 1,756,860 |
| | TOTAL | 17,783,497 |
| | Georgia – 3.4% | |
| 5,000,000 | | Athens-Clarke County, GA Water & Sewerage, Revenue Bonds (Series 2008), 5.625% (Original Issue Yield: 5.78%), 1/1/2033 | 5,191,800 |
| 2,190,000 | | Atlanta, GA Airport General Revenue, Airport General Revenue Bonds (Series 2010A), 5.00%, 1/1/2035 | 2,007,617 |
| 2,000,000 | | Atlanta, GA Water & Wastewater, Revenue Bonds (Series 2009A), 6.00%, 11/1/2019 | 2,282,800 |
| 2,000,000 | | Burke County, GA Development Authority, PCRBs (Series 2008A), 5.50% (Oglethorpe Power Corp.), 1/1/2033 | 2,007,640 |
| 1,000,000 | | Georgia State, UT GO Bonds (Series 2009B), 5.00%, 1/1/2026 | 1,072,210 |
| 1,000,000 | | Municipal Electric Authority of Georgia, Project One Subordinated Bonds (Series 2008A), 5.25%, 1/1/2021 | 1,095,810 |
| 3,000,000 | | Municipal Electric Authority of Georgia, Project One Subordinated Bonds (Series 2008D), 5.50% (Original Issue Yield: 5.80%), 1/1/2026 | 3,134,520 |
| | TOTAL | 16,792,397 |
| | Hawaii – 0.4% | |
| 2,000,000 | | Hawaii State, UT GO Bonds (Series 2006D1), 5.00% (Assured Guaranty Municipal Corp. INS), 3/1/2025 | 2,089,860 |
Annual Shareholder Report24
Principal
Amount | | | Value |
| | Illinois – 4.2% | |
| $3,000,000 | | Chicago, IL Water Revenue, Second Lien Water Refunding Revenue Bonds (Series 2008), 5.00% (Assured Guaranty Municipal Corp. INS), 11/1/2028 | 2,961,870 |
| 1,000,000 | | Illinois Finance Authority, Recovery Zone Facility Revenue Bonds (Series 2010), 6.50% (Navistar International Corp.), 10/15/2040 | 992,300 |
| 2,145,000 | | Illinois Finance Authority, Revenue Refunding Bonds (Series 2007), 5.00% (Loyola University of Chicago), 7/1/2022 | 2,172,392 |
| 4,000,000 | | Illinois State Toll Highway Authority, Toll Highway Senior Refunding Revenue Bonds (Series 2010 A-1), 5.25%, 1/1/2030 | 3,952,680 |
| 5,000,000 | | Illinois State, GO Refunding Bonds (Series February 2010), 5.00%, 1/1/2024 | 4,772,600 |
| 2,250,000 | | Illinois State, UT GO Bonds (Series 2006), 5.00%, 1/1/2027 | 2,100,802 |
| 450,000 | | Illinois State, UT GO Bonds, 5.25%, (National Public Finance Guarantee Corporation INS), 10/1/2018 | 454,765 |
| 1,500,000 | | Metropolitan Pier & Exposition Authority, IL, McCormick Place Expansion Project Bonds (Series 2010A), 5.50%, 6/15/2050 | 1,347,960 |
| 1,200,000 | | Railsplitter Tobacco Settlement Authority, IL , Tobacco
Settlement Revenue Bonds (Series 2010), 6.00% (Original Issue
Yield: 6.10%), 6/1/2028 | 1,159,992 |
| 400,000 | | University of Illinois, COP (Series A), 5.50% (United States Treasury PRF 8/15/2011@100), 8/15/2017 | 407,548 |
| 175,000 | | University of Illinois, COP (Series B), 5.25% (United States Treasury PRF 8/15/2011@100), 8/15/2021 | 178,140 |
| | TOTAL | 20,501,049 |
| | Indiana – 3.5% | |
| 1,000,000 | | Indiana Development Finance Authority, Environmental Improvement Revenue Bonds, 5.25% TOBs (Marathon Oil Corp.) Mandatory Tender 12/2/2011 | 1,033,210 |
| 2,200,000 | | Indiana Health Facility Financing Authority, Revenue Bonds (Series 2004A), 5.375% (Deaconess Hospital)/(AMBAC Assurance Corporation INS), 3/1/2029 | 2,154,086 |
| 1,005,000 | | Indiana Municipal Power Agency, Revenue Bonds (Series B), 5.25%, (National Public Finance Guarantee Corporation INS), 1/1/2018 | 1,059,079 |
| 1,500,000 | | Indiana State Finance Authority (Environmental Improvement Bonds), Revenue Refunding Bonds (Series 2010), 6.00% (United States Steel Corp.), 12/1/2026 | 1,453,845 |
| 1,500,000 | | Indiana State Office Building Commission Capitol Complex, Revenue Bonds (Series 1990A: Senate Avenue Parking Facility), 7.40% (National Public Finance Guarantee Corporation INS)/(Original Issue Yield: 7.488%), 7/1/2015 | 1,736,790 |
| 4,000,000 | | Indianapolis, IN Gas Utility Distribution System, Second Lien Revenue Refunding Bonds (Series 2008C), 5.25% (Assured Guaranty Corp. INS), 6/1/2019 | 4,373,480 |
Annual Shareholder Report25
Principal
Amount | | | Value |
| $2,000,000 | | St. Joseph County, IN Hospital Authority, Health Facilities Revenue Bonds (Series 2005), 5.375% (Madison Center Obligated Group), 2/15/2034 | 520,200 |
| 500,000 | | Westfield Washington, IN Schools, Revenue Bonds, 5.50% (United States Treasury PRF 7/15/2011@100), 1/15/2022 | 507,130 |
| 4,000,000 | | Whiting, IN Environmental Facilities, Revenue Bonds (Series 2009), 5.00% (BP PLC), 1/1/2016 | 4,333,080 |
| | TOTAL | 17,170,900 |
| | Kansas – 0.2% | |
| 1,010,000 | | Kansas State Development Finance Authority, Health Facilities Revenue Bonds (Series 2007L), 5.125% (Stormont-Vail HealthCare, Inc.)/(National Public Finance Guarantee Corporation INS), 11/15/2032 | 973,509 |
| | Kentucky – 1.3% | |
| 3,000,000 | | Kentucky Turnpike Authority, Economic Development Road Revenue Bonds (Series 2008A), 5.00%, 7/1/2023 | 3,128,460 |
| 4,000,000 | | Louisville & Jefferson County, KY Metropolitan Government, Health System Revenue Bonds (Series 2006), 5.25% (Norton Healthcare, Inc.), 10/1/2036 | 3,461,360 |
| | TOTAL | 6,589,820 |
| | Maryland – 0.2% | |
| 1,060,000 | | Maryland State Economic Development Corp., Port Facilities Refunding Revenue Bonds (Series 2010), 5.75% (CONSOL Energy, Inc.), 9/1/2025 | 986,542 |
| | Massachusetts – 5.2% | |
| 4,000,000 | | Massachusetts Bay Transportation Authority General Transportation System, Assessment Bonds (Series 2008A), 5.25%, 7/1/2034 | 4,103,880 |
| 2,300,000 | | Massachusetts Bay Transportation Authority Sales Tax Revenue, Revenue Bonds (Series 2006B), 5.25%, 7/1/2018 | 2,674,854 |
| 4,330,000 | | Massachusetts Department of Transportation, Metropolitan Highway System Revenue Bonds (Series 2010B), 5.00%, 1/1/2032 | 4,188,496 |
| 3,000,000 | | Massachusetts Development Finance Agency, Revenue Bonds (Series 2010B-2), 5.00% (Harvard University), 10/15/2020 | 3,462,180 |
| 1,000,000 | | Massachusetts HEFA, Revenue Bonds (Series 2002D), 6.50% (Milford Regional Medical Center)/(United States Treasury PRF 7/15/2012@101), 7/15/2023 | 1,083,760 |
| 5,000,000 | | Massachusetts State HFA, Single Family Housing Mortgage Revenue Bonds (Series 147), 4.60%, 12/1/2025 | 4,874,200 |
| 5,000,000 | | Massachusetts Water Resources Authority, General Revenue Refunding Bonds (Series 2010B), 5.00%, 8/1/2027 | 5,294,050 |
| | TOTAL | 25,681,420 |
Annual Shareholder Report26
Principal
Amount | | | Value |
| | Michigan – 1.6% | |
| $1,500,000 | | Michigan State Hospital Finance Authority, Hospital Revenue Bonds (Series 2002A) , 6.00% (Oakwood Obligated Group), 4/1/2022 | 1,521,525 |
| 1,000,000 | | Michigan State Hospital Finance Authority, Refunding Revenue Bonds (Series 2002A), 5.50% (Crittenton Hospital Medical Center)/(Original Issue Yield: 5.67%), 3/1/2022 | 1,000,610 |
| 2,470,000 | | Michigan State Housing Development Authority, SFM Revenue Bonds (Series 2009A), 5.35%, 6/1/2022 | 2,507,174 |
| 2,900,000 | | Michigan State Strategic Fund, Revenue Refunding PCRBs (Series C), 5.45% (Detroit Edison Co.), 9/1/2029 | 2,900,058 |
| | TOTAL | 7,929,367 |
| | Minnesota – 0.2% | |
| 1,000,000 | | University of Minnesota, GO Bonds (Series 2011A), 5.25%, 12/1/2030 | 1,075,250 |
| | Mississippi – 1.7% | |
| 8,000,000 | | Mississippi State, UT GO Bonds (Series 2007B), 5.00%, 12/1/2024 | 8,431,120 |
| | Missouri – 0.2% | |
| 1,335,000 | | Missouri Development Finance Board, Infrastructure Facilities Revenue Bonds (Series 2005A), 5.00% (Branson, MO), 6/1/2035 | 1,171,876 |
| | Nebraska – 0.1% | |
| 625,000 | | Nebraska Investment Finance Authority, Single Family Housing Revenue Bonds (Series 2010A), 5.70%, 9/1/2031 | 656,075 |
| | Nevada – 0.9% | |
| 3,000,000 | | Clark County, NV School District, LT GO Building Bonds (Series 2008A), 5.00%, 6/15/2025 | 3,003,360 |
| 1,000,000 | | Henderson, NV, Health Facility Revenue Bonds (Series 2004A), 5.625% (Catholic Healthcare West)/(Original Issue Yield: 5.72%), 7/1/2024 | 1,008,600 |
| 235,000 | | Henderson, NV, LID No. T-16 LT Obligation Improvement Bonds , 5.10% (Falls at Lake Las Vegas LID No. T-16)/(Original Issue
Yield: 5.15%), 3/1/2022 | 117,422 |
| 585,000 | | Henderson, NV, LID No. T-16 LT Obligation Improvement Bonds , 5.125% (Falls at Lake Las Vegas LID No. T-16)/(Original Issue
Yield: 5.20%), 3/1/2025 | 288,259 |
| | TOTAL | 4,417,641 |
| | New Hampshire – 0.3% | |
| 1,685,000 | | New Hampshire Higher Educational & Health Facilities Authority, Healthcare System Revenue Bonds (Series 2004), 5.375% (Covenant Health Systems)/(Original Issue Yield: 5.50%), 7/1/2024 | 1,658,984 |
| | New Jersey – 0.4% | |
| 2,000,000 | | New Jersey Turnpike Authority, Revenue Bonds (Series 2009H), 5.00% (Original Issue Yield: 5.069%), 1/1/2036 | 1,893,920 |
Annual Shareholder Report27
Principal
Amount | | | Value |
| | New Mexico – 0.4% | |
| $2,000,000 | | Albuquerque Bernalillo County, NM Water Utility Authority, Joint Water & Sewer System Improvement Revenue Bonds (Series 2009A-1), 5.25% (Original Issue Yield: 5.34%), 7/1/2034 | 2,059,200 |
| | New York – 9.3% | |
| 3,220,000 | | Chautauqua County, NY IDA, Exempt Facility Revenue Bonds (Series 2009), 5.875% (NRG Energy, Inc.), 4/1/2042 | 2,977,502 |
| 2,000,000 | | Hempstead (town), NY IDA, Civic Facility Revenue Bonds , 5.25% (Hofstra University), 7/1/2018 | 2,129,940 |
| 4,000,000 | | New York City, NY IDA, CPI PILOT Revenue Bonds (Series 2006), 2.452% (Yankee Stadium LLC)/(FGIC INS), 3/1/2021 | 2,976,360 |
| 3,970,000 | | New York City, NY Municipal Water Finance Authority, Water & Sewer System Revenue Bonds (Fiscal 2002 Series A), 5.00%, 6/15/2032 | 3,969,643 |
| 3,000,000 | | New York City, NY Municipal Water Finance Authority, Water & Sewer System Revenue Bonds (Fiscal 2005 Series C), 5.00%, 6/15/2030 | 3,023,520 |
| 4,000,000 | | New York City, NY TFA, Building Aid Revenue Bonds (Fiscal 2009 S-1), 5.50% (TFA State/School Building Aid)/(Original Issue
Yield: 5.60%), 7/15/2028 | 4,220,520 |
| 2,725,000 | | New York City, NY TFA, Future Tax Secured Subordinate Bonds (Series 2011C), 5.50%, 11/1/2035 | 2,846,617 |
| 3,570,000 | | New York City, NY, UT GO Bonds (Series 2009E), 5.00%, 8/1/2026 | 3,690,166 |
| 5,000,000 | | New York City, NY, UT GO Bonds (Series 2009I-1), 5.375% (Original Issue Yield: 5.55%), 4/1/2036 | 5,059,950 |
| 1,060,000 | | New York State Dormitory Authority, Revenue Bonds (Series 2007B), 5.25% (Health Quest Systems, Inc. Obligated Group)/(Assured Guaranty Corp. INS), 7/1/2027 | 1,066,074 |
| 2,000,000 | | New York State Dormitory Authority, Revenue Bonds (Series 2008A), 5.00% (New York State Personal Income Tax Revenue Bond Fund), 3/15/2028 | 2,059,120 |
| 2,500,000 | | New York State Thruway Authority, Revenue Bonds (Series 2007A), 5.25% (New York State Personal Income Tax Revenue Bond Fund), 3/15/2026 | 2,636,925 |
| 3,000,000 | | New York State, UT GO Bonds (Series 2011A), 5.00%, 2/15/2020 | 3,390,870 |
| 1,985,000 | | Suffolk County, NY Water Authority, Water System Revenue Bonds (Series 1994), 6.00% (National Public Finance Guarantee Corporation INS), 6/1/2014 | 2,165,178 |
| 4,000,000 | | Triborough Bridge & Tunnel Authority, NY, General Revenue Bonds (Series 2008A), 5.00% (Original Issue Yield: 5.10%), 11/15/2037 | 3,879,520 |
| | TOTAL | 46,091,905 |
| | North Carolina – 7.4% | |
| 2,000,000 | | Cape Fear Public Utility Authority, NC, Water & Sewer System Revenue Bonds (Series 2008), 5.00%, 8/1/2028 | 2,059,240 |
| 1,000,000 | | Charlotte, NC Water & Sewer System, Water & Sewer Revenue Bonds (Series 2008), 5.00%, 7/1/2028 | 1,049,490 |
Annual Shareholder Report28
Principal
Amount | | | Value |
| $1,000,000 | | Charlotte, NC Water & Sewer System, Water & Sewer Revenue Bonds (Series 2009), 5.25%, 7/1/2030 | 1,066,040 |
| 500,000 | | Charlotte-Mecklenburg Hospital Authority, NC, Health Care
Revenue & Refunding Bonds (Series 2007A), 5.00% (Carolinas HealthCare System)/(Original Issue Yield: 5.09%), 1/15/2031 | 479,345 |
| 500,000 | | Charlotte-Mecklenburg Hospital Authority, NC, Health Care Revenue Refunding Bonds (Series 2008A), 5.25% (Carolinas HealthCare System), 1/15/2024 | 521,395 |
| 1,000,000 | | Cumberland County, NC, Refunding COP (Series 2009B), 5.00%, 12/1/2024 | 1,046,460 |
| 500,000 | | Greenville, NC Combined Enterprise System, Revenue Bonds (Series 2008A), 5.00% (Assured Guaranty Municipal Corp. INS), 11/1/2025 | 514,985 |
| 800,000 | | High Point, NC Combined Enterprise System, Revenue Bonds (Series 2008), 5.00% (Assured Guaranty Municipal Corp. INS), 11/1/2028 | 816,664 |
| 500,000 | | Iredell County, NC, COP (Series 2008), 5.125% (Assured Guaranty Municipal Corp. INS)/(Original Issue Yield: 5.13%), 6/1/2027 | 510,940 |
| 1,660,000 | | Johnston Memorial Hospital Authority, NC, FHA INS Mortgage Revenue Bonds (Series 2008), 5.25% (Johnston Memorial Hospital)/(Assured Guaranty Municipal Corp. INS), 10/1/2036 | 1,603,460 |
| 2,000,000 | | North Carolina Capital Facilities Finance Agency, Educational Facilities Revenue Bonds (Series 2009), 5.00% (Wake Forest University), 1/1/2038 | 1,973,700 |
| 5,000,000 | | North Carolina Capital Facilities Finance Agency, Revenue Bonds (Series 2009B), 5.00% (Duke University), 10/1/2038 | 4,970,400 |
| 500,000 | | North Carolina Eastern Municipal Power Agency, Power System Refunding Revenue Bonds (Series 2003C), 5.375% (Original Issue Yield: 5.57%), 1/1/2017 | 525,060 |
| 500,000 | | North Carolina Eastern Municipal Power Agency, Power System Revenue Bonds (Series 2009A), 5.50%, 1/1/2026 | 516,505 |
| 3,915,000 | | North Carolina Eastern Municipal Power Agency, Power System Revenue Bonds (Series 2009C), 5.00%, 1/1/2026 | 3,919,698 |
| 1,500,000 | | North Carolina Medical Care Commission, Health Care Facilities First Mortgage Revenue Bonds (Series 2006A), 5.00% (The Pines at Davidson), 1/1/2036 | 1,261,950 |
| 500,000 | | North Carolina Medical Care Commission, Health Care Facilities First Mortgage Revenue Bonds, 6.25% (Arbor Acres Community)/(United States Treasury PRF 3/1/2012@101)/(Original Issue
Yield: 6.40%), 3/1/2027 | 530,120 |
| 1,000,000 | | North Carolina Medical Care Commission, Health Care Facilities Revenue Bonds (Series 1999), 6.25% (Stanly Memorial Hospital Project)/(Original Issue Yield: 6.40%), 10/1/2019 | 1,000,670 |
| 1,205,000 | | North Carolina Medical Care Commission, Health Care Facilities Revenue Bonds (Series 2004A) , 5.25% (Cleveland Community Healthcare)/(AMBAC Assurance Corporation INS), 7/1/2021 | 1,220,328 |
Annual Shareholder Report29
Principal
Amount | | | Value |
| $1,230,000 | | North Carolina Medical Care Commission, Health Care Facilities Revenue Bonds, 5.50% (Hugh Chatham Memorial Hospital)/(Radian Asset Assurance, Inc. INS), 10/1/2019 | 1,221,193 |
| 625,000 | | North Carolina Medical Care Commission, Health Care Facilities Revenue Bonds, 5.50% (Scotland Memorial Hospital)/(Radian Asset Assurance, Inc. INS)/(Original Issue Yield: 5.593%), 10/1/2019 | 625,281 |
| 500,000 | | North Carolina Medical Care Commission, Health Care Facilities Revenue Refunding Bonds (Series 2008D), 6.25% (University Health Systems of Eastern Carolina)/(Original Issue Yield: 6.75%), 12/1/2033 | 521,570 |
| 2,000,000 | | North Carolina Medical Care Commission, Health Care Housing Revenue Bonds (Series 2004A), 5.80% (Arc of North Carolina Projects), 10/1/2034 | 1,889,900 |
| 1,000,000 | | North Carolina Medical Care Commission, Hospital Revenue Bonds, 6.125% (Southeastern Regional Medical Center)/(Original Issue
Yield: 6.25%), 6/1/2019 | 1,002,110 |
| 250,000 | | North Carolina Medical Care Commission, Retirement Facilities First Mortgage Revenue Bonds (Series 2002), 6.25% (Forest at Duke)/(United States Treasury PRF 9/1/2012@100)/(Original Issue Yield: 6.35%), 9/1/2021 | 268,980 |
| 500,000 | | North Carolina Medical Care Commission, Retirement Facilities First Mortgage Revenue Bonds (Series 2003A), 6.375% (Givens Estates)/(United States Treasury PRF 7/1/2013@101)/(Original Issue Yield: 6.50%), 7/1/2023 | 567,420 |
| 250,000 | | North Carolina Medical Care Commission, Retirement Facilities First Mortgage Revenue Refunding Bonds (Series 2007), 5.125% (Forest at Duke), 9/1/2032 | 225,758 |
| 500,000 | | North Carolina State, Grant Anticipation Revenue Vehicle Bonds (Series 2007), 5.00% (National Public Finance Guarantee Corporation INS), 3/1/2019 | 547,810 |
| 1,000,000 | | Northern Hospital District of Surry County, NC, Health Care Facilities Revenue Refunding Bonds (Series 2001), 5.10% (Radian Asset Assurance, Inc. INS)/(Original Issue Yield: 5.242%), 10/1/2021 | 968,410 |
| 500,000 | | Pitt County, NC, Refunding Bonds, 5.25% (Pitt County Memorial Hospital)/(Escrowed In Treasuries COL)/(Original Issue
Yield: 5.85%), 12/1/2021 | 525,815 |
| 500,000 | | Raleigh & Durham, NC Airport Authority, Revenue Bonds (Series 2005A), 5.00% (AMBAC Assurance Corporation INS), 5/1/2030 | 501,260 |
| 850,000 | | University of North Carolina at Chapel Hill, Refunding General Revenue Bonds (Series 2005A), 5.00%, 12/1/2034 | 854,505 |
| 500,000 | | University of North Carolina Wilmington, COP (Series 2008), 5.00% (Assured Guaranty Corp. INS), 6/1/2022 | 530,830 |
| 525,000 | | University of North Carolina Wilmington, COP, 5.25% (FGIC and National Public Finance Guarantee Corporation INS), 6/1/2022 | 546,226 |
| | TOTAL | 36,383,518 |
Annual Shareholder Report30
Principal
Amount | | | Value |
| | Ohio – 3.7% | |
| $5,000,000 | | American Municipal Power-Ohio, Inc., Revenue Bonds (Series 2008A), 5.25% (American Municipal Power, Prairie State Energy Campus Project), 2/15/2028 | 5,039,850 |
| 1,700,000 | | Cleveland, OH Municipal School District, UT GO Bonds, 5.25% (Assured Guaranty Municipal Corp. INS), 12/1/2024 | 1,741,599 |
| 980,000 | | Ohio HFA, Residential Mortgage Revenue Bonds (Series 2008F), 5.25% (GNMA COL Home Mortgage Program GTD), 9/1/2028 | 995,111 |
| 1,345,000 | | Ohio State Building Authority, State Facilities Bonds (Series 2002A), 5.00% (United States Treasury PRF 4/1/2012@100), 4/1/2022 | 1,406,682 |
| 5,000,000 | | Ohio State Turnpike Commission, Revenue Refunding Bonds (Series 2010A), 5.00%, 2/15/2031 | 5,017,500 |
| 75,000 | | Ohio State Water Development Authority, Revenue Bonds (Series I), 7.00% (AMBAC Assurance Corporation INS)/(Escrowed In Treasuries COL)/(Original Issue Yield: 7.45%), 12/1/2014 | 82,869 |
| 1,800,000 | | Ohio State, Hospital Revenue Refunding Bonds (Series 2008A), 5.25% (Cleveland Clinic)/(Original Issue Yield: 98.376%), 1/1/2033 | 1,745,388 |
| 2,000,000 | | Ohio State, Infrastructure Improvement GO Bonds (Series 2008A), 5.375% (Original Issue Yield: 5.50%), 9/1/2028 | 2,106,600 |
| | TOTAL | 18,135,599 |
| | Oklahoma – 0.2% | |
| 1,000,000 | | Tulsa, OK Industrial Authority, Revenue Bonds, Series A, 6.00% (University of Tulsa)/(National Public Finance Guarantee Corporation INS), 10/1/2016 | 1,115,680 |
| | Oregon – 0.3% | |
| 1,500,000 | | Clackamas County, OR Hospital Facilities Authority, Revenue Refunding Bonds (Series 2001), 5.25% (Legacy Health System)/(Original Issue Yield: 5.50%), 5/1/2021 | 1,510,125 |
| | Pennsylvania – 9.5% | |
| 3,890,000 | | Allegheny County, PA HDA Authority, Hospital Revenue Bonds (Series 2008A), 5.00% (UPMC Health System), 6/15/2018 | 4,274,449 |
| 1,280,000 | | Allegheny County, PA HDA Authority, Refunding Revenue Bonds (Series 1998A), 5.125% (Jefferson Regional Medical Center, PA)/(Original Issue Yield: 5.40%), 5/1/2029 | 1,068,057 |
| 1,085,000 | | Allegheny County, PA IDA, Environmental Improvement Refunding Revenue Bonds (Series 2005), 5.50% (United States Steel Corp.), 11/1/2016 | 1,089,438 |
| 2,570,000 | | Allegheny County, PA Port Authority, Special Revenue Transportation Refunding Bonds (Series 2011), 5.75%, 3/1/2029 | 2,674,265 |
| 4,935,000 | | Commonwealth of Pennsylvania, UT GO Bonds (Second
Series 2010A), 5.00%, 5/1/2017 | 5,659,211 |
| 5,000,000 | | Delaware Valley, PA Regional Finance Authority, Revenue Bonds, 5.75%, 7/1/2017 | 5,549,600 |
| 3,000,000 | | Pennsylvania EDFA, Exempt Facilities Revenue Bonds (Series 2009), 7.00% (Allegheny Energy Supply Company LLC), 7/15/2039 | 3,123,780 |
Annual Shareholder Report31
Principal
Amount | | | Value |
| $5,000,000 | | Pennsylvania HFA, SFM Revenue Bonds (Series 2009-105C), 4.875%, 10/1/2034 | 4,827,050 |
| 1,500,000 | | Pennsylvania State Higher Education Facilities Authority, Revenue Bonds (Series 2009A), 5.25% (University of Pennsylvania Health System), 8/15/2022 | 1,563,750 |
| 3,125,000 | | Pennsylvania State Higher Education Facilities Authority, Revenue Bonds (Series 2010E), 5.00% (UPMC Health System)/(Original Issue Yield: 5.10%), 5/15/2031 | 2,903,719 |
| 2,000,000 | | Pennsylvania State Higher Education Facilities Authority, Student Housing Revenue Bonds, 5.125% (Foundation for Indiana University of Pennsylvania)/(Syncora Guarantee, Inc. INS), 7/1/2039 | 1,674,260 |
| 3,000,000 | | Pennsylvania State Turnpike Commission, Subordinate Revenue Bonds (Series 2008 B-1), 5.50%, 6/1/2033 | 2,995,950 |
| 1,000,000 | | Pennsylvania State Turnpike Commission, Turnpike Subordinated Revenue Bonds (Series 2008A), 5.00% (Assured Guaranty Corp. INS), 6/1/2033 | 962,340 |
| 5,000,000 | | Philadelphia, PA School District, UT GO Bonds (Series 2008E), 6.00% (Original Issue Yield: 6.30%), 9/1/2038 | 5,113,650 |
| 1,000,000 | | Philadelphia, PA Water & Wastewater System, Water and Wastewater Revenue Bonds (Series 2009A), 5.25% (Original Issue
Yield: 5.29%), 1/1/2032 | 986,240 |
| 1,250,000 | | Philadelphia, PA Water & Wastewater System, Water and Wastewater Revenue Bonds (Series 2009A), 5.25% (Original Issue
Yield: 5.33%), 1/1/2036 | 1,186,862 |
| 1,000,000 | | University of Pittsburgh, University Capital Project Bonds (Series 2009B), 5.50%, 9/15/2024 | 1,104,840 |
| | TOTAL | 46,757,461 |
| | Puerto Rico – 0.4% | |
| 1,000,000 | | Commonwealth of Puerto Rico, Public Improvement GO Bonds (Series 2008A), 5.50%, 7/1/2018 | 1,034,000 |
| 1,000,000 | | Puerto Rico Electric Power Authority, Power Refunding Revenue Bonds (Series 2007VV), 5.25% (National Public Finance Guarantee Corporation INS), 7/1/2029 | 937,410 |
| | TOTAL | 1,971,410 |
| | Rhode Island – 0.5% | |
| 2,500,000 | | Rhode Island State Health and Educational Building Corp., Higher Education Facilities Revenue Bonds (Series 2007), 5.00% (Brown University), 9/1/2037 | 2,463,825 |
| | South Carolina – 0.9% | |
| 3,000,000 | | Piedmont Municipal Power Agency, SC, Electric Revenue Refunding Bonds (Series 2009A-3), 5.00%, 1/1/2018 | 3,236,490 |
Annual Shareholder Report32
Principal
Amount | | | Value |
| $1,000,000 | | South Carolina State Public Service Authority (Santee Cooper), Revenue Obligations (Series 2008A), 5.375% (Original Issue
Yield: 5.60%), 1/1/2028 | 1,060,000 |
| | TOTAL | 4,296,490 |
| | Tennessee – 1.0% | |
| 2,500,000 | | Sullivan County, TN Health Educational & Housing Facilities Board, Revenue Bonds, 6.25% (Wellmont Health System)/(United States Treasury PRF 9/1/2012@101)/(Original Issue Yield: 6.45%), 9/1/2022 | 2,715,100 |
| 985,000 | | Tennessee Housing Development Agency, Home Ownership Program Bonds (Issue 2009-2), 4.70%, 7/1/2027 | 961,951 |
| 1,000,000 | | Tennessee State, GO Bonds (Series 2009A), 5.00%, 5/1/2027 | 1,055,700 |
| | TOTAL | 4,732,751 |
| | Texas – 9.2% | |
| 2,795,000 | | Bexar County, HFDC, Revenue Bonds (Series 2010), 6.20% (Army Retirement Residence Foundation), 7/1/2045 | 2,647,200 |
| 5,000,000 | | Dallas, TX Area Rapid Transit, Senior Lien Sales Tax Revenue Bonds, 5.25%, 12/1/2038 | 5,049,900 |
| 2,200,000 | | Harris County, TX HFDC, Hospital Revenue Bonds, Series 1997A, 6.00% (Memorial Hermann Healthcare System)/(National Public Finance Guarantee Corporation INS), 6/1/2011 | 2,216,346 |
| 4,000,000 | | Harris County, TX HFDC, Hospital Revenue Bonds, Series 1997A, 6.00% (Memorial Hermann Healthcare System)/(National Public Finance Guarantee Corporation INS), 6/1/2012 | 4,192,320 |
| 2,000,000 | | Harris County, TX, Toll Road Senior Lien Revenue & Refunding Bonds (Series 2008B), 5.00% (Harris County, TX Toll Road Authority)/(Original Issue Yield: 5.08%), 8/15/2033 | 1,952,520 |
| 2,000,000 | | Houston, TX Airport System, Senior Lien Revenue & Refunding Bonds (Series 2009A), 5.50% (Original Issue Yield: 5.67%), 7/1/2034 | 2,018,840 |
| 1,000,000 | | Humble, TX ISD, UT GO Bonds, 5.00% (FGIC and National Public Finance Guarantee Corporation INS), 2/15/2024 | 1,026,150 |
| 2,015,000 | | Port of Corpus Christi, TX IDC, Revenue Refunding Bonds (Series C), 5.40% (Valero Energy Corp.), 4/1/2018 | 1,910,442 |
| 1,000,000 | | Sam Rayburn, TX Municipal Power Agency, Refunding Revenue Bonds (Series 2002A), 6.00%, 10/1/2021 | 1,013,560 |
| 3,515,000 | | San Antonio, TX Electric & Gas System, Revenue Refunding Bonds (Series 2009A), 5.25%, 2/1/2027 | 3,737,289 |
| 1,000,000 | | Socorro, TX ISD, School Building UT GO Bonds (Series 2006A), 5.00% (PSFG GTD), 8/15/2026 | 1,047,870 |
| 2,500,000 | | Tarrant County, TX Cultural Education Facilities Finance Corp., Revenue Bonds, Series 2006A, 6.00% (Northwest Senior Housing Corp. Edgemere Project), 11/15/2036 | 2,185,200 |
| 2,030,000 | | Texas Municipal Gas Acquisition & Supply Corp. I, Gas Supply Senior Lien Revenue Bonds (Series 2006A), 5.25%, 12/15/2026 | 1,849,756 |
Annual Shareholder Report33
Principal
Amount | | | Value |
| $3,735,000 | | Texas State Department of Housing & Community Affairs, Residential Mortgage Revenue Bonds (Series 2009A), 5.30%, 7/1/2034 | 3,740,565 |
| 1,525,000 | | Texas State Public Finance Authority, GO Bonds (Series 2007), 5.00% (Texas State), 10/1/2027 | 1,593,198 |
| 5,000,000 | | Texas State Transportation Commission, Mobility Fund Revenue Bonds (Series 2007), 4.75% (Texas State), 4/1/2027 | 5,072,950 |
| 4,000,000 | | Texas State, Water Financial Assistance UT GO Bonds (Series 2009A), 5.00%, 8/1/2029 | 4,153,880 |
| | TOTAL | 45,407,986 |
| | Utah – 0.4% | |
| 2,000,000 | | Utah County, UT IDA, Environmental Improvement Revenue Bonds, 5.05% TOBs (Marathon Oil Corp.), Mandatory Tender 11/1/2011 | 2,059,320 |
| | Vermont – 0.2% | |
| 1,000,000 | | Burlington, VT Airport, Revenue Bonds, Series A, 5.00% (National Public Finance Guarantee Corporation INS), 7/1/2023 | 945,970 |
| | Virginia – 1.6% | |
| 3,900,000 | | Virginia Peninsula Port Authority, Coal Terminal Revenue Refunding Bonds (Series 2003), 6.00% (Brinks Co. (The)), 4/1/2033 | 3,906,357 |
| 4,000,000 | | Virginia Resources Authority, Subordinated Revenue Bonds (Series 2008), 5.00% (Virginia State Clean Water Revolving Fund), 10/1/2027 | 4,235,720 |
| | TOTAL | 8,142,077 |
| | Washington – 1.6% | |
| 2,000,000 | | Port of Seattle, WA, Revenue & Refunding Bonds (Series 2010B), 5.00%, 6/1/2040 | 1,849,940 |
| 3,060,000 | | Tobacco Settlement Authority, WA, Tobacco Settlement Asset Backed Revenue Bonds, 6.625% (Original Issue Yield: 6.875%), 6/1/2032 | 3,016,854 |
| 2,000,000 | | Washington State Health Care Facilities Authority, Revenue Bonds (Series 2009A), 6.50% (Swedish Health Services)/(Original Issue
Yield: 6.73%), 11/15/2033 | 2,080,680 |
| 1,150,000 | | Washington State Health Care Facilities Authority, Revenue Bonds, 5.00% (Group Health Cooperative)/(Radian Asset Assurance, Inc. INS), 12/1/2036 | 954,546 |
| | TOTAL | 7,902,020 |
| | West Virginia – 0.4% | |
| 2,200,000 | | Pleasants County, WV County Commission, PCR Refunding Bonds (Series 2007F), 5.25% (Allegheny Energy Supply Company LLC), 10/15/2037 | 1,932,106 |
| | Wisconsin – 4.9% | |
| 1,520,000 | | Wisconsin Housing & EDA, Housing Revenue Bonds (Series 2002C), 5.35% (National Public Finance Guarantee Corporation INS), 11/1/2022 | 1,533,513 |
Annual Shareholder Report34
Principal
Amount | | | Value |
| $6,000,000 | | Wisconsin State General Fund Appropriation, Revenue Bonds (Series 2009A), 6.00% (Wisconsin State)/(Original Issue
Yield: 6.02%), 5/1/2033 | 6,402,900 |
| 3,000,000 | | Wisconsin State HEFA, 6.625% (ProHealth Care, Inc.)/(Original Issue Yield: 6.87%), 2/15/2039 | 3,100,800 |
| 5,500,000 | | Wisconsin State HEFA, Refunding Revenue Bonds, 5.75% (Wheaton Franciscan HealthCare)/(United States Treasury PRF 2/15/2012@101)/(Original Issue Yield: 5.96%), 8/15/2025 | 5,801,950 |
| 1,630,000 | | Wisconsin State HEFA, Revenue Bonds, 6.00% (Agnesian Healthcare, Inc.)/(United States Treasury PRF 7/1/2011@100)/(Original Issue Yield: 6.15%), 7/1/2030 | 1,652,983 |
| 1,670,000 | | Wisconsin State HEFA, Revenue Bonds, 6.00% (SynergyHealth, Inc.)/(Original Issue Yield: 6.10%), 11/15/2023 | 1,709,545 |
| 4,000,000 | | Wisconsin State, UT GO Bonds (Series 2008C), 5.00%, 5/1/2028 | 4,127,360 |
| | TOTAL | 24,329,051 |
| | TOTAL MUNICIPAL BONDS
(IDENTIFIED COST $496,002,956) | 488,482,730 |
| | SHORT-TERM MUNICIPALS – 0.1% 1 | |
| | New York – 0.1% | |
| 650,000 | | New York City, NY TFA, New York City Recovery Bonds
(2003 Subseries 2-A) Daily VRDNs (Dexia Credit Local LIQ),
0.230%, 4/1/2011
(AT AMORTIZED COST) | 650,000 |
| | TOTAL INVESTMENTS — 99.0%
(IDENTIFIED COST $496,652,956) 2 | 489,132,730 |
| | OTHER ASSETS AND LIABILITIES - NET — 1.0% 3 | 4,988,525 |
| | TOTAL NET ASSETS — 100% | $494,121,255 |
At March 31, 2011, the Fund holds no securities that are subject to the federal alternative minimum tax (AMT) (unaudited).
| 1 | Current rate and next reset date shown for Variable Rate Demand Notes. |
| 2 | The cost of investments for federal tax purposes amounts to $496,628,281. |
| 3 | Assets, other than investments in securities, less liabilities. See Statement of Assets and Liabilities. |
Note: The categories of investments are shown as a percentage of total net assets at March 31, 2011.
Annual Shareholder Report
35
Various inputs are used in determining the value of the Fund's investments. These inputs are summarized in the three broad levels listed below:Level 1 — quoted prices in active markets for identical securities, including investment companies with daily net asset values, if applicable.
Level 2 — other significant observable inputs (including quoted prices for similar securities, interest rates, prepayment speeds, credit risk, etc.). Also includes securities valued at amortized cost.
Level 3 — significant unobservable inputs (including the Fund's own assumptions in determining the fair value of investments).
The inputs or methodology used for valuing securities are not an indication of the risk associated with investing in those securities.
As of March 31, 2011, all investments of the Fund utilized Level 2 inputs in valuing the Fund's assets carried at fair value.
The following acronyms are used throughout this portfolio:
| AMBAC | — American Municipal Bond Assurance Corporation |
| CCD | — Community College District |
| CDA | — Community Development Administration |
| COL | — Collateralized |
| COP | — Certificate of Participation |
| CPI | — Consumer Price Index |
| EDA | — Economic Development Authority |
| EDFA | — Economic Development Finance Authority |
| FGIC | — Financial Guaranty Insurance Company |
| FHA | — Federal Housing Administration |
| GNMA | — Government National Mortgage Association |
| GO | — General Obligation |
| GTD | — Guaranteed |
| HDA | — Hospital Development Authority |
| HEFA | — Health and Education Facilities Authority |
| HFA | — Housing Finance Authority |
| HFDC | — Health Facility Development Corporation |
| IDA | — Industrial Development Authority |
| IDB | — Industrial Development Bond |
| IDC | — Industrial Development Corporation |
| INS | — Insured |
| ISD | — Independent School District |
| LID | — Local Improvement District |
| LIQ | — Liquidity Agreement |
| LT | — Limited Tax |
| PCR | — Pollution Control Revenue |
| PCRBs | — Pollution Control Revenue Bonds |
| PRF | — Prerefunded |
| PSFG | — Public School Fund Guarantee |
| SFM | — Single Family Mortgage |
| TFA | — Transitional Finance Authority |
| TOBs | — Tender Option Bonds |
| USD | — Unified School District |
| UT | — Unlimited Tax |
| VRDNs | — Variable Rate Demand Notes |
See Notes which are an integral part of the Financial Statements
Annual Shareholder Report36
Statement of Assets and Liabilities
March 31, 2011
| Assets: | | |
| Total investments in securities, at value (identified cost $496,652,956) | | $489,132,730 |
| Cash | | 68,064 |
| Income receivable | | 7,652,110 |
| Receivable for investments sold | | 3,452,214 |
| Receivable for shares sold | | 285,886 |
| TOTAL ASSETS | | 500,591,004 |
| Liabilities: | | |
| Payable for investments purchased | $4,328,480 | |
| Payable for shares redeemed | 1,373,127 | |
| Income distribution payable | 425,934 | |
| Payable for shareholder services fee (Note 5) | 181,087 | |
| Payable for distribution services fee (Note 5) | 24,714 | |
| Accrued expenses | 136,407 | |
| TOTAL LIABILITIES | | 6,469,749 |
| Net assets for 51,660,532 shares outstanding | | $494,121,255 |
| Net Assets Consist of: | | |
| Paid-in capital | | $527,864,217 |
| Net unrealized depreciation of investments | | (7,520,226) |
| Accumulated net realized loss on investments | | (26,224,684) |
| Undistributed net investment income | | 1,948 |
| TOTAL NET ASSETS | | $494,121,255 |
Annual Shareholder Report37
Statement of Assets and Liabilities — continued| Net Asset Value, Offering Price and Redemption Proceeds Per Share | | |
| Class A Shares: | | |
| Net asset value per share ($438,344,261 ÷ 45,829,129 shares outstanding), $0.01 par value, 375,000,000 shares authorized | | $9.56 |
| Offering price per share (100/95.50 of $9.56) | | $10.01 |
| Redemption proceeds per share | | $9.56 |
| Class B Shares: | | |
| Net asset value per share ($13,402,395 ÷ 1,401,192 shares outstanding), $0.01 par value, 250,000,000 shares authorized | | $9.56 |
| Offering price per share | | $9.56 |
| Redemption proceeds per share (94.50/100 of $9.56) | | $9.03 |
| Class C Shares: | | |
| Net asset value per share ($24,635,332 ÷ 2,575,597 shares outstanding), $0.01 par value, 375,000,000 shares authorized | | $9.56 |
| Offering price per share | | $9.56 |
| Redemption proceeds per share (99.00/100 of $9.56) | | $9.46 |
| Class F Shares: | | |
| Net asset value per share ($17,739,267 ÷ 1,854,614 shares outstanding), $0.01 par value, 150,000,000 shares authorized | | $9.56 |
| Offering price per share (100/99.00 of $9.56) | | $9.66 |
| Redemption proceeds per share (99.00/100 of $9.56) | | $9.46 |
See Notes which are an integral part of the Financial Statements
Annual Shareholder Report38
Statement of Operations
Year Ended March 31, 2011
| Investment Income: | | | |
| Interest | | | $28,032,791 |
| Expenses: | | | |
| Investment adviser fee (Note 5) | | $2,927,292 | |
| Administrative fee (Note 5) | | 434,956 | |
| Custodian fees | | 28,946 | |
| Transfer and dividend disbursing agent fees and expenses | | 340,333 | |
| Directors'/Trustees' fees | | 12,787 | |
| Auditing fees | | 23,532 | |
| Legal fees | | 8,005 | |
| Portfolio accounting fees | | 125,015 | |
| Distribution services fee — Class B Shares (Note 5) | | 128,428 | |
| Distribution services fee — Class C Shares (Note 5) | | 204,023 | |
| Shareholder services fee — Class A Shares (Note 5) | | 1,191,264 | |
| Shareholder services fee — Class B Shares (Note 5) | | 42,810 | |
| Shareholder services fee — Class C Shares (Note 5) | | 68,007 | |
| Shareholder services fee — Class F Shares (Note 5) | | 49,589 | |
| Account administration fee — Class A Shares | | 6,835 | |
| Share registration costs | | 69,078 | |
| Printing and postage | | 45,641 | |
| Insurance premiums | | 5,338 | |
| Taxes | | 42,889 | |
| Miscellaneous | | 11,990 | |
| TOTAL EXPENSES | | 5,766,758 | |
Annual Shareholder Report39
Statement of Operations — continued| Waiver and Reimbursements (Note 5): | | | |
| Waiver of administrative fee | $(11,609) | | |
Reimbursement of shareholder services fee —
Class A Shares | (488,917) | | |
Reimbursement of shareholder services fee —
Class F Shares | (21,078) | | |
| TOTAL WAIVER AND REIMBURSEMENTS | | $(521,604) | |
| Net expenses | | | $5,245,154 |
| Net investment income | | | 22,787,637 |
Realized and Unrealized Gain (Loss)
on Investments: | | | |
| Net realized gain on investments | | | 1,095,730 |
| Net change in unrealized depreciation of investments | | | (24,593,976) |
| Net realized and unrealized loss on investments | | | (23,498,246) |
| Change in net assets resulting from operations | | | $(710,609) |
See Notes which are an integral part of the Financial Statements
Annual Shareholder Report40
Statement of Changes in Net Assets
| Year Ended March 31 | 2011 | 2010 |
| Increase (Decrease) in Net Assets | | |
| Operations: | | |
| Net investment income | $22,787,637 | $20,526,772 |
| Net realized gain on investments | 1,095,730 | 431,875 |
| Net change in unrealized appreciation/depreciation of investments | (24,593,976) | 26,646,570 |
| CHANGE IN NET ASSETS RESULTING FROM OPERATIONS | (710,609) | 47,605,217 |
| Distributions to Shareholders: | | |
| Distributions from net investment income | | |
| Class A Shares | (20,485,239) | (18,886,022) |
| Class B Shares | (559,822) | (555,375) |
| Class C Shares | (890,161) | (818,651) |
| Class F Shares | (825,320) | (600,920) |
| CHANGE IN NET ASSETS RESULTING FROM DISTRIBUTIONS TO SHAREHOLDERS | (22,760,542) | (20,860,968) |
| Share Transactions: | | |
| Proceeds from sale of shares | 64,639,636 | 94,606,427 |
| Proceeds from shares issued in connection with the tax-free transfer of assets from Federated California Municipal Income Fund | — | 59,262,137 |
| Proceeds from shares issued in connection with the tax-free transfer of assets from Federated North Carolina Municipal Income Fund | — | 48,313,584 |
| Net asset value of shares issued to shareholders in payment of distributions declared | 16,814,665 | 14,396,019 |
| Cost of shares redeemed | (140,045,477) | (110,583,582) |
| CHANGE IN NET ASSETS RESULTING FROM SHARE TRANSACTIONS | (58,591,176) | 105,994,585 |
| Change in net assets | (82,062,327) | 132,738,834 |
| Net Assets: | | |
| Beginning of period | 576,183,582 | 443,444,748 |
| End of period (including undistributed net investment income of $1,948 and $24, respectively) | $494,121,255 | $576,183,582 |
See Notes which are an integral part of the Financial Statements
Annual Shareholder Report41
Notes to Financial Statements
March 31, 2011
1. Organization
Federated Municipal Securities Fund, Inc. (the “Fund”) is registered under the Investment Company Act of 1940, as amended (the “Act”), as a diversified, open-end management investment company. The Fund offers four classes of shares: Class A Shares, Class B Shares, Class C Shares and Class F Shares. All shares of the Fund have equal rights with respect to voting, except on class-specific matters. The investment objective of the Fund is to provide for its shareholders a high level of current income which is exempt from federal regular income tax. Interest income from the Fund's investments normally will not be subject to federal AMT for individuals and corporations, but may be subject to state and local taxes.
On December 6, 2009, the Fund acquired all of the net assets of Federated California Municipal Income Fund and Federated North Carolina Municipal Income Fund (the “Acquired Funds”), open-end investment companies in a tax-free reorganization in exchange for shares of the Fund, pursuant to a plan of reorganization approved by the Acquired Funds' shareholders on November 20, 2009. The primary purposes of the transaction were to provide the shareholders of the Acquired Funds a competitive, more diversified and more viable fund with share class expense ratios ultimately lower than the expense ratios of the Acquired Funds would have been after the Adviser and its affiliates eliminated or substantially reduced the voluntary waivers on the Acquired Funds' share classes. For financial reporting purposes, assets received and shares issued by the Fund were recorded at fair value; however, the cost basis of the investments received from the Acquired Funds was carried forward to align ongoing reporting of the Fund's realized and unrealized gains and losses with amounts distributable to shareholders for tax purposes.
Assuming the acquisition had been completed on April 1, 2009, the beginning of the annual reporting period of the Fund, the Fund's pro forma results of operations for the year ended March 31, 2010, are as follows:
| Net investment income* | $23,767,830 |
| Net realized and unrealized gain on investments | $34,180,128 |
| Net increase in net assets resulting from operations | $57,947,958 |
| * | Net investment income includes $95,855 of pro forma additional expenses. |
Annual Shareholder Report
42
Because the combined investment portfolios have been managed as a single integrated portfolio since the acquisition was completed, it is not practicable to separate the amounts of revenue and earnings of the Acquired Funds that have been included in the Fund's Statement of Operations as of March 31, 2010. The Fund received net assets from the Acquired Funds as the result of the tax-free reorganization as follows: | Shares of
the Fund
Issued | Acquired
Funds Net
Assets
Received | Unrealized
Appreciation/
(Depreciation) 1 | Net Assets of
the Fund
Immediately
Prior to
Combination | Net Assets
of the Fund
Immediately
After
Combination |
| Federated California Municipal Income Fund | 5,926,221 | $59,262,137 | $(210,182) | | |
| Federated North Carolina Municipal Income Fund | 4,831,425 | 48,313,584 | 1,350,084 | | |
| TOTAL | 10,757,646 | $107,575,721 | $1,139,902 | $471,631,337 | $579,207,058 |
| 1 | Unrealized appreciation/(depreciation) is included in the Acquired Funds Net Assets Received amount shown above. |
2. Significant Accounting Policies
The following is a summary of significant accounting policies consistently followed by the Fund in the preparation of its financial statements. These policies are in conformity with U.S. generally accepted accounting principles (GAAP).
Investment Valuation
In calculating its net asset value (NAV), the Fund generally values investments as follows:
- Fixed-income securities acquired with remaining maturities greater than 60 days are fair valued using price evaluations provided by a pricing service approved by the Directors.
- Fixed-income securities acquired with remaining maturities of 60 days or less are valued at their cost (adjusted for the accretion of any discount or amortization of any premium), which approximates market value.
- Shares of other mutual funds are valued based upon their reported NAVs.
- Derivative contracts listed on exchanges are valued at their reported settlement or closing price.
- Over-the-counter (OTC) derivative contracts are fair valued using price evaluations provided by a pricing service approved by the Directors.
- For securities that are fair valued in accordance with procedures established by and under the general supervision of the Trustees, certain factors may be considered such as: the purchase price of the security, information obtained by contacting the issuer, analysis of the issuer's financial statements or other available documents, fundamental analytical data, the nature and duration of restrictions on disposition, the movement of the market in which the security is normally traded and public trading in similar securities of the issuer or comparable issuers.
Annual Shareholder Report
43
If the Fund cannot obtain a price or price evaluation from a pricing service for an investment, the Fund may attempt to value the investment based upon the mean of bid and asked quotations or fair value the investment based on price evaluations, from one or more dealers. If any price, quotation, price evaluation or other pricing source is not readily available when the NAV is calculated, the Fund uses the fair value of the investment determined in accordance with the procedures described below. There can be no assurance that the Fund could purchase or sell an investment at the price used to calculate the Fund's NAV.Fair Valuation and Significant Events Procedures
The Directors have authorized the use of pricing services to provide evaluations of the current fair value of certain investments for purposes of calculating the NAV. Factors considered by pricing services in evaluating an investment include the yields or prices of investments of comparable quality, coupon, maturity, call rights and other potential prepayments, terms and type, reported transactions, indications as to values from dealers and general market conditions. Some pricing services provide a single price evaluation reflecting the bid-side of the market for an investment (a “bid” evaluation). Other pricing services offer both bid evaluations and price evaluations indicative of a price between the prices bid and asked for the investment (a “mid” evaluation). The Fund normally uses bid evaluations for U.S. Treasury and Agency securities, mortgage-backed securities and municipal securities. The Fund normally uses mid evaluations for other types of fixed-income securities and OTC derivative contracts. In the event that market quotations and price evaluations are not available for an investment, the fair value of the investment is determined in accordance with procedures adopted by the Directors.
The Directors also have adopted procedures requiring an investment to be priced at its fair value whenever the Adviser determines that a significant event affecting the value of the investment has occurred between the time as of which the price of the investment would otherwise be determined and the time as of which the NAV is computed. An event is considered significant if there is both an affirmative expectation that the investment's value will change in response to the event and a reasonable basis for quantifying the resulting change in value. Examples of significant events that may occur after the close of the principal market on which a security is traded, or after the time of a price evaluation provided by a pricing service or a dealer, include:
- With respect to price evaluations of fixed-income securities determined before the close of regular trading on the NYSE, actions by the Federal Reserve Open Market Committee and other significant trends in U.S. fixed-income markets;
- Political or other developments affecting the economy or markets in which an issuer conducts its operations or its securities are traded; and
- Announcements concerning matters such as acquisitions, recapitalizations, litigation developments, a natural disaster affecting the issuer's operations or regulatory changes or market developments affecting the issuer's industry.
The Fund may seek to obtain more current quotations or price evaluations from alternative pricing sources. If a reliable alternative pricing source is not available, the Fund will determine the fair value of the investment using another method approved by the Directors.
Investment Income, Gains and Losses, Expenses and Distributions
Investment transactions are accounted for on a trade-date basis. Realized gains and losses from investment transactions are recorded on an identified-cost basis. Interest income and expenses are accrued daily. Distributions to shareholders are recorded on the ex-dividend date. Distributions of net investment income are declared daily and paid monthly. Non-cash Annual Shareholder Report
44
dividends included in dividend income, if any, are recorded at fair value. Investment income, realized and unrealized gains and losses, and certain fund-level expenses are allocated to each class based on relative average daily net assets, except that each class may bear certain expenses unique to that class such as account administration, distribution services and shareholder services fees. Dividends are declared separately for each class. No class has preferential dividend rights; differences in per share dividend rates are generally due to differences in separate class expenses.Premium and Discount Amortization
All premiums and discounts on fixed-income securities are amortized/accreted using the effective interest rate method.
Federal Taxes
It is the Fund's policy to comply with the Subchapter M provision of the Internal Revenue Code and to distribute to shareholders each year substantially all of its income. Accordingly, no provision for federal income tax is necessary. As of and during the year ended March 31, 2011, the Fund did not have a liability for any uncertain tax positions. The Fund recognizes interest and penalties, if any, related to tax liabilities as income tax expense in the Statement of Operations. As of March 31, 2011, tax years 2008 through 2011 remain subject to examination by the Fund's major tax jurisdictions, which include the United States of America, the state of Maryland and the Commonwealth of Pennsylvania.
Other Taxes
As an open-end management investment company incorporated in the state of Maryland but domiciled in the Commonwealth of Pennsylvania, the Fund is subject to the Pennsylvania Franchise Tax. This franchise tax is assessed annually on the value of the Fund, as represented by average net assets for the tax year.
When-Issued and Delayed Delivery Transactions
The Fund may engage in when-issued or delayed delivery transactions. The Fund records when-issued securities on the trade date and maintains security positions such that sufficient liquid assets will be available to make payment for the securities purchased. Securities purchased on a when-issued or delayed delivery basis are marked to market daily and begin earning interest on the settlement date. Losses may occur on these transactions due to changes in market conditions or the failure of counterparties to perform under the contract.
Restricted Securities
The Fund may purchase securities which are considered restricted. Restricted securities are securities that either: (a) cannot be offered for public sale without first being registered, or being able to take advantage of an exemption from registration, under the Securities Act of 1933; or (b) are subject to contractual restrictions on public sales. In some cases, when a security cannot be offered for public sale without first being registered, the issuer of the restricted security has agreed to register such securities for resale, at the issuer's expense, either upon demand by the Fund or in connection with another registered offering of the securities. Many such restricted securities may be resold in the secondary market in transactions exempt from registration. Restricted securities may be determined to be liquid Annual Shareholder Report
45
under criteria established by the Directors. The Fund will not incur any registration costs upon such resales. The Fund's restricted securities are valued at the price provided by dealers in the secondary market or, if no market prices are available, at the fair value as determined in accordance with procedures established by and under the general supervision of the Directors.Other
The preparation of financial statements in conformity with GAAP requires management to make estimates and assumptions that affect the amounts of assets, liabilities, expenses and revenues reported in the financial statements. Actual results could differ from those estimated.
3. Capital Stock
The following tables summarize capital stock activity:
| Year Ended March 31 | 2011 | 2010 |
| Class A Shares: | Shares | Amount | Shares | Amount |
| Shares sold | 4,805,739 | $48,259,048 | 7,554,043 | $74,989,475 |
| Shares issued in connection with the tax-free transfer of assets from Federated California Municipal Income Fund | — | — | 5,146,402 | 51,463,752 |
| Shares issued in connection with the tax-free transfer of assets from Federated North Carolina Municipal Income Fund | — | — | 4,831,425 | 48,313,584 |
| Shares issued to shareholders in payment of distributions declared | 1,502,999 | 14,952,779 | 1,306,629 | 12,914,348 |
| Shares redeemed | (11,698,178) | (115,983,512) | (9,745,781) | (96,377,562) |
NET CHANGE RESULTING
FROM CLASS A SHARE TRANSACTIONS | (5,389,440) | $(52,771,685) | 9,092,718 | $91,303,597 |
| Year Ended March 31 | 2011 | 2010 |
| Class B Shares: | Shares | Amount | Shares | Amount |
| Shares sold | 271,596 | $2,726,467 | 247,004 | $2,442,687 |
| Shares issued in connection with the tax-free transfer of assets from Federated California Municipal Income Fund | — | — | 779,819 | 7,798,385 |
| Shares issued to shareholders in payment of distributions declared | 46,040 | 458,536 | 43,514 | 430,162 |
| Shares redeemed | (878,843) | (8,738,624) | (712,343) | (7,041,016) |
NET CHANGE RESULTING
FROM CLASS B SHARE TRANSACTIONS | (561,207) | $(5,553,621) | 357,994 | $3,630,218 |
Annual Shareholder Report46
| Year Ended March 31 | 2011 | 2010 |
| Class C Shares: | Shares | Amount | Shares | Amount |
| Shares sold | 772,531 | $7,719,617 | 871,508 | $8,563,984 |
| Shares issued to shareholders in payment of distributions declared | 65,573 | 651,711 | 52,070 | 514,941 |
| Shares redeemed | (921,888) | (9,043,854) | (428,788) | (4,235,098) |
NET CHANGE RESULTING
FROM CLASS C SHARE TRANSACTIONS | (83,784) | $(672,526) | 494,790 | $4,843,827 |
| Year Ended March 31 | 2011 | 2010 |
| Class F Shares: | Shares | Amount | Shares | Amount |
| Shares sold | 591,997 | $5,934,504 | 870,121 | $8,610,281 |
| Shares issued to shareholders in payment of distributions declared | 75,617 | 751,639 | 54,267 | 536,568 |
| Shares redeemed | (644,619) | (6,279,487) | (299,483) | (2,929,906) |
NET CHANGE RESULTING
FROM CLASS F SHARE TRANSACTIONS | 22,995 | $406,656 | 624,905 | $6,216,943 |
NET CHANGE RESULTING
FROM TOTAL FUND SHARE TRANSACTIONS | (6,011,436) | $(58,591,176) | 10,570,407 | $105,994,585 |
4. Federal Tax Information
The timing and character of income and capital gain distributions are determined in accordance with income tax regulations, which may differ from GAAP. These differences are due in part to differing treatments for discount accretion/premium amortization on debt securities and interest on a defaulted security.
For the year ended March 31, 2011, permanent differences identified and reclassified among the components of net assets were as follows:
| Increase (Decrease) |
Undistributed
Net Investment
Income (loss) | Accumulated
Net Realized
Gain (Loss) |
| ($25,171) | $25,171 |
Net investment income (loss), net realized gains (losses) and net assets were not affected by this reclassification.
The tax character of distributions as reported on the Statement of Changes in Net Assets for the years ended March 31, 2011 and 2010, was as follows:
| 2011 | 2010 |
| Tax-exempt income | $22,760,542 | $20,854,605 |
| Ordinary income | $ — | $6,363 |
Annual Shareholder Report
47
As of March 31, 2011, the components of distributable earnings on a tax basis were as follows:| Undistributed tax-exempt income | $1,948 |
| Net unrealized depreciation | $(7,495,551) |
| Capital loss carryforwards and deferrals | $(26,249,359) |
The difference between book-basis and tax-basis net unrealized appreciation/depreciation is attributable to differing treatments for discount accretion/premium amortization on debt securities and defaulted securities.
At March 31, 2011, the cost of investments for federal tax purposes was $496,628,281. The net unrealized depreciation of investments for federal tax purposes was $7,495,551. This consists of net unrealized appreciation from investments for those securities having an excess of value over cost of $8,165,386 and net unrealized depreciation from investments for those securities having an excess of cost over value of $15,660,937.
At March 31, 2011, the Fund had a capital loss carryforward of $24,448,495 which will reduce the Fund's taxable income arising from future net realized gains on investments, if any, to the extent permitted by the Code and thus will reduce the amount of distributions to shareholders which would otherwise be necessary to relieve the Fund of any liability for federal income tax. Pursuant to the Code, such capital loss carryforward will expire as follows:
| Expiration Year | Expiration Amount |
| 2016 | $1,218,209 |
| 2017 | $16,161,827 |
| 2018 | $7,068,459 |
As a result of the tax-free transfer of assets from Federated California Municipal Income Fund, the use of certain capital loss carryforwards listed above may be limited.
Under the recently enacted Regulated Investment Company Modernization Act of 2010, the Fund will be permitted to carry forward capital losses incurred in taxable years beginning after December 22, 2010 for an unlimited period. However, any losses incurred during those future years will be required to be utilized prior to the losses incurred in pre-enactment tax years. As a result of this ordering rule, pre-enactment capital loss carryforwards may be more likely to expire unused. Additionally, post-enactment capital losses that are carried forward will retain their character as either short-term or long-term capital losses rather than being considered all short-term as under previous law.
Capital loss carryforwards of $2,733,544 were utilized during the year ended March 31, 2011.
Under current tax regulations, capital losses on securities transactions realized after October 31 may be deferred and treated as occurring on the first day of the following fiscal year. As of March 31, 2011, for federal income tax purposes, post October losses of $1,800,864 were deferred to April 1, 2011.
Annual Shareholder Report
48
5. Investment Adviser Fee and Other Transactions with AffiliatesInvestment Adviser Fee
Federated Investment Management Company is the Fund's investment adviser (the “Adviser”). The advisory agreement between the Fund and the Adviser provides for an annual fee equal to: (a) 0.30% of the Fund's average daily net assets; and (b) 4.50% of the gross income of the Fund, excluding capital gains or losses. Subject to the terms described in the Expense Limitation note, the Adviser may voluntarily choose to waive any portion of its fee.
Administrative Fee
Federated Administrative Services (FAS), under the Administrative Services Agreement, provides the Fund with administrative personnel and services. The fee paid to FAS is based on the average aggregate daily net assets of certain Federated funds as specified below:
| Administrative Fee | Average Aggregate Daily Net Assets
of the Federated Funds |
| 0.150% | on the first $5 billion |
| 0.125% | on the next $5 billion |
| 0.100% | on the next $10 billion |
| 0.075% | on assets in excess of $20 billion |
The administrative fee received during any fiscal year shall be at least $150,000 per portfolio and $40,000 per each additional class of Shares. Subject to the terms described in the Expense Limitation note, FAS may voluntarily choose to waive any portion of its fee. For the year ended March 31, 2011, the net fee paid to FAS was 0.076% of average daily net assets of the Fund. FAS waived $11,609 of its fee.
Distribution Services Fee
The Fund has adopted a Distribution Plan (the “Plan”) pursuant to Rule 12b-1 under the Act. Under the terms of the Plan, the Fund will compensate Federated Securities Corp. (FSC), the principal distributor, from the daily net assets of the Fund's Class B Shares and Class C Shares to finance activities intended to result in the sale of these shares. The Plan provides that the Fund may incur distribution expenses at the following percentages of average daily net assets annually, to compensate FSC:
| Share Class Name | Percentage of Average Daily
Net Assets of Class |
| Class B Shares | 0.75% |
| Class C Shares | 0.75% |
Subject to the terms described in the Expense Limitation note, FSC may voluntarily choose to waive any portion of its fee. When FSC receives fees, it may pay some or all of them to financial intermediaries whose customers purchase shares. For the year ended March 31, 2011, FSC retained $48,432 of fees paid by the Fund.
Annual Shareholder Report
49
Sales ChargesFront-end sales charges and contingent deferred sales charges (CDSC) do not represent expenses of the Fund. They are deducted from the proceeds of sales of Fund shares prior to investment or from redemption proceeds prior to remittance, as applicable. For the year ended March 31, 2011, FSC retained $14,648 in sales charges from the sale of Class A Shares. FSC also retained $8,565 of CDSC relating to redemptions of Class A Shares, $1,226 relating to redemptions of Class C Shares and $5,939 relating to redemptions of Class F Shares.
Shareholder Services Fee
The Fund may pay fees (“Service Fees”) up to 0.25% of the average daily net assets of the Fund's Class A Shares, Class B Shares, Class C Shares and Class F Shares to financial intermediaries or to Federated Shareholder Services Company (FSSC) for providing services to shareholders and maintaining shareholder accounts. Subject to the terms described in the Expense Limitation note, FSSC may voluntarily reimburse the Fund for Service Fees. For the year ended March 31, 2011, FSSC voluntarily reimbursed $509,995 of Service Fees. For the year ended March 31, 2011, FSSC did not receive any fees paid by the Fund.
Interfund Transactions
During the year ended March 31, 2011, the Fund engaged in purchases and sales transactions with funds that have a common investment adviser (or affiliated investment advisers), common Directors/Trustees, and/or common Officers. These purchase and sale transactions complied with Rule 17a-7 under the Act and amounted to $183,715,000 and $181,150,000, respectively.
Expense Limitation
The Adviser and its affiliates (which may include FSC, FAS and FSSC) have voluntarily agreed to waive their fees and/or reimburse expenses so that the total annual fund operating expenses (as shown in the financial highlights) paid by the Fund's Class A Shares, Class B Shares, Class C Shares and Class F Shares (after the voluntary waivers and reimbursements) will not exceed 0.87%, 1.76%, 1.76% and 0.87% (the “Fee Limit”), respectively, up to but not including the later of (the “Termination Date”): (a) June 1, 2012; or (b) the date of the Fund's next effective Prospectus. While the Adviser and its affiliates currently do not anticipate terminating or increasing these arrangements prior to the Termination Date, these arrangements may only be terminated or the Fee Limit increased prior to the Termination Date with the agreement of the Directors.
General
Certain Officers and Directors of the Fund are Officers and Directors or Trustees of the above companies.
6. Investment Transactions
Purchases and sales of investments, excluding long-term U.S. government securities and short-term obligations, for the year ended March 31, 2011, were as follows:
| Purchases | $114,705,324 |
| Sales | $159,454,221 |
Annual Shareholder Report50
7. Line of Credit
The Fund participates in a $100,000,000 unsecured, uncommitted revolving line of credit (LOC) agreement with PNC Bank. The LOC was made available for extraordinary or emergency purposes, primarily for financing redemption payments. Borrowings are charged interest at a rate offered to the Fund by PNC Bank at the time of the borrowing. As of March 31, 2011, there were no outstanding loans. During the year ended March 31, 2011, the Fund did not utilize the LOC.
8. Interfund Lending
Pursuant to an Exemptive Order issued by the Securities and Exchange Commission, the Fund, along with other funds advised by subsidiaries of Federated Investors, Inc., may participate in an interfund lending program. This program provides an alternative credit facility allowing the funds to borrow from other participating affiliated funds. As of March 31, 2011, there were no outstanding loans. During the year ended March 31, 2011, the program was not utilized.
9. Federal Tax Information (unaudited)
For the year ending March 31, 2011, 100.00% of the distributions from net investment income is exempt from federal income tax, other than the federal AMT.
Annual Shareholder Report51
Report of Independent Registered Public Accounting Firm
To the Board of Directors and Shareholders of Federated Municipal Securities Fund, Inc.:
We have audited the accompanying statement of assets and liabilities of Federated Municipal Securities Fund, Inc. (the “Fund”), including the portfolio of investments, as of March 31, 2011, and the related statement of operations for the year then ended, the statement of changes in net assets for each of the two years in the period then ended, and the financial highlights for each of the periods indicated therein. These financial statements and financial highlights are the responsibility of the Fund's management. Our responsibility is to express an opinion on these financial statements and financial highlights based on our audits.
We conducted our audits in accordance with standards of the Public Company Accounting Oversight Board (United States). Those standards require that we plan and perform the audit to obtain reasonable assurance about whether the financial statements and financial highlights are free of material misstatement. We were not engaged to perform an audit of the Fund's internal control over financial reporting. Our audits included consideration of internal control over financial reporting as a basis for designing audit procedures that are appropriate in the circumstances, but not for the purpose of expressing an opinion on the effectiveness of the Fund's internal control over financial reporting. Accordingly, we express no such opinion. An audit also includes examining, on a test basis, evidence supporting the amounts and disclosures in the financial statements and financial highlights, assessing the accounting principles used and significant estimates made by management, and evaluating the overall financial statement presentation. Our procedures included confirmation of securities owned as of March 31, 2011, by correspondence with the custodian and others or by other appropriate auditing procedures where replies from others were not received. We believe that our audits provide a reasonable basis for our opinion.
In our opinion, the financial statements and financial highlights referred to above present fairly, in all material respects, the financial position of Federated Municipal Securities Fund, Inc. at March 31, 2011, the results of its operations for the year then ended, the changes in its net assets for each of the two years in the period then ended, and the financial highlights for each of the periods indicated therein, in conformity with U.S. generally accepted accounting principles.
Boston, Massachusetts
May 24, 2011
Annual Shareholder Report52
Board of Directors and Fund Officers
The Board of Directors is responsible for managing the Fund's business affairs and for exercising all the Fund's powers except those reserved for the shareholders. The following tables give information about each Director and the senior officers of the Fund. Where required, the tables separately list Directors who are “interested persons” of the Fund (i.e., “Interested” Directors) and those who are not (i.e., “Independent” Directors). Unless otherwise noted, the address of each person listed is Federated Investors Tower, 1001 Liberty Avenue, Pittsburgh, PA 15222. The address of all Independent Directors listed is 4000 Ericsson Drive, Warrendale, PA 15086-7561; Attention: Mutual Fund Board. As of December 31, 2010, the Fund comprised one portfolio(s), and the Federated Fund Family consisted of 43 investment companies (comprising 136 portfolios). Unless otherwise noted, each Officer is elected annually. Unless otherwise noted, each Director oversees all portfolios in the Federated Fund Family and serves for an indefinite term. The Fund's Statement of Additional Information includes additional information about Fund Directors and is available, without charge and upon request, by calling 1-800-341-7400.
Interested DIRECTORS Background
Name
Birth Date
Positions Held with Fund
Date Service Began | Principal Occupation(s) for Past Five Years,
Other Directorships Held and Previous Position(s) |
John F. Donahue*
Birth Date: July 28, 1924
Director
Began serving: September 1976 | Principal Occupations : Director or Trustee of the Federated Fund Family; Chairman and Director, Federated Investors, Inc.; Chairman of the Federated Fund Family's Executive Committee.
Previous Positions : Chairman of the Federated Fund Family; Trustee, Federated Investment Management Company; Chairman and Director, Federated Investment Counseling. |
J. Christopher Donahue*
Birth Date: April 11, 1949
President and Director
Began serving: December 1986 | Principal Occupations : Principal Executive Officer and President of the Federated Fund Family; Director or Trustee of some of the Funds in the Federated Fund Family; President, Chief Executive Officer and Director, Federated Investors, Inc.; Chairman and Trustee, Federated Investment Management Company; Trustee, Federated Investment Counseling; Chairman and Director, Federated Global Investment Management Corp.; Chairman, Federated Equity Management Company of Pennsylvania and Passport Research, Ltd. (investment advisory subsidiary of Federated); Trustee, Federated Shareholder Services Company; Director, Federated Services Company.
Previous Positions : President, Federated Investment Counseling; President and Chief Executive Officer, Federated Investment Management Company, Federated Global Investment Management Corp. and Passport Research, Ltd. |
| * | Family relationships and reasons for “interested” status: John F. Donahue is the father of J. Christopher Donahue; both are “interested” due to their beneficial ownership of shares of Federated Investors, Inc. and the positions they hold with Federated and its subsidiaries. |
Annual Shareholder Report53
INDEPENDENT DIRECTORS Background
Name
Birth Date
Positions Held with Fund
Date Service Began | Principal Occupation(s) for Past Five Years,
Other Directorships Held, Previous Position(s) and Qualifications |
Nicholas P. Constantakis, CPA
Birth Date: September 3, 1939
Director
Began serving: February 1998 | Principal Occupation : Director or Trustee of the Federated Fund Family.
Other Directorship Held : Director and Chairman of the Audit Committee, Michael Baker Corporation (architecture, engineering and construction services).
Previous Position : Partner, Andersen Worldwide SC.
Qualifications : Public accounting and director experience. |
John F. Cunningham
Birth Date: March 5, 1943
Director
Began serving: June 1999 | Principal Occupation : Director or Trustee of the Federated Fund Family.
Other Directorships Held : Chairman, President and Chief Executive Officer, Cunningham & Co., Inc. (strategic business consulting); Trustee Associate, Boston College.
Previous Positions : Director, Redgate Communications and EMC Corporation (computer storage systems); Chairman of the Board and Chief Executive Officer, Computer Consoles, Inc.; President and Chief Operating Officer, Wang Laboratories; Director, First National Bank of Boston; Director, Apollo Computer, Inc.
Qualifications : Business management and director experience. |
Maureen Lally-Green
Birth Date: July 5, 1949
Director
Began serving: August 2009 | Principal Occupations : Director or Trustee of the Federated Fund Family; Director, Office of Church Relations, Diocese of Pittsburgh; Adjunct Professor of Law, Duquesne University School of Law.
Other Directorships Held : Director, Auberle; Trustee, St. Francis University; Director, Ireland Institute of Pittsburgh; Director, UPMC Mercy Hospital; Regent, St. Vincent Seminary; Director, Epilepsy Foundation of Western and Central Pennsylvania; Director, Saint Thomas More Society, Allegheny County; Director, Carlow University.
Previous Position : Pennsylvania Superior Court Judge.
Qualifications : Legal and director experience. |
Peter E. Madden
Birth Date: March 16, 1942
Director
Began serving: August 1991 | Principal Occupation : Director or Trustee, and Chairman of the Board of Directors or Trustees, of the Federated Fund Family.
Previous Positions : Representative, Commonwealth of Massachusetts General Court; President, Chief Operating Officer and Director, State Street Bank and Trust Company and State Street Corporation (retired); Director, VISA USA and VISA International; Chairman and Director, Massachusetts Bankers Association; Director, Depository Trust Corporation; Director, The Boston Stock Exchange.
Qualifications : Business management, mutual fund services and director experience. |
Annual Shareholder Report54
Name
Birth Date
Positions Held with Fund
Date Service Began | Principal Occupation(s) for Past Five Years,
Other Directorships Held, Previous Position(s) and Qualifications |
Charles F. Mansfield, Jr.
Birth Date: April 10, 1945
Director
Began serving: June 1999 | Principal Occupations : Director or Trustee and Chairman of the Audit Committee of the Federated Fund Family; Management Consultant.
Previous Positions : Chief Executive Officer, PBTC International Bank; Partner, Arthur Young & Company (now Ernst & Young LLP); Chief Financial Officer of Retail Banking Sector, Chase Manhattan Bank; Senior Vice President, HSBC Bank USA (formerly, Marine Midland Bank); Vice President, Citibank; Assistant Professor of Banking and Finance, Frank G. Zarb School of Business, Hofstra University; Executive Vice President, DVC Group, Inc. (marketing, communications and technology).
Qualifications : Banking, business management, education and director experience. |
R. James Nicholson
Birth Date: February 4, 1938
Director
Began serving: January 2008 | Principal Occupations : Director or Trustee of the Federated Fund Family; Senior Counsel, Brownstein Hyatt Farber Schrek, P.C.; Former Secretary of the U.S. Dept. of Veterans Affairs; Former U.S. Ambassador to the Holy See; Former Chairman of the Republican National Committee.
Other Directorships Held : Director, Horatio Alger Association; Director, The Daniels Fund.
Previous Positions : Colonel, U.S. Army Reserve; Partner, Calkins, Kramer, Grimshaw and Harring, P.C.; General Counsel, Colorado Association of Housing and Building; Chairman and CEO, Nicholson Enterprises, Inc. (real estate holding company); Chairman and CEO, Renaissance Homes of Colorado.
Qualifications : Legal, government, business management and director experience. |
Thomas M. O'Neill
Birth Date: June 14, 1951
Director
Began serving: October 2006 | Principal Occupations : Director or Trustee of the Federated Fund Family; Sole Proprietor, Navigator Management Company (investment and strategic consulting).
Other Directorships Held : Board of Overseers, Children's Hospital of Boston; Visiting Committee on Athletics, Harvard College.
Previous Positions : Chief Executive Officer and President, Managing Director and Chief Investment Officer, Fleet Investment Advisors; President and Chief Executive Officer, Aeltus Investment Management, Inc.; General Partner, Hellman, Jordan Management Co., Boston, MA; Chief Investment Officer, The Putnam Companies, Boston, MA; Credit Analyst and Lending Officer, Fleet Bank; Director and Consultant, EZE Castle Software (investment order management software); Director, Midway Pacific (lumber).
Qualifications : Business management, mutual fund, director and investment experience. |
Annual Shareholder Report55
Name
Birth Date
Positions Held with Fund
Date Service Began | Principal Occupation(s) for Past Five Years,
Other Directorships Held, Previous Position(s) and Qualifications |
John S. Walsh
Birth Date: November 28, 1957
Director
Began serving: January 1999 | Principal Occupations : Director or Trustee of the Federated Fund Family; President and Director, Heat Wagon, Inc. (manufacturer of construction temporary heaters); President and Director, Manufacturers Products, Inc. (distributor of portable construction heaters); President, Portable Heater Parts, a division of Manufacturers Products, Inc.
Previous Position : Vice President, Walsh & Kelly, Inc.
Qualifications : Business management and director experience. |
James F. Will
Birth Date: October 12, 1938
Director
Began serving: April 2006 | Principal Occupations : Director or Trustee of the Federated Fund Family; formerly, Vice Chancellor and President, Saint Vincent College.
Other Directorships Held : Trustee, Saint Vincent College; Director, Alleghany Corporation; Trustee, Wheeling Jesuit University; Director, Liberty Tire Recycling.
Previous Positions : Chairman, President and Chief Executive Officer, Armco, Inc.; President and Chief Executive Officer, Cyclops Industries; President and Chief Operating Officer, Kaiser Steel Corporation.
Qualifications : Business management, education and director experience. |
OFFICERS**
Name
Birth Date
Positions Held with Fund
Date Service Began | Principal Occupation(s) and Previous Position(s) |
John W. McGonigle
Birth Date: October 26, 1938
EXECUTIVE VICE PRESIDENT AND SECRETARY
Began serving: September 1976 | Principal Occupations : Executive Vice President and Secretary of the Federated Fund Family; Vice Chairman, Executive Vice President, Secretary and Director, Federated Investors, Inc.
Previous Positions : Trustee, Federated Investment Management Company and Federated Investment Counseling; Director, Federated Global Investment Management Corp., Federated Services Company and Federated Securities Corp. |
Richard A. Novak
Birth Date: December 25, 1963
TREASURER
Began serving: January 2006 | Principal Occupations : Principal Financial Officer and Treasurer of the Federated Fund Family; Senior Vice President, Federated Administrative Services; Financial and Operations Principal for Federated Securities Corp., Edgewood Services, Inc. and Southpointe Distribution Services, Inc.
Previous Positions : Controller of Federated Investors, Inc.; Vice President, Finance of Federated Services Company; held various financial management positions within The Mercy Hospital of Pittsburgh; Auditor, Arthur Andersen & Co. |
Annual Shareholder Report56
Name
Birth Date
Positions Held with Fund
Date Service Began | Principal Occupation(s) and Previous Position(s) |
Richard B. Fisher
Birth Date: May 17, 1923
VICE PRESIDENT
Began serving: January 1985 | Principal Occupations : Vice Chairman or Vice President of some of the Funds in the Federated Fund Family; Vice Chairman, Federated Investors, Inc.; Chairman, Federated Securities Corp.
Previous Positions : President and Director or Trustee of some of the Funds in the Federated Fund Family; Executive Vice President, Federated Investors, Inc.; Director and Chief Executive Officer, Federated Securities Corp. |
Brian P. Bouda
Birth Date: February 28, 1947
CHIEF COMPLIANCE OFFICER AND SENIOR VICE PRESIDENT
Began serving: August 2004 | Principal Occupations : Senior Vice President and Chief Compliance Officer of the Federated Fund Family; Vice President and Chief Compliance Officer of Federated Investors, Inc. and Chief Compliance Officer of its subsidiaries. Mr. Bouda joined Federated in 1999 and is a member of the American Bar Association and the State Bar Association of Wisconsin. |
Robert J. Ostrowski
Birth Date: April 26, 1963
CHIEF INVESTMENT OFFICER
Began serving: February 2010 | Principal Occupations : Robert J. Ostrowski joined Federated in 1987 as an Investment Analyst and became a Portfolio Manager in 1990. He was named Chief Investment Officer of taxable fixed-income products in 2004 and also serves as a Senior Portfolio Manager. He has been a Senior Vice President of the Fund's Adviser since 1997. Mr. Ostrowski has received the Chartered Financial Analyst designation. He received his M.S. in Industrial Administration from Carnegie Mellon University. |
J. Scott Albrecht
Birth Date: June 1, 1960
VICE PRESIDENT
Began serving: May 2004 | Principal Occupations : J. Scott Albrecht has been the Fund's portfolio manager since May 1996. He is Vice President of the Fund. Mr. Albrecht joined Federated in 1989. He became a Senior Vice President of the Fund's Adviser in January 2005 and served as a Vice President of the Fund's Adviser from 1994 through 2004. He has been a Senior Portfolio Manager since 1997 and was a Portfolio Manager from 1994 to 1996. Mr. Albrecht has received the Chartered Financial Analyst designation and holds an M.S. in Public Management from Carnegie Mellon University. |
Annual Shareholder Report57
Evaluation and Approval of Advisory Contract – May 2010
Federated Municipal Securities Fund, Inc. (the “Fund”)
The Fund's Board reviewed the Fund's investment advisory contract at meetings held in May 2010. The Board's decision regarding the contract reflects the exercise of its business judgment on whether to continue the existing arrangements.
In this connection, the Federated funds' Board had previously appointed a Senior Officer, whose duties include specified responsibilities relating to the process by which advisory fees are to be charged to a Federated fund. The Senior Officer has the authority to retain consultants, experts, or staff as may be reasonably necessary to assist in the performance of his duties, reports directly to the Board, and may be terminated only with the approval of a majority of the independent members of the Board. The Senior Officer prepared and furnished to the Board an independent, written evaluation that covered topics discussed below. The Board considered that evaluation, along with other information, in deciding to approve the advisory contract.
During its review of the contract, the Board considered compensation and benefits received by the Adviser. This included the fees received for services provided to the Fund by other entities in the Federated organization and research services (if any) received by the Adviser from brokers that execute Federated fund trades, as well as advisory fees. The Board is also familiar with and considered judicial decisions concerning allegedly excessive investment advisory fees, which have indicated that the following factors may be relevant to an Adviser's fiduciary duty with respect to its receipt of compensation from a fund: the nature and quality of the services provided by the Adviser, including the performance of the fund; the Adviser's cost of providing the services; the extent to which the Adviser may realize “economies of scale” as a fund grows larger; any indirect benefits that may accrue to the Adviser and its affiliates as a result of the Adviser's relationship with a fund; performance and expenses of comparable funds; and the extent to which the independent Board members are fully informed about all facts the Board deems relevant bearing on the Adviser's services and fees. The Board further considered management fees (including any components thereof) charged to institutional and other clients of the Adviser for what might be viewed as like services, and the cost to the Adviser and its affiliates of supplying services pursuant to the management fee agreements, excluding any intra-corporate profit and profit margins of the Adviser and its affiliates for supplying such services. The Board was aware of these factors and was guided by them in its review of the Fund's advisory contract to the extent it considered them to be appropriate and relevant, as discussed further below.
Annual Shareholder Report
58
The Board considered and weighed these circumstances in light of its substantial accumulated experience in governing the Fund and working with Federated on matters relating to the Federated funds, and was assisted in its deliberations by independent legal counsel. Throughout the year, the Board has requested and received substantial and detailed information about the Fund and the Federated organization that was in addition to the extensive materials that comprise and accompany the Senior Officer's evaluation. Federated provided much of this information at each regular meeting of the Board, and furnished additional reports in connection with the particular meeting at which the Board's formal review of the advisory contract occurred. Between regularly scheduled meetings, the Board also received information on particular matters as the need arose. Thus, the Board's consideration of the advisory contract included review of the Senior Officer's evaluation, accompanying data and additional reports covering such matters as: the Adviser's investment philosophy, revenue, profitability, personnel and processes; investment and operating strategies; the Fund's short- and long-term performance (in absolute terms, both on a gross basis and net of expenses, as well as in relationship to its particular investment program and certain competitor or “peer group” funds and/or other benchmarks, as appropriate), and comments on the reasons for performance; the Fund's investment objectives; the Fund's expenses (including the advisory fee itself and the overall expense structure of the Fund, both in absolute terms and relative to similar and/or competing funds, with due regard for contractual or voluntary expense limitations); the use and allocation of brokerage commissions derived from trading the Fund's portfolio securities (if any); and the nature, quality and extent of the advisory and other services provided to the Fund by the Adviser and its affiliates. The Board also considered the preferences and expectations of Fund shareholders and their relative sophistication; the continuing state of competition in the mutual fund industry and market practices; the range of comparable fees for similar funds in the mutual fund industry; the Fund's relationship to the Federated family of funds which include a comprehensive array of funds with different investment objectives, policies and strategies which are available for exchange without the incurrence of additional sales charges; compliance and audit reports concerning the Federated funds and the Federated companies that service them (including communications from regulatory agencies), as well as Federated's responses to any issues raised therein; and relevant developments in the mutual fund industry and how the Federated funds and/or Federated are responding to them. The Board's evaluation process is evolutionary. The criteria considered and the emphasis placed on relevant criteria change in recognition of changing circumstances in the mutual fund marketplace.With respect to the Fund's performance and expenses in particular, the Board has found the use of comparisons to other mutual funds with comparable investment programs to be relevant, given the high degree of competition in the mutual fund business. The Board focused on comparisons with other similar Annual Shareholder Report
59
mutual funds more heavily than non-mutual fund products or services because it is believed that they are more relevant. For example, other mutual funds are the products most like the Fund, they are readily available to Fund shareholders as alternative investment vehicles, and they are the type of investment vehicle in fact chosen and maintained by the Fund's investors. The range of their fees and expenses therefore appears to be a generally reliable indication of what consumers have found to be reasonable in the precise marketplace in which the Fund competes. The Fund's ability to deliver competitive performance when compared to its peer group was a useful indicator of how the Adviser is executing the Fund's investment program, which in turn assisted the Board in reaching a conclusion that the nature, extent, and quality of the Adviser's investment management services were such as to warrant continuation of the advisory contract. In this regard, the Senior Officer has reviewed Federated's fees for providing advisory services to products outside the Federated family of funds (e.g., institutional and separate accounts). He concluded that mutual funds and institutional accounts are inherently different products. Those differences include, but are not limited to, different types of targeted investors; being subject to different laws and regulations; different legal structures; different average account sizes; different associated costs; different portfolio management techniques made necessary by different cash flows; and portfolio manager time spent in review of securities pricing. The Senior Officer did not consider these fee schedules to be determinative in judging the appropriateness of mutual fund advisory contracts.The Senior Officer reviewed reports compiled by Federated, using data supplied by independent fund ranking organizations, regarding the performance of, and fees charged by, other mutual funds, noting his view that comparisons to fund peer groups are relevant in judging the reasonableness of proposed fees.
The Fund's performance fell below the median of the relevant peer group for the one-year, three-year and five-year periods covered by the report. The Board discussed the Fund's performance with the Adviser and recognized the efforts being undertaken by the Adviser. The Board will continue to monitor these efforts and the performance of the Fund.
The Board also received financial information about Federated, including reports on the compensation and benefits Federated derived from its relationships with the Federated funds. These reports covered not only the fees under the advisory contracts, but also fees received by Federated's subsidiaries for providing other services to the Federated funds under separate contracts (e.g., for serving as the Federated funds' administrator). The reports also discussed any indirect benefit Federated may derive from its receipt of research services from brokers who execute Federated fund trades. In addition, the Board considered the fact that, in order for a fund to be competitive in the marketplace, Federated and its affiliates frequently waived fees and/or Annual Shareholder Report
60
reimbursed expenses and have disclosed to fund investors and/or indicated to the Board their intention to do so in the future, where appropriate. Moreover, the Board receives regular reports regarding the institution or elimination of these voluntary waivers.Federated furnished reports, requested by the Senior Officer, that reported revenues on a fund-by-fund basis and made estimates of the allocation of expenses on a fund-by-fund basis, using allocation methodologies specified by the Senior Officer. The Senior Officer noted that, although they may apply consistent allocation processes, the inherent difficulties in allocating costs (and the unavoidable arbitrary aspects of that exercise) and the lack of consensus on how to allocate those costs may render such allocation reports unreliable. The allocation reports were considered in the analysis by the Board but were determined to be of limited use.
The Board and the Senior Officer also reviewed a report compiled by Federated comparing profitability information for Federated to other publicly held fund management companies. In this regard, the Senior Officer noted the limited availability of such information, but nonetheless concluded that Federated's profit margins did not appear to be excessive and the Board agreed.
The Senior Officer's evaluation also discussed the notion of possible realization of “economies of scale” as a fund grows larger. The Board considered in this regard that the Adviser has made significant and long-term investments in areas that support all of the Federated funds, such as personnel and processes for the portfolio management, compliance, and risk management functions; and systems technology; and that the benefits of these efforts (as well as any economies, should they exist) were likely to be enjoyed by the fund complex as a whole. Finally, the Board also noted the absence of any applicable regulatory or industry guidelines on this subject, which (as discussed in the Senior Officer's evaluation) is compounded by the lack of any common industry practice or general pattern with respect to structuring fund advisory fees with “breakpoints” that serve to reduce the fee as the fund attains a certain size. The Senior Officer did not recommend institution of breakpoints in pricing Federated's fund advisory services at this time.
It was noted in the materials for the Board meeting that for the period covered by the report, the Fund's investment advisory fee, after waivers and expense reimbursements, if any, was above the median of the relevant peer group. The Board reviewed the fees and other expenses of the Fund with the Adviser and was satisfied that the overall expense structure of the Fund remained competitive. The Board will continue to monitor advisory fees and other expenses borne by the Fund.
The Senior Officer's evaluation noted his belief that the information and observations contained in his evaluation supported a finding that the proposed management fees are reasonable, and that Federated appeared to provide appropriate administrative services to the Fund for the fees paid. Under these Annual Shareholder Report
61
circumstances, no changes were recommended to, and no objection was raised to, the continuation of the Fund's advisory contract. The Board concluded that the nature, quality and scope of services provided the Fund by the Adviser and its affiliates were satisfactory.In its decision to continue an existing investment advisory contract, the Board was mindful of the potential disruptions of the Fund's operations and various risks, uncertainties and other effects that could occur as a result of a decision to terminate or not renew an advisory contract. In particular, the Board recognized that many shareholders have invested in the Fund on the strength of the Adviser's industry standing and reputation and with the expectation that the Adviser will have a continuing role in providing advisory services to the Fund. Thus, the Board's approval of the advisory contract reflected the fact that it is the shareholders who have effectively selected the Adviser by virtue of having invested in the Fund.
The Board based its decision to approve the advisory contract on the totality of the circumstances and relevant factors and with a view to past and future long-term considerations. Not all of the factors and considerations identified above were necessarily relevant to the Fund, nor did the Board consider any one of them to be determinative. With respect to the factors that were relevant, the Board's decision to approve the contract reflects its determination that Federated's performance and actions provided a satisfactory basis to support the decision to continue the existing arrangements.
Annual Shareholder Report62
Voting Proxies on Fund Portfolio Securities
A description of the policies and procedures that the Fund uses to determine how to vote proxies, if any, relating to securities held in the Fund's portfolio is available, without charge and upon request, by calling 1-800-341-7400. A report on “Form N-PX” of how the Fund voted any such proxies during the most recent 12-month period ended June 30 is available from Federated's website at FederatedInvestors.com. To access this information from the home page, select “View All” next to “Find Products.” Select a fund name and share class, if applicable, to go to the Fund Overview page. On the Fund Overview page, select the “Documents” tab. At the bottom of that page, select “Proxy Voting Record Report (Form N-PX).” Form N-PX filings are also available at the SEC's website at www.sec.gov.
Quarterly Portfolio Schedule
The Fund files with the SEC a complete schedule of its portfolio holdings, as of the close of the first and third quarters of its fiscal year, on “Form N-Q.” These filings are available on the SEC's website at www.sec.gov and may be reviewed and copied at the SEC's Public Reference Room in Washington, DC. (Call 1-800-SEC-0330 for information on the operation of the Public Reference Room.) You may also access this information from the “Products” section of Federated's website at FederatedInvestors.com. From the home page, select “View All” next to “Find Products.” Select a fund name and share class, if applicable, to go to the Fund Overview page. On the Fund Overview page, select the “Documents” tab. At the bottom of that page, select “Form N-Q.”
Annual Shareholder Report63
Mutual funds are not bank deposits or obligations, are not guaranteed by any bank and are not insured or guaranteed by the U.S. government, the Federal Deposit Insurance Corporation, the Federal Reserve Board or any other government agency. Investment in mutual funds involves investment risk, including the possible loss of principal.
This Report is authorized for distribution to prospective investors only when preceded or accompanied by the Fund's Prospectus, which contains facts concerning its objective and policies, management fees, expenses and other information.
Federated Municipal Securities Fund, Inc.
Federated Investors Funds
4000 Ericsson Drive
Warrendale, PA 15086-7561
Contact us at FederatedInvestors.com
or call 1-800-341-7400.
Federated Securities Corp., Distributor
Cusip 313913105
Cusip 313913204
Cusip 313913303
Cusip 313913402
8042830 (5/11)
Federated is a registered trademark of Federated Investors, Inc.
2011 © Federated Investors, Inc.
Item 2. Code of Ethics
(a) As of the end of the period covered by this report, the registrant has adopted a code of ethics (the "Section 406 Standards for Investment Companies - Ethical Standards for Principal Executive and Financial Officers") that applies to the registrant's Principal Executive Officer and Principal Financial Officer; the registrant's Principal Financial Officer also serves as the Principal Accounting Officer.
(c) Not Applicable
(d) Not Applicable
(e) Not Applicable
(f)(3) The registrant hereby undertakes to provide any person, without charge, upon request, a copy of the code of ethics. To request a copy of the code of ethics, contact the registrant at 1-800-341-7400, and ask for a copy of the Section 406 Standards for Investment Companies - Ethical Standards for Principal Executive and Financial Officers.
Item 3. Audit Committee Financial Expert
The registrant's Board has determined that each of the following members of the Board's Audit Committee is an “audit committee financial expert,” and is "independent," for purposes of this Item: Nicholas P. Constantakis, Charles F. Mansfield, Jr., Thomas M. O'Neill and John S. Walsh.
Item 4. Principal Accountant Fees and Services
(a) Audit Fees billed to the registrant for the two most recent fiscal years:
Fiscal year ended 2011 - $23,500
Fiscal year ended 2010 - $23,500
(b) Audit-Related Fees billed to the registrant for the two most recent fiscal years:
Fiscal year ended 2011 - $24
Fiscal year ended 2010 - $31
Travel to Audit Committee Meeting.
Amount requiring approval of the registrant’s audit committee pursuant to paragraph (c)(7)(ii) of Rule 2-01 of Regulation S-X, $0 and $4,506 respectively. Fiscal year ended 2010- Audit consent fee for N-14 merger document.
(c) Tax Fees billed to the registrant for the two most recent fiscal years:
Fiscal year ended 2011 - $0
Fiscal year ended 2010 - $0
Amount requiring approval of the registrant’s audit committee pursuant to paragraph (c)(7)(ii) of Rule 2-01 of Regulation S-X, $0 and $0 respectively.
(d) All Other Fees billed to the registrant for the two most recent fiscal years:
Fiscal year ended 2011 - $0
Fiscal year ended 2010 - $0
Amount requiring approval of the registrant’s audit committee pursuant to paragraph (c)(7)(ii) of Rule 2-01 of Regulation S-X, $0 and $0 respectively.
(e)(1) Audit Committee Policies regarding Pre-approval of Services.
The Audit Committee is required to pre-approve audit and non-audit services performed by the independent auditor in order to assure that the provision of such services do not impair the auditor’s independence. Unless a type of service to be provided by the independent auditor has received general pre-approval, it will require specific pre-approval by the Audit Committee. Any proposed services exceeding pre-approved cost levels will require specific pre-approval by the Audit Committee.
Certain services have the general pre-approval of the Audit Committee. The term of the general pre-approval is 12 months from the date of pre-approval, unless the Audit Committee specifically provides for a different period. The Audit Committee will annually review the services that may be provided by the independent auditor without obtaining specific pre-approval from the Audit Committee and may grant general pre-approval for such services. The Audit Committee will revise the list of general pre-approved services from time to time, based on subsequent determinations. The Audit Committee will not delegate its responsibilities to pre-approve services performed by the independent auditor to management.
The Audit Committee has delegated pre-approval authority to its Chairman. The Chairman will report any pre-approval decisions to the Audit Committee at its next scheduled meeting. The Committee will designate another member with such pre-approval authority when the Chairman is unavailable.
AUDIT SERVICES
The annual Audit services engagement terms and fees will be subject to the specific pre-approval of the Audit Committee. The Audit Committee must approve any changes in terms, conditions and fees resulting from changes in audit scope, registered investment company (RIC) structure or other matters.
In addition to the annual Audit services engagement specifically approved by the Audit Committee, the Audit Committee may grant general pre-approval for other Audit Services, which are those services that only the independent auditor reasonably can provide. The Audit Committee has pre-approved certain Audit services, all other Audit services must be specifically pre-approved by the Audit Committee.
AUDIT-RELATED SERVICES
Audit-related services are assurance and related services that are reasonably related to the performance of the audit or review of the Company’s financial statements or that are traditionally performed by the independent auditor. The Audit Committee believes that the provision of Audit-related services does not impair the independence of the auditor, and has pre-approved certain Audit-related services, all other Audit-related services must be specifically pre-approved by the Audit Committee.
TAX SERVICES
The Audit Committee believes that the independent auditor can provide Tax services to the Company such as tax compliance, tax planning and tax advice without impairing the auditor’s independence. However, the Audit Committee will not permit the retention of the independent auditor in connection with a transaction initially recommended by the independent auditor, the purpose of which may be tax avoidance and the tax treatment of which may not be supported in the Internal Revenue Code and related regulations. The Audit Committee has pre-approved certain Tax services, all Tax services involving large and complex transactions must be specifically pre-approved by the Audit Committee.
ALL OTHER SERVICES
With respect to the provision of services other than audit, review or attest services the pre-approval requirement is waived if:
| (1) | The aggregate amount of all such services provided constitutes no more than five percent of the total amount of revenues paid by the registrant, the registrant’s adviser (not including any sub-adviser whose role is primarily portfolio management and is subcontracted with or overseen by another investment adviser), and any entity controlling, controlled by, or under common control with the investment adviser that provides ongoing services to the registrant to its accountant during the fiscal year in which the services are provided; |
| (2) | Such services were not recognized by the registrant, the registrant’s adviser (not including any sub-adviser whose role is primarily portfolio management and is subcontracted with or overseen by another investment adviser), and any entity controlling, controlled by, or under common control with the investment adviser that provides ongoing services to the registrant at the time of the engagement to be non-audit services; and |
| (3) | Such services are promptly brought to the attention of the Audit Committee of the issuer and approved prior to the completion of the audit by the Audit Committee or by one or more members of the Audit Committee who are members of the board of directors to whom authority to grant such approvals has been delegated by the Audit Committee. |
The Audit Committee may grant general pre-approval to those permissible non-audit services classified as All Other services that it believes are routine and recurring services, and would not impair the independence of the auditor.
The SEC’s rules and relevant guidance should be consulted to determine the precise definitions of prohibited non-audit services and the applicability of exceptions to certain of the prohibitions.
PRE-APPROVAL FEE LEVELS
Pre-approval fee levels for all services to be provided by the independent auditor will be established annually by the Audit Committee. Any proposed services exceeding these levels will require specific pre-approval by the Audit Committee.
PROCEDURES
Requests or applications to provide services that require specific approval by the Audit Committee will be submitted to the Audit Committee by both the independent auditor and the Principal Accounting Officer and/or Internal Auditor, and must include a joint statement as to whether, in their view, the request or application is consistent with the SEC’s rules on auditor independence.
(e)(2) Percentage of services identified in items 4(b) through 4(d) that were approved by the registrants audit committee pursuant to paragraph (c)(7)(i)(C) of Rule 2-01 of Regulation S-X:
4(b)
Fiscal year ended 2011 – 0%
Fiscal year ended 2010 - 0%
Percentage of services provided to the registrants investment adviser and any entity controlling, controlled by, or under common control with the investment adviser that provides ongoing services to the registrant that were approved by the registrants audit committee pursuant to paragraph (c)(7)(i)(C) of Rule 2-01 of Regulation S-X, 0% and 0% respectively.
4(c)
Fiscal year ended 2011 – 0%
Fiscal year ended 2010 – 0%
Percentage of services provided to the registrants investment adviser and any entity controlling, controlled by, or under common control with the investment adviser that provides ongoing services to the registrant that were approved by the registrants audit committee pursuant to paragraph (c)(7)(i)(C) of Rule 2-01 of Regulation S-X, 0% and 0% respectively.
4(d)
Fiscal year ended 2011 – 0%
Fiscal year ended 2010 – 0%
Percentage of services provided to the registrants investment adviser and any entity controlling, controlled by, or under common control with the investment adviser that provides ongoing services to the registrant that were approved by the registrants audit committee pursuant to paragraph (c)(7)(i)(C) of Rule 2-01 of Regulation S-X, 0% and 0% respectively.
| (g) | Non-Audit Fees billed to the registrant, the registrant’s investment adviser, and certain entities controlling, controlled by or under common control with the investment adviser: |
Fiscal year ended 2011 - $292,632
Fiscal year ended 2010 - $358,115
| (h) | The registrant’s Audit Committee has considered that the provision of non-audit services that were rendered to the registrant’s adviser (not including any sub-adviser whose role is primarily portfolio management and is subcontracted with or overseen by another investment adviser), and any entity controlling, controlled by, or under common control with the investment adviser that provides ongoing services to the registrant that were not pre-approved pursuant to paragraph (c)(7)(ii) of Rule 2-01 of Regulation S-X is compatible with maintaining the principal accountant’s independence. |
Item 5. Audit Committee of Listed Registrants
Not Applicable
Item 6. Schedule of Investments
Not Applicable
| Item 7. | Disclosure of Proxy Voting Policies and Procedures for Closed-End Management Investment Companies |
| Item 8. | Portfolio Managers of Closed-End Management Investment Companies |
| Item 9. | Purchases of Equity Securities by Closed-End Management Investment Company and Affiliated Purchasers |
Item 10. Submission of Matters to a Vote of Security Holders
Not Applicable
Item 11. Controls and Procedures
(a) The registrant’s President and Treasurer have concluded that the
registrant’s disclosure controls and procedures (as defined in rule 30a-3(c) under the Act) are effective in design and operation and are sufficient to form the basis of the certifications required by Rule 30a-(2) under the Act, based on their evaluation of these disclosure controls and procedures within 90 days of the filing date of this report on Form N-CSR.
(b) There were no changes in the registrant’s internal control over financial reporting (as defined in rule 30a-3(d) under the Act) during the second fiscal quarter of the period covered by this report that have materially affected, or are reasonably likely to materially affect, the registrant’s internal control over financial reporting.
Item 12. Exhibits
SIGNATURES
Pursuant to the requirements of the Securities Exchange Act of 1934 and the Investment Company Act of 1940, the registrant has duly caused this report to be signed on its behalf by the undersigned, thereunto duly authorized.
Registrant Federated Municipal Securities Fund, Inc.
By /S/Richard A. Novak
Richard A. Novak, Principal Financial Officer
Date May 23, 2011
Pursuant to the requirements of the Securities Exchange Act of 1934 and the Investment Company Act of 1940, this report has been signed below by the following persons on behalf of the registrant and in the capacities and on the dates indicated.
By /S/J. Christopher Donahue
J. Christopher Donahue, Principal Executive Officer
Date May 23, 2011
By /S/Richard A. Novak
Richard A. Novak, Principal Financial Officer
Date May 23, 2011