Filed Pursuant to Rule 433 of the Securities Act of 1933
Issuer Free Writing Prospectus dated November 21, 2024
Relating to the Preliminary Prospectus dated November 18, 2024
Registration No. 333-281853
Investor Presentation
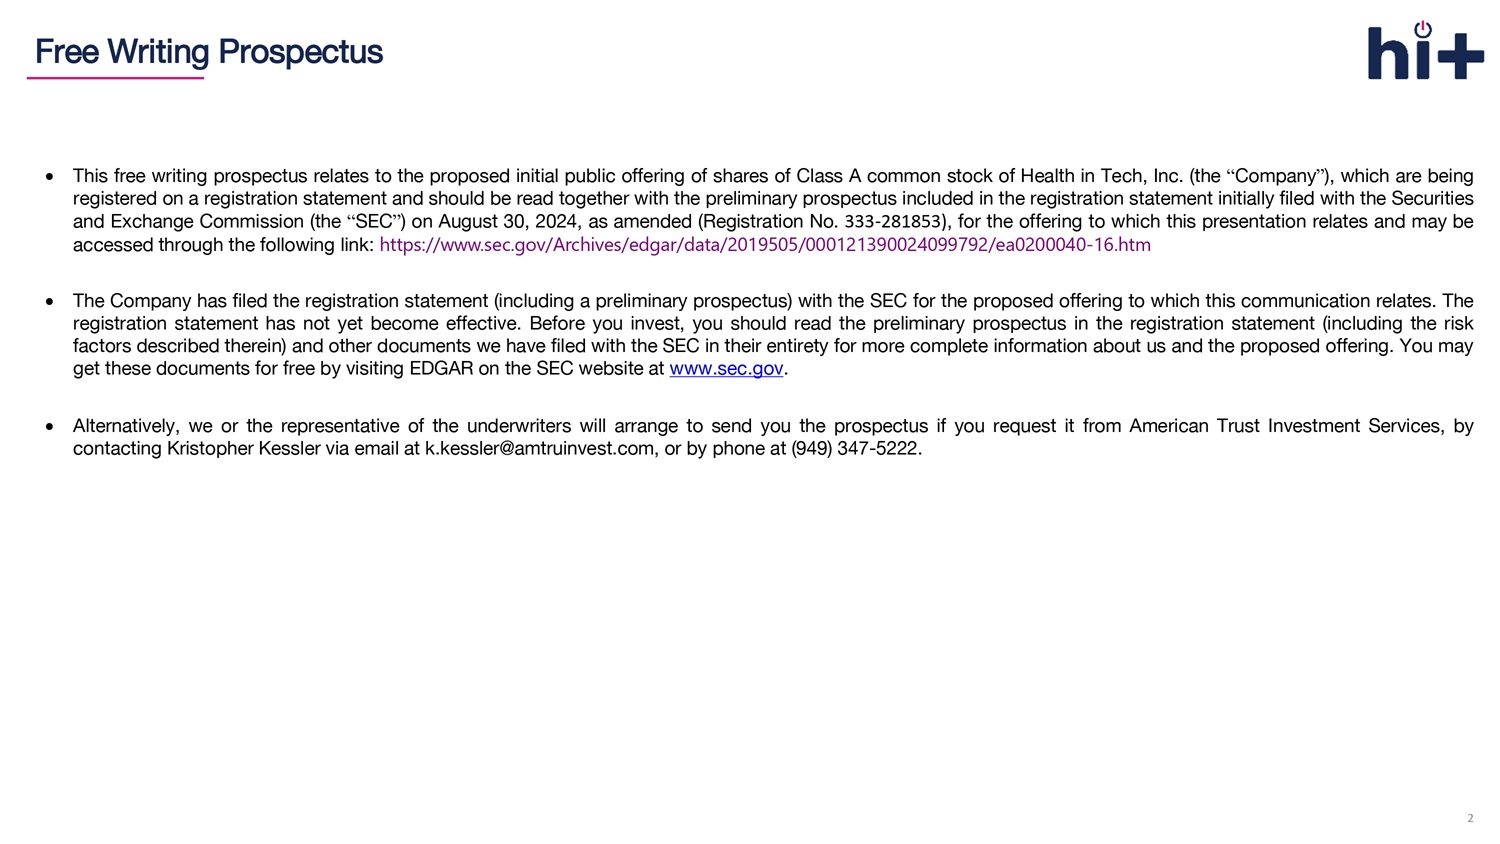
This free writing prospectus relates to the proposed initial public offering of shares of Class A common stock of Health in Tech, Inc . (the “ Company ” ), which are being registered on a registration statement and should be read together with the preliminary prospectus included in the registration statement initially filed with the Securities and Exchange Commission (the “ SEC ” ) on August 30 , 2024 , as amended (Registration No . 333 - 281853 ) , for the offering to which this presentation relates and may be accessed through the following link : https : //www . sec . gov/Archives/edgar/data/ 2019505 / 000121390024099792 /ea 0200040 - 16 . htm The Company has filed the registration statement (including a preliminary prospectus) with the SEC for the proposed offering to which this communication relates . The registration statement has not yet become effective . Before you invest, you should read the preliminary prospectus in the registration statement (including the risk factors described therein) and other documents we have filed with the SEC in their entirety for more complete information about us and the proposed offering . You may get these documents for free by visiting EDGAR on the SEC website at www . sec . gov . Alternatively, we or the representative of the underwriters will arrange to send you the prospectus if you request it from American Trust Investment Services, by contacting Kristopher Kessler via email at k . kessler@amtruinvest . com, or by phone at ( 949 ) 347 - 5222 . 2 Free Writing Prospectus
Disclaimer 3 This Presentation has been prepared by the Company solely for informational purposes . The information included herein in this presentation has not been independently verified . No representations, warranties or undertakings, express or implied, are made by the Company or any of it’ s affiliates, advisers or representatives or the underwriters as to, and no reliance should be placed upon, the accuracy, fairness, completeness or correctness of the information or opinions presented or contained in this presentation . By viewing or accessing the information contained in this presentation, you acknowledge and agree that none of the Company or any of its affiliates, advisers or representatives or the underwriters accept any responsibility whatsoever (in negligence or otherwise) for any loss howsoever arising from any information presented or contained in this presentation or otherwise arising in connection with the presentation . The information presented or contained in this presentation is subject to change without notice and its accuracy is not guaranteed . None of the Company or any of its affiliates, advisers or representatives or the underwriters make any undertaking to update any such information subsequent to the date hereof . This presentation should not be construed as legal, tax, investment or other advice . This presentation contains statements that reflect the Company’s intent, beliefs or current expectations about the future . These statements can be recognized by the use of words such as “ expects, ” “ plans, ” “ will, ” “ estimates, ” “ projects, ” “ intends, ” or words of similar meaning . These forward - looking statements are not guarantees of future performance and are based on a number of assumptions about the Company’s operations and other factors, many of which are beyond the Company’s control, and accordingly, actual results may differ materially from these forward - looking statements . Caution should be taken with respect to such statements, and you should not place undue reliance on any such forward looking statements . The Company or any of its affiliates, advisers or representatives or the underwriters has no obligation and does not undertake to revise forward looking statements to reflect newly available information, future events or circumstances . This presentation does not constitute an offer to sell or an invitation to purchase or subscribe for any securities of the Company for sale in the United States or anywhere else . No part of this presentation shall form the basis of or be relied upon in connection with any contract or commitment whatsoever . Specifically, these materials do not constitute a “ prospectus ” within the meaning of the U . S . Securities Act of 1933 , as amended, and the regulations enacted thereunder . This presentation does not contain all relevant information relating to the Company or its securities, particularly with respect to the risks and special considerations involved with an investment in the securities of the Company . In evaluating its business, the Company uses certain non - GAAP measures as supplemental measures to review and assess its operating and financial performance . These non - GAAP financial measures have limitations as analytical tools, and when assessing the Company’s operating and financial performances, investors should not consider them in isolation, or as a substitute for any consolidated statement of operations data prepared in accordance with U . S . GAAP . As participants of this presentation, you agree not to photograph, copy or otherwise reproduce this presentation in any form or pass on this presentation to any other person for any purpose .
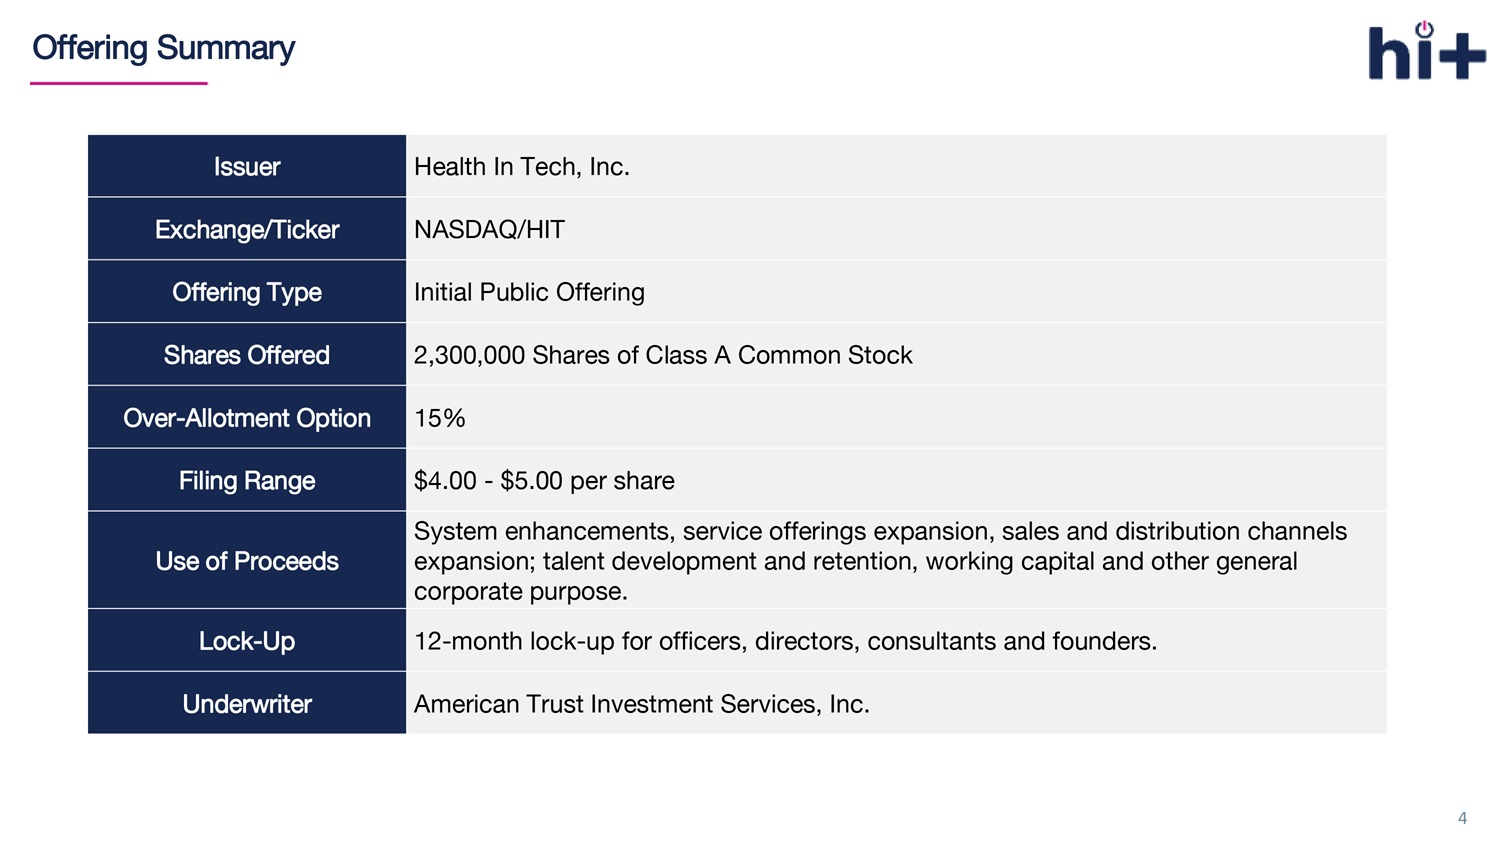
O ffering Summary 4 Health In Tech, Inc. Issuer NASDAQ/ HIT Exchange/Ticker Initial Public Offering Offering Type 2,300,000 Shares of Class A Common Stock Shares Offered 15% Over - Allotment Option $4.00 - $5.00 per share Filing Range System enhancements, service offerings expansion , sales and distribution channels expansion; talent development and retention, working capital and other general corporate purpose. Use of Proceeds 12 - month lock - up for officers, directors, consultants and founders. Lock - Up American Trust Investment Services, Inc. Underwriter
Health In Tech is Changing Healthcare through Digital Innovation 5

Our Mission Mission To change the nontransparent US $4. 5 T healthcare industry with innovation that removes friction and complexities with vertical integration, process simplification, automation, and digitalization. 6

Company Snapshot • An insurance technology platform company which offers a marketplace that aims to improve process in the healthcare industry through vertical integration , process simplification, and automation. • AI backed sales platform provides self - funded health benefits plans and stop loss insurance policies for small businesses in about two minutes. • Single, standardized transaction and service platform provides 24/7 secured access from medical records to coverage eligibility. • Diversified products and services for small businesses. • As of December 2023 • Policy amount includes all premium and other expense business pays for medical insurance plan • Number of lives billed end of period 2 .32x YoY Revenue Growth ~$191M Total Policies sold* 21,213 Enrolled Employees* 42 States 1,002 Business clients 300 + Brokers, TPAs and additional third - party agencies 7
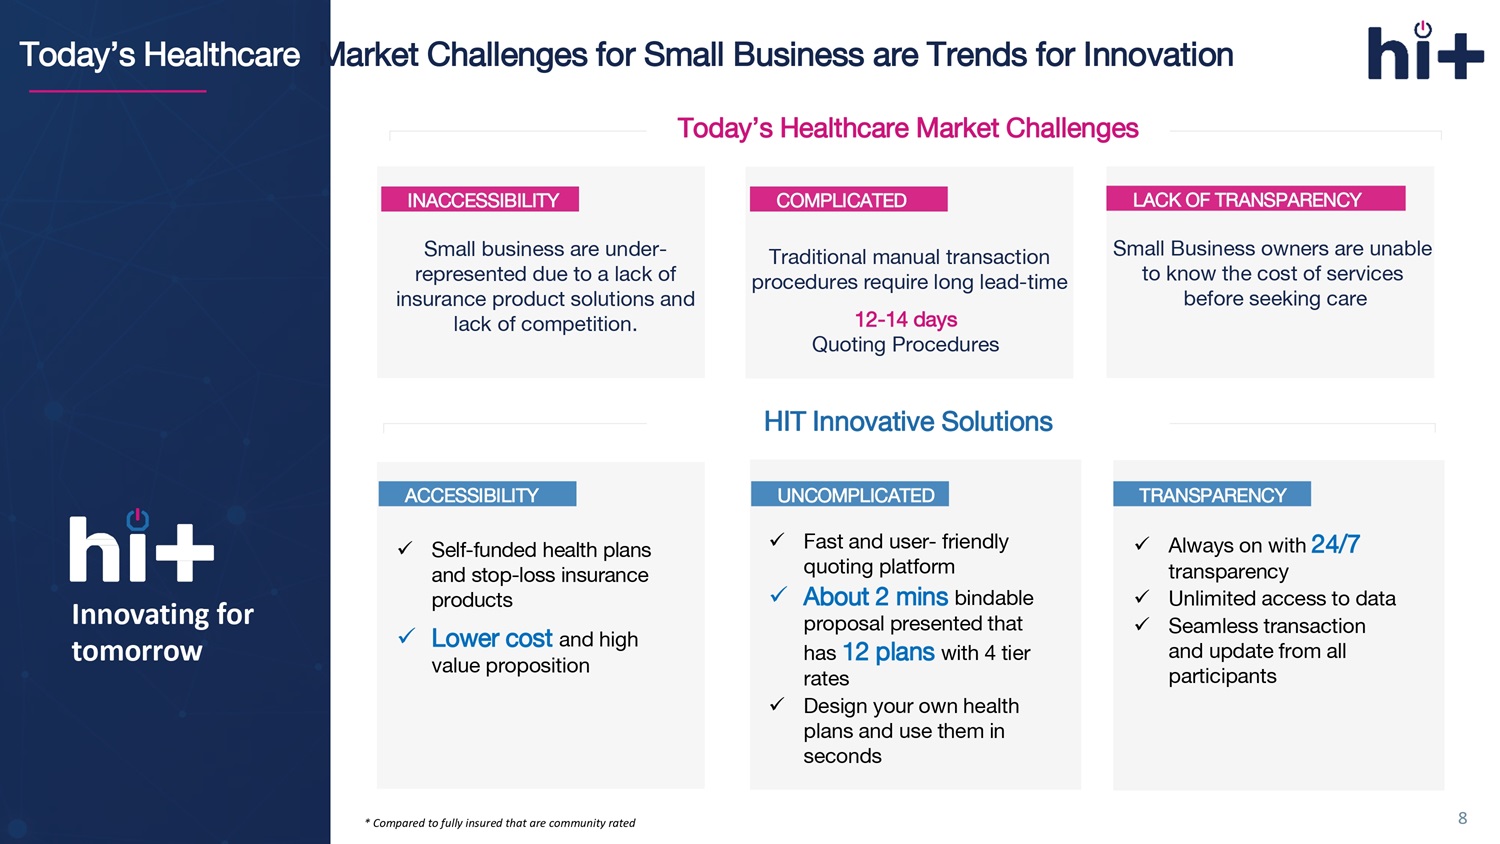
Today’s Healthcare Market Challenges for Small Business are Trends for Innovation Innovating for tomorrow INACCESSIBILITY COMPLICATED LACK OF TRANSPARENCY Small business are under - represented due to a lack of insurance product solutions and lack of competition. Traditional manual transaction procedures require long lead - time 12 - 14 days Quoting Procedures Small Business owners are unable to know the cost of services before seeking care x Self - funded health plans and stop - loss insurance products x L ower cost and high value proposition x Fast and user - friendly quoting platform x About 2 mins bindable proposal presented that has 12 plans with 4 tier rates x Design your own health plans and use them in seconds x Always on with 24/7 transparency x Unlimited access to data x Seamless transaction and update from all participants Today’s Healthcare Market Challenges HIT Innovative Solutions ACCESSIBILITY UNCOMPLICATED TRANSPARENCY 8 * Compared to fully insured that are community rated
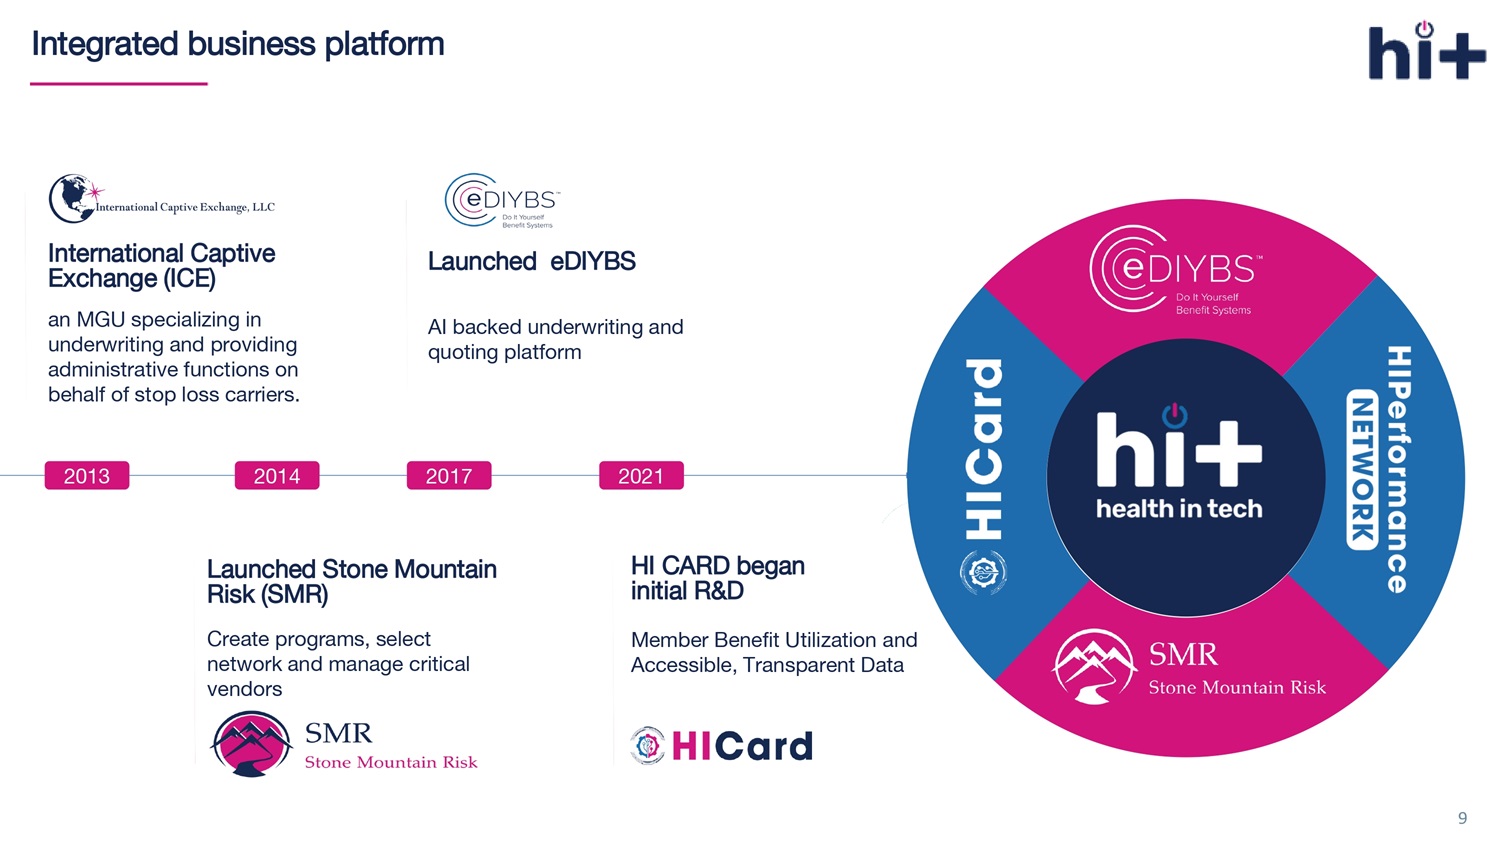
Integrated business platform 2006 2008 2017 9 International Captive Exchange (ICE) 2013 an MGU specializing in underwriting and providing administrative functions on behalf of stop loss carriers. 2014 Launched Stone Mountain Risk (SMR) Create programs, select network and manage critical vendors 2017 Launched eDIYBS AI backed underwriting and quoting platform HI CARD began initial R&D 2021 Member Benefit Utilization and Accessible, Transparent Data
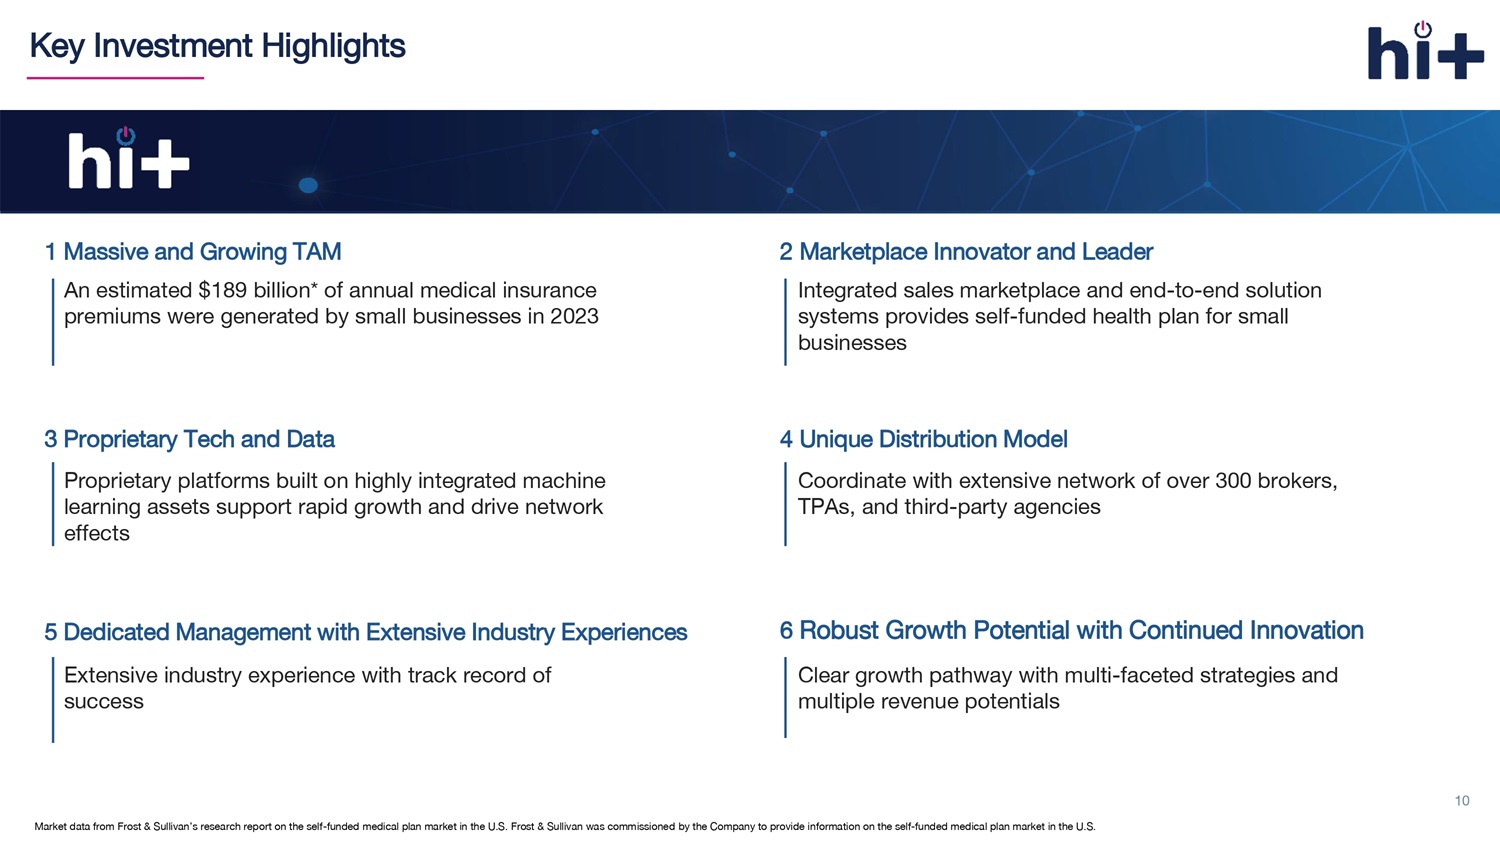
1 Massive and Growing TAM An estimated $189 billion* of annual medical insurance premiums were generated by small businesses in 2023 2 Marketplace Innovator and Leader Integrated sales marketplace and end - to - end solution systems provides self - funded health plan for small businesses 4 Unique Distribution Model Coordinate with extensive network of over 300 brokers, TPAs, and third - party agencies 5 Dedicated Management with Extensive Industry Experiences Extensive industry experience with track record of success 3 Proprietary Tech and Data Proprietary platforms built on highly integrated machine learning assets support rapid growth and drive network effects 6 Robust Growth Potential with Continued Innovation Key Investment Highlights Clear growth pathway with multi - faceted strategies and multiple revenue potentials 10 Market data from Frost & Sullivan’s research report on the self - funded medical plan market in the U.S. Frost & Sullivan was comm issioned by the Company to provide information on the self - funded medical plan market in the U.S.
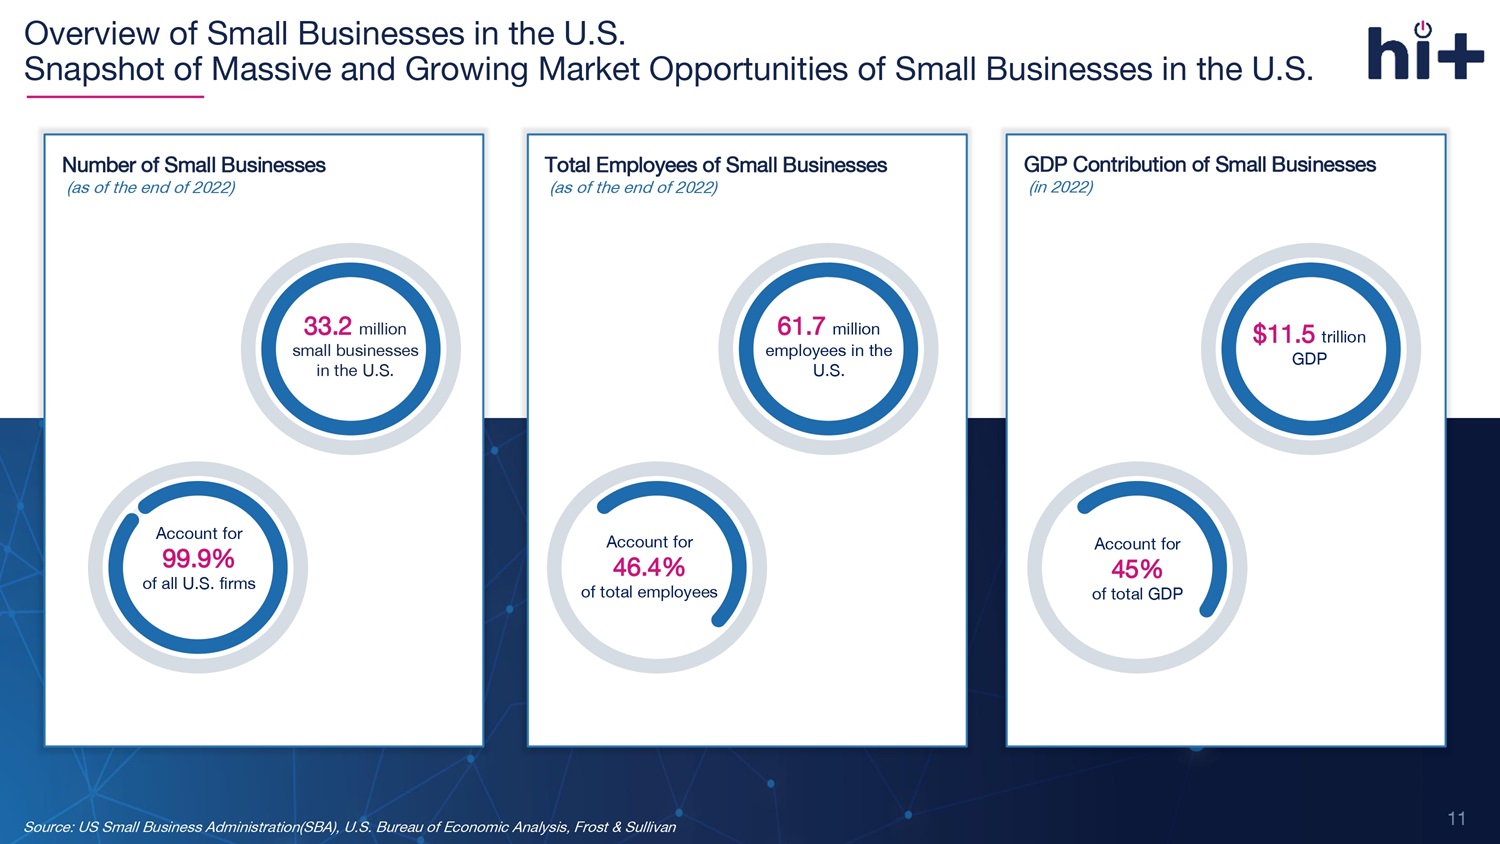
Source: US Small Business Administration(SBA), U.S. Bureau of Economic Analysis, Frost & Sullivan Account for 99.9% of all U.S. firms 61.7 million employees in the U.S. Account for 46.4% of total employees Total Employees of Small Businesses (as of the end of 2022) $11.5 trillion GDP Account for 45% of total GDP GDP Contribution of Small Businesses (in 202 2 ) 33.2 million small businesses in the U.S. Number of Small Businesses (as of the end of 202 2 ) Account for 99.9% of all U.S. firms Overview of Small Businesses in the U.S. Snapshot of Massive and Growing Market Opportunities of Small Businesses in the U.S. 11
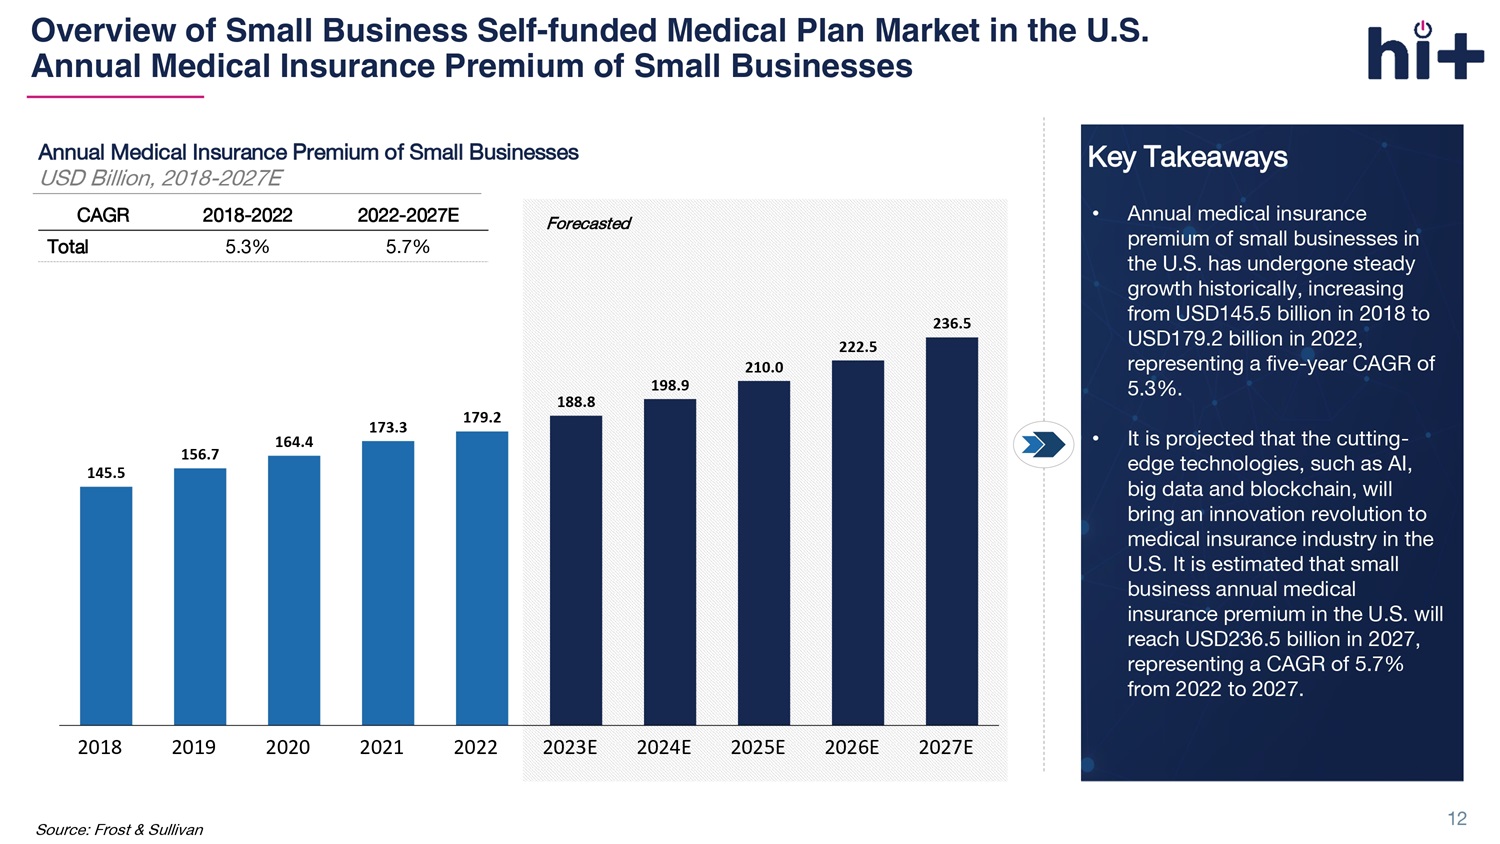
Overview of Small Business Self - funded Medical Plan Market in the U.S. Annual Medical Insurance Premium of Small Businesses Source: Frost & Sullivan Forecasted Annual Medical Insurance Premium of Small Businesses USD Billion, 2018 - 2027E 145.5 156.7 164.4 173.3 179.2 188.8 198.9 210.0 222.5 236.5 2018 2019 2020 2021 2022 2023E 2024E 2025E 2026E 2027E 2022 - 2027E 2018 - 2022 CAGR 5.7% 5.3% Total Key Takeaways • Annual medical insurance premium of small businesses in the U.S. has undergone steady growth historically, increasing from USD145.5 billion in 2018 to USD179.2 billion in 2022, representing a five - year CAGR of 5.3%. • It is projected that the cutting - edge technologies, such as AI, big data and blockchain, will bring an innovation revolution to medical insurance industry in the U.S. It is estimated that small business annual medical insurance premium in the U.S. will reach USD236.5 billion in 2027, representing a CAGR of 5.7% from 2022 to 2027. 12 yw0JQ1
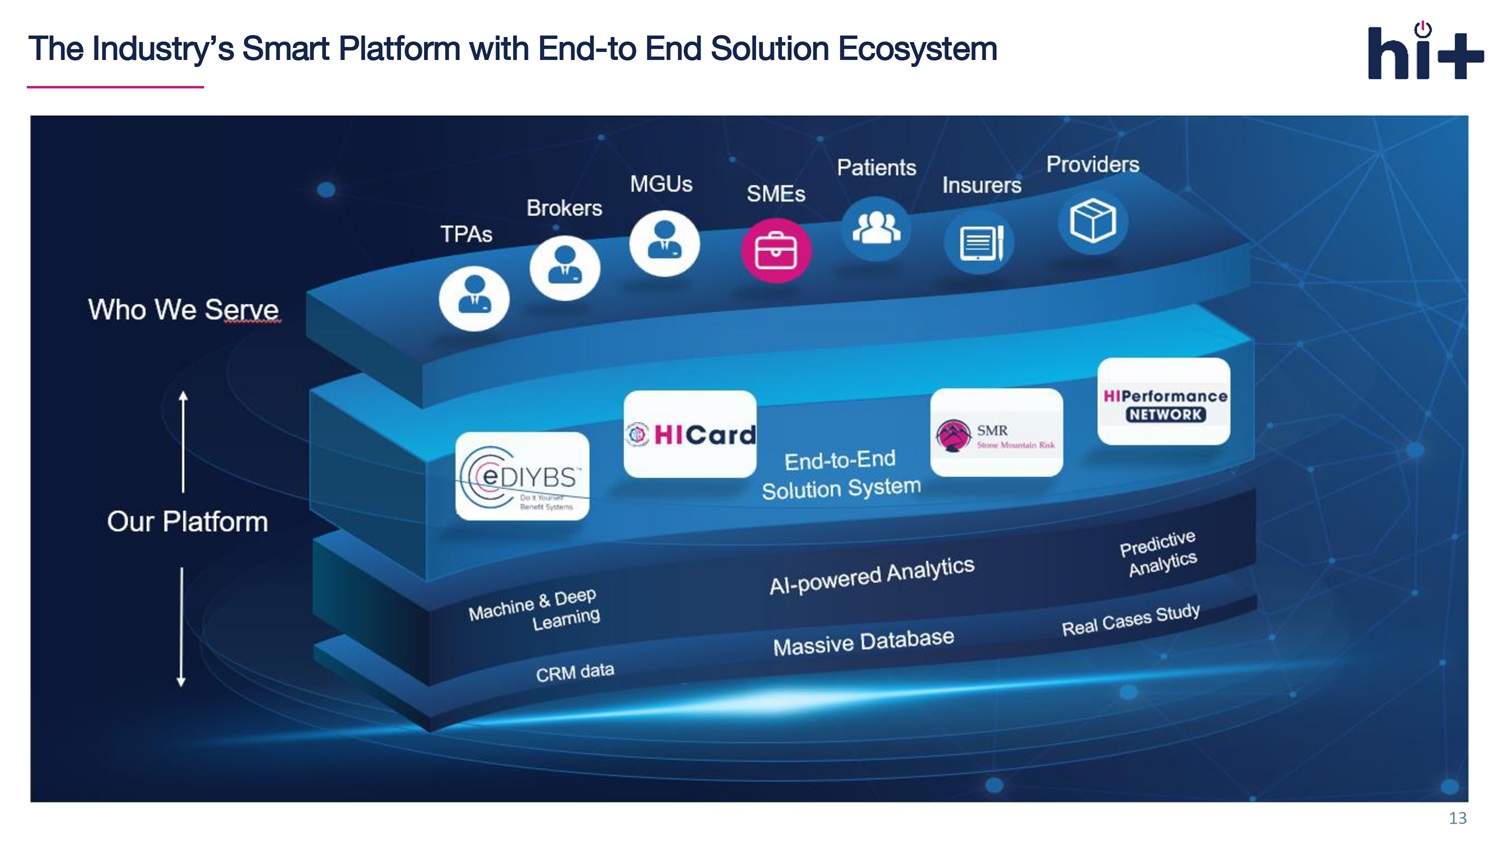
MGUs Patients Insurers Providers The Industry’s Smart Platform with End - to End Solution Ecosystem 13
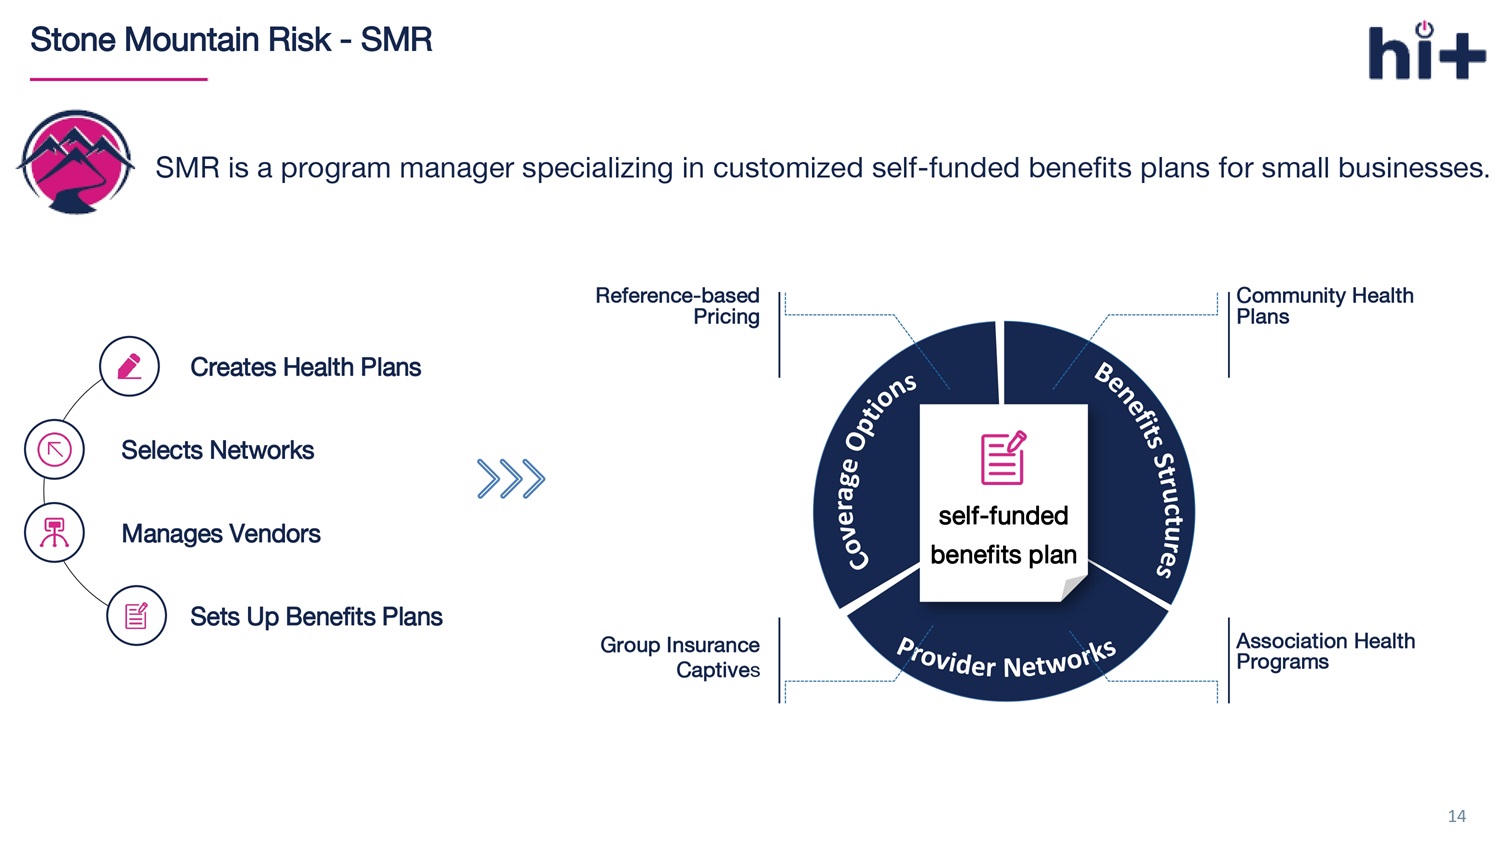
14 Stone Mountain Risk - SMR SMR is a program manager specializing in customized self - funded benefits plans for small businesses . Creates Health Plans Selects Networks Manages Vendors Sets Up Benefits Plans self - funded benefits plan Reference - based Pricing Group Insurance Captive s Community Health Plans Association Health Programs
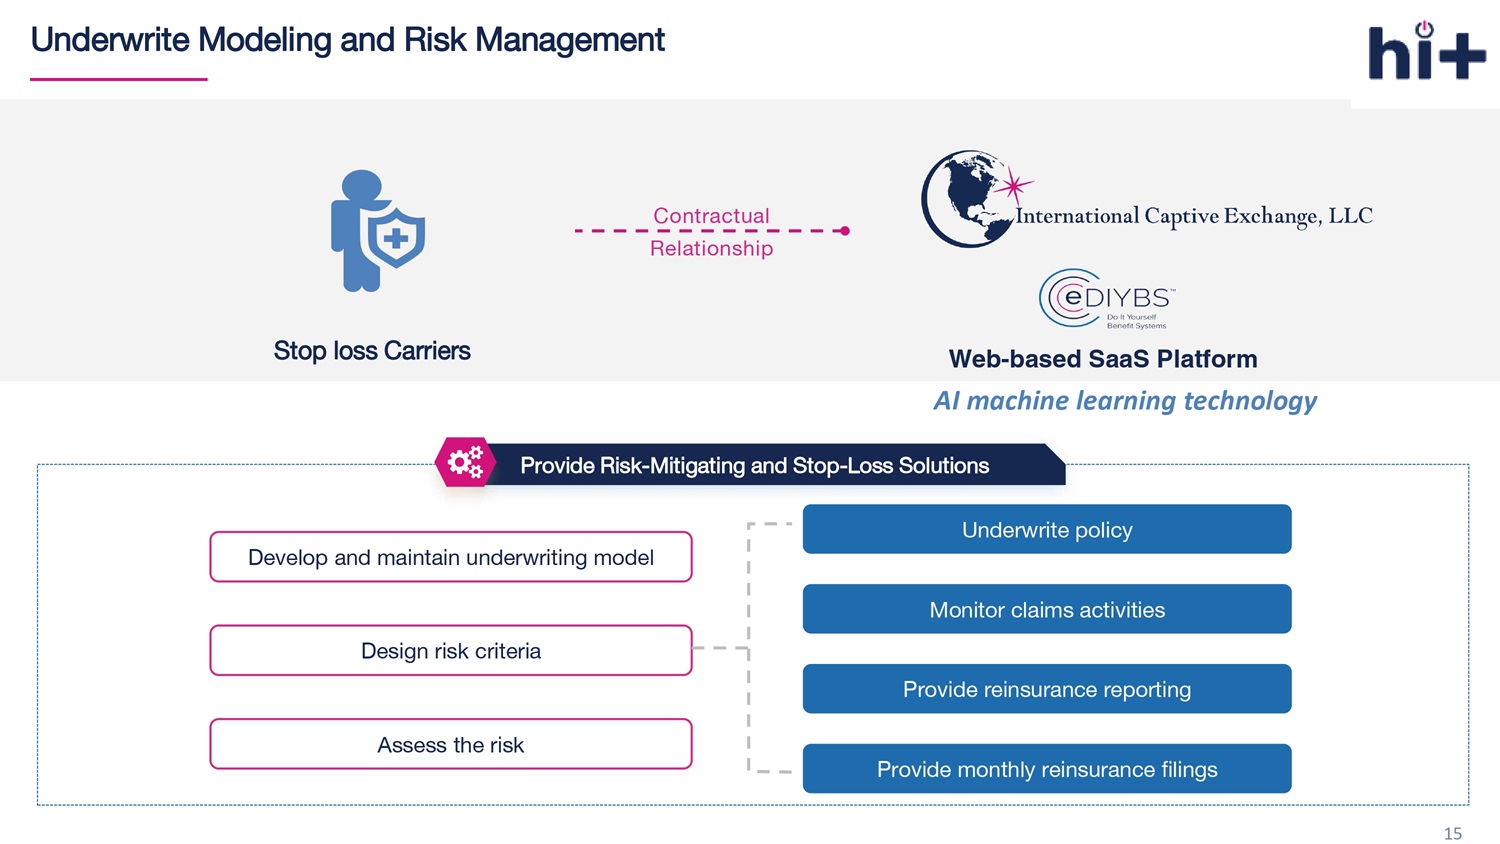
15 Underwrite Modeling and Risk Management Develop and maintain underwriting model Design risk criteria Assess the risk Underwrite policy Monitor claims activities Provide reinsurance reporting Provide monthly reinsurance filings Provide Risk - Mitigating and Stop - Loss Solutions Contractual Relationship Stop loss Carriers Web - based SaaS Platform AI machine learning technology
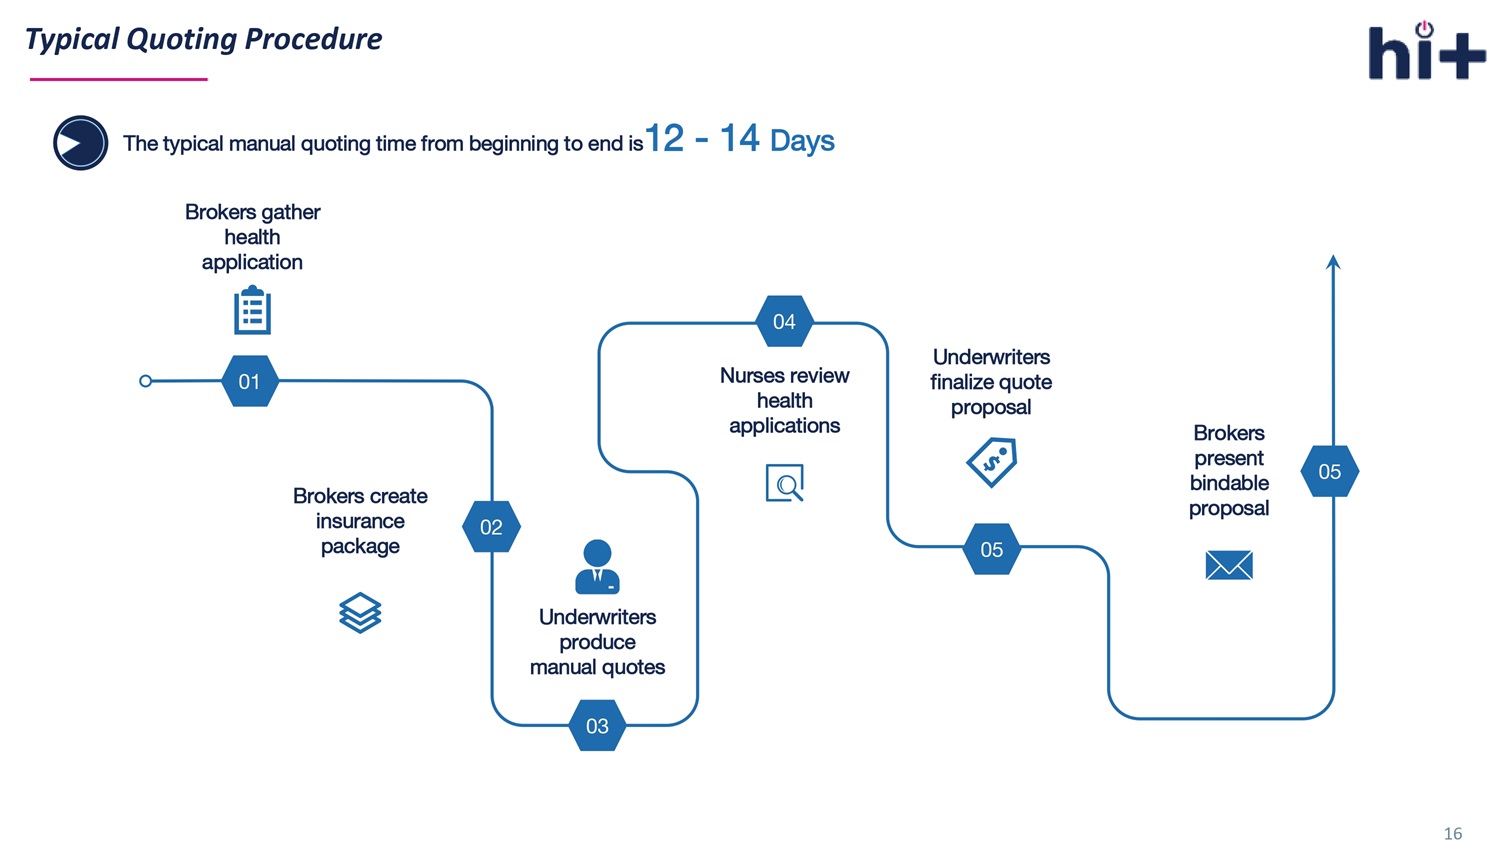
16 Typical Quoting Procedure The typical manual quoting time from beginning to end is 12 - 14 Days Brokers gather health application Brokers create insurance package Underwriters produce manual quotes Nurses review health applications Underwriters finalize quote proposal Brokers present bindable proposal 01 02 03 04 05 05
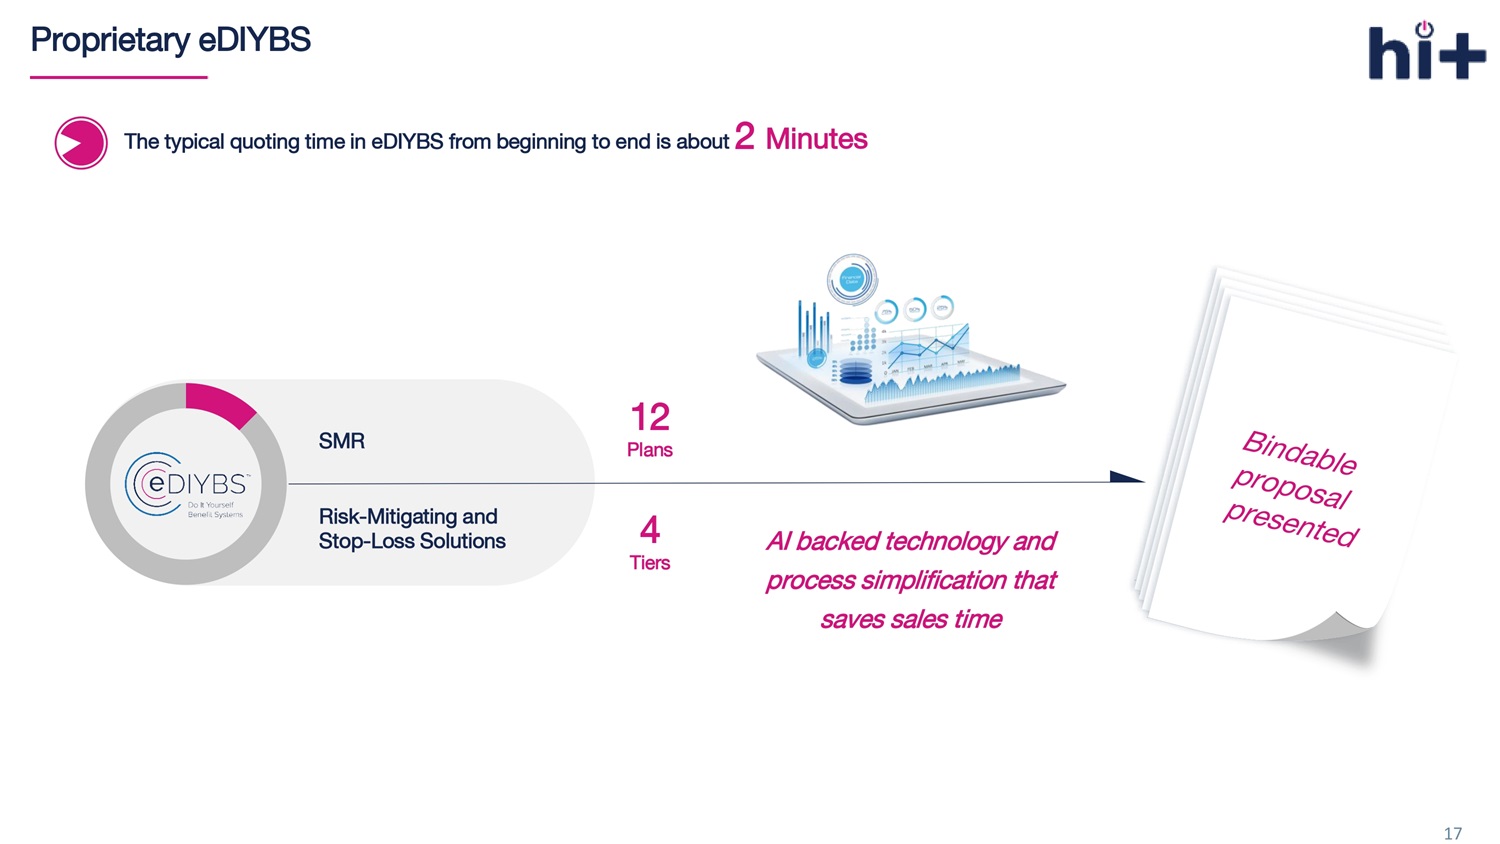
17 Proprietary eDIYBS The typical quoting time in eDIYBS from beginning to end is about 2 Minutes 4 Tiers SMR Risk - Mitigating and Stop - Loss Solutions AI backed technology and process simplification that saves sales time 12 P lans
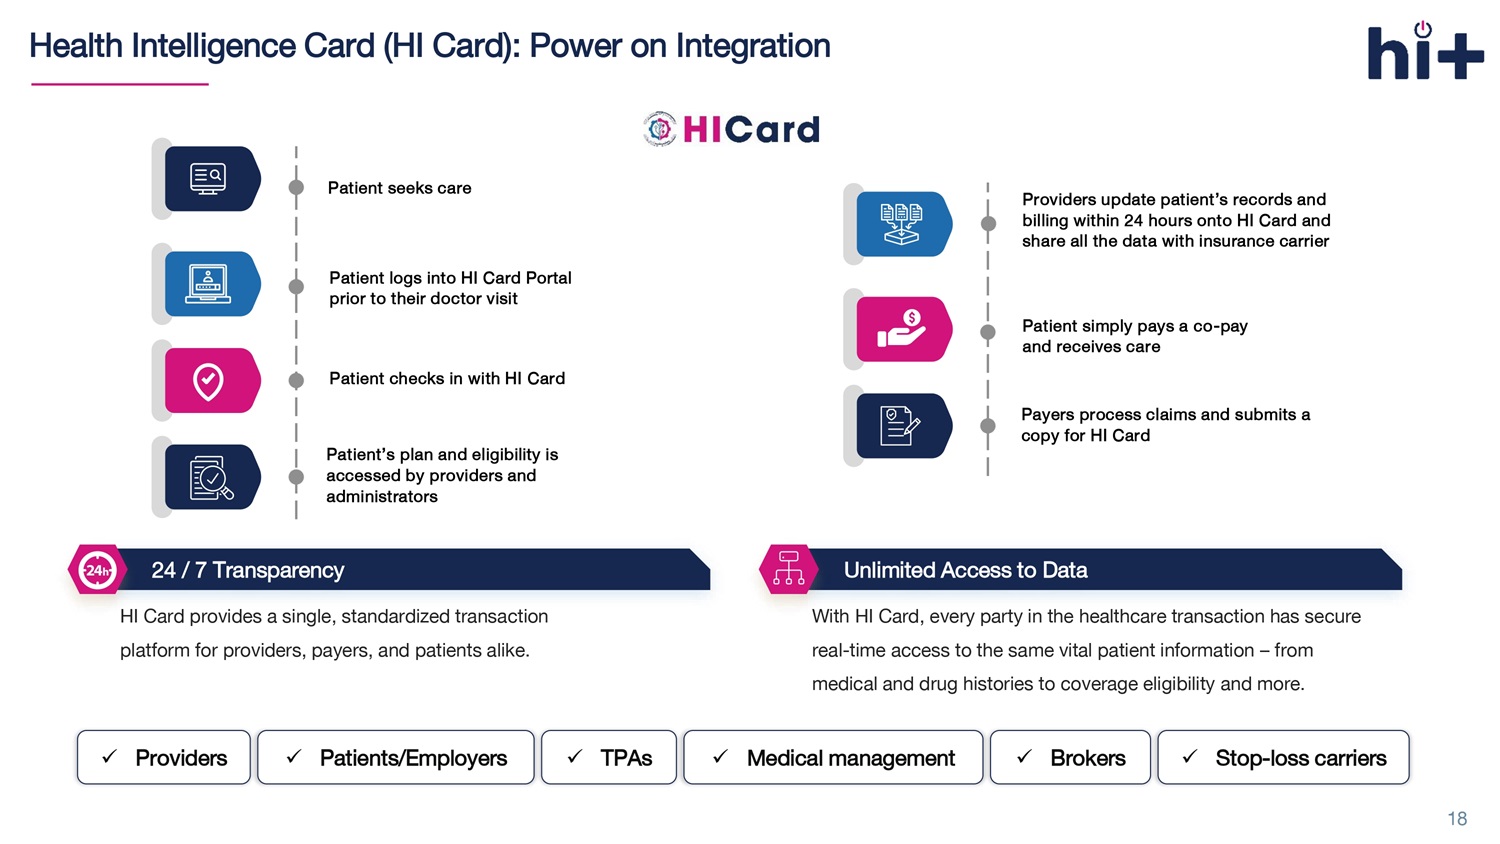
Health Intelligence Card (HI Card): Power on Integration HI Card provides a single, standardized transaction platform for providers, payers, and patients alike. With HI Card, every party in the healthcare transaction has secure real - time access to the same vital patient information – from medical and drug histories to coverage eligibility and more. 24 / 7 Transparency Unlimited Access to Data x Providers x Patients /Employers x TPAs x Medical management x Brokers x S top - loss carriers Patient seeks care Patient logs into HI Card Portal prior to their doctor visit Patient checks in with HI Card Patient’s plan and eligibility is accessed by providers and administrators Providers update patient’s records and billing within 24 hours onto HI Card and share all the data with insurance carrier Patient simply pays a co - pay and receives car e Payers process claims and submits a copy for HI Card 18

HI - Performance Network: Power on Savings Health in Tech’s HI - Performance Network, powered by HI Card, is a series of hospital facilities and providers that delivers Medicare - based reimbursement pricing. 19 50 States 12 , 475 Hospitals Provider Locations 1, 610 , 314 All numbers above are valued as of September 30, 2024
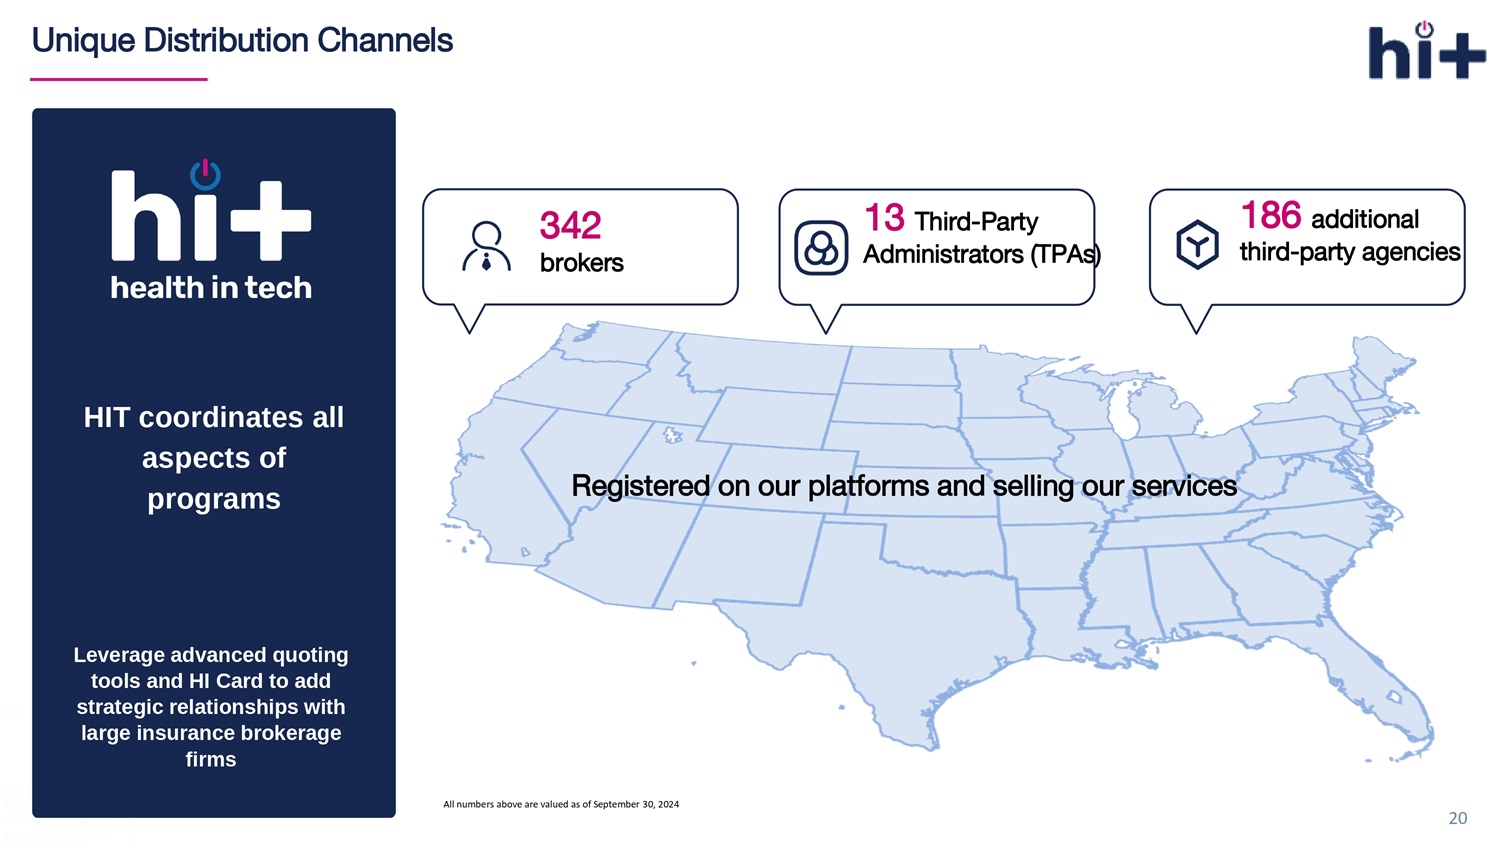
Unique Distribution Channels Leverage advanced quoting tools and HI Card to add strategic relationships with large insurance brokerage firms HIT coordinates all aspects of programs 20 Registered on o ur p latforms and s elling o ur s ervices 13 Third - Party Administrators (TPAs) 342 brokers 186 additional third - party agencies All numbers above are valued as of September 30, 2024
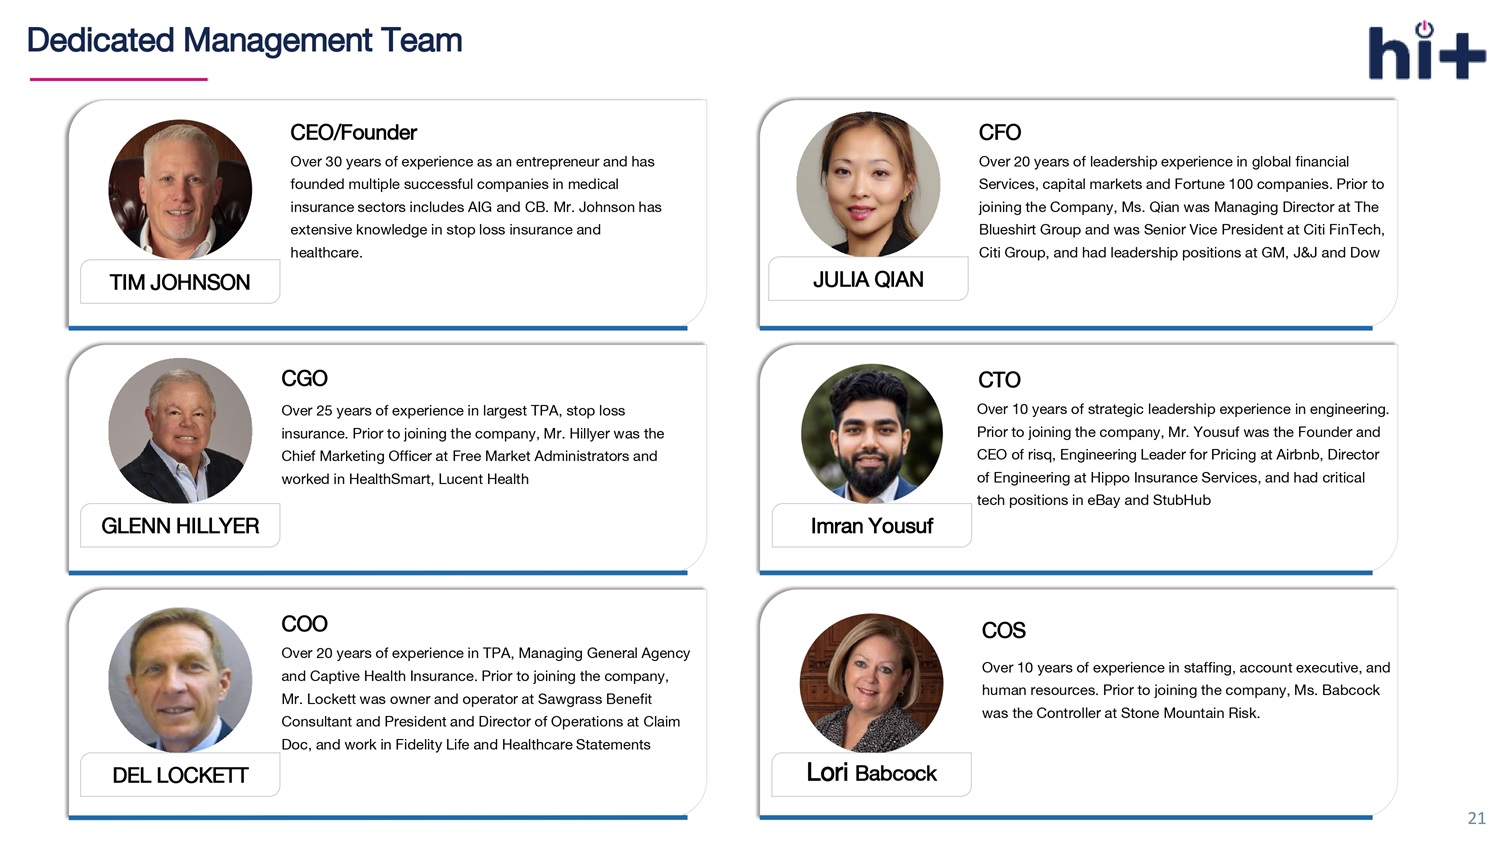
21 Dedicated Management Team GLENN HILLYER CGO Over 25 years of experience in largest TPA, stop loss insurance. Prior to joining the company, Mr. Hillyer was the Chief Marketing Officer at Free Market Administrators and worked in HealthSmart , Lucent Health DEL LOCKETT COO Over 20 years of experience in TPA, Managing General Agency and Captive Health Insurance. Prior to joining the company, Mr. Lockett was owner and operator at Sawgrass Benefit Consultant and President and Director of Operations at Claim Doc, and work in Fidelity Life and Healthcare Statements JULIA QIAN CFO Over 20 years of leadership experience in global financial Services, capital markets and Fortune 100 companies. Prior to joining the Company, Ms. Qian was Managing Director at The Blueshirt Group and was Senior Vice President at Citi FinTech, Citi Group , and had leadership positions at GM, J&J and Dow Lori Babcock COS Over 10 years of experience in staffing, account executive, and human resources. Prior to joining the company, Ms. Babcock was the Controller at Stone Mountain Risk. CEO/Founder Over 30 years of experience as an entrepreneur and has founded multiple successful companies in medical insurance sectors includes AIG and CB. Mr. Johnson has extensive knowledge in stop loss insurance and healthcare. TIM JOHNSON CTO Over 10 years of strategic leadership experience in engineering. Prior to joining the company, Mr. Yousuf was the Founder and CEO of risq , Engineering Leader for Pricing at Airbnb, Director of Engineering at Hippo Insurance Services , and had critical tech positions in eBay and StubHub Imran Yousuf
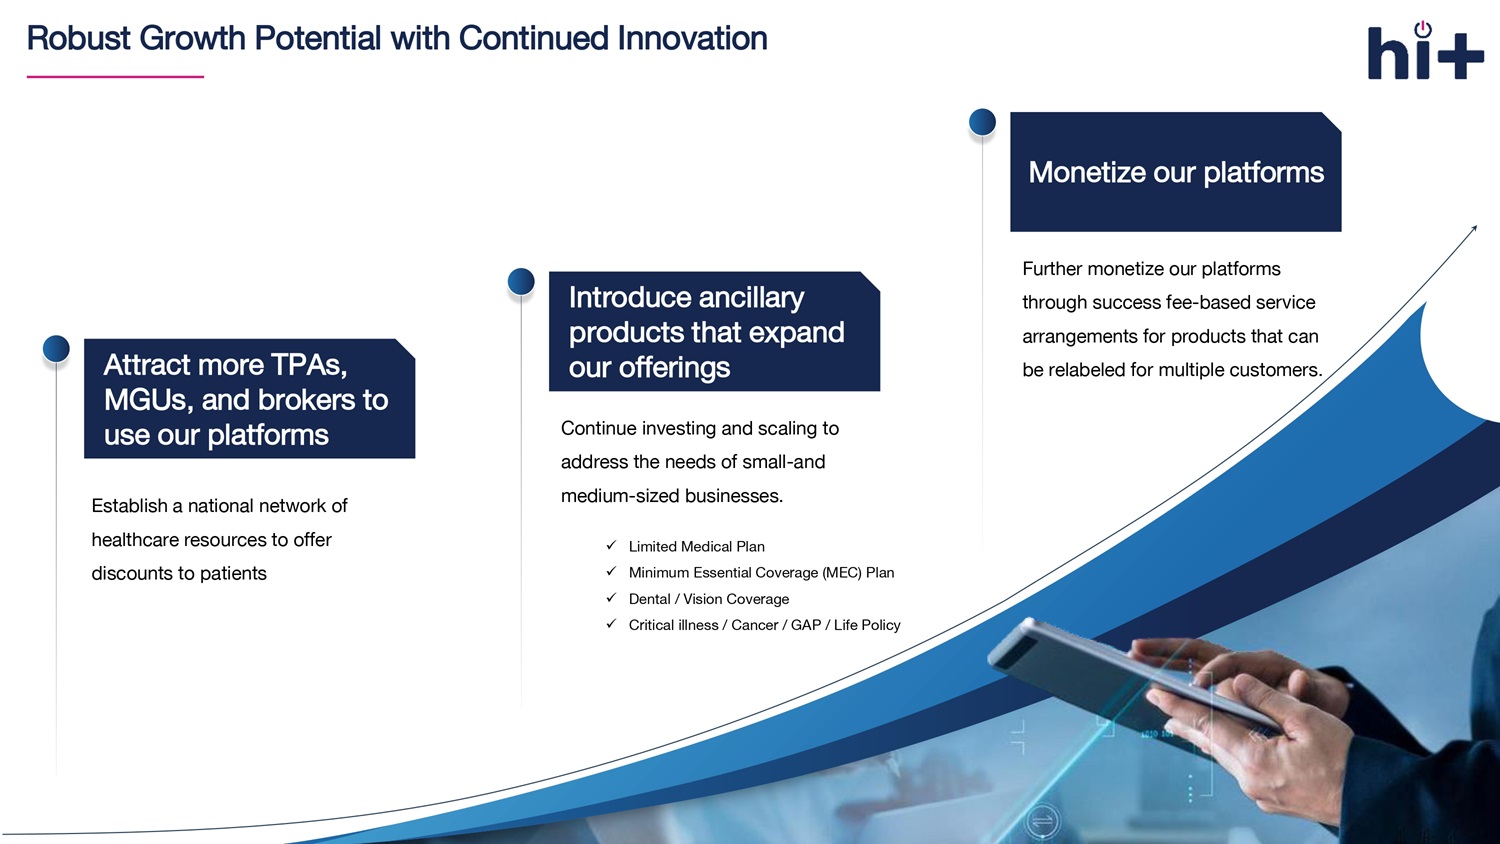
Robust Growth Potential with Continued Innovation 22 C ontinue investing and scaling to address the needs of small - and medium - sized businesses. Introduce ancillary products that expand our offerings F urther monetize our platforms through success fee - based service arrangements for products that can be relabeled for multiple customers. Monetize our platforms x Limited Medical Plan x Minimum Essential Coverage (MEC) Plan x Dental / Vision Coverage x Critical illness / Cancer / GAP / Life Policy Attract more TPAs, MGUs, and brokers to use our platforms Establish a national network of healthcare resources to offer discounts to patients
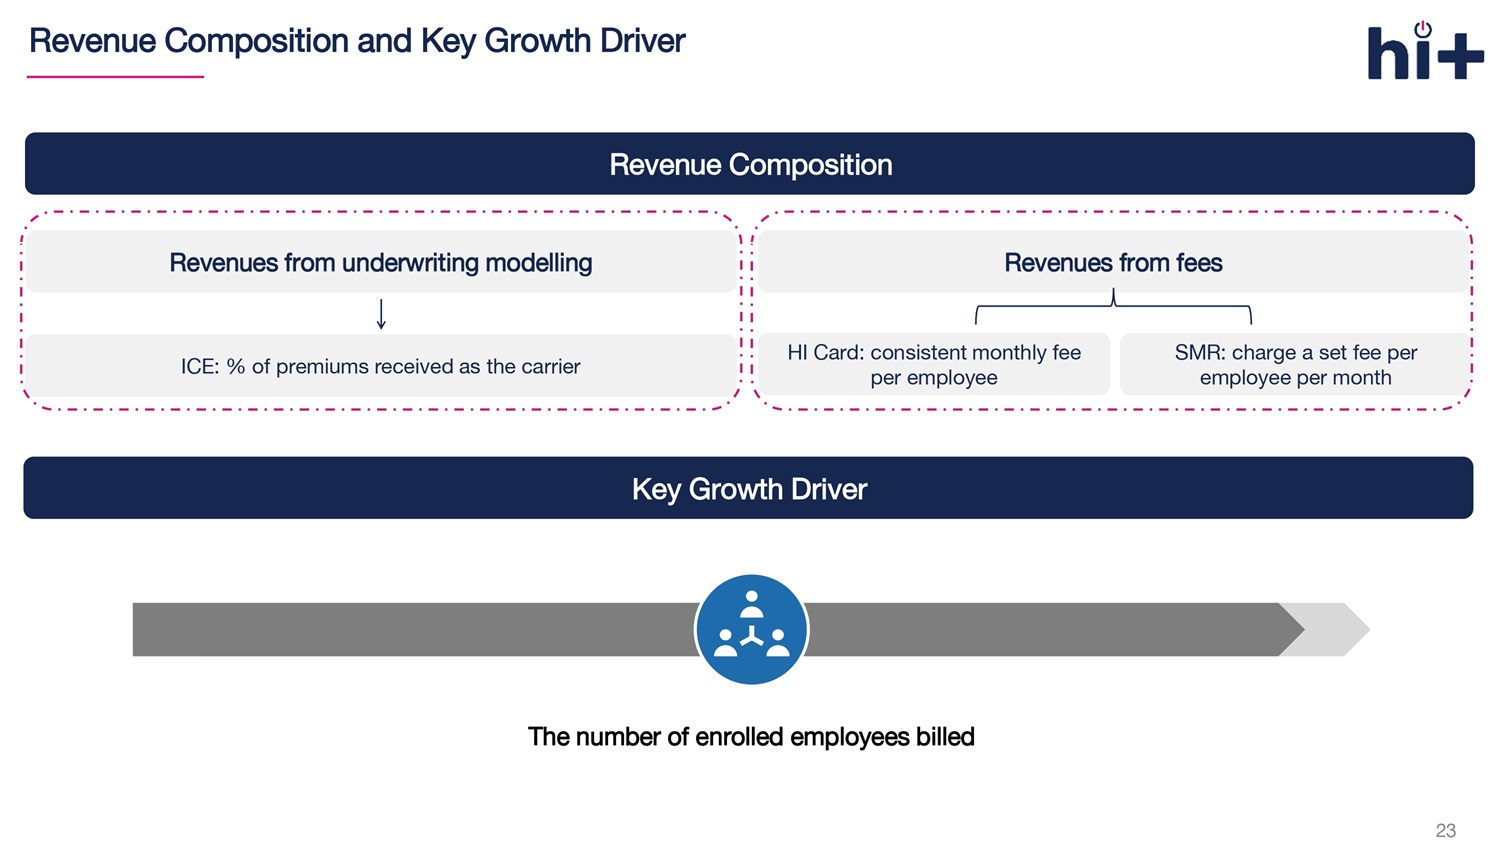
23 Revenue Composition and Key Growth Driver Revenue Composition Revenues from underwriting modelling Revenues from fees HI Card: consistent monthly fee per employee SMR : charge a set fee per employee per month ICE: % of premiums received as the carrier Key Growth Driver The number of enrolled employees billed
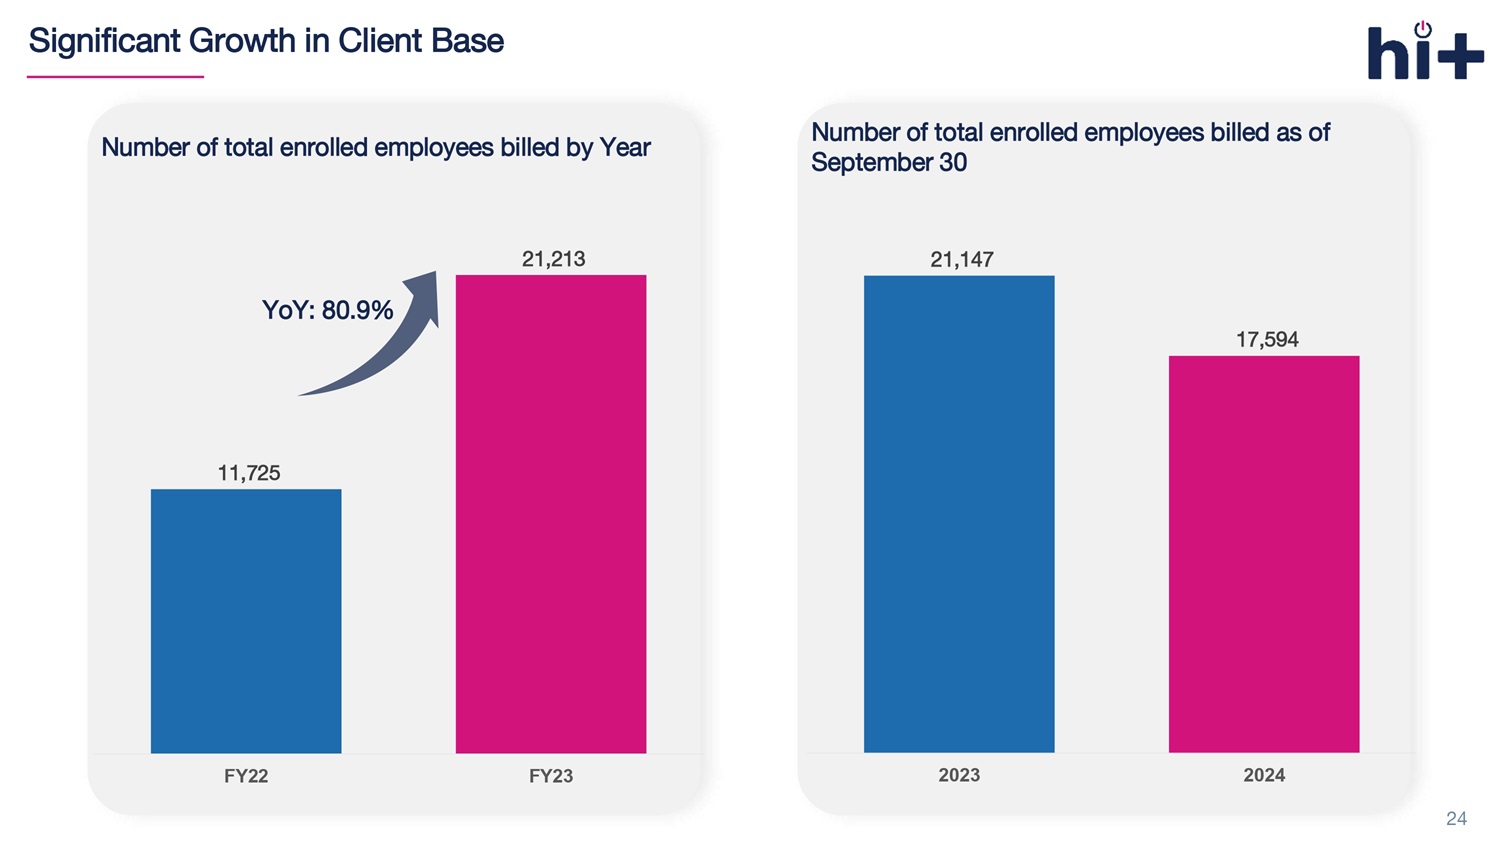
Number of total enrolled employees billed as of September 30 Significant Growth in Client Base 24 Number of total enrolled employees billed by Year 11,725 21,213 FY22 FY23 YoY: 80.9% 21,147 17,594 2023 2024
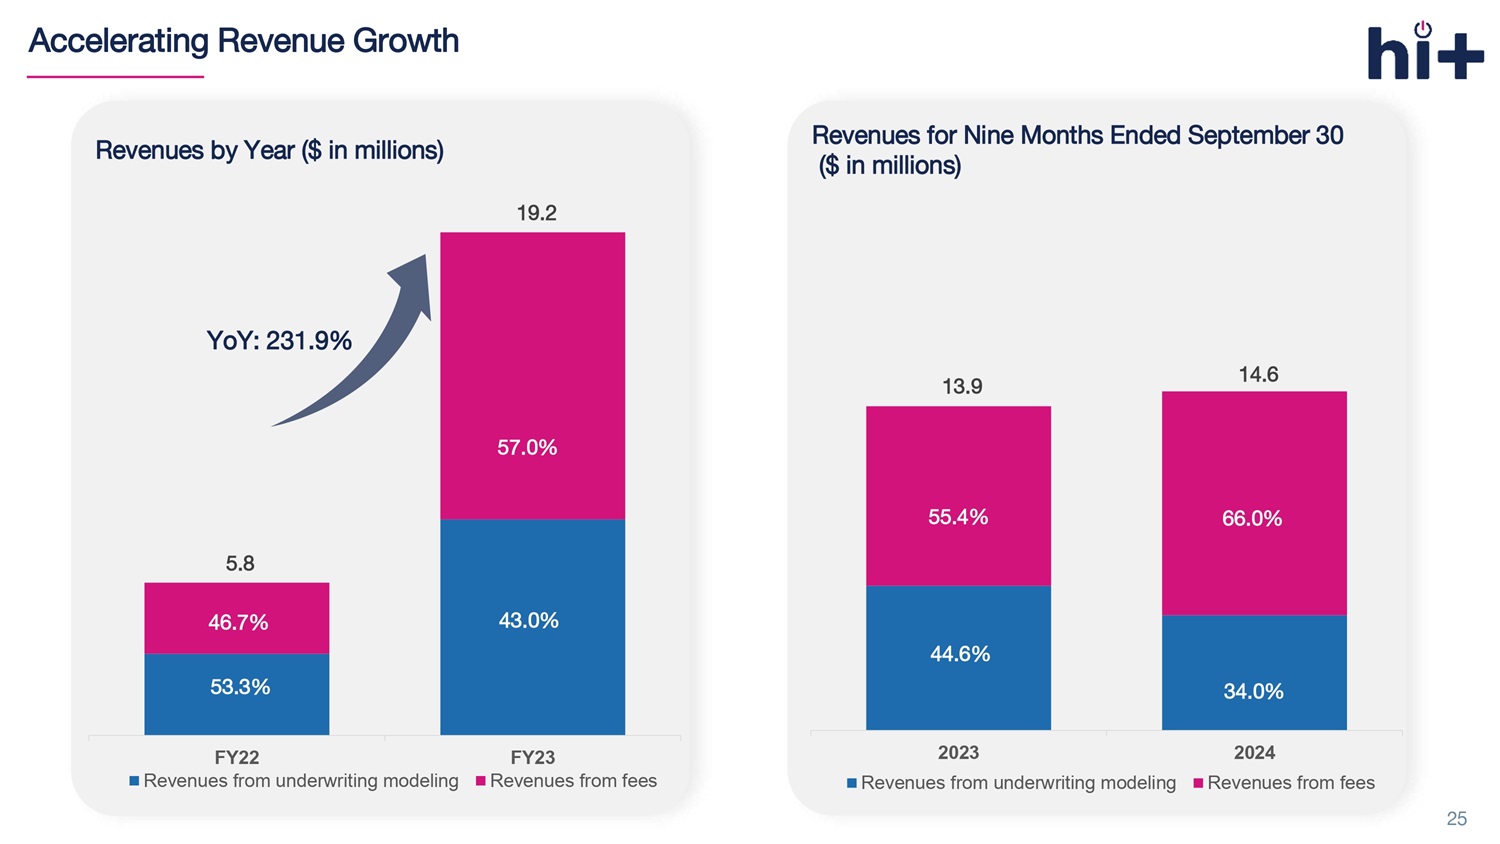
Revenues for Nine Months Ended September 30 ($ in millions) 13.9 14.6 2023 2024 Revenues from underwriting modeling Revenues from fees 55.4% 44.6% Accelerating Revenue Growth 25 5.8 19.2 FY22 FY23 Revenues from underwriting modeling Revenues from fees 46.7% 53.3% YoY: 231.9% Revenues by Year ($ in millions) 43.0% 57.0% 34.0% 66.0%
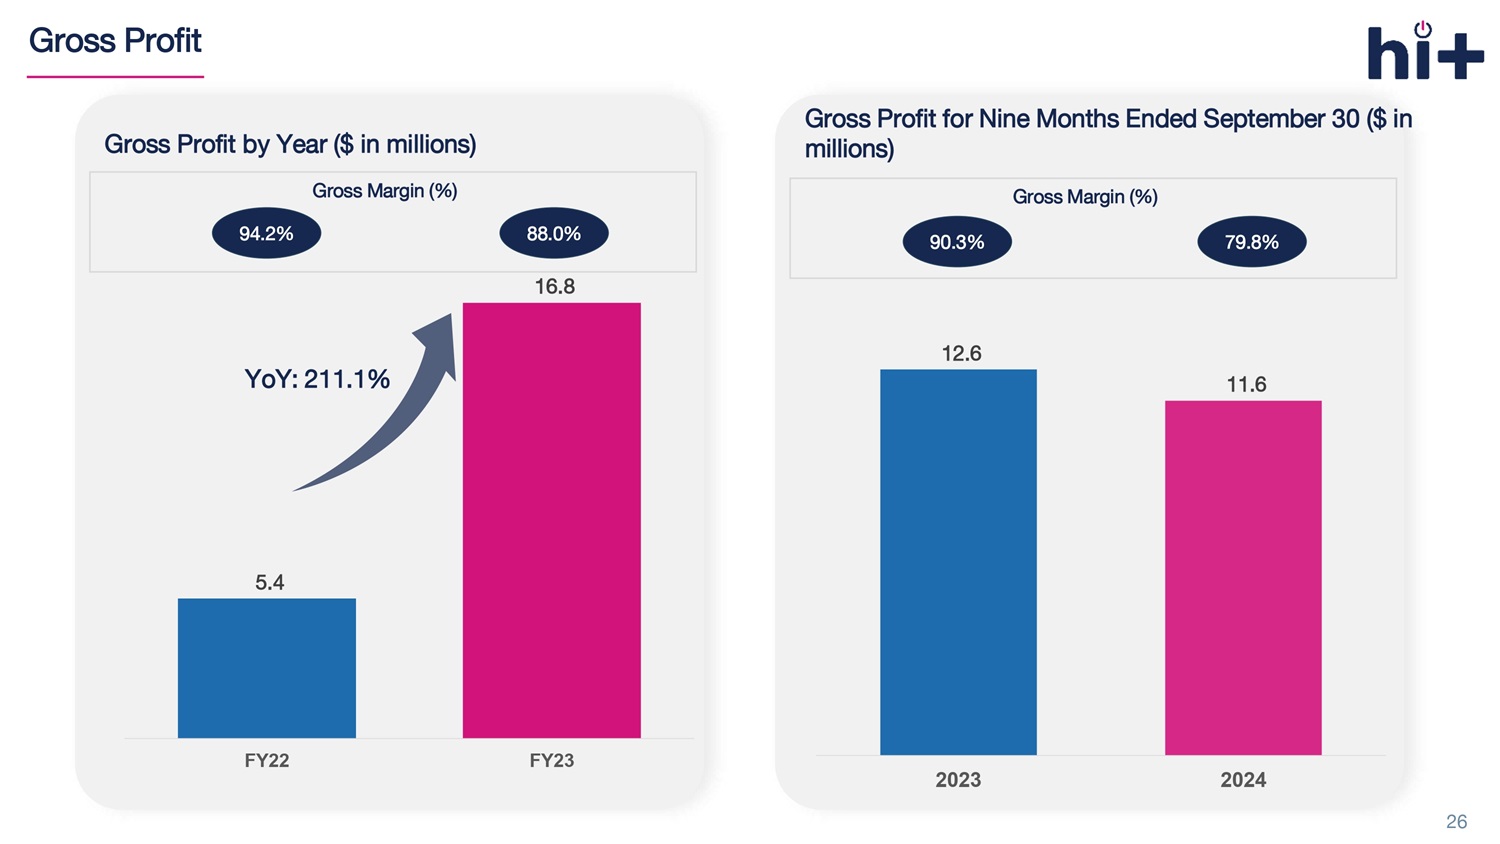
Gross Profit 26 Gross Profit for Nine Months Ended September 30 ($ in millions) Gross Margin (%) 90.3% 79.8% 5.4 16.8 FY22 FY23 Gross Profit by Year ($ in millions) YoY: 211.1% 94.2% 88.0% Gross Margin (%) 12.6 11.6 2023 2024
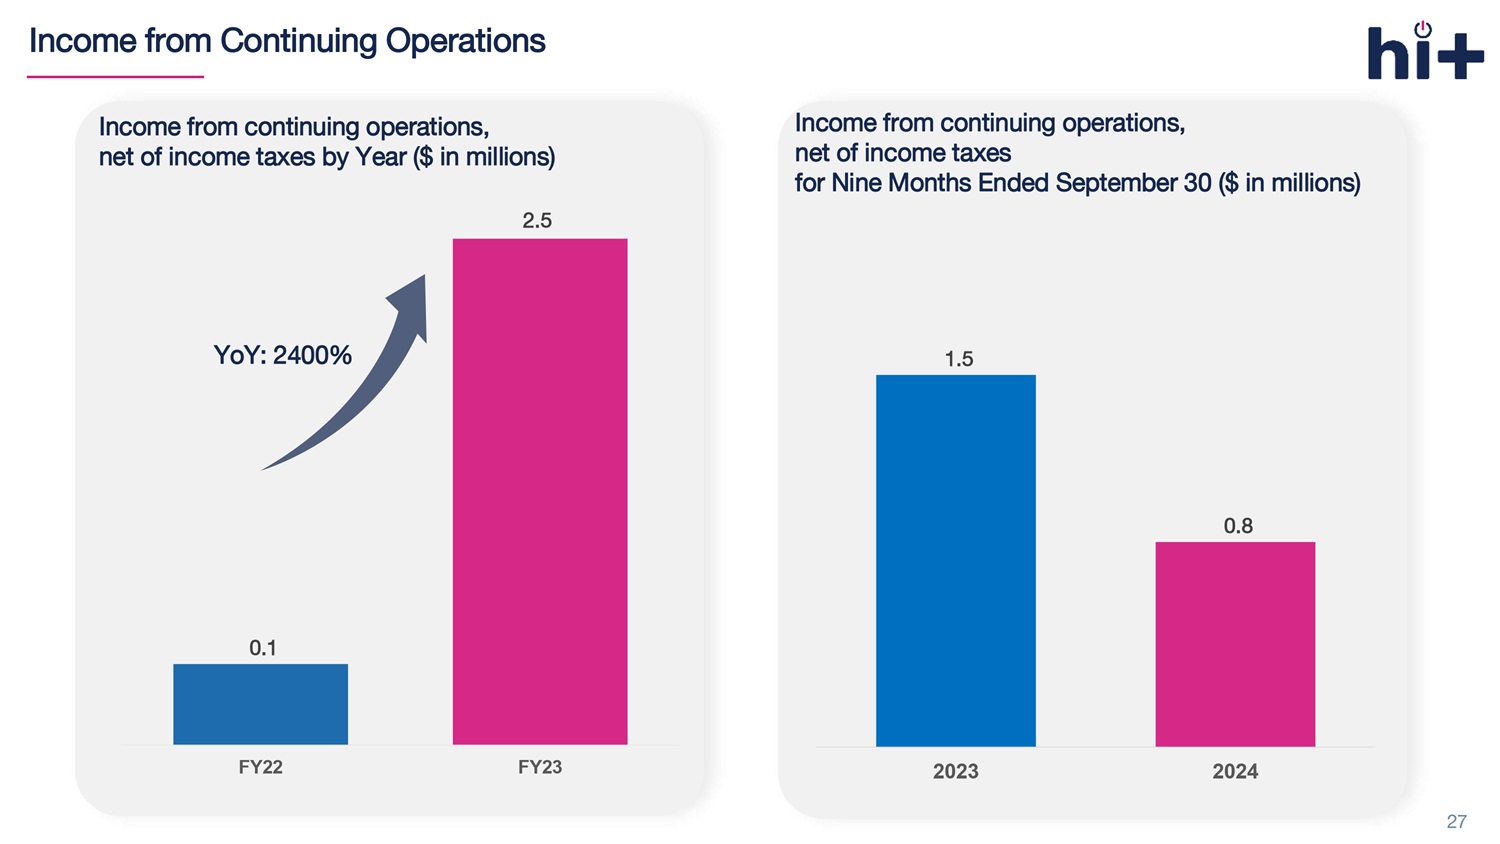
Income from Continuing Operations 27 Income from continuing operations, net of income taxes by Year ($ in millions) 0.1 FY22 FY23 YoY: 2400% 2.5 Income from continuing operations, net of income taxes for Nine Months Ended September 30 ($ in millions) 1.5 0.8 2023 2024
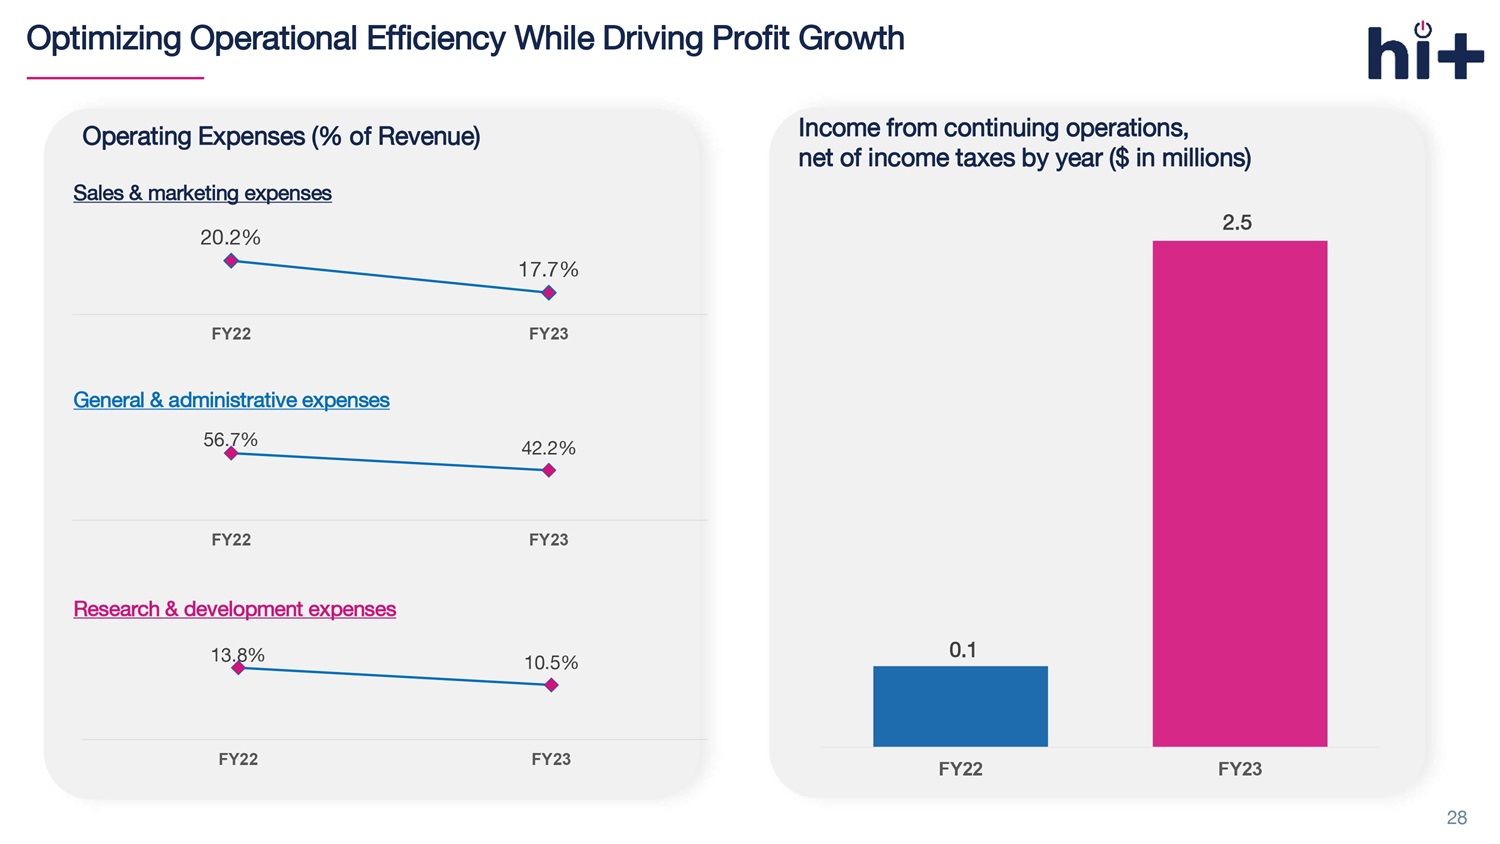
Optimizing Operational Efficiency While Driving Profit Growth 28 Operating Expenses (% of Revenue) Sales & marketing expenses 20.2% 17.7% FY22 FY23 General & administrative expenses 56.7% 42.2% FY22 FY23 Research & development expenses 13.8% 10.5% FY22 FY23 0.1 FY22 FY23 Income from continuing operations, net of income taxes by year ($ in millions) 2.5
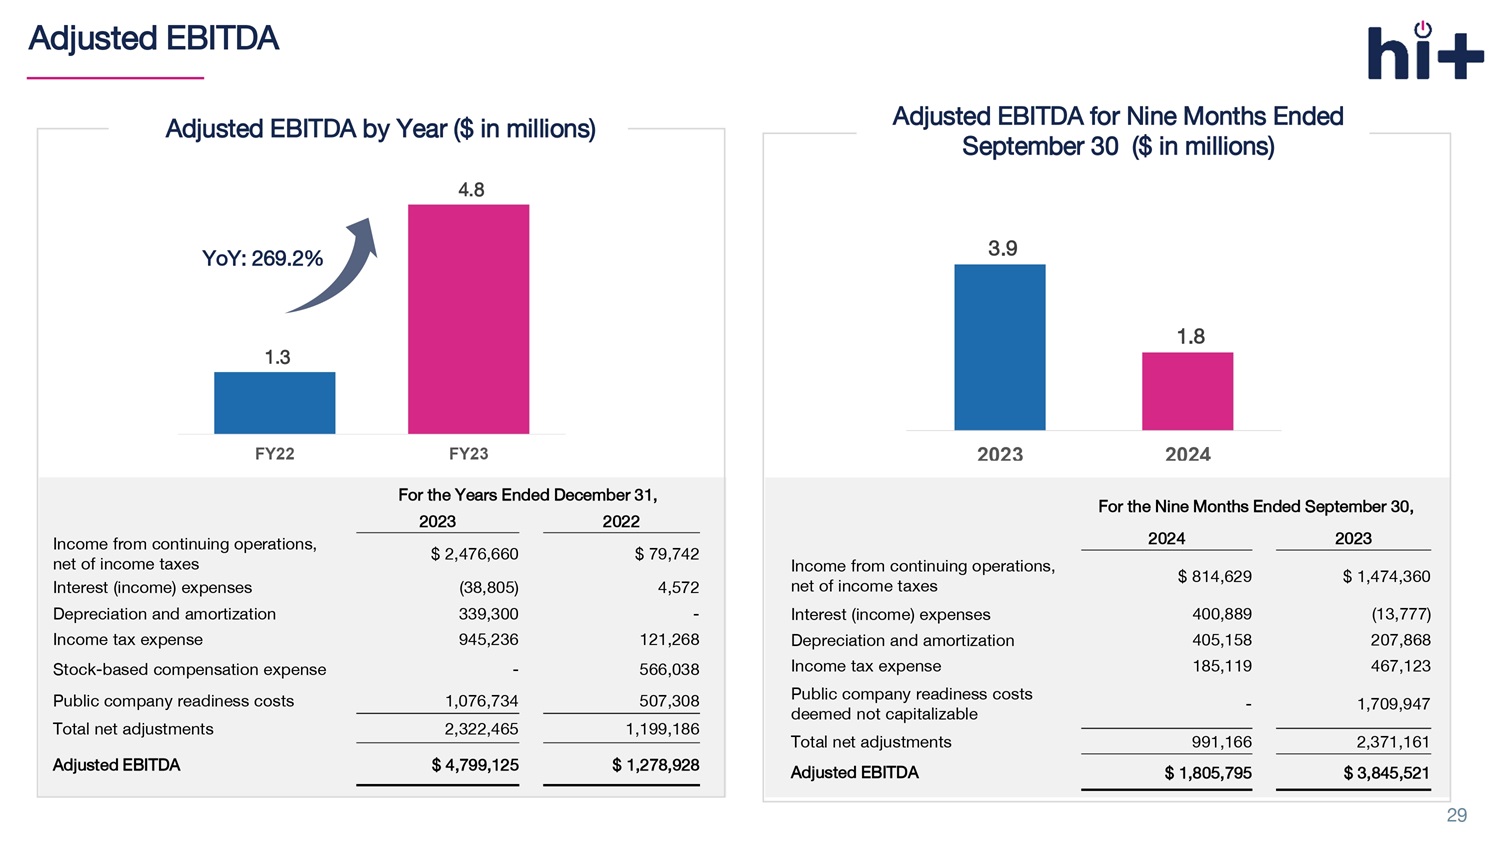
Adjusted EBITDA 29 1.3 4.8 FY22 FY23 YoY: 269.2% For the Years Ended December 31, 2022 2023 $ 79,742 $ 2,476,660 Income from continuing operations, net of income taxes 4,572 (38,805) Interest (income) expenses - 339,300 Depreciation and amortization 121,268 945,236 Income tax expense 566,038 - Stock - based compensation expense 507,308 1,076,734 Public company readiness costs 1,199,186 2,322,465 Total net adjustments $ 1,278,928 $ 4,799,125 Adjusted EBITDA Adjusted EBITDA by Year ($ in millions) Adjusted EBITDA for Nine Months Ended September 30 ($ in millions) 3.9 1.8 2023 2024 For the N ine Months Ended September 30, 2023 2024 $ 1,474,360 $ 814,629 Income from continuing operations, net of income taxes (13,777) 400,889 Interest (income) expenses 207,868 405,158 Depreciation and amortization 467,123 185,119 Income tax expense 1,709,947 - Public company readiness costs deemed not capitalizable 2,371,161 991,166 Total net adjustments $ 3,845,521 $ 1,805,795 Adjusted EBITDA

Financial Results For the Years Ended December 31, 2022 2023 $ 5,769,781 $ 19,151,502 Total revenue s 3,076,162 8,226,852 Revenues from underwriting modeling 2,693,619 10,924,650 Revenues from fees 334,188 2,303,911 Cost of revenues $ 5,435,593 $ 16,847,591 Gross profit 79,742 2,476,660 Income from continuing operations, net of income taxes (243,342) 3,957,914 Net income $ 1,278,928 $ 4,799,125 Adjusted EBITDA 30 Selected Income Statement Data by Year For the Nine Months Ended September 30, 2023 2024 $ 13,935,219 $ 14,586,342 Total revenue s 6,215,792 4,952,191 Revenues from underwriting modeling 7,719,427 9,634,151 Revenues from fees 1,351,944 2,944,266 Cost of revenues $ 12,583,275 $ 11,642,076 Gross profit 1,474,360 814,629 Income from continuing operations, net of income taxes 2,955,614 814,629 Net income $ 3,845,521 $ 1,805,795 Adjusted EBITDA Selected Income Statement Data for Nine Months Ended September 30

Certain Terms and Definitions • “ Broker” or “insurance broker” is an intermediary who sells, solicits or negotiates insurance policies on behalf of a client for compensation. A broker typically acts on behalf of a client by negotiating with multiple insurers • “ Carrier” refers to an insurance company or insurer that provides stop loss insurance. • “ eDIYBS ” refers to our Enhanced Do It Yourself Benefits System. Licensed brokers log in to this online platform to select vendors, net wor ks, and stop loss insurance programs. The broker can design and sell the self - funded benefits plan to small employers • “MGU” refers to Managing General Underwriter and is an entity that performs underwriting and administrative functions on behalf of an insurance company. International Captive Exchange, LLC, a wholly - owned subsidiary of the Company (“ICE”) is an MGU. ICE is granted the aut hority by insurance carriers to underwrite policies, meaning ICE can assess risks, set premiums, and determine coverage terms within the guidelin es provided by the carrier. • “Self - funded benefits plan” or “self - insured group health plan” is an insurance plan in which the employer assumes the financial risk for providing health care benefits to its employees. In practical terms, self - insured employers pay for each out - of - pocket claim as they are incurred instead of paying a fixed premium to an insurance carrier, which is known as a fully - insured plan. Typically, a self - insured employer will set up a special trust fund to earmark money (corporate and employee contributions) to pay incurred claims. • “ Stop - loss insurance ” (also known as excess insurance) is a product that provides protection for self - funded employers by serving as a reimbursement mechanism for catastrophic claims exceeding pre - determined levels. • “Third - party administrator (TPA)” is a company that manages claims and administrative tasks for an employer’s self - funded employee benefits plan. TPAs are often the primary point of contact for employees. • “Small employers” refer to the small businesses with total employees ranging from 5 to 150 employees. 31