
Exhibit 99.2 Q3 2024 Financial Results 30 October 2024 1
Disclaimer This presentation is for informational purposes only in connection with the spin-off (the Transaction) by Liberty Global Ltd. (Liberty Global) of the businesses of its Swiss telecommunications provider into a separate publicly traded company Sunrise Communications AG (Sunrise). No Offer to Sell or Solicit Adjusted EBITDAaL less P&E Additions: Adjusted EBITDAaL less P&E Additions is defined as Adjusted EBITDAaL less property and equipment additions on an accrual basis (excluding those P&E additions under finance lease). Adjusted EBITDAaL less P&E Additions is a meaningful measure because it provides (i) a transparent view This presentation is not an offer to sell or a solicitation of offers to purchase or subscribe for shares or a solicitation of any vote or approval. This document is not a of Adjusted EBITDAaL that remains after capital spend, which Sunrise believes is important to take into account when evaluating overall performance and (ii) a prospectus within the meaning of the Swiss Financial Services Act and not a prospectus under any other applicable laws. Copies of this document may not be sent to, distributed in or sent from jurisdictions in which this is barred or prohibited by law. The information contained herein shall not constitute an offer to sell or the comparable view of Sunrise performance relative to other telecommunications companies. solicitation of an offer to buy, in any jurisdiction in which such offer or solicitation would be unlawful prior to registration, exemption from registration or qualification Adjusted Free Cash Flow: Adjusted FCF is defined as net cash provided by operating activities, plus (a) operating-related vendor financed additions (which under the securities laws of any jurisdiction and there shall be no sale of securities in any such jurisdiction. represents an increase in the period to actual cash available as a result of extending vendor payment terms beyond normal payment terms, which are typically 90 days or less, through non-cash financing activities), and (b) cash receipts in the period from interest-related derivatives, less (i) cash payments in the period for This presentation is only addressed to and directed at specific addressees who: (A) if in member states of the European Economic Area (the EEA) are people who are interest, (ii) cash payments in the period for capital expenditures, (iii) principal payments on amounts financed by vendors and intermediaries (which represents a “qualified investors” within the meaning of Article 2(e) of Regulation (EU) 2017/1129 (as amended) (the Prospectus Regulation) (Qualified Investors); and (B) if in the U.K., are “qualified investors” within the meaning of Article 2(e) of the UK version of the Prospectus Regulation as it forms part of domestic law in the U.K. by decrease in the period to actual cash available as a result of paying amounts to vendors and intermediaries where we previously had extended vendor payments virtue of the European Union (Withdrawal) Act 2018 (the UK Prospectus Regulation) who are: (i) persons having professional experience in matters relating to beyond the normal payment terms), and (iv) principal payments on lease liabilities (which represents a decrease in the period to actual cash available). Sunrise investments who fall within the definition of “investment professionals” in Article 19(5) of the Financial Services and Markets Act 2000 (Financial Promotion) Order believes its presentation of Adjusted FCF provides useful information to investors because this measure can be used to gauge its ability to (i) service debt and (ii) fund new investment opportunities after consideration of all actual cash payments related to its working capital activities and expenses that are capital in nature, 2005, as amended (the Order); or (ii) high net worth entities falling within Article 49(2)(a) to (d) of the Order; or (C) are other persons to whom an invitation or whether paid inside normal vendor payment terms or paid later outside normal vendor payment terms (in which case payment is typically made in less than 365 inducement to engage in investment activity (within the meaning of section 21 of the Financial Services and Markets Act 2000 (as amended)) in connection with the sale of any securities of the Company or any member of its group may otherwise lawfully be communicated or caused to be communicated (all such persons referred days). Adjusted FCF should not be understood to represent Sunrise’s ability to fund discretionary amounts, as they have various mandatory and contractual to in (B) and (C) being Relevant Persons). This presentation must not be acted on or relied on (i) in the U.K., by persons who are not Relevant Persons and (ii) in obligations, including debt repayments, that are not deducted to arrive at these amounts. any member state of the EEA by persons who are not Qualified Investors. Any investment activity to which this presentation relates (i) in the U.K. is available only These non-IFRS financial measures should be viewed as supplements to, and not substitutes for, IFRS measures of performance or liquidity as presented in Sunrise’s IFRS financial statements. These non-IFRS financial measures have no standardized meaning under IFRS and may not be comparable to similarly titled measures to, any may be engaged in only with, Relevant Persons; and (ii) in any member state of the EEA is available only to, and may be engaged only with, Qualified reported by other companies. They should not be considered in isolation or as an alternative for or superior to IFRS measures. These measures are presented and Investors. This presentation is an advertisement for the purposes of the Prospectus Regulation (EU) 2017/1129 as it forms part of domestic law by virtue of the European Union described in order to provide additional means of understanding Sunrise’s results in the same manner as its management team. (Withdrawal) Act 2018 (as amended) and underlying legislation. It is not a prospectus. A copy of any prospectus published by the Company will, if approved and published, be made available for inspection on Liberty Global’s website at www.libertyglobal.com subject to certain access restrictions. This presentation constitutes advertising in accordance with article 68 of the Swiss Financial Services Act. Such advertisements are communications to investors aiming to draw their attention to financial instruments. Any investment decisions with respect to any securities should not be made based on this advertisement. Forward-Looking Statements This presentation contains forward-looking statements within the meaning of the Private Securities Litigation Reform Act of 1995, including statements regarding certain forecasted financial information, the financial condition, results of operations, business, market share, network, revenue stabilization, growth and other strategies, future growth prospects, expectations, plans and opportunities of Sunrise, the Transaction, progress towards realizing the remainder of synergies of the UPC merger and various ongoing operational efficiencies, deleveraging in connection with the Transaction, the macroeconomic environment, gradual tapering of capital expenditures and other information and statements that are not historical fact. These forward-looking statements are based on current expectations, estimates and projections about the factors that may affect Sunrise’s future performance and are subject to a wide variety of significant risks and uncertainties, some of which are beyond the control of Sunrise or Liberty Global, that could cause actual results to differ materially from those expressed or implied by these statements. Such risks and uncertainties include, among others, Sunrise’s ability to successfully execute on its plans and strategies, Sunrise’s ability to realize the expected benefits from the Transaction, unanticipated difficulties or costs in connection with the Transaction, Sunrise’s ability to successfully operate as an independent public company and maintain its relationships with material counterparties after the Transaction, the trading and the development of a trading market for Sunrise’s Class A shares on the SIX Swiss Exchange and for Sunrise’s Class A American depositary shares on the Nasdaq Global Select Market, and other factors, including those detailed from time to time in Sunrise’s and Liberty Global’s filings with the Securities and Exchange Commission (the SEC), including Liberty Global´s most recently filed annual report on Form 10-K, as it may be supplemented from time to time by its quarterly reports and other subsequent filings. These forward-looking statements speak only as of the date hereof. Although Sunrise and Liberty Global believe that their expectations reflected in any such forward-looking statement are based upon reasonable assumptions, no assurance can be given that these expectations will be achieved. Liberty Global and Sunrise expressly disclaim any obligation or undertaking to disseminate any updates or revisions to any forward-looking statement contained herein to reflect any change in their expectations with regard thereto or any change in events, conditions or circumstances on which any such statement is based. You are cautioned not to place undue reliance on any forward-looking statement. Non-IFRS Financial Measures This presentation includes financial measures not presented in accordance with International Financial Reporting Standards (IFRS), including Adjusted EBITDA, Adjusted EBITDAaL, Adjusted EBITDAaL less P&E Additions, and Adjusted FCF. Adjusted EBITDA: Adjusted EBITDA is defined as net income (loss) before income tax benefit (expense), share of losses (gains) of affiliates, financial income, financial expenses, depreciation and amortization, share-based compensation expense, and impairment, restructuring and other operating items. Other operating items include (a) provisions and provision releases related to significant litigation, (b) certain related-party charges and (c) gains and losses on the disposition of long-lived assets. Adjusted EBITDAaL: Adjusted EBITDAaL is defined as Adjusted EBITDA after lease-related expenses. Sunrise believes Adjusted EBITDA and Adjusted EBITDAaL are meaningful measures because they represent a transparent view of Sunrise’s recurring operating performance that is unaffected by its capital structure and allows management to (a) readily view operating trends, (b) perform analytical comparisons and benchmarking between segments and (c) identify strategies to improve operating performance. Sunrise believes Adjusted EBITDA and Adjusted EBITDAaL are useful to investors because they provide a basis for comparing Sunrise performance with the performance of other companies in the same or similar industries. . Sunrise Q3 2024 Results | 30 October 2024 2 Not for release, publication or distribution, in whole or in part, directly or indirectly, in any jurisdiction in which the release, publication or distribution would be unlawful.
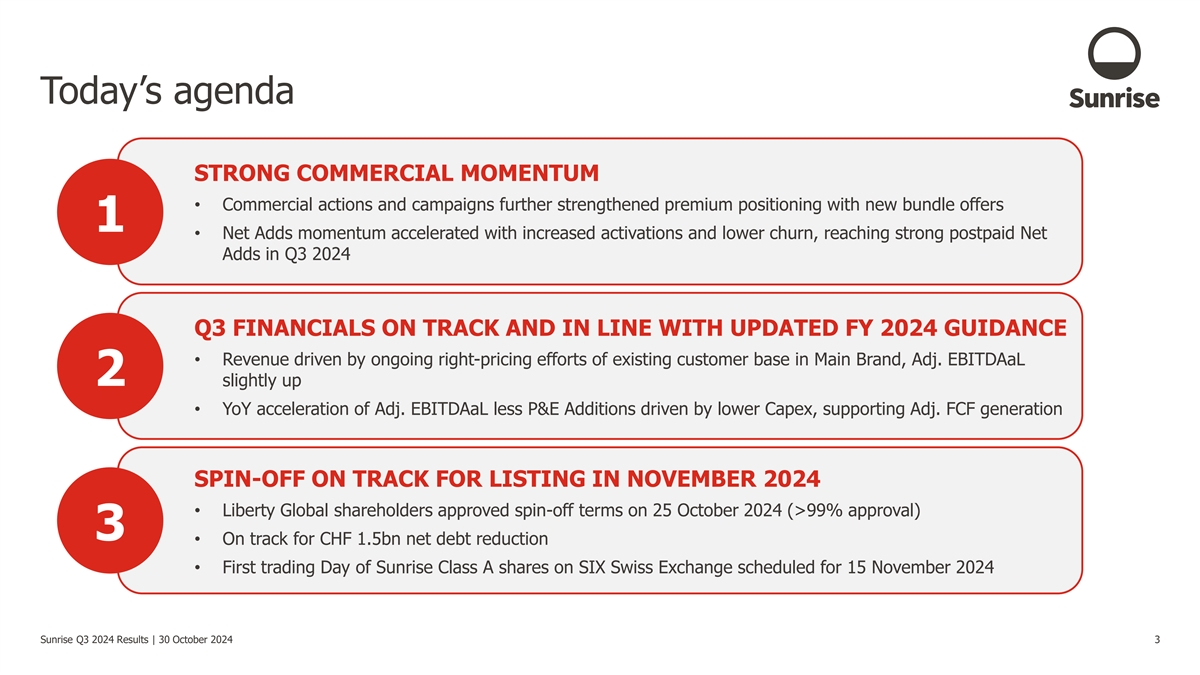
Today’s agenda STRONG COMMERCIAL MOMENTUM • Commercial actions and campaigns further strengthened premium positioning with new bundle offers 1 • Net Adds momentum accelerated with increased activations and lower churn, reaching strong postpaid Net Adds in Q3 2024 Q3 FINANCIALS ON TRACK AND IN LINE WITH UPDATED FY 2024 GUIDANCE • Revenue driven by ongoing right-pricing efforts of existing customer base in Main Brand, Adj. EBITDAaL 2 slightly up • YoY acceleration of Adj. EBITDAaL less P&E Additions driven by lower Capex, supporting Adj. FCF generation SPIN-OFF ON TRACK FOR LISTING IN NOVEMBER 2024 • Liberty Global shareholders approved spin-off terms on 25 October 2024 (>99% approval) 3 • On track for CHF 1.5bn net debt reduction • First trading Day of Sunrise Class A shares on SIX Swiss Exchange scheduled for 15 November 2024 Sunrise Q3 2024 Results | 30 October 2024 3

Strong commercial momentum Sunrise Q3 2024 Results | 30 October 2024 4
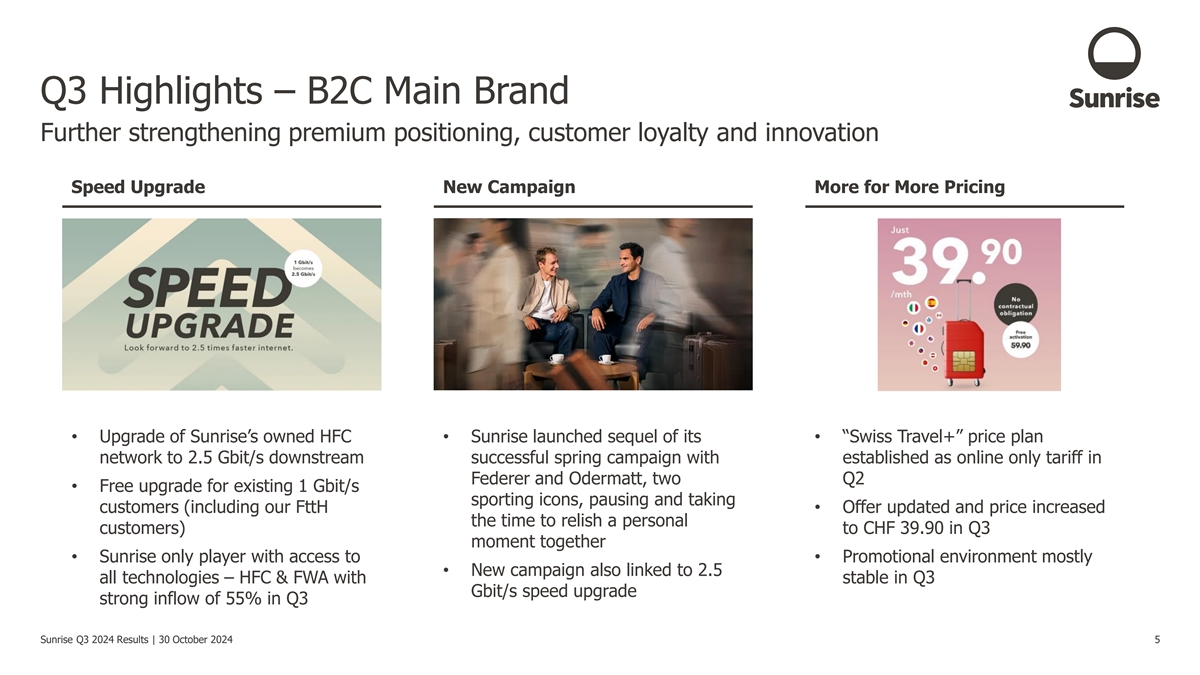
Q3 Highlights – B2C Main Brand Further strengthening premium positioning, customer loyalty and innovation Speed Upgrade New Campaign More for More Pricing • Upgrade of Sunrise’s owned HFC • Sunrise launched sequel of its • “Swiss Travel+” price plan network to 2.5 Gbit/s downstream successful spring campaign with established as online only tariff in Federer and Odermatt, two Q2 • Free upgrade for existing 1 Gbit/s sporting icons, pausing and taking customers (including our FttH • Offer updated and price increased the time to relish a personal customers) to CHF 39.90 in Q3 moment together • Sunrise only player with access to • Promotional environment mostly • New campaign also linked to 2.5 all technologies – HFC & FWA with stable in Q3 Gbit/s speed upgrade strong inflow of 55% in Q3 Sunrise Q3 2024 Results | 30 October 2024 5

Q3 Highlights – B2C Main Brand Flex Premium Bundle offers unique value proposition for our new and existing customers With Flex Premium Bundle always the latest smartphone and your mobile subscription at an unbeatable price forever • For everyone: New and existing customers • Always the newest smartphone – with Flex Upgrade • Attractive Bundle Price e.g. CHF 87.- / month for a Up Mobile L (EU Unlimited) incl. iPhone 16 Pro (256 Gb), incl. Apple Care and iCloud+ >20% ~5% 50% of all smartphone YoY iPhone 16 vs Flex Upgrade sales driven by iPhone 15 sales attach rate Flex Premium increase Bundle Sunrise Q3 2024 Results | 30 October 2024 6

Q3 Highlights – B2C Flanker Brand yallo with continued strong growth and focus on quality Continued Momentum Increased Presence Enhancing Full Telco Positioning • Milestone of 1m RGUs surpassed• Footprint expansion with new • Highest quarterly Internet NPS in 18 prime store opened in Zurich main months and all-time high for TV NPS • Stable level of competitive station intensity• Further modernizing our digital • New yallo & UberEats partnership infrastructure and customer journeys • Mobile churn rate continues to launched (e.g. new check-out) improve YoY Sunrise Q3 2024 Results | 30 October 2024 7

Q3 Highlights – B2B Continued customer wins while new quality awards underpin our strong offering Continued customer wins Certified Quality Cycling World Championships 2024 • Sunrise achieved ISO 22301 • Sunrise supported the 2024 • Various renewals and new certification for our business- Cycling World Championships in customer wins in Q3 across mobile continuity management system Zurich as technology partner and fixed products • «Bilanz Magazin» and «connect • B2B clients and Sunrise Moments professional» awards underpinning customers received “Money can’t our strong offering in the market buy” experiences, VIP and fan village tickets Sunrise Q3 2024 Results | 30 October 2024 8

Q3 Commercial Highlights Commercial momentum reflected in strong net additions 48 29 27 27 23 Strong Inflow Momentum on the back of an attractive Product Offering and New Q3 2023 Q4 2023 Q1 2024 Q2 2024 Q3 2024 Postpaid Product Launches Net 10 7 5 1 2 Additions in k Internet -4 Focus on Customer Retention materializing Q3 2023 Q4 2023 Q1 2024 Q2 2024 Q3 2024 in lower Churn: Mobile and Fixed Churn reduced ~20% in Q3 YoY 55.5% 55.7% 55.9% 56.2% 56.6% 2 FMC as % of base Q3 2023 Q4 2023 Q1 2024 Q2 2024 Q3 2024 -2.2 Migration of UPC Customer base ongoing -6.8% (approx. 120k customers migrated in Q3) 32.4 31.1 30.1 30.0 30.1 Q3 2023 Q4 2023 Q1 2024 Q2 2024 Q3 2024 Mobile 3 ARPU -2.8 -4.6% in CHF ARPU development driven by Brand Mix / 61.6 61.1 60.1 59.6 58.8 Usage (Mobile) and right-pricing (Fixed) Fixed Q3 2023 Q4 2023 Q1 2024 Q2 2024 Q3 2024 1 Net Additions incl. Residential and B2B; Q3 2023 Postpaid net additions adjusted versus Factsheet by 27k non-organic prepaid to postpaid base shift related to Swype (within Flanker Brands) 2 Defined as number of customers who subscribed to both a fixed broadband internet service and post-paid mobile telephony service, divided by the total number of customers who subscribe to at least one fixed broadband internet service 9 Sunrise Q3 2024 Results | 30 October 2024 3 ARPU based on residential customers only; mobile ARPU based on mobile subscription revenue divided by mobile RGUs, and fixed ARPU based on fixed subscription revenue divided by fixed customer relationships

Q3 financials on track and in line with updated FY 2024 guidance Sunrise Q3 2024 Results | 30 October 2024 10

Q3 Financial Highlights Slight revenue decrease compensated by higher profitability and acceleration in cash flows Key Financials in CHFm, YoY Q3 2023 Q3 2024 Δ 9M 2023 9M 2024 Δ • Modest YoY decrease in Q3 2024 revenue as decline in Main Brand is partly compensated by Revenue (1.3%) (0.3%) continued revenue growth momentum from 759 749 2’240 2’233 Flanker Brand and B2B • First quarter after annualization of price increase Adj. EBITDAaL 1 273 274 772 780• Impact of revenue decline on Adj. EBITDAaL softened +0.4% +1.1% % of Revenue 36.0% 36.6% 34.4% 34.9% on the back of optimized Opex spend and lower direct costs, leading to slightly increasing Adj. EBITDAaL YoY and low-single digit growth on a 2 CAPEX 133 111 381 369 (16.1%) (3.2%) YTD basis % of Revenue 17.5% 14.9% 17.0% 16.5% • Lower P&E Additions (“Capex”) YoY incl. the 3 phase-out of cost-to-capture , leading to growing Adj. EBITDAaL Adj. EBITDAaL less P&E Additions less P&E Additions 141 163 391 412 +15.9% +5.3% % of Revenue 18.5% 21.8% 17.5% 18.4% • Q3 adj. FCF generation reflecting typical in-year phasing pattern (Q3 2023 impacted by a one-off hence limited comparability) Adj. FCF (101) 6 151 119 n/m (21.5%) % of Revenue n/m 0.8% 6.8% 5.3% Note: Financial metrics are shown on a rebased IFRS basis (RB); See appendix for alternate performance measure definitions and reconciliations. 1 2024YTD accounting reclassification in relation to fibre lease, leading to a reduction of Direct Cost and according increase of Opex in the amount of CHF8m (CHF 4.5m within B2B, CHF 3.5m within I&S) 2 3 Excluding finance lease additions and hockey rights; Referring to costs arising in capturing the synergies Sunrise Q3 2024 Results | 30 October 2024 11

Revenue and Adj. EBITDAaL Revenue decline offset by Opex savings, leading to slightly increasing adj. EBITDAaL YoY 1 Revenue Adj. EBITDAaL in CHFm, YoY in CHFm, YoY +1 (10) +0.4% (1.3%) 759 273 (3) 274 Consumer Residential (1) 749 10 B2B & WHS 2 (25) (16) Infra & Support 13 10 Gross Gross Profit Gross OPEX Leasing Q3 2023 Q3 2024 Q3 Q3 Profit CR B2B/WHS Profit I&S 2023 2024 • Modest YoY decline in Q3 2024 revenue, driven by continued • Consumer Residential GP driven by revenue decline, partially right-pricing efforts of existing customer base in Main Brand, offset by lower direct costs (on both fixed and mobile) reflected in lower subscription revenues in Fixed and lower mobile roaming due to increased inclusion in bundles • Adjusted EBITDAaL improving slightly YoY despite softer revenues. Excluding an accounting reclassification in relation to fibre • Decline partly offset by better mobile handset sales, increasing 1 fixed and mobile subscription revenues from Flanker Brand lease , the increase in EBITDAaL has been driven by: driven by growing customer base and pre- to post-paid migration • Infrastructure & Support GP improvement driven by phasing of Built-to-Suit revenues • Continued pattern of revenue growth in B2B & Wholesale primarily on the basis of increasing fixed and mobile subscription • Opex optimization due to ongoing efficiency program as well revenues incl. strong MVNO performance (part of wholesale as phase-out of Cost-to-Capture and related external spend operations) 1 2024YTD accounting reclassification in relation to fibre lease, leading to a reduction of Direct Cost and according increase Sunrise Q3 2024 Results | 30 October 2024 12 of Opex in the amount of CHF8m (CHF 4.5m within B2B, CHF 3.5m within I&S)

Adj. EBITDAaL less P&E Additions and Adj. FCF Lower Capex including Cost-to-Capture phase-out, leading to strong cash flow generation Adj. EBITDAaL less P&E Additions Adj. FCF in CHFm, YoY Δ in CHFm, YoY Δ (CHF / %) (CHF / %) Adj. EBITDAaL 391 +21 / +5.3 412 1 / 0.4 Less P&E Additions Adj. EBITDAaL 273 274 Interest 229 0 / 0 229 (22) / (16.1) +7 / n/m Capex 133 Tax 6 1 111 (46) / n/m WC + Other 17 63 Adj. EBITDAaL +22 / +15.9 141 163 Less P&E Additions (33) / (21.5) Adj. FCF 151 119 Q3 2023 Q3 2024 9M 2023 9M 2024 • Capex decrease mainly driven by lower CPE, as well as lower spend on TV- and IT platforms, including the phase out of Cost-to-Capture spend, partially offset by higher spend YoY on Mobile Capacity and 5G • YoY acceleration of Adj. EBITDAaL less P&E Additions supporting the YTD Adj. FCF generation, which is on track with main YoY difference from comparatively higher supplier payments, vendor financing additions as well as one-off and intercompany-related elements Illustrative adj. FCF phasing CHFm • Limited seasonality in Adj. EBITDAaL generation • Typically some acceleration of capex in Q4 • Semi-annual interest and higher supplier payments impacting Q1 & Q3, resulting in Q2 and Q4 tending to be the strongest cash flow generating quarters Q1 Q2 Q3 Q4 Sunrise Q3 2024 Results | 30 October 2024 13

Guidance 2024 On track and in line with updated FY 2024 Guidance on all metrics 2023 Reported (pre-rebasing for 2024) 2024 Guidance (IFRS, rebased) CHF 3,035m Broadly stable Revenue Stable to low-single digit 1 CHF 1,030m Adj. EBITDAaL growth Capex / revenue 17.7% of revenue 16 - 18% of revenue CHF 360 - 370m 1 CHF 353m Adj. FCF (after deduction of CHF ~10m spin-off costs) 2 • 2025 dividend (for FY2024): ≥CHF240m Dividend • Dividends not subject to Swiss withholding tax for 5+ years 1 Quantitative reconciliations to net earnings/loss (including net earnings/loss growth rates) and cash flow from operating activities for Adj. EBITDA, Adj. EBITDAaL, and Adj. FCF guidance cannot be provided without unreasonable efforts as we do not forecast (i) certain non-cash charges including: the components of nonoperating income/expense, depreciation and amortization, and impairment, restructuring and other operating items included in net earnings/loss from continuing operations, nor (ii) specific changes in working capital that impact cash flows Sunrise Q3 2024 Results | 30 October 2024 14 from operating activities. The items we do not forecast may vary significantly from period to period 2 Subject to approval by Sunrise’s Annual General Meeting

Spin-off on track for listing in November 2024 Sunrise Q3 2024 Results | 30 October 2024 15

Expected Spin-off timetable Listing on SIX Swiss Exchange expected on 15 November 2024 First day of trading of First day of trading of Distribution Record Date Class A shares on SIX Class A ADSs on Nasdaq Swiss Exchange 31 Oct 2024 12 Nov 2024 14 Nov 2024 22 Nov 2024 04 Nov 2024 13 Nov 2024 15 Nov 2024 Liberty Global capital Expected inclusion of injection / gross debt Class A and B ADSs ADSs Distribution Date Class A Shares in Swiss available to be cancelled reduction Performance Index (SPI) (see next page) Sunrise Q3 2024 Results | 30 October 2024 16

Debt Structure post capital injection Targeted leverage of 4.5x at year end • Gross debt reduction of ~CHF1.2bn (incl. related derivative 1 Leverage post capital injection (in CHFm) terminations resulting in reduction of swap liabilities) will be effected as of 31 October 2024, funded by a capital contribution from Liberty 30 Sep 2024 Paydown Pro Forma Global Senior Credit Facilities 3’070 (940) 2’130 • Additional cash contribution of CHF50m pre spin-off as well as Senior Secured Notes 1’409 (17) 1’392 Sunrise adj. FCF generation post spin expected to achieve a net debt reduction of CHF1.5bn and reduce leverage to 4.5x by year Senior Notes 700 (95) 605 end Vendor Financing 341 (5) 336 • Reconfirmation of the 3.5-4.5x expected leverage range in the mid- 2 Third-party Debt Obligations 5’519 (1’057) 4’463 term with clear intention to use excess adj. FCF for further de- leveraging as part of the capital allocation policy Cross-Currency Principal 607 (156) 450 Gross Debt 6’126 (1’213) 4’913 Illustrative net debt development • Debt stack fully-hedged against interest rate and currency changes until 2029 3 with weighted average cost of debt of 3.0% CHF 1.5bn Net • Fully swapped into CHF Debt reduction Liberty Global • No near-term maturities with 78% of debt becoming due in 2029 or 2031 only Capital Injection 4.5x Leverage 4 Debt maturity profile Sunrise FY 2024 52.4% FCF Generation 25.2% 22.4 % Net Debt Net Debt Reduction Exp. Net Debt 2025 2026 2027 2028 2029 2030 2031 30 Sep 24 31 Dec 24 1 Converted at CHF/EUR exchange rate of 1.0622. Sunrise Q3 2024 Results | 30 October 2024 17 2 Excludes finance lease obligations. 3 As of October 2024. 4 Relating to third-party debt obligations excluding Vendor Financing.

Key Takeaways 1 STRONG COMMERCIAL MOMENTUM Q3 FINANCIALS ON TRACK AND IN LINE WITH 2 UPDATED FY 2024 GUIDANCE SPIN-OFF ON TRACK FOR LISTING IN 3 NOVEMBER 2024 Sunrise Q3 2024 Results | 30 October 2024 18

Q&A Sunrise Q3 2024 Results | 30 October 2024 19

Appendix Sunrise Q3 2024 Results | 30 October 2024 20

Q3 Bridge from Liberty Global to Sunrise Non-Financial Disclosure Q3 24 NFI Bridge Liberty Global reporting to Sunrise reporting Q3 24 Liberty Global Reported Bridge to Sunrise Reported Q3 24 Sunrise Reported • Broader inclusion of 2nd Sim Cards counted as RGUs • Postpaid, Net Additions in k 43 Timing of Recognition change (different cut- 48 off date within month) • Other • Reclassification of certain customers receiving fixed broadband internet services over Sunrise’s mobile services are considered fixed Internet Subscribers Broadband, Net Additions in • Broader B2B definition in Sunrise reported 1 5 • Product Count: multiple Broadband Products k being counted as multiple RGUs • Timing of Recognition change (different cut- off date within month) • Other • Sunrise discloses Residential and B2B FMC FMC Penetration, as % of Penetration separately whereas LG definition 56.6 59.0 considers all SoHo as well base (Residential only) • Other Sunrise Q3 2024 Results | 30 October 2024 21

Quarterly P&L and Cash Flow Financials - P&L 2023RB 2024RB CHF millions 2021RB Q122 Q222 Q322 Q422 2022RB Q123 Q223 Q323 Q423 2023RB Q124 Q224 Q324* (H1) (H1) Revenue 3’042.4 760.1 740.4 765.7 775.7 3’041.9 747.4 733.3 1’480.7 759.1 795.4 3’035.2 746.8 737.5 1’484.3 749.0 Growth % (0.0%) (1.7%) (1.0%) (0.9%) 2.5% (0.2%) (0.1%) 0.6% (1.3%) CoS 818.4 195.7 179.2 199.3 228.0 802.4 201.7 192.3 394.0 204.2 236.4 834.6 201.7 195.1 396.9 189.3 Gross Profit 2’224.0 564.4 561.2 566.4 547.7 2’239.7 545.7 541.0 1’086.7 554.9 559.0 2’200.6 545.0 542.4 1’087.4 559.7 Growth % 0.7% (3.3%) (3.6%) (2.0%) 2.1% (1.7%) (0.1%) 0.3% 0.9% Margin % 73.1% 74.3% 75.8% 74.0% 70.6% 73.6% 73.0% 73.8% 73.4% 73.1% 70.3% 72.5% 73.0% 73.5% 73.3% 74.7% OPEX 968.3 250.4 257.1 236.2 260.6 1’004.3 252.5 237.7 490.2 232.7 251.6 974.5 246.2 235.5 481.7 235.5 SBC 24.8 8.9 4.9 9.9 7.0 30.7 5.3 6.9 12.2 5.1 5.2 22.5 4.8 5.2 10.0 4.9 Adjustments (24.8) (8.9) (4.9) (9.9) (7.0) (30.7) (5.3) (6.9) (12.2) (5.1) (5.2) (22.5) (4.8) (5.2) (10.0) (4.9) Adj. EBITDA 1’255.7 313.9 304.1 330.1 287.1 1’235.2 293.2 303.3 596.5 322.2 307.4 1’226.1 298.8 306.9 605.7 324.2 Leases 191.7 52.7 52.7 52.7 52.6 210.7 48.8 49.4 98.2 48.9 48.8 195.9 49.8 50.0 99.8 49.8 Adj. EBITDAaL 1’064.0 261.2 251.4 277.4 234.5 1’024.5 244.4 253.9 498.3 273.3 258.6 1’030.2 249.0 256.9 505.9 274.4 Growth % (3.7%) (6.4%) 1.0% (1.5%) 10.3% 1.9% 1.2% 0.4% Margin % 35.0% 34.4% 34.0% 36.2% 30.2% 33.7% 32.7% 34.6% 33.7% 36.0% 32.5% 33.9% 33.3% 34.8% 34.1% 36.6% P&E Additions excl. Hockey rights 579.7 138.4 114.7 142.4 180.3 575.8 137.8 110.1 247.9 132.6 157.2 537.7 130.7 126.5 257.2 111.3 % of Revenue 19.1% 18.2% 15.5% 18.6% 23.2% 18.9% 18.4% 15.0% 16.7% 17.5% 19.8% 17.7% 17.5% 17.2% 17.3% 14.9% Adj. EBITDA less PP&E add. 676.0 175.5 189.4 187.7 106.8 659.4 155.4 193.2 348.6 189.6 150.2 688.4 168.1 180.4 348.5 212.9 Adj. EBITDAaL less PP&E add. 484.3 122.8 136.7 135.0 54.2 448.7 106.6 143.8 250.4 140.7 101.4 492.5 118.3 130.4 248.7 163.1 Growth % (7.4%) (13.2%) 5.2% 4.2% 87.1% 9.8% 11.0% (9.3%) 15.9% % revenue 15.9% 14.8% 16.9% 16.2% 16.8% Interest (284.2) (287.1) (125.4) (103.8) (248.0) (125.3) (103.6) Tax (18.1) (9.3) (0.6) 6.8 4.0 (1.2) - Working Capital & Other 114.5 147.2 127.6 (144.3) 104.0 (9.5) (53.3) Adj. FCF 296.5 299.5 252.0 (100.6) 352.5 112.7 6.2 *2024YTD accounting reclassification in relation to fibre lease, leading to a reduction of Direct Cost and Sunrise Q3 2024 Results | 30 October 2024 according increase of Opex in the amount of CHF8m (CHF 4.5m within B2B, CHF 3.5m within I&S) 22

Quarterly segment split Financials - Revenue split 2023RB 2024RB 1 1 CHF millions 2021A 2022A Q123 Q232 Q323 Q423 2023RB Q124 Q234 Q324 (H1) (H1) Revenue 3’035.7 3’035.2 747.4 733.3 1’480.7 759.1 795.4 3’035.2 746.8 737.5 1’484.3 749.0 Growth % (0.0%) (1.7%) (1.0%) (0.9%) 2.5% (0.2%) (0.1%) 0.6% (1.3%) Residential Customers 2’314.6 2’275.5 559.7 544.4 1’104.1 563.6 579.6 2’247.3 547.1 533.1 1’080.2 538.6 Fixed Revenue 1’136.5 1’088.3 265.5 263.9 529.4 269.0 263.4 1’061.8 257.0 253.1 510.1 249.3 o/w Subscription 1’124.5 1’079.6 262.5 259.5 522.0 262.7 258.4 1’043.1 252.7 249.6 502.3 245.8 o/w Non-Subscription & Hardware 12.0 8.7 3.0 4.4 7.4 6.3 5.0 18.7 4.3 3.5 7.8 3.5 Mobile Revenue 1’028.5 1’053.5 258.8 250.2 509.0 265.1 278.2 1’052.3 256.2 249.7 505.9 257.5 o/w Subscription 831.7 854.8 206.0 208.9 414.9 222.9 215.1 852.9 207.3 208.9 416.2 211.0 o/w Non-Subscription & Hardware 196.8 198.7 52.8 41.3 94.1 42.2 63.1 199.4 48.9 40.8 89.7 46.5 Other 149.6 133.7 35.4 30.3 65.7 29.5 38.0 133.2 33.9 30.3 64.2 31.8 Business Customers & Wholesale 713.3 752.3 187.6 187.5 375.1 194.1 207.3 776.5 199.3 202.6 401.9 207.3 Fixed Revenue 412.6 430.6 104.8 106.3 211.1 109.9 116.4 437.4 115.4 117.8 233.2 117.6 o/w Subscription 273.8 270.0 66.9 68.1 135.0 68.5 69.9 273.4 70.2 72.0 142.2 76.2 o/w Non-Subscription & Hardware 138.8 160.6 37.9 38.2 76.1 41.4 46.5 164.0 45.2 45.8 91.0 41.4 Mobile Revenue 299.6 320.8 80.8 81.0 161.8 83.9 90.5 336.2 83.2 84.0 167.2 88.8 o/w Subscription 226.0 240.6 61.7 62.6 124.3 64.3 66.1 254.7 65.3 66.0 131.3 68.1 o/w Non-Subscription & Hardware 73.6 80.2 19.1 18.4 37.5 19.6 24.4 81.5 17.9 18.0 35.9 20.7 Other 1.1 0.9 2.0 0.2 2.2 0.3 0.4 2.9 0.7 0.8 1.5 0.9 Infrastructure & Support Functions 7.8 7.4 0.1 1.4 1.5 1.4 8.5 11.4 0.4 1.8 2.2 3.1 Fixed Revenue (Subscription) 2.6 0.7 - - - - - - - - - - Other 5.2 6.7 0.1 1.4 1.5 1.4 8.5 11.4 0.4 1.8 2.2 3.1 1: As Reported excl. rebased adjustments Sunrise Q3 2024 Results | 30 October 2024 23
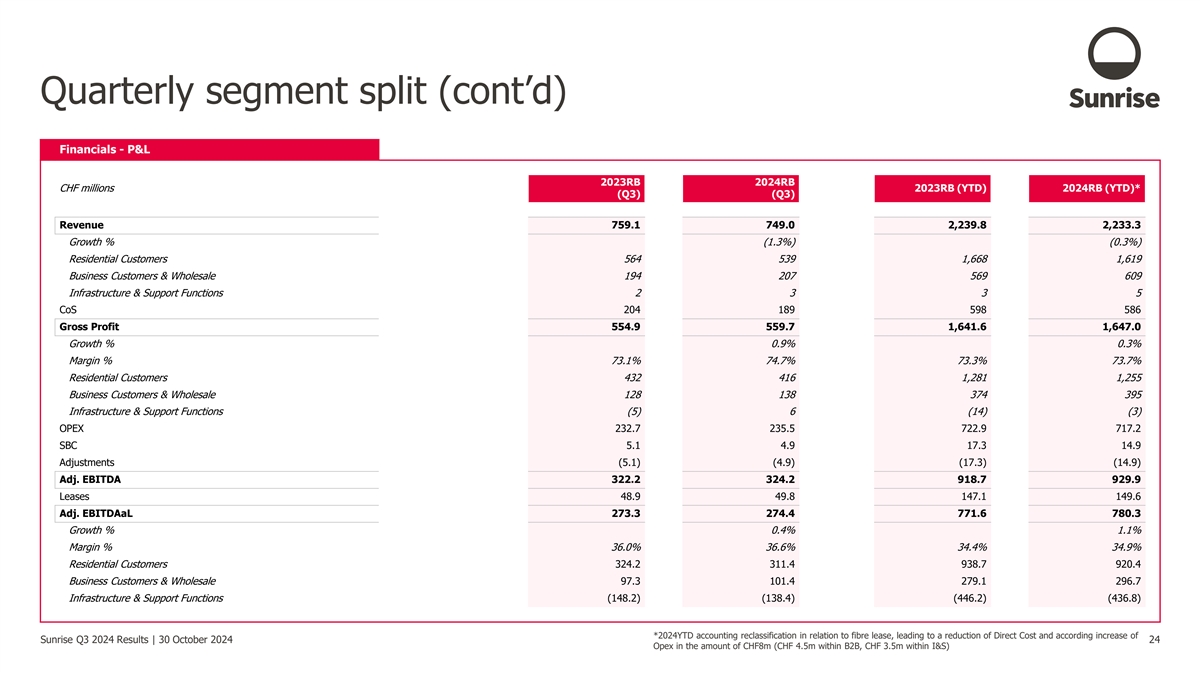
Quarterly segment split (cont’d) Financials - P&L 2023RB 2024RB CHF millions 2023RB (YTD) 2024RB (YTD)* (Q3) (Q3) Revenue 759.1 749.0 2,239.8 2,233.3 Growth % (1.3%) (0.3%) Residential Customers 564 539 1,668 1,619 Business Customers & Wholesale 194 207 569 609 Infrastructure & Support Functions 2 3 3 5 CoS 204 189 598 586 Gross Profit 554.9 559.7 1,641.6 1,647.0 Growth % 0.9% 0.3% Margin % 73.1% 74.7% 73.3% 73.7% Residential Customers 432 416 1,281 1,255 Business Customers & Wholesale 128 138 374 395 Infrastructure & Support Functions (5) 6 (14) (3) OPEX 232.7 235.5 722.9 717.2 SBC 5.1 4.9 17.3 14.9 Adjustments (5.1) (4.9) (17.3) (14.9) Adj. EBITDA 322.2 324.2 918.7 929.9 Leases 48.9 49.8 147.1 149.6 Adj. EBITDAaL 273.3 274.4 771.6 780.3 Growth % 0.4% 1.1% Margin % 36.0% 36.6% 34.4% 34.9% Residential Customers 324.2 311.4 938.7 920.4 Business Customers & Wholesale 97.3 101.4 279.1 296.7 Infrastructure & Support Functions (148.2) (138.4) (446.2) (436.8) *2024YTD accounting reclassification in relation to fibre lease, leading to a reduction of Direct Cost and according increase of Sunrise Q3 2024 Results | 30 October 2024 24 Opex in the amount of CHF8m (CHF 4.5m within B2B, CHF 3.5m within I&S)

Operational KPIs – Customer relationships Customer Relationships 2021 2022 Q123 Q232 2023H1 Q323 Q423 2023H2 2023 Q124 Q224 2024 H1 Q324 Fixed Customer Relationships represent the number of customers who receive at least one of Sunrise’s broadband internet, TV or fixed-line telephony services, without regard to which or to how many services they subscribe. Fixed Customer Relationships generally are counted on a unique premises basis. Accordingly, if an individual receives Sunrise’s services in two premises (e.g., a o/w Fixed primary home and a vacation home), that individual generally will count as two Fixed Customer Relationships. Sunrise’s fixed customer relationships include customers who receive Basic Cable Services (“BCS”) which are services delivered without the use of encryption- enabling, integrated or virtual technology as well as customers who receive fixed telephony services over Sunrise’s networks, or that Sunrise services through a partner network. Residential 1,429,995 1,412,276 1,436,027 1,426,348 1,426,348 1,416,509 1,401,508 1,401,508 1,401,508 1,399,307 1,394,952 1,394,952 1,392,680 1 Business 87,914 99,745 102,579 105,337 105,337 107,789 110,275 110,275 110,275 112,476 115,198 115,198 121,033 Fixed-mobile convergence penetration represents the number of customers who subscribe to both a fixed broadband internet service Convergence (FMC and pre- or postpaid mobile telephony service, divided by the total Penetration) number of customers who subscribe to fixed broadband internet service. Residential 54.3% 55.1% 55.3% 55.5% 55.5% 55.5% 55.7% 55.7% 55.7% 55.9% 56.2% 56.2% 56.6% 2 Business 85.5% 85.7% 85.4% 85.4% 85.4% 85.3% 85.0% 85.0% 85.0% 84.4% 83.8% 83.8% 82.0% (1) Business customer and wholesale fixed relationships and Fixed RGUs include customers who receive fixed services that are the same or similar to mass marketed product offered to residential customers. This includes customers who receive discounted services pursuant to a program Sunrise has in place with their employer, small or home office (“SOHO”) customers and small or medium enterprise (“SME”) customers (generally defined as businesses with 99 or fewer employees) and does not include services provided to large enterprises (generally defined as businesses with 100 or more employees) or wholesale services. (2) Business customer and wholesale Mobile RGUs represent the number of active SIM cards in service that are provided to business and wholesale customers, including customers who receive discounted services pursuant to a program Sunrise has in place with their employer, SOHO, SME and large enterprise customers, as well as to customers who subscribed for mobile services delivered over Sunrise’s networks through a branded reseller with whom Sunrise contracts, and excluding customers who subscribed for mobile services delivered over Sunrise’s networks through a MVNO with whom Sunrise contracts, as well as other wholesale customers. Sunrise Q3 2024 Results | 30 October 2024 25

Operational KPIs – Base RGUs 1 Base RGUs 2021 2022 Q123 Q232 2023H1 Q323 Q423 2023H2 2023 Q124 Q224 2024 H1 Q324 Internet Subscribers are homes, residential multiple dwelling units or commercial units that receive fixed Broadband Internet broadband internet services over Sunrise’s fixed or mobile networks or that Sunrise services through a partner network. Residential 1,171,166 1,178,628 1,180,640 1,176,745 1,176,745 1,170,354 1,169,539 1,169,539 1,169,539 1,176,516 1,180,335 1,180,335 1,178,476 2 Business 95,475 108,966 112,351 115,372 115,372 118,138 120,998 120,998 120,998 123,584 126,665 126,665 133,047 Enhanced TV Subscribers are homes, residential multiple dwelling units or commercial units that receive Sunrise’s enhanced TV services, which are TV services delivered Enhanced TV through encryption-enabling, integrated or virtual technology over Sunrise’s broadband network or through a partner network. Enhanced TV Subscribers exclude subscribers that receive BCS. Residential 936,620 940,549 935,733 929,749 929,749 920,409 914,664 914,664 914,664 913,987 908,212 908,212 900,788 2 Business 57,212 68,739 71,714 74,583 74,583 76,989 79,606 79,606 79,606 81,758 84,279 84,279 85,265 A Mobile RGU is a Mobile Subscriber, which represents an active SIM card in service. A subscriber who has a Mobile RGUs data and voice plan for a mobile handset and a data plan for a laptop would be counted as two Mobile Subscribers. Residential 2,157,105 2,256,483 2,271,034 2,285,477 2,285,477 2,306,325 2,298,181 2,298,181 2,298,181 2,305,657 2,322,469 2,322,469 2,343,537 3 Business 608,448 691,187 705,748 704,015 704,015 714,829 722,618 722,618 722,618 729,493 737,495 737,495 753,247 Mobile Postpaid RGUs Numbers of Mobile products (Postpaid) Residential 1,751,173 1,866,952 1,894,342 1,914,507 1,914,507 1,957,948 1,974,009 1,974,009 1,974,009 1,989,848 2,010,033 2,010,033 2,041,125 3 Business 550,506 635,299 648,813 651,176 651,176 661,988 673,206 673,206 673,206 680,248 689,499 689,499 706,206 (1) A Fixed RGU is, separately, an Internet Subscriber or an Enhanced TV Subscriber. A home, residential multiple dwelling unit or commercial unit may contain one or more RGUs. For example, if a residential customer subscribed to Sunrise’s broadband internet service or enhanced TV service, the customer would constitute two RGUs. RGUs generally are counted on a unique premises basis such that a given premise does not count as more than one RGU for any given service. However, if an individual receives one of Sunrise’s services in two premises (e.g., a primary home and a vacation home), that individual will count as two RGUs for that service. Each bundled internet or enhanced TV service is counted as a separate RGU regardless of the nature of any bundling discount or promotion. Non-paying subscribers are counted as subscribers during their free promotional service period. Some of these subscribers may choose to disconnect after their free service period. Services offered without charge on a long-term basis (e.g., certain preferred subscribers) generally are not counted as RGUs. Free services provided to Sunrise employees generally are counted as RGUs. (2) Business customer and wholesale fixed relationships and Fixed RGUs include customers who receive fixed services that are the same or similar to mass marketed product offered to residential customers. This includes customers who receive discounted services pursuant to a program Sunrise has in place with their employer, small or home office (“SOHO”) customers and small or medium enterprise (“SME”) customers (generally defined as businesses with 99 or fewer employees) and does not include services provided to large enterprises (generally defined as businesses with 100 or more employees) or wholesale services. (3) Business customer and wholesale Mobile RGUs represent the number of active SIM cards in service that are provided to business and wholesale customers, including customers who receive discounted services pursuant to a program Sunrise has in place with their employer, SOHO, SME and large enterprise customers, as well as to customers who subscribed for mobile services delivered over Sunrise’s networks through a branded reseller with whom Sunrise contracts, and excluding customers who subscribed for mobile services delivered over Sunrise’s networks through a MVNO with whom Sunrise contracts, as well as other wholesale customers. Sunrise Q3 2024 Results | 30 October 2024 26

Operational KPIs – ARPU Residential ARPU (Residential) 2021 2022 Q123 Q232 2023H1 Q323 Q423 2023H2 2023 Q124 Q224 2024 H1 Q324 Subscription Revenue CHFm 1,956 1,934 469 468 937 486 474 959 1,896 460 459 919 457 Fixed CHFm 1,125 1,080 263 260 522 263 258 521 1,043 253 250 502 246 Mobile CHFm 832 855 206 209 415 223 215 438 853 207 209 416 211 Endbase Fixed - Customer # 1,429,995 1,412,276 1,436,027 1,426,348 1,426,348 1,416,509 1,401,508 1,401,508 1,401,508 1,399,307 1,394,952 1,394,952 1,392,680 Relationships Mobile - RGUs # 2,157,105 2,256,483 2,271,034 2,285,477 2,285,477 2,306,325 2,298,181 2,298,181 2,298,181 2,305,657 2,322,469 2,322,469 2,343,537 Average Base Fixed - Customer # 1,424,152 1,431,188 1,419,312 1,421,429 1,409,009 1,413,928 1,400,408 1,397,130 1,398,230 1,393,816 Relationships Mobile - RGUs # 2,263,759 2,278,256 2,270,980 2,295,901 2,302,253 2,291,829 2,301,919 2,314,063 2,310,325 2,333,003 Average Revenue Per Unit (“ARPU”) is the average ARPU subscription revenue per average fixed customer relationship or mobile subscriber, as applicable. ARPU per fixed customer relationship is calculated by dividing the average subscription revenue from Fixed CHF residential fixed services by the average of the 61.4 60.4 61.3 61.6 61.1 61.4 60.1 59.6 59.9 58.8 opening and ending balance of fixed customer relationships for the period. ARPU per mobile subscriber is calculated by dividing the average mobile subscription revenue (including interconnect revenue but excluding Mobile CHF 30.3 30.6 30.4 32.4 31.1 31.9 30.0 30.1 30.0 30.1 handset sales and late fees) by the average of the opening and ending balance of mobile subscribers in service for the period. Sunrise Q3 2024 Results | 30 October 2024 27

US GAAP to IFRS Reconciliations Three months ended September 30, 2024 Nine months ended September 30, 2024 Three months ended September 30, 2023 Nine months ended September 30, 2023 Revenue Revenue Revenue Revenue Asset Asset Asset Asset Cloud Sports Rights Cloud Sports Rights Cloud Sports Rights Cloud Sports Rights U.S. GAAP Leases Retirement Pension IFRS U.S. GAAP Leases Retirement Pension IFRS U.S. GAAP Leases Retirement Pension IFRS U.S. GAAP Leases Retirement Pension IFRS Computing Agreements Computing Agreements Computing Agreements Computing Agreements Obligations Obligations Obligations Obligations CHF in millions CHF in millions CHF in millions CHF in millions As Reported 749.0 - - - - - 749.0 2’233.3 - - - - 2’233.3 759.1 - - - - - 759.1 2’239.8 - - - - - 2’239.8 Three months ended September 30, 2024 Nine months ended September 30, 2024 Three months ended September 30, 2023 Nine months ended September 30, 2023 Adj EBITDA Adj EBITDA Adj EBITDA Adj EBITDA Asset Asset Asset Asset Cloud Sports Rights Cloud Sports Rights Cloud Sports Rights Cloud Sports Rights U.S. GAAP Leases Retirement Pension IFRS U.S. GAAP Leases Retirement Pension IFRS U.S. GAAP Leases Retirement Pension IFRS U.S. GAAP Leases Retirement Pension IFRS Computing Agreements Computing Agreements Computing Agreements Computing Agreements Obligations Obligations Obligations Obligations CHF in millions CHF in millions CHF in millions CHF in millions As Reported 275.3 47.9 0.2 - (4.0) 3.8 323.2 778.2 129.1 0.7 - 0.4 18.8 927.2 274.6 41.9 0.2 0.3 1.5 3.8 322.2 775.9 126.2 0.7 (0.4) (2.6) 18.8 918.7 Three months ended September 30, 2024 Nine months ended September 30, 2024 Three months ended September 30, 2023 Nine months ended September 30, 2023 Adj EBITDAaL Adj EBITDAaL Adj EBITDAaL Adj EBITDAaL Asset Asset Asset Asset Cloud Sports Rights Cloud Sports Rights Cloud Sports Rights Cloud Sports Rights U.S. GAAP Leases Retirement Pension IFRS U.S. GAAP Leases Retirement Pension IFRS U.S. GAAP Leases Retirement Pension IFRS U.S. GAAP Leases Retirement Pension IFRS Computing Agreements Computing Agreements Computing Agreements Computing Agreements Obligations Obligations Obligations Obligations CHF in millions CHF in millions CHF in millions CHF in millions 274.2 (0.8) 0.2 - (4.0) 3.8 273.4 773.9 (16.2) 0.7 - 0.4 18.8 777.6 273.6 (6.0) 0.2 0.3 1.5 3.8 273.3 772.1 (17.1) 0.7 (0.4) (2.6) 18.8 771.6 As Reported Three months ended September 30, 2024 Nine months ended September 30, 2024 Three months ended September 30, 2023 Nine months ended September 30, 2023 P&E Adds excl finance lease additions & sports rights P&E Adds excl finance lease additions & sports rights P&E Adds excl finance lease additions & sports rights P&E Adds excl finance lease additions & sports rights Asset Asset Asset Asset Cloud Sports Rights Cloud Sports Rights Cloud Sports Rights Cloud Sports Rights U.S. GAAP Leases Retirement Pension IFRS U.S. GAAP Leases Retirement Pension IFRS U.S. GAAP Leases Retirement Pension IFRS U.S. GAAP Leases Retirement Pension IFRS Computing Agreements Computing Agreements Computing Agreements Computing Agreements Obligations Obligations Obligations Obligations CHF in millions CHF in millions CHF in millions CHF in millions As Reported (111.3) (0.0) - - - - (111.3) (368.5) - - - - (368.5) (132.6) 0.0 - - - - (132.6) (380.5) - - - - - (380.5) Three months ended September 30, 2024 Nine months ended September 30, 2024 Three months ended September 30, 2023 Nine months ended September 30, 2023 Adj EBITDAaL less P&E Adj EBITDAaL less P&E Adj EBITDAaL less P&E Adj EBITDAaL less P&E Asset Asset Asset Asset Cloud Sports Rights Cloud Sports Rights Cloud Sports Rights Cloud Sports Rights U.S. GAAP Leases Retirement Pension IFRS U.S. GAAP Leases Retirement Pension IFRS U.S. GAAP Leases Retirement Pension IFRS U.S. GAAP Leases Retirement Pension IFRS Computing Agreements Computing Agreements Computing Agreements Computing Agreements Obligations Obligations Obligations Obligations CHF in millions CHF in millions CHF in millions CHF in millions 162.9 (0.8) 0.2 - (4.0) 3.8 162.1 405.4 (16.2) 0.7 - 0.4 18.8 409.1 141.0 (6.0) 0.2 0.3 1.5 3.8 140.7 391.6 (17.1) 0.7 (0.4) (2.6) 18.8 391.1 As Reported Notes: Leases: Finance leases are presented as part of right-of-use assets under IFRS whereas finance leases are presented as part of property and equipment, net under U.S. GAAP. The amortization of all right of use assets is presented as part of depreciation expense under IFRS whereas the amortization of operating leases is presented as part of operating expenses under U.S. GAAP. Interest expense related to the accretion of all lease liabilities is presented as part of interest expense under IFRS whereas the periodic accretion of lease liabilities related to operating leases is recognized as a reduction to amortization expense presented as part of operating expenses under U.S. GAAP. Asset Retirement Obligations: Asset retirement obligation provisions are remeasured at each reporting period and accretion expense on asset retirement obligation provisions is presented as interest expense under IFRS, whereas asset retirement obligation provisions are only remeasured upon a revision of the estimated cash flows and accretion expense is presented within operating expenses under U.S. GAAP. Pension: Curtailment gains are recognized at the same time as the related restructuring or termination benefits under IFRS whereas curtailment gains are recognized when they occur under U.S. GAAP. Cloud Computing: Certain cloud computing costs related to application development that are provided directly by the cloud computing provider and would not be incurred again if the provider were replaced with another provider are allowed to be deferred as a prepayment and expensed over the service period under IFRS. Under U.S. GAAP, eligible costs incurred during application development are allowed to be deferred as a prepayment and expensed over the service period regardless of whether they are provided directly by the cloud computing provider or another party. Sports Rights Agreements: Sports rights agreements are capitalized as an intangible asset and recognized as a liability at the start of the first sports season and subsequently amortized on a straight line basis over the contract term under IFRS, whereas payments for sports rights in advance of the respective season are recorded as a prepaid expense and amortized on a straight-line basis over the respective sports season within operating expenses under U.S. GAAP. Sunrise Q3 2024 Results | 30 October 2024 28
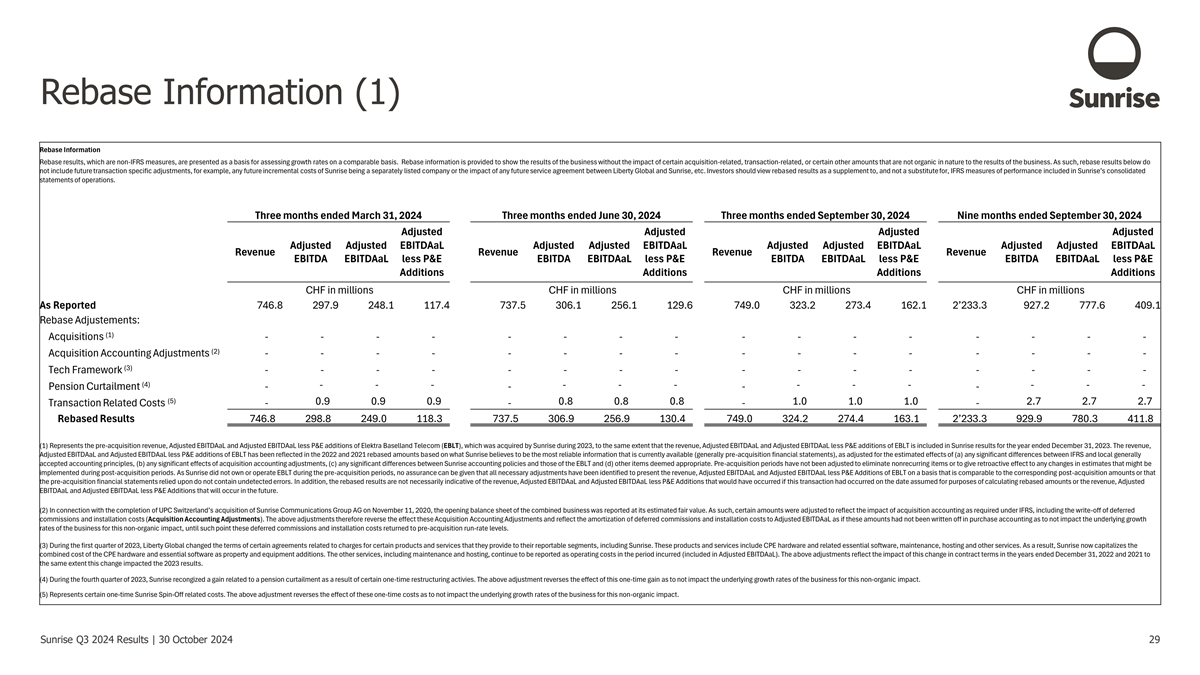
Rebase Information (1) Rebase Information Rebase results, which are non-IFRS measures, are presented as a basis for assessing growth rates on a comparable basis. Rebase information is provided to show the results of the business without the impact of certain acquisition-related, transaction-related, or certain other amounts that are not organic in nature to the results of the business. As such, rebase results below do not include future transaction specific adjustments, for example, any future incremental costs of Sunrise being a separately listed company or the impact of any future service agreement between Liberty Global and Sunrise, etc. Investors should view rebased results as a supplement to, and not a substitute for, IFRS measures of performance included in Sunrise’s consolidated statements of operations. Three months ended March 31, 2024 Three months ended June 30, 2024 Three months ended September 30, 2024 Nine months ended September 30, 2024 Adjusted Adjusted Adjusted Adjusted Adjusted Adjusted EBITDAaL Adjusted Adjusted EBITDAaL Adjusted Adjusted EBITDAaL Adjusted Adjusted EBITDAaL Revenue Revenue Revenue Revenue EBITDA EBITDAaL less P&E EBITDA EBITDAaL less P&E EBITDA EBITDAaL less P&E EBITDA EBITDAaL less P&E Additions Additions Additions Additions CHF in millions CHF in millions CHF in millions CHF in millions As Reported 746.8 297.9 248.1 117.4 737.5 306.1 256.1 129.6 749.0 323.2 273.4 162.1 2’233.3 927.2 777.6 409.1 Rebase Adjustements: (1) Acquisitions - - - - - - - - - - - - - - - - (2) Acquisition Accounting Adjustments - - - - - - - - - - - - - - - - (3) Tech Framework - - - - - - - - - - - - - - - - (4) - - - - - - - - - - - - Pension Curtailment - - - - (5) 0.9 0.9 0.9 0.8 0.8 0.8 1.0 1.0 1.0 2.7 2.7 2.7 Transaction Related Costs - - - - Rebased Results 746.8 298.8 249.0 118.3 737.5 306.9 256.9 130.4 749.0 324.2 274.4 163.1 2’233.3 929.9 780.3 411.8 (1) Represents the pre-acquisition revenue, Adjusted EBITDAaL and Adjusted EBITDAaL less P&E additions of Elektra Baselland Telecom (EBLT), which was acquired by Sunrise during 2023, to the same extent that the revenue, Adjusted EBITDAaL and Adjusted EBITDAaL less P&E additions of EBLT is included in Sunrise results for the year ended December 31, 2023. The revenue, Adjusted EBITDAaL and Adjusted EBITDAaL less P&E additions of EBLT has been reflected in the 2022 and 2021 rebased amounts based on what Sunrise believes to be the most reliable information that is currently available (generally pre-acquisition financial statements), as adjusted for the estimated effects of (a) any significant differences between IFRS and local generally accepted accounting principles, (b) any significant effects of acquisition accounting adjustments, (c) any significant differences between Sunrise accounting policies and those of the EBLT and (d) other items deemed appropriate. Pre-acquisition periods have not been adjusted to eliminate nonrecurring items or to give retroactive effect to any changes in estimates that might be implemented during post-acquisition periods. As Sunrise did not own or operate EBLT during the pre-acquisition periods, no assurance can be given that all necessary adjustments have been identified to present the revenue, Adjusted EBITDAaL and Adjusted EBITDAaL less P&E Additions of EBLT on a basis that is comparable to the corresponding post-acquisition amounts or that the pre-acquisition financial statements relied upon do not contain undetected errors. In addition, the rebased results are not necessarily indicative of the revenue, Adjusted EBITDAaL and Adjusted EBITDAaL less P&E Additions that would have occurred if this transaction had occurred on the date assumed for purposes of calculating rebased amounts or the revenue, Adjusted EBITDAaL and Adjusted EBITDAaL less P&E Additions that will occur in the future. (2) In connection with the completion of UPC Switzerland’s acquisition of Sunrise Communications Group AG on November 11, 2020, the opening balance sheet of the combined business was reported at its estimated fair value. As such, certain amounts were adjusted to reflect the impact of acquisition accounting as required under IFRS, including the write-off of deferred commissions and installation costs (Acquisition Accounting Adjustments). The above adjustments therefore reverse the effect these Acquisition Accounting Adjustments and reflect the amortization of deferred commissions and installation costs to Adjusted EBITDAaL as if these amounts had not been written off in purchase accounting as to not impact the underlying growth rates of the business for this non-organic impact, until such point these deferred commissions and installation costs returned to pre-acquisition run-rate levels. (3) During the first quarter of 2023, Liberty Global changed the terms of certain agreements related to charges for certain products and services that they provide to their reportable segments, including Sunrise. These products and services include CPE hardware and related essential software, maintenance, hosting and other services. As a result, Sunrise now capitalizes the combined cost of the CPE hardware and essential software as property and equipment additions. The other services, including maintenance and hosting, continue to be reported as operating costs in the period incurred (included in Adjusted EBITDAaL). The above adjustments reflect the impact of this change in contract terms in the years ended December 31, 2022 and 2021 to the same extent this change impacted the 2023 results. (4) During the fourth quarter of 2023, Sunrise recongized a gain related to a pension curtailment as a result of certain one-time restructuring activies. The above adjustment reverses the effect of this one-time gain as to not impact the underlying growth rates of the business for this non-organic impact. (5) Represents certain one-time Sunrise Spin-Off related costs. The above adjustment reverses the effect of these one-time costs as to not impact the underlying growth rates of the business for this non-organic impact. Sunrise Q3 2024 Results | 30 October 2024 29

Rebase Information (2) Rebase Information Rebase results, which are non-IFRS measures, are presented as a basis for assessing growth rates on a comparable basis. Rebase information is provided to show the results of the business without the impact of certain acquisition-related, transaction-related, or certain other amounts that are not organic in nature to the results of the business. As such, rebase results below do not include future transaction specific adjustments, for example, any future incremental costs of Sunrise being a separately listed company or the impact of any future service agreement between Liberty Global and Sunrise, etc. Investors should view rebased results as a supplement to, and not a substitute for, IFRS measures of performance included in Sunrise’s consolidated statements of operations. Three months ended March 31, 2023 Three months ended June 30, 2023 Three months ended September 30, 2023 Nine months ended September 30, 2023 Three months ended December 31, 2023 Year ended December 31, 2023 Adjusted Adjusted Adjusted Adjusted Adjusted Adjusted Adjusted Adjusted EBITDAaL Adjusted Adjusted EBITDAaL Adjusted Adjusted EBITDAaL Adjusted Adjusted EBITDAaL Adjusted Adjusted EBITDAaL Adjusted Adjusted EBITDAaL Revenue Revenue Revenue Revenue Revenue Revenue EBITDA EBITDAaL less P&E EBITDA EBITDAaL less P&E EBITDA EBITDAaL less P&E EBITDA EBITDAaL less P&E EBITDA EBITDAaL less P&E EBITDA EBITDAaL less P&E Additions Additions Additions Additions Additions Additions CHF in millions CHF in millions CHF in millions CHF in millions CHF in millions CHF in millions As Reported 747.4 293.2 244.4 106.6 733.3 303.3 253.9 143.8 759.1 322.2 273.3 140.7 2’239.8 918.7 771.6 391.1 795.4 320.9 272.1 114.9 3’035.2 1’239.5 1’043.6 505.9 Rebase Adjustements: - - - - (1) Acquisitions - - - - - - - - - - - - - - - - - - - - - - - - Acquisition Accounting Adjustments - - - - (2) - - - - - - - - - - - - - - - - - - - - (3) Tech Framework - - - - - - - - - - - - - - - - - - - - - - - - (4) (13.5) (13.5) (13.5) - (13.5) (13.5) (13.5) Pension Curtailment - - - - - - - - - - - - - - - - - (5) - - - - - - - Transaction Related Costs - - - - - - - - - - - - - - - - - Rebased Results 747.4 293.2 244.4 106.6 733.3 303.3 253.9 143.8 759.1 322.2 273.3 140.7 2’239.8 918.7 771.6 391.1 795.4 307.4 258.6 101.4 3’035.2 1’226.1 1’030.2 492.5 (1) Represents the pre-acquisition revenue, Adjusted EBITDAaL and Adjusted EBITDAaL less P&E additions of Elektra Baselland Telecom (EBLT), which was acquired by Sunrise during 2023, to the same extent that the revenue, Adjusted EBITDAaL and Adjusted EBITDAaL less P&E additions of EBLT is included in Sunrise results for the year ended December 31, 2023. The revenue, Adjusted EBITDAaL and Adjusted EBITDAaL less P&E additions of EBLT has been reflected in the 2022 and 2021 rebased amounts based on what Sunrise believes to be the most reliable information that is currently available (generally pre-acquisition financial statements), as adjusted for the estimated effects of (a) any significant differences between IFRS and local generally accepted accounting principles, (b) any significant effects of acquisition accounting adjustments, (c) any significant differences between Sunrise accounting policies and those of the EBLT and (d) other items deemed appropriate. Pre-acquisition periods have not been adjusted to eliminate nonrecurring items or to give retroactive effect to any changes in estimates that might be implemented during post-acquisition periods. As Sunrise did not own or operate EBLT during the pre-acquisition periods, no assurance can be given that all necessary adjustments have been identified to present the revenue, Adjusted EBITDAaL and Adjusted EBITDAaL less P&E Additions of EBLT on a basis that is comparable to the corresponding post-acquisition amounts or that the pre-acquisition financial statements relied upon do not contain undetected errors. In addition, the rebased results are not necessarily indicative of the revenue, Adjusted EBITDAaL and Adjusted EBITDAaL less P&E Additions that would have occurred if this transaction had occurred on the date assumed for purposes of calculating rebased amounts or the revenue, Adjusted EBITDAaL and Adjusted EBITDAaL less P&E Additions that will occur in the future. (2) In connection with the completion of UPC Switzerland’s acquisition of Sunrise Communications Group AG on November 11, 2020, the opening balance sheet of the combined business was reported at its estimated fair value. As such, certain amounts were adjusted to reflect the impact of acquisition accounting as required under IFRS, including the write-off of deferred commissions and installation costs (Acquisition Accounting Adjustments). The above adjustments therefore reverse the effect these Acquisition Accounting Adjustments and reflect the amortization of deferred commissions and installation costs to Adjusted EBITDAaL as if these amounts had not been written off in purchase accounting as to not impact the underlying growth rates of the business for this non-organic impact, until such point these deferred commissions and installation costs returned to pre-acquisition run-rate levels. (3) During the first quarter of 2023, Liberty Global changed the terms of certain agreements related to charges for certain products and services that they provide to their reportable segments, including Sunrise. These products and services include CPE hardware and related essential software, maintenance, hosting and other services. As a result, Sunrise now capitalizes the combined cost of the CPE hardware and essential software as property and equipment additions. The other services, including maintenance and hosting, continue to be reported as operating costs in the period incurred (included in Adjusted EBITDAaL). The above adjustments reflect the impact of this change in contract terms in the years ended December 31, 2022 and 2021 to the same extent this change impacted the 2023 results. (4) During the fourth quarter of 2023, Sunrise recongized a gain related to a pension curtailment as a result of certain one-time restructuring activies. The above adjustment reverses the effect of this one-time gain as to not impact the underlying growth rates of the business for this non-organic impact. (5) Represents certain one-time Sunrise Spin-Off related costs. The above adjustment reverses the effect of these one-time costs as to not impact the underlying growth rates of the business for this non-organic impact. Sunrise Q3 2024 Results | 30 October 2024 30

Rebase Information (3) Rebase Information Rebase results, which are non-IFRS measures, are presented as a basis for assessing growth rates on a comparable basis. Rebase information is provided to show the results of the business without the impact of certain acquisition-related, transaction-related, or certain other amounts that are not organic in nature to the results of the business. As such, rebase results below do not include future transaction specific adjustments, for example, any future incremental costs of Sunrise being a separately listed company or the impact of any future service agreement between Liberty Global and Sunrise, etc. Investors should view rebased results as a supplement to, and not a substitute for, IFRS measures of performance included in Sunrise’s consolidated statements of operations. Three months ended March 31, 2022 Three months ended June 30, 2022 Three months ended September 30, 2022 Three months ended December 31, 2022 Year ended December 31, 2022 Year ended December 31, 2021 Adjusted Adjusted Adjusted Adjusted Adjusted Adjusted Adjusted Adjusted EBITDAaL Adjusted Adjusted EBITDAaL Adjusted Adjusted EBITDAaL Adjusted Adjusted EBITDAaL Adjusted Adjusted EBITDAaL Adjusted Adjusted EBITDAaL Revenue Revenue Revenue Revenue Revenue Revenue EBITDA EBITDAaL less P&E EBITDA EBITDAaL less P&E EBITDA EBITDAaL less P&E EBITDA EBITDAaL less P&E EBITDA EBITDAaL less P&E EBITDA EBITDAaL less P&E Additions Additions Additions Additions Additions Additions CHF in millions CHF in millions CHF in millions CHF in millions CHF in millions CHF in millions As Reported Rebase Adjustements: 758.7 324.2 271.5 139.6 739.0 312.9 260.2 152.4 763.7 337.8 285.1 149.1 773.8 293.6 241.0 68.1 3’035.2 1’268.5 1’057.8 509.2 3’035.7 1’308.0 1’116.3 563.3 (1) Acquisitions Acquisition Accounting Adjustments 1.4 3.8 3.8 2.3 1.4 3.8 3.8 2.3 2.0 4.3 4.3 2.8 1.9 4.4 4.4 2.9 6.7 16.3 16.3 10.3 6.7 14.4 14.4 10.4 (2) (3) - (4.6) (4.6) (4.6) - (3.3) (3.3) (3.3) - (2.3) (2.3) (2.3) - (1.2) (1.2) (1.2) - (11.4) (11.4) (11.4) - (26.2) (26.2) (26.2) Tech Framework (4) Pension Curtailment - (9.5) (9.5) (14.5) - (9.3) (9.3) (14.7) - (9.7) (9.7) (14.6) - (9.7) (9.7) (15.6) - (38.2) (38.2) (59.4) - (40.5) (40.5) (63.2) (5) Transaction Related Costs - - - - - - - - - - - - - - - - - - - - Rebased Results - - - - - - - - - - - - - - - - - - - - - - - - 760.1 313.9 261.2 122.8 740.4 304.1 251.4 136.7 765.7 330.1 277.4 135.0 775.7 287.1 234.5 54.2 3’041.9 1’235.2 1’024.5 448.7 3’042.4 1’255.7 1’064.0 484.3 (1) Represents the pre-acquisition revenue, Adjusted EBITDAaL and Adjusted EBITDAaL less P&E additions of Elektra Baselland Telecom (EBLT), which was acquired by Sunrise during 2023, to the same extent that the revenue, Adjusted EBITDAaL and Adjusted EBITDAaL less P&E additions of EBLT is included in Sunrise results for the year ended December 31, 2023. The revenue, Adjusted EBITDAaL and Adjusted EBITDAaL less P&E additions of EBLT has been reflected in the 2022 and 2021 rebased amounts based on what Sunrise believes to be the most reliable information that is currently available (generally pre-acquisition financial statements), as adjusted for the estimated effects of (a) any significant differences between IFRS and local generally accepted accounting principles, (b) any significant effects of acquisition accounting adjustments, (c) any significant differences between Sunrise accounting policies and those of the EBLT and (d) other items deemed appropriate. Pre-acquisition periods have not been adjusted to eliminate nonrecurring items or to give retroactive effect to any changes in estimates that might be implemented during post-acquisition periods. As Sunrise did not own or operate EBLT during the pre-acquisition periods, no assurance can be given that all necessary adjustments have been identified to present the revenue, Adjusted EBITDAaL and Adjusted EBITDAaL less P&E Additions of EBLT on a basis that is comparable to the corresponding post-acquisition amounts or that the pre-acquisition financial statements relied upon do not contain undetected errors. In addition, the rebased results are not necessarily indicative of the revenue, Adjusted EBITDAaL and Adjusted EBITDAaL less P&E Additions that would have occurred if this transaction had occurred on the date assumed for purposes of calculating rebased amounts or the revenue, Adjusted EBITDAaL and Adjusted EBITDAaL less P&E Additions that will occur in the future. (2) In connection with the completion of UPC Switzerland’s acquisition of Sunrise Communications Group AG on November 11, 2020, the opening balance sheet of the combined business was reported at its estimated fair value. As such, certain amounts were adjusted to reflect the impact of acquisition accounting as required under IFRS, including the write-off of deferred commissions and installation costs (Acquisition Accounting Adjustments). The above adjustments therefore reverse the effect these Acquisition Accounting Adjustments and reflect the amortization of deferred commissions and installation costs to Adjusted EBITDAaL as if these amounts had not been written off in purchase accounting as to not impact the underlying growth rates of the business for this non-organic impact, until such point these deferred commissions and installation costs returned to pre-acquisition run-rate levels. (3) During the first quarter of 2023, Liberty Global changed the terms of certain agreements related to charges for certain products and services that they provide to their reportable segments, including Sunrise. These products and services include CPE hardware and related essential software, maintenance, hosting and other services. As a result, Sunrise now capitalizes the combined cost of the CPE hardware and essential software as property and equipment additions. The other services, including maintenance and hosting, continue to be reported as operating costs in the period incurred (included in Adjusted EBITDAaL). The above adjustments reflect the impact of this change in contract terms in the years ended December 31, 2022 and 2021 to the same extent this change impacted the 2023 results. (4) During the fourth quarter of 2023, Sunrise recongized a gain related to a pension curtailment as a result of certain one-time restructuring activies. The above adjustment reverses the effect of this one-time gain as to not impact the underlying growth rates of the business for this non-organic impact. (5) Represents certain one-time Sunrise Spin-Off related costs. The above adjustment reverses the effect of these one-time costs as to not impact the underlying growth rates of the business for this non-organic impact. Sunrise Q3 2024 Results | 30 October 2024 31

Non-IFRS Reconciliations Nine months ended Three months ended Three months ended Three months ended September 30, Year ended December 31, March 31, September March 31, September December 31, March 31, September December 31, 2024 2023 2023 2022 2021 June 30, 2024 June 30, 2023 June 30, 2022 2024 30, 2024 2023 30, 2023 2023 2022 30, 2022 2022 CHF in millions CHF in millions CHF in millions Adjusted EBITDA and Adjusted EBITDAaL: Adjusted EBITDA and Adjusted EBITDAaL: Net income (loss) (219.2) (203.2) (312.2) 84.0 (68.6) Net income (loss) (127.2) (73.7) (18.3) (58.2) (76.5) (68.5) (109.0) 118.1 97.0 29.2 (160.3) Income tax expense (benefit) 14.1 (46.2) (59.9) (50.7) (62.6) Income tax expense (benefit) (11.8) 19.8 6.1 (15.2) (16.1) (14.9) (13.7) (8.8) (8.9) (3.7) (29.3) Share of losses (gains) of affiliates 2.6 1.3 0.3 (2.2) (2.8) Share of losses (gains) of affiliates 0.2 0.1 2.3 (1.2) 0.2 2.3 (1.0) (0.9) - (0.1) (1.2) Net financial expense (income) 295.0 290.7 382.5 (116.5) 184.7 Operating income (loss) 92.5 42.6 10.7 (85.4) 50.7 Net financial expense (income) 160.0 83.3 51.7 91.0 84.4 115.3 91.8 (118.5) (97.1) (7.3) 106.4 Depreciation and amortization 695.3 737.3 992.1 1’028.8 995.6 Operating income (loss) 21.2 29.5 41.8 16.4 (8.0) 34.2 (31.9) (10.1) (9.0) 18.1 (84.4) Depreciation of right-of-use assets 99.0 96.2 128.0 145.4 129.9 Depreciation and amortization (non-lease related) 233.0 232.1 230.2 222.5 265.1 249.7 254.8 247.3 244.2 245.3 292.0 Share-based compensation expense 14.9 17.3 22.5 30.7 24.8 Depreciation of right-of-use assets 32.9 33.1 33.0 32.1 31.9 32.2 31.8 30.3 45.2 31.7 38.2 Impairment, restructuring and other operating items 25.5 25.2 86.2 149.0 107.0 Share-based compensation expense 4.8 5.2 4.9 5.3 6.9 5.1 5.2 8.9 4.9 9.9 7.0 Adjusted EBITDA 927.2 918.6 1’239.5 1’268.5 1’308.0 Impairment, restructuring and other operating items 6.0 6.2 13.3 16.8 7.3 1.1 61.0 47.8 27.6 32.8 40.8 Lease-related expenses (149.6) (147.1) (195.9) (210.7) (191.7) Adjusted EBITDA 297.9 306.1 323.2 293.2 303.3 322.3 320.9 324.2 312.9 337.8 293.6 Adjusted EBITDAaL 777.6 771.5 1’043.6 1’057.8 1’116.3 Lease-related expenses (49.8) (50.0) (49.8) (48.8) (49.4) (49.0) (48.8) (52.7) (52.7) (52.7) (52.6) Adjusted EBITDAaL 248.1 256.1 273.4 244.4 253.9 273.3 272.1 271.5 260.2 285.1 241.0 Nine months ended September 30, Year ended December 31, 2024 2023 2023 2022 2021 Three months ended Three months ended Three months ended CHF in millions CHF in millions March 31, September March 31, September December 31, March 31, September December 31, Adjusted EBITDAaL less P&E Additions: 2024 June 30, 2024 30, 2024 2023 June 30, 2023 30, 2023 2023 2022 June 30, 2022 30, 2022 2022 Adjusted EBITDAaL 777.6 771.5 1’043.6 1’057.8 1’116.3 CHF in millions Adjusted EBITDAaL less P&E Additions: Property and Equipment Additions 368.5 380.5 537.7 698.6 553.0 Adjusted EBITDAaL 248.1 256.1 273.4 244.4 253.9 273.3 272.1 271.5 260.2 285.1 241.0 Recognition of sports broadcasting rights - - - (150.0) - P&E excluding the recognition of sports broadcasting rights 368.5 380.5 537.7 548.6 553.0 Property and Equipment Additions 130.7 126.5 111.3 137.8 110.1 132.6 157.2 131.9 107.8 286.0 172.9 Adjusted EBITDAaL less P&E Additions 409.1 391.0 505.9 509.2 563.3 Recognition of sports broadcasting rights - - - - - - - - - (150.0) - P&E excluding the recognition of sports broadcasting rights 130.7 126.5 111.3 137.8 110.1 132.6 157.2 131.9 107.8 136.0 172.9 Nine months ended September 30, Year ended December 31, Adjusted EBITDAaL less P&E Additions 117.4 129.6 162.1 106.5 143.8 140.7 114.9 139.6 152.4 149.1 68.1 2024 2023 2023 2022 2021 CHF in millions CHF in millions Three months Three months Adjusted Free Cash Flow: ended ended Net cash provided by operating activities 820.1 866.8 1’201.5 1’252.7 1’265.1 September September Interest paid (349.6) (342.8) (422.5) (329.3) (298.0) 30, 2024 30, 2023 Interest-related derivative receipts (payments) 120.7 113.6 174.5 42.2 13.8 (i) Adjusted Free Cash Flow: CHF in millions CHF in millions Vendor financing additions 255.3 161.3 271.2 148.2 205.5 Net cash provided by operating activities 268.9 210.7 Capital expenditures (365.6) (333.4) (468.0) (417.4) (353.8) Interest paid (132.0) (128.3) Principal payments on vendor financing (268.4) (258.8) (296.6) (284.5) (447.8) Payments of lease liabilities (93.7) (55.3) (107.6) (112.4) (88.3) Interest-related derivative receipts (payments) 28.4 24.5 (i) Adjusted Free Cash Flow 118.8 151.4 352.5 299.5 296.5 Vendor financing additions 117.4 44.5 Capital expenditures (119.9) (138.9) (i) For purposes of Sunrise’s consolidated statements of cash flows, vendor financing additions represent Principal payments on vendor financing (105.5) (87.4) operatingrelated expenses financed by an intermediary that are treated as constructive operating cash outflows Payments of lease liabilities (51.1) (25.7) and constructive financing cash inflows when the intermediary settles the liability with the vendor. When Adjusted Free Cash Flow 6.2 (100.6) Sunrise pays the financing intermediary, it records financing cash outflows in its consolidated statements of (i) For purposes of Sunrise’s consolidated statements of cash flows, vendor financing additions represent operatingrelated expenses financed by an intermediary that are treated as constructive operating cash outflows and constructive financing cash inflows when the intermediary settles the liability with the vendor. When Sunrise pays the cash flows. For purposes of its Adjusted Free Cash Flow definition, Sunrise (A) adds in the constructive financing intermediary, it records financing cash outflows in its consolidated statements of cash flows. For purposes of its Adjusted Free Cash Flow definition, Sunrise (A) adds in the constructive financing cash inflow when the intermediary settles the liability with the vendor as its actual net cash available at that time is not affected and (B) subsequently deducts the related financing cash outflow when Sunrise actually pays the financing intermediary, reflecting the actual reduction to its cash available to service debt or fund new investment opportunities. financing cash inflow when the intermediary settles the liability with the vendor as its actual net cash available at that time is not affected and (B) subsequently deducts the related financing cash outflow when Sunrise actually pays the financing intermediary, reflecting the actual reduction to its cash available to service debt or fund new investment opportunities. Sunrise Q3 2024 Results | 30 October 2024 32

Contact Information Investor Relations Sunrise investor.relations@sunrise.net Thurgauerstrasse 101B +41 58 777 61 00 8152 Glattpark (Opfikon) Switzerland