Table of Contents
As filed with the U.S. Securities and Exchange Commission on October 15, 2024.
Registration No. 333-282129
UNITED STATES
SECURITIES AND EXCHANGE COMMISSION
Washington, D.C. 20549
Amendment No. 1 to
Form S-1
REGISTRATION STATEMENT
UNDER
THE SECURITIES ACT OF 1933
Peak Resources LP
(Exact name of registrant as specified in its charter)
Delaware | 1311 | 99-2937133 | ||
(State or other jurisdiction of incorporation or organization) | (Primary Standard Industrial Classification Code Number) | (I.R.S. Employer Identification No.) |
1910 Main Avenue
Durango, Colorado 81301
(970) 247-1500
(Address, including zip code, and telephone number, including area code, of registrant’s principal executive offices)
Jack E. Vaughn
Chief Executive Officer
1910 Main Avenue
Durango, Colorado 81301
(970) 247-1500
(Name, address, including zip code, and telephone number, including area code, of agent for service)
Copies to:
Jesse E. Betts Jessica W. Hammons Akin Gump Strauss Hauer & Feld LLP 2300 N. Field Street Suite 1800 Dallas, Texas 75201 (214) 969-2800 | Clinton H. Smith Victoria J. Bagot Jones Walker LLP 201 St. Charles Avenue Suite 5100 New Orleans, Louisiana 70170 (504) 582-8000 |
Approximate date of commencement of proposed sale of the securities to the public:
As soon as practicable after the effective date of this Registration Statement.
If any of the securities being registered on this Form are to be offered on a delayed or continuous basis pursuant to Rule 415 under the Securities Act of 1933, check the following box: ☐
If this Form is filed to register additional securities for an offering pursuant to Rule 462(b) under the Securities Act, check the following box and list the Securities Act registration statement number of the earlier effective registration statement for the same offering. ☐
If this Form is a post-effective amendment filed pursuant to Rule 462(c) under the Securities Act, check the following box and list the Securities Act registration statement number of the earlier effective registration statement for the same offering. ☐
If this Form is a post-effective amendment filed pursuant to Rule 462(d) under the Securities Act, check the following box and list the Securities Act registration statement number of the earlier effective registration statement for the same offering. ☐
Indicate by check mark whether the registrant is a large accelerated filer, an accelerated filer, a non-accelerated filer, a smaller reporting company, or an emerging growth company. See the definitions of “large accelerated filer,” “accelerated filer,” “smaller reporting company,” and “emerging growth company” in Rule 12b-2 of the Exchange Act.
Large accelerated filer | ☐ | Accelerated filer | ☐ | |||
Non-accelerated filer | ☒ | Smaller reporting company | ☒ | |||
Emerging Growth Company | ☒ |
If an emerging growth company, indicate by check mark if the registrant has elected not to use the extended transition period for complying with any new or revised financial accounting standards provided pursuant to Section 7(a)(2)(B) of the Securities Act. ☐
The registrant hereby amends this Registration Statement on such date or dates as may be necessary to delay its effective date until the registrant shall file a further amendment that specifically states that this Registration Statement shall thereafter become effective in accordance with Section 8(a) of the Securities Act of 1933, as amended, or until this Registration Statement shall become effective on such date as the Securities and Exchange Commission, acting pursuant to said Section 8(a), may determine.
Table of Contents
The information in this prospectus is not complete and may be changed. We may not sell the securities described herein until the registration statement filed with the Securities and Exchange Commission is effective. This prospectus is not an offer to sell the securities described herein and it is not soliciting an offer to buy such securities in any jurisdiction where the offer or sale is not permitted.
SUBJECT TO COMPLETION, DATED OCTOBER 15, 2024
PRELIMINARY PROSPECTUS
4,700,000 Class A Common Units
Peak Resources LP is a Delaware limited partnership focused on the development and production of oil and natural gas reserves in the Powder River Basin of Wyoming. This is the initial public offering of Class A Common Units of Peak Resources LP. We are offering 4,700,000 Class A Common Units, each Class A Common Unit representing a limited partner interest in the Company. No public market currently exists for any of the Class A Common Units. We expect the initial public offering price to be between $13.00 and $15.00 per Class A Common Unit. We have applied to list the Class A Common Units on the NYSE American (the “NYSE American”) under the symbol “PRB.” We will not consummate this offering unless our Class A Common Units are approved for listing on the NYSE American. We are an “emerging growth company” as that term is used in the Jumpstart Our Business Startups Act.
Investing in our securities involves risks. See “Risk Factors” beginning on page 35 of this prospectus.
These risks include the following:
• | Cash distributions may fluctuate with our performance, and we may not have sufficient cash available to pay any quarterly distribution on our Class A Common Units. |
• | Oil and natural gas prices are volatile. A substantial or extended decrease in prices of these commodities could adversely affect our business, financial condition, results of operations, ability to meet our financial commitments, ability to make our planned capital expenditures and distributions. |
• | Unless we replace the reserves we produce, our revenues and production will decline, which would adversely affect our cash flow from operations, results of operations and our ability to make distributions. |
• | We must adhere to stringent requirements by multiple governing agencies—all of which have the potential to adversely impact the cost and feasibility of our endeavors, and/or expose us to significant risk of liability. |
• | Our general partner and its affiliates own a controlling interest in us and may have conflicts of interest with, and owe limited duties to, us, which may permit them to favor their own interests to the detriment of us and our unitholders. |
• | Our unitholders have limited voting rights and are not entitled to elect our general partner or the Board, which could reduce the price at which our Class A Common Units will trade. |
• | Even if our unitholders are dissatisfied, they cannot remove our general partner without its consent (other than for cause). |
• | We are treated as a corporation for U.S. federal income tax purposes, and distributions to our Class A Common Unitholders may be substantially reduced. |
PRICE $ PER CLASS A COMMON UNIT
Per Class A Common Unit | Total | |||||||
Public offering price | $ | $ | ||||||
Underwriting discount(1) | $ | $ | ||||||
Proceeds, before expenses | $ | $ |
(1) | Includes an aggregate structuring fee equal to 0.75% of the gross proceeds of this offering payable to Janney Montgomery Scott LLC. Please read “Underwriting.” |
We have granted the underwriters a 30-day option to purchase up to an additional 705,000 Class A Common Units on the same terms and conditions as set forth above if the underwriters sell more than 4,700,000 Class A Common Units in this offering.
Neither the Securities and Exchange Commission nor any state securities commission has approved or disapproved of these securities or determined if this prospectus is truthful or complete. Any representation to the contrary is a criminal offense.
The underwriters expect to deliver the Class A Common Units on or about , 2024.
Lead Book-Running Manager
Janney Montgomery Scott
Joint Book-Running Managers
Roth Capital Partners | Texas Capital Securities |
Co-Manager
Seaport Global
, 2024
Table of Contents
i
Table of Contents
116 | ||||
124 | ||||
129 | ||||
131 | ||||
133 | ||||
133 | ||||
134 | ||||
135 | ||||
135 | ||||
136 | ||||
136 | ||||
137 | ||||
137 | ||||
143 | ||||
145 | ||||
147 | ||||
148 | ||||
153 | ||||
154 | ||||
155 | ||||
155 | ||||
170 | ||||
170 | ||||
173 | ||||
173 | ||||
173 | ||||
173 | ||||
175 | ||||
175 | ||||
175 | ||||
175 | ||||
176 | ||||
176 | ||||
178 | ||||
Employment Contracts, Termination of Employment, Change-in-Control Arrangements | 178 | |||
179 | ||||
SECURITY OWNERSHIP OF CERTAIN BENEFICIAL OWNERS AND MANAGEMENT | 180 | |||
183 | ||||
Distributions and Payments to Our General Partner and Its Affiliates | 183 | |||
Agreements with Affiliates in Connection with the Reorganization Transactions | 184 | |||
184 | ||||
Procedures for Review, Approval or Ratification of Transactions with Related Persons | 185 | |||
186 | ||||
194 | ||||
194 | ||||
194 | ||||
194 | ||||
195 | ||||
195 | ||||
197 | ||||
197 | ||||
197 |
ii
Table of Contents
197 | ||||
197 | ||||
199 | ||||
200 | ||||
201 | ||||
201 | ||||
203 | ||||
204 | ||||
204 | ||||
204 | ||||
205 | ||||
206 | ||||
206 | ||||
206 | ||||
206 | ||||
207 | ||||
207 | ||||
208 | ||||
208 | ||||
208 | ||||
209 | ||||
209 | ||||
210 | ||||
210 | ||||
211 | ||||
211 | ||||
212 | ||||
213 | ||||
213 | ||||
214 | ||||
218 | ||||
218 | ||||
218 | ||||
219 | ||||
220 | ||||
220 | ||||
220 | ||||
221 | ||||
221 | ||||
222 | ||||
222 | ||||
223 | ||||
223 | ||||
223 | ||||
224 | ||||
F-1 | ||||
APPENDIX A AMENDED AND RESTATED AGREEMENT OF LIMITED PARTNERSHIP OF PEAK RESOURCES LP | A-1 | |||
B-1 |
iii
Table of Contents
We have not, and the underwriters have not, authorized any other person to provide you with information different from that contained in this prospectus and any free writing prospectus. We and the underwriters take no responsibility for, and can provide no assurance as to the reliability of, any other information that others may give you. We are not, and the underwriters are not, making an offer to sell the securities described herein in any jurisdiction where an offer or sale is not permitted. The information in this prospectus is accurate only as of the date of this prospectus, regardless of the time of delivery of this prospectus or any sale of the Class A Common Units. Our business, financial condition, results of operations and prospects may have changed since that date.
This prospectus contains forward-looking statements that are subject to a number of risks and uncertainties, many of which are beyond our control. See “Risk Factors” and “Cautionary Note Regarding Forward-Looking Statements” in this prospectus.
Through and including , 2024 (the 25th day after the date of this prospectus), all dealers effecting transactions in our securities, whether or not participating in this offering, may be required to deliver a prospectus. This requirement is in addition to the dealers’ obligation to deliver a prospectus when acting as an underwriter and with respect to an unsold allotment or subscription.
The market data and certain other statistical information included in this prospectus are based on a variety of sources, including independent industry publications, government publications and other published independent sources. Some data is also based on our good faith estimates, which have been derived from management’s knowledge and experience in the industry in which we operate. Although we have not independently verified the accuracy or completeness of the third-party information included in this prospectus, based on management’s knowledge and experience, we believe that these third-party sources are reliable and that the third-party information included in this prospectus or in our estimates is accurate and complete. While we are not aware of any misstatements regarding the market, industry or similar data presented herein, such data involves risks and uncertainties and is subject to change based on various factors, including those discussed under the headings “Risk Factors” and “Cautionary Note Regarding Forward-Looking Statements” in this prospectus.
We own or have rights to various trademarks, service marks and trade names that we use in connection with the operation of our business. This prospectus may also contain trademarks, service marks and trade names of third parties, which are the property of their respective owners. Our use or display of third parties’ trademarks, service marks, trade names or products in this prospectus is not intended to, and does not imply a relationship with, or endorsement or sponsorship by us. Solely for convenience, the trademarks, service marks and trade names referred to in this prospectus may appear without the ®, TM or SM symbols, but such references are not intended to indicate, in any way, that we will not assert, to the fullest extent under applicable law, our rights or the right of the applicable licensor to these trademarks, service marks and trade names.
Unless otherwise indicated, the historical financial information presented in this prospectus represents the financial statement combination of certain entities under common control, namely Peak Exploration & Production, LLC, a Delaware limited liability company (“Peak E&P”), and Peak BLM Lease LLC, a Delaware limited liability company (“PBLM”). The combined financial statements of Peak E&P and PBLM are referred to
iv
Table of Contents
as the predecessor for accounting purposes. The pro forma financial information also includes certain information related to a minority ownership position in PetroSantander, Inc., a Canadian corporation (“PSI”), and is included herein as indicated.
This prospectus contains unaudited pro forma financial information, which presents certain financial information and operating data of our predecessor and PSI on a pro forma combined basis, as adjusted to give effect to the initial public offering and the use of proceeds therefrom and the Reorganization Transactions (as defined herein) as if they had occurred at the beginning of the periods presented. The production, reserve, acreage, well count, drilling locations, and other historical data in this prospectus are presented on a pro forma combined basis as if the Reorganization Transactions had occurred unless otherwise indicated.
The entities to be contributed in connection with the initial public offering and the Reorganization Transactions described in this prospectus are under common control and therefore the Reorganization Transactions are accounted for as common control transactions. Peak E&P and PBLM have been in operation and under the common control of Yorktown Partners LLC (“Yorktown”) for the entirety of the periods presented. Affiliates of Yorktown will control our general partner, which will ultimately control the business operations of the Company (as defined below). Accordingly, the financial statements are presented in accordance with SEC requirements for predecessor financial statements to be included in the registration statement.
Unless another date or source is specified, all production, operational, acreage, well count and drilling location data presented in this prospectus is as of June 30, 2024. Unless another date or source is specified, all reserve data presented in this prospectus is as of December 31, 2023. Our reserves and production are reported in two streams: crude oil and natural gas. The economic value of the natural gas liquids is included in the natural gas price and in our natural gas reserves.
The terms “dollar” or “$” refer to U.S. dollars. Unless otherwise specified, all dollar amounts are expressed in U.S. dollars.
v
Table of Contents
This summary highlights information contained elsewhere in this prospectus. You should read the entire prospectus carefully before making an investment decision, including the information under the headings “Risk Factors,” “Cautionary Note Regarding Forward-Looking Statements” and “Management’s Discussion and Analysis of Financial Condition and Results of Operations” and the financial statements and the notes thereto appearing elsewhere in this prospectus. The information presented in this prospectus assumes (i) an initial public offering price of $14.00 per Class A Common Unit (the midpoint of the price range set forth on the cover of this prospectus) and (ii) unless otherwise indicated, that the underwriters do not exercise their option to purchase an additional 705,000 Class A Common Units in this offering.
Except as otherwise indicated or required by the context, all references in this prospectus to “our general partner” refer to Peak Resources GP LLC, a Delaware limited liability company, and all references in this prospectus to the “Company,” the “Partnership,” “Peak Resources LP,” “we,” “us” or “our” refer to (i) prior to the Reorganization Transactions described in this prospectus, to Peak Exploration & Production, LLC and its consolidated subsidiaries (“Peak E&P”), Peak BLM Lease LLC and its consolidated subsidiaries (“PBLM”) and a minority ownership position in PetroSantander, Inc. (“PSI”) and (ii) following the Reorganization Transactions described in this prospectus, to Peak Resources LP and its consolidated subsidiaries. We have provided definitions for certain of the industry terms used in this prospectus in the “Glossary of Oil and Natural Gas Terms” included in this prospectus as Appendix B. References to our proved reserves as of December 31, 2023 are derived from our reserve report prepared by Cawley, Gillespie & Associates, Inc. (“Cawley Gillespie”), our independent petroleum engineers, and references to our proved reserves as of December 31, 2022 are derived from the summation of the reports prepared by Cawley Gillespie for Peak E&P and PBLM. Immediately prior to the closing of this offering, we intend to complete the Reorganization Transactions described in this prospectus pursuant to which the Company will acquire certain assets, including (i) 100% of the ownership interests in Peak E&P, (ii) 100% of the ownership interests in PBLM and (iii) an approximately 16% minority ownership position in PSI. We account for our noncontrolling ownership interest in PSI using the cost method of accounting. The carrying value of the Partnership’s investment in PSI on the balance sheet included in our consolidated financial statements is at cost.
We are an independent limited partnership that was recently formed to hold investments in oil and natural gas businesses and assets owned by certain investment partnerships managed by Yorktown, management and other investors who are not affiliated with Yorktown or management. Our objective is to consistently create significant equity value for the holders of our Class A Common Units (each, a “Class A Common Unitholder” and collectively, the “Class A Common Unitholders”) in two ways: first, to actively develop and expand our large acreage position in the Powder River Basin of Wyoming in a way that materially increases oil and associated natural gas production, cash flow, and reserve value; and second, to return cash to Class A Common Unitholders through a quarterly distribution of Available Cash (as defined below).
Our primary operational focus is on using advanced horizontal drilling and completion technology to economically and expeditiously grow our oil and natural gas production and reserves in the Powder River Basin, which we believe remains less developed from a horizontal drilling perspective than most other basins in the United States. We are focused on increasing equity value through the development of our 1,770 gross (530 net) identified horizontal drilling locations. We seek to organically grow our production profile through the low-risk development of our existing properties, funded by cash flow from operating activities and cash on hand, including proceeds from this offering initially designated as reserves. We also believe that the Powder River Basin offers opportunities to make future accretive acquisitions of producing properties and acreage. We expect such acquisitions, together with our development activities, will allow us to further increase our production, reserves and free cash flow, and over time, increase distributions to our unitholders.
1
Table of Contents
We are offering Class A Common Units in this offering. The Class A Common Units will entitle Class A Common Unitholders to quarterly distributions of Available Cash. Our partnership agreement requires us to distribute all of our Available Cash. We define “Available Cash” as our cash on hand at the end of each quarter, plus certain distributions or dividends received after the end of the quarter, plus certain working capital borrowings and proceeds from this offering if determined by our general partner, less cash reserves established by our general partner, including for the proper conduct of our business, such as for capital expenditures, acquisitions, debt service, compliance with law and loan agreements and future distributions. We intend to make quarterly distributions of Available Cash on our Class A Common Units. Our goal is to make a distribution of at least $0.30 per Class A Common Unit per quarter (adjusted for the number of days in the first quarterly period after the closing date of this offering), which we refer to as our initial target quarterly distribution. However, to the extent there is no Available Cash, our partnership agreement does not require us to pay distributions on our Class A Common Units on a quarterly basis or otherwise.
Our goal is to make consistent quarterly distributions to our Class A Common Unitholders at or above our initial target quarterly distribution that grow over time, based on the attractive economics associated with our development locations and our large multi-year inventory of operated locations. Additionally, we believe our balance sheet strength following this offering, our accretive acquisition opportunities and our expected supplemental dividends from PSI will help us grow our distributions over time. However, we have no legal obligation to pay cash distributions to our Class A Common Unitholders, and there is no guarantee that we will make quarterly cash distributions to our Class A Common Unitholders at the initial target quarterly distribution amount, or at all, or that distributions will grow over time. The amount of cash flow from operations available for distribution with respect to any quarter will be dependent on the then-prevailing prices of oil and natural gas, among other factors. To mitigate the risk associated with volatile commodity prices and to satisfy requirements under our Existing Credit Agreement (as hereinafter defined) and the New Credit Facility (as hereinafter defined), as applicable, we have historically hedged, and anticipate that, under the New Credit Facility, we will hedge, a portion of our production volumes based on reasonably anticipated projected production of proved developed producing reserves that we are required to hedge. To the extent our Distributable Cash from Operations (as hereinafter defined) is insufficient to pay our quarterly distributions, we may use cash on hand, including proceeds from this offering initially designated as reserves, to maintain or grow our cash distributions to our Class A Common Unitholders. See “The Offering—Non-GAAP Financial Measures—Distributable Cash from Operations” for our definition of Distributable Cash from Operations. For example, on a pro forma basis, if we had completed the transactions contemplated in this prospectus on January 1, 2023, our pro forma Distributable Cash from Operations would have been approximately $21.2 million for the year ended December 31, 2023 and $16.0 million for the twelve months ended June 30, 2024, which would have been sufficient to pay our initial target quarterly distributions for the quarters in those periods. However, our forecasted Distributable Cash from Operations for the twelve months ending June 30, 2025 and the twelve months ending December 31, 2025 would be insufficient to pay our initial target quarterly distributions for the quarters in those periods, so all or a portion of the quarterly cash distributions to our Class A Common Unitholders would need to be made from our cash on hand, including from proceeds from this offering initially designated as reserves.
The Company is structured in a manner where our general partner will hold a small number of Class A Common Units and a general partner interest that will not entitle it to receive cash distributions until such time as the Company has grown its quarterly cash distribution to the Class A Common Unitholders above the initial target quarterly distribution per Class A Common Unit, after which time our general partner will receive an amount equal to 10% of the amount distributed above the initial target quarterly distribution per Class A Common Unit. The general partner will not be entitled to its 10% share of any such amount for the first six full calendar quarters after the closing of this offering. Management will hold Class B Common Units that will not be listed on any stock exchange and will not pay a cash distribution, other than distributions of Available Cash from capital surplus, distributions of proceeds from the sale of our investment in PSI and any liquidating distributions. However, the
2
Table of Contents
Class B Common Units will be mandatorily convertible into Class A Common Units based upon an excess Distributable Cash from Operations coverage test, which we intend will protect the existing Class A Common Unitholder distribution. See “The Offering—Non-GAAP Financial Measures—Distributable Cash from Operations” for our definition of Distributable Cash from Operations. The mandatory conversion is subject to review and election of our general partner. As a result, our general partner and management have a strong incentive to grow Available Cash that will accrue to the benefit of the investors in this offering. See “Description of Our Securities—Conversion of Class B Common Units.”
In addition, pursuant to the Reorganization Transactions described in this prospectus, certain investment partnerships managed by Yorktown and other non-Yorktown affiliated investors will receive Class B Common Units in exchange for their common and preferred ownership interests in Peak E&P, PBLM and PSI. These Class B Common Units will not be listed on any stock exchange and will not pay a cash distribution, other than distributions of Available Cash from capital surplus, distributions of proceeds from the sale of our investment in PSI and any liquidating distributions. However, these Class B Common Units will be mandatorily convertible (at the election of our general partner) into Class A Common Units based upon an excess Distributable Cash from Operations coverage test, which we intend will protect the existing Class A Common Unitholder distribution. See “Description of Our Securities—Conversion of Class B Common Units.”
Experienced Management Team
Peak E&P was formed by our management team and investment partnerships managed by Yorktown in 2011 to identify, evaluate, acquire and develop onshore oil and natural gas assets in the United States. Peak E&P is led by Jack E. Vaughn, Glen E. Christiansen and Justin M. Vaughn, who have over 90 years of collective experience operating in the exploration and production industry.
PBLM was formed by an investment partnership managed by Yorktown in 2017 to identify and fund the acquisition of additional high-quality acreage in the Powder River Basin for development by Peak E&P.
Our management team has an established track record of identifying, developing and efficiently operating oil and natural gas assets in the Powder River Basin as well as other premier onshore U.S. basins. Moreover, members of our management team were key participants in the early implementation of advanced drilling techniques in the Granite Wash (Anadarko Basin) as well as the shift from vertical to horizontal drilling and the application of advanced completion techniques in the Barnett Shale (Fort Worth Basin) and Bakken Shale (Williston Basin). In total, our Chief Executive Officer and Yorktown have worked together to navigate three prior successful upstream exits, with an average return on investment of 296%, excluding general and administrative and other expenses. We believe our management team’s experience provides us with a competitive advantage in the identification of opportunities in the Powder River Basin and continues to drive our top-tier operational performance; however, the prior performance of companies or business initiatives in which our management team or Yorktown were involved may not be indicative of our future performance.
Upon completion of this offering, our management team will consist of Jack E. Vaughn, Chief Executive Officer; Glen E. Christiansen, President and Chief Operating Officer; Justin M. Vaughn, Executive Vice President and Chief Financial Officer; and Ali A. Kouros, Executive Vice President, Corporate Development and Strategy. Our management team will be supported by employees, including geologists, completion and drilling engineers, land personnel, regulatory and environmental specialists, as well as field operating personnel.
Powder River Basin, Wyoming, USA
Our primary operational focus is on using advanced horizontal drilling and completion technology to economically and expeditiously grow our oil and natural gas production and proved reserves in the Powder River Basin. We believe that the geologic characteristics and in-place resources of the Powder River Basin make it one
3
Table of Contents
of the most attractive regions in the United States for the development and production of oil and associated natural gas. The Powder River Basin consists of an expansive and thick gross column with multiple, proven productive horizons that are conducive to the application of horizontal drilling and completion techniques using state-of-the-art technology. We believe this results in high oil and natural gas recoveries and attractive economic returns relative to drilling and completion costs, lower drilling risk, high initial production rates and long reserve life. Further, we believe at this current development stage, the Powder River Basin remains less developed from a horizontal drilling perspective, which presents many years of attractive development opportunities.
Utilizing their experience in identifying unconventional resource development opportunities, our management team analyzed the geologic potential of numerous North American basins and decided to make the Powder River Basin our focal point. The Powder River Basin has a long history of oil and natural gas development through the vertical development of its extensive oil reservoirs, and later through the development of its coal bed methane reserves. Like the Permian Basin, the Powder River Basin has been substantially delineated through the drilling of more than 33,000 vertical oil and natural gas wells. However, in our opinion, unlike the Permian Basin, the Powder River Basin’s tight oil resource has yet to be widely re-developed with advanced horizontal drilling and completion technologies.
We believe the reservoir quality and stacked pay potential of the Powder River Basin is similar to that of the Permian Basin, with an approximate 4,000-foot gross column, high oil content and significant over-pressure, with multiple productive horizons as deep as 13,500 feet. In addition, the geographic location of the Powder River Basin provides us with attractive realized pricing and operating leverage due to its proximity to end markets, installed infrastructure with ample capacity for growth, access to in-basin service providers and what we view as a favorable regulatory climate in the State of Wyoming for hydrocarbon development operations.
As of June 30, 2024, we had approximately 65,000 gross (45,000 net) acres comprised of private, state, and federal lands with a number of large, contiguous leasehold blocks in the over-pressured core of the Powder River Basin, primarily in Campbell and Converse Counties, Wyoming. We have drilled and operate a total of 104 gross (56 net) producing horizontal wells. In addition, we have drilled two gross (one net) horizontal wells awaiting completion. We also own interests in an additional 83 gross (four net) non-operated, producing horizontal wells with an average working interest of approximately 4.8%. All 83 gross (four net) non-operated wells are operated primarily by other leading Powder River Basin operators including EOG Resources, Devon Energy, Anschutz Exploration, and Ballard Petroleum. Our small working interest in these non-operated wells allows us the benefit of ascertaining other operators’ techniques and advances at a relatively small cost. The following map illustrates our acreage positions within the Powder River Basin, consisting primarily of leased acreage in Campbell County, Wyoming, with additional positions in Johnson County and Converse County, Wyoming.
4
Table of Contents
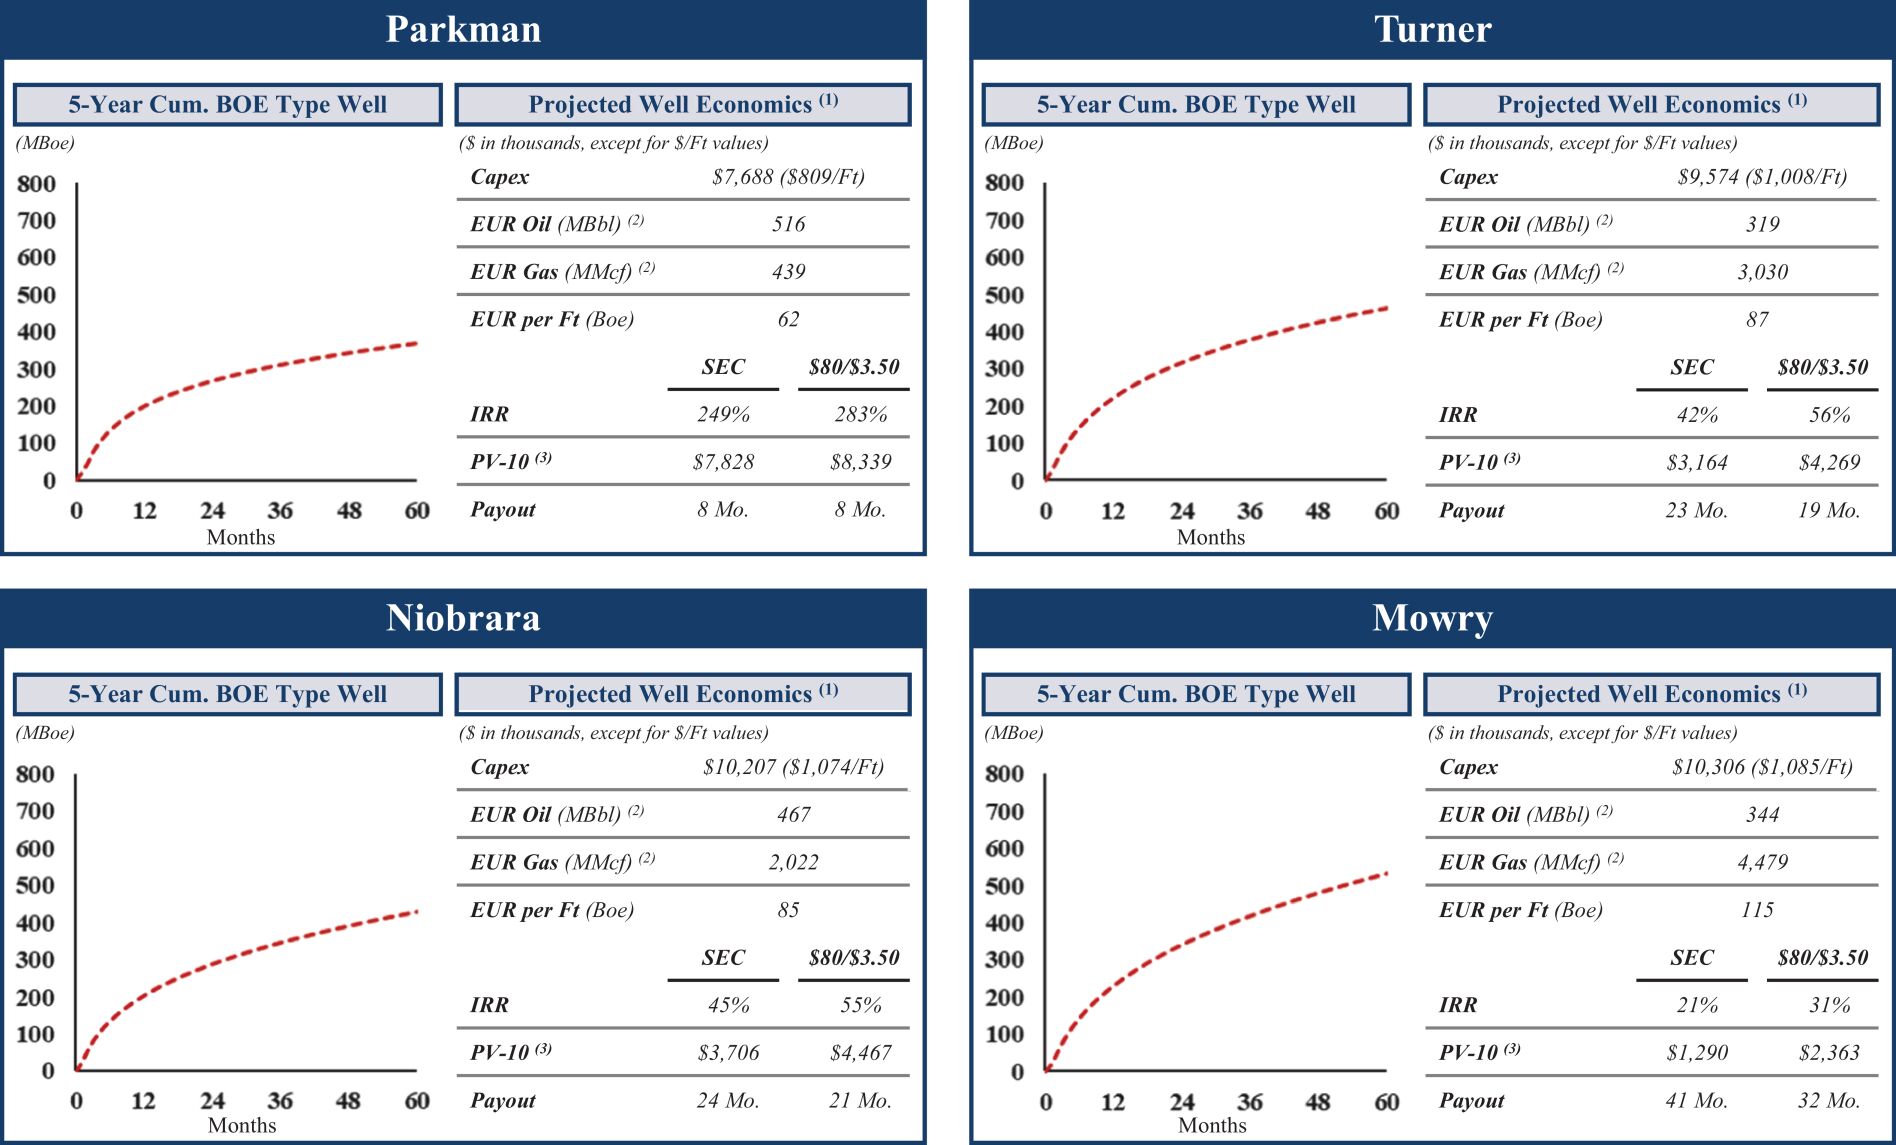
We have identified 1,770 gross (530 net) horizontal drilling locations across our acreage in the Powder River Basin, the majority of which target the Parkman, Shannon, Turner, Niobrara and Mowry reservoirs. We believe that
5
Table of Contents
a significant portion of our inventory in the Turner and Shannon horizons (over-pressured, marine-influenced, tight sandstone formations) and the Parkman horizon (normally pressured, marine-influenced, tight sandstone formation) has been substantially delineated by the number of horizontal and vertical wells drilled on or within the vicinity of our acreage and has lowered the geologic and operational risk. Furthermore, we have been actively developing the Mowry and Niobrara horizons, which are both organic-rich, over-pressured, tight shale formations. Combining our results with those of other offset operators, attractive returns in these horizons have been proven at current commodity prices utilizing advanced drilling and completion techniques and technology. We also see additional potential development opportunities in the Teapot, Sussex, Muddy and Dakota formations. Based on our near-term development program, and assuming that we drill an average of eight gross wells per year, we have a multi-decade drilling inventory. We have identified 1,770 gross (530 net) horizontal drilling locations within our approximately 65,000 gross (45,000 net) acre position, of which at a 10% internal rate of return, 658 gross (244 net) locations are currently economic at $55.00 per barrel for oil and $1.85 per MMBtu for natural gas, and 1,198 gross (423 net) locations are economic at $70.00 per barrel for oil and $2.36 per MMBtu for natural gas. Furthermore, if we increase our current development cadence from eight gross wells per year to 24 gross wells per year (i.e., one full-time rig per year), our inventory would still span 27 years using the 658 gross (244 net) locations from the lower pricing assumptions above. As of December 31, 2023, our total estimated proved oil and natural gas reserves were approximately 16,247 Mboe, based on our annual reserve report prepared by Cawley Gillespie. Because our reserves are reported in two streams, the economic value of the NGLs is included in our natural gas price and natural gas reserves. Our proved reserves are comprised of approximately 59% oil and 41% natural gas and are approximately 50% proved developed.
The following table sets forth a summary, as of December 31, 2023, of our gross and net identified horizontal drilling locations by reservoir.
Identified Horizontal Drilling Locations(1)(2)(3)(4) | ||||||||
Gross | Net | |||||||
Parkman | 162 | 61 | ||||||
Shannon | 82 | 29 | ||||||
Turner | 259 | 87 | ||||||
Niobrara | 712 | 196 | ||||||
Mowry | 526 | 147 | ||||||
Teapot | 12 | 3 | ||||||
Sussex | 17 | 7 | ||||||
|
|
|
| |||||
Total | 1,770 | 530 | ||||||
|
|
|
|
(1) | The above table includes 1,074 gross (354 net) of our identified horizontal drilling locations that have been evaluated by Cawley Gillespie, our independent reserve engineer, along with 696 gross (176 net) identified horizontal drilling locations that have not been evaluated by Cawley Gillespie that were based solely on the internal evaluations of our management. See “Risk Factors—Risks Related to Our Business—A portion of our identified horizontal drilling locations are based on our management’s internal estimates and were not based on evaluations prepared by Cawley Gillespie.” |
(2) | Identified horizontal drilling locations represent total gross and net locations that have either been evaluated by Cawley Gillespie or specifically identified by management as an estimate of our future multi-year drilling inventory on existing acreage. We have estimated our drilling locations based upon our interpretation of available geologic and engineering data as well as the evaluation of the performance of vertical and horizontal wells drilled on and within the vicinity of our acreage. Our actual drilling activities may change depending on oil and natural gas prices, the availability of capital, costs, drilling results, regulatory approvals and other factors. Any drilling activities we are able to conduct on these identified locations may not be successful and may not result in our ability to add additional reserves to our existing reserves. Further, to the extent the drilling locations are associated with acreage that expires, we would lose |
6
Table of Contents
our right to develop the related locations. See “Risk Factors—Risks Related to Our Business and the Oil and Natural Gas Industry—Our identified drilling locations are scheduled out over many years, making them susceptible to uncertainties that could materially alter the occurrence or timing of their drilling.” |
(3) | Our identified horizontal drilling location count assumes the following with respect to wells per drilling and spacing unit (“DSU”) and spacing for each of our targeted reservoirs: |
Gross Wells per DSU | Spacing (in feet) | |||||||
Parkman | 4 | 1,056 | ||||||
Shannon | 2 | 1,760 | ||||||
Turner | 3 | 1,320 | ||||||
Niobrara* | 4 | 1,056 | ||||||
Mowry | 4 | 1,056 | ||||||
Teapot | 3 | 1,320 | ||||||
Sussex | 2 | 1,760 |
* | Niobrara locations generally assume four wells per DSU. However, in the eastern portion of Campbell County, the Niobrara develops two distinct reservoirs and as a result, a total of eight gross wells per DSU have been identified (four wells in the Upper Niobrara and four wells in the Lower Niobrara). |
(4) | One-mile laterals represent horizontal wells expected to be drilled on a 640-acre DSU. Typically, these horizontal wells are drilled with a lateral length of approximately 4,000 feet. Two-mile laterals represent horizontal wells that are drilled across a 1,280-acre DSU. Typically, these horizontal wells are drilled with a lateral length of approximately 9,500 feet. While a portion of our locations represent one-mile laterals, we anticipate there will be increasing opportunities to shift many of these locations towards the drilling and completion of horizontal wells with two-mile laterals. |
International Assets
Although our operational focus is on developing our large acreage holdings in the Powder River Basin, in connection with the Reorganization Transactions and immediately prior to the closing of this offering, we will acquire a non-controlling, approximately 16% minority equity position in PSI, a private, Canadian company formed in 1995 and headquartered in Houston, Texas. PSI owns international oil and natural gas assets, primarily in Colombia and Brazil.
PSI operates oil and natural gas fields in Colombia, most of which are located in the Middle Magdalena Valley Basin (Las Monas Block). PSI also operates five oil and gas fields in Romania, with approximately 660 Boe/d, but is planning on a full exit of the country by December 2024. During the year ended December 31, 2023, PSI’s average operated daily net production in Colombia was approximately 2,370 Boe/d with 132 active wells, and PSI’s revenue with respect to its non-RECV (as defined below) operations was approximately $54.4 million.
PSI also owns an indirect interest in Brazilian operations through its approximately 20% ownership of PetroReconcavo S.A. (“RECV”), a publicly-held company that trades on the Sao Paulo Stock Exchange under the ticker symbol RECV3:SAO. As of the close of business on June 30, 2024, RECV’s market capitalization was approximately $979 million. RECV has primarily grown through the acquisition of conventional and mature onshore oil and natural gas properties in Brazil and the subsequent development of those properties. For the year ended December 31, 2023, RECV reported average daily production of approximately 26,000 Boe/d, 835 active wells, revenues of approximately $560 million, and $58 million in dividends paid to its shareholders. We account for our non-controlling ownership interest in PSI using the cost method of accounting. The carrying value of the Partnership’s investment in PSI on the balance sheet included in our consolidated financial statements is at cost.
7
Table of Contents
We will acquire our interest in PSI from two investment partnerships managed by Yorktown in the Reorganization Transactions described below. Historically, PSI has paid significant dividends to its shareholders, and we expect PSI to continue to pay dividends in the future, although it has no obligation to do so and we have no influence or control over PSI’s payment of dividends. We plan to use any future dividends we receive from PSI to fund capital expenditures, to pay cash distributions and for other general uses. For the years ended December 31, 2021, 2022 and 2023, PSI paid aggregate dividends with respect to the approximately 16% minority interest we will acquire in the Reorganization Transaction of $22.1 million, an average of approximately $7.3 million per year.
Development Plan and Capital Budget
Historically, our business plan has focused on acquiring and then developing non-producing acreage. Funding sources for our activities have included cash from our partners, proceeds from borrowings, and cash flow from operating activities.
We spent approximately $10.5 million on development costs (which includes expansion capital expenditures and maintenance capital expenditures, but excludes divestiture proceeds) for the year ended December 31, 2023. Our capital budget for the year ending December 31, 2024 is approximately $8.6 million ($5.6 million of which related to expansion capital expenditures paid as of June 30, 2024). Based on current commodity prices and our drilling success rate to date, we expect to fund our 2024 capital development program from cash flow from operating activities. For the twelve months ending December 31, 2025, we intend to use cash flow from operating activities and cash on hand, including proceeds from this offering initially designated as reserves, to significantly increase capital expenditures to approximately $75.9 million. Our development efforts and capital for the year ending December 31, 2024 are primarily focused on the completion of one gross drilled but uncompleted horizontal well, along with commencing the drilling of a total of four gross (three net) horizontal wells, which are expected to be completed in early 2025. For the years ending December 31, 2025, 2026 and 2027, we anticipate a continued focus on the drilling and completion of additional wells, with seven gross (five net) wells expected to be drilled and 11 gross (eight net) wells expected to be completed in 2025, 15 gross (12 net) wells expected to be drilled and 12 gross (11 net) wells expected to be completed in 2026, and six gross (five net) wells expected to be drilled and nine gross (seven net) wells expected to be completed in 2027. The objective of these activities is to consistently grow net production over the next several years.
By operating a high percentage of our acreage, we are better able to control the cadence of our development activities and the corresponding amount and timing of our capital expenditures. We may choose to defer a portion of these planned capital expenditures or modify our rig count depending on a variety of factors, including, but not limited to, the success of our drilling activities, prevailing and anticipated commodity prices, the availability of necessary equipment, infrastructure, drilling rigs, labor and capital, the receipt and timing of required regulatory permits and approvals, seasonal conditions and drilling and completion costs. Additionally, our projected capital budget includes our expectations regarding the amount of capital that will be required for non-operated development activity. The amount of capital that may ultimately be spent on non-operated development activity may vary based on the development activities of the applicable operators. Any reduction in our capital expenditure budget could delay or limit our development program, which could materially and adversely affect our ability to grow production and our future business, financial condition, results of operations and liquidity. Our development plan and capital budget are based on management’s current expectations and assumptions about future events. While we consider these expectations and assumptions to be reasonable, they are subject to significant business, economic, competitive, regulatory and other risks, contingencies and uncertainties, most of which are difficult to predict and many of which are beyond our control. For further discussion of the risks we face, see “Risk Factors—Risks Related to Our Business and the Oil and Natural Gas Industry.”
8
Table of Contents
Our primary business objective is to consistently create significant equity value for our Class A Common Unitholders through a combination of (i) growing our production, cash flow and reserve value and (ii) returning cash to our Class A Common Unitholders through stable and growing cash distributions. To achieve our objective, we intend to execute the following business strategies:
Grow cash flows, reserves and production by developing our extensive oil-focused resource base in the Powder River Basin. We have built an extensive oil-focused inventory of 1,770 gross (530 net) identified horizontal drilling locations predominately targeting our five main producing horizons in the Powder River Basin. We also see additional potential development opportunities in the Teapot, Sussex, Muddy and Dakota formations. We believe our extensive inventory of oil-focused drilling locations, together with our long-lived reserves and operating expertise, will enable us to create equity value by growing cash flow, reserves and production in the current commodity price environment. We intend to utilize these increased cash flows to make quarterly cash distributions to our Class A Common Unitholders, fund future capital programs and grow our acreage position.
Strategically grow our acreage position through opportunistic bolt-on acquisitions and leasing opportunities while increasing our working interest in existing acreage. Our management team has a demonstrated track record of identifying and executing on attractive resource development opportunities. Since entering the Powder River Basin in 2012, we have consummated nearly 78 opportunistic bolt-on acquisitions and acreage purchases in the Powder River Basin, acquiring approximately 45,000 net acres as of December 31, 2023. We intend to build upon these successes and pursue similar opportunistic bolt-on and strategic acquisitions in the Powder River Basin. We also expect to continue to use the Wyoming “forced pooling” process to increase our working interest in wells we propose to drill as operator, which could lead to a proportionate increase in our share of the production and reserves associated with any such successfully drilled well.
Focus on making cash distributions to, and providing long-term value for, our Class A Common Unitholders. Our primary goal is to maximize investor returns through cash distributions and attractive growth of our production and oil and gas reserve value. Our goal is to make a distribution of at least $0.30 per Class A Common Unit per quarter (adjusted for the number of days in the first quarterly period after the closing date of this offering), which we refer to as our initial target quarterly distribution. Although our partnership agreement requires that we distribute all of our Available Cash, if any, quarterly, we have no legal obligation to do so, and there is no guarantee that we will make quarterly cash distributions to our Class A Common Unitholders at the initial target quarterly distribution amount, or at all, or that distributions will grow over time. However, we intend to grow production annually and acquire acreage over time, while continuing to provide consistent quarterly distributions to our Class A Common Unitholders at or above our initial target quarterly distribution, with a goal of increasing the long-term value of our Class A Common Units.
Maintain financial flexibility with a conservative capital structure and a strong liquidity profile. We intend to conduct our operations primarily through cash flow generated from operations with a focus on maintaining a strong balance sheet with significant cash reserves and little to no net debt. We intend to terminate our Existing Credit Agreement (as defined below) in connection with the closing of this offering, and we are currently negotiating the New Credit Facility (as defined below). Assuming we enter into the New Credit Facility at the closing of this offering, we will use borrowings under the New Credit Facility and a portion of the proceeds from this offering to repay in full and terminate our Existing Credit Agreement. See “Reorganization Transactions, Partnership Structure and Expected Refinancing Transaction—Expected Refinancing Transaction” for additional information. Due to our strong operating cash flows and post-offering liquidity, we expect to have substantial flexibility to fund our capital budget and to potentially accelerate our drilling program as conditions warrant. Our focus is on the economic extraction of hydrocarbons while maintaining a prudent leverage ratio and strong liquidity
9
Table of Contents
profile. Although we may use leverage to make accretive acquisitions, we expect to do so with the long-term goal of maintaining a strong balance sheet. To mitigate the risk associated with volatile commodity prices and to satisfy requirements under our Existing Credit Agreement and the New Credit Facility, as applicable, we have historically hedged, and anticipate that, under the New Credit Facility, we will hedge, a portion of our production volumes, on a rolling quarterly basis, based on reasonably anticipated projected production of proved developed producing reserves that we are required to hedge.
Leverage our geologic and operational expertise to enhance operating efficiencies and maximize returns. We believe our management and technical teams are among the best operators in the Powder River Basin. We regularly benchmark our operating data against our own historical results as well as those of other Powder River Basin operators in order to evaluate our performance, identify opportunities to improve our drilling and completion techniques and make informed decisions about our capital program and drilling activity levels. Our team is focused on utilizing our geologic expertise to analyze the geological characteristics of the horizons we intend to develop, which allows us to develop techniques specifically tailored to each horizon.
Improve returns through the use of advanced drilling and completion techniques, technology and increasing lateral lengths. We continuously seek efficiencies in our drilling, completion and production techniques to optimize ultimate resource recoveries, rates of return and cash flows. Since inception, we have strived to be on the leading-edge of deploying advanced completion technology in the Powder River Basin. We intend to continue to leverage our management and technical teams’ geologic and operational experience in applying unconventional drilling and completion techniques in the Powder River Basin to maximize our returns and will allocate capital towards next generation technologies where applicable.
We believe that the following strengths will allow us to successfully execute our business strategies:
Our sole basin focus promotes optimized development of our concentrated position in the oil and liquids-rich Powder River Basin. While we have exposure to international production through our non-controlling position in PSI, our primary and sole operating focus is on the development of our Powder River Basin assets. Additionally, while the majority of the top operators in the Powder River Basin are large, diversified companies with operations in multiple basins, our operations are focused exclusively in the Powder River Basin. As of December 31, 2023, we were the fifth largest private pure Powder River Basin operator based on gross equivalent production, and the tenth largest producer overall in the Powder River Basin. Our single basin focus has allowed us to develop expertise in the Powder River Basin and to work on refining area-specific drilling and completion designs. Upon completion of this offering, we will be the only public company solely operating in the Powder River Basin, and we intend to leverage our deep knowledge of the basin, along with our understanding of the geology and reservoir properties of potential acquisition targets, to identify and opportunistically acquire prospective bolt-on acreage that improves our potential drilling outcomes and meets our strategic and financial objectives. We believe we are well-positioned in our combined attributes of production growth, dividend yield and proved reserve inventory, with estimated production growth of 135.3% from 2024 to 2026, an estimated dividend yield of approximately 8.6% (based on an initial public offering price of $14.00 per Class A Common Unit) and a projected proved reserves to 2024 production ratio estimate of 16.3 years.
Highly experienced management team with a track record of creating value. Our management team has an established track record operating in the Powder River Basin and other premier onshore U.S. basins and is experienced in the identification, evaluation, execution and integration of acquisitions. Members of our management team have a long history of working together on the cost-efficient management of leading-edge development programs, including three in the Granite Wash (Anadarko Basin), the Barnett Shale (Fort Worth Basin) and the Bakken Shale (Williston Basin). Our Chief Executive Officer and Yorktown have led activities in
10
Table of Contents
other active plays and basins, growing a cumulative investment of approximately $340 million to approximately $1 billion over the course of three successful upstream exit transactions, with an average return on investment of 296%, excluding general and administrative and other expenses. In the Powder River Basin, our management team has delivered leading well performance results. For example, with respect to the formations in which we are active, our average 12-month cumulative production results for laterals greater than or equal to one and a half miles on a Boe per foot basis place us among the leading basin operators. We believe our management team is able to leverage their experience to create equity value through organic development of our existing assets and opportunistic acquisitions; however, the prior performance of companies or business initiatives in which our management team or Yorktown were involved may not be indicative of our future performance.
Low-risk acreage position with multi-year inventory of oil-weighted drilling locations. We have a large inventory of drilling opportunities in the core of the Powder River Basin. As of December 31, 2023, our horizontal drilling inventory evaluated by Cawley Gillespie consisted of 1,074 gross (354 net) locations, primarily targeting the Parkman, Shannon, Turner, Niobrara and Mowry horizons. Between September 1, 2024 and December 31, 2026, we expect to drill 26 gross (20 net) operated wells and complete 23 gross (18 net) operated wells. Based on our near-term development program, assuming we drill an average of eight gross wells per year, we have a multi-decade opportunity set. We have identified 1,770 gross (530 net) horizontal drilling locations within our approximately 65,000 gross (45,000 net) acre position, of which at a 10% internal rate of return, 658 gross (244 net) locations are currently economic at $55.00 per barrel for oil and $1.85 per MMBtu for natural gas, and 1,198 gross (423 net) locations are economic at $70.00 per barrel for oil and $2.36 per MMBtu for natural gas. Furthermore, if we increase our current development cadence from eight gross wells per year to 24 gross wells per year (i.e., one full-time rig per year), our inventory would still span 27 years using the 658 gross (244 net) locations from the lower pricing assumptions above. Our production stream is oil weighted, and we envision increasing our average oil production from 55-60% to approximately 60-70% of our total equivalent production over the next three years.
Balanced asset portfolio with significant capital allocation flexibility. Our acreage spans all hydrocarbon mix windows of the Powder River Basin, giving us the flexibility to adjust our capital plan and drilling program to rebalance our production as the commodity price environment evolves. Because approximately 70% of our net acreage position was held by production as of December 31, 2023, and we have the ability to extend many of our material, non-producing leases beyond 2026 for approximately $2.5 million and potentially renew the remaining non-producing leases beyond 2026 for an additional $1.4 million, we are able to opportunistically allocate our human and capital resources to focus on certain windows to produce the commodity mix that is expected to provide the highest potential rate of return at that given time.
Positioned in the Powder River Basin with existing infrastructure built to gather and transport higher volumes than are currently being produced in the basin results in a present-day underutilization. The first oil well in the Powder River Basin was drilled in 1889. Since that time, the Powder River Basin has experienced multiple waves of conventional development. Starting in 2012, horizontal development began and production growth followed. As of December 2023, the Powder River Basin was producing nearly 181 MBbls/d – roughly four times the production from the low in 2009. The Powder River Basin has available refining and takeaway capacity of 1,097 MBbls/d, significantly above current production. Our average net daily production for the year ended December 31, 2023 was approximately 2,947 Boe/d, from approximately 60 net wells. As a result of the legacy production along with the recent upswing in activity, we believe the oil infrastructure in place across our acreage has sufficient capacity to support our anticipated production growth.
Geographically advantaged assets with regional price advantages. Our acreage position is in close proximity to end markets for our oil and natural gas, which provides us with a regional price advantage. For example, in 2023, we sold all of our operated oil production to purchasers in the Powder River Basin, which was then refined in Casper, Rawlins or Newcastle, Wyoming, which are all approximately 75 miles from our acreage
11
Table of Contents
position. We expect to continue to sell a majority of our operated oil production on a go-forward basis at attractive prices with all-in differentials of approximately ($3.00) per barrel against the NYMEX WTI. Our operated natural gas also realizes competitive pricing. For example, in 2023, we sold all of our operated natural gas production for $0.02/Mcf over NYMEX Henry Hub, including all transportation, compression and enhancement fees and percentage of proceeds paid to the gas gatherers and marketers. We expect to continue to sell a majority of our operated natural gas production on a go-forward basis at attractive prices that are at or near NYMEX Henry Hub pricing.
Strong relationships with local landowners and government authorities. We have purposefully developed strong relationships with surface and mineral interest owners in the Powder River Basin, which we believe provides us with a competitive advantage in acquiring additional leasehold and operatorship positions. Furthermore, our management’s substantial experience in the Powder River Basin and extensive interactions with the relevant state and federal regulatory bodies allow us to efficiently and effectively navigate the regulatory process, which affords us opportunities to assume operatorship and expand our ownership.
Significant operational control allowing us to improve drilling results and economic returns. As operator, we are able to control the timing and design of our development program. We believe this affords us the flexibility to efficiently develop our acreage by adjusting drilling, completion and production activities opportunistically to react to changes in the operational and economic environment, such as changes in commodity prices, service costs and access to services.
Exposure to international operations and supplemental cash dividends. Through our approximately 16% non-controlling investment in PSI, we anticipate receiving future cash dividends. For the years ended December 31, 2021, 2022 and 2023, PSI paid aggregate dividends with respect to the approximately 16% minority interest we will acquire in the Reorganization Transaction of $22.1 million, an average of $7.3 million per year. We believe that our ownership position in PSI will continue to provide us with cash dividends to supplement our operational cash flow; however, we are not solely relying on these dividends in our financial planning and budgeting.
An investment in our Class A Common Units involves risks associated with our cash distributions, our business, our partnership structure and the tax consequences of owning the Class A Common Units, among other things. You should carefully consider the risks described in “Risk Factors” and the other information in this prospectus before investing in our Class A Common Units. Some of the most significant challenges and risks we face include the following:
Risks Related to Cash Distributions on our Class A Common Units
• | Cash distributions may fluctuate with our performance, and we may not have sufficient cash available to pay any quarterly distribution on our Class A Common Units. |
• | The assumptions underlying the forecast of Available Cash for distribution to our Class A Common Unitholders we include in “Our Cash Distribution Policy and Restrictions on Distributions” may prove inaccurate and are subject to significant risks and uncertainties that could cause actual results to differ materially from our forecasted results. |
• | The amount of our quarterly cash distributions from Available Cash, if any, may vary significantly both quarterly and annually and will be directly dependent on the performance of our business. We will not have a minimum quarterly distribution and could pay no distribution with respect to any particular quarter. |
12
Table of Contents
• | Our general partner’s absolute discretion in determining the level of cash reserves may adversely affect our ability to make cash distributions to Class A Common Unitholders. |
Risks Related to Our Business and the Oil and Natural Gas Industry
• | Oil and natural gas prices are volatile. A substantial or extended decrease in prices of these commodities could adversely affect our business, financial condition, results of operations, ability to meet our financial commitments, ability to make our planned capital expenditures and distributions. |
• | Unless we replace the reserves we produce, our revenues and production will decline, which would adversely affect our cash flow from operations, results of operations and our ability to make distributions. |
• | If commodity prices decline and remain depressed for a prolonged period, production from a significant portion of our properties may become uneconomic and cause downward adjustments of our reserve estimates and write downs of the value of such properties, which may adversely affect our financial condition and our ability to make distributions. |
• | Our identified drilling locations are scheduled out over many years, making them susceptible to uncertainties that could materially alter the occurrence or timing of their drilling. |
• | A portion of our identified horizontal drilling locations are based on our management’s internal estimates and were not based on evaluations prepared by Cawley Gillespie. |
• | Our development projects and potential future acquisitions require substantial capital expenditures. We may be unable to obtain any required capital or financing on satisfactory terms, which could lead to a decline in our production and reserves. |
• | Our U.S. producing properties are concentrated in the Powder River Basin, making us vulnerable to risks associated with operating in a single geographic area. |
• | The unavailability, high cost or shortages of drilling rigs, fracking crews, equipment, raw materials, supplies, personnel and oilfield services could adversely affect our ability to execute our development plans within our budget and on a timely basis. |
• | Drilling for and producing oil and natural gas are high-risk activities with many uncertainties that could adversely affect our business, financial condition, results of operations and cash distributions. |
• | Declining general economic, business or industry conditions, including high inflation, may have a material adverse effect on our results of operations, liquidity and financial condition. |
• | Events outside of our control, including an epidemic or outbreak of an infectious disease or the threat thereof, could have a material adverse effect on our business, liquidity, financial condition, results of operations, cash flows and ability to pay distributions. |
• | We use derivative instruments to economically hedge exposure to changes in commodity price and, as a result, are exposed to credit risk and market risk. |
• | Reserve estimates depend on many interpretations and assumptions. Any significant inaccuracies in reserve estimates or underlying interpretations or assumptions will materially affect the quantities and present value of our reserves. |
• | Our business strategy involves using some of the latest available horizontal drilling and completion techniques, which involve risks and uncertainties in their application. |
• | Our Existing Credit Agreement contains, and it is anticipated that our New Credit Facility will contain, restrictions and financial covenants that may restrict our business and financing activities and our ability to pay distributions. |
13
Table of Contents
• | Increased attention to ESG matters and conservation measures may adversely impact our business. |
• | Prolonged negative investor sentiment toward upstream natural gas and oil-focused companies could limit our access to capital funding, which would constrain liquidity. |
Risks Related to Environmental and Regulatory Matters
• | We must adhere to stringent requirements by multiple governing agencies—all of which have the potential to adversely impact the cost and feasibility of our endeavors, and/or expose us to significant risk of liability. |
• | Our operations are subject to a series of risks arising from the threat of climate change, which could result in increased operating costs, limit the areas in which we may conduct oil and natural gas exploration and production activities, and reduce demand for the oil and natural gas we produce. |
Risks Inherent in an Investment in Us
• | Our general partner and its affiliates own a controlling interest in us and may have conflicts of interest with, and owe limited duties to, us, which may permit them to favor their own interests to the detriment of us and our unitholders. |
• | The conversion of Class B Common Units into Class A Common Units could lead to selling pressure on the Class A Common Unit price. |
• | Our partnership agreement does not restrict our Sponsors and their respective affiliates from competing with us. Certain of our directors and officers may in the future spend significant time serving, and may have significant duties with, investment partnerships or other private entities that compete with us in seeking out acquisitions and business opportunities and, accordingly, may have conflicts of interest in allocating time or pursuing business opportunities. |
• | Our partnership agreement requires that we distribute all of our Available Cash, if any, which could limit our ability to grow our reserves and production and make acquisitions. |
• | Our partnership agreement replaces our general partner’s fiduciary duties to our unitholders with contractual standards governing its duties, and restricts the remedies available to unitholders for actions taken by our general partner that might otherwise constitute breaches of fiduciary duty. |
• | Our unitholders have limited voting rights and are not entitled to elect our general partner or the Board, which could reduce the price at which our Class A Common Units will trade. |
• | Even if our unitholders are dissatisfied, they cannot remove our general partner without its consent (other than for cause). |
• | Control of our general partner may be transferred to a third party without unitholder consent. |
• | We may issue an unlimited number of additional units, including units that are senior to the Class A Common Units, without unitholder approval, which may dilute your ownership interest in us. |
• | Once our Class A Common Units are publicly traded, the Existing Owners may sell their Class A Common Units in the public markets, which sales could have an adverse impact on the trading price of the Class A Common Units. |
• | Our general partner has a limited call right that may require you to sell your Class A Common Units and at an undesirable time or price. |
• | For as long as we are an emerging growth company, we will not be required to comply with certain reporting requirements that apply to other public companies, including those relating to auditing standards and disclosure about our executive compensation. |
14
Table of Contents
Tax Risks to Purchasers of Class A Common Units in this Offering
• | We are treated as a corporation for U.S. federal income tax purposes, and our distributions to our Class A Common Unitholders may be substantially reduced. |
• | Distributions to Class A Common Unitholders may be taxable as dividends. |
Reorganization Transactions, Partnership Structure and Expected Refinancing Transaction
Reorganization Transactions and Partnership Structure
As part of our reorganization, immediately prior to the closing of this offering:
• | 100% of the common units in Peak E&P, including the common units held by Yorktown Energy Partners IX, L.P. (“Yorktown IX”) and the members of our management team, will be contributed to the Company in exchange for an aggregate of 2,114,100 Class B Common Units; |
• | 100% of the preferred units in Peak E&P, including the preferred units held by Yorktown Energy Partners X, L.P. (“Yorktown X”), and Yorktown Energy Partners XI, L.P. (“Yorktown XI”), will be contributed to the Company in exchange for an aggregate of 5,044,139 Class B Common Units; |
• | 100% of the ownership interests in PBLM, all of which is held by Yorktown XI, will be contributed to the Company in exchange for 1,080,000 Class B Common Units; |
• | an aggregate of approximately 16% of the equity in PSI, held by Yorktown Energy Partners VIII, L.P. (“Yorktown VIII”) and Yorktown IX, will be contributed to the Company in exchange for 167,636 Class A Common Units and 1,370,566 Class B Common Units, respectively (all recipients of units in the Reorganization Transactions (as defined below) are referred to herein as the “Existing Owners”); and |
• | $1,000,000 will be contributed to the Company by our general partner in exchange for 71,429 Class A Common Units. |
We will amend and restate our partnership agreement to reflect the reorganization as outlined above (collectively, the “Reorganization Transactions”).
Expected Refinancing Transaction
As of June 30, 2024, Peak E&P had $57.35 million of outstanding borrowings under the Fortress-Peak Credit and Guaranty Agreement (the “Existing Credit Agreement” or “Existing Credit Facility”). As of September 30, 2024, we had approximately $54.25 million of outstanding borrowings under the Existing Credit Facility. We intend to use a portion of the net proceeds of this offering to repay a portion of the Existing Credit Agreement, which would include payment of the applicable prepayment fee. Please see “Use of Proceeds” for additional information.
We are in the process of negotiating a new credit facility (the “New Credit Facility”) at the Partnership level that we anticipate entering into at the closing of this offering. The amount, maturity, interest rates and other terms of the New Credit Facility are in the process of being negotiated with prospective lenders; however, we expect that the aggregate commitments thereunder will be approximately $200.0 million with an initial borrowing base of $45.0 million. The New Credit Facility will be a senior secured revolving credit facility that will be guaranteed by certain of our subsidiaries and secured by substantially all of our assets and the assets of certain of our subsidiaries. We anticipate the New Credit Facility to have a four-year term and borrowings under the New Credit Facility to bear interest at a variable rate per annum equal to, at the Partnership’s option, SOFR or base rate, in each case plus an applicable margin per annum that is determined by a leverage ratio. The New Credit Facility is anticipated to contain representations and warranties, affirmative, negative and financial covenants and events of default customary for secured financings of this type.
15
Table of Contents
Borrowings under the New Credit Facility may vary significantly from time to time depending on our cash needs at any given time. Assuming we enter into the New Credit Facility at the closing of this offering, we will use approximately $15.0 million in borrowings under the New Credit Facility and approximately $40.9 million of the net proceeds of this offering to repay in full (including payment of the applicable prepayment fee) and terminate the Existing Credit Agreement. However, in the event that we are unable to obtain binding commitments for the New Credit Facility on acceptable terms, $15.0 million of the $15.7 million of net proceeds that would otherwise be designated as a reserve for general partnership purposes will be used to repay the balance on the Existing Credit Agreement. We cannot assure you that we will obtain binding commitments for the New Credit Facility. Please see “Management’s Discussion and Analysis of Financial Condition and Results of Operations—Debt Agreements,” “Risk Factors” and “Use of Proceeds” for additional information.
Ownership and Organizational Structure of Peak Resources LP
The diagram below depicts our organization and ownership before giving effect to the offering and the Reorganization Transactions.
The diagram below depicts our organization and ownership after giving effect to this offering and the Reorganization Transactions and assumes that the underwriters do not exercise their option to purchase additional Class A Common Units. Totals may not be exact due to rounding.
16
Table of Contents
(1) | Yorktown VIII, Yorktown IX, Yorktown X, and Yorktown XI are investment partnerships managed by Yorktown. |
(2) | Management includes members of our executive management team and other employees of Peak E&P. |
(3) | Immediately upon the consummation of the Reorganization Transactions, Yorktown VIII, Yorktown IX, Yorktown X, and Yorktown XI will collectively beneficially own 167,636 Class A Common Units and an aggregate of 8,202,079 Class B Common Units, representing approximately 57.5% of the outstanding Class A Common Units on an as-converted basis because of the ownership of Class B Common Units by Yorktown IX, Yorktown X and Yorktown XI. |
(4) | Immediately upon the consummation of the Reorganization Transactions, Yorktown IX, Yorktown X and Yorktown XI will collectively own 8,202,079 Class B Common Units representing approximately 85.4% of the outstanding Class B Common Units. |
(5) | Our general partner has one class of member interests, all of which are owned by members of our executive management team and certain members of our Board, who are also affiliated with Yorktown. Such owners of our general partner are referred to as the “Sponsors.” |
(6) | Immediately upon consummation of this offering, our general partner will continue to be owned by the Sponsors, who collectively with our general partner and Yorktown, will own and control the voting of an aggregate of approximately 58.3% of our outstanding Class A Common Units and Class B Common Units, voting as a single class. |
(7) | Immediately upon consummation of this offering, the public investors will collectively beneficially own 4,700,000 Class A Common Units, representing 95.2% of the outstanding Class A Common Units (or 32.3% of the outstanding Class A Common Units and Class B Common Units, voting together as a single class). |
Management of Peak Resources LP
We are managed and operated by the board of directors (the “Board”) and executive officers of our general partner. Our unitholders will not be entitled to elect our general partner or its directors or otherwise participate in our management or operations. Additionally, our general partner may not be removed except for cause by a vote of the holders of at least 66 2/3% of the outstanding Class A Common Units and Class B Common Units, including any Class A Common Units and Class B Common Units owned by our general partner, its members and their respective affiliates, voting together as a single class and we receive an opinion of counsel regarding limited liability matters. For information about the executive officers and directors of our general partner, please read “Management.”
Our general partner has one class of member interests, all of which are owned by members of our executive management team, certain members of the Board, who are also affiliated with Yorktown, and other individuals affiliated with Yorktown (collectively, the “Sponsors”).
Yorktown VIII, Yorktown IX, Yorktown X, and Yorktown XI, which are investment partnerships managed by Yorktown, will beneficially own approximately 3.4% of our outstanding Class A Common Units immediately after this offering (or 57.5% of our outstanding Class A Common Units on an as-converted basis as a result of their ownership of Class B Common Units). Immediately upon the consummation of the Reorganization Transactions, the funds affiliated with Yorktown will own approximately 85.4% of the outstanding Class B Common Units. Yorktown is an energy-focused private equity firm with a 27-year track record targeting control-oriented investments in free cashflow-focused assets in partnership with best-in-class management teams. Over three decades, Yorktown has invested more than $8 billion in targeted energy sectors and has an investment team with diverse experience across the entire energy sector. We believe our relationship with Yorktown gives us access to a highly accomplished and aligned investment partner.
17
Table of Contents
Implications of Being an Emerging Growth Company
We are an “emerging growth company” as defined in the Jumpstart Our Business Startups Act (the “JOBS Act”). For as long as we are an emerging growth company, unlike other public companies that are not emerging growth companies under the JOBS Act, we are not required to:
• | provide an auditor’s attestation report on management’s assessment of the effectiveness of our system of internal control over financial reporting pursuant to Section 404(b) of the Sarbanes-Oxley Act of 2002; |
• | provide more than two years of audited financial statements and related management’s discussion and analysis of financial condition and results of operations, nor more than two years of selected financial data in a registration statement on Form S-1; |
• | comply with any new requirements adopted by the PCAOB requiring mandatory audit firm rotation or a supplement to the auditor’s report in which the auditor would be required to provide additional information about the audit and the financial statements of the issuer; or |
• | provide certain disclosure regarding executive compensation required of larger public companies required by the Dodd-Frank Wall Street Reform and Consumer Protection Act (the “Dodd-Frank Act”). |
In addition, Section 107 of the JOBS Act also provides that an emerging growth company can use the extended transition period provided in Section 7(a)(2)(B) of the Securities Act of 1933, as amended (the “Securities Act”), for complying with new or revised accounting standards. This permits an emerging growth company to delay the adoption of certain accounting standards until those standards would otherwise apply to private companies. We are choosing to take advantage of this extended transition period and, as a result, we will comply with new or revised accounting standards on the relevant dates on which adoption of such standards is required for private companies. As a result, we will not be subject to new or revised accounting standards at the same time as other public companies that are not emerging growth companies. We intend to take advantage of the other exemptions discussed above, both in this prospectus and in future filings with the U.S. Securities and Exchange Commission (the “SEC”). Accordingly, the information contained herein and that we provide to our unitholders from time to time may be different than the information you receive from other public companies. For additional information, see “Risk Factors—Risks Inherent in an Investment in Us—For as long as we are an emerging growth company, we will not be required to comply with certain reporting requirements that apply to other public companies, including those relating to auditing standards and disclosure about our executive compensation” and “Risk Factors—Risks Inherent in an Investment in Us—Taking advantage of the longer phase-in periods for the adoption of new or revised financial accounting standards applicable to emerging growth companies may make our Class A Common Units less attractive to investors.”
We may take advantage of these provisions until we are no longer an emerging growth company, which will occur on the earliest of (i) the last day of the fiscal year following the fifth anniversary of this offering, (ii) the last day of the fiscal year in which we have equal to or more than $1.235 billion in annual revenue, (iii) the date on which we issue more than $1 billion of non-convertible debt over a three-year period or (iv) the date on which we are deemed to be a “large accelerated filer,” as defined in Rule 12b-2 promulgated under the Securities Exchange Act of 1934, as amended (the “Exchange Act”).
Principal Executive Offices and Internet Address
Our principal executive office is located at 1910 Main Avenue, Durango, Colorado 81301, and our telephone number at that address is (970) 247-1500. We also maintain an office in Denver, Colorado. Following the closing of this offering, our website will be located at www.peakresourceslp.com. We expect to make our periodic reports and other information filed with or furnished to the Securities and Exchange Commission (the
18
Table of Contents
“SEC”) available, free of charge, through our website as soon as reasonably practicable after those reports and other information are electronically filed with or furnished to the SEC. Information on, or otherwise accessible through, our website or any other website is not incorporated by reference herein and does not constitute a part of this prospectus.
Summary of Conflicts of Interest and Duties
Under our partnership agreement, our general partner has a duty to manage us in a manner it believes is not adverse to our best interests. However, because our general partner is wholly owned by the Sponsors, the officers and directors of our general partner also have a duty to manage the business of our general partner in a manner that is beneficial to the Sponsors. As a result of this relationship, conflicts of interest may arise in the future between us and our unitholders, on the one hand, and our general partner and its affiliates, including the Sponsors, on the other hand. For example, our general partner is entitled to make determinations that affect our ability to generate the cash flow necessary to make cash distributions to our unitholders, including determinations related to:
• | purchases and sales of oil and natural gas properties and other acquisitions and dispositions, including whether to pursue acquisitions that may also be suitable for the Sponsors or any affiliate of the Sponsors; |
• | the manner in which our business is operated; |
• | the level of our borrowings; |
• | the amount, nature and timing of our capital expenditures; and |
• | the amount of cash reserves necessary or appropriate to satisfy our general, administrative and other expenses and debt service requirements and to otherwise provide for the proper conduct of our business. |
For a more detailed description of the conflicts of interest and duties of our general partner, please read “Risk Factors—Risks Inherent in an Investment in Us” and “Conflicts of Interest and Duties.”
Our partnership agreement can generally be amended with the consent of our general partner and the approval of the holders of a majority of our outstanding Class A Common Units and Class B Common Units, including any such Class A Common Units and Class B Common Units owned by our general partner, its members and their respective affiliates, voting together as a single class. Immediately upon consummation of this offering, our general partner will continue to be owned by the Sponsors, who collectively with our general partner and Yorktown, will own and control the voting of an aggregate of approximately 58.3% of our outstanding Class A Common Units and Class B Common Units, voting as a single class (or 55.6% if the underwriters exercise in full their option to purchase 705,000 additional Class A Common Units). Assuming that we do not issue any additional voting units and Yorktown does not transfer its Class A Common Units or Class B Common Units, Yorktown will have the ability to amend our partnership agreement, including our policy to distribute all of our Available Cash to our Class A Common Unitholders, without the approval of any other unitholders. Please see “Risk Factors—Risks Inherent in an Investment in Us” and “The Partnership Agreement—Amendment of the Partnership Agreement.”
Delaware law provides that Delaware limited partnerships may, in their partnership agreements, expand, restrict or eliminate the fiduciary duties owed by the general partner to limited partners and the Partnership. Our partnership agreement contains various provisions replacing the fiduciary duties that would otherwise be owed by our general partner with contractual standards governing the duties of our general partner and contractual methods of resolving conflicts of interest. The effect of these provisions is to restrict the remedies available to unitholders for actions taken by our general partner that might otherwise constitute breaches of its fiduciary
19
Table of Contents
duties. Our partnership agreement also provides that affiliates of our general partner, including our Sponsor and its affiliates, are not restricted from competing with us, and neither our general partner nor its affiliates have any obligation to present business opportunities to us. By purchasing a Class A Common Unit, the purchaser agrees to be bound by the terms of our partnership agreement, and pursuant to the terms of our partnership agreement, each such holder consents to various actions and potential conflicts of interest contemplated in our partnership agreement that might otherwise be considered a breach of fiduciary or other duties under Delaware law. Please read “Conflicts of Interest and Duties — Duties of Our General Partner” for a description of the fiduciary duties imposed on our general partner by Delaware law, the replacement of those duties with contractual standards under our partnership agreement and certain legal rights and remedies available to holders of our Class A Common Units. For a description of our other relationships with our affiliates, please read “Certain Relationships and Related Party Transactions.”
20
Table of Contents
Issuer | Peak Resources LP |
Securities offered by us | 4,700,000 Class A Common Units, each Class A Common Unit representing a limited partner interest in the Company (5,405,000 Class A Common Units if the underwriters exercise in full their option to purchase 705,000 additional Class A Common Units). |
The Class A Common Units being offered to the public represent an approximate 32.3% limited partner interest in the Partnership, or an approximate 35.4% limited partner interest in the Partnership if the underwriters exercise in full their option to purchase additional Class A Common Units. |
Number of securities to be outstanding | See chart below. |
Before this offering(1) | After this offering(2) | |||||||
Class A Common Units | 239,065 | 4,939,065 | ||||||
Class B Common Units(3) | 9,608,805 | 9,608,805 |
(1) | Includes the consummation of the Reorganization Transactions and the issuance of Class A Common Units and Class B Common Units to the Existing Owners contemplated thereby immediately prior to this offering. |
(2) | Assumes the underwriters have not exercised their over-allotment option. |
(3) | Class B Common Units are mandatorily convertible (at the election of our general partner) on a one-for-one basis into Class A Common Units, subject to certain conversion metrics being satisfied. See “Description of Our Securities—Conversion of Class B Common Units.” |
Use of proceeds | We expect the net proceeds from this offering to be approximately $57.2 million ($66.4 million if the underwriters exercise their option in full to purchase 705,000 additional Class A Common Units), based upon the assumed initial public offering price of $14.00 per Class A Common Unit (the mid-point of the price range set forth on the cover of this prospectus), after deducting underwriting discounts (including the structuring fee) and estimated expenses. We expect that approximately $40.9 million of the net proceeds will be used to repay a portion of the amount outstanding under our Existing Credit Facility (including the applicable prepayment penalty), approximately $0.6 million of the net proceeds will be used to pay bonuses to certain of our executives related to the consummation of this offering and the remaining $15.7 million of the net proceeds will remain at the Partnership initially designated as a reserve for general partnership purposes, including to pay distributions on our Class A Common Units, if needed. |
We are currently negotiating the New Credit Facility and assuming we enter into the New Credit Facility at the closing of this offering, we will use approximately $15.0 million in borrowings under the New Credit Facility and approximately $40.9 million of the net proceeds of this offering to repay in full (including payment of the applicable |
21
Table of Contents
prepayment fee) and terminate our Existing Credit Agreement. We cannot assure you that we will obtain binding commitments for the New Credit Facility. In the event that we are unable to obtain binding commitments for the New Credit Facility on acceptable terms, $15.0 million of the $15.7 million of net proceeds that would otherwise be designated as a reserve for general partnership purposes will be used to repay the balance on the Existing Credit Agreement. See “Prospectus Summary—Reorganization Transactions, Partnership Structure and Expected Refinancing Transaction—Expected Refinancing Transaction” for additional information. |
Cash distributions to Class A Common Unitholders | Under our current cash distribution policy, within 90 days after the end of each quarter, beginning with the quarter ending December 31, 2024, we intend to make quarterly distributions of Available Cash to the holders of our Class A Common Units. Available Cash will include cash on hand at the end of such quarter, plus certain distributions or dividends received after the end of the quarter, plus certain working capital borrowings and proceeds from this offering if determined by our general partner, less cash reserves established by our general partner, including for the proper conduct of our business, such as for capital expenditures, acquisitions, debt service, compliance with law and loan agreements and future distributions. |
Our ability to pay such cash distributions is subject to various restrictions and other factors described in more detail under the caption “Our Cash Distribution Policy and Restrictions on Distributions.” We will prorate the amount of our distribution payable for the period from the closing of this offering through December 31, 2024, based on the actual length of that period. |
Our partnership agreement generally provides that we will distribute all of our Available Cash each quarter. Our goal is to make a distribution of at least $0.30 per Class A Common Unit per quarter (adjusted for the number of days in the first quarterly period after the closing date of this offering), which we refer to as our initial target quarterly distribution. Our general partner will receive 10% of the amount distributed above the initial target quarterly distribution per Class A Common Unit after the sixth full calendar quarter following the consummation of this offering (and also share in distributions from capital surplus, liquidating distributions and distributions of proceeds from any sale of our investment in PSI). However, to the extent there is no Available Cash, we have no legal obligation to pay cash distributions to our Class A Common Unitholders, and there is no guarantee that we will make quarterly cash distributions to our Class A Common Unitholders at the initial target quarterly distribution amount, or at all, or that distributions will grow over time. |
If we had completed the transactions contemplated in this prospectus on January 1, 2023, our pro forma Distributable Cash from Operations |
22
Table of Contents
would have been approximately $21.2 million for the year ended December 31, 2023 and $16.0 million for the twelve months ended June 30, 2024, which would have been sufficient to pay our initial target quarterly distributions for the quarters in those periods. However, our forecasted Distributable Cash from Operations for the twelve months ending June 30, 2025 and the twelve months ending December 31, 2025 would be insufficient to pay our initial target quarterly distributions for the quarters in those periods, so all or a portion of the quarterly cash distributions to our Class A Common Unitholders would need to be made from our cash on hand, including from proceeds from this offering initially designated as reserves. Our historical and pro forma financial statements do not include the estimated incremental expenses of being a publicly traded company. However, our forecast of Distributable Cash from Operations for the twelve months ending June 30, 2025 and the twelve months ending December 31, 2025 includes the estimated incremental expenses of being a publicly-traded company. For a calculation of our ability to pay distributions to our unitholders based on our pro forma results for the year ended December 31, 2023, and the twelve months ended June 30, 2024, and based on our forecasted results for the twelve months ending June 30, 2025 and the twelve months ending December 31, 2025, please read “Our Cash Distribution Policy and Restrictions on Distributions—Unaudited Pro Forma Distributable Cash from Operations for the Year Ended December 31, 2023 and the Twelve Months Ended June 30, 2024” and “Our Cash Distribution Policy and Restrictions on Distributions—Estimated Distributable Cash from Operations for the Twelve Months Ending June 30, 2025 and the Twelve Months Ending December 31, 2025.” |
We believe, based on our financial forecast and the related assumptions included under “Our Cash Distribution Policy and Restrictions on Distributions—Estimated Distributable Cash from Operations for the Twelve Months Ending June 30, 2025 and the Twelve Months Ending December 31, 2025,” that we will have sufficient Available Cash to make cash distributions at our initial target quarterly distribution of $0.30 per Class A Common Unit on all Class A Common Units (on an annualized basis) for the four quarter period ending June 30, 2025 and the quarters in the period ending December 31, 2025. We cannot guarantee that we will make any particular amount of distributions or any distributions to our unitholders in any quarter. Please read “Our Cash Distribution Policy and Restrictions on Distributions.” |
Issuance of additional units | We can issue an unlimited number of additional units, including units that are senior to the Class A Common Units in right of distributions, liquidation and voting, on terms and conditions determined by our general partner, without the approval of our unitholders. Please read “Class A Common Units Eligible for Future Sale” and “The Partnership Agreement—Issuance of Additional Partnership Interests.” |
23
Table of Contents
Limited voting rights | Our general partner will manage us and operate our business. Unlike stockholders of a corporation, our Class A Common Unitholders will have only limited voting rights on matters affecting our business. Our Class A Common Unitholders will have no right to elect our general partner or its board of directors on an annual or other continuing basis. Our general partner may not be removed unless that removal is for cause and is approved by the vote of the holders of not less than 66 2/3% of the outstanding Class A Common Units and Class B Common Units, including any Class A Common Units and Class B Common Units owned by our general partner, its members and their respective affiliates, voting together as a single class, and we receive an opinion of counsel regarding limited liability matters. Immediately upon consummation of this offering, our general partner, our Sponsors and Yorktown will own an aggregate of approximately 58.3% of our Class A Common Units and Class B Common Units, which would vote together as a single class (excluding any Class A Common Units purchased by our directors, executive officers and other designated persons under our directed unit program), and, therefore, will be able to prevent the removal of our general partner. Please read “The Partnership Agreement—Limited Voting Rights.” |
Limited call right | If at any time our general partner and its affiliates own more than 90% of our then-issued and outstanding limited partner interests, our general partner will have the right, but not the obligation, which it may assign to any of its affiliates or to us, to acquire all, but not less than all, of the Class A Common Units held by unaffiliated persons at a price that is not less than the greater of their then-current market price, as calculated pursuant to the terms of our partnership agreement, and the highest price paid by our general partner or any of its affiliates for Class A Common Units during the 90 day period preceding the date that our general partner notifies the Class A Common Unitholders of its notice of election to exercise the call right. Immediately upon consummation of this offering, affiliates of Yorktown (including our general partner and our Sponsors) will own an aggregate of approximately 4.8% of our outstanding Class A Common Units (or 58.3% of our outstanding Class A Common Units on an as-converted basis as a result of their ownership of Class B Common Units) (excluding any Class A Common Units purchased by our directors, executive officers and other designated persons under our directed unit program). Please read “The Partnership Agreement—Limited Call Right.” |
Election to be treated as a corporation | The Partnership has made an election to be treated as an entity taxable as a corporation for U.S. federal income tax purposes effective as of its formation date. |
Eligible Holders and redemption | Class A Common Units held by persons who our general partner determines are not Eligible Holders will be subject to redemption. As used herein, an “Eligible Holder” means any person or entity qualified to hold an interest in oil and natural gas leases on U.S. federal lands. |
24
Table of Contents
We have the right (which we may assign to any of our affiliates), but not the obligation, to redeem all of the Class A Common Units of any holder that is not an Eligible Holder or that has failed to certify or has falsely certified that such holder is an Eligible Holder. The purchase price for such redemption would be equal to the then-current market price of the Class A Common Units. The redemption price will be paid in cash or by delivery of a promissory note, as determined by our general partner. Please read “Description of Our Securities—Transfer of Class A Common Units” and “The Partnership Agreement—Non-Citizen Unitholders; Redemption.” |
Directed Unit Program | At our request, the underwriters have reserved for sale, at the initial public offering price, up to 10% of the Class A Common Units offered hereby for our directors, executive officers and other designated persons. We do not know if these persons will choose to purchase all or any portion of these reserved Class A Common Units, but any purchases they do make will reduce the number of Class A Common Units available to the general public. Please read “Underwriting—Directed Unit Program” for more information. |
Material tax consequences | For a discussion of material federal income tax consequences that may be relevant to prospective unitholders, please read “Material U.S. Federal Income Tax Consequences.” |
Listing and trading symbol(s) | We have applied to list our Class A Common Units on the NYSE American under the symbol “PRB.” We will not consummate this offering unless our Class A Common Units are approved for listing on the NYSE American. |
Summary Predecessor Combined Historical and Pro Forma Financial and Operating Data
The summary predecessor combined historical consolidated financial data set forth below as of and for each of the years ended December 31, 2023 and 2022 have been derived from our audited consolidated financial statements included elsewhere in this prospectus. The summary predecessor combined historical consolidated financial data set forth below as of June 30, 2024 and for the six months ended June 30, 2024 and 2023 are derived from our unaudited condensed consolidated financial statements included elsewhere in this prospectus.
The summary unaudited pro forma financial data as of June 30, 2024 and for the six months ended June 30, 2024 and for the year ended December 31, 2023 are derived from the unaudited pro forma condensed financial statements of Peak Resources LP included elsewhere in this prospectus. Our unaudited pro forma condensed financial statements give pro forma effect to the following:
• | the Reorganization Transactions as described in “Prospectus Summary—Reorganization Transactions, Partnership Structure and Expected Refinancing Transaction” elsewhere in this prospectus summary; and |
• | the issuance and sale by us to the public of 4,700,000 Class A Common Units in this offering and the application of the net proceeds of the offering as described in “Use of Proceeds.” |
The summary unaudited pro forma financial data were prepared as if the items listed above occurred on January 1, 2023, in the case of statement of operations data, or June 30, 2024, as applicable, in the case of balance sheet data. The unaudited pro forma historical financial data is presented for illustrative purposes only and are not necessarily indicative of the financial position that would have existed or the financial results that
25
Table of Contents
would have occurred if this offering and the Reorganization Transactions had been consummated on the dates indicated, nor are they necessarily indicative of the financial position or results of our operations in the future. The pro forma adjustments, as described in the notes to the unaudited pro forma condensed combined financial statements, are preliminary and based upon currently available information and certain assumptions that our management believes are reasonable. The summary historical consolidated financial data is qualified in its entirety by, and should be read in conjunction with, the “Management’s Discussion and Analysis of Financial Condition and Results of Operations” section included in this prospectus and the consolidated financial statements and related notes and other financial information included in this prospectus. Among other things, those historical financial statements and unaudited pro forma condensed financial statements include more detailed information regarding the basis of presentation for the following information. Historical results are not necessarily indicative of results that may be expected for any future period.
You should read the following table in conjunction with “Use of Proceeds,” “Management’s Discussion and Analysis of Financial Condition and Results of Operations,” our historical combined financial statements and our unaudited pro forma condensed combined financial statements and the notes thereto included elsewhere in this prospectus. Among other things, those historical financial statements and unaudited pro forma condensed combined financial statements include more detailed information regarding the basis of presentation for the following information.
26
Table of Contents
The following table presents non-GAAP financial measures, Adjusted EBITDAX and Distributable Cash from Operations, which we use in evaluating the financial performance of our business. These measures are not calculated or presented in accordance with generally accepted accounting principles, or GAAP. We explain these measures below and reconcile them to the most directly comparable financial measures calculated and presented in accordance with GAAP.
Predecessor Combined Historical | Pro Forma | |||||||||||||||||||||||
Six Months Ended June 30, | Year Ended December 31, | Six Months Ended June 30, 2024 | Year Ended December 31, 2023 | |||||||||||||||||||||
(in thousands, except per unit amounts) | 2024 | 2023 | 2023 | 2022 | ||||||||||||||||||||
Statement of operations information: | ||||||||||||||||||||||||
Revenue: | ||||||||||||||||||||||||
Oil and natural gas sales, net | $ | 24,529 | $ | 27,960 | $ | 54,133 | $ | 94,646 | $ | 24,529 | $ | 54,133 | ||||||||||||
|
|
|
|
|
|
|
|
|
|
|
| |||||||||||||
Total revenue, net | 24,529 | 27,960 | 54,133 | 94,646 | 24,529 | 54,133 | ||||||||||||||||||
|
|
|
|
|
|
|
|
|
|
|
| |||||||||||||
Operating Expenses: | ||||||||||||||||||||||||
Lease operating | 6,397 | 6,839 | 13,949 | 14,164 | 6,397 | 13,949 | ||||||||||||||||||
Production and ad valorem taxes | 3,266 | 4,043 | 7,508 | 11,393 | 3,266 | 7,508 | ||||||||||||||||||
Depletion, depreciation and amortization | 7,163 | 13,275 | 28,801 | 30,917 | 7,163 | 28,801 | ||||||||||||||||||
Accretion | 116 | 113 | 227 | 224 | 116 | 227 | ||||||||||||||||||
Abandonment | 1,973 | 2,896 | 2,932 | 1,143 | 1,973 | 2,932 | ||||||||||||||||||
Impairment of oil and natural gas properties(1) | — | — | 111,871 | — | — | 111,871 | ||||||||||||||||||
General and administrative | 4,486 | 4,070 | 7,830 | 7,352 | 4,486 | 8,430 | ||||||||||||||||||
|
|
|
|
|
|
|
|
|
|
|
| |||||||||||||
Total operating expenses | 23,401 | 31,236 | 173,118 | 65,193 | 23,401 | 173,718 | ||||||||||||||||||
|
|
|
|
|
|
|
|
|
|
|
| |||||||||||||
Income (loss) from operations | 1,128 | (3,276 | ) | (118,985 | ) | 29,453 | 1,128 | (119,585 | ) | |||||||||||||||
|
|
|
|
|
|
|
|
|
|
|
| |||||||||||||
Other Income (Expense): | ||||||||||||||||||||||||
Gain (loss) on commodity derivatives | (6,992 | ) | 3,573 | 1,604 | (27,271 | ) | (6,992 | ) | 1,604 | |||||||||||||||
Interest expense, net | (4,330 | ) | (4,193 | ) | (8,867 | ) | (4,913 | ) | (794 | ) | (1,591 | ) | ||||||||||||
Loss from retirement of long-term debt | — | (1,089 | ) | (1,080 | ) | — | — | (1,080 | ) | |||||||||||||||
Investment income(2) | — | — | — | — | 2,304 | 9,675 | ||||||||||||||||||
Gain (loss) on sale of assets | (23 | ) | 1,203 | 1,240 | 7 | (23 | ) | 1,240 | ||||||||||||||||
Other gain (loss) | 90 | 1,293 | 1,652 | (862 | ) | 90 | 1,652 | |||||||||||||||||
|
|
|
|
|
|
|
|
|
|
|
| |||||||||||||
Total other income (expense) | (11,255 | ) | 787 | (5,451 | ) | (33,039 | ) | (5,415 | ) | 11,500 | ||||||||||||||
|
|
|
|
|
|
|
|
|
|
|
| |||||||||||||
Net income (loss) before income taxes | (10,127 | ) | (2,489 | ) | (124,436 | ) | (3,586 | ) | (4,287 | ) | (108,085 | ) | ||||||||||||
Income tax benefit (provision) | — | — | — | — | 900 | 22,698 | ||||||||||||||||||
|
|
|
|
|
|
|
|
|
|
|
| |||||||||||||
Net Loss | $ | (10,127 | ) | $ | (2,489 | ) | $ | (124,436 | ) | $ | (3,586 | ) | $ | (3,387 | ) | $ | (85,387 | ) | ||||||
|
|
|
|
|
|
|
|
|
|
|
| |||||||||||||
Pro forma information: | ||||||||||||||||||||||||
Pro forma net loss(3) | $ | (10,127 | ) | $ | (2,489 | ) | $ | (124,436 | ) | $ | (3,586 | ) | $ | (3,387 | ) | $ | (85,387 | ) | ||||||
Pro forma net loss per Class A Common Unit | ||||||||||||||||||||||||
Basic | $ | (0.23 | ) | $ | (5.87 | ) | ||||||||||||||||||
|
|
|
| |||||||||||||||||||||
Diluted | $ | (0.23 | ) | $ | (5.87 | ) | ||||||||||||||||||
|
|
|
|
27
Table of Contents
Predecessor Combined Historical | Pro Forma | |||||||||||||||||||||||
Six Months Ended June 30, | Year Ended December 31, | Six Months Ended June 30, 2024 | Year Ended December 31, 2023 | |||||||||||||||||||||
(in thousands, except per unit amounts) | 2024 | 2023 | 2023 | 2022 | ||||||||||||||||||||
Pro forma net loss per Class B Common Unit | ||||||||||||||||||||||||
Basic | $ | (0.23 | ) | $ | (5.87 | ) | ||||||||||||||||||
|
|
|
| |||||||||||||||||||||
Diluted | $ | (0.23 | ) | $ | (5.87 | ) | ||||||||||||||||||
|
|
|
| |||||||||||||||||||||
Pro forma weighted-average number of Class A Common Units | ||||||||||||||||||||||||
Basic | 4,939,065 | 4,939,065 | ||||||||||||||||||||||
|
|
|
| |||||||||||||||||||||
Diluted | 4,939,065 | 4,939,065 | ||||||||||||||||||||||
|
|
|
| |||||||||||||||||||||
Pro forma weighted-average number of Class B Common Units | ||||||||||||||||||||||||
Basic | 9,608,805 | 9,608,805 | ||||||||||||||||||||||
|
|
|
| |||||||||||||||||||||
Diluted | 9,608,805 | 9,608,805 | ||||||||||||||||||||||
|
|
|
| |||||||||||||||||||||
Balance sheet information (end of period): | ||||||||||||||||||||||||
Cash and cash equivalents | $ | 9,170 | $ | 10,468 | $ | 15,439 | $ | 6,561 | $ | 25,904 | ||||||||||||||
Total oil and natural gas properties | $ | 187,397 | $ | 312,704 | $ | 194,658 | $ | 317,774 | $ | 187,397 | ||||||||||||||
Total assets | $ | 213,454 | $ | 345,368 | $ | 233,985 | $ | 346,926 | $ | 248,520 | ||||||||||||||
Long-term debt | $ | 48,610 | $ | 53,957 | $ | 49,765 | $ | 52,000 | $ | — | ||||||||||||||
Total liabilities | $ | 93,023 | $ | 92,863 | $ | 103,427 | $ | 91,932 | $ | 69,294 | ||||||||||||||
Total members’ equity | $ | 120,431 | $ | 252,505 | $ | 130,558 | $ | 254,994 | $ | 179,226 | ||||||||||||||
Net cash provided by (used by): | ||||||||||||||||||||||||
Operating activities | $ | (2,391 | ) | $ | 4,684 | $ | 14,093 | $ | 20,829 | |||||||||||||||
Investing activities | $ | (2,248 | ) | $ | (7,733 | ) | $ | (9,099 | ) | $ | (15,278 | ) | ||||||||||||
Financing activities | $ | (1,630 | ) | $ | 6,956 | $ | 3,884 | $ | (19,408 | ) | ||||||||||||||
Other financial information: | ||||||||||||||||||||||||
Adjusted EBITDAX(4) | $ | 10,211 | $ | 13,145 | $ | 24,076 | $ | 29,708 | $ | 10,211 | $ | 33,151 | ||||||||||||
Distributable Cash from Operations(5) | $ | 2,744 | $ | (384 | ) | $ | 4,258 | $ | 11,119 | $ | 4,004 | $ | 21,179 |
(1) | Impairment for the year ended December 31, 2023 and the six months ended June 30, 2024 was primarily due to a decrease in the value of proved oil and natural gas reserves as a result of lower oil and natural gas prices at December 31, 2023 and June 30, 2024, respectively, as well as SEC guidelines on development pace. For the year ended December 31, 2023, oil and natural gas prices calculated in accordance with SEC guidelines decreased by 16.5% and 58.5%, respectively, as compared to the year ended December 31, 2022. |
(2) | Adjustment to reflect distributions received from PSI representing a return on investment during the six months ended June 30, 2024 and the year ended December 31, 2023. |
(3) | Pro forma net loss reflects a pro forma income tax benefit of $0.9 million for the six months ended June 30, 2024 and $22.7 million for the year ended December 31, 2023, respectively, all of which is associated with the income tax effects of the corporate reorganization described under “Prospectus Summary—Reorganization Transactions, Partnership Structure and Expected Refinancing Transaction” and this offering. Our predecessor was not subject to U.S. federal income tax at an entity level. As a result, the consolidated net loss |
28
Table of Contents
in our historical financial statements does not reflect the tax expense or benefit we would have incurred if we were subject to U.S. federal income tax at an entity level during such periods. |
(4) | Adjusted EBITDAX is not a financial measure calculated in accordance with U.S. generally accepted accounting principles (“GAAP”), but we believe it provides important perspective regarding our operating results. “—Non-GAAP Financial Measures” below contains a description of Adjusted EBITDAX and a reconciliation to our net income, our most directly comparable financial measure calculated in accordance with GAAP. |
(5) | Distributable Cash from Operations is not a financial measure calculated in accordance with GAAP, but we believe it provides important perspective regarding our ability to internally fund our exploration and development activities, pay distributions and to service or incur additional debt. “—Non-GAAP Financial Measures” below contains a description of Distributable Cash from Operations and a reconciliation to net income (loss), our most directly comparable financial measure calculated in accordance with GAAP. |
Adjusted EBITDAX
We include in this prospectus the non-GAAP financial measure Adjusted EBITDAX and provide our calculation of Adjusted EBITDAX and a reconciliation of Adjusted EBITDAX to net income (loss), our most directly comparable financial measure calculated and presented in accordance with GAAP. We define Adjusted EBITDAX as net income (loss) before (1) interest expense, net of interest income, (2) income tax provision, (3) depreciation, depletion and amortization, (4) impairment expenses, (5) accretion of discount on asset retirement obligations, (6) exploration expenses, (7) unrealized (gains) losses on commodity derivative contracts, (8) non-cash incentive compensation, (9) non-cash (gain) loss on investment in PSI, (10) abandonment expenses, and (11) certain other non-cash expenses.
We believe Adjusted EBITDAX is useful because it allows us to more effectively evaluate our operating performance and compare the results of our operations from period to period without regard to our financing methods or capital structure. We exclude the items listed above from net income (loss) in arriving at Adjusted EBITDAX because these amounts can vary substantially from company to company within our industry depending upon accounting methods and book values of assets, capital structures and the method by which the assets were acquired. Adjusted EBITDAX should not be considered as an alternative to, or more meaningful than, net income (loss) as determined in accordance with GAAP or as an indicator of our operating performance. Certain items excluded from Adjusted EBITDAX are significant components in understanding and assessing a company’s financial performance, such as a company’s cost of capital, hedging strategy and tax structure, as well as the historic costs of depreciable assets, none of which are components of Adjusted EBITDAX. Our computations of Adjusted EBITDAX may not be comparable to other similarly titled measures of other companies.
Distributable Cash from Operations
Distributable Cash from Operations is not a measure of net income (loss), our most directly comparable financial measure, calculated and presented in accordance with GAAP. Distributable Cash from Operations is a supplemental non-GAAP financial measure used by our management and by external users of our financial statements, such as investors, lenders and others (including industry analysts and rating agencies who will be using such measure), to assess our ability to internally fund our exploration and development activities, pay distributions and to service or incur additional debt. We define Distributable Cash from Operations as Adjusted EBITDAX, including dividends, less (1) cash interest expense, net of interest income, (2) development costs net of divestiture proceeds, (3) acquisition costs, (4) cash income tax payments, (5) reimbursements of expenses and payment of fees to our general partner and its affiliates and (6) certain other cash expenses (“Distributable Cash from Operations”). Development costs include all of our expansion capital expenditures made for oil and natural gas properties, other than acquisitions, as well as maintenance capital expenditures, net of any proceeds from divestitures. Distributable Cash from Operations will not reflect changes in working capital balances.
29
Table of Contents
Distributable Cash from Operations is not a measurement of our financial performance or liquidity under GAAP and should not be considered as an alternative to, or more meaningful than, net income (loss) as determined in accordance with GAAP or as indicators of our financial performance and liquidity. The GAAP measure most directly comparable to Distributable Cash from Operations is net income (loss). Distributable Cash from Operations should not be considered as an alternative to, or more meaningful than, net income (loss).
Available Cash will include Distributable Cash from Operations plus net proceeds of this offering to the extent not designated as a reserve for general partnership purposes, including in order to pay distributions on our Class A Common Units, if needed, and payment of indebtedness.
Reconciliations of Adjusted EBITDAX and Distributable Cash from Operations to GAAP Financial Measures
The following table presents our reconciliation of the non-GAAP financial measures Adjusted EBITDAX and Distributable Cash from Operations to the GAAP financial measure of net income (loss) for each of the periods indicated.
Predecessor Combined Historical | Pro Forma | |||||||||||||||||||||||
Six Months Ended June 30, | Year Ended December 31, | Six Months Ended June 30, 2024 | Year Ended December 31, 2023 | |||||||||||||||||||||
(in thousands) | 2024 | 2023 | 2023 | 2022 | ||||||||||||||||||||
Net loss | $ | (10,127 | ) | $ | (2,489 | ) | $ | (124,436 | ) | $ | (3,586 | ) | $ | (3,387 | ) | $ | (85,387 | ) | ||||||
Interest expense, net of interest income | 4,330 | 4,193 | 8,867 | 4,913 | 794 | 1,591 | ||||||||||||||||||
Income tax provision (benefit) | — | — | — | — | (900 | ) | (22,698 | ) | ||||||||||||||||
Depreciation, depletion and amortization |
| 7,163 |
|
| 13,275 |
| 28,801 | 30,917 | 7,163 | 28,801 | ||||||||||||||
Impairment of oil and natural gas properties | — | — | 111,871 | — | — | 111,871 | ||||||||||||||||||
Accretion | 116 | 113 | 227 | 224 | 116 | 227 | ||||||||||||||||||
Exploration expenses | — | — | — | — | — | — | ||||||||||||||||||
Non-cash gain (loss) on commodity derivatives |
| 6,756 |
|
| (5,932 | ) | (5,266 | ) | (3,903 | ) | 6,756 | (5,266 | ) | |||||||||||
Non-cash incentive compensation expenses |
| — |
|
| — |
| — | — | — | — | ||||||||||||||
Non-cash (gain) loss on extinguishment of debt |
| — |
| | 1,089 | | 1,080 | — | — | 1,080 | ||||||||||||||
Non-cash (gain) loss on investment in PSI |
| — |
|
| — |
| — | — | (2,304 | ) | — | |||||||||||||
Abandonment | 1,973 | 2,896 | 2,932 | 1,143 | 1,973 | 2,932 | ||||||||||||||||||
Other | — | — | — | — | — | — | ||||||||||||||||||
|
|
|
|
|
|
|
|
|
|
|
| |||||||||||||
Adjusted EBITDAX | $ | 10,211 | $ | 13,145 | $ | 24,076 | $ | 29,708 | $ | 10,211 | $ | 33,151 | ||||||||||||
Cash interest expense, net of interest income | (1,988 | ) | (4,474 | ) | (9,306 | ) | (2,875 | ) | (728 | ) | (1,460 | ) | ||||||||||||
Maintenance capital expenditures(1) | — | — | (349 | ) | — | — | (349 | ) | ||||||||||||||||
Expansion capital expenditures(1) | (5,479 | ) | (9,055 | ) | (10,163 | ) | (15,714 | ) | (5,479 | ) | (10,163 | ) | ||||||||||||
Acquisition costs | — | — | — | — | — | — | ||||||||||||||||||
Cash income tax payments | — | — | — | — | — | — | ||||||||||||||||||
Reimbursement of general partner expenses | — | — | — | — | — | — | ||||||||||||||||||
Other | — | — | — | — | — | — | ||||||||||||||||||
|
|
|
|
|
|
|
|
|
|
|
| |||||||||||||
Distributable Cash from Operations | $ | 2,744 | $ | (384 | ) | $ | 4,258 | $ | 11,119 | $ | 4,004 | $ | 21,179 | |||||||||||
|
|
|
|
|
|
|
|
|
|
|
|
(1) | Maintenance capital expenditures are those capital expenditures required to maintain, over the long-term, the operating capacity of, or the revenue generated by, our capital assets and are incurred as an oil or gas property is |
30
Table of Contents
impacted by an unforeseen condition impacting its expected production. Natural declines in production that occur through the life of an oil or gas property will not be directly affected by incurring maintenance capital expenditures. Expansion capital expenditures are those capital expenditures that increase the operating capacity of, or the revenue generated by, our capital assets. |
Reconciliation of PV-10 to Standardized Measure
PV-10 represents the present value of estimated future cash inflows from oil and gas reserves, less future development and production costs, discounted at 10% per annum to reflect the timing of future cash flows. PV-10 is a financial measure not prepared in accordance with GAAP that generally differs from a measure under GAAP known as the standardized measure of discounted future net cash flows (“Standardized Measure”) in that PV-10 is calculated without consideration of future income taxes on future net revenues. Additionally, the calculation of PV-10 does not give effect to derivatives transactions. We believe the presentation of the PV-10 value of our oil and natural gas properties is relevant and useful to investors because it presents the estimated discounted future net cash flows attributable to our estimated reserves independent of our income tax attributes, thereby isolating the intrinsic value of the estimated future cash flows attributable to our reserves. We believe the use of a pretax measure provides greater comparability of assets when evaluating companies because the timing and quantification of future income taxes is dependent on company-specific factors, many of which are difficult to determine. For these reasons, we use and believe the industry generally uses the PV-10 as a measure to compare the relative size and value of reserves held by companies without regard to the specific tax characteristics of such entities. PV-10 does not necessarily represent the fair market value of oil and natural gas properties. PV-10 is not a measure of financial or operational performance under GAAP, nor should it be considered in isolation or as a substitute for Standardized Measure as defined under GAAP.
Due to the absence of income taxes in our calculations of Standardized Measure, our PV-10 has historically been computed on the same basis as our Standardized Measure, the most comparable measure under GAAP; however, as a result of this offering and the election of Peak Resources LP to be taxed as a corporation, our future presentations of PV-10 may require a reconciliation to Standardized Measure because our Standardized Measure for future periods will include the effects of income taxes.
Investors should be cautioned that neither PV-10 nor Standardized Measure of proved reserves represents an estimate of the fair market value of our proved reserves. We and others in the industry use PV-10 as a measure to compare the relative size and value of estimated reserves held by companies without regard to the specific tax characteristics of such entities.
Summary Reserve, Production and Operating Data
Summary Reserve Data
The following table summarizes our estimated net oil and natural gas reserves as of December 31, 2023 and December 31, 2022. Estimates as of December 31, 2023 are based on a report prepared by Cawley Gillespie for Peak Resources LP and filed as Exhibit 99.1 to the registration statement of which this prospectus forms a part. Estimates as of December 31, 2022 represent a summation of the reports prepared by Cawley Gillespie for Peak E&P and PBLM and filed as Exhibits 99.4 and 99.5, respectively, to the registration statement of which this prospectus forms a part. Our reserves are reported in two streams: oil and natural gas. The economic value of the NGLs is included in our natural gas price and reserves. All of these reserve estimates were prepared in accordance with the SEC’s rule regarding reserve reporting currently in effect. Please read “Management’s
31
Table of Contents
Discussion and Analysis of Financial Condition and Results of Operations” and “Business and Properties—Oil and Natural Gas Data—Reserves” in evaluating the material presented below.
As of December 31, 2023(1)(2) | As of December 31, 2022(3) | |||||||
Proved Reserves: | ||||||||
Oil (MBbls) | 9,515 | 7,411 | ||||||
Natural Gas (MMcf) | 40,392 | 36,548 | ||||||
|
|
|
| |||||
Total Proved Reserves (Mboe) | 16,247 | 13,502 | ||||||
Proved Developed Reserves: | ||||||||
Oil (MBbls) | 4,579 | 5,700 | ||||||
Natural Gas (MMcf) | 21,327 | 23,875 | ||||||
|
|
|
| |||||
Total Proved Developed Reserves (Mboe) | 8,134 | 9,679 | ||||||
Proved Undeveloped Reserves: | ||||||||
Oil (MBbls) | 4,936 | 1,711 | ||||||
Natural Gas (MMcf) | 19,065 | 12,673 | ||||||
|
|
|
| |||||
Total Proved Undeveloped Reserves (Mboe) | 8,114 | 3,823 |
(1) | Our estimated net proved reserves were determined using average first-day-of-the-month prices for the prior 12 months in accordance with SEC guidance. For oil volumes, the average WTI posted price of $78.22 per barrel as of December 31, 2023, was adjusted for oil and gas differentials, which may include local basis differentials, transportation, gas shrinkage, and gas heating value (BTU content) and/or crude quality and gravity corrections. For natural gas volumes, the average Henry Hub spot price of $2.637 per MMBtu as of December 31, 2023, was similarly adjusted for oil and gas differentials, which may include local basis differentials, transportation, gas shrinkage, and gas heating value (BTU content) and/or crude quality and gravity corrections. All prices are held constant throughout the lives of the properties. |
(2) | The development plan associated with our 2023 proved reserves includes the use of cash flow from operations as well as a portion of the estimated net proceeds from this offering. |
(3) | Our estimated net proved reserves were determined using average first-day-of-the-month prices for the prior 12 months in accordance with SEC guidance. For oil volumes, the average WTI posted price of $93.67 per barrel as of December 31, 2022, was adjusted for oil and gas differentials, which may include local basis differentials, transportation, gas shrinkage, and gas heating value (BTU content) and/or crude quality and gravity corrections. For natural gas volumes, the average Henry Hub spot price of $6.358 per MMBtu as of December 31, 2022, was similarly adjusted for oil and gas differentials, which may include local basis differentials, transportation, gas shrinkage, and gas heating value (BTU content) and/or crude quality and gravity corrections. All prices are held constant throughout the lives of the properties. |
The following table summarizes the PV-10 of our proved reserves as of December 31, 2023. For more information on how we calculate PV-10 and reconcile PV-10 to Standardized Measure, its nearest GAAP measure, see “—Non-GAAP Financial Measures—Reconciliation of PV-10 to Standardized Measure.”
PV-10 as of December 31, 2023 ($ in thousands) | ||||
Total Proved Reserves | $ | 186,486 | ||
|
| |||
Proved Developed Reserves | $ | 112,667 | ||
Proved Undeveloped Reserves | $ | 73,819 |
32
Table of Contents
Selected Production and Operating Statistics
Predecessor Combined Historical | ||||||||||||
Six Months Ended June 30, | Year Ended December 31, | |||||||||||
2024 | 2023 | 2022 | ||||||||||
Summary Historical Operating Data: | ||||||||||||
Production and Operating Data: | ||||||||||||
Net production volumes: | ||||||||||||
Oil (MBbls) | 288 | 625 | 809 | |||||||||
Natural gas (MMcf) | 1,269 | 2,705 | 2,982 | |||||||||
Total (Mboe) | 500 | 1,076 | 1,306 | |||||||||
Average net production (Boe/d) | 2,745 | 2,947 | 3,578 | |||||||||
Average sales prices(1): | ||||||||||||
Oil sales (per Bbl) | $ | 76.50 | $ | 76.04 | $ | 93.27 | ||||||
Oil sales with derivative settlements (per Bbl) | $ | 72.18 | $ | 70.12 | $ | 66.06 | ||||||
Natural gas (per Mcf) | $ | 1.98 | $ | 2.45 | $ | 6.44 | ||||||
Natural gas sales with derivative settlements (per Mcf) | $ | 2.76 | $ | 2.46 | $ | 3.37 | ||||||
Average price per Boe | $ | 49.10 | $ | 50.33 | $ | 72.48 | ||||||
Average price per Boe with derivative settlements | $ | 48.63 | $ | 46.92 | $ | 48.61 | ||||||
Average unit costs per Boe: | ||||||||||||
Lease operating | $ | 12.80 | $ | 12.97 | $ | 10.85 | ||||||
Production and ad valorem taxes | $ | 6.54 | $ | 6.98 | $ | 8.72 | ||||||
Depletion, depreciation and amortization | $ | 14.34 | $ | 26.78 | $ | 23.68 | ||||||
Accretion | $ | 0.23 | $ | 0.21 | $ | 0.17 | ||||||
Abandonment | $ | 3.95 | $ | 2.73 | $ | 0.88 | ||||||
Impairment of oil and natural gas properties | — | $ | 104.00 | — | ||||||||
General and administrative | $ | 8.98 | $ | 7.28 | $ | 5.63 |
(1) | Average sales prices shown in the table reflect prices both before and after the effects of our realized commodity hedging transactions. Our calculation of such effects includes both realized gains or losses on cash settlements for commodity derivative transactions and premiums paid or received on options, if any, that settled during the period. |
Selected Projected Financial and Production Information
The following table sets forth projected production of the Company’s oil and natural gas reserves based on the projected drilling schedule presented herein:
Projected Average Daily Production (1) | ||||||||||||||||
Year Ending December 31, | ||||||||||||||||
2024 (Estimated) | 2025 (Estimated) | 2026 (Estimated) | 2027 (Estimated) | |||||||||||||
Average daily oil production (Bbl/d) | 1,508 | 2,814 | 4,410 | 4,724 | ||||||||||||
Average daily natural gas production (Mcf/d) | 7,306 | 11,484 | 12,021 | 13,226 | ||||||||||||
|
|
|
|
|
|
|
| |||||||||
Total average daily production (Boe/d) | 2,726 | 4,728 | 6,413 | 6,929 | ||||||||||||
|
|
|
|
|
|
|
|
33
Table of Contents
(1) | Represents timing for production when revenue is actually paid to the Company. Well production estimates are based on type curves for the current development plan, which uses a portion of the proceeds from the offering. |
Based on the projected production information set forth above, the following table sets forth our projected revenue, PSI dividends declared, projected PSI dividends and estimated Adjusted EBITDAX for the periods presented:
Twelve Months Ending December 31, | ||||||||
(in thousands) | 2024 (Estimated) | 2025 (Estimated) | ||||||
Projected revenue | $ | 48,486 | $ | 88,232 | ||||
PSI dividend paid | $ | 2,304 | $ | — | ||||
Projected PSI dividend(1) | $ | 6,440 | $ | 6,440 | ||||
Estimated Adjusted EBITDAX(2) | $ | 26,464 | $ | 56,749 |
(1) | Projected PSI dividend for the year ending December 31, 2024 includes PSI dividend of $2.3 million to the Company. |
(2) | The following table presents our reconciliation of the non-GAAP financial measure of estimated Adjusted EBITDAX for the periods indicated. We do not forecast certain estimated non-cash items as components of our estimated Adjusted EBITDAX calculation because they cannot be accurately estimated due to the uncertainty regarding timing and estimates of such items. Forecasted depreciation, depletion and amortization is calculated using 2023 depletion rates multiplied by estimated production for each applicable period. Additionally, estimated Adjusted EBITDAX includes historically paid or estimated PSI dividends to be paid. |
Forecasted | ||||||||
Twelve Months Ending December 31, | ||||||||
(in thousands) | 2024 (Estimated) | 2025 (Estimated) | ||||||
Projected net income (loss) | $ | (576 | ) | $ | 12,280 | |||
Interest expense, net of interest income | 6,353 | 1,208 | ||||||
Income tax provision (benefit) | (153 | ) | 3,264 | |||||
Depreciation, depletion and amortization | 18,634 | 39,745 | ||||||
Impairment of oil and natural gas properties | — | — | ||||||
Accretion | 233 | 252 | ||||||
Exploration expenses | — | — | ||||||
Non-cash gain (loss) on commodity derivatives | — | — | ||||||
Non-cash incentive compensation expenses | — | — | ||||||
Non-cash (gain) loss on extinguishment of debt | — | — | ||||||
Non-cash (gain) loss on investment in PSI | — | — | ||||||
Abandonment | 1,973 | — | ||||||
Other (gain) loss | — | — | ||||||
Estimated Adjusted EBITDAX | $ | 26,464 | $ | 56,749 |
34
Table of Contents
Investing in our Class A Common Units involves a high degree of risk. You should carefully consider the risks described below with all of the other information included in this prospectus before deciding to invest in our Class A Common Units. Limited partner interests are inherently different from the capital stock of a corporation, although many of the business risks to which we are subject are similar to those that would be faced by a corporation engaged in a similar business. Additionally, new risks may emerge at any time, and we cannot predict those risks or estimate the extent to which they may affect our financial performance.
If any of the following risks actually occur, our business, financial condition or results of operations could be materially adversely affected. In that case, we might not be able to pay distributions on our Class A Common Units, the trading price of our Class A Common Units could decline and our unitholders could lose all or part of their investment.
Risks Related to Cash Distributions on our Class A Common Units
Cash distributions may fluctuate with our performance, and we may not have sufficient cash available to pay any quarterly distribution on our Class A Common Units.
We may not have sufficient cash available each quarter to pay distributions on our Class A Common Units. Our partnership agreement requires us to distribute all of our Available Cash each quarter. We define “Available Cash” as our cash on hand at the end of each quarter, plus certain distributions or dividends received after the end of the quarter, plus certain working capital borrowings and proceeds from this offering if determined by our general partner, less cash reserves established by our general partner, including for the proper conduct of our business, such as for capital expenditures, acquisitions, debt service, compliance with law and loan agreements and future distributions. As a result, to the extent there is no Available Cash, our partnership agreement does not require us to pay distributions on our Class A Common Units on a quarterly basis or otherwise. The amount of Available Cash that we distribute to our Class A Common Unitholders will depend principally on the cash we generate from operations, which will depend on, among other factors:
• | the amount of oil and natural gas we produce; |
• | the prices at which we sell our oil and natural gas production; |
• | the amount and timing of settlements on our commodity derivative contracts; |
• | the level of our capital expenditures, including scheduled and unexpected maintenance expenditures; |
• | the level of our operating costs, including payments to our general partner and its affiliates for general and administrative expenses; |
• | the amount of cash dividends we receive from our investment in PSI; |
• | the restrictive covenants in our Existing Credit Agreement, and the New Credit Facility, if applicable, and other agreements governing indebtedness that limit our ability to pay dividends or distributions in respect of our equity; |
• | the cost of acquisitions, if any; |
• | fluctuations in our and our subsidiaries’ working capital needs; |
• | our debt service requirements and the level of our interest expenses, which will depend on the amount of our outstanding indebtedness and the applicable interest rate; and |
• | the amount of cash reserves established by our general partner in its discretion for the proper conduct of our business. |
Because of all these factors, we cannot guarantee that in the future we will be able to pay distributions or that any distributions we do make will be at or above our initial target quarterly distribution. The actual amount
35
Table of Contents
of cash that is available for distribution to our Class A Common Unitholders will depend on numerous factors, many of which are beyond our control or the control of our general partner. Furthermore, the amount of Available Cash for distribution also depends on our cash from financial reserves and working capital or other borrowings, and not solely on profitability, which will be affected by non-cash items. As a result, we may make distributions of Available Cash during periods when we record losses for financial accounting purposes and may not make distributions of Available Cash during periods when we record net income for financial accounting purposes. To the extent our Distributable Cash from Operations is insufficient to pay our quarterly distributions, we may use cash on hand, including proceeds from this offering, to maintain or grow our cash distributions to our Class A Common Unitholders. In addition, the issuance of additional Class A Common Units, or the conversion of Class B Common Units, may be dilutive to our Class A Common Unitholders and, as a result, distributions of Available Cash to our Class A Common Unitholders may decrease.
The assumptions underlying the forecast of Available Cash for distribution to our Class A Common Unitholders we include in “Our Cash Distribution Policy and Restrictions on Distributions” may prove inaccurate and are subject to significant risks and uncertainties that could cause actual results to differ materially from our forecasted results.
Our management’s forecast of Available Cash for distribution on our Class A Common Units set forth in “Our Cash Distribution Policy and Restrictions on Distributions” includes our forecasted results of operations, Adjusted EBITDAX and Distributable Cash from Operations for the twelve months ending June 30, 2025 and the twelve months ending December 31, 2025. The assumptions underlying the forecast may prove inaccurate and are subject to significant risks and uncertainties that could cause actual results to differ materially from those forecasted. If our actual results are significantly below forecasted results, or if our expenses are greater than forecasted, we may not be able to pay the forecasted quarterly distribution or any amount on our Class A Common Units, which may cause the market price of our Class A Common Units to decline materially.
The amount of our quarterly cash distributions from Available Cash, if any, may vary significantly both quarterly and annually and will be directly dependent on the performance of our business. We will not have a minimum quarterly distribution and could pay no distribution with respect to any particular quarter.
We cannot guarantee the payment of regular quarterly distributions. Our future business performance may be volatile, and our cash flows may be unstable. We will not have a minimum quarterly distribution. Because our quarterly distributions will significantly correlate to the cash we generate each quarter after payment of our fixed and variable expenses, future quarterly distributions paid to our Class A Common Unitholders will vary significantly from quarter to quarter and may be zero. Please read “Our Cash Distribution Policy and Restrictions on Distributions.”
Our general partner’s absolute discretion in determining the level of cash reserves may adversely affect our ability to make cash distributions to Class A Common Unitholders.
Our partnership agreement allows our general partner to establish cash reserves from Available Cash that in its reasonable discretion are necessary, among other things, to fund our future capital and operating expenditures. In addition, our partnership agreement permits our general partner to reduce Available Cash by establishing cash reserves for the proper conduct of our business, to comply with applicable law or agreements to which we are a party or to provide funds for future distributions to partners. These cash reserves will affect the amount of distributions to Class A Common Unitholders.
36
Table of Contents
Risks Related to Our Business and the Oil and Natural Gas Industry
Oil and natural gas prices are volatile. A substantial or extended decrease in prices of these commodities could adversely affect our business, financial condition, results of operations, ability to meet our financial commitments, ability to make our planned capital expenditures and distributions.
Our revenues, operating results, cash flows from operations, distributions, future growth rates, and the carrying value of our oil and natural gas properties depend significantly upon the prevailing prices for oil and natural gas. Oil and natural gas prices historically have been volatile and likely will continue to be volatile in the future, especially given current world geopolitical conditions. The price volatility could affect the amount of our cash flows available for capital expenditures, the costs of conducting and maintaining operations, and our ability to borrow money or raise additional capital. The prices for oil and natural gas are subject to a variety of factors that are beyond our control. These factors include, but are not limited to:
• | worldwide and regional economic conditions impacting the supply and demand for oil and natural gas; |
• | the level of global oil and natural gas exploration and production; |
• | the ability of and actions taken by members of OPEC and other oil-producing nations in connection with their arrangements to maintain oil prices and production controls; |
• | the impact on worldwide economic activity of an epidemic, outbreak or other public health events; |
• | localized and global supply and demand fundamentals and transportation availability; |
• | weather conditions across the globe; |
• | market uncertainty due to political conditions or conflicts in oil and natural gas-producing regions, including the Middle East; |
• | technological advances affecting energy consumption and energy supply; |
• | speculative trading in commodity markets, including expectations about future commodity prices; |
• | the proximity of our oil and natural gas production to, and the availability, capacity and cost of, pipelines and other transportation and storage facilities, and other factors that result in differentials to benchmark prices; |
• | the impact of worldwide energy conservation measures, alternative fuel requirements and climate change-related legislation, policies, initiatives and developments; |
• | the price and availability of alternative fuels; |
• | the cost of exploring for, developing, producing, transporting, and marketing oil and natural gas; |
• | stockholder activism or activities by non-governmental organizations to restrict the exploration, development and production of oil and natural gas or limit sources of funding for the energy sector; |
• | domestic, local and foreign governmental laws, regulation and taxes; and |
• | overall domestic and global economic conditions. |
These and other factors and the volatility of the energy markets make it extremely difficult to predict future oil and natural gas price movements accurately. Changes in oil and natural gas prices have a significant impact on the amount of oil and natural gas that we can produce economically, the value of our reserves and on our cash flows. Any substantial or extended decline in the price of oil and natural gas will likely have a material adverse effect on our financial condition, results of operations, ability to meet our financial commitments and fund planned capital expenditures and distributions.
37
Table of Contents
Unless we replace the reserves we produce, our revenues and production will decline, which would adversely affect our cash flow from operations, results of operations and our ability to make distributions.
We may be unable to pay distributions without substantial capital expenditures that maintain and grow our asset base. Oil and natural gas production is generally characterized by declining production rates that vary depending upon reservoir characteristics and other factors. Unless we conduct successful ongoing exploitation, development and exploration activities or continually acquire properties containing reserves, our reserves will decline as those reserves are produced. Our future reserves and production and, therefore, our cash flow and ability to make distributions, are highly dependent on our success in efficiently developing, optimizing and exploiting our current reserves. Our production decline rates may be significantly higher than currently estimated if our wells do not produce as expected. Further, our decline rate may change when we make acquisitions. We may not be able to develop, find or acquire additional reserves to replace our current and future production on economically acceptable terms, which would adversely affect our business, financial condition and results of operations and distributions.
If commodity prices decline and remain depressed for a prolonged period, production from a significant portion of our properties may become uneconomic and cause downward adjustments of our reserve estimates and write downs of the value of such properties, which may adversely affect our financial condition and our ability to make distributions.
Lower commodity prices over extended periods of time may render many of our development projects uneconomic and result in a downward adjustment of our reserve estimates and also possibly cause us to shut in or plug and abandon certain wells, which would negatively impact our ability to borrow to fund our operations or make distributions. As a result, we may reduce the amount of distributions paid or cease paying distributions. In addition, a significant or sustained decline in commodity prices could hinder our ability to effectively execute our hedging strategy. For example, during a period of declining commodity prices, we may enter into commodity derivative contracts at relatively unattractive prices in order to mitigate a potential decrease in our cash flow. Furthermore, if commodity prices fall below certain levels, our production, reserves and cash flows will be adversely impacted and we may be required to record additional impairments, which could be material. While we currently have a fixed term loan under our Existing Credit Agreement, in the future we may refinance our debt into a revolving reserve-based loan, such as under the New Credit Facility, which we are in the process of negotiating. Under such a loan structure, lower oil and natural gas prices may result in a reduction in the borrowing base under, which may be determined at the discretion of the lenders.
Our identified drilling locations are scheduled out over many years, making them susceptible to uncertainties that could materially alter the occurrence or timing of their drilling.
We have specifically identified and scheduled certain drilling locations as an estimation of our future multi-year drilling activities on our existing acreage. These drilling locations represent a significant part of our growth strategy. Our ability to drill and develop these locations depends on a number of uncertainties, including oil and natural gas prices, availability and cost of capital, drilling and production costs, availability of drilling services and equipment, availability and cost of sand and other proppant used in hydraulic fracturing operations, drilling results, gathering system and pipeline transportation constraints, access to and availability of water sourcing and distribution and disposal systems, access to and availability of wastewater water disposal systems, regulatory approvals, the cooperation of other working interest owners and other factors. Because of these uncertain factors, we do not know if the drilling locations we have identified will ever be drilled or if we will be able to produce oil and natural gas from these or any other drilling locations. As such, our actual drilling activities may materially differ from those presently identified.
In addition, the leases covering our identified drilling locations will expire at the end of their respective primary terms unless production is established in paying quantities under the units that include all or a portion of the respective leases, the leases are held beyond their primary terms under continuous drilling provisions, or the
38
Table of Contents
leases, or some of them, are renewed. The cost to renew such leases may increase significantly, and we may not be able to renew such leases on commercially reasonable terms, or at all. If our leases expire and we are unable to renew the leases, we will lose our right to develop the affected properties and our actual drilling activities may differ materially from our current expectations. As such, our future oil and natural gas reserves and production, including our drilling activities, and therefore, our future cash flows and income are highly dependent on successfully developing our undeveloped leasehold acreage.
As a result of the limitations described in this prospectus, we may be unable to drill certain of our identified locations. In addition, although we plan to fund our drilling program with cash flow from operations and proceeds from this offering, if our cash flows are less than we expect or we alter our drilling plans, we may be required to issue new debt or equity securities in order to pursue the development of these locations, and we may not be able to raise or generate the capital required to do so. See “Our development projects and potential future acquisitions require substantial capital expenditures. We may be unable to obtain any required capital or financing on satisfactory terms, which could lead to a decline in our production and reserves.” Any drilling activities we are able to conduct on these locations may not be successful, may not result in production or additions to our estimated proved reserves and could result in a downward revision of our estimated proved reserves, which in turn could have a material adverse effect on our ability to raise additional capital or incur additional indebtedness.
A portion of our identified horizontal drilling locations are based on our management’s internal estimates and were not based on evaluations prepared by Cawley Gillespie.
Approximately 696 gross (176 net) of our 1,770 gross (530 net) identified horizontal drilling locations were based on our management’s internal estimates and not based on evaluations of Cawley Gillespie. While we feel that management’s internal estimates were based upon the same guidelines as used within the Cawley Gillespie evaluation, being production performance-based methods, material balance-based methods, volumetric-based methods and analogy, these locations ultimately were not audited by Cawley Gillespie. As a result, these estimates have greater uncertainty than those identified horizontal drilling locations evaluated by Cawley Gillespie.
Our development projects and potential future acquisitions require substantial capital expenditures. We may be unable to obtain any required capital or financing on satisfactory terms, which could lead to a decline in our production and reserves.
The oil and natural gas industry is capital-intensive. We make and expect to continue to make substantial capital expenditures for development drilling and completion activities. Funding sources for our capital expenditures have historically included borrowings under our Existing Credit Agreement, cash from our Existing Owners and cash flow from operating activities. A number of factors could cause our cash flow to be less than we expect, including the results of our drilling and completion program. Moreover, our capital budget is based on a number of assumptions, including expected elections by working interest partners, drilling and completion costs, midstream service costs, oil and natural gas prices, and drilling results, and are therefore subject to change. If our cash flows are less than we expect, we decide to pursue acquisitions, or we change our capital budget, we may be required to issue debt or equity securities to consummate such acquisitions or fund our drilling and completion program. The incurrence of additional indebtedness, either through the issuance of additional debt securities, refinancing the Existing Credit Agreement with the New Credit Facility, or otherwise, would require that a portion of our cash flow from operations be used for the payment of interest and principal on our indebtedness, thereby reducing our ability to use cash flow from operations to fund capital expenditures, our development plan, acquisitions and cash distributions to unitholders. Additionally, the market demand for equity issued by master limited partnerships has been significantly lower in recent years than it has been historically, which may make it more challenging for us to finance our capital expenditures with the issuance of additional equity. The issuance of additional equity securities may be dilutive to our unitholders. The actual amount and timing of our future capital expenditures may differ materially from our estimates as a result of, among other
39
Table of Contents
things: oil and natural gas prices; actual drilling results; the availability and cost of drilling rigs and labor and other services and equipment; the availability, cost and adequacy of midstream gathering, processing, compression and transportation infrastructure; and regulatory, technological and competitive developments.
Our cash flow from operations and access to capital are subject to a number of variables, including:
• | the prices at which our oil and natural gas are sold; |
• | the amount of our reserves; |
• | the volume of hydrocarbons we are able to produce from existing wells and future wells; |
• | our ability to successfully drill and complete new wells; |
• | our ability to acquire, locate and produce economically new reserves; |
• | the amount of our operating expenses; |
• | the amount of debt service; |
• | the extent and levels of our derivative activities; and |
• | our ability to access the debt and equity capital markets, obtain financing under our New Credit Facility or sell non-core assets. |
If our revenues or cash flows decrease as a result of lower commodity prices, increases in interest rates or capital expenditures, operational difficulties, declines in reserves or for any other reason we may have limited ability to obtain the capital necessary to develop our existing undeveloped properties or to make acquisitions or sustain our operations at current levels. If additional capital is needed, we may not be able to obtain debt or equity financing on terms acceptable to us, if at all. If cash flow generated by our operations is insufficient to meet our capital requirements, the failure to obtain additional financing could result in a curtailment of the development of our properties, which in turn could lead to a decline in our reserves and production and could materially and adversely affect our business, financial condition and results of operations. See “Management’s Discussion and Analysis of Financial Condition and Results of Operations—Liquidity and Capital Resources.”
Our U.S. producing properties are concentrated in the Powder River Basin, making us vulnerable to risks associated with operating in a single geographic area.
As a result of our geographic concentration in the Powder River Basin, adverse industry developments in our primary operating area could have a greater impact on our financial condition and results of operations than if our exploration and development operations were more geographically diverse. We may be disproportionately exposed to the impact of regional supply and demand factors, governmental regulations, midstream capacity constraints, availability of facilities, services market limitations or interruption of the processing or transportation of crude oil, natural gas or NGLs, and extreme weather conditions and their adverse impact on production volumes, availability of electrical power, road accessibility and transportation facilities. In addition, fluctuations of supply and demand may become more pronounced within specific geographic oil and natural gas producing areas such as the Powder River Basin, which may cause these conditions to occur with greater frequency or magnify the effects of these conditions. Due to the concentrated nature of our portfolio of properties, these fluctuations may result in a relatively greater impact on our results of operations than they might have on other companies that have a more diversified portfolio of properties. Delays or interruptions caused by such adverse developments could have a material adverse effect on our financial condition and results of operations.
Similarly, the concentration of our assets within a small number of producing formations exposes us to risks, such as changes in field wide rules, which could adversely affect development activities or production relating to those formations. In addition, in areas where exploration and production activities are increasing, as has been the case recently in our operating areas, we are subject to increasing competition for drilling rigs,
40
Table of Contents
workover rigs, tubulars and other well equipment, services, supplies as well as increased labor costs and qualified personnel, which may lead to periodic shortages or delays. The curtailments arising from these and similar circumstances may last from a few days to several months, and in many cases, we may be provided only limited, if any, notice as to when these circumstances will arise and their anticipated duration.
Demand for qualified personnel in this area, and the cost to attract and retain such personnel, has increased over the past few years and may increase substantially in the future. Moreover, our competitors, including those operating in multiple basins, may be able to offer better compensation packages to attract and retain qualified personnel than we are able to offer. Any delay or inability to secure the personnel necessary for us to continue or complete our current and planned development activities could have a negative effect on production volumes or significantly increase costs, which, in turn, could have a material adverse effect on our results of operations, liquidity and financial condition.
The unavailability, high cost or shortages of drilling rigs, fracking crews, equipment, raw materials, supplies, personnel and oilfield services could adversely affect our ability to execute our development plans within our budget and on a timely basis.
The demand for drilling rigs, frac crews, pipe and other equipment, raw materials and supplies, including source water, sand and other proppant used in hydraulic fracturing operations, as well as for qualified and experienced field personnel, geologists, geophysicists, engineers and other professionals in the oil and natural gas industry, can fluctuate significantly, often in correlation with commodity prices or drilling activity in our areas of operation and in other shale basins in the United States, causing periodic shortages of supplies and needed personnel and rapid increases in costs. Increased drilling activity could materially increase the demand for and prices of these goods and services, and we could encounter rising costs and delays in or an inability to secure the personnel, equipment, power, services, resources and facilities access necessary for us to conduct our drilling and development activities, which could result in production volumes being below our forecasted volumes. In addition, any such negative effect on production volumes, or significant increases in costs could have a material adverse effect on our cash flow and profitability.
Drilling for and producing oil and natural gas are high-risk activities with many uncertainties that could adversely affect our business, financial condition, results of operations and cash distributions.
Our future financial condition and results of operations, and therefore our ability to make cash distributions to our unitholders, will depend on the success of our acquisition, development, optimization and exploitation activities, which are subject to numerous risks beyond our control, including the risk that drilling will not result in commercially viable production.
Our decisions to purchase, develop, optimize or otherwise exploit prospects or properties will depend in part on the evaluation of data obtained through geophysical and geological analyses, production data and engineering studies, the results of which are often inconclusive or subject to varying interpretations. For a discussion of the uncertainty involved in these processes, see “Reserve estimates depend on many interpretations and assumptions. Any significant inaccuracies in reserve estimates or underlying interpretations or assumptions will materially affect the quantities and present value of our reserves.” In addition, our cost of drilling, completing and operating wells is often uncertain before drilling commences.
Further, many factors may curtail, delay or cancel our scheduled drilling projects, including the following:
• | unexpected or adverse drilling conditions; |
• | delays imposed by or resulting from compliance with environmental and other governmental or regulatory requirements including permitting requirements (including any such permits relating to water sourcing), limitations on or resulting from wastewater discharge and the disposal of exploration and production wastes, including subsurface injections; |
41
Table of Contents
• | elevated pressure or irregularities in geological formations; |
• | shortages of or delays in obtaining equipment and qualified personnel or in obtaining water or proppant for hydraulic fracturing activities; |
• | facility or equipment failures or accidents; |
• | lack of available gathering facilities or delays in construction of gathering facilities; |
• | lack of available capacity on interconnecting transmission pipelines or other forms of transportation; |
• | adverse weather conditions, such as cyclones, lightning storms, flooding, tornadoes, snow or ice storms and changes in weather patterns; |
• | issues related to compliance with, or changes in, environmental and other governmental regulations; |
• | environmental hazards, such as oil and natural gas leaks, oil spills, pipeline and tank ruptures, encountering naturally occurring radioactive materials, and unauthorized discharges of wastewater or brine, well stimulation and completion fluids, toxic gases or other pollutants into the surface and subsurface environment; |
• | declines in oil and natural gas prices; |
• | limited availability of financing at acceptable terms; |
• | the availability and timely issuance of required governmental permits and licenses; |
• | title issues or legal disputes regarding leasehold rights; and |
• | other market limitations in our industry. |
We have a minority ownership position in PSI, a private company primarily operating in Colombia and a minority ownership position in PetroReconcavo, S.A., a company which operates in Brazil and is publicly listed on the Sao Paulo stock exchange.
The value of our minority ownership position in PSI and the amount of dividends which we may receive from PSI in the future is subject to a number of risks. Outside of risks relating to oil and gas operations, other risks include:
• | termination of, or intervention in, concessions, rights or authorizations granted by the Colombian or Brazilian governments to us; |
• | expropriation risk; |
• | capital controls risk; |
• | the recent social and political unrest, driven in many cases by populist groups, in the countries that PSI operates and has an interest in; |
• | potential for armed conflict in the countries PSI operates and has an interest in; |
• | fluctuation in inflation and exchange rates in Colombia and Brazil; |
• | contract counterparty risk; |
• | violations of the U.S. Foreign Corruption Act; |
• | direct or indirect impact resulting from terrorist incidents or responses to such incidents, including the effect and availability of and premiums on insurance; |
• | changes in the government or other changes in political conditions in Brazil and/or Colombia; and |
• | the adoption of policies, regulations, or taxes which impact PSI’s or PetroReconcavo’s operations, cash flow or ownership of assets. |
42
Table of Contents
We may be unable to make accretive acquisitions or successfully integrate acquired businesses or assets, and any inability to do so may disrupt our business and hinder our growth potential.
Our ability to grow and to increase distributions to our unitholders depends in part on our ability to make acquisitions that result in an increase in Distributable Cash from Operations. There is intense competition for acquisition opportunities in our industry and we may not be able to identify attractive acquisition opportunities. Even if we do identify attractive acquisition opportunities, we may not be able to complete the acquisition, do so on commercially acceptable terms or obtain sufficient financing to do so. Competition for acquisitions may increase the cost of, or cause us to refrain from, completing acquisitions.
In addition, our debt arrangements impose certain limitations on our ability to enter into mergers or business combination transactions and to make certain investments. Our debt arrangements also limit our ability to incur certain indebtedness, which could indirectly limit our ability to engage in acquisitions. See “Management’s Discussion and Analysis of Financial Condition and Results of Operations—Debt Agreements—Existing Credit Agreement.”
The success of any completed acquisition will depend on our ability to integrate effectively the acquired business into our existing operations. The process of integrating acquired businesses may involve unforeseen difficulties and may require a disproportionate amount of our managerial and financial resources.
Any of these factors could have a material adverse effect on our financial condition and results of operations.
Properties we acquire may not produce as projected, and we may be unable to determine reserve potential, identify liabilities associated with the properties that we acquire or obtain protection from sellers against such liabilities.
Acquiring oil and natural gas properties requires us to assess reservoir and infrastructure characteristics, including recoverable reserves, development and operating costs and potential liabilities, including, but not limited to, environmental liabilities. Such assessments are inexact and inherently uncertain. For these reasons, the properties we have acquired or may acquire in the future may not produce as projected. In connection with the assessments, we perform a review of the subject properties that we believe to be generally consistent with industry practice, but such a review will not reveal all existing or potential problems. As a practical matter, in the course of our due diligence, inspections may not always be performed on every well, pipeline or associated facility. We cannot necessarily observe structural and environmental problems, such as pipe corrosion or groundwater contamination, when a physical review is performed. We may be unable to negotiate contractual indemnities from any seller for liabilities arising from or attributable to the period prior to our purchase of the property. Additionally, in connection with certain acquisitions, we may be required to assume the risk of the physical condition of the properties in addition to the risk that the properties may not perform in accordance with our expectations.
Increased cost of capital could adversely affect our business.
Our business could be harmed by factors such as the availability, terms and cost of capital or increases in interest rates. For example, interest rates rose throughout 2022 and 2023 and may continue to rise, and there can be no assurance as to what actions the Federal Reserve will take in the future. Changes in any one or more of these factors could cause our cost of doing business to increase, limit our access to capital, limit our ability to pursue acquisition opportunities, reduce our cash flows available and place us at a competitive disadvantage. Continuing disruptions and volatility in the global financial markets may lead to an increase in interest rates or a contraction in credit availability impacting our ability to finance our activities. A significant reduction in the availability of credit could materially and adversely affect our ability to achieve our business strategy and cash flows.
43
Table of Contents
Properties that we decide to drill may not yield oil or natural gas in commercially viable quantities.
Certain of the properties we drill may not yield oil or natural gas in commercially viable quantities and, accordingly, will adversely affect our results of operations and financial condition. There is no way to predict in advance of drilling and testing whether any particular prospect will yield oil or natural gas in sufficient quantities to recover drilling and completion costs or to be economically viable. The use of geologic data and other technologies and the study of producing fields in the same area will not enable us to know conclusively prior to drilling whether oil or natural gas will be present or, if present, whether oil or natural gas will be present in commercial quantities. We cannot assure you that the analogies we draw from available data from other wells, more fully explored prospects, or producing fields will be applicable to our drilling prospects.
We may incur losses as a result of title defects in the properties in which we invest.
The existence of material title defects can cause our title to fail, which would render a lease or other interest worthless, which can adversely affect the results of our operations and financial condition. In order to minimize our acquisition costs, we rely upon the judgment of experienced lease brokers or landmen, who are not licensed to provide a legal title opinion, to perform a review of title and examine the records in the field (i.e., in the appropriate governmental office) before attempting to acquire a lease or other interest. Failure of title on our leases or other interests in a DSU in which we have drilled a well is unlikely because we commission a drill site title opinion from a licensed oil and gas attorney to ensure that our interests are not burdened by any material title defects.
We own non-operating interests in properties that are operated by third parties and some of our leasehold acreage on which we currently control operations could potentially be challenged resulting in our loss of operatorship. As a result, we are unable, or may become unable, to control the operation and ultimate profitability of such properties.
As part of our business strategy, we seek to maintain operational control over the majority of our drilling, completion, and production activities. In Wyoming, operatorship is initially granted to the first working interest owner to successfully submit a State of Wyoming Application for Permit to Drill (“State APD”) for a given formation in a DSU, the requirements for which include:
• | WOGCC approved spacing order; |
• | surface owner consent; |
• | well location plat; |
• | drill plan; |
• | well plan; |
• | horizontal application; and |
• | electrical certification. |
We strive to maintain control of operatorship on our properties; however, Chapter 3, Section 8(m) of the WOGCC’s rules on APDs contains a mechanism by which other working interest owners can challenge our State APDs based on multiple factors, including working interest ownership in the DSU, expertise & technical ability to drill and complete wells and contractual obligations. To date, we have never had one of our existing APDs challenged before the Wyoming Oil and Gas Conservation Commission. We intend to continue to focus on controlling the operatorship of our leasehold through prompt APD submissions and renewals, but we cannot guarantee that we will be successful in maintaining it on all or a majority of our currently controlled properties.
Some of the properties in which we have an interest are in DSUs that are operated by other companies. We have limited ability to influence or control the success of drilling and development activities on properties
44
Table of Contents
operated by third parties. Some of the factors that are under the control of the third-party operator include, among other things, the nature and timing of drilling and operational activities, the timing and amount of capital expenditures, and the use of suitable technology. In addition, the third-party operator’s operational expertise, financial resources and ability to gain the approval of other participants in drilling wells will impact the timing and potential success of drilling and development activities. A third-party operator’s failure to effectively perform operations, act in ways that are favorable to us or abide by applicable agreements could reduce our production and revenues, negatively impact our liquidity, and cause us to spend capital in excess of our current plans, and, as a result, have a material adverse effect on our financial condition and operational results.
We may be forced to incur additional capital expenditures beyond our budgeted amounts and at levels above what we can afford due to the Wyoming forced pooling process and as a result of third-party owners’ ability or desire to participate in our development activities.
In the past we have used, and we expect to continue to use, the Wyoming “forced pooling” process to potentially increase our working interest in wells we propose to drill as operator on our acreage, which could lead to a proportionate increase in our share of the production and reserves associated with any such successfully drilled well. The amount of additional working interest we may acquire from third-party mineral and lease owners in our drilling units is unpredictable and varies from one drilling unit to the next. As third-party owners focus more on the development of their own acreage and reserves within cashflow, we believe that third-party working interest owners may be less likely to bear their share of the costs of the proposed future wells we propose to drill on our acreage. Thus, our working interest in proposed wells may be much higher than it is today as we may be forced to absorb third party working interests, resulting in capital expenditures that are significantly higher than we have budgeted. To the extent we are unable to afford the additional capital expenditures from the increased working interests, our development plans may be altered.
We participate in oil and gas leases with third parties who may not be able to fulfill their commitments to our projects.
We often own less than 100% of the working interest in the DSUs in which we conduct operations, with other parties owning the remaining portion of the working interest (“Non-Operating Working Interest Owner”). Financial risks are inherent in any operation where the cost of drilling, equipping, completing, and operating wells is shared by more than one party. As operator, we could be responsible for joint activity obligations of Non-Operating Working Interest Owners, such as nonpayment of expended costs. In addition, declines in oil and natural gas prices could increase the likelihood that some of these Non-Operating Working Interest Owners, particularly those that are smaller and less established, will be unwilling or unable fulfill their joint activity payment obligations. In the event that any of the Non-Operating Working Interest Owners do not pay their share of costs in a well, we would likely have to pay such costs and attempt to recoup said costs out of the Non-Operating Working Interest Owner’s share of the revenue from such well, which could adversely affect our financial position in a material way.
Extreme weather conditions could adversely affect our ability to conduct drilling activities in the areas where we operate.
Changes in climate and/or changes in weather patterns may be associated with more frequent or more extreme weather events, changes in temperature and precipitation patterns, changes to ground and surface water availability, and other related phenomena could affect some, or all, of our operations. Our development, optimization and exploitation activities and equipment could be adversely affected by extreme weather conditions, particularly in our operating region, such as thunderstorms, cyclones and tornadoes, snow or ice storms, and both hold and cold temperature extremes, which may cause a loss of production from temporary cessation of activity or lost or damaged facilities and equipment. Such extreme weather conditions could also impact other areas of our operations, including access to our water sources and drilling and production facilities for routine operations, maintenance and repairs and the availability of, and our access to, necessary third-party
45
Table of Contents
services, such as gathering, processing, compression and transportation services. Similarly, weather conditions could potentially impact our supply-chain services as well as our product take-away capacity. In some cases, snowstorms can lead to road closures, requiring wells to be shut-in for various reasons and pausing workovers. Our suppliers and customers could also similarly be impacted by weather conditions, which could further impact costs of operations and our revenues. These constraints and the resulting shortages or high costs could delay or temporarily halt our production operations and materially increase our operation and capital costs, which could have a material adverse effect on our business, financial condition and results of operations.
Declining general economic, business or industry conditions, including high inflation, may have a material adverse effect on our results of operations, liquidity and financial condition.
Concerns over global economic conditions, energy costs, supply chain disruptions, increased demand, labor shortages associated with a fully employed U.S. labor force, geopolitical issues, high inflation, the availability and cost of credit and the United States financial market and other factors have contributed to increased economic uncertainty and diminished expectations for the global economy. During the year ended December 31, 2022, the U.S. economy experienced the highest rate of inflation in the past 40 years. High inflation has been pervasive since 2022, increasing the cost of salaries, wages, supplies, material, freight and energy. We expect relatively higher pricing due to inflation continuing in the second half of 2024, resulting in higher costs. Though we have incorporated inflationary factors in our 2024 and 2025 business plans, inflation may outpace those assumptions. We continue to undertake actions and implement plans to strengthen our supply chain to mitigate these pressures and protect the requisite access to commodities and services. These supply chain constraints and inflationary pressures may continue to adversely impact our operating costs and if we are unable to manage our supply chain, it may impact our ability to procure materials and equipment in a timely and cost-effective manner, if at all, which could impact our ability to distribute Available Cash. Typically, as prices for oil and natural gas increase, so do associated costs. Conversely, in a period of declining prices, associated cost declines often lag and may not adjust downward in proportion to prices. If we are unable to recover higher costs through higher commodity prices, our revenues could be adversely impacted and result in reduced margins and production delays and, as a result, our business, financial condition, results of operations and cash flows could be materially and adversely affected.
We continue to take actions to mitigate supply chain and inflationary pressures. We are working closely with our suppliers and contractors to ensure availability of supplies on site, especially fuel, steel and chemical suppliers, which are critical to many of our operations. However, these mitigation efforts may not succeed or may be insufficient, which could have an adverse effect on our results of operations and financial condition. In addition, continued and escalating hostilities in the Middle East, continued hostility related to the Russian invasion of Ukraine, potential economic uncertainty in China leading to decreased demand, and the occurrence or threat of terrorist attacks in the United States or other countries could adversely affect the global economy. These and other factors, combined with volatile commodity prices and declining business and consumer confidence, may contribute to an economic slowdown and a recession. Recent growing concerns about global economic growth have had a significant adverse impact on global financial markets and commodity prices. If the economic climate in the United States or abroad deteriorates, worldwide demand for petroleum products could diminish, which could impact the price at which we can sell our production, affect the ability of our vendors, suppliers and customers to continue operations and ultimately adversely impact our results of operations, liquidity and financial condition.
Events outside of our control, including an epidemic or outbreak of an infectious disease or the threat thereof, could have a material adverse effect on our business, liquidity, financial condition, results of operations, cash flows and ability to pay distributions.
We face risks related to epidemics, outbreaks or other public health events, or the threat thereof, that are outside of our control, and could significantly disrupt our business and operational plans and adversely affect our liquidity, financial condition, results of operations, cash flows and ability to pay distributions on our Class A Common Units. The COVID-19 pandemic resulted in unprecedented governmental actions in the United States
46
Table of Contents
and countries around the world, including, among other things, social distancing guidelines, travel restrictions and stay-at-home orders, among other actions, which caused a significant decrease in activity in the global economy and the demand for oil, and to a lesser extent and natural gas. Additionally, the effects of a similar pandemic might worsen the likelihood or the impact of other risks already inherent in our business. We believe that the known and potential impacts of a pandemic and related events include, but are not limited to, the following:
• | disruption in the demand for natural gas and other petroleum products; |
• | intentional project delays until commodity prices stabilize; |
• | potentially higher borrowing costs in the future; |
• | a need to preserve liquidity, which could result in a reductions, delays or changes in our capital expenditures; |
• | liabilities resulting from operational delays due to decreased productivity resulting from stay-at-home orders affecting our workforce or facility closures resulting from the pandemic; |
• | future asset impairments, including impairment of our natural gas properties and other property and equipment; and |
• | infections and quarantining of our employees and the personnel of vendors, suppliers and other third parties. |
New outbreaks of other viruses could cause further commodity market volatility and resulting financial market instability, or any other event described above, and these are variables beyond our control that may adversely impact our operating cash flows, our ability to pay distributions and our ability to access the capital markets.
We use derivative instruments to economically hedge exposure to changes in commodity price and, as a result, are exposed to credit risk and market risk.
To mitigate the risk associated with volatile commodity prices and to satisfy requirements under our Existing Credit Agreement and the New Credit Facility, as applicable, we have historically hedged, and anticipate that, under the New Credit Facility, we will hedge, a portion of our production volumes based on reasonably anticipated projected production of proved developed producing reserves that we are required to hedge, predominantly using swaps and collars. See “Management’s Discussion and Analysis of Financial Condition and Results of Operations—Quantitative and Qualitative Disclosure About Market Risk—Commodity Derivatives.” By using derivative instruments to economically hedge exposure to changes in commodity prices, we could limit the benefit we would receive from increases in the prices for oil and natural gas, which could have an adverse effect on our financial condition. Likewise, to the extent our production is not hedged, we may be materially and adversely impacted by declines in commodity prices, and our derivative arrangements may be inadequate to protect us from continuing and prolonged declines in commodity prices.
Changes in the fair value of commodity price derivatives are recognized currently in earnings. Realized and unrealized gains and losses on commodity derivatives are recognized in oil and natural gas revenues. Settlements of derivatives are included in cash flows from operating activities. While our price risk management activities decrease the volatility of cash flows, they may obscure our reported financial condition. As required under GAAP, we record derivative financial instruments at their fair value, representing projected gains and losses to be realized upon settlement of these contracts in subsequent periods when related production occurs. These gains and losses are generally offset by increases and decreases in the market value of our proved reserves, which are not reflected in the financial statements.
Additionally, restrictive covenants in our Existing Credit Agreement or the New Credit Facility may hinder our ability to effectively execute our hedging strategy. On a rolling quarterly basis, based on reasonably
47
Table of Contents
anticipated projected production of proved developed producing reserves, we are required and anticipate that, under the New Credit Facility, we will be required, to hedge at least certain volumes. Notwithstanding the foregoing, no volumes are required to be hedged more than 12 months after the maturity of the Existing Credit Agreement. Additionally, our future development activities must be approved by the existing lender. See “Our Existing Credit Agreement contains restrictions and financial covenants that may restrict our business and financing activities and our ability to pay distributions” and “Management’s Discussion and Analysis of Financial Condition and Results of Operations—Debt Agreements—Existing Credit Agreement.”
We also expose ourselves to credit risk due to the failure of the counterparty to perform under the terms of the derivative contract. When the fair value of a derivative contract is positive, the counterparty owes us, which creates credit risk. Disruptions in the financial markets could lead to sudden decreases in a counterparty’s liquidity, which could make it unable to perform under the terms of the derivative contract and we may not be able to realize the benefit of the derivative contract. Any default by a counterparty to these derivative contracts when they become due could have a material adverse effect on our financial condition and results of operations. Further, we are unable to predict sudden changes in a counterparty’s creditworthiness or ability to perform. Even if we do accurately predict sudden changes, our ability to negate the risk may be limited depending upon market conditions.
The failure of our customers or working interest holders to meet their obligations to us may adversely affect our financial results.
Our ability to collect payments from the sale of oil and natural gas to our customers depends on the payment ability of our customer base, which includes several significant customers. If any one or more of our significant customers fail to pay us for any reason or otherwise satisfy their contractual obligations, we could experience a material loss. In addition, if any of our significant customers cease to purchase our oil and natural gas or reduce the volume of the oil and natural gas that they purchase from us, the loss or reduction could have a detrimental effect on our revenues and may cause a temporary interruption in sales of, or a lower price for, our oil and natural gas.
We also face credit risk through joint interest receivables. Joint interest receivables arise from billing entities who own partial working interests in the wells we operate. Though we have the ability to withhold future revenue disbursements to recover non-payment of joint interest billings, the inability or failure of working interest holders to meet their obligations to us or their insolvency or liquidation may adversely affect our financial results.
Derivatives reform legislation and related regulation could have an adverse effect on our ability to hedge risks associated with our business.
The Dodd-Frank Act, enacted in 2010, established federal oversight and regulation of the over-the-counter derivatives market and of entities, such as us, that participate in that market. The Dodd-Frank Act requires the CFTC and the SEC to promulgate rules and regulations implementing the Dodd-Frank Act. In its rulemaking under the Dodd-Frank Act, the CFTC has adopted rules that place limits on positions in certain core futures and equivalent swaps contracts for or linked to certain physical commodities, subject to exceptions for certain bona fide hedging transactions. These limitations could increase the costs to us of entering into, or lessen the availability of, derivative contracts to hedge or mitigate our exposure to volatility in oil and natural gas prices and other commercial risks affecting our business. The Dodd-Frank Act and CFTC rules will also require us, in connection with certain derivatives activities, to comply with clearing and trade execution requirements (or to qualify for an exemption to such requirements). In addition, the CFTC and certain banking regulators have recently adopted final rules establishing minimum margin requirements for uncleared swaps. Although we expect to qualify for the end user exception to the mandatory clearing, trade execution and margin requirements for swaps entered to hedge our commercial risks, the application of such requirements to other market participants, such as swap dealers, may change the cost and availability of the swaps that we use for hedging. In addition, if
48
Table of Contents
any of our swaps do not qualify for the commercial end user exception, posting of collateral could impact liquidity and reduce cash available to us for capital expenditures, therefore reducing our ability to execute hedges to reduce risk and protect cash flow. It is not possible at this time to predict with certainty the full effects of the Dodd-Frank Act and CFTC rules on us or the timing of such effects. The Dodd-Frank Act and any new regulations could significantly increase the cost of derivative contracts, materially alter the terms of derivative contracts, reduce the availability of derivatives to protect against risks we encounter, and reduce our ability to monetize or restructure our existing derivative contracts. If we reduce our use of derivatives as a result of the Dodd-Frank Act and CFTC rules, our results of operations may become more volatile and our cash flows may be less predictable, which could adversely affect our ability to plan for and fund capital expenditures. Finally, the Dodd-Frank Act was intended, in part, to reduce the volatility of natural gas prices, which some legislators attributed to speculative trading in derivatives and commodity instruments related to natural gas. Our revenues could therefore be adversely affected if a consequence of the Dodd-Frank Act and CFTC rules is to lower commodity prices. Any of these consequences could have a material and adverse effect on us, our financial condition or our results of operations. In addition, the European Union and other non-U.S. jurisdictions are implementing regulations with respect to the derivatives market. To the extent we transact with counterparties in foreign jurisdictions, we may become subject to such regulations, the impact of which is not clear at this time.
Reserve estimates depend on many interpretations and assumptions. Any significant inaccuracies in reserve estimates or underlying interpretations or assumptions will materially affect the quantities and present value of our reserves.
The process of estimating oil and natural gas reserves and future net cash flows from such reserves is complex. It requires interpretations of available technical data and many assumptions, including assumptions relating to current and future economic conditions and commodity prices. As noted in more detail below, any significant variances in these interpretations or assumptions could materially affect the estimated quantities and present value of our reserves.
Furthermore, the SEC rules require that, subject to limited exceptions, PUD reserves may only be recorded if they relate to wells scheduled to be drilled within five years after the date of booking. This rule may limit our potential to record additional PUD reserves as we pursue our drilling program. To the extent that natural gas and oil prices decline materially from current levels, such conditions could render uneconomic a number of our identified drilling locations, in which case we would be required to write down our PUD reserves if we do not drill those wells within the required five-year time frame. If we choose not to develop PUD reserves, or if we are not otherwise able to successfully develop them, then we will be required to remove the associated volumes from our reported reserves.
We present reserves for the Company as of December 31, 2023 in addition to reserves for Peak E&P and Peak BLM. The proved undeveloped reserves as of December 31, 2023 for the Company assume the use of a portion of the estimated net proceeds from the offering, together with cash from operations. Our actual use of funds in connection with our development plan may differ from the assumptions in the reserve report, which may cause our reserves in future periods to differ.
The preparation of reserve estimates requires the projection of production rates and the timing of development expenditures based on an analysis of available geological, geophysical, production and engineering data. The extent, quality and reliability of this data can vary. The process also requires economic assumptions about matters such as oil and natural gas prices, drilling and operating expenses, capital expenditures, taxes and availability of funds. Many of these factors are or may be beyond our control.
Actual future production, oil and natural gas prices, revenues, taxes, development expenditures, operating expenses and quantities of recoverable oil and natural gas reserves will most likely vary from our estimates. Any significant variance, including any significant downward revisions to our existing reserve estimates, could materially affect the estimated quantities and present value of our reserves. In addition, we may revise reserve
49
Table of Contents
estimates to reflect production history, results of exploration and development, existing commodity prices and other factors, many of which are beyond our control.
The standardized measure of our estimated proved reserves is not necessarily the same as the current market value of our estimated proved reserves.
The present value of future net cash flow from our proved reserves, or standardized measure, may not represent the current market value of our estimated proved oil and natural gas reserves. In accordance with SEC requirements, we base the estimated discounted future net cash flow from our estimated proved reserves on the 12-month average oil and natural gas index prices, calculated as the unweighted arithmetic average for the first-day-of-the-month price for each month and costs in effect as of the date of the estimate, holding the prices and costs constant throughout the life of the properties.
Actual future prices and costs may differ materially from those used in the net present value estimate, and future net present value estimates using then current prices and costs may be significantly less than current estimates. For example, our estimated proved reserves as of December 31, 2023 were calculated under the SEC rules using the unweighted arithmetic average first-day-of-the-month prices for the prior 12 months of $2.637/MMBtu for natural gas and $78.22/Bbl for oil at December 31, 2023, which for certain periods during this period were substantially different from the available spot prices. In addition, the 10% discount factor we use when calculating discounted future net cash flow for reporting requirements in compliance with Accounting Standards Codification 932, “Extractive Activities—Oil and Gas,” may not be the most appropriate discount factor based on interest rates in effect from time to time and risks associated with us or the oil and natural gas industry in general.
We depend upon two significant purchasers for the sale of most of our oil and natural gas production. The loss of one or more of these purchasers could, among other factors, limit our access to suitable markets for the oil and natural gas we produce.
For the six months ended June 30, 2024, HF Sinclair Refining & Marketing LLC and WGR Operating, LP accounted for approximately 83.9% and 8.8% of our total revenues, respectively, excluding the impact of our commodity derivatives. For the year ended December 31, 2023, HF Sinclair Refining & Marketing LLC and Thunder Creek Gas Services, LLC accounted for approximately 87% and 11% of our total revenues, respectively, excluding the impact of our commodity derivatives. For the year ended December 31, 2022, HF Sinclair Refining & Marketing LLC and Thunder Creek Gas Services, LLC accounted for approximately 75% and 18% of our total revenues, respectively, excluding the impact of our commodity derivatives. No other purchaser accounted for more than 10% of our revenue during such periods. We do not have long-term contracts with our purchasers but rather we sell the substantial majority of our production under arm’s length contracts with terms of 12 months or less, potentially including on a month-to-month basis, to a relatively small number of purchasers. We do not believe that the loss of a single purchaser would materially affect our business because there are numerous other potential purchasers in the area in which we sell our production. However, the loss of any one of these significant purchasers, our ability to sell our production to other purchasers on terms we consider acceptable, the inability or failure of our significant purchasers to meet their obligations to us or their insolvency or liquidation could have a short-term impact on our financial condition, results of operations and ability to make distributions to our unitholders. We cannot assure you that any of our purchasers will continue to do business with us or that we will continue to have ready access to suitable markets for our future production. See “Business and Properties—Operations—Marketing and Customers.”
The availability of a ready market for any hydrocarbons we produce depends on numerous factors beyond our control, including but not limited to the extent of domestic production and imports of oil, the proximity and capacity of natural gas pipelines, the availability of skilled labor, materials and equipment, water sourcing, the effect of state and federal regulation of oil and natural gas production and federal regulation of oil and natural gas sold in interstate commerce.
50
Table of Contents
We may be unable to compete effectively with larger companies, which may adversely affect our ability to generate sufficient revenue to allow us to pay distributions.
The oil and natural gas industry is intensely competitive, and we compete with companies that possess and employ financial, technical and personnel resources substantially greater than ours. Our ability to acquire additional properties and to exploit reserves in the future will depend on our ability to evaluate and select suitable properties and to consummate transactions in a highly competitive environment. Companies we compete with may be able to pay more for properties and evaluate, bid for and purchase a greater number of properties than our financial, technical or personnel resources permit. In addition, there is substantial competition for investment capital in the oil and natural gas industry. These larger companies may have a greater ability to continue development activities during periods of low oil prices and to absorb the burden of present and future federal, state, local and other laws and regulations. Any inability to compete effectively with larger companies could have a material adverse impact on our business activities, financial condition and results of operations and our ability to make distributions.
The development of our estimated undeveloped reserves may take longer and may require higher levels of capital expenditures than we currently anticipate. Therefore, our estimated undeveloped reserves may not be ultimately developed or produced.
As of December 31, 2023, approximately 50% of our total estimated proved reserves were classified as PUDs. Development of these undeveloped reserves may take longer and require higher levels of capital expenditures than we currently anticipate. Estimated future development costs relating to the development of our PUDs at December 31, 2023 was approximately $122.5 million over the next five years. We cannot be certain that the estimated costs of the development of these reserves are accurate, that development will occur as scheduled or that the results of such development will be as estimated. Our ability to fund these expenditures is subject to a number of risks. See “Our development projects and potential future acquisitions require substantial capital expenditures. We may be unable to obtain any required capital or financing on satisfactory terms, which could lead to a decline in our production and reserves.” Delays in the development of our PUDs, increases in costs to drill and develop such reserves or decreases in commodity prices will reduce the PV-10 value of our estimated PUDs and future net cash flows estimated for such reserves and may result in some projects becoming uneconomical. In addition, delays in the development of reserves could cause us to have to reclassify some of our PUDs as unproved reserves. Furthermore, there is no certainty that we will be able to convert our undeveloped reserves to developed reserves or that our PUDs will be economically viable or technically feasible to produce.
Further, the SEC rules require that, subject to limited exceptions, PUDs may only be booked if they relate to wells scheduled to be drilled within five years after the date of booking. This requirement has limited and may continue to limit our ability to book additional PUDs as we pursue our drilling program. As a result, we may be required to reclassify certain of our PUDs if we do not drill those wells within the required five-year timeframe.
The marketability of our production is dependent upon access to gathering, treating, processing and transportation facilities, which we do not control. If these facilities are unavailable, our operations could be interrupted and our revenues could decrease.
The marketability of our oil and natural gas production depends in part upon the availability, proximity and capacity of gathering, treating, processing and transportation pipelines, plants and other midstream facilities, which are owned by third parties. Our oil is collected from the wellhead to our tank batteries and then transported by the purchaser by truck or pipeline to a tank farm, another pipeline or a refinery. Our natural gas is transported from the wellhead to the purchaser’s meter and pipeline interconnection point. We do not control these third-party facilities and our access to them may be limited, curtailed or denied. Pipelines, plants, and other midstream facilities may become unavailable because of testing, turnarounds, line repair, maintenance, reduced operating pressure, lack of operating capacity, regulatory requirements, and curtailments of receipts or deliveries
51
Table of Contents
due to insufficient capacity or because of damage from severe weather conditions or other operational issues. The third-party facilities may experience unplanned downtime or maintenance for a variety of reasons outside our control and our production could be materially negatively impacted as a result of such outages. Insufficient production from our wells in the properties we do not operate to support the construction of pipeline facilities by third parties or a significant disruption in the availability of our or third-party midstream facilities or other production facilities could adversely impact our ability to deliver to market or produce our natural gas and thereby causing a significant interruption in our operations. If, in the future, we are unable, for any sustained period, to implement gathering, treating, processing or transportation arrangements or encounter production related difficulties, we may be required to shut in or curtail production. Any such shut-in or curtailment, or an inability to obtain favorable terms for delivery of the oil and natural gas produced from our fields, would materially and adversely affect our financial condition and results of operations.
We could experience periods of higher costs if commodity prices rise. These increases could reduce our profitability, cash flows and ability to complete development activities as planned.
Historically, our capital and operating costs have risen during periods of increasing oil and natural gas prices and drilling activity in our areas of operation and other major shale basins across the U.S. These cost increases result from a variety of factors beyond our control, such as increases in the cost of sand and other proppants used in hydraulic fracturing operations, and electricity, steel and other raw materials, including water, that we and our vendors rely upon; increased demand for experienced development crews and oil field equipment and services and materials as drilling activity increases; and increased taxes, which could restrict our ability to drill the wells and conduct the operations that we currently have planned. Any delay in the development of new wells or a significant increase in development costs could reduce our revenues and reduce our Distributable Cash from Operations. Decreased levels of drilling activity in the oil and natural gas industry in recent periods have led to declining costs of some drilling equipment, materials and supplies. However, such costs may rise faster than the following increases in our revenue if commodity prices rise, thereby negatively impacting our profitability, cash flows and ability to complete development activities as scheduled and on budget. This impact may be magnified to the extent that our ability to participate in the commodity price increases is limited by our derivative activities.
Our business strategy involves using some of the latest available horizontal drilling and completion techniques, which involve risks and uncertainties in their application.
Difficulties that we face while completing our wells include the ability to:
• | fracture stimulate the planned number of stages with the planned amount of proppant; |
• | run tools through the entire length of the wellbore during completion operations; |
• | run our casing the entire length of the wellbore; |
• | space wells to maximize economic return; |
• | land our wellbore in the desired drilling zone; |
• | stay in the desired drilling zone while drilling horizontally through the formation; and |
• | successfully clean out the wellbore after completion of the final fracture stimulation stage. |
In addition, certain techniques we utilize may cause irregularities or interruptions in production due to offset wells being shut-in and the time required to drill and complete multiple wells before any such wells begin producing. If our development and production results are less than anticipated, the return on our investment for a particular well or region may not be as attractive as we anticipated, and we could incur material write-downs of our undeveloped acreage and its value could decline in the future.
52
Table of Contents
We are highly dependent on the services of our senior management and the loss of senior management or technical personnel could adversely affect our operations.
We depend on the services of our senior management and technical personnel. Our management team has significant experience in the oil and gas industry, and specifically in the Powder River Basin. There can be no assurance that we would be able to replace such members of management with comparable talent or that such replacements would integrate well with our existing team. Further, the loss of the services of our senior management could have a material adverse effect on our business, financial condition and results of operations. In particular, the loss of the services of one or more members of our management team could disrupt our operations. We do not maintain, nor do we plan to obtain, “key person” life insurance policies on any of our employees. As a result, we are not insured against any losses resulting from the death of our key employees. Our continued success will depend, in part, on our ability to attract and retain experienced technical personnel, including geologists, engineers and other professionals. Competition for these professionals is strong and will likely intensify as a significant portion of today’s engineers, geologists and other professionals working within the oil and natural gas industry will reach the age of retirement in the coming years. We are likely to continue to experience increased costs to attract and retain these professionals.
Regardless, retirements and other factors may lead to an increased demand for qualified, entry-level technical personnel, increased compensation costs, and additional competition from oil and gas companies attempting to meet their hiring needs. If a shortage of technical personnel materializes, companies in the oil and gas industry may be unable to hire adequate numbers of technical personnel, resulting in disruptions, increased costs of operations, financial difficulties and other adverse effects. These circumstances may become more severe in the future and, as a consequence, cause a material adverse effect on our business.
We are responsible for the decommissioning, abandonment, and reclamation costs for our facilities, which could decrease funds available for servicing our debt obligations and other operating expenses.
We are responsible for compliance with all applicable laws and regulations regarding the decommissioning, abandonment and reclamation of our facilities at the end of their economic life, the costs of which may be substantial. It is not possible to predict these costs with certainty since they will be a function of regulatory requirements at the time of decommissioning, abandonment and reclamation. We may, in the future, determine it prudent or be required by applicable laws or regulations to acquire decommissioning bonds or to establish and fund one or more decommissioning, abandonment and reclamation reserve funds to provide for payment of future decommissioning, abandonment and reclamation costs, which, in the case of a decommissioning fund, could decrease monies available to service debt obligations. We note that such reserve funds, if established, may not be sufficient to satisfy such future decommissioning, abandonment and reclamation costs and we will be responsible for the payment of the balance of such costs.
Asset retirement obligations for our oil and gas assets and properties are estimates, and actual costs could vary significantly.
We are required to record a liability for the discounted present value of our estimated asset retirement obligations to plug, abandon, and decommission inactive wells and related assets and non-producing oil and gas properties in which we have a working interest. Such asset retirement obligations may include complete structural removal and/or restoration of the land. As of December 31, 2023, we had accrued asset retirement obligations of approximately $2.8 million for our Powder River Basin assets. Although management has used its best efforts to determine future asset retirement obligations, assumptions and estimates can be influenced by many factors beyond management’s control, including, but not limited to, changes in regulatory requirements, which may be more restrictive in the future, changes in costs for abandonment related services and technologies, which could increase or decrease based on supply and demand, and/or extreme weather conditions, such as cyclones, tornadoes, lightning storms, and other extreme weather events, which may cause structural or other damage to oil and natural gas assets and properties. Accordingly, our estimate of future asset retirement obligations could differ materially from actual costs that may be incurred.
53
Table of Contents
Our business could be negatively affected by security threats, including cybersecurity threats, and other disruptions.
As an oil and natural gas producer, we face various security threats, including cybersecurity threats to gain unauthorized access to, or control of, sensitive information or to render our data or systems unusable; threats to the security of our facilities and infrastructure or third-party facilities and infrastructure, such as processing plants and pipelines; and threats from terrorist acts. The potential for such security threats has subjected our operations to increased risks that could have a material adverse effect on our business. In particular, our implementation of various procedures and controls to monitor and mitigate security threats and to increase security for our information, facilities and infrastructure may result in increased capital and operating costs. Moreover, there can be no assurance that such procedures and controls will be sufficient to prevent security breaches from occurring. In addition, if our third-party vendors do not maintain adequate security measures, do not require their sub-contractors to maintain adequate security measures, do not perform as anticipated and in accordance with contractual requirements, or become targets of cyber-attacks, we may experience a breach of customer data or operational difficulties and increased costs, which could materially and adversely affect our business. If any of these security breaches were to occur, they could lead to losses of sensitive information, critical infrastructure or capabilities essential to our operations and could have a material adverse effect on our reputation, financial position, results of operations or cash flows.
We have not experienced, to date, any cybersecurity incidents or had any material business interruptions or material losses from breaches of cybersecurity. However, there is no assurance that we will not suffer any such interruptions or losses in the future. Cybersecurity attacks in particular are becoming more sophisticated and include, but are not limited to, malicious software, phishing, ransomware, attempts to gain unauthorized access to data and systems, and other electronic security breaches that could lead to disruptions in critical systems, unauthorized release of confidential or otherwise protected information, and corruption of data. These events could lead to financial losses from remedial actions, loss of business or potential liability. Although we maintain insurance to protect against losses resulting from certain data protection breaches and cyber-attacks, our coverage for protecting against such risks may not be sufficient.
In addition, certain cyber incidents, such as surveillance, may remain undetected for an extended period, and our systems and insurance coverage for protecting against such cybersecurity risks may be costly and may not be sufficient. As cyber-attackers become more sophisticated, we may be required to expend significant additional resources to continue to protect our business or remediate the damage from cyber-attacks. Furthermore, the continuing and evolving threat of cyber-attacks has resulted in increased regulatory focus on prevention, and we may be required to bear additional costs and efforts to continue to modify or enhance our protective measures or to investigate and remediate any information security vulnerabilities. To the extent we face increased regulatory requirements, we may be required to spend additional resources to meet such requirements.
We are subject to a number of privacy and data protection laws, rules and directives (collectively, “data protection laws”) relating to the processing of personal data.
The regulatory environment surrounding data protection laws continues to grow in complexity and scope. We collect, use, share, retain, delete and otherwise process certain personal information and other sensitive personal information in connection with our operations. We are subject to a variety of laws and regulations, including state data breach notification laws, and may become subject to additional pending laws and regulations that govern the collection, use and other processing of such information obtained from individuals, businesses and other third parties. These laws and regulations are inconsistent across jurisdictions and are subject to evolving interpretations. Government officials, regulators, privacy advocates and class action attorneys are increasingly scrutinizing how companies collect, process, use, store, share, transmit and destroy personal data. We must continually monitor the development and adoption of, and commit substantial time and resources to comply with, new and emerging laws and regulations and/or expanded interpretations of existing laws, which may increase the costs and complexity of compliance. These laws and regulations provide disclosure and other
54
Table of Contents
obligations for businesses that collect personal information, individual rights relating to personal information, collection, use, storage, transmission and other processing requirements, and potential liability expansion.
Any failure, or perceived failure, by us to comply with applicable data protection laws, regulations, policies, industry standards, contractual obligations, or other legal obligations, including at newly acquired companies, could result in proceedings or actions against us by governmental entities or others and expose us to significant damage awards, fines, and other penalties that could materially harm our business reputation. Such litigation and enforcement may require us to change our business practices, increase the costs and complexity of compliance, and adversely affect our business. As noted above, we are also subject to the possibility of security and privacy breaches, which themselves may result in a violation of these laws. Additionally, the acquisition of a company that is not in compliance with applicable data protection laws may result in a violation of these laws.
Loss of our information and computer systems could adversely affect our business.
We are dependent on our information systems and computer-based programs, including our well operations information, seismic data, electronic data processing and accounting data. If any of such programs or systems were to fail or create erroneous information in our hardware or software network infrastructure, possible consequences include our loss of communication links, inability to find, produce, process and sell oil and natural gas and inability to automatically process commercial transactions or engage in similar automated or computerized business activities. Any such consequence could adversely affect our operations, customer service, and competitive position and have a material adverse effect on our business. They may also result in a breach of our contractual obligations or legal duties. Such a breach could expose us to business interruption, lost revenue, ransom payments, remediation costs, liabilities to affected parties, cybersecurity protection costs, lost assets, litigation, regulatory scrutiny and actions, reputational harm, harm to our vendor relationships, or loss of market share.
We may be involved in legal proceedings that could result in substantial liabilities.
Like many oil and gas companies, we are from time to time involved in various legal and other proceedings, such as title, royalty or contractual disputes, regulatory compliance matters and personal injury or property damage matters, in the ordinary course of our business. Such legal proceedings are inherently uncertain and their results cannot be predicted. Regardless of the outcome, such proceedings could have an adverse impact on us because of legal costs, diversion of management and other personnel and other factors. In addition, it is possible that a resolution of one or more such proceedings could result in liability, penalties or sanctions, as well as judgments, consent decrees or orders requiring a change in our business practices, which could materially and adversely affect our business, operating results and financial condition. Accruals for such liability, penalties or sanctions may be insufficient. Judgments and estimates to determine accruals or range of losses related to legal and other proceedings could change from one period to the next, and such changes could be material.
We maintain insurance against some, but not all, operating risks and losses. Losses and liabilities arising from uninsured and underinsured events could materially and adversely affect our business, financial condition or results of operations.
Our operations are subject to all of the risks associated with drilling for and producing oil and natural gas including the risk of:
• | environmental hazards, such as releases of pollutants into the environment, including groundwater, surface water, soil and air contamination; |
• | formations with abnormal or unexpected pressures; |
• | mechanical difficulties, such as stuck oilfield drilling and service tools and casing collapse; |
• | ruptures, fires, explosions or well blowouts; |
55
Table of Contents
• | loss of well control or malfunction to or damage to pipelines, processing plants, compression assets, water infrastructure, and related equipment and surrounding properties; |
• | inadvertent damage from construction, vehicles, farm and utility equipment; |
• | personal injuries and death; |
• | natural disasters; and |
• | terrorist attacks targeting oil and natural gas related facilities and infrastructure. |
Any of these events could adversely affect our ability to conduct operations or result in substantial loss to us as a result of claims by government agencies or third parties for:
• | injury or loss of life; |
• | damage to or destruction of property, facilities, natural resources and equipment; |
• | pollution or other environmental damage; |
• | suspension or interruption of our operations; |
• | regulatory investigations and penalties; and |
• | repair and remediation costs. |
We maintain insurance against many, but not all, such losses and liabilities in accordance with what we believe are customary industry practices and in amounts and at costs that we believe to be prudent and commercially practicable.
Limitations or restrictions on our ability to obtain and dispose of water may have a material adverse effect on our operating results.
Water is an essential component of our operations during the drilling and hydraulic fracturing processes and the production life cycle. Our access to water to be used in these processes may be adversely affected due to reasons such as periods of extended drought, private, third-party competition for water in localized areas or the implementation of local or state governmental programs to monitor or restrict the beneficial use of water subject to their jurisdiction for hydraulic fracturing to assure adequate local water supplies. Disposal of produced water as a result of drilling, hydraulic fracturing, and production is also a critical component of our operations. Access to appropriate, permitted third-party water disposal facilities may be adversely affected due to a number of factors outside of our control. Capacity limitations, permitting issues, air emissions, remediation, and competition for disposal facilities are risks to our water disposal requirements and may adversely affect our business, financial condition, and cash flow.
Our Existing Credit Agreement contains, and it is anticipated that the New Credit Facility will contain, restrictions and financial covenants that may restrict our business and financing activities and our ability to pay distributions.
Our Existing Credit Agreement contains a number of significant covenants, including restrictive covenants that will, subject to certain qualifications, restrict, among other things our ability to:
• | incur certain liens or permit them to exist; |
• | merge or consolidate with another company; |
• | incur or guarantee additional debt; |
• | make certain investments and acquisitions; |
• | hedge future production or interest rates; |
56
Table of Contents
• | make or pay distributions on, or redeem or repurchase, common units, if an event of default exists; |
• | enter into certain types of transactions with affiliates; |
• | restrict the transfer, sell or otherwise dispose of assets; and |
• | engage in certain other transactions without the prior consent of our lenders. |
In addition, our Existing Credit Agreement requires us to comply with customary financial covenants and specified financial ratios, including limitations on our annual general and administrative expenses (as defined in the Existing Credit Agreement) and that we maintain, as of the last day of any fiscal quarter, (i) a current ratio greater than 1.0 to 1.0 (the “Current Ratio Covenant”), (ii) a ratio of total net indebtedness-to-EBITDAX of not greater than 2.75 to 1.00, (iii) a ratio of PDP assets plus or minus the value of future hedge settlements (both discounted at a 10% rate) to net indebtedness of not less than 1.75 to 1.00 and (iv) maintain at least $5,000,000 in liquidity. If market or other economic conditions deteriorate, our ability to comply with these covenants may be impaired.
For the fiscal quarter ended December 31, 2023, we failed to comply with the Current Ratio Covenant, and as a result of such failure, an event of default occurred under the Existing Credit Agreement. Pursuant to the Waiver and Consent to Credit and Guaranty Agreement, dated as of April 11, 2024, the lenders waived such event of default. There is no assurance that we will be able to obtain any future waivers. If we are unable to comply with the Current Ratio Covenant for a future period or other customary financial covenants and specified financial ratios or violate any other provisions of our Existing Credit Agreement that are not cured or waived within specific time periods, our lender may declare our indebtedness thereunder to be immediately due and payable, our ability to make distributions will be inhibited and our lenders’ commitment to make further loans to us may terminate. Any such acceleration of such debt could also result in a cross-acceleration of other future indebtedness which we may incur. We might not have, or be able to obtain, sufficient funds to make these accelerated payments. In addition, our obligations under our Existing Credit Agreement are secured by substantially all of our assets, and if we are unable to repay our indebtedness under our Existing Credit Agreement, the lenders could seek to foreclose on our assets or force us to seek bankruptcy protection.
In addition, our Existing Credit Agreement may hinder our ability to effectively execute our hedging strategy. Our Existing Credit Agreement requires the minimum percentage of our production that we can hedge and the duration and structure of those hedges, so we may be required to enter into commodity derivative contracts at inopportune times.
We are currently in the process of negotiating the New Credit Facility that we anticipate entering into at the closing of this offering. To the extent we successfully negotiate and enter into the New Credit Facility, we cannot ensure that such terms will be the same as or more favorable than the terms described in the Existing Credit Agreement.
We may not be able to generate sufficient cash to service all of our indebtedness and may be forced to take other actions to satisfy our obligations under our debt arrangements, which may not be successful.
Our ability to make scheduled payments on or to refinance our indebtedness obligations, including our Existing Credit Agreement, depends on our financial condition and operating performance, which are subject to prevailing economic and competitive conditions and certain financial, business and other factors beyond our control. If oil and natural gas prices decline for an extended period of time, we may not be able to maintain a level of cash flows from operating activities sufficient to permit us to pay the principal, premium, if any, and interest on our indebtedness.
If our cash flows and capital resources are insufficient to fund debt service obligations, we may be forced to reduce or delay investments and capital expenditures, sell assets, seek additional equity or debt capital or
57
Table of Contents
restructure or refinance indebtedness or seek bankruptcy protection to facilitate a restructuring. Our ability to restructure or refinance indebtedness will depend on the condition of the capital markets and our financial condition at such time. Any refinancing of indebtedness could be at higher interest rates and may require us to comply with more onerous covenants, which could further restrict business operations. The terms of existing or future debt or preferred equity arrangements may restrict us from adopting some of these alternatives. In addition, any failure to make payments of interest and principal on outstanding indebtedness on a timely basis could harm our ability to incur additional indebtedness. In the absence of sufficient cash flows and capital resources, we could face substantial liquidity problems and might be required to dispose of material assets or operations to meet debt service and other obligations. Our Existing Credit Agreement currently restricts, and the New Credit Facility may restrict, our ability to dispose of assets and our use of the proceeds from such disposition in certain circumstances. We may not be able to consummate those dispositions, and the proceeds of any such disposition may not be adequate to meet any debt service obligations then due. These alternative measures may not be successful and may not permit us to meet scheduled debt service obligations.
Any significant reduction in the borrowing base under a replacement facility, such as the New Credit Facility, as a result of periodic borrowing base redeterminations or otherwise may negatively impact our ability to fund our operations.
In the future, if we have a revolving reserve-based loan, including under the New Credit Facility, which we are in the process of negotiating, we may not be able to access adequate funding as a result of a decrease in the borrowing base due to the issuance of new indebtedness, the outcome of a subsequent borrowing base redetermination or an unwillingness or inability on the part of our lenders to meet their funding obligations. Declines in commodity prices could result in a determination by the lenders to decrease the borrowing base in the future and, in such a case, we could be required to promptly repay any indebtedness in excess of the redetermined borrowing base. As a result, we may be unable to implement our respective drilling and development plan, make acquisitions or otherwise carry out business plans, which could have a material adverse effect on our financial condition and results of operations and impair our ability to service our indebtedness.
Our variable rate indebtedness subjects us to interest rate risk, which could cause our debt service obligations to increase significantly.
Borrowings under our Existing Credit Agreement or New Credit Facility bear or will bear interest at variable rates and expose us to interest rate risk. If interest rates increase, our debt service obligations on the variable rate indebtedness would increase even if the amount borrowed remained the same, and could materially impact our business, financial condition and results of operations and distributions.
Our level of indebtedness may increase and reduce our financial flexibility.
Although we do not expect to have significant net indebtedness at the closing of this offering, in the future we may incur significant indebtedness through future debt issuances in order to make acquisitions or to develop our properties or for other general partnership purposes. Such indebtedness could affect our operations in several ways:
• | a significant portion of our cash flows could be used to service our indebtedness; |
• | a high level of debt would increase our vulnerability to general adverse economic and industry conditions; |
• | the covenants contained in the agreements governing our outstanding indebtedness may limit our ability to borrow additional funds, dispose of assets, pay distributions on our Class A Common Units and make certain investments; |
• | a high level of debt may place us at a competitive disadvantage compared to our competitors that are less leveraged and therefore may not be able to take advantage of opportunities that our indebtedness would prevent us from pursuing; |
58
Table of Contents
• | our debt covenants may also affect our flexibility in planning for, and reacting to, changes in the economy and our industry; |
• | a high level of debt may make it more likely that a reduction in any future borrowing base following a periodic redetermination could require us to repay a significant portion of our then-outstanding bank borrowings; and |
• | a high level of debt may impair our ability to obtain additional financing in the future for working capital, capital expenditures, acquisitions, general corporate or other purposes. |
A high level of indebtedness, if incurred in the future, increases the risk that we may default on our debt obligations. Our ability to meet our debt obligations and to reduce our level of indebtedness in such event depends on our future performance. General economic conditions, commodity prices, and financial, business, and other factors affect our operations and our future performance. Many of these factors are beyond our control. We may not be able to generate sufficient cash flows to pay the interest on our debt and future working capital, borrowings, or equity financing may not be available to pay or refinance such debt. Factors that will affect our ability to raise cash through an offering of our common units or a refinancing of our debt include financial market conditions (including any financial crisis), the value of our assets, and our performance at the time we need capital.
We cannot assure you that we will be able to obtain the New Credit Facility to refinance the indebtedness under the Existing Credit Agreement, or that we will be able to refinance the indebtedness we will incur under the New Credit Facility.
There can be no assurance that the New Credit Facility will be obtained on the terms described herein, or at all. In order to obtain the New Credit Facility, which we are in the process of negotiating, we must first obtain commitments from lenders for the New Credit Facility, and agree on final definitive documentation for the New Credit Facility with the lenders. We may not be able to arrange such commitments, or the pricing, size, covenants or other terms of the facility may be less favorable than the New Credit Facility described herein, which could increase our interest costs, reduce our operational or financial flexibility, or reduce our access to liquidity. Assuming we enter into the New Credit Facility at the closing of this offering, we will use approximately $15.0 million in borrowings under the New Credit Facility and approximately $40.9 million of the net proceeds of this offering to repay in full (including payment of the applicable prepayment fee) and terminate our Existing Credit Agreement. However, in the event that we are unable to obtain binding commitments for the New Credit Facility on acceptable terms, we will use approximately $15.0 million of the $15.7 million of net proceeds that would otherwise be designated as a reserve for general partnership purposes to repay the balance on the Existing Credit Agreement. No assurance can be given that any refinancing or additional financing will be possible when needed or that we will be able to negotiate favorable terms. In addition, our access to capital is affected by prevailing conditions in the financial and capital markets and other factors beyond our control. There can be no assurance that market conditions will be favorable at the times that we require new or additional financing. Further, changes by any rating agency to our credit rating may negatively impact the value and liquidity of both our debt and equity securities, as well as the potential costs associated with refinancing our debt, including the Existing Credit Agreement and, if ultimately agreed upon, the New Credit Facility. Downgrades in our credit ratings could also affect the terms of any such financing and restrict our ability to obtain additional financing in the future. Failure to obtain the New Credit Facility or to refinance the indebtedness under the Existing Credit Agreement could have a material adverse effect on our business, financial condition, results of operations and cash flows.
Increased attention to ESG matters and conservation measures may adversely impact our business.
Increasing attention to climate change, societal expectations on companies to address climate change, investor and societal expectations regarding voluntary environmental, social and governance (“ESG”) disclosures, and consumer demand for alternative forms of energy, may result in increased costs, reduced demand for our products, reduced profits, increased investigations and litigation, and negative impacts on the price of our Class A Common Units and access to capital markets. Increasing attention to climate change and
59
Table of Contents
environmental conservation, for example, may result in demand shifts for oil and natural gas products and additional governmental investigations and private litigation against us or our operators. To the extent that societal pressures or political or other factors are involved, it is possible that such liability could be imposed without regard to our causation of, or contribution to, the asserted damage, or to other mitigating factors.
Moreover, while we may create and publish voluntary disclosures regarding ESG matters in the future, many of the statements in those voluntary disclosures may be on hypothetical expectations and assumptions that may or may not be representative of current or actual risks or events or forecasts of expected risks or events, including the costs associated therewith. Such expectations and assumptions are necessarily uncertain and may be prone to error or subject to misinterpretation, given the long timelines involved and the lack of an established single approach to identifying and measuring many ESG matters.
In addition, organizations that voluntarily provide information to investors on corporate governance and related matters have developed ratings processes for evaluating companies on their approach to ESG matters. Such ratings are used by some investors to inform their investment and voting decisions. Unfavorable ESG ratings and recent activism directed at shifting funding away from companies with energy-related assets, could lead to increased negative investor sentiment toward us and our industry, and to the diversion of investment to other industries, which could have a negative impact on our access to, and costs of, capital. Also, institutional lenders may decide not to provide funding for fossil fuel energy companies based on climate change related concerns, which could affect our access to capital for potential growth projects.
We may face various risks associated with the long-term trend toward increased activism against oil and gas exploration and development activities.
Opposition toward oil and gas drilling and development activity has been growing globally. Companies in the oil and gas industry are often the target of activist efforts from both individuals and non-governmental organizations regarding safety, environmental compliance, and business practices. Anti-development activists are working to, among other things, reduce access to federal and state government lands, and delay or cancel certain projects, such as the development of oil and gas shale plays. Environmental activists continue to advocate for increased regulations or bans on shale drilling and hydraulic fracturing in the United States, even in jurisdictions that are among the most stringent in their regulation of the industry. For example, in September 2024, the U.S. District Court for the District of Columbia issued a ruling temporarily enjoining further APDs with respect to an oil and gas project area previously approved by the U.S. Department of the Interior and the BLM as a result of a lawsuit filed by two environmental advocacy groups that oppose the large-scale oil and gas activities in that area. These and future activist efforts could result in the following:
• | Delay or denial of drilling permits. |
• | Shortening of lease terms and reduction in lease size. |
• | Restrictions on installation or operation of production, gathering or processing facilities. |
• | Restrictions on installation and operation of transmission pipelines. |
• | Restrictions on the use of certain operating practices, such as hydraulic fracturing, or disposal of related waste materials, such as hydraulic fracking fluids and production. |
• | Increased severance and/or other taxes. |
• | Cyber-attacks. |
• | Legal challenges or lawsuits. |
• | Negative publicity about our business or the oil and gas industry in general. |
• | Increased costs of doing business. |
• | Reduction in demand for our products. |
• | Other adverse effects on our ability to develop our properties and expand production. |
60
Table of Contents
We may incur significant costs associated with responding to these initiatives. Complying with any resulting additional legal or regulatory requirements that are substantial, could have a material adverse effect on our business, financial condition, cash flow, results of operations, and ability to pay distributions on our Class A Common Units.
Prolonged negative investor sentiment toward upstream natural gas and oil-focused companies could limit our access to capital funding, which would constrain liquidity.
Certain segments of the investor community have developed negative sentiment towards investing in our industry. Recent equity returns in the sector, versus other sectors, have led to lower natural gas and oil representation in certain key equity market indices. Some investors, including certain pension funds, private equity funds, university endowments, and family foundations, have stated policies to reduce or eliminate their investments in the natural gas and oil sector based on social and environmental considerations. Certain other stakeholders have pressured commercial and investment banks to stop funding hydrocarbon extraction, transportation, or refining. If this negative sentiment continues or worsens, it may reduce the availability of capital funding for potential development projects, each of which could have a material adverse effect our financial condition, results of operations, cash flows, and ability to pay distributions on our Class A Common Units.
Conservation measures and technological advances could reduce demand for oil and natural gas.
Fuel conservation measures, alternative fuel requirements, increasing availability of, and consumer and industrial/commercial demand for alternatives to oil and natural gas (e.g., alternative energy sources), and products manufactured with, or powered by, non-oil and gas sources (e.g., electric vehicles and renewable residential and commercial power supplies), and technological advances in fuel economy and energy generation, transmission, storage and consumption of energy (e.g., wind, solar and hydrogen power, smart grid technology and battery technology), could reduce demand for oil and natural gas. The impact of the changing demand for oil and natural gas services and products may have a material adverse effect on our business, financial condition, results of operations, and cash flow.
In addition, our business could be impacted by governmental initiatives to incentivize the conservation of energy or the use of alternative energy sources, such as with the previously mentioned, “Long-Term Strategy for the United States: Pathways to Net-Zero Greenhouse Gas Emissions by 2050,” or with the U.S. DOT’s recent issue of more stringent fuel economy standards. These initiatives, or similar state or federal initiatives to reduce energy consumption or incentivize a shift away from fossil fuels, could reduce demand for hydrocarbons and have a material adverse effect on our earnings, cash flows, and financial condition.
Risks Related to Environmental and Regulatory Matters
We must adhere to stringent requirements by multiple governing agencies—all of which have the potential to adversely impact the cost and feasibility of our endeavors, and/or expose us to significant risk of liability.
Our operations are subject to a myriad of federal, state, and local laws and regulations which govern occupational health and safety, seek to measure and limit the discharge of materials, and aim to safeguard and protect natural resources and the environment (including threatened and endangered species). These laws and regulations may impose numerous obligations applicable to our operations, including but not limited to: the approval of permits before commencement of drilling and other regulated activities; the restriction of types, quantities and concentrations of materials that may be released into the environment; the limitation or prohibition of drilling activities on certain lands lying within wilderness, wetlands, and other ecologically or seismically sensitive areas; the application of specific health and safety criteria addressing worker protection; the imposition of substantial liabilities for emissions resulting from our operations; and the assumption of costs related to land reclamation and restoration.
61
Table of Contents
Governmental authorities, such as the U.S. Environmental Protection Agency (“EPA”) and analogous state counterparts, have the power to enforce compliance with these laws and regulations, and with the restrictions and requirements laid out in the permits they issue. Such enforcement often results in complicated and costly measures or corrective action. Further, failure to comply with these laws and regulations may result in the assessment of sanctions, including administrative, civil or criminal penalties, the imposition of investigatory or remedial obligations, and the issuance of orders to limit or prohibit some or all of our operations. Additionally, we may experience delays in obtaining, or be unable to obtain, required permits, resulting in delays or interruptions to our operations and specific projects, thereby limiting our growth and revenue.
Owing to the handling of petroleum hydrocarbons and other potentially harmful substances as well as air emissions, wastewater and solid waste generation related to our operations, and historical operations and waste disposal practices that took place at our leased and owned properties, we carry an inherent risk of incurring significant environmental costs and liabilities. Spills, air emissions or other releases of regulated substances could expose us to material losses, expenditures, and liabilities. Under certain applicable environmental laws and regulations, we could also be subject to strict joint and several liability for the removal or remediation of contamination, regardless of whether we were responsible for the release or contamination, and even if our operations met the previous industry standards at the time they were conducted. Furthermore, we may not be able to recover some, or any, of these costs from insurance.
The trend in environmental regulation has long been towards more stringent requirements. Changes that result in more costly well drilling, construction, completion or water management activities, air emissions control or waste handling, storage, transport, and disposal or cleanup requirements, could require us to make significant expenditures to attain and maintain compliance, and may otherwise have a material adverse effect on the results of our operations, competitive position, or financial condition. Compliance with these and other increasingly stringent environmental regulations at the federal and state levels could also delay or prohibit our ability to obtain permits for operations, or require us to install additional pollution control equipment, the costs of which could be significant. Furthermore, proposed regulations may require retrofitting of existing equipment to meet current emission control requirements. See “Business and Properties—Operations,” for a more comprehensive description of the laws and regulations that affect us.
Should we fail to comply with all applicable agency administered statutes, rules, regulations, and orders, we could be subject to substantial penalties and fines arising from allegations of market manipulation.
Several federal agencies have statutory authority to regulate market manipulation in the crude oil and natural gas industries, including the Federal Energy Regulatory Commission (“FERC”), the Federal Trade Commission (“FTC”), and the Commodity Futures Trading Commission (“CFTC”). FERC, under the Natural Gas Act, enforces transparency and anti-market manipulation rules related to the natural gas markets. The FTC has regulations to prohibit market manipulation in the petroleum industry, and the CFTC regulates market manipulation with respect to derivatives, swaps and futures contracts related to crude oil and natural gas purchases and sales. Each regulator also has civil penalty enforcement authority of over $1 million per violation per day.
Our operations are subject to a series of risks arising from the threat of climate change, which could result in increased operating costs, limit the areas in which we may conduct oil and natural gas exploration and production activities, and reduce demand for the oil and natural gas we produce.
Following the U.S. Supreme Court finding that greenhouse gas (“GHG”) emissions constitute a pollutant under the Clean Air Act (“CAA”), the EPA has adopted regulations that, among other things, establish construction and operating permit reviews for emissions from certain large stationary sources, require the monitoring and annual reporting of GHG emissions from certain petroleum and natural gas system sources in the United States, and, together with the Department of Transportation (“DOT”), implement GHG emissions limits on vehicles manufactured for operation in the United States. Additionally, on August 16, 2022, President Biden signed into law the Inflation Reduction Act of 2022 (the “IRA”), which includes billions of dollars in incentives
62
Table of Contents
for the development of renewable energy, clean hydrogen, clean fuels, electric vehicles, investments in advanced biofuels and supporting infrastructure and carbon capture and sequestration. Also, in March 2024, the EPA finalized ambitious rules to reduce harmful air pollutant emissions, including GHGs, from light-, medium-, and heavy-duty vehicles beginning in model year 2027. These rules and incentives could accelerate the transition of the economy away from the use of fossil fuels towards lower- or zero-carbon emissions alternatives, which could decrease demand for, and in turn the prices of, the oil and natural gas that we produce and sell and adversely impact our business.
The IRA also imposes the first ever federal fee on the emission of greenhouse gases through a methane emissions charge. The IRA amends the CAA to impose a fee on the emission of methane that exceeds an applicable waste emissions threshold from sources required to report their GHG emissions to the EPA, including those sources in the oil and gas sector. The methane emissions charge would start in calendar year 2024 at $900 per ton of methane, increase to $1,200 in 2025 and be set at $1,500 for 2026 and each year after. Calculation of the fee is based on certain thresholds established in the IRA. On January 26, 2024, the EPA published a proposed rule to implement the methane emissions charge. The methane emissions charge could increase our operating costs, which could adversely impact our business, financial condition and cash flows.
The federal government has also increased regulation of methane from oil and gas facilities in recent years. For example, in 2016, the EPA issued regulations under its New Source Performance Standards (“NSPS”, Subpart OOOOa) requiring operators to reduce methane and VOC emissions from new, modified and reconstructed crude oil and natural gas wells and equipment located at natural gas production gathering and booster stations, gas processing plants, and natural gas transmission compressor stations. On March 8, 2024, the EPA finalized new rules under NSPS OOOOb and OOOOc to further reduce methane and VOC emissions from new and existing sources in the oil and natural gas sector, though the Texas Railroad Commission and Texas Commission on Environmental Quality have petitioned to challenge the rule in court. Though the final outcome of the NSPS is uncertain, the rule, as written, establishes standards of performance for sources that commence construction, modification or reconstruction after March 8, 2024, and establishes emissions guidelines that will subsequently inform state plans to establish standards for existing sources. If implemented as currently drafted, these increasingly stringent methane and VOC requirements on new facilities, or the application of new requirements to existing facilities, could result in additional restrictions on our operations and increase compliance costs, which could be significant. Given the long-term trend toward increasing regulation, we fully expect there will be additional future federal GHG regulations of the oil and gas industry.
Additionally, various states, and groups of states, have adopted or are considering adopting, legislation, regulations or other regulatory initiatives that are focused on GHG cap and trade programs, carbon taxes, reporting and tracking programs, and restriction of emissions.
Internationally, in December 2015, the United States participated in the 21st Conference of the Parties of the United Nations Framework Convention on Climate Change in Paris, France. The resulting Paris Agreement, which went into effect on November 4, 2016, requires member states to individually determine and submit non-binding emissions reduction targets every five years after 2020. On April 21, 2021, President Biden announced a goal of reducing the United States’ emissions by 50-52% below 2005 levels by 2030. In November 2021, the international community gathered again in Glasgow at the 26th Conference to the Parties on the UN Framework Convention on Climate Change (“COP26”), during which multiple announcements were made, including a call for parties to eliminate certain fossil fuel subsidies and pursue further action on non-CO2 GHGs. Relatedly, the United States and European Union jointly announced the launch of the “Global Methane Pledge,” which aims to cut global methane pollution at least 30% by 2030 (relative to 2020 levels), including “all feasible reductions” in the energy sector. President Biden also agreed that same month to cooperate with Chinese leader Xi Jinping on accelerating progress toward the adoption of clean energy. Most recently, at the 28th Conference of the Parties in the United Arab Emirates, world leaders agreed to transition away from fossil fuels in a just, orderly and equitable manner and to triple renewables and double energy efficiency globally by 2030. The impacts of these orders, pledges, agreements and any legislation or regulation promulgated to fulfill the United States’
63
Table of Contents
commitments under the Paris Agreement, COP26, or other international conventions, cannot be predicted at this time. However, to the extent these developments result in new restrictions on oil and gas operations, increase operational costs, or otherwise reduce the demand for oil and gas, they could have a material adverse effect on our business.
Litigation risks are also increasing, as several entities have sought to bring suit against oil and natural gas companies in state or federal courts, alleging, among other things, that such companies created public nuisances by producing fuels that contributed to climate change. Suits have also been brought against such companies under shareholder and consumer protection laws, alleging that companies have been aware of the adverse effects of climate change, but failed to adequately disclose those impacts.
Fossil fuel producers face increasing financial risks as investors currently invested in fossil fuel energy companies may elect to shift some or all of their investments into other sectors. Institutional lenders who provide financing to fossil fuel energy companies have become more attentive to sustainable lending practices, and some of them may elect not to provide funding for fossil fuel energy companies. For example, at COP26, the Glasgow Financial Alliance for Net Zero (“GFANZ”) announced that commitments from over 450 firms across 45 countries had resulted in over $130 trillion in capital committed to net zero goals. The various sub-alliances of GFANZ generally require participants to set short-term, sector-specific targets to transition their financing, investing, and/or underwriting activities to net zero emissions by 2050. There is also a risk that financial institutions will be required to adopt policies that have the effect of reducing the funding provided to the fossil fuel sector. President Biden signed an executive order calling for the development of a “climate finance plan” and, separately, the Federal Reserve has joined the Network for Greening the Financial System, a consortium of financial regulators focused on addressing climate-related risks in the financial sector. More recently, in November 2021, the Federal Reserve issued a statement in support of the efforts of the NGFS to identify key issues and potential solutions for the climate-related challenges most relevant to central banks and supervisory authorities. Limitation of investments in, and financing for, fossil fuel energy companies, could result in the restriction, delay or cancellation of drilling programs or development and production activities.
Additionally, the SEC recently adopted, and then paused, rules relating to the disclosure of a range of climate-related risks. If implemented, the rules are expected to impose several new disclosure obligations, including: (i) disclosure on an annual basis of a registrant’s Scope 1 and Scope 2 GHG emissions; (ii) third-party independent attestation of the same for accelerated and large accelerated filers; (iii) disclosure on how a general partner’s board of directors and underlying management oversee climate-related risks and certain climate-related governance items; (iv) disclosure of information related to a registrant’s publicly announced climate-related targets, goals and/or transition plans; and (v) disclosure of whether and how climate-related events and transition activities impact line items above a threshold amount on a registrant’s consolidated financial statements, including the impact of the financial estimates and the assumptions used. While we, as an emerging growth company, would not be required to report GHG emissions (including Scope 1 and Scope 2 emissions) and will be subject to a longer phase-in for other climate-related disclosure requirements (starting in the fiscal year beginning in 2027), we are currently assessing this rule and cannot predict the costs of implementation or any potential adverse impacts resulting from the rule, should it be adopted as proposed. We expect, however, these costs to be substantial. In addition, enhanced climate disclosure requirements could accelerate the trend of certain stakeholders and lenders to restrict or seek more stringent conditions with respect to their investments in certain carbon-intensive sectors.
The adoption and implementation of new or more stringent international, federal, regional or state legislation, regulations, or other regulatory initiatives that impose more stringent standards for GHG emissions from the oil and natural gas sector, or otherwise restrict the areas in which this sector may produce oil and natural gas or generate GHG emissions, could result in increased costs of compliance or costs of consumption, thereby reducing demand for oil and natural gas. Additionally, political, financial, and litigation risks may result in our restricting or cancelling production activities, incurring liability for infrastructure damages as a result of climatic changes, or having an impaired ability to continue to operate in an economic manner. One or more of these
64
Table of Contents
developments could have a material adverse effect on our business, financial condition, and the results of our operations.
Federal, state and local legislative and regulatory initiatives relating to hydraulic fracturing as well as governmental reviews of such activities could result in increased costs and additional operating restrictions or delays in the completion of unconventional oil and natural gas wells, adversely affecting our production.
Hydraulic fracturing is an important and common practice that is used to stimulate production of oil and natural gas from dense subsurface rock formations. Hydraulic fracturing involves the injection of water, sand, or alternative proppant and chemicals under pressure, into targeted geological formations to fracture the surrounding rock and stimulate production.
Hydraulic fracturing is typically regulated by state oil and natural gas commissions. However, several federal agencies have asserted regulatory authority over certain aspects of the process. For example, the EPA has taken the position that hydraulic fracturing with fluids containing diesel fuel is subject to regulation under the Underground Injection Control program, specifically as “Class II” Underground Injection Control wells under the Safe Drinking Water Act. Also, On June 28, 2016, the EPA published a final rule prohibiting the discharge of wastewater from onshore unconventional oil and natural gas extraction facilities to publicly owned wastewater treatment plants. The EPA is also conducting a study of private wastewater treatment facilities (also known as centralized waste treatment, or CWT, facilities) accepting oil and natural gas extraction wastewater. The EPA is collecting data and information related to the extent to which CWT facilities accept such wastewater, available treatment technologies (and their associated costs), discharge characteristics, financial characteristics of CWT facilities, and the environmental impacts of discharges from CWT facilities.
Additionally, the EPA published final CAA regulations in 2012 and, more recently, in June 2016 and March 2024, governing CAA performance standards, including standards for the capture of air emissions released during oil and natural gas hydraulic fracturing and leak detection, and further, permitting an effluent limitation guideline that prohibits the discharge of wastewater from onshore unconventional oil and natural gas extraction facilities to publicly owned wastewater treatment plants. In December 2016, the EPA released its final report on the potential impacts of hydraulic fracturing on drinking water resources. The final report concluded that “water cycle” activities associated with hydraulic fracturing may impact drinking water resources under certain limited circumstances.
Similarly, in 2015, the Bureau of Land Management (“BLM”), finalized rules establishing stringent standards relating to hydraulic fracturing on federal and Indian lands, including well casing and wastewater storage requirements and an obligation for exploration and production operators to disclose what chemicals they are using in fracturing activities. In December 2017, the BLM repealed the 2015 hydraulic fracturing rule. Rescission of the rule was challenged by several environmental groups and states in the United States District Court for the Northern District of California, which, in a March 2020 decision, upheld the BLM’s recission.
Additionally, from time to time, legislation has been introduced, but not enacted in Congress, to provide for federal regulation of hydraulic fracturing and to require disclosure of the chemicals used in the fracturing process. Meanwhile, states have continued to regulate hydraulic fracturing.
In the event that new federal, state or local legal restrictions relating to the hydraulic fracturing process are adopted in areas where we operate, we may incur additional costs to comply with such requirements when horizontally completing wells, which could be significant in nature, and could also become subject to additional permitting requirements resulting in added delays or curtailment of the pursuit of exploration, development, or production activities, thereby having a material adverse effect on our business and results of operations. (See “Business and Properties—Operations,” for a further description of the laws and regulations that affect us.)
65
Table of Contents
Restrictions on drilling activities intended to protect certain species of wildlife may adversely affect our ability to conduct drilling and completion activities in areas where we operate.
Oil and natural gas operations in our areas of exploration and development may be adversely affected by seasonal or permanent restrictions on drilling and completion activities designed to protect various wildlife. Seasonal restrictions may limit our ability to operate in protected areas and can intensify competition for drilling rigs, equipment, services, supplies, and qualified personnel, which may lead to periodic shortages when drilling or completion is allowed. These constraints, and the resulting shortages or high costs, could delay our operations or materially increase our operating and capital costs. Permanent restrictions imposed to protect threatened or endangered species could prohibit drilling and completing in certain areas or require the implementation of expensive mitigation measures. Additionally, the designation of previously unprotected species in areas where we operate as threatened or endangered, could cause us to incur increased costs arising from species protection measures, or could result in limitations on our exploration and production activities, causing a material adverse impact on our ability to develop and produce our reserves.
Risks Inherent in an Investment in Us
Our general partner and its affiliates own a controlling interest in us and may have conflicts of interest with, and owe limited duties to, us, which may permit them to favor their own interests to the detriment of us and our unitholders.
Our general partner will have control over all decisions related to our operations. Upon consummation of this offering, our management team and certain members of our Board, who are also affiliated with Yorktown (collectively, the “Sponsors”), will own all of the membership interests in our general partner. Upon the completion of this offering, the Sponsors will own an aggregate of approximately 1.45% of our outstanding Class A Common Units (or 0.8% of our outstanding Class A Common Units on an as-converted basis as a result of their ownership of Class B Common Units) (excluding any Class A Common Units purchased by our directors, executive officers and other designated persons under our directed unit program). Although our general partner has a duty to manage us in a manner that is not adverse to the best interests of us and our unitholders, the executive officers and directors of our general partner also have a duty to manage our general partner in a manner that is not adverse to the best interests of its owners. As a result of these relationships, conflicts of interest may arise in the future between the Sponsors and their respective affiliates, including our general partner, on the one hand, and us and our unitholders, on the other hand. In resolving these conflicts of interest, our general partner may favor its own interests and the interests of its affiliates over the interests of our unitholders. These conflicts include, among others, the following:
• | our partnership agreement replaces the fiduciary duties that would otherwise be owed by our general partner with contractual standards governing its duties, limiting our general partner’s liabilities and restricting the remedies available to our unitholders for actions that, without the limitations, might constitute breaches of fiduciary duty; |
• | neither our partnership agreement nor any other agreement requires the Sponsors or their respective affiliates (other than our general partner) to pursue a business strategy that favors us; |
• | the Sponsors and their affiliates are not limited in their ability to compete with us, including with respect to future acquisition opportunities, and are under no obligation to offer or sell assets to us; |
• | our general partner determines the amount and timing of our development operations and related capital expenditures, asset purchases and sales, borrowings, issuance of additional partnership interests, other investments, including investment capital expenditures in other partnerships with which our general partner is or may become affiliated, and cash reserves, each of which can affect the amount of cash that is distributed to unitholders; |
• | except in limited circumstances, our general partner has the power and authority to conduct our business without unitholder approval; |
• | our general partner determines which costs incurred by it and its affiliates are reimbursable by us; |
66
Table of Contents
• | our partnership agreement does not restrict our general partner from causing us to pay it or its affiliates for any services rendered to us or entering into additional contractual arrangements with any of these entities on our behalf; |
• | our general partner intends to limit its liability regarding our contractual and other obligations and, in some circumstances, is entitled to be indemnified by us; |
• | our general partner may exercise its limited right to call and purchase Class A Common Units if it and its affiliates own more than 90% of the then outstanding limited partner interests; |
• | our general partner controls the enforcement of obligations owed to us by our general partner and its affiliates; and |
• | our general partner decides whether to retain separate counsel, accountants or others to perform services for us. Please read “Certain Relationships and Related Party Transactions” and “Conflicts of Interest and Duties.” |
As a result of such potential conflicts of interests and the limited duties they owe to us, our general partner and its affiliates may favor their own interests to the detriment of us and our unitholders.
The conversion of Class B Common Units into Class A Common Units could lead to selling pressure on the Class A Common Unit price.
The conversion of Class B Common Units into publicly-traded Class A Common Units will provide liquidity to the Class B Common Unitholders, some of whom may elect to sell the Class A Common Units they receive. In addition, Yorktown may elect to make distributions of Class A Common Units to the limited partners in the Yorktown partnerships, some of whom may also elect to sell the Class A Common Units they receive. Future sales of Class A Common Units received in exchange for Class B Common Units could put downward pressure on the market price of the Class A Common Units. While the Class B Common Units are designed to be convertible only upon an excess Distributable Cash from Operations coverage test, which we intend will protect the existing Class A Common Unitholder distribution, there can be no assurance that the Class A Common Units that are ultimately issued upon conversion will not be dilutive.
Our partnership agreement does not restrict our Sponsors and their respective affiliates from competing with us. Certain of our directors and officers may in the future spend significant time serving, and may have significant duties with, investment partnerships or other private entities that compete with us in seeking out acquisitions and business opportunities and, accordingly, may have conflicts of interest in allocating time or pursuing business opportunities.
Our partnership agreement provides that our general partner is restricted from engaging in any business activities other than acting as our general partner and those activities incidental to its ownership of interests in us. Affiliates of our general partner are not prohibited from owning projects or engaging in businesses that compete directly or indirectly with us. Similarly, our partnership agreement does not limit our Sponsors’ or their respective affiliates’ ability to compete with us and our Sponsors do not have any obligation to present business opportunities to us.
In addition, certain of our officers and directors may in the future hold similar positions with investment partnerships or other private entities that are in the business of identifying and acquiring mineral and royalty interests. In such capacities, these individuals would likely devote significant time to such other businesses and would be compensated by such other businesses for the services rendered to them. The positions of these directors and officers may give rise to duties that are in conflict with duties owed to us. In addition, these individuals may become aware of business opportunities that may be appropriate for presentation to us as well as the other entities with which they are or may be affiliated. Due to these potential future affiliations, they may have duties to present potential business opportunities to those entities prior to presenting them to us, which
67
Table of Contents
could cause additional conflicts of interest. Our Sponsors and their respective affiliates will be under no obligation to make any acquisition opportunities available to us, except as provided for under the contribution agreement. See “Conflicts of Interest and Duties.”
Under the terms of our partnership agreement, the doctrine of corporate opportunity, or any analogous doctrine, does not apply to our general partner or any of its affiliates, including its executive officers and directors, our Sponsors and their respective affiliates. Any such person or entity that becomes aware of a potential transaction, agreement, arrangement or other matter that may be an opportunity for us will not have any duty to communicate or offer such opportunity to us. Any such person or entity will not be liable to us or to any limited partner for breach of any fiduciary duty or other duty by reason of the fact that such person or entity pursues or acquires such opportunity for itself, directs such opportunity to another person or entity or does not communicate such opportunity or information to us. This may create actual and potential conflicts of interest between us and affiliates of our general partner and result in less than favorable treatment of us and holders of our Class A Common Units.
Our partnership agreement requires that we distribute all of our Available Cash, if any, which could limit our ability to grow our reserves and production and make acquisitions.
Our partnership agreement requires that we distribute all of our Available Cash, if any, each quarter. As a result, we expect to rely primarily upon our cash reserves, cash from operations and external financing sources, including the issuance of additional Class A Common Units and other partnership interests, to fund future development drilling, completion activities and acquisitions of acreage and/or producing properties and finance our growth. To the extent we are unable to finance growth with our cash reserves and external sources of capital, the requirement in our partnership agreement to distribute all of our Available Cash may impair our ability to grow.
A number of factors will affect our ability to issue securities and borrow money to finance growth, as well as the costs of such financings, including:
• | general economic and market conditions, including interest rates, prevailing at the time we desire to issue securities or borrow funds; |
• | conditions in the oil and gas industry; |
• | the market price of, and demand for, our Class A Common Units; |
• | our results of operations and financial condition; and |
• | prices for oil and natural gas. |
In addition, because we distribute all of our Available Cash, our growth may not be as fast as that of businesses that reinvest their Available Cash to expand ongoing operations. To the extent we issue additional Class A Common Units in connection with any acquisitions or expansion capital expenditures, or upon the conversion of the Class B Common Units to Class A Common Units, the payment of distributions on those additional Class A Common Units may increase the risk that we will be unable to maintain or increase our per Class A Common Unit distribution level. There are no limitations in our partnership agreement or our Existing Credit Agreement, and we do not anticipate any limitations in our New Credit Facility, which we are currently negotiating, on our ability to issue additional Class A Common Units, including units ranking senior to the Class A Common Units. The incurrence of additional commercial borrowings or other debt to finance our growth strategy would result in increased interest expense, which, in turn, may impact the Available Cash that we have to distribute to our Class A Common Unitholders.
68
Table of Contents
Our partnership agreement replaces our general partner’s fiduciary duties to our unitholders with contractual standards governing its duties, and restricts the remedies available to unitholders for actions taken by our general partner that might otherwise constitute breaches of fiduciary duty.
Our partnership agreement contains provisions that eliminate the fiduciary standards to which our general partner would otherwise be held by state fiduciary duty law and replaces those duties with different contractual standards. For example, our partnership agreement provides that:
• | whenever our general partner (acting in its capacity as our general partner), the Board or any committee thereof (including the conflicts committee) makes a determination or takes, or declines to take, any other action in their respective capacities, our general partner, the Board and any committee thereof (including the conflicts committee), as applicable, is required to make such determination, or take or decline to take such other action, in good faith, meaning that it subjectively believed that the decision was not adverse to our best interests, and, except as specifically provided by our partnership agreement, will not be subject to any other or different standard imposed by our partnership agreement, Delaware law, or any other law, rule or regulation, or equitable principle; |
• | our general partner may make a number of decisions in its individual capacity, as opposed to in its capacity as our general partner, free of any duties to us and our unitholders other than the implied contractual covenant of good faith and fair dealing, which means that a court will enforce the reasonable expectations of the partners where the language in the partnership agreement does not provide for a clear course of action. This provision entitles our general partner to consider only the interests and factors that it desires and relieves it of any duty or obligation to give any consideration to any interest of, or factors affecting, us, our affiliates or our limited partners. Examples of decisions that our general partner may make in its individual capacity include: |
• | how to allocate corporate opportunities among us and its other affiliates; |
• | whether to exercise its limited call right; |
• | whether to seek approval of the resolution of a conflict of interest by the conflicts committee of the Board or our unitholders; |
• | how to exercise its voting rights with respect to the units it owns; |
• | whether to sell or otherwise dispose of any units or other partnership interests it owns; and |
• | whether or not to consent to any merger or consolidation of the partnership or amendment to the partnership agreement. |
• | our general partner will not have any liability to us or our unitholders for decisions made in its capacity as general partner so long as it acted in good faith; |
• | our general partner and its officers and directors will not be liable for monetary damages to us, our limited partners or assignees for any acts or omissions unless there has been a final and non-appealable judgment entered by a court of competent jurisdiction determining that our general partner or its officers and directors acted in bad faith or engaged in fraud or willful misconduct or, in the case of a criminal matter, acted with knowledge that the conduct was criminal; and |
• | our general partner will not be in breach of its obligations under the partnership agreement (including any duties to us or our unitholders) if a transaction with an affiliate or the resolution of a conflict of interest is: |
(1) | approved by the conflicts committee of the Board, if any; |
(2) | approved by the vote of a majority of the outstanding Class A Common Units and Class B Common Units, voting together as a single class (excluding any Class A Common Units and Class B Common Units owned by the general partner and its affiliates); |
69
Table of Contents
(3) | determined by the Board to be on terms no less favorable to us than those generally being provided to or available from unrelated third parties; or |
(4) | determined by the Board to be fair and reasonable to us, taking into account the totality of the relationships between the parties involved, including other transactions that may be particularly favorable or advantageous to us. |
In connection with a situation involving a transaction with an affiliate or a conflict of interest, any determination by our general partner must be made in good faith. If an affiliate transaction or the resolution of a conflict of interest is not approved by the vote described in the second sub-bullet point above and the Board determines that the resolution or course of action taken with respect to the affiliate transaction or conflict of interest satisfies either of the standards set forth in the third and fourth sub-bullet points above, then it will be presumed that, in making its decision, the Board acted in good faith, and in any proceeding brought by or on behalf of any limited partner or the Partnership challenging such determination, the person bringing or prosecuting such proceeding will have the burden of overcoming such presumption.
All limited partners are bound by the provisions in the partnership agreement, including the provisions discussed above.
Increases in interest rates could adversely impact our unit price and our ability to issue additional equity and incur debt.
Interest rates on future credit facilities and debt offerings could be higher than current levels, causing our financing costs to increase. In addition, as with other yield-oriented securities, our Class A Common Unit price is impacted by the level of our cash distributions to our Class A Common Unitholders and implied distribution yield. This implied distribution yield is often used by investors to compare and rank similar yield-oriented securities for investment decision-making purposes. Therefore, changes in interest rates, either positive or negative, may affect the yield requirements of investors who invest in our Class A Common Units, and a rising interest rate environment could have an adverse impact on our unit price and our ability to issue additional equity or incur debt. See “Increases in interest rates could adversely impact our unit price and our ability to issue additional equity and incur debt.”
Class A Common Units held by persons who our general partner determines are not eligible holders will be subject to redemption.
To comply with U.S. laws with respect to the ownership of interests in oil and natural gas leases on U.S. federal lands, we have adopted certain requirements regarding those investors who may own our Class A Common Units. As used herein, an “Eligible Holder” means a person or entity qualified to hold an interest in oil and natural gas leases on federal lands. As of the date hereof, Eligible Holder means:
• | a citizen of the United States; |
• | a corporation organized under the laws of the United States or of any state thereof; |
• | a public body, including a municipality; or |
• | an association of United States citizens, such as a partnership or limited liability company, organized under the laws of the United States or of any state thereof, but only if such association does not have any direct or indirect foreign ownership, other than foreign ownership of stock in a parent corporation organized under the laws of the United States or of any state thereof. |
Onshore mineral leases or any direct or indirect interest therein may be acquired and held by aliens only through stock ownership, holding or control in a corporation organized under the laws of the United States or of any state thereof. Class A Common Unitholders who are not persons or entities who meet the requirements to be
70
Table of Contents
an Eligible Holder run the risk of having their Class A Common Units redeemed by us at the then-current market price. The redemption price will be paid in cash or by delivery of a promissory note, as determined by our general partner. Please read “Description of Our Securities—Transfer of Class A Common Units.”
Our unitholders have limited voting rights and are not entitled to elect our general partner or the Board, which could reduce the price at which our Class A Common Units will trade.
Unlike the holders of common stock in a corporation, unitholders (including Class A Common Unitholders and Class B Common Unitholders) have only limited voting rights on matters affecting our business and, therefore, limited ability to influence management’s decisions regarding our business. Our unitholders will have no right on an annual or ongoing basis to elect our general partner or its board of directors. The Board, including the independent directors, is chosen entirely by the Sponsors, as a result of their ownership of our general partner, and not by our unitholders. Please read “Management—Board of Directors” and “Certain Relationships and Related Party Transactions.” Unlike publicly-traded corporations, we will not conduct annual meetings of our unitholders to elect directors or conduct other matters routinely conducted at annual meetings of stockholders of corporations. As a result of these limitations, the price at which our Class A Common Units will trade could be diminished because of the absence or reduction of a takeover premium in the trading price.
Our general partner will have control over all decisions related to our operations. Since, upon consummation of this offering, our general partner will continue to be owned by the Sponsors, who collectively with our general partner and Yorktown, will own and control the voting of an aggregate of approximately 58.3% of our outstanding Class A Common Units and Class B Common Units, voting together as a single class (excluding any Class A Common Units purchased by our directors, executive officers and other designated persons under our directed unit program), the other unitholders will not have an ability to influence any operating decisions and will not be able to prevent us from entering into any transactions. However, our partnership agreement can be amended with the consent of our general partner and the approval of the holders of a majority of our outstanding Class A Common Units and Class B Common Units, voting together as a single class (including Class A Common Units and Class B Common Units held by Yorktown and its affiliates). Assuming we do not issue any additional Class A Common Units and Class B Common Units, and Yorktown does not transfer any of its Class A Common Units and Class B Common Units, Yorktown will have the ability to amend our partnership agreement, including our policy to distribute all of our Available Cash to our Class A Common Unitholders without the approval of any other unitholder. Furthermore, the goals and objectives of Yorktown and its affiliates that hold our Class A Common Units and Class B Common Units relating to us may not be consistent with those of a majority of the other unitholders.
Even if our unitholders are dissatisfied, they cannot remove our general partner without its consent (other than for cause).
The public unitholders will be unable initially to remove our general partner without cause or without its consent because our general partner and its affiliates will own sufficient Class A Common Units and Class B Common Units upon completion of this offering to be able to prevent the removal of our general partner. Our general partner may not be removed except for cause by a vote of the holders of at least 66 2/3% of the outstanding Class A Common Units and Class B Common Units, including any Class A Common Units and Class B Common Units owned by our general partner, its members and their respective affiliates, voting together as a single class, and we receive an opinion of counsel regarding limited liability matters. Immediately upon consummation of this offering, our Sponsors, our general partner and Yorktown will own an aggregate of approximately 58.3% of our Class A Common Units and Class B Common Units, voting together as a single class (excluding any Class A Common Units purchased by our directors, executive officers and other designated persons under our directed unit program), which will enable those holders, collectively, to prevent the removal of our general partner.
Control of our general partner may be transferred to a third party without unitholder consent.
Our general partner may transfer its general partner interest to a third party without the consent of the unitholders. Furthermore, our partnership agreement does not restrict the ability of the Sponsors, who own our
71
Table of Contents
general partner, from transferring all or a portion of their ownership interests in our general partner to a third party. The new owner of our general partner would then be in a position to replace the Board and officers of our general partner with their own choices and thereby influence the decisions made by the Board and officers.
We may issue an unlimited number of additional units, including units that are senior to the Class A Common Units, without unitholder approval, which may dilute your ownership interest in us.
Our partnership agreement does not limit the number of additional Class A Common Units that we may issue at any time without the approval of our unitholders. In addition, we may issue an unlimited number of units that are senior to the Class A Common Units in right of distribution, liquidation and voting. The issuance by us of additional common units or other equity interests of equal or senior rank will have the following effects:
• | our unitholders’ proportionate ownership interest in us will decrease; |
• | the amount of distributions on each unit may decrease; |
• | the ratio of taxable income to distributions may increase; |
• | the relative voting strength of each previously outstanding unit may be diminished; and |
• | the market price of our Class A Common Units may decline. |
We cannot predict the size of future issuances of our Class A Common Units or securities convertible into Class A Common Units or the effect, if any, that future issuances and sales of our Class A Common Units will have on the market price of our Class A Common Units or the distribution amount payable with respect to our Class A Common Units. Sales of substantial amounts of our Class A Common Units (including Class A Common Units issued in connection with an acquisition), or the perception that such sales could occur, may adversely affect prevailing market prices of our Class A Common Units or the distribution amount payable with respect to our Class A Common Units. In addition, the issuance of additional Class A Common Units will result in dilution to the interests of the Class A Common Unitholders.
Our partnership agreement restricts the voting rights of unitholders owning 20% or more of our common units.
Our partnership agreement restricts unitholders’ limited voting rights by providing that any common units held by a person, entity or group owning 20% or more of any class of common units then outstanding, other than our general partner, its affiliates, their transferees and persons who acquired such common units with the prior approval of the Board, cannot vote on any matter. Our partnership agreement also contains provisions limiting the ability of common unitholders to call meetings or to acquire information about our operations, as well as other provisions limiting the ability of our common unitholders to influence the manner or direction of management.
Once our Class A Common Units are publicly traded, the Existing Owners may sell their Class A Common Units in the public markets, which sales could have an adverse impact on the trading price of the Class A Common Units.
After the sale of the Class A Common Units offered hereby, the Existing Owners (including Yorktown VIII) and our general partner will own an aggregate of 239,065 Class A Common Units, or approximately 4.8% of our outstanding Class A Common Units. In addition, our Existing Owners will own an aggregate of 9,608,805 Class B Common Units, which will be convertible into Class A Common Units based upon an excess Distributable Cash from Operations coverage test. Once our Class A Common Units are publicly traded, the sale of Class A Common Units by the Existing Owners in the public markets could have an adverse impact on the price of the Class A Common Units or on any trading market that may develop.
72
Table of Contents
Our general partner has a limited call right that may require you to sell your Class A Common Units at an undesirable time or price.
If at any time our general partner and its affiliates own more than 90% of our then-issued and outstanding limited partner interests, our general partner will have the right, but not the obligation, which it may assign to any of its affiliates or to us, to acquire all, but not less than all, of the Class A Common Units held by unaffiliated persons at a price that is not less than the greater of their then-current market price, as calculated pursuant to the terms of our partnership agreement, and the highest price paid by our general partner or any of its affiliates for Class A Common Units during the 90 day period preceding the date that our general partner notifies the Class A Common Unitholders of its notice of election to exercise the call right. As a result, you may be required to sell your Class A Common Units at an undesirable time or price and may not receive any return on your investment. You may also incur a tax liability upon a sale of your Class A Common Units. Our general partner is not obligated to obtain a fairness opinion regarding the value of the Class A Common Units to be repurchased by it upon exercise of the limited call right. There is no restriction in our partnership agreement that prevents our general partner from causing us to issue additional Class A Common Units and then exercising its call right. If our general partner exercised its limited call right, the effect would be to take us private and, if the Class A Common Units were subsequently deregistered, we would no longer be subject to the reporting requirements of the Exchange Act. At the closing of this offering, our general partner and its affiliates will own approximately 4.8% of our Class A Common Units (or 58.3% assuming conversion of all of the Class B Common Units held by our general partner, its members and their respective affiliates as of the date of this prospectus into Class A Common Units) (excluding any Class A Common Units purchased by our directors, executive officers and other designated persons under our directed unit program). For additional information about this call right, please read “The Partnership Agreement—Limited Call Right.”
Our partnership agreement designates the Court of Chancery of the State of Delaware as the exclusive forum for certain types of actions and proceedings that may be initiated by our unitholders, which may limit our unitholders’ ability to choose the judicial forum for disputes with us or our general partner’s directors, officers or other employees.
Our partnership agreement provides that, with certain limited exceptions, the Court of Chancery of the State of Delaware will be the exclusive forum for any claims, suits, actions or proceedings (1) arising out of or relating in any way to our partnership agreement (including any claims, suits or actions to interpret, apply or enforce the provisions of our partnership agreement or the duties, obligations or liabilities among limited partners or of limited partners to us, or the rights or powers of, or restrictions on, the limited partners or us), (2) brought in a derivative manner on our behalf, (3) asserting a claim of breach of a duty owed by any director, officer or other employee of us or our general partner, or owed by our general partner, to us or the limited partners, (4) asserting a claim arising pursuant to any provision of the Delaware Revised Uniform Limited Partnership Act (the “Delaware Act”) or (5) asserting a claim against us governed by the internal affairs doctrine. This provision would not apply to claims brought to enforce a duty or liability created by the Exchange Act, the Securities Act or any other claim for which the federal courts have exclusive jurisdiction. This choice of forum provision may limit a stockholder’s ability to bring a claim in a judicial forum that it finds favorable for disputes with us or our directors, officers, employees or agents, which may discourage such lawsuits against us and such persons. Alternatively, if a court were to find these provisions of our amended and restated certificate of limited partnership inapplicable to, or unenforceable in respect of, one or more of the specified types of actions or proceedings, we may incur additional costs associated with resolving such matters in other jurisdictions, which could adversely affect our business, financial condition or results of operations. Our partnership agreement also provides that each limited partner waives the right to trial by jury in any such claim, suit, action or proceeding, including any claim under the U.S. federal securities laws, to the fullest extent permitted by applicable law. If a lawsuit is brought against us under our partnership agreement, it may be heard only by a judge or justice of the applicable trial court, which would be conducted according to different civil procedures and may result in different outcomes than a trial by jury would have, including results that could be less favorable to the plaintiffs in any such action. No unitholder can waive compliance with respect to the Partnership’s or such unitholder’s compliance with U.S. federal securities laws and the rules and regulations promulgated thereunder. If the Partnership or one of our unitholders opposed a jury trial demand based on the
73
Table of Contents
waiver, the applicable court would determine whether the waiver was enforceable based on the facts and circumstances of that case in accordance with applicable state and federal laws. To our knowledge, the enforceability of a contractual pre-dispute jury trial waiver in connection with claims arising under the U.S. federal securities laws has not been finally adjudicated by the United States Supreme Court. However, we believe that a contractual predispute jury trial waiver provision is generally enforceable, including under the laws of the State of Delaware, which govern our partnership agreement. By purchasing a Class A Common Unit, a limited partner is irrevocably consenting to these limitations, provisions and potential reimbursement obligations regarding claims, suits, actions or proceedings and submitting to the exclusive jurisdiction of the Court of Chancery of the State of Delaware (or such other court) in connection with any such claims, suits, actions or proceedings. These provisions may have the effect of discouraging lawsuits against us and our general partner’s directors and officers. For additional information about the exclusive forum provision of our partnership agreement, please read “The Partnership Agreement—Applicable Law; Forum, Venue and Jurisdiction.”
The NYSE American does not require a publicly-traded partnership like us to comply, and we do not intend to comply, with certain of its governance requirements generally applicable to corporations.
We have applied to list our Class A Common Units on the NYSE American. Because we will be a publicly-traded partnership, the NYSE American will not require us to have a majority of independent directors on our general partner’s board of directors or to establish a compensation committee or a nominating and corporate governance committee. Accordingly, unitholders will not have the same protections afforded to stockholders of certain corporations that are subject to all of the NYSE American’s corporate governance requirements. Please read “Management—Management of Peak Resources LP.”
Our unitholders’ liability may not be limited if a court finds that unitholder action constitutes control of our business.
A general partner of a partnership generally has unlimited liability for the obligations of the partnership, except for those contractual obligations of the partnership that are expressly made without recourse to the general partner. Our partnership is organized under Delaware law and we conduct business in a number of other states. The limitations on the liability of holders of limited partner interests for the obligations of a limited partnership have not been clearly established in some of the other states in which we do business. A unitholder could be liable for our obligations as if it was a general partner if:
• | a court or government agency determined that we were conducting business in a state but had not complied with that particular state’s partnership statute; or |
• | a unitholder’s right to act with other unitholders to remove or replace the general partner, to approve some amendments to our partnership agreement or to take other actions under our partnership agreement constitute “control” of our business. |
Please read “The Partnership Agreement—Limited Liability” for a discussion of the implications of the limitations of liability on a unitholder.
Our unitholders may have liability to repay distributions that were wrongfully distributed to them.
Under certain circumstances, unitholders may have to repay amounts wrongfully returned or distributed to them. Under Section 17-607 of the Delaware Act, we may not make distributions to unitholders if the distribution would cause our liabilities to exceed the fair value of our assets. Liabilities to partners on account of their partnership interests and liabilities that are non-recourse to us are not counted for purposes of determining whether a distribution is permitted. Delaware law provides that for a period of three years from the date of an impermissible distribution, limited partners who received the distribution and who knew at the time of the distribution that it violated Delaware law will be liable to the limited partnership for the distribution amount. Transferees of common units are liable both for the obligations of the transferor to make contributions to us that are known to the transferee at the time of the transfer and for unknown obligations if the liabilities could be determined from our partnership agreement.
74
Table of Contents
Our Class A Common Unitholders may have limited liquidity for their Class A Common Units, respectively, a trading market may not develop for the Class A Common Units and our Class A Common Unitholders may not be able to resell their Class A Common Units, respectively, at the initial public offering price.
Prior to this offering, there has been no public market for the Class A Common Units. After this offering, there will be 4,700,000 publicly-traded Class A Common Units, or 5,405,000 Class A Common Units if the underwriters exercise their option to purchase additional Class A Common Units in full. We do not know the extent to which investor interest will lead to the development of a trading market or how liquid that market might be. Our Class A Common Unitholders may not be able to resell their Class A Common Units at or above the initial public offering price. Additionally, a lack of liquidity would likely result in wide bid-ask spreads, contribute to significant fluctuations in the market price of the Class A Common Units and limit the number of investors who are able to buy the Class A Common Units.
If our Class A Common Units price declines after the initial public offering, our Class A Common could lose a significant part of their investment.
The initial public offering price for the Class A Common Units will be determined by negotiations between us and the representatives of the underwriters and may not be indicative of the market price of the Class A Common Units that will prevail in the trading market. The market price of our Class A Common Units could be subject to wide fluctuations in response to a number of factors, most of which we cannot control, including:
• | changes in commodity prices; |
• | changes in securities analysts’ recommendations and their estimates of our financial performance; |
• | public reaction to our press releases, announcements and filings with the SEC; |
• | fluctuations in broader securities market prices and volumes, particularly among securities of oil and natural gas companies and securities of publicly traded limited partnerships and limited liability companies; |
• | changes in market valuations of similar companies; |
• | departures of key personnel; |
• | commencement of or involvement in litigation; |
• | variations in our quarterly results of operations or those of other oil and natural gas companies; |
• | variations in the amount of our quarterly cash distributions to our unitholders; |
• | changes in tax law; |
• | future issuances and sales of our Class A Common Units; and |
• | changes in general conditions in the U.S. economy, financial markets or the oil and natural gas industry. |
In recent years, the securities market has experienced extreme price and volume fluctuations. This volatility has had a significant effect on the market price of securities issued by many companies for reasons unrelated to the operating performance of these companies. Future market fluctuations may result in a lower price of our Class A Common Units.
For as long as we are an emerging growth company, we will not be required to comply with certain reporting requirements that apply to other public companies, including those relating to auditing standards and disclosure about our executive compensation.
The JOBS Act contains provisions that, among other things, relax certain reporting requirements for “emerging growth companies,” including certain requirements relating to auditing standards and compensation disclosure. We are classified as an emerging growth company. For as long as we are an emerging growth
75
Table of Contents
company, which may be up to five full fiscal years, unlike other public companies, we will not be required to, among other things, (1) provide an auditor’s attestation report on management’s assessment of the effectiveness of our system of internal control over financial reporting pursuant to Section 404(b) of the Sarbanes-Oxley Act of 2002, (2) comply with any new requirements adopted by the PCAOB requiring mandatory audit firm rotation or a supplement to the auditor’s report in which the auditor would be required to provide additional information about the audit and the financial statements of the issuer, (3) comply with any new audit rules adopted by the PCAOB after April 5, 2012 unless the SEC determines otherwise or (4) provide certain disclosure regarding executive compensation required of larger public companies.
Taking advantage of the longer phase-in periods for the adoption of new or revised financial accounting standards applicable to emerging growth companies may make our Class A Common Units less attractive to investors.
We intend to take advantage of all of the reduced reporting requirements and exemptions available to emerging growth companies under the JOBS Act, including the longer phase-in periods for the adoption of new or revised financial accounting standards under Section 107 of the JOBS Act, until we are no longer an emerging growth company. If we were to subsequently elect instead to comply with these public company effective dates, such election would be irrevocable pursuant to Section 107 of the JOBS Act.
Our election to use the phase-in periods permitted by this election may make it difficult to compare our financial statements to those of non-emerging growth companies and other emerging growth companies that have opted out of the longer phase-in periods under Section 107 of the JOBS Act and who will comply with new or revised financial accounting standards. Under the JOBS Act, emerging growth companies may also delay adopting new or revised accounting standards until such time as those standards apply to private companies. We cannot predict if investors will find our Class A Common Units less attractive because we will rely on these exemptions. If some investors find our Class A Common Units less attractive as a result, there may be a less active trading market for our Class A Common Units and our Class A Common Unit price may be more volatile.
If we fail to develop or maintain an effective system of internal controls, we may not be able to accurately report our financial results or prevent fraud. As a result, current and potential unitholders could lose confidence in our financial reporting, which would harm our business and the trading price of our Class A Common Units.
Effective internal controls are necessary for us to provide reliable financial reports, prevent fraud and operate successfully as a public company. If we cannot provide reliable financial reports or prevent fraud, our reputation and operating results would be harmed. We cannot be certain that our efforts to develop and maintain our internal controls will be successful, that we will be able to maintain adequate controls over our financial processes and reporting in the future or that we will be able to comply with our obligations under Section 404 of the Sarbanes-Oxley Act of 2002. Any failure to develop or maintain effective internal controls, or difficulties encountered in implementing or improving our internal controls, could harm our operating results or cause us to fail to meet our reporting obligations. Ineffective internal controls could also cause investors to lose confidence in our reported financial information, which would likely have a negative effect on the trading price of our Class A Common Units.
We will incur increased costs as a result of being a publicly-traded partnership, which may reduce the amount of cash we have available for distributions to our Class A Common Unitholders and our ability to attract and retain qualified persons to serve on the Board of our general partner or as executive officers.
We have no history operating as a publicly traded partnership. As a publicly traded partnership, we will incur significant legal, accounting and other expenses that we did not incur prior to this offering. In addition, the Sarbanes-Oxley Act of 2002, as well as rules implemented by the SEC and the exchange where our units will be listed, require publicly traded entities to adopt various corporate governance practices that will further increase our costs.
76
Table of Contents
Prior to this offering, we have not filed reports with the SEC. Following this offering, we will become subject to the public reporting requirements of the Exchange Act. We expect these rules and regulations to increase certain of our legal and financial compliance costs and to make activities more time- consuming and costly. The NYSE American does not require a listed publicly traded limited partnership, such as ours, to have a majority of independent directors on its board of directors or to establish a compensation committee or a nominating and corporate governance committee. However, our general partner is required to have an audit committee of at least three members, and all its members are required to meet the independence and experience standards established by the Exchange Act and the applicable exchange rules, subject to certain transitional relief during the one-year period following consummation of this offering. In addition, we will incur additional costs associated with our SEC reporting requirements. The amount of our expenses or reserves for expenses, including the costs of being a publicly traded partnership will reduce the amount of cash we have for distribution to our unitholders. As a result, the amount of cash we have available for distribution to our Class A Common Unitholders will be affected by the costs associated with being a public company.
We also expect to incur additional expense in order to obtain director and officer liability insurance. Because of the limitations in coverage for directors, it may be more difficult for us to attract and retain qualified persons to serve on the Board or as executive officers.
If securities or industry analysts do not publish research or reports about our business, if they adversely change their recommendations regarding our Class A Common Units or if our operating results do not meet their expectations, Class A Common Unit price could decline.
The trading market for our Class A Common Units will be influenced by the research and reports that industry or securities analysts publish about us or our business. If one or more of these analysts cease coverage of our company or fail to publish reports on us regularly, we could lose visibility in the financial markets, which in turn could cause our unit price or trading volume to decline. Moreover, if one or more of the analysts who cover our company downgrades our Class A Common Units or if our operating results do not meet their expectations, our unit price could decline.
Tax Risks to Purchasers of Class A Common Units in this Offering
In addition to reading the following risk factors, prospective purchasers should read “Material U.S. Federal Income Tax Consequences” for a more complete discussion of the expected material federal income tax consequences of owning and disposing of our Class A Common Units.
We are treated as a corporation for U.S. federal income tax purposes, and our distributions to our Class A Common Unitholders may be substantially reduced.
We are a Delaware limited partnership and have elected to be treated as a corporation for U.S. federal income tax purposes. As a result, we are subject to tax as a corporation at the corporate tax rate. Because an entity-level tax is imposed on us due to our status as a corporation for U.S. federal income tax purposes, our distributable cash flow may be substantially reduced by our tax liabilities.
Distributions to Class A Common Unitholders may be taxable as dividends.
Because we are treated as a corporation for U.S. federal income tax purposes, if we make distributions to our Class A Common Unitholders from current or accumulated earnings and profits as computed for U.S. federal income tax purposes, such distributions will be treated as distributions on corporate stock for U.S. federal income tax purposes, and generally be taxable to our Class A Common Unitholders as ordinary dividend income for U.S. federal income tax purposes (to the extent of our current and accumulated earnings and profits). Such dividend distributions paid to non-corporate U.S. unitholders will be subject to U.S. federal income tax at preferential rates, provided that certain holding period and other requirements are satisfied. Any portion of our distributions
77
Table of Contents
to Class A Common Unitholders that exceeds our current and accumulated earnings and profits as computed for U.S. federal income tax purposes will constitute a non-taxable return of capital distribution to the extent of a Class A Common Unitholder’s basis in its Class A Common Units and thereafter as gain on the sale or exchange of such units.
U.S. tax legislation and regulations may change over time, and such changes may adversely affect our business, financial condition, results of operations, and cash flow.
From time to time, legislation has been proposed that, if enacted into law, would make significant changes to U.S. federal and state income tax laws affecting the oil and natural gas industry, such as eliminating the immediate deduction for intangible drilling and development costs. No accurate prediction can be made as to whether any such legislative changes or similar or other tax changes will be proposed or enacted in the future or, if enacted, what the specific provisions or the effective date of any such legislation would be.
In addition, legislation may be proposed with respect to the enactment of a tax levied on the carbon content of fuels based on the GHG emissions associated with such fuels. A carbon tax, whether imposed on producers or consumers, would generally increase the prices for crude oil and natural gas. Such price increases may, in turn, reduce demand for crude oil and natural gas and materially and adversely affect our cash flows, results of operations and financial condition.
In August 2022, President Biden signed into law the IRA, which, among other changes, imposes a 15% corporate alternative minimum tax (the “CAMT”) on the “adjusted financial statement income” of certain large corporations (generally, corporations reporting at least $1 billion average adjusted financial statement net income). We do not believe we will be subject to the CAMT; however, to the extent we are subject to the CAMT, our cash obligations for U.S. federal income taxes could be accelerated. The U.S. Treasury Department, the Internal Revenue Service and other standard-setting bodies are expected to continue to issue guidance on how the CAMT and other provisions of the IRA will be applied or otherwise administered which may differ from our interpretations.
We are unable to predict the timing, scope and effect of any proposed or enacted tax law changes, but any such changes (if enacted) could adversely affect our business, financial condition, results of operations, and cash flows.
78
Table of Contents
We expect the net proceeds from this offering to be approximately $57.2 million ($66.4 million if the underwriters exercise their option in full to purchase 705,000 additional Class A Common Units), based upon the assumed initial public offering price of $14.00 per Class A Common Unit (the mid-point of the price range set forth on the cover of this prospectus), after deducting underwriting discounts (including the structuring fee) and estimated expenses. We expect that approximately $40.9 million of the net proceeds will be used to repay a portion of the amount outstanding under our Existing Credit Facility (including the applicable prepayment penalty), approximately $0.6 million of the net proceeds will be used to pay bonuses to certain of our executives related to the consummation of this offering and the remaining approximately $15.7 million of the net proceeds will remain at the Partnership initially designated as a reserve for general partnership purposes, including in order to pay distributions on our Class A Common Units if needed.
We are currently negotiating the New Credit Facility and assuming we enter into the New Credit Facility at the closing of this offering, we will use approximately $15.0 million in borrowings under the New Credit Facility and approximately $40.9 million of the net proceeds of this offering to repay in full (including payment of the applicable prepayment fee) and terminate our Existing Credit Agreement. In the event that we are unable to obtain binding commitments for the New Credit Facility on acceptable terms, $15.0 million of the $15.7 million of net proceeds that would otherwise be designated as a reserve for general partnership purposes will be used to repay the balance on the Existing Credit Agreement. See “Prospectus Summary—Reorganization Transactions, Partnership Structure and Expected Refinancing Transaction—Expected Refinancing Transaction” for additional information.
As of June 30, 2024, we had approximately $57.35 million of outstanding borrowings under the Existing Credit Facility, which has a maturity date of January 31, 2027. As of September 30, 2024, we had approximately $54.25 million of outstanding borrowings under the Existing Credit Facility. Borrowings outstanding under the Existing Credit Agreement are initially Term SOFR Loans (as defined in the Existing Credit Agreement), which bear interest at a rate equal to the sum of (i) the Term SOFR Rate for a three-month interest period, plus 0.15% (“Adjusted Term SOFR Rate”); and (ii) 8.00% per annum. Borrowings outstanding under the Existing Credit Facility bore interest at a weighted average rate of 13.5% as of June 30, 2024. The outstanding borrowings under our Existing Credit Facility were incurred to repay in full the Prior Credit Facility (as hereinafter defined) and the NPA (as hereinafter defined), as well as the related debt issuance costs. The remaining outstanding borrowings under the Existing Credit Facility have been incurred to fund Peak E&P’s capital expenditures.
We have granted the underwriters a 30-day option to purchase up to an aggregate of 705,000 additional Class A Common Units to cover over-allotments of Class A Common Units. To the extent the underwriters’ option to purchase additional Class A Common Units is exercised, we may use the proceeds from the sale of these additional shares to reduce debt under the New Credit Facility (assuming we enter into the New Credit Facility at the closing of this offering) or increase the amount of the net proceeds to be designated as a reserve for general partnership purposes.
A $1.00 increase (decrease) in the assumed initial public offering price of $14.00 per Class A Common Unit (the midpoint of the price range set forth on the cover of this prospectus) would cause the net proceeds from this offering, after deducting the underwriting discounts and commissions (including the structuring fee), and estimated offering expenses, to increase (decrease), respectively, by approximately $4.4 million, assuming the number of Class A Common Units offered by us, as set forth on the cover page of this prospectus, remains the same. If the proceeds increase due to a higher initial public offering price, we may use the additional net proceeds to reduce debt under the New Credit Facility (assuming we enter into the New Credit Facility at the closing of this offering) or increase the amount of the net proceeds to be designated as a reserve for general partnership purposes. If the proceeds decrease due to a lower initial public offering price, we would reduce by a corresponding amount the net proceeds to be designated as a reserve for general partnership purposes.
79
Table of Contents
The sources and uses of our proceeds may differ from those set forth above. The foregoing represents our current intentions with respect to the use and allocation of the net proceeds of this offering based upon our present plans and business conditions and expectation that we will enter into the New Credit Facility at closing, but our management will have significant flexibility and discretion in applying the net proceeds. The occurrence of unforeseen events or changes in business conditions could result in application of the net proceeds of this offering in a manner other than as described in this prospectus.
80
Table of Contents
The following table sets forth as of June 30, 2024:
• | Our predecessor’s combined historical capitalization on an actual basis; and |
• | Our predecessor’s combined historical capitalization as adjusted to give effect to (i) the transactions described under “Prospectus Summary—Reorganization Transactions, Partnership Structure and Expected Refinancing Transaction” and (ii) this offering and the application of the net proceeds therefrom as set forth under “Use of Proceeds.” |
The information set forth in the table below is illustrative only and will be adjusted based on the actual initial public offering price and other final terms of this offering. This table should be read in conjunction with, and is qualified in its entirety by reference to, “Use of Proceeds,” “Management’s Discussion and Analysis of Financial Condition and Results of Operations” and our historical and pro forma financial statements and related notes appearing elsewhere in this prospectus. For a description of the pro forma adjustments, please read our unaudited pro forma condensed combined financial statements.
As of June 30, 2024 | ||||||||
Predecessor Combined Historical | As Adjusted | |||||||
Cash and Cash Equivalents | $ | 9,170 | $ | 25,904 | ||||
|
|
|
| |||||
Long-Term Debt, including Current Portion: | ||||||||
Existing Credit Agreement(1) | $ | 57,350 | — | |||||
New Credit Facility(2) | — | $ | 15,000 | |||||
Partners’ Capital/Net Equity: | ||||||||
Class A Common Units held by the public | $ | — | $ | 57,194 | ||||
Class A Common Units held by Existing Owners | — | $ | 3,347 | |||||
Class B Common Units held by Existing Owners | — | $ | 118,685 | |||||
Preferred Equity Held by Existing Owners | $ | 95,886 | — | |||||
Common Equity Held by Existing Owners | $ | 24,545 | — | |||||
|
|
|
| |||||
Total Equity | $ | 120,431 | $ | 179,226 | ||||
|
|
|
| |||||
Total Capitalization | $ | 177,781 | $ | 194,226 | ||||
|
|
|
|
(1) | Including current portion as of June 30, 2024 and September 30, 2024, Peak E&P had approximately $57.35 million and $54.25 million, respectively, of outstanding borrowings under the Existing Credit Agreement. We intend to terminate our Existing Credit Agreement in connection with the closing of this offering. For more information on the Existing Credit Agreement, see “Management’s Discussion and Analysis of Financial Condition and Results of Operations—Debt Agreements—Existing Credit Agreement.” |
(2) | We are currently negotiating the New Credit Facility and assuming we enter into the New Credit Facility at the closing of this offering, we will use borrowings under the New Credit Facility and a portion of the net proceeds of this offering to repay in full (including payment of the applicable prepayment fee) and terminate our Existing Credit Agreement. |
81
Table of Contents
Dilution is the amount by which the offering price paid by the purchasers of Class A Common Units sold in this offering will exceed the pro forma net tangible book value per Class A Common Unit after this offering. Pro forma net tangible book value is our total tangible assets less total liabilities. Purchasers of the Class A Common Units in this offering will experience immediate and substantial dilution in the pro forma net tangible book value per Class A Common Unit for accounting purposes. Our pro forma net tangible book value as of June 30, 2024, after giving effect to the transactions described under “Prospectus Summary—Reorganization Transactions, Partnership Structure and Expected Refinancing Transaction,” was $122.8 million, or $12.46 per Class A Common Unit.
Assuming an initial public offering price of $14.00 per Class A Common Unit (which is the midpoint of the price range set forth on the cover page of this prospectus), after giving further effect to the sale of the Class A Common Units in this offering and assuming the receipt of the estimated net proceeds, after deducting estimated underwriting discounts and commissions (including the structuring fee) and estimated offering expenses, our adjusted pro forma net tangible book value as of June 30, 2024 would have been approximately $178.8 million, or $12.29 per Class A Common Unit. This represents an immediate decrease in the pro forma net tangible book value of $0.17 per Class A Common Unit to the Existing Owners of Class A Common Units and immediate dilution to new investors purchasing Class A Common Units in this offering of $1.71 per Class A Common Unit. The following table illustrates the per Class A Common Unit dilution to new investors purchasing Units in this offering:
Assumed initial public offering price per Class A Common Unit | $ | 14.00 | ||||||
Pro forma net tangible book value per Class A Common Unit before this offering(1) | $ | 12.46 | ||||||
Decrease in pro forma net tangible book value per Class A Common Unit attributable to purchasers in the offering | (0.17 | ) | ||||||
|
| |||||||
Less: Pro forma net tangible book value per Class A Common Unit after this offering(2) | $ | 12.29 | ||||||
|
| |||||||
Immediate dilution in pro forma net tangible net book value per Class A Common Unit to purchasers in the offering(3)(4) | $ | 1.71 | ||||||
|
|
(1) | Determined by dividing the pro forma net tangible book value immediately prior to the offering by the number of Class A Common Units and Class B Common Units held by the Existing Owners, after giving effect to the Reorganization Transactions. |
(2) | Determined by dividing our pro forma as adjusted net tangible book value, after giving effect to the application of the net proceeds of Class A Common Units in this offering, by the total number of Class A Common Units and Class B Common Units to be outstanding after this offering after giving effect to the Reorganization Transactions. |
(3) | If the initial public offering price were to increase or decrease by $1.00 per Class A Common Unit, then pro forma net tangible book value per Class A Common Unit would equal $12.59 and $11.99, respectively. |
(4) | Because the total number of Class A Common Units outstanding following the consummation of this offering will be impacted by any exercise of the underwriters’ option to purchase additional Class A Common Units and any net proceeds from such exercise will be retained by us, there will be a change to the dilution in pro forma net tangible book value per Class A Common Unit to purchasers in the offering due to any such exercise of the underwriters’ option to purchase 705,000 additional Class A Common Units. |
82
Table of Contents
The following table summarizes, on an adjusted pro forma basis as of June 30, 2024, the total number of Class A Common Units owned by the Existing Owners, and to be owned by new investors purchasing Class A Common Units in this offering, the total consideration paid, and the price per Class A Common Unit paid by the Existing Owners and to be paid by new investors purchasing Class A Common Units in this offering at our initial public offering price of $14.00 per Class A Common Unit, calculated before deduction of estimated underwriting discounts and commissions:
Class A Common Units Acquired | Total Consideration | |||||||||||||||
Number | Percent | Amount | Percent | |||||||||||||
(in thousands) | ||||||||||||||||
Existing Owners | 239,065 | 4.8 | % | $ | 3,346,910 | 4.8 | % | |||||||||
Purchasers in the offering | 4,700,000 | 95.2 | % | $ | 65,800,000 | 95.2 | % | |||||||||
|
|
|
|
|
|
|
| |||||||||
Total | 4,939,065 | 100.0 | % | $ | 69,146,910 | 100.0 | % | |||||||||
|
|
|
|
|
|
|
|
83
Table of Contents
OUR CASH DISTRIBUTION POLICY AND RESTRICTIONS ON DISTRIBUTIONS
You should read the following discussion of our cash distribution policy in conjunction with the factors and assumptions upon which our cash distribution policy is based, which are included under the heading “—Assumptions and Considerations” below. In addition, you should read “Risk Factors” and “Cautionary Note Regarding Forward-Looking Statements” for information regarding statements that do not relate strictly to historical or current facts and certain risks inherent in our business.
Distributions to Class A Common Unitholders
Our partnership agreement requires us to distribute all of our Available Cash, if any. Our cash distribution policy reflects a basic judgment that our unitholders generally will be better served by our re-investing a portion of our cash flow sufficient to generate meaningful annual production growth and distributing our remaining cash, after expenses and cash reserves, rather than distributing all of it. Our general partner intends to maintain a significant cash reserve in the Partnership.
Generally, we define “Available Cash” as cash on hand at the end of such quarter, plus certain distributions or dividends received after the end of the quarter, plus certain working capital borrowings and proceeds from this offering if determined by our general partner, less cash reserves established by our general partner, including for the proper conduct of our business, such as for capital expenditures, acquisitions, debt service, compliance with law and loan agreements and future distributions. We may, but are under no obligation to, borrow funds to make quarterly cash distributions to Class A Common Unitholders, for example, in circumstances where we believe that the distribution level is sustainable over the long-term, but short-term factors have caused Available Cash to be insufficient to pay the distribution at the current level.
Under our current cash distribution policy, within 90 days after the end of each quarter, beginning with the quarter ending December 31, 2024, we intend to make quarterly distributions of all of our Available Cash to the holders of our Class A Common Units. However, other than the requirement in our partnership agreement to distribute all of our Available Cash each quarter, we have no legal obligation to make quarterly cash distributions of our Available Cash, and our general partner has considerable discretion to determine the amount of Available Cash for distribution each quarter. Our goal is to make a distribution of at least $0.30 per Class A Common Unit per quarter (adjusted for the number of days in the first quarterly period after the closing date of this offering), which we refer to as our initial target quarterly distribution. Our goal is to make consistent quarterly distributions of Available Cash to our Class A Common Unitholders at or above our initial target quarterly distribution amount that grow over time. The record date for Class A Common Unitholders to receive each quarterly cash distribution will be set by our general partner at least ten (10) business days before the distribution payment date. However, to the extent there is no Available Cash, our partnership agreement does not require us to pay distributions on our Class A Common Units on a quarterly basis or otherwise.
Our general partner will receive 10% of the amount distributed above the initial target quarterly distribution per Class A Common Unit after the sixth full calendar quarter following the consummation of this offering (and also share in distributions from capital surplus, liquidating distributions and distributions of proceeds from any sale of our investment in PSI).
To the extent that our ability to transfer cash from any of our operating subsidiaries to the Partnership is restricted under the Existing Credit Agreement or the New Credit Facility, which we are in the process of negotiating, burdening our assets, or our cash flow from operations is insufficient to fully or partially fund a distribution on the Class A Common Units, our general partner will have the discretion to make cash distributions to Class A Common Unitholders from cash reserves at the Partnership level, including from the net proceeds of this offering initially designated as reserves.
84
Table of Contents
Limitations on Cash Distributions and Our Ability to Change Our Cash Distribution Policy
Although our partnership agreement requires that we distribute all of our Available Cash, if any, quarterly, there is no guarantee that we will make quarterly cash distributions to our Class A Common Unitholders at the initial target quarterly distribution amount, or at all, and we have no legal obligation to do so. Our current cash distribution policy is subject to certain restrictions, as well as the considerable discretion of our general partner in determining the amount of our Available Cash and cash reserves each quarter. The following factors will affect our ability to make cash distributions, as well as the amount of any cash distributions we make:
• | Our cash distribution policy may be subject to restrictions on distributions under the Existing Credit Agreement or our New Credit Facility, which we are in the process of negotiating, or other debt agreements that we may enter into in the future. Specifically, our Existing Credit Agreement contains, and we anticipate that our New Credit Facility will contain, financial tests and covenants that we must satisfy in order to pay distributions. These financial tests and covenants are described in “Management’s Discussion and Analysis of Financial Condition and Results of Operations—Debt Agreements—Existing Credit Agreement” and “Management’s Discussion and Analysis of Financial Condition and Results of Operations—Factors Affecting the Comparability of our Future Results of Operations to Our Historical Results of Operations—New Credit Facility.” Should we be unable to satisfy these covenants, or if a default or event of default occurs under our Existing Credit Agreement or New Credit Facility, we would be prohibited from making cash distributions to our Class A Common Unitholders notwithstanding our stated cash distribution policy. Any future indebtedness may contain similar or more stringent restrictions. |
• | The amount of cash that we distribute and the decision to make any distribution is determined by our general partner, taking into consideration the terms of our partnership agreement. Specifically, our general partner will have the authority to establish cash reserves for the prudent conduct of our business and the establishment of or increase in those reserves could result in a reduction in cash distributions from levels we currently anticipate pursuant to our stated cash distribution policy. Any decision to establish cash reserves made by our general partner in good faith will be binding on our unitholders. If our general partner does not set aside sufficient cash reserves or make sufficient cash expenditures to maintain the current production levels over the long-term of our oil and natural gas properties, we will be unable to pay any cash distributions from cash generated from operations. Our general partner intends to maintain a significant cash reserve in the Partnership. We are unlikely to be able to sustain our current level of distributions without making capital expenditures on development drilling or acquisitions that maintains the current production levels of our oil and natural gas properties. Decreases in commodity prices from current levels will adversely affect our ability to pay distributions. If our asset base decreases and we do not reduce our distributions, a portion of the distributions may have the effect of, and may effectively represent, a return of part of our unitholders’ investment in us as opposed to a return on our unitholders’ investment. |
• | Prior to making any cash distribution on our Class A Common Units, we will reimburse our general partner and its affiliates for all direct and indirect expenses they incur on our behalf. Our partnership agreement does not set a limit on the amount of expenses for which our general partner and its affiliates may be reimbursed. These expenses include salary, bonus, incentive compensation and other amounts paid to persons who perform services for us or on our behalf and expenses allocated to our general partner by its affiliates. Our partnership agreement provides that our general partner will determine in good faith the expenses that are allocable to us. The reimbursement of expenses and payment of fees, if any, to our general partner and its affiliates will reduce the amount of cash available to pay cash distributions to our Class A Common Unitholders. |
• | Although our partnership agreement requires us to distribute all of our Available Cash, if any, to our Class A Common Unitholders, our partnership agreement, including the provisions requiring us to make cash distributions contained therein, may be amended. Our partnership agreement generally may be amended with the consent of our general partner and the approval of the holders of a majority of our |
85
Table of Contents
outstanding Class A Common Units and Class B Common Units (including any such Class A Common Units and Class B Common Units held by our general partner, its members and their respective affiliates), voting together as a single class. Immediately upon the consummation of this offering, the Sponsors will control our general partner, and investment partnerships managed by Yorktown will own approximately 57.5% of our outstanding Class A Common Units and Class B Common Units, voting as a single class. Please read “The Partnership Agreement—Amendment of the Partnership Agreement.” Our general partner has significant discretion to calculate the amount of Available Cash and amount of distributions to our Class A Common Unitholders. |
• | Even if our cash distribution policy is not modified or revoked, the amount of distributions we pay under our cash distribution policy and the decision to make any distribution is determined by our general partner. |
• | Under Section 17-607 of the Delaware Revised Uniform Limited Partnership Act, we may not make a distribution to any of our unitholders if the distribution would cause our liabilities to exceed the fair value of our assets. |
• | We may lack sufficient Available Cash to pay distributions to our Class A Common Unitholders due to a number of factors, including decreases in commodity prices, decreases in our oil and natural gas production or increases in our general and administrative expenses, principal and interest payments on our outstanding debt, tax expenses, working capital requirements or anticipated cash needs. |
• | To the extent that our Distributable Cash from Operations is insufficient to pay the initial target quarterly distribution or the level of distribution estimated to be paid in future quarters to the Class A Common Unitholders or to the extent we are restricted in our ability to transfer cash from our operating subsidiaries, we will still have the option to use the proceeds of this offering initially designated as reserves to pay a quarterly cash distribution to Class A Common Unitholders, but we will also have the ability to reduce our quarterly cash distribution in order to service or repay our debt, fund maintenance or grow capital expenditures. |
• | While our Class B Common Units are not entitled to cash distributions (other than distributions of Available Cash from capital surplus, distributions of proceeds from the sale of our investment in PSI and liquidating distributions), those units are mandatorily convertible (at the election of our general partner) into Class A Common Units based upon an excess Distributable Cash from Operations coverage test. See “Description of Our Securities—Conversion of Class B Common Units.” |
Our Partnership Agreement Requires That We Distribute All of Our Available Cash, if Any, Which Could Limit Our Ability to Grow
Our partnership agreement requires us to distribute all of our Available Cash, if any, to our Class A Common Unitholders on a quarterly basis. Even though our general partner maintains significant flexibility on its ability to establish cash reserves, our growth may not be as fast as businesses that reinvest a higher portion of their cash to expand ongoing operations. Further, we may rely upon our cash reserves, including the net proceeds that we will receive in this offering and external financing sources, including expected borrowings under our New Credit Facility, which we are currently negotiating, and the issuance of other debt and equity securities, to fund future capital expenditures on development and acquisitions. Following the completion of this offering, we expect that we will need to utilize the public equity or debt markets and bank financings to fund future development, capital expenditures and acquisitions. To the extent we require external sources of capital to fund our growth and are unable to access such sources, the requirement in our partnership agreement to distribute all of our Available Cash and our current cash distribution policy may impair our ability to grow. Our Existing Credit Agreement does, and our New Credit Facility may, and any future debt agreements may, limit our ability to incur additional debt, including through the issuance of debt securities. Please read “Risk Factors—Risks Related to Our Indebtedness—Our Existing Credit Agreement contains restrictions and financial covenants that may restrict our business and financing activities and our ability to pay distributions.” To the extent we issue
86
Table of Contents
additional Class A Common Units, including through conversion of the Class B Common Units, the payment of distributions on those additional Class A Common Units may increase the risk that we will be unable to maintain or increase our cash distributions per Class A Common Unit. There are no limitations in our partnership agreement on our ability to issue additional units, including units ranking senior to our Class A Common Units, and our Class A Common Unitholders will have no preemptive or other rights (solely as a result of their status as Class A Common Unitholders) to purchase any such additional units. If we incur additional debt to finance our growth strategy, we will have increased interest expense, which in turn will reduce the Available Cash that we have to distribute to our unitholders. See “Risk Factors—Risks Inherent in an Investment in Us—Increases in interest rates could adversely impact our unit price and our ability to issue additional equity and incur debt.”
Unaudited Pro Forma and Estimated Distributable Cash from Operations
The following table illustrates, on an unaudited pro forma basis for the year ended December 31, 2023 and the twelve months ended June 30, 2024, the amount of Distributable Cash from Operations that would have been available for distribution to our Class A Common Unitholders, assuming in each case that this offering had been consummated on January 1, 2023. For purposes of comparison, we have also included in this table our estimates of Distributable Cash from Operations for the twelve months ending June 30, 2025 and for the twelve months ending December 31, 2025 that would be available for distribution to our Class A Common Unitholders. All of the amounts for the twelve months ending June 30, 2025 and the twelve months ending December 31, 2025 in the table below are estimates. The assumptions that we believe are relevant to particular estimated line items in the table below are explained in the corresponding footnotes and in “—Assumptions and Considerations.”
87
Table of Contents
Peak Resources LP
Unaudited Pro Forma and Estimated Distributable Cash from Operations
Pro Forma | Estimated(1) | |||||||||||||||
Year Ended December 31, 2023 | Twelve Months Ended June 30, 2024 | Twelve Months Ending June 30, 2025 | Twelve Months Ending December 31, 2025 | |||||||||||||
(in thousands) | ||||||||||||||||
Net Loss(2) | $ | (85,387 | ) | $ | (94,113 | ) | $ | 4,639 | $ | 12,280 | ||||||
Interest expense, net of interest income(3) | 1,591 | 1,589 | 2,629 | 1,208 | ||||||||||||
Income tax provision (benefit) | (22,698 | ) | (25,017 | ) | 1,233 | 3,264 | ||||||||||
Depreciation, depletion and amortization | 28,801 | 22,689 | 27,463 | 39,745 | ||||||||||||
Impairment of oil and natural gas properties(4) | 111,871 | 111,871 | — | — | ||||||||||||
Accretion | 227 | 230 | 238 | 252 | ||||||||||||
Exploration expenses | — | — | — | — | ||||||||||||
Non-cash (gain) loss on commodity derivatives | (5,266 | ) | 7,422 | — | — | |||||||||||
Non-cash incentive compensation expenses | — | — | — | — | ||||||||||||
Non-cash (gain) loss on extinguishment of debt | 1,080 | (9 | ) | — | — | |||||||||||
Non-cash (gain) loss on investment in PSI | — | (2,304 | ) | — | — | |||||||||||
Abandonment | 2,932 | 2,009 | — | — | ||||||||||||
Other (gain) loss | — | — | — | — | ||||||||||||
Adjusted EBITDAX(5) | 33,151 | 24,367 | $ | 36,202 | $ | 56,749 | ||||||||||
Cash interest expense, net of interest income(3) | (1,460 | ) | (1,458 | ) | (2,595 | ) | (1,163 | ) | ||||||||
Maintenance capital expenditures(6) | (349 | ) | — | — | — | |||||||||||
Expansion capital expenditures(6) | (10,163 | ) | (6,936 | ) | (32,193 | ) | (75,858 | ) | ||||||||
Acquisition costs | — | — | — | — | ||||||||||||
Cash income tax payments | — | — | — | — | ||||||||||||
Reimbursement of general partner expenses | — | — | — | — | ||||||||||||
Other | — | — | — | |||||||||||||
Distributable Cash from Operations(7)(8)(9) | $ | 21,179 | $ | 15,973 | $ | 1,413 | $ | (20,272 | ) | |||||||
|
|
|
|
|
|
|
| |||||||||
Estimated Annual Cash Distributions (based on initial target quarterly distribution of $0.30 per Class A Common Unit): | ||||||||||||||||
Distributions on Class A Common Units held by purchasers in this offering(10) | $ | 5,640 | $ | 5,640 | $ | 4,256 | $ | 5,728 | ||||||||
Distributions on Class A Common Units held by our general partner and its affiliates(10) | $ | 289 | $ | 289 | $ | 217 | $ | 291 | ||||||||
Total estimated annual cash distributions(10) | $ | 5,929 | $ | 5,929 | $ | 4,473 | $ | 6,019 | ||||||||
Total estimated distributions from cash on hand(10) | — | — | $ | 3,060 | $ | 6,019 |
88
Table of Contents
(1) | See “—Assumptions and Considerations” for information about the assumptions we have made for the financial forecast underlying our estimates. |
(2) | Pro forma net loss reflects a pro forma income tax benefit of $22.7 million for the year ended December 31, 2023 and $25.0 million for the twelve months ended June 30, 2024, all of which is associated with the income tax effects of the corporate reorganization described under “Prospectus Summary—Reorganization Transactions, Partnership Structure and Expected Refinancing Transaction” and this offering. Our predecessor was not subject to U.S. federal income tax at an entity level. As a result, the consolidated net loss in our historical financial statements does not reflect the tax expense or benefit we would have incurred if we were subject to U.S. federal income tax at an entity level during such periods. |
(3) | The following table provides a reconciliation of cash interest expense, net of interest income, to interest expenses, net of interest income for the pro forma periods presented: |
Year Ended December 31, 2023 | Twelve Months Ended June 30, 2024 | |||||||
Interest expense, net of interest income | $ | 1,591 | $ | 1,589 | ||||
(Decrease in) accrued interest expense | — | — | ||||||
Amortization of deferred finance cost | | (131 | ) | (131 | ) | |||
|
|
|
| |||||
Cash interest expense, net of interest income | $ | 1,460 | $ | 1,458 |
(4) | Impairment for the year ended December 31, 2023 and the twelve months ended June 30, 2024 was primarily due to a decrease in the value of proved oil and natural gas reserves as a result of lower oil and natural gas prices at December 31, 2023 and June 30, 2024, respectively as well as SEC guidelines on development pace. For the year ended December 31, 2023, oil and natural gas prices calculated in accordance with SEC guidelines decreased by 16.5% and 58.5%, respectively, as compared to the year ended December 31, 2022. |
(5) | Adjusted EBITDAX is not a financial measure calculated in accordance with GAAP, but we believe it provides important perspective regarding our operating results. “The Offering—Non-GAAP Financial Measures” contains a description of Adjusted EBITDAX and a reconciliation to our net income (loss), our most directly comparable financial measure calculated in accordance with GAAP. |
(6) | Maintenance capital expenditures are those capital expenditures required to maintain, over the long-term, the operating capacity of, or the revenue generated by, our capital assets and are incurred as an oil or gas property is impacted by an unforeseen condition impacting its expected production. Natural declines in production that occur through the life of an oil or gas property will not be directly affected by incurring maintenance capital expenditures. Expansion capital expenditures are those capital expenditures that increase the operating capacity of, or the revenue generated by, our capital assets. |
(7) | Distributable Cash from Operations is not a financial measure calculated in accordance with GAAP, but we believe it provides important perspective regarding our ability to internally fund our exploration and development activities, pay distributions, and to service or incur additional debt. “The Offering—Non-GAAP Financial Measures” contains a description of Distributable Cash from Operations and a reconciliation to net income (loss), our most directly comparable financial measure calculated in accordance with GAAP. |
(8) | If we had completed the transactions contemplated in this prospectus on January 1, 2023, our pro forma Distributable Cash from Operations would have been sufficient to pay our initial target quarterly distributions for the quarters in both pro forma periods presented. To the extent that our Distributable Cash from Operations had been insufficient to pay our initial target quarterly distributions, a portion of the quarterly cash distributions to our Class A Common Unitholders would have been made from our cash on hand, including from proceeds from this offering initially designated as reserves. |
(9) | Based on our current financial projections, all or a portion of the quarterly cash distributions to our Class A Common Unitholders through December 31, 2025 is expected to be made from our cash on hand, including partially from proceeds of this offering initially designated as reserves. |
(10) | For the pro forma periods presented, assumes quarterly distributions in all four quarters of such period at the initial target quarterly distribution of $0.30 per Class A Common Unit. With respect to estimated |
89
Table of Contents
distributions for the twelve months ending June 30, 2025, assumes no distribution for the first quarterly period and quarterly distributions of $0.30 per Class A Common Unit for each of the other three quarterly periods in the twelve months ending June 30, 2025. With respect to estimated distributions for the twelve months ending December 31, 2025, assumes quarterly distributions of $0.30 per Class A Common Unit for each of the first two quarterly periods and quarterly distributions of $0.31 per Class A Common Unit for each of the last two quarterly periods in the twelve months ending December 31, 2025. |
Unaudited Pro Forma Distributable Cash from Operations for the Year Ended December 31, 2023 and the Twelve Months Ended June 30, 2024
If we had completed the transactions contemplated in this prospectus on January 1, 2023, our pro forma Distributable Cash from Operations would have been approximately $21.2 million for the year ended December 31, 2023 and $16.0 million for the twelve months ended June 30, 2024, which would have been sufficient to pay our initial target quarterly distributions for the quarters in those periods. To the extent that our Distributable Cash from Operations had been insufficient to pay our initial target quarterly distributions, all or a portion of the quarterly cash distributions to our Class A Common Unitholders would have been made from our cash on hand, including from proceeds from this offering initially designated as reserves.
Upon the completion of this offering, we expect to incur incremental non-recurring costs related to our transition to a publicly traded partnership, including the costs of this offering and the costs associated with the initial implementation of our internal control implementation and testing. We also expect to incur additional recurring costs related to being a publicly-traded partnership, including costs associated with the employment of additional personnel, compliance under the Exchange Act and applicable securities exchange requirements, annual and quarterly reports to be filed with the SEC, tax return preparation, independent auditor fees, incremental legal fees, investor relations activities, registrar and transfer agent fees, and incremental director and officer liability insurance costs. The direct, incremental general and administrative expenses are not included in our historical or pro forma financial statements; however, we expect those expenses to be approximately $2.5 million per year. These costs are not included in our unaudited pro forma Distributable Cash from Operations calculation above.
The pro forma financial statements appearing elsewhere in this prospectus, from which pro forma Distributable Cash from Operations is derived, do not purport to present our results of operations had the transactions contemplated in this prospectus actually been completed as of the dates indicated. Furthermore, Distributable Cash from Operations is a cash accounting concept, while our unaudited pro forma financial statements have been prepared on an accrual basis. We derived the amounts of pro forma Distributable Cash from Operations stated above in the manner described in the table above. As a result, the amount of pro forma Distributable Cash from Operations should only be viewed as a general indication of the amount of Distributable Cash from Operations that we might have generated had we been formed and completed the transactions contemplated in this prospectus in earlier periods.
Estimated Distributable Cash from Operations for the Twelve Months Ending June 30, 2025 and the Twelve Months Ending December 31, 2025
The financial forecast presents, to the best of our knowledge and belief, our expected results of operations, Adjusted EBITDAX and Distributable Cash from Operations for the twelve months ending June 30, 2025 and the twelve months ending December 31, 2025. Based upon the assumptions and considerations set forth in the table below, we forecast that our estimated Distributable Cash from Operations for the twelve months ending June 30, 2025 and the twelve months ending December 31, 2025 will be insufficient to pay our initial target quarterly distribution of $0.30 per Class A Common Unit for each of the quarters presented. As a result, we forecast that all or a portion of the quarterly cash distributions to our Class A Common Unitholders for the twelve months ending June 30, 2025 and the twelve months ending December 31, 2025 will be made from our cash on hand, including partially from proceeds from this offering initially designated as reserves. The number of outstanding Class A Common Units on which we have based these forecasts does not include (i) any Class A Common Units
90
Table of Contents
that may be issued under the long-term incentive plan that our general partner is expected to adopt, the anticipated issuance and related vesting of which is not expected to significantly impact the total number of outstanding Class A Common Units for the periods presented herein, or (ii) the issuance of any Class A Common Units upon mandatory conversion of Class B Common Units, which would not be eligible for conversion prior to December 31, 2025 based on the eligibility requirements for conversion described in “Description of Our Securities—Conversion of Class B Common Units.” Furthermore, the financial forecast assumes that we do not make any acquisitions of properties during the twelve months ending June 30, 2025 or the twelve months ending December 31, 2025.
Our Statement of Estimated Adjusted EBITDAX, Distributable Cash from Operations and Available Cash reflects our judgment, as of the date of this prospectus, of conditions we expect to exist and the course of action we expect to take for the twelve months ending June 30, 2025 and the twelve months ending December 31, 2025, as applicable. The assumptions discussed below under “—Assumptions and Considerations” are those that we believe are significant to our ability to generate the requisite Adjusted EBITDAX, Distributable Cash from Operations and Available Cash. Based on such assumptions, we believe our actual results of operations, cash flow and proceeds from this offering will be sufficient to generate the Adjusted EBITDAX, Distributable Cash from Operations and Available Cash necessary to pay the quarterly and annualized cash distributions set forth below. We cannot, however, give you any assurance that we will generate this amount. There will likely be differences between our estimated Adjusted EBITDAX, Distributable Cash from Operations and Available Cash and our actual results, and those differences could be material. If we fail to generate the estimated Adjusted EBITDAX, Distributable Cash from Operations and Available Cash contained in our forecast, our annualized cash distribution to our Class A Common Unitholders may be less than expected. We can give you no assurance that our assumptions will be realized, in which event we will not be able to pay quarterly cash distributions to our Class A Common Unitholders.
While we do not as a matter of course make public projections as to future sales, earnings or other results, our management has prepared the prospective financial information that is the basis of our estimated Adjusted EBITDAX, Distributable Cash from Operations and Available Cash below to substantiate our belief that we will have sufficient Available Cash to pay the forecasted $0.91 cash distribution per Class A Common Unit for the twelve months ending June 30, 2025 and the forecasted $1.22 cash distribution per Class A Common Unit for the twelve months ending December 31, 2025. This forecast is a forward-looking statement and should be read together with our historical financial statements and the accompanying notes included elsewhere in this prospectus and “Management’s Discussion and Analysis of Financial Condition and Results of Operations.” The accompanying prospective financial information was not prepared with a view toward complying with the published guidelines of the SEC or the guidelines established by the American Institute of Certified Public Accountants with respect to prospective financial information, but, in the view of our management, is substantially consistent with those guidelines and was prepared on a reasonable basis, reflects the best currently available estimates and judgments, and presents, to the best of management’s knowledge and belief, the assumptions and considerations on which we base our belief that we can generate Adjusted EBITDAX, Distributable Cash from Operations and Available Cash necessary for us to pay annualized cash distributions of $0.91 per Class A Common Unit for the twelve months ending June 30, 2025 and $1.22 per Class A Common Unit for the twelve months ending December 31, 2025. Readers of this prospectus are cautioned not to place undue reliance on this prospective financial information. Please read “—Assumptions and Considerations,” including the sensitivity analysis included therein.
The prospective financial information included in this prospectus has been prepared by, and is the responsibility of, our management. Our independent registered public accounting firm has not compiled, examined or performed any procedures with respect to the accompanying prospective financial information and, accordingly, our independent registered public accounting firm does not express an opinion or any other form of assurance with respect thereto. The reports of our independent registered public accounting firm included in the registration statement relate to our historical financial information. It does not extend to the prospective financial information and should not be read to do so.
91
Table of Contents
When considering our financial forecast, you should keep in mind the risk factors and other cautionary statements under “Risk Factors.” Any of the risks discussed in this prospectus, to the extent they are realized, could cause our actual results of operations to vary significantly from those that would enable us to generate Adjusted EBITDAX, Distributable Cash from Operations and Available Cash necessary to pay the forecasted aggregate cash distribution of $0.91 per Class A Common Unit for the twelve months ending June 30, 2025 and the forecasted aggregate cash distribution of $1.22 per Class A Common Unit for the twelve months ending December 31, 2025.
We are providing the Statement of Estimated Adjusted EBITDAX, Distributable Cash from Operations and Available Cash to supplement our historical financial statements and unaudited pro forma condensed combined financial statements and in support of our belief that we will have sufficient Available Cash to pay the forecasted aggregate cash distribution of $0.91 per Class A Common Unit for the twelve months ending June 30, 2025 and the forecasted aggregate cash distribution of $1.22 per Class A Common Unit for the twelve months ending December 31, 2025. Please read below under “—Assumptions and Considerations” for further information about the assumptions we have made for the financial forecast.
We do not undertake any obligation to release publicly the results of any future revisions we may make to this prospective financial information or to update this prospective financial information to reflect events or circumstances after the date of this prospectus. Therefore, you are cautioned not to place undue reliance on this information.
Our Estimated Available Cash for Distribution
The following table shows how we calculate estimated Adjusted EBITDAX and Distributable Cash from Operations and Available Cash for the twelve months ending June 30, 2025, for the twelve months ending December 31, 2025 and for each quarter during those twelve-month periods that would be available for distribution to our Class A Common Unitholders. All of the amounts for the twelve months ending June 30, 2025 and the twelve months ending December 31, 2025 in the table below are estimates. The assumptions that we believe are relevant to particular line items in the table below are explained in the corresponding footnotes and in “—Assumptions and Considerations.”
Neither our independent registered public accounting firm nor any other independent registered public accounting firm has compiled, examined or performed any procedures with respect to the forecasted financial information contained herein, nor has it expressed any opinion or given any other form of assurance on such information or its achievability, and it assumes no responsibility for such forecasted financial information. Our independent registered public accounting firm’s reports included elsewhere in this prospectus relate to our audited historical financial statements. These reports do not extend to the table and the related forecasted information contained in this section and should not be read to do so.
92
Table of Contents
Based on our current financial projections, a portion of the quarterly Class A Common Unit cash distributions through December 31, 2025 is expected to be made from our cash on hand, including partially from proceeds of this offering initially designated as reserves.
Three Months Ending September 30, 2024 | Three Months Ending December 31, 2024 | Three Months Ending March 31, 2025 | Three Months Ending June 30, 2025 | Three Months Ending September 30, 2025 | Three Months Ending December 31, 2025 | Twelve Months Ending June 30, 2025 | Twelve Months Ending December 31, 2025 | |||||||||||||||||||||||||
(in thousands) | ||||||||||||||||||||||||||||||||
Estimated Net Income (Loss) | $ | (2,116 | ) | $ | 4,202 | $ | (1,237 | ) | $ | 3,790 | $ | 3,826 | $ | 5,901 | $ | 4,639 | $ | 12,280 | ||||||||||||||
Interest expense, net of interest income | 1,859 | 176 | 300 | 294 | 294 | 320 | 2,629 | 1,208 | ||||||||||||||||||||||||
Income tax provision (benefit) | (562 | ) | 1,117 | (329 | ) | 1,007 | 1,017 | 1,569 | 1,233 | 3,264 | ||||||||||||||||||||||
Depreciation, depletion and amortization | 5,691 | 5,780 | 6,023 | 9,969 | 11,577 | 12,176 | 27,463 | 39,745 | ||||||||||||||||||||||||
Impairment of oil and natural gas properties | — | — | — | — | — | — | ||||||||||||||||||||||||||
Accretion | 58 | 59 | 59 | 62 | 65 | 66 | 238 | 252 | ||||||||||||||||||||||||
Exploration expenses | — | — | — | — | — | — | — | — | ||||||||||||||||||||||||
Non-cash (gain) loss on commodity derivatives | — | — | — | — | — | — | — | — | ||||||||||||||||||||||||
Non-cash incentive compensation expenses | — | — | — | — | — | — | — | — | ||||||||||||||||||||||||
Non-cash (gain) loss on extinguishment of debt | — | — | — | — | — | — | — | — | ||||||||||||||||||||||||
Non-cash (gain) loss on investment in PSI | — | — | — | — | — | — | — | — | ||||||||||||||||||||||||
Abandonment | — | — | — | — | — | — | — | — | ||||||||||||||||||||||||
Other (gain) loss | — | — | — | — | — | — | — | — | ||||||||||||||||||||||||
Adjusted EBITDAX(1) | 4,930 | 11,334 | 4,816 | 15,122 | 16,779 | 20,032 | 36,202 | 56,749 | ||||||||||||||||||||||||
Cash interest expense, net of interest income | (1,859 | ) | (165 | ) | (289 | ) | (283 | ) | (283 | ) | (309 | ) | (2,595 | ) | (1,163 | ) | ||||||||||||||||
Maintenance capital expenditures(2) | — | — | — | — | — | — | — | — | ||||||||||||||||||||||||
Expansion capital expenditures(2) | (1,156 | ) | (2,447 | ) | (9,013 | ) | (19,577 | ) | (27,444 | ) | (19,824 | ) | (32,193 | ) | (75,858 | ) | ||||||||||||||||
Acquisition costs | — | — | — | — | — | — | — | — | ||||||||||||||||||||||||
Cash income tax payments | — | — | — | — | — | — | — | — | ||||||||||||||||||||||||
Reimbursement of general partner expenses | — | — | — | — | — | — | — | — | ||||||||||||||||||||||||
Other | — | — | — | — | — | — | — | — | ||||||||||||||||||||||||
Estimated Distributable Cash from Operations(3) | $ | 1,915 | $ | 8,722 | $ | (4,486 | ) | $ | (4,738 | ) | $ | (10,948 | ) | $ | (101 | ) | $ | 1,413 | $ | (20,272 | ) | |||||||||||
|
|
|
|
|
|
|
|
|
|
|
|
|
|
|
| |||||||||||||||||
Estimated Available Cash for Distribution(4) | 1,915 | 1,482 | 1,491 | 1,500 | 1,509 | 1,519 | 4,473 | 6,019 | ||||||||||||||||||||||||
Estimated Cash Distributions per Class A Common Unit(5) | — | 0.30 | 0.30 | 0.30 | 0.31 | 0.31 | 0.91 | 1.22 | ||||||||||||||||||||||||
Estimated Cash Distribution | — | 1,482 | 1,491 | 1,500 | 1,509 | 1,519 | 4,473 | 6,019 | ||||||||||||||||||||||||
Distributions on Class A Common Units held by Purchasers in this Offering | — | 1,410 | 1,419 | 1,428 | 1,436 | 1,445 | 4,256 | 5,728 | ||||||||||||||||||||||||
Distributions on Class A Common Units held by our General Partner in this Offering | — | 22 | 21 | 21 | 22 | 22 | 65 | 87 | ||||||||||||||||||||||||
Distributions on Class A Common Units held by Existing Investors in this Offering | — | 50 | 51 | 51 | 51 | 52 | 152 | 204 | ||||||||||||||||||||||||
Total Estimated Cash Distributions to Class A Common Unitholders |
| — |
|
| 1,482 |
|
| 1,491 |
|
| 1,500 |
|
| 1,509 |
|
| 1,519 |
|
| 4,473 |
| 6,019 |
93
Table of Contents
(1) | Adjusted EBITDAX is not a financial measure calculated in accordance with GAAP, but we believe it provides important perspective regarding our operating results. “The Offering—Non-GAAP Financial Measures” contains a description of Adjusted EBITDAX and a reconciliation to our net income (loss), our most directly comparable financial measure calculated in accordance with GAAP. |
(2) | Maintenance capital expenditures are those capital expenditures required to maintain, over the long-term, the operating capacity of, or the revenue generated by, our capital assets and are incurred as an oil or gas property is impacted by an unforeseen condition impacting its expected production. Natural declines in production that occur through the life of an oil or gas property will not be directly affected by incurring maintenance capital expenditures. Expansion capital expenditures are those capital expenditures that increase the operating capacity of, or the revenue generated by, our capital assets. |
(3) | Distributable Cash from Operations is not a financial measure calculated in accordance with GAAP, but we believe it provides important perspective regarding our ability to internally fund our exploration and development activities, pay distributions, and to service or incur additional debt. “The Offering—Non-GAAP Financial Measures” contains a description of Distributable Cash from Operations and a reconciliation to net income (loss), our most directly comparable financial measure calculated in accordance with GAAP. |
(4) | Based on our current financial projections, all or a portion of the quarterly cash distributions to our Class A Common Unitholders through December 31, 2025 is expected to be made from our cash on hand, including partially from proceeds of this offering initially designated as reserves. |
(5) | See “Risk Factors—Risks Related to Cash Distributions on our Class A Common Units.” Estimated cash distribution per Class A Common Unit for the three months ending December 31, 2024 will be adjusted for the number of days in that quarterly period after the closing date of this offering. |
Assumptions and Considerations
Based upon the specific assumptions outlined below, and our current financial projections, all or a portion of the quarterly Class A Common Unit cash distributions for the four quarters in the twelve months ending June 30, 2025 and the four quarters in the twelve months ending December 31, 2025 is expected to be made from our cash on hand, including partially from proceeds of this offering initially designated as reserves.
While we believe that these assumptions are reasonable in light of management’s current expectations concerning future events, the estimates underlying these assumptions are inherently uncertain and are subject to significant business, economic, regulatory, environmental and competitive risks and uncertainties that could cause actual results to differ materially from those we anticipate. It is also important to note that we will hold a minority ownership interest in PSI and will not control PSI, have any control over the size of dividends paid by PSI or have any control over whether dividends are paid at all. If our assumptions are not correct, the amount of actual cash available to pay distributions could be substantially less than the amount we currently estimate, in which event the market price of our Class A Common Units may decline substantially. When reading this section, you should keep in mind the risk factors and other cautionary statements described under “Risk Factors” and “Cautionary Note Regarding Forward-Looking Statements.” Any of the risks discussed in this prospectus could cause our actual results to vary significantly from our estimates.
Upon the completion of this offering, we expect to incur incremental non-recurring costs related to our transition to a publicly traded partnership, including the costs of this initial public offering and the costs associated with the initial implementation of our internal control implementation and testing. We also expect to incur additional recurring costs related to being a public company, including costs associated with the employment of additional personnel, compliance under the Exchange Act and applicable securities exchange requirements, annual and quarterly reports to be filed with the SEC, tax return preparation, independent auditor fees, incremental legal fees, investor relations activities, registrar and transfer agent fees, and incremental director and officer liability insurance costs. The direct, incremental general and administrative expenses are included in our financial forecast of Available Cash for distribution for the twelve months ending June 30, 2025 and the twelve months ending December 31, 2025. We expect those expenses to be approximately $2.5 million per year.
94
Table of Contents
Operations and Revenue
Production. Our ability to generate sufficient cash from operations to pay cash distributions to Class A Common Unitholders is a function of two primary variables: (i) production volumes and (ii) commodity prices. Production volumes directly impact our revenue. Any negative effect on production volumes could have a material adverse effect on our business, financial condition, results of operations and Distributable Cash from Operations. Our existing production will naturally decline over time as the applicable reservoir is depleted. As of June 30, 2024, the decline rate for our existing oil and natural gas properties over the next twelve months in the Powder River Basin is approximately 15-20%.
The following table presents historical production volumes for our properties on a pro forma basis for the year ended December 31, 2023 and the twelve months ended June 30, 2024 and on a forecasted basis for the twelve months ending June 30, 2025 and the twelve months ended December 31, 2025:
Pro Forma Year Ended December 31, 2023 | Pro Forma Twelve Months Ended June 30, 2024 | Forecasted Twelve Months Ending June 30, 2025 | Forecasted Twelve Months Ending December 31, 2025 | |||||||||||||
Annual production: | ||||||||||||||||
Oil and condensate (MBbl) | 625 | 588 | 648 | 1,027 | ||||||||||||
Natural gas (MMcf)(1) | 2,705 | 2,511 | 3,264 | 4,192 | ||||||||||||
|
|
|
|
|
|
|
| |||||||||
Total (Mboe) | 1,076 | 1,006 | 1,192 | 1,726 | ||||||||||||
|
|
|
|
|
|
|
| |||||||||
Average net daily production: | ||||||||||||||||
Oil and condensate (Bbls/d) | 1,712 | 1,606 | 1,778 | 2,814 | ||||||||||||
Natural gas (Mcf/d)(1) | 7,410 | 6,862 | 8,946 | 11,484 | ||||||||||||
|
|
|
|
|
|
|
| |||||||||
Total (Boe/d) | 2,947 | 2,749 | 3,269 | 4,728 | ||||||||||||
|
|
|
|
|
|
|
|
(1) | Because our reserves and production are reported in two streams, the economic value of the NGLs is included in our pricing and natural gas production. |
We estimate that our total oil and natural gas production for the twelve months ending June 30, 2025 and the twelve months ending December 31, 2025 will be 3,269 Boe per day and 4,728 Boe per day, respectively, as compared to 2,947 Boe per day on a pro forma basis for the year ended December 31, 2023 and 2,749 Boe per day on a pro forma basis for the twelve months ended June 30, 2024. We intend to grow our forecasted production level to 1,192 Mboe and 1,726 Mboe for the twelve months ending June 30, 2025 and December 31, 2025, respectively.
Prices. Our results of operations depend on many factors, particularly the price of our commodity production and our ability to market our production effectively. Oil and natural gas prices have historically been volatile, and this volatility is expected to continue in the future. During the period from January 1, 2023 through June 30, 2024, our settled prices for crude oil and natural gas reached a high of $92.92 per Bbl and $5.018 per MMBtu, respectively, and a low of $64.97 per Bbl and $1.575 per MMBtu, respectively. A future decline in commodity prices may adversely affect our business, financial condition or results of operations. Lower commodity prices may not only decrease our revenues, but also the amount of oil and natural gas that we can produce economically. Lower oil and natural gas prices may also result in a reduction in the borrowing base under our New Credit Facility, which we are in the process of negotiating, and which is expected to be redetermined semi-annually.
The NYMEX WTI, for oil prices, and NYMEX Henry Hub, for gas prices, are widely used benchmarks for the pricing of oil, NGL and natural gas in the United States. The price we receive for our oil and natural gas production is generally different than the NYMEX price because of adjustments for delivery location (“basis”), relative quality and other factors. The differentials to published oil and natural gas prices are based upon our analysis of the historic price differentials for production from the mineral interests with consideration given to gravity, quality and transportation and marketing costs that may affect these differentials. There is no assurance that these assumed differentials will occur. The table below illustrates the relationship between average oil and
95
Table of Contents
natural gas realized sales prices and average NYMEX futures prices as of December 31, 2023 on a pro forma basis for the year ended December 31, 2023 and the twelve months ended June 30, 2024, as well as our forecast for the twelve months ending June 30, 2025 and the twelve months ending December 31 2025:
Pro Forma Year Ended December 31, 2023 | Pro Forma Twelve Months Ended June 30, 2024 | Forecasted Twelve Months Ending June 30, 2025 | Forecasted Twelve Months Ending December 31, 2025 | |||||||||||||
Average oil sales prices ($/Bbl): | ||||||||||||||||
Average daily NYMEX-WTI oil price | $77.32 | $79.53 | $78.30 | $75.13 | ||||||||||||
Differential to NYMEX-WTI oil | (1.28) | (1.79) | (2.67) | (2.00) | ||||||||||||
Realized oil sales price (excluding derivatives) | 76.04 | 77.74 | 75.63 | 73.13 | ||||||||||||
Realized oil sales price (including derivatives) | 70.12 | 72.75 | 67.38 | 70.48 | ||||||||||||
Average natural gas sales prices ($/Mcf)(1): | ||||||||||||||||
Average daily NYMEX-Henry Hub natural gas price | $ | 2.79 | $ | 2.48 | $ | 3.10 | $ | 3.48 | ||||||||
Differential to NYMEX-Henry Hub natural gas | (0.34 | ) | (0.36 | ) | (0.30 | ) | (0.30 | ) | ||||||||
Realized natural gas sales price (excluding derivatives) | 2.45 | 2.12 | 2.80 | 3.18 | ||||||||||||
Realized natural gas sales price (including derivatives) | 2.46 | 2.68 | 3.03 | 3.22 |
(1) | Because our reserves and production are reported in two streams, the economic value of the NGLs is included in the natural gas price. |
Hedging Activities. We plan to continue our practice of entering into hedging arrangements to reduce the impact of commodity price volatility on our cash flow from operations. To satisfy requirements under our Existing Credit Agreement and the New Credit Facility, as applicable, we have historically hedged, and anticipate that, under the New Credit Facility, we will hedge, a portion of our production volumes, on a rolling quarterly basis, based on reasonably anticipated projected production of proved developed producing reserves that we are required to hedge. See “Management’s Discussion and Analysis of Financial Condition and Results of Operations—Quantitative and Qualitative Disclosure About Market Risk—Commodity Derivatives” for more information.
Our commodity derivative contracts consist of swap and collar agreements based upon NYMEX-WTI prices. The table below shows the volumes and prices covered by the commodity derivative contracts for the twelve months ending June 30, 2025. Because our reserves and production are reported in two streams, the economic value of the NGLs is included in our natural gas production and reserves. For purposes of our forecast, we have assumed that we will not enter into additional natural gas or oil derivative contracts during the forecast period, although we may do so on an opportunistic basis if market conditions are favorable. See “Risk Factors—
96
Table of Contents
We use derivative instruments to economically hedge exposure to changes in commodity price and, as a result, are exposed to credit risk and market risk.”
Swaps | Collars(1) | |||||||||||||||
Volume per Day | Weighted Avg. Floor Price | Volume per Day | Weighted Avg. Floor Price | |||||||||||||
Oil: | ||||||||||||||||
July 2024-June 2025 (Bbl/d) | 782 | $ | 67.40 | 236 | $ | 62.63 | ||||||||||
% of Forecasted Production | 44% | 13% | ||||||||||||||
Natural Gas(2): | ||||||||||||||||
July 2024-June 2025 (MMBtu/d) | 2,713 | $ | 3.60 | 802 | $ | 3.02 | ||||||||||
% of Forecasted Production | 30% | 9% |
(1) | Statistics reflect periods in which derivative instruments exist such that period averages are not affected by periods with no hedged volumes. |
(2) | Because our reserves and production are reported in two streams, the economic value of the NGLs is included in the natural gas price and in our natural gas production. |
Operating Revenues and Realized Commodity Derivative Gains. The following table illustrates the primary components of operating revenues and realized commodity derivative gains on a pro forma basis for the year ended December 31, 2023 and the twelve months ended June 30, 2024 as well as on a forecasted basis for the twelve months ending June 30, 2025 and the twelve months ending December 31, 2025:
Pro Forma Year Ended December 31, 2023 | Pro Forma Twelve Months Ended June 30, 2024 | Forecasted Twelve Months Ending June 30, 2025 | Forecasted Twelve Months Ending December 31, 2025 | |||||||||||||
(in thousands) | ||||||||||||||||
Oil: | ||||||||||||||||
Oil revenues (excluding the effects of derivative instruments) | $ | 47,517 | $ | 45,544 | $ | 48,853 | $ | 74,866 | ||||||||
Realized oil derivative instruments gain (loss) | (3,702 | ) | (2,935 | ) | (3,609 | ) | (2,951 | ) | ||||||||
|
|
|
|
|
|
|
| |||||||||
Total | $ | 43,815 | $ | 42,609 | $ | 45,244 | $ | 71,915 | ||||||||
|
|
|
|
|
|
|
| |||||||||
Natural Gas(1): | ||||||||||||||||
Natural Gas revenues (excluding the effects of derivative instruments) | $ | 6,616 | $ | 5,294 | $ | 9,107 | $ | 13,366 | ||||||||
Realized natural gas derivative instruments gain (loss) | 40 | 1,397 | 563 | 139 | ||||||||||||
|
|
|
|
|
|
|
| |||||||||
Total | $ | 6,656 | $ | 6,691 | $ | 9,670 | $ | 13,505 | ||||||||
|
|
|
|
|
|
|
| |||||||||
Total: | ||||||||||||||||
Operating revenues | $ | 54,133 | $ | 50,838 | $ | 57,960 | $ | 88,232 | ||||||||
Commodity derivative instruments gain (loss) | (3,662 | ) | (1,538 | ) | (3,046 | ) | (2,812 | ) | ||||||||
|
|
|
|
|
|
|
| |||||||||
Operating revenue and realized commodity derivative instrument gains (losses) | $ | 50,471 | $ | 49,300 | $ | 54,914 | $ | 85,420 | ||||||||
|
|
|
|
|
|
|
|
(1) | Because our reserves and production are reported in two streams, the economic value of the NGLs is included in our natural gas revenue. |
97
Table of Contents
Expenses
Development Costs. Our estimated development costs for the twelve months ending June 30, 2025 and the twelve months ending December 31, 2025 of $32.2 million and $75.9 million, respectively, represent our estimate of the average annual capital expenditures necessary to achieve our forecasted production level of 3,269 Boe per day for the twelve months ended June 30, 2025 and 4,728 Boe per day for the twelve months ending December 31, 2025, respectively. Development costs include all of our expansion capital expenditures made for oil and natural gas properties, other than acquisitions, as well as maintenance capital expenditures, net of any proceeds from divestitures. Maintenance capital expenditures are those capital expenditures required to maintain, over the long-term, the operating capacity of, or the revenue generated by, our capital assets and are incurred as an oil or gas property is impacted by an unforeseen condition impacting its expected production. As a result, our financial forecast does not include estimated maintenance capital expenditures.
Production Expenses. The following table summarizes production expenses on an aggregate basis and on a per Boe basis on a pro forma basis for the year ended December 31, 2023 and the twelve months ended June 30, 2024 as well as on a forecasted basis for the twelve months ending June 30, 2025 and the twelve months ending December 31, 2025:
Pro Forma Year Ended December 31, 2023 | Pro Forma Twelve Months Ended June 30, 2024 | Forecasted Twelve Months Ending June 30, 2025 | Forecasted Twelve Months Ending December 31, 2025 | |||||||||||||
Production expenses (in thousands) | $ | 13,949 | $ | 13,507 | $ | 13,300 | $ | 15,220 | ||||||||
Production expenses (per Boe) | $ | 12.97 | $ | 13.43 | $ | 11.16 | $ | 8.82 |
We estimate that our production expenses for the twelve months ending June 30, 2025 will be approximately $13.3 million and $15.2 million for the twelve months ending December 31, 2025. Production expenses consist of lease operating expenses incurred for the operation and maintenance of wells and related equipment. On a pro forma basis, for the year ended December 31, 2023 and the twelve months ended June 30, 2024, production expenses were approximately $13.9 million and $13.5 million, respectively. It is anticipated that production expenses on a per Boe basis will continue to decrease due to higher production and forecasted lower commodity prices.
Production and Ad Valorem Taxes. Production and ad valorem taxes consist primarily of severance taxes and ad valorem taxes. Severance taxes are paid on produced oil and natural gas based on a percentage of revenues from production sold at fixed rates established by state or local taxing authorities. In general, the severance taxes we pay correlate to the changes in oil and natural gas revenues. We are also subject to ad valorem taxes in the counties where our production is located. We evaluate production and ad valorem taxes on a per Boe basis to monitor costs to ensure that they are at acceptable levels. These can also be influenced by acquisitions, commodity prices, changes in values of our properties, sales mix and acquisitions. It is anticipated that production and ad valorum taxes on a per Boe basis will continue to decrease due to higher production and forecasted lower commodity prices.
The following table summarizes production and ad valorem taxes on a pro forma basis for the year ended December 31, 2023 and the twelve months ended June 30, 2024, as well as on a forecasted basis for the twelve months ending June 30, 2025 and the twelve months ending December 31, 2025:
Pro Forma Year Ended December 31, 2023 | Pro Forma Twelve Months Ended June 30, 2024 | Forecasted Twelve Months Ending June 30, 2025 | Forecasted Twelve Months Ending December 31, 2025 | |||||||||||||
Production and ad valorem taxes (in thousands) | $ | 7,508 | $ | 6,731 | $ | 7,257 | $ | 11,015 | ||||||||
Production and ad valorem taxes (per Boe) | $ | 6.98 | $ | 6.69 | $ | 6.09 | $ | 6.38 |
98
Table of Contents
General and Administrative Expenses. General and administrative expenses consist primarily of personnel related costs and are partially offset by certain reimbursements of overhead expenses. In connection with the consummation of this offering, we expect to incur additional costs related to being a public company. However, we do not expect to experience a material change in our cash cost structure, except as maybe affected by the volatility of commodity prices, increased expenses as a publicly-traded limited partnership, the effectives of our commodity derivative contracts, the effects of impairment on our producing properties. See “Management’s Discussion and Analysis of Financial Condition and Results of Operation—Factors Affecting the Comparability of Our Future Results of Operations to Our Historical Results of Operations.”
Interest Expense. Interest expense is primarily a result of interest on our borrowings on our Existing Credit Agreement and potentially, the New Credit Facility, to fund operations and acquisitions of properties as well as the amortization of debt issuance costs associated with these borrowings. Interest expense can fluctuate with our level of indebtedness as well as changes in interest rates and other fees under our credit agreements. We intend to terminate our Existing Credit Agreement in connection with the closing of this offering. Please see “Use of Proceeds” for additional information. We are in the process of negotiating the New Credit Facility that we anticipate entering into at the closing of this offering. The amount, maturity, interest rates and other terms of the New Credit Facility are in the process of being negotiated with prospective lenders; however, we expect that the aggregate commitments thereunder will be approximately $200.0 million with an initial borrowing base of $45.0 million. The New Credit Facility will be a senior secured revolving credit facility that will be guaranteed by certain of our subsidiaries and secured by substantially all of our assets and the assets of certain of our subsidiaries. We anticipate the New Credit Facility to have a four-year term and borrowings under the New Credit Facility to bear interest at a variable rate per annum equal to, at the Partnership’s option, SOFR or base rate, in each case plus an applicable margin per annum that is determined by a leverage ratio. We estimate that our cash interest expense for the twelve months ending June 30, 2025 and the twelve months ending December 31, 2025 will be approximately $2.6 million and $1.2 million, respectively, as compared to $1.6 million on a pro forma basis for each of the years ended December 31, 2023 and the twelve months ended June 30, 2024.
Regulatory, Industry and Economic Factors
Our forecasts for the twelve months ending June 30, 2025 and the twelve months ending December 31, 2025 are based on the following significant assumptions related to regulatory, industry and economic factors:
• | There will not be any new federal, state or local regulation of portions of the energy industry in which we operate, or any interpretation of existing regulations, that will be materially adverse to our business; |
• | There will not be any material nonperformance or credit-related defaults by suppliers, customers or vendors, or shortage of skilled labor; |
• | All supplies and commodities necessary for production and sufficient transportation will be readily available; |
• | There will not be any major adverse change in commodity prices or the energy industry in general; |
• | There will not be any material accidents, releases, weather-related incidents, unscheduled downtime or similar unanticipated events, including any events that could lead to force majeure under any of our marketing agreements; |
• | There will not be any adverse change in the markets in which we operate resulting from supply or production disruptions, reduced demand for our product or significant changes in the market prices for our product; and |
• | Market, insurance, regulatory and overall economic conditions will not change substantially. |
Sensitivity Analysis
Our ability to generate sufficient cash from operations to pay cash distributions to our Class A Common Unitholders is a function of two primary variables: (i) production volumes; and (ii) commodity prices. In the tables below, we illustrate the effect that changes in either of these variables, while holding all other variables constant, would have on our ability to generate sufficient cash from our operations to pay the forecasted cash distributions on our outstanding Class A Common Units for the twelve months ending June 30, 2025.
99
Table of Contents
We believe that a sensitivity analysis regarding the effect of changes in assumptions on estimated impairment is impracticable to provide because of the number of assumptions and variables involved which have interdependent effects on the potential outcome.
Production Volume Changes
Production volumes directly impact our revenue. Any negative effect on production volumes could have a material adverse effect on our business, financial condition, results of operations and Distributable Cash from Operations. The following table shows estimated Adjusted EBITDAX and Distributable Cash from Operations under production levels of 80%, 100% and 120% of the production level we have forecasted for the twelve months ending June 30, 2025 and for the twelve months ending December 31, 2025. The estimated Adjusted EBITDAX and Distributable Cash from Operations amounts shown below are based on the assumptions used in our forecast.
Forecasted Twelve Months Ending June 30, 2025 | Forecasted Twelve Months Ending December 31, 2025 | |||||||||||||||||||||||
Percentage of Forecasted Net Production | Percentage of Forecasted Net Production | |||||||||||||||||||||||
80% | 100% | 120% | 80% | 100% | 120% | |||||||||||||||||||
(in thousands, except per unit amounts) | (in thousands, except per unit amounts) | |||||||||||||||||||||||
Forecasted net production(1): | ||||||||||||||||||||||||
Oil (MBbl) | 518 | 648 | 778 | 822 | 1,027 | 1,232 | ||||||||||||||||||
Natural gas (Mmcf) | 2,611 | 3,264 | 3,917 | 3,354 | 4,192 | 5,030 | ||||||||||||||||||
Total (Mboe) | 954 | 1,192 | 1,430 | 1,381 | 1,726 | 2,071 | ||||||||||||||||||
Oil (Bbl/d) | 1,422 | 1,778 | 2,134 | 2,251 | 2,814 | 3,377 | ||||||||||||||||||
Natural gas (Mcf/d) | 7,157 | 8,946 | 10,735 | 9,187 | 11,484 | 13,781 | ||||||||||||||||||
Total (Boe per day) | 2,615 | 3,269 | 3,923 | 3,782 | 4,728 | 5,674 | ||||||||||||||||||
Forecasted Prices(1): | ||||||||||||||||||||||||
NYMEX-WTI oil price (per Bbl) | 78.30 | 78.30 | 78.30 | 75.13 | 75.13 | 75.13 | ||||||||||||||||||
Realized oil sales price (per Bbl) (excluding derivatives) | 75.63 | 75.63 | 75.63 | 73.13 | 73.13 | 73.13 | ||||||||||||||||||
Realized oil sales price (per Bbl) (including derivatives) | 67.38 | 67.38 | 67.38 | 70.48 | 70.48 | 70.48 | ||||||||||||||||||
NYMEX- Henry Hub natural gas price (per Mcf) | 3.10 | 3.10 | 3.10 | 3.48 | 3.48 | 3.48 | ||||||||||||||||||
Realized natural gas sales price (per Mcf) (excluding derivatives) | 2.80 | 2.80 | 2.80 | 3.18 | 3.18 | 3.18 | ||||||||||||||||||
Realized natural gas sales price (per Mcf) (including derivatives) | 3.03 | 3.03 | 3.03 | 3.22 | 3.22 | 3.22 | ||||||||||||||||||
Estimated Net Income (Loss)(2) | $ | 960 | $ | 4,639 | $ | 8,319 | $ | 6,309 | $ | 12,280 | $ | 18,135 | ||||||||||||
Interest expense, net of interest income | 2,629 | 2,629 | 2,629 | 1,470 | 1,208 | 1,180 | ||||||||||||||||||
Income tax provision (benefit) | 255 | 1,233 | 2,211 | 1,677 | 3,264 | 4,821 | ||||||||||||||||||
Depreciation, depletion and amortization | 21,971 | 27,463 | 32,956 | 31,797 | 39,745 | 47,695 | ||||||||||||||||||
Impairment of oil and natural gas properties | — | — | — | — | — | — | ||||||||||||||||||
Accretion | 238 | 238 | 238 | 252 | 252 | 252 | ||||||||||||||||||
Exploration expenses | — | — | — | — | — | — | ||||||||||||||||||
Non-cash gain (loss) on commodity derivatives | — | — | — | — | — | — | ||||||||||||||||||
Non-cash incentive compensation expenses | — | — | — | — | — | — | ||||||||||||||||||
Non-cash (gain) loss on extinguishment of debt | — | — | — | — | — | — | ||||||||||||||||||
Non-cash (gain) loss on investment in PSI | — | — | — | — | — | — | ||||||||||||||||||
Abandonment | — | — | — | — | — | — | ||||||||||||||||||
Other | — | — | — | — | — | — | ||||||||||||||||||
Estimated Adjusted EBITDAX(2) | $ | 26,053 | $ | 36,202 | $ | 46,353 | $ | 41,505 | $ | 56,749 | $ | 72,083 | ||||||||||||
Cash interest expense, net of interest income | (2,595 | ) | (2,595 | ) | (2,595 | ) | (1,425 | ) | (1,163 | ) | (1,135 | ) | ||||||||||||
Maintenance capital expenditures(3) | — | — | — | — | — | — | ||||||||||||||||||
Expansion capital expenditures(3) | (32,193 | ) | (32,193 | ) | (32,193 | ) | (75,858 | ) | (75,858 | ) | (75,858 | ) | ||||||||||||
Acquisition costs | — | — | — | — | — | — | ||||||||||||||||||
Cash income tax payments | — | — | — | — | — | — | ||||||||||||||||||
Reimbursement of general partner expenses | — | — | — | — | — | — | ||||||||||||||||||
Distributable Cash from Operations(4) | $ | (8,735 | ) | $ | 1,413 | $ | 11,565 | $ | (35,778 | ) | $ | (20,272 | ) | $ | (4,910 | ) |
100
Table of Contents
(1) | Because our reserves and production are reported in two streams, the economic value of the NGLs is included in our natural gas production and reserves as well as in the natural gas price |
(2) | Adjusted EBITDAX is not a financial measure calculated in accordance with GAAP, but we believe it provides important perspective regarding our operating results. “The Offering—Non-GAAP Financial Measures” contains a description of Adjusted EBITDAX and a reconciliation to our net income (loss), our most directly comparable financial measure calculated in accordance with GAAP. |
(3) | Maintenance capital expenditures are those capital expenditures required to maintain, over the long-term, the operating capacity of, or the revenue generated by, our capital assets and are incurred as an oil or gas property is impacted by an unforeseen condition impacting its expected production. As a result, our financial forecast does not include estimated maintenance capital expenditures. Natural declines in production that occur through the life of an oil or gas property will not be directly affected by incurring maintenance capital expenditures. Expansion capital expenditures are those capital expenditures that increase the operating capacity of, or the revenue generated by, our capital assets. |
(4) | Distributable Cash from Operations is not a financial measure calculated in accordance with GAAP, but we believe it provides important perspective regarding our ability to internally fund our exploration and development activities, pay distributions, and to service or incur additional debt. “The Offering—Non-GAAP Financial Measures” contains a description of Distributable Cash from Operations and a reconciliation to net income (loss), our most directly comparable financial measure calculated in accordance with GAAP. |
As reservoir pressures decline, production from a given well or formation decreases. Maintaining or growing our future production and reserves will depend on our ability to continue to replace current production with new reserves. Accordingly, we plan to focus on maintaining reserves through both the drill bit and acquisitions, while maintaining a conservative financial profile. Our ability to add reserves through development projects and acquisitions is dependent on many factors, including our ability to raise capital, obtain regulatory approvals, procure contract drilling rigs and personnel, and successfully identify and consummate acquisitions. See “Risk Factors—Risks Related to Our Business and the Oil and Natural Gas Industry” for a discussion of these and other risks affecting our proved reserves and production.
Commodity Price Changes
Our major market risk exposure is in the pricing that we receive for our oil and natural gas production. Pricing for oil and natural gas has been volatile and unpredictable for several years, and this volatility is expected to continue in the future. The prices we receive for our oil and natural gas production depend on many factors outside of our control, such as the strength of the global economy and global supply and demand for the commodities we produce.
To reduce the impact of fluctuations in oil and natural gas prices on our revenues, we periodically enter into commodity derivative contracts with respect to certain of our oil and natural gas production through various transactions that limit the risks of fluctuations of future prices. We plan to continue our practice of entering into such transactions to reduce the impact of commodity price volatility on our cash flow from operations. Future transactions may include price swaps whereby we will receive a fixed price for our production and pay a variable market price to the contract counterparty. Additionally, we may enter into collars, whereby we receive the excess, if any, of the fixed floor over the floating rate or pay the excess, if any, of the floating rate over the fixed ceiling. While there is a risk we may not be able to realize the full benefits of rising prices, these hedging activities are intended to limit our exposure to product price volatility and to maintain stable cash flows.
The following table shows estimated Adjusted EBITDAX and Distributable Cash from Operations under various assumed NYMEX-WTI oil and NYMEX-Henry Hub natural gas prices for the twelve months ending June 30, 2025 and for the twelve months ending December 31, 2025. For the twelve months ending June 30, 2025, we have assumed that commodity derivative contracts will cover (i) 371 Mbbl, or approximately 65% of our estimated total oil production from proved reserves for the twelve months ending June 30, 2025, at a weighted average floor price of $66.33 per Bbl and (ii) 1,279 Mcf, or approximately 43% of our estimated total
101
Table of Contents
natural gas production from proved reserves for the twelve months ending June 30, 2025, at a weighted average floor price of $3.47 per Mcf. For the twelve months ending December 31, 2025, we have assumed that commodity derivative contracts will cover (i) 325 Mbbl, or approximately 29% of our estimated total oil production from proved reserves for the twelve months ending December 31, 2025, at a weighted average floor price of $65.36 per Bbl and (ii) 1,112 Mcf, or approximately 31% of our estimated total natural gas production from proved reserves for the twelve months ending December 31, 2025, at a weighted average floor price of $3.50 per Mcf. Because our reserves and production are reported in two streams, the economic value of the NGLs is included in our natural gas production and reserves. In addition, the estimated Adjusted EBITDAX and Distributable Cash from Operations amounts shown below are based on forecasted realized commodity prices that take into account assumptions based on our average historical NYMEX commodity price differentials as set forth in our December 31, 2023 reserve report. We have assumed no changes in our production based on changes in prices. The estimated Adjusted EBITDAX and Distributable Cash from Operations amounts shown below are based on forecasted realized commodity prices that take into account our average NYMEX commodity price differential assumptions.
Forecasted Twelve Months Ending June 30, 2025 | Forecasted Twelve Months Ending December 31, 2025 | |||||||||||||||||||||||
Percentage of Forecasted Prices | Percentage of Forecasted Prices | |||||||||||||||||||||||
80% | 100% | 120% | 80% | 100% | 120% | |||||||||||||||||||
(in thousands, except per unit amounts) | (in thousands, except per unit amounts) | |||||||||||||||||||||||
Forecasted net production(1): | ||||||||||||||||||||||||
Oil (MBbl) | 648 | 648 | 648 | 1,027 | 1,027 | 1,027 | ||||||||||||||||||
Natural gas (Mmcf) | 3,264 | 3,264 | 3,264 | 4,192 | 4,192 | 4,192 | ||||||||||||||||||
Total (Mboe) | 1,192 | 1,192 | 1,192 | 1,726 | 1,726 | 1,726 | ||||||||||||||||||
Oil (Bbl/d) | 1,778 | 1,778 | 1,778 | 2,814 | 2,814 | 2,814 | ||||||||||||||||||
Natural gas (Mcf/d) | 8,946 | 8,946 | 8,946 | 11,484 | 11,484 | 11,484 | ||||||||||||||||||
Total (Boe per day) | 3,269 | 3,269 | 3,269 | 4,728 | 4,728 | 4,728 | ||||||||||||||||||
Forecasted Prices(1): | ||||||||||||||||||||||||
NYMEX-WTI oil price (per Bbl) | 62.64 | 78.30 | 93.96 | 60.10 | 75.13 | 90.16 | ||||||||||||||||||
Realized oil sales price (per Bbl) (excluding derivatives) | 59.97 | 75.63 | 91.29 | 58.10 | 73.13 | 88.16 | ||||||||||||||||||
Realized oil sales price (per Bbl) (including derivatives) | 62.55 | 67.38 | 73.70 | 59.63 | 70.48 | 81.11 | ||||||||||||||||||
NYMEX- Henry Hub natural gas price (per Mcf) | 2.48 | 3.10 | 3.72 | 2.78 | 3.48 | 4.18 | ||||||||||||||||||
Realized natural gas sales price (per Mcf) (excluding derivatives) | 2.18 | 2.80 | 3.42 | 2.48 | 3.18 | 3.88 | ||||||||||||||||||
Realized natural gas sales price (per Mcf) (including derivatives) | 2.62 | 3.03 | 3.37 | 2.71 | 3.22 | 3.74 | ||||||||||||||||||
Estimated Net Income (Loss)(2) | $ | 336 | $ | 4,639 | $ | 8,430 | $ | 3,619 | $ | 12,280 | $ | 20,695 | ||||||||||||
Interest expense, net of interest income | 2,629 | 2,629 | 2,629 | 1,343 | 1,208 | 1,180 | ||||||||||||||||||
Income tax provision (benefit) | 89 | 1,233 | 2,241 | 962 | 3,264 | 5,501 | ||||||||||||||||||
Depreciation, depletion and amortization | 27,463 | 27,463 | 27,463 | 39,745 | 39,745 | 39,745 | ||||||||||||||||||
Impairment of oil and natural gas properties | — | — | — | — | — | — | ||||||||||||||||||
Accretion | 238 | 238 | 238 | 252 | 252 | 252 | ||||||||||||||||||
Exploration expenses | — | — | — | — | — | — | ||||||||||||||||||
Non-cash gain (loss) on commodity derivatives | — | — | — | — | — | — | ||||||||||||||||||
Non-cash incentive compensation expenses | — | — | — | — | — | — | ||||||||||||||||||
Non-cash (gain) loss on extinguishment of debt | — | — | — | — | — | — | ||||||||||||||||||
Non-cash (gain) loss on investment in PSI | — | — | — | — | — | — | ||||||||||||||||||
Abandonment | — | — | — | — | — | — | ||||||||||||||||||
Other | — | — | — | — | — | — | ||||||||||||||||||
Estimated Adjusted EBITDAX(2) | $ | 30,755 | $ | 36,202 | $ | 41,001 | $ | 45,921 | $ | 56,749 | $ | 67,373 | ||||||||||||
Cash interest expense, net of interest income | (2,595 | ) | (2,595 | ) | (2,595 | ) | (1,298 | ) | (1,163 | ) | (1,135 | ) | ||||||||||||
Maintenance capital expenditures(3) | — | — | — | — | — | — | ||||||||||||||||||
Expansion capital expenditures(3) | (32,193 | ) | (32,193 | ) | (32,193 | ) | (75,858 | ) | (75,858 | ) | (75,858 | ) | ||||||||||||
Acquisition costs | — | — | — | — | — | — | ||||||||||||||||||
Cash income tax payments | — | — | — | — | — | — | ||||||||||||||||||
Reimbursement of general partner expenses | — | — | — | — | — | — | ||||||||||||||||||
Distributable Cash from Operations(4) | $ | (4,033 | ) | $ | 1,413 | $ | 6,213 | $ | (31,235 | ) | $ | (20,272 | ) | $ | (9,620 | ) |
102
Table of Contents
(1) | Because our reserves and production are reported in two streams, the economic value of the NGLs is included in our natural gas production and reserves as well as in the natural gas price. |
(2) | Adjusted EBITDAX is not a financial measure calculated in accordance with GAAP, but we believe it provides important perspective regarding our operating results. “The Offering—Non-GAAP Financial Measures” contains a description of Adjusted EBITDAX and a reconciliation to our net income (loss), our most directly comparable financial measure calculated in accordance with GAAP. |
(3) | Maintenance capital expenditures are those capital expenditures required to maintain, over the long-term, the operating capacity of, or the revenue generated by, our capital assets and are incurred as an oil or gas property is impacted by an unforeseen condition impacting its expected production. As a result, our financial forecast does not include estimated maintenance capital expenditures. Natural declines in production that occur through the life of an oil or gas property will not be directly affected by incurring maintenance capital expenditures. Expansion capital expenditures are those capital expenditures that increase the operating capacity of, or the revenue generated by, our capital assets. |
(4) | Distributable Cash from Operations is not a financial measure calculated in accordance with GAAP, but we believe it provides important perspective regarding our ability to internally fund our exploration and development activities, pay distributions, and to service or incur additional debt. “The Offering—Non-GAAP Financial Measures” contains a description of Distributable Cash from Operations and a reconciliation to net income (loss), our most directly comparable financial measure calculated in accordance with GAAP. |
103
Table of Contents
PROVISIONS OF OUR PARTNERSHIP AGREEMENT RELATING TO CASH DISTRIBUTIONS
Set forth below is a summary of the significant provisions of our partnership agreement that relate to cash distributions.
Quarterly Distributions of Available Cash
General
Our partnership agreement requires that, within 90 days after the end of each quarter beginning with the quarter ending December 31, 2024, we distribute all of our Available Cash, if any, to Class A Common Unitholders of record on the applicable record date. We will adjust the amount of our cash distribution for the period from the closing of this offering through December 31, 2024, based on the actual length of that period.
Definition of Available Cash
Available Cash generally means, for any quarter:
• | cash and cash equivalents on hand at the end of that quarter, which, for the avoidance of doubt, includes all proceeds from this offering; |
• | plus, all cash on hand on the date of determination resulting from dividends or distributions received after the end of the quarter from equity interests in any person other than a subsidiary in respect of operations conducted by such person during the quarter; |
• | plus, if our general partner so determines, all or a portion of cash on hand on the date of determination resulting from working capital borrowings made after the end of the quarter; |
• | less, the amount of cash reserves established by our general partner to: |
• | provide for the proper conduct of our business, which could include, but is not limited to, amounts reserved for capital expenditures, future acquisitions, debt service requirements; |
• | comply with applicable law, any of our debt instruments or other agreements; or |
• | provide funds for distribution to our Class A Common Unitholders for one or more of the next four quarters. |
The purpose and effect of the first and third bullet points above is to allow our general partner, if it so decides, to use cash from working capital borrowings made after the end of the quarter but on or before the date of determination of Available Cash for that quarter or proceeds from this offering to pay distributions to Class A Common Unitholders. Working capital borrowings are generally borrowings that are made under a credit facility, commercial paper facility or similar financing arrangement and in all cases are used solely for working capital purposes or to pay distributions to partners and with the intent of the borrower to repay such borrowings within twelve months from sources other than additional working capital borrowings.
Methods of Distribution
We intend to distribute Available Cash to our Class A Common Unitholders, pro rata. Our partnership agreement permits, but does not require, us to borrow to pay distributions. Accordingly, there is no guarantee that we will pay the initial target quarterly distribution amount, or any distributions at all, on the Class A Common Units in any quarter.
Operating Surplus and Capital Surplus
General
All cash distributed to unitholders will be characterized as either being paid from “operating surplus” or “capital surplus”. We treat distributions of Available Cash from operating surplus differently than distributions of Available Cash from capital surplus.
104
Table of Contents
Operating Surplus
Operating surplus for any period generally means:
• | all of our cash and cash equivalents at the closing of this offering, including, as determined by our general partner, all or a portion of cash receipts from this offering; plus |
• | all of our cash receipts (including our proportionate share of cash receipts of any subsidiaries we do not wholly own) after the closing of this offering, excluding cash from (1) borrowings, other than working capital borrowings, (2) sales of equity and debt securities, (3) sales or other dispositions of assets outside the ordinary course of business (collectively, clauses (1)-(3), “interim capital transactions”) and (4) PSI Proceeds (as defined below); plus |
• | working capital borrowings (including our proportionate share of working capital borrowings for any subsidiaries we do not wholly own) made after the end of a quarter but before the date of determination of operating surplus for the quarter as determined by our general partner; less |
• | all of our “operating expenditures” (which includes maintenance and replacement capital expenditures as further described below) (including our proportionate share of operating expenditures by any subsidiaries we do not wholly own) immediately after the closing of this offering; less |
• | the amount of cash reserves (including our proportionate share of cash reserves for any subsidiaries we do not wholly own) established by our general partner to provide funds for future operating expenditures. |
As described above, operating surplus includes a provision that will enable us, if we choose, to distribute as operating surplus, any or all of the cash receipts we receive in this offering, which would otherwise be distributed as capital surplus.
Operating expenditures generally means all of our cash expenditures, including but not limited to taxes, reimbursement of expenses to our general partner, debt service payments, and maintenance and estimated replacement capital expenditures (which are discussed in further detail under “—Capital Expenditures” below), provided that operating expenditures will not include:
• | payments (including prepayments and payment penalties) of principal of and premium on indebtedness required in connection with the sale or other disposition of assets or made in connection with the refinancing or refunding of indebtedness with the proceeds from new indebtedness or from the sale of equity interests; |
• | expansion capital expenditures, investment capital expenditures or replacement capital expenditures (which are discussed in further detail under “—Capital Expenditures” below); |
• | payment of transaction expenses (including taxes) relating to interim capital transactions; or |
• | distributions to partners. |
Capital Expenditures
For purposes of determining operating surplus, capital expenditures are classified as either replacement capital expenditures, expansion capital expenditures or investment capital expenditures. Replacement capital expenditures are those capital expenditures required to maintain, improve or expand, over the long-term, the operating capacity of or the revenue generated by our capital assets.
Expansion capital expenditures are those capital expenditures that increase the operating capacity of or the revenue generated by our capital assets.
Investment capital expenditures are those capital expenditures that are neither replacement capital expenditures nor expansion capital expenditures. Investment capital expenditures largely will consist of capital
105
Table of Contents
expenditures made for investment purposes. Examples of investment capital expenditures include traditional capital expenditures for investment purposes, such as purchases of equity securities, as well as other capital expenditures that might be made in lieu of such traditional investment capital expenditures, such as the acquisition of a capital asset for investment purposes.
Definition of Capital Surplus
Capital surplus generally will be generated only by:
• | borrowings other than working capital borrowings; |
• | sales of debt and equity securities; and |
• | sales or other dispositions of assets for cash, other than inventory, accounts receivable and other current assets sold in the ordinary course of business or non-current assets sold as part of normal retirements or replacements of assets. |
Characterization of Cash Distributions
We will treat all Available Cash distributed as coming from operating surplus until the sum of all Available Cash distributed since the closing of this offering, other than proceeds from the sale of our investment in PSI, equals the operating surplus as of the most recent date of determination of Available Cash. We will treat any amount distributed in excess of operating surplus, regardless of its source, as capital surplus. As described above, operating surplus does not reflect actual cash on hand that is available for distribution to our unitholders. For example, it includes a provision that will enable us, if we choose, to distribute as operating surplus cash receipts we receive in this offering, that would otherwise be distributed as capital surplus.
Distributions of Available Cash from Operating Surplus
We will make distributions from Available Cash from operating surplus in the following manner:
• | first, to the Class A Common Unitholders, pro rata, until we distribute for each outstanding Class A Common Unit an amount equal to the initial target quarterly distribution for that quarter; and |
• | second, (i) for the six full quarters following the closing of this offering, 100% to the Class A Common Unitholders, pro rata; and (ii) for each quarter thereafter, 10% to our general partner and 90% to the Class A Common Unitholders, pro rata. |
Distributions of Available Cash from Capital Surplus
We will make distributions from Available Cash from capital surplus in the following manner:
• | first, to the Class A Common Unitholders, pro rata, until (i) we distribute for each outstanding Class A Common Unit an amount equal to the excess of the price paid for such Class A Common Unit in this offering over all distributions made in respect of Class A Common Units (which includes operating surplus distributions, prior capital surplus distributions, PSI Proceeds (as hereinafter defined) distributions and liquidating distributions) for the current and prior quarters and (ii) to the extent there has been a conversion of Class B Common Units to Class A Common Units, we distribute for each Class A Common Unit acquired (in the most recent conversion) during the period since such conversion, an amount equal to the excess of the value of each Class B Common Unit as of the closing of this offering over the aggregate amount of distributions made in respect of such Class A Common Unit after such conversion and in respect of each Class B Common Unit acquired on the closing date of this offering prior to such conversion; |
• | second, to the Class B Common Unitholders, pro rata until we distribute for each outstanding Class B Common Unit an amount equal to the value of such Class B Common Unit as of the closing of this offering; and |
• | third, 10% to our general partner and 90% to the Class A Common Unitholders and Class B Common Unitholders, pro rata and on an as-converted basis, as one class. |
106
Table of Contents
Distributions of Proceeds from the Sale of our Investment in PSI
We will make distributions of the proceeds of any sale of our investment in PSI (“PSI Proceeds”) in the following manner:
• | first, to the Class A Common Unitholders and Class B Common Unitholders, pro rata and on an as-converted basis, until we distribute an amount equal to the aggregate value of our investment in PSI as of the closing of this offering; and |
• | second, 10% to our general partner and 90% to the Class A Common Unitholders and Class B Common Unitholders, pro rata and on an as-converted basis. |
Distributions upon Liquidation
If we sell all or substantially all of our assets or dissolve in accordance with the partnership agreement, in connection with which we would sell or otherwise dispose of our assets in a process called liquidation, we will apply the proceeds in the following manner:
• | first, to the payment of our creditors in satisfaction of any indebtedness; |
• | second, to the Class A Common Unitholders, pro rata, until (i) we distribute for each outstanding Class A Common Unit, including all prior distributions from operating surplus and capital surplus, an amount equal to the excess of the price paid for such Class A Common Unit in this offering over all distributions made in respect of Class A Common Units (which includes operating surplus distributions, prior capital surplus distributions, PSI Proceeds distributions and liquidating distributions) for the current and prior quarters and (ii) to the extent there has been a conversion of Class B Common Units to Class A Common Units, we distribute for each Class A Common Unit acquired (in the most recent conversion) during the period since such conversion, an amount equal to the excess of the value of each Class B Common Unit as of the closing of this offering over the aggregate amount of distributions made in respect of such Class A Common Unit after such conversion and in respect of each Class B Common Unit acquired on the closing date of this offering prior to such conversion; |
• | third, to the Class B Common Unitholders, pro rata until we distribute for each outstanding Class B Common Unit, including all prior distributions from operating surplus and capital surplus, an amount equal to the value of such Class B Common Unit as of the closing of this offering; and |
• | fourth, 10% to our general partner and 90% to the Class A Common Unitholders and Class B Common, pro rata and on an as-converted basis, as one class. |
We cannot assure that there will be sufficient proceeds in liquidation to make any distributions to the Class A Common Unitholders.
107
Table of Contents
SELECTED PREDECESSOR COMBINED HISTORICAL AND PRO FORMA FINANCIAL AND OPERATING DATA
The selected predecessor combined historical consolidated financial data set forth below as of and for each of the years ended December 31, 2023 and 2022 have been derived from our audited consolidated financial statements included elsewhere in this prospectus. The selected predecessor combined historical consolidated financial data set forth below as of June 30, 2024 and for the six months ended June 30, 2024 and 2023 are derived from our unaudited condensed consolidated financial statements and related notes included elsewhere in this prospectus.
The selected unaudited pro forma financial data for the year ended December 31, 2023 are derived from the unaudited pro forma condensed financial statements of Peak Resources LP included elsewhere in this prospectus. The selected unaudited pro forma financial data as of June 30, 2024 and for the six months ended June 30, 2024 are derived from the unaudited pro forma condensed financial statements of Peak Resources LP included elsewhere in this prospectus. Our unaudited pro forma condensed financial statements give pro forma effect to the following:
• | the Reorganization Transactions as described in “Prospectus Summary—Reorganization Transactions, Partnership Structure and Expected Financing Transaction” elsewhere in this prospectus; and |
• | the issuance and sale by us to the public of 4,700,000 Class A Common Units in this offering and the application of the net proceeds of the offering as described in “Use of Proceeds.” |
The unaudited pro forma financial data were prepared as if the items listed above occurred on January 1, 2023, for pro forma statements of operations purposes, and on June 30, 2024, for pro forma balance sheet purposes, with respect to the pro forma financial data as of December 31, 2023 and June 30, 2024, respectively. We have not given pro forma effect to the incremental general and administrative expenses that we expect to incur annually as a result of being a publicly-traded partnership.
The unaudited pro forma historical financial data is presented for illustrative purposes only and is not necessarily indicative of the financial position that would have existed or the financial results that would have occurred if this offering and the Reorganization Transactions had occurred on the dates indicated, nor is it necessarily indicative of the financial position or results of our operations in the future. The pro forma adjustments, as described in the notes to the unaudited pro forma condensed combined financial statements, are preliminary and based upon currently available information and certain assumptions that our management believes are reasonable. The selected historical consolidated financial data is qualified in its entirety by, and should be read in conjunction with, the “Management’s Discussion and Analysis of Financial Condition and Results of Operations” section included in this prospectus and the consolidated financial statements and related notes and other financial information included in this prospectus. Among other things, those historical financial statements and unaudited pro forma condensed combined financial statements include more detailed information regarding the basis of presentation for the following information. Historical results are not necessarily indicative of results that may be expected for any future period.
108
Table of Contents
You should read the following table in conjunction with “Use of Proceeds,” “Management’s Discussion and Analysis of Financial Condition and Results of Operations,” our historical combined financial statements and our unaudited pro forma condensed combined financial statements and the notes thereto included elsewhere in this prospectus. Among other things, those historical combined financial statements and the unaudited pro forma condensed combined financial statements include more detailed information regarding the basis of presentation for the following information.
Predecessor Combined Historical | Pro Forma | |||||||||||||||||||||||
Six Months Ended June 30, | Year Ended December 31, | Six Months Ended June 30, 2024 | Year Ended December 31, 2023 | |||||||||||||||||||||
(in thousands, except per unit amounts) | 2024 | 2023 | 2023 | 2022 | ||||||||||||||||||||
Statement of operations information: | ||||||||||||||||||||||||
Revenue: | ||||||||||||||||||||||||
Oil and natural gas sales, net | $ | 24,529 | $ | 27,960 | $ | 54,133 | $ | 94,646 | $ | 24,529 | $ | 54,133 | ||||||||||||
|
|
|
|
|
|
|
|
|
|
|
| |||||||||||||
Total revenue, net | 24,529 | 27,960 | 54,133 | 94,646 | 24,529 | 54,133 | ||||||||||||||||||
|
|
|
|
|
|
|
|
|
|
|
| |||||||||||||
Operating Expenses: | ||||||||||||||||||||||||
Lease operating | 6,397 | 6,839 | 13,949 | 14,164 | 6,397 | 13,949 | ||||||||||||||||||
Production and ad valorem taxes | 3,266 | 4,043 | 7,508 | 11,393 | 3,266 | 7,508 | ||||||||||||||||||
Depletion, depreciation and amortization | 7,163 | 13,275 | 28,801 | 30,917 | 7,163 | 28,801 | ||||||||||||||||||
Accretion | 116 | 113 | 227 | 224 | 116 | 227 | ||||||||||||||||||
Abandonment | 1,973 | 2,896 | 2,932 | 1,143 | 1,973 | 2,932 | ||||||||||||||||||
Impairment of oil and natural gas properties(1) | — | — | 111,871 | — | — | 111,871 | ||||||||||||||||||
General and administrative | 4,486 | 4,070 | 7,830 | 7,352 | 4,486 | 8,430 | ||||||||||||||||||
|
|
|
|
|
|
|
|
|
|
|
| |||||||||||||
Total operating expenses | 23,401 | 31,236 | 173,118 | 65,193 | 23,401 | 173,718 | ||||||||||||||||||
|
|
|
|
|
|
|
|
|
|
|
| |||||||||||||
Income (loss) from operations | 1,128 | (3,276 | ) | (118,985 | ) | 29,453 | 1,128 | (119,585 | ) | |||||||||||||||
|
|
|
|
|
|
|
|
|
|
|
| |||||||||||||
Other Income (Expense): | ||||||||||||||||||||||||
Gain (loss) on commodity derivatives | (6,992 | ) | 3,573 | 1,604 | (27,271 | ) | (6,992 | ) | 1,604 | |||||||||||||||
Interest expense, net | (4,330 | ) | (4,193 | ) | (8,867 | ) | (4,913 | ) | (794 | ) | (1,591 | ) | ||||||||||||
Loss from retirement of long-term debt | — | (1,089 | ) | (1,080 | ) | — | — | (1,080 | ) | |||||||||||||||
Investment income(2) | — | — | — | — | 2,304 | 9,675 | ||||||||||||||||||
Gain (loss) on sale of assets | (23 | ) | 1,203 | 1,240 | 7 | (23 | ) | 1,240 | ||||||||||||||||
Other gain (loss) | 90 | 1,293 | 1,652 | (862 | ) | 90 | 1,652 | |||||||||||||||||
|
|
|
|
|
|
|
|
|
|
|
| |||||||||||||
Total other income (expense) | (11,255 | ) | 787 | (5,451 | ) | (33,039 | ) | (5,415 | ) | 11,500 | ||||||||||||||
|
|
|
|
|
|
|
|
|
|
|
| |||||||||||||
Net income (loss) before income taxes | (10,127 | ) | (2,489 | ) | (124,436 | ) | (3,586 | ) | (4,287 | ) | (108,085 | ) | ||||||||||||
Income tax benefit (provision) | — | — | — | — | 900 | 22,698 | ||||||||||||||||||
|
|
|
|
|
|
|
|
|
|
|
| |||||||||||||
Net Loss | $ | (10,127 | ) | $ | (2,489 | ) | $ | (124,436 | ) | $ | (3,586 | ) | $ | (3,387 | ) | $ | (85,387 | ) | ||||||
|
|
|
|
|
|
|
|
|
|
|
| |||||||||||||
Pro forma information: | ||||||||||||||||||||||||
Pro forma net loss(3) | $ | (10,127 | ) | $ | (2,489 | ) | $ | (124,436 | ) | $ | (3,586 | ) | $ | (3,387 | ) | $ | (85,387 | ) | ||||||
Pro forma net loss per Class A Common Unit | ||||||||||||||||||||||||
Basic | $ | (0.23 | ) | $ | (5.87 | ) | ||||||||||||||||||
|
|
|
| |||||||||||||||||||||
Diluted | $ | (0.23 | ) | $ | (5.87 | ) | ||||||||||||||||||
|
|
|
| |||||||||||||||||||||
Pro forma net loss per Class B Common Unit | ||||||||||||||||||||||||
Basic | $ | (0.23 | ) | $ | (5.87 | ) | ||||||||||||||||||
|
|
|
| |||||||||||||||||||||
Diluted | $ | (0.23 | ) | $ | (5.87 | ) | ||||||||||||||||||
|
|
|
|
109
Table of Contents
Predecessor Combined Historical | Pro Forma | |||||||||||||||||||||||
Six Months Ended June 30, | Year Ended December 31, | Six Months Ended June 30, 2024 | Year Ended December 31, 2023 | |||||||||||||||||||||
(in thousands, except per unit amounts) | 2024 | 2023 | 2023 | 2022 | ||||||||||||||||||||
Pro forma weighted-average number of Class A Common Units | ||||||||||||||||||||||||
Basic | 4,939,065 | 4,939,065 | ||||||||||||||||||||||
|
|
|
| |||||||||||||||||||||
Diluted | 4,939,065 | 4,939,065 | ||||||||||||||||||||||
|
|
|
| |||||||||||||||||||||
Pro forma weighted-average number of Class B Common Units | ||||||||||||||||||||||||
Basic | 9,608,805 | 9,608,805 | ||||||||||||||||||||||
|
|
|
| |||||||||||||||||||||
Diluted | 9,608,805 | 9,608,805 | ||||||||||||||||||||||
|
|
|
| |||||||||||||||||||||
Balance sheet information (end of period): | ||||||||||||||||||||||||
Cash and cash equivalents | $ | 9,170 | $ | 10,468 | $ | 15,439 | $ | 6,561 | $ | 25,904 | ||||||||||||||
Total oil and natural gas properties | $ | 187,397 | $ | 312,704 | $ | 194,658 | $ | 317,774 | $ | 187,397 | ||||||||||||||
Total assets | $ | 213,454 | $ | 345,368 | $ | 233,985 | $ | 346,926 | $ | 248,520 | ||||||||||||||
Long-term debt | $ | 48,610 | $ | 53,957 | $ | 49,765 | $ | 52,000 | $ | — | ||||||||||||||
Total liabilities | $ | 93,023 | $ | 92,863 | $ | 103,427 | $ | 91,932 | $ | 69,294 | ||||||||||||||
Total members’ equity | $ | 120,431 | $ | 252,505 | $ | 130,558 | $ | 254,994 | $ | 179,226 | ||||||||||||||
Net cash provided by (used by): | ||||||||||||||||||||||||
Operating activities | $ | (2,391 | ) | $ | 4,684 | $ | 14,093 | $ | 20,829 | |||||||||||||||
Investing activities | $ | (2,248 | ) | $ | (7,733 | ) | $ | (9,099 | ) | $ | (15,278 | ) | ||||||||||||
Financing activities | $ | (1,630 | ) | $ | 6,956 | $ | 3,884 | $ | (19,408 | ) | ||||||||||||||
Other financial information: | ||||||||||||||||||||||||
Adjusted EBITDAX(4) | $ | 10,211 | $ | 13,145 | $ | 24,076 | $ | 29,708 | $ | 10,211 | $ | 33,151 | ||||||||||||
Distributable Cash from Operations(5) | $ | 2,744 | $ | (384 | ) | $ | 4,258 | $ | 11,119 | $ | 4,004 | $ | 21,179 |
(1) | Impairment for the year ended December 31, 2023 and the six months ended June 30, 2024 was primarily due to a decrease in the value of proved oil and natural gas reserves as a result of lower oil and natural gas prices at December 31, 2023 and June 30, 2024, respectively, as well as SEC guidelines on development pace. For the year ended December 31, 2023, oil and natural gas prices calculated in accordance with SEC guidelines decreased by 16.5% and 58.5%, respectively, as compared to the year ended December 31, 2022. |
(2) | Adjustment to reflect distributions received from PSI representing a return on investment during the six months ended June 30, 2024 and the year ended December 31, 2023. |
(3) | Pro forma net loss reflects a pro forma income tax benefit of $0.9 million for the six months ended June 30, 2024 and $22.7 million for the year ended December 31, 2023, respectively, all of which is associated with the income tax effects of the corporate reorganization described under “Prospectus Summary—Reorganization Transactions, Partnership Structure and Expected Refinancing Transaction” and this offering. Our predecessor was not subject to U.S. federal income tax at an entity level. As a result, the consolidated net loss in our historical financial statements does not reflect the tax expense or benefit we would have incurred if we were subject to U.S. federal income tax at an entity level during such periods. |
(4) | Adjusted EBITDAX is not a financial measure calculated in accordance with GAAP, but we believe it provides important perspective regarding our operating results. “The Offering—Non-GAAP Financial Measures” contains a description of Adjusted EBITDAX and a reconciliation to our net income (loss), our most directly comparable financial measure calculated in accordance with GAAP. |
(5) | Distributable Cash from Operations is not a financial measure calculated in accordance with GAAP, but we believe it provides important perspective regarding our ability to internally fund our exploration and development activities, pay distributions, and to service or incur additional debt. “The Offering—Non-GAAP Financial Measures” contains a description of Distributable Cash from Operations and a reconciliation to net income (loss), our most directly comparable financial measure calculated in accordance with GAAP. |
110
Table of Contents
MANAGEMENT’S DISCUSSION AND ANALYSIS OF FINANCIAL CONDITION AND RESULTS OF OPERATIONS
The following discussion and analysis should be read in conjunction with the “Selected Predecessor Combined Historical and Pro Forma Financial and Operating Data” and the audited historical financial statements and related notes of Peak E&P and PBLM, as well as the unaudited pro forma financial statements included elsewhere in this prospectus. Unless otherwise indicated, the historical financial information in this “Management’s Discussion and Analysis of Financial Condition and Results of Operation” reflects the historical financial results of Peak E&P and PBLM, on an individual basis and does not include the results of, or give pro forma effect to, the offering and the Reorganization Transactions described in “Prospectus Summary—Reorganization Transactions, Partnership Structure and Expected Refinancing Transaction.”
The following discussion contains forward-looking statements that reflect our future plans, estimates, beliefs and expected performance, which may affect future operating results and financial position. The forward-looking statements are dependent upon events, risks and uncertainties that may be outside our control. Actual results and the timing of the events could differ materially from those discussed in these forward-looking statements. Factors that could cause or contribute to such differences include, but are not limited to, market prices for oil and natural gas, production volumes, estimates of reserves, capital expenditures, economic, inflationary and competitive conditions, drilling results, regulatory changes and other uncertainties, as well as those factors discussed below and elsewhere in this prospectus, particularly under “Risk Factors” and “Cautionary Note Regarding Forward-Looking Statements,” all of which are difficult to predict. In light of these risks, uncertainties and assumptions, the forward-looking events discussed may not occur. We do not undertake any obligation to publicly update any forward-looking statements except as otherwise required by applicable law.
We are an independent limited partnership that was recently formed to hold investments in oil and natural gas businesses and assets owned by certain investment partnerships managed by Yorktown, management and other investors who are not affiliated with Yorktown or management. The historical financial statements of Peak Resources LP are not included in this registration statement because it does not currently have any assets or liabilities. We conduct our operating activities in Wyoming. We believe the reservoir quality and stacked pay potential of the Powder River Basin is similar to that of the Permian Basin, with an approximate 4,000-foot gross column, high oil content and significant over-pressure, with multiple productive horizons as deep as 13,500 feet. In addition, the geographic location of the Powder River Basin provides us with attractive realized pricing and operating leverage due to its proximity to end markets, installed infrastructure with ample capacity for growth, access to in-basin service providers and what we view as a favorable regulatory climate in the State of Wyoming for hydrocarbon development operations. Further we expect that with increased basin-wide activity, our production costs will decrease on a per Boe basis while maintaining realized pricing due to ample takeaway and a geographical advantage.
As of June 30, 2024, we had approximately 65,000 gross (45,000 net) acres comprised of private, state, and federal lands with a number of large, contiguous leasehold blocks in the over-pressured core of the Powder River Basin, primarily in Campbell and Converse Counties, Wyoming. We have drilled and operate a total of 104 gross (56 net) producing horizontal wells. In addition, we have drilled two gross (one net) horizontal wells awaiting completion. We also own interests in an additional 83 gross (four net) non-operated, producing horizontal wells with an average working interest of approximately 4.8%. All 83 gross (four net) non-operated wells are operated primarily by other leading Powder River Basin operators including EOG Resources, Devon Energy, Anschutz Exploration, and Ballard Petroleum.
111
Table of Contents
Factors Affecting the Comparability of Our Future Results of Operations to Our Historical Results of Operations
Our future results of operations may not be comparable to our historical results of operations for the periods presented, primarily for the reasons described below.
Reorganization Transactions—The historical consolidated financial statements included in this prospectus are of Peak E&P and PBLM prior to the Reorganization Transactions described in “Prospectus Summary—Reorganization Transactions, Partnership Structure and Expected Refinancing Transaction.” Our historical financial data may not yield an accurate indication of what our actual results would have been if the Reorganization Transactions had been completed at the beginning of the periods presented or of what our future results of operations are likely to be. For our results of operations of Peak E&P and PBLM presented on a combined basis and pro forma for the Reorganization Transactions and this offering, please see “Selected Predecessor Combined Historical and Pro Forma Financial and Operating Data” presented elsewhere in this prospectus.
Public Company Expenses—Upon the completion of this offering, we expect to incur incremental non-recurring costs related to our transition to a publicly traded partnership, including the costs of this initial public offering and the costs associated with the initial implementation of our internal control implementation and testing. We also expect to incur additional recurring costs related to being a public company, including costs associated with the employment of additional personnel, compliance under the Exchange Act and applicable securities exchange requirements, annual and quarterly reports to be filed with the SEC, tax return preparation, independent auditor fees, investor relations activities, registrar and transfer agent fees, and incremental director and officer liability insurance costs. The direct, incremental general and administrative expenses are not included in our historical or pro forma financial statements; however, we expect those expenses to be approximately $2.5 million per year.
Impairment—We evaluate our producing properties for impairment whenever events or changes in circumstances indicate that the carrying amount of an asset may not be recoverable. When assessing proved properties for impairment, we compare the expected undiscounted future cash flows of the proved properties to the carrying amount of the proved properties to determine recoverability. If the carrying amount of proved properties exceeds the expected undiscounted future cash flows, the carrying amount is written down to the properties’ estimated fair value, which is measured as the present value of the expected future cash flows of such properties. The factors used to determine fair value include estimates of proved reserves, future commodity prices, timing of future production, and a risk-adjusted discount rate. The proved property impairment test is primarily impacted by future commodity prices, changes in estimated reserve quantities, estimates of future production, overall proved property balances, and depletion expense. If pricing conditions decline or are depressed, or if there is a negative impact on one or more of the other components of the calculation, we may incur proved property impairments in future periods.
New Credit Facility—We are in the process of negotiating the terms of the New Credit Facility at the Partnership level that we anticipate entering into at the closing of this offering. The amount, maturity, interest rates and other terms of the New Credit Facility are in the process of being negotiated with prospective lenders; however we expect that the aggregate commitments thereunder will be approximately $200.0 million with an initial borrowing base of $45.0 million. The New Credit Facility will be a senior secured revolving credit facility that will be guaranteed by certain of our subsidiaries and secured by substantially all of our assets and the assets of certain of our subsidiaries. We anticipate the New Credit Facility to have a four-year term and borrowings under the New Credit Facility to bear interest at a variable rate per annum equal to, at the Partnership’s option, SOFR or base rate, in each case plus an applicable margin per annum that is determined by a leverage ratio. The New Credit Facility is anticipated to contain representations and warranties, affirmative, negative and financial covenants and events of default customary for secured financings of this type. Assuming we enter into the New Credit Facility at the closing of this offering, we will use approximately $15.0 million in borrowings under the New Credit Facility and approximately $40.9 million of the net proceeds of this offering to repay in full (including payment of the applicable prepayment fee) and terminate our Existing Credit Agreement. However, in
112
Table of Contents
the event that we are unable to obtain binding commitments for the New Credit Facility on acceptable terms, $15.0 million of the $15.7 million of net proceeds that would otherwise be designated as a reserve for general partnership purposes will be used to repay the balance on the Existing Credit Agreement. We may not be able to arrange binding commitments for the New Credit Facility, or the pricing, size, covenants or other terms of the facility may be less favorable than the New Credit Facility described herein, which could increase our interest costs, reduce our operational or financial flexibility, or reduce our access to liquidity.
Tax Status—Even though we are organized as a partnership under state law, we made an election to be treated as a corporation for United States federal income tax purposes. As such, we are subject to income tax at the United States federal corporate tax rate. The amount of taxable income attributable to non-controlling interest is not subject to federal income taxes. Prior to this offering, we were not subject to United States federal income taxes as we were organized and taxed as partnerships.
How We Evaluate Our Operations
We use a variety of financial and operational metrics to assess the performance of our operations, including the following sources of our revenue, principal components of our cost structure and other financial metrics:
• | production volumes; |
• | realized prices on the sale of oil and natural gas; |
• | lease operating expenses; |
• | Adjusted EBITDAX; and |
• | Distributable Cash from Operations. |
Net Production Volumes—Our oil and natural gas revenue is derived from the sale of oil and natural gas production. We report our reserves in two streams: oil and natural gas. The economic value of NGLs is included in our natural gas price and production. As reservoir pressures decline, production from a given well or formation decreases. Growth in future production and reserves will depend on our ability to continue to add proved reserves in excess of our production. Our ability to add reserves through development projects and acquisitions is dependent on many factors, including our ability to raise capital, obtain regulatory approvals, procure contract drilling rigs and personnel and successfully identify and consummate acquisitions.
Realized Prices—The NYMEX WTI and Henry Hub futures prices are widely used benchmarks in the pricing of domestic and imported oil and natural gas, respectively, in the United States. The actual prices realized from the sale of oil and natural gas differ from the quoted NYMEX WTI price and the NYMEX Henry Hub price, respectively, as a result of quality and location differentials. The prices we realize on the oil produced is affected by the ability to transport crude oil to the applicable transportation hub. Location differentials to NYMEX Henry Hub prices result from variances in transportation costs based on the proximity of the natural gas to the major consuming markets to which it is ultimately delivered.
We plan to continue our practice of entering into hedging arrangements to reduce the impact of commodity price volatility on our cash flow from operations and to satisfy requirements under the Existing Credit Agreement and the New Credit Facility, as applicable, to hedge, on a rolling quarterly basis, reasonably anticipated projected production of proved developed producing reserves. All derivative instruments are recorded on the consolidated balance sheets as an asset or liability measured at fair value, with changes in the fair value of the derivatives recorded currently in the consolidated statements of operations. For the years ended December 31, 2023 and 2022, and for the six months ended June 30, 2024 and 2023, we did not designate any of our derivative contracts as cash flow hedges. PBLM does not engage in hedging activities.
113
Table of Contents
Hedging only provides partial price protection against declines in prices and may partially limit our potential gains from future price increases. In addition, in times of low commodity prices, our ability to enter into additional commodity derivative contracts with favorable commodity price terms may be limited, which may adversely impact our future operating income and cash flows as compared to historical periods during which we were able to hedge a portion of production at higher prices.
Principal Components of Our Cost Structure
Lease Operating Expense—Lease operating expenses are the costs incurred in the operation and maintenance of producing properties and related well workover expenses. Expenses for direct labor, water injection and disposal, utilities, materials, supplies, compressor rental, and surface-use payments comprise the most significant portion of our lease operating expenses. Lease operating expenses do not include general and administrative expenses or production or ad valorem taxes. Certain items, such as direct labor and materials and supplies, generally remain relatively fixed across broad production volume ranges, but can fluctuate depending on activities performed during a specific period. For instance, repairs to equipment or surface facilities result in increased lease operating expenses in periods during which they are performed. Certain of our operating cost components are variable and increase or decrease as the level of produced hydrocarbons and water increases or decreases. For example, certain power and water disposal costs may vary directly with the amount of hydrocarbons and water produced.
We monitor our operations to ensure we are incurring lease operating expenses at an acceptable level. Although we strive to reduce our lease operating expenses, these expenses can increase or decrease on a per unit basis as a result of various factors.
Production and Ad Valorem Tax Expense—Production taxes are paid based on a percentage of revenues from oil and natural gas production sold at fixed rates established by state or local taxing authorities. In general, the production taxes we pay are correlated to changes in revenues. We recognize and pay production taxes at the full statutory rate until an application for a reduced production tax rate is approved, as applicable, at which time a refund will be issued for severance taxes paid in excess of the approved reduced rate. We are also subject to ad valorem taxes in the counties where our production is located. Ad valorem taxes are generally based on the valuation of our oil and natural gas properties and vary slightly across the different counties in which we operate.
Depletion, Depreciation and Amortization—Depletion, depreciation and amortization is the systematic expensing of the capitalized costs incurred to acquire, explore and develop natural gas and oil. We use the successful efforts method of accounting for oil and natural gas activities and, as such, we capitalize all costs associated with the drilling and completion of oil and natural gas properties associated with developmental wells. Costs associated with exploratory wells are capitalized, or suspended, until we determine if proved reserves are discovered.
Accretion—We recognize accretion expense in connection with the discounted liability for future abandonment costs over the remaining estimated economic lives of the respective oil and natural gas properties.
Abandonment—We recognize abandonment expenses in connection with the determination that certain leases of unproved property will be allowed to expire. Upon determination that a property lease will be allowed to expire, we recognize an abandonment expense for the associated costs of the lease.
Impairment of Oil and Natural Gas Properties—We review and evaluate our long-lived assets for impairment when events or changes in circumstances indicate that the related carrying amounts may not be recoverable. If there is an indication the carrying amount of an asset may not be recovered, the asset is assessed for potential impairment by management through an established process. If, upon review, the sum of the undiscounted pre-tax reserve cash flows is less than the carrying value of the asset, the carrying value is written down to estimated fair value. An impairment loss is measured as the amount by which asset carrying value exceeds fair value on an individual field-by-field basis.
114
Table of Contents
General and Administrative—General and administrative expenses include costs incurred to operate the business that are not directly tied to the operation of producing properties. Employee compensation and benefits, rent, office expenses and audit and other fees for professional services and legal compliance comprise the most significant portion of general and administrative expenses.
We monitor our general and administrative expenses to ensure that we are incurring expenses at an acceptable level. Although we strive to reduce our expenses, these expenses can increase or decrease as a result of various factors as we manage our business activities or make acquisitions and dispositions of properties. For example, we may increase general and administrative expenses to optimize our business monitoring and reporting, incurring higher expenses in one quarter relative to another or we may acquire or dispose of properties that have different development opportunities. These initiatives would influence our overall general and administrative expenses and could cause fluctuations when comparing general and administrative expenses on a period-to-period basis.
Gain (Loss) on Commodity Derivatives—We recognize our derivative instruments on the consolidated balance sheet as assets or liabilities at fair value with such amounts classified as current or long-term based on anticipated settlement dates. The accounting for the changes in fair value of a derivative depends on the intended use of the derivative and resulting designation. We have not designated derivative instruments as hedges for accounting purposes and, as a result, mark derivative instruments to fair value and recognize the cash and non-cash change in fair value on derivative instruments for each period in our consolidated statements of operations.
Interest Expense, Net—We have borrowings outstanding under our Existing Credit Facility and anticipate having borrowings outstanding under our New Credit Facility, which we are currently negotiating, at the closing of this offering. As a result, we incur interest expense that is impacted by both fluctuations in interest rates and total principal amount outstanding. Interest paid to the lenders under the Existing Credit Facility is included in interest expense in the consolidated statements of operations.
Adjusted EBITDAX—We include in this prospectus the non-GAAP financial measure Adjusted EBITDAX and provide our calculation of Adjusted EBITDAX and a reconciliation of Adjusted EBITDAX to net income (loss), our most directly comparable financial measures calculated and presented in accordance with GAAP. We define Adjusted EBITDAX as net income (loss) before (1) interest expense, net of interest income, (2) income tax provision, (3) depreciation, depletion and amortization, (4) impairment expenses, (5) accretion of discount on asset retirement obligations, (6) exploration expenses, (7) unrealized (gains) losses on commodity derivative contracts, (8) non-cash incentive compensation, (9) non-cash (gain) loss on investment in PSI, (10) abandonment expenses, and (11) certain other non-cash expenses. For a reconciliation of Adjusted EBITDAX to net income (loss), our most directly comparable financial measures calculated and presented in accordance with GAAP, see “The Offering—Non-GAAP Financial Measures—Adjusted EBITDAX.”
We believe Adjusted EBITDAX is useful because it allows us to more effectively evaluate our operating performance and compare the results of our operations from period to period without regard to our financing methods or capital structure. We exclude the items listed above from net income (loss) in arriving at Adjusted EBITDAX because these amounts can vary substantially from company to company within our industry depending upon accounting methods and book values of assets, capital structures and the method by which the assets were acquired. Adjusted EBITDAX should not be considered as an alternative to, or more meaningful than, net income (loss) as determined in accordance with GAAP or as an indicator of our operating performance. Certain items excluded from Adjusted EBITDAX are significant components in understanding and assessing a company’s financial performance, such as a company’s cost of capital, hedging strategy and tax structure, as well as the historic costs of depreciable assets, none of which are components of Adjusted EBITDAX. Our computations of Adjusted EBITDAX may not be comparable to other similarly titled measure of other companies.
115
Table of Contents
Distributable Cash from Operations—Distributable Cash from Operations is not a measure of net cash flow provided by or used in operating activities as determined by GAAP. Distributable Cash from Operations is a supplemental non-GAAP financial measure used by our management and by external users of our financial statements, such as investors, lenders and others (including industry analysts and rating agencies who will be using such measure), to assess our ability to internally fund our exploration and development activities, pay distributions, and to service or incur additional debt. We define Distributable Cash from Operations as Adjusted EBITDAX, including dividends, less (1) cash interest expense, net of interest income, (2) development costs net of divestiture proceeds, (3) acquisition costs, (4) cash income tax payments, (5) reimbursements of expenses and payment of fees to our general partner and its affiliates and (6) certain other cash expenses. Development costs include all of our expansion capital expenditures made for oil and natural gas properties, other than acquisitions, as well as maintenance capital expenditures net of any proceeds from divestitures. Distributable Cash from Operations will not reflect changes in working capital balances. Distributable Cash from Operations is not a measurement of our financial performance or liquidity under GAAP and should not be considered as an alternative to, or more meaningful than, net income (loss) as determined in accordance with GAAP or as indicators of our financial performance and liquidity. The GAAP measure most directly comparable to Distributable Cash from Operations is net income (loss). Distributable Cash from Operations should not be considered as an alternative to, or more meaningful than, net income (loss).
Results of Operations—Peak E&P
Six Months Ended June 30, 2024 Compared to the Six Months Ended June 30, 2023
Revenues
The following information provides the components of Peak E&P’s revenues, as well as average realized prices and net production volumes (dollar amounts in thousands):
Six Months Ended June 30, | 2024 Compared to 2023 | |||||||||||||||
2024 | 2023 | Change | % Change | |||||||||||||
Revenues: | ||||||||||||||||
Oil sales | $ | 20,611 | $ | 21,678 | $ | (1,067 | ) | (4.9 | )% | |||||||
Natural gas sales(1) | 2,366 | 3,587 | (1,221 | ) | (34.0 | )% | ||||||||||
|
|
|
|
|
|
|
| |||||||||
Total revenues, net | $ | 22,977 | $ | 25,265 | $ | (2,288 | ) | (9.1 | )% | |||||||
|
|
|
|
|
|
|
| |||||||||
Average Sales Price: | ||||||||||||||||
Oil, without realized derivatives ($/Bbl) | $ | 76.53 | $ | 73.87 | $ | 2.65 | 3.6 | % | ||||||||
Oil, with realized derivatives ($/Bbl) | $ | 71.96 | $ | 67.07 | $ | 4.89 | 7.3 | % | ||||||||
Natural gas, without realized derivatives ($/Mcf) | $ | 1.98 | $ | 2.70 | $ | (0.71 | ) | (26.4 | )% | |||||||
Natural gas, with realized derivatives ($/Mcf) | $ | 2.82 | $ | 2.42 | $ | 0.39 | 16.3 | % | ||||||||
Total, without realized derivatives ($/Boe) | $ | 49.07 | $ | 49.04 | $ | 0.04 | 0.1 | % | ||||||||
Total, with realized derivatives ($/Boe) | $ | 48.57 | $ | 44.46 | $ | 4.12 | 9.3 | % | ||||||||
Net Production Volumes: | ||||||||||||||||
Oil (Bbls) | 269,332 | 293,448 | (24,116 | ) | (8.2 | )% | ||||||||||
Natural gas (Mcf) | 1,193,367 | 1,330,748 | (137,381 | ) | (10.3 | )% | ||||||||||
Total (Boe) | 468,227 | 515,239 | (47,012 | ) | (9.1 | )% | ||||||||||
Average daily production (Boe/d) | 2,573 | 2,847 | (274 | ) | (9.6 | )% |
(1) | Because our reserves and production are reported in two streams, the economic value of the NGLs is included in our natural gas pricing and production. |
Peak E&P’s results of operations are heavily influenced by commodity prices, which have historically been volatile. As Peak E&P’s production consists primarily of oil, its revenues are more sensitive to fluctuations in oil prices, as compared to fluctuations in natural gas prices. An extended decline in commodity prices may adversely affect Peak E&P’s business, financial condition or results of operations and its ability to meet capital expenditure obligations and financial commitments.
116
Table of Contents
The following table provides the dollar effect of changes in commodity prices on Peak E&P’s oil and natural gas revenues for the periods indicated (dollar amounts in thousands):
Six Months Ended June 30, 2024 Compared to 2023 | ||||||||||||
Change in Price | Production Volumes | Total Net Effect | ||||||||||
Effect of Change in Price: | ||||||||||||
Oil sales (Bbls) | $ | 2.65 | 269,332 | $ | 715 | |||||||
Natural gas sales (Mcf)(1) | $ | (0.71 | ) | 1,193,367 | (851 | ) | ||||||
|
| |||||||||||
Change in total revenues | $ | (136 | ) | |||||||||
|
|
(1) | Because our reserves and production are reported in two streams, the economic value of the NGLs is included in our natural gas pricing and production. |
The following table provides the dollar effect of changes in production volumes on Peak E&P’s oil and natural gas revenues for the periods indicated (dollar amounts in thousands):
Six Months Ended June 30, 2024 Compared to 2023 | ||||||||||||
Change in Production | Prior Period Prices | Total Net Effect | ||||||||||
Effect of Change in Production: | ||||||||||||
Oil sales (Bbls) | (24,116 | ) | $ | 73.87 | $ | (1,782 | ) | |||||
Natural gas sales (Mcf)(1) | (137,381 | ) | $ | 2.70 | (370 | ) | ||||||
|
| |||||||||||
Change in total revenues | $ | (2,152 | ) | |||||||||
|
|
(1) | Because our reserves and production are reported in two streams, the economic value of the NGLs is included in our natural gas pricing and production. |
Production decreased 47,013 Boe, or 9.1%, for the six months ended June 30, 2024, as compared to the six months ended June 30, 2023. This decrease in production was primarily due to natural production decline with oil and natural gas production decreasing by 8.2% and 10.3%, respectively, during the six months ended June 30, 2024, as compared to the six months ended June 30, 2023.
117
Table of Contents
Operating Expenses
The following information provides the components of Peak E&P’s operating expenses, on both an absolute basis and per Boe basis, (dollar amounts in thousands):
Six Months Ended June 30, | 2024 Compared to 2023 | |||||||||||||||
2024 | 2023 | Change | % Change | |||||||||||||
Operating Expenses: | ||||||||||||||||
Lease operating | $ | 6,050 | $ | 6,506 | $ | (456 | ) | (7.0 | )% | |||||||
Production and ad valorem taxes | 3,057 | 3,678 | (621 | ) | (16.9 | )% | ||||||||||
Depletion, depreciation and amortization | $ | 6,555 | 12,139 | (5,584 | ) | (46.0 | )% | |||||||||
Accretion | 114 | 111 | 3 | 2.7 | % | |||||||||||
Abandonment | 1,921 | 2,863 | (942 | ) | (32.9 | )% | ||||||||||
General and administrative | 3,606 | 3,436 | 170 | 4.9 | % | |||||||||||
|
|
|
|
|
|
|
| |||||||||
Total operating expenses | $ | 21,303 | $ | 28,733 | $ | (7,430 | ) | (25.9 | )% | |||||||
|
|
|
|
|
|
|
| |||||||||
Operating Expenses ($/BOE): |
| |||||||||||||||
Lease operating | $ | 12.92 | $ | 12.63 | $ | 0.29 | 2.3 | % | ||||||||
Production and ad valorem taxes | $ | 6.53 | $ | 7.14 | $ | (0.61 | ) | (8.5 | )% | |||||||
Depletion, depreciation and amortization | $ | 14.00 | $ | 23.56 | $ | (9.56 | ) | (40.6 | )% | |||||||
Accretion | $ | 0.24 | $ | 0.22 | $ | 0.02 | 9.1 | % | ||||||||
Abandonment | $ | 4.10 | $ | 5.56 | $ | (1.46 | ) | (26.2 | )% | |||||||
General and administrative | $ | 7.70 | $ | 6.67 | $ | 1.03 | 15.5 | % |
Lease Operating—Lease operating expenses decreased by 7.0%, to $6.1 million for the six months ended June 30, 2024, as compared to the six months ended June 30, 2023. On a Boe basis, lease operating expenses increased by 2.3% to $12.92 per Boe as a result of lower production during the six months ended June 30, 2024 as compared to the six months ended June 30, 2023.
Production and Ad Valorem Taxes—Production and ad valorem taxes decreased by 16.9%, to $3.1 million for the six months ended June 30, 2024 as compared to the six months ended June 30, 2023. On a Boe basis, production and ad valorem taxes decreased by 8.5% to $6.53 per Boe for the six months ended June 30, 2024, as compared to the six months ended June 30, 2023. Lower production and ad valorem taxes per Boe were the result of lower natural gas prices during the six months ended June 30, 2024, as compared to the six months ended June 30, 2023.
Depletion, Depreciation and Amortization—Depletion, depreciation and amortization expenses decreased by 46.0%, to $6.6 million for the six months ended June 30, 2024, as compared to the six months ended June 30, 2023. On a Boe basis, depletion, depreciation and amortization expenses decreased by 40.6% to $14.00 per Boe for the six months ended June 30, 2024, as compared to the six months ended June 30, 2023. Lower depletion, depreciation and amortization expenses were the result of a significant decrease in the net book value of proved oil and gas properties at June 30, 2024, as compared to June 30, 2023, due to a large impairment charge booked at the end of 2023, offset partially by lower overall production for the six months ended June 30, 2024 as compared to the six months ended June 30, 2023.
Abandonment—Abandonment expenses were $1.9 million for the six months ended June 30, 2024, as compared to $2.9 million for the six months ended June 30, 2023. Peak E&P performs a periodic review of unproved property costs to determine (i) whether any leases associated with the property have expired or been abandoned, (ii) whether the subject property will be developed or (iii) if the carrying value of the property is not realizable.
General and Administrative—General and administrative expenses increased by 4.9%, to $3.6 million for the six months ended June 30, 2024, as compared to six months ended June 30, 2023. Higher general and
118
Table of Contents
administrative expenses were primarily the result of market adjustments to compensation. On a Boe basis, general and administrative expenses increased by 15.5% to $7.70 per Boe for the six months ended June 30, 2024, as compared to the six months ended June 30, 2023. Higher general and administrative expenses per Boe were the result of a decrease in overall production, slightly offset by increase in general and administrative expenses due to market adjustments to compensation for the six months ended June 30, 2024, as compared to the six months ended June 30, 2023.
Other Income (Expense)
The following information provides the components of Peak E&P’s other income and expenses (in thousands):
Six Months Ended June 30, | 2024 Compared to 2023 | |||||||||||||||
2024 | 2023 | Change | % Change | |||||||||||||
Other Income (Expense): | ||||||||||||||||
Gain (loss) on commodity derivatives | $ | (6,992 | ) | $ | 3,573 | $ | (10,565 | ) | (295.7 | )% | ||||||
Interest expense, net | (4,330 | ) | (4,193 | ) | (137 | ) | 3.3 | % | ||||||||
Loss from retirement of long-term debt | — | (1,089 | ) | 1,089 | * | |||||||||||
Gain (loss) on sale of assets | (23 | ) | 1,203 | (1,226 | ) | (101.9 | )% | |||||||||
Other gain | 52 | 1,293 | (1,241 | ) | (96.0 | )% | ||||||||||
|
|
|
|
|
|
|
| |||||||||
Total other income (expense) | $ | (11,293 | ) | $ | 787 | $ | (12,080 | ) | * | |||||||
|
|
|
|
|
|
|
|
* | Percentage change not meaningful |
Gain (Loss) on Commodity Derivatives—Gain (loss) on commodity derivatives decreased to a loss of $7.0 million for the six months ended June 30, 2024, as compared to a gain of $3.6 million for the six months ended June 30, 2023.
The following table provides the components of Peak E&P’s gain (loss) on commodity derivatives for the six months ended June 30, 2024 and 2023:
Six Months Ended June 30, | 2024 Compared to 2023 | |||||||||||||||
2024 | 2023 | Change | % Change | |||||||||||||
Cash paid on derivatives | $ | (236 | ) | $ | (2,359 | ) | $ | 2,124 | (90.0 | )% | ||||||
Non-cash gain (loss) on derivatives | (6,756 | ) | 5,932 | (12,689 | ) | (213.9 | )% | |||||||||
|
|
|
|
|
|
|
| |||||||||
Gain (loss) on commodity derivatives | $ | (6,992 | ) | $ | 3,573 | $ | (10,565 | ) | (295.7 | )% | ||||||
|
|
|
|
|
|
|
|
The $2.1 million favorable change in cash paid on derivatives was largely driven by lower oil and natural gas prices for the six months ended June 30, 2024, as compared to the six months ended June 30, 2023.
Interest Expense, Net—Interest expense, net, increased by 3.3%, to $4.3 million, for the six months ended June 30, 2024, as compared to the six months ended June 30, 2023. The increase in interest expense for the six months ended June 30, 2024, as compared to the six months ended June 30, 2023, was due to a slightly higher interest rate associated with the Existing Credit Agreement (as compared to the prior credit facilities), which was a weighted average of 13.48% for the six months ended June 30, 2024, as compared to a weighted average of 12.63% for the six months ended June 30, 2023.
Loss From Retirement of Long-Term Debt—Loss from retirement of long-term debt was $1.1 million for the six months ended June 30, 2023. During the six months ended June 30, 2023, Peak E&P entered into the Existing Credit Agreement and used the proceeds to fully repay the Prior Credit Facility and the NPA (as hereinafter defined). As a
119
Table of Contents
result of the full repayment of the Prior Credit Facility and NPA, all unamortized debt issuance costs associated with those two facilities were written off, resulting in a loss from the early retirement of those two facilities.
Year Ended December 31, 2023 Compared to the Year Ended December 31, 2022
Revenues
The following information provides the components of Peak E&P’s revenues, as well as average realized prices and net production volumes (dollar amounts in thousands):
Year Ended December 31, | 2023 Compared to 2022 | |||||||||||||||
2023 | 2022 | Change | % Change | |||||||||||||
Revenues: | ||||||||||||||||
Oil sales | $ | 43,553 | $ | 66,236 | $ | (22,683 | ) | (34.2 | )% | |||||||
Natural gas sales(1) | 6,078 | 18,365 | (12,287 | ) | (66.9 | )% | ||||||||||
|
|
|
|
|
|
|
| |||||||||
Total revenues, net | $ | 49,631 | $ | 84,601 | $ | (34,970 | ) | (41.3 | )% | |||||||
|
|
|
|
|
|
|
| |||||||||
Average Sales Price: | ||||||||||||||||
Oil, without realized derivatives ($/Bbl) | $ | 76.17 | $ | 93.25 | $ | (17.08 | ) | (18.3 | )% | |||||||
Oil, with realized derivatives ($/Bbl) | $ | 69.70 | $ | 62.26 | $ | 7.44 | 11.9 | % | ||||||||
Natural gas, without realized derivatives ($/Mcf)(1) | $ | 2.45 | $ | 6.37 | $ | (3.92 | ) | (61.5 | )% | |||||||
Natural gas, with realized derivatives ($/Mcf)(1) | $ | 2.46 | $ | 3.19 | $ | (0.73 | ) | (22.9 | )% | |||||||
Total, without realized derivatives ($/Boe) | $ | 50.35 | $ | 71.06 | $ | (20.71 | ) | (29.1 | )% | |||||||
Total, with realized derivatives ($/Boe) | $ | 46.63 | $ | 44.87 | $ | 1.76 | 3.9 | % | ||||||||
Net Production Volumes: |
| |||||||||||||||
Oil (Bbls) | 571,769 | 710,294 | (138,525 | ) | (19.5 | )% | ||||||||||
Natural gas (Mcf) | 2,484,069 | 2,881,933 | (397,864 | ) | (13.8 | )% | ||||||||||
Total (Boe) | 985,781 | 1,190,616 | (204,835 | ) | (17.2 | )% | ||||||||||
Average daily production (Boe/d) | 2,701 | 3,262 | (561 | ) | (17.2 | )% |
(1) | Because our reserves and production are reported in two streams, the economic value of the NGLs is included in our natural gas pricing and production. |
Peak E&P’s results of operations are heavily influenced by commodity prices, which have historically been volatile. As Peak E&P’s production consists primarily of oil, its revenues are more sensitive to fluctuations in oil prices, as compared to fluctuations in natural gas prices. An extended decline in commodity prices may adversely affect Peak E&P’s business, financial condition or results of operations and its ability to meet capital expenditure obligations and financial commitments.
The following table provides the dollar effect of changes in commodity prices on Peak E&P’s oil and natural gas revenues for the periods indicated (dollar amounts in thousands):
Year Ended December 31, 2023 Compared to 2022 | ||||||||||||
Change in Prices | Production Volumes | Total Net Effect | ||||||||||
Effect of Change in Price: |
| |||||||||||
Oil sales (Bbls) | $ | (17.08 | ) | 571,769 | $ | (9,766 | ) | |||||
Natural gas sales (Mcf)(1) | $ | (3.92 | ) | 2,484,069 | (9,738 | ) | ||||||
|
| |||||||||||
Change in total revenues | $ | (19,504 | ) | |||||||||
|
|
(1) | Because our reserves and production are reported in two streams, the economic value of the NGLs is included in our natural gas pricing and sales. |
120
Table of Contents
The following table provides the dollar effect of changes in production volumes on Peak E&P’s oil and natural gas revenues for the periods indicated (dollar amounts in thousands):
Year Ended December 31, 2023 Compared to 2022 | ||||||||||||
Change in Production Volumes | Prior Period Prices | Total Net Effect | ||||||||||
Effect of Change in Production: |
| |||||||||||
Oil sales (Bbls) | (138,525 | ) | $ | 93.25 | $ | (12,917 | ) | |||||
Natural gas sales (Mcf)(1) | (397,864 | ) | $ | 6.37 | (2,549 | ) | ||||||
|
| |||||||||||
Change in total revenues | $ | (15,466 | ) | |||||||||
|
|
(1) | Because our reserves and production are reported in two streams, the economic value of the NGLs is included in our pricing and natural gas production. |
Production decreased 204,835 Boe, or 17.2%, for the year ended December 31, 2023, as compared to the year ended December 31, 2022. This decrease in production was attributable to lower oil production, which decreased by 19.5%, and lower natural gas production, which decreased by 13.8%, both during the year ended December 31, 2023 as compared to the year ended December 31, 2022.
Operating Expenses
The following information provides the components of Peak E&P’s operating expenses, on both an absolute basis and per Boe basis, (dollar amounts in thousands):
Year Ended December 31, | 2023 Compared to 2022 | |||||||||||||||
2023 | 2022 | Change | % Change | |||||||||||||
Operating Expenses: | ||||||||||||||||
Lease operating | $ | 13,243 | $ | 13,436 | $ | (193 | ) | (1.4 | )% | |||||||
Production and ad valorem taxes | 6,943 | 10,182 | (3,239 | ) | (31.8 | )% | ||||||||||
Depletion, depreciation and amortization | 27,061 | 28,687 | (1,626 | ) | (5.7 | )% | ||||||||||
Accretion | 223 | 220 | 3 | 1.4 | % | |||||||||||
Abandonment | 2,882 | 1,092 | 1,790 | 163.9 | % | |||||||||||
Impairment of oil and natural gas properties | 111,871 | — | 111,871 | * | ||||||||||||
General and administrative | 6,566 | 6,049 | 517 | 8.5 | % | |||||||||||
|
|
|
|
|
|
|
| |||||||||
Total operating expenses | $ | 168,789 | $ | 59,666 | $ | 109,123 | 182.9 | % | ||||||||
|
|
|
|
|
|
|
| |||||||||
Operating Expenses ($/Boe): | ||||||||||||||||
Lease operating | $ | 13.43 | $ | 11.28 | $ | 2.15 | 19.1 | % | ||||||||
Production and ad valorem taxes | $ | 7.04 | $ | 8.55 | $ | (1.51 | ) | (17.7 | )% | |||||||
Depletion, depreciation and amortization | $ | 27.45 | $ | 24.09 | $ | 3.36 | 13.9 | % | ||||||||
Accretion | $ | 0.23 | $ | 0.18 | $ | 0.05 | 27.8 | % | ||||||||
Abandonment | $ | 2.92 | $ | 0.92 | $ | 2.00 | 217.4 | % | ||||||||
Impairment of oil and natural gas properties | $ | 113.48 | $ | — | $ | 113.48 | * | |||||||||
General and administrative | $ | 6.65 | $ | 5.08 | $ | 1.57 | 30.9 | % |
* | Percentage change not meaningful |
Lease Operating—Lease operating expenses decreased by 1.4%, to $13.2 million, for the year ended December 31, 2023, as compared to the year ended December 31, 2022. On a Boe basis, lease operating expenses
121
Table of Contents
increased by 19.1%, to $13.43 per Boe, as a result of lower production during the year ended December 31, 2023, as compared to the year ended December 31, 2022.
Production and Ad Valorem Taxes—Production and ad valorem taxes decreased by 31.8%, to $6.9 million, for the year ended December 31, 2023, as compared to the year ended December 31, 2022. On a Boe basis, production and ad valorem taxes decreased by 17.7%, to $7.04 per Boe, for the year ended December 31, 2023, as compared to the year ended December 31, 2022. Lower production and ad valorem taxes were the result of lower realized pricing, as Peak E&P’s realized pricing for oil, without realized derivatives, decreased by 18.3% and realized pricing for natural gas, without realized derivatives, decreased by 61.5% for the year ended December 31, 2023, as compared to the year ended December 31, 2022.
Depletion, Depreciation and Amortization—Depletion, depreciation and amortization expenses decreased by 5.7%, to $27.1 million, for the year ended December 31, 2023, as compared to the year ended December 31, 2022. On a Boe basis, depletion, depreciation and amortization expenses increased by 13.9%, to $27.45 per Boe, for the year ended December 31, 2023, as compared to the year ended December 31, 2022. Higher depletion, depreciation and amortization expenses on a Boe basis were the result of a decrease in proved oil and gas reserves for the 2023 year and offset partially by lower overall production for the year ended December 31, 2023, as compared to the year ended December 31, 2022. Additionally, declines in prices led to a reduction in PUD reserves as of December 31, 2023 due to reserves becoming uneconomical at lower prices and shorter lives.
Abandonment—Abandonment expenses increased by 163.9%, to $2.9 million, for the year ended December 31, 2023, as compared to the year ended December 31, 2022. Peak E&P performs a periodic review of unproved property costs to determine (i) whether any leases associated with the property have expired or been abandoned, (ii) whether the subject property will be developed, or (iii) if the carrying value of the property is not realizable. To conserve cash, certain leases associated with unproved property were allowed to expire, resulting in an increase in abandonment expense for the year ended December 31, 2023.
Impairment of Oil and Natural Gas Properties—For the year ended December 31, 2023, Peak E&P recorded an impairment of oil and natural gas properties of $111.9 million. This impairment was primarily due to a decrease in the value of proved oil and natural gas reserves as a result of lower oil and natural gas prices at December 31, 2023. For purposes of determining proved reserves, under guidelines established by the SEC, estimates of proved oil and natural gas reserves are prepared using existing economic and operating conditions and oil and natural gas prices based upon the 12-month unweighted average first day of the month spot prices. For the year ended December 31, 2023, oil and natural gas prices calculated in accordance with SEC guidelines decreased by 16.5% and 58.5%, respectively, as compared to the year ended December 31, 2022.
General and Administrative—General and administrative expenses increased by 8.5%, to $6.6 million, for the year ended December 31, 2023, as compared to the year ended December 31, 2022. Higher general and administrative expenses were primarily the result of market adjustments to compensation. On a Boe basis, general and administrative expenses increased by 30.9%, to $6.65 per Boe, for the year ended December 31, 2023, as compared to the year ended December 31, 2022. Higher general and administrative expenses per Boe were the result of a decrease in production as well as market adjustments to compensation for the year ended December 31, 2023, as compared to the year ended December 31, 2022.
122
Table of Contents
Other Income (Expense)
The following information provides the components of Peak E&P’s other income and expenses (in thousands):
Year Ended December 31, | 2023 Compared to 2022 | |||||||||||||||
2023 | 2022 | Change | % Change | |||||||||||||
Other Income (Expense): | ||||||||||||||||
Gain (loss) on commodity derivatives | $ | 1,604 | $ | (27,271 | ) | $ | 28,875 | 105.9 | % | |||||||
Interest expense, net | (8,867 | ) | (4,913 | ) | (3,954 | ) | (80.5 | )% | ||||||||
Loss from retirement of long-term debt | (1,080 | ) | — | (1,080 | ) | * | ||||||||||
Gain on sale of assets | 1,240 | 7 | 1,233 | * | ||||||||||||
Other gain (loss) | 1,619 | (887 | ) | 2,506 | * | |||||||||||
|
|
|
|
|
|
|
| |||||||||
Total other expense | $ | (5,484 | ) | $ | (33,064 | ) | $ | 27,580 | 83.4 | % | ||||||
|
|
|
|
|
|
|
|
* | Percentage change not meaningful |
Gain (Loss) on Commodity Derivatives—Gain (loss) on commodity derivatives increased to a gain of $1.6 million for the year ended December 31, 2023, from a loss of $27.3 million for the year ended December 31, 2022.
The following table provides the components of Peak E&P’s gain (loss) on commodity derivatives for the years ended December 31, 2023 and 2022:
Year Ended December 31, | 2023 Compared to 2022 | |||||||||||||||
2023 | 2022 | Change | % Change | |||||||||||||
Cash paid on derivatives | $ | (3,662 | ) | $ | (31,174 | ) | $ | 27,512 | 88.3 | % | ||||||
Non-cash gain on derivatives | 5,266 | 3,903 | 1,363 | 34.9 | % | |||||||||||
|
|
|
|
|
|
|
| |||||||||
Gain (loss) on commodity derivatives | $ | 1,604 | $ | (27,271 | ) | $ | 28,875 | 105.9 | % | |||||||
|
|
|
|
|
|
|
|
The $27.5 million favorable change in cash paid on derivatives was largely driven by lower oil and natural gas prices for the year ended December 31, 2023, as compared to the year ended December 31, 2022.
Interest Expense, Net—Interest expense, net, increased by 80.5%, to $8.9 million, for the year ended December 31, 2023, as compared to the year ended December 31, 2022. The increase in interest expense for the 2023 year was due to a $6.9 million increase in borrowings under the Existing Credit Agreement, along with a higher interest rate associated with the Existing Credit Agreement (as compared to the prior credit facilities), which was a weighted average of 13.07% for the year ended December 31, 2023, as compared to a weighted average of 7.82% for the year ended December 31, 2022.
Loss From Retirement of Long-Term Debt—Loss from retirement of long-term debt was $1.1 million for the year ended December 31, 2023. During the year ended December 31, 2023, Peak E&P entered into the Existing Credit Agreement and used the proceeds to fully repay the Prior Credit Facility and the NPA (each as defined below). As a result of the full repayment of the Prior Credit Facility and NPA, all unamortized debt issuance costs associated with those two facilities were written off, resulting in a loss from the early retirement of those two facilities.
123
Table of Contents
Six Months Ended June 30, 2024 Compared to the Six Months Ended June 30, 2023
Revenues
The following information provides the components of PBLM’s revenues, as well as average realized prices and net production volumes (dollar amounts in thousands):
Six Months Ended June 30, | 2024 Compared to 2023 | |||||||||||||||
2024 | 2023 | Change | % Change | |||||||||||||
Revenues: |
| |||||||||||||||
Oil sales | $ | 1,410 | $ | 2,325 | $ | (915 | ) | (39.3 | )% | |||||||
Natural gas sales(1) | 142 | 370 | (228 | ) | (61.6 | )% | ||||||||||
|
|
|
|
|
|
|
| |||||||||
Total revenues, net | $ | 1,552 | $ | 2,695 | $ | (1,143 | ) | (42.4 | )% | |||||||
|
|
|
|
|
|
|
| |||||||||
Average Sales Price: | ||||||||||||||||
Oil ($/Bbl) | $ | 75.36 | $ | 72.13 | $ | 3.23 | 4.5 | % | ||||||||
Natural gas ($/Mcf) | $ | 1.87 | $ | 2.64 | $ | (0.77 | ) | (29.3 | )% | |||||||
Total ($/Boe) | $ | 49.45 | $ | 48.47 | $ | 0.98 | 2.0 | % | ||||||||
Net Production Volumes: | ||||||||||||||||
Oil (Bbls) | 18,709 | 32,233 | (13,524 | ) | (42.0 | )% | ||||||||||
Natural gas (Mcf) | 76,067 | 140,211 | (64,144 | ) | (45.7 | )% | ||||||||||
Total (Boe) | 31,387 | 55,302 | (23,915 | ) | (43.6 | )% | ||||||||||
Average daily production (Boe/d) | 172 | 307 | (135 | ) | (43.9 | )% |
(1) | Because our reserves and production are reported in two streams, the economic value of the NGLs is included in our natural gas pricing and production. |
PBLM’s results of operations are heavily influenced by commodity prices, which have historically been volatile. As PBLM’s production consists primarily of oil, its revenues are more sensitive to fluctuations in oil prices, as compared to fluctuations in natural gas prices. An extended decline in commodity prices may adversely affect PBLM’s business, financial condition or results of operations and its ability to meet capital expenditure obligations and financial commitments.
The following table provides the dollar effect of changes in commodity prices on PBLM’s oil and natural gas revenues for the periods indicated (dollar amounts in thousands):
Six Months Ended June 30, 2024 Compared to 2023 | ||||||||||||
Change in Price | Production Volumes | Total Net Effect | ||||||||||
Effect of Change in Price: |
| |||||||||||
Oil sales (Bbls) | $ | 3.23 | 18,709 | $ | 61 | |||||||
Natural gas sales (Mcf)(1) | $ | (0.77 | ) | 76,067 | (59 | ) | ||||||
|
| |||||||||||
Change in total revenues | $ | 2 | ||||||||||
|
|
(1) | Because our reserves and production are reported in two streams, the economic value of the NGLs is included in our natural gas pricing and production. |
124
Table of Contents
The following table provides the dollar effect of changes in production volumes on PBLM’s oil and natural gas revenues for the periods indicated (dollar amounts in thousands):
Six Months Ended June 30, 2024 Compared to 2023 | ||||||||||||
Change in Production | Prior Period Prices | Total Net Effect | ||||||||||
Effect of Change in Production: |
| |||||||||||
Oil sales (Bbls) | (13,524 | ) | $ | 72.13 | $ | (976 | ) | |||||
Natural gas sales (Mcf)(1) | (64,144 | ) | $ | 2.64 | (169 | ) | ||||||
|
| |||||||||||
Change in total revenues | $ | (1,145 | ) | |||||||||
|
|
(1) | Because our reserves and production are reported in two streams, the economic value of the NGLs is included in our natural gas pricing and production. |
Production decreased 24,215 Boe, or 43.6%, for the six months ended June 30, 2024, as compared to the six months ended June 30, 2023. This decrease in production was due to higher initial production declines from the four wells that began producing in January 2023.
Operating Expenses
The following information provides the components of PBLM’s operating expenses, on both an absolute basis and per Boe basis, (dollar amounts in thousands):
Six Months Ended June 30, | 2024 Compared to 2023 | |||||||||||||||
2024 | 2023 | Change | % Change | |||||||||||||
Operating Expenses: | ||||||||||||||||
Lease operating | $ | 347 | $ | 333 | $ | 14 | 4.2 | % | ||||||||
Production and ad valorem taxes | 209 | 365 | (156 | ) | (42.7 | )% | ||||||||||
Depletion, depreciation and amortization | 608 | 1,136 | (528 | ) | (46.5 | )% | ||||||||||
Accretion | 2 | 2 | — | — | ||||||||||||
Abandonment | 52 | 33 | 19 | 57.6 | % | |||||||||||
General and administrative | 880 | 634 | 246 | 38.8 | % | |||||||||||
|
|
|
|
|
|
|
| |||||||||
Total operating expenses | $ | 2,098 | $ | 2,503 |