| FREE WRITING PROSPECTUS | ||
| FILED PURSUANT TO RULE 433 | ||
| REGISTRATION FILE NO.: 333-260277-06 | ||
June 24, 2024
BENCHMARK 2024-V8
Mortgage Trust
Free Writing Prospectus
Collateral Term Sheet
$1,009,985,421
(Approximate Total Mortgage Pool Balance)
$895,099,000
(Approximate Offered Certificates)
Deutsche Mortgage & Asset Receiving Corporation Depositor |
Commercial Mortgage Pass-Through Certificates
Series 2024-V8
German American Capital Corporation Citi Real Estate Funding Inc. Goldman Sachs Mortgage Company Bank of Montreal Barclays Capital Real Estate Inc. |
As Sponsors and Mortgage Loan Sellers
| Deutsche Bank Securities | Goldman Sachs & Co. LLC | BMO Capital Markets | Barclays | Citigroup |
Co-Lead Managers and Joint Bookrunners
| AmeriVet Securities | Drexel Hamilton |
Co-Managers
The depositor has filed a registration statement (including the prospectus) with the Securities and Exchange Commission (File No. 333-260277) for the offering to which this communication relates. Before you invest, you should read the prospectus in the registration statement and other documents the depositor has filed with the Securities and Exchange Commission for more complete information about the depositor, the issuing entity and this offering. You may get these documents for free by visiting EDGAR on the Securities and Exchange Commission website at www.sec.gov. Alternatively, the depositor or Deutsche Bank Securities Inc., any other underwriter, or any dealer participating in this offering will arrange to send you the prospectus if you request it by calling toll-free 1-800-503-4611 or by emailing: prospectus.cpdg@db.com. The offered certificates referred to in these materials, and the asset pool backing them, are subject to modification or revision (including the possibility that one or more classes of certificates may be split, combined or eliminated at any time prior to issuance or availability of a final prospectus) and are offered on a “when, as and if issued” basis. You understand that, when you are considering the purchase of these certificates, a contract of sale will come into being no sooner than the date on which the relevant class has been priced and we have verified the allocation of certificates to be made to you; any “indications of interest” expressed by you, and any “soft circles” generated by us, will not create binding contractual obligations for you or us. This free writing prospectus does not contain all information that is required to be included in the prospectus.
| THE INFORMATION IN THIS STRUCTURAL AND COLLATERAL TERM SHEET IS NOT COMPLETE AND MAY BE AMENDED PRIOR TO THE TIME OF SALE. THIS TERM SHEET IS NOT AN OFFER TO SELL THESE SECURITIES AND IT IS NOT A SOLICITATION OF AN OFFER TO BUY THESE SECURITIES IN ANY JURISDICTION WHERE THE OFFER OR SALE IS NOT PERMITTED. | ||
| 1 | ||
Benchmark 2024-V8 Mortgage Trust |
| KEY FEATURES OF SECURITIZATION |
| Capitalized terms used but not defined herein have the meanings assigned to them in the Preliminary Prospectus expected to be dated June 24, 2024 relating to the offered certificates (hereinafter referred to as the “Preliminary Prospectus”). |
| Offering Terms: | |
| Co-Lead Managers and Joint Bookrunners: | Deutsche Bank Securities Inc., Citigroup Global Markets Inc., Goldman Sachs & Co. LLC, BMO Capital Markets Corp. and Barclays Capital Inc. |
| Co-Managers: | AmeriVet Securities, Inc., and Drexel Hamilton, LLC |
| Sponsors and Mortgage Loan Sellers: | German American Capital Corporation* (“GACC”) (18.7%), Citi Real Estate Funding Inc. (“CREFI”) (54.6%), Goldman Sachs Mortgage Company (“GSMC”), (16.1%), Bank of Montreal (“BMO”) (7.1%) and Barclays Capital Real Estate Inc. (“BCREI”) (3.4%) *An indirect wholly owned subsidiary of Deutsche Bank AG |
| Master Servicer: | Wells Fargo Bank, National Association |
| Operating Advisor: | Park Bridge Lender Services LLC |
| Asset Representations Reviewer: | Park Bridge Lender Services LLC |
| Special Servicer: | LNR Partners, LLC |
| Certificate Administrator: | Computershare Trust Company, National Association |
| Trustee: | Computershare Trust Company, National Association |
| Rating Agencies: | S&P Global Ratings (“S&P”), Fitch Ratings, Inc. (“Fitch”) and Kroll Bond Rating Agency, LLC (“KBRA”). |
| Credit Risk Retention: | For a discussion on the manner in which the U.S. credit risk retention requirements are being satisfied by GACC, as retaining sponsor, see “Credit Risk Retention” in the Preliminary Prospectus. Note that this securitization transaction is not being structured to satisfy EU/UK risk retention and due diligence requirements. |
| Determination Date: | 11th day of each month, or if such 11th day is not a business day, the immediately following business day, commencing in August 2024. |
| Distribution Date: | 4th business day following the Determination Date in each month, commencing in August 2024. |
| Cut-off Date: | With respect to each mortgage loan, the later of the related payment date of such mortgage loan in July 2024 (or, in the case of any mortgage loan that has its first due date subsequent to July 2024, the date that would have been its due date in July 2024 under the terms of that mortgage loan if a monthly payment were scheduled to be due in that month) and the date of origination of such mortgage loan. Unless otherwise noted, all mortgage loan statistics are based on balances as of the Cut-off Date. |
| Closing Date: | On or about July 18, 2024 |
| Settlement Terms: | DTC, Euroclear and Clearstream, same day funds, with accrued interest. |
| ERISA Eligible: | All of the Offered Certificates are expected to be ERISA eligible. |
| SMMEA Eligible: | None of the Offered Certificates will be SMMEA eligible. |
| Day Count: | 30/360 |
| Tax Treatment: | REMIC |
| Rated Final Distribution Date: | July 2057 |
| Minimum Denominations: | $10,000 (for each class of offered principal balance certificates) and $100,000 (for each class of offered interest-only certificates) and in each case in multiples of $1 thereafter. |
| Clean-up Call: | 1% (with certain exceptions described under “Pooling and Servicing Agreement—Termination; Retirement of Certificates” in the Preliminary Prospectus) |
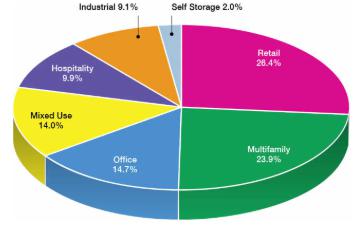
| Distribution of Collateral by Property Type |
| THE INFORMATION IN THIS STRUCTURAL AND COLLATERAL TERM SHEET IS NOT COMPLETE AND MAY BE AMENDED PRIOR TO THE TIME OF SALE. THIS TERM SHEET IS NOT AN OFFER TO SELL THESE SECURITIES AND IT IS NOT A SOLICITATION OF AN OFFER TO BUY THESE SECURITIES IN ANY JURISDICTION WHERE THE OFFER OR SALE IS NOT PERMITTED. | ||
| 2 | ||
Benchmark 2024-V8 Mortgage Trust |
| OVERVIEW OF MORTGAGE POOL CHARACTERISTICS |
| Mortgage Loan Sellers | Number of Mortgage Loans | Number of Mortgaged Properties | Aggregate Cut-off Date Balance | % of Initial Outstanding Pool Balance | Roll-up Aggregate Cut-off Date Balance | Roll-up Aggregate % of Initial Outstanding Pool Balance | ||
| German American Capital Corporation | 7 | 17 | $149,700,000 | 14.8% | $189,174,253 | 18.7% | ||
| Citi Real Estate Funding Inc. | 19 | 36 | $551,935,000 | 54.6% | $551,935,000 | 54.6% | ||
| Goldman Sachs Mortgage Company | 3 | 3 | $93,360,000 | 9.2% | $162,960,000 | 16.1% | ||
| Bank of Montreal | 3 | 22 | $44,000,000 | 4.4% | $71,500,000 | 7.1% | ||
| Barclays Capital Real Estate Inc. | 1 | 1 | $8,100,000 | 0.8% | $34,416,168 | 3.4% | ||
| Goldman Sachs Mortgage Company / Bank of Montreal(1) | 1 | 1 | $97,100,000 | 9.6% | ||||
| German American Capital Corporation / Barclays Capital Real Estate Inc.(2) | 1 | 1 | $65,790,421 | 6.5% | ||||
| Total: | 35 | 81 | $1,009,985,421 | 100.0% | ||||
Collateral Facts | ||||||||
| Initial Outstanding Pool Balance: | $1,009,985,421 | |||||||
| Number of Mortgage Loans: | 35 | |||||||
| Number of Mortgaged Properties: | 81 | |||||||
| Average Mortgage Loan Cut-off Date Balance: | $28,856,726 | |||||||
| Weighted Average Mortgage Rate: | 6.96578% | |||||||
| Weighted Average Mortgage Loan Original Term to Maturity Date (months): | 60 | |||||||
| Weighted Average Mortgage Loan Remaining Term to Maturity Date (months): | 59 | |||||||
| Weighted Average Mortgage Loan Seasoning (months): | 1 | |||||||
| % of Mortgaged Properties Leased to a Single Tenant: | 11.9% | |||||||
Credit Statistics(3) | ||||||||
| Weighted Average Mortgage Loan U/W NCF DSCR: | 1.69x | |||||||
| Weighted Average Mortgage Loan Cut-off Date LTV(4): | 52.7% | |||||||
| Weighted Average Mortgage Loan Maturity Date LTV(4): | 52.1% | |||||||
| Weighted Average U/W NOI Debt Yield: | 13.6% | |||||||
Amortization Overview | ||||||||
| % Mortgage Loans with Amortization through Maturity Date: | 16.1% | |||||||
| % Mortgage Loans which pay Interest Only through Maturity Date: | 83.9% | |||||||
| % Mortgage Loans which pay Interest Only followed by Amortization through Maturity Date: | 0.0% | |||||||
| Weighted Average Remaining Amortization Term (months)(5): | 238 | |||||||
Loan Structural Features | ||||||||
| % Mortgage Loans with Upfront or Ongoing Tax Reserves: | 72.9% | |||||||
| % Mortgage Loans with Upfront or Ongoing Insurance Reserves: | 36.1% | |||||||
| % Mortgage Loans with Upfront or Ongoing Replacement Reserves(6): | 82.1% | |||||||
| % Mortgage Loans with Upfront or Ongoing TI/LC Reserves(7): | 82.1% | |||||||
| % Mortgage Loans with In Place Hard Lockboxes: | 60.1% | |||||||
| % Mortgage Loans with Cash Traps Triggered at DSCR Levels ≥ 1.10x: | 73.1% | |||||||
| % Mortgage Loans with Cash Traps Triggered at Debt Yield Levels ≥ 9.00%: | 24.1% | |||||||
Prepayment Provisions(8) | ||||||||
| % Mortgage Loans with Defeasance Only After a Lockout Period and Prior to an Open Period: | 76.7% | |||||||
| % Mortgage Loans with Yield Maintenance Prior to an Open Period: | 10.4% | |||||||
| % Mortgage Loans with Prepayment Only After a Lockout Period and Prior to an Open Period with a Yield Maintenance Charge: | 10.0% | |||||||
| % Mortgage Loans with Prepayment or Defeasance Only After a Lockout Period and Prior to an Open Period with Defeasance or a Yield Maintenance Charge: | 2.9% | |||||||
| (1) | Includes a $97.1 million non-controlling pari passu portion of the 640 5th Avenue whole loan. GSMC is selling Note A-5 in the outstanding principal balance of $69,600,000 as of the Cut-off Date and BMO is selling Notes A-9 and A-10 in the aggregate outstanding principal balance of $27,500,000 as of the Cut-off Date. |
| (2) | Includes the Sugarloaf Mills mortgage loan, as to which GACC is acting as mortgage loan seller of approximately $39.5 million of such mortgage loan and BCREI is acting as mortgage loan seller of approximately $26.3 million of such mortgage loan as of the Cut-off date. |
| (3) | The LTV, DSCR and Debt Yield calculations include any related pari passu companion loan(s) and exclude any related subordinate companion loan(s) and/or mezzanine loan(s). |
| (4) | With respect to 4 mortgaged properties (9.5%) (488 Madison, Lotus 315, Courtyard Marriott, TownePlace Suites), the Cut-off Date LTV Ratio and Maturity Date or LTV Ratio have been calculated using a value other than the “As Is” appraised value. For additional information please see the footnotes to Annex A-1 in the Preliminary Prospectus. |
| (5) | Excludes mortgage loans which are interest only for the full loan term and the 640 5th Avenue Mortgage Loan which has a fixed amortization schedule. |
| (6) | Includes FF&E reserves. |
| (7) | Represents the percent of the allocated Initial Outstanding Pool Balance of retail, office, industrial and mixed use properties only. |
| (8) | Please see Annex A-1 of the Preliminary Prospectus for more information. |
| THE INFORMATION IN THIS STRUCTURAL AND COLLATERAL TERM SHEET IS NOT COMPLETE AND MAY BE AMENDED PRIOR TO THE TIME OF SALE. THIS TERM SHEET IS NOT AN OFFER TO SELL THESE SECURITIES AND IT IS NOT A SOLICITATION OF AN OFFER TO BUY THESE SECURITIES IN ANY JURISDICTION WHERE THE OFFER OR SALE IS NOT PERMITTED. | ||
| 3 | ||
Benchmark 2024-V8 Mortgage Trust |
| STRUCTURE SUMMARY |
OFFERED CERTIFICATES
| Class(1) | Ratings (S&P/Fitch/KBRA) | Initial Certificate Balance(2) | Initial Subordination | Weighted Average Life (years)(4) | Principal Window (months)(4) | Certificate Principal to Value Ratio(5) | Certificate Underwritten NOI Debt Yield(6) |
| Class A-1 | AAA(sf) / AAAsf / AAA(sf) | $15,468,000 | 30.000%(7) | 2.48 | 1 – 57 | 36.9% | 19.4% |
| Class A-2 | AAA(sf) / AAAsf / AAA(sf) | (8) | 30.000%(7) | (8) | (8) | 36.9% | 19.4% |
| Class A-3 | AAA(sf) / AAAsf / AAA(sf) | (8) | 30.000%(7) | (8) | (8) | 36.9% | 19.4% |
| Class A-M | NR / AAAsf / AAA(sf) | $97,211,000 | 20.375% | 4.98 | 59 – 60 | 42.0% | 17.1% |
| Class B | NR / AA-sf / AA(sf) | $53,025,000 | 15.125% | 4.99 | 60 – 60 | 44.7% | 16.0% |
| Class C | NR / A-sf / A(sf) | $37,874,000 | 11.375% | 4.99 | 60 – 60 | 46.7% | 15.3% |
NON-OFFERED CERTIFICATES
| Class(1) | Ratings (S&P/Fitch/KBRA) | Initial Certificate Balance or Notional Amount (2) | Initial Subordination | Weighted Average Life (years)(4) | Principal Window (months)(4) | Certificate Principal to Value Ratio(5) | Certificate Underwritten NOI Debt Yield(6) | |
| Class X-A(9) | NR / AAAsf / AAA(sf) | $804,200,000 | (10) | N/A | N/A | N/A | N/A | N/A |
| Class X-B(9) | NR / A-sf / AAA(sf) | $90,899,000 | (10) | N/A | N/A | N/A | N/A | N/A |
| Class X-D(9)(11) | NR / BBBsf / BBB+(sf) | $22,725,000 | (10) | N/A | N/A | N/A | N/A | N/A |
| Class D(11) | NR /BBBsf / BBB+(sf) | $22,725,000 | 9.125% | 4.99 | 60 – 60 | 47.9% | 15.0% | |
| Class X-RR(9)(11) | NR / NR / NR | $92,161,421 | (10) | N/A | N/A | N/A | N/A | N/A |
| Class E-RR(11) | NR / BBB-sf / BBB+(sf) | $11,362,000 | 8.000% | 4.99 | 60 – 60 | 48.5% | 14.8% | |
| Class F-RR | NR / BB-sf / BB+(sf) | $21,462,000 | 5.875% | 4.99 | 60 – 60 | 49.6% | 14.4% | |
| Class G-RR | NR / B-sf / BB-(sf) | $15,150,000 | 4.375% | 4.99 | 60 – 60 | 50.4% | 14.2% | |
| Class J-RR | NR / NR / NR | $44,187,421 | 0.000% | 4.99 | 60 – 60 | 52.7% | 13.6% | |
| (1) | The pass-through rates for the Class A-1, Class A-2, Class A-3, Class A-M, Class B, Class C, Class D, Class E-RR, Class F-RR, Class G-RR and Class J-RR certificates (collectively, the “Principal Balance Certificates”) in each case, will be one of: (i) a fixed per annum rate, (ii) the weighted average of the net mortgage rates on the mortgage loans (in each case, adjusted, if necessary, to accrue on the basis of a 360-day year consisting of twelve 30-day months) as of their respective due dates in the month preceding the month in which such Distribution Date occurs (the “WAC Rate”), (iii) a rate equal to the lesser of a specified pass-through rate and the WAC Rate or (iv) the WAC Rate less a specified rate, but in any case not less than 0.000%. |
| (2) | Approximate; subject to a variance of plus or minus 5%. |
| (3) | The initial subordination levels are calculated based on the initial Certificate Balance. See “Credit Risk Retention” and “Description of the Certificates” in the Preliminary Prospectus. |
| (4) | The weighted average life and principal window during which distributions of principal would be received as set forth in the table with respect to each class of Principal Balance Certificates are based on (i) modeling assumptions described in the Preliminary Prospectus and (ii) assumptions that there are no prepayments, modifications or losses in respect of the mortgage loans and there are no extensions or forbearances of maturity dates of the mortgage loans. The weighted average life and principal window of the Class A-2 and Class A-3 certificates are subject to change as described in footnote (8) below. |
| (5) | “Certificate Principal to Value Ratio” for any class of Principal Balance Certificates is calculated as the product of (a) the weighted average mortgage loan Cut-off Date LTV of the mortgage loans, multiplied by (b) a fraction, the numerator of which is the total initial Certificate Balance of the related class of Principal Balance Certificates and all other classes of Principal Balance Certificates, if any, that are senior to such class, and the denominator of which is the total initial Certificate Balance of all classes of Principal Balance Certificates. The Certificate Principal to Value Ratios of the Class A-1, Class A-2 and Class A-3 certificates are calculated in the aggregate for those classes as if they were a single class. |
| (6) | “Certificate Underwritten NOI Debt Yield” for any class of Principal Balance Certificates is calculated as the product of (a) the weighted average Underwritten NOI Debt Yield for the mortgage loans, multiplied by (b) a fraction, the numerator of which is the total initial Certificate Balance of all classes of Principal Balance Certificates and the denominator of which is the total initial Certificate Balance of such class of Principal Balance Certificates and all other classes of Principal Balance Certificates, if any, that are senior to such class. The Certificate Underwritten NOI Debt Yields of the Class A-1, Class A-2 and Class A-3 certificates are calculated in the aggregate for those classes as if they were a single class. |
| (7) | The initial subordination levels for the Class A-1, Class A-2 and Class A-3 certificates are represented in the aggregate. |
| (8) | The exact initial Certificate Balances of the Class A-2 and Class A-3 certificates are unknown and will be determined based on the final pricing of those classes of certificates. However, the respective initial Certificate Balances, weighted average lives and principal windows of the Class A-2 and Class A-3 certificates are expected to be within the applicable ranges reflected in the following chart. The aggregate initial Certificate Balance of the Class A-2 and Class A-3 certificates is expected to be approximately $691,521,000, subject to a variance of plus or minus 5.0%. |
| Class of Certificates | Expected Range of Initial Certificate Balance | Expected Range of Weighted Avg. Life (years)(4) | Expected Range of Principal Window (months)(4) |
| Class A-2 | $0 – $300,000,000 | NAP – 4.84 | NAP / 57 – 59 |
| Class A-3 | $391,521,000 – $691,521,000 | 4.91 – 4.88 | 59 – 59 / 57 – 59 |
| (9) | As further described in the Preliminary Prospectus, the pass-through rate applicable to the Class X-A , Class X-B, Class X-D and Class X-RR certificates (collectively, the “Class X Certificates”) for each Distribution Date will generally be equal to the excess of (i) the WAC Rate over (ii) (A) with respect to the Class X-A certificates, the weighted average of the pass-through rates of the Class A-1, Class A-2, Class A-3 and Class A-M certificates (based on their respective Certificate Balances outstanding immediately prior to such Distribution Date), (B) with respect to the Class X-B certificates, the weighted average of the pass-through rates of the Class B and Class C certificates (based on their respective Certificate Balances outstanding immediately prior to such Distribution Date), (C) with respect to the Class X-D certificates, the pass-through rate of the Class D certificates, and (D) with respect to the Class X-RR certificates, the weighted average of the pass-through rates of the Class E-RR, Class F-RR, Class G-RR and Class J-RR certificates (based on their respective Certificate Balances outstanding immediately prior to such Distribution Date). |
| (10) | The Class X Certificates will not have Certificate Balances. None of the Class X Certificates will be entitled to distributions of principal. The interest accrual amounts on the Class X-A certificates will be calculated by reference to a notional amount equal to the aggregate Certificate Balances of the Class A-1, Class A-2, Class A-3 and Class A-M certificates. The interest accrual amounts on the Class X-B certificates will be calculated by reference to a notional amount equal to the aggregate Certificate Balances of the Class B and Class C certificates. The interest accrual amounts on the Class X-D certificates will be calculated by reference to a notional amount equal to the Certificate Balances of the Class D. The interest accrual amounts on the Class X-RR certificates will be calculated by reference to a notional amount equal to the aggregate Certificate Balances of the Class E-RR, Class F-RR, Class G-RR and Class J-RR certificates. The notional amount of each class of Class X Certificates is subject to change depending upon the final pricing of the Principal Balance Certificates, as follows: (1) if as a result of such pricing the pass-through rate of any class of Principal Balance Certificates whose Certificate Balance comprises such notional amount is equal to the WAC Rate, the Certificate Balance of such class of Principal Balance Certificates may not be part of, and will reduce accordingly, such notional amount of such class of Class X Certificates (or, if as a result of such pricing the pass-through rate of such class of Class X Certificates is equal to zero, such class of Class X Certificates may not be issued on the Closing Date), and/or (2) if as a result of such pricing the pass-through rate of any class of Principal Balance Certificates that does not comprise such notional amount of such class of Class X Certificates is less than the WAC Rate, such class of Principal Balance Certificates may become a part of, and increase accordingly, such notional amount of such class of Class X Certificates. |
| (11) | The initial Certificate Balance of each of the Class D and Class E-RR certificates, and the notional amount of the Class X-D and Class X-RR certificates, is subject to change based on final pricing of all Certificates, the final determination of the Class X-RR, Class E-RR, Class F-RR, Class G-RR and Class J-RR certificates (collectively, the “HRR Certificates”) that will be retained by Eightfold Real Estate Capital Fund VI, L.P., as the retaining third-party purchaser, in satisfaction of the retention obligations of German American Capital Corporation, in its capacity as retaining sponsor, to satisfy the U.S. risk retention requirements. For more information regarding the methodology and key inputs and assumptions used to determine the sizing of the HRR Certificates, see “Credit Risk Retention” in the Preliminary Prospectus. |
| THE INFORMATION IN THIS STRUCTURAL AND COLLATERAL TERM SHEET IS NOT COMPLETE AND MAY BE AMENDED PRIOR TO THE TIME OF SALE. THIS TERM SHEET IS NOT AN OFFER TO SELL THESE SECURITIES AND IT IS NOT A SOLICITATION OF AN OFFER TO BUY THESE SECURITIES IN ANY JURISDICTION WHERE THE OFFER OR SALE IS NOT PERMITTED. | ||
| 4 | ||
Benchmark 2024-V8 Mortgage Trust |
| OVERVIEW OF MORTGAGE POOL CHARACTERISTICS |
| Ten Largest Mortgage Loans | ||||||||||
| Mortgage Loan | Mortgage Loan Seller | City, State | Property Type | Mortgage Loan Cut-off Date | % of Initial Outstanding Pool Balance | Cut-off Date Room(1) | Cut-off Date LTV(1) | U/W NCF DSCR after IO(1) | U/W NOI Debt Yield(1) | |
| 640 5th Avenue | GSMC, BMO | New York, NY | Mixed Use | $97,100,000 | 9.6% | $954 | 41.7% | 2.04x | 18.7% | |
| City Creek Center | GSMC | Salt Lake City, UT | Retail | 70,000,000 | 6.9% | $215 | 51.7% | 1.79x | 14.3% | |
| Showcase I | CREFI | Las Vegas, NV | Retail | 69,500,000 | 6.9% | $937 | 67.8% | 1.30x | 8.5% | |
| Sugarloaf Mills | GACC, Barclays | Lawrenceville, GA | Retail | 65,790,421 | 6.5% | $56 | 30.6% | 2.73x | 30.2% | |
| Hilton Garden Inn & Canopy – Chicago Central Loop | CREFI | Chicago, IL | Hospitality | 65,000,000 | 6.4% | $185,714 | 40.5% | 1.68x | 14.6% | |
| Bedrock Mixed-Use Portfolio | GACC | Detroit, MI | Various | 55,000,000 | 5.4% | $88 | 54.3% | 1.58x | 11.3% | |
| University Pointe | CREFI | Davie, FL | Multifamily | 50,000,000 | 5.0% | $97,891 | 54.5% | 1.73x | 11.9% | |
| Soldier Hill Commons | CREFI | Paramus, NJ | Multifamily | 46,500,000 | 4.6% | $332,143 | 62.7% | 1.24x | 8.6% | |
| The Light Building | CREFI | San Antonio, TX | Office | 43,500,000 | 4.3% | $295 | 56.1% | 1.83x | 13.6% | |
| 488 Madison | GACC | New York, NY | Office | 40,000,000 | 4.0% | $208 | 45.5% | 1.94x | 15.6% | |
| Total/Weighted Average | $602,390,421 | 59.6% | 49.7% | 1.81x | 15.2% | |||||
| (1) | The Cut-off Date Balance per NRA/Unit/Room, Cut-off Date LTV, U/W NCF DSCR after IO and U/W NOI Debt Yield calculations include any related pari passu companion loan(s) and exclude any related subordinate companion loan(s) and/or mezzanine loan(s). |
| Subordinate Debt Summary | ||||||||||
| Mortgage Loan | Mortgage Loan Cut-off Date Balance |
Pari Passu Companion Loans Cut-off Date Balance | Subordinate Debt Cut-off Date Balance | Mezzanine Debt Cut-off Date Balance | Trust U/W NCF DSCR(1)(3) | Total Debt U/W NCF DSCR(2)(3) | Trust Cut-off Date LTV(1) | Total Debt Cut-off Date LTV(2) | Trust U/W NOI Debt Yield(1) | Total Debt U/W NOI Debt Yield(2) |
| 640 5th Avenue | $97,100,000 | $202,900,000 | N/A | $100,000,000 | 2.04x | 1.31x | 41.7% | 55.6% | 18.7% | 14.0% |
| (1) | Trust U/W NCF DSCR, Trust Cut-off Date LTV and Trust U/W NOI Debt Yield calculations include any related pari passu companion loan(s) and exclude any related subordinate companion loan(s) and/or mezzanine loan(s). |
| (2) | Total Debt U/W NCF DSCR, Total Debt Cut-off Date LTV and Total Debt U/W NOI Debt Yield calculations include any related pari passu companion loan(s), related subordinate companion loan(s) and/or related mezzanine loan(s). |
| (3) | The DSCR shown above is based on the fixed amortization schedule for the 640 5th avenue whole loan and mezzanine loan, respectively. |
| THE INFORMATION IN THIS STRUCTURAL AND COLLATERAL TERM SHEET IS NOT COMPLETE AND MAY BE AMENDED PRIOR TO THE TIME OF SALE. THIS TERM SHEET IS NOT AN OFFER TO SELL THESE SECURITIES AND IT IS NOT A SOLICITATION OF AN OFFER TO BUY THESE SECURITIES IN ANY JURISDICTION WHERE THE OFFER OR SALE IS NOT PERMITTED. | ||
| 5 | ||
Benchmark 2024-V8 Mortgage Trust |
| OVERVIEW OF MORTGAGE POOL CHARACTERISTICS |
| Companion Loan Summary |
| Loan No. | Mortgage Loan | Note(s) | Cut-off Date Balance | Holder of Note(1) | Lead Servicer for Whole Loan (Y/N) | Master Servicer Under Lead Securitization | Special Servicer Under Lead Securitization |
| 1 | 640 5th Avenue
| A-1 | $40,000,000 | MSBNA | Yes | ||
| A-2 | $37,500,000 | MSBNA | No | ||||
| A-3 | $30,000,000 | MSBNA | No | ||||
| A-4 | $20,000,000 | MSBNA | No | ||||
| A-5 | $69,600,000 | Benchmark 2024-V8 | No | ||||
| A-6 | $40,000,000 | GSBI | No | ||||
| A-7 | $10,400,000 | GSBI | No | ||||
| A-8 | $25,000,000 | BBCMS 2024-5C27(2) | No | Wells Fargo(2) | LNR(2) | ||
| A-9 | $17,500,000 | Benchmark 2024-V8 | No | ||||
| A-10 | $10,000,000 | Benchmark 2024-V8 | No | ||||
| 3 | Showcase I(3) | A-1 | $70,000,000 | JPMCB | Yes | ||
| A-2 | $20,000,000 | JPMCB | No | ||||
| A-3 | $10,000,000 | JPMCB | No | ||||
| A-4 | $40,000,000 | Benchmark 2024-V8 | No | ||||
| A-5 | $29,500,000 | Benchmark 2024-V8 | No | ||||
| 6 | Bedrock Mixed-Use Portfolio | A-1 | $55,000,000 | Benchmark 2024-V8 | Yes | Wells Fargo | LNR |
| A-2 | $20,000,000 | BBCMS 2024-5C27 | No | ||||
| 7 | University Pointe | A-1 | $50,000,000 | Benchmark 2024-V8 | Yes | Wells Fargo | LNR |
| A-2 | $35,850,000 | BBCMS 2024-5C27 | No | ||||
| 10 | 488 Madison | A-1 | $60,000,000 | BANK5 2024-5YR7 | Yes | Wells Fargo | KeyBank |
| A-2 | $40,000,000 | Benchmark 2024-V8 | No | ||||
| 11 | Pleasanton Corporate Commons | A-1 | $25,000,000 | Benchmark 2024-V8 | Yes | Wells Fargo | LNR |
| A-2 | $12,100,000 | Benchmark 2024-V8 | No | ||||
| A-3 | $20,000,000 | BANK5 2024-5YR7 | No | ||||
| A-4 | $8,700,000 | BANK5 2024-5YR7 | No | ||||
| 12 | Lotus 315 & Essence 144(3) | A-1 | $50,000,000 | CREFI | Yes | ||
| A-2 | $36,100,000 | Benchmark 2024-V8 | No | ||||
| 15 | Saks Beverly Hills | A-1 | $61,365,000 | BANK5 2024-5YR7 | Yes | Wells Fargo | KeyBank |
| A-2 | $28,635,000 | Benchmark 2024-V8 | No | ||||
| 19 | Prime Storage – Blue Portfolio | A-1 | $38,000,000 | Benchmark 2024-V7 | Yes | Midland | KKR |
| A-2 | $20,000,000 | Benchmark 2024-V8 | No | ||||
| 22 | Sunroad Centrum | A-1 | $70,000,000 | Benchmark 2024-V7 | Yes | Midland | KKR |
| A-2 | $12,460,000 | Benchmark 2024-V8 | No | ||||
| 26 | GNL Industrial Portfolio | A-1 | $70,000,000 | BMO 2024-5C4 | Yes | Midland | Argentic |
| A-2 | $15,000,000 | BBCMS 2024-5C27 | No | ||||
| A-3 | $11,000,000 | Benchmark 2024-V7 | No | ||||
| A-4 | $8,000,000 | Benchmark 2024-V8 | No | ||||
| A-5 | $2,650,000 | Benchmark 2024-V8 | No | ||||
| A-6 | $16,500,000 | Benchmark 2024-V7 | No | ||||
| A-7 | $12,500,000 | Benchmark 2024-V7 | No | ||||
| A-8 | $8,000,000 | BBCMS 2024-5C27 | No | ||||
| A-9 | $6,400,000 | BBCMS 2024-5C27 | No | ||||
| A-10 | $4,000,000 | BBCMS 2024-5C27 | No | ||||
| A-11 | $15,000,000 | BBCMS 2024-5C27 | No | ||||
| A-12 | $10,550,000 | SGFC | No | ||||
| A-13 | $10,000,000 | SGFC | No | ||||
| A-14 | $20,000,000 | BBCMS 2024-5C27 | No | ||||
| A-15 | $12,000,000 | KeyBank | No | ||||
| A-16 | $10,000,000 | BBCMS 2024-5C27 | No | ||||
| A-17 | $5,400,000 | KeyBank | No |
| (1) | The identification of a securitization trust means we have identified another securitization trust that has closed or as to which a preliminary prospectus (or preliminary offering circular) or final prospectus (or final offering circular) has printed that has or is expected to include the identified Mortgage Note(s). |
| (2) | The 640 5th Avenue mortgage loan is expected to initially be serviced under the pooling and servicing agreement governing the BBCMS 2024-5C27 securitization. From and after the securitization of the related controlling pari passu companion loan, such whole loan will be serviced under the pooling and servicing agreement governing such securitization, such securitization will be the related controlling noteholder and the directing party will be the directing certificateholder (or equivalent) specified in such pooling and servicing agreement. |
| (3) | Prior to the related servicing shift securitization date, the related whole loan will be serviced under the pooling and servicing agreement for this transaction. From and after the related servicing shift securitization date, the related servicing shift whole loan will be serviced under the related servicing shift pooling and servicing agreement. |
| THE INFORMATION IN THIS STRUCTURAL AND COLLATERAL TERM SHEET IS NOT COMPLETE AND MAY BE AMENDED PRIOR TO THE TIME OF SALE. THIS TERM SHEET IS NOT AN OFFER TO SELL THESE SECURITIES AND IT IS NOT A SOLICITATION OF AN OFFER TO BUY THESE SECURITIES IN ANY JURISDICTION WHERE THE OFFER OR SALE IS NOT PERMITTED. | ||
| 6 | ||
Benchmark 2024-V8 Mortgage Trust |
| OVERVIEW OF MORTGAGE POOL CHARACTERISTICS |
| Distribution of Cut-off Date Balances(1) | ||||||||||||
| Range of Cut-off Date Balances | Number of Mortgage Loans | Aggregate Cut-off Date Balance | % of Initial Pool | Weighted Averages | ||||||||
| Mortgage Rate | Stated Remaining Term (Mos.) | U/W NCF DSCR(2) | Cut-off Date LTV(3) | Maturity Date LTV(3) | ||||||||
| $2,400,000 | - | $9,999,999 | 9 | $56,750,000 | 5.6% | 6.8397% | 59 | 1.55x | 61.1% | 61.1% | ||
| $10,000,000 | - | $19,999,999 | 6 | $76,160,000 | 7.5% | 6.8699% | 59 | 1.64x | 57.7% | 57.7% | ||
| $20,000,000 | - | $29,999,999 | 6 | $134,570,000 | 13.3% | 6.8230% | 59 | 1.51x | 53.6% | 53.6% | ||
| $30,000,000 | - | $39,999,999 | 4 | $140,115,000 | 13.9% | 7.4078% | 59 | 1.40x | 58.4% | 58.4% | ||
| $40,000,000 | - | $97,100,000 | 10 | $602,390,421 | 59.6% | 6.9189% | 59 | 1.81x | 49.7% | 48.7% | ||
| Total/Weighted Average | 35 | $1,009,985,421 | 100.0% | 6.9658% | 59 | 1.69x | 52.7% | 52.1% | ||||
| Distribution of Mortgage Rates(1) | ||||||||||||
| Range of Mortgage Rates | Number of Mortgage Loans | Aggregate Cut-off Date Balance | % of Initial Pool | Weighted Averages | ||||||||
| Mortgage Rate | Stated Remaining Term (Mos.) | U/W NCF DSCR(2) | Cut-off Date LTV(3) | Maturity Date LTV(3) | ||||||||
| 4.8200% | - | 5.9999% | 2 | $22,400,000 | 2.2% | 5.2593% | 59 | 2.37x | 51.4% | 51.4% | ||
| 6.0000% | - | 6.4999% | 9 | $326,200,000 | 32.3% | 6.2704% | 59 | 1.57x | 57.6% | 56.5% | ||
| 6.5000% | - | 6.9999% | 8 | $225,050,000 | 22.3% | 6.7832% | 59 | 1.64x | 55.9% | 55.9% | ||
| 7.0000% | - | 8.5300% | 16 | $436,335,421 | 43.2% | 7.6674% | 59 | 1.76x | 47.4% | 46.8% | ||
| Total/Weighted Average | 35 | $1,009,985,421 | 100.0% | 6.9658% | 59 | 1.69x | 52.7% | 52.1% | ||||
| Property Type Distribution(1)(4) | ||||||||||||
| Property Type | Number of Mortgaged Properties | Aggregate Cut-off Date Balance | % of Initial Outstanding Pool Balance | Number of NRA/Units/Rooms /Pads | Weighted Averages | |||||||
Cut-off Date NRA/Units/Rooms/ | Mortgage Rate | Stated Remaining Term (Mos.) | Occupancy | U/W NCF DSCR(2) | Cut-off Date LTV(3) | Maturity Date LTV(3) | ||||||
| Retail | 10 | $266,506,944 | 26.4% | 2,127,751 | $125 | 7.3627% | 59 | 89.8% | 1.85x | 50.7% | 49.9% | |
| Super Regional Mall | 2 | $135,790,421 | 13.4% | 1,504,366 | $90 | 7.8175% | 58 | 86.0% | 2.25x | 41.5% | 39.8% | |
| Anchored | 3 | $82,581,523 | 8.2% | 347,966 | $237 | 6.3360% | 60 | 90.4% | 1.36x | 66.5% | 66.5% | |
| Single Tenant | 3 | $34,280,570 | 3.4% | 128,765 | $266 | 7.6322% | 59 | 100.0% | 1.66x | 47.6% | 47.6% | |
| Unanchored | 2 | $13,854,430 | 1.4% | 146,654 | $94 | 8.3587% | 60 | 98.9% | 1.36x | 55.1% | 55.1% | |
| Multifamily | 16 | $241,622,915 | 23.9% | 2,179 | $110,887 | 6.6051% | 59 | 96.2% | 1.41x | 61.8% | 61.8% | |
| Mid Rise | 8 | $79,337,983 | 7.9% | 384 | $206,609 | 6.5330% | 59 | 94.9% | 1.37x | 62.4% | 62.4% | |
| Student Housing | 2 | $71,500,000 | 7.1% | 1,093 | $65,416 | 6.5151% | 59 | 97.9% | 1.60x | 59.2% | 59.2% | |
| Garden | 4 | $69,350,000 | 6.9% | 413 | $167,918 | 6.8409% | 59 | 96.8% | 1.30x | 62.7% | 62.7% | |
| High Rise | 2 | $21,434,932 | 2.1% | 289 | $74,169 | 6.4091% | 59 | 93.3% | 1.34x | 64.8% | 64.8% | |
| Office | 9 | $148,678,665 | 14.7% | 1,289,819 | $115 | 6.9883% | 59 | 89.1% | 1.78x | 51.1% | 51.1% | |
| CBD | 7 | $130,366,565 | 12.9% | 1,124,933 | $116 | 6.9394% | 59 | 91.9% | 1.84x | 50.3% | 50.3% | |
| Suburban | 2 | $18,312,100 | 1.8% | 164,886 | $111 | 7.3369% | 60 | 68.9% | 1.37x | 57.2% | 57.2% | |
| Mixed Use | 4 | $141,732,063 | 14.0% | 672,208 | $211 | 6.5750% | 59 | 93.2% | 1.87x | 47.1% | 44.5% | |
| Office/Retail | 2 | $98,654,235 | 9.8% | 336,236 | $293 | 6.1334% | 60 | 93.0% | 2.03x | 41.9% | 38.3% | |
| Office/Lab | 1 | $37,100,000 | 3.7% | 295,306 | $126 | 7.7800% | 58 | 100.0% | 1.49x | 59.6% | 59.6% | |
| Retail/Office | 1 | $5,977,828 | 0.6% | 40,666 | $147 | 6.3850% | 59 | 54.2% | 1.58x | 54.3% | 54.3% | |
| Hospitality | 3 | $100,000,000 | 9.9% | 599 | $166,945 | 7.8590% | 59 | 77.3% | 1.66x | 44.9% | 44.9% | |
| Full Service | 1 | $65,000,000 | 6.4% | 350 | $185,714 | 7.6000% | 59 | 77.3% | 1.68x | 40.5% | 40.5% | |
| Select Service | 1 | $18,575,000 | 1.8% | 131 | $141,794 | 8.3400% | 60 | 78.9% | 1.63x | 53.0% | 53.0% | |
| Extended Stay | 1 | $16,425,000 | 1.6% | 118 | $139,195 | 8.3400% | 60 | 75.2% | 1.63x | 53.0% | 53.0% | |
| Industrial | 34 | $91,444,834 | 9.1% | 5,025,229 | $18 | 6.5195% | 59 | 95.7% | 1.58x | 51.5% | 51.5% | |
| Flex | 11 | $42,750,000 | 4.2% | 417,141 | $102 | 7.0700% | 59 | 95.5% | 1.25x | 50.9% | 50.9% | |
| Warehouse | 4 | $24,021,045 | 2.4% | 198,029 | $121 | 5.9544% | 59 | 100.0% | 1.92x | 49.9% | 49.9% | |
| Manufacturing | 5 | $16,573,304 | 1.6% | 1,270,255 | $13 | 6.2973% | 59 | 88.0% | 1.65x | 54.2% | 54.2% | |
| Warehouse/Distribution | 10 | $6,336,275 | 0.6% | 2,598,277 | $2 | 5.7440% | 57 | 100.0% | 2.12x | 53.8% | 53.8% | |
| Manufacturing/Flex | 1 | $520,309 | 0.1% | 130,581 | $4 | 5.7440% | 57 | 100.0% | 2.12x | 53.8% | 53.8% | |
| Manufacturing/Warehouse | 1 | $470,698 | 0.0% | 216,300 | $2 | 5.7440% | 57 | 100.0% | 2.12x | 53.8% | 53.8% | |
| Distribution/Flex | 1 | $388,417 | 0.0% | 85,646 | $5 | 5.7440% | 57 | 100.0% | 2.12x | 53.8% | 53.8% | |
| Manufacturing/Distribution | 1 | $384,787 | 0.0% | 109,000 | $4 | 5.7440% | 57 | 100.0% | 2.12x | 53.8% | 53.8% | |
| Self Storage | 5 | $20,000,000 | 2.0% | 247,112 | $81 | 6.2100% | 58 | 92.7% | 1.44x | 63.6% | 63.6% | |
| Total/Weighted Average | 81 | $1,009,985,421 | 100.0% | 6.9658% | 59 | 91.1% | 1.69x | 52.7% | 52.1% | |||
| THE INFORMATION IN THIS STRUCTURAL AND COLLATERAL TERM SHEET IS NOT COMPLETE AND MAY BE AMENDED PRIOR TO THE TIME OF SALE. THIS TERM SHEET IS NOT AN OFFER TO SELL THESE SECURITIES AND IT IS NOT A SOLICITATION OF AN OFFER TO BUY THESE SECURITIES IN ANY JURISDICTION WHERE THE OFFER OR SALE IS NOT PERMITTED. | ||
| 7 | ||
Benchmark 2024-V8 Mortgage Trust |
| OVERVIEW OF MORTGAGE POOL CHARACTERISTICS |
| Geographic Distribution(1)(4) | |||||||||||
| State/Location | Number of Properties | Aggregate Cut-off Date Balance | % of Initial Outstanding Pool Balance | Weighted Averages | |||||||
| Mortgage Rate | Stated Remaining Term (Mos.) | U/W NCF DSCR(2) | Cut-off Date LTV(3) | Maturity Date LTV(3) | |||||||
| New York | 25 | $298,650,000 | 29.6% | 6.8343% | 60 | 1.73x | 47.7% | 46.5% | |||
| New York City | 9 | $201,500,000 | 20.0% | 6.4967% | 60 | 1.89x | 45.5% | 43.7% | |||
| New York State | 16 | $97,150,000 | 9.6% | 7.5344% | 59 | 1.40x | 52.3% | 52.3% | |||
| New Jersey | 9 | $109,950,000 | 10.9% | 6.5601% | 59 | 1.27x | 65.2% | 65.2% | |||
| California | 6 | $107,830,608 | 10.7% | 7.5374% | 59 | 1.49x | 56.6% | 56.6% | |||
| Southern(5) | 5 | $70,730,608 | 7.0% | 7.4102% | 59 | 1.49x | 55.0% | 55.0% | |||
| Northern(5) | 1 | $37,100,000 | 3.7% | 7.7800% | 58 | 1.49x | 59.6% | 59.6% | |||
| Georgia | 2 | $73,890,421 | 7.3% | 7.8975% | 58 | 2.61x | 34.2% | 31.1% | |||
| Utah | 1 | $70,000,000 | 6.9% | 7.6300% | 58 | 1.79x | 51.7% | 51.7% | |||
| Nevada | 1 | $69,500,000 | 6.9% | 6.3600% | 60 | 1.30x | 67.8% | 67.8% | |||
| Illinois | 2 | $65,909,936 | 6.5% | 7.5744% | 59 | 1.69x | 40.7% | 40.7% | |||
| Michigan | 13 | $59,899,375 | 5.9% | 6.3326% | 59 | 1.62x | 54.3% | 54.3% | |||
| Texas | 3 | $55,984,787 | 5.5% | 7.2133% | 59 | 1.73x | 55.8% | 55.8% | |||
| Florida | 3 | $50,539,064 | 5.0% | 6.6898% | 59 | 1.73x | 54.5% | 54.5% | |||
| Other | 16 | $47,831,230 | 4.7% | 5.8558% | 59 | 1.76x | 62.3% | 62.3% | |||
| Total/Weighted Average | 81 | $1,009,985,421 | 100.0% | 6.9658% | 59 | 1.69x | 52.7% | 52.1% | |||
| Distribution of Cut-off Date LTVs(1)(3) | ||||||||||
| Range of Cut-off Date LTVs | Number of Mortgage Loans | Aggregate Cut-off Date Balance | % of Initial Outstanding Pool Balance |
Weighted Averages | ||||||
| Mortgage Rate | Stated Remaining Term (Mos.) | U/W NCF DSCR(2) | Cut-off Date LTV(3) | Maturity Date LTV(3) | ||||||
| 30.6% | - | 39.9% | 2 | $85,790,421 | 8.5% | 7.7846% | 58 | 2.59x | 31.2% | 28.5% |
| 40.0% | - | 49.9% | 6 | $250,485,000 | 24.8% | 6.7671% | 59 | 1.92x | 42.9% | 41.5% |
| 50.0% | - | 59.9% | 12 | $390,800,000 | 38.7% | 7.2072% | 59 | 1.61x | 54.1% | 54.1% |
| 60.0% | - | 69.9% | 14 | $261,410,000 | 25.9% | 6.5990% | 59 | 1.31x | 65.4% | 65.4% |
| 70.0% | - | 70.0% | 1 | $21,500,000 | 2.1% | 6.0850% | 58 | 1.30x | 70.0% | 70.0% |
| Total/Weighted Average | 35 | $1,009,985,421 | 100.0% | 6.9658% | 59 | 1.69x | 52.7% | 52.1% | ||
| Distribution of Maturity Date LTVs(1)(3) | ||||||||||
| Range of Maturity Date LTVs | Number of Mortgage Loans | Aggregate Cut-off Date Balance | % of Initial Outstanding Pool Balance | Weighted Averages | ||||||
| Mortgage Rate | Stated Remaining Term (Mos.) | U/W NCF DSCR(2) | Cut-off Date LTV(3) | Maturity Date LTV(3) | ||||||
| 27.1% | - | 39.9% | 3 | $182,890,421 | 18.1% | 6.9058% | 59 | 2.30x | 36.8% | 33.6% |
| 40.0% | - | 49.9% | 5 | $153,385,000 | 15.2% | 7.1709% | 59 | 1.85x | 43.7% | 43.7% |
| 50.0% | - | 59.9% | 12 | $390,800,000 | 38.7% | 7.2072% | 59 | 1.61x | 54.1% | 54.1% |
| 60.0% | - | 70.0% | 15 | $282,910,000 | 28.0% | 6.5599% | 59 | 1.31x | 65.8% | 65.8% |
| Total/Weighted Average | 35 | $1,009,985,421 | 100.0% | 6.9658% | 59 | 1.69x | 52.7% | 52.1% | ||
| Distribution of Underwritten NCF Debt Service Coverages(1)(2) | ||||||||||
| Range of Underwritten NCF Debt Service Coverages | Number of Mortgage Loans | Aggregate Cut-off Date Balance | % of Initial Outstanding Pool Balance | Weighted Averages | ||||||
| Mortgage Rate | Stated Remaining Term (Mos.) | U/W NCF DSCR(2) | Cut-off Date LTV(3) | Maturity Date LTV(3) | ||||||
| 1.21x | - | 1.49x | 19 | $393,360,000 | 38.9% | 6.8516% | 59 | 1.31x | 62.4% | 62.4% |
| 1.50x | - | 1.99x | 10 | $403,335,000 | 39.9% | 7.2020% | 59 | 1.73x | 50.6% | 50.6% |
| 2.00x | - | 2.49x | 4 | $135,750,000 | 13.4% | 6.2710% | 60 | 2.07x | 41.8% | 39.1% |
| 2.50x | - | 2.73x | 2 | $77,540,421 | 7.7% | 7.5325% | 58 | 2.71x | 33.4% | 30.4% |
| Total/Weighted Average | 35 | $1,009,985,421 | 100.0% | 6.9658% | 59 | 1.69x | 52.7% | 52.1% | ||
| Original Terms to Maturity(1) | ||||||||
| Original Terms to Maturity | Number of Mortgage Loans | Aggregate Cut-off Date Balance | % of Initial Outstanding Pool Balance | Weighted Averages | ||||
| Mortgage Rate | Stated Remaining Term (Mos.) | U/W NCF DSCR(2) | Cut-off Date LTV(3) | Maturity Date LTV(3) | ||||
| 60 | 35 | $1,009,985,421 | 100.0% | 6.9658% | 59 | 1.69x | 52.7% | 52.1% |
| Total/Weighted Average | 35 | $1,009,985,421 | 100.0% | 6.9658% | 59 | 1.69x | 52.7% | 52.1% |
Distribution of Remaining Terms to Maturity(1) | ||||||||||
| Range of Remaining Terms to Maturity | Number of Mortgage Loans | Aggregate Cut-off Date Balance | % of Initial Outstanding Pool Balance | Weighted Averages | ||||||
| Mortgage Rate | Stated Remaining Term (Mos.) | U/W NCF DSCR(2) | Cut-off Date LTV(3) | Maturity Date LTV(3) | ||||||
| 57 | - | 59 | 24 | $706,885,421 | 70.0% | 7.0784% | 59 | 1.69x | 52.6% | 52.3% |
| 60 | - | 60 | 11 | $303,100,000 | 30.0% | 6.7032% | 60 | 1.68x | 52.8% | 51.6% |
| Total/Weighted Average | 35 | $1,009,985,421 | 100.0% | 6.9658% | 59 | 1.69x | 52.7% | 52.1% | ||
| THE INFORMATION IN THIS STRUCTURAL AND COLLATERAL TERM SHEET IS NOT COMPLETE AND MAY BE AMENDED PRIOR TO THE TIME OF SALE. THIS TERM SHEET IS NOT AN OFFER TO SELL THESE SECURITIES AND IT IS NOT A SOLICITATION OF AN OFFER TO BUY THESE SECURITIES IN ANY JURISDICTION WHERE THE OFFER OR SALE IS NOT PERMITTED. | ||
| 8 | ||
Benchmark 2024-V8 Mortgage Trust |
| OVERVIEW OF MORTGAGE POOL CHARACTERISTICS |
| Distribution of Underwritten NOI Debt Yields(1) | ||||||||||
| Range of Underwritten NOI Debt Yields | Number of Mortgage Loans | Aggregate Cut-off Date Balance | % of Initial Outstanding Pool Balance | Weighted Averages | ||||||
| Mortgage Rate | Stated Remaining Term (Mos.) | U/W NCF DSCR(2) | Cut-off Date LTV(3) | Maturity Date LTV(3) | ||||||
| 7.9% | - | 8.4% | 5 | $98,100,000 | 9.7% | 6.3741% | 59 | 1.25x | 66.9% | 66.9% |
| 8.5% | - | 9.4% | 6 | $198,100,000 | 19.6% | 6.6564% | 59 | 1.29x | 61.4% | 61.4% |
| 9.5% | - | 10.4% | 1 | $7,400,000 | 0.7% | 7.1600% | 60 | 1.39x | 60.7% | 60.7% |
| 10.5% | - | 11.4% | 5 | $77,260,000 | 7.6% | 6.7729% | 59 | 1.52x | 57.3% | 57.3% |
| 11.5% | - | 30.2% | 18 | $629,125,421 | 62.3% | 7.1769% | 59 | 1.91x | 47.0% | 46.1% |
| Total/Weighted Average | 35 | $1,009,985,421 | 100.0% | 6.9658% | 59 | 1.69x | 52.7% | 52.1% | ||
| Amortization Types(1) | ||||||||
| Amortization Type | Number of Mortgage Loans | Aggregate Cut-off Date Balance | % of Initial Outstanding Pool Balance | Weighted Averages | ||||
| Mortgage Rate | Stated Remaining Term (Mos.) | U/W NCF DSCR(2) | Cut-off Date LTV(3) | Maturity Date LTV(3) | ||||
| Interest Only | 33 | $847,095,000 | 83.9% | 6.9800% | 59 | 1.57x | 55.6% | 55.6% |
| Amortizing Balloon | 2 | $162,890,421 | 16.1% | 6.8918% | 59 | 2.32x | 37.2% | 33.6% |
| Total/Weighted Average | 35 | $1,009,985,421 | 100.0% | 6.9658% | 59 | 1.69x | 52.7% | 52.1% |
| (1) | The U/W NCF DSCR, Cut-off Date LTV, Maturity Date LTV, Underwritten NOI Debt Yield and Cut-off Date Balance per # of NRA/Units/Rooms/Pads calculations include any related pari passu companion loan(s) and exclude any related subordinate companion loan(s) and/or mezzanine loan(s). |
| (2) | The 640 5th Avenue Whole Loan has a fixed amortization for its entire 60-month loan term. With respect to the 640 5th Avenue Whole Loan, the borrower is required to make payments on each monthly payment date, as follows: (x) principal in the amount of $437,500 and (y) the monthly interest payment. |
| (3) | With respect to 4 mortgaged properties (9.5%) (488 Madison, Lotus 315, Courtyard Marriott, TownePlace Suites), the Cut-off Date LTV Ratio and Maturity Date or LTV Ratio have been calculated using a value other than the “As Is” appraised value. For additional information please see the footnotes to Annex A-1 in the Preliminary Prospectus. |
| (4) | Reflects the allocated loan amount for properties securing multi-property Mortgage Loans. |
| (5) | Northern California properties have a zip code greater than 93600. Southern California properties have a zip code less than or equal to 93600. |
| Previously Securitized Mortgaged Properties(1) | |||||
| Mortgaged Property | Cut-off Date Balance | % of Initial Outstanding Pool Balance | City, State | Property Type | Previous Securitization |
| City Creek Center | 70,000,000 | 6.9% | Salt Lake City, Utah | Retail | MSBAM 2013-C12 |
| Showcase I | 69,500,000 | 6.9% | Las Vegas, Nevada | Retail | JPMBB 2014-C21 |
| Sugarloaf Mills | 65,790,421 | 6.5% | Lawrenceville, Georgia | Retail | JPMCC 2006-LDP9 |
| Lotus 315 | 21,320,383 | 2.1% | East Orange, New Jersey | Multifamily | ARCLO 2021-FL3 |
| 3575 Cahuenga | 18,300,000 | 1.8% | Los Angeles, California | Office | JPMBB 2014-C19 |
| Essence 144 | 14,779,617 | 1.5% | East Orange, New Jersey | Multifamily | UBSCM 2017-C4 |
| Sunroad Centrum | 12,460,000 | 1.2% | San Diego, California | Office | COMM 2014-CR19 |
| Exchange Plaza | 12,100,000 | 1.2% | San Antonio, Texas | Retail | M360 2021-CRE3 |
| Woodbury Gardens | 7,400,000 | 0.7% | Central Valley, New York | Multifamily | FNA 2014-M1 |
| 49 South Clinton Street | 7,350,000 | 0.7% | East Orange, New Jersey | Multifamily | FRESB 2019-SB68 |
| Prime Storage - Union City | 6,793,103 | 0.7% | Union City, New Jersey | Self Storage | WFCM 2015-NXS2 |
| Prime Storage - Jersey City | 4,551,724 | 0.5% | Jersey City, New Jersey | Self Storage | WFCM 2015-NXS2 |
| Prime Storage - Newark | 4,517,241 | 0.4% | Newark, New Jersey | Self Storage | WFCM 2015-NXS2 |
| Prime Storage - Hoboken | 2,655,172 | 0.3% | Jersey City, New Jersey | Self Storage | WFCM 2015-NXS2 |
| Prime Storage - Garfield | 1,482,759 | 0.1% | Garfield, New Jersey | Self Storage | RCMT 2019-FL3 |
| (1) | The table above includes mortgaged properties securing mortgage loans for which the most recent prior financing of all or a significant portion of each such mortgaged property was included in a securitization. Information under “Previous Securitization” represents the most recent such securitization with respect to each of those mortgaged properties. The information in the above table is based solely on information provided by the related borrower or obtained through searches of a third-party database and has not otherwise been confirmed by the related mortgage loan seller. |
| THE INFORMATION IN THIS STRUCTURAL AND COLLATERAL TERM SHEET IS NOT COMPLETE AND MAY BE AMENDED PRIOR TO THE TIME OF SALE. THIS TERM SHEET IS NOT AN OFFER TO SELL THESE SECURITIES AND IT IS NOT A SOLICITATION OF AN OFFER TO BUY THESE SECURITIES IN ANY JURISDICTION WHERE THE OFFER OR SALE IS NOT PERMITTED. | ||
| 9 | ||
Benchmark 2024-V8 Mortgage Trust |
| STRUCTURE OVERVIEW |
| Available Funds: | The amount available for distribution to holders of the certificates on each Distribution Date will be the gross amount of interest, principal, yield maintenance charges and prepayment premiums collected with respect to the Mortgage Loans in the applicable one-month collection period, net of specified expenses of the issuing entity, including fees payable therefrom to, and losses, liabilities, costs and expenses reimbursable or indemnifiable therefrom to, the Master Servicer, the Special Servicer, the Certificate Administrator, the Trustee, the Operating Advisor, the Asset Representations Reviewer and CREFC®. See “Description of the Certificates” in the Preliminary Prospectus. |
| Principal Payments: | Payments in respect of principal on the certificates will be distributed to the Class A-1, Class A-2, Class A-3, Class A-M, Class B, Class C, Class D, Class E-RR, Class F-RR, Class G-RR and Class J-RR certificates, in that order, until the Certificate Balance of each such class is reduced to zero. Notwithstanding the foregoing, if the total Certificate Balance of the Class A-M, Class B, Class C, Class D, Class E-RR, Class F-RR, Class G-RR and Class J-RR certificates have been reduced to zero as a result of loss allocation, payments in respect of principal of the certificates will be distributed, first, to the Class A-1, Class A-2 and Class A-3 certificates, on a pro rata basis, based on the Certificate Balance of each such class, then, to the extent of any recoveries on realized losses, to the Class A-M, Class B, Class C, Class D, Class E-RR, Class F-RR, Class G-RR and Class J-RR certificates, in that order, in each case until the Certificate Balance of each such class is reduced to zero (or previously allocated realized losses have been fully reimbursed). Each of the Class X Certificates will not be entitled to receive distributions of principal; however, (i) the notional amount of the Class X-A certificates will be reduced by the aggregate amount of principal distributions and realized losses allocated to the Class A-1, Class A-2, Class A-3 and Class A-M certificates, (ii) the notional amount of the Class X-B certificates will be reduced by the aggregate amount of principal distributions and realized losses allocated to the Class B and Class C certificates, (iii) the notional amount of the Class X-D certificates will be reduced by the amount of principal distributions and realized losses allocated to the Class D certificates, and (iv) the notional amount of the Class X-RR certificates will be reduced by the aggregate amount of principal distributions and realized losses allocated to the Class E-RR, Class F-RR, Class G-RR and Class J-RR certificates. |
Interest Payments: | On each Distribution Date, interest accrued for each class of certificates at the applicable pass-through rate will be distributed in the following order of priority, to the extent of available funds (exclusive of any portion thereof that represents any yield maintenance charges and prepayment premiums): first, to the Class A-1, Class A-2, Class A-3, Class X-A, Class X-B and Class X-D certificates, on a pro rata basis, based on the accrued and unpaid interest on each such class and then, to the Class A-M, Class B, Class C, Class D, Class X-RR, Class E-RR, Class F-RR, Class G-RR and Class J-RR certificates, in that order, in each case until the interest payable to each such class is paid in full. The pass-through rates applicable to the Class A-1, Class A-2, Class A-3, Class A-M, Class B, Class C, Class D, Class E-RR, Class F-RR, Class G-RR and Class J-RR certificates for each Distribution Date will equal one of: (i) a fixed per annum rate, (ii) the WAC Rate, (iii) a rate equal to the lesser of a specified pass-through rate and the WAC Rate or (iv) the WAC Rate less a specified rate, but in any case not less than 0.000%. As further described in the Preliminary Prospectus, the pass-through rates applicable to the Class X Certificates for each Distribution Date will generally be equal to the excess of (i) the WAC Rate over (ii) (A) with respect to the Class X-A certificates, the weighted average of the pass-through rates of the Class A-1, Class A-2, Class A-3 and Class A-M certificates (weighted based on their respective Certificate Balances outstanding immediately prior to that Distribution Date), (B) with respect to the Class X-B certificates, the weighted average of the pass-through rates of the Class B and Class C certificates (weighted based on their respective Certificate Balances outstanding immediately prior to that Distribution Date), (C) with respect to the Class X-D certificates, the pass-through rate of the Class D certificates and (D) with respect to the Class X-RR certificates, the weighted average of the pass-through rates of the Class E-RR, Class F-RR, Class G-RR and Class J-RR certificates (weighted based on their respective Certificate Balances outstanding immediately prior to that Distribution Date) . |
| THE INFORMATION IN THIS STRUCTURAL AND COLLATERAL TERM SHEET IS NOT COMPLETE AND MAY BE AMENDED PRIOR TO THE TIME OF SALE. THIS TERM SHEET IS NOT AN OFFER TO SELL THESE SECURITIES AND IT IS NOT A SOLICITATION OF AN OFFER TO BUY THESE SECURITIES IN ANY JURISDICTION WHERE THE OFFER OR SALE IS NOT PERMITTED. | ||
| 10 | ||
Benchmark 2024-V8 Mortgage Trust |
| STRUCTURE OVERVIEW |
| Prepayment Interest Shortfalls: | Prepayment interest shortfalls will be allocated pro rata based on interest entitlements, in reduction of the interest otherwise payable with respect to each of the interest-bearing classes of certificates. |
| Loss Allocation: | Losses on the Mortgage Loans will be allocated to each class of certificates entitled to principal in reverse alphabetical order starting with the Class J-RR certificates through and including the Class A-M certificates and then to the Class A-1, Class A-2 and Class A-3 certificates on a pro rata basis based on the Certificate Balance of each such class. The notional amount of any class of Class X Certificates will be reduced by the aggregate amount of realized losses allocated to the class(es) of certificates that are component(s) of the notional amount of such class of Class X Certificates. |
Prepayment Premiums:
| A percentage of all prepayment premiums (either fixed prepayment premiums or yield maintenance amounts) collected on the Mortgage Loans will be allocated to each of the Class A-1, Class A-2, Class A-3, Class A-M, Class B, Class C and Class D certificates (the “YM P&I Certificates”) then entitled to principal distributions, which percentage will be equal to the product of (a) a fraction, not greater than one, the numerator of which is the amount of principal distributed to such class on such Distribution Date and the denominator of which is the total amount of principal distributed to the holders of each class of Principal Balance Certificates on such Distribution Date and (b) the Base Interest Fraction for the related principal prepayment and such class of certificates. The “Base Interest Fraction” for any principal prepayment on any Mortgage Loan and for: (A) any of the Class A-1 through Class D certificates with a Pass-Through Rate equal to either the WAC Rate or the WAC Rate less a specified rate, will be a fraction (not greater than one) (a) whose numerator is the greater of zero and the amount, if any, by which (i) the Pass-Through Rate on such class of certificates exceeds (ii) the yield rate (as provided by the master servicer) used in calculating the prepayment premium or yield maintenance charge, as applicable, with respect to such principal prepayment and (b) whose denominator is the amount, if any, by which (i) the Net Mortgage Rate on such Mortgage Loan during the related interest accrual period exceeds (ii) the yield rate (as provided by the master servicer) used in calculating the prepayment premium or yield maintenance charge, as applicable, with respect to such principal prepayment; provided, however, that if such yield rate is greater than or equal to the Net Mortgage Rate on such Mortgage Loan during the related interest accrual period, then the respective Base Interest Fraction will be zero; provided, further, that if such yield rate is greater than or equal to the Net Mortgage Rate on such Mortgage Loan during the related interest accrual period, but less than the Pass-Through Rate described in clause (a)(i) above, then the respective Base Interest Fraction will be one; and (B) any of the Class A-1 through Class D certificates with a Pass-Through Rate equal to a fixed per annum rate, will be a fraction (not greater than one) (a) whose numerator is the greater of zero and the amount, if any, by which (i) the Pass-Through Rate on such class of certificates exceeds (ii) the yield rate (as provided by the master servicer) used in calculating the prepayment premium or yield maintenance charge, as applicable, with respect to such principal prepayment and (b) whose denominator is the amount, if any, by which (i) the Mortgage Rate on such Mortgage Loan (net of the Administrative Cost Rate) during the related interest accrual period multiplied by 365/360 exceeds (ii) the yield rate (as provided by the master servicer) used in calculating the prepayment premium or yield maintenance charge, as applicable, with respect to such principal prepayment; provided, however, that if such yield rate is greater than or equal to the amount set forth in clause (b)(i) above, then the respective Base Interest Fraction will be zero; provided, further, that if such yield rate is greater than or equal to the amount set forth in clause (b)(i) above, but less than the Pass-Through Rate described in clause (a)(i) above, then the respective Base Interest Fraction will be one. The remaining percentage of prepayment premiums will be allocated to the Class X-A, Class X-B and Class X-D certificates in the manner described in the Preliminary Prospectus. In general, this formula provides for an increase in the percentage of prepayment premiums allocated to the YM P&I Certificates then entitled to principal distributions relative to the Class X-A, Class X-B and Class X-D certificates as Discount Rates decrease and a decrease in the percentage allocated to such classes as Discount Rates rise. |
| THE INFORMATION IN THIS STRUCTURAL AND COLLATERAL TERM SHEET IS NOT COMPLETE AND MAY BE AMENDED PRIOR TO THE TIME OF SALE. THIS TERM SHEET IS NOT AN OFFER TO SELL THESE SECURITIES AND IT IS NOT A SOLICITATION OF AN OFFER TO BUY THESE SECURITIES IN ANY JURISDICTION WHERE THE OFFER OR SALE IS NOT PERMITTED. | ||
| 11 | ||
Benchmark 2024-V8 Mortgage Trust |
| STRUCTURE OVERVIEW |
| Whole Loans: | The mortgaged properties identified on Annex A-1 to the Preliminary Prospectus as 640 5th Avenue, Showcase I, Bedrock Mixed-Use Portfolio, University Pointe, 488 Madison, Pleasanton Corporate Commons, Lotus 315 & Essence 144, Saks Beverly Hills, Prime Storage – Blue Portfolio, Sunroad Centrum and GNL Industrial Portfolio each secure both a mortgage loan to be included in the trust fund and one or more other companion loans that will not be included in the trust fund, each of which will be pari passu or subordinate in right of payment with the mortgage loan included in the trust fund. We refer to each such group of related loans as a “whole loan”. As of the Closing Date, the pari passu companion loans and any subordinate companion loans are expected to be held by the party identified in “—Companion Loan Summary” above and the table titled “Whole Loan Control Notes and Non-Control Notes” in “Description of the Mortgage Pool—The Whole Loans—General” in the Preliminary Prospectus. |
| Control Rights and Directing Holder: | With respect to any Serviced Mortgage Loan and any related Serviced Companion Loan, the Directing Holder will generally be entitled to direct the Special Servicer to take, or refrain from taking certain actions with respect to each Serviced Mortgage Loan and any related Serviced Companion Loans. Furthermore, the Directing Holder will also have the right to receive notice and consent to certain material actions that the Master Servicer and the Special Servicer proposes to take with respect to each Serviced Mortgage Loan and any related Serviced Companion Loans. The “Directing Holder” means, (i) with respect to each Serviced Mortgage Loan (other than any Servicing Shift Mortgage Loan) or Serviced Whole Loan (other than any Servicing Shift Whole Loan), the Controlling Class Certificateholder (or its representative) selected by more than 50% of the Controlling Class, by Certificate Balance, as determined by the certificate registrar from time to time (the “Trust Directing Holder”); and (ii) with respect to any Servicing Shift Mortgage Loan or Servicing Shift Whole Loan, the related Loan-Specific Directing Holder identified in the Preliminary Prospectus (which is expected to be the holder of the related controlling pari passu companion loan) prior to the related Servicing Shift Securitization Date. Eightfold Real Estate Capital Fund VI, L.P. or its affiliate is expected to appoint itself or its affiliate as the initial Trust Directing Holder. For a description of the directing holder (or equivalent party) for each Non-Serviced Whole Loan, see “Description of the Mortgage Pool—The Whole Loans” and “Pooling and Servicing Agreement—The Directing Holder” in the Preliminary Prospectus. |
| Control Eligible Certificates: | Class E-RR, Class F-RR, Class G-RR and Class J-RR certificates. |
| Controlling Class: | The Controlling Class will be, as of any time of determination, the most subordinate class of Control Eligible Certificates then-outstanding that has an aggregate Certificate Balance (as notionally reduced by any cumulative appraisal reduction amounts allocable to such class) at least equal to 25% of the initial Certificate Balance of such class; provided that if at any time the Certificate Balances of all Control Eligible Certificates, as notionally reduced by any appraisal reduction amounts (but without regard to any collateral deficiency amounts) allocable to such classes, have been reduced to zero, then the “Controlling Class” will be the most subordinate class of Control Eligible Certificates that has an aggregate principal balance greater than zero; provided, further, that if at any time the Certificate Balances of the Class A-1, Class A-2, Class A-3, Class A-M, Class B, Class C and Class D certificates have been reduced to zero as a result of the allocation of principal payments on the Mortgage Loans, then the “Controlling Class” will be the most subordinate class of Control Eligible Certificates that has an aggregate Certificate Balance greater than zero without regard to the application of appraisal reduction amounts (or any collateral deficiency amounts) to notionally reduce the Certificate Balance of such class. The Controlling Class as of the Closing Date will be the Class J-RR certificates. |
| Appraised-Out Class: | Any class of Control Eligible Certificates that has been determined, as a result of appraisal reduction amounts and collateral deficiency amounts allocable to such class, to no longer be the Controlling Class (an “Appraised-Out Class”). |
| THE INFORMATION IN THIS STRUCTURAL AND COLLATERAL TERM SHEET IS NOT COMPLETE AND MAY BE AMENDED PRIOR TO THE TIME OF SALE. THIS TERM SHEET IS NOT AN OFFER TO SELL THESE SECURITIES AND IT IS NOT A SOLICITATION OF AN OFFER TO BUY THESE SECURITIES IN ANY JURISDICTION WHERE THE OFFER OR SALE IS NOT PERMITTED. | ||
| 12 | ||
Benchmark 2024-V8 Mortgage Trust |
| STRUCTURE OVERVIEW |
| Remedies Available to Holders of an Appraised-Out Class: | Holders of the majority (by Certificate Balance) of an Appraised-Out Class will have the right, at their sole expense, to require the Special Servicer to order a supplemental appraisal of any Mortgage Loan (or Serviced Whole Loan) for which an appraisal reduction event has occurred or as to which there exists a collateral deficiency amount. Upon receipt of such supplemental appraisal, the Special Servicer will be required to send the appraisal to the Master Servicer, who will be required to recalculate the appraisal reduction amount or collateral deficiency amount, as applicable, based on such supplemental appraisal, and if required by such recalculation, the applicable Appraised-Out Class as the Controlling Class. Any Appraised-Out Class requesting a supplemental appraisal will not be entitled to exercise any rights of the Controlling Class until such time, if any, as the class is reinstated as the Controlling Class. |
Control Termination Event: | Will occur and be continuing with respect to any Mortgage Loan (other than any Servicing Shift Mortgage Loan or Serviced Whole Loan (other than any Servicing Shift Whole Loan), when one or more of the following is true: (i) the Class E-RR certificates have a Certificate Balance (taking into account the application of any cumulative appraisal reduction amounts and collateral deficiency amounts to notionally reduce the Certificate Balance of such class) being reduced to less than 25% of the initial Certificate Balance of that class or (ii) such Mortgage Loan or Whole Loan is an applicable excluded loan; provided, that a Control Termination Event will not be deemed to be continuing in the event the Certificate Balances of all Classes of Principal Balance Certificates other than the Control Eligible Certificates have been reduced to zero; provided, further, that no Control Termination Event may occur with respect to the Loan-Specific Directing Holder related to any Servicing Shift Whole Loan and the term “Control Termination Event” will not be applicable to the Loan-Specific Directing Holder related to such Servicing Shift Whole Loan. With respect to an excluded loan related to the Directing Holder, a Control Termination Event will be deemed to exist. During the continuance of a Control Termination Event, the Directing Holder will no longer have any control rights. The Directing Holder will no longer have the right to direct certain actions of the Special Servicer and will no longer have consent rights with respect to certain material actions that the Master Servicer or Special Servicer proposes to take with respect to a Serviced Mortgage Loan and any related Serviced Companion Loans. During the continuance of a Control Termination Event, the Directing Holder will retain non-binding consultation rights with respect to certain material actions that the Special Servicer proposes to take with respect to a Serviced Mortgage Loan and any related Serviced Companion Loans. Such consultation rights will continue until the occurrence of a Consultation Termination Event. |
| Consultation Termination Event: | Will occur and be continuing with respect to any Mortgage Loan (other than any Servicing Shift Mortgage Loan) or Serviced Whole Loan (other than any Servicing Shift Whole Loan), when one or more of the following is true: (i) there is no class of Control Eligible Certificates that has a then-outstanding Certificate Balance (without regard to the application of any cumulative appraisal reduction amounts) equal to at least 25% of the initial Certificate Balance of that class or (ii) such Mortgage Loan or Whole Loan is an applicable excluded loan; provided that a Consultation Termination Event will not be deemed to be continuing in the event the Certificate Balances of all Classes of Principal Balance Certificates other than the Control Eligible Certificates have been reduced to zero; provided, further, that no Consultation Termination Event may occur with respect to the Loan-Specific Directing Holder related to any Servicing Shift Whole Loan and the term “Consultation Termination Event” will not be applicable to the Loan-Specific Directing Holder related to such Servicing Shift Whole Loan. With respect to an excluded loan related to the Directing Holder, a Consultation Termination Event will be deemed to exist. During the continuance of a Consultation Termination Event, the Directing Holder will have no rights under the PSA other than those rights that all Certificateholders have. |
| Appointment and Replacement of Special Servicer: | The Directing Holder will appoint the initial Special Servicer with respect to each Serviced Mortgage Loan and any related Serviced Companion Loans as of the Closing Date. For so long as no Control Termination Event is continuing, the Directing Holder generally may replace the Special Servicer with respect to each Serviced Mortgage Loan and any related Serviced Companion Loans with or without cause at any time. |
| THE INFORMATION IN THIS STRUCTURAL AND COLLATERAL TERM SHEET IS NOT COMPLETE AND MAY BE AMENDED PRIOR TO THE TIME OF SALE. THIS TERM SHEET IS NOT AN OFFER TO SELL THESE SECURITIES AND IT IS NOT A SOLICITATION OF AN OFFER TO BUY THESE SECURITIES IN ANY JURISDICTION WHERE THE OFFER OR SALE IS NOT PERMITTED. | ||
| 13 | ||
Benchmark 2024-V8 Mortgage Trust |
| STRUCTURE OVERVIEW |
During the continuance of a Control Termination Event, the Directing Holder will no longer have the right to replace the Special Servicer and such replacement (other than with respect to the Non-Serviced Whole Loans) will occur based on a vote of holders of all voting eligible classes of certificates as described below. See “Description of the Mortgage Pool—The Whole Loans” and “Pooling and Servicing Agreement” in the Preliminary Prospectus for a description of the special servicer appointment and replacement rights with respect to Non-Serviced Whole Loans. | |
| Replacement of Special Servicer by Vote of Certificateholders: | Other than with respect to Non-Serviced Whole Loans, if a Control Termination Event is continuing, upon (i) the written direction of holders of certificates evidencing not less than 25% of the voting rights (taking into account the application of any appraisal reduction amounts to notionally reduce the Certificate Balances) of the Principal Balance Certificates and requesting a vote to replace the Special Servicer (other than with respect to any Servicing Shift Whole Loan) with a new special servicer, (ii) payment by such requesting holders to the Certificate Administrator of all reasonable fees and expenses to be incurred by the Certificate Administrator in connection with administering such vote and (iii) delivery by such holders to the Certificate Administrator and Trustee of written confirmations from each Rating Agency that the appointment of the replacement Special Servicer will not result in a downgrade of the certificates, the Certificate Administrator will be required to promptly post notice of such request on the Certificate Administrator’s website and concurrently provide written notice of such request by mail to all Certificateholders of such request and conduct the solicitation of votes of all certificates in such regard, which such vote must occur within 180 days of the posting of such notice. Upon the written direction of (i) holders of Principal Balance Certificates evidencing at least 66-2/3% of a Certificateholder Quorum or (ii) holders of Principal Balance Certificates evidencing more than 50% of the aggregate voting rights of Principal Balance Certificates outstanding that has not been reduced to less than 25% of its initial Certificate Balance through the application of appraisal reduction amounts and realized losses), the Trustee will immediately replace the Special Servicer with the replacement Special Servicer (other than with respect to Non-Serviced Whole Loans). “Certificateholder Quorum” means, in connection with any solicitation of votes in connection with the replacement of the Special Servicer as described above or the Asset Representations Reviewer as described below, the holders of certificates evidencing at least 50% of the aggregate voting rights (taking into account the application of any appraisal reduction amounts to notionally reduce the Certificate Balance of the certificates, except in the case of the termination of the Asset Representations Reviewer) of all Principal Balance Certificates, on an aggregate basis. If at any time, the Operating Advisor determines, in its sole discretion exercised in good faith, that (1) the Special Servicer is not performing its duties as required under the PSA or is otherwise not acting in accordance with the Servicing Standard and (2) the replacement of the Special Servicer would be in the best interest of the Certificateholders as a collective whole, then the Operating Advisor will have the right to recommend the replacement of the Special Servicer. The Operating Advisor’s recommendation to replace the Special Servicer (other than with respect Non-Serviced Whole Loans) must be confirmed by holders of Principal Balance Certificates representing a majority of the Voting Rights (taking into account the application of Appraisal Reduction Amounts to notionally reduce the respective Certificate Balances) of all Principal Balance Certificates whose holders voted on the matter; provided that the holders of Principal Balance Certificates that so voted on the matter (i) hold Principal Balance Certificates representing at least 20% of the Voting Rights (taking into account the application of any appraisal reduction amounts to notionally reduce the respective Certificate Balances) of all Principal Balance Certificates on an aggregate basis and (ii) consist of at least three Certificateholders or Certificate Owners that are not risk retention affiliated with each other) within 180 days from the time such recommendation is posted to the Certificate Administrator website and is subject to the receipt of written confirmations from each Rating Agency that the appointment of the replacement Special Servicer will not result in a downgrade of the certificates. See “Description of the Mortgage Pool—The Whole Loans” and “Pooling and Servicing Agreement” in the Preliminary Prospectus for a description of the special servicer appointment and replacement rights with respect to Non-Serviced Whole Loans. |
| THE INFORMATION IN THIS STRUCTURAL AND COLLATERAL TERM SHEET IS NOT COMPLETE AND MAY BE AMENDED PRIOR TO THE TIME OF SALE. THIS TERM SHEET IS NOT AN OFFER TO SELL THESE SECURITIES AND IT IS NOT A SOLICITATION OF AN OFFER TO BUY THESE SECURITIES IN ANY JURISDICTION WHERE THE OFFER OR SALE IS NOT PERMITTED. | ||
| 14 | ||
Benchmark 2024-V8 Mortgage Trust |
| STRUCTURE OVERVIEW |
| Cap on Workout and Liquidation Fees: | The workout fees and liquidation fees payable to a Special Servicer under the PSA will be an amount equal to the lesser of: (1) 1.0% of each collection of interest and principal following a workout or liquidation, subject to a minimum of $25,000 and (2) $1,000,000 per workout or liquidation. All Modification Fees actually paid to the Special Servicer in connection with a workout or liquidation or in connection with any prior workout or partial liquidation that occurred within the prior 18 months will be deducted from the total workout fee (only after receipt by the Special Servicer of workout fees of $25,000) and/or liquidation fees payable (other than Modification Fees earned while the Mortgage Loan was not in special servicing). In addition, the total amount of workout and liquidation fees actually payable by the Issuing Entity under the PSA will be capped in the aggregate at $1,000,000 for each related Mortgage Loan. If a new special servicer begins servicing the related Mortgage Loan, all amounts paid to the prior special servicer will be disregarded for purposes of calculating the cap. |
Special Servicer Compensation: | The special servicing fee will equal 0.25% per annum of the stated principal balance of the related specially serviced loan or REO property, as applicable with a minimum monthly fee of $5,000. The Special Servicer and its affiliates will be prohibited from receiving or retaining any compensation or any other remuneration under the PSA (including, without limitation, in the form of commissions, brokerage fees, rebates, or as a result of any other fee-sharing arrangement) from any person (including, without limitation, the issuing entity, any borrower, any manager, any guarantor or indemnitor in respect of a Serviced Mortgage Loan and any related Serviced Companion Loans, and any purchaser of any Serviced Mortgage Loan and any related Serviced Companion Loan or REO Property) in connection with the disposition, workout or foreclosure of any Mortgage Loan (or Serviced Whole Loan, if applicable), the management or disposition of any REO Property, or the performance of any other special servicing duties under the PSA, other than as expressly permitted in the PSA and other than commercially reasonable treasury management fees, banking fees, property condition report fees, customary title agent fees and insurance commissions or fees received or retained by the Special Servicer or any of its Affiliates in connection with any services performed by such party with respect to any Mortgage Loan, Serviced Whole Loan or REO Property. Subject to certain limited exceptions, the Special Servicer will also be required to report any compensation or other remuneration the Special Servicer or its affiliates have received from any person and such information will be disclosed in the Certificateholders’ monthly distribution date statement. |
Operating Advisor: | With respect to the Serviced Mortgage Loans and any related Serviced Companion Loans the Operating Advisor will have access to any final asset status report and all information available with respect to the transaction on the Certificate Administrator’s website and will have certain monitoring responsibilities on behalf of the entire trust. After the occurrence and during the continuance of an Operating Advisor Consultation Event, the Operating Advisor will have consultation rights with respect to certain major decisions. The Operating Advisor will be subject to termination if holders of at least 15% of the aggregate voting rights of the certificates (in connection with termination and replacement relating to the Mortgage Loans) vote to terminate and replace the Operating Advisor and such vote is approved by holders of more than 50% of the applicable voting rights that exercise their right to vote (in the case of each of such vote and approval, taking into account realized losses and the application of any appraisal reduction amounts to notionally reduce the Certificate Balance of the certificates), provided that holders of at least 50% of the applicable voting rights have exercised their right to vote. The holders initiating such vote will be responsible for the fees and expenses in connection with the vote and replacement. An “Operating Advisor Consultation Event” will occur upon the earlier of when (i) the aggregate Certificate Balances of the HRR Certificates (taking into account the application of any Cumulative Appraisal Reduction Amounts to notionally reduce the Certificate Balances of such classes) is 25% or less of the initial aggregate Certificate Balances of the HRR Certificates or (ii) a Control Termination Event has occurred and is continuing (or a Control Termination Event would occur and be continuing if not for the second to last proviso in the definition of Control Termination Event). The Operating Advisor will not have consultation rights in respect of Non-Serviced Mortgage Loans. |
| THE INFORMATION IN THIS STRUCTURAL AND COLLATERAL TERM SHEET IS NOT COMPLETE AND MAY BE AMENDED PRIOR TO THE TIME OF SALE. THIS TERM SHEET IS NOT AN OFFER TO SELL THESE SECURITIES AND IT IS NOT A SOLICITATION OF AN OFFER TO BUY THESE SECURITIES IN ANY JURISDICTION WHERE THE OFFER OR SALE IS NOT PERMITTED. | ||
| 15 | ||
Benchmark 2024-V8 Mortgage Trust |
| STRUCTURE OVERVIEW |
| Asset Representations Reviewer: | The Asset Representations Reviewer will be required to review certain delinquent Mortgage Loans after a specified delinquency threshold has been exceeded and the required percentage of Certificateholders vote to direct a review of such delinquent Mortgage Loans. An asset review will occur when either (1) Mortgage Loans with an aggregate outstanding principal balance of 25% or more of the aggregate outstanding principal balance of all of the Mortgage Loans (including any REO loans (or a portion of any REO loan in the case of a whole loan)) held by the issuing entity as of the end of the applicable collection period are delinquent loans or (2)(A) prior to and including the second anniversary of the Closing Date, at least 10 Mortgage Loans are delinquent loans as of the end of the applicable collection period and the outstanding principal balance of such delinquent loans in the aggregate constitutes at least 15% of the aggregate outstanding principal balance of all of the Mortgage Loans (including any REO loans (or a portion of any REO loan in the case of a whole loan)) held by the issuing entity as of the end of the applicable collection period, or (B) after the second anniversary of the Closing Date, at least 15 Mortgage Loans are delinquent loans as of the end of the applicable collection period and the outstanding principal balance of such delinquent loans in the aggregate constitutes at least 20% of the aggregate outstanding principal balance of all of the Mortgage Loans (including any REO loans (or a portion of any REO loan in the case of a whole loan)) held by the issuing entity as of the end of the applicable collection period. The Asset Representations Reviewer may be terminated and replaced without cause. Upon (i) the written direction of Certificateholders evidencing not less than 25% of the voting rights (taking into account realized losses, but without regard to the application of any appraisal reduction amounts to notionally reduce the Certificate Balance of the certificates) requesting a vote to terminate and replace the Asset Representations Reviewer with a proposed successor asset representations reviewer that is an eligible asset representations reviewer, and (ii) payment by such holders to the Certificate Administrator of the reasonable fees and expenses to be incurred by the Certificate Administrator in connection with administering such vote, the Certificate Administrator will promptly provide notice to all Certificateholders and the Asset Representations Reviewer of such request by posting such notice on its internet website, and by mailing such notice to all Certificateholders and the Asset Representations Reviewer. Upon the written direction of Certificateholders evidencing at least 75% of a Certificateholder Quorum, the Trustee will terminate all of the rights and obligations of the Asset Representations Reviewer under the PSA by written notice to the Asset Representations Reviewer, and the proposed successor Asset Representations Reviewer will be appointed. See “Pooling and Servicing Agreement—The Asset Representations Reviewer” in the Preliminary Prospectus. |
| Dispute Resolution Provisions: | Each Mortgage Loan Seller will be subject to the dispute resolution provisions set forth in the PSA to the extent those provisions are triggered with respect to any Mortgage Loan sold to the depositor by such Mortgage Loan Seller and such Mortgage Loan Seller will be obligated under the related mortgage loan purchase agreement to comply with all applicable provisions and to take part in any mediation or arbitration proceedings that may result. Generally, in the event that a repurchase request as described in the Preliminary Prospectus is not “Resolved” within 180 days after the related Mortgage Loan Seller receives such Repurchase Request, then the enforcing servicer will be required to send a notice to the initial requesting Certificateholder (if any) indicating the enforcing servicer’s intended course of action with respect to the Repurchase Request. If (a) the enforcing servicer’s intended course of action with respect to the Repurchase Request does not involve pursuing further action to exercise rights against the related Mortgage Loan Seller with respect to the Repurchase Request and the initial requesting Certificateholder, if any, or any other Certificateholder or Certificate Owner wishes to exercise its right to refer the matter to mediation (including nonbinding arbitration) or arbitration, or (b) the enforcing servicer’s intended course of action is to pursue further action to exercise rights against the related Mortgage Loan Seller with respect to the Repurchase Request but the initial requesting Certificateholder, if any, or any other Certificateholder or Certificate Owner does not agree with the dispute resolution method selected by the enforcing servicer, then the initial requesting Certificateholder, if any, or such other Certificateholder or Certificate Owner may deliver a written notice to the enforcing servicer indicating its intent to exercise its right to refer the matter to either mediation or arbitration. “Resolved” means, with respect to a Repurchase Request, (i) that the related material defect or material breach has been cured, (ii) the related Mortgage Loan has been repurchased in accordance with the related mortgage loan purchase agreement, (iii) a mortgage loan has been substituted for the related Mortgage Loan in accordance with the related mortgage loan |
| THE INFORMATION IN THIS STRUCTURAL AND COLLATERAL TERM SHEET IS NOT COMPLETE AND MAY BE AMENDED PRIOR TO THE TIME OF SALE. THIS TERM SHEET IS NOT AN OFFER TO SELL THESE SECURITIES AND IT IS NOT A SOLICITATION OF AN OFFER TO BUY THESE SECURITIES IN ANY JURISDICTION WHERE THE OFFER OR SALE IS NOT PERMITTED. | ||
| 16 | ||
Benchmark 2024-V8 Mortgage Trust |
| STRUCTURE OVERVIEW |
purchase agreement, (iv) the applicable Mortgage Loan Seller made the loss of value payment, (v) a contractually binding agreement is entered into between the enforcing servicer, on behalf of the issuing entity, and the related Mortgage Loan Seller that settles the related Mortgage Loan Seller’s obligations under the related mortgage loan purchase agreement, or (vi) the related Mortgage Loan is no longer property of the issuing entity as a result of a sale or other disposition in accordance with the PSA. See “Pooling and Servicing Agreement—Dispute Resolution Provisions” in the Preliminary Prospectus. | |
| Liquidated Loan Waterfall: | On liquidation of any Mortgage Loan, all net liquidation proceeds will be applied according to the PSA, so that amounts allocated as a recovery of accrued and unpaid interest will not, in the first instance, include (a) any amount by which the interest portion of P&I Advances previously made was reduced as a result of appraisal reduction amounts and (b) Accrued AB Loan Interest. After the adjusted interest amount is so allocated, any remaining net liquidation proceeds will be allocated to pay principal on the Mortgage Loan until the unpaid principal amount of the Mortgage Loan has been reduced to zero. Any remaining liquidation proceeds would then be allocated as a recovery of (a) accrued and unpaid interest corresponding to the amount by which the interest portion of P&I Advances previously made was reduced as a result of appraisal reduction amounts and (b) any Accrued AB Loan Interest. |
| THE INFORMATION IN THIS STRUCTURAL AND COLLATERAL TERM SHEET IS NOT COMPLETE AND MAY BE AMENDED PRIOR TO THE TIME OF SALE. THIS TERM SHEET IS NOT AN OFFER TO SELL THESE SECURITIES AND IT IS NOT A SOLICITATION OF AN OFFER TO BUY THESE SECURITIES IN ANY JURISDICTION WHERE THE OFFER OR SALE IS NOT PERMITTED. | ||
| 17 | ||
Mixed Use – Office / Retail 640 5th Avenue New York, NY 10022 | Collateral Asset Summary – Loan No. 1 640 5th Avenue | Cut-off Date Balance: Cut-off Date LTV: U/W NCF DSCR: U/W NOI Debt Yield: | $97,100,000 41.7% 2.04x 18.7% |

| THE INFORMATION IN THIS STRUCTURAL AND COLLATERAL TERM SHEET IS NOT COMPLETE AND MAY BE AMENDED PRIOR TO THE TIME OF SALE. THIS TERM SHEET IS NOT AN OFFER TO SELL THESE SECURITIES AND IT IS NOT A SOLICITATION OF AN OFFER TO BUY THESE SECURITIES IN ANY JURISDICTION WHERE THE OFFER OR SALE IS NOT PERMITTED. | ||
| 18 | ||
Mixed Use – Office / Retail 640 5th Avenue New York, NY 10022 | Collateral Asset Summary – Loan No. 1 640 5th Avenue | Cut-off Date Balance: Cut-off Date LTV: U/W NCF DSCR: U/W NOI Debt Yield: | $97,100,000 41.7% 2.04x 18.7% |
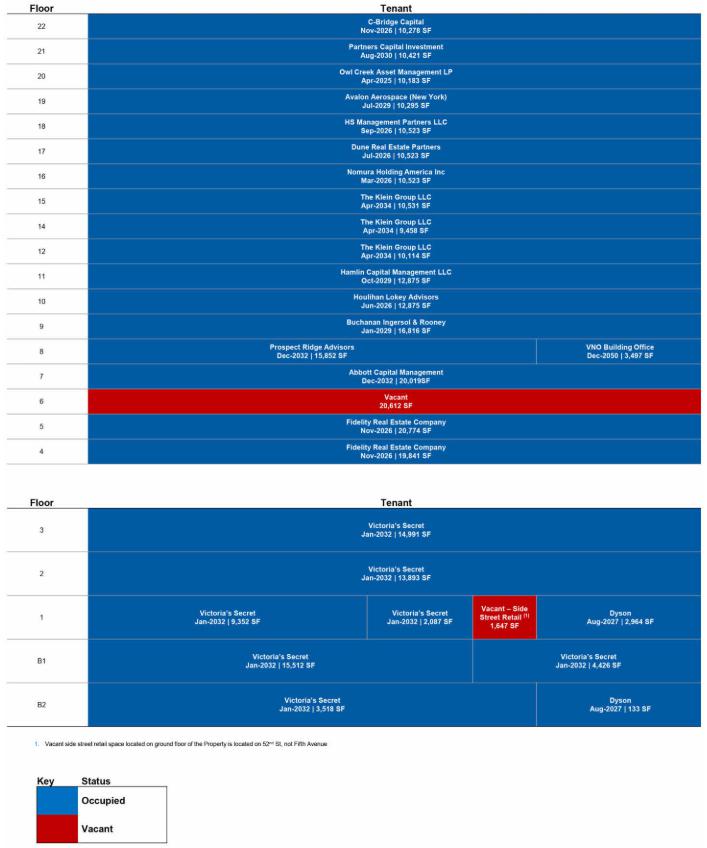
| THE INFORMATION IN THIS STRUCTURAL AND COLLATERAL TERM SHEET IS NOT COMPLETE AND MAY BE AMENDED PRIOR TO THE TIME OF SALE. THIS TERM SHEET IS NOT AN OFFER TO SELL THESE SECURITIES AND IT IS NOT A SOLICITATION OF AN OFFER TO BUY THESE SECURITIES IN ANY JURISDICTION WHERE THE OFFER OR SALE IS NOT PERMITTED. | ||
| 19 | ||
Mixed Use – Office / Retail 640 5th Avenue New York, NY 10022 | Collateral Asset Summary – Loan No. 1 640 5th Avenue | Cut-off Date Balance: Cut-off Date LTV: U/W NCF DSCR: U/W NOI Debt Yield: | $97,100,000 41.7% 2.04x 18.7% |
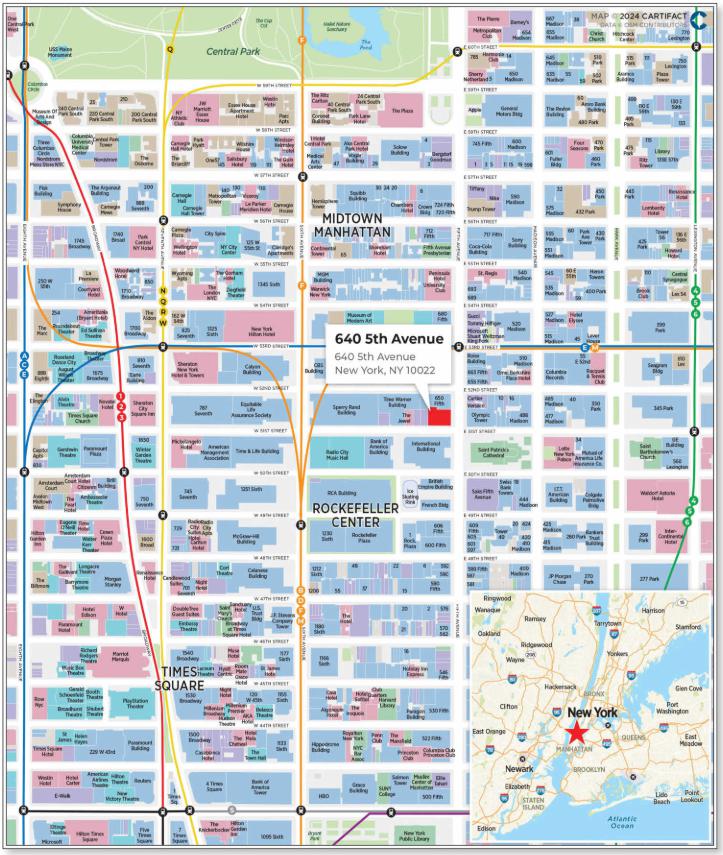
| THE INFORMATION IN THIS STRUCTURAL AND COLLATERAL TERM SHEET IS NOT COMPLETE AND MAY BE AMENDED PRIOR TO THE TIME OF SALE. THIS TERM SHEET IS NOT AN OFFER TO SELL THESE SECURITIES AND IT IS NOT A SOLICITATION OF AN OFFER TO BUY THESE SECURITIES IN ANY JURISDICTION WHERE THE OFFER OR SALE IS NOT PERMITTED. | ||
| 20 | ||
Mixed Use – Office / Retail 640 5th Avenue New York, NY 10022 | Collateral Asset Summary – Loan No. 1 640 5th Avenue | Cut-off Date Balance: Cut-off Date LTV: U/W NCF DSCR: U/W NOI Debt Yield: | $97,100,000 41.7% 2.04x 18.7% |
| Mortgage Loan Information | Property Information | |||
| Loan Seller: | GSMC, BMO | Single Asset / Portfolio: | Single Asset | |
| Loan Purpose: | Refinance | Property Type – Subtype: | Mixed Use – Office/Retail | |
| Borrower Sponsor(s): | Vornado Realty Trust | Collateral(4): | Fee / Leasehold | |
| Borrower(s): | 640 Fifth Avenue Owner LLC | Location: | New York, NY | |
| Original Balance(1): | $97,100,000 | Year Built / Renovated: | 1949 / 2003 | |
| Cut-off Date Balance(1): | $97,100,000 | Property Management: | Vornado Office Management LLC | |
| % by Initial UPB: | 9.6% | Size: | 314,533 SF | |
| Interest Rate: | 6.1293333% | Appraised Value / Per SF: | $720,000,000 / $2,289 | |
| Note Date: | June 10, 2024 | Appraisal Date: | February 28, 2024 | |
| Original Term: | 60 months | Occupancy: | 92.9% (as of January 31, 2024) | |
| Amortization: | Amortizing Balloon | UW Economic Occupancy: | 100.0% | |
| Original Amortization(5): | NAP | Underwritten NOI: | $56,185,614 | |
| Interest Only Period: | None | Underwritten NCF: | $48,532,770 | |
| First Payment Date: | August 1, 2024 | |||
| Maturity Date: | July 1, 2029 | Historical NOI | ||
| Additional Debt Type(1): | Pari Passu / Mezzanine | 2023 NOI: | $53,799,655 | |
| Additional Debt Balance(1): | $202,900,000 / $100,000,000 | 2022 NOI: | $47,771,835 | |
| Call Protection(2): | L(24),D(29),O(7) | 2021 NOI: | $48,824,168 | |
| Lockbox / Cash Management: | Hard / In Place | 2020 NOI: | $51,524,481 | |
| Reserves(3) | Financial Information(1)(5) | ||||||
| Initial | Monthly | Cap | Whole Loan | Total Debt | |||
| Taxes: | $0 | Springing | NAP | Cut-off Date Loan / SF: | $954 | $1,272 | |
| Insurance: | $0 | Springing | NAP | Maturity Date Loan / SF: | $870 | $1,160 | |
| Replacement Reserves: | $0 | Springing | $195,217 | Cut-off Date LTV: | 41.7% | 55.6% | |
| TI/LC Reserve: | $1,567,900 | $500,000 | $15,000,000 | Maturity Date LTV: | 38.0% | 50.7% | |
| Free Rent Reserve: | $1,648,112 | $0 | NAP | UW NOI DY: | 18.7% | 14.0% | |
| UW NCF DSCR: | 2.04x | 1.31x | |||||
| Sources and Uses | ||||||||
| Sources | Proceeds | % of Total | Uses | Proceeds | % of Total | |||
| Whole Loan | $300,000,000 | 59.3 | % | Loan Payoff | $501,608,063 | 99.1 | % | |
| Equity Contribution | 106,245,190 | 21.0 | Upfront Reserves | 3,216,012 | 0.6 | |||
| Mezzanine Loan Amount | 100,000,000 | 19.8 | Closing Costs | 1,421,115 | 0.3 | |||
| Total Sources | $506,245,190 | 100.0 | % | Total Uses | $506,245,190 | 100.0 | % | |
| (1) | The 640 5th Avenue Mortgage Loan (as defined below) is part of a whole loan evidenced by 10 pari passu notes with an aggregate outstanding principal balance as of the Cut-off Date of $300.0 million (the “640 5th Avenue Whole Loan”). The Financial Information in the chart above reflects the Cut-off Date Balance of the 640 5th Avenue Whole Loan and of the 640 5th Avenue Total Debt (as defined below) inclusive of a $100,000,000 mezzanine loan, respectively. |
| (2) | The lockout period for prepayment of the 640 5th Avenue Whole Loan will be at least 24 months beginning with and including the first payment date on August 1, 2024; provided that partial prepayment to resize the 640 5th Avenue Whole Loan to satisfy certain debt yield requirements are permitted during the whole loan term with the payment of the applicable yield maintenance payment. Defeasance of the 640 5th Avenue Whole Loan, in whole but not in part, is permitted after the date that is the earlier of (i) two years from the closing date of the securitization that includes the last note to be securitized and (ii) August 1, 2027. The assumed lockout period of 24 payments is based on the anticipated closing date of the Benchmark 2024-V8 securitization in July 2024. The actual lockout period may be longer. |
| (3) | See “Initial and Ongoing Reserves” below. |
| (4) | A prior owner of the 640 5th Avenue Property ground leased the 640 5th Avenue Property to the owner of the property located at 650 5th Avenue (the “Air Rights Tenant”), who subleased the 640 5th Avenue Property (other than development rights relating to one of the two buildings comprising the 640 5th Avenue Property, which was retained by the Air Rights Tenant) back to such prior owner of the 640 5th Avenue Property, solely for purposes of satisfying certain zoning requirements in connection with the transfer of such development rights to the Air Rights Tenant, as further described under “Description of the Mortgage Pool—Mortgage Pool Characteristics—Fee & Leasehold Estates; Ground Leases” in the Preliminary Prospectus. |
| (5) | The 640 5th Avenue Whole Loan and the 640 5th Avenue Mezzanine Loan (as defined below) have fixed amortization for their entire 60-month loan terms. With respect to the 640 5th Avenue Whole Loan, the borrower is required to make payments on each monthly payment date, as follows: (x) principal in the amount of $437,500 and (y) the monthly interest payment. With respect to the 640 5th Avenue Mezzanine Loan, the mezzanine borrower is required to make payments on each monthly payment date as follows: (x) principal in the amount of approximately $145,833 and (y) the monthly interest payment. |
| THE INFORMATION IN THIS STRUCTURAL AND COLLATERAL TERM SHEET IS NOT COMPLETE AND MAY BE AMENDED PRIOR TO THE TIME OF SALE. THIS TERM SHEET IS NOT AN OFFER TO SELL THESE SECURITIES AND IT IS NOT A SOLICITATION OF AN OFFER TO BUY THESE SECURITIES IN ANY JURISDICTION WHERE THE OFFER OR SALE IS NOT PERMITTED. | ||
| 21 | ||
Mixed Use – Office / Retail 640 5th Avenue New York, NY 10022 | Collateral Asset Summary – Loan No. 1 640 5th Avenue | Cut-off Date Balance: Cut-off Date LTV: U/W NCF DSCR: U/W NOI Debt Yield: | $97,100,000 41.7% 2.04x 18.7% |
The Loan. The largest mortgage loan (the “640 5th Avenue Mortgage Loan”) is part of a whole loan (the “640 5th Avenue Whole Loan”) secured by the borrower’s fee and leasehold interest in a 314,533 SF mixed-use property comprised of two abutting and interconnected buildings facing Fifth Avenue and West 52nd Street (other than development rights relating to the West 52nd Street building), respectively, in New York, New York (the “640 5th Avenue Property”). The 640 5th Avenue Whole Loan is comprised of 10 pari passu notes, with an aggregate outstanding principal balance as of the Cut-off Date of $300,000,000. The 640 5th Avenue Mortgage Loan, which is evidenced by the non-controlling Note A-5, Note A-9 and Note A-10, has an aggregate outstanding principal balance as of the Cut-off Date of $97,100,000. The 640 5th Avenue Whole Loan was originated by Goldman Sachs Bank USA (“GSBI”), Bank of Montreal (“BMO”) and Morgan Stanley Bank, N.A. (“MSBNA”) and has an aggregate outstanding principal balance as of the Cut-off Date of $300,000,000. GSMC is selling Note A-5 in the outstanding principal balance of $69,600,000 as of the Cut-off Date and BMO is selling Notes A-9 and A-10 in the aggregate outstanding principal balance of $27,500,000 as of the Cut-off Date. The 640 5th Avenue Whole Loan has fixed amortization, as described below, for the entire term and accrues interest on an Actual/360 basis. The borrower is required to make payments on each monthly payment date for the 640 5th Avenue Whole Loan as follows: (x) principal in the amount of $437,500 and (y) the monthly interest payment.
A prior owner of the 640 5th Avenue Property ground leased the 640 5th Avenue Property to the Air Rights Tenant, who subleased the 640 5th Avenue Property (other than development rights relating to the West 52nd Street building, which were retained by the Air Rights Tenant) back to such prior owner of the 640 5th Avenue Property, solely for the purpose of satisfying certain zoning requirements in connection with the transfer of such development rights to the Air Rights Tenant, as further described under “Description of the Mortgage Pool—Mortgage Pool Characteristics—Fee & Leasehold Estates; Ground Leases” in the Preliminary Prospectus.
The table below identifies the promissory notes that comprise the 640 5th Avenue Whole Loan. The relationship between the holders of the 640 5th Avenue Whole Loan is governed by a co-lender agreement as described under “Description of the Mortgage Pool—The Whole Loans—The Non-Serviced Pari Passu Whole Loans” in the Preliminary Prospectus. The 640 5th Avenue Whole Loan will be serviced pursuant to the pooling and servicing agreement for the BBCMS 2024-5C27 securitization trust until the controlling Note A-1 is securitized, whereupon the 640 5th Avenue Whole Loan will be serviced pursuant to the pooling and servicing agreement for such securitization. See “Description of the Mortgage Pool—The Whole Loans—The Non-Serviced Pari Passu Whole Loans” in the Preliminary Prospectus.
| Whole Loan Summary | ||||
| Note | Original Balance | Cut-off Date Balance | Note Holder | Controlling Piece |
| A-1(1) | $40,000,000 | $40,000,000 | MSBNA | Yes |
| A-2(1) | 37,500,000 | 37,500,000 | MSBNA | No |
| A-3(1) | 30,000,000 | 30,000,000 | MSBNA | No |
| A-4(1) | 20,000,000 | 20,000,000 | MSBNA | No |
| A-5 | 69,600,000 | 69,600,000 | Benchmark 2024-V8 | No |
| A-6(1) | 40,000,000 | 40,000,000 | GSBI | No |
| A-7(1) | 10,400,000 | 10,400,000 | GSBI | No |
| A-8 | 25,000,000 | 25,000,000 | BBCMS 2024-5C27 | No |
| A-9 | 17,500,000 | 17,500,000 | Benchmark 2024-V8 | No |
| A-10 | 10,000,000 | 10,000,000 | Benchmark 2024-V8 | No |
| Whole Loan | $300,000,000 | $300,000,000 | ||
| (1) | Expected to be contributed to one or more securitization trust(s). |
The Property. The 640 5th Avenue Property consists of both (i) a 22-story, Class A office building with multi-level retail space commonly known as 640 Fifth Avenue (the “Fifth Avenue Building”), and (ii) a two-story commercial building on the south side commonly known as 6 West 52nd Street (the “6 West 52nd Street Building”). The Fifth Avenue Building and the 6 West 52nd Street Building are interconnected and share certain paths of ingress and egress. The 640 5th Avenue Property (inclusive of the 6 West 52nd Street Building) totals 314,533 SF, which consists of 245,740 SF of office space (78.1% of NRA and 30.9% of underwritten base rent), 58,359 SF of retail space (18.6% of NRA and 67.8% of underwritten base rent) and 10,434 SF of storage space (3.3% of NRA and 1.2% of underwritten base rent). As of January 1, 2024, 91.7% of the office space (“Office NRA”) is leased to 15 tenants and 97.2% of the retail space (“Retail NRA”) and 97.4% of the storage space is leased to two tenants, Victoria’s Secret and Dyson. The Fifth Avenue Building includes retail spaces located on the first three levels of the building and office spaces on the remaining 19 levels of the building.
| THE INFORMATION IN THIS STRUCTURAL AND COLLATERAL TERM SHEET IS NOT COMPLETE AND MAY BE AMENDED PRIOR TO THE TIME OF SALE. THIS TERM SHEET IS NOT AN OFFER TO SELL THESE SECURITIES AND IT IS NOT A SOLICITATION OF AN OFFER TO BUY THESE SECURITIES IN ANY JURISDICTION WHERE THE OFFER OR SALE IS NOT PERMITTED. | ||
| 22 | ||
Mixed Use – Office / Retail 640 5th Avenue New York, NY 10022 | Collateral Asset Summary – Loan No. 1 640 5th Avenue | Cut-off Date Balance: Cut-off Date LTV: U/W NCF DSCR: U/W NOI Debt Yield: | $97,100,000 41.7% 2.04x 18.7% |
| Property Summary(1) | ||||||
| Space Type | Total SF | % Total SF | Occupancy | UW Base Rent(2) | % of UW Base Rent | UW Base Rent PSF(2)(3) |
| Office | 245,740 | 78.1% | 91.7% | $20,885,412 | 30.9% | $92.66 |
| Retail | 58,359 | 18.6% | 97.2% | $45,771,452 | 67.8% | $807.09 |
| Storage | 10,434 | 3.3% | 97.4% | $831,121 | 1.2% | $81.77 |
| Total / Wtd. Avg. | 314,533 | 100.0% | 92.9% | $67,487,985 | 100.0% | $230.91 |
| (1) | Based on the underwritten rent roll dated January 31, 2024. |
| (2) | UW Base Rent, UW Base Rent PSF and % of UW Base Rent are inclusive of contractual rent steps through June 2025. |
| (3) | UW Base Rent PSF excludes vacant space. |
The 640 5th Avenue Property has been the recipient of an Industrial and Commercial Tax Abatement (the “ICAP Tax Abatement”) that commenced on July 1, 2019 and is scheduled to end on July 1, 2029, which is set to be phased out beginning in July 2024. The ICAP Tax Abatement originally provided a 100% tax abatement of the 640 5th Avenue Property’s assessment value, which abatement amount will be reduced to 80.0% of such assessment value in July 2024, 60.0% in July 2025, 40.0% in July 2026 and 20.0% in July 2027 until termination. The total benefit from the ICAP Tax Abatement is estimated in the table below.
| ICAP Tax Abatement | ||||
| Tax Year | ICAP Year | ICAP Phase-out | ICAP Benefit | Reduction in Benefit |
| 2019/20 | 1 | 100% | $3,074,549 | $588,138 |
| 2020/21 | 2 | 100% | 3,074,549 | 588,138 |
| 2021/22 | 3 | 100% | 3,074,549 | 588,138 |
| 2022/23 | 4 | 100% | 3,074,549 | 588,138 |
| 2023/24 | 5 | 100% | 3,074,549 | 588,138 |
| 2024/25 | 6 | 80% | 2,459,639 | 470,511 |
| 2025/26 | 7 | 60% | 1,844,729 | 352,883 |
| 2026/27 | 8 | 40% | 1,229,820 | 235,255 |
| 2027/28 | 9 | 20% | 614,910 | 117,628 |
| 2028/29 | 10 | 20% | 614,910 | 117,628 |
| Total / Wtd Avg. | $22,136,752 | $4,234,597 | ||
Major Tenants. The largest tenants by underwritten base rent at the 640 5th Avenue Property are Victoria’s Secret, Dyson and The Klein Group LLC.
Victoria’s Secret (63,779 square feet; 20.3% of Total NRA; 92.1% of Retail NRA; 54.5% of underwritten base rent): Victoria’s Secret (NYSE: VSCO) is a clothing retailer specializing in selling intimate garments and undergarments. The company is the largest intimates retailer in the world and produces a range of products such as bras, panties, lingerie, swimwear and sleepwear, which are sold to customers across the United States and globally. Victoria’s Secret spun off L Brands in 2021 and reported a net income of $109 million on $6.182 billion of net sales in 2023. The 640 5th Avenue Property is the flagship location for Victoria’s Secret. Victoria’s Secret’s lease at the 640 5th Avenue Property commenced in February 2016, expires January 31, 2032 and has one, 10-year renewal option and no termination options.
Dyson (3,097 square feet; 1.0% of Total NRA; 5.1% of Retail NRA ;14.6% of underwritten base rent): Dyson is a multi-national Singapore based appliances company. Dyson produces a range of products such as vacuum cleaners, hair care, air purifiers, headphones and lighting. Dyson was founded in 1991 and employs approximately 14,000 people. Dyson’s lease at the 640 5th Avenue Property commenced in March 2017, expires August 27, 2027 and has no renewal or termination options.
The Klein Group LLC (30,103 square feet; 9.6% of Total NRA; 12.2% of Office NRA; 5.1% of underwritten base rent): The Klein Group LLC is a provider of brokerage services. The Klein Group LLC offers investment banking, trading, private placement of securities and investment advisory services. The Klein Group LLC’s lease at the 640 5th Avenue Property commenced in June 2015 and was amended in May 2019 and April 2023 to expand its leased space at the 640 5th Avenue Property. The lease is scheduled to expire on April 14, 2034, and the tenant has no renewal option. The Klein Group LLC has a two-time right to terminate its lease, effective either (i) December 31, 2027 or (ii) December 31, 2029, subject to, among other things, providing notice to the borrower no later than a year before the effective date of each such termination right, satisfaction of certain minimum occupancy and demise requirements under the lease, no event of default having occurred and continuing under the lease and the payment of a termination fee.
| THE INFORMATION IN THIS STRUCTURAL AND COLLATERAL TERM SHEET IS NOT COMPLETE AND MAY BE AMENDED PRIOR TO THE TIME OF SALE. THIS TERM SHEET IS NOT AN OFFER TO SELL THESE SECURITIES AND IT IS NOT A SOLICITATION OF AN OFFER TO BUY THESE SECURITIES IN ANY JURISDICTION WHERE THE OFFER OR SALE IS NOT PERMITTED. | ||
| 23 | ||
Mixed Use – Office / Retail 640 5th Avenue New York, NY 10022 | Collateral Asset Summary – Loan No. 1 640 5th Avenue | Cut-off Date Balance: Cut-off Date LTV: U/W NCF DSCR: U/W NOI Debt Yield: | $97,100,000 41.7% 2.04x 18.7% |
The following table presents certain information relating to the historical occupancy of the 640 5th Avenue Property:
| Historical and Current Occupancy(1) | |||
| 2021 | 2022 | 2023 | Current(2) |
| 85.8% | 93.4% | 92.6% | 92.9% |
| (1) | Historical occupancies are as of December 31 of each respective year. |
| (2) | Current Occupancy is as of January 31, 2024. |
The following table presents certain information relating to the tenants at the 640 5th Avenue Property:
| Tenant Summary(1) | ||||||||||||
| Tenant | Tenant Type | Ratings Moody’s/S&P/Fitch(2) | Net Rentable Area (SF) | % of Total NRA | UW Base Rent PSF(3) | UW Base Rent(3) | % of Total UW Base Rent(3) | Lease Expiration Date | Termination Option (Y/N) | Renewal Options | ||
| Victoria's Secret | Retail and Storage | Ba3/BB-/NR | 63,779 | 20.3 | % | $576.42 | $36,763,592 | 54.5 | % | 1/31/2032 | N | 1 x 10 Yr |
| Dyson | Retail and Storage | NR/NR/NR | 3,097 | 1.0 | $3,176.94 | 9,838,981 | 14.6 | 8/27/2027 | N | None | ||
| The Klein Group LLC(4) | Office | NR/NR/NR | 30,103 | 9.6 | $115.00 | 3,461,845 | 5.1 | 4/14/2034 | Y | None | ||
| Fidelity Real Estate Company(5) | Office | NR/NR/NR | 40,615 | 12.9 | $80.00 | 3,249,200 | 4.8 | 11/30/2026 | N | None | ||
| Houlihan Lokey Advisors(6) | Office | NR/NR/NR | 12,875 | 4.1 | $112.00 | 1,442,000 | 2.1 | 6/30/2026 | N | 1 x 5 Yr | ||
| Abbot Capital Management | Office | NR/NR/NR | 20,019 | 6.4 | $68.00 | 1,361,292 | 2.0 | 12/31/2032 | N | 1 x 5 Yr | ||
| Buchanan Ingersoll & Rooney(7) | Office | NR/NR/NR | 16,816 | 5.3 | $80.00 | 1,345,280 | 2.0 | 1/31/2029 | Y | None | ||
| Hamlin Capital Mgmt LLC | Office | NR/NR/NR | 12,875 | 4.1 | $100.00 | 1,287,500 | 1.9 | 10/31/2029 | N | None | ||
| C-Bridge Capital | Office | NR/NR/NR | 10,278 | 3.3 | $120.00 | 1,233,360 | 1.8 | 11/30/2026 | N | 1 x 5 Yr | ||
| Dune Real Estate Partners LP | Office | NR/NR/NR | 10,523 | 3.3 | $112.00 | 1,178,576 | 1.7 | 7/31/2026 | N | 1 x 5 Yr | ||
| HS Management Partners LLC | Office | NR/NR/NR | 10,523 | 3.3 | $112.00 | 1,178,576 | 1.7 | 9/30/2026 | N | None | ||
| Nomura Greentech Capital(8) | Office | NR/NR/NR | 10,523 | 3.3 | $110.00 | 1,157,530 | 1.7 | 3/31/2026 | N | 1 x 5 Yr | ||
| Prospect Ridge Advisors(9) | Office | NR/NR/NR | 15,852 | 5.0 | $73.00 | 1,157,196 | 1.7 | 12/31/2032 | Y | 1 x 5 Yr | ||
| Avolon Aerospace (New York)(10) | Office | NR/NR/NR | 10,295 | 3.3 | $101.00 | 1,039,795 | 1.5 | 7/31/2029 | N | 1 x 5 Yr | ||
| Partners Capital Investment | Office | NR/NR/NR | 10,421 | 3.3 | $90.00 | 937,890 | 1.4 | 8/31/2030 | N | 1 x 5 Yr | ||
| Owl Creek Asset Management LP | Office | NR/NR/NR | 10,183 | 3.2 | $84.00 | 855,372 | 1.3 | 4/30/2025 | N | None | ||
| VNO Building Office | Office | NR/NR/NR | 3,497 | 1.1 | $0.00 | 0 | 0.0 | 12/31/2050 | N | None | ||
| Office/Retail Tenants | 292,274 | 92.9 | % | $230.91 | $67,487,985 | 100.0 | % | |||||
| Remaining Occupied | 0 | 0.0 | $0.00 | 0 | 0.0 | |||||||
| Total Occupied | 292,274 | 92.9 | % | $230.91 | $67,487,985 | 100.0 | % | |||||
| Vacant Space | 22,259 | 7.1 | ||||||||||
| Collateral Total | 314,533 | 100.0 | % | |||||||||
| (1) | Based on the underwritten rent roll dated January 31, 2024, with contractual rent steps through June 2025. |
| (2) | In certain instances, ratings provided are those of the parent company of the entity shown, whether or not the parent company guarantees the lease. |
| (3) | UW Base Rent, UW Base Rent PSF and % of Total UW Base Rent are inclusive of contractual rent steps underwritten through June 2025. |
| (4) | The Klein Group LLC is entitled to $1,648,112 in free rent through February 2025. At origination, the borrower deposited $1,648,112 into the free rent reserve, which will be disbursed in accordance with the schedule set forth in the related loan documents. For more details, see “Description of the Mortgage Pool” in the Preliminary Prospectus. In addition, the tenant has a two-time right to terminate its lease, effective either (i) December 31, 2027 or (ii) December 31, 2029, subject to, among other things, providing notice to the borrower no later than a year before the effective date of each such termination right, satisfaction of certain minimum occupancy and demise requirements under the lease, no event of default having occurred and continuing under the lease and the payment of a termination fee. |
| (5) | Fidelity Real Estate Company has subleased 19,841 square feet to Advisor Group in Suite 401, which commenced on October 1, 2020, is scheduled to expire on October 31, 2026 and provides for approximately $907,726 in annual rent to Fidelity Real Estate Company. |
| (6) | Houlihan Lokey Advisors has subleased all of its 12,875 square feet to Triple P Services LLC in Suite 1000, which commenced on June 7, 2023, is scheduled to expire on June 29, 2026 and provides for $965,625 in annual rent to Houlihan Lokey Advisors. |
| (7) | Buchanan Ingersoll & Rooney has a one-time right to terminate its lease, effective January 2, 2026, subject to providing notice to the borrower no later than November 8, 2024 and the payment of a termination fee. |
| (8) | Nomura Greentech Capital has subleased all of its 10,523 square feet to Kershner Trading Group in Suite 1600, which commenced on December 14, 2020, is scheduled to expire on March 30, 2026 and provides for $631,380 in annual rent to Nomura Greentech Capital. |
| (9) | Prospect Ridge Advisors has a one-time right to terminate its lease effective December 31, 2029, subject to providing notice to the borrower no later than October 7, 2028 and payment of a termination fee. |
| (10) | Avolon Aerospace (New York) has subleased all of its 10,295 square feet to Trinet USA in Suite 1900, which commenced on September 7, 2022, is scheduled to expire on June 30, 2029 and provides for $844,190 in annual rent to Avolon Aerospace (New York). |
| THE INFORMATION IN THIS STRUCTURAL AND COLLATERAL TERM SHEET IS NOT COMPLETE AND MAY BE AMENDED PRIOR TO THE TIME OF SALE. THIS TERM SHEET IS NOT AN OFFER TO SELL THESE SECURITIES AND IT IS NOT A SOLICITATION OF AN OFFER TO BUY THESE SECURITIES IN ANY JURISDICTION WHERE THE OFFER OR SALE IS NOT PERMITTED. | ||
| 24 | ||
Mixed Use – Office / Retail 640 5th Avenue New York, NY 10022 | Collateral Asset Summary – Loan No. 1 640 5th Avenue | Cut-off Date Balance: Cut-off Date LTV: U/W NCF DSCR: U/W NOI Debt Yield: | $97,100,000 41.7% 2.04x 18.7% |
The following table presents certain information relating to the tenant lease expirations at the 640 5th Avenue Property:
| Lease Rollover Schedule(1)(2)(3) | ||||||||||||||||
| Year | Number of Leases Expiring | Net Rentable Area Expiring | % of NRA Expiring | UW Base Rent Expiring(4) | % of UW Base Rent Expiring(4) | Cumulative Net Rentable Area Expiring | Cumulative % of NRA Expiring | Cumulative UW Base Rent Expiring(4) | Cumulative % of UW Base Rent Expiring(4) | |||||||
| MTM | 2 | 0 | 0.0 | % | $0 | 0.0 | % | 0 | 0.0% | $0 | 0.0% | |||||
| 2024 | 2 | 0 | 0.0 | 0 | 0.0 | 0 | 0.0% | $0 | 0.0% | |||||||
| 2025 | 1 | 10,183 | 3.2 | 855,372 | 1.3 | 10,183 | 3.2% | $855,372 | 1.3% | |||||||
| 2026 | 8 | 95,337 | 30.3 | 9,439,242 | 14.0 | 105,520 | 33.5% | $10,294,614 | 15.3% | |||||||
| 2027 | 1 | 3,097 | 1.0 | 9,838,981 | 14.6 | 108,617 | 34.5% | $20,133,595 | 29.8% | |||||||
| 2028 | 1 | 0 | 0.0 | 0 | 0.0 | 108,617 | 34.5% | $20,133,595 | 29.8% | |||||||
| 2029 | 3 | 39,986 | 12.7 | 3,672,575 | 5.4 | 148,603 | 47.2% | $23,806,170 | 35.3% | |||||||
| 2030 | 1 | 10,421 | 3.3 | 937,890 | 1.4 | 159,024 | 50.6% | $24,744,060 | 36.7% | |||||||
| 2031 | 0 | 0 | 0.0 | 0 | 0.0 | 159,024 | 50.6% | $24,744,060 | 36.7% | |||||||
| 2032 | 3 | 99,650 | 31.7 | 39,282,080 | 58.2 | 258,674 | 82.2% | $64,026,140 | 94.9% | |||||||
| 2033 | 0 | 0 | 0.0 | 0 | 0.0 | 258,674 | 82.2% | $64,026,140 | 94.9% | |||||||
| 2034 | 1 | 30,103 | 9.6 | 3,461,845 | 5.1 | 288,777 | 91.8% | $67,487,985 | 100.0% | |||||||
| 2035 & Beyond | 1 | 3,497 | 1.1 | 0 | 0.0 | 292,274 | 92.9% | $67,487,985 | 100.0% | |||||||
| Vacant | NAP | 22,259 | 7.1 | NAP | NAP | 314,533 | 100.0% | NAP | NAP | |||||||
| Total / Wtd. Avg. | 24(5) | 314,533 | 100.0 | % | $67,487,985 | 100.0 | % | |||||||||
| (1) | Based on the underwritten rent roll dated January 31, 2024. |
| (2) | Lease Rollover Schedule is based on the lease expiration dates of all direct leases in place. Certain tenants have more than one lease. |
| (3) | Certain tenants may have termination or contraction options (which may become exercisable prior to the originally stated expiration date of the tenant lease) that are not considered in the above Lease Rollover Schedule. |
| (4) | UW Base Rent Expiring, % of UW Base Rent Expiring, Cumulative UW Base Rent Expiring and Cumulative % of UW Base Rent Expiring are inclusive of contractual rent steps underwritten through June 2025. |
| (5) | The number of expiring leases includes 15 office tenants, two retail/storage tenants and seven other tenants, and excludes the Air Rights Lease (as defined below). No net rentable area or underwritten base rent is attributable to other tenants. |
| THE INFORMATION IN THIS STRUCTURAL AND COLLATERAL TERM SHEET IS NOT COMPLETE AND MAY BE AMENDED PRIOR TO THE TIME OF SALE. THIS TERM SHEET IS NOT AN OFFER TO SELL THESE SECURITIES AND IT IS NOT A SOLICITATION OF AN OFFER TO BUY THESE SECURITIES IN ANY JURISDICTION WHERE THE OFFER OR SALE IS NOT PERMITTED. | ||
| 25 | ||
Mixed Use – Office / Retail 640 5th Avenue New York, NY 10022 | Collateral Asset Summary – Loan No. 1 640 5th Avenue | Cut-off Date Balance: Cut-off Date LTV: U/W NCF DSCR: U/W NOI Debt Yield: | $97,100,000 41.7% 2.04x 18.7% |
The following table presents certain information relating to the operating history and underwritten net cash flow of the 640 5th Avenue Property:
| Operating History and Underwritten Net Cash Flow(1) | ||||||||||
| 2019 | 2020 | 2021 | 2022 | 2023 | Underwritten | Per Square Foot | %(2) | |||
| Base Rent | $60,784,545 | $61,607,022 | $59,918,692 | $61,922,806 | $64,089,076 | $65,997,448 | $209.83 | 85.2 | % | |
| Free Rent | (1,626,528) | 0 | (334,847) | (2,247,718) | (730,003) | 0 | $0.00 | 0.0 | ||
| Percentage Rent | (73,405) | 0 | 0 | 0 | 0 | 0 | $0.00 | 0.0 | ||
| Rent Steps | 0 | 0 | 0 | 0 | 0 | 1,490,537 | $4.74 | 1.9 | ||
| Recovery Income | 4,318,055 | 5,394,737 | 5,869,822 | 6,714,695 | 7,448,692 | 8,824,722 | $28.06 | 11.4 | ||
| Other Income(3) | 1,189,908 | 1,200,647 | 1,197,940 | 1,181,296 | 1,229,121 | 1,166,319 | $3.71 | 1.5 | ||
| Gross Potential Rent | $64,592,575 | $68,202,405 | $66,651,606 | $67,571,078 | $72,036,886 | $77,479,026 | $246.33 | 100.0 | % | |
| (Vacancy/Credit Loss/Abatements) | 0 | (1,465) | 0 | 0 | 0 | 0 | $0.00 | 0.0 | ||
| Effective Gross Income | $64,592,575 | $68,200,940 | $66,651,606 | $67,571,078 | $72,036,886 | $77,479,026 | $246.33 | 100.0 | % | |
| Total Expenses(4) | 16,729,042 | 16,676,459 | 17,827,438 | 19,799,244 | 18,237,231 | 21,293,412 | $67.70 | 27.5 | ||
| Net Operating Income(5)(6) | $47,863,533 | $51,524,481 | $48,824,168 | $47,771,835 | $53,799,655 | $56,185,614 | $178.63 | 72.5 | % | |
| Capital Expenditures | 0 | 0 | 0 | 0 | 0 | 78,633 | $0.25 | 0.1 | ||
| TI/LC | 0 | 0 | 0 | 0 | 0 | 7,574,210 | $24.08 | 9.8 | ||
| Net Cash Flow | $47,863,533 | $51,524,481 | $48,824,168 | $47,771,835 | $53,799,655 | $48,532,770 | $154.30 | 62.6 | % | |
| (1) | Based on the underwritten rent roll dated January 31, 2024, with contractual rent steps through June 2025. |
| (2) | % column represents percent of Gross Potential Rent for revenue lines and percent of Effective Gross Income for all remaining fields. |
| (3) | Other Income is based on the borrower’s 2024 budget and is largely comprised of the Air Rights Lease income paid in the form of a fixed annual lease payment to the borrower from the adjacent building. Income from the Air Rights Lease as of the end of 2023 was approximately $1.2 million. |
| (4) | Tax benefits from the ICAP Tax Abatement were underwritten based on the borrower-provided ICAP tax abatement schedule. |
| (5) | The 640 5th Avenue Property receives an annual fixed rent payment from the Air Rights Tenant (the fee owner of the real property known as 650 Fifth Avenue), pursuant to the related ground leases (collectively, the “Air Rights Lease”) that expire on July 30, 2070. The annual rent from the Air Rights Lease as of July 1, 2024 is $1,166,319 per annum, payable monthly in installments of $97,193.25. Annual rent must reset as of August 1, 2024 and must be in an amount equal to the greater of the rental rate for the prior period (i.e., $1,166,319 per annum) or an amount equal to 1.6065% of the fair value of the land as determined by a qualified, third-party appraisal (the “Appraised Rental”) which valuation is required to be as of February 1, 2024. As of the date of the loan agreement, the borrower and the Air Rights Tenant are in continuing negotiations regarding the amount of the Appraised Rental, provided, however, that such amount may not be no lower than the rental rate for the prior period (i.e., $1,166,319 per annum). If the Appraised Rental is not finalized by August 1, 2024, the Air Rights Tenant will be required to continue to pay rent at the prior rental rate (i.e., $1,166,319 per annum), and upon determination of the Appraised Rental (assuming such rate is higher than the rental rate for the prior period), the Air Rights Tenant will pay the difference between the Appraised Rental and the rent paid on account for all months elapsed theretofore on the first day of the month following such determination. Upon resolution of the final rental rate, such rental rate will remain in effect through July 31, 2047, at which time the rental rate will again be the greater of the rental for the prior period or 1.6065% of the fair value of the land. |
| (6) | Base rent for two of the retail suites is above market. Based on the appraiser’s market rents for these two suites, the Underwritten Net Operating Income would be approximately $46,959,997. The 640 5th Avenue Whole Loan underwritten NOI Debt Yield would decrease from 18.7% to 15.7% and the underwritten NOI Debt Service Coverage Ratio would decrease from 2.37x to 1.98x. |
Environmental. According to the Phase I environmental assessment dated April 17, 2024, there was no evidence of any recognized environmental conditions at the 640 5th Avenue Property.
Appraisal. According to the appraisal dated May 7, 2024, the 640 5th Avenue Property had an “As-Is” appraised value of $720,000,000 as of February 28, 2024.
| Property | Appraised Value(1) | Capitalization Rate(1) |
| 640 5th Avenue | $720,000,000 | 5.75% |
| (1) | Source: Appraisal. |
The Market. The 640 5th Avenue Property is located in New York, New York, more specifically in the Manhattan retail market. The Manhattan retail market has regressed since the pandemic, but not as strongly as the office market. The retail market is driven by Manhattan’s pedestrians and tourists. According to the appraisal, New York City expects to welcome 63.2 million visitors in 2023, and total city visitors will surpass 2019 levels by 2024. The 640 5th Avenue Property is situated on upper Fifth Avenue, one of the most well-known retail areas in the United States. Notable features in the proximate area of the 640 5th Avenue Property include Rockefeller Center, 4.7 million square feet of Class A office space, the New York Public Library, a Ritz-Carlton hotel and conference center, central park and luxury residential buildings. As of the fourth quarter of 2023, total leasing velocity in the market increased 6.6% year-over-year with an average annual leasing velocity of 2.9 million square feet. The 640 5th Avenue Property is also located in the Manhattan office market, which has been practically brought to a halt since March 2020. According to the appraisal, as of the fourth quarter of 2023, the Manhattan office vacancy rate reached 12.8% with an availability rate of 18.5%. According to the appraisal, the 2023 total population within a 0.25-, 0.5- and one-mile radii of the 640 5th Avenue Property was 1,772, 25,066 and 200,725, respectively, and the 2023 median household income within the same radii was $129,959, $135,306 and $124,189, respectively.
| THE INFORMATION IN THIS STRUCTURAL AND COLLATERAL TERM SHEET IS NOT COMPLETE AND MAY BE AMENDED PRIOR TO THE TIME OF SALE. THIS TERM SHEET IS NOT AN OFFER TO SELL THESE SECURITIES AND IT IS NOT A SOLICITATION OF AN OFFER TO BUY THESE SECURITIES IN ANY JURISDICTION WHERE THE OFFER OR SALE IS NOT PERMITTED. | ||
| 26 | ||
Mixed Use – Office / Retail 640 5th Avenue New York, NY 10022 | Collateral Asset Summary – Loan No. 1 640 5th Avenue | Cut-off Date Balance: Cut-off Date LTV: U/W NCF DSCR: U/W NOI Debt Yield: | $97,100,000 41.7% 2.04x 18.7% |
According to a third-party report, the 640 5th Avenue Property is located in the Fifth Avenue retail submarket, ranging from Saks Fifth Avenue (East 50th Street) to the GM Building (East 60th Street). According to the appraisal, this area is identified as one of the top five most expensive retail corridors in the world. As of the fourth quarter of 2023, the Fifth Avenue retail submarket had an availability rate of 17.1%, which is consistent with the previous quarter. The average asking rent was $1,201 per square foot, a decrease over the asking rent of $1,345 per square foot from the previous quarter.
According to a third-party report, the 640 5th Avenue Property is located in the Plaza District office submarket. As of the fourth quarter of 2023, the Plaza District office submarket had an inventory of 26.2 million square feet with a 13.6% vacancy rate. The average asking rent was $111.15 per square foot, an increase over the asking rent of $95.83 per square foot from the previous year.
The following table presents certain information relating to comparable retail leases for the 640 5th Avenue Property:
| Comparable Retail Rental Summary(1) | |||||||
| Property / Location | Year Built / Renovated | Gross Building Area (SF) | Tenant Size (SF) | Tenant Name | Annual Base Rent PSF | Commencement | Lease Term (Months) |
| 640 5th Avenue New York, NY | 1949 / 2003 | 314,533(2) | 63,779(2) | Victoria’s Secret | $576.42(2) | Feb-16(2) | 192(2) |
| 691 Madison Avenue New York, NY | NAV | NAV | 23,339 | Dolce & Gabanna | $514.16 | Q4-23 | 180.0 |
| 693 Fifth Avenue New York, NY | NAV | NAV | 14,761 | Burberry | $372.60 | Q1-23 | 20.0 |
| 690 Madison Avenue New York, NY | NAV | NAV | 7,848 | Van Cleef and Arpels | $573.39 | Q1-23 | 120.0 |
| 140 West 57th Street New York, NY | NAV | NAV | 15,482 | Morton Williams | $108.15 | Q3-22 | 180.0 |
| 645 Fifth Avenue New York, NY | NAV | NAV | 2,320 | Tag Heuer | $1,185.34 | Q3-22 | 132.0 |
| 680 Fifth Avenue New York, NY | NAV | NAV | 14,000 | Swarovski | $500.00 | Q1-22 | 132.0 |
| 144 West 46th Street New York, NY | NAV | NAV | 4,500 | Gossip Bar | $93.33 | Q3-21 | 144.0 |
| 660 Fifth Avenue New York, NY | NAV | NAV | 8,071 | Citibank (Side Street) | $164.75 | Q1-21 | 123.0 |
| 721-725 Fifth Avenue New York, NY | NAV | NAV | 48,167 | Gucci | $519.03 | Q1-21 | 84.0 |
| 730 Fifth Avenue New York, NY | NAV | NAV | 2,808 4,505 | Chopard Mikimoto | $1,673.79 $958.94 | Q3-20 Q2-19 | 120.0 120.0 |
| 685 Fifth Avenue New York, NY | NAV | NAV | 896 | Tag Heuer | $3,000.00 | Q1-20 | 36.0 |
| (1) | Information obtained from the appraisal unless otherwise indicated. |
| (2) | Based on the underwritten rent roll dated January 31, 2024. Annual Base Rent PSF includes contractual rent steps through June 2025. |
| THE INFORMATION IN THIS STRUCTURAL AND COLLATERAL TERM SHEET IS NOT COMPLETE AND MAY BE AMENDED PRIOR TO THE TIME OF SALE. THIS TERM SHEET IS NOT AN OFFER TO SELL THESE SECURITIES AND IT IS NOT A SOLICITATION OF AN OFFER TO BUY THESE SECURITIES IN ANY JURISDICTION WHERE THE OFFER OR SALE IS NOT PERMITTED. | ||
| 27 | ||
Mixed Use – Office / Retail 640 5th Avenue New York, NY 10022 | Collateral Asset Summary – Loan No. 1 640 5th Avenue | Cut-off Date Balance: Cut-off Date LTV: U/W NCF DSCR: U/W NOI Debt Yield: | $97,100,000 41.7% 2.04x 18.7% |
The following table presents certain information relating to comparable office leases for the 640 5th Avenue Property:
| Comparable Office Rental Summary(1) | |||||||
| Property Address/Location | Year Built / Renovated | Gross Building Area (SF) | Tenant Size (SF) | Tenant Name | Annual Base Rent PSF | Commencement | Lease Term (Months) |
| 640 5th Avenue New York, NY | 1949 / 2003 | 314,533(2) | 40,615(2) | Fidelity Real Estate Company | $80.00(2) | Dec-16(2) | 120.0(2) |
| 745 Fifth Avenue New York, NY | 1930 / 1989 | 535,451 | 11,227 12,400 12,307 | Fundamental Advisors Hakluyt and Company Hildred Capital | $105.45 $95.91 $69.31 | Feb-24 Dec-23 Jul-23 | 130.0 135.0 132.0 |
| 360 Madison Avenue New York, NY | 1981 / 2002 | 373,000 | 14,883 | Vestwell | $64.38 | Nov-23 | 135.0 |
| 40 West 57th Street New York, NY | 1972 / NAP | 712,000 | 25,000 | Access Industries | $88.31 | Nov-23 | 134.0 |
| 1 Rockefeller Plaza New York, NY | 1936 / NAP | 655,350 | 19,468 | Ingalls & Synder | $66.36 | Oct-23 | 132.0 |
| 767 Fifth Avenue New York, NY | 1968 / 2019 | 1,965,003 | 15,445 48,000 38,100 | Balyasny Asset Management L.P. CVC Capital Partners Grosvenor Capital | $101.82 $87.84 $94.67 | Sep-23 Sep-23 Jun-23 | 130.0 200.0 180.0 |
| 510 Madison Avenue New York, NY | 2009 / 2012 | 355,089 | 5,891 | Granger Management Holdings LLC | $100.29 | Sep-23 | 82.0 |
| 545 Madison Avenue New York, NY | 1955 / 2021 | 153,583 | 7,000 | Helix Partners Management | $79.20 | May-23 | 60.0 |
| 595 Madison Avenue New York, NY | 1929 / 2011 | 331,000 | 13,227 | Matouk | $55.48 | Apr-23 | 120.0 |
| 590 Madison Avenue New York, NY | 1982 / 2006 | 1,049,759 | 25,030 | Schonfeld Securities, LLC | $79.52 | Mar-23 | 96.0 |
| 535 Madison Avenue New York, NY | 1982 / NAP | 548,530 | 14,875 | The Lanier Law Firm | $69.39 | Jan-23 | 130.0 |
| (1) | Information obtained from the appraisal unless otherwise indicated. |
| (2) | Based on the underwritten rent roll dated January 31, 2024. Annual Base Rent PSF includes contractual rent steps through June 2025. |
The Borrower and Borrower Sponsor. The borrower is 640 Fifth Avenue Owner LLC, a Delaware limited liability company structured as a single purpose, bankruptcy-remote entity, with one independent director. Legal counsel to the borrower delivered a non-consolidation opinion in connection with the origination of the 640 5th Avenue Whole Loan.
The borrower sponsor is Vornado Realty Trust (“Vornado”). Vornado is a real estate investment firm that owns and manages over 26 million SF of LEED certified buildings and received the Energy Star Partner of the Year Award, Sustained Excellence 2022. Vornado commemorated 50 years on the New York Stock Exchange in 2012 and is a member of the S&P MidCap 400. Vornado’s portfolio is concentrated on office and retail properties in New York. Vornado has 57 Manhattan operating properties consisting of approximately 20.4 million SF of office space in 30 of the properties, approximately 2.4 million SF of street retail space in 50 of the properties and 1,662 residential units in five Manhattan properties.
The non-recourse carveout guarantor is Manhattan High Street Holdings LP, a subsidiary of Vornado. The non-recourse carveout guarantor’s recourse obligations with respect to bankruptcy or insolvency related events is capped at 25% of the outstanding principal balance of the 640 5th Avenue Whole Loan, plus the lender’s enforcement costs under the guaranty, including reasonable attorneys’ fees. Additionally, recourse for losses relating to a transfer of the related mortgaged property or interests in the borrower is limited as described under “Description of the Mortgage Pool—Non-Recourse Carveout Limitations” in the Preliminary Prospectus.
Property Management. The 640 5th Avenue Property is managed by Vornado Office Management LLC, a borrower sponsor affiliate.
| THE INFORMATION IN THIS STRUCTURAL AND COLLATERAL TERM SHEET IS NOT COMPLETE AND MAY BE AMENDED PRIOR TO THE TIME OF SALE. THIS TERM SHEET IS NOT AN OFFER TO SELL THESE SECURITIES AND IT IS NOT A SOLICITATION OF AN OFFER TO BUY THESE SECURITIES IN ANY JURISDICTION WHERE THE OFFER OR SALE IS NOT PERMITTED. | ||
| 28 | ||
Mixed Use – Office / Retail 640 5th Avenue New York, NY 10022 | Collateral Asset Summary – Loan No. 1 640 5th Avenue | Cut-off Date Balance: Cut-off Date LTV: U/W NCF DSCR: U/W NOI Debt Yield: | $97,100,000 41.7% 2.04x 18.7% |
Initial and Ongoing Reserves. At origination of the 640 5th Avenue Whole Loan, the borrower deposited $1,567,900 for tenant improvements and leasing commissions and approximately $1,648,112 for free rent reserves.
Tax Escrows – On a monthly basis during a Trigger Period (as defined below), the borrower is required to escrow 1/12th of the estimated annual real estate tax payments.
Insurance Escrows – On a monthly basis during a Trigger Period, the borrower is required to escrow 1/12th of the annual estimated insurance payments. Such reserve has been conditionally waived so long as the borrower maintains a blanket policy meeting the requirements of the 640 5th Avenue Whole Loan documents and the borrower provides evidence of the renewal of any insurance policy prior to the expiration thereof and receipts for the payment of the applicable premiums.
Replacement Reserve – On a monthly basis during a Trigger Period, the borrower is required to escrow approximately $8,134 for the payment or reimbursement of approved capital expenses. Such monthly deposits will not be required during such time that the balance of the capital expense reserve exceeds approximately $195,217.
Rollover Reserve – On a monthly basis, the borrower is required to escrow $500,000 for approved leasing expenses. Such monthly deposits will not be required during such time that the balance of the capital expense reserve exceeds approximately $15,000,000.
Free Rent Reserve – Provided that no event of default exists, on each monthly payment date, the free rent funds deposited for each applicable lease will be disbursed in the amounts equal to the applicable monthly rent credits or free rent amounts set forth in the 640 5th Avenue Whole Loan documents.
Lockbox / Cash Management. The 640 5th Avenue Whole Loan is structured with a hard lockbox and in-place cash management. The borrower was required to deliver tenant direction letters to the existing tenants at the 640 5th Avenue Property, directing them to remit their rent directly to the lender-controlled lockbox. The borrower is required to cause revenue received by the borrower or the property manager, as applicable, from the 640 5th Avenue Property to be deposited into such lockbox within 10 business days. All funds in the lockbox account are required to be swept each business day into the lender-controlled cash management account and applied and disbursed in accordance with the 640 5th Avenue Whole Loan documents. All excess cash flow will be deposited, (A) provided no Trigger Period is continuing (i) for so long as the 640 5th Avenue Mezzanine Loan remains outstanding, into the 640 5th Avenue Mezzanine Loan subaccount, or (ii) following the repayment in full of the 640 5th Avenue Mezzanine Loan, into the borrower’s account, or (B) during the continuance of a Trigger Period, into the excess cash trap subaccount held by the lender.
A “Trigger Period” means a period commencing upon the earliest to occur of (i) an event of default under the 640 5th Avenue Whole Loan or the 640 5th Avenue Mezzanine Loan, (ii) a Low Debt Yield Trigger Period (as defined below) or (iii) a Victoria’s Secret Event Period (as defined below), and ending if, with respect to a Trigger Period continuing pursuant to (A) clause (i), the event of default commencing the Trigger Period has been cured or waived and such cure has been accepted by the applicable lender or the applicable lender has waived such event of default in writing, and no other event of default is then continuing, (B) clause (ii), the Low Debt Yield Trigger Period has ended and (C) clause (iii), such Victoria’s Secret Event Period has ended.
A “Low Debt Yield Trigger Period” means a period commencing if, as of the last day of any calendar quarter, the NOI Debt Yield (as defined below) is less than 10.0%, and ending if the NOI Debt Yield is equal to or in excess of 10.0% on any subsequent calculation date; provided, however, that a Low Debt Yield Trigger Period will be deemed not to exist as of such related calculation date if, not later than 15 business days after the borrower’s receipt of notice from the lender that a Low Debt Yield Trigger Period has commenced, the borrower (a) prepays a portion of the 640 5th Avenue Whole Loan, along with any yield maintenance premium, and the 640 5th Avenue Mezzanine Loan in accordance with the terms of the 640 5th Avenue Mezzanine Loan documents, which amount will be applied, in each case, on a pro rata basis to the 640 5th Avenue Whole Loan and the 640 5th Avenue Mezzanine Loan, or (b) delivers to the lender as additional collateral for the 640 5th Avenue Whole Loan, either (i) cash, which must be deposited into, or retained in, the cash collateral account, or (ii) a letter of credit in lieu of cash, in each case, in an amount equal to the Low Debt Yield Avoidance Amount (as defined below). If the borrower delivers to the lender such Low Debt Yield Avoidance Collateral (as defined below), then for so long as the lender holds such Low Debt Yield Avoidance Collateral, the NOI Debt Yield will be calculated based on the assumption that the outstanding principal balance of the 640 5th Avenue Whole Loan has been reduced by the value of the Low Debt Yield Avoidance Collateral, such value being the amount of cash or notional amount of any letter of credit.
The “NOI Debt Yield” means, as of any date of determination, a fraction, expressed as a percentage, of which (a) the numerator is the underwritten net operating income as of such date; and (b) the denominator is the sum of the outstanding principal balances, as of such date, of (A) the 640 5th Avenue Whole Loan and (B) the 640 5th Avenue Mezzanine Loan.
A “Low Debt Yield Avoidance Amount” means, at any point in time, the amount that when applied on a pro rata basis to the reduction of the then-current outstanding principal balance of the 640 5th Avenue Whole Loan and the then-current outstanding principal balance of the 640 5th Avenue Mezzanine Loan would cause the NOI Debt Yield to equal at least 10.0%, taking into account the aggregate amount of Low Debt Yield Avoidance Collateral previously provided by the borrower and then held by the lender.
| THE INFORMATION IN THIS STRUCTURAL AND COLLATERAL TERM SHEET IS NOT COMPLETE AND MAY BE AMENDED PRIOR TO THE TIME OF SALE. THIS TERM SHEET IS NOT AN OFFER TO SELL THESE SECURITIES AND IT IS NOT A SOLICITATION OF AN OFFER TO BUY THESE SECURITIES IN ANY JURISDICTION WHERE THE OFFER OR SALE IS NOT PERMITTED. | ||
| 29 | ||
Mixed Use – Office / Retail 640 5th Avenue New York, NY 10022 | Collateral Asset Summary – Loan No. 1 640 5th Avenue | Cut-off Date Balance: Cut-off Date LTV: U/W NCF DSCR: U/W NOI Debt Yield: | $97,100,000 41.7% 2.04x 18.7% |
“Low Debt Yield Avoidance Collateral” means (i) cash or (ii) a letter of credit in lieu of cash, in each case, in an amount equal to the Low Debt Yield Avoidance Amount.
A ”Victoria’s Secret Event Period” will (i) commence upon the occurrence, as applicable, of (x) a bankruptcy or other insolvency proceeding, whether voluntary or involuntary, with respect to the Victoria’s Secret tenant or any guarantor of the Victoria’s Secret lease, or (y) the Victoria’s Secret tenant discontinues normal business operations at the Victoria’s Secret leased space, other than a temporary cessation of business operations for permitted alterations, renovations, necessary repairs or restoration following casualty, provided that in any such case the Victoria’s Secret tenant continues to pay all contractual rent, and (ii) will end upon the first to occur of (a) in the event the Victoria’s Secret Event Period commenced due to a bankruptcy or other insolvency proceeding, the affirmation of the Victoria’s Secret lease in such applicable proceeding, provided that the Victoria’s Secret tenant is actually paying all rents and other amounts due under the Victoria’s Secret lease, (b) in the event the Victoria’s Secret Event Period commenced due to a vacancy at the Victoria’s Secret leased space, the Victoria’s Secret tenant re-commences normal business operations at the Victoria’s Secret leased space in accordance with the terms and conditions of the Victoria’s Secret lease and (c) the date on which the entirety of the Victoria’s Secret space is leased to one or more replacement tenants that are acceptable to the lender.
Current Mezzanine or Secured Subordinate Indebtedness. Concurrently with the origination of the 640 5th Avenue Whole Loan, a $100,000,000 mezzanine loan (the “640 5th Avenue Mezzanine Loan” and together with the 640 5th Avenue Whole Loan, the “640 5th Avenue Total Debt”) was funded by MSBNA and GSBI, which is secured by the mezzanine borrower’s direct equity interests in the borrower. The mezzanine borrower is required under the 640 5th Avenue Mezzanine Loan to make monthly payments to the Mezzanine Lenders equal to (x) principal in the amount of approximately $145,833 and (y) the monthly interest payment. The 640 5th Avenue Mezzanine Loan accrues interest at a rate of 11.50000% per annum and is coterminous with the 640 5th Avenue Whole Loan.
Permitted Future Mezzanine or Secured Subordinate Indebtedness. Not permitted.
Release of Collateral. Not permitted.
Ground Lease. A prior owner of the 640 5th Avenue Property ground leased the 640 5th Avenue Property to the Air Rights Tenant, and the Air Rights Tenant who subleased the 640 5th Avenue Property (other than development rights relating to one of the two buildings comprising the 640 5th Avenue Property, which were retained by the Air Rights Tenant) back to such prior owner of the 640 5th Avenue Property, solely for purposes of satisfying certain zoning requirements in connection with the transfer of such development rights to the Air Rights Tenant. The borrower receives an annual fixed rent payment from the Air Rights Tenant pursuant to the Air Rights Lease that expires on July 30, 2070. The annual rent from the Air Rights Lease is calculated as described in “Operating History and Underwritten Net Cash Flow” above. See “Description of the Mortgage Pool—Mortgage Pool Characteristics—Fee & Leasehold Estates; Ground Leases” in the Preliminary Prospectus.
| THE INFORMATION IN THIS STRUCTURAL AND COLLATERAL TERM SHEET IS NOT COMPLETE AND MAY BE AMENDED PRIOR TO THE TIME OF SALE. THIS TERM SHEET IS NOT AN OFFER TO SELL THESE SECURITIES AND IT IS NOT A SOLICITATION OF AN OFFER TO BUY THESE SECURITIES IN ANY JURISDICTION WHERE THE OFFER OR SALE IS NOT PERMITTED. | ||
| 30 | ||
Retail – Super Regional Mall 50 South Main Street Salt Lake City, UT 84101 | Collateral Asset Summary – Loan No. 2 City Creek Center | Cut-off Date Balance: Cut-off Date LTV: U/W NCF DSCR: U/W NOI Debt Yield: | $70,000,000 51.7% 1.79x 14.3% |

| THE INFORMATION IN THIS STRUCTURAL AND COLLATERAL TERM SHEET IS NOT COMPLETE AND MAY BE AMENDED PRIOR TO THE TIME OF SALE. THIS TERM SHEET IS NOT AN OFFER TO SELL THESE SECURITIES AND IT IS NOT A SOLICITATION OF AN OFFER TO BUY THESE SECURITIES IN ANY JURISDICTION WHERE THE OFFER OR SALE IS NOT PERMITTED. | ||
| 31 | ||
Retail – Super Regional Mall 50 South Main Street Salt Lake City, UT 84101 | Collateral Asset Summary – Loan No. 2 City Creek Center | Cut-off Date Balance: Cut-off Date LTV: U/W NCF DSCR: U/W NOI Debt Yield: | $70,000,000 51.7% 1.79x 14.3% |
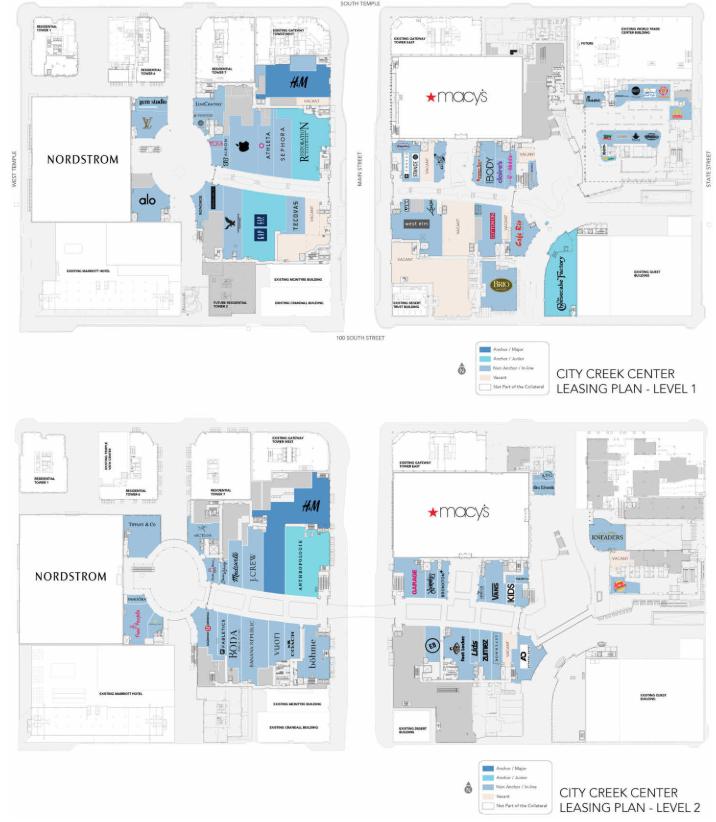
| THE INFORMATION IN THIS STRUCTURAL AND COLLATERAL TERM SHEET IS NOT COMPLETE AND MAY BE AMENDED PRIOR TO THE TIME OF SALE. THIS TERM SHEET IS NOT AN OFFER TO SELL THESE SECURITIES AND IT IS NOT A SOLICITATION OF AN OFFER TO BUY THESE SECURITIES IN ANY JURISDICTION WHERE THE OFFER OR SALE IS NOT PERMITTED. | ||
| 32 | ||
Retail – Super Regional Mall 50 South Main Street Salt Lake City, UT 84101 | Collateral Asset Summary – Loan No. 2 City Creek Center | Cut-off Date Balance: Cut-off Date LTV: U/W NCF DSCR: U/W NOI Debt Yield: | $70,000,000 51.7% 1.79x 14.3% |
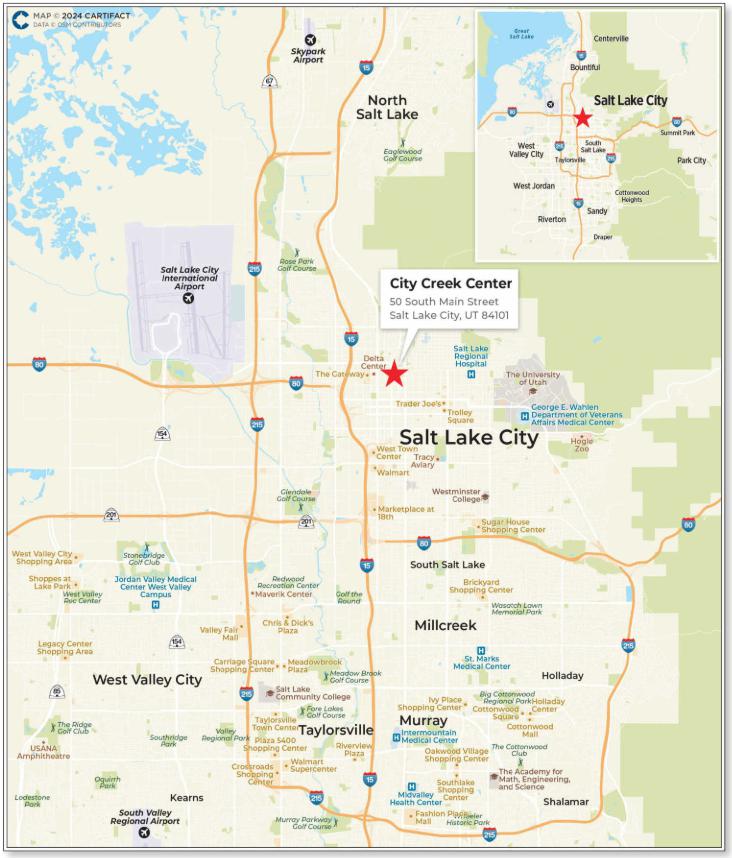
| THE INFORMATION IN THIS STRUCTURAL AND COLLATERAL TERM SHEET IS NOT COMPLETE AND MAY BE AMENDED PRIOR TO THE TIME OF SALE. THIS TERM SHEET IS NOT AN OFFER TO SELL THESE SECURITIES AND IT IS NOT A SOLICITATION OF AN OFFER TO BUY THESE SECURITIES IN ANY JURISDICTION WHERE THE OFFER OR SALE IS NOT PERMITTED. | ||
| 33 | ||
Retail – Super Regional Mall 50 South Main Street Salt Lake City, UT 84101 | Collateral Asset Summary – Loan No. 2 City Creek Center | Cut-off Date Balance: Cut-off Date LTV: U/W NCF DSCR: U/W NOI Debt Yield: | $70,000,000 51.7% 1.79x 14.3% |
| Mortgage Loan Information | Property Information | |||
| Loan Seller: | GSMC | Single Asset / Portfolio: | Single Asset | |
| Loan Purpose: | Refinance | Property Type – Subtype: | Retail – Super Regional Mall | |
| Borrower Sponsor(s)(1): | The Taubman Realty Group LLC | Collateral: | Fee / Leasehold | |
| Borrower(s): | City Creek Center Associates LLC | Location: | Salt Lake City, UT | |
| Original Balance: | $70,000,000 | Year Built / Renovated: | 2012 / NAP | |
| Cut-off Date Balance: | $70,000,000 | Property Management: | The Taubman Company LLC | |
| % by Initial UPB: | 6.9% | Size: | 325,790 SF | |
| Interest Rate: | 7.63000% | Appraised Value / Per SF: | $135,500,000 / $416 | |
| Note Date: | April 24, 2024 | Appraisal Date: | February 27, 2024 | |
| Original Term: | 60 months | Occupancy: | 85.4% (as of January 31, 2024) | |
| Amortization: | Interest Only | UW Economic Occupancy: | 90.7% | |
| Original Amortization: | NAP | Underwritten NOI(4): | $10,025,026 | |
| Interest Only Period: | 60 months | Underwritten NCF: | $9,694,708 | |
| First Payment Date: | June 1, 2024 | |||
| Maturity Date: | May 1, 2029 | Historical NOI | ||
| Additional Debt Type: | NAP | 2023 NOI(4)(5): | $8,820,338 | |
| Additional Debt Balance: | NAP | 2022 NOI(5): | $10,573,053 | |
| Call Protection: | L(26),D(27),O(7) | 2021 NOI: | $10,969,850 | |
| Lockbox / Cash Management: | Hard / Springing | 2020 NOI: | $8,972,608 | |
| Reserves(2) | Financial Information | |||||
| Initial | Monthly | Cap | Cut-off Date Loan / SF: | $215 | ||
| Taxes: | $0 | Springing | NAP | Maturity Date Loan / SF: | $215 | |
| Insurance: | $0 | Springing | NAP | Cut-off Date LTV: | 51.7% | |
| Replacement Reserves: | $0 | Springing | NAP | Maturity Date LTV: | 51.7% | |
| TI / LC: | $0 | $28,516 | $684,392 | UW NOI DY: | 14.3% | |
| Other(3): | $3,361,256 | $0 | NAP | UW NCF DSCR: | 1.79x | |
| Sources and Uses | ||||||||
| Sources | Proceeds | % of Total | Uses | Proceeds | % of Total | |||
| Mortgage Loan | $70,000,000 | 99.6 | % | Loan Payoff | $66,329,269 | 94.4 | % | |
| Equity Contribution | 246,865 | 0.4 | Reserves | 3,361,256 | 4.8 | |||
| Closing Costs | 556,341 | 0.8 | ||||||
| Total Sources | $70,246,865 | 100.0 | % | Total Uses | $70,246,865 | 100.0 | % | |
| (1) | The borrower sponsor for the City Creek Center Mortgage Loan (as defined below) is related to the borrower sponsor for the Sugarloaf Mills Mortgage Loan. |
| (2) | See “Initial and Ongoing Reserves.” |
| (3) | Other initial reserves include unfunded obligations ($2,236,955) and gap rent ($1,124,301). |
| (4) | The increase in 2023 NOI to Underwritten NOI reflects increased in-place rents, commercial reimbursement revenue and grossed-up vacant rents. |
| (5) | The decrease from 2022 NOI to 2023 NOI was primarily driven by reduced percentage-in-lieu rent and common area maintenance recoveries. |
| THE INFORMATION IN THIS STRUCTURAL AND COLLATERAL TERM SHEET IS NOT COMPLETE AND MAY BE AMENDED PRIOR TO THE TIME OF SALE. THIS TERM SHEET IS NOT AN OFFER TO SELL THESE SECURITIES AND IT IS NOT A SOLICITATION OF AN OFFER TO BUY THESE SECURITIES IN ANY JURISDICTION WHERE THE OFFER OR SALE IS NOT PERMITTED. | ||
| 34 | ||
Retail – Super Regional Mall 50 South Main Street Salt Lake City, UT 84101 | Collateral Asset Summary – Loan No. 2 City Creek Center | Cut-off Date Balance: Cut-off Date LTV: U/W NCF DSCR: U/W NOI Debt Yield: | $70,000,000 51.7% 1.79x 14.3% |
The Loan. The second largest mortgage loan (the “City Creek Center Mortgage Loan”) is secured by the borrower’s fee and leasehold interest in a 325,790 SF retail property located in Salt Lake City, Utah (the “City Creek Center Property”). The borrower owns a leasehold interest in the majority of the City Creek Center Property and a fee interest in four restaurant tenant spaces, provided fee title reverts to the ground lessor upon expiration of the ground lease. The City Creek Center Mortgage Loan has an outstanding principal balance as of the Cut-off Date of $70,000,000. The City Creek Center Mortgage Loan was originated by Goldman Sachs Bank USA. The City Creek Center Mortgage Loan has a five-year interest-only term and accrues interest at a fixed rate of 7.63000% per annum. The City Creek Center Mortgage Loan has an initial term of 60 months and has a remaining term of 58 months as of the Cut-off Date.
The Property. The City Creek Center is a 325,790 SF retail property located at 50 South Main Street in Salt Lake City, Utah. The City Creek Center Property is part of a larger mixed-use retail, office and residential development known as City Creek Center, all of which opened in 2012. The City Creek Center Property consists of a food court, an eastern enclosed component, a western enclosed component and an outdoor circular plaza located on the far western end of the City Creek Center Property. The eastern and western enclosed component are connected by an enclosed glass skybridge extending over Main Street. The City Creek Property is subject to an unsubordinated ground lease between the borrower, as lessee, and Property Reserve, Inc. the real estate investment arm of The Church of Jesus Christ of Latter-Day Saints, as lessor. The initial ground lease is for 30 years, expiring on March 21, 2042, with four, 10-year lease extension options (resulting in an outside expiration date of December 31, 2070). See “Ground Lease” below for additional information.
As of January 31, 2024, the City Creek Property is leased to 84 tenants, all of which are collateral apart from shadow anchors Macy’s and Nordstrom. No single tenant at the City Creek Center Property comprises more than 5.9% of underwritten base rent or 8.1% of collateral net rentable area (“NRA”).
Major Tenants.
Restoration Hardware (11,522 SF; 3.5% of NRA; 5.9% of underwritten base rent): Restoration Hardware is an American retailer operating primarily in the home furnishings market. The company offers merchandise assortments across a number of categories, including furniture, lighting, textiles, bath-ware, décor, outdoor/garden and baby/child/teenager furnishings. Restoration Hardware’s current lease expires in July 2024.
Tiffany & Co (6,123 SF; 1.9% of NRA; 4.7% of underwritten base rent): Tiffany & Co is an American luxury jewelry house. Tiffany & Co’s product offering spans jewelry, gifts, watches, accessories and fragrances, amongst others. Founded in 1837 in New York City, Tiffany & Co now operates 300 stores worldwide. The related borrower is working on a renewal with Tiffany & Co to renew its lease through January 31, 2033. We cannot assure you that the renewal will occur.
H&M (26,362 SF; 8.1% of NRA; 3.5% of underwritten base rent): H&M is a multinational fashion and design company based in Sweden that focuses on fast-fashion clothing. Founded in 1947, H&M now has over 4,000 stores in more than 75 markets. H&M’s current lease expires in January 2028 with one, five-year renewal option remaining.
The following table presents certain information relating to the tenants at the City Creek Center Property:
| Tenant Summary(1) | |||||||||||||
Tenant | Credit Rating (Moody’s/ S&P/Fitch)(2) | Net Rentable Area (SF) | % of Net Rentable Area | U/W Base Rent | U/W Base Rent Per SF | % of Total U/W Base Rent | Lease Expiration | Termination Option (Y/N) | Renewal Options | ||||
| Restoration Hardware | B1/NR/NR | 11,522 | 3.5 | % | $862,500 | $74.86 | 5.9 | % | 7/31/2024 | N | None | ||
| Tiffany & Co | Aa3/NR/NR | 6,123 | 1.9 | 690,337 | $112.74 | 4.7 | 1/31/2033(3) | N | 1 x 5 Yr | ||||
| H&M | NR/BBB/NR | 26,362 | 8.1 | 515,219 | $19.54 | 3.5 | 1/31/2028 | N | 1 x 5 Yr | ||||
| Alo Yoga | NR/NR/NR | 5,359 | 1.6 | 506,727 | $94.56 | 3.5 | 1/31/2028 | N | 1 x 5 Yr | ||||
| The Cheesecake Factory | NR/NR/NR | 11,971 | 3.7 | 417,501 | $34.88 | 2.9 | 1/31/2033 | N | 1 x 5 Yr | ||||
| Sephora | Aa3/AA-/NR | 5,400 | 1.7 | 415,354 | $76.92 | 2.8 | 1/31/2028 | Y | None | ||||
| Brio Tuscan Grille | NR/NR/NR | 7,340 | 2.3 | 400,000 | $54.50 | 2.7 | 6/30/2028 | N | 2 x 5 Yr | ||||
| Apple | Aaa/AA+/NR | 7,655 | 2.3 | 391,510 | $51.14 | 2.7 | 1/31/2028 | Y | None | ||||
| Tecovas | NR/NR/NR | 3,579 | 1.1 | 389,986 | $108.97 | 2.7 | 1/31/2031 | Y | None | ||||
| West Elm | NR/NR/NR | 8,133 | 2.5 | 382,500 | $47.03 | 2.6 | 1/31/2025 | Y | None | ||||
| Largest Tenants | 93,444 | 28.7 | % | $4,971,634 | $53.20 | 34.1 | % | ||||||
| Remaining Occupied | 184,831 | 56.7 | 9,613,395 | $52.01 | 65.9 | ||||||||
| Total Occupied | 278,275 | 85.4 | % | $14,585,029 | $52.41 | 100.0 | % | ||||||
| Vacant | 47,515 | 14.6 | |||||||||||
| Total | 325,790 | 100.0 | % | ||||||||||
| (1) | Based on the underwritten rent roll dated January 31, 2024. |
| (2) | Certain ratings are those of the parent company whether or not the parent guarantees the lease. |
| (3) | The related borrower is working on a renewal with Tiffany & Co to renew its lease through January 31, 2033. We cannot assure you that the renewal will occur. |
| THE INFORMATION IN THIS STRUCTURAL AND COLLATERAL TERM SHEET IS NOT COMPLETE AND MAY BE AMENDED PRIOR TO THE TIME OF SALE. THIS TERM SHEET IS NOT AN OFFER TO SELL THESE SECURITIES AND IT IS NOT A SOLICITATION OF AN OFFER TO BUY THESE SECURITIES IN ANY JURISDICTION WHERE THE OFFER OR SALE IS NOT PERMITTED. | ||
| 35 | ||
Retail – Super Regional Mall 50 South Main Street Salt Lake City, UT 84101 | Collateral Asset Summary – Loan No. 2 City Creek Center | Cut-off Date Balance: Cut-off Date LTV: U/W NCF DSCR: U/W NOI Debt Yield: | $70,000,000 51.7% 1.79x 14.3% |
The following table presents certain information relating to the lease rollover schedule at the City Creek Center Property, based on the initial lease expiration dates:
| Lease Rollover Schedule(1) | ||||||||||||
| Year Ending December 31 | Expiring Owned GLA | % of Owned GLA | Cumulative % of Owned GLA | U/W Base Rent | % of Total U/W Base Rent | U/W Base Rent $ per SF | # of Expiring Leases | |||||
| MTM | 12,963 | 4.0 | % | 4.0% | $403,930 | 2.8 | % | $31.16 | 3 | |||
| 2024 | 35,921 | 11.0 | 15.0% | 1,799,619 | 12.3 | $50.10 | 8 | |||||
| 2025 | 33,566 | 10.3 | 25.3% | 1,655,112 | 11.3 | $49.31 | 13 | |||||
| 2026 | 12,196 | 3.7 | 29.1% | 727,213 | 5.0 | $59.63 | 6 | |||||
| 2027 | 29,242 | 9.0 | 38.0% | 1,595,796 | 10.9 | $54.57 | 8 | |||||
| 2028 | 70,622 | 21.7 | 59.7% | 3,224,595 | 22.1 | $45.66 | 12 | |||||
| 2029 | 28,423 | 8.7 | 68.4% | 1,540,168 | 10.6 | $54.19 | 11 | |||||
| 2030 | 5,274 | 1.6 | 70.0% | 449,748 | 3.1 | $85.28 | 6 | |||||
| 2031 | 7,031 | 2.2 | 72.2% | 656,597 | 4.5 | $93.39 | 3 | |||||
| 2032 | 15,331 | 4.7 | 76.9% | 570,102 | 3.9 | $37.19 | 4 | |||||
| 2033 | 20,447 | 6.3 | 83.2% | 1,429,271 | 9.8 | $69.90 | 4 | |||||
| 2034 | 7,259 | 2.2 | 85.4% | 532,879 | 3.7 | $73.41 | 4 | |||||
| 2035 & Thereafter | 0 | 0.0 | 85.4% | 0 | 0.0 | $0.00 | 0 | |||||
| Vacant | 47,515 | 14.6 | 100.0% | NAP | NAP | NAP | NAP | |||||
| Total / Wtd. Avg. | 325,790 | 100.0 | % | $14,585,029 | 100.0 | % | $52.41 | 82 | ||||
| (1) | Based on the underwritten rent roll dated January 31, 2024. |
The following table presents certain information relating to the tenants with the highest overall sales in the order of their December 31, 2024 sales:
| Top Tenants by Total Sales(1) | |||||||||
| Tenant | SF | % NRA | Lease Start | Base Rent(2) | 2022 Sales | 2022 Sales PSF | 2023 Sales | 2023 Sales PSF | 2023 Occ Cost |
| Apple | 7,655 | 2.3% | 2012 | $391,510 | $39,617,026 | $5,175 | $37,709,904 | $4,926 | 1.0% |
| Restoration Hardware | 11,522 | 3.5% | 2012 | $862,500 | $18,397,218 | $1,597 | $16,583,938 | $1,439 | 5.2% |
| Louis Vuitton | 4,000 | 1.2% | 2019 | $360,372 | $20,487,398 | $5,122 | $16,144,621 | $4,036 | 2.2% |
| Tiffany & Co | 6,123 | 1.9% | 2024 | $690,337 | $9,958,423 | $1,626 | $10,398,306 | $1,698 | 6.6% |
| The Cheesecake Factory | 11,971 | 3.7% | 2012 | $417,501 | $9,136,764 | $763 | $9,949,487 | $831 | 4.2% |
| lululemon athletica | 4,492 | 1.4% | 2017 | $335,393 | $7,767,055 | $1,729 | $7,939,797 | $1,768 | 4.2% |
| Sephora | 5,400 | 1.7% | 2012 | $415,354 | $6,122,854 | $1,134 | $7,807,867 | $1,446 | 5.3% |
| Anthropologie | 12,041 | 3.7% | 2012 | $317,463 | $5,447,811 | $452 | $5,451,630 | $453 | 5.8% |
| Vuori | 3,000 | 0.9% | 2022 | $160,104 | $2,329,028 | $776 | $4,901,146 | $1,634 | 3.3% |
| H&M | 26,362 | 8.1% | 2012 | $515,219 | $5,201,020 | $197 | $4,864,305 | $185 | 10.6% |
| (1) | All sales information presented herein with respect to the City Creek Center Property is based upon information provided by the borrower sponsor. |
| (2) | Base Rent consists of contractual rent steps through March 2025. |
| THE INFORMATION IN THIS STRUCTURAL AND COLLATERAL TERM SHEET IS NOT COMPLETE AND MAY BE AMENDED PRIOR TO THE TIME OF SALE. THIS TERM SHEET IS NOT AN OFFER TO SELL THESE SECURITIES AND IT IS NOT A SOLICITATION OF AN OFFER TO BUY THESE SECURITIES IN ANY JURISDICTION WHERE THE OFFER OR SALE IS NOT PERMITTED. | ||
| 36 | ||
Retail – Super Regional Mall 50 South Main Street Salt Lake City, UT 84101 | Collateral Asset Summary – Loan No. 2 City Creek Center | Cut-off Date Balance: Cut-off Date LTV: U/W NCF DSCR: U/W NOI Debt Yield: | $70,000,000 51.7% 1.79x 14.3% |
The following table presents certain information relating to the historical operating performance and Underwritten Net Cash Flow at the City Creek Center Property:
| Cash Flow Analysis | ||||||
| 2020 | 2021 | 2022 | 2023 | U/W(1)(2) | U/W Per SF | |
| Base Rent | $10,843,096 | $10,999,040 | $12,025,698 | $12,799,420 | $14,209,960 | $43.62 |
| Rent Steps | $0 | $0 | $0 | $0 | $375,069 | $1.15 |
| Percent Rent | $651,404 | $2,483,980 | $2,678,036 | $1,644,170 | $1,054,670 | $3.24 |
| Other Rental Revenue | $1,576,995 | $999,371 | $798,419 | $916,987 | $1,810,464 | $5.56 |
| Vacant Income | $0 | $0 | $0 | $0 | $2,723,638 | $8.36 |
| Total Reimbursements | $10,607,755 | $9,364,493 | $8,955,767 | $8,302,750 | $9,051,883 | $27.78 |
| Potential Gross Revenue | $23,679,250 | $23,846,883 | $24,457,920 | $23,663,327 | $29,225,683 | $89.71 |
| (Vacancy/Credit Loss) | ($1,707,081) | $859,832 | $459,166 | ($28,169) | ($2,821,638) | ($8.66) |
| Effective Gross Income | $21,972,169 | $24,706,715 | $24,917,085 | $23,635,158 | $26,404,045 | $81.05 |
| Real Estate Taxes | $1,816,131 | $1,255,859 | $1,154,897 | $1,212,457 | $1,193,335 | $3.66 |
| Utilities | $1,032,918 | $1,165,813 | $1,310,842 | $1,608,711 | $1,575,940 | $4.84 |
| Repairs & Maintenance | $2,138,626 | $2,198,299 | $2,071,847 | $1,968,026 | $2,285,533 | $7.02 |
| Payroll | $1,720,447 | $1,830,927 | $1,791,458 | $2,081,128 | $2,010,608 | $6.17 |
| Ground Rent | $2,770,978 | $3,130,582 | $3,729,654 | $3,212,831 | $4,122,955 | $12.66 |
| Other Expenses(3) | $3,520,461 | $4,155,386 | $4,285,335 | $4,731,668 | $5,190,649 | $15.93 |
| Total Expenses | $12,999,562 | $13,736,865 | $14,344,033 | $14,814,820 | $16,379,020 | $50.27 |
| Net Operating Income(4) | $8,972,608 | $10,969,850 | $10,573,053 | $8,820,338 | $10,025,026 | $30.77 |
| Capital Expenditures | $0 | $0 | $0 | $0 | $34,220 | $0.11 |
| TI/LC | $0 | $0 | $0 | $0 | $296,098 | $0.91 |
| Net Cash Flow | $8,972,608 | $10,969,850 | $10,573,053 | $8,820,338 | $9,694,708 | $29.76 |
| Occupancy | 97.5% | 94.9% | 95.6% | 94.8% | 90.7% | |
| NCF DSCR | 1.66x | 2.03x | 1.95x | 1.63x | 1.79x | |
| NOI Debt Yield | 12.8% | 15.7% | 15.1% | 12.6% | 14.3% | |
| (1) | Based on the underwritten rent roll dated January 31, 2024. |
| (2) | Other Rental Revenue consists of contractual rent steps through March 2025, Overage & PIL Rent, Credit Rent and Other Revenue. |
| (3) | Other Expenses consists of promotion expense, partnership expense, specialty leasing expense, insurance, janitorial, management fees, professional fees and other tenant services expenses. |
| (4) | The increase in 2023 NOI to U/W NOI reflects increased in-place rents, commercial reimbursement revenue and grossed-up vacant rents. The decrease from 2022 NOI to 2023 NOI was primarily driven by reduced percentage-in-lieu rent and common area maintenance recoveries. |
Appraisal. According to the appraisal dated March 22, 2024, the City Creek Center Property had an “As-Is” appraised value of $135,500,000 as of February 27, 2024.
| Property | Appraised Value(1) | Capitalization Rate(1) |
| City Creek Center | $135,500,000 | 6.25% |
| (1) | Source: Appraisal. |
Environmental. According to the Phase I environmental assessment dated March 4, 2024, there was no evidence of any recognized environmental conditions at the City Creek Center Property.
The Market. The City Creek Center Property is located in the Central Business District submarket within the Salt Lake City Metro retail market. Population and household growth within the immediate one-mile radius have grown at an above-average rate compared to Salt Lake City and the state of Utah. The median household income within a one-, three- and five-mile radius of the City Creek Center Property are $55,933, $59,667 and $65,281, respectively. According to the appraisal, the Salt Lake City Central Business District saw zero new deliveries in 2023 while maintaining a vacancy rate of 4.6%. The City Creek Center Property has accessibility to I-15 (north/south) and I-80 (east/west). There is a Salt Lake City TRAX train station located on S Main Street adjacent to the City Creek Center Property.
The Borrower and the Borrower Sponsor. The borrower is City Creek Center Associates LLC, a Delaware limited liability company. The borrower is a single purpose bankruptcy-remote entity with two independent managers in its organizational structure. Legal counsel to the borrower delivered a non-consolidation opinion in connection with the origination of the City Creek Center Mortgage Loan.
| THE INFORMATION IN THIS STRUCTURAL AND COLLATERAL TERM SHEET IS NOT COMPLETE AND MAY BE AMENDED PRIOR TO THE TIME OF SALE. THIS TERM SHEET IS NOT AN OFFER TO SELL THESE SECURITIES AND IT IS NOT A SOLICITATION OF AN OFFER TO BUY THESE SECURITIES IN ANY JURISDICTION WHERE THE OFFER OR SALE IS NOT PERMITTED. | ||
| 37 | ||
Retail – Super Regional Mall 50 South Main Street Salt Lake City, UT 84101 | Collateral Asset Summary – Loan No. 2 City Creek Center | Cut-off Date Balance: Cut-off Date LTV: U/W NCF DSCR: U/W NOI Debt Yield: | $70,000,000 51.7% 1.79x 14.3% |
The borrower sponsor and non-recourse carveout guarantor is The Taubman Realty Group LLC (“Taubman”). Founded in 1950, Taubman develops and manages regional, super-regional and outlet shopping centers. Including the City Creek Center Property, Taubman owns and operates 23 regional, super-regional and outlet malls across 10 states, Puerto Rico, China, and South Korea.
Pursuant to the City Creek Center Mortgage Loan documents, so long as one or more of Taubman, Simon Property Group, Inc., Simon Property Group, L.P. or an affiliate of any of the foregoing is the non-recourse carveout guarantor, the non-recourse carveout guarantor’s liability (other than with respect to a Ground Lease Purchase Shortfall) is limited to 20% of the outstanding principal balance at such time, in the aggregate, plus all of the reasonable out-of- pocket costs and expenses (including court costs and reasonable attorneys’ fees) incurred by the lender in the enforcement of the related guaranty or the preservation of the lender’s rights under such guaranty.
Property Management. The City Creek Center Property is managed by The Taubman Company LLC, which is an affiliate of the borrower sponsor.
Initial and Ongoing Reserves. At origination of the City Creek Center Mortgage Loan, the borrower was required to deposit into escrow (i) $2,236,955 for a reserve with respect to outstanding tenant improvement allowances, leasing commissions and unfunded obligations under leases for certain tenants (the “Outstanding TI/LC Reserve”) and (ii) $1,124,301 for a reserve with respect to gap rent under leases for certain tenants (the “Gap Rent Reserve”). In lieu of remitting such amounts for deposit, provided that no event of default is continuing the borrower may fund the Outstanding TI/LC Reserve or the Gap Rent Reserve by delivering to the lender (i) upon at least 10 days written notice to the lender, a qualifying letter of credit in the applicable amount or (ii) a qualifying guaranty in the applicable amount, in each case in accordance with the City Creek Center Mortgage Loan documents.
Tax Reserve – During a City Creek Center Lockbox Event Period or at any time (x) any taxes are not paid by the borrower prior to the assessment of any penalty for late payment and prior to the date that such taxes become delinquent (unless the borrower is contesting such taxes in accordance with the terms of the City Creek Center Mortgage Loan documents), or (y) upon request of the lender, the borrower fails to promptly provide evidence reasonably satisfactory to the lender that such taxes have been paid prior to the assessment of any penalty for late payment and prior to the date that such taxes become delinquent (unless the borrower is contesting such taxes in accordance with the terms of the City Creek Center Mortgage Loan documents), the borrower is required to deposit into a real estate tax reserve, on a monthly basis, 1/12 of the reasonably estimated annual real estate taxes; in lieu of remitting such amounts for deposit, the borrower may fund the tax reserve by delivering to the lender (i) upon at least 10 days written notice to the lender, a qualifying letter of credit in such amount or (ii) provided that no event of default is continuing, a qualifying guaranty in such amount, in each case in accordance with the City Creek Center Mortgage Loan documents.
Insurance Reserve – In the event that during a City Creek Center Lockbox Event Period the borrower has not provided satisfactory evidence to the lender that the City Creek Center Property is covered by policies that are being maintained as part of a reasonably acceptable blanket insurance policy in accordance with the City Creek Center Mortgage Loan documents, the borrower is required to deposit into an insurance reserve, 1/12 of reasonably estimated insurance premiums; in lieu of remitting such amounts for deposit, the borrower may fund the insurance reserve by delivering to the lender (i) upon at least 10 days written notice to the lender, a qualifying letter of credit in such amount or (ii) provided that no event of default is continuing, a qualifying guaranty in such amount, in each case in accordance with the City Creek Center Mortgage Loan documents.
Replacement Reserve – On each monthly payment date during a City Creek Center Lockbox Event Period, the borrower is required to deposit into a replacement reserve, an amount equal to $2,851.63 if the balance on deposit in the replacement reserve account is less than $68,439.20 for reasonably estimated replacements and repairs required to be made to the City Creek Center Property during each calendar year; provided, however, that in lieu of remitting such amounts for deposit, the borrower may fund the replacement reserve by delivering to the lender (i) upon at least 10 days written notice to the lender, a qualifying letter of credit in such amount or (ii) provided that no City Creek Center Control Event (as defined below) or event of default is continuing, a qualifying guaranty in such amount, in each case in accordance with the City Creek Center Mortgage Loan documents.
TI/LC Reserve – The borrower is required to deposit into a rollover reserve, on a monthly basis, an amount equal to $28,516.33 if the balance of the rollover reserve falls below $684,392.00; in lieu of remitting such amounts for deposit, the borrower may fund the rollover reserve by delivering to the lender (i) upon at least 10 days written notice to the lender, a qualifying letter of credit in such amount or (ii) provided that no City Creek Center Control Event or event of default is continuing, a qualifying guaranty in such amount, in each case in accordance with the City Creek Center Mortgage Loan documents.
Ground Rent Reserve – During a City Creek Center Lockbox Event Period, the borrower is required to deposit into a ground rent reserve, on a monthly basis, an amount equal to the ground rent that will be payable under the Ground Lease for the month in which such payment occurs.
A “City Creek Center Control Event” means that any combination of Taubman, Simon Property Group, Inc. or Simon Property Group, L.P. does not own, in the aggregate, at least 30% of the direct or indirect interests in the borrower or does not control the borrower.
| THE INFORMATION IN THIS STRUCTURAL AND COLLATERAL TERM SHEET IS NOT COMPLETE AND MAY BE AMENDED PRIOR TO THE TIME OF SALE. THIS TERM SHEET IS NOT AN OFFER TO SELL THESE SECURITIES AND IT IS NOT A SOLICITATION OF AN OFFER TO BUY THESE SECURITIES IN ANY JURISDICTION WHERE THE OFFER OR SALE IS NOT PERMITTED. | ||
| 38 | ||
Retail – Super Regional Mall 50 South Main Street Salt Lake City, UT 84101 | Collateral Asset Summary – Loan No. 2 City Creek Center | Cut-off Date Balance: Cut-off Date LTV: U/W NCF DSCR: U/W NOI Debt Yield: | $70,000,000 51.7% 1.79x 14.3% |
Lockbox / Cash Management. The City Creek Center Mortgage Loan is structured with a hard lockbox and springing cash management. At origination of the City Creek Center Mortgage Loan, the borrower was required to direct each tenant to remit all rents directly to a lender-controlled lockbox account. In addition, the borrower is required to, and is required to cause the property manager to, cause all amounts constituting rents received by the borrower or the property manager with respect to the City Creek Center Property to be deposited into the lockbox account or a lender-controlled cash management account by the end of the second business day following receipt. In addition, the borrower is required to, and is required to cause the property manager to, instruct all persons that maintain open accounts with the borrower or property manager with respect to the City Creek Center Property or with whom the borrower or property manager does business on an “accounts receivable” basis with respect to the City Creek Center Property to deliver all payments due under such accounts to the lockbox account. On each Wednesday during the continuance of a City Creek Center Lockbox Event Period (as defined below) under the City Creek Center Mortgage Loan documents, all amounts in the lockbox are required to be remitted to the cash management account. On a daily basis at any time no City Creek Center Lockbox Event Period is in effect, all amounts in the lockbox account are required to be remitted to a borrower-controlled operating account.
Notwithstanding anything to the contrary in the foregoing, the borrower may maintain an account in its name into which it may deposit or cause to be deposited rents from persons who are parties to a City Creek Center License Agreement (as defined below) and miscellaneous amounts received by the borrower that are not rents, payments, reimbursements or other amounts paid under leases, provided that if a City Creek Center Lockbox Event Period exists, at the lender’s direction, the borrower is required to direct all persons who are parties to a City Creek Center License Agreement to deliver all sums due under such City Creek Center License Agreements directly to the lockbox account. To the extent any such sums are collected directly by the borrower or property manager, the borrower is required to, and is required to cause the property manager to, cause all such sums received by the borrower or property manager to be deposited into the lockbox account by the end of the second business day following receipt.
On each due date during the continuance of a City Creek Center Lockbox Event Period, all funds on deposit in the cash management account after payment of debt service on the City Creek Center Mortgage Loan, required reserves and budgeted operating expenses are required to be deposited into an excess cash flow reserve account as additional collateral for the City Creek Center Mortgage Loan.
A “City Creek Center License Agreement” means any license or occupancy agreement granted by the borrower (or a predecessor-in-interest) to (i) an operator of a cart, kiosk or similar merchandising facilities located in the common areas of the City Creek Center Property or (ii) a licensee or occupant of an in-line space for a term of one year or less.
A “City Creek Center Lockbox Event” means the occurrence of: (i) an event of default; (ii) any bankruptcy action of the borrower; (iii) a bankruptcy action of the property manager if the property manager is an affiliate of the borrower, provided that the property manager is not replaced within 60 days with a qualified property manager; or (iv) a City Creek Center Debt Yield Trigger Event (as defined below).
A “City Creek Center Lockbox Event Period” means the period commencing on the occurrence of a City Creek Center Lockbox Event and continuing until the occurrence of the applicable City Creek Center Lockbox Termination Event (as defined below).
A “City Creek Center Debt Yield Trigger Event” means, as of any date of determination, the debt yield based on the trailing four calendar quarter period immediately preceding such date of determination is less than 10.00% for two consecutive calendar quarters.
A “City Creek Center Lockbox Termination Event” means (a) if the City Creek Center Lockbox Event is caused solely by the occurrence of a City Creek Center Debt Yield Trigger Event, the achievement of a debt yield for the City Creek Center Mortgage Loan of 10.00% or greater for two consecutive calendar quarters based on the trailing four calendar quarter period immediately preceding such date of determination, (b) if the City Creek Center Lockbox Event is caused solely by an event of default, the acceptance by the lender of a cure of such event of default (which cure the lender is not obligated to accept and may reject or accept in its sole and absolute discretion) provided that the lender has not accelerated the City Creek Center Mortgage Loan, moved for a receiver or commenced foreclosure proceedings or (c) if the City Creek Center Lockbox Event is caused solely by a bankruptcy action of the property manager, if the borrower replaces the property manager with a qualified property manager under a replacement property management agreement within 60 days or such bankruptcy action of the property manager is discharged or dismissed within 90 days without any adverse consequences to the City Creek Center Property or the City Creek Center Mortgage Loan; provided, however, that, each such City Creek Center Lockbox Termination Event is subject to the following conditions: (i) no other City Creek Center Lockbox Event has occurred and is continuing, (ii) no other event of default has occurred and is continuing under the City Creek Center Mortgage Loan documents, (iii) the borrower may not cure a City Creek Center Lockbox Event (x) more than a total of five times in the aggregate during the term of the City Creek Center Mortgage Loan or (y) triggered by a bankruptcy action of the borrower at any time during the term of the City Creek Center Mortgage Loan and (iv) the borrower has paid all of the lender’s reasonable out-of-pocket expenses incurred in connection with such City Creek Center Lockbox Termination Event, including reasonable attorney’s fees and expenses.
Current Mezzanine or Secured Subordinate Indebtedness. None.
Permitted Future Mezzanine or Secured Subordinate Indebtedness. None.
| THE INFORMATION IN THIS STRUCTURAL AND COLLATERAL TERM SHEET IS NOT COMPLETE AND MAY BE AMENDED PRIOR TO THE TIME OF SALE. THIS TERM SHEET IS NOT AN OFFER TO SELL THESE SECURITIES AND IT IS NOT A SOLICITATION OF AN OFFER TO BUY THESE SECURITIES IN ANY JURISDICTION WHERE THE OFFER OR SALE IS NOT PERMITTED. | ||
| 39 | ||
Retail – Super Regional Mall 50 South Main Street Salt Lake City, UT 84101 | Collateral Asset Summary – Loan No. 2 City Creek Center | Cut-off Date Balance: Cut-off Date LTV: U/W NCF DSCR: U/W NOI Debt Yield: | $70,000,000 51.7% 1.79x 14.3% |
Partial Release. The City Creek Center Mortgage Loan documents permit the borrower to obtain the release of non-income producing or vacant portions of the City Creek Center Property in connection with a transfer to third parties or affiliates of the borrower without the payment of a release price provided that, among other conditions, the borrower satisfies customary REMIC requirements.
Ground Lease. The City Creek Center Property is subject to that certain unsubordinated 30-year amended and restated retail airspace lease, effective as of December 4, 2008, as amended (the “Airspace Ground Lease”), between Property Reserve, Inc., a Utah nonprofit corporation and the real estate investment arm of The Church of Jesus Chris of Latter-Day Saints, as ground lessor, and the borrower, as ground lessee, which expires on March 21, 2042, and is subject to four, 10-year extension options (provided that the as-extended expiration date may be no later than December 31, 2070 unless certain additional conditions set forth in the ground lease are satisfied).
Under the Airspace Ground Lease, the ground lessor has two options to purchase the leasehold estate: (i) in the event the occupancy rate at the City Creek Center Property falls below 50% for 6 consecutive months and (ii) on the 12th anniversary of the retail center’s opening date and every 5 years thereafter, with the next option available for exercise on March 22, 2029. The purchase price under the options is equal to the sum of (i) 95% of the fair market value of the leasehold interest, assuming all extension options are exercised, plus (ii) the Landlord’s Rental Stream Value (as defined below) of the percentage rent, which purchase price may not exceed 100% of the fair market value. The City Creek Center Mortgage Loan documents provide recourse to the guarantor for any losses to the lender arising out of or in connection with any failure of the purchase price paid by the ground lessor in connection with the exercise of the ground lessor’s purchase option to repay the City Creek Center Mortgage Loan in its entirety (the “Ground Lease Purchase Shortfall”).
“Landlord’s Rental Stream Value” means the product of (a) the average annual percentage rent, if any, the ground lessee paid the ground lessor in the three full calendar years immediately before the ground lessor exercised its purchase option and (b) a fraction whose numerator is 100% and whose denominator is the cap rate.
| THE INFORMATION IN THIS STRUCTURAL AND COLLATERAL TERM SHEET IS NOT COMPLETE AND MAY BE AMENDED PRIOR TO THE TIME OF SALE. THIS TERM SHEET IS NOT AN OFFER TO SELL THESE SECURITIES AND IT IS NOT A SOLICITATION OF AN OFFER TO BUY THESE SECURITIES IN ANY JURISDICTION WHERE THE OFFER OR SALE IS NOT PERMITTED. | ||
| 40 | ||
Retail – Anchored 3785 South Las Vegas Boulevard Las Vegas, NV 89109
| Collateral Asset Summary – Loan No. 3 Showcase I | Cut-off Date Balance: Cut-off Date LTV: U/W NCF DSCR: U/W NOI Debt Yield: | $69,500,000 67.8% 1.30x 8.5% |
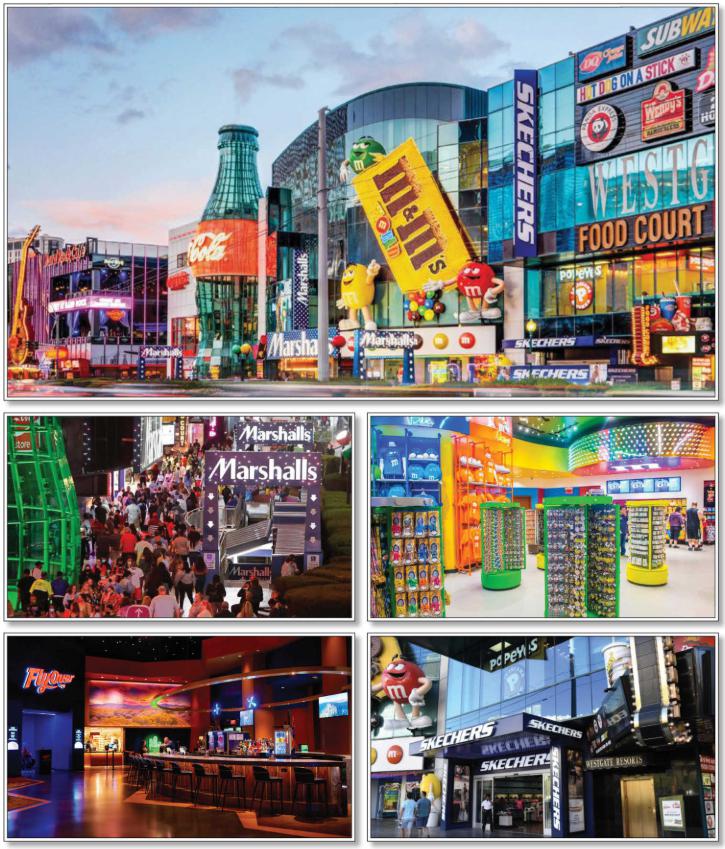
| THE INFORMATION IN THIS STRUCTURAL AND COLLATERAL TERM SHEET IS NOT COMPLETE AND MAY BE AMENDED PRIOR TO THE TIME OF SALE. THIS TERM SHEET IS NOT AN OFFER TO SELL THESE SECURITIES AND IT IS NOT A SOLICITATION OF AN OFFER TO BUY THESE SECURITIES IN ANY JURISDICTION WHERE THE OFFER OR SALE IS NOT PERMITTED. | ||
| 41 | ||
Retail – Anchored 3785 South Las Vegas Boulevard Las Vegas, NV 89109
| Collateral Asset Summary – Loan No. 3 Showcase I | Cut-off Date Balance: Cut-off Date LTV: U/W NCF DSCR: U/W NOI Debt Yield: | $69,500,000 67.8% 1.30x 8.5% |
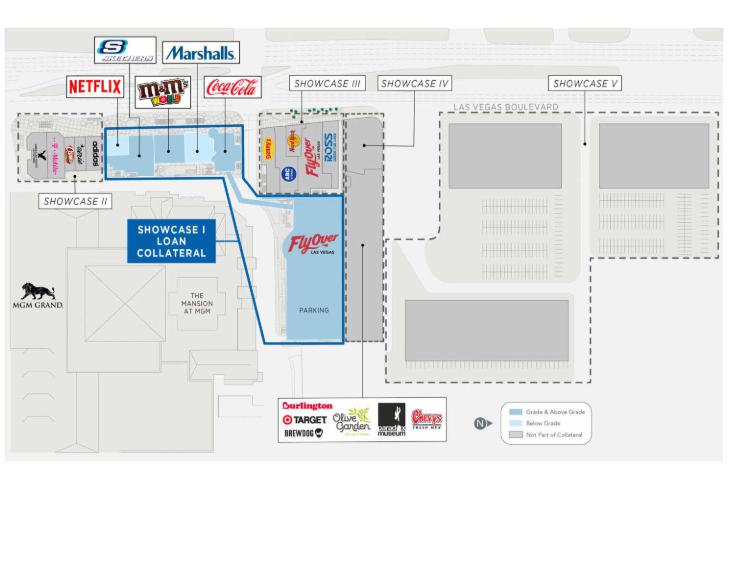
| THE INFORMATION IN THIS STRUCTURAL AND COLLATERAL TERM SHEET IS NOT COMPLETE AND MAY BE AMENDED PRIOR TO THE TIME OF SALE. THIS TERM SHEET IS NOT AN OFFER TO SELL THESE SECURITIES AND IT IS NOT A SOLICITATION OF AN OFFER TO BUY THESE SECURITIES IN ANY JURISDICTION WHERE THE OFFER OR SALE IS NOT PERMITTED. | ||
| 42 | ||
Retail – Anchored 3785 South Las Vegas Boulevard Las Vegas, NV 89109
| Collateral Asset Summary – Loan No. 3 Showcase I | Cut-off Date Balance: Cut-off Date LTV: U/W NCF DSCR: U/W NOI Debt Yield: | $69,500,000 67.8% 1.30x 8.5% |
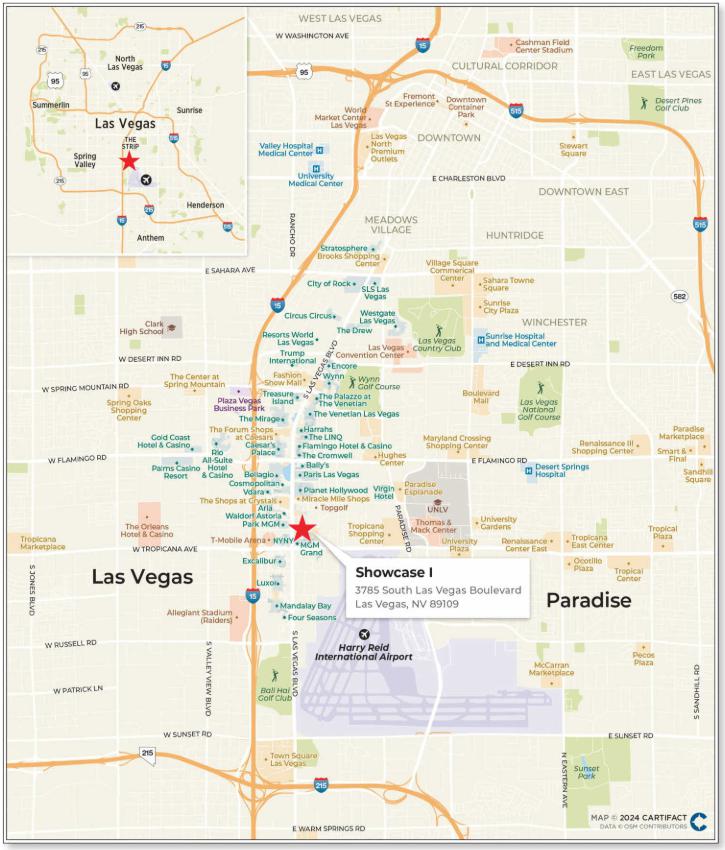
| THE INFORMATION IN THIS STRUCTURAL AND COLLATERAL TERM SHEET IS NOT COMPLETE AND MAY BE AMENDED PRIOR TO THE TIME OF SALE. THIS TERM SHEET IS NOT AN OFFER TO SELL THESE SECURITIES AND IT IS NOT A SOLICITATION OF AN OFFER TO BUY THESE SECURITIES IN ANY JURISDICTION WHERE THE OFFER OR SALE IS NOT PERMITTED. | ||
| 43 | ||
Retail – Anchored 3785 South Las Vegas Boulevard Las Vegas, NV 89109
| Collateral Asset Summary – Loan No. 3 Showcase I | Cut-off Date Balance: Cut-off Date LTV: U/W NCF DSCR: U/W NOI Debt Yield: | $69,500,000 67.8% 1.30x 8.5% |
| Mortgage Loan Information | Property Information | |||
| Loan Seller: | CREFI | Single Asset / Portfolio: | Single Asset | |
| Loan Purpose: | Refinance | Property Type – Subtype: | Retail - Anchored | |
| Borrower Sponsor(s): | Jeffrey Gindi and Eli Gindi | Collateral: | Fee | |
| Borrower(s): | N & G Showcase LLC | Location: | Las Vegas, NV | |
| Original Balance(1): | $69,500,000 | Year Built / Renovated: | 1997 / 2003 | |
| Cut-off Date Balance(1): | $69,500,000 | Property Management: | Showcase Mall Vegas Management LLC | |
| % by Initial UPB: | 6.9% | Size: | 180,848 SF | |
| Interest Rate: | 6.36000% | Appraised Value (As Is) / Per SF: | $250,000,000 / $1,382 | |
| Note Date: | June 7, 2024 | Appraisal Date: | March 27, 2024 | |
| Original Term: | 60 months | Occupancy(4): | 90.0% (as of February 29, 2024) | |
| Amortization: | Interest Only | UW Economic Occupancy: | 91.7% | |
| Original Amortization: | NAP | Underwritten NOI(5): | $14,408,703 | |
| Interest Only Period: | 60 months | Underwritten NCF: | $14,200,728 | |
| First Payment Date: | August 1, 2024 | |||
| Maturity Date: | July 1, 2029 | Historical NOI | ||
| Additional Debt Type(1): | Pari Passu | Most Recent NOI(5): | $12,894,000 (TTM April 30, 2024) | |
| Additional Debt Balance(1): | $100,000,000 | 2023 NOI: | $12,390,114 | |
| Call Protection: | L(24),YM1(29),O(7) | 2022 NOI: | $10,800,125 | |
| Lockbox / Cash Management: | Hard / Springing | 2021 NOI: | NAV | |
| Reserves(2) | Financial Information(1) | ||||||
| Initial | Monthly | Cap | Cut-off Date Loan / SF: | $937 | |||
| Taxes: | $363,322 | $121,107 | NAP | Maturity Date Loan / SF: | $937 | ||
| Insurance: | $0 | Springing | NAP | Cut-off Date LTV: | 67.8% | ||
| Replacement Reserves: | $2,261 | $2,261 | NAP | Maturity Date LTV: | 67.8% | ||
| TI / LC: | $15,071 | $15,071 | $542,544 | UW NOI DY: | 8.5% | ||
| Unfunded Obligations: | $250,000 | $0 | NAP | UW NCF DSCR: | 1.30x | ||
| Other(3): | $14,152,888 | $0 | NAP | ||||
| Sources and Uses | |||||||
| Sources | Proceeds | % of Total | Uses | Proceeds | % of Total | ||
| Whole Loan | $169,500,000 | 97.4 | % | Loan Payoff | $101,221,918 | 58.1% | |
| Borrower Sponsor Equity | $4,571,072 | 2.6 | % | Preferred Equity Payoff | $50,523,000 | 29.0% | |
| Upfront Reserves | $14,783,541 | 8.5% | |||||
| Closing Costs(6) | $7,542,613 | 4.3% | |||||
| Total Sources | $174,071,072 | 100.0 | % | Total Uses: | $174,071,072 | 100.0% | |
| (1) | The Showcase I Mortgage Loan (as defined below) is part of the Showcase I Whole Loan (as defined below), which is comprised of five pari passu promissory notes. Financial Information in the chart above is based on the aggregate outstanding principal balance as of the Cut-off Date of the Showcase I Whole Loan. |
| (2) | See “Initial and Ongoing Reserves” below. |
| (3) | Other Reserves are comprised of $12,000,000 allocable to the Unfunded M&M TI Obligations Reserve and $2,152,888 allocable to the Unfunded M&M Free Rent Obligations Reserve (each as described under “Initial and Ongoing Reserves” below). |
| (4) | Though in occupancy and paying rent, Netflix has been underwritten as vacant as the Netflix lease is scheduled to expire on December 31, 2024. Netflix currently leases its space at a rental rate of $83.15 PSF. The Showcase I Property (as defined below) was 100.0% physically occupied as of February 29, 2024. |
| (5) | The increase from Most Recent NOI to Underwritten NOI is primarily attributed to (i) the execution of the M&M World (“M&M”) renewal lease with an effective date and rent step up in September 2025, reflected in the lender underwriting, and (ii) increased parking income in accordance with the borrower’s budget. At loan origination, $2,152,888 was reserved in connection with the M&M gap/free rent obligations, representing the difference between the current in-place rent under the M&M lease and the renewal rent which is scheduled to take effect on the earlier to occur of (i) the delivery of the renovated M&M space to M&M and (ii) September 1, 2025 (the earlier to occur of clause (i) or (ii) above is hereinafter referred to as the “M&M Renewal Rent Commencement Date”). |
| (6) | Closing Costs include a rate buydown fee of $6,632,535. |
| THE INFORMATION IN THIS STRUCTURAL AND COLLATERAL TERM SHEET IS NOT COMPLETE AND MAY BE AMENDED PRIOR TO THE TIME OF SALE. THIS TERM SHEET IS NOT AN OFFER TO SELL THESE SECURITIES AND IT IS NOT A SOLICITATION OF AN OFFER TO BUY THESE SECURITIES IN ANY JURISDICTION WHERE THE OFFER OR SALE IS NOT PERMITTED. | ||
| 44 | ||
Retail – Anchored 3785 South Las Vegas Boulevard Las Vegas, NV 89109
| Collateral Asset Summary – Loan No. 3 Showcase I | Cut-off Date Balance: Cut-off Date LTV: U/W NCF DSCR: U/W NOI Debt Yield: | $69,500,000 67.8% 1.30x 8.5% |
The Loan. The third largest mortgage loan (the “Showcase I Mortgage Loan”) is part of a whole loan (the “Showcase I Whole Loan”) evidenced by five pari passu promissory notes in the aggregate original principal amount of $169,500,000. The Showcase I Whole Loan was co-originated by JPMorgan Chase Bank, National Association (“JPMCB”) and CREFI on June 7, 2024. The Showcase I Whole Loan is secured by a first priority fee mortgage encumbering a 180,848 SF anchored retail property located in Las Vegas, Nevada (the “Showcase I Property”).
The table below identifies the promissory notes that comprise the Showcase I Whole Loan. The relationship between the holders of the Showcase I Whole Loan is governed by a co-lender agreement as described under “Description of the Mortgage Pool—The Whole Loans—The Serviced Pari Passu Whole Loans” and “—The Non-Serviced Pari Passu Whole Loans” in the Preliminary Prospectus. The Showcase I Whole Loan will initially be serviced pursuant to the pooling and servicing agreement for the Benchmark 2024-V8 securitization until the controlling Note A-1 is securitized, whereupon the Showcase I Whole Loan will be serviced pursuant to the pooling and servicing agreement for the transaction in which the controlling Note A-1 is securitized. See “The Pooling and Servicing Agreement—Servicing of the Servicing Shift Mortgage Loans” in the Preliminary Prospectus.
| Whole Loan Summary | ||||
| Note | Original Balance | Cut-off Date Balance | Note Holder | Controlling Piece |
| A-1(1) | $70,000,000 | $70,000,000 | JPMCB | Yes |
| A-2(1) | $20,000,000 | $20,000,000 | JPMCB | No |
| A-3(1) | $10,000,000 | $10,000,000 | JPMCB | No |
| A-4 | $40,000,000 | $40,000,000 | Benchmark 2024-V8 | No |
| A-5 | $29,500,000 | $29,500,000 | Benchmark 2024-V8 | No |
| Whole Loan | $169,500,000 | $169,500,000 | ||
| (1) | Expected to be contributed to one or more securitization trust(s) or may otherwise be transferred at any time. |
The Property. The Showcase I Property is a four-story, 180,848 SF, anchored retail property located along the east side of Las Vegas Boulevard within Las Vegas, Nevada. The Showcase I Property is situated on the southeast corner of the intersection of Las Vegas Boulevard and MGM Road, which provides access to MGM Resort and Casino. Additionally, just south of the Showcase I Property is Tropicana Avenue, which is home to three major resorts and casinos including the MGM Grand, New York New York Hotel & Casino and Excalibur Hotel & Casino. According to the appraisal, pedestrian traffic fronting the Showcase I Property exceeds 50,000 vehicles per day. The Showcase I Property is in close proximity to tourist attractions including the T-Mobile Arena, The Park, Park MGM and Park Theater.
The Showcase I Property was constructed in 1997 and most recently renovated in 2003. According to the appraisal, the Showcase I Property has undergone several renovations since opening, including exterior and interior improvements. The building features frontage along Las Vegas Boulevard and is structurally designed to have a large amount of billboard and advertisement exposure. Additionally, major tenants at the Showcase I Property such as M&M and Coca Cola have built out significant exterior design elements. The Showcase I Property is comprised of two parcels located directly adjacent to each other and connected via a sky bridge. The first parcel contains a retail building with four above ground floors and a sub-grade basement level. The second parcel contains a 12-story parking garage featuring 1,406 parking spaces, connected to the Showcase I Property via a pedestrian bridge on the fourth level, as well as 41,108 SF of specialty theatre concept space split across the first two floors. Furthermore, the Showcase I Property features four sets of escalators and two elevators. Lower level major tenants including M&M and Coca Cola have their own escalators providing convenient lower-level access.
As of February 29, 2024, the Showcase I Property is 90.0% leased to a roster of nationally branded tenants (although currently in occupancy and paying rent, the Netflix lease expires in December 2024 and has been marked vacant for purposes of lender underwriting). M&M is located across portions of all four above ground level floors and features a wide range of amenities including gift stores and a custom candy dispenser capable of producing M&M’s candies with personalized messages and images. Other amenities include a free 10-minute, 3-D movie on the third floor and Red’s Pit Stop, an ice cream and dessert bar where the store also hosts children’s birthday parties. In addition, M&M recently executed a 15-year lease renewal commencing in September 2025. M&M’s renewal rent of $4,000,000 is an approximately 75.6% increase as compared to the current in-place rent of $2,277,692. Such renewal rent is scheduled to take effect on the M&M Renewal Rent Commencement Date. In connection with the M&M renewal lease, the borrower agreed to a partial rent abatement of $166,666.67 per month (representing approximately 50% of the renewal rent) for the first 12 months after the M&M Renewal Rent Commencement Date and a rent abatement of $6,240.25 per day (representing approximately 99% of the current in-place rent) for 180 days commencing on the date that M&M vacates its entire premises and removes trade fixtures and movable personal property in connection with renovating its premises in accordance with the M&M lease (such date, if any, the “Vacate Date”). In addition, M&M is entitled to additional rent credits if delivery of its renovated premises is delayed. See “Initial and Ongoing Reserves” below. Coca Cola occupies portions of the first three above ground levels and features exclusive Coca Cola branded merchandise as well as a Coca Cola fountain on the second floor with 16 different international beverages. Outback Steakhouse leases space on the fourth floor. Marshalls
| THE INFORMATION IN THIS STRUCTURAL AND COLLATERAL TERM SHEET IS NOT COMPLETE AND MAY BE AMENDED PRIOR TO THE TIME OF SALE. THIS TERM SHEET IS NOT AN OFFER TO SELL THESE SECURITIES AND IT IS NOT A SOLICITATION OF AN OFFER TO BUY THESE SECURITIES IN ANY JURISDICTION WHERE THE OFFER OR SALE IS NOT PERMITTED. | ||
| 45 | ||
Retail – Anchored 3785 South Las Vegas Boulevard Las Vegas, NV 89109
| Collateral Asset Summary – Loan No. 3 Showcase I | Cut-off Date Balance: Cut-off Date LTV: U/W NCF DSCR: U/W NOI Debt Yield: | $69,500,000 67.8% 1.30x 8.5% |
and Netflix have exclusive ground floor entries providing access to the lower sub-grade leased space. Westgate Resorts occupies multiple suites at the Showcase I Property, as well as a kiosk and also maintains large exterior signage. The second floor of the Showcase I Property features a food court with multiple vendor suites, master leased to a third-party operator which runs the food court comprising 14,737 SF in aggregate. The food court also features its own entry and access from Las Vegas Boulevard frontage. The ground level and second level of the Showcase I Property parking garage is leased to FlyOver Las Vegas LLC (“FlyOver”), an operator of an immersive amusement attraction. The experience uses flight motion seats designed to swoop, dip and turn, giving a feeling of true flight. In order to enhance the ride and fully immerse the customer in the experience, certain 4D features such as a 20-meter spherical screen, wind, mists and fragrant scents are utilized.
The following table presents certain information relating to tenant sales history with respect to the Showcase I Property.
| Tenant Sales | |||||||||
| 2021 | 2022 | 2023 | T-12 4/30/2024 | ||||||
| Square Feet | Sales | Sales PSF | Sales | Sales PSF | Sales | Sales PSF | Sales | Sales PSF | |
| FlyOver | 41,108 | NAV | NAV | $6,651,390 | $161.80 | $8,244,418 | $200.56 | $8,000,200 | $194.61 |
| M&M World | 31,025 | $32,071,045 | $1,033.72 | $33,881,880 | $1,092.08 | $30,984,942 | $998.71 | $30,360,018 | $978.57 |
| Marshalls(1) | 30,624 | $12,679,436 | $414.04 | $14,393,699 | $470.01 | $16,336,842 | $533.47 | NAV | NAV |
| Coca Cola | 18,597 | $11,317,077 | $608.54 | $13,261,687 | $713.11 | $15,093,882 | $811.63 | $15,291,122 | $822.24 |
| Total Sales | 121,354 | $56,067,558 | $698.70 | $68,188,656 | $561.90 | $70,660,084 | $582.26 | $53,651,340 | $591.33 |
| (1) | Sales periods represent the data from February of the current year to January of the following year. |
Major Tenants. The three largest tenants based on underwritten base rent are M&M, Sketchers and Coca Cola.
M&M (31,025 square feet; 17.2% of net rentable area; 29.3% of underwritten base rent) – First introduced in Newark, New Jersey in 1941, M&Ms are now offered in over 100 different countries around the world. M&M World is a retail store that specializes in M&M’s candy and related merchandise. The store features a gift shop on the first floor, candy dispensers on the second floor, collector’s items on the third floor and an authentic M&M-sponsored NASCAR race car which was driven by Ken Schrader on the fourth floor. Other core attractions include a custom candy dispenser capable of imprinting custom messages and images onto the candies as well as a digitally-remastered interactive 3-D film which runs for about 10 minutes and plays throughout the day. Although many subsequent M&M retail stores have since opened, the one at the Showcase I Property was the first, originally opened in 1997. M&M recently executed a renewal lease commencing in September 2025 for a 15-year term at a base rent of $4,000,000, 75.6% in excess of the current in-place rent. Such renewal rent is scheduled to take effect on the M&M Renewal Rent Commencement Date. The M&M lease is guaranteed by Mars Inc., the tenant’s investment grade credit-rated parent company. M&M’s renewal lease term ends in August 2040 with two, five-year renewal options. In connection with the M&M renewal lease, the borrower agreed to a partial rent abatement of $166,666.67 per month (representing approximately 50% of the renewal rent) for the first 12 months after the M&M Renewal Rent Commencement Date and a rent abatement of $6,240.25 per day (representing approximately 99% of the current in-place rent) for 180 days commencing on M&M’s Vacate Date (if any). At origination of the Showcase I Mortgage Loan, $2,152,888 was reserved in a gap and free rent reserve, representing the difference between the current in-place rent under the M&M lease and the renewal rent which is scheduled to take effect on the M&M Renewal Rent Commencement Date. The 12 month rent abatement, and the six month rent abatement described above related to renovations was not separately reserved for. Such reserve is required to be disbursed as described under “Initial and Ongoing Reserves—Unfunded M&M Free Rent Obligations Reserve” below. In addition, the borrower has a $12,000,000 landlord contribution obligation, in the event M&M elects to renovate its space at any point prior to July 8, 2027. In the event the construction plans for the M&M renovation are not approved by borrower or M&M by such date, M&M is instead entitled to a $2,000,000 free rent credit in lieu of the $12,000,000 available for renovations. See Initial and Ongoing Reserves—Unfunded M&M TI Obligations Reserve” below.
Skechers (7,230 square feet; 4.0% of net rentable area; 16.1% of underwritten base rent) – Founded in 1992 by Robert Greenberg, Skechers is an American multinational footwear and apparel company headquartered in Manhattan Beach, California. Skechers operates 5,203 company and third-party owned retail stores across more than 180 countries. Skechers is currently the third-largest athletic footwear brand in the world and has major manufacturing facilities throughout North America, Europe, Central America, South America and Asia. 2023 saw Skechers record annual sales of $8.00 billion, a year-over-year increase of 7.5%, also recording a record gross margin of 53.1% in the fourth quarter of 2023. In 2023, Skechers introduced partnerships and a capsule collection with Martha Stewart and Snoop Dogg, who appeared in a joint Super Bowl campaign. Additionally, it continued to grow its sports presence, signing Harry Kane, Julius Randle and Terance Mann. Skechers’ lease term ends in March 2027 with two, five-year renewal options remaining.
Coca Cola (18,597 SF; 10.3% of NRA; 12.2% of underwritten base rent) – Founded in 1886, Coca Cola has grown into an international total beverage brand sold in more than 200 countries, with 2.2 billion servings of Coca Cola branded drinks served daily. Coca Cola’s beverage portfolio is expansive, covering more than 200 brands and thousands of beverages across the globe, from soft drinks and waters, to coffee and teas. Additionally, the company has amassed over 225 bottling partners across 900 bottling plants globally. Coca Cola’s lease term expires in December 2029 with one, five-year renewal option remaining.
| THE INFORMATION IN THIS STRUCTURAL AND COLLATERAL TERM SHEET IS NOT COMPLETE AND MAY BE AMENDED PRIOR TO THE TIME OF SALE. THIS TERM SHEET IS NOT AN OFFER TO SELL THESE SECURITIES AND IT IS NOT A SOLICITATION OF AN OFFER TO BUY THESE SECURITIES IN ANY JURISDICTION WHERE THE OFFER OR SALE IS NOT PERMITTED. | ||
| 46 | ||
Retail – Anchored 3785 South Las Vegas Boulevard Las Vegas, NV 89109
| Collateral Asset Summary – Loan No. 3 Showcase I | Cut-off Date Balance: Cut-off Date LTV: U/W NCF DSCR: U/W NOI Debt Yield: | $69,500,000 67.8% 1.30x 8.5% |
The following table presents certain information relating to the largest tenants at the Showcase I Property:
| Tenant Summary(1) | ||||||||||||||
| April 2024 TTM Sales | ||||||||||||||
| Tenant Name | Credit Rating (Moody’s/ S&P/Fitch)(2) | Net Rentable Area (SF) | % of Net Rentable Area | U/W Base Rent | U/W Base Rent Per SF | % of Total U/W Base Rent | Sales $ | Sales Per SF | Occ Cost %(3) | Lease Expiration | Termination Option (Y/N) | Renewal Options | ||
| Major Tenants | ||||||||||||||
| M&M World(4) | A1/A+/NR | 31,025 | 17.2% | $4,000,000 | $128.93 | 29.3% | $30,360,018 | $979 | 14.8% | 8/31/2040 | N | 2 x 5 years | ||
| Skechers(5) | NR/NR/NR | 7,230 | 4.0% | $2,199,985 | $304.29 | 16.1% | NAV | NAV | NAV | 3/30/2027 | N | 2 x 5 years | ||
| Coca Cola | A1/A+/NR | 18,597 | 10.3% | $1,673,730 | $90.00 | 12.2% | $15,291,122 | $822 | 12.9% | 12/31/2029 | N | 1 x 5 years | ||
| Marshalls | A2/A/NR | 30,624 | 16.9% | $1,667,215 | $54.44 | 12.2% | $16,336,842(6) | $533(6) | 13.6%(6) | 1/31/2029 | N | 2 x 5 years | ||
| FlyOver | NR/NR/NR | 41,108 |
| 22.7% |
| $1,124,880 | $27.36 | 8.2% | $8,000,200 | $195 | 21.3% | 8/31/2034 | N | 3 x 5 years |
| Major Tenants Subtotal/Wtd. Avg. | 128,584 | 71.1% | $10,665,810 | $82.95 | 78.0% | |||||||||
| Other Tenants(7) | 34,225 |
| 18.9% |
| $3,007,743 | $87.88 | 22.0% | |||||||
| Occupied Subtotal/Wtd. Avg. | 162,809 | 90.0% | $13,673,553 | $83.99 | 100.0% | |||||||||
| Vacant Space(8) | 18,039 |
| 10.0% |
|
| |||||||||
| Total/Wtd. Avg. | 180,848 | 100.0% | ||||||||||||
| (1) | Information is based on the underwritten rent roll as of February 29, 2024, inclusive of contractual rent steps through September 30, 2025. |
| (2) | Certain ratings are those of the parent company whether or not the parent guarantees the lease. |
| (3) | Based on the underwritten base rent and borrower’s projected 2024 recoveries. |
| (4) | M&M World is entitled to free rent as described under “Major Tenants—M&M” above. |
| (5) | Skechers pays a premium rent due to the size of its space, being on the grade level and featuring frontage along the Las Vegas Boulevard. |
| (6) | Sales $, Sales Per SF and Occ Cost % for Marshalls represents February 2023 to January 2024 total sales. |
| (7) | Other Tenants is inclusive of 1,585 SF which is associated with an owner-occupied management office with no attributable underwritten base rent. |
| (8) | Though in occupancy and paying rent, Netflix has been underwritten as vacant as the Netflix lease is scheduled to expire in December 2024. Netflix currently leases its space at a rental rate of $83.15 PSF. |
The following table presents certain information relating to the lease rollover schedule at the Showcase I Property, based on initial lease expiration date:
| Lease Rollover Schedule(1)(2) | |||||||||||
| Year Ending December 31 | Expiring Owned GLA | % of Owned GLA | Cumulative % of Owned GLA | U/W Base Rent | % of Total U/W Base Rent | U/W Base Rent $ per SF | # of Expiring Leases | ||||
| MTM/2024(3) | 1,595 | 0.9% | 0.9% | $20,112 | 0.1% | $12.61 | 2 | ||||
| 2025 | 0 | 0.0% | 0.9% | $0 | 0.0% | $0.00 | 0 | ||||
| 2026 | 0 | 0.0% | 0.9% | $0 | 0.0% | $0.00 | 0 | ||||
| 2027 | 7,230 | 4.0% | 4.9% | $2,199,985 | 16.1% | $304.29 | 1 | ||||
| 2028 | 11,467 | 6.3% | 11.2% | $1,958,331 | 14.3% | $170.78 | 2 | ||||
| 2029 | 49,221 | 27.2% | 38.4% | $3,340,945 | 24.4% | $67.88 | 2 | ||||
| 2030 | 0 | 0.0% | 38.4% | $0 | 0.0% | $0.00 | 0 | ||||
| 2031 | 0 | 0.0% | 38.4% | $0 | 0.0% | $0.00 | 0 | ||||
| 2032 | 0 | 0.0% | 38.4% | $0 | 0.0% | $0.00 | 0 | ||||
| 2033 | 0 | 0.0% | 38.4% | $0 | 0.0% | $0.00 | 0 | ||||
| 2034 | 41,108 | 22.7% | 61.2% | $1,124,880 | 8.2% | $27.36 | 1 | ||||
| 2035 & Thereafter | 52,188 | 28.9% | 90.0% | $5,029,300 | 36.8% | $96.37 | 3 | ||||
| Vacant(4) | 18,039 | 10.0% | 100.0% | NAP | NAP | NAP | NAP | ||||
| Total/Wtd. Avg. | 180,848 | 100.0% | $13,673,553 | 100.0% | $83.99 | 11 | |||||
| (1) | Information is based on the underwritten rent roll as of February 29, 2024, inclusive of contractual rent steps through September 30, 2025. |
| (2) | Certain tenants may have lease termination options that are exercisable prior to the originally stated expiration date of the related lease and are not considered in the lease rollover schedule. |
| (3) | MTM/2024 is inclusive of 1,585 SF which is associated with an owner-occupied management office with no attributable UW base rent. |
| (4) | Though in occupancy and paying rent, Netflix has been underwritten as vacant as the Netflix lease is scheduled to expire in December 2024. Netflix currently leases its space at a rental rate of $83.15 PSF. |
| THE INFORMATION IN THIS STRUCTURAL AND COLLATERAL TERM SHEET IS NOT COMPLETE AND MAY BE AMENDED PRIOR TO THE TIME OF SALE. THIS TERM SHEET IS NOT AN OFFER TO SELL THESE SECURITIES AND IT IS NOT A SOLICITATION OF AN OFFER TO BUY THESE SECURITIES IN ANY JURISDICTION WHERE THE OFFER OR SALE IS NOT PERMITTED. | ||
| 47 | ||
Retail – Anchored 3785 South Las Vegas Boulevard Las Vegas, NV 89109
| Collateral Asset Summary – Loan No. 3 Showcase I | Cut-off Date Balance: Cut-off Date LTV: U/W NCF DSCR: U/W NOI Debt Yield: | $69,500,000 67.8% 1.30x 8.5% |
The following table presents certain information relating to the historic operating performance and Underwritten Net Cash Flow at the Showcase I Property:
| Cash Flow Analysis(1) | ||||||
| 2022 | 2023 | TTM 4/30/2024(2) | U/W(2) | U/W Per SF | ||
| Rents in Place | $10,160,383 | $12,029,049 | $12,413,607 | $13,673,553 | $75.61 | |
| Vacant Income | 0 | 0 | 0 | 1,499,943 | $8.29 | |
| Reimbursements | 2,357,104 | 2,375,437 | 2,587,716 | 2,941,175 | $16.26 | |
| Gross Potential Income | $12,517,487 | $14,404,487 | $15,001,323 | $18,114,671 | $100.17 | |
| Other Income | 1,169,255 | 1,111,404 | 1,086,689 | 1,295,481 | $7.16 | |
| Vacancy | 0 | 0 | 0 | (1,499,943) | ($8.29) | |
| Effective Gross Income | $13,686,743 | $15,515,891 | $16,088,013 | $17,910,209 | $99.03 | |
| Real Estate Taxes | 467,369 | 495,962 | 512,323 | 522,232 | $2.89 | |
| Insurance | 73,418 | 86,793 | 91,514 | 157,496 | $0.87 | |
| Other Operating Expenses | 2,345,831 | 2,543,023 | 2,590,176 | 2,821,779 | $15.60 | |
| Total Operating Expenses | $2,886,618 | $3,125,777 | $3,194,013 | $3,501,507 | $19.36 | |
| Net Operating Income | $10,800,125 | $12,390,114 | $12,894,000 | $14,408,703 | $79.67 | |
| Replacement Reserves | 0 | 0 | 0 | 27,127 | $0.15 | |
| TI/LC | 0 | 0 | 0 | 180,848 | $1.00 | |
| Net Cash Flow | $10,800,125 | $12,390,114 | $12,894,000 | $14,200,728 | $78.52 | |
| Occupancy (%) | 90.0% | 100.0% | 100.0% | 91.7%(3) | ||
| NCF DSCR(4) | 0.99x | 1.13x | 1.18x | 1.30x | ||
| NOI Debt Yield(4) | 6.4% | 7.3% | 7.6% | 8.5% | ||
| (1) | Based on the underwritten rent roll as of February 29, 2024, inclusive of contractual rent steps through September 30, 2025. |
| (2) | The increase in Net Operating Income from TTM 4/30/2024 to U/W is primarily attributed to (i) the execution of the M&M renewal lease with an effective date and rent step up in September 2025, reflected in the lender underwriting, and (ii) increased parking income in accordance with the borrower’s budget. At loan origination, $2,152,888 was reserved in connection with the M&M gap/free rent obligations. |
| (3) | Although in occupancy and paying rent, Netflix has been underwritten as vacant as the Netflix lease is scheduled to expire December 2024. Netflix currently leases its space at a rental rate of $83.15 PSF. Occupancy (%) represents the underwritten economic occupancy. The Showcase I Property was 100.0% physically occupied as of February 29, 2024. |
| (4) | Based on the Showcase I Whole Loan. |
Appraisal. The appraisal concluded to an “as-is” value for the Showcase I Property of $250,000,000 as of March 27, 2024.
| Showcase I Appraised Value(1) | ||
| Property | Value | Capitalization Rate |
| Showcase I | $250,000,000 | 5.75% |
| (1) | Source: Appraisal. |
Environmental Matters. According to the Phase I environmental site assessment dated April 4, 2024, there was no evidence of any recognized environmental conditions at the Showcase I Property.
The Market. The Showcase I Property is situated on the east side of Las Vegas Boulevard, just north of the intersection with Tropicana Avenue. According to the appraisal, the intersections of Tropicana Avenue and Las Vegas Boulevard and Harmon Avenue and Las Vegas Boulevard are two of the busiest in Las Vegas, both in terms of vehicle and pedestrian traffic. The area, commonly known as the central/southern portion of the Las Vegas Strip Resort Corridor, consists of a mix of well-established, recently developed and redeveloped resort casino-hotels. Additionally, the area also includes business hotels, apartment complexes, commercial retail buildings, regional retail centers and industrial buildings. Within close proximity to the Showcase I Property are a variety of prominent attractions, including MGM Grand, New York New York Hotel and Casino, Excalibur Hotel and Casino, Tropicana Las Vegas, Park MGM/NoMad, CityCenter (including Aria, Vdara, Waldorf Astoria and The Shops at Crystals), The Cosmopolitan, The Luxor, T-Mobile Arena as well as other phases of The Showcase retail development.
The Showcase I Property is located in Las Vegas, Nevada within the Las Vegas-Paradise-Henderson Core Based Statistical Area (“CBSA”). The Las Vegas metro is the largest of Nevada’s 17 counties by population size and the city is considered the 28th most populated city in the United States with a population of over 2.3 million. Las Vegas is known for its grand casinos and lavish hotels, among
| THE INFORMATION IN THIS STRUCTURAL AND COLLATERAL TERM SHEET IS NOT COMPLETE AND MAY BE AMENDED PRIOR TO THE TIME OF SALE. THIS TERM SHEET IS NOT AN OFFER TO SELL THESE SECURITIES AND IT IS NOT A SOLICITATION OF AN OFFER TO BUY THESE SECURITIES IN ANY JURISDICTION WHERE THE OFFER OR SALE IS NOT PERMITTED. | ||
| 48 | ||
Retail – Anchored 3785 South Las Vegas Boulevard Las Vegas, NV 89109
| Collateral Asset Summary – Loan No. 3 Showcase I | Cut-off Date Balance: Cut-off Date LTV: U/W NCF DSCR: U/W NOI Debt Yield: | $69,500,000 67.8% 1.30x 8.5% |
other attractions. According to the appraisal, Las Vegas is considered one of the top three destinations in the United States for business conventions and is a global leader in the hospitality industry, claiming more AAA Five Diamond hotels than any other city in the world. Additionally, Las Vegas frequently ranks as one of the world’s most visited tourist destinations, with an economy that heavily relies on tourist traffic. The appraisal concludes that employment in the city has increased greatly over the last 12 months preceding the appraisal date and convention activity has increased by 31% year over year as of June 2023. In terms of gross metropolitan product, the Las Vegas CBSA has outperformed the national expansion by an average of 50 basis points from 2012 through 2022. A year-end 2023 study by a local visitor’s and convention authority suggests that visitors stay an average of 3.3 nights and budget approximately $788 for gaming, a continued increasing trend since 2018. The same study also indicates that visitors report spending an average of $249 per visit for shopping, $109 per visit for shows and $565 per visit for food and drinks. The 2023 visitor expenditure for food and drink is the highest on record, with expenditure on shopping being the second highest on record, falling behind the 2021 record of approximately $285 per visit.
According to the appraisal, total 2023 visitors were equal to approximately 40.8 million, up approximately 5.2% from visitation levels reported for 2022 and exceeding 40.0 million visitors for the first time since the COVID-19 pandemic. Each month of 2023 reported visits in excess of 3.0 million. Additionally, annual convention attendance neared 6.0 million in 2023, approximately 20.0% over 2022 levels. Year to date visits as of February 2024 totaled 6,757,800, up 6.3% as compared to the first two months of 2023.
According to a third-party market research report, the 2023 population within a one-, three- and five-mile radius of the Showcase I Property was 17,188, 161,038 and 386,068, respectively. The 2023 average household income within the same radii was $148,485, $71,536 and $75,009, respectively.
According to the appraisal, the Las Vegas Retail market contains approximately 30,447,000 SF of space. The Southeast submarket that the Showcase I Property is located in contains 5,083,000 SF, or 16.7% of the region’s inventory, featuring asking rents of $20.18 PSF. Moreover, the Southeast submarket has a vacancy rate of 14.8%. However, according to a third-party market research report, retail and shopping center properties located along the Las Vegas Boulevard Corridor generally exhibit an average vacancy of between 4.0% and 7.0%. According to the appraisal, 547,000 SF of space was completed between 2019 and 2023 in the Las Vegas market, an average of 109,400 SF per year. In the Southeast submarket, a total of 10,000 SF of space was completed between 2019 and 2023, equating to 1.8% of new construction for the region. Between 2019 and 2023, new construction in the Southeast submarket outpaced absorption with an annual average of 2,000 SF completed and -8,400 SF absorbed within the five year period.
| THE INFORMATION IN THIS STRUCTURAL AND COLLATERAL TERM SHEET IS NOT COMPLETE AND MAY BE AMENDED PRIOR TO THE TIME OF SALE. THIS TERM SHEET IS NOT AN OFFER TO SELL THESE SECURITIES AND IT IS NOT A SOLICITATION OF AN OFFER TO BUY THESE SECURITIES IN ANY JURISDICTION WHERE THE OFFER OR SALE IS NOT PERMITTED. | ||
| 49 | ||
Retail – Anchored 3785 South Las Vegas Boulevard Las Vegas, NV 89109
| Collateral Asset Summary – Loan No. 3 Showcase I | Cut-off Date Balance: Cut-off Date LTV: U/W NCF DSCR: U/W NOI Debt Yield: | $69,500,000 67.8% 1.30x 8.5% |
The following table presents recent large retail leases at comparable retail properties with respect to the Showcase I Property:
| Comparable Leases Summary | |||
| Property | Tenant Name | Tenant Size (SF) | Base Rent PSF |
| Showcase I(1) | Marshalls | 30,624 | $54.44 |
| Confidential | Confidential | 20,000 | $115.00 |
| Confidential | Confidential | 15,185 | $80.00 |
| Confidential | Confidential | 50,000 | $50.00 |
| Confidential | Confidential | 30,000 | $110.00 |
| Confidential | Confidential | 27,900 | $155.06 |
| Confidential | Confidential | 27,800 | $76.44 |
| Confidential | Confidential | 10,845 | $124.48 |
| Confidential | Confidential | 13,025 | $122.84 |
| Total/Wtd. Avg.(2) | 194,755 | $96.10 | |
| Source: Appraisal |
| (1) | Information is based on the underwritten rent roll as of February 29, 2024, inclusive of contractual rent steps through September 30, 2025. |
| (2) | The Total/Wtd. Avg. excludes the Showcase I Property. |
The following table presents recent specialty retail leases at comparable retail properties with respect to the Showcase I Property:
| Comparable Leases Summary | |||
| Property | Tenant Name | Tenant Size (SF) | Base Rent PSF |
| Showcase I(1) | M&M World | 31,025 | $128.93 |
| Confidential | Confidential | 692 | $541.91 |
| Confidential | Confidential | 6,176 | $194.30 |
| Confidential | Confidential | 5,669 | $264.60 |
| Confidential | Confidential | 9,118 | $174.38 |
| Confidential | Confidential | 9,500 | $170.00 |
| Confidential | Confidential | 10,350 | $227.05 |
| Confidential | Confidential | 10,960 | $228.10 |
| Confidential | Confidential | 1,800 | $242.31 |
| Confidential | Confidential | 1,182 | $368.99 |
| Confidential | Confidential | 383 | $313.32 |
| Confidential | Confidential | 952 | $99.95 |
| Confidential | Confidential | 648 | $324.28 |
| Confidential | Confidential | 454 | $317.18 |
| Confidential | Confidential | 764 | $282.72 |
| Confidential | Confidential | 863 | $417.15 |
| Confidential | Confidential | 3,923 | $229.42 |
| Confidential | Confidential | 698 | $250.00 |
| Confidential | Confidential | 446 | $440.85 |
| Total/Wtd. Avg.(2) | 64,578 | $223.28 | |
| Source: Appraisal |
| (1) | Information is based on the underwritten rent roll as of February 29, 2024, inclusive of contractual rent steps through September 30, 2025. |
| (2) | The Total/Wtd. Avg. excludes the Showcase I Property. |
| THE INFORMATION IN THIS STRUCTURAL AND COLLATERAL TERM SHEET IS NOT COMPLETE AND MAY BE AMENDED PRIOR TO THE TIME OF SALE. THIS TERM SHEET IS NOT AN OFFER TO SELL THESE SECURITIES AND IT IS NOT A SOLICITATION OF AN OFFER TO BUY THESE SECURITIES IN ANY JURISDICTION WHERE THE OFFER OR SALE IS NOT PERMITTED. | ||
| 50 | ||
Retail – Anchored 3785 South Las Vegas Boulevard Las Vegas, NV 89109
| Collateral Asset Summary – Loan No. 3 Showcase I | Cut-off Date Balance: Cut-off Date LTV: U/W NCF DSCR: U/W NOI Debt Yield: | $69,500,000 67.8% 1.30x 8.5% |
The following table presents certain information relating to the appraisal’s market rent conclusion for the Showcase I Property:
| Market Rent Summary | ||||
| Anchor | Major | Theater | Food Court | |
| Market Rent PSF (NNN) | $115.00 | $75.00 | $27.00 | $50.00 |
| Lease Term (Years) | 10 | 10 | 10 | 10 |
| Rent Increase Projection | 10.0% year six | 3.0% per annum | 10.0% year six | 3.0% per annum |
The Borrower and the Borrower Sponsor. The borrower is N & G Showcase LLC, a Delaware limited liability company and single purpose entity with two independent directors. The borrower sponsors and non-recourse carveout guarantors for the Showcase I Whole Loan are Jeffrey Gindi and Eli Gindi. Legal counsel to the borrower delivered a non-consolidation opinion in connection with origination of the Showcase I Whole Loan.
Founded in the late 1990s by brothers Jeffrey and Eli Gindi, Gindi Capital is a family-owned real estate and consumer products investment firm headquartered in New York, New York. Since its founding, Gindi Capital has been involved in several commercial real estate projects in markets such as New York, Miami and Las Vegas. Notable real estate holdings for Gindi Capital include Showcase One through Five located in Las Vegas (adjacent to the Showcase I Property), 100-10 125th Street located in New York, Versace Mansion located in Florida and Dizengoff Center located in Israel.
Property Management. The Showcase I Property is managed by Showcase Mall Vegas Management LLC, a borrower-affiliated management company.
Initial and Ongoing Reserves. On the loan origination date, the borrower was required to make an upfront deposit of $250,000 into an outstanding tenant improvement allowances reserve in connection with Outback Steak House.
Real Estate Taxes – On the loan origination date, the borrower was required to make an upfront deposit of $363,322 into a reserve for real estate taxes. In addition, the borrower is required to deposit into a real estate tax reserve, on a monthly basis, an amount equal to 1/12th of the real estate taxes that the lender estimates will be payable during the next twelve months (initially estimated to be $121,107).
Insurance – The borrower is required to reserve monthly 1/12th of the annual estimated insurance payments, unless (i) no event of default is continuing under the Showcase I Whole Loan and (ii) the Showcase I Property is insured under a blanket policy meeting the requirements set forth in the related loan agreement.
Replacement Reserve – On the loan origination date, the borrower was required to make an upfront deposit of $2,261 into a reserve for replacement. In addition, the borrower is required to deposit into the replacement reserve, on a monthly basis, an amount equal to $2,261.
TI/LC Reserve – On the loan origination date, the borrower was required to make an upfront deposit of $15,071 into a TI/LC reserve. In addition, the borrower is required to deposit into the TI/LC reserve, on a monthly basis, $15,071, along with any lease termination fees or other payments received by the borrower in connection with the termination of any lease at the Showcase I Property. So long as no event of default has occurred and is continuing, the aggregate amount of the TI/LC reserve fund is subject to a cap of $542,544.
Unfunded M&M TI Obligations Reserve – On the loan origination date, the borrower was required to make an upfront deposit of $12,000,000 into a reserve for certain unfunded obligations in connection with the recently extended M&M lease. The funds on deposit in the Unfunded M&M TI Obligations Reserve are required to be disbursed in the same manner as the funds on deposit in the TI/LC Reserve (and with the same restrictions and requirements, except that such disbursements from the Unfunded M&M TI Obligations Reserve are not subject to lender’s approval). In the event the borrower has provided evidence to the lender that (i) neither the borrower nor M&M World has approved construction plans for renovation work detailed in the M&M lease documents as of July 8, 2027, (ii) there are no further obligations remaining under the M&M lease with respect to such renovation work, and (iii) neither the borrower nor M&M are in monetary or material non-monetary default under the M&M lease, then, provided no event of default has occurred and is continuing under the Showcase I Whole Loan documents, (1) an amount equal to $2,000,000 will automatically be transferred from the Unfunded M&M TI Obligations Reserve to an Outstanding TI/LC reserve (which $2,000,000 is required to be disbursed to the lockbox account in respect of free rent in accordance with a schedule to be provided by the borrower and reasonably approved by the lender) and (2) any funds on deposit in the Unfunded M&M TI Obligations Reserve in excess of $2,000,000 will automatically be transferred into the lockbox account.
Unfunded M&M Free Rent Obligations Reserve – On the loan origination date, the borrower was required to make an upfront deposit of $2,152,888 into a reserve for M&M gap/free rent, representing the difference between the current in-place rent under the M&M lease and the renewal rent. The 12 month rent abatement, and the six month full rent abatement related to renovations was not separately reserved for. On the payment date occurring in September 2025, provided no event of default is continuing under the Showcase I Whole Loan, an amount equal to $84,503.50 is required to be released into the lockbox account, from the Unfunded M&M Free Rent Obligations Reserve for 12 months such that the remaining reserve is equal to the abated rent M&M is entitled to during its renovation (if M&M elects to
| THE INFORMATION IN THIS STRUCTURAL AND COLLATERAL TERM SHEET IS NOT COMPLETE AND MAY BE AMENDED PRIOR TO THE TIME OF SALE. THIS TERM SHEET IS NOT AN OFFER TO SELL THESE SECURITIES AND IT IS NOT A SOLICITATION OF AN OFFER TO BUY THESE SECURITIES IN ANY JURISDICTION WHERE THE OFFER OR SALE IS NOT PERMITTED. | ||
| 51 | ||
Retail – Anchored 3785 South Las Vegas Boulevard Las Vegas, NV 89109
| Collateral Asset Summary – Loan No. 3 Showcase I | Cut-off Date Balance: Cut-off Date LTV: U/W NCF DSCR: U/W NOI Debt Yield: | $69,500,000 67.8% 1.30x 8.5% |
renovate). The remaining reserve is required to be released into the lockbox account, provided no event of default is continuing under the Showcase I Whole Loan, in six equal installments of $189,807.67 commencing upon M&M’s Vacate Date (if any). At such time as the borrower has provided the lender with reasonably acceptable evidence that (i) no free rent periods remain (including, without limitation, (x) actual free rent periods and/or gap periods and/or (y) rights or potential rights to apply or convert tenant improvements, allowances or any other amounts to free rent and/or gap rent) pursuant to the M&M lease and (ii) neither borrower nor M&M is in monetary or material nonmonetary default pursuant to the M&M lease, all funds in the Unfunded M&M Free Rent Obligations Reserve will be deposited into the lockbox account.
Lockbox / Cash Management. The Showcase I Whole Loan is structured with a hard lockbox and springing cash management. At origination, the borrower and property manager were required to direct the tenants to pay rent directly into the lockbox account, and are required to deposit into such lockbox account any rents otherwise received within two business days after receipt. If no Cash Sweep Period is continuing, all funds in the lockbox account will be swept each business day to the borrower’s operating account. During the continuance of a Cash Sweep Period, all funds in the lockbox account are required to be swept to a lender-controlled cash management account and applied in accordance with the Showcase I Whole Loan documents. During the continuance of a Cash Sweep Period, any excess cash is required to be deposited into an excess cash flow reserve account to be held as additional security for the Showcase I Whole Loan in accordance with the Showcase I Whole Loan documents. All sums remaining on deposit in the excess cash flow reserve account will be disbursed to the borrower upon payment in full of the debt. Further, if at any time during a Cash Sweep Period there are insufficient funds on deposit in the TI/LC Reserve or the unfunded obligations reserve (to the extent applicable) to cover any tenant improvement costs and/or leasing commissions which would be payable utilizing funds in the TI/LC Reserve or the unfunded obligations reserve, then provided no event of default is continuing and no such funds are disbursed to cover any fees payable to an affiliate of the borrower or the guarantors, the lender is required to make funds in the excess cash flow reserve available to pay for any such tenant improvements and/or leasing commissions.
A “Cash Sweep Period” means a period commencing upon the occurrence of (i) an event of default, (ii) any bankruptcy action of the property manager or borrower or (iii) the debt service coverage ratio falling below 1.15x for two consecutive calendar quarters based on the trailing twelve-month period immediately preceding the date of such determination, and expiring upon (a) with respect to clause (i) above, the cure of such event of default and the acceptance of such cure by the lender, (b) with respect to clause (ii) above, if the Cash Sweep Period is caused solely by a bankruptcy action of the property manager, the borrower replacing the property manager with a qualified property manager under a replacement management agreement within 60 days following the occurrence of such bankruptcy or insolvency action and (c) with respect to clause (iii) above, the achievement of a debt service coverage ratio of 1.15x or greater for two consecutive calendar quarters based upon the trailing 12-month period immediately preceding the date of determination.
Current Mezzanine or Secured Subordinate Indebtedness. None.
Permitted Future Mezzanine or Secured Subordinate Indebtedness. Not Permitted
Release of Collateral. Not Permitted.
Ground Lease. None.
| THE INFORMATION IN THIS STRUCTURAL AND COLLATERAL TERM SHEET IS NOT COMPLETE AND MAY BE AMENDED PRIOR TO THE TIME OF SALE. THIS TERM SHEET IS NOT AN OFFER TO SELL THESE SECURITIES AND IT IS NOT A SOLICITATION OF AN OFFER TO BUY THESE SECURITIES IN ANY JURISDICTION WHERE THE OFFER OR SALE IS NOT PERMITTED. | ||
| 52 | ||
Retail – Super Regional Mall 5900 Sugarloaf Parkway Lawrenceville, GA 30043
| Collateral Asset Summary – Loan No. 4 Sugarloaf Mills | Cut-off Date Balance: Cut-off Date LTV: U/W NCF DSCR: U/W NOI Debt Yield: | $65,790,421 30.6% 2.73x 30.2% |
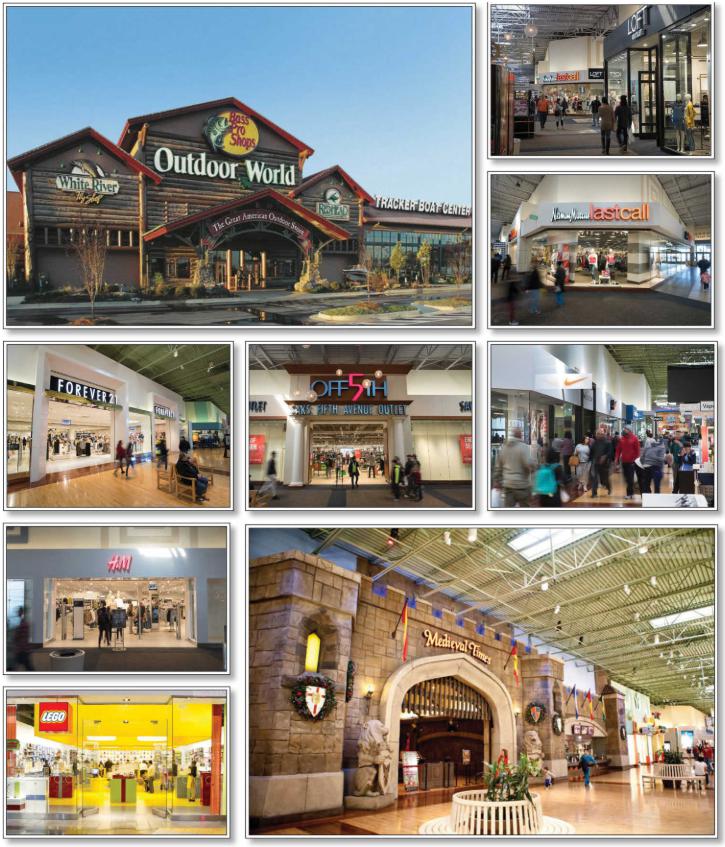
| THE INFORMATION IN THIS STRUCTURAL AND COLLATERAL TERM SHEET IS NOT COMPLETE AND MAY BE AMENDED PRIOR TO THE TIME OF SALE. THIS TERM SHEET IS NOT AN OFFER TO SELL THESE SECURITIES AND IT IS NOT A SOLICITATION OF AN OFFER TO BUY THESE SECURITIES IN ANY JURISDICTION WHERE THE OFFER OR SALE IS NOT PERMITTED. | ||
| 53 | ||
Retail – Super Regional Mall 5900 Sugarloaf Parkway Lawrenceville, GA 30043
| Collateral Asset Summary – Loan No. 4 Sugarloaf Mills | Cut-off Date Balance: Cut-off Date LTV: U/W NCF DSCR: U/W NOI Debt Yield: | $65,790,421 30.6% 2.73x 30.2% |
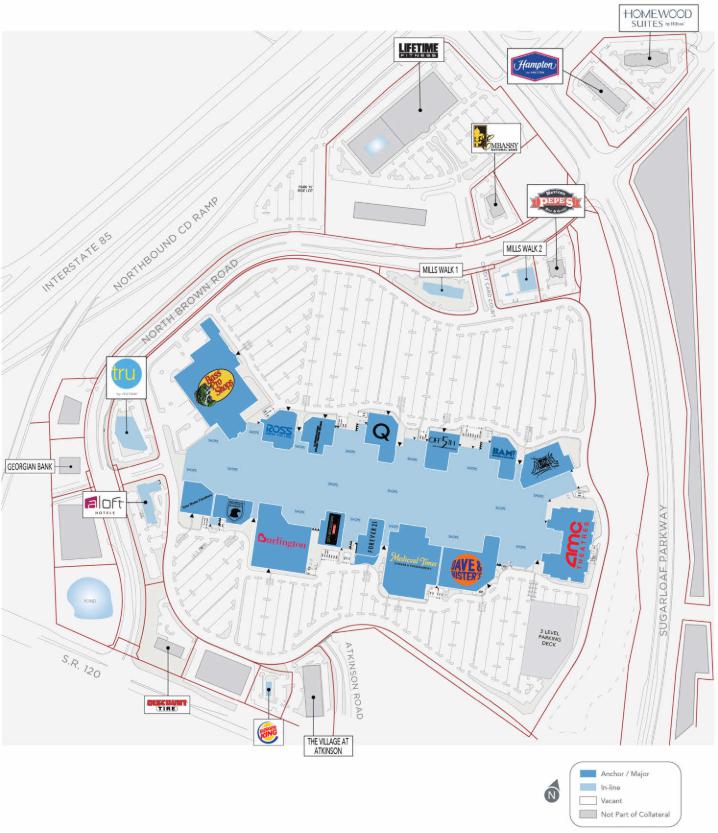
| THE INFORMATION IN THIS STRUCTURAL AND COLLATERAL TERM SHEET IS NOT COMPLETE AND MAY BE AMENDED PRIOR TO THE TIME OF SALE. THIS TERM SHEET IS NOT AN OFFER TO SELL THESE SECURITIES AND IT IS NOT A SOLICITATION OF AN OFFER TO BUY THESE SECURITIES IN ANY JURISDICTION WHERE THE OFFER OR SALE IS NOT PERMITTED. | ||
| 54 | ||
Retail – Super Regional Mall 5900 Sugarloaf Parkway Lawrenceville, GA 30043
| Collateral Asset Summary – Loan No. 4 Sugarloaf Mills | Cut-off Date Balance: Cut-off Date LTV: U/W NCF DSCR: U/W NOI Debt Yield: | $65,790,421 30.6% 2.73x 30.2% |
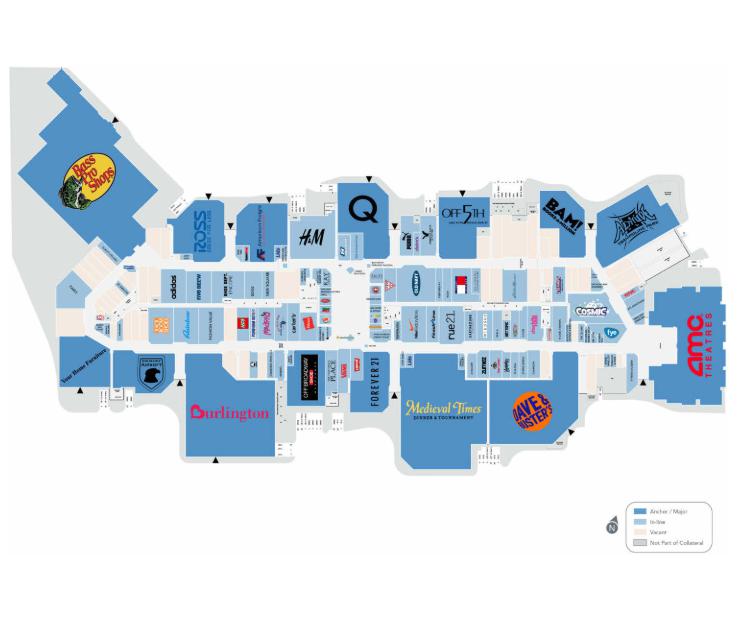
| THE INFORMATION IN THIS STRUCTURAL AND COLLATERAL TERM SHEET IS NOT COMPLETE AND MAY BE AMENDED PRIOR TO THE TIME OF SALE. THIS TERM SHEET IS NOT AN OFFER TO SELL THESE SECURITIES AND IT IS NOT A SOLICITATION OF AN OFFER TO BUY THESE SECURITIES IN ANY JURISDICTION WHERE THE OFFER OR SALE IS NOT PERMITTED. | ||
| 55 | ||
Retail – Super Regional Mall 5900 Sugarloaf Parkway Lawrenceville, GA 30043
| Collateral Asset Summary – Loan No. 4 Sugarloaf Mills | Cut-off Date Balance: Cut-off Date LTV: U/W NCF DSCR: U/W NOI Debt Yield: | $65,790,421 30.6% 2.73x 30.2% |
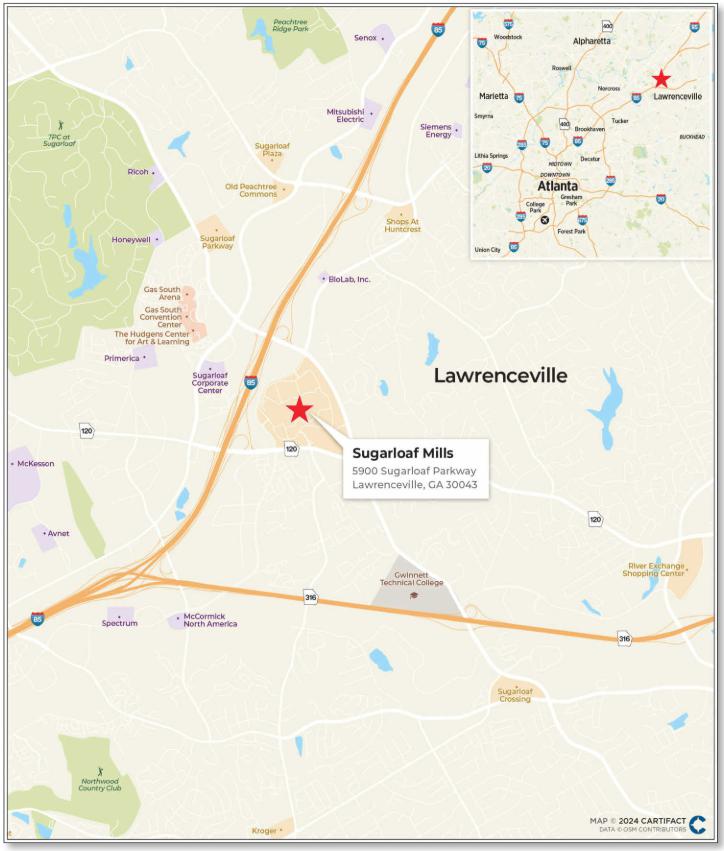
| THE INFORMATION IN THIS STRUCTURAL AND COLLATERAL TERM SHEET IS NOT COMPLETE AND MAY BE AMENDED PRIOR TO THE TIME OF SALE. THIS TERM SHEET IS NOT AN OFFER TO SELL THESE SECURITIES AND IT IS NOT A SOLICITATION OF AN OFFER TO BUY THESE SECURITIES IN ANY JURISDICTION WHERE THE OFFER OR SALE IS NOT PERMITTED. | ||
| 56 | ||
Retail – Super Regional Mall 5900 Sugarloaf Parkway Lawrenceville, GA 30043
| Collateral Asset Summary – Loan No. 4 Sugarloaf Mills | Cut-off Date Balance: Cut-off Date LTV: U/W NCF DSCR: U/W NOI Debt Yield: | $65,790,421 30.6% 2.73x 30.2% |
| Mortgage Loan Information | Property Information | |||
| Loan Sellers: | GACC, Barclays | Single Asset / Portfolio: | Single Asset | |
| Loan Purpose: | Refinance | Property Type - Subtype: | Retail – Super Regional Mall | |
| Borrower Sponsor(s)(1): | Simon Property Group, L.P. | Collateral: | Fee | |
| Borrower(s): | Sugarloaf Mills Limited Partnership | Location: | Lawrenceville, GA | |
| Original Balance: | $66,000,000 | Year Built / Renovated: | 2001 / 2006 | |
| Cut-off Date Balance: | $65,790,421 | Property Management: | Simon Management Associates II, LLC | |
| % by Initial UPB: | 6.5% | Size: | 1,178,576 SF | |
| Interest Rate: | 8.01700% | Appraised Value / Per SF: | $215,000,000 / $182 | |
| Note Date: | April 24, 2024 | Appraisal Date: | February 22, 2024 | |
| Original Term: | 60 months | Occupancy: | 86.6% (as of February 16, 2024) | |
| Amortization: | Amortizing Balloon | UW Economic Occupancy: | 95.0% | |
| Original Amortization: | 240 months | Underwritten NOI: | $19,850,501 | |
| Interest Only Period: | None | Underwritten NCF: | $18,082,637 | |
| First Payment Date: | June 1, 2024 | |||
| Maturity Date: | May 1, 2029 | Historical NOI | ||
| Additional Debt Type: | NAP | 2023 NOI: | $19,831,565 | |
| Additional Debt Balance : | NAP | 2022 NOI: | $19,957,034 | |
| Call Protection: | L(26),D(27),O(7) | 2021 NOI: | $18,470,013 | |
| Lockbox / Cash Management: | Hard / Springing | 2020 NOI: | $14,840,347 | |
| Reserves(2) | Financial Information | ||||||
| Initial | Monthly | Cap | Cut-off Date Loan Per SF: | $56 | |||
| Taxes: | $831,404 | $103,926 | NAP | Maturity Date Loan Per SF: | $49 | ||
| Insurance: | $0 | Springing | NAP | Cut-off Date LTV: | 30.6% | ||
| FF&E Reserve: | $0 | $98,215 | NAP | Maturity Date LTV: | 27.1% | ||
| TI/LC: | $0 | $179,816 | NAP | UW NOI DY: | 30.2% | ||
| Other(3): | $2,988,258 | $0 | NAP | UW NCF DSCR: | 2.73x | ||
| Sources and Uses | ||||||||
| Sources | Proceeds | % of Total | Uses | Proceeds | % of Total | |||
| Mortgage Loan | $66,000,000 | 92.9 | % | Loan Payoff(4) | $65,281,823 | 91.9 | % | |
| Borrower Sponsor Equity | $5,023,495 | 7.1 | % | Upfront Reserves | 3,819,662 | 5.4 | ||
| Closing Costs | 1,922,010 | 2.7 | ||||||
| Total Sources | $71,023,495 | 100.0 | % | Total Uses | $71,023,495 | 100.0 | % | |
| (1) | The borrower sponsor for the Sugarloaf Mills Mortgage Loan is related to the borrower sponsor for the City Creek Center Mortgage Loan. |
| (2) | See “Initial and Ongoing Reserves” below. |
| (3) | Other Reserves consists of an AMC Reserve ($1,867,325), Outstanding TI/LC Reserve ($1,059,738), Deferred Maintenance ($44,500) and a Gap Rent Reserve ($16,695). |
| (4) | The existing reserve balances were used to pay down the loan. |
The Loan. The fourth largest mortgage loan (the “Sugarloaf Mills Mortgage Loan”) is secured by the borrower’s fee interest in a 1,178,576 SF super regional mall located at 5900 Sugarloaf Parkway in Lawrenceville, Georgia (the “Sugarloaf Mills Property”). The Sugarloaf Mills Mortgage Loan is comprised of four pari passu notes, with an aggregate outstanding principal balance as of the Cut-off Date of $65,790,421. The Sugarloaf Mills Mortgage Loan was co-originated on April 24, 2024 by German American Capital Corporation and Barclays Capital Real Estate Inc. and accrues interest at a fixed rate of 8.01700% per annum. The Sugarloaf Mills Mortgage Loan has an initial term of five years and amortizes on a 20-year schedule. The scheduled maturity date of the Sugarloaf Mills Whole Loan is on May 1, 2029. The Sugarloaf Mills Mortgage Loan is evidenced by the controlling Note A-1-1, and non-controlling Notes A-1-2 and A-2-1 and A-2-2. GACC is selling Notes A-1-1 and A-1-2 with an aggregate outstanding principal balance of approximately $39,474,253 as of the Cut-off Date, and Barclays is selling Note A-2-1 and Note A-2-2 in the aggregate outstanding principal amount of approximately $26,316,168 as of the Cut-off Date.
The Property. The Sugarloaf Mills Property is a 1,178,576 SF super regional mall located in Lawrenceville, Georgia. The Sugarloaf Mills Property consists of one contiguous building and 6,231 parking spaces (for a parking ratio of 5.29 spaces per 1,000 SF) situated on a 115.54 acre site in Lawrenceville, Georgia, and has 130 tenants. The Sugarloaf Mills Property is anchored by Bass Pro Shops Outdoor World (“Bass Pro Shops”), Burlington, Medieval Times, and AMC Theatres along with a strong line-up of major tenants including Forever 21, Dave & Buster’s, Ross Dress for Less, Saks Fifth Avenue Off Fifth, and Off Broadway Shoes. The Sugarloaf Mills Property offers a diverse mix of traditional retailers along with outlet and entertainment options for visitors. The Sugarloaf Mills Property recently underwent
| THE INFORMATION IN THIS STRUCTURAL AND COLLATERAL TERM SHEET IS NOT COMPLETE AND MAY BE AMENDED PRIOR TO THE TIME OF SALE. THIS TERM SHEET IS NOT AN OFFER TO SELL THESE SECURITIES AND IT IS NOT A SOLICITATION OF AN OFFER TO BUY THESE SECURITIES IN ANY JURISDICTION WHERE THE OFFER OR SALE IS NOT PERMITTED. | ||
| 57 | ||
Retail – Super Regional Mall 5900 Sugarloaf Parkway Lawrenceville, GA 30043
| Collateral Asset Summary – Loan No. 4 Sugarloaf Mills | Cut-off Date Balance: Cut-off Date LTV: U/W NCF DSCR: U/W NOI Debt Yield: | $65,790,421 30.6% 2.73x 30.2% |
an approximately $600,000 remodel of the food court in 2023, which featured furniture and fixtures upgrades, bringing a modern look to a high traffic area in the Sugarloaf Mills Property. As of year-end 2023, sales for the in-line tenant category (approximately 10,000 SF) are $427 PSF, with an occupancy cost ratio of 11.0%. In-line (approximately 10,000 SF) sales are up 7.7% from 2019 in-line (approximately 10,000 SF) sales of $396 PSF. Additionally, the anchor tenants reported 2023 year-end sales of $80.3 million ($220 PSF), which represents a 7.1% growth in sales from 2019 sales of $75.0 million ($206 PSF). The growth in anchor sales is highlighted by Bass Pro Shops, which has increased sales to $42.3 million, representing a 14.6% increase since 2019.
The Sugarloaf Mills Property has maintained occupancy above 82% (93.1% including temporary tenants) and an NOI above $17.7 million since 2018, with the exception of 2020 due to the impact of the COVID-19 pandemic. In 2020, occupancy fell to 82.8% (93.1% including temporary tenants) and NOI decreased to $14.8 million, representing a 16.8% decrease over the prior year. The Sugarloaf Mills Property rebounded in 2021, reporting an NOI of $18.4 million, representing a 3.5% increase from 2019. The nearest other Medieval Times, the second largest tenant at the Sugarloaf Mills Property based on net rentable area, is located in Myrtle Beach, South Carolina, while the closest Bass Pro Shops, Dave & Busters, and Saks Fifth Avenue Off 5th are located over 25 miles away from the Sugarloaf Mills Property. GE Airsoft, which leases 23,510 SF at the Sugarloaf Mills Property, operates one of the largest indoor airsoft battlefields in the United States and does not have any other locations outside of the Sugarloaf Mills Property.
Major Tenants. The four anchor tenants are Bass Pro Shops, Medieval Times, Burlington and AMC Theatres.
AMC Theatres (74,693 SF; 6.3% of net rentable area; 7.3% of underwritten gross rent). AMC Theatres is the largest movie theater chain in the United States and in the world. AMC Theatres has approximately 1,000 theatres and more than 11,000 screens across the globe serving approximately 350 million guests annually. In the U.S., AMC operates approximately 660 theatres with 8,200 screens serving 265 million guests. At the Sugarloaf Mills Property, AMC Theatres has 18 screens and reported $6.6 million (approximately $366,000 per screen) in sales in 2023. AMC Theatres has been at the Sugarloaf Mills Property since December 2003 and their lease expires in December 2024 with three, five-year renewal options remaining.
Burlington (79,850 SF; 6.8% of net rentable area; 2.7% of underwritten gross rent). Burlington started as Burlington Coat Factory over 50 years ago selling off-price coats out of a factory building. Today, Burlington is a nationally recognized off-price retailer with more than 1,000 stores nationwide. Burlington sells a wide assortment of low-priced brand name ladies, men’s, kids/baby apparel and accessories, home décor items and much more. Burlington is a nationally recognized off-price retailer and a Fortune 500 company with its common stock traded on the New York Stock Exchange under the ticker symbol “BURL”. The company has over 1,000 stores across 46 states and Puerto Rico, principally under the name Burlington Stores. Burlington has been at the Sugarloaf Mills Property since 2001 and its lease expires in January 2027 with one, five-year renewal options remaining.
Medieval Times (87,200 SF; 7.4% of net rentable area; 2.6% of underwritten gross rent). Medieval Times is a dinner and show experience inspired by an 11th century dinner and tournament. Medieval Times is based upon authentic Medieval history and features the story of a noble family of the 11th Century. Medieval Times began with dinner entertainment complexes located in Majorca and Benidorm, Spain. The first North American Medieval Time in Kissimmee, Florida opened in December 1983. Since opening in North America, Medieval Times’ castles have entertained more than 72 million guests. The Lawrenceville Castle at the Sugarloaf Mills Property opened in 2001. Medieval Times reported $8.9 million ($102 PSF) in sales across the trailing twelve-month period ending December 2023 and its lease expires in July 2026 with three, 10-year renewal options remaining.
Bass Pro Shops (122,670 SF; 10.4% of net rentable area; 0.5% of underwritten gross rent). Bass Pro Shops, Inc., headquartered in Springfield, Missouri, is a retailer of fishing, hunting, camping and outdoor gear. The company's products include various types of sporting equipment, such as fishing poles, lures, nets, traps, etc. All products can be purchased online, via a company catalog or at one of the Bass Pro Shops retail locations. Big Cedar Lodge, a rustic resort and showcase for outdoor activities in Table Rock, Missouri, is owned by Bass Pro Shops. Bass Pro Shops currently pays 2.0% of sales in lieu of rent totaling $845,860 in 2023. Bass Pro Shops has been a tenant at the Sugarloaf Mills Property since 2001 and its lease expires in October 2026, with five, five-year renewal options remaining.
The following table presents certain information relating to historical occupancy for the Sugarloaf Mills Property inclusive of anchor tenants:
| Historical Occupancy | ||||
| 2020 | 2021 | 2022 | 2023 | 2/16/2024(1) |
| 82.8% | 82.6% | 86.4% | 87.0% | 86.6% |
| (1) | Based on the underwritten rent roll dated February 16, 2024. |
| THE INFORMATION IN THIS STRUCTURAL AND COLLATERAL TERM SHEET IS NOT COMPLETE AND MAY BE AMENDED PRIOR TO THE TIME OF SALE. THIS TERM SHEET IS NOT AN OFFER TO SELL THESE SECURITIES AND IT IS NOT A SOLICITATION OF AN OFFER TO BUY THESE SECURITIES IN ANY JURISDICTION WHERE THE OFFER OR SALE IS NOT PERMITTED. | ||
| 58 | ||
Retail – Super Regional Mall 5900 Sugarloaf Parkway Lawrenceville, GA 30043
| Collateral Asset Summary – Loan No. 4 Sugarloaf Mills | Cut-off Date Balance: Cut-off Date LTV: U/W NCF DSCR: U/W NOI Debt Yield: | $65,790,421 30.6% 2.73x 30.2% |
The following table presents certain information relating to the tenants (of which, certain tenants may have cotenancy provisions) at the Sugarloaf Mills Property:
| Tenant Summary(1) | |||||||||
Tenant | Credit Rating (Moody’s/ S&P/Fitch)(2) | Net Rentable Area (SF) | % of Net Rentable Area | U/W Base Rent | U/W Base Rent Per SF | % of Total U/W Base Rent | Lease Expiration | Termination Option (Y/N) | Renewal Options |
| Anchors | |||||||||
| Bass Pro Shops Outdoor World(3) | Ba3/BB/NR | 122,670 | 10.4% | $0 | $0.00 | 0.0% | 10/31/2026 | N | 5 x 5 |
| Medieval Times(4) | NR/NR/NR | 87,200 | 7.4% | 550,000 | $6.31 | 3.4 | 7/31/2026 | N | 3 x 10 |
| Burlington | NR/BB+/NR | 79,850 | 6.8% | 479,100 | $6.00 | 3.0 | 1/31/2027 | N | 1 x 5 |
| AMC Theatres | Caa1/CCC+/NR | 74,693 | 6.3% | 1,434,106 | $19.20 | 8.9 | 12/31/2024 | N | 3 x 5 |
| Major Tenants | |||||||||
| Dave & Buster’s | NR/NR/NR | 61,160 | 5.2% | 1,506,982 | $24.64 | 9.4 | 5/31/2026 | N | 2 x 5 |
| Altitude Trampoline Park | NR/NR/NR | 40,090 | 3.4% | 280,630 | $7.00 | 1.7 | 2/29/2032 | N | None |
| Ross Dress For Less(5) | A2/BBB+/NR | 28,350 | 2.4% | 432,338 | $15.25 | 2.7 | 1/31/2028 | Y | None |
| Saks Fifth Avenue Off 5th(3) | NR/NR/NR | 28,100 | 2.4% | 0 | $0.00 | 0.0 | 11/30/2026 | N | 1 x 5 |
| American Freight | NR/NR/NR | 25,550 | 2.2% | 255,500 | $10.00 | 1.6 | 12/31/2024 | N | None |
| Your Home Furniture | NR/NR/NR | 24,850 | 2.1% | 68,338 | $2.75 | 0.4 | 2/28/2026 | N | None |
| Books-A-Million | NR/NR/NR | 23,370 | 2.0% | 180,000 | $7.70 | 1.1 | 1/31/2025 | N | None |
| GE Airsoft | NR/NR/NR | 23,510 | 2.0% | 64,653 | $2.75 | 0.4 | 2/28/2025 | N | None |
| Forever 21(3) | NR/NR/NR | 20,150 | 1.7% | 0 | $0.00 | 0.0 | 1/31/2026 | N | None |
| Off Broadway Shoes | NR/NR/NR | 20,680 | 1.8% | 500,000 | $24.18 | 3.1 | 1/31/2029 | N | None |
| In-line >10,000 SF | 47,637 | 4.0% | 414,978 | $8.71 | 2.6 | ||||
| In-line <10,000 SF | 312,916 | 26.6% | 9,873,366 | $31.55 | 61.6 | ||||
| Other | 1 | 0.0% | 1,200 | $1,200.00 | 0.0 | ||||
| Total Occupied | 1,020,777 | 86.6% | $16,041,189 | $15.71 | 100.0% | ||||
| Vacant | 157,799 | 13.4% | |||||||
| Total | 1,178,576 | 100.0% | |||||||
| (1) | Based on the underwritten rent roll dated February 16, 2024. |
| (2) | Certain ratings are those of the parent company whether or not the parent guarantees the lease. |
| (3) | Brass Pro Shops Outdoor World, Saks Fifth Avenue Off 5th and Forever 21 all play percentage rent in lieu of base rent. The tenants pay 2%, 3.5% and 14.4% of sales per year in percentage rent, respectively. |
| (4) | The second largest tenant at the Sugarloaf Mills Property, Medieval Times, subleases its space (representing approximately 7.4% of the net rentable area at the Sugarloaf Mills Property) from Mills Enterprises, Inc, an affiliate of the related borrower sponsor. The term of the related sublease expires on July 31, 2026, subject to 3, 10-year renewal options (with the term of the prime lease running concurrent with the renewal options provided for in the sublease). The lender underwrote the rent due under the prime lease (which is higher than the rent due under the sublease). |
| (5) | If at any time the applicable zoning does not permit the retail sale in the store of all the types of merchandise customarily sold in tenant’s other stores, tenant may, without waiving any other rights Ross Dress for Less may terminate the lease by giving the borrower 30 days’ prior written notice thereof. Ross Dress of Less’ termination notice will be required to include a written specification of the unamortized cost of any leasehold improvements made to the store. The borrower will be required to pay such unamortized cost to Ross Dress for Less, within 30 days following the date of termination. |
| Tenant Sales Per SF(1) | ||||
| 2019 | 2021 | 2022 | 2023 | |
| Tenants < 10,000 SF | ||||
| Occupancy Cost(2)(3) | 13.0% | 11.1% | 11.0% | 10.9% |
| Sales PSF | $396 | $429 | $419 | $427 |
| (1) | All sales information presented above is based upon information provided by the borrower sponsor. In certain instances, sales figures represent estimates because the tenants are not required to report, or otherwise may not have reported sales information on a timely basis. Further, because sales are self-reported, such information is not independently verified by the borrower sponsor. |
| (2) | Occupancy Cost was not calculated during periods affected by COVID-19 due to incomplete sales reporting by tenants. |
| (3) | Occupancy Cost is based on current gross rent paid by tenants and sales of each respective year. |
| THE INFORMATION IN THIS STRUCTURAL AND COLLATERAL TERM SHEET IS NOT COMPLETE AND MAY BE AMENDED PRIOR TO THE TIME OF SALE. THIS TERM SHEET IS NOT AN OFFER TO SELL THESE SECURITIES AND IT IS NOT A SOLICITATION OF AN OFFER TO BUY THESE SECURITIES IN ANY JURISDICTION WHERE THE OFFER OR SALE IS NOT PERMITTED. | ||
| 59 | ||
Retail – Super Regional Mall 5900 Sugarloaf Parkway Lawrenceville, GA 30043
| Collateral Asset Summary – Loan No. 4 Sugarloaf Mills | Cut-off Date Balance: Cut-off Date LTV: U/W NCF DSCR: U/W NOI Debt Yield: | $65,790,421 30.6% 2.73x 30.2% |
The following table presents certain information relating to the tenants with the highest overall sales in the order of their December 31, 2023 sales.
| Top Tenants by Total Sales(1) | |||||||||
| Tenant | SF | % NRA | Lease Start | Base Rent | 2022 Sales | 2022 Sales PSF | 2023 Sales | 2023 Sales PSF | 2023 Occ Cost(2) |
| Bass Pro Shops Outdoor World(3) | 122,670 | 10.4% | 10/29/2001 | $0 | $42,616,000 | $347 | $42,293,019 | $345 | 2.2% |
| Burlington | 79,850 | 6.8% | 11/2/2001 | $479,100 | $22,860,000 | $286 | $22,545,242 | $282 | 2.6% |
| Dave & Buster's | 61,160 | 5.2% | 10/29/2001 | $1,506,982 | $13,972,000 | $228 | $13,458,132 | $220 | 11.7% |
| Nike Factory Store | 9,288 | 0.8% | 2/1/2022 | $353,819 | $12,446,000 | $1,340 | $12,304,480 | $1,325 | 3.1% |
| Medieval Times | 87,200 | 7.4% | 11/11/2001 | $550,000 | $8,571,000 | $98 | $8,916,363 | $102 | 6.2% |
| AMC Theatres | 74,693 | 6.3% | 12/17/2003 | $1,434,106 | $5,586,000 | $75 | $6,579,462 | $88 | 23.8% |
| H&M(4) | 20,000 | 1.7% | 2/23/2017 | $0 | $6,374,000 | $319 | $5,591,295 | $280 | 9.3% |
| Lego Factory Outlet | 4,298 | 0.4% | 4/1/2023 | $265,971 | $4,537,000 | $1,056 | $4,850,094 | $1,128 | 6.0% |
| Adidas | 8,725 | 0.7% | 3/1/2012 | $410,075 | $5,813,000 | $666 | $4,750,662 | $544 | 9.3% |
| The Finish Line | 4,653 | 0.4% | 5/1/2023 | $88,965 | $3,367,000 | $724 | $4,370,618 | $939 | 5.0% |
| (1) | All sales information presented herein with respect to the Sugarloaf Mills Property is based upon information provided by the borrower sponsor. In certain instances, sales figures represent estimates because the tenants are not required to report, or otherwise may not have reported sales information on a timely basis. Further, because sales are self-reported, such information is not independently verified by the borrower sponsor. |
| (2) | 2023 Occ Cost is based on U/W Gross Rent which includes Base Rent, recoveries (fixed CAM, tax reimbursements and utility reimbursements) and marketing. |
| (3) | Bass Pro Shops Outdoor World pays 2.0% of percentage rent in lieu of Base Rent, amounting to $845,860 in 2023. |
| (4) | H&M pays 8.0% percentage rent in lieu of base rent amounting to $447,304 in 2023. |
The following table presents certain information relating to the lease rollover schedule at the Sugarloaf Mills Property, based on initial lease expiration dates:
| Lease Rollover Schedule(1)(2) | |||||||
| Year Ending December 31 | Expiring Owned GLA | % of Owned GLA | Cumulative % of Owned GLA | U/W Base Rent | % of Total U/W Base Rent | U/W Base Rent $ per SF | # of Expiring Leases |
| MTM | 13,566 | 1.2% | 1.2% | $369,342 | 2.3% | $27.23 | 4 |
| 2024 | 125,591 | 10.7% | 11.8% | 2,473,346 | 15.4% | $19.69 | 11 |
| 2025 | 164,898 | 14.0% | 25.8% | 2,557,080 | 15.9% | $15.51 | 30 |
| 2026 | 412,842 | 35.0% | 60.8% | 4,305,891 | 26.8% | $10.43 | 27 |
| 2027 | 108,472 | 9.2% | 70.0% | 1,620,239 | 10.1% | $14.94 | 16 |
| 2028 | 39,280 | 3.3% | 73.4% | 857,065 | 5.3% | $21.82 | 7 |
| 2029 | 67,727 | 5.7% | 79.1% | 1,327,001 | 8.3% | $19.59 | 8 |
| 2030 | 8,222 | 0.7% | 79.8% | 120,749 | 0.8% | $14.69 | 3 |
| 2031 | 10,785 | 0.9% | 80.7% | 375,719 | 2.3% | $34.84 | 3 |
| 2032 | 45,173 | 3.8% | 84.6% | 530,658 | 3.3% | $11.75 | 3 |
| 2033 | 18,399 | 1.6% | 86.1% | 1,238,015 | 7.7% | $67.29 | 8 |
| 2034 | 5,822 | 0.5% | 86.6% | 266,084 | 1.7% | $45.70 | 3 |
| 2035 & Thereafter | 0 | 0.0% | 86.6% | 0 | 0.0% | $0.00 | 8 |
| Vacant | 157,799 | 13.4% | 100.0% | NAP | NAP | NAP | NAP |
| Total / Wtd. Avg. | 1,178,576 | 100.0% | 100.0% | $16,041,189 | 100.0% | $15.71 | 131 |
| (1) | Based on the underwritten rent roll as of February 16, 2024. |
| (2) | Certain tenants may have lease termination options that are not reflected in the Lease Rollover Schedule. |
| THE INFORMATION IN THIS STRUCTURAL AND COLLATERAL TERM SHEET IS NOT COMPLETE AND MAY BE AMENDED PRIOR TO THE TIME OF SALE. THIS TERM SHEET IS NOT AN OFFER TO SELL THESE SECURITIES AND IT IS NOT A SOLICITATION OF AN OFFER TO BUY THESE SECURITIES IN ANY JURISDICTION WHERE THE OFFER OR SALE IS NOT PERMITTED. | ||
| 60 | ||
Retail – Super Regional Mall 5900 Sugarloaf Parkway Lawrenceville, GA 30043
| Collateral Asset Summary – Loan No. 4 Sugarloaf Mills | Cut-off Date Balance: Cut-off Date LTV: U/W NCF DSCR: U/W NOI Debt Yield: | $65,790,421 30.6% 2.73x 30.2% |
The following table presents certain information relating to the historical operating performance and Underwritten Net Cash Flow at the Sugarloaf Mills Property:
| Cash Flow Analysis(1) | |||||||
| 2019 | 2020 | 2021 | 2022 | 2023 | U/W | U/W Per SF | |
| Base Rent | $13,548,657 | $12,797,849 | $12,047,605 | $12,880,243 | $14,860,474 | $16,041,189 | $13.61 |
| Rent Steps | 0 | 0 | 0 | 0 | 0 | 197,680 | 0.17 |
| Gross Up Vacancy | 0 | 0 | 0 | 0 | 0 | 314,956 | 0.27 |
| Gross Potential Rent | $13,548,657 | $12,797,849 | 12,047,605 | 12,880,243 | 14,860,474 | $16,553,826 | $14.05 |
| Total Reimbursements | 5,325,588 | 4,972,020 | 4,971,875 | 5,205,939 | 5,257,932 | 5,607,271 | 4.76 |
| Other Income | 6,592,893 | 5,500,733 | 8,776,155 | 9,414,529 | 7,709,782 | 7,530,342 | 6.39 |
| Total Gross Income | $25,467,138 | $23,270,602 | $25,795,635 | $27,500,711 | $27,828,188 | $29,691,439 | $25.19 |
| (Vacancy / Bad Debt) | (70,657) | (2,051,073) | (364,343) | 213,702 | (202,670) | (1,484,572) | (1.26) |
| Effective Gross Income | $25,396,481 | $21,219,529 | $25,431,292 | $27,714,413 | $27,625,518 | $28,206,867 | $23.93 |
| Management Fee | 876,136 | 726,633 | 876,476 | 955,889 | 1,003,010 | 968,556 | 0.82 |
| Real Estate Taxes | 1,259,858 | 1,243,133 | 1,182,889 | 1,352,816 | 1,248,637 | 1,247,106 | 1.06 |
| Insurance | 304,006 | 313,586 | 326,224 | 343,503 | 520,428 | 587,670 | 0.50 |
| Other Expenses(2) | 5,118,969 | 4,095,803 | 4,575,690 | 5,105,171 | 5,021,878 | 5,553,034 | 4.71 |
| Total Expenses | $7,558,969 | $6,379,155 | $6,961,279 | $7,757,379 | $7,793,953 | $8,356,366 | 7.09 |
| Net Operating Income | $17,837,512 | $14,840,374 | $18,470,013 | $19,957,034 | $19,831,565 | $19,850,501 | $16.84 |
| Capital Expenditures | 0 | 0 | 0 | 0 | 0 | 589,288 | 0.50 |
| TI/LC | 0 | 0 | 0 | 0 | 0 | 1,178,576 | 1.00 |
| Net Cash Flow | $17,837,512 | $14,840,374 | $18,470,013 | $19,957,034 | $19,831,565 | $18,082,637 | $15.34 |
| Occupancy (%) | 87.3% | 82.8% | 82.6% | 86.4% | 87.0% | 86.6% | |
| NCF DSCR | 2.69x | 2.24x | 2.78x | 3.01x | 2.99x | 2.73x | |
| NOI Debt Yield | 27.1% | 22.6% | 28.1% | 30.3% | 30.1% | 30.2% | |
| (1) | Based on the underwritten rent roll as of February 16, 2024. |
| (2) | Other Expenses include general and administrative, repairs and maintenance, security, utility, marketing, other expenses, ground rent and janitorial expenses. |
Appraisals. According to the appraisal, the Sugarloaf Mills Property had an “as-is” appraised value of $215,000,000 as of February 22, 2024.
Property | Appraised Value | Capitalization Rate |
| Sugarloaf Mills | $215,000,000 | 8.50% |
Environmental Matters. According to the Phase I environmental report, dated March 4, 2024, there was no evidence of any recognized environmental conditions at the Sugarloaf Mills Property.
The Market. The Sugarloaf Mills Property is located in within the Atlanta-Sandy Springs-Alpharetta, Georgia Metropolitan Statistical Area (the “Atlanta MSA”) within the Gwinnet Mall/Duluth retail market. The Atlanta MSA comprises 29 counties, with the majority of the region's population and employment concentrated in the core counties of Clayton, Cobb, DeKalb, Fulton, and Gwinnet. The Atlanta MSA is the ninth-largest MSA in the nation. According to the appraisal, Atlanta continues to attract new businesses and sustain net in-migration.
According to the appraisal, construction activity in the Atlanta retail market was fairly strong and steady over most of the past decade. Growth in the Atlanta retail market has been driven by continued regional in-migration, corporate expansion, and overall strong economic growth. Construction activity was steady in 2022 and 2023 when the inventory in the market grew by 1.2 million SF and 1.4 million SF, respectively.
Within the Gwinnett Mall/Duluth retail submarket, retail is the largest subtype, accounting for approximately 7.1 million SF. Rents are approximately $23.08/SF, which is a 6.6% increase from 2022. Vacancy in the retail submarket is 7.8%, which is near the same level it was in 2022. During this period, there has been negative absorption of 23,804 SF.
| THE INFORMATION IN THIS STRUCTURAL AND COLLATERAL TERM SHEET IS NOT COMPLETE AND MAY BE AMENDED PRIOR TO THE TIME OF SALE. THIS TERM SHEET IS NOT AN OFFER TO SELL THESE SECURITIES AND IT IS NOT A SOLICITATION OF AN OFFER TO BUY THESE SECURITIES IN ANY JURISDICTION WHERE THE OFFER OR SALE IS NOT PERMITTED. | ||
| 61 | ||
Retail – Super Regional Mall 5900 Sugarloaf Parkway Lawrenceville, GA 30043
| Collateral Asset Summary – Loan No. 4 Sugarloaf Mills | Cut-off Date Balance: Cut-off Date LTV: U/W NCF DSCR: U/W NOI Debt Yield: | $65,790,421 30.6% 2.73x 30.2% |
The following tables presents certain information relating to the demographics of the Sugarloaf Mills Property:
| Demographics Summary(1)(2) | ||||||||
| Property Name | City, State | Mortgage Loan Cut-off Date Balance | 1-mile Population | 3-mile Population | 5-mile Population | 1-mile Avg Household Income | 3-mile Avg Household Income | 5-mile Avg Household Income |
| Sugarloaf Mills | Lawrenceville, GA | $65,790,421 | 8,886 | 83,114 | 245,453 | $115,388 | $106,148 | $99,287 |
| (1) | Source: Appraisal. |
| (2) | Values are as of 2023. |
The Borrower and the Borrower Sponsors. The borrower for the Sugarloaf Mills Mortgage Loan is Sugarloaf Mills Limited Partnership, a Delaware limited partnership and single purpose entity with two independent managers. Legal counsel to the borrower delivered a non-consolidation opinion in connection with the origination of the Sugarloaf Mills Mortgage Loan.
The borrower is a 50/50 joint venture between the borrower sponsors, which is indirectly owned and controlled by affiliates of Simon Property Group, L.P. (“Simon”) and Kan Am Group (“Kan Am”).
Simon is a real estate investment trust engaged in the ownership of premier shopping, dining, entertainment and mixed-use destinations and an S&P 100 company (Simon Property Group, NYSE: SPG). Simon’s properties across North America, Europe and Asia provide community gathering places for millions of people every day and generate billions of dollars in annual sales.
Kan Am was founded in Germany in 1978 and its main offices are located in Munich, Frankfurt and Atlanta. Kan Am is one of Germany’s leading sponsors of international real estate funds and has a wide-ranging expertise with real estate located in the U.S., Australia, Eastern and Western Europe. Since inception, Kan Am has sponsored a total of 44 real estate funds and private placements for private and institutional investors. To date, investors have invested more than $1.6 billion in the Kan Am closed-end real estate funds.
Property Management. The Sugarloaf Mills Property is managed Simon Management Associates II, LLC, an affiliate of the non-recourse carveout guarantor.
Initial and Ongoing Reserves. At origination, the borrower was required to deposit approximately $1,867,325 into an AMC Reserve, $1,059,738 into an outstanding TI/LC reserve, $831,404 into a real estate tax reserve, $44,500 into a required repairs reserve and $16,695 into a gap rent reserve.
Tax Reserve – The borrower is required to escrow 1/12th of the annual estimated tax payments payable during the next ensuing 12 months on a monthly basis, (initially, $103,926).
Insurance Reserve – The borrower is required to escrow 1/12th of the annual estimated insurance payments on a monthly basis, unless the Sugarloaf Mills Property is insured under a blanket policy meeting the requirements set forth in the related loan agreement.
Replacement Reserve – The borrower is required to deposit monthly, with or on behalf of the lender, an amount equal to approximately $98,215.
TI/LC Reserve – The borrower is required to deposit monthly, with or on behalf of the lender, an amount equal to approximately $179,816.
Lockbox / Cash Management. The Sugarloaf Mills Mortgage Loan is structured with a hard lockbox and springing cash management. The borrower is required to cause all tenants at the Sugarloaf Mills Property to pay rents directly into a lockbox account controlled by the lender (the “Lockbox Account”), and to deposit any rents otherwise received by the borrower or the property manager into the Lockbox Account within two business days after receipt. Prior to a Lockbox Event, the borrower may utilize the Lockbox Account as the borrower’s operating account. During the continuance of a Lockbox Event, the borrower will no longer have access to the Lockbox Account, and all funds deposited into the Lockbox Account are required to be swept on a weekly basis into a deposit account controlled by the lender, to be applied and disbursed in accordance with the Sugarloaf Mills Mortgage Loan documents. During the continuance of a Lockbox Event, any excess cash is required to be deposited into an eligible account (the “Excess Cash Flow Reserve Account”) and held by the lender as additional security for the Sugarloaf Mills Mortgage Loan; provided, that, funds on deposit in the Excess Cash Flow Reserve Account will be made available to the borrower for the payment of certain property-level expenses and other uses as set forth in the Sugarloaf Mills Mortgage Loan documents.
A “Lockbox Event” means the occurrence of: (a) an event of default; (b) a bankruptcy action of the borrower; (c) a bankruptcy action of the property manager if manager is an affiliate of the borrower and provided the property manager is not replaced within 60 days with a qualified manager; (d) a Debt Yield Trigger Event; or (e) a Major Tenant Trigger Event.
| THE INFORMATION IN THIS STRUCTURAL AND COLLATERAL TERM SHEET IS NOT COMPLETE AND MAY BE AMENDED PRIOR TO THE TIME OF SALE. THIS TERM SHEET IS NOT AN OFFER TO SELL THESE SECURITIES AND IT IS NOT A SOLICITATION OF AN OFFER TO BUY THESE SECURITIES IN ANY JURISDICTION WHERE THE OFFER OR SALE IS NOT PERMITTED. | ||
| 62 | ||
Retail – Super Regional Mall 5900 Sugarloaf Parkway Lawrenceville, GA 30043
| Collateral Asset Summary – Loan No. 4 Sugarloaf Mills | Cut-off Date Balance: Cut-off Date LTV: U/W NCF DSCR: U/W NOI Debt Yield: | $65,790,421 30.6% 2.73x 30.2% |
A “Debt Yield Trigger Event” means, as of any date of determination, the debt yield based on the trailing four calendar quarter period immediately preceding such date of determination is less than 21.0% for two consecutive calendar quarters.
A “Major Tenant Trigger Event” means the period commencing on the earlier to occur of (i) bankruptcy event of a Major Tenant (as defined below), (ii) a Major Tenant Operations Event (as defined below) or (iii) a Major Tenant Renewal Event (as defined below).
A “Major Tenant” means (i) Bass Pro Shops, (ii) Medieval Times, (iii) Burlington Coat, (iv) AMC Theaters, (v) Dave & Buster’s and/or (vi) any replacement tenant that occupies at least 50% of the square footage of the Sugarloaf Mills Property occupied by one or more of the foregoing.
A “Major Tenant Renewal Event” means, unless a Major Tenant lease has been renewed or extended on terms approved in writing by lender, the earlier of (x) the date on which such Major Tenant gives notice that it will not be renewing its lease in accordance with its terms, and (y) the date that is six months prior to the date of lease expiration.
A “Major Tenant Operations Event” means the date on which a Major Tenant “goes dark” or vacates, on a permanent basis (or for more than 90 consecutive days with an intention to vacate permanently), its demised space at the Sugarloaf Mills Property; provided that none of the following will constitute a Major Tenant Operations Event: (a) a temporary closure in connection with a restoration or renovation, (b) any other temporary closure with a duration of less than 90 days, (c) a temporary closure in compliance with applicable law, regulations and/or governmental mandates or (d) a temporary closure related to COVID-19 pandemic mandated stay-at-home closures.
Current Mezzanine or Secured Subordinate Indebtedness. None.
Permitted Future Mezzanine or Secured Subordinate Indebtedness. Not Permitted.
Release of Collateral. The Sugarloaf Mills Mortgage Loan documents permit the borrower to obtain the release of non-income producing portions of the Sugarloaf Mills Property in connection with a transfer to third parties or affiliates of the borrower without the payment of a release price provided that, among other conditions, the borrower satisfies customary REMIC requirements. If the LTV is less than 125% after the transfer then the borrower is required to prepay the Sugarloaf Mills Mortgage Loan documents without a yield maintenance premium equal to the least of: (i) if the release parcel was sold, the net proceeds of an arm’s-length sale; (ii) the net condemnation proceeds (if applicable); (iii) the fair market value of the parcel at the time of release; or (iv) an amount such that the LTV ratio does not increase after the release, unless the lender receives an opinion that if such prepayment does not occur, the securitization will not fail to maintain its status as a REMIC.
Ground Lease. None.
| THE INFORMATION IN THIS STRUCTURAL AND COLLATERAL TERM SHEET IS NOT COMPLETE AND MAY BE AMENDED PRIOR TO THE TIME OF SALE. THIS TERM SHEET IS NOT AN OFFER TO SELL THESE SECURITIES AND IT IS NOT A SOLICITATION OF AN OFFER TO BUY THESE SECURITIES IN ANY JURISDICTION WHERE THE OFFER OR SALE IS NOT PERMITTED. | ||
| 63 | ||
Hospitality – Full Service 226 West Jackson Boulevard Chicago, IL 60606
| Collateral Asset Summary – Loan No. 5 Hilton Garden Inn & Canopy - | Cut-off Date Balance: Cut-off Date LTV: U/W NCF DSCR: U/W NOI Debt Yield: | $65,000,000 40.5% 1.68x 14.6% |
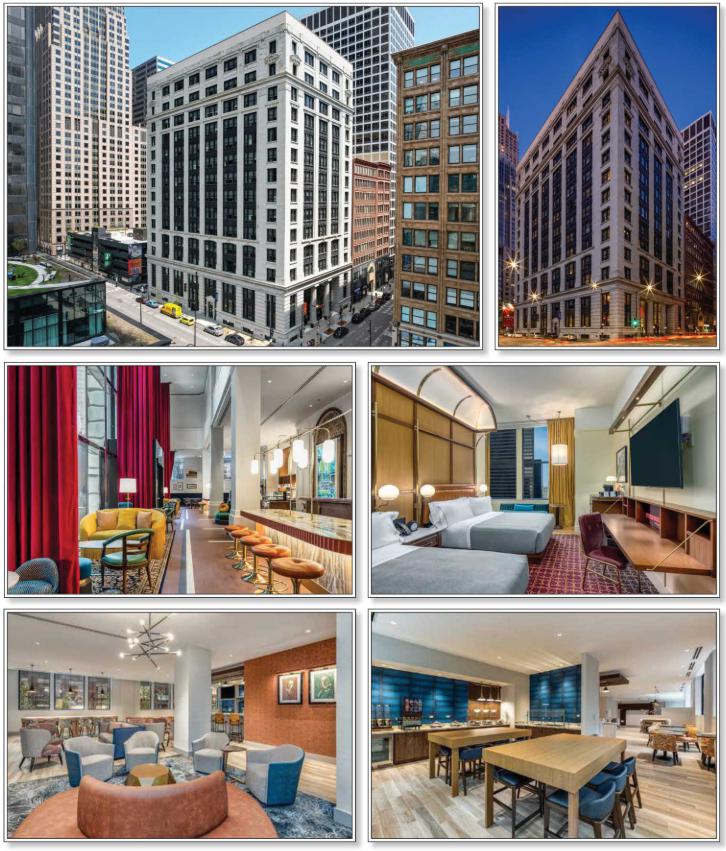
| THE INFORMATION IN THIS STRUCTURAL AND COLLATERAL TERM SHEET IS NOT COMPLETE AND MAY BE AMENDED PRIOR TO THE TIME OF SALE. THIS TERM SHEET IS NOT AN OFFER TO SELL THESE SECURITIES AND IT IS NOT A SOLICITATION OF AN OFFER TO BUY THESE SECURITIES IN ANY JURISDICTION WHERE THE OFFER OR SALE IS NOT PERMITTED. | ||
| 64 | ||
Hospitality – Full Service 226 West Jackson Boulevard Chicago, IL 60606
| Collateral Asset Summary – Loan No. 5 Hilton Garden Inn & Canopy - | Cut-off Date Balance: Cut-off Date LTV: U/W NCF DSCR: U/W NOI Debt Yield: | $65,000,000 40.5% 1.68x 14.6% |
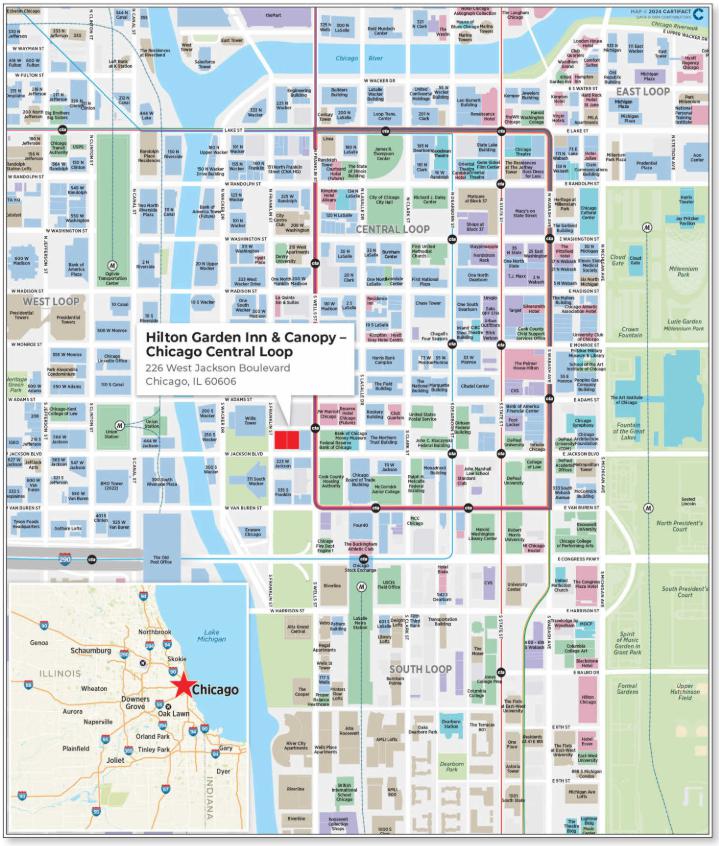
| THE INFORMATION IN THIS STRUCTURAL AND COLLATERAL TERM SHEET IS NOT COMPLETE AND MAY BE AMENDED PRIOR TO THE TIME OF SALE. THIS TERM SHEET IS NOT AN OFFER TO SELL THESE SECURITIES AND IT IS NOT A SOLICITATION OF AN OFFER TO BUY THESE SECURITIES IN ANY JURISDICTION WHERE THE OFFER OR SALE IS NOT PERMITTED. | ||
| 65 | ||
Hospitality – Full Service 226 West Jackson Boulevard Chicago, IL 60606
| Collateral Asset Summary – Loan No. 5 Hilton Garden Inn & Canopy - | Cut-off Date Balance: Cut-off Date LTV: U/W NCF DSCR: U/W NOI Debt Yield: | $65,000,000 40.5% 1.68x 14.6% |
| Mortgage Loan Information | Property Information | |||
| Loan Seller: | CREFI | Single Asset / Portfolio: | Single Asset | |
| Loan Purpose: | Refinance | Property Type - Subtype: | Hospitality - Full Service | |
| Borrower Sponsor(s): | Blue Glacier Fund II, L.P., 1907 Management GP, LLC and Phoenix RD Fund II LLC | Collateral: | Fee | |
| Borrower(s): | Phoenix 226 Central Loop Owner, LLC and Phoenix 226 Central Loop Operator, LLC | Location: | Chicago, IL | |
| Original Balance: | $65,000,000 | Year Built / Renovated: | 1904 / 2021 | |
| Cut-off Date Balance: | $65,000,000 | Property Management: | Aimbridge Hospitality, LLC | |
| % by Initial UPB: | 6.4% | Size: | 350 Rooms | |
| Interest Rate: | 7.60000% | Appraised Value / Per Room: | $160,400,000 / $458,286 | |
| Note Date: | June 6, 2024 | Appraisal Date: | March 7, 2024 | |
| Original Term: | 60 months | Occupancy: | 77.3% (as of May 31, 2024) | |
| Amortization: | Interest Only | UW Economic Occupancy: | 77.3% | |
| Original Amortization: | NAP | Underwritten NOI: | $9,475,432 | |
| Interest Only Period: | 60 months | Underwritten NCF: | $8,427,727 | |
| First Payment Date: | July 6, 2024 | |||
| Maturity Date: | June 6, 2029 | Historical NOI | ||
| Additional Debt Type: | NAP | Most Recent NOI: | $9,380,054 (TTM May 31, 2024) | |
| Additional Debt Balance: | NAP | 2023 NOI(3): | $9,297,246 | |
| Call Protection: | L(25),D(28),O(7) | 2022 NOI(3): | $7,384,793 | |
| Lockbox / Cash Management: | Hard / Springing | 2021 NOI: | NAV | |
| Reserves(1) | Financial Information | ||||||
| Initial | Monthly | Cap | Cut-off Date Loan Per Room: | $185,714 | |||
| Taxes: | $223,655 | $44,731 | NAP | Maturity Date Loan Per Room: | $185,714 | ||
| Insurance: | $307,362 | $30,736 | NAP | Cut-off Date LTV: | 40.5% | ||
| FF&E Reserve: | $0 | $65,049 | NAP | Maturity Date LTV: | 40.5% | ||
| Deferred Maintenance: | $166,654 | $0 | NAP | UW NOI DY: | 14.6% | ||
| Other(2): | $0 | $273,311 | $1,200,000 | UW NCF DSCR: | 1.68x | ||
| Sources and Uses | ||||||||
| Sources | Proceeds | % of Total | Uses | Proceeds | % of Total | |||
| Mortgage Loan | $65,000,000 | 65.7 | % | Loan Payoff(4) | $95,122,538 | 96.1 | % | |
| Borrower Sponsor Equity | 33,996,328 | 34.3 | Closing Costs | 3,176,119 | 3.2 | |||
| Upfront Reserves | 697,671 | 0.7 | ||||||
| Total Sources | $98,996,328 | 100.0 | % | Total Uses | $98,996,328 | 100.0 | % | |
| (1) | See “Initial and Ongoing Reserves” below. |
| (2) | Other Reserves consists of a (i) monthly hotel management agreement reserve of approximately $190,940, (ii) monthly put price reserve of approximately $82,371 and (iii) springing monthly seasonality reserve that is capped at $1,200,000. See “Initial and Ongoing Reserves” below. |
| (3) | The increase in financial performance from 2022 to 2023 is primarily attributable to increased occupancy at the Hilton Garden Inn & Canopy – Chicago Central Loop Property. The Hilton Garden Inn & Canopy – Chicago Central Loop Property was purchased by the Phoenix RD Fund II LLC related borrower sponsors in 2019 and subsequently developed into a dual branded Hilton Garden Inn and Canopy. The Hilton Garden Inn Property (as defined below) was completed in September 2021 and the Canopy by Hilton Property (as defined below) was completed in November 2021. The increase in occupancy from 2022 to 2023 is driven by the ramp up period following the renovation. |
| (4) | The proceeds of the Hilton Garden Inn & Canopy – Chicago Central Loop Mortgage Loan were used to repay the prior mortgage loan, which was in maturity default, in a discounted payoff that resulted in an approximately $4,000,000 discount to the outstanding principal balance of the prior mortgage loan. |
| THE INFORMATION IN THIS STRUCTURAL AND COLLATERAL TERM SHEET IS NOT COMPLETE AND MAY BE AMENDED PRIOR TO THE TIME OF SALE. THIS TERM SHEET IS NOT AN OFFER TO SELL THESE SECURITIES AND IT IS NOT A SOLICITATION OF AN OFFER TO BUY THESE SECURITIES IN ANY JURISDICTION WHERE THE OFFER OR SALE IS NOT PERMITTED. | ||
| 66 | ||
Hospitality – Full Service 226 West Jackson Boulevard Chicago, IL 60606
| Collateral Asset Summary – Loan No. 5 Hilton Garden Inn & Canopy - | Cut-off Date Balance: Cut-off Date LTV: U/W NCF DSCR: U/W NOI Debt Yield: | $65,000,000 40.5% 1.68x 14.6% |
The Loan. The fifth largest mortgage loan (the “Hilton Garden Inn & Canopy - Chicago Central Loop Mortgage Loan”) is secured by the borrowers’ fee interest in a 16-story, 350-room full-service dual-brand hotel located in Chicago, Illinois (the “Hilton Garden Inn & Canopy - Chicago Central Loop Property”). The Hilton Garden Inn & Canopy - Chicago Central Loop Mortgage Loan was originated on June 6, 2024 by CREFI and accrues interest at a fixed rate of 7.60000% per annum. The Hilton Garden Inn & Canopy - Chicago Central Loop Mortgage Loan has an initial term of five-years and is interest-only for the full term. The scheduled maturity date of the Hilton Garden Inn & Canopy - Chicago Central Loop Mortgage Loan is the payment date that occurs on June 6, 2029.
The Property. The Hilton Garden Inn & Canopy - Chicago Central Loop Property is a 16-story, 350-room, full-service, dual-brand hospitality property located at 226 West Jackson Boulevard in Chicago, Illinois. The Hilton Garden Inn & Canopy - Chicago Central Loop Property was originally constructed in 1904 and subsequently renovated in 2021. The Hilton Garden Inn & Canopy - Chicago Central Loop Property consists of a 135-room Hilton Garden Inn located on floors 3-7 (the “Hilton Garden Inn Property”) and a 215-room Canopy by Hilton located on floors 8-14 (the “Canopy by Hilton Property”). Each of the Hilton Garden Inn Property and the Canopy by Hilton Property are party to franchise agreements with Hilton Franchise Holding LLC, expiring on September 30, 2041 and November 30, 2041, respectively.
The Hilton Garden Inn & Canopy - Chicago Central Loop Property benefits from its location within the Central Loop of Chicago which has nearby demand generators including Millennium Park, Art Institute of Chicago, the Chicago Riverwalk and the University of Chicago. The Hilton Garden Inn & Canopy - Chicago Central Loop Property is also in close proximity to major corporations such as Amazon, Accenture, American Airlines, Boeing, JPMorgan Chase, Kraft Heinz, Pepsi, and Tyson Foods amongst others. Additionally, the Hilton Garden Inn & Canopy - Chicago Central Loop Property is located across the street from the Willis Tower Chicago which features Convene, an approximately 70,000 square foot meeting venue. According to the appraisal, the estimated demand segmentation for the Hilton Garden Inn & Canopy - Chicago Central Loop Property consisted of 38.0% leisure, 35.0% group, 25.0% commercial, and 2.0% extended stay.
The Hilton Garden Inn Property and the Canopy by Hilton Property have separate entrances, with the Hilton Garden Inn Property using 245 South Franklin Street and the Canopy by Hilton Property using 226 West Jackson Boulevard. The two hotels have interconnected lobbies and public space on a split-level first floor, with separate elevators. The ground level lobby area of the Canopy by Hilton Property features a café and bar, while level 1.5 features a shared business center, 1,299 square feet of meeting rooms, and a guest retreat. Level two features the Canopy by Hilton’s fitness center and transfer lounge, an area for pre-arrival or post-checkout guests that includes luggage lockers, shower and bathroom amenities. The lobby of the Hilton Garden Inn Property features a grab-and-go breakfast area and a 24/7 pantry. The Hilton Garden Inn Property’s fitness facility is located on the third floor. Both hotels have free-wi-fi and share back of the house and administrative functions.
The food and beverage outlets at the Hilton Garden Inn & Canopy – Chicago Central Loop Property include Depot 226, a bistro, market and coffee shop that is open for breakfast, brunch, lunch and dinner in the Canopy by Hilton Property, Garden Grille, a breakfast buffet and coffee shop located in the Hilton Garden Inn Property and Seville Chicago, a recently opened rooftop restaurant serving Mediterranean food run by celebrity chef, Fabio Viviani.
The following table presents certain information relating to the 2023 demand analysis with respect to the Hilton Garden Inn & Canopy - Chicago Central Loop Property:
| Demand Segmentation(1) | |||||
| Property | Rooms | Leisure | Group | Commercial | Extended Stay |
| Hilton Garden Inn & Canopy - Chicago Central Loop | 350 | 38.0% | 35.0% | 25.0% | 2.0% |
| (1) | Source: Appraisal |
The following tables present certain information relating to the current and historical occupancy, ADR and RevPAR at the Hilton Garden Inn Property and its competitors:
| Historical Occupancy, ADR, RevPAR(1) | |||||||||
| Hilton Garden Inn(2) | Competitive Set(2) | Penetration Factor(2) | |||||||
| Period | Occupancy | ADR | RevPAR | Occupancy | ADR | RevPAR | Occupancy | ADR | RevPAR |
| 2022 | 72.1% | $230.07 | $165.92 | 75.6% | $204.13 | $154.33 | 95.4% | 112.7% | 107.5% |
| 2023 | 81.6% | $227.94 | $186.01 | 80.7% | $207.02 | $167.16 | 101.1% | 110.1% | 111.3% |
| T-12 April 2024 | 82.7% | $229.90 | $190.19 | 80.8% | $207.42 | $167.65 | 102.4% | 110.8% | 113.4% |
| (1) | Variances between the underwriting, the appraisal and the above table with respect to Occupancy, ADR and RevPAR at the Hilton Garden Inn Property are attributable to variances in reporting methodologies and/or timing differences. |
| (2) | Occupancy, ADR and RevPAR are based on data provided by a third-party hospitality research report. The Competitive Set for 2022, 2023 and T-12 April 2024 includes Hampton Inn Majestic Theatre District, La Quinta Inns & Suites Chicago Downtown, Hilton Garden Inn Chicago Downtown Riverwalk, Residence Inn Chicago Downtown Loop, Hyatt Place Chicago Downtown The Loop, Homewood Suites by Hilton Chicago Downtown West Loop, and Cambria Hotel Chicago Loop - Theatre District. |
| THE INFORMATION IN THIS STRUCTURAL AND COLLATERAL TERM SHEET IS NOT COMPLETE AND MAY BE AMENDED PRIOR TO THE TIME OF SALE. THIS TERM SHEET IS NOT AN OFFER TO SELL THESE SECURITIES AND IT IS NOT A SOLICITATION OF AN OFFER TO BUY THESE SECURITIES IN ANY JURISDICTION WHERE THE OFFER OR SALE IS NOT PERMITTED. | ||
| 67 | ||
Hospitality – Full Service 226 West Jackson Boulevard Chicago, IL 60606
| Collateral Asset Summary – Loan No. 5 Hilton Garden Inn & Canopy - | Cut-off Date Balance: Cut-off Date LTV: U/W NCF DSCR: U/W NOI Debt Yield: | $65,000,000 40.5% 1.68x 14.6% |
The following tables present certain information relating to the current and historical occupancy, ADR and RevPAR at the Canopy by Hilton Property and its competitors:
| Historical Occupancy, ADR, RevPAR(1) | |||||||||
| Canopy by Hilton Property(2) | Competitive Set(2) | Penetration Factor(2) | |||||||
| Period | Occupancy | ADR | RevPAR | Occupancy | ADR | RevPAR | Occupancy | ADR | RevPAR |
| 2022 | 51.3% | $250.40 | $128.43 | 62.7% | $262.00 | $164.31 | 81.8% | 95.6% | 78.2% |
| 2023 | 72.0% | $251.61 | $181.12 | 69.7% | $258.85 | $180.52 | 103.2% | 97.2% | 100.3% |
| T-12 April 2024 | 74.0% | $249.24 | $184.55 | 69.7% | $259.07 | $180.62 | 106.2% | 96.2% | 102.2% |
| (1) | Variances between the underwriting, the appraisal and the above table with respect to Occupancy, ADR and RevPAR at the Canopy by Hilton Property are attributable to variances in reporting methodologies and/or timing differences. |
| (2) | Occupancy, ADR and RevPAR are based on data provided by a third-party hospitality research report. The Competitive Set for 2022, 2023 and T-12 April 2024 includes W Hotel Chicago City Center, L7 Chicago by Lotte, JW Marriott Chicago, Virgin Hotels Chicago, Hyatt Centric The Loop Chicago, Arlo Chicago, and Kimpton Gray. |
The following table presents certain information relating to the historical operating performance and Underwritten Net Cash Flow at the Hilton Garden Inn & Canopy - Chicago Central Loop Property:
| Cash Flow Analysis | |||||
| 2022(1) | 2023(1) | TTM 5/31/2024 | UW | UW Per Room(2) | |
| Occupancy (%) | 59.3% | 75.7% | 77.3% | 77.3% | |
| ADR | $240.87 | $241.76 | $242.86 | $242.86 | |
| RevPar | $142.89 | $183.00 | $187.81 | $187.81 | |
| Rooms Revenue | $18,254,295 | $23,378,718 | $24,058,946 | $24,058,946 | $68,740 |
| Food & Beverage Revenue | 1,200,992 | 1,538,409 | 1,516,724 | 1,516,724 | $4,333 |
| Rooftop Lease(3) | 0 | 0 | 0 | 250,000 | $714 |
| Other Revenue(4) | 403,829 | 328,833 | 366,959 | 366,959 | $1,048 |
| Total Revenue | $19,859,116 | $25,245,961 | $25,942,628 | $26,192,628 | $74,836 |
| Rooms Expense | $3,515,277 | $5,439,078 | $5,724,859 | $5,724,859 | $16,357 |
| Food & Beverage Expense | 1,179,114 | 1,676,109 | 1,764,127 | 1,764,127 | $5,040 |
| Other Departmental Expenses(5) | 149,955 | 46,525 | 44,569 | 44,569 | $127 |
| Departmental Expenses | $4,844,346 | $7,161,712 | $7,533,554 | $7,533,554 | $21,524 |
| Departmental Profit | $15,014,770 | $18,084,249 | $18,409,074 | $18,659,074 | $53,312 |
| Management Fee | $597,495 | $757,933 | $776,540 | $785,779 | $2,245 |
| Marketing and Franchise Fee | 2,482,245 | 3,746,614 | 3,898,605 | 3,933,669 | $11,239 |
| Other Undistributed Expenses(6) | 2,909,904 | 3,151,402 | 3,137,122 | 3,143,077 | $8,980 |
| Total Undistributed Expenses | $5,989,645 | $7,655,949 | $7,812,268 | $7,862,524 | $22,464 |
| Real Estate Taxes(7) | $1,364,543 | $814,007 | $874,411 | $969,846 | $2,771 |
| Property Insurance | 273,051 | 315,271 | 340,774 | 351,271 | $1,004 |
| Other Fixed Expenses(8) | 2,739 | 1,776 | 1,567 | 0 | $0 |
| Net Operating Income | $7,384,793 | $9,297,246 | $9,380,054 | $9,475,432 | $27,073 |
| FF&E | 794,365 | 1,009,838 | 1,037,705 | 1,047,705 | $2,993 |
| Net Cash Flow | $6,590,428 | $8,287,407 | $8,342,349 | $8,427,727 | $24,079 |
| NCF DSCR | 1.32x | 1.65x | 1.67x | 1.68x | |
| NOI Debt Yield | 11.4% | 14.3% | 14.4% | 14.6% | |
| (1) | The increase in financial performance from 2022 to 2023 is primarily attributable to the Hilton Garden Inn & Canopy - Chicago Central Loop Property coming online in late 2021. |
| (2) | UW Per Room is based on 350 rooms. |
| (3) | The rooftop restaurant commenced its lease in September 2023 and has a lease term through August 2033. |
| (4) | Other Revenue primarily consists of parking and sundry revenue. |
| (5) | Other Departmental Expenses primarily consist of expenses associated with the Other Revenue components. |
| (6) | Other Undistributed Expenses consist of administrative and general, operations and maintenance, heat, power and light and information and telecom expenses. |
| (7) | The Hilton Garden Inn & Canopy - Chicago Central Loop Property was a historic adaptive re-use project that qualified for the Class L property tax incentive beginning with the 2022 tax year (payable in 2023). This reduces the assessment ratio of the improvements for 12 years to 10% per year for the first 10 years, 15% in year 11, and 20% in year 12. The program ends in year 13, and the property is then assessed at the standard rate of 25%. The Class L property tax incentive is meant to encourage the preservation and rehabilitation of landmark buildings. Real estate taxes were underwritten based on the lender’s estimated 5-year abated tax average, which assumes an increase in assessed value in 2024 (which would be reflected in 2025 real estate taxes). The estimated unabated taxes payable in 2024 according to the appraisal would be $1,397,104. |
| (8) | Other Fixed Expenses historically consisted of equipment leases. |
| THE INFORMATION IN THIS STRUCTURAL AND COLLATERAL TERM SHEET IS NOT COMPLETE AND MAY BE AMENDED PRIOR TO THE TIME OF SALE. THIS TERM SHEET IS NOT AN OFFER TO SELL THESE SECURITIES AND IT IS NOT A SOLICITATION OF AN OFFER TO BUY THESE SECURITIES IN ANY JURISDICTION WHERE THE OFFER OR SALE IS NOT PERMITTED. | ||
| 68 | ||
Hospitality – Full Service 226 West Jackson Boulevard Chicago, IL 60606
| Collateral Asset Summary – Loan No. 5 Hilton Garden Inn & Canopy - | Cut-off Date Balance: Cut-off Date LTV: U/W NCF DSCR: U/W NOI Debt Yield: | $65,000,000 40.5% 1.68x 14.6% |
Appraisal. According to the appraisal, the Hilton Garden Inn & Canopy - Chicago Central Loop Property had an “as-is” appraised value of $160,400,000 as of March 7, 2024. The table below shows the appraiser’s “as-is” conclusions.
| Hilton Garden Inn & Canopy - Chicago Central Loop(1) | ||
| Property | Appraised Value | Capitalization Rate |
| Hilton Garden Inn & Canopy - Chicago Central Loop | $160,400,000 | 6.50% |
| (1) | Source: Appraisal. |
Environmental Matters. According to the Phase I environmental report, dated March 25, 2024, there was no evidence of any recognized environmental conditions at the Hilton Garden Inn & Canopy - Chicago Central Loop Property.
The Market. The Hilton Garden Inn & Canopy - Chicago Central Loop Property is located at 226 West Jackson Boulevard in downtown Chicago’s Loop. Nearby demand generators include Millennium Park, the Art Institute of Chicago, the Chicago Riverwalk and the University of Chicago. The Hilton Garden Inn & Canopy - Chicago Central Loop Property is also in close proximity to major corporations such as Amazon, Accenture, American Airlines, Boeing, JPMorgan Chase, Kraft Heinz, Pepsi, and Tyson Foods amongst others. The Hilton Garden Inn & Canopy - Chicago Central Loop Property is located approximately 11.0 miles northeast of Midway International Airport and 17.5 miles southeast from Chicago O’Hare International Airport.
The following table presents certain information relating to the primary competition for the Hilton Garden Inn Property:
| Competitive Set(1) | |||||
| Property | Number of Rooms | Year Opened | Estimated 2023 Occupancy | Estimated 2023 ADR | Estimated 2023 RevPAR |
| Hilton Garden Inn(2) | 135 | 2021 | 81.6% | $227.94 | $186.01 |
| Hampton Inn Majestic Theatre District | 135 | 2007 | 75.0%-80.0% | $200.00-$205.00 | $155.00-$160.00 |
| La Quinta Inns & Suites Chicago Downtown | 239 | 2009 | 65.0%-70.0% | $195.00-$200.00 | $125.00-$130.00 |
| Hilton Garden Inn Chicago Downtown Riverwalk | 191 | 2015 | 70.0%-75.0% | $190.00-$195.00 | $140.00-$145.00 |
| Hyatt Place Chicago Downtown The Loop | 206 | 2015 | 75.0%-80.0% | $225.00-$230.00 | $170.00-$175.00 |
| Cambria Hotel Chicago Loop - Theatre District | 199 | 2017 | 70.0%-75.0% | $210.00-$215.00 | $155.00-$160.00 |
| (1) | Source: Appraisal. |
| (2) | Occupancy, ADR and RevPAR provided by a third-party hospitality research report. |
The following table presents certain information relating to the primary competition for the Canopy by Hilton Property:
| Competitive Set(1) | |||||
| Property | Number of Rooms | Year Opened | Estimated 2023 Occupancy | Estimated 2023 ADR | Estimated 2023 RevPAR |
| Canopy by Hilton(2) | 215 | 2021 | 72.0% | $251.61 | $181.12 |
| W Hotel Chicago City Center | 403 | 1929 | 60.0%-65.0% | $285.00-$290.00 | $175.00-$180.00 |
| JW Marriott Chicago | 610 | 2010 | 65.0%-70.0% | $305.00-$310.00 | $210.00-$215.00 |
| Virgin Hotels Chicago | 250 | 2015 | 75.0%-80.0% | $210.00-$215.00 | $155.00-$160.00 |
| Hyatt Centric The Loop Chicago | 257 | 2015 | 75.0%-80.0% | $225.00-$230.00 | $175.00-$180.00 |
| Arlo Chicago | 218 | 2018 | 70.0%-75.0% | $200.00-$205.00 | $145.00-$150.00 |
| Kimpton Gray | 293 | 2016 | 75.0%-80.0% | $245.00-$250.00 | $190.00-$195.00 |
| (1) | Source: Appraisal. |
| (2) | Occupancy, ADR and RevPAR provided by a third-party hospitality research report. |
| THE INFORMATION IN THIS STRUCTURAL AND COLLATERAL TERM SHEET IS NOT COMPLETE AND MAY BE AMENDED PRIOR TO THE TIME OF SALE. THIS TERM SHEET IS NOT AN OFFER TO SELL THESE SECURITIES AND IT IS NOT A SOLICITATION OF AN OFFER TO BUY THESE SECURITIES IN ANY JURISDICTION WHERE THE OFFER OR SALE IS NOT PERMITTED. | ||
| 69 | ||
Hospitality – Full Service 226 West Jackson Boulevard Chicago, IL 60606
| Collateral Asset Summary – Loan No. 5 Hilton Garden Inn & Canopy - | Cut-off Date Balance: Cut-off Date LTV: U/W NCF DSCR: U/W NOI Debt Yield: | $65,000,000 40.5% 1.68x 14.6% |
The Borrowers and the Borrower Sponsors. The borrowers are Phoenix 226 Central Loop Owner, LLC (“Propco Borrower”) and Phoenix 226 Central Loop Operator, LLC (“Opco Borrower”), each a Delaware limited liability company and single purpose entity with one independent director in its organizational structure. Legal counsel to the borrowers delivered a non-consolidation opinion in connection with the origination of the Hilton Garden Inn & Canopy - Chicago Central Loop Mortgage Loan. The borrower sponsors are Blue Glacier Fund II, L.P., 1907 Management GP, LLC and Phoenix RD Fund II LLC, (“Phoenix”), and the non-recourse carveout guarantor is Blue Glacier Fund II, L.P. The sponsorship is a combination of the original developer of the Hilton Garden Inn & Canopy – Chicago Central Loop Property, Phoenix, and a joint venture between 1907 Capital and Crestline Investors, Inc. 1907 Capital is an investment firm based in Miami, Florida that invests on behalf of family offices, institutions, endowments, and pensions. Crestline Investors, Inc. is an alternative investment manager that was founded in 1997 and had over $18 billion in assets under management as of December 31, 2023.
Propco Borrower is the fee owner of the Hilton Garden Inn & Canopy - Chicago Central Loop Property, and has leased the property to Opco Borrower, which operates the property, pursuant to an operating lease. Propco Borrower is 99% owned by a historic tax credit investor (“HTC Investor”), and 1% owned by its managing member, 226 Jackson SPE LLC, a Delaware limited liability company which also owns 100% of, and is the managing member of, Opco Borrower (“Opco Borrower Sole Member”). The non-recourse carveout guarantor, Blue Glacier Fund II, L.P. owns a 10.55% interest in 1907-Crestline Partnership, Registered Series, LLC – Series 1, a Delaware limited liability company, which is the manager of, and holds a 100% preferred interest in, 226 Jackson Investors, LLC, a Delaware limited liability company which is the 100% owner and manager of Opco Borrower Sole Member.
In addition, GDC Jackson LLC (“Preferred Equity Investor”) is the holder of a preferred equity investment in Phoenix RD Fund II LLC (“RD Fund”), which owns 100% of the common equity interests in the sole member of Opco Borrower Sole Member. Preferred Equity Investor has the right to receive payment of a priority preferred return and redemption of its preferred equity interest. Such right has been subordinated to the lender’s rights pursuant to a subordination and standstill agreement. See “Description of the Mortgage Pool—Preferred Equity” in the Preliminary Prospectus.
The Opco Borrower has made an unsecured intercompany loan in the amount of $34,250,000 to the Propco Borrower, which has been subordinated to the Hilton Garden Inn & Canopy – Chicago Central Loop Mortgage Loan pursuant to a subordination and standstill agreement. In addition, the Opco Borrower is the borrower under “key money” loans (i) from the franchisor, (of which $1,800,000 remained unamortized as of the origination date), and (ii) from the property manager (of which $1,466,666.66 remained unamortized as of the origination date). The Opco Borrower also owes the property manager certain past due management fees and other amounts in the aggregate amount of $1,145,641.33, which it has agreed to pay pursuant to a fixed repayment schedule. See “Description of the Mortgage Pool—Other Unsecured Indebtedness” in the Preliminary Prospectus.
Historic Tax Credit Structure. The Hilton Garden Inn & Canopy – Chicago Central Loop Property received federal historic rehabilitation tax credits in connection with the rehabilitation of the Hilton Garden Inn & Canopy – Chicago Central Loop Property. HTC Investor is entitled to receive 99% of such historic tax credit benefits subject to a five year compliance period. Beginning on December 31, 2026, and expiring on June 30, 2027, HTC Investor has the right to exercise a put option whereby the Propco Borrower will be required to redeem HTC Investor’s membership interest in Propco Borrower for a price equal to the lesser of (i) the fair market value of HTC Investor’s interest in Propco Borrower as of the date of redemption and (ii) any unpaid amounts due to HTC Investor (including, but not limited to, any unpaid annual return and tax distributions) plus 4% of the total amount of capital contributions made by HTC Investor.
In addition, the borrowers, the lender and HTC Investor entered into a Foreclosure Rights Agreement which provides that if the lender forecloses on, or otherwise acquires, the Hilton Garden Inn & Canopy – Chicago Central Loop Property before December 31, 2026, then the Propco Borrower and the transferee that takes possession of the Hilton Garden Inn & Canopy – Chicago Central Loop Property after the foreclosure event (the “Post-Foreclosure Owner”) are required to enter into a master lease until December 31, 2026 to preserve the historic tax credit structure. In addition, the Foreclosure Rights Agreement provides that the Propco Borrower and the Post-Foreclosure Owner may not take any action that could cause a recapture of the historic tax credits with respect to the Hilton Garden Inn & Canopy - Chicago Central Loop Property, and are prohibited from transferring the Hilton Garden Inn & Canopy - Chicago Central Loop Property and Opco Borrower Sole Member’s 1% ownership interest in Propco Borrower to certain tax-exempt entities which could cause a recapture of historic tax credits prior to December 31, 2026. See “Description of the Mortgage Pool—Property Types—Hospitality Properties” in the Preliminary Prospectus.
Property Management. The Hilton Garden Inn & Canopy – Chicago Central Loop Property is managed by Aimbridge Hospitality, LLC, a third party property manager.
Initial and Ongoing Reserves. At origination of the Hilton Garden Inn & Canopy - Chicago Central Loop Mortgage Loan, the borrowers deposited approximately (i) $223,655 into a reserve account for real estate taxes, (ii) $307,362 into a reserve account for insurance premiums, and (iii) $166,654 into a reserve account for deferred maintenance.
Tax Reserve – The borrowers are required to deposit into a real estate tax reserve, on a monthly basis, 1/12th of the taxes that the lender reasonably estimates will be payable over the next-ensuing 12-month period (initially estimated to be approximately $44,731).
| THE INFORMATION IN THIS STRUCTURAL AND COLLATERAL TERM SHEET IS NOT COMPLETE AND MAY BE AMENDED PRIOR TO THE TIME OF SALE. THIS TERM SHEET IS NOT AN OFFER TO SELL THESE SECURITIES AND IT IS NOT A SOLICITATION OF AN OFFER TO BUY THESE SECURITIES IN ANY JURISDICTION WHERE THE OFFER OR SALE IS NOT PERMITTED. | ||
| 70 | ||
Hospitality – Full Service 226 West Jackson Boulevard Chicago, IL 60606
| Collateral Asset Summary – Loan No. 5 Hilton Garden Inn & Canopy - | Cut-off Date Balance: Cut-off Date LTV: U/W NCF DSCR: U/W NOI Debt Yield: | $65,000,000 40.5% 1.68x 14.6% |
Insurance Reserve – The borrowers are required to deposit into an insurance reserve, on a monthly basis, 1/12th of the amount which would be sufficient to pay the insurance premiums due for the renewal of coverage afforded by such policies (initially estimated to be $30,736).
FF&E Reserve – The borrowers are required to deposit into a furniture, fixtures and equipment (“FF&E”) reserve, on a monthly basis, an amount equal to the greater of (i) the FF&E Payment (as defined below), and (ii) the amount of the deposit (if any) then required by the franchisors on account of FF&E under each franchise agreement.
“FF&E Payment” means, with respect to the corresponding monthly payment date, an amount equal to (A) commencing on the origination date through and including June 6, 2025, 1/12th of 3.0%, and (B) thereafter, 1/12th of 4.0%, in each case of the greater of (x) the annual gross revenues for the hotel related operations at the Hilton Garden Inn & Canopy - Chicago Central Loop Property for the immediately preceding calendar year and (y) the projected annual gross revenues for the hotel related operations at the Hilton Garden Inn & Canopy – Chicago Central Loop Property for the immediately succeeding calendar year as set forth in the then-current approved annual budget.
Seasonality Reserve – On each monthly payment date occurring on and after the occurrence and continuance of a Trigger Period (as defined below), the borrowers are required to deposit into a seasonality reserve an amount equal to 100% of the Excess Cash Flow (as defined below) generated by the Hilton Garden Inn & Canopy – Chicago Central Loop Property for the immediately preceding interest accrual period, for the purpose of creating a reserve for shortfalls during seasonal periods when the gross revenue of the Hilton Garden Inn & Canopy – Chicago Central Loop Property may be reduced. Notwithstanding the foregoing, any amounts that would be deposited by the borrowers into the seasonal reserve that would cause the funds then on deposit in such account to exceed $1,200,000 (the “Seasonality Reserve Account Cap”) must instead be deposited into the excess cash flow account.
Put Price Reserve – The borrowers are required to deposit monthly, from the first monthly payment date through and including the monthly payment date in June 2026, an amount equal to approximately $82,371 for the purpose of creating a reserve to pay to the historic tax credit investor all amounts due and payable to it for annual returns, tax distributions and the exercise of the put option held by the historical tax credit investor.
HMA (Hotel Management Agreement) Reserve – The borrowers are required to deposit monthly, from the first monthly payment date through and including the monthly payment date in December 2024, an amount equal to approximately $190,940 for the purpose of creating a reserve to pay the property manager certain past due management fees, reimbursable expenses and other amounts due to it in the aggregate amount of $1,145,641.33, which includes the obligation to pay to the property manager six monthly installment payments each in the amount of $100,000 on or before the final day of each month, with the first installment payment due on or before June 30, 2024 and the sixth installment payment due on or before November 30, 2024 and to pay the remaining $545,641.33 owed to the property manager on or before December 31, 2024.
Lockbox / Cash Management. The Hilton Garden Inn & Canopy - Chicago Central Loop Mortgage Loan is structured with a hard lockbox and springing cash management. The borrowers are required to (or cause the property manager to) immediately deposit all revenue generated by the Hilton Garden Inn & Canopy - Chicago Central Loop Property into a lender-controlled lockbox account, and to instruct the property manager to immediately deposit into such lockbox account all funds otherwise payable by the property manager to the borrowers. In addition, on or before the origination date, the borrowers were required to deliver direction letters to (1) all tenants and (2) each of the credit card companies with which the borrowers have entered into a merchant’s or other credit card agreements, in each case, directing them to pay to the lender-controlled lockbox account all rent and payments which would otherwise be paid to the borrowers or the property manager. Upon the first occurrence of a Trigger Period, the lender, on the borrowers’ behalf, is required to establish a cash management account. All funds deposited into the lockbox account are required to be transferred on each business day to or at the direction of the borrowers unless a Trigger Period exists and the lender elects (in its sole and absolute discretion) to deliver a notice instructing the institution maintaining the lockbox account to transfer all funds on deposit on each business day to the cash management account under the control of the lender, to be applied and disbursed in accordance with the Hilton Garden Inn & Canopy - Chicago Central Loop Mortgage Loan documents, and all excess cash flow funds remaining in the cash management account after the application of such funds in accordance with the Hilton Garden Inn & Canopy - Chicago Central Loop Mortgage Loan documents (“Excess Cash Flow”) is required to be deposited, (i) if the Seasonality Reserve Account Cap has not been exceeded, 100% into the seasonality reserve and (ii) if the Seasonality Reserve Account Cap has been exceeded, then 100% into an excess cash flow reserve account as additional collateral for the Hilton Garden Inn & Canopy - Chicago Central Loop Mortgage Loan.
A “Trigger Period” means a period (A) commencing upon the earliest of: (i) the occurrence and continuance of an event of default, (ii) the debt service coverage ratio being less than 1.20x, (iii) the occurrence of a Franchise Agreement Trigger Period (as defined below), (iv) the occurrence of a Franchise Renewal Trigger Event (as defined below), (v) the occurrence of a bankruptcy event applicable to the property manager, and (vi) the occurrence of a Seasonality Reserve Trigger Period (as defined below) and (B) expiring upon (1) with respect to any Trigger Period commenced in connection with clause (i) above, the cure (if applicable) of such event of default, (2) with respect to any Trigger Period commenced in connection with clause (ii) above, the date that the debt service coverage ratio is equal to or greater than 1.25x for two consecutive calendar quarters, (3) with respect to any Trigger Period commenced in connection with clause (iii) above, a Franchise Agreement Trigger Period ceasing to exist in accordance with the definition of such term, (4) with respect to any Trigger Period commenced in connection with clause (iv) above, a Franchise Renewal Event (as defined below), (5) with respect to any Trigger Period commenced in connection with clause (v) above, the borrowers’ replacement of the applicable property manager with a
| THE INFORMATION IN THIS STRUCTURAL AND COLLATERAL TERM SHEET IS NOT COMPLETE AND MAY BE AMENDED PRIOR TO THE TIME OF SALE. THIS TERM SHEET IS NOT AN OFFER TO SELL THESE SECURITIES AND IT IS NOT A SOLICITATION OF AN OFFER TO BUY THESE SECURITIES IN ANY JURISDICTION WHERE THE OFFER OR SALE IS NOT PERMITTED. | ||
| 71 | ||
Hospitality – Full Service 226 West Jackson Boulevard Chicago, IL 60606
| Collateral Asset Summary – Loan No. 5 Hilton Garden Inn & Canopy - | Cut-off Date Balance: Cut-off Date LTV: U/W NCF DSCR: U/W NOI Debt Yield: | $65,000,000 40.5% 1.68x 14.6% |
new manager and under a new management agreement, each of which has been approved by the lender, and (6) with respect to any Trigger Period commenced in connection with clause (vi) above, the Seasonality Reserve Trigger Period ceasing to exist in accordance with the definition of such term.
“Franchise Agreement Trigger Period” means a period (A) commencing upon the first to occur of (i) the borrowers being in default under the franchise agreement beyond any applicable notice and cure periods, (ii) the borrowers or franchisor giving notice that it is terminating the franchise agreement, (iii) any termination or cancellation of the franchise agreement (including, without limitation, rejection in any bankruptcy or similar insolvency proceeding of the franchisor) and/or the franchise agreement expiring or otherwise failing to be in full force and effect, (iv) any bankruptcy or similar insolvency of the franchisor and (v) the Hilton Garden Inn & Canopy - Chicago Central Loop Property failing to be operated, “flagged” and/or branded pursuant to the franchise agreement; and (B) expiring upon the lender’s receipt of reasonably acceptable evidence (which evidence will include, without limitation, a duly executed estoppel certificate from the applicable franchisor or comfort letter from a new franchisor that is a Qualified Franchisor (as defined below)) of (1) (a) the satisfaction of the Franchise Agreement Cure Conditions or (b) the branding, “flagging” and operation of the Hilton Garden Inn & Canopy - Chicago Central Loop Property pursuant to a replacement franchise agreement approved by the lender and entered into in accordance with the terms of the loan documents and which is in full force and effect and (2) to the extent a property improvement plan (“PIP”) is required in connection with the foregoing, there are funds on deposit in the excess cash flow account equal to at least 125% of the cost of such PIP.
“Franchise Agreement Cure Conditions” means each of the following (i) the borrowers have cured all defaults (if any) under the franchise agreement to the satisfaction of the applicable franchisor, (ii) the borrowers and the applicable franchisor have re-affirmed the franchise agreement as being in full force and effect, (iii) with respect to any applicable bankruptcy or insolvency proceedings involving the applicable franchisor and/or franchise agreement (if any), such franchisor is no longer insolvent or subject to any bankruptcy or insolvency proceedings and has affirmed such franchise agreement pursuant to a final, non-appealable order of a court of competent jurisdiction and (iv) the Hilton Garden Inn & Canopy - Chicago Central Loop Property continues to be operated, “flagged” and branded pursuant to the franchise agreement.
“Franchise Renewal Event” means, in connection with a Franchise Renewal Trigger Event, an event which will occur upon the lender’s receipt of reasonably acceptable evidence (which evidence will include, without limitation, a duly executed estoppel certificate from the applicable franchisor or comfort letter from a new franchisor that is a Qualified Franchisor) that (i) the related franchise agreement has been extended or a replacement franchise agreement approved by the lender has been entered into, in each case, for a term expiring no earlier than three years after the maturity date of the Hilton Garden Inn & Canopy - Chicago Central Loop Mortgage Loan and otherwise in accordance with the terms of the loan documents, (ii) such franchise agreement (as so extended) or such replacement franchise agreement, as applicable, is in full force and effect and (iii) to the extent a PIP is required in connection with the foregoing, there are funds on deposit in the excess cash flow account equal to at least 125% of the cost of such PIP.
“Franchise Renewal Trigger Event” means an event which will occur if a Franchise Renewal Event does not occur on or before the date which is 12 months prior to the expiration of the then applicable term of the franchise agreement.
“Qualified Franchisor” means a reputable and experienced franchisor possessing experience in flagging hotel properties similar in size, scope, use and value as the Hilton Garden Inn & Canopy - Chicago Central Loop Property and approved by the lender in writing.
“Seasonality Reserve Trigger Period” means a period (A) commencing upon the origination date and on any date thereafter that funds on deposit in the seasonality reserve are less than the Seasonality Reserve Account Cap, and (B) expiring upon the date that funds on deposit in the seasonality reserve exceed the Seasonality Reserve Account Cap.
Current Mezzanine or Secured Subordinate Indebtedness. None.
Permitted Future Mezzanine or Secured Subordinate Indebtedness. None Permitted.
Release of Collateral. Not Permitted.
Ground Lease. None.
| THE INFORMATION IN THIS STRUCTURAL AND COLLATERAL TERM SHEET IS NOT COMPLETE AND MAY BE AMENDED PRIOR TO THE TIME OF SALE. THIS TERM SHEET IS NOT AN OFFER TO SELL THESE SECURITIES AND IT IS NOT A SOLICITATION OF AN OFFER TO BUY THESE SECURITIES IN ANY JURISDICTION WHERE THE OFFER OR SALE IS NOT PERMITTED. | ||
| 72 | ||
Various – Various Various Detroit, MI
| Collateral Asset Summary – Loan No. 6 Bedrock Mixed-Use Portfolio | Cut-off Date Balance: Cut-off Date LTV: U/W NCF DSCR: U/W NOI Debt Yield: | $55,000,000 54.3% 1.58x 11.3% |
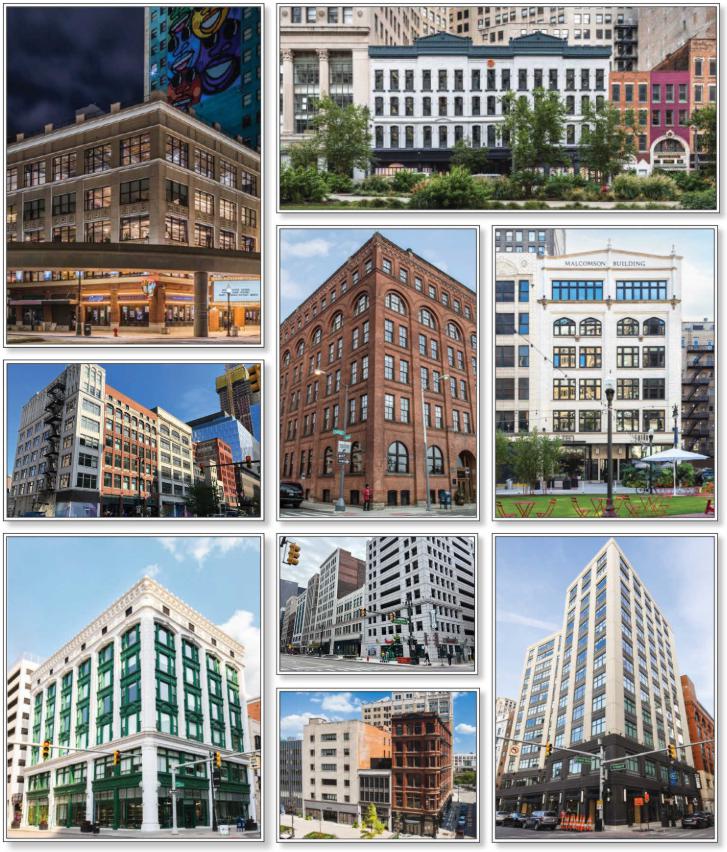
| THE INFORMATION IN THIS STRUCTURAL AND COLLATERAL TERM SHEET IS NOT COMPLETE AND MAY BE AMENDED PRIOR TO THE TIME OF SALE. THIS TERM SHEET IS NOT AN OFFER TO SELL THESE SECURITIES AND IT IS NOT A SOLICITATION OF AN OFFER TO BUY THESE SECURITIES IN ANY JURISDICTION WHERE THE OFFER OR SALE IS NOT PERMITTED. | ||
| 73 | ||
Various – Various Various Detroit, MI
| Collateral Asset Summary – Loan No. 6 Bedrock Mixed-Use Portfolio | Cut-off Date Balance: Cut-off Date LTV: U/W NCF DSCR: U/W NOI Debt Yield: | $55,000,000 54.3% 1.58x 11.3% |
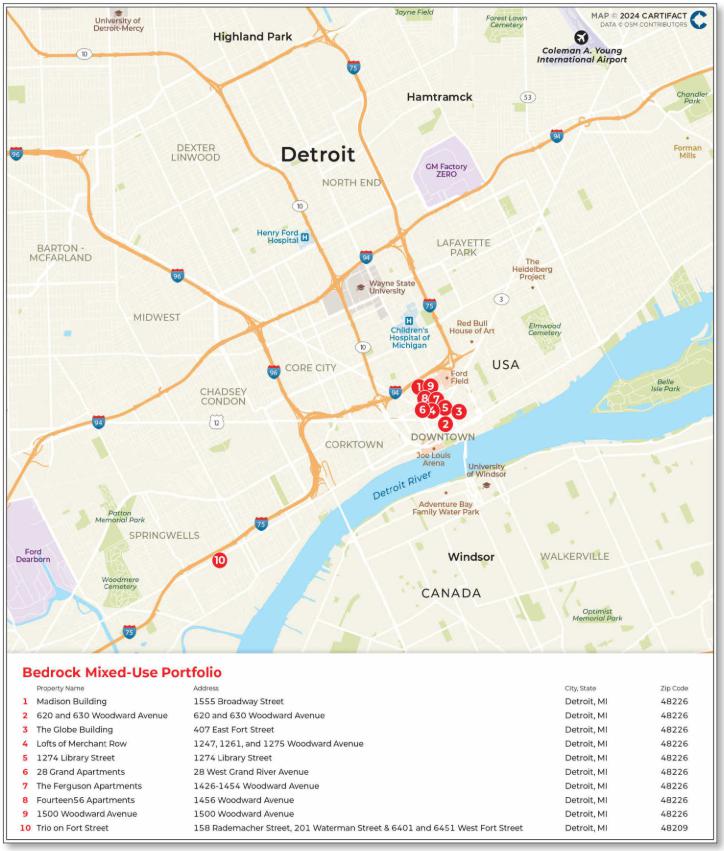
| THE INFORMATION IN THIS STRUCTURAL AND COLLATERAL TERM SHEET IS NOT COMPLETE AND MAY BE AMENDED PRIOR TO THE TIME OF SALE. THIS TERM SHEET IS NOT AN OFFER TO SELL THESE SECURITIES AND IT IS NOT A SOLICITATION OF AN OFFER TO BUY THESE SECURITIES IN ANY JURISDICTION WHERE THE OFFER OR SALE IS NOT PERMITTED. | ||
| 74 | ||
Various – Various Various Detroit, MI
| Collateral Asset Summary – Loan No. 6 Bedrock Mixed-Use Portfolio | Cut-off Date Balance: Cut-off Date LTV: U/W NCF DSCR: U/W NOI Debt Yield: | $55,000,000 54.3% 1.58x 11.3% |
| Mortgage Loan Information | Property Information | |||
| Loan Seller: | GACC | Single Asset / Portfolio: | Portfolio | |
| Loan Purpose: | Refinance | Property Type - Subtype: | Various – Various | |
| Borrower Sponsor(s)(1): | Daniel Gilbert | Collateral: | Fee | |
| Borrower(s)(2): | Various | Location: | Detroit, MI | |
| Original Balance(3): | $55,000,000 | Year Built / Renovated: | Various / Various | |
| Cut-off Date Balance(3): | $55,000,000 | Property Management: | Bedrock Management Services LLC | |
| % by Initial UPB: | 5.4% | Size(6): | 853,067 SF | |
| Interest Rate: | 6.38500% | Appraised Value / Per SF: | $138,010,000 / $162 | |
| Note Date: | June 5, 2024 | Appraisal Date: | February 27-29, 2024 | |
| Original Term: | 60 months | Occupancy(6): | 83.0% (as of May 20, 2024) | |
| Amortization: | Interest Only | UW Economic Occupancy: | 88.6% | |
| Original Amortization: | NAP | Underwritten NOI: | $8,455,670 | |
| Interest Only Period: | 60 months | Underwritten NCF: | $7,686,888 | |
| First Payment Date: | July 6, 2024 | |||
| Maturity Date: | June 6, 2029 | Historical NOI | ||
| Additional Debt Type(3): | Pari Passu | 2023 NOI: | $8,191,302 | |
| Additional Debt Balance(3): | $20,000,000 | 2022 NOI: | $5,942,624 | |
| Call Protection: | L(25),D(30),O(5) | 2021 NOI(7): | $3,294,646 | |
| Lockbox / Cash Management(4): | Hard / Springing | 2020 NOI(7): | NAV | |
| Reserves(5) | Financial Information(3) | ||||||
| Initial | Monthly | Cap | Cut-off Date Loan Per SF(8): | $88 | |||
| Taxes: | $0 | Springing | NAP | Maturity Date Loan Per SF(8): | $88 | ||
| Insurance: | $0 | Springing | NAP | Cut-off Date LTV: | 54.3% | ||
| Replacement: | $0 | $16,708 | NAP | Maturity Date LTV: | 54.3% | ||
| TI/LC: | $0 | $75,000 | $3,000,000 | UW NOI DY: | 11.3% | ||
| UW NCF DSCR: | 1.58x | ||||||
| Sources and Uses | |||||||
| Sources | Proceeds | % of Total | Uses | Proceeds | % of Total | ||
| Whole Loan | $75,000,000 | 100.0% | Loan Payoff | $66,050,211 | 88.1 | % | |
| Closing Costs(9) | 6,044,555 | 8.1 | |||||
| Return of Equity | 2,905,234 | 3.9 | |||||
| Total Sources | $75,000,000 | 100.0% | Total Uses | $75,000,000 | 100.0 | % | |
| (1) | The non-recourse carveout guarantor is Rock Backer LLC, a Michigan limited liability company. |
| (2) | The borrowers are 11 Delaware limited liability companies and special purpose entities. See “The Borrowers and Borrower Sponsors” below for the names of each entity. |
| (3) | The Bedrock Mixed-Use Portfolio Mortgage Loan (as defined below) is part of the Bedrock Mixed-Use Portfolio Whole Loan (as defined below) evidenced by two pari passu notes with an aggregate outstanding principal balance as of the Cut-off Date of $75.0 million. The Financial Information in the chart above reflects the metrics of the Bedrock Mixed-Use Portfolio Whole Loan. |
| (4) | The Bedrock Mixed-Use Portfolio is structured with a hard lockbox for the commercial tenants and a springing (soft) lockbox for the multifamily tenants. See “Lockbox/Cash Management” below. |
| (5) | See “Initial and Ongoing Reserves” below. |
| (6) | Represents the Net Rentable Area (SF) and Occupancy of the commercial space. The Bedrock Mixed-Use Portfolio consists of 853,067 SF of commercial space and 194 multifamily units. The multifamily units were 87.6% leased as of May 20, 2024. |
| (7) | The borrower acquired the Trio on Fort Street mortgaged property vacant in 2020 and therefore does not have a full presentation of 2020 or 2021 financials. |
| (8) | Based solely on the SF of the commercial space and excludes the multifamily units. |
| (9) | Closing Costs include an interest rate buydown of $4,762,500. |
| THE INFORMATION IN THIS STRUCTURAL AND COLLATERAL TERM SHEET IS NOT COMPLETE AND MAY BE AMENDED PRIOR TO THE TIME OF SALE. THIS TERM SHEET IS NOT AN OFFER TO SELL THESE SECURITIES AND IT IS NOT A SOLICITATION OF AN OFFER TO BUY THESE SECURITIES IN ANY JURISDICTION WHERE THE OFFER OR SALE IS NOT PERMITTED. | ||
| 75 | ||
Various – Various Various Detroit, MI
| Collateral Asset Summary – Loan No. 6 Bedrock Mixed-Use Portfolio | Cut-off Date Balance: Cut-off Date LTV: U/W NCF DSCR: U/W NOI Debt Yield: | $55,000,000 54.3% 1.58x 11.3% |
The Loan. The sixth largest mortgage loan (the “Bedrock Mixed-Use Portfolio Mortgage Loan”) is part of a whole loan (the “Bedrock Mixed-Use Portfolio Whole Loan”) secured by the borrowers’ fee interest, in an 853,067 SF mixed use portfolio located in Detroit, Michigan (the “Bedrock Mixed-Use Portfolio Properties”). The Bedrock Mixed-Use Portfolio Whole Loan is comprised of two pari passu notes, with an aggregate outstanding principal balance as of the Cut-off Date of $75,000,000. The Bedrock Mixed-Use Portfolio Whole Loan was co-originated on June 5, 2024 by German American Capital Corporation and accrues interest at a fixed rate of 6.38500% per annum. The Bedrock Mixed-Use Portfolio Whole Loan has an initial term of five years and is interest only for the full term. The scheduled maturity date of the Bedrock Mixed-Use Portfolio Whole Loan is on June 6, 2029. The Bedrock Mixed-Use Portfolio Mortgage Loan is evidenced by the controlling Note A-1 with an outstanding principal balance as of the Cut-off Date of $55,000,000.
The table below summarizes the promissory notes that comprise the Bedrock Mixed-Use Portfolio Whole Loan. The relationship between the holders of the Bedrock Mixed-Use Portfolio Whole Loan will be governed by a co-lender agreement as described under “Description of the Mortgage Pool— The Whole Loans—Serviced Pari Passu Whole Loans” in the Preliminary Prospectus.
| Whole Loan Summary | ||||
| Note | Original Balance | Cut-off Date Balance | Note Holder | Controlling Piece |
| A-1 | $55,000,000 | $55,000,000 | Benchmark 2024-V8 | Yes |
| A-2 | 20,000,000 | 20,000,000 | BBCMS 2024-5C27 | No |
| Whole Loan | $75,000,000 | $75,000,000 | ||
The Property. The Bedrock Mixed-Use Portfolio Properties are comprised of a diverse 10 property office, retail, industrial, and multifamily portfolio that includes 853,067 SF of commercial space and 194 apartment units. The office, retail, and multifamily properties are located in Downtown Detroit and the industrial property is located in neighboring Southwest Detroit. The three apartment buildings (28 Grand Apartments, The Ferguson Apartments, and Fourteen56 Apartments) include 194 units and 30,152 SF of commercial space. The industrial property totals 563,782 SF and is 86.1% leased to two tenants, LM Manufacturing and Diversified Synergies LLC. The six office and retail buildings total 259,133 SF and are leased to national retail and office users. Office tenants in the portfolio include Bedrock Management Services LLC (a borrower affiliate), Rockbridge Growth Equity LLC (a borrower affiliate), Hello Innovation Inc., and Hudson Real Property LLC. Retail tenants include Nike, Buddy’s Pizza, Chipotle, Bonobos, Hudson Café, and Gucci. As of May 20, 2024, the commercial space at the Bedrock Mixed-Use Portfolio Properties was 83.0% leased and the multifamily space was 87.6% leased. Approximately 76.0% of underwritten base rent is from commercial space and approximately 24.0% is from multifamily space. Approximately 22.2% of commercial underwritten base rent is from affiliates of the borrower.
The following table presents detailed information with respect to each of the Bedrock Mixed-Use Portfolio Properties:
| Portfolio Summary | |||||||||
| Property Name/Location | Property Type | Year Built/ Renovated | SF/Units(1)(2) | Occupancy(1)(2) | Allocated Whole Loan Amount (“ALA”) | % of ALA | Appraised Value | UW NCF | % of UW NCF |
| Trio on Fort Street | Industrial | 2001/2018 | 563,782 | 86.1% | $19,509,456 | 26.0% | $35,900,000 | $2,757,216 | 35.9% |
| 28 Grand Apartments(3) | Multifamily | 2016/NAP | 133 | 84.2% | $9,075,429 | 12.1% | $16,700,000 | $699,074 | 9.1% |
| Madison Building | Office | 1917/2006 | 58,869 | 97.5% | $8,205,927 | 10.9% | $15,100,000 | $566,502 | 7.4% |
| 1274 Library Street | Retail/Office | 1917/1975 | 40,666 | 54.2% | $8,151,583 | 10.9% | $15,000,000 | $539,194 | 7.0% |
| The Ferguson Apartments | Multifamily | 1897/2015 | 55 | 94.5% | $8,097,239 | 10.8% | $14,900,000 | $586,483 | 7.6% |
| Lofts of Merchant Row(3) | Retail | 1891/2017 | 50,983 | 89.8% | $6,792,986 | 9.1% | $12,500,000 | $654,383 | 8.5% |
| 620 and 630 Woodward Avenue | Office | 1880/2013 | 39,602 | 74.7% | $5,744,149 | 7.7% | $10,570,000 | $907,536 | 11.8% |
| The Globe Building | Office | 1888/2020 | 47,310 | 80.1% | $5,695,239 | 7.6% | $10,480,000 | $585,399 | 7.6% |
| 1500 Woodward Avenue | Office/Retail | 1891/2020 | 21,703 | 100.0% | $2,119,412 | 2.8% | $3,900,000 | $292,880 | 3.8% |
| Fourteen56 Apartments | Multifamily | 1924/2024 | 6 | 100.0% | $1,608,579 | 2.1% | $2,960,000 | $98,223 | 1.3% |
| Total/Wtd. Avg.(4) | 853,067 | 83.0% | $75,000,000 | 100.0% | $138,010,000 | $7,686,888 | 100.0% | ||
| (1) | Information is based on the underwritten rent roll as of May 20, 2024. |
| (2) | The 28 Grand Apartments mortgaged property, The Ferguson Apartments mortgaged property and the Fourteen56 Apartments mortgaged property SF and Occupancy respectively represents the multifamily units and excludes the 30,152 square feet of commercial space at such properties. The following represents the commercial SF at the multifamily properties: the 28 Grand Apartments mortgaged property (4,890 SF), The Ferguson Apartments mortgaged property (20,374 SF) and the Fourteen56 Apartments mortgaged property (4,888 SF). |
| (3) | The 28 Grand Apartments mortgaged property and the Lofts of Merchant Row mortgaged property are condominium units. The 28 Grand Apartments mortgaged property is part of a condominium comprised of (i) a commercial unit, (ii) an affordable unit, (iii) a market unit and (iv) a rooftop unit, and the related borrower owns all of such units except the affordable unit. The Lofts of Merchant Row mortgaged property is part of a condominium comprised of six units, of which the related borrower owns two units and does not control the condominium. |
| (4) | The Total/Wtd. Avg. SF and Occupancy excludes the multifamily units and includes the 30,152 square feet of commercial space at the multifamily properties. |
| THE INFORMATION IN THIS STRUCTURAL AND COLLATERAL TERM SHEET IS NOT COMPLETE AND MAY BE AMENDED PRIOR TO THE TIME OF SALE. THIS TERM SHEET IS NOT AN OFFER TO SELL THESE SECURITIES AND IT IS NOT A SOLICITATION OF AN OFFER TO BUY THESE SECURITIES IN ANY JURISDICTION WHERE THE OFFER OR SALE IS NOT PERMITTED. | ||
| 76 | ||
Various – Various Various Detroit, MI
| Collateral Asset Summary – Loan No. 6 Bedrock Mixed-Use Portfolio | Cut-off Date Balance: Cut-off Date LTV: U/W NCF DSCR: U/W NOI Debt Yield: | $55,000,000 54.3% 1.58x 11.3% |
Major Tenants. The three largest commercial tenants at the Bedrock Mixed-Use Portfolio Properties based on the underwritten base rent are LM Manufacturing LLC, Diversified Synergies LLC and Bedrock Management Services LLC.
LM Manufacturing LLC (“LM”) (295,974 SF; 34.7% of the commercial net rentable area; 21.7% of underwritten base rent of the commercial space): Founded in 2019, LM is a joint venture between Magna International and LAN Manufacturing. LM provides manufacturing, assembly, sequencing, supply chain, and logistics management of complete seat assemblies for the automotive and other mobility industries.
LM has an office component that is fully utilized, as well as an industrial space that is entirely utilized as warehousing/manufacturing with seat assembly associated with the Ford Ranger, Raptor and Bronco. LM has been in occupancy at the Trio on Fort Street mortgaged property since August 2022, with $0.25 PSF annual rent increases for its industrial space and $0.50 PSF for its office space. LM has two five-year renewal options remaining and no termination options.
Diversified Synergies LLC (“Diversified Synergies”) (189,358 SF; 22.2% of the commercial net rentable area; 13.3% of underwritten base rent of the commercial space): Diversified Synergies is a packager and distributor for pharmaceutical, food and consumer goods Fortune 500 companies, offering services such as kitting, fulfilling, display constructing, packaging, merchandising, and distributing. Diversified Synergies is a joint venture between Staffing Synergies, Inc. and Diversified Chemical Technology, Inc. Diversified Synergies also works with Abbott Laboratories to supply COVID-19 test kits.
Diversified Synergies’ office portion is fully utilized and assists in supporting the manufacturing space, which is also 100% utilized. Diversified Synergies has been in occupancy at the Trio on Fort Street mortgaged property since August 2022 with 4% annual rent increases during the lease term. The Diversified Synergies lease expires in August 2027, and has no renewal or termination options.
Bedrock Management Services LLC (“Bedrock”) (25,783 SF; 3.0% of the commercial net rentable area; 13.3% of underwritten base rent of the commercial space): Founded in 2011, Bedrock is a full-service real estate with over $7.5 billion committed to acquire, develop and operate more 140 properties in Detroit and Cleveland with landmark developments at Hudson's Detroit, Book Tower, City Modern, Tower City and the May Company Building. Bedrock has been in occupancy since December 2016 with $0.99 PSF in annual rent increases. The lease terminates in June 2027 with no termination options and two 5-year extension options.
The following table presents certain information relating to the tenants at the Bedrock Mixed-Use Portfolio:
| Tenant Summary (Commercial)(1) | |||||||||
Tenant | Credit Rating (Moody’s/ S&P/Fitch)(2) | Net Rentable Area (SF) | % of Net Rentable Area | U/W Base Rent(3) | U/W Base Rent Per SF(3) | % of Total U/W Base Rent(3) | Lease Expiration | Termination Option (Y/N) | Renewal Options |
| LM Manufacturing LLC | NR/NR/NR | 295,974 | 34.7% | $2,090,428 | $7.06 | 21.7% | 7/31/2030 | N | 2 x 5 |
| Diversified Synergies LLC | NR/NR/NR | 189,358 | 22.2% | $1,280,040 | $6.76 | 13.3% | 8/31/2027 | N | None |
| Bedrock Management Services LLC(4) | NR/NR/NR | 25,783 | 3.0% | $1,279,353 | $49.62 | 13.3% | 6/30/2027 | N | 2 x 5 |
| Gucci America Inc. | A-/NR/NR | 3,611 | 0.4% | $557,900 | $154.50 | 5.8% | 7/31/2032 | N | None |
| Detroit Venture Partners LLC(4) | NR/NR/NR | 20,057 | 2.4% | $552,735 | $27.56 | 5.7% | 1/31/2027 | N | None |
| Madison Hospitality | NR/NR/NR | 18,702 | 2.2% | $321,330 | $17.18 | 3.3% | 12/31/2035 | N | None |
| Hello Innovation Inc. | NR/NR/NR | 11,202 | 1.3% | $308,055 | $27.50 | 3.2% | 6/30/2025 | N | None |
| Rockbridge Growth Equity LLC(4) | NR/NR/NR | 9,780 | 1.1% | $300,834 | $30.76 | 3.1% | 12/31/2029 | N | 1 x 5 |
| Buddy's Downtown Detroit, LLC | NR/NR/NR | 7,977 | 0.9% | $216,833 | $27.18 | 2.3% | 5/31/2030 | N | None |
| Kenneth Neumann/Joel Smith & Associates Inc. | NR/NR/NR | 6,196 | 0.7% | $192,076 | $31.00 | 2.0% | 12/31/2025 | N | 1 x 5 |
| Largest Tenants | 588,640 | 69.0% | 7,099,584 | $12.06 | 73.9% | ||||
| Remaining Occupied | 119,208 | 14.0% | 2,513,326 | $21.08 | 26.1% | ||||
| Total Occupied | 707,848 | 83.0% | $9,612,910 | $13.58 | 100.0% | ||||
| Vacant | 145,219 | 17.0% | |||||||
| Total | 853,067 | 100.0% | |||||||
| (1) | Based on the underwritten rent roll dated May 20, 2024. |
| (2) | Certain ratings are those of the parent company whether or not the parent guarantees the lease. |
| (3) | U/W Base Rent, UW Base Rent PSF and % of Total U/W Base Rent are inclusive of contractual rent steps underwritten through June 2025 |
| (4) | Bedrock Management Services LLC, Rockbridge Growth Equity LLC and Detroit Venture Partners LLC are affiliates of the borrower. The Bedrock Management Services LLC space serves as the headquarters for the borrower sponsor’s real estate ventures, Bedrock Detroit. |
| THE INFORMATION IN THIS STRUCTURAL AND COLLATERAL TERM SHEET IS NOT COMPLETE AND MAY BE AMENDED PRIOR TO THE TIME OF SALE. THIS TERM SHEET IS NOT AN OFFER TO SELL THESE SECURITIES AND IT IS NOT A SOLICITATION OF AN OFFER TO BUY THESE SECURITIES IN ANY JURISDICTION WHERE THE OFFER OR SALE IS NOT PERMITTED. | ||
| 77 | ||
Various – Various Various Detroit, MI
| Collateral Asset Summary – Loan No. 6 Bedrock Mixed-Use Portfolio | Cut-off Date Balance: Cut-off Date LTV: U/W NCF DSCR: U/W NOI Debt Yield: | $55,000,000 54.3% 1.58x 11.3% |
The following table presents certain information relating to the lease rollover schedule at the Bedrock Mixed-Use Portfolio, based on initial lease expiration dates:
| Lease Rollover Schedule(1)(2) | |||||||
| Year Ending December 31 | Expiring Owned GLA | % of Owned GLA | Cumulative % of Owned GLA | U/W Base Rent | % of Total U/W Base Rent | U/W Base Rent $ per SF | # of Expiring Leases |
| MTM | 4,204 | 0.5% | 0.5% | $61,286 | 0.6% | $14.58 | 5 |
| 2024 | 8,585 | 1.0% | 1.5% | 276,746 | 2.9% | $32.24 | 4 |
| 2025 | 52,960 | 6.2% | 7.7% | 1,406,150 | 14.6% | $26.55 | 13 |
| 2026 | 27,947 | 3.3% | 11.0% | 284,375 | 3.0% | $10.18 | 5 |
| 2027 | 239,111 | 28.0% | 39.0% | 3,220,022 | 33.5% | $13.47 | 5 |
| 2028 | 16,722 | 2.0% | 41.0% | 334,042 | 3.5% | $19.98 | 6 |
| 2029 | 19,129 | 2.2% | 43.2% | 509,518 | 5.3% | $26.64 | 4 |
| 2030 | 303,951 | 35.6% | 78.8% | 2,307,261 | 24.0% | $7.59 | 2 |
| 2031 | 6,122 | 0.7% | 79.6% | 204,281 | 2.1% | $33.37 | 2 |
| 2032 | 3,611 | 0.4% | 80.0% | 557,900 | 5.8% | $154.50 | 1 |
| 2033 | 0 | 0.0% | 80.0% | 0 | 0.0% | $0.00 | 0 |
| 2034 | 6,804 | 0.8% | 80.8% | 130,000 | 1.4% | $19.11 | 2 |
| 2035 & Thereafter | 18,702 | 2.2% | 83.0% | 321,330 | 3.3% | $17.18 | 1 |
| Vacant | 145,219 | 17.0% | 100.0% | 0 | 0.0% | NAP | NAP |
| Total / Wtd. Avg. | 853,067 | 100.0% | 100.0% | $9,612,910 | 100.0% | $13.58 | 50 |
| (1) | Based on the underwritten rent roll as of May 20, 2024. |
| (2) | Certain tenants may have lease termination options that are not reflected in the Lease Rollover Schedule. |
| Unit Mix - 28 Grand Apartments | |||||
| Unit Type | # of Units | % of Total Units | Occupancy | Average Unit Size | Average Monthly Rent Per Unit |
| Studio | 133 | 100.0% | 84.2% | 259 | $1,072 |
| Unit Mix – The Ferguson Apartments | |||||
| Unit Type | # of Units | % of Total Units | Occupancy | Average Unit Size | Average Monthly Rent Per Unit |
| Studio | 10 | 18.2% | 90.0% | 719 | $1,702 |
| 1 BR / 1 BA | 45 | 81.8% | 95.6% | 1,014 | $1,942 |
| Total / Wtd. Avg. | 55 | 100.0% | 94.5% | 960 | $1,901 |
| Unit Mix - Fourteen56 Apartments | |||||
| Unit Type | # of Units | % of Total Units | Occupancy | Average Unit Size | Average Monthly Rent Per Unit |
| 2 BR / 2 BA | 6 | 100.0% | 100.0% | 1,474 | $3,489 |
| THE INFORMATION IN THIS STRUCTURAL AND COLLATERAL TERM SHEET IS NOT COMPLETE AND MAY BE AMENDED PRIOR TO THE TIME OF SALE. THIS TERM SHEET IS NOT AN OFFER TO SELL THESE SECURITIES AND IT IS NOT A SOLICITATION OF AN OFFER TO BUY THESE SECURITIES IN ANY JURISDICTION WHERE THE OFFER OR SALE IS NOT PERMITTED. | ||
| 78 | ||
Various – Various Various Detroit, MI
| Collateral Asset Summary – Loan No. 6 Bedrock Mixed-Use Portfolio | Cut-off Date Balance: Cut-off Date LTV: U/W NCF DSCR: U/W NOI Debt Yield: | $55,000,000 54.3% 1.58x 11.3% |
The following table presents certain information relating to the historical operating performance and Underwritten Net Cash Flow at the Bedrock Mixed-Use Portfolio Properties:
| Cash Flow Analysis(1) | |||||
| 2021 | 2022 | 2023 | U/W | U/W Per Square Foot | |
| Base Commercial Rent(2) | $6,087,483 | $8,835,747 | $9,095,396 | $9,436,984 | $11.06 |
| Rent Steps(3) | 0 | 0 | 0 | 120,008 | $0.14 |
| Vacant Income | 0 | 0 | 0 | 1,782,438 | $2.09 |
| Gross Potential Rent | $6,087,483 | $8,835,747 | $9,095,396 | $11,339,430 | $13.29 |
| Reimbursements | 883,522 | 794,287 | 2,694,616 | 2,044,337 | $2.40 |
| Percentage Rent | 667,899 | 664,230 | 585,617 | 705,617 | $0.83 |
| Multifamily Rental Income | 1,851,577 | 2,658,855 | 2,712,464 | 3,042,178 | $3.57 |
| Multifamily Commercial Income | 435,201 | 382,911 | 299,520 | 175,925 | $0.21 |
| Other Rental Income(4) | 153,128 | 115,233 | 247,050 | 237,656 | $0.28 |
| Miscellaneous Income(4) | 93,595 | 126,089 | 148,902 | 148,902 | $0.17 |
| Less: Vacancy | 0 | 0 | 0 | (2,021,016) | ($2.37) |
| Effective Gross Income | $10,172,405 | $13,577,352 | $15,783,565 | $15,673,030 | $18.37 |
| Management Fee | 799,060 | 859,482 | 945,438 | 626,921 | $0.73 |
| Real Estate Taxes(5) | 1,478,536 | 1,090,631 | 973,163 | 1,013,708 | $1.19 |
| Insurance | 154,162 | 275,616 | 332,953 | 474,024 | $0.56 |
| Other Expenses | 4,446,001 | 5,408,999 | 5,340,709 | 5,102,707 | $5.98 |
| Total Expenses | $6,877,759 | $7,634,728 | $7,592,263 | $7,217,360 | $8.46 |
| Net Operating Income | $3,294,646 | $5,942,624 | $8,191,302 | $8,455,670 | $9.91 |
| Capital Expenditures | 0 | 0 | 0 | 200,496 | $0.24 |
| TI / LC | 0 | 0 | 0 | 568,285 | $0.67 |
| Net Cash Flow | $3,294,646 | $5,942,624 | $8,191,302 | $7,686,888 | $9.01 |
| (1) | Based on the underwritten rent roll dated May 20, 2024. |
| (2) | Includes base rent from commercial properties only. Base rent for the commercial space at the multifamily properties is included in the Multifamily Commercial Income. |
| (3) | Contractual rent steps through June 30, 2025. |
| (4) | Other Rental Income and Miscellaneous Income includes late fees, pet fees, laundry and parking for the multifamily space and parking, security contribution and other miscellaneous reimbursements for the commercial space. |
| (5) | The 28 Grand Apartments (9.1% of UW NCF) benefits from a tax abatement that expires in 2032. The lender has underwritten the current abated taxes for the 28 Grand Apartments property. |
| THE INFORMATION IN THIS STRUCTURAL AND COLLATERAL TERM SHEET IS NOT COMPLETE AND MAY BE AMENDED PRIOR TO THE TIME OF SALE. THIS TERM SHEET IS NOT AN OFFER TO SELL THESE SECURITIES AND IT IS NOT A SOLICITATION OF AN OFFER TO BUY THESE SECURITIES IN ANY JURISDICTION WHERE THE OFFER OR SALE IS NOT PERMITTED. | ||
| 79 | ||
Various – Various Various Detroit, MI
| Collateral Asset Summary – Loan No. 6 Bedrock Mixed-Use Portfolio | Cut-off Date Balance: Cut-off Date LTV: U/W NCF DSCR: U/W NOI Debt Yield: | $55,000,000 54.3% 1.58x 11.3% |
Appraisals. According to the appraisal, the Bedrock Mixed-Use Portfolio Properties had an aggregate “as-is” appraised value of $138,010,000 as of February 27, 2024 to February 29, 2024.
Bedrock Mixed-Use Portfolio | ||
Property | Appraised Value | Capitalization Rate(1) |
| Trio on Fort Street | $35,900,000 | 7.00% |
| 28 Grand Apartments | $16,700,000 | 6.25% |
| Madison Building | $15,100,000 | 7.25% |
| 1274 Library Street | $15,000,000 | 7.25% |
| The Ferguson Apartments | $14,900,000 | 6.25% |
| Lofts of Merchant Row | $12,500,000 | 7.25% |
| 620 and 630 Woodward Avenue | $10,570,000 | 7.00% |
| The Globe Building | $10,480,000 | 7.25% |
| 1500 Woodward Avenue | $3,900,000 | 7.25% |
| Fourteen56 Apartments | $2,960,000 | 6.00% |
| (1) | Represents the direct Capitalization Rate. |
Environmental Matters. According to Phase I environmental assessments dated between March 11, 2024 and March 18, 2024, there was no evidence of any recognized environmental conditions at the Bedrock Mixed-Use Portfolio Properties. Four of the Bedrock Mixed-Use Portfolio Properties had controlled recognized environmental conditions. See “Description of the Mortgage Pool—Environmental Considerations” in the Preliminary Prospectus.
The Market. The office, retail and multifamily buildings are located in the Downtown Detroit neighborhoods of Capitol Park, Campus Martius, Grand Circus Park, and Bricktown, and are within a 1.5-mile radius of one another. Parking for the Bedrock Mixed-Use Properties is provided by street parking and city parking lots. Most of the Bedrock Mixed-Use Portfolio Properties are on or nearby Woodward Avenue, which is the major north-south thoroughfare through metropolitan Detroit, which runs from Jefferson Avenue in downtown Detroit to Pontiac to the north. The Bedrock Mixed-Use Portfolio Properties are located near the I-75, I-375, and the Lodge Freeway interchanges, which provide access to the entire Detroit metropolitan area. Detroit is a port city on the Detroit River, which connects with Lake Erie and Lake St. Clair. The Ambassador Bridge, the Detroit Windsor Tunnel, and the Gordie Howe International Bridge, which is expected to open in 2025, provide access to Windsor, Ontario, Canada (the Bedrock Mixed-Use Portfolio Properties are one mile away from the Gordie Howe International Bridge and two miles away from the Ambassador Bridge).
| Market Summary(1) | |||||
| Property Name | ALA | Property Type | Submarket | Inventory (SF/Units) | Submarket Vacancy |
| Trio on Fort Street | $19,509,456 | Industrial | Detroit West | 50,648,378 | 7.9% |
| 28 Grand Apartments | $9,075,429 | Multifamily | Downtown/Midtown/Rivertown | 20,600 | 8.0% |
| Madison Building | $8,205,927 | Office | Central Business District | 27,483,247 | 10.3% |
| 1274 Library Street(2) | $8,151,583 | Retail/Office | Central Business District | 1,360,180 | 3.9% |
| The Ferguson Apartments | $8,097,239 | Multifamily | Downtown/Midtown/Rivertown | 20,600 | 8.0% |
| Lofts of Merchant Row | $6,792,986 | Retail | Central Business District | 1,360,180 | 3.9% |
| 620 and 630 Woodward Avenue | $5,744,149 | Office | Central Business District | 27,483,247 | 10.3% |
| The Globe Building | $5,695,239 | Office | Central Business District | 27,483,247 | 10.3% |
| 1500 Woodward Avenue(3) | $2,119,412 | Office/Retail | Central Business District | 27,483,247 | 10.3% |
| Fourteen56 Apartments | $1,608,579 | Multifamily | Downtown/Midtown/Rivertown | 20,600 | 8.0% |
| (1) | Source: Appraisal. |
| (2) | Represents market data from the retail submarket |
| (3) | Represents market data from the office submarket. |
Office Lease Comparables: The appraisals identified six office lease comparables located in the Detroit metropolitan statistical area (“MSA”). The office lease comparable buildings were built between 1910 and 2006 and ranged in size from 15,100 to 576,449 square feet. The office lease comparable commencement dates ranged from October 2021 to March 2024 and ranged in size from 3,375 square feet to 51,404 square feet. The office lease comparable rents ranged from $14.50 PSF to $27.88 PSF, with a weighted average of $20.16 PSF. The comparable office lease terms ranged from 0.8 to seven years.
Retail Lease Comparables: The appraisals identified six retail lease comparables located in the Detroit MSA. The comparable buildings were built between 1926 and 2022 and ranged in size from 6,300 to 188,000 square feet. The lease comparable commencement dates
| THE INFORMATION IN THIS STRUCTURAL AND COLLATERAL TERM SHEET IS NOT COMPLETE AND MAY BE AMENDED PRIOR TO THE TIME OF SALE. THIS TERM SHEET IS NOT AN OFFER TO SELL THESE SECURITIES AND IT IS NOT A SOLICITATION OF AN OFFER TO BUY THESE SECURITIES IN ANY JURISDICTION WHERE THE OFFER OR SALE IS NOT PERMITTED. | ||
| 80 | ||
Various – Various Various Detroit, MI
| Collateral Asset Summary – Loan No. 6 Bedrock Mixed-Use Portfolio | Cut-off Date Balance: Cut-off Date LTV: U/W NCF DSCR: U/W NOI Debt Yield: | $55,000,000 54.3% 1.58x 11.3% |
ranged from May 2022 to March 2023 and the comparable leases ranged in size from 1,363 to 6,300 square feet. The rents ranged from $25.00 PSF to $35.00 PSF, with a weighted average of $31.53 PSF. The lease terms ranged from 1.1 to 10 years.
Industrial Lease Comparables: The appraisals identified six industrial lease comparables located in the general Detroit MSA. The comparable buildings were built between 1967 and 2022 and ranged in size from 200,000 to 1,120,655 square feet. The lease comparable commencement dates ranged from November 2022 to August 2023 and ranged in size from 200,000 to 659,589 square feet. The industrial lease comparable rents ranged from $5.00 PSF to $9.62 PSF (triple net), with a weighted average of $7.57 PSF. The comparable industrial lease terms ranged from five to 25 years.
Multifamily Lease Comparables: The appraisals identified six multifamily lease comparables located in the Detroit MSA for the 28 Grand Apartments and The Ferguson Apartments mortgaged properties. The comparable buildings were built between 1900 to 2023 and ranged from 25 units to 288 units. The average comparable studio rent per unit ranged from $1,147 to $1,645 per unit. The average comparable one-bedroom rent per unit ranged from $1,612 to $2,267 per unit. The appraisal identified six multifamily lease comparables for the Fourteen56 Apartments mortgaged property. The comparable buildings were built between 1915 to 2023 and ranged from 20 units to 288 units. The average comparable rent per unit ranged from $1,815 to $6,470 per unit.
The Borrowers and the Borrower Sponsors. The borrowers for the Bedrock Mixed Use Portfolio Whole Loan are Madison Theatre Building LLC, 28 Grand River LLC, Merchants Row Webward LLC, 1448 Webdward Avenue LLC, Fort Street Company Trio LLC, Fort Street Company 4 LLC, 407 Fort Street LLC, DTRT 1456 Woodward LLC, 1500 Webward Avenue LLC, 1274 Library LLC and 620 Webward Building LLC, each a Delaware limited liability company and single purpose entity with two independent directors. Legal counsel to the borrowers delivered a non-consolidation opinion in connection with the origination of the Bedrock Mixed-Use Portfolio Whole Loan.
The borrower sponsor is Dan Gilbert and non-recourse carveout guarantor for the Bedrock Mixed-Use Portfolio Whole Loan is Rock Backer LLC which is funded by Dan Gilbert. Dan Gilbert is the Founder and Chairman of Rock, which is the family office for the Gilberts and their Family of Companies and is based in Downtown Detroit. There are more than 100 affiliated companies across the country that employ more than 30,000 team members, including more than 17,000 in Detroit’s urban core. These companies consist of fintech, philanthropy, sports, media, and entertainment, real estate and hospitality, venture capital and private equity. Some of the companies include Rocket Mortgage, Rocket Connections, Rock Entertainment Group, Rocket Community Fund, Amrock, Bedrock, Benzinga, Stock X, Gilbert Family Foundation, Shinola Hotel, Ritz-Carlton Cleveland, Jack Cleveland Casino and Jack Thistledown Racino, and more. According to the 2023 Forbes 400, Dan Gilbert was ranked 34th wealthiest person in the country with an estimated net worth of $21.3 billion.
In 2011, Dan Gilbert founded Detroit-based Bedrock, which is a full service commercial real estate firm based in Downtown Detroit specializing in the strategic development of urban cores. Since its founding, Bedrock and its affiliates have invested and committed more than $5.6 billion to acquiring and developing more than 100 properties totaling over 18 million square feet, including new construction of ground up developments. Bedrock is the largest real estate partner in Downtown Detroit and also has a strong presence in Cleveland Ohio.
Property Management. The Bedrock Mixed-Use Portfolio is managed Bedrock Management Services LLC, an affiliate of the non-recourse carveout guarantor.
Initial and Ongoing Reserves.
Tax Reserve – So long as Trigger Period (as defined below) does not exist, monthly tax escrow requirements will be waived. Upon the continuance of a Trigger Period, the borrowers are required to escrow 1/12th of the annual estimated tax payments payable during the next ensuing 12 months on a monthly basis.
Insurance Reserve – So long as Trigger Period (as defined below) does not exist, monthly insurance escrow requirements will be waived Upon the continuance of a Trigger Period, the borrowers are required to escrow 1/12th of the annual estimated insurance payments on a monthly basis.
Replacement Reserve – The borrowers are required to deposit monthly, with or on behalf of the lender, an amount equal to approximately $16,708.03.
TI/LC Reserve – The borrowers are required to deposit monthly, with or on behalf of the lender, an amount equal to approximately $75,000, capped at $3,000,000.
Lockbox / Cash Management. The Bedrock Mixed-Use Portfolio Whole Loan is structured with a hard lockbox (commercial properties); and a springing lockbox (multifamily properties) as well as springing cash management. The borrower is required to direct the tenants to pay rent directly into the lockbox account (or the Property Manager with respect to the residential tenants), and to deposit into such account any rents otherwise received within three business days of receipt. During the continuance of a Trigger Period (as defined below) all funds in the lockbox account are required to be swept on each business day to a lender-controlled cash management account. All excess cash flow funds remaining in the cash management account after the application of such funds in accordance with the Bedrock
| THE INFORMATION IN THIS STRUCTURAL AND COLLATERAL TERM SHEET IS NOT COMPLETE AND MAY BE AMENDED PRIOR TO THE TIME OF SALE. THIS TERM SHEET IS NOT AN OFFER TO SELL THESE SECURITIES AND IT IS NOT A SOLICITATION OF AN OFFER TO BUY THESE SECURITIES IN ANY JURISDICTION WHERE THE OFFER OR SALE IS NOT PERMITTED. | ||
| 81 | ||
Various – Various Various Detroit, MI
| Collateral Asset Summary – Loan No. 6 Bedrock Mixed-Use Portfolio | Cut-off Date Balance: Cut-off Date LTV: U/W NCF DSCR: U/W NOI Debt Yield: | $55,000,000 54.3% 1.58x 11.3% |
Mixed-Use Portfolio Whole Loan documents are required to be held by the lender in an excess cash flow reserve account as additional collateral for the Bedrock Mixed-Use Whole Loan during the continuance of a Cash Sweep Trigger Period.
A “Trigger Period” will commence upon (i) an event of default, (ii) the commencement of a Low DSCR Period (as defined below), (iii) a bankruptcy action of an affiliated Borrower or property manager or (iv) a Lease Sweep Period (as defined below). A Trigger Period will end if (a) with respect to clause (i) above, a cure of such event of default is accepted by the lender, (b) with respect to clause (ii) above, the Low DSCR Period has been cured in accordance with the definition of such term, (c) with respect to clause (iii) above, the property manager is replaced with an unaffiliated qualified property manager and (d) with respect to clause (iv) above, such Lease Sweep Period has been cured in accordance with the definition of such term.
A “Low DSCR Period” will commence if the debt service coverage ratio falls below 1.15x as of any calendar quarter and will end if the debt service coverage ratio is at least 1.20x for two consecutive calendar quarters.
A “Lease Sweep Period” will commence (a) upon the earlier of (i) the date that is seven months prior to the expiration of a Sweep Lease (as defined below) or (ii) the date required under the Sweep Lease by which the Sweep Tenant (as defined below) is required to give notice of its exercise of a renewal option thereunder (and such renewal has not been so exercised); (b) upon the termination, cancellation or surrender of a Sweep Lease or upon the borrower’s receipt of written notice by a Sweep Tenant of its intent to effect a termination, cancellation or surrender of its Sweep Lease; (c) if a Sweep Tenant has ceased operating its business (i.e., “goes dark”) at the Bedrock Mixed-Use Portfolio or any material portion of its space at the Bedrock Mixed-Use Portfolio, it being understood that a Sweep Tenant will be deemed to be “dark” if such Sweep Tenant has discontinued its operations; (d) upon a monetary or material nonmonetary default under a Sweep Lease by a Sweep Tenant beyond any applicable notice and cure period or (e) upon a bankruptcy or insolvency proceeding of a Sweep Tenant or its parent.
A Lease Sweep Period will terminate upon: (A) in the case of clauses (a), (b), and (c) above, the entirety of the Sweep Lease space (or applicable portion thereof) is leased pursuant to one or more qualified leases (which must be on market terms and have terms that are for at least five years and extend at least two years beyond the loan term) and in the lender’s reasonable judgement there are sufficient funds in the lease sweep reserve to cover all anticipated leasing expenses approved by the lender, and free or abated rent periods for such qualified leases (collectively, “Leasing Costs”), and any shortfalls in loan agreement payments or operating expenses resulting from anticipated down time prior to the commencement of payments under such qualified leases; (B) in the case of clause (a) above, the Sweep Tenant irrevocably exercises its renewal or extension option with respect to all of its space, and in the lender’s judgement there are sufficient funds in the lease sweep reserve to cover all Leasing Costs in connection with such renewal or extension; (C) in the case of clause (d) above, the subject default has been cured and no other default under the Sweep Lease occurs for three consecutive months following such cure; (D) in the case of clause and (e) above, the applicable bankruptcy or insolvency proceeding has been terminated and the applicable Sweep Lease (and any guaranty of it) has been affirmed or assumed in a manner reasonably satisfactory to the lender pursuant to a final non-appealable order of the bankruptcy court, all lease defaults have been cured and the Sweep Tenant is in occupancy and paying full, unabated rent, and adequate assurance of future performance under the Sweep Lease (and any guaranty), as reasonably determined by the lender, has been provided.
A “Sweep Lease” means (i) the Bedrock Management Services LLC lease or (ii) any replacement Tenant that covers the majority of the Sweep Lease space.
Current Mezzanine or Secured Subordinate Indebtedness. None.
Permitted Future Mezzanine or Secured Subordinate Indebtedness. Not Permitted.
Release of Collateral. Provided no event of default is continuing under the Bedrock Mixed-Use Portfolio Whole Loan documents, after the earlier to occur of (x) June 5, 2027 and (y) the end of the two-year period commencing on the closing date of the securitization of the last promissory note representing a portion of the Bedrock Mixed-Use Portfolio Whole Loan to be securitized, the borrowers may release an individual property or properties from the Bedrock Mixed-Use Portfolio Whole Loan by defeasing 120% of the allocated loan amount of the release property or properties, and subject to terms and conditions set forth in the Bedrock Mixed-Use Portfolio Whole Loan documents, including but not limited to: (i) the DSCR after giving effect to such release is at least the greater of (x) 1.43x and (y) the DSCR immediately prior to such release; (ii) the LTV after giving effect to such release is no more than the lesser of (x) 54.3% and (y) the LTV immediately prior to such release and (iii) receipt of rating agency confirmation.
Ground Lease. None
| THE INFORMATION IN THIS STRUCTURAL AND COLLATERAL TERM SHEET IS NOT COMPLETE AND MAY BE AMENDED PRIOR TO THE TIME OF SALE. THIS TERM SHEET IS NOT AN OFFER TO SELL THESE SECURITIES AND IT IS NOT A SOLICITATION OF AN OFFER TO BUY THESE SECURITIES IN ANY JURISDICTION WHERE THE OFFER OR SALE IS NOT PERMITTED. | ||
| 82 | ||
Multifamily – Student Housing 6350 Griffin Road Davie, FL 33314
| Collateral Asset Summary – Loan No. 7 University Pointe | Cut-off Date Balance: Cut-off Date LTV: U/W NCF DSCR: U/W NOI Debt Yield: | $50,000,000 54.5% 1.73x 11.9% |
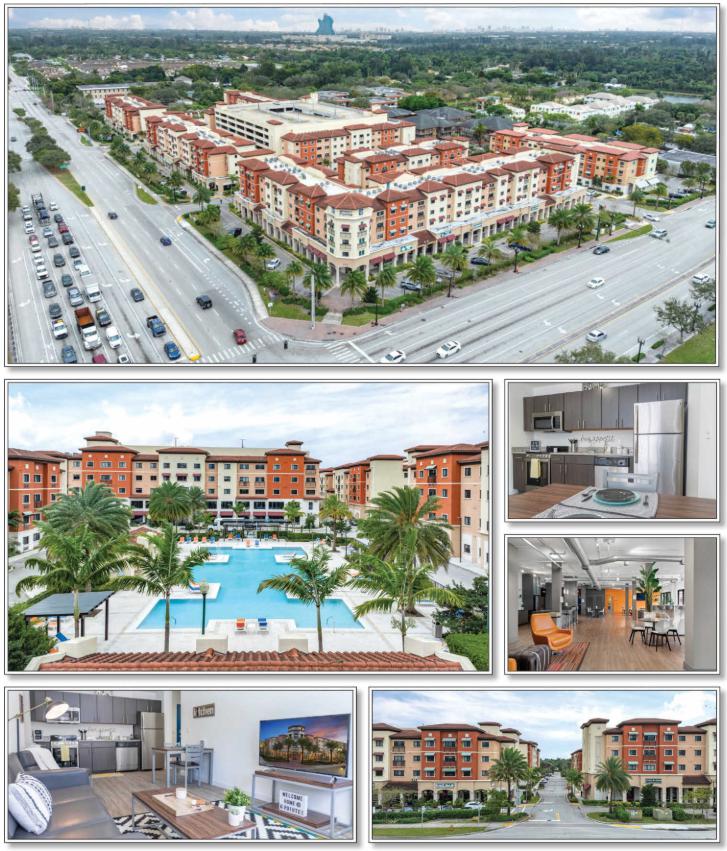
| THE INFORMATION IN THIS STRUCTURAL AND COLLATERAL TERM SHEET IS NOT COMPLETE AND MAY BE AMENDED PRIOR TO THE TIME OF SALE. THIS TERM SHEET IS NOT AN OFFER TO SELL THESE SECURITIES AND IT IS NOT A SOLICITATION OF AN OFFER TO BUY THESE SECURITIES IN ANY JURISDICTION WHERE THE OFFER OR SALE IS NOT PERMITTED. | ||
| 83 | ||
Multifamily – Student Housing 6350 Griffin Road Davie, FL 33314
| Collateral Asset Summary – Loan No. 7 University Pointe | Cut-off Date Balance: Cut-off Date LTV: U/W NCF DSCR: U/W NOI Debt Yield: | $50,000,000 54.5% 1.73x 11.9% |
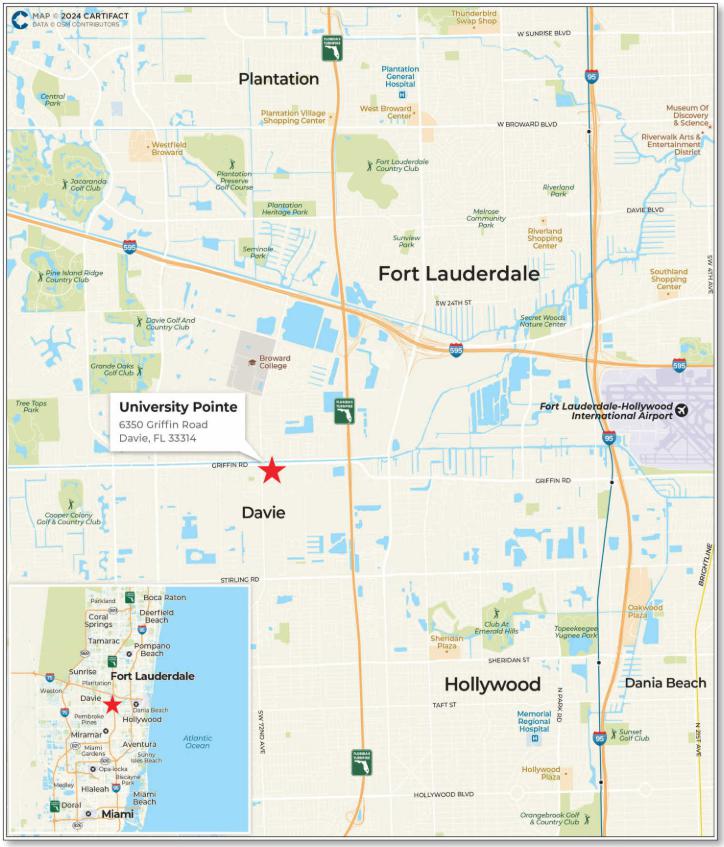
| THE INFORMATION IN THIS STRUCTURAL AND COLLATERAL TERM SHEET IS NOT COMPLETE AND MAY BE AMENDED PRIOR TO THE TIME OF SALE. THIS TERM SHEET IS NOT AN OFFER TO SELL THESE SECURITIES AND IT IS NOT A SOLICITATION OF AN OFFER TO BUY THESE SECURITIES IN ANY JURISDICTION WHERE THE OFFER OR SALE IS NOT PERMITTED. | ||
| 84 | ||
Multifamily – Student Housing 6350 Griffin Road Davie, FL 33314
| Collateral Asset Summary – Loan No. 7 University Pointe | Cut-off Date Balance: Cut-off Date LTV: U/W NCF DSCR: U/W NOI Debt Yield: | $50,000,000 54.5% 1.73x 11.9% |
| Mortgage Loan Information | Property Information | |||
| Loan Seller: | CREFI | Single Asset / Portfolio: | Single Asset | |
| Loan Purpose: | Refinance | Property Type – Subtype: | Multifamily - Student Housing | |
| Borrower Sponsor(s): | Robert Konig and Steven Krausman | Collateral: | Fee | |
| Borrower(s): | Nob Hill Partners, LLC and Broward Student Housing, LLC | Location: | Davie, FL | |
| Original Balance(1): | $50,000,000 | Year Built / Renovated: | 2019 / NAP | |
| Cut-off Date Balance(1): | $50,000,000 | Property Management: | Self-Managed | |
| % by Initial UPB: | 5.0% | Size: | 877 Beds | |
| Interest Rate: | 6.70000% | Appraised Value / Per Bed: | $157,400,000 / $179,475 | |
| Note Date: | May 16, 2024 | Appraisal Date: | April 22, 2024 | |
| Original Term: | 60 months | Occupancy(3): | 98.1% (as of April 4, 2024) | |
| Amortization: | Interest Only | UW Economic Occupancy: | 95.0% | |
| Original Amortization: | NAP | Underwritten NOI(4): | $10,195,067 | |
| Interest Only Period: | 60 months | Underwritten NCF: | $10,096,983 | |
| First Payment Date: | July 6, 2024 | |||
| Maturity Date: | June 6, 2029 | Historical NOI | ||
| Additional Debt Type(1): | Pari Passu | Most Recent NOI(4): | $8,192,053 (TTM March 31, 2024) | |
| Additional Debt Balance(1): | $35,850,000 | 2023 NOI: | $8,127,143 | |
| Call Protection: | YM1(53),O(7) | 2022 NOI(5): | NAV | |
| Lockbox / Cash Management: | Springing / Springing | 2021 NOI(5): | NAV | |
| Reserves(2) | Financial Information(1) | ||||||
| Initial | Monthly | Cap | Cut-off Date Loan / Bed: | $97,891 | |||
| Taxes: | $581,528 | $145,382 | NAP | Maturity Date Loan / Bed: | $97,891 | ||
| Insurance: | $633,393 | $70,377 | NAP | Cut-off Date LTV: | 54.5% | ||
| Replacement Reserves: | $0 | $5,595 | NAP | Maturity Date LTV: | 54.5% | ||
| TI / LC: | $0 | $2,579 | NAP | UW NOI DY: | 11.9% | ||
| UW NCF DSCR: | 1.73x | ||||||
| Sources and Uses | |||||||
| Sources | Proceeds | % of Total | Uses | Proceeds | % of Total | ||
| Whole Loan(1) | $85,850,000 | 100.0% | Loan Payoff | $61,152,998 | 71.2 | % | |
| Sponsor Equity | 18,433,215 | 21.5 | |||||
| Closing Costs(6) | 5,048,866 | 5.9 | |||||
| Upfront Reserves | 1,214,921 | 1.4 | |||||
| Total Sources | $85,850,000 | 100.0% | Total Uses | $85,850,000 | 100.0 | % | |
| (1) | The University Pointe Mortgage Loan (as defined below) is part of the University Pointe Whole Loan (as defined below) evidenced by two pari passu notes with an aggregate outstanding principal balance as of the Cut-off Date of $85,850,000. The Financial Information in the chart above reflects the University Pointe Whole Loan. |
| (2) | See “Initial and Ongoing Reserves” below. |
| (3) | Occupancy is based on 877 beds and does not include the 30,943 square feet of ground floor retail space at the University Pointe Property (as defined below). The retail component is 84.2% occupied as of February 13, 2024. |
| (4) | The increase from Most Recent NOI to Underwritten NOI is primarily attributable to underwritten commercial income of $920,064 and straight line rent increases of $632,484 related to the NSU (as defined below) lease. |
| (5) | 2021 NOI and 2022 NOI are not available because the units at the University Pointe Property were opened in phases beginning in 2019, with the final phase coming online in August 2022. |
| (6) | Closing Costs include a rate buydown of $3,434,000. |
| THE INFORMATION IN THIS STRUCTURAL AND COLLATERAL TERM SHEET IS NOT COMPLETE AND MAY BE AMENDED PRIOR TO THE TIME OF SALE. THIS TERM SHEET IS NOT AN OFFER TO SELL THESE SECURITIES AND IT IS NOT A SOLICITATION OF AN OFFER TO BUY THESE SECURITIES IN ANY JURISDICTION WHERE THE OFFER OR SALE IS NOT PERMITTED. | ||
| 85 | ||
Multifamily – Student Housing 6350 Griffin Road Davie, FL 33314
| Collateral Asset Summary – Loan No. 7 University Pointe | Cut-off Date Balance: Cut-off Date LTV: U/W NCF DSCR: U/W NOI Debt Yield: | $50,000,000 54.5% 1.73x 11.9% |
The Loan. The seventh largest mortgage loan (the “University Pointe Mortgage Loan”) is part of a whole loan (the “University Pointe Whole Loan”) secured by the borrowers’ fee interest in a Class A, 877-bed, 250-unit, student housing property, with 30,943 square feet of ground floor retail space, located in Davie, Florida (the “University Pointe Property”). The University Pointe Whole Loan is comprised of two pari passu notes, with an aggregate outstanding principal balance as of the Cut-off Date of $85,850,000. The University Pointe Whole Loan accrues interest at a fixed rate of 6.70000% per annum. The University Pointe Whole Loan has an initial term of five years and is interest-only for the full term. The University Pointe Mortgage Loan is evidenced by the controlling Note A-1, with an outstanding principal balance as of the Cut-off Date of $50,000,000.
The table below identifies the promissory notes that comprise the University Pointe Whole Loan. The relationship between the holders of the University Pointe Whole Loan is governed by a co-lender agreement as described under “Description of the Mortgage Pool—The Whole Loans—The Serviced Pari Passu Whole Loans” in the Preliminary Prospectus. The University Pointe Whole Loan will be serviced pursuant to the pooling and servicing agreement for the Benchmark 2024-V8 transaction.
| Whole Loan Summary | ||||
| Note | Original Balance | Cut-off Date Balance | Note Holder | Controlling Piece |
| A-1 | $50,000,000 | $50,000,000 | Benchmark 2024-V8 | Yes |
| A-2 | $35,850,000 | $35,850,000 | BBCMS 2024-5C27(1) | No |
| Whole Loan | $85,850,000 | $85,850,000 | ||
| (1) | Expected to close on or prior to July 11, 2024. |
The Property. The University Pointe Property is a Class A, 877-bed, 250-unit, student housing property, with 30,943 square feet of ground floor retail space located at 6350 Griffin Road in Davie, Florida. The University Pointe Property was originally constructed in 2019 on a 9.58-acre site and was opened in phases from April 2019 to August 2022. The University Pointe Property is comprised of six, four-story apartment buildings and one, five-story residential building attached to a seven-level parking garage. Amenities at the University Pointe Property include a clubhouse/leasing office, stainless steel appliances, garage parking, free internet, a campus shuttle, on-site security, in-unit washer and dryers, a study lounge, private study rooms, a computer lab, fitness center, outdoor kitchen and barbecue area and a swimming pool. As of April 4, 2024, the residential component of the University Pointe Property was 98.1% occupied.
The University Pointe Property is located approximately 1.5 miles southeast from Nova Southeastern University (“NSU”), and according to the appraisal is the only off-campus purpose-built student housing project in the market serving NSU, Florida Atlantic University – Davie Campus, University of Florida Davie Extension Campus, and Broward College. The University Pointe Property is a direct provider of housing to NSU with a rental lease in place for 380 beds (43.3% of beds and 41.3% of underwritten base rent) through July 31, 2027. All student leases at the University Pointe Property require parental guarantees, unless the tenant can meet certain income requirements or place a two-month deposit. Additionally, the borrowers have a lease in place with Carnival Cruise Line (“Carnival”) for 64 beds (7.3% of beds and 7.0% of underwritten base rent) through July 31, 2027.
The University Pointe Property also includes 30,943 square feet of ground floor retail space, which as of February 13, 2024 was 84.2% occupied by a granular rent roll of 13 tenants with an average base rent of $28.05 per square foot. Total commercial income represents 5.9% of underwritten effective gross income at the University Pointe Property. No commercial tenant accounts for more than 12.6% of commercial rent or 11.4% of commercial NRA. The commercial tenant base consists of, among others, multiple restaurant tenants, medical tenants and a fitness studio.
| THE INFORMATION IN THIS STRUCTURAL AND COLLATERAL TERM SHEET IS NOT COMPLETE AND MAY BE AMENDED PRIOR TO THE TIME OF SALE. THIS TERM SHEET IS NOT AN OFFER TO SELL THESE SECURITIES AND IT IS NOT A SOLICITATION OF AN OFFER TO BUY THESE SECURITIES IN ANY JURISDICTION WHERE THE OFFER OR SALE IS NOT PERMITTED. | ||
| 86 | ||
Multifamily – Student Housing 6350 Griffin Road Davie, FL 33314
| Collateral Asset Summary – Loan No. 7 University Pointe | Cut-off Date Balance: Cut-off Date LTV: U/W NCF DSCR: U/W NOI Debt Yield: | $50,000,000 54.5% 1.73x 11.9% |
The following table presents certain information relating to the unit mix at the University Pointe Property:
| Unit Mix(1) | |||||||||
| Unit Type | # of Units | # of Beds | Occupied Beds | Occupancy | Average Unit Size (SF) | Average Monthly Rental Rate Per Bed(2) | Average Monthly Market Rent Per Bed(3) | Average Monthly Rental Rate Per Unit(4) | Average Monthly Market Rent Per Unit(3) |
| 1x1 Market – Layout 1 | 15 | 15 | 15 | 100.0% | 611 | $2,382 | $2,223 | $2,382 | $2,223 |
| 1x1 Market – Layout 2 | 6 | 6 | 5 | 83.3% | 1,500 | $2,922 | $2,922 | $2,922 | $2,922 |
| 2x2 Market | 10 | 20 | 15 | 75.0% | 826 | $1,618 | $1,618 | $3,243 | $3,236 |
| 3x3 Market | 20 | 60 | 56 | 93.3% | 1,100 | $1,376 | $1,328 | $4,155 | $3,984 |
| 4x4 Market – Layout 1 | 71 | 284 | 277 | 97.5% | 1,307 | $1,226 | $1,167 | $4,918 | $4,667 |
| 4x4 Market – Layout 2 | 12 | 48 | 48 | 100.0% | 1,356 | $1,507 | $1,506 | $6,027 | $6,024 |
| 2x2 NSU(5) | 6 | 12 | 12 | 100.0% | 826 | $1,365 | $1,316 | $2,731 | $2,632 |
| 3x3 NSU(5) | 8 | 24 | 24 | 100.0% | 1,044 | $1,343 | $1,255 | $4,029 | $3,765 |
| 4x4 NSU – Layout 1(5) | 30 | 120 | 120 | 100.0% | 1,309 | $1,100 | $1,055 | $4,398 | $4,218 |
| 4x4 NSU – Layout 2(5) | 56 | 224 | 224 | 100.0% | 1,323 | $1,390 | $1,350 | $5,562 | $5,399 |
| 4x4 Carnival(6) | 16 | 64 | 64 | 100.0% | 1,304 | $1,302 | $1,225 | $5,208 | $4,900 |
| Total/Wtd. Avg. | 250 | 877 | 860 | 98.1% | 1,220 | $1,321 | $1,277 | $4,722 | $4,479 |
| (1) | Based on the underwritten rent roll dated April 4, 2024. |
| (2) | Average Monthly Rental Rate Per Bed excludes four employee occupied beds for which no underwritten base rent is attributable. |
| (3) | Source: Appraisal. |
| (4) | Average Monthly Rental Rate Per Unit is based on units with all beds occupied and excludes four employee occupied units for which no underwritten base rent is attributable. |
| (5) | Unit Types designated as “NSU” are under a lease with NSU through July 31, 2027. The NSU lease permits the units at the University Pointe Property to be terminated as follows: (i) up to 10 units in any year of the term, upon three months’ notice and payment of 30 days’ rent per bed in the terminated unit plus a termination fee of $500 per unit, and (ii) any additional units in such year upon 18 months’ notice. |
| (6) | Unit Types designated as “Carnival” are under a lease with Carnival through July 31, 2027. The Carnival lease permits Carnival to terminate its lease on the following terms: (i) prior to August 1, 2025, up to five units may be terminated upon payment of four months’ rent, and six or more units may be terminated only upon full payment of the lease, (ii) on and after August 1, 2025, up to five units may be terminated upon nine months’ notice with no termination fee, and six or more units may be terminated upon nine months’ notice with a termination fee equal to one-half month of rent, and (iii) after January 1, 2026, up to 12 units may be terminated upon nine months’ notice with a termination fee equal to one-half month of rent, and any additional units may be terminated upon 12 months’ notice with a termination fee equal to one and one-half month of rent. |
The following table presents certain information relating to the commercial tenants lease rollover schedule at the University Pointe Property:
| Commercial Lease Rollover Schedule(1) | ||||||||||
| Year | Number of Leases Expiring | Net Rentable Area Expiring | % of NRA Expiring | UW Base Rent Expiring | % of UW Base Rent Expiring | Cumulative Net Rentable Area Expiring | Cumulative % of NRA Expiring | Cumulative UW Base Rent Expiring | Cumulative % of UW Base Rent Expiring | |
| 2024 | 0 | 0 | 0.0 | $0 | 0.0% | 0 | 0.0% | $0 | 0.0% | |
| 2025 | 0 | 0 | 0.0 | 0 | 0.0% | 0 | 0.0% | $0 | 0.0% | |
| 2026 | 0 | 0 | 0.0 | 0 | 0.0% | 0 | 0.0% | $0 | 0.0% | |
| 2027 | 1 | 3,187 | 10.3 | 85,588 | 11.7% | 3,187 | 10.3% | $85,588 | 11.7% | |
| 2028 | 2w | 3,104 | 10.0 | 83,740 | 11.5% | 6,291 | 20.3% | $169,328 | 23.2% | |
| 2029 | 7 | 12,905 | 41.7 | 368,746 | 50.4% | 19,196 | 62.0% | $538,074 | 73.6% | |
| 2030 | 0 | 0 | 0.0 | 0 | 0.0% | 19,196 | 62.0% | $538,074 | 73.6% | |
| 2031 | 1 | 3,532 | 11.4 | 92,390 | 12.6% | 22,728 | 73.5% | $630,464 | 86.3% | |
| 2032 | 2 | 3,330 | 10.8 | 100,504 | 13.7% | 26,058 | 84.2% | $730,968 | 100.0% | |
| 2033 | 0 | 0 | 0.0 | 0 | 0.0% | 26,058 | 84.2% | $730,968 | 100.0% | |
| 2034 | 0 | 0 | 0.0 | 0 | 0.0% | 26,058 | 84.2% | $730,968 | 100.0% | |
| 2035 & Beyond | 0 | 0 | 0.0 | 0 | 0.0% | 26,058 | 84.2% | $730,968 | 100.0% | |
| Vacant | NAP | 4,885 | 15.8 | % | NAP | NAP | 30,943 | 100.0% | NAP | NAP |
| Total | 13 | 30,943 | 100.0 | % | $730,968 | 100.0% | ||||
| (1) | Based on the underwritten rent roll dated February 13, 2024, inclusive of $20,309 of contractual rent steps though May 1, 2025. |
| THE INFORMATION IN THIS STRUCTURAL AND COLLATERAL TERM SHEET IS NOT COMPLETE AND MAY BE AMENDED PRIOR TO THE TIME OF SALE. THIS TERM SHEET IS NOT AN OFFER TO SELL THESE SECURITIES AND IT IS NOT A SOLICITATION OF AN OFFER TO BUY THESE SECURITIES IN ANY JURISDICTION WHERE THE OFFER OR SALE IS NOT PERMITTED. | ||
| 87 | ||
Multifamily – Student Housing 6350 Griffin Road Davie, FL 33314
| Collateral Asset Summary – Loan No. 7 University Pointe | Cut-off Date Balance: Cut-off Date LTV: U/W NCF DSCR: U/W NOI Debt Yield: | $50,000,000 54.5% 1.73x 11.9% |
The following table presents certain information relating to the operating history and Underwritten Net Cash Flow at the University Pointe Property:
| Cash Flow Analysis(1) | ||||
| 2023 | TTM 3/31/2024(2) | U/W(2) | U/W Per Bed | |
| Residential Base Rent | $12,531,533 | $12,647,752 | $13,572,461 | $15,476 |
| Commercial Base Rent | 0 | 0 | 730,968 | $833 |
| Nova Straight Line Increase | 0 | 0 | 632,484 | $721 |
| Potential Income from Vacant Space | 0 | 0 | 431,116 | $492 |
| Gross Potential Rent | $12,531,533 | $12,647,752 | $15,367,029 | $17,522 |
| Other Income(3) | 829,008 | 858,492 | 1,047,588 | $1,195 |
| (Vacancy/Credit Loss) | (150) | (700) | (861,744) | (983) |
| Effective Gross Income | $13,360,391 | $13,505,544 | $15,552,873 | $17,734 |
| Management Fee(4) | 529,076 | 532,650 | 466,586 | $532 |
| Real Estate Taxes | 1,406,549 | 1,559,049 | 1,594,843 | $1,819 |
| Insurance | 651,490 | 651,081 | 804,309 | $917 |
| Other Expenses(5) | 2,646,133 | 2,570,710 | 2,492,067 | $2,842 |
| Total Expenses | $5,233,248 | $5,313,490 | $5,357,805 | $6,109 |
| Net Operating Income | $8,127,143 | $8,192,053 | $10,195,067 | $11,625 |
| Capital Expenditures | 0 | 0 | 67,141 | $77 |
| TI/LC | 0 | 0 | 30,943 | $35 |
| Net Cash Flow | $8,127,143 | $8,192,053 | $10,096,983 | $11,513 |
| Occupancy | 98.9% | 97.9% | 95.0%(6) | |
| NCF DSCR(7) | 1.39x | 1.40x | 1.73x | |
| NOI Debt Yield(7) | 9.5% | 9.5% | 11.9% | |
| (1) | Historical cashflows prior to 2023 are not available because the units at the University Pointe Property were opened in phases beginning in 2019 with the final phase coming online in August 2022. |
| (2) | The increase from TTM 3/31/2024 to U/W Net Operating Income is primarily attributable to underwritten commercial income of $920,064 and straight line rent increases of $632,484 related to the NSU lease. |
| (3) | Other Income consists of lease fees, application fees, forfeited deposits, late charges, RUBS and miscellaneous income. |
| (4) | The University Pointe Property is self-managed. Management Fees are underwritten to 3.0% of Underwritten Effective Gross Income. Historical Management Fee consists of corporate employee payroll expenses, their affiliated additional fees, and consulting fees. |
| (5) | Other Expenses consist of utilities, general & administrative, repairs and maintenance, payroll & benefits, advertising and marketing. |
| (6) | Represents economic occupancy. |
| (7) | Based on the University Pointe Whole Loan. |
Appraisal. According to the appraisal, the University Pointe Property had an “as-is” appraised value of $157,400,000 as of April 22, 2024. Based on the “as-is” value of $157,400,000, the Cut-off Date LTV and Maturity Date LTV for the University Pointe Whole Loan are 54.5%.
| University Pointe Appraised Value(1) | ||
| Property | Value | Capitalization Rate |
| University Pointe | $157,400,000 | 5.50% |
| (1) | Source: Appraisal. |
Environmental Matters. According to the Phase I environmental site assessment dated February 16, 2024, there was no evidence of any recognized environmental conditions at the University Pointe Property.
The Market. The University Pointe Property is located at 6350 Griffin Road in Davie, Florida. There are four colleges/universities located within Davie including NSU, Florida Atlantic University – Davie Campus, University of Florida Davie Extension Campus and Broward College. Founded in 1964, NSU is a private school that offers more than 280 undergraduate, graduate and professional degree programs to 6,217 undergraduate students and 3,341 graduate students on its main Fort Lauderdale campus, which is located approximately 1.4 miles away from the University Pointe Property.
According to the appraisal, the University Pointe Property is located in the Plantation/Davie/Weston (“P/D/W”) apartment submarket of the Fort Lauderdale MSA. As of December 31, 2023, the P/D/W apartment submarket had a total inventory of 19,710 units, a vacancy rate of 5.7% and effective rent of $2,469 per unit. Additionally, the P/D/W submarket experienced positive net absorption of 640 units in 2023.
According to the appraisal, the 2023 population within a one-, three- and five-mile radius of the University Pointe Property was 15,307, 121,702 and 357,592, respectively. The 2023 average household income within the same radii was $83,016, $103,696 and $103,383, respectively.
| THE INFORMATION IN THIS STRUCTURAL AND COLLATERAL TERM SHEET IS NOT COMPLETE AND MAY BE AMENDED PRIOR TO THE TIME OF SALE. THIS TERM SHEET IS NOT AN OFFER TO SELL THESE SECURITIES AND IT IS NOT A SOLICITATION OF AN OFFER TO BUY THESE SECURITIES IN ANY JURISDICTION WHERE THE OFFER OR SALE IS NOT PERMITTED. | ||
| 88 | ||
Multifamily – Student Housing 6350 Griffin Road Davie, FL 33314
| Collateral Asset Summary – Loan No. 7 University Pointe | Cut-off Date Balance: Cut-off Date LTV: U/W NCF DSCR: U/W NOI Debt Yield: | $50,000,000 54.5% 1.73x 11.9% |
The following table presents certain information relating to comparable student housing properties to the University Pointe Property:
| Student Housing Rent Comparables(1) | ||||
Property Name | Year Built / Renovated |
Occupancy | Number of Beds | Average Rent Per Bed |
| University Pointe | 2019 / NAP | 98.1%(2)(3) | 877(2) | $1,321(2)(4) |
| The Yard University Apartments | 1969 / 2020 | 98% | 50 | $1,325 |
| University Park Student Housing | 2015 / NAP | 95% | 598 | $1,363 |
| 109 Tower | 2014 / NAP | 100% | 542 | $1,101 |
| Identity Miami | 2019 / NAP | 98% | 621 | $1,360 |
| 4th Street Commons | 2015 / NAP | 99% | 562 | $933 |
| The One At University City | 2020 / NAP | 99% | 1,244 | $1,526 |
| (1) | Source: Appraisal. |
| (2) | Based on the underwritten rent roll dated April 4, 2024. |
| (3) | Occupancy is based on 877 beds and does not include the 30,943 square feet of ground floor retail space at the University Pointe Property. The retail component is 84.2% occupied as of February 13, 2024. |
| (4) | Average Rent Per Bed for the University Pointe Property excludes four employee beds for which no underwritten base rent is attributable. |
The Borrowers and the Borrower Sponsor. The borrowers are Nob Hill Partners, LLC and Broward Student Housing, LLC, each a Florida limited liability company and single purpose entity having at least one independent director in its organizational structure. Legal counsel to the borrowers delivered a non-consolidation opinion in connection with the origination of the University Pointe Whole Loan. The borrower sponsors and non-recourse carveout guarantors are Robert Konig and Steven Krausman, who are experienced owners and operators of commercial real estate. Steven Krausman is an entrepreneur, holding interests in seven commercial real estate properties including student housing, office, retail and multifamily properties.
Property Management. The University Pointe Property is self-managed with no formal management agreement.
Initial and Ongoing Reserves. At origination, the borrowers deposited approximately (i) $581,528 into a reserve account for real estate taxes and (ii) $633,393 into a reserve account for insurance premiums.
Tax Escrows – On a monthly basis, the borrowers are required to deposit into a real estate tax reserve 1/12th of the property taxes that the lender estimates will be payable over the next-ensuing 12-month period (initially estimated to be approximately $145,382).
Insurance Escrows – On a monthly basis, the borrowers are required to deposit into an insurance reserve 1/12th of the amount that will be sufficient to pay the insurance premiums due for the renewal of coverage afforded by such policies (initially estimated to be approximately $70,377).
Replacement Reserves – On a monthly basis, the borrowers are required to deposit approximately $5,595 into a replacement reserve.
TI / LC Reserve – On a monthly basis, the borrowers are required to deposit into a tenant improvements and leasing commissions reserve account approximately $2,579, for tenant improvements and leasing commissions incurred with respect to the University Pointe Property.
Lockbox / Cash Management. The University Pointe Whole Loan is structured with a springing lockbox and springing cash management. On the first occurrence of a Trigger Period (as defined below), the borrowers are required to establish a lender-controlled lockbox account, and are thereafter required to deposit, or cause the property manager to immediately deposit, all revenue received by the borrowers or the property manager, as applicable, into such lockbox. Within five days after the first occurrence of a Trigger Period, the borrowers are required to deliver a notice to all tenants under non-residential leases at the University Pointe Property directing them to remit rent and all other sums due under the applicable lease directly to the lender-controlled lockbox account. All funds deposited into the lockbox are required to be transferred on each business day to, or at the direction of, the borrowers, unless a Trigger Period exists and the lender elects, in its sole and absolute discretion, to deliver a restricted account notice to the institution maintaining the lockbox account, in which case all funds in the lockbox account are required to be swept on each business day to a lender-controlled cash management account to be applied and disbursed in accordance with the University Pointe Whole Loan documents. To the extent that a Trigger Period continues to exist, all excess cash flow funds remaining in the cash management account after the application of such funds in accordance with the University Pointe Whole Loan documents are required to be held by the lender in an excess cash flow reserve account as additional collateral for the University Pointe Whole Loan.
| THE INFORMATION IN THIS STRUCTURAL AND COLLATERAL TERM SHEET IS NOT COMPLETE AND MAY BE AMENDED PRIOR TO THE TIME OF SALE. THIS TERM SHEET IS NOT AN OFFER TO SELL THESE SECURITIES AND IT IS NOT A SOLICITATION OF AN OFFER TO BUY THESE SECURITIES IN ANY JURISDICTION WHERE THE OFFER OR SALE IS NOT PERMITTED. | ||
| 89 | ||
Multifamily – Student Housing 6350 Griffin Road Davie, FL 33314
| Collateral Asset Summary – Loan No. 7 University Pointe | Cut-off Date Balance: Cut-off Date LTV: U/W NCF DSCR: U/W NOI Debt Yield: | $50,000,000 54.5% 1.73x 11.9% |
“Trigger Period” means a period (A) commencing upon the earliest of (i) the occurrence and continuance of an event of default under the University Pointe Whole Loan documents, (ii) the debt service coverage ratio (“DSCR”) being less than 1.20x and (iii) the occurrence of a Specified Tenant Trigger Period (as defined below) (provided, however, that no Trigger Period will exist pursuant to this clause (iii) if, and so long as, the Trigger Period Avoidance Conditions (as defined below) are satisfied), and (B) expiring upon, with regard to (x) clause (i) above, the cure of such event of default under the University Pointe Whole Loan documents, (y) clause (ii) above, the date that the DSCR is equal to or greater than 1.25x for two consecutive calendar quarters and (z) clause (iii) above, a Specified Tenant Trigger Period ceasing to exist.
“Trigger Period Avoidance Conditions” means that the borrowers deposit into the excess cash flow account an amount equal to the next 18 months of full, unabated rent payments from the applicable Specified Tenant (as defined below) due pursuant to the Specified Tenant lease that triggered such Specified Tenant Trigger Period; provided that in connection with any such scheduled rent increases pursuant to the Specified Tenant lease, in order for the Trigger Period Avoidance Conditions to continue to be satisfied, the borrowers will be required to make a true up payment into the excess cash flow account such that the amount on deposit therein equals or exceeds an amount equal to the next 18 months of full, unabated rent payments from such Specified Tenant.
“Specified Tenant Trigger Period” means a period: (A) commencing upon the first to occur of (i) a Specified Tenant giving notice that it is terminating more than 10 residential units subject to the applicable Specified Tenant lease, (ii) any termination or cancellation of more than 10 residential units subject to the Specified Tenant lease (including, without limitation, rejection in any bankruptcy or similar insolvency proceeding) and/or more than 10 residential units subject to the Specified Tenant lease failing to otherwise be in full force and effect (any such occurrence in subsection (i) or (ii) above, a “Termination Trigger Event”), or (iii) any Specified Tenant failing to extend or renew the applicable Specified Tenant lease on or prior to the applicable Specified Tenant extension deadline in accordance with the applicable terms and conditions thereof for the applicable Specified Tenant Renewal Term (as defined below) (any such occurrence, a “Renewal Trigger Event”); and (B) expiring upon the lender’s receipt of evidence reasonably acceptable to the lender of the first to occur of (1) the satisfaction of the Specified Tenant Cure Conditions (as defined below) or (2) the borrowers leasing the entire Specified Tenant space, or applicable portion thereof, in accordance with the applicable terms and conditions of the University Pointe Whole Loan documents, with the applicable tenant(s) under such lease(s) being in actual, physical occupancy of the space demised under their lease(s), open to the public for business in such space and paying the full amount of rent due under such lease(s), or any free rent is deposited with the lender.
“Specified Tenant Cure Conditions” means each of the following, as applicable: (i) the Specified Tenant has cured all defaults under the applicable Specified Tenant lease; (ii) the applicable Specified Tenant is in actual, physical possession of the Specified Tenant space (or applicable portion thereof), open to the public for business during customary hours and not “dark” in the Specified Tenant space, or applicable portion thereof; (iii) the applicable Specified Tenant has revoked or rescinded all termination or cancellation notices with respect to the applicable Specified Tenant lease and has re-affirmed the applicable Specified Tenant lease as being in full force and effect; (iv) the date that the DSCR is equal to or greater than 1.30x for one calendar quarter; (v) in the event the Specified Tenant Trigger Period is due to a Renewal Trigger Event, the applicable Specified Tenant has renewed or extended the applicable Specified Tenant lease in accordance with the terms of the University Pointe Whole Loan documents and such lease for the applicable Specified Tenant Renewal Term; (vi) the applicable Specified Tenant is paying full, unabated rent under the applicable Specified Tenant lease, or any free rent is deposited with the lender; or (vii) in the event the Specified Tenant Trigger Period is due to a Termination Trigger Event, the number of residential units subject to the applicable Specified Tenant lease is equal to or greater than the minimum occupancy requirement.
“Specified Tenant” means, as applicable, (i) Carnival, a division of Carnival Corporation, a Panamanian corporation, together with any successor and/or assigns thereof in accordance with the terms of the University Pointe Whole Loan documents, (ii) NSU, together with any successor and/or assigns thereof in accordance with the terms of the University Pointe Whole Loan documents, (iii) any other lessees of the space leased to a Specified Tenant as of the origination date, or any portion thereof, (iv) any guarantor of any Specified Tenant lease and (v) any parent company of any such Specified Tenant, and any affiliate providing credit support for, or guarantor of, any such Specified Tenant lease.
“Specified Tenant Renewal Term” means (i) with respect to any Specified Tenant other than NSU and Carnival, a minimum of two years following the maturity date of the University Pointe Whole Loan, and (ii) with respect to NSU and Carnival, a renewal term that when added to the remaining term of the applicable Specified Tenant lease is greater than 18 months.
Current Mezzanine or Secured Subordinate Indebtedness. None.
Permitted Future Mezzanine or Secured Subordinate Indebtedness. Not permitted.
Release of Collateral. Not permitted.
Ground Lease. The University Pointe Property is subject to a ground lease between Nob Hill Partners, LLC, a co-borrower as landlord, and Broward Student Housing, LLC, a co-borrower as tenant.
| THE INFORMATION IN THIS STRUCTURAL AND COLLATERAL TERM SHEET IS NOT COMPLETE AND MAY BE AMENDED PRIOR TO THE TIME OF SALE. THIS TERM SHEET IS NOT AN OFFER TO SELL THESE SECURITIES AND IT IS NOT A SOLICITATION OF AN OFFER TO BUY THESE SECURITIES IN ANY JURISDICTION WHERE THE OFFER OR SALE IS NOT PERMITTED. | ||
| 90 | ||
0.3 Multifamily – Garden 1-5 Soldier Hill Road Paramus, NJ 07652
| Collateral Asset Summary – Loan No. 8 Soldier Hill Commons | Cut-off Date Balance: Cut-off Date LTV: U/W NCF DSCR: U/W NOI Debt Yield: | $46,500,000 62.7% 1.24x 8.6% |
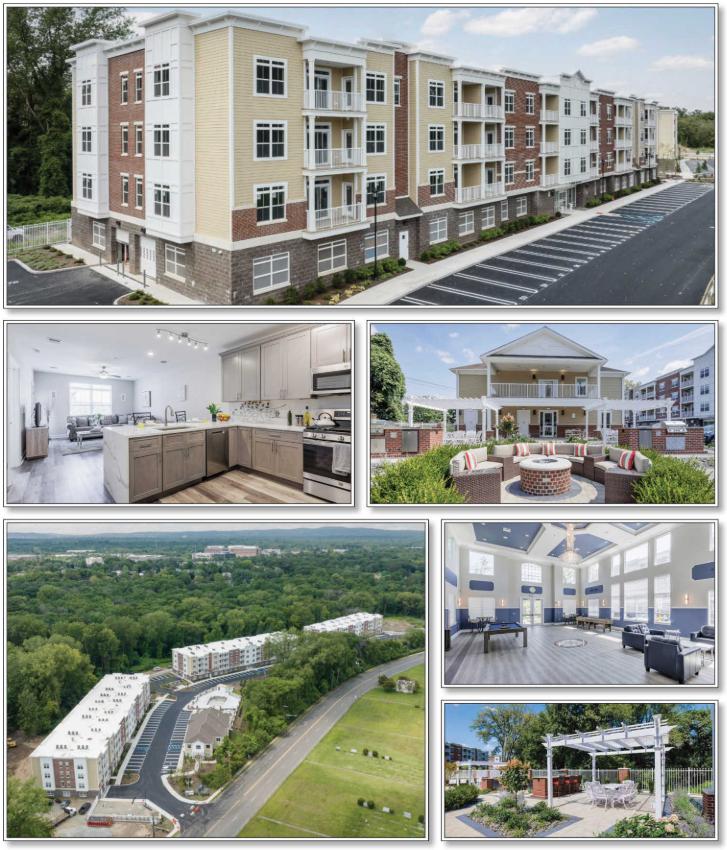
| THE INFORMATION IN THIS STRUCTURAL AND COLLATERAL TERM SHEET IS NOT COMPLETE AND MAY BE AMENDED PRIOR TO THE TIME OF SALE. THIS TERM SHEET IS NOT AN OFFER TO SELL THESE SECURITIES AND IT IS NOT A SOLICITATION OF AN OFFER TO BUY THESE SECURITIES IN ANY JURISDICTION WHERE THE OFFER OR SALE IS NOT PERMITTED. | ||
| 91 | ||
0.3 Multifamily – Garden 1-5 Soldier Hill Road Paramus, NJ 07652
| Collateral Asset Summary – Loan No. 8 Soldier Hill Commons | Cut-off Date Balance: Cut-off Date LTV: U/W NCF DSCR: U/W NOI Debt Yield: | $46,500,000 62.7% 1.24x 8.6% |
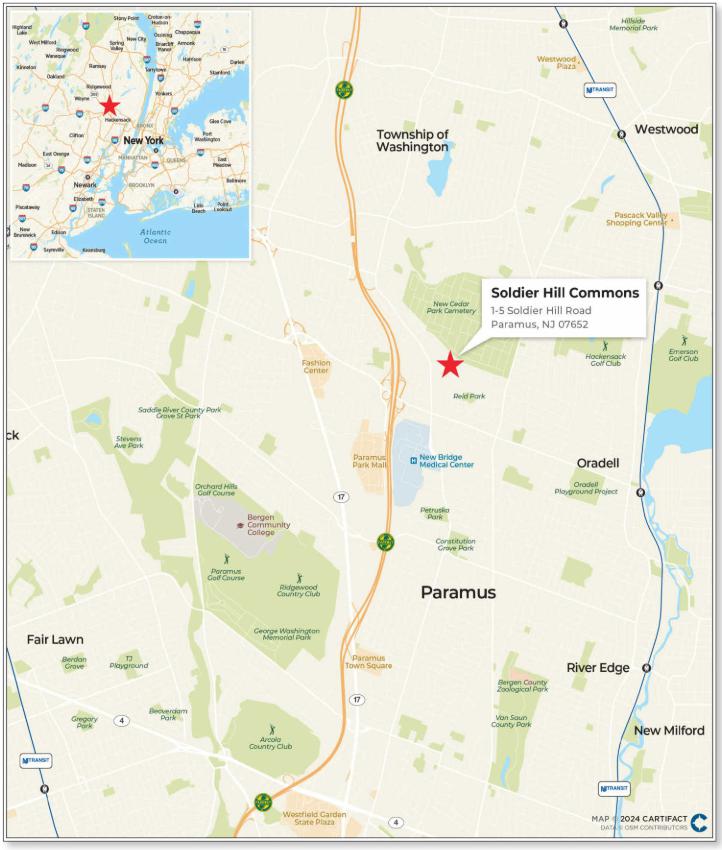
| THE INFORMATION IN THIS STRUCTURAL AND COLLATERAL TERM SHEET IS NOT COMPLETE AND MAY BE AMENDED PRIOR TO THE TIME OF SALE. THIS TERM SHEET IS NOT AN OFFER TO SELL THESE SECURITIES AND IT IS NOT A SOLICITATION OF AN OFFER TO BUY THESE SECURITIES IN ANY JURISDICTION WHERE THE OFFER OR SALE IS NOT PERMITTED. | ||
| 92 | ||
0.3 Multifamily – Garden 1-5 Soldier Hill Road Paramus, NJ 07652
| Collateral Asset Summary – Loan No. 8 Soldier Hill Commons | Cut-off Date Balance: Cut-off Date LTV: U/W NCF DSCR: U/W NOI Debt Yield: | $46,500,000 62.7% 1.24x 8.6% |
| Mortgage Loan Information | Property Information | |||
| Loan Seller: | CREFI | Single Asset / Portfolio: | Single Asset | |
| Loan Purpose: | Refinance | Property Type – Subtype: | Multifamily – Garden | |
| Borrower Sponsor(s): | Paula O’Neill | Collateral: | Fee | |
| Borrower(s): | Shamrock Creek Redevelopment Urban Renewal, LLC | Location: | Paramus, NJ | |
| Original Balance: | $46,500,000 | Year Built / Renovated: | 2023 / NAP | |
| Cut-off Date Balance: | $46,500,000 | Property Management: | The O'Neill Group, LLC | |
| % by Initial UPB: | 4.6% | Size: | 140 Units | |
| Interest Rate: | 6.78000% | Appraised Value / Per Unit: | $74,200,000 / $530,000 | |
| Note Date: | May 24, 2024 | Appraisal Date: | March 11, 2024 | |
| Original Term: | 60 months | Occupancy: | 96.4% (as of May 22, 2024) | |
| Amortization: | Interest Only | UW Economic Occupancy: | 95.2% | |
| Original Amortization: | NAP | Underwritten NOI(3): | $4,008,747 | |
| Interest Only Period: | 60 months | Underwritten NCF: | $3,966,247 | |
| First Payment Date: | July 6, 2024 | |||
| Maturity Date: | June 6, 2029 | Historical NOI(2) | ||
| Additional Debt Type: | NAP | Most Recent NOI(3)(4): | $3,279,994 (T-3 Ann. April 30, 2024) | |
| Additional Debt Balance: | NAP | 2023 NOI: | NAV | |
| Call Protection: | L(25),D(32),O(3) | 2022 NOI: | NAV | |
| Lockbox / Cash Management: | Springing / Springing | 2021 NOI: | NAV | |
| Reserves(1) | Financial Information | ||||||
| Initial | Monthly | Cap | Cut-off Date Loan / Unit: | $332,143 | |||
| Taxes: | $95,025 | $47,513 | NAP | Maturity Date Loan / Unit: | $332,143 | ||
| Insurance: | $108,318 | $12,035 | NAP | Cut-off Date LTV: | 62.7% | ||
| Replacement Reserves: | $0 | $3,542 | NAP | Maturity Date LTV: | 62.7% | ||
| TI / LC: | $0 | $0 | NAP | UW NOI DY: | 8.6% | ||
| UW NCF DSCR: | 1.24x | ||||||
| Sources and Uses | |||||||
| Sources | Proceeds | % of Total | Uses | Proceeds | % of Total | ||
| Mortgage Loan | $46,500,000 | 100.0% | Loan Payoff | $36,715,428 | 79.0 | % | |
| Sponsor Equity | 7,557,371 | 16.3 | |||||
| Closing Costs(5) | 2,023,858 | 4.4 | |||||
| Upfront Reserves | 203,343 | 0.4 | |||||
| Total Sources | $46,500,000 | 100.0% | Total Uses | $46,500,000 | 100.0 | % | |
| (1) | See “Initial and Ongoing Reserves” below. |
| (2) | Historical NOI information for the years stated above is not available because the Soldier Hill Commons Property (as defined below) was recently constructed in 2023. See “Cash Flow Analysis” table for information regarding net operating income for the trailing twelve months dated April 30, 2024. |
| (3) | The increase from Most Recent NOI to Underwritten NOI is primarily attributable to lease-up at the Soldier Hill Commons Property which was recently constructed in 2023. |
| (4) | Most Recent NOI reflects the trailing three months annualized as of April 30, 2024 as the Soldier Hill Commons Property was recently constructed in 2023. |
| (5) | Closing Costs include a rate buydown fee of $1,395,000. |
The Loan. The eighth largest mortgage loan (the “Soldier Hill Commons Mortgage Loan”) is secured by the borrower’s fee interest in a Class A, 140 unit, three building apartment complex located in Paramus, New Jersey (the “Soldier Hill Commons Property”). The Soldier Hill Commons Mortgage Loan is evidenced by a single promissory note with an outstanding principal balance as of the Cut-off Date of $46,500,000. The Soldier Hill Commons Mortgage Loan was originated on May 24, 2024 by CREFI and accrues interest at a fixed rate of 6.78000% per annum. The Soldier Hill Commons Mortgage Loan has an initial term of five-years and is interest-only for the full term. The scheduled maturity date of the Soldier Hill Commons Mortgage Loan is June 6, 2029.
| THE INFORMATION IN THIS STRUCTURAL AND COLLATERAL TERM SHEET IS NOT COMPLETE AND MAY BE AMENDED PRIOR TO THE TIME OF SALE. THIS TERM SHEET IS NOT AN OFFER TO SELL THESE SECURITIES AND IT IS NOT A SOLICITATION OF AN OFFER TO BUY THESE SECURITIES IN ANY JURISDICTION WHERE THE OFFER OR SALE IS NOT PERMITTED. | ||
| 93 | ||
0.3 Multifamily – Garden 1-5 Soldier Hill Road Paramus, NJ 07652
| Collateral Asset Summary – Loan No. 8 Soldier Hill Commons | Cut-off Date Balance: Cut-off Date LTV: U/W NCF DSCR: U/W NOI Debt Yield: | $46,500,000 62.7% 1.24x 8.6% |
The Property. The Soldier Hill Commons Property is a recently constructed, 140-unit, Class A, apartment complex located at 1-5 Soldier Hill Road in Paramus, New Jersey. The Soldier Hill Commons Property was completed in 2023 and is comprised of three buildings consisting of three residential floors located above a ground level parking garage. Amenities at the Soldier Hill Commons Property include an amenity clubhouse with a resident lounge, game room, spa/sauna, co-working lounge, theatre room, golf simulator and dog run. Each building also contains its own fitness center. The Soldier Hill Commons Property also features 129 surface and 150 garage parking spaces, resulting in a parking ratio of 1.99 spaces per unit.
The unit mix at the Soldier Hill Commons Property consists of 48 market rate one-bedroom units, two rent restricted one-bedroom units, 78 market rate two-bedroom units, nine rent restricted two-bedroom units, and three rent restricted three-bedroom units. In addition, 14 of the 140 units at the Soldier Hill Commons Property are designated Mount Laurel affordable units utilizing the Council on Affordable Housing program. Mount Laurel units must be affordable to moderate income households with earnings at or below 80% of median county income or to low-income families with earnings below 50% of median household income. Unit amenities at the Soldier Hill Commons Property include stainless steel kitchen appliances, quartz countertops, in-unit laundry, and balconies. As of May 22, 2024, the Soldier Hill Commons Property was 96.4% occupied.
The following table presents certain information relating to the unit mix at the Soldier Hill Commons Property:
| Unit Mix(1) | ||||||
| Unit Type | # of Units | % of Total Units | Occupancy | Average Unit Size (SF) | Average Monthly Rent Per Unit | Average Monthly Market Rent Per Unit(2) |
| 1 BR/1BA - Affordable Unit | 2 | 1.4 | 100.0% | 771 | $840 | $840 |
| 1 BR/1BA | 48 | 34.3 | 100.0% | 778 | $2,689 | $2,725 |
| 2BR/2BA - Affordable Unit | 9 | 6.4 | 100.0% | 1,015 | $1,183 | $1,183 |
| 2BR/2BA | 78 | 55.7 | 93.6% | 1,202 | $3,674 | $3,730 |
| 3BR/2BA - Affordable Unit | 3 | 2.1 | 100.0% | 1,144 | $1,385 | $1,385 |
| Total / Wtd Avg. | 140 | 100.0% | 96.4% | 1,037 | $3,065 | $3,130 |
| (1) | Based on the underwritten rent roll dated May 22, 2024. Average Monthly Rent Per Unit is based on occupied units. |
| (2) | Source: Appraisal. |
| THE INFORMATION IN THIS STRUCTURAL AND COLLATERAL TERM SHEET IS NOT COMPLETE AND MAY BE AMENDED PRIOR TO THE TIME OF SALE. THIS TERM SHEET IS NOT AN OFFER TO SELL THESE SECURITIES AND IT IS NOT A SOLICITATION OF AN OFFER TO BUY THESE SECURITIES IN ANY JURISDICTION WHERE THE OFFER OR SALE IS NOT PERMITTED. | ||
| 94 | ||
0.3 Multifamily – Garden 1-5 Soldier Hill Road Paramus, NJ 07652
| Collateral Asset Summary – Loan No. 8 Soldier Hill Commons | Cut-off Date Balance: Cut-off Date LTV: U/W NCF DSCR: U/W NOI Debt Yield: | $46,500,000 62.7% 1.24x 8.6% |
The following table presents certain information relating to the Underwritten Net Cash Flow at the Soldier Hill Commons Property:
| Cash Flow Analysis(1) | |||||
| TTM 4/30/2024 | T-6 Ann. 4/30/2024 | T-3 Ann. 4/30/2024(2) | U/W(2) | U/W Per Unit | |
| Base Rent | $2,252,380 | $4,183,181 | $5,272,042 | $4,964,712 | $35,462 |
| Potential Income from Vacant Units | 0 | 0 | 0 | 223,800 | $1,599 |
| Gross Potential Rent | $2,252,380 | $4,183,181 | $5,272,042 | $5,188,512 | $37,061 |
| Parking Income | 64,846 | 117,646 | 144,027 | 232,800 | $1,663 |
| Potential Income from Vacant Parking | 0 | 0 | 0 | 108,000 | $771 |
| Other Income(3) | 85,366 | 115,305 | 123,331 | 217,762 | $1,555 |
| Net Rental Income | $2,402,592 | $4,416,132 | $5,539,401 | $5,747,074 | $41,051 |
| Vacancy Residential | (645,598) | (1,291,197) | (1,791,906) | (249,343) | ($1,781) |
| Vacancy Parking | 0 | 0 | 0 | (108,000) | (771) |
| Effective Gross Income | $1,756,994 | $3,124,935 | $3,747,495 | $5,389,731 | $38,498 |
| Real Estate Taxes(4) | 5,084 | 5,084 | 5,084 | 549,753 | $3,927 |
| Insurance | 111,324 | 111,324 | 111,324 | 137,547 | $982 |
| Management Fee | 13,762 | 13,762 | 13,762 | 161,692 | $1,155 |
| Other Expenses(5) | 337,330 | 337,330 | 337,330 | 531,992 | $3,800 |
| Total Expenses | 467,501 | 467,501 | 467,501 | 1,380,983 | $9,864 |
| Net Operating Income | $1,289,493 | $2,657,434 | $3,279,994 | $4,008,747 | $28,634 |
| Replacement Reserves | 0 | 0 | 0 | 42,500 | $304 |
| Net Cash Flow | $1,289,493 | $2,657,434 | $3,279,994 | $3,966,247 | $28,330 |
| Occupancy | NAP | NAP | NAP | 95.2%(6) | |
| NCF DSCR | 0.40x | 0.83x | 1.03x | 1.24x | |
| NOI Debt Yield | 2.8% | 5.7% | 7.1% | 8.6% | |
| (1) | Historical financial information prior to the TTM 4/30/2024 is not available because the Soldier Hill Commons Property was recently constructed in 2023. |
| (2) | The increase from T-3 Ann. 4/30/2024 Net Operating Income to U/W Net Operating Income is primarily attributable to lease-up at the Soldier Hill Commons Property which was recently constructed in 2023. |
| (3) | Other Income includes amenity fees, application fees, pet fees, storage fees and other miscellaneous income. |
| (4) | The Soldier Hill Commons Property is subject to a 30-year PILOT program. Real Estate Taxes are underwritten based on years one through six of the PILOT schedule. See “Payment in Lieu of Taxes” below. |
| (5) | Other Expenses include payroll and benefits, repairs and maintenance, utilities, advertising and marketing, and general and administrative expenses. |
| (6) | Represents economic occupancy. |
Appraisal. According to the appraisal, the Soldier Hill Commons Property had an “as-is” appraised value of $74,200,000 as of March 11, 2024. Based on the “as-is” value of $74,200,000, the Cut-off Date LTV and Maturity Date LTV for the Soldier Hill Commons Mortgage Loan are 62.7%.
| Soldier Hill Commons Appraised Value(1) | ||
| Property | Value | Capitalization Rate |
| Soldier Hill Commons | $74,200,000 | 5.25% |
| (1) | Source: Appraisal. |
Environmental Matters. The Phase I environmental assessment dated April 15, 2024, identified as a recognized environmental condition for the Soldier Hill Commons Property metals impacts above applicable standards to site soils as a result of placement of fill material onsite during the 1950s and 1960s, including impacts to the soils at the Soldier Hill Commons Property by polycyclic aromatic hydrocarbons above applicable standards. The Phase I ESA consultant recommended completing any remaining response actions in accordance with a remedial action workplan prepared for the Soldier Hill Commons Property until such time that regulatory closure for the Soldier Hill Commons Property is achieved. See “Description of the Mortgage Pool—Environmental Considerations” in the Preliminary Prospectus.
The Market. The Soldier Hill Commons Property is located at 1-5 Soldier Hill Road in Paramus, New Jersey. Primary access to the Soldier Hill Commons Property is provided by Route 17 and the Garden State Parkway. Public transportation is provided via New Jersey Transit with the nearby access to Oradell Station located approximately 2.0 miles from the Solider Hill Commons Property and NJ Transit bus service providing transportation to New York City. The Soldier Hill Commons Property is located within the Northern New Jersey multifamily market which according to the appraisal, as of December 31, 2023, had total inventory of 498,150 units, a vacancy rate of 4.3%, asking rent of $2,304 per unit and positive absorption of 13,094 units over the prior calendar year.
According to the appraisal, the Soldier Hill Commons Property is located in the Bergen County multifamily submarket of the Northern New Jersey multifamily market. As of December 31, 2023, the Bergen County multifamily submarket had total inventory of 54,116 units, a vacancy rate of 2.9%, asking rent of $2,419 per unit and positive net absorption of 1,444 units over the prior calendar year.
| THE INFORMATION IN THIS STRUCTURAL AND COLLATERAL TERM SHEET IS NOT COMPLETE AND MAY BE AMENDED PRIOR TO THE TIME OF SALE. THIS TERM SHEET IS NOT AN OFFER TO SELL THESE SECURITIES AND IT IS NOT A SOLICITATION OF AN OFFER TO BUY THESE SECURITIES IN ANY JURISDICTION WHERE THE OFFER OR SALE IS NOT PERMITTED. | ||
| 95 | ||
0.3 Multifamily – Garden 1-5 Soldier Hill Road Paramus, NJ 07652
| Collateral Asset Summary – Loan No. 8 Soldier Hill Commons | Cut-off Date Balance: Cut-off Date LTV: U/W NCF DSCR: U/W NOI Debt Yield: | $46,500,000 62.7% 1.24x 8.6% |
According to the appraisal, the 2023 population within a one-, three- and five-mile radius of the Soldier Hill Commons Property was 7,802, 96,391 and 331,782, respectively. The 2023 average household income within the same radii was $230,147, $204,104 and $187,955, respectively. The following table presents certain information relating to comparable multifamily properties to the Soldier Hill Commons Property:
| Multifamily Rent Comparables(1) | |||||||
| Property Name / Address | Distance from Subject | Year Built / Renovated | Occupancy | Number of Units | Unit Type | Average Unit Size | Average Rent Per Unit |
Soldier Hill Commons 1-5 Solider Hill Road, Paramus, NJ | – | 2023 / NAP | 96.4%(2) | 140 | 1BR / 1BA | 778 SF(2) | $2,689(2) |
| 2BR / 2BA | 1,202 SF(2) | $3,674(2) | |||||
The Benjamin 1 Franklin Avenue, Ridgewood, NJ | 4.1 miles | 2021 / NAP | 100.0% | 60 | 1BR / 1BA | 879 SF | $3,447 |
| 2BR / 2BA | 1,297 SF | $4,700 | |||||
Dumont Washington Promenade 546 Washington Street, Dumont, NJ | 5.0 miles | 2019 / NAP | 100.0% | 146 | 1BR / 1BA | 827 SF | $2,955 |
| 2BR / 2BA | 1,257 SF | $3,695 | |||||
The Jefferson 2 Kinderkamack Road, Hackensack, NJ | 5.0 miles | 2022 / NAP | 98.0% | 377 | 1BR / 1BA | 811 SF | $2,915 |
| 2BR / 2BA | 1,146 SF | $3,490 | |||||
Waldwick Station 41 W. Prospect Street, Waldwick, NJ | 6.1 miles | 2017 / NAP | 97.0% | 111 | 1BR / 1BA | 920 SF | $2,672 |
| 2BR / 2BA | 1,183 SF | $3,498 | |||||
Fair Lawn Promenade 5 Promenade Blvd, Fair Lawn, NJ | 7.5 miles | 2013 / NAP | 100.0% | 150 | 1BR / 1BA | 913 SF | $3,295 |
| 2BR / 2BA | 1,390 SF | $3,945 | |||||
| (1) | Source: Appraisal. |
| (2) | Based on the underwritten rent roll dated May 22, 2024. Average Unit Size and Average Rent Per Unit reflects the average fair market value for occupied units. |
The Borrower and the Borrower Sponsor. The borrower is Shamrock Creek Redevelopment Urban Renewal, LLC, a New Jersey limited liability company and single purpose entity having at least one independent director in its organizational structure. Legal counsel to the borrower delivered a non-consolidation opinion in connection with the origination of the Soldier Hill Commons Mortgage Loan. The borrower sponsor and non-recourse carveout guarantor is Paula O’Neill of OneKey, LLC. OneKey, LLC is headquartered in Hackensack, New Jersey and is a primarily multifamily focused firm with projects and assets under management located throughout the tri-state area. Paula is the CEO of OneKey, LLC and has over twenty years of involvement in the construction and real estate industries. See “Description of the Mortgage Pool—Litigation and Other Considerations” in the Preliminary Prospectus.
Property Management. The Soldier Hill Commons Property is managed by The O’Neill Group, LLC, a borrower affiliated management company.
Initial and Ongoing Reserves. At origination of the Soldier Hill Commons Mortgage Loan, the borrower deposited approximately (i) $95,025 into a reserve account for real estate taxes and (ii) $108,318 into a reserve account for insurance premiums.
Tax Reserve – The borrower is required to deposit into a real estate tax reserve, on a monthly basis, 1/12th of the taxes that the lender reasonably estimates will be payable over the next-ensuing 12-month period, assuming that said taxes are to be paid in full on the date occurring 30 days prior to the date such taxes are due and payable (initially estimated to be approximately $47,513).
Insurance Reserve – The borrower is required to deposit into an insurance reserve, on a monthly basis, 1/12th of the amount which will be sufficient to pay the insurance premiums due for the renewal of coverage afforded by such policies (initially estimated to be approximately $12,035).
Replacement Reserve – The borrower is required to deposit into a replacement reserve, on a monthly basis, approximately $3,542.
Lockbox / Cash Management. The Soldier Hill Commons Mortgage Loan is structured with a springing lockbox and springing cash management. Upon the first occurrence of a Trigger Period (as defined below), the borrower is required to establish a lender-controlled lockbox account, and is thereafter required to deposit, or cause the property manager to deposit, immediately upon receipt, all revenue received by the borrower or the property manager into such lockbox. Within five days after the first occurrence of a Trigger Period, the borrower is required to deliver a notice to all credit card companies directing them to remit all payments into the lender-controlled lockbox account. All funds deposited into the lockbox are required to be transferred on each business day to or at the direction of the borrower unless a Trigger Period exists and the lender elects (in its sole and absolute discretion) to deliver a restricted account notice, in which case all funds in the lockbox account are required to be swept on each business day to a lender-controlled cash management account to
| THE INFORMATION IN THIS STRUCTURAL AND COLLATERAL TERM SHEET IS NOT COMPLETE AND MAY BE AMENDED PRIOR TO THE TIME OF SALE. THIS TERM SHEET IS NOT AN OFFER TO SELL THESE SECURITIES AND IT IS NOT A SOLICITATION OF AN OFFER TO BUY THESE SECURITIES IN ANY JURISDICTION WHERE THE OFFER OR SALE IS NOT PERMITTED. | ||
| 96 | ||
0.3 Multifamily – Garden 1-5 Soldier Hill Road Paramus, NJ 07652
| Collateral Asset Summary – Loan No. 8 Soldier Hill Commons | Cut-off Date Balance: Cut-off Date LTV: U/W NCF DSCR: U/W NOI Debt Yield: | $46,500,000 62.7% 1.24x 8.6% |
be applied and disbursed in accordance with the Soldier Hill Commons Mortgage Loan documents, and all excess cash flow funds remaining in the cash management account after the application of such funds in accordance with the Soldier Hill Commons Mortgage Loan documents are required to be held by the lender in an excess cash flow reserve account as additional collateral for the Soldier Hill Commons Mortgage Loan. Upon the cure of the applicable Trigger Period, so long as no other Trigger Period exists, the lender is required to return any amounts remaining on deposit in the excess cash flow reserve account to the borrower. Upon an event of default under the Soldier Hill Commons Mortgage Loan documents, the lender will apply funds to the debt in such priority as it may determine.
“Trigger Period” means a period (A) commencing upon the earliest of (i) the occurrence and continuance of an event of default under the Soldier Hill Commons Mortgage Loan documents, and (ii) the debt service coverage ratio being less than 1.10x; and (B) expiring upon (x) with regard to clause (i) above, the cure (if applicable) of such event of default under the Soldier Hill Commons Mortgage Loan documents, and (y) with regard to clause (ii) above, the date that the debt service coverage ratio is equal to or greater than 1.10x for two consecutive calendar quarters.
Current Mezzanine or Secured Subordinate Indebtedness. None.
Permitted Future Mezzanine or Secured Subordinate Indebtedness. Not permitted.
Release of Collateral. Not permitted.
Ground Lease. None.
Payment in Lieu of Taxes. The Soldier Hill Commons Property is operating under a 30-year payment in lieu of taxes (“PILOT”) Program through the City of Paramus (the “City”) that commenced in December 2023 under which the borrower does not pay real estate taxes and instead makes payments to the City. The annual charge will be 10% of annual gross revenue from years 1 through 6 of the program, 11% of annual gross revenue from years 7 through 11 of the program, 12% of annual gross revenue from years 12 through 16 of the program, and 13% of the annual gross revenue from years 17 through 30 of the program. In addition to the annual charge, a 2% administrative fee based on the annual charge is payable to the City. The City has agreed that, in the event the lender or its nominee succeeds to the Soldier Hill Commons Property (whether through foreclosure, power of sale, deed in lieu of foreclosure or otherwise), so long as lender or its nominee qualifies as an “Urban Renewal Entity” under the New Jersey Long Term Tax Exemption Law of 1992, as amended, such successor entity will be recognized as the successor-in-interest to the borrower’s rights under the PILOT agreement.
| THE INFORMATION IN THIS STRUCTURAL AND COLLATERAL TERM SHEET IS NOT COMPLETE AND MAY BE AMENDED PRIOR TO THE TIME OF SALE. THIS TERM SHEET IS NOT AN OFFER TO SELL THESE SECURITIES AND IT IS NOT A SOLICITATION OF AN OFFER TO BUY THESE SECURITIES IN ANY JURISDICTION WHERE THE OFFER OR SALE IS NOT PERMITTED. | ||
| 97 | ||
Office – CBD 420 Broadway Street, 305-309 North San Antonio, TX 78205
| Collateral Asset Summary – Loan No. 9 The Light Building | Cut-off Date Balance: Cut-off Date LTV: U/W NCF DSCR: U/W NOI Debt Yield: | $43,500,000 56.1% 1.83x 13.6% |
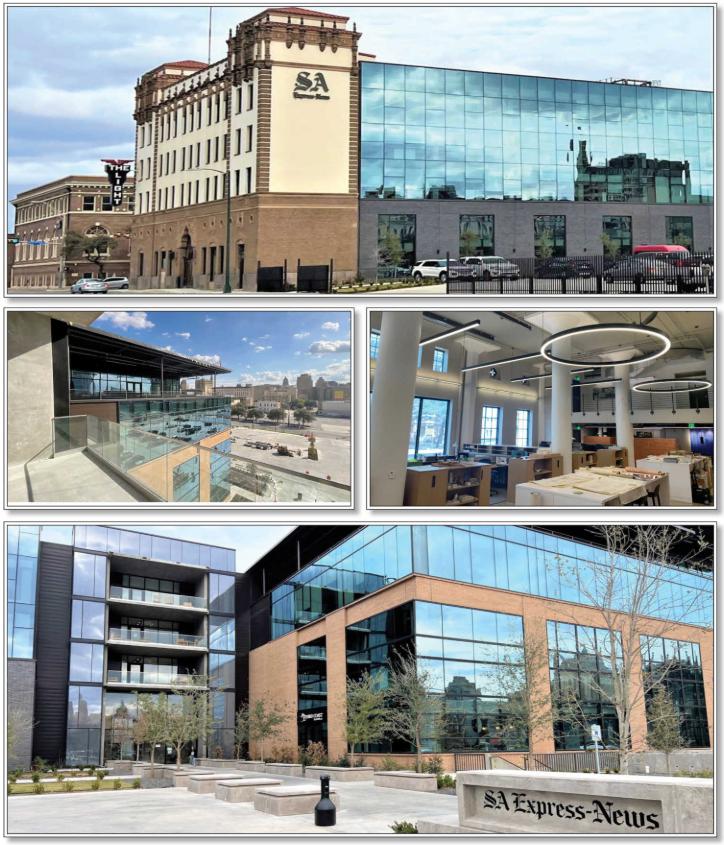
| THE INFORMATION IN THIS STRUCTURAL AND COLLATERAL TERM SHEET IS NOT COMPLETE AND MAY BE AMENDED PRIOR TO THE TIME OF SALE. THIS TERM SHEET IS NOT AN OFFER TO SELL THESE SECURITIES AND IT IS NOT A SOLICITATION OF AN OFFER TO BUY THESE SECURITIES IN ANY JURISDICTION WHERE THE OFFER OR SALE IS NOT PERMITTED. | ||
| 98 | ||
Office – CBD 420 Broadway Street, 305-309 North San Antonio, TX 78205
| Collateral Asset Summary – Loan No. 9 The Light Building | Cut-off Date Balance: Cut-off Date LTV: U/W NCF DSCR: U/W NOI Debt Yield: | $43,500,000 56.1% 1.83x 13.6% |

| THE INFORMATION IN THIS STRUCTURAL AND COLLATERAL TERM SHEET IS NOT COMPLETE AND MAY BE AMENDED PRIOR TO THE TIME OF SALE. THIS TERM SHEET IS NOT AN OFFER TO SELL THESE SECURITIES AND IT IS NOT A SOLICITATION OF AN OFFER TO BUY THESE SECURITIES IN ANY JURISDICTION WHERE THE OFFER OR SALE IS NOT PERMITTED. | ||
| 99 | ||
Office – CBD 420 Broadway Street, 305-309 North San Antonio, TX 78205
| Collateral Asset Summary – Loan No. 9 The Light Building | Cut-off Date Balance: Cut-off Date LTV: U/W NCF DSCR: U/W NOI Debt Yield: | $43,500,000 56.1% 1.83x 13.6% |
| Mortgage Loan Information | Property Information | |||
| Loan Seller: | CREFI | Single Asset / Portfolio: | Single Asset | |
| Loan Purpose: | Refinance | Property Type – Subtype: | Office - CBD | |
| Borrower Sponsor(s): | GrayStreet Light, LP | Collateral: | Fee | |
| Borrower(s): | GS Light, LLC | Location: | San Antonio, TX | |
| Original Balance: | $43,500,000 | Year Built / Renovated: | 1931 / 2022 | |
| Cut-off Date Balance: | $43,500,000 | Property Management: | GrayStreet Management Services, LLC | |
| % by Initial UPB: | 4.3% | Size: | 147,549 SF | |
| Interest Rate: | 6.86000% | Appraised Value / Per SF: | $77,500,000 / $525 | |
| Note Date: | May 24, 2024 | Appraisal Date: | April 25, 2024 | |
| Original Term: | 60 months | Occupancy: | 100.0% (as of June 1, 2024) | |
| Amortization: | Interest Only | UW Economic Occupancy: | 95.0% | |
| Original Amortization: | NAP | Underwritten NOI(3): | $5,909,451 | |
| Interest Only Period: | 60 months | Underwritten NCF: | $5,526,782 | |
| First Payment Date: | July 6, 2024 | |||
| Maturity Date: | June 6, 2029 | Historical NOI | ||
| Additional Debt Type: | NAP | Most Recent NOI(3): | $4,695,664 (TTM March 31, 2024) | |
| Additional Debt Balance: | NAP | 2023 NOI: | $4,032,256 | |
| Call Protection: | L(25),D(30),O(5) | 2022 NOI(4): | NAV | |
| Lockbox / Cash Management: | Springing / Springing | 2021 NOI(4): | NAV | |
| Reserves(1) | Financial Information | |||||
| Initial | Monthly | Cap | Cut-off Date Loan / SF: | $295 | ||
| Taxes: | $66,789 | $66,789 | NAP | Maturity Date Loan / SF: | $295 | |
| Insurance: | $0 | Springing | NAP | Cut-off Date LTV: | 56.1% | |
| Replacement Reserves: | $0 | $86 | $4,550 | Maturity Date LTV: | 56.1% | |
| TI / LC: | $0 | Springing | NAP | UW NOI DY: | 13.6% | |
| Deferred Maintenance: | $2,438 | $0 | NAP | UW NCF DSCR: | 1.83x | |
| Environmental: | $45,000 | $0 | NAP | |||
| Other(2): | $901,210 | $0 | NAP | |||
| Sources and Uses | ||||||||
| Sources | Proceeds | % of Total | Uses | Proceeds | % of Total | |||
| Mortgage Loan | $43,500,000 | 99.7 | % | Loan Payoff | $40,448,447 | 92.7 | % | |
| Borrower Sponsor Equity | 121,758 | 0.3 | Closing Costs | 2,157,874 | 4.9 | |||
| Upfront Reserves | 1,015,437 | 2.3 | ||||||
| Total Sources | $43,621,758 | 100.0 | % | Total Uses | $43,621,758 | 100.0 | % | |
| (1) | See “Initial and Ongoing Reserves” below. |
| (2) | Other Reserves consist of an initial unfunded obligations reserve of $901,210. |
| (3) | The increase from Most Recent NOI to Underwritten NOI is primarily attributed to free rent burning off in relation to three leases executed from March 2023 through July 2023. |
| (4) | Historical NOI information prior to 2023 is not available because The Light Building Property (as defined below) was recently renovated in 2022. |
| THE INFORMATION IN THIS STRUCTURAL AND COLLATERAL TERM SHEET IS NOT COMPLETE AND MAY BE AMENDED PRIOR TO THE TIME OF SALE. THIS TERM SHEET IS NOT AN OFFER TO SELL THESE SECURITIES AND IT IS NOT A SOLICITATION OF AN OFFER TO BUY THESE SECURITIES IN ANY JURISDICTION WHERE THE OFFER OR SALE IS NOT PERMITTED. | ||
| 100 | ||
Office – CBD 420 Broadway Street, 305-309 North San Antonio, TX 78205
| Collateral Asset Summary – Loan No. 9 The Light Building | Cut-off Date Balance: Cut-off Date LTV: U/W NCF DSCR: U/W NOI Debt Yield: | $43,500,000 56.1% 1.83x 13.6% |
The Loan. The ninth largest mortgage loan (the “The Light Building Mortgage Loan”) is secured by the borrower’s fee interest in an office property totaling 147,549 square feet located in San Antonio, Texas (the “The Light Building Property”). The Light Building Mortgage Loan was originated on May 24, 2024 by Citi Real Estate Funding Inc. and accrues interest at a fixed rate of 6.86000% per annum. The Light Building Mortgage Loan has an initial term of five years and is interest-only for the entire term. The scheduled maturity date of The Light Building Mortgage Loan is the payment date that occurs on June 6, 2029.
The Property. The Light Building Property is a four-story, Class A office property totaling 147,549 square feet and is comprised of two interconnected buildings in San Antonio, Texas. The Light Building Property was originally constructed in 1931, subsequently gut renovated from two vacant industrial buildings into an interconnected office building in 2022 and is situated on an approximately 3.83-acre site. Amenities at The Light Building Property include a fitness center, sensitive compartmented information facility (“SCIF”) space, and underground parking. The Light Building Property has access to 446 surface and underground parking spaces resulting in a parking ratio of approximately 3.02 spaces per 1,000 square feet. SCIF space is a highly specialized secure room designed to guard against electronic surveillance and suppresses data leakage of sensitive military and security information. The SCIF space at The Light Building Property is leased to SCIF-GSS, an affiliate of the borrower, which licenses space to several US Air Force affiliated contractors for cybersecurity uses.
As of June 1, 2024, The Light Building Property was 100.0% occupied by seven tenants. The tenants at The Light Building Property have a weighted average lease term remaining of 8.1 years. The tenancy also includes three tenants that are affiliated with the United States Air Force: 90th Shadows Edge – Chenega (“Shadow’s Edge”), Namauu Corp dba LevelUp (“LevelUP”), and Namauu Corp dba Wavelength (“Wavelength”). These tenants account for 42.6% of net rentable area and 64.4% of underwritten base rent.
Major Tenants. The three largest tenants based on underwritten base rent are Shadows Edge, LevelUP and Wavelength.
Shadow’s Edge (28,263 square feet; 19.2% of net rentable area; 26.4% of underwritten base rent) Shadow’s Edge houses the 90th Cyberspace Operations Squadron and is a cyberspace capabilities development organization in the United States Air Force. Shadow’s Edge delivers software to enable offensive and defensive cyberspace operations for the combatant commands and military services. Shadow’s Edge has been at The Light Building Property since August 2022 with a current lease term through February 2027 with three, one-year renewal options. Shadows Edge has the ongoing right to terminate its lease effective as of February 28, 2025 or February 28, 2026 upon one month’s prior written notice to the borrower.
LevelUP (18,830 square feet; 12.8% of net rentable area; 19.6% of underwritten base rent) LevelUP is an affiliate of the United States Air Force with an active mission to deliver rapidly deployable software capabilities to support a full range of Air Force and Department of Defense missions. LevelUP has been at The Light Building Property since May 2023 and has a current lease term through May 2028 with no renewal options. LevelUP has the right to terminate its lease upon the first, second and third anniversary of such tenant’s lease commencement date upon 30 days’ prior written notice to the borrower and payment of a termination fee. LevelUP’s lease commenced on May 22, 2023.
Wavelength (15,753 square feet; 10.7% of net rentable area; 18.5% of underwritten base rent) Wavelength delivers electronic warfare-mission-focused software to enable the 350th Spectrum Warfare Wing of the United States Airforce to excel in a digitally focused future state. Wavelength has been at The Light Building Property since March 2023 with a current lease term through March 2028 with no renewal options. Wavelength has the right to terminate its lease upon the first, second, third and fourth anniversary of such tenant’s lease commencement date upon 30 days’ prior written notice to the borrower and payment of a termination fee. Wavelength’s lease commenced on March 6, 2023.
| THE INFORMATION IN THIS STRUCTURAL AND COLLATERAL TERM SHEET IS NOT COMPLETE AND MAY BE AMENDED PRIOR TO THE TIME OF SALE. THIS TERM SHEET IS NOT AN OFFER TO SELL THESE SECURITIES AND IT IS NOT A SOLICITATION OF AN OFFER TO BUY THESE SECURITIES IN ANY JURISDICTION WHERE THE OFFER OR SALE IS NOT PERMITTED. | ||
| 101 | ||
Office – CBD 420 Broadway Street, 305-309 North San Antonio, TX 78205
| Collateral Asset Summary – Loan No. 9 The Light Building | Cut-off Date Balance: Cut-off Date LTV: U/W NCF DSCR: U/W NOI Debt Yield: | $43,500,000 56.1% 1.83x 13.6% |
The following table presents certain information relating to the largest tenants at The Light Building Property:
| Tenant Summary(1) | |||||||||||
Tenant | Credit Rating (Moody’s/ S&P/Fitch) | Net Rentable Area (SF) | % of Net Rentable Area | U/W Base Rent | U/W Base Rent Per SF | % of Total U/W Base Rent | Lease Expiration | Termination Option (Y/N) | Renewal Options | ||
| Shadows Edge | NR/NR/NR | 28,263 | 19.2 | % | $1,666,386 | $58.96 | 26.4 | % | 2/28/2027 | Y(2) | 3 x 1 Yr |
| LevelUP | NR/NR/NR | 18,830 | 12.8 | 1,234,871 | $65.58 | 19.6 | 5/31/2028 | Y(3) | None | ||
| Wavelength | NR/NR/NR | 15,753 | 10.7 | 1,166,037 | $74.02 | 18.5 | 3/6/2028 | Y(4) | None | ||
| SCIF – GSS(5) | NR/NR/NR | 19,962 | 13.5 | 671,920 | $33.66 | 10.6 | 8/31/2043 | N | 2 x 10 Yr | ||
| Third Coast Bank | NR/NR/NR | 21,386 | 14.5 | 628,284 | $29.38 | 10.0 | 5/31/2034 | N | None | ||
| Hearst Corporation | NR/NR/NR | 22,794 | 15.4 | 592,872 | $26.01 | 9.4 | 10/31/2032 | Y(6) | 2 x 3 Yr | ||
| Ford, Powell, and Carson(7) | NR/NR/NR | 20,561 | 13.9 | 350,538 | $17.05 | 5.6 | Various | N | 2 x 5 Yr | ||
| Total Occupied | 147,549 | 100.0 | % | $6,310,909 | $42.77 | 100.0 | % | ||||
| Vacant | 0 | 0.0 | |||||||||
| Total | 147,549 | 100.0 | % | ||||||||
| (1) | Based on the underwritten rent roll dated June 1, 2024, inclusive of $91,852 of contractual rent steps underwritten through October 1, 2024. |
| (2) | Shadows Edge has the ongoing right to terminate its lease effective as of February 28, 2025 or February 28, 2026 upon one month’s prior written notice to the borrower. |
| (3) | LevelUP has the right to terminate its lease upon the first, second and third anniversary of such tenant’s lease commencement date upon 30 days’ prior written notice to the borrower and payment of a termination fee. LevelUP’s lease commenced on May 22, 2023. |
| (4) | Wavelength has the right to terminate its lease upon the first, second, third and fourth anniversary of such tenant’s lease commencement date upon 30 days’ prior written notice to the borrower and payment of a termination fee. Wavelength’s lease commenced on March 6, 2023. |
| (5) | SCIF – GSS is an affiliate of the borrower sponsor. |
| (6) | Hearst Corporation may terminate its lease effective on May 31, 2028, with 60 days' prior notice. Heart Corporation also has a continuing right to surrender possession of 7,250 SF of space on the third floor from and after January 1, 2025 with 180 days’ prior written notice. |
| (7) | Ford, Powell, and Carson leases 13,700 SF of space that expires in September 2031 and 6,861 SF that expires in January 2040. |
The following table presents certain information relating to the lease rollover schedule at The Light Building Property, based on initial lease expiration date:
| Lease Rollover Schedule(1)(2) | ||||||||
| Year Ending December 31 | Expiring Owned GLA | % of Owned GLA | Cumulative % of Owned GLA | U/W Base Rent | % of Total U/W Base Rent | U/W Base Rent $ per SF | # of Expiring Leases | |
| 2024 | 0 | 0.0% | 0.0% | $0 | 0.0% | $0.00 | 0 | |
| 2025 | 0 | 0.0 | 0.0% | 0 | 0.0 | $0.00 | 0 | |
| 2026 | 0 | 0.0 | 0.0% | 0 | 0.0 | $0.00 | 0 | |
| 2027 | 28,263 | 19.2 | 19.2% | 1,666,386 | 26.4 | $58.96 | 1 | |
| 2028 | 34,583 | 23.4 | 42.6% | 2,400,908 | 38.0 | $69.42 | 2 | |
| 2029 | 0 | 0.0 | 42.6% | 0 | 0.0 | $0.00 | 0 | |
| 2030 | 0 | 0.0 | 42.6% | 0 | 0.0 | $0.00 | 0 | |
| 2031 | 13,700 | 9.3 | 51.9% | 350,538 | 5.6 | $25.59 | 1 | |
| 2032 | 22,794 | 15.4 | 67.3% | 592,872 | 9.4 | $26.01 | 1 | |
| 2033 | 0 | 0.0 | 67.3% | 0 | 0.0 | $0.00 | 0 | |
| 2034 | 21386 | 14.5 | 81.8% | 628,284 | 10.0 | $29.38 | 1 | |
| 2035 & Thereafter | 26,823 | 18.2 | 100.0% | 671,920 | 10.6 | $25.05 | 2 | |
| Vacant | 0 | 0.0 | 100.0% | NAP | NAP | NAP | NAP | |
| Total / Wtd. Avg. | 147,549 | 100.00% | $6,310,909 | 100.00% | $42.77 | 8 | ||
| (1) | Based on the underwritten rent roll dated June 1, 2024, inclusive of $91,852 of contractual rent steps underwritten through October 1, 2024. |
| (2) | Certain tenants may have lease termination options that are exercisable prior to the stated expiration date of the subject lease or leases which are not considered in the Lease Rollover Schedule. |
| THE INFORMATION IN THIS STRUCTURAL AND COLLATERAL TERM SHEET IS NOT COMPLETE AND MAY BE AMENDED PRIOR TO THE TIME OF SALE. THIS TERM SHEET IS NOT AN OFFER TO SELL THESE SECURITIES AND IT IS NOT A SOLICITATION OF AN OFFER TO BUY THESE SECURITIES IN ANY JURISDICTION WHERE THE OFFER OR SALE IS NOT PERMITTED. | ||
| 102 | ||
Office – CBD 420 Broadway Street, 305-309 North San Antonio, TX 78205
| Collateral Asset Summary – Loan No. 9 The Light Building | Cut-off Date Balance: Cut-off Date LTV: U/W NCF DSCR: U/W NOI Debt Yield: | $43,500,000 56.1% 1.83x 13.6% |
The following table presents certain information relating to the historical operating performance and Underwritten Net Cash Flow at The Light Building Property:
| Cash Flow Analysis(1)(2) | ||||||
| 2023 | TTM 3/31/2024(3) | U/W(3) | U/W Per SF | |||
| Base Rent | $4,863,102 | $5,473,590 | $6,219,056 | $42.15 | ||
| Contractual Rent Steps | 0 | 0 | 91,852 | $0.62 | ||
| Gross Potential Rent | $4,863,102 | $5,473,590 | $6,310,909 | $42.77 | ||
| Total Reimbursements | 739738 | 772180 | 899,724 | $6.10 | ||
| Total Gross Income | $5,602,840 | $6,245,770 | $7,210,633 | $48.87 | ||
| Parking | $654,545 | $697,088 | 1,129,030 | $7.65 | ||
| (Vacancy/Credit Loss) | 0 | 0 | (360,532) | ($2.44) | ||
| Effective Gross Income | $6,257,385 | $6,942,858 | $7,979,131 | $54.08 | ||
| Management Fee | 187,722 | 208,286 | 239,374 | $1.62 | ||
| Real Estate Taxes | 728,290 | 745,672 | 758,482 | $5.14 | ||
| Insurance | 188,602 | 173,005 | 123,205 | $0.84 | ||
| Other Expenses(4) | 1,120,515 | 1,120,231 | 948,619 | $6.43 | ||
| Total Expenses | $2,225,129 | $2,247,194 | $2,069,680 | $14.03 | ||
| Net Operating Income | $4,032,256 | $4,695,664 | $5,909,451 | $40.05 | ||
| Capital Expenditures | 0 | 0 | 29,510 | $0.20 | ||
| TI/LC | 0 | 0 | 353,160 | $2.39 | ||
| Net Cash Flow | $4,032,256 | $4,695,664 | $5,526,782 | $37.46 | ||
| Occupancy (%) | 85.9% | 94.2% | 95.0%(5) | |||
| NCF DSCR | 1.33x | 1.55x | 1.83x | |||
| NOI Debt Yield | 9.3% | 10.8% | 13.6% | |||
| (1) | Underwritten Base Rent is based on the underwritten rent roll dated June 1, 2024. Contractual Rent Steps are inclusive of $91,852 of contractual rent steps underwritten through October 1, 2024. |
| (2) | Historical NOI information prior to 2023 is not available because The Light Building Property was recently renovated in 2022. |
| (3) | The increase from TTM 3/31/2024 Net Operating Income to U/W Net Operating Income is primarily attributed to free rent burning off in relation to three leases executed from March 2023 through July 2023. |
| (4) | Other Expenses include cleaning, general operating, repairs and maintenance, utilities, and franchise tax expenses. |
| (5) | Represents economic occupancy. |
Appraisal. According to the appraisal, The Light Building Property had an “as-is” appraised value of $77,500,000 as of April 25, 2024, as shown in the table below. Based on the “as-is” value of $77,500,000, the Cut-off Date LTV and Maturity Date LTV for The Light Building Mortgage Loan are 56.1%, respectively.
| The Light Building Appraised Value(1) | ||
| Property | Value | Capitalization Rate |
| The Light Building | $77,500,000 | 7.00% |
| (1) | Source: Appraisal. |
Environmental Matters. The Phase I environmental assessment dated June 19, 2023 identified as a recognized environmental condition for The Light Building Property impacts to site soils and groundwater attributed to historical onsite printing operations. See “Description of the Mortgage Pool—Environmental Considerations” in the Preliminary Prospectus.
The Market. The Light Building Property is located along Broadway Street in the central business district (“CBD”) of San Antonio, Texas. San Antonio has a population of 2,698,487 and has seen population increase by 555,959 since 2020. San Antonio has four major military installations, all part of the Joint Base San Antonio (“JBSA”). According to the appraisal, JBSA directly employs approximately 74,300 people in the region. JBSA is considered the largest and most diverse base in the Department of Defense and is comprised of four primary locations: Fort Sam Houston (US Army), Camp Bullis (US Army), Randolph Air Force Base (US Air Force), Lackland Air Force Base (US Air Force).
According to the appraisal, the Light Building Property is located in the San Antonio CBD submarket of the San Antonio-New Braunfels, TX Metropolitan Statistical Area. As of March 31, 2024, the San Antonio CBD office submarket had a total inventory of 10,788,450 square feet, an overall vacancy rate of 15.9% and average asking rent of $28.52 per square foot.
| THE INFORMATION IN THIS STRUCTURAL AND COLLATERAL TERM SHEET IS NOT COMPLETE AND MAY BE AMENDED PRIOR TO THE TIME OF SALE. THIS TERM SHEET IS NOT AN OFFER TO SELL THESE SECURITIES AND IT IS NOT A SOLICITATION OF AN OFFER TO BUY THESE SECURITIES IN ANY JURISDICTION WHERE THE OFFER OR SALE IS NOT PERMITTED. | ||
| 103 | ||
Office – CBD 420 Broadway Street, 305-309 North San Antonio, TX 78205
| Collateral Asset Summary – Loan No. 9 The Light Building | Cut-off Date Balance: Cut-off Date LTV: U/W NCF DSCR: U/W NOI Debt Yield: | $43,500,000 56.1% 1.83x 13.6% |
According to the appraisal, the 2023 population and average household income in a one-, three- and five-mile radius are 11,825, 124,921 and 337,340 and $91,552, $68,731 and $72,058, respectively.
The following table presents certain information relating to comparable office leases for The Light Building Property:
| Comparable Office Rental Summary(1) | |||||
| Property Name | Tenant | Suite Size (SF) | Lease Commencement | Lease Term (Yrs) | Rent (PSF)(2) |
| The Light Building | Various | Various | Various | Various | $42.15(3) |
| The Soto | Argonaut Management | 25,313 SF | July 2022 | 5.3 Yrs. | $31.00 |
| Frost Tower | BitDefender | 9,360 SF | August 2020 | 10.0 Yrs. | $42.44 |
| The Phipps Building | Phipps Ortiz Talafuse, PLLC | 7,100 SF | January 2022 | 5.0 Yrs. | $38.87 |
| Oxbow | CBRE | 17,090 SF | June 2021 | 10.5 Yrs. | $38.00 |
| Full Goods Building | CFS | 1,916 SF | January 2023 | 5.0 Yrs. | $42.00 |
| (1) | Source: Appraisals. |
| (2) | Rent (PSF) does not include rent steps. |
| (3) | Based on the underwritten rent roll dated June 1, 2024. |
The Borrower and the Borrower Sponsor. The borrower is GS Light, LLC, a Delaware limited liability company, with one independent director. Legal counsel to the borrower delivered a non-consolidation opinion in connection with the origination of The Light Building Mortgage Loan. The borrower sponsor is GrayStreet Light, LP, a Texas limited partnership and the non-recourse carveout guarantor is Kevin Covey. Kevin Covey is the founder of GrayStreet Partners and predecessor Caliburn Capital. GrayStreet Partners was founded in 2009 and is a private equity firm focusing on the investment, development, and management of urban commercial real estate.
Property Management. The Light Building Property is managed by GrayStreet Management Services, LLC, a borrower-affiliated management company.
Initial and Ongoing Reserves. At origination of The Light Building Mortgage Loan, the borrower deposited approximately: (i) $66,789 into a tax reserve, (ii) $901,210 into an unfunded obligations reserve, (iii) $45,000 into an environmental reserve and (iv) $2,438 into an immediate repairs reserve.
Tax Reserve – The borrower is required to deposit into the real estate tax reserve, on a monthly basis, 1/12th of the taxes that the lender reasonably estimates will be payable over the next-ensuing 12-month period (initially estimated to be approximately $66,789).
Insurance Reserve – The borrower is required to deposit into the insurance reserve, on a monthly basis, 1/12th of the amount which will be sufficient to pay the insurance premiums due for the renewal of coverage afforded by such policies; provided, however, such insurance reserve has been conditionally waived so long as the borrower maintains a blanket policy meeting the requirements of The Light Building Mortgage Loan documents.
Replacement Reserve – The borrower is required to deposit into a replacement reserve, on a monthly basis, approximately $86 (subject to a cap of $4,550).
Leasing Reserve – Upon the occurrence and during the continuance of a Trigger Period (as defined below), The borrower is required to deposit into a leasing reserve, on a monthly basis, approximately $29,446 for tenant improvements, including tenant allowances and landlord work.
Lockbox / Cash Management. The Light Building Mortgage Loan is structured with a springing lockbox and springing cash management. Upon the first occurrence of a Trigger Period, the borrower is required to establish a lender-controlled lockbox account, and is thereafter required to deposit, or cause the property manager to deposit, immediately upon receipt, all revenue received by the borrower or the property manager into such lockbox. Within five days after the first occurrence of a Trigger Period, the borrower is required to deliver a notice to all tenants at The Light Building Property directing them to pay all rent and other sums due under their respective leases into the lender-controlled lockbox account. All funds deposited into the lockbox are required to be transferred on each business day to or at the direction of the borrower unless a Trigger Period exists and the lender elects (in its sole and absolute discretion) to deliver a restricted account notice, in which case all funds in the lockbox account are required to be swept on each business day to a lender-controlled cash management account to be applied and disbursed in accordance with The Light Building Mortgage Loan documents, and all excess cash flow funds remaining in the cash management account after the application of such funds in accordance with The Light Building Mortgage Loan documents are required to be held by the lender in an excess cash flow reserve account as
| THE INFORMATION IN THIS STRUCTURAL AND COLLATERAL TERM SHEET IS NOT COMPLETE AND MAY BE AMENDED PRIOR TO THE TIME OF SALE. THIS TERM SHEET IS NOT AN OFFER TO SELL THESE SECURITIES AND IT IS NOT A SOLICITATION OF AN OFFER TO BUY THESE SECURITIES IN ANY JURISDICTION WHERE THE OFFER OR SALE IS NOT PERMITTED. | ||
| 104 | ||
Office – CBD 420 Broadway Street, 305-309 North San Antonio, TX 78205
| Collateral Asset Summary – Loan No. 9 The Light Building | Cut-off Date Balance: Cut-off Date LTV: U/W NCF DSCR: U/W NOI Debt Yield: | $43,500,000 56.1% 1.83x 13.6% |
additional collateral for The Light Building Mortgage Loan. Upon the cure of the applicable Trigger Period, so long as no other Trigger Period exists, the lender is required to return any amounts remaining on deposit in the excess cash flow reserve account to the borrower; provided, however, any excess cash flow funds required to satisfy the Specified Tenant Excess Cash Flow Condition (as defined below) or to satisfy the ST Cap Condition (as defined below) will be retained by the lender in the excess cash flow account. Upon an event of default under The Light Building Mortgage Loan documents, the lender may apply funds to the debt in such priority as it may determine.
A “Trigger Period” means a period (A) commencing upon the earliest of (i) the occurrence and continuance of an event of default, (ii) the debt service coverage ratio being less than 1.20x, and (iii) the occurrence of a Specified Tenant Trigger Period (as defined below) and (B) expiring upon (x) with regard to clause (i) above, the cure (if applicable) of such event of default, (y) with regard to clause (ii) above, the date that the debt service coverage ratio is equal to or greater than 1.25x for two consecutive calendar quarters, and (z) with regard to clause (iii) above, the Specified Tenant Trigger Period ceasing to exist.
A “Specified Tenant” means, as applicable, (i) GrayStreet Secure Solutions, LLC, a Texas limited liability company (“GSS”), together with its successors and/or assigns, (ii) Namauu Technological & Industrial, LLC, a Hawaiian corporation (“NTI”), (iii) The Chenega Corporation, an Alaska corporation (“Chenega”), (iv) any other tenant that (together with its affiliates) either (A) accounts for 25% or more of the total rental income for The Light Building Property, or (B) demises 25% or more of The Light Building Property’s gross leasable area pursuant to the terms of a Specified Tenant lease, (v) any sublessee, subtenant or subcontractor of any portion of The Light Building Property pursuant to the terms of a Specified Tenant lease, and (vi) any guarantor(s) of the applicable related Specified Tenant lease(s) or any parent or affiliate providing credit support for the applicable related Specified Tenant lease(s).
A “Specified Tenant Trigger Period” means a period (A) commencing upon the first to occur of (i) Specified Tenant being in default under the applicable Specified Tenant lease beyond applicable notice and cure periods, (ii) Specified Tenant failing to be in actual, physical possession of its Specified Tenant space (or applicable portion thereof), (iii) Specified Tenant failing to be open for business during customary hours and/or “going dark” in its Specified Tenant space (or applicable portion thereof), (iv) Specified Tenant giving written notice that it is terminating its lease for its Specified Tenant space (or applicable portion thereof), (v) any termination or cancellation of any Specified Tenant lease (including, without limitation, rejection in any bankruptcy or similar insolvency proceeding) and/or any Specified Tenant lease failing to otherwise be in full force and effect, (vi) any bankruptcy or similar insolvency of Specified Tenant, and (vii) Specified Tenant failing to extend or renew the applicable Specified Tenant lease on or prior to the earlier to occur of (A) 12 months prior to the expiration of the applicable Specified Tenant lease and (B) the date by which the applicable Specified Tenant must provide notice of renewal of its lease pursuant to the terms thereof; and (B) expiring upon the first to occur of (i) the satisfaction of the applicable Specified Tenant Cure Conditions (as defined below), (ii) the borrower leasing the entire applicable Specified Tenant space (or applicable portion thereof) pursuant to one or more leases in accordance with the applicable terms and conditions of The Light Building Mortgage Loan documents, the applicable tenant(s) under such lease(s) being in actual, physical occupancy of the space demised, and, in the lender’s judgment, the applicable Specified Tenant Excess Cash Flow Condition is satisfied, or (iii) solely with respect to a Specified Tenant Trigger Period contemplated in clauses (A)(i)-(v) and (vii) above, the ST Cap Condition is satisfied.
“Specified Tenant Cure Conditions” means each of the following, as applicable, (i) the applicable Specified Tenant has cured all defaults under the applicable Specified Tenant lease and no other default under such Specified Tenant lease occurs for a period of 3 consecutive months following such cure, (ii) the applicable Specified Tenant is in actual, physical possession of its Specified Tenant space (or applicable portion thereof) and open for business during customary hours and not “dark” in all or any portion of its Specified Tenant space (or applicable portion thereof), (iii) the applicable Specified Tenant has revoked or rescinded all termination or cancellation notices with respect to the applicable Specified Tenant lease and has re-affirmed the applicable Specified Tenant lease as being in full force and effect, (iv) with respect to a Specified Tenant Trigger Period relating to clause (vii) of the definition of “Specified Tenant Trigger Period”, the applicable Specified Tenant has renewed or extended the applicable Specified Tenant lease in accordance with the terms of The Light Building Mortgage Loan and, in the lender’s judgment, the applicable Specified Tenant Excess Cash Flow Condition is satisfied in connection therewith, (v) with respect to any applicable bankruptcy or insolvency proceedings involving the applicable Specified Tenant and/or the applicable Specified Tenant lease, the applicable Specified Tenant is no longer insolvent or subject to any bankruptcy or insolvency proceedings and has affirmed the applicable Specified Tenant lease pursuant to final, non-appealable order of a court of competent jurisdiction and (vi) the applicable Specified Tenant is paying full, unabated rent under the applicable Specified Tenant lease.
“Specified Tenant Excess Cash Flow Condition” means, with respect to curing any Specified Tenant Trigger Period by re-tenanting the applicable Specified Tenant space or renewal/extension of any Specified Tenant lease, sufficient funds have been accumulated in the excess cash flow account (during the continuance of the subject Specified Tenant Trigger Period) to cover all anticipated and unpaid leasing commissions, tenant improvement costs, tenant allowances, free rent periods, and/or rent abatement periods to be incurred in connection with any such re-tenanting or renewal/extension.
“ST Cap Condition” means that the amount on deposit in the excess cash flow account is equal to or greater than (x) $50, multiplied by (y) the number of leasable square feet demised (prior to giving effect to any full or partial termination thereof) pursuant to the applicable Specified Tenant lease with respect to which the applicable Specified Tenant Trigger Period has occurred.
Current Mezzanine or Secured Subordinate Indebtedness. None.
| THE INFORMATION IN THIS STRUCTURAL AND COLLATERAL TERM SHEET IS NOT COMPLETE AND MAY BE AMENDED PRIOR TO THE TIME OF SALE. THIS TERM SHEET IS NOT AN OFFER TO SELL THESE SECURITIES AND IT IS NOT A SOLICITATION OF AN OFFER TO BUY THESE SECURITIES IN ANY JURISDICTION WHERE THE OFFER OR SALE IS NOT PERMITTED. | ||
| 105 | ||
Office – CBD 420 Broadway Street, 305-309 North San Antonio, TX 78205
| Collateral Asset Summary – Loan No. 9 The Light Building | Cut-off Date Balance: Cut-off Date LTV: U/W NCF DSCR: U/W NOI Debt Yield: | $43,500,000 56.1% 1.83x 13.6% |
Permitted Future Mezzanine or Secured Subordinate Indebtedness. Not Permitted.
Release of Collateral. Provided that no event of default is continuing under The Light Building Mortgage Loan documents, at any time after May 24, 2027, the borrower has the one time right to either deliver defeasance collateral or partially prepay The Light Building Mortgage Loan and obtain release of a portion of The Light Building Property located at 305-309 North Alamo Street, San Antonio, Texas 78205 and 318 and 320 Broadway Street, San Antonio, Texas 78205, in each case, provided that, among other conditions, (i) the defeasance collateral or partial prepayment, as applicable, is of an amount equal to the greater of (a) 125% of the allocated loan amount for such portion of The Light Building Property, and (b) 100% of the net sales proceeds applicable to such portion of The Light Building Property, (ii) the borrower delivers a REMIC opinion, (iii) the borrower delivers (if requested by the lender) a rating agency confirmation, (iv) as of the date of notice of the partial release and the consummation of the partial release (whether by partial prepayment or partial defeasance), after giving effect to the release, the debt service coverage ratio with respect to the remaining portion of The Light Building Property is equal to or greater than the greater of (a) 1.83x, and (b) the debt service coverage ratio all of The Light Building Property immediately prior to the date of notice of the partial release or the consummation of the partial release, as applicable, (v) as of the date of notice of the partial release and the consummation of the partial release (whether by partial prepayment or partial defeasance), after giving effect to the release, the loan-to-value ratio with respect to the remaining portion of The Light Building Property is no greater than the lesser of (a) 56.1% and (b) the loan-to-value ratio for all of The Light Building Property immediately prior to the date of notice of the partial release or the consummation of the partial release, as applicable, and (vi) as of the date of notice of the partial release and the consummation of the partial release (whether by partial prepayment or partial defeasance), after giving effect to the release, the debt yield with respect to the remaining portion of The Light Building Property is equal to or greater than the greater of (a) 12.7%, and (b) the debt yield for all of The Light Building Property immediately prior to the date of notice of the partial release or the consummation of the partial release, as applicable.
Ground Lease. None.
| THE INFORMATION IN THIS STRUCTURAL AND COLLATERAL TERM SHEET IS NOT COMPLETE AND MAY BE AMENDED PRIOR TO THE TIME OF SALE. THIS TERM SHEET IS NOT AN OFFER TO SELL THESE SECURITIES AND IT IS NOT A SOLICITATION OF AN OFFER TO BUY THESE SECURITIES IN ANY JURISDICTION WHERE THE OFFER OR SALE IS NOT PERMITTED. | ||
| 106 | ||
Office – CBD 488 Madison Avenue New York, NY 10022
| Collateral Asset Summary – Loan No. 10 488 Madison | Cut-off Date Balance: Cut-off Date LTV: U/W NCF DSCR: U/W NOI Debt Yield: | $40,000,000 45.5% 1.94x 15.6% |
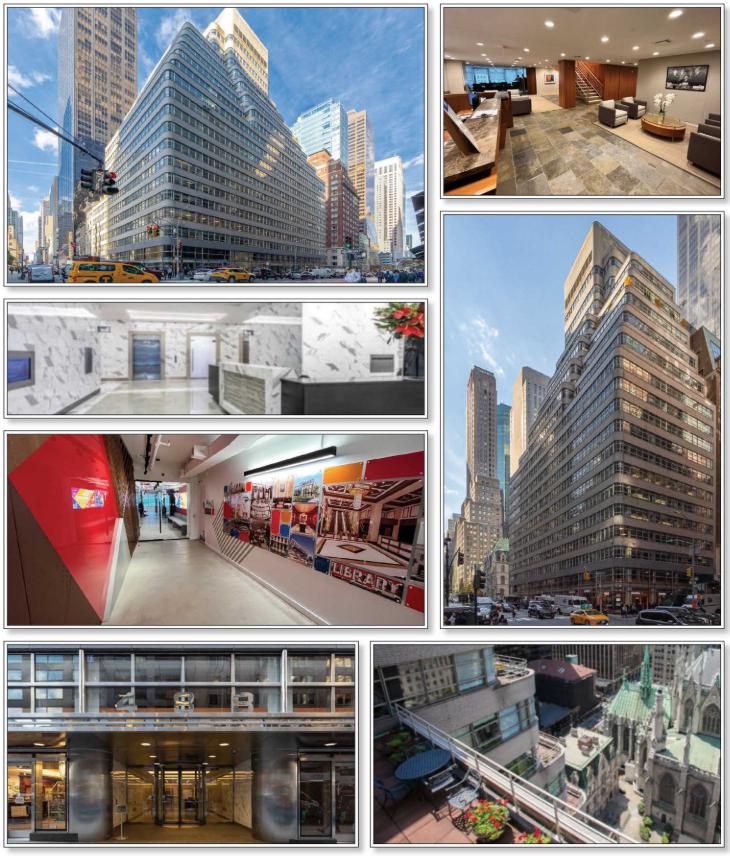
| THE INFORMATION IN THIS STRUCTURAL AND COLLATERAL TERM SHEET IS NOT COMPLETE AND MAY BE AMENDED PRIOR TO THE TIME OF SALE. THIS TERM SHEET IS NOT AN OFFER TO SELL THESE SECURITIES AND IT IS NOT A SOLICITATION OF AN OFFER TO BUY THESE SECURITIES IN ANY JURISDICTION WHERE THE OFFER OR SALE IS NOT PERMITTED. | ||
| 107 | ||
Office – CBD 488 Madison Avenue New York, NY 10022
| Collateral Asset Summary – Loan No. 10 488 Madison | Cut-off Date Balance: Cut-off Date LTV: U/W NCF DSCR: U/W NOI Debt Yield: | $40,000,000 45.5% 1.94x 15.6% |
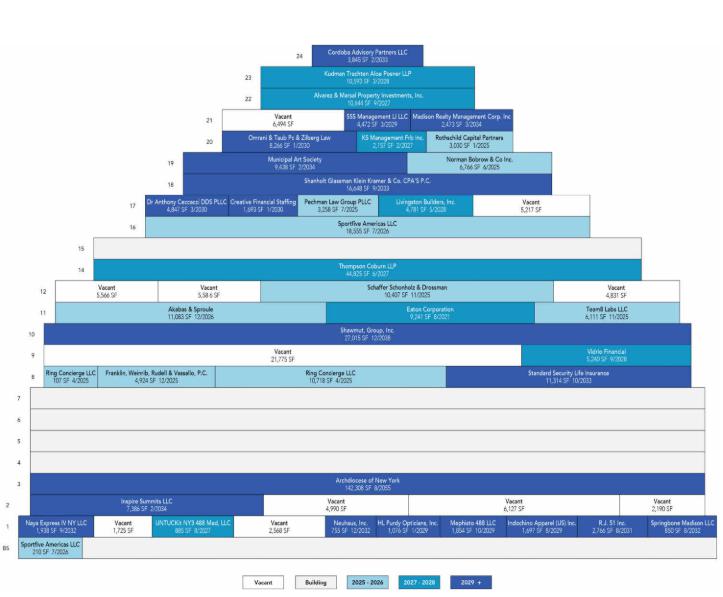
| THE INFORMATION IN THIS STRUCTURAL AND COLLATERAL TERM SHEET IS NOT COMPLETE AND MAY BE AMENDED PRIOR TO THE TIME OF SALE. THIS TERM SHEET IS NOT AN OFFER TO SELL THESE SECURITIES AND IT IS NOT A SOLICITATION OF AN OFFER TO BUY THESE SECURITIES IN ANY JURISDICTION WHERE THE OFFER OR SALE IS NOT PERMITTED. | ||
| 108 | ||
Office – CBD 488 Madison Avenue New York, NY 10022
| Collateral Asset Summary – Loan No. 10 488 Madison | Cut-off Date Balance: Cut-off Date LTV: U/W NCF DSCR: U/W NOI Debt Yield: | $40,000,000 45.5% 1.94x 15.6% |
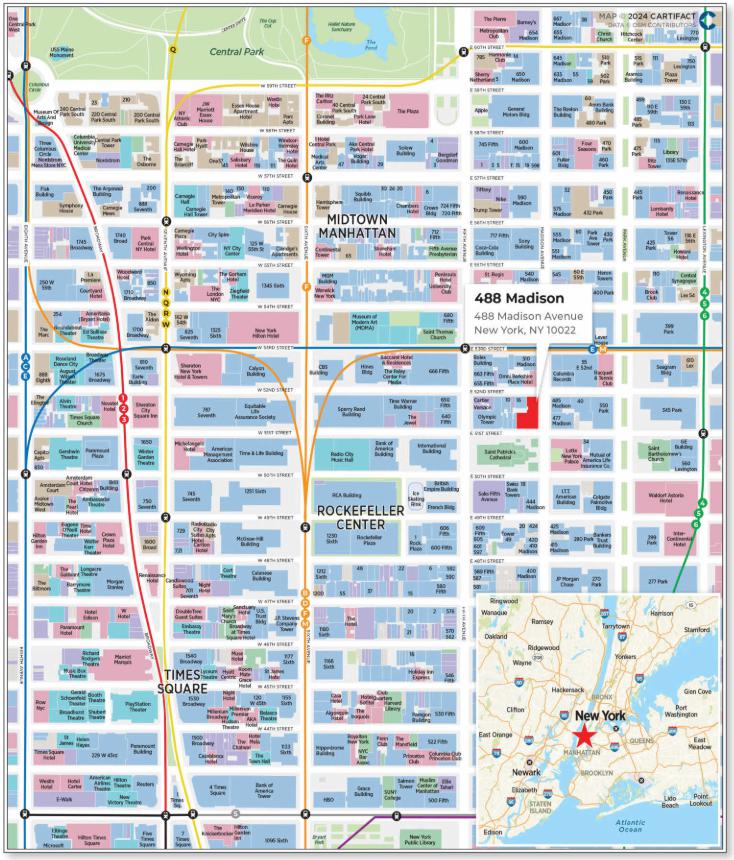
| THE INFORMATION IN THIS STRUCTURAL AND COLLATERAL TERM SHEET IS NOT COMPLETE AND MAY BE AMENDED PRIOR TO THE TIME OF SALE. THIS TERM SHEET IS NOT AN OFFER TO SELL THESE SECURITIES AND IT IS NOT A SOLICITATION OF AN OFFER TO BUY THESE SECURITIES IN ANY JURISDICTION WHERE THE OFFER OR SALE IS NOT PERMITTED. | ||
| 109 | ||
Office – CBD 488 Madison Avenue New York, NY 10022
| Collateral Asset Summary – Loan No. 10 488 Madison | Cut-off Date Balance: Cut-off Date LTV: U/W NCF DSCR: U/W NOI Debt Yield: | $40,000,000 45.5% 1.94x 15.6% |
| Mortgage Loan Information | Property Information | |||
| Loan Seller: | GACC | Single Asset / Portfolio: | Single Asset | |
| Loan Purpose: | Refinance | Property Type – Subtype: | Office – CBD | |
| Borrower Sponsor(s): | Feil Organization | Collateral: | Fee | |
| Borrower(s): | 488 Madison Avenue Associates LLC | Location: | New York, NY | |
| Original Balance(1): | $40,000,000 | Year Built / Renovated: | 1950 / 2012-2023 | |
| Cut-off Date Balance(1): | $40,000,000 | Property Management: | Jeffrey Management Corp. | |
| % by Initial UPB: | 4.0% | Size: | 481,245 SF | |
| Interest Rate: | 6.88200% | Appraised Value / Per SF(4): | $220,000,000 / $457 | |
| Note Date: | May 14, 2024 | Appraisal Date: | April 1, 2024 | |
| Original Term: | 60 months | Occupancy: | 86.1% (as of April 1, 2024) | |
| Amortization: | Interest Only | UW Economy Occupancy: | 82.6% | |
| Original Amortization: | NAP | Underwritten NOI(5): | $15,580,226 | |
| Interest Only Period: | 60 Months | Underwritten NCF: | $13,511,276 | |
| First Payment Date: | July 1, 2024 | |||
| Maturity Date: | June 1, 2029 | Historical NOI | ||
| Additional Debt Type(1): | Pari Passu | Most Recent NOI(5): | $6,404,367 (TTM March 31, 2024) | |
| Additional Debt Balance(1): | $60,000,000 | 2023 NOI: | $6,151,808 | |
| Call Protection: | L(25),D(30),O(5) | 2022 NOI: | $10,169,001 | |
| Lockbox / Cash Management: | Hard / In Place | 2020 NOI: | NAV | |
| Reserves(2) | Financial Information(1) | ||||||
| Initial | Monthly | Cap | Cut-off Date Loan Per SF: | $208 | |||
| Taxes: | $3,230,895 | $538,482 | NAP | Maturity Date Loan Per SF: | $208 | ||
| Insurance: | $0 | Springing | NAP | Cut-off Date LTV(4): | 45.5% | ||
| Replacement Reserves: | $0 | $7,979 | $95,753 | Maturity Date LTV(4): | 45.5% | ||
| TI/LC: | $0 | $112,153 | $2,691,664 | UW NOI DY: | 15.6% | ||
| ADNY Reserve(3): | $22,481,687 | $0 | NAP | UW NCF DSCR: | 1.94x | ||
| Alvarez & Marsal Reserve: | $585,399 | $0 | NAP | ||||
| Condominium Reserve: | $0 | Springing | NAP | ||||
| Sources and Uses | |||||||
| Sources | Proceeds | % of Total | Uses | Proceeds | % of Total | ||
| Whole Loan | $100,000,000 | 85.3% | Loan Payoff | $90,076,354 | 76.8% | ||
| Borrower Equity | $17,264,301 | 14.7% | Upfront Reserves | $26,297,981 | 22.4% | ||
| Closing Costs | $889,966 | 0.8% | |||||
| Total Sources | $117,264,301 | 100.0% | Total Uses | $117,264,301 | 100.0% | ||
| (1) | The 488 Madison Mortgage Loan (as defined below) is part of the 488 Madison Whole Loan (as defined below), which is comprised of two pari passu promissory notes with an aggregate original principal balance and Cut-off Date Balance of $100,000,000. The Financial Information in the chart above is based on the aggregate outstanding principal balance as of the Cut-off Date of the 488 Madison Whole Loan. |
| (2) | See “Initial and Ongoing Reserves” below. |
| (3) | The borrower reserved $20,353,872 for outstanding amounts for the Archdiocese of New York tenant improvement and allowances, and $2,127,815 for the Archdiocese of New York tenant leasing commissions with the lender. Additionally, the borrower provided a letter of credit to the lender in the amount of $8,462,091 for the Archdiocese of New York’s free rent funds and gap rent funds. See “Initial and Ongoing Reserves” below for further details. |
| (4) | The appraisal concluded to a “As-Is Assuming ADNY Reserves” value for the 488 Madison Property (as defined below) of $220,000,000 as of April 1, 2024, which assumes that the contractual obligations from the Archdiocese of New York lease (free rent, tenant improvements, leasing costs, and other capital expenditures) would be funded by a cash reserve held in escrow and that such reserved funds would be available for any potential purchase. At origination, $22,481,687 was deposited as shown above. The appraisal concluded to an “As-Is” appraised value of $180,000,000 as of April 1, 2024, resulting in a Cut-off Date LTV Ratio and Maturity Date LTV Ratio of 55.6%. In addition, the appraisal employs the extraordinary assumptions that the 488 Madison Property will be subdivided into condominiums and that the Archdiocese of New York unit real estate tax exemption will be granted, and that beginning March 1, 2025, real estate tax attributable to the space leased by the Archdiocese of New York (29.528% of the total real estate taxes) will be abated. |
| (5) | The increase in Most Recent NOI to Underwritten NOI is primarily due to the underwriting of the Archdiocese of New York lease that has not yet commenced as well as, in the case of UW NOI, the assumption regarding a tax exemption. Real Estate Taxes assumes the Archdiocese of New York’s leased space has obtained the tax exemption described under “Major Tenants—Archdiocese of New York.” UW Real Estate Taxes without the tax exemption would be $6,273,583, resulting in a NOI DSCR, NCF DSCR, NOI Debt Yield and NCF Debt Yield of 1.97x, 1.67x, 13.7% and 11.7%, respectively. |
| THE INFORMATION IN THIS STRUCTURAL AND COLLATERAL TERM SHEET IS NOT COMPLETE AND MAY BE AMENDED PRIOR TO THE TIME OF SALE. THIS TERM SHEET IS NOT AN OFFER TO SELL THESE SECURITIES AND IT IS NOT A SOLICITATION OF AN OFFER TO BUY THESE SECURITIES IN ANY JURISDICTION WHERE THE OFFER OR SALE IS NOT PERMITTED. | ||
| 110 | ||
Office – CBD 488 Madison Avenue New York, NY 10022
| Collateral Asset Summary – Loan No. 10 488 Madison | Cut-off Date Balance: Cut-off Date LTV: U/W NCF DSCR: U/W NOI Debt Yield: | $40,000,000 45.5% 1.94x 15.6% |
The Loan. The tenth largest mortgage loan (the “488 Madison Mortgage Loan”) is part of a whole loan (the “488 Madison Whole Loan”) with an original principal balance and Cut-off Date Balance of $100,000,000. The 488 Madison Whole Loan is secured by a first priority fee mortgage encumbering a 481,245 SF office property in New York, New York (the “488 Madison Property”). The 488 Madison Whole Loan is comprised of two pari passu promissory notes in the aggregate original principal balance of $100,000,000. The 488 Madison Whole Loan was originated by Morgan Stanley Bank, N.A. (“MSBNA”) and German American Capital Corporation (“GACC”) on May 14, 2024 and accrues interest at a fixed rate of 6.88200% per annum. The 488 Madison Whole Loan has an initial term of 60 months and has a remaining term of 59 months as of the Cut-off Date. The 488 Madison Whole Loan requires interest-only payments during its entire term.
The table below identifies the promissory notes that comprise the 488 Madison Whole Loan. The relationship between the holders of the 488 Madison Whole Loan is governed by a co-lender agreement as described under “Description of the Mortgage Pool—The Whole Loans—The Non-Serviced Pari Passu Whole Loans” in the Preliminary Prospectus. The 488 Madison Whole Loan will be serviced pursuant to the pooling and servicing agreement for the BANK5 2024-5YR7 transaction. See “The Pooling and Servicing Agreement—Servicing of the Non-Serviced Mortgage Loans” in the Preliminary Prospectus.
| Whole Loan Summary | ||||
| Note | Original Balance | Cut-off Date Balance | Note Holder | Controlling Piece |
| A-1 | $60,000,000 | $60,000,000 | BANK5 2024-5YR7 | Yes |
| A-2 | $40,000,000 | $40,000,000 | Benchmark 2024-V8 | No |
| Whole Loan | $100,000,000 | $100,000,000 | ||
The Property. The 488 Madison Property is a 24-story, Class B, 481,245 SF office building situated on an approximately 0.5-acre site, located in New York, New York. The 488 Madison Property is comprised of 464,814 SF of office space (96.6% of NRA, 86.8% of UW Base Rent), 16,114 SF of ground floor retail space (3.3% of NRA, 13.2 % of UW Rent), and 317 SF of storage space (0.1% of NRA, 0.0% of UW Base Rent). Known as the “Look Building”, the 488 Madison Property is situated directly across from and overlooking the renowned St. Patrick’s Cathedral and New York Palace Hotel. The 488 Madison Property was built in 1950 and has a distinctively curved, multi-layered façade comprised of glazed white brick. The multi-tiered structure provides tenants on floors fourteen and above with balcony access that has unobstructed views to the south, overlooking St. Patrick’s Cathedral, The New York Palace Hotel, and Madison Avenue. The 488 Madison Property’s façade is landmarked. The borrower sponsor acquired the 488 Madison Property in the 1970s and has invested approximately $21.8 million since 2009 in capital expenditures across various improvements projects, renovating essentially the entirety of the building. Additionally, as part of the Archdiocese of New York’s lease, the borrower is required to perform base building work in an amount of $4.4 million. As of April 1, 2024, the 488 Madison Property was 86.1% leased to a diverse roster of 36 tenants.
Major Tenants. The three largest tenants based on underwritten base rent are Archdiocese of New York, Thompson Coburn LLP and Shawmut, Group, Inc.
Archdiocese of New York (142,308 SF, 29.6% of NRA, 24.5% Annual UW rent). The Archdiocese of New York is the second-largest diocese in the United States by population, encompassing 2.5 million Catholics in nearly 300 parishes through its three boroughs of New York City (Manhattan, the Bronx and Staten Island) and seven counties north of New York City (Dutchess, Orange, Putnam, Rockland, Sullivan, Ulster and Westchester). The archdiocese includes 156 Catholic schools serving more than 50,000 students, helps more than 400,000 individuals each year through Catholic Charities, and provides healthcare through ArchCare, the healthcare ministry. In January 2024, the Archdiocese of New York signed a 30 year lease at the 488 Madison Property to occupy 142,308 SF, including 137,810 SF of office space on the entire 3rd through 7th floor of the 488 Madison Property, and 4,498 SF of retail space. The retail space is currently occupied by the Trustees for St Patrick’s Cathedral, located directly across 51st Street on Madison Avenue, and operates as a gift shop for St. Patrick’s Cathedral.
The Archdiocese of New York lease has not yet commenced, and accordingly the Archdiocese of New York is not yet in occupancy of its space. The lease provides for substantial tenant improvement work and building modification work. The lease commencement date occurs when the space is delivered with the tenant improvement work and building modification work substantially completed, which date will be no earlier than March 1, 2025. Delivery of the space is currently expected in March 2025; however, we cannot assure you that the space will be delivered by such time. The rent commencement date occurs six months after the lease commencement (accordingly there is gap rent until the space is delivered and free rent for six months thereafter). The borrower reserved $20,353,872 with the lender for outstanding amounts for tenant improvements and allowances and $2,127,815 for leasing commissions. In addition, the borrower provided a letter of credit in the amount of $8,462,091 for the tenant’s gap and free rent. In addition, the Archdiocese of New York was granted free rent for the first 3 months of each of the second through fifth lease years, which has not been reserved for. We cannot assure you that the tenant will commence paying rent as expected or at all.
| THE INFORMATION IN THIS STRUCTURAL AND COLLATERAL TERM SHEET IS NOT COMPLETE AND MAY BE AMENDED PRIOR TO THE TIME OF SALE. THIS TERM SHEET IS NOT AN OFFER TO SELL THESE SECURITIES AND IT IS NOT A SOLICITATION OF AN OFFER TO BUY THESE SECURITIES IN ANY JURISDICTION WHERE THE OFFER OR SALE IS NOT PERMITTED. | ||
| 111 | ||
Office – CBD 488 Madison Avenue New York, NY 10022
| Collateral Asset Summary – Loan No. 10 488 Madison | Cut-off Date Balance: Cut-off Date LTV: U/W NCF DSCR: U/W NOI Debt Yield: | $40,000,000 45.5% 1.94x 15.6% |
If the lease commencement date has not occurred prior to the date which is 13 months following the date the plans and specifications for the tenant improvement work (the “Final Plans”) are approved by both landlord and tenant, subject to certain permitted delays (the “First Outside Date”), then the free rent period will be increased by (x) 1 day for each day after the First Outside Date that the lease commencement date has not occurred for the first 60 days of delay, (y) 1.5 days for each day after the First Outside Date that the lease commencement date has not occurred for the next 60 days of delay, and (z) 2 days for each day after the First Outside Date that the lease commencement date has not occurred thereafter. If the lease commencement date has not occurred prior to the date which is 2.5 years following the date the Final Plans are approved by both landlord and tenant, subject to certain permitted delays (the “Outside Delivery Date”), the tenant will have the right within 30 days after the Outside Delivery Date, to cancel the lease by giving notice of cancellation to landlord. If the tenant does not timely exercise the foregoing termination right, the Outside Delivery Date will be extended by a period of 90 days, and if the lease commencement date has not occurred prior to the Outside Delivery Date (as so extended), then the tenant will have the right within 30 days after the Outside Delivery Date (as so extended), as its sole and exclusive remedy therefor, to cancel the lease by giving notice of cancellation to landlord. The process described in the immediately preceding sentence will repeat, as applicable, until the lease commencement date has occurred, or the lease is terminated.
Additionally, under the Archdiocese of New York lease, the borrower is required to establish a condominium regime for the 488 Madison Property, and subdivide the building into three or more fee condominium units. One unit comprising the entirety of the premises and two or more units comprising space not part of the premises. Such condominium has been formed. The Archdiocese of New York leased space encompasses the entirety of one fee condominium unit. Such structure is intended to allow the Archdiocese of New York to create a leasehold condominium in order to apply for a real estate tax exemption for its portion of the 488 Madison Property’s real estate tax liability. Once the fee condominium structure has been created, the tenant is responsible for obtaining tax-exempt status and if the Archdiocese of New York fails to abate its property tax obligation, it will be responsible for paying its pro-rata-share of property taxes (29.528%). The Archdiocese of New York’s lease provides for an initial rent of $45.00 PSF with 1% annual rent escalations along with $5.00 PSF increases every five years of the lease term.
We cannot assure you that the Archdiocese of New York will take occupancy as expected, or at all, that the gap and free rent periods will not be extended, or that a tax exemption will be obtained for the Archdiocese of New York’s space.
Thompson Coburn LLP (44,825 SF, 9.3% of NRA, 11.9% of UW rent). Thompson Coburn LLP is a full-service law firm with over 400 attorneys and eight offices located in Birmingham, Chicago, Dallas, Los Angeles, New York, Southern Illinois, St. Louis and Washington, D.C. Thompson Coburn LLP has been a tenant at the 488 Madison Property since 2002, has a lease expiration date of June 30, 2027 and have no renewal options remaining.
Shawmut, Group, Inc. (27,015 SF, 5.6% of NRA, 5.8% of UW rent). Shawmut, Group, Inc. is a construction management firm, with approximately 1,000 employees across offices in Boston, New York, Providence, Las Vegas, Los Angeles, West Springfield, New Haven and Miami. Shawmut, Group, Inc. has occupied the 488 Madison Property since 2022, has a lease expiration date of December 31, 2038, and has one, five-year renewal option remaining. Shawmut, Group, Inc. has the right to terminate its lease effective on January 31, 2034, upon 12 months’ notice and payment of a termination fee. Shawmut, Group Inc. has a free rent period for the months of September 2024 and October 2024, which has not been reserved for.
The following table presents certain information relating to historical occupancy for the 488 Madison Property:
| Historical Occupancy(1) | ||
| 2022 | 2023 | 4/1/2024(2) |
| 78.3% | 67.9% | 86.1% |
| (1) | Historical occupancies are as of December 31 of each respective year. |
| (2) | Based on the underwritten rent roll dated April 1, 2024. |
| THE INFORMATION IN THIS STRUCTURAL AND COLLATERAL TERM SHEET IS NOT COMPLETE AND MAY BE AMENDED PRIOR TO THE TIME OF SALE. THIS TERM SHEET IS NOT AN OFFER TO SELL THESE SECURITIES AND IT IS NOT A SOLICITATION OF AN OFFER TO BUY THESE SECURITIES IN ANY JURISDICTION WHERE THE OFFER OR SALE IS NOT PERMITTED. | ||
| 112 | ||
Office – CBD 488 Madison Avenue New York, NY 10022
| Collateral Asset Summary – Loan No. 10 488 Madison | Cut-off Date Balance: Cut-off Date LTV: U/W NCF DSCR: U/W NOI Debt Yield: | $40,000,000 45.5% 1.94x 15.6% |
The following table presents a summary regarding the major tenants at the 488 Madison Property:
| Tenant Summary(1) | |||||||||
| Tenant Name | Credit Rating (Moody’s/Fitch /S&P)(2) | Tenant SF | Approx.% of SF | Annual UW Rent | % of Total Annual UW Rent | Annual UW Rent PSF | Lease Expiration | Renewal Options | Term. Option (Y/N) |
| Archdiocese of New York | NR/NR/NR | 142,308 | 29.6% | $6,403,860 | 24.5% | $45.00 | 8/31/2055 | 3 x 5 or 10 years each | Y(3) |
| Thompson Coburn LLP | NR/NR/NR | 44,825 | 9.3% | $3,104,500 | 11.9% | $69.26 | 6/30/2027 | None | N |
| Shawmut, Group, Inc. | NR/NR/NR | 27,015 | 5.6% | $1,502,903 | 5.8% | $55.63 | 12/31/2038 | 1 x 5 year | Y(4) |
| Sportfive Americas LLC | NR/NR/NR | 18,765 | 3.9% | $1,206,600 | 4.6% | $64.30 | 7/31/2026 | 1 x 5 year | N |
| Shanholt Glassman Klein Kramer & Co. CPA’S P.C. | NR/NR/NR | 16,648 | 3.5% | $1,027,099 | 3.9% | $61.70 | 9/30/2033 | 1 x 5 year | Y(5) |
| Subtotal/Wtd. Avg. | 249,561 | 51.9% | $13,244,962 | 50.7% | $53.07 | ||||
| Other Tenants | 164,615 | 34.2% | $12,854,872 | 49.3% | $78.09 | ||||
| Occupied Subtotal/Wtd. Avg. | 414,176 | 86.1% | $26,099,833 | 100.0% | $63.02 | ||||
| Vacant Space | 67,069 | 13.9% | |||||||
| Total/Wtd. Avg. | 481,245 | 100.0% | |||||||
| (1) | Information is based on the underwritten rent roll dated April 1, 2024. |
| (2) | Certain ratings are those of the parent entity, whether or not the parent entity guarantees the lease. |
| (3) | The Archdiocese of New York lease has not yet commenced, and accordingly the Archdiocese of New York is not yet in occupancy of its space. The lease provides for substantial tenant improvement work and building modification work. The lease commencement date occurs when the space is delivered with the tenant improvement work and building modification work substantially completed, which date will be no earlier than March 1, 2025. The rent commencement occurs six months after lease commencement (accordingly there is gap rent until the space is delivered and free rent for six months thereafter). The borrower reserved $20,353,872 with the lender for outstanding amounts for tenant improvements and allowances and $2,127,815 for leasing commissions. In addition, the borrower provided a letter of credit in the amount of $8,462,091 for the tenant’s gap and free rent. In addition, the Archdiocese of New York was granted free rent for the first 3 months of each of the second through fifth lease years, which has not been reserved for. The lease provides for additional free rent if the lease commencement date does not occur by a specified date, as described under “Major Tenants-Archdiocese of New York” above. If the lease commencement date has not occurred prior to the date which is 2.5 years following the date final plans are approved by both landlord and tenant, subject to certain permitted delays, the tenant will have the right to terminate the lease, as described under “Major Tenants-Archdiocese of New York” above. |
| (4) | Shawmut, Group, Inc. has the right to terminate its lease on January 31, 2034, upon a minimum of twelve months prior notice and payment of a termination fee. Shawmut, Group Inc. has a free rent period for the months of September and October 2024, which has not been reserved for. |
| (5) | Shanholt Glassman Klein Kramer & Co. CPA’s P.C. has a one time right to terminate its lease on August 31, 2031 upon nine months prior written notice, and the payment of a termination fee. |
The following table presents certain information relating to the lease rollover schedule at the 488 Madison Property:
| Lease Rollover Schedule(1)(2) | ||||||||||
| Year Ending December 31 | Expiring Owned GLA | % of Owned GLA | Cumulative % of Owned GLA | U/W Base Rent | % of Total U/W Base Rent | U/W Base Rent $ per SF | # of Expiring Leases | |||
| MTM | 0 | 0.0% | 0.0 % | $0 | 0.0 | % | $0.00 | 0 | ||
| 2024 | 0 | 0.0% | 0.0% | $0 | 0.0 | % | $0.00 | 0 | ||
| 2025 | 45,321 | 9.4% | 9.4% | $2,907,025 | 11.1 | % | $64.14 | 8 | ||
| 2026 | 29,848 | 6.2% | 15.6% | $1,871,580 | 7.2 | % | $62.70 | 3 | ||
| 2027 | 58,511 | 12.2% | 27.8% | $4,344,186 | 16.6 | % | $74.25 | 4 | ||
| 2028 | 29,855 | 6.2% | 34.0% | $1,836,533 | 7.0 | % | $61.52 | 4 | ||
| 2029(3) | 9,099 | 1.9% | 35.9% | $1,861,105 | 7.1 | % | $204.54 | 4 | ||
| 2030 | 14,806 | 3.1% | 38.9% | $1,080,865 | 4.1 | % | $73.00 | 3 | ||
| 2031 | 2,766 | 0.6% | 39.5% | $610,428 | 2.3 | % | $220.69 | 1 | ||
| 2032 | 3,543 | 0.7% | 40.3% | $778,887 | 3.0 | % | $219.84 | 3 | ||
| 2033 | 31,807 | 6.6% | 46.9% | $1,993,517 | 7.6 | % | $62.68 | 3 | ||
| 2034 | 19,297 | 4.0% | 50.9% | $908,944 | 3.5 | % | $47.10 | 3 | ||
| 2035 & Thereafter | 169,323 | 35.2% | 86.1% | $7,906,763 | 30.3 | % | $46.70 | 2 | ||
| Vacant | 67,069 | 13.9% | 100.0% | NAP | NAP | $0.00 | 0 | |||
| Total / Wtd. Avg. | 481,245 | 100.0% | 100.0% | $26,099,833 | 100.0 | % | $63.02(4) | 38 | ||
| (1) | Information is based on the underwritten rent roll as of April 1, 2024. |
| (2) | Certain tenants may have lease termination options that are exercisable prior to the stated expiration date of the subject lease or leases which are not considered in the lease rollover schedule. |
| (3) | The 488 Madison Mortgage Loan matures on June 1, 2029. |
| (4) | Total/Wtd. Avg. Annual U/W Base Rent per SF excludes vacant space. |
| THE INFORMATION IN THIS STRUCTURAL AND COLLATERAL TERM SHEET IS NOT COMPLETE AND MAY BE AMENDED PRIOR TO THE TIME OF SALE. THIS TERM SHEET IS NOT AN OFFER TO SELL THESE SECURITIES AND IT IS NOT A SOLICITATION OF AN OFFER TO BUY THESE SECURITIES IN ANY JURISDICTION WHERE THE OFFER OR SALE IS NOT PERMITTED. | ||
| 113 | ||
Office – CBD 488 Madison Avenue New York, NY 10022
| Collateral Asset Summary – Loan No. 10 488 Madison | Cut-off Date Balance: Cut-off Date LTV: U/W NCF DSCR: U/W NOI Debt Yield: | $40,000,000 45.5% 1.94x 15.6% |
The following table presents certain information relating to the historical operating performance and the Underwritten Net Cash Flow at the 488 Madison Property:
| Cash Flow Analysis | ||||||
| 2022 | 2023 | 3/31/2024 TTM(2) | UW(2) | UW PSF | ||
| Gross Potential Rent(1) | $22,233,372 | $18,235,046 | $18,297,605 | $31,591,455 | $65.65 | |
| Reimbursements | $1,282,056 | $937,066 | $919,532 | $1,263,358 | $2.63 | |
| Other Income(3) | $111,478 | $236,948 | $266,841 | $107,846 | $0.22 | |
| Less Vacancy & Credit Loss | $0 | $0 | $0 | ($5,491,621) |
| ($11.41) |
| Effective Gross Income | $23,626,906 | $19,409,060 | $19,483,978 | $27,471,037 | $57.08 | |
| 0 | ||||||
| Real Estate Taxes | $5,937,468 | $6,070,856 | $6,070,856 | $4,421,120 | (4) | $9.19 |
| Insurance | $466,186 | $533,873 | $533,874 | $465,210 | $0.97 | |
| Other Expenses | $7,054,251 | $6,652,523 | $6,474,881 | $7,004,482 |
| $14.55 |
| Total Expenses | $13,457,905 | $13,257,252 | $13,079,611 | $11,890,811 | $24.71 | |
| 0 | ||||||
| Net Operating Income | $10,169,001 | $6,151,808 | $6,404,367 | $15,580,226 | $32.37 | |
| Capital Expenditures | $0 | $0 | $0 | $95,753 | $0.20 | |
| TI/LC | $0 | $0 | $0 | $1,973,196 |
| $4.10 |
| Net Cash Flow | $10,169,001 | $6,151,808 | $6,404,367 | $13,511,276 | $28.08 | |
| Occupancy %(5) | 78.3% | 67.9% | 86.1% | 82.6% | ||
| NOI DSCR(6) | 1.46x | 0.88x | 0.92x | 2.23x | ||
| NCF DSCR(6) | 1.46x | 0.88x | 0.92x | 1.94x | ||
| NOI Debt Yield(6) | 10.2% | 6.2% | 6.4% | 15.6% | ||
| NCF Debt Yield(6) | 10.2% | 6.2% | 6.4% | 13.5% | ||
| (1) | Based on the underwritten rent roll dated as of April 1, 2024 inclusive of contractual rent steps through April 1, 2025, totaling $424,778. |
| (2) | The increase in Gross Potential Rent and Net Operating Income from 3/31/2024 TTM to UW is primarily due to the underwriting of the Archdiocese of New York lease, as well as, in the case of Net Operating Income, the assumption regarding a tax exemption described in footnote (4) below. |
| (3) | Other Income includes antenna income and miscellaneous income. |
| (4) | UW Real Estate Taxes assumes the Archdiocese of New York’s leased space has obtained the tax exemption described under “Major Tenants—Archdiocese of New York.” UW Real Estate Taxes without the tax exemption would be $6,273,583, resulting in a NOI DSCR, NCF DSCR, NOI Debt Yield and NCF Debt Yield of 1.97x, 1.67x, 13.7% and 11.7%, respectively. |
| (5) | UW Occupancy represents economic occupancy; historical occupancies represent physical occupancies. 3/31/2024 TTM Occupancy is based on the rent roll dated as of April 1, 2024. |
| (6) | NOI and NCF debt service coverage ratios and debt yields are based on the aggregate Cut-off Date balance of the 488 Madison Whole Loan. |
Appraisals. According to the appraisal, the 488 Madison Property had an “As-Is Assuming ADNY Reserves” appraised value of $220,000,000 as of April 1, 2024.
Property Name | Appraised Value | Capitalization Rate |
| 488 Madison | $220,000,000(1) | 5.67% |
| (1) | The appraisal concluded to a “As-Is Assuming ADNY Reserves” value for the 488 Madison Property (as defined below) of $220,000,000 as of April 1, 2024, which assumes that the contractual obligations from the Archdiocese of New York lease (free rent, tenant improvements, leasing costs, and other capital expenditures) would be funded by a cash reserve held in escrow and that such reserved funds would be available for any potential purchase. At origination, $22,481,687 was deposited as shown above. The appraisal concluded to an “As-Is” appraised value of $180,000,000 as of April 1, 2024, resulting in a Cut-off Date LTV Ratio and Maturity Date LTV Ratio of 55.6%. In addition, the appraisal employs the extraordinary assumptions that the 488 Madison Property will be subdivided into condominiums and that the Archdiocese of New York unit real estate tax exemption will be granted, and that beginning March 1, 2025, real estate tax attributable to the space leased by the Archdiocese of New York (29.528% of the total real estate taxes) will be abated. |
Environmental Matters. According to the Phase I environmental report, dated April 2, 2024, there was no evidence of any recognized environmental conditions at the 488 Madison Property.
The Market. The 488 Madison Property is located within the Plaza District office submarket of the Midtown Manhattan office market, in New York, New York. The 488 Madison Property is situated on the western blockfront of Madison Avenue between East 51st Street and East 52nd Street, directly across from and overlooking the renowned New York City landmarks, St. Patrick’s Cathedral and The New York Palace Hotel, approximately 0.5 miles north of Grand Central Terminal and one-block east of Rockefeller Center. According to the appraisal, Fifth Avenue includes some of the most well-known shopping, particularly from 51st to 59th street, with stores including Saks Fifth Avenue, Cartier, Tiffany & Co., Gucci, Prada, Chanel, Louis Vuitton, Burberry’s and Hermes. In addition to these luxury retailers, the area houses various department stores, boutiques, jewelers, art galleries, antique shops, and gourmet food shops. The Plaza District
| THE INFORMATION IN THIS STRUCTURAL AND COLLATERAL TERM SHEET IS NOT COMPLETE AND MAY BE AMENDED PRIOR TO THE TIME OF SALE. THIS TERM SHEET IS NOT AN OFFER TO SELL THESE SECURITIES AND IT IS NOT A SOLICITATION OF AN OFFER TO BUY THESE SECURITIES IN ANY JURISDICTION WHERE THE OFFER OR SALE IS NOT PERMITTED. | ||
| 114 | ||
Office – CBD 488 Madison Avenue New York, NY 10022
| Collateral Asset Summary – Loan No. 10 488 Madison | Cut-off Date Balance: Cut-off Date LTV: U/W NCF DSCR: U/W NOI Debt Yield: | $40,000,000 45.5% 1.94x 15.6% |
neighborhood also features many of New York’s most famous tourist attractions and landmarks, including Grand Central Station, The Chrysler Building, The New York Public Library, Rockefeller Center, Radio City Music Hall and Carnegie Hall. Additionally, the Plaza District contains a number of first-class hotels such as the Four Seasons Hotel, Mandarin Oriental, Ritz Carlton, Park Hyatt, the United Nations Plaza Hotel and the New York Helmsley Hotel, as well as numerous more moderately priced hotels.
The neighborhood is serviced by public transportation, with the New York Metropolitan Transit Authority (“MTA”) operating several subway lines through the neighborhood including the A, B, C, D, E, F, N, R, Q, 1, 2, 3, 4, 5 and 6 trains. The MTA also operates several bus service routes along all the major north/south avenues. Crosstown bus service is provided by several bus lines along 57th Street and Central Park South. According to the appraisal, as of the fourth quarter of 2023, the vacancy rate in the Madison/Fifth Avenue Plaza District submarket was approximately 25.2% with average asking rents of $103.30 PSF and inventory of approximately 24.3 million SF. According to the appraisal, as of the fourth quarter of 2023, the vacancy rate in the Midtown Manhattan office market was approximately 22.3% with average asking rents of $78.23 PSF and inventory of approximately 263.1 million SF.
The Borrower and the Borrower Sponsor. The borrower is 488 Madison Avenue Associates LLC, a single-purpose Delaware limited liability company with two independent directors in its organizational structure. Legal counsel to the borrower delivered a non-consolidation opinion in connection with the origination of the 488 Madison Whole Loan. The borrower is controlled by Feil Family, LLC whose managing member is Jeffrey J. Feil, the non-recourse carveout guarantor. Jeffrey J. Feil is the chairman and current chief executive officer of The Feil Organization, the borrower sponsor. The Feil Organization is a full-service family-owned real estate investment, development, and property management firm. Founded by Louis Feil in 1950, The Feil Organization presently has a portfolio of 26 million square feet of retail and commercial properties, over 5,000 residential rental units, as well as hundreds of net leased properties and thousands of acres of undeveloped land across the country. Headquartered in Manhattan, the Feil Organization’s portfolio includes properties in New York, New Orleans, Florida, Connecticut, Illinois, and Washington D.C.
Property Management. The 488 Madison Property is managed by the Jeffrey Management Corp, an affiliate of the non-recourse carveout guarantor.
Initial and Ongoing Reserves. At origination, the 488 Madison Whole Loan documents require the borrower to deposit (i) $22,481,687 into an ADNY reserve, representing (a) $20,353,872 for tenant improvement costs and allowances (including $2,302,825 for base building work and $18,051,047 for tenant improvement work) and (b) $2,127,815 for leasing commissions, in each case for the Archdiocese of New York lease, (ii) $3,230,895 deposited into an upfront tax reserve, (iii) $585,399 into an upfront reserve, representing (a) $319,320 for tenant improvement costs and allowances and (b) $266,079 representing free and gap rent, in each case for the Alvarez & Marsal lease.
Tax Reserve – The 488 Madison Whole Loan documents require ongoing monthly deposits into a reserve for real estate taxes in an amount equal to 1/12th of the real estate taxes that the lender estimates will be payable during the next twelve months for the 488 Madison Property (initially estimated to be $538,482).
Insurance Reserve – The borrower is not required to make deposits into a reserve for insurance premiums for the 488 Madison Property so long as (i) the liability and casualty insurance policies covering the 488 Madison Property are part of a blanket or umbrella policy approved by the lender in its reasonable discretion, (ii) no event of default is continuing under the 488 Madison Whole Loan documents and (iii) the borrower provides the lender with evidence of renewal of such insurance policies no later than five days prior to their expiration and paid receipts for the insurance premiums no later than 10 days prior to their expiration. If such conditions are not satisfied, the 488 Madison Whole Loan documents provide for ongoing monthly deposits into a reserve for insurance premiums in an amount equal to 1/12th of the insurance premiums that the lender estimates will be payable for the renewal of coverage upon the expiration of the insurance policies.
Replacement Reserve – The 488 Madison Whole Loan documents provide for ongoing monthly deposits of $7,979 into a reserve for capital expenditures, provided that such deposits will not be required at any time the amount in such reserve is equal to or greater than $95,753.
TI/LC Reserve – The 488 Madison Whole Loan documents provide for ongoing monthly deposits of $112,153 into a reserve for future tenant improvement and leasing commission expenses, provided that such deposits will not be required at any time the amount in such reserve is equal to or greater than $2,691,664.
Archdiocese of New York Gap and Free Rent Reserves – A letter of credit in the amount of $8,462,091 was delivered in connection with the 488 Madison Whole Loan Documents, representing (i) $5,077,254 for gap rent and (ii) $3,384,836 for free rent, in each case for the Archdiocese of New York lease. At origination, the borrower provided a letter of credit for such reserve. The reserve does not cover the rent abatement during the first three full months occurring during the second through fifth lease year. The free rent is only for the first three months of the lease. Not more than once every 90 days, if the undrawn letter of credit is in excess of the amount required to be on deposit with the lender if borrower had delivered cash to the lender, the lender is required to reasonably cooperate with the borrower to amend the letter of credit such that it is not in excess of such amount.
| THE INFORMATION IN THIS STRUCTURAL AND COLLATERAL TERM SHEET IS NOT COMPLETE AND MAY BE AMENDED PRIOR TO THE TIME OF SALE. THIS TERM SHEET IS NOT AN OFFER TO SELL THESE SECURITIES AND IT IS NOT A SOLICITATION OF AN OFFER TO BUY THESE SECURITIES IN ANY JURISDICTION WHERE THE OFFER OR SALE IS NOT PERMITTED. | ||
| 115 | ||
Office – CBD 488 Madison Avenue New York, NY 10022
| Collateral Asset Summary – Loan No. 10 488 Madison | Cut-off Date Balance: Cut-off Date LTV: U/W NCF DSCR: U/W NOI Debt Yield: | $40,000,000 45.5% 1.94x 15.6% |
Condominium Reserve – The 488 Madison Whole Loan documents require that during any period that the condominium board for the 488 Madison Property is authorized to, and does, collect condominium assessments, the borrower is required to deposit an amount such that the lender is always holding an amount equal to 1/12 of the annual condominium charges (the “Condominium Reserve Monthly Deposit”); provided, that if a Cash Sweep Event Period (as defined below) is continuing, at the lender’s option the borrower is required to deposit the Condominium Reserve Monthly Deposit each month.
Lockbox / Cash Management. The 488 Madison Whole Loan is structured with a hard lockbox and in place cash management. The borrower is required to establish and maintain a lockbox account for the benefit of the lender, to direct all tenants to send all payments of rents at the 488 Madison Property directly into the lockbox account, and to deposit any funds received by the borrower or property manager into the lockbox account within two business day of receipt. On each business day, all funds in the lockbox account are required to be swept to the cash management account and, provided no event of default is continuing under the 488 Madison Whole Loan documents, applied on each monthly payment date: (i) to make the monthly deposits into the real estate tax reserve and insurance reserve, if any, as described above under “Initial and Ongoing Reserves,” (ii) to pay debt service on the 488 Madison Whole Loan, (iii) to make the monthly deposits into the replacement reserve, TI/LC reserve and condominium reserve, if any, as described above under “Initial and Ongoing Reserves,” (iv) to pay operating expenses set forth in the annual budget (which is required to be approved by the lender during a Cash Sweep Event Period) and lender-approved extraordinary expenses, and (v) to deposit all remaining amounts (“Excess Cash Flow”) into an excess cash flow reserve, to be held as additional security for the 488 Madison Whole Loan during such Cash Sweep Event Period, or if a Cash Sweep Event Period no longer exists, to be disbursed to the borrower.
“Cash Sweep Event Period” means a period:
| (i) | commencing upon an event of default under the 488 Madison Whole Loan documents, and ending upon the cure (if applicable) of such event of default; or |
| (ii) | commencing upon the debt service coverage ratio of the 488 Madison Whole Loan being less than 1.50x at the end of any calendar quarter and ending upon the earliest of (1) the date such debt service coverage ratio is equal to or greater than 1.50x for two consecutive calendar quarters, (2) the date the borrower deposits into an account with the lender an amount of cash which, if applied to prepay the 488 Madison Whole Loan, would result in the debt service coverage ratio being at least 1.50x (the “DSCR Cure Amount”) or (3) the date when the amount of Excess Cash Flow is at least equal to the DSCR Cure Amount; or |
| (iii) | commencing upon a Material Tenant Cash Sweep Event Period (as defined below) and ending upon either (1) the satisfaction of the Material Tenant Cure Conditions (as defined below) or (2) the borrower has re-let the entire Material Tenant Space (as defined below) (or applicable portion thereof) on terms and conditions acceptable to the lender and in accordance with the terms and conditions of the 488 Madison Whole Loan documents, and the tenant(s) under the replacement lease(s) are in occupancy of their leased space, open for business and paying full contractual rent. |
“Material Tenant” means (i) Archdiocese of New York and (ii) any other lessee of the Material Tenant Space.
“Material Tenant Space” means that portion of the 488 Madison Property leased as of the origination date to the initial Material Tenant. References to “applicable portions” of the Material Tenant Space refer to the portion of the Material Tenant Space demised pursuant to the applicable Material Tenant lease(s) entered into after the origination date in accordance with the applicable terms and conditions of the 488 Madison Whole Loan documents.
“Material Tenant Cash Sweep Event Period” means a period commencing upon the first to occur of (i) Material Tenant failing to be in actual, physical possession of the Material Tenant Space (or applicable portion thereof), failing to be open to the public for business during customary hours and/or “going dark” in the Material Tenant Space (or applicable portion thereof), in each case with respect to greater than 50% of the net leasable area of the Material Tenant Space, (ii) Material Tenant giving notice, or publicly announcing, that it is terminating its lease for all or with respect to greater than 50% of the rentable portion of the Material Tenant Space (or applicable portion thereof), (iii) any termination or cancellation of any Material Tenant lease (including, without limitation, rejection in any bankruptcy or similar insolvency proceeding) and/or any Material Tenant lease failing to otherwise be in full force and effect, or (iv) any bankruptcy or similar insolvency of Material Tenant.
Current Mezzanine or Secured Subordinate Indebtedness. None.
Permitted Future Mezzanine or Secured Subordinate Indebtedness. Not Permitted.
Release of Collateral. Not Permitted.
Ground Lease. None
| THE INFORMATION IN THIS STRUCTURAL AND COLLATERAL TERM SHEET IS NOT COMPLETE AND MAY BE AMENDED PRIOR TO THE TIME OF SALE. THIS TERM SHEET IS NOT AN OFFER TO SELL THESE SECURITIES AND IT IS NOT A SOLICITATION OF AN OFFER TO BUY THESE SECURITIES IN ANY JURISDICTION WHERE THE OFFER OR SALE IS NOT PERMITTED. | ||
| 116 | ||
Mixed Use – Office/Lab 6210 and 6230 Stoneridge Mall Road
| Collateral Asset Summary – Loan No. 11 Pleasanton Corporate | Cut-off Date Balance: Cut-off Date LTV: U/W NCF DSCR: U/W NOI Debt Yield: | $37,100,000 59.6% 1.49x 12.9% |
| Mortgage Loan Information | Property Information | |||
| Loan Seller: | CREFI | Single Asset / Portfolio: | Single Asset | |
| Loan Purpose: | Acquisition | Property Type - Subtype: | Mixed Use - Office/Lab | |
| Borrower Sponsor(s): | Rohit Kumar and Jayaprasad Vejendla | Collateral: | Fee | |
| Borrower(s): | PCC Stoneridge I LLC and RSPCC I LLC | Location: | Pleasanton, CA | |
| Original Balance(1): | $37,100,000 | Year Built / Renovated: | 2001 / 2023 | |
| Cut-off Date Balance(1): | $37,100,000 | Property Management: | G&E Real Estate Management Services, Inc. | |
| % by Initial UPB: | 3.7% | Size: | 295,306 SF | |
| Interest Rate: | 7.78000% | Appraised Value / Per SF: | $110,400,000 / $374 | |
| Note Date: | May 6, 2024 | Appraisal Date: | January 9, 2024 | |
| Original Term: | 60 months | Occupancy: | 100.0% (as of July 6, 2024) | |
| Amortization: | Interest Only | UW Economic Occupancy: | 95.0% | |
| Original Amortization: | NAP | Underwritten NOI(4): | $8,480,059 | |
| Interest Only Period: | 60 months | Underwritten NCF: | $7,727,029 | |
| First Payment Date: | June 6, 2024 | |||
| Maturity Date: | May 6, 2029 | Historical NOI | ||
| Additional Debt Type(1): | Pari Passu | Most Recent NOI(4): | $7,414,565 (TTM March 31, 2024) | |
| Additional Debt Balance(1): | $28,700,000 | 2022 NOI: | $6,952,895 | |
| Call Protection: | L(26),D(30),O(4) | 2021 NOI: | $4,836,820 | |
| Lockbox / Cash Management: | Springing / Springing | 2020 NOI: | $4,454,320 | |
| Reserves | Financial Information(1) | ||||||
| Initial | Monthly | Cap | Cut-off Date Loan Per SF: | $223 | |||
| Taxes(2): | $0 | Springing | NAP | Maturity Date Loan Per SF: | $223 | ||
| Insurance(2): | $0 | Springing | NAP | Cut-off Date LTV: | 59.6% | ||
| Replacement Reserves: | $0 | $4,922 | NAP | Maturity Date LTV: | 59.6% | ||
| TI/LC(2): | $0 | Springing | NAP | UW NOI DY: | 12.9% | ||
| Deferred Maintenance: | $8,750 | $0 | NAP | UW NCF DSCR: | 1.49x | ||
| Other(3): | $26,890 | Springing | $8,250,000 | ||||
| Sources and Uses | ||||||||
| Sources | Proceeds | % of Total | Uses | Proceeds | % of Total | |||
| Whole Loan(1) | $65,800,000 | 61.8 | % | Purchase Price | $105,300,000 | 98.9 | % | |
| Borrower Sponsor Equity | 40,724,498 | 38.2 | Closing Costs | 1,188,858 | 1.1 | |||
| Upfront Reserves | 35,640 | 0.0 | ||||||
| Total Sources | $106,524,498 | 100.0 | % | Total Uses | $106,524,498 | 100.0 | % | |
| (1) | The Pleasanton Corporate Commons mortgage loan is part of a whole loan evidenced by four pari passu notes with an aggregate outstanding principal balance as of the Cut-off Date of $65,800,000 (the “Pleasanton Corporate Commons Whole Loan”). The Financial Information in the chart above reflects the Pleasanton Corporate Commons Whole Loan. The Pleasanton Corporate Commons Whole Loan was co-originated by Citi Real Estate Funding Inc. and Bank of America, National Association. |
| (2) | According to the Pleasanton Corporate Commons Whole Loan documents, the monthly deposits for taxes will be waived as long as (i) no Trigger Period (as defined below) is continuing and (ii) the sole tenant, 10x Genomics, Inc., pays taxes directly and provides evidence of payment. Monthly deposits for insurance are waived as long as the borrower maintains a blanket policy for the Pleasanton Corporate Commons property. The borrower is required to deposit $57,830.77 into a TI/LC reserve on each monthly payment date that a Trigger Period is continuing. A “Trigger Period” means a period (A) commencing upon (i) the occurrence of an event of default, (ii) the debt service coverage ratio falling below 1.10x, (iii) the sole tenant, 10x Genomics, Inc., defaulting under its lease, failing to be in actual, physical possession of its space, “going dark”, giving notice of lease termination, filing for bankruptcy or giving notice of relocation of its headquarters, and (B) ending upon the cure of the applicable trigger conditions in accordance with the Pleasanton Corporate Commons Whole Loan agreement. |
| (3) | Initial Other Reserve represents a Prepaid Rent Reserve ($26,889.94) for prepaid rent received by the borrower from 6210 Stoneridge Mall Drive Solar Project 2021, LLC. Springing Monthly Other Reserve deposits represents a 10x Genomics Renewal Reserve, for which the borrower will be required to deposit $460,000 during a 10x Genomics Renewal Reserve Trigger Event (as defined herein), subject to a cap of $8,250,000. A “10x Genomics Renewal Reserve Trigger Event” means that as of the earlier to occur of (i) 13 months prior to the loan maturity date and (ii) 18 months prior to the expiration of the 10x Genomics, Inc. lease at the 6230 building, the lender has not received a notice of renewal of the lease at the 6230 building from 10x Genomics, Inc. for at least a three-year extension. |
| (4) | The increase from Most Recent NOI to Underwritten NOI is primarily attributable to contractual rent steps and the commencement of one new lease with 10x Genomics, Inc. in July 2023 for 31,030 square feet and $1,325,602 of underwritten base rent. In addition, expenses were reduced due to removal of the escalators and new security and landscaping contracts. |
| THE INFORMATION IN THIS STRUCTURAL AND COLLATERAL TERM SHEET IS NOT COMPLETE AND MAY BE AMENDED PRIOR TO THE TIME OF SALE. THIS TERM SHEET IS NOT AN OFFER TO SELL THESE SECURITIES AND IT IS NOT A SOLICITATION OF AN OFFER TO BUY THESE SECURITIES IN ANY JURISDICTION WHERE THE OFFER OR SALE IS NOT PERMITTED. | ||
| 117 | ||
Mixed Use – Office/Lab 6210 and 6230 Stoneridge Mall Road
| Collateral Asset Summary – Loan No. 11 Pleasanton Corporate | Cut-off Date Balance: Cut-off Date LTV: U/W NCF DSCR: U/W NOI Debt Yield: | $37,100,000 59.6% 1.49x 12.9% |
The table below identifies the promissory notes that comprise the Pleasanton Corporate Commons Whole Loan. The relationship between the holders of the Pleasanton Corporate Commons Whole Loan is governed by a co-lender agreement as described under “Description of the Mortgage Pool—The Whole Loans—The Serviced Pari Passu Whole Loans” in the Preliminary Prospectus. The Pleasanton Corporate Commons Whole Loan will be serviced pursuant to the Benchmark 2024-V8 pooling and servicing agreement. See “Pooling and Servicing Agreement” in the Preliminary Prospectus.
| Whole Loan Summary | ||||
| Note | Original Balance | Cut-off Date Balance | Note Holder | Controlling Piece |
| A-1 | $25,000,000 | $25,000,000 | Benchmark 2024-V8 | Yes |
| A-2 | $12,100,000 | $12,100,000 | Benchmark 2024-V8 | No |
| A-3 | $20,000,000 | $20,000,000 | BANK5 2024-5YR7 | No |
| A-4 | $8,700,000 | $8,700,000 | BANK5 2024-5YR7 | No |
| Whole Loan | $65,800,000 | $65,800,000 | ||
The following table presents certain information relating to the major tenants at the Pleasanton Corporate Commons property:
| Tenant Summary(1) | |||||||||||
| Tenant | Credit Rating (Moody’s/S&P/Fitch) | Net Rentable Area (SF) | % of Net Rentable Area | U/W Base Rent | U/W Base Rent Per SF | % of Total U/W Base Rent | Lease Expiration | Termination Option (Y/N) | Renewal Options | ||
| 10x Genomics, Inc. | NR / NR / NR | 150,151 | 50.8 | % | $6,216,251 | $41.40 | 50.4 | % | 9/30/2029 | N | 2 x 5 Yr |
| 10x Genomics, Inc.(2) | NR / NR / NR | 145,155 | 49.2 | 6,125,696 | $42.20(3) | 49.6 | 6/30/2033 | N | 2 x 5 Yr | ||
| Total Occupied | 295,306 | 100.0 | % | $12,341,948 | $41.79 | 100.0 | % | ||||
| Vacant | 0 | 0.0 | |||||||||
| Total | 295,306 | 100.0 | % | ||||||||
| (1) | Based on the underwritten rent roll dated July 6, 2024 inclusive of rent steps through January 1, 2025. |
| (2) | A portion of the 2nd floor space at the 6210 building is currently subleased. A total of 16,601 square feet (5.6% of net rentable area) of the 31,030 square foot floor plate is subleased to two separate tenants. Suite 250 consists of 9,419 square feet and is currently subleased to Bright Pattern Inc. from May 1, 2023 to July 31, 2026 at a current rental rate of $27.00 per square foot. Suite 240 consists of 7,182 square feet and is currently subleased to MH SUB I, LLC from October 16, 2023 to October 31, 2026 at a current rental rate of $26.40 per square foot. |
| (3) | Represents weighted average UW Rent PSF for floor plates ranging between 9,183 square feet to 31,030 square feet. |
| THE INFORMATION IN THIS STRUCTURAL AND COLLATERAL TERM SHEET IS NOT COMPLETE AND MAY BE AMENDED PRIOR TO THE TIME OF SALE. THIS TERM SHEET IS NOT AN OFFER TO SELL THESE SECURITIES AND IT IS NOT A SOLICITATION OF AN OFFER TO BUY THESE SECURITIES IN ANY JURISDICTION WHERE THE OFFER OR SALE IS NOT PERMITTED. | ||
| 118 | ||
Mixed Use – Office/Lab 6210 and 6230 Stoneridge Mall Road
| Collateral Asset Summary – Loan No. 11 Pleasanton Corporate | Cut-off Date Balance: Cut-off Date LTV: U/W NCF DSCR: U/W NOI Debt Yield: | $37,100,000 59.6% 1.49x 12.9% |
The following table presents certain information relating to the lease rollover schedule at the Pleasanton Corporate Commons property:
| Lease Rollover Schedule(1) | |||||||||
| Year Ending December 31 | Expiring Owned GLA | % of Owned GLA | Cumulative % of Owned GLA | UW Base Rent | % of Total UW Base Rent | UW Base Rent $ per SF | # of Expiring Leases | ||
| MTM | 0 | 0.0 | % | 0.0% | $0 | 0.0 | % | $0.00 | 0 |
| 2024 | 0 | 0.0 | 0.0% | 0 | 0.0 | $0.00 | 0 | ||
| 2025 | 0 | 0.0 | 0.0% | 0 | 0.0 | $0.00 | 0 | ||
| 2026 | 0 | 0.0 | 0.0% | 0 | 0.0 | $0.00 | 0 | ||
| 2027 | 0 | 0.0 | 0.0% | 0 | 0.0 | $0.00 | 0 | ||
| 2028 | 0 | 0.0 | 0.0% | 0 | 0.0 | $0.00 | 0 | ||
| 2029 | 150,151 | 50.8 | 50.8% | 6,216,251 | 50.4 | $41.40 | 1 | ||
| 2030 | 0 | 0.0 | 50.8% | 0 | 0.0 | $0.00 | 0 | ||
| 2031 | 0 | 0.0 | 50.8% | 0 | 0.0 | $0.00 | 0 | ||
| 2032 | 0 | 0.0 | 50.8% | 0 | 0.0 | $0.00 | 0 | ||
| 2033 | 145,155 | 49.2 | 100.0% | 6,125,696 | 49.6 | $42.20 | 1 | ||
| 2034 | 0 | 0.0 | 100.0% | 0 | 0.0 | $0.00 | 0 | ||
| 2035 & Thereafter | 0 | 0.0 | 100.0% | 0 | 0.0 | $0.00 | 0 | ||
| Vacant | 0 | 0.0 | 100.0% | NAP | NAP | NAP | NAP | ||
| Total / Wtd. Avg. | 295,306 | 100.0 | % | $12,341,948 | 100.0 | % | $41.79 | 2 | |
| (1) | Information is based on the underwritten rent roll dated July 6, 2024 inclusive of rent steps through January 1, 2025. 10x Genomics, Inc. took occupancy at the 6230 building in April 2019 and signed the lease in the 6210 building in 2020 and gradually took occupancy between 2021-2023 on a rolling basis as space became available. Its lease at the 6230 building expires in September 2029 and its lease at the 6210 building expires in June 2033. |
| THE INFORMATION IN THIS STRUCTURAL AND COLLATERAL TERM SHEET IS NOT COMPLETE AND MAY BE AMENDED PRIOR TO THE TIME OF SALE. THIS TERM SHEET IS NOT AN OFFER TO SELL THESE SECURITIES AND IT IS NOT A SOLICITATION OF AN OFFER TO BUY THESE SECURITIES IN ANY JURISDICTION WHERE THE OFFER OR SALE IS NOT PERMITTED. | ||
| 119 | ||
Mixed Use – Office/Lab 6210 and 6230 Stoneridge Mall Road
| Collateral Asset Summary – Loan No. 11 Pleasanton Corporate | Cut-off Date Balance: Cut-off Date LTV: U/W NCF DSCR: U/W NOI Debt Yield: | $37,100,000 59.6% 1.49x 12.9% |
The following table presents certain information relating to the historical operating performance and Underwritten Net Cash Flow at the Pleasanton Corporate Commons property:
| Cash Flow Analysis(1)(2) | |||||||
| 2020 | 2021 | 2022 | 2023 | TTM 3/31/2024 | U/W | U/W Per SF | |
| Base Rent | $6,733,610 | $7,841,410 | $8,337,343 | $10,506,102 | $10,949,181 | $11,969,563 | $40.53 |
| Contractual Rent Steps(3) | 0 | 0 | 0 | 0 | 0 | 372,385 | $1.26 |
| Gross Potential Rent | $6,733,610 | $7,841,410 | $8,337,343 | $10,506,102 | $10,949,181 | $12,341,948 | $41.79 |
| Reimbursements | 730,874 | 1,199,787 | 2,217,641 | 2,508,489 | 2,673,757 | 2,335,576 | $7.91 |
| Other Income | 13,813 | 14,260 | 15,100 | 35,060 | 46,688 | 92,785 | $0.31 |
| Total Gross Income | $7,478,297 | $9,055,457 | $10,570,084 | $13,049,651 | $13,669,626 | $14,770,310 | $50.02 |
| (Vacancy / Credit Loss) | 0 | 0 | 0 | 0 | 0 | (733,876) | ($2.49) |
| Effective Gross Income | $7,478,297 | $9,055,457 | $10,570,084 | $13,049,651 | $13,669,626 | $14,036,433 | $47.53 |
| Management Fee | 224,349 | 271,664 | 317,103 | 391,490 | 410,089 | 421,093 | $1.43 |
| Real Estate Taxes | 1,222,952 | 1,238,766 | 1,271,245 | 1,342,091 | 1,335,952 | 1,244,003 | $4.21 |
| Insurance | 181,436 | 220,555 | 259,475 | 449,072 | 508,418 | 159,375 | $0.54 |
| Other Expenses(4) | 2,342,375 | 2,870,152 | 3,885,441 | 3,914,103 | 4,000,602 | 3,731,903 | $12.64 |
| Total Expenses | $3,971,112 | $4,601,137 | $5,733,264 | $6,096,756 | $6,255,061 | $5,556,374 | $18.82 |
| Net Operating Income | $3,507,185 | $4,454,320 | $4,836,820 | $6,952,895 | $7,414,565 | $8,480,059 | $28.72 |
| Capital Expenditures | 0 | 0 | 0 | 0 | 0 | 59,061 | $0.20 |
| TI/LC | 0 | 0 | 0 | 0 | 0 | 693,969 | $2.35 |
| Net Cash Flow | $3,507,185 | $4,454,320 | $4,836,820 | $6,952,895 | $7,414,565 | $7,727,029 | $26.17 |
| Occupancy (%) | 100.0% | 100.0% | 100.0% | 100.0% | 100.0% | 95.0%(5) | |
| NCF DSCR(6) | 0.68x | 0.86x | 0.93x | 1.34x | 1.43x | 1.49x | |
| NOI Debt Yield(6) | 5.3% | 6.8% | 7.4% | 10.6% | 11.3% | 12.9% | |
| (1) | Based on the underwritten rent roll as of July 6, 2024. 10x Genomics, Inc. took occupancy at the 6230 building in April 2019 and signed the lease in the 6210 building in 2020 and gradually took occupancy between 2021-2023 on a rolling basis as space became available. |
| (2) | The increase from TTM 3/31/2024 NOI to U/W NOI is primarily attributable to contractual rent steps and the commencement of one new lease with 10x Genomics, Inc. in July 2023 for 31,030 square feet and $1,325,602 of underwritten base rent. In addition, expenses were reduced due to removal of the escalators and new security and landscaping contracts. |
| (3) | Inclusive of rent steps through January 1, 2025. |
| (4) | Other Expenses include cleaning, repairs and maintenance, utilities, general and administrative, tenant direct billed utilities and tenant specific direct bills. |
| (5) | Represents economic occupancy. |
| (6) | Based on the Pleasanton Corporate Commons Whole Loan. |
| THE INFORMATION IN THIS STRUCTURAL AND COLLATERAL TERM SHEET IS NOT COMPLETE AND MAY BE AMENDED PRIOR TO THE TIME OF SALE. THIS TERM SHEET IS NOT AN OFFER TO SELL THESE SECURITIES AND IT IS NOT A SOLICITATION OF AN OFFER TO BUY THESE SECURITIES IN ANY JURISDICTION WHERE THE OFFER OR SALE IS NOT PERMITTED. | ||
| 120 | ||
Multifamily – Various Various East Orange, NJ 07018
| Collateral Asset Summary – Loan No. 12 Lotus 315 & Essence 144 | Cut-off Date Balance: Cut-off Date LTV: U/W NCF DSCR: U/W NOI Debt Yield: | $36,100,000 69.6% 1.23x 8.1% |
| Mortgage Loan Information | Property Information | |||
| Loan Seller: | CREFI | Single Asset / Portfolio: | Portfolio | |
| Loan Purpose: | Refinance | Property Type – Subtype(4): | Multifamily - Various | |
| Borrower Sponsor(s): | Syed A. Hasan and Ayesha Wahidy | Collateral: | Fee | |
| Borrower(s): | 315 Urban Renewal Limited Liability Company and Essence 144 Urban Renewal LLC | Location: | East Orange, NJ | |
| Original Balance(1): | $36,100,000 | Year Built / Renovated(5): | Various / NAP | |
| Cut-off Date Balance(1): | $36,100,000 | Property Management: | Blackstone Realty Management LLC | |
| % by Initial UPB: | 3.6% | Size: | 336 Units | |
| Interest Rate: | 6.42000% | Appraised Value / Per Unit(6): | 123,700,000 / $368,155 | |
| Note Date: | June 3, 2024 | Appraisal Date(6): | Various | |
| Original Term: | 60 months | Occupancy: | 96.4% (as of June 1, 2024) | |
| Amortization: | Interest Only | UW Economic Occupancy: | 95.0% | |
| Original Amortization: | NAP | Underwritten NOI(7): | $6,971,402 | |
| Interest Only Period: | 60 months | Underwritten NCF: | $6,867,456 | |
| First Payment Date: | July 6, 2024 | |||
| Maturity Date: | June 6, 2029 | Historical NOI(2) | ||
| Additional Debt Type(1): | Pari Passu | Most Recent NOI(7): | $5,870,649 (TTM April 30, 2024) | |
| Additional Debt Balance(1): | $50,000,000 | 2023 NOI: | $5,659,568 | |
| Call Protection(2): | L(25),D(28),O(7) | 2022 NOI: | $5,603,876 | |
| Lockbox / Cash Management: | Springing / Springing | 2021 NOI: | NAV | |
| Reserves | Financial Information(1) | ||||||
| Initial | Monthly | Cap | Cut-off Date Loan / Unit: | $256,250 | |||
| Taxes: | $116,278 | $58,139 | NAP | Maturity Date Loan / Unit: | $256,250 | ||
| Insurance: | $38,489 | $6,415 | NAP | Cut-off Date LTV(6): | 69.6% | ||
| Replacement Reserves: | $0 | $8,537 | NAP | Maturity Date LTV(6): | 69.6% | ||
| TI / LC: | $0 | $1,350 | NAP | UW NOI DY: | 8.1% | ||
| Other(3): | $1,225,000 | $0 | NAP | UW NCF DSCR: | 1.23x | ||
| Sources and Uses | |||||||
| Sources | Proceeds | % of Total | Uses | Proceeds | % of Total | ||
| Whole Loan | $86,100,000 | 100.0% | Loan Payoff | $78,827,137 | 91.6 | % | |
| Closing Costs(8) | 4,010,102 | 4.7 | |||||
| Borrower Sponsor Equity | 1,882,994 | 2.2 | |||||
| Upfront Reserves | 1,379,767 | 1.6 | |||||
| Total Sources | $86,100,000 | 100.0% | Total Uses | $86,100,000 | 100.0 | % | |
| (1) | The Lotus 315 & Essence 144 mortgage loan is part of a whole loan evidenced by two pari passu promissory notes with an aggregate outstanding principal balance as of the Cut-off Date of $86,100,000 (the “Lotus 315 & Essence 144 Whole Loan”). The Financial Information in the chart above is based on the Lotus 315 & Essence 144 Whole Loan. |
| (2) | The lockout period will be at least 25 payment dates beginning with and including the first payment date on July 6, 2024. Defeasance of the Lotus 315 & Essence 144 Whole Loan in full is permitted at any time after the earlier to occur of (i) June 3, 2027 or (ii) the date that is two years from the closing date of the securitization that includes the last pari passu note to be securitized. The assumed lockout period of 25 payments is based on the expected Benchmark 2024-V8 securitization closing date in July 2024. The actual lockout period may be longer. |
| (3) | Other Reserves include an initial (i) upfront holdback reserve of $1,000,000, (ii) upfront free rent reserve of $141,750 in connection with the rent abatement periods attributable to the buildout of the ground floor retail space at the Lotus 315 property leased by Sihana LLC and (iii) upfront gap rent reserve of $83,250 in connection with the buildout of the ground floor retail spaces at the Lotus 315 property. The holdback reserve may be disbursed in up to four increments upon (a) no event of default existing and (b) the lender has received evidence, in form and substance reasonably satisfactory to the lender, that the unadjusted net operating income debt yield (calculated as set forth in the Lotus 315 & Essence 144 Whole Loan documents and after giving effect to the release) equals or exceeds 8.15%. In the event that the borrower has not satisfied the conditions to the disbursement of all funds in the holdback reserve on or prior to the date which is 36 months after the origination of the Lotus 315 & Essence 144 Whole Loan, the lender will have the right to, in the lender’s sole discretion, retain the holdback reserve funds thereafter as collateral, and the borrower will have no further right to obtain the release thereof. |
| (4) | The Lotus 315 property is a seven-story mid-rise multifamily property. The Essence 144 property is a 12-story high-rise multifamily property. |
| (5) | See “Portfolio Summary” below. |
| (6) | Appraised Value represents the aggregate appraised value of the Lotus 315 property and the Essence 144 property. The Appraised Value for the Lotus 315 property represents the “prospective market value upon stabilization” of $73,200,000 as of October 1, 2024 which includes value attributable to the renovated commercial units at the Lotus 315 property. The Appraised Value for the Essence 144 property represents the “as is” value of $50,500,000 as of April 23, 2024. The aggregate “as is” value for the Lotus 315 & Essence 144 properties is $122,200,000 which results in a Cut-off Date LTV and Maturity Date LTV of 70.5% |
| (7) | The increase from Most Recent NOI to Underwritten NOI is primarily attributable to commercial rental income of $602,244 at the Lotus 315 property. The borrower sponsor recently executed leases with two retail tenants for $427,500 and converted another retail unit into 160 self-storage units which were 41.6% economically occupied as of June 13, 2024. The tenant Sihana LLC, which accounts for 64.8% of the retail net rentable area at the Lotus 315 property, was in a 100% rent abatement period through June 30, 2024, and is in a 50% rent abatement period beginning on July 1, 2024 and ending on September 30, 2024, and a 25% rent abatement period beginning on October 1, 2024 and ending on March 31, 2025. The tenant Bernard Jackson Art Gallery, which accounts for 35.2% of the retail net rentable area at the Lotus 315 property, is in a gap rent period through September 6, 2024. |
| (8) | Closing Costs include a rate buydown fee of $3,271,800. |
| THE INFORMATION IN THIS STRUCTURAL AND COLLATERAL TERM SHEET IS NOT COMPLETE AND MAY BE AMENDED PRIOR TO THE TIME OF SALE. THIS TERM SHEET IS NOT AN OFFER TO SELL THESE SECURITIES AND IT IS NOT A SOLICITATION OF AN OFFER TO BUY THESE SECURITIES IN ANY JURISDICTION WHERE THE OFFER OR SALE IS NOT PERMITTED. | ||
| 121 | ||
Multifamily – Various Various East Orange, NJ 07018
| Collateral Asset Summary – Loan No. 12 Lotus 315 & Essence 144 | Cut-off Date Balance: Cut-off Date LTV: U/W NCF DSCR: U/W NOI Debt Yield: | $36,100,000 69.6% 1.23x 8.1% |
The table below identifies the promissory notes that comprise the Lotus 315 & Essence 144 Whole Loan. The relationship between the holders of the Lotus 315 & Essence 144 Whole Loan is governed by a co-lender agreement as described under “Description of the Mortgage Pool—The Whole Loans—The Serviced Pari Passu Whole Loans” and “—The Non-Serviced Pari Passu Whole Loans” in the Preliminary Prospectus. The Lotus 315 & Essence 144 Whole Loan will initially be serviced pursuant to the Benchmark 2024-V8 pooling and servicing agreement; however, following the securitization of the controlling Note A-1, the Lotus 315 & Essence 144 Whole Loan will be serviced pursuant to the pooling and servicing agreement for such securitization. See “The Pooling and Servicing Agreement—Servicing of the Servicing Shift Mortgage Loans” in the Preliminary Prospectus.
| Whole Loan Summary | ||||
| Note | Original Balance | Cut-off Date Balance | Note Holder | Controlling Piece |
| A-1(1) | $50,000,000 | $50,000,000 | CREFI | Yes |
| A-2 | 36,100,000 | 36,100,000 | Benchmark 2024-V8 | No |
| Whole Loan | $86,100,000 | $86,100,000 | ||
| (1) | Expected to be contributed to one or more future securitizations. |
The following table presents certain information relating to the Lotus 315 & Essence 144 properties:
| Portfolio Summary | |||||||||
| Property Name | Address | Year Built / Renovated(2) | Units(1) | Occ. %(1) | Allocated Whole Loan Amounts | Appraised Value(2) | UW NOI(1) | % of UW NOI(1) | |
| Lotus 315 | 315 South Harrison Street, East Orange, NJ | 2019 / NAP | 180 | 95.6% | $50,850,000 | $73,200,000(3) | $4,102,999 | 58.9 | % |
| Essence 144 | 144 South Harrison Street, East Orange, NJ | 2017 / NAP | 156 | 97.4% | 35,250,000 | 50,500,000 | 2,868,403 | 41.1 | |
| Total / Wtd. Avg. | 336 | 96.4% | $86,100,000 | $123,700,000 | $6,971,402 | 100.0 | % | ||
| (1) | Based on the underwritten rent rolls dated June 1, 2024. |
| (2) | Source: Appraisals. |
| (3) | The Appraised Value for the Lotus 315 property represents the “prospective market value upon stabilization” as of October 1, 2024. The “as is” value is $71,700,000 as of April 23, 2024. |
The following table presents certain information relating to the unit mix at the Lotus 315 property:
| Unit Mix(1) | ||||||||
| Unit Type | # of Units | % of Total Units | Occupancy | Average Unit Size (Sq. Ft.) | Average Monthly Rent Per Unit | Average Monthly Market Rent Per Unit(2) | ||
| Studio | 12 | 6.7 | % | 91.7 | % | 560 | $1,604 | $1,700 |
| 1 BR/1BA | 129 | 71.7 | 95.3 | 821 | $2,038 | $2,069 | ||
| 2BR/2BA | 39 | 21.7 | 97.4 | 1,122 | $2,534 | $2,690 | ||
| Total / Wtd Avg. | 180 | 100.0 | % | 95.6 | % | 869 | $2,120 | $2,179 |
| (1) | Based on the underwritten rent roll dated June 1, 2024. Average Monthly Rent Per Unit is based on occupied units. |
| (2) | Source: Appraisal. |
The following table presents certain information relating to the unit mix at the Essence 144 property:
| Unit Mix(1) | ||||||||
| Unit Type | # of Units | % of Total Units | Occupancy | Average Unit Size (Sq. Ft.) | Average Monthly Rent Per Unit | Average Monthly Market Rent Per Unit(2) | ||
| Studio | 26 | 16.7 | % | 100.0 | % | 589 | $1,700 | $1,654 |
| 1 BR/1BA | 108 | 69.2 | 98.1 | 818 | $1,950 | $1,971 | ||
| 2BR/2BA | 22 | 14.1 | 90.9 | 1,101 | $2,469 | $2,709 | ||
| Total / Wtd Avg. | 156 | 100.0 | % | 97.4 | % | 820 | $1,976 | $2,022 |
| (1) | Based on the underwritten rent roll dated June 1, 2024. Average Monthly Rent Per Unit is based on occupied units. |
| (2) | Source: Appraisal. |
| THE INFORMATION IN THIS STRUCTURAL AND COLLATERAL TERM SHEET IS NOT COMPLETE AND MAY BE AMENDED PRIOR TO THE TIME OF SALE. THIS TERM SHEET IS NOT AN OFFER TO SELL THESE SECURITIES AND IT IS NOT A SOLICITATION OF AN OFFER TO BUY THESE SECURITIES IN ANY JURISDICTION WHERE THE OFFER OR SALE IS NOT PERMITTED. | ||
| 122 | ||
Multifamily – Various Various East Orange, NJ 07018
| Collateral Asset Summary – Loan No. 12 Lotus 315 & Essence 144 | Cut-off Date Balance: Cut-off Date LTV: U/W NCF DSCR: U/W NOI Debt Yield: | $36,100,000 69.6% 1.23x 8.1% |
The following table presents certain information relating to the historical operating performance and Underwritten Net Cash Flow at the Lotus 315 & Essence 144 properties:
| Cash Flow Analysis(1) | |||||
| 2022 | 2023 | TTM 4/30/2024(2) | U/W(2) | U/W Per Unit | |
| Base Rent | $7,436,978 | $7,432,770 | $7,585,109 | $7,979,066 | $23,747 |
| Potential Income from Vacant Units | 0 | 0 | 0 | 313,968 | $934 |
| Commercial Rental Income | 0 | 0 | 0 | 602,244 | $1,792 |
| Potential Income from Vacant Commercial Space | 0 | 0 | 0 | 157,019 | $467 |
| Gross Potential Rent | $7,436,978 | $7,432,770 | $7,585,109 | $9,052,296 | $26,941 |
| Other Income(3) | 610,121 | 715,447 | 762,211 | 967,730 | $2,880 |
| Net Rental Income | $8,047,099 | $8,148,217 | $8,347,320 | $10,020,027 | $29,822 |
| Vacancy Residential | (93,825) | (98,312) | (97,925) | (414,652) | ($1,234) |
| Vacancy Commercial | 0 | 0 | 0 | (181,544) | ($540) |
| Effective Gross Income | $7,953,274 | $8,049,905 | $8,249,395 | $9,423,831 | $28,047 |
| Management Fee | 318,475 | 322,717 | 331,644 | 282,715 | $841 |
| Real Estate Taxes(4) | 683,502 | 751,025 | 817,119 | 1,006,409 | $2,995 |
| Insurance | 142,598 | 155,255 | 154,109 | 148,465 | $442 |
| Other Expenses(5) | 1,204,824 | 1,161,341 | 1,075,875 | 1,014,841 | $3,020 |
| Total Expenses | 2,349,398 | 2,390,337 | 2,378,747 | 2,452,429 | $7,299 |
| Net Operating Income | $5,603,876 | $5,659,568 | $5,870,649 | $6,971,402 | $20,748 |
| Replacement Reserves | $0 | $0 | $0 | $87,746 | $261 |
| TI/LC | 0 | 0 | 0 | 16,200 | $48 |
| Net Cash Flow | $5,603,876 | $5,659,568 | $5,870,649 | $6,867,456 | $20,439 |
| Occupancy | 92.7% | 91.6% | 93.2% | 95.0%(6) | |
| NCF DSCR(7) | 1.00x | 1.01x | 1.05x | 1.23x | |
| NOI Debt Yield(7) | 6.5% | 6.6% | 6.8% | 8.1% | |
| (1) | Based on the underwritten rent roll as of June 1, 2024. |
| (2) | The increase from TTM 4/30/2024 NOI to U/W NOI is primarily attributable to commercial rental income of $602,244 at the Lotus 315 property. The borrower sponsor recently executed leases with two retail tenants for $427,500 and converted another retail unit into 160 self-storage units which were 41.6% economically occupied as of June 13, 2024. The tenant Sihana LLC, which accounts for 64.8% of the retail net rentable area at the Lotus 315 property, was in a 100% rent abatement period through June 30, 2024, and is in a 50% rent abatement period beginning on July 1, 2024 and ending on September 30, 2024, and a 25% rent abatement period beginning on October 1, 2024 and ending on March 31, 2025. The tenant Bernard Jackson Art Gallery, which accounts for 35.2% of the retail net rentable area at the Lotus 315 property, is in a gap rent period through September 6, 2024. |
| (3) | Other Income includes parking income, fee/miscellaneous income and amenity fees. |
| (4) | The Lotus 315 & Essence 144 properties are both subject to a 30-year PILOT program. Real Estate Taxes are underwritten based on estimated current abated taxes. |
| (5) | Other Expenses include payroll and benefits, repairs and maintenance, utilities, advertising and marketing, and general and administrative expenses. |
| (6) | Represents economic occupancy. |
| (7) | Based on the Lotus 315 & Essence 144 Whole Loan. |
| THE INFORMATION IN THIS STRUCTURAL AND COLLATERAL TERM SHEET IS NOT COMPLETE AND MAY BE AMENDED PRIOR TO THE TIME OF SALE. THIS TERM SHEET IS NOT AN OFFER TO SELL THESE SECURITIES AND IT IS NOT A SOLICITATION OF AN OFFER TO BUY THESE SECURITIES IN ANY JURISDICTION WHERE THE OFFER OR SALE IS NOT PERMITTED. | ||
| 123 | ||
Hospitality – Various Various Farmingdale, NY 11735
| Collateral Asset Summary – Loan No. 13 Farmingdale Hotel Portfolio | Cut-off Date Balance: Cut-off Date LTV: U/W NCF DSCR: U/W NOI Debt Yield: | $35,000,000 53.0% 1.63x 15.4% |
| Mortgage Loan Information | Property Information | |||
| Loan Seller: | CREFI | Single Asset / Portfolio: | Portfolio | |
| Loan Purpose: | Refinance | Property Type – Subtype(2): | Hospitality - Various | |
| Borrower Sponsor(s): | John A. Danzi and John C. Tsunis | Collateral: | Leasehold | |
| Borrower(s): | Runway Hotel, LLC and Runway Hotel II, LLC | Location: | Farmingdale, NY | |
| Original Balance: | $35,000,000 | Year Built / Renovated(2): | Various / Various | |
| Cut-off Date Balance: | $35,000,000 | Property Management: | Long Island Hotels, LLC | |
| % by Initial UPB: | 3.5% | Size: | 249 Rooms | |
| Interest Rate: | 8.34000% | Appraised Value / Per Room(3): | 66,000,000 / $265,060 | |
| Note Date: | June 11, 2024 | Appraisal Date(3): | January 1, 2026 | |
| Original Term: | 60 months | Occupancy: | 77.1% (as of March 31, 2024) | |
| Amortization: | Interest Only | UW Economic Occupancy: | 77.1% | |
| Original Amortization: | NAP | Underwritten NOI: | $5,387,976 | |
| Interest Only Period: | 60 months | Underwritten NCF: | $4,819,458 | |
| First Payment Date: | August 6, 2024 | |||
| Maturity Date: | July 6, 2029 | Historical NOI | ||
| Additional Debt Type: | NAP | Most Recent NOI: | $5,316,295 (TTM March 31, 2024) | |
| Additional Debt Balance: | NAP | 2023 NOI: | $4,907,276 | |
| Call Protection: | L(24),D(29),O(7) | 2022 NOI: | $4,253,090 | |
| Lockbox / Cash Management: | Hard / Springing | 2021 NOI: | $4,002,831 | |
| Reserves | Financial Information | |||||
| Initial | Monthly | Cap | Cut-off Date Loan Per Room: | $140,562 | ||
| Taxes: | $196,381 | $39,276 | NAP | Maturity Date Loan Per Room: | $140,562 | |
| Insurance: | $138,972 | $27,794 | NAP | Cut-off Date LTV(3): | 53.0% | |
| FF&E Reserve: | $0 | $47,376 | NAP | Maturity Date LTV(3): | 53.0% | |
| Deferred Maintenance: | $19,000 | $0 | NAP | UW NOI DY: | 15.4% | |
| Other(1): | $3,953,231 | $181,600 | NAP | UW NCF DSCR: | 1.63x | |
| Sources and Uses | ||||||||
| Sources | Proceeds | % of Total | Uses | Proceeds | % of Total | |||
| Mortgage Loan | $35,000,000 | 95.6 | % | Loan Payoff | $31,379,809 | 85.8 | % | |
| Borrower Sponsor Equity | 1,592,512 | 4.4 | Upfront Reserves | 4,307,585 | 11.8 | |||
| Closing Costs | 905,118 | 2.5 | ||||||
| Total Sources | $36,592,512 | 100.0 | % | Total Uses | $36,592,512 | 100.0 | % | |
| (1) | Other Reserves consists of an (i) upfront PIP reserve for the Courtyard Marriott property of $2,470,000, (ii) monthly PIP reserve for the Courtyard Marriott property of approximately $81,367, (iii) upfront temporary renovation investment program (“TRIP”) reserve for the TownePlace Suites property of $1,390,000, (iv) monthly TRIP reserve for the TownePlace Suites property of approximately $46,203, (v) upfront ground rent reserve of approximately $93,231, (vi) monthly seasonality reserve of approximately $44,030, and (vii) monthly future PIP reserve of $10,000. |
| (2) | See “Portfolio Summary” below. |
| (3) | Appraised Value represents the aggregate “as stabilized” values of the Farmingdale Hotel Portfolio properties. The aggregate “as is” values of the Farmingdale Hotel Portfolio properties is $57,000,000. Based on the aggregate “as is” value of the Farmingdale Hotel Portfolio properties as of December 8, 2023, the Cut-off Date LTV and Maturity Date LTV are 61.4% and 61.4%, respectively. |
| THE INFORMATION IN THIS STRUCTURAL AND COLLATERAL TERM SHEET IS NOT COMPLETE AND MAY BE AMENDED PRIOR TO THE TIME OF SALE. THIS TERM SHEET IS NOT AN OFFER TO SELL THESE SECURITIES AND IT IS NOT A SOLICITATION OF AN OFFER TO BUY THESE SECURITIES IN ANY JURISDICTION WHERE THE OFFER OR SALE IS NOT PERMITTED. | ||
| 124 | ||
Hospitality – Various Various Farmingdale, NY 11735
| Collateral Asset Summary – Loan No. 13 Farmingdale Hotel Portfolio | Cut-off Date Balance: Cut-off Date LTV: U/W NCF DSCR: U/W NOI Debt Yield: | $35,000,000 53.0% 1.63x 15.4% |
The following table presents certain information relating to the Farmingdale Hotel Portfolio properties:
| Portfolio Summary | |||||||||||
| Property Name | City, State(1) | Year Built / Renovated(1) | Rooms(2) | Occ. %(2) | ADR(2) | RevPar(2) | Allocated Whole Loan Amounts | Appraised Value(1)(3) | UW NOI | % of UW NOI | |
| Courtyard Marriott | Farmingdale, NY | 2007 / 2014-2015 | 131 | 78.9% | $195.87 | $154.46 | $18,575,000 | $35,000,000 | $2,688,365 | 49.9 | % |
| TownePlace Suites | Farmingdale, NY | 2008 / 2014 | 118 | 75.2% | $186.06 | $139.93 | 16,425,000 | 31,000,000 | 2,699,610 | 50.1 | |
| Total / Wtd. Avg. | 249 | 77.1% | $191.34 | $147.58 | $35,000,000 | $66,000,000 | $5,387,976 | 100.0 | % | ||
| (1) | Source: Appraisals. |
| (2) | Based on the underwritten cash flow file, and as of the trailing 12 months ending March 31, 2024. |
| (3) | Appraised Value represents the aggregate “as stabilized” values of Farmingdale Hotel Portfolio properties. The aggregate “as is” values of the Farmingdale Hotel Portfolio properties is $57,000,000. |
The following table presents certain information relating to the 2023 demand analysis with respect to the Courtyard Marriott property:
| Demand Segmentation(1) | ||||
| Property | Rooms | Commercial | Leisure | Meeting & Group |
| Courtyard Marriott | 131 | 60.0% | 25.0% | 15.0% |
| (1) | Source: Appraisal. |
The following table presents certain information relating to the 2023 demand analysis with respect to the TownePlace Suites property:
| Demand Segmentation(1) | ||||
| Property | Rooms | Extended Stay | Transient | Meeting & Group |
| TownePlace Suites | 118 | 60.0% | 35.0% | 5.0% |
| (1) | Source: Appraisal. |
The following tables present certain information relating to the current and historical occupancy, ADR and RevPAR at the Courtyard Marriott property and its competitors:
| Historical Occupancy, ADR, RevPAR(1) | |||||||||
| Courtyard Marriott Property(2) | Competitive Set(3) | Penetration Factor | |||||||
| Period | Occupancy | ADR | RevPAR | Occupancy | ADR | RevPAR | Occupancy | ADR | RevPAR |
| 2021 | 71.3% | $171.18 | $122.08 | 62.0% | $167.44 | $103.76 | 115.1% | 102.2% | 117.7% |
| 2022 | 76.0% | $188.63 | $143.40 | 68.8% | $187.19 | $128.86 | 110.4% | 100.8% | 111.3% |
| 2023 | 78.1% | $194.94 | $152.18 | 71.4% | $192.51 | $137.53 | 109.3% | 101.3% | 110.7% |
| T-12 March 2024 | 78.9% | $195.87 | $154.46 | 70.8% | $194.23 | $137.45 | 111.4% | 100.8% | 112.4% |
| (1) | Variances between the underwriting, the appraisal and the above table with respect to Occupancy, ADR and RevPAR at the Courtyard Marriott property are attributable to variances in reporting methodologies and/or timing differences. |
| (2) | Occupancy, ADR and RevPAR for the Courtyard Marriott property are based on the underwritten cash flow file dated March 31, 2024. |
| (3) | Occupancy, ADR and RevPAR are based on data provided by a third-party hospitality research report. The Competitive Set includes Holiday Inn Plainview Long Island, Marriott Melville Long Island, Four Points by Sheraton Plainview Long Island, Hilton Long Island Huntington, Inn at Fox Hollow, and Hilton Garden Inn Melville. |
The following tables present certain information relating to the current and historical occupancy, ADR and RevPAR at the TownePlace Suites property and its competitors:
| Historical Occupancy, ADR, RevPAR(1) | |||||||||
| TownePlace Suites Property(2) | Competitive Set(3) | Penetration Factor | |||||||
| Period | Occupancy | ADR | RevPAR | Occupancy | ADR | RevPAR | Occupancy | ADR | RevPAR |
| 2021 | 68.1% | $168.27 | $114.55 | 80.6% | $137.34 | $110.69 | 84.5% | 122.5% | 103.5% |
| 2022 | 72.0% | $177.33 | $127.75 | 77.8% | $152.08 | $118.29 | 92.6% | 116.6% | 108.0% |
| 2023 | 73.2% | $185.85 | $136.02 | 80.1% | $156.51 | $125.43 | 91.3% | 118.7% | 108.4% |
| T-12 March 2024 | 75.2% | $186.06 | $139.93 | 80.7% | $155.84 | $125.76 | 93.2% | 119.4% | 111.3% |
| (1) | Variances between the underwriting, the appraisal and the above table with respect to Occupancy, ADR and RevPAR at the TownePlace Suites property are attributable to variances in reporting methodologies and/or timing differences. |
| (2) | Occupancy, ADR and RevPAR for the TownePlace Suites property are based on the underwritten cash flow file dated March 31, 2024. |
| (3) | Occupancy, ADR and RevPAR are based on data provided by a third-party hospitality research report. The Competitive Set includes Hampton by Hilton Long Island/Commack, Extended Stay America Long Island - Bethpage, Extended Stay America Long Island - Melville, and Homewood Suites by Hilton Long Island-Melville. |
| THE INFORMATION IN THIS STRUCTURAL AND COLLATERAL TERM SHEET IS NOT COMPLETE AND MAY BE AMENDED PRIOR TO THE TIME OF SALE. THIS TERM SHEET IS NOT AN OFFER TO SELL THESE SECURITIES AND IT IS NOT A SOLICITATION OF AN OFFER TO BUY THESE SECURITIES IN ANY JURISDICTION WHERE THE OFFER OR SALE IS NOT PERMITTED. | ||
| 125 | ||
Hospitality – Various Various Farmingdale, NY 11735
| Collateral Asset Summary – Loan No. 13 Farmingdale Hotel Portfolio | Cut-off Date Balance: Cut-off Date LTV: U/W NCF DSCR: U/W NOI Debt Yield: | $35,000,000 53.0% 1.63x 15.4% |
The following table presents certain information relating to the historical operating performance and Underwritten Net Cash Flow at the Farmingdale Hotel Portfolio properties:
| Cash Flow Analysis(1) | ||||||
| 2021 | 2022 | 2023 | TTM 3/31/2024 | UW | UW Per Room(2) | |
| Occupancy (%) | 69.8% | 74.1% | 75.8% | 77.1% | 77.1% | |
| ADR | $169.83 | $183.43 | $190.77 | $191.34 | $191.34 | |
| RevPar | $118.52 | $135.99 | $144.52 | $147.58 | $147.58 | |
| Rooms Revenue | $10,771,262 | $12,359,078 | $13,134,834 | $13,449,325 | $13,412,579 | $53,866 |
| Food & Beverage Revenue | 405,312 | 668,528 | 724,506 | 720,675 | 718,706 | $2,886 |
| Other Revenue(3) | 90,907 | 95,560 | 85,023 | 81,874 | 81,650 | $328 |
| Total Revenue | $11,267,482 | $13,123,167 | $13,944,363 | $14,251,874 | $14,212,935 | $57,080 |
| Rooms Expense | $2,215,778 | $2,920,476 | $2,835,602 | $2,748,034 | $2,740,526 | $11,006 |
| Food & Beverage Expense | 393,048 | 434,026 | 644,929 | 690,447 | 688,560 | $2,765 |
| Departmental Expenses | $2,608,825 | $3,354,502 | $3,480,531 | $3,438,481 | $3,429,086 | $13,771 |
| Departmental Profit | $8,658,656 | $9,768,664 | $10,463,831 | $10,813,393 | $10,783,848 | $43,309 |
| Management Fee | $449,871 | $525,221 | $550,056 | $573,761 | $426,388 | $1,712 |
| Marketing and Franchise Fee | 1,408,552 | 1,526,593 | 1,615,147 | 1,625,937 | 1,534,537 | $6,163 |
| Other Undistributed Expenses(4) | 1,864,468 | 2,222,278 | 2,079,335 | 1,966,166 | 1,964,668 | $7,890 |
| Total Undistributed Expenses | $3,722,891 | $4,274,092 | $4,244,538 | $4,165,864 | $3,925,593 | $15,765 |
| Real Estate Taxes(5) | $435,242 | $435,242 | $452,686 | $452,686 | $464,510 | $1,866 |
| Property Insurance | 235,205 | 281,598 | 311,362 | 318,195 | 354,300 | $1,423 |
| Ground Rent(6) | 262,488 | 524,642 | 547,969 | 560,353 | 651,469 | $2,616 |
| Net Operating Income(7) | $4,002,831 | $4,253,090 | $4,907,276 | $5,316,295 | $5,387,976 | $21,638 |
| FF&E | 450,699 | 524,927 | 557,775 | 570,075 | 568,517 | $2,283 |
| Net Cash Flow | $3,552,132 | $3,728,163 | $4,349,502 | $4,746,220 | $4,819,458 | $19,355 |
| NCF DSCR | 1.20x | 1.26x | 1.47x | 1.60x | 1.63x | |
| NOI Debt Yield | 11.4% | 12.2% | 14.0% | 15.2% | 15.4% | |
| (1) | Based on the underwritten cash flow file dated March 31, 2024. |
| (2) | UW Per Room is based on 249 rooms. |
| (3) | Other Revenue primarily consists of pet, smoking, miscellaneous and sundry revenue. |
| (4) | Other Undistributed Expenses consist of administrative and general, marketing and franchise, operations and maintenance, heat, power and light and information and telecom expenses. |
| (5) | The Farmingdale Portfolio properties are subject to a PILOT program that is co-terminus with the ground lease further described below. Real Estate Taxes are underwritten based on the five-year average PILOT payments for both properties. |
| (6) | The Farmingdale Portfolio properties, which are located adjacent to each other at the entrance of the Republic Airport, a regional executive airport, are both ground leased by affiliates of the borrowers from the New York State Department of Transportation, and are sub-ground leased by such affiliates (which also signed a joinder to the mortgage) to the borrowers. Each ground lease expires September 12, 2045 and has two 10-year renewal options. Base rent under each ground lease is the higher of (i) 4.00% of total revenue through September 2025, and 4.5% of total revenue at all times thereafter, in each case provided that more than $4.25 million in gross revenue is earned during the applicable year and (ii) $125,000, and is subject to a consumer price index adjustment every seven years. Ground rent was underwritten based on the estimated five-year average ground rent payment for each property commencing in 2024. |
| (7) | Each borrower leases its sub-ground leasehold interest to an affiliated operating lessee (which is not a borrower under the Farmingdale Hotel Portfolio mortgage loan). For so long as the operating leases are in effect, the borrowers are only entitled to receive rents under the operating leases, and not the revenues from the hotels located on the Farmingdale Hotel Portfolio Properties. The Farmingdale Hotel Portfolio mortgage loan was underwritten based on the hotel revenues. See “Description of the Mortgage Pool—Fee & Leasehold Interests” in the Preliminary Prospectus. |
| THE INFORMATION IN THIS STRUCTURAL AND COLLATERAL TERM SHEET IS NOT COMPLETE AND MAY BE AMENDED PRIOR TO THE TIME OF SALE. THIS TERM SHEET IS NOT AN OFFER TO SELL THESE SECURITIES AND IT IS NOT A SOLICITATION OF AN OFFER TO BUY THESE SECURITIES IN ANY JURISDICTION WHERE THE OFFER OR SALE IS NOT PERMITTED. | ||
| 126 | ||
Hospitality – Various Various Farmingdale, NY 11735
| Collateral Asset Summary – Loan No. 13 Farmingdale Hotel Portfolio | Cut-off Date Balance: Cut-off Date LTV: U/W NCF DSCR: U/W NOI Debt Yield: | $35,000,000 53.0% 1.63x 15.4% |
The following table presents certain information relating to the primary competition for the Courtyard Marriott property:
| Competitive Set(1) | |||||
| Property | Number of Rooms | Year Built | Estimated 2023 Occupancy | Estimated 2023 ADR | Estimated 2023 RevPAR |
| Courtyard Marriott(2) | 131 | 2007 | 78.1% | $194.94 | $152.18 |
| Four Points by Sheraton Plainview Long Island | 103 | 1961 | 70.0% - 75.0% | $160.00 - $170.00 | $120.00 - $125.00 |
| Hilton Garden Inn Melville | 178 | 2008 | 75.0% – 80.0% | $180.00 - $190.00 | $140.00 - $150.00 |
| Hilton Long Island/Huntington | 305 | 1988 | 65.0% – 70.0% | $180.00 - $190.00 | $125.00 - $130.00 |
| Holiday Inn Plainview Long Island | 125 | 1965 | 70.0% – 75.0% | $170.00 - $180.00 | $120.00 - $125.00 |
| The Inn at Fox Hollow | 145 | 2002 | 65.0% – 70.0% | $210.00 - $220.00 | $140.00 - $150.00 |
| Marriott Melville Long Island | 371 | 1990 | 65.0% – 70.0% | $210.00 - $220.00 | $140.00 - $150.00 |
| Total Avg. Competitive Set(3) | 72.0% | $193.10 | $138.99 | ||
| (1) | Source: Appraisal. |
| (2) | Estimated 2023 Occupancy, ADR and RevPAR are based on operating statements provided by the borrower dated as of December 31, 2023. |
| (3) | Excludes the Courtyard Marriott property. |
The following table presents certain information relating to the primary competition for the TownePlace Suites property:
| Competitive Set(1) | |||||
| Property | Number of Rooms | Year Built | Estimated 2023 Occupancy | Estimated 2023 ADR | Estimated 2023 RevPAR |
| TownePlace Suites(2) | 118 | 2008 | 73.2% | $185.85 | $136.02 |
| Extended Stay America Long Island - Bethpage | 104 | 1999 | 80.0% - 85.0% | $130.00 - $140.00 | $105.00 – $110.00 |
| Extended Stay America Long Island - Melville | 134 | 2000 | 75.0% - 80.0% | $125.00 – $130.00 | $100.00 – $105.00 |
| Hampton by Hilton Inn Long Island/Commack | 143 | 1988 | 70.0% - 75.0% | $170.00 – $180.00 | $125.00 – $130.00 |
| Homewood Suites by Hilton Long Island Melville | 147 | 2005 | 80.0% - 85.0% | $180.00 – $190.00 | $150.00 – $160.00 |
| Total Avg. Competitive Set(3) | 78.1% | $161.98 | $126.46 | ||
| (1) | Source: Appraisal. |
| (2) | Estimated 2023 Occupancy, ADR and RevPAR are based on operating statements provided by the borrower dated as of December 31, 2023. |
| (3) | Excludes the TownePlace Suites property. |
| THE INFORMATION IN THIS STRUCTURAL AND COLLATERAL TERM SHEET IS NOT COMPLETE AND MAY BE AMENDED PRIOR TO THE TIME OF SALE. THIS TERM SHEET IS NOT AN OFFER TO SELL THESE SECURITIES AND IT IS NOT A SOLICITATION OF AN OFFER TO BUY THESE SECURITIES IN ANY JURISDICTION WHERE THE OFFER OR SALE IS NOT PERMITTED. | ||
| 127 | ||
Industrial – Various Various Various, NY Various
| Collateral Asset Summary – Loan No. 14 Rechler Industrial Portfolio - B | Cut-off Date Balance: Cut-off Date LTV: U/W NCF DSCR: U/W NOI Debt Yield: | $31,915,000 50.3% 1.25x 9.3% |
| Mortgage Loan Information | Property Information | |||
| Loan Seller: | CREFI | Single Asset / Portfolio: | Portfolio | |
| Loan Purpose: | Refinance | Property Type – Subtype(5): | Industrial - Various | |
| Borrower Sponsor(s): | Mitchell Rechler and Gregg Rechler | Collateral: | Fee | |
| Borrower(s)(1): | REP B-2029 LLC | Location(5): | Various, NY | |
| Original Balance: | $31,915,000 | Year Built / Renovated(5): | Various / NAP | |
| Cut-off Date Balance: | $31,915,000 | Property Management: | Rechler Equity Management LLC | |
| % by Initial UPB: | 3.2% | Size: | 292,823 SF | |
| Interest Rate: | 7.07000% | Appraised Value / Per SF: | $63,500,000 / $217 | |
| Note Date: | May 23, 2024 | Appraisal Date: | April 25, 2024 | |
| Original Term: | 60 months | Occupancy(6): | 92.2% (as of Various) | |
| Amortization: | Interest Only | UW Economic Occupancy: | 92.2% | |
| Original Amortization: | NAP | Underwritten NOI: | $2,954,460 | |
| Interest Only Period: | 60 months | Underwritten NCF: | $2,849,095 | |
| First Payment Date: | July 6, 2024 | |||
| Maturity Date: | June 6, 2029 | Historical NOI | ||
| Additional Debt Type(2): | NAP | Most Recent NOI: | $2,915,655 (TTM March 31, 2024) | |
| Additional Debt Balance: | NAP | 2023 NOI: | $2,841,493 | |
| Call Protection: | YM1(53),O(7) | 2022 NOI: | $2,733,320 | |
| Lockbox / Cash Management: | Springing / Springing | 2021 NOI: | $2,574,167 | |
| Reserves | Financial Information | |||||
| Initial | Monthly | Cap | Cut-off Date Loan Per SF: | $109 | ||
| Taxes: | $81,966 | $40,983 | NAP | Maturity Date Loan Per SF: | $109 | |
| Insurance(3): | $0 | Springing | NAP | Cut-off Date LTV: | 50.3% | |
| Replacement Reserves: | $0 | $5,183 | $186,575 | Maturity Date LTV: | 50.3% | |
| TI/LC(4): | $292,823 | Springing | $219,618 | UW NOI DY: | 9.3% | |
| Deferred Maintenance: | $52,041 | $0 | NAP | UW NCF DSCR: | 1.25x | |
| Sources and Uses | |||||||
| Sources | Proceeds | % of Total | Uses | Proceeds | % of Total | ||
| Mortgage Loan | $31,915,000 | 100.0% | Loan Payoff | $15,315,457 | 48.0 | % | |
| Borrower Sponsor Equity | 14,981,739 | 46.9 | |||||
| Closing Costs | 1,190,973 | 3.7 | |||||
| Upfront Reserves | 426,830 | 1.3 | |||||
| Total Sources | $31,915,000 | 100.0% | Total Uses | $31,915,000 | 100.0 | % | |
| (1) | The borrower is related to the borrower under the Rechler Industrial Portfolio – A mortgage loan included in the Benchmark 2024-V8 securitization. |
| (2) | Future mezzanine financing secured by a pledge of the direct ownership interests in the borrower may be incurred by parent entities of the borrower subject to certain conditions, including, among others, (i) at the time of origination of such permitted mezzanine debt (x) the combined loan-to-value ratio of the total indebtedness may not exceed the loan-to-value ratio of the Rechler Industrial Portfolio – B mortgage loan as of its date of origination, (y) the combined debt service coverage ratio of the Rechler Industrial Portfolio – B mortgage loan and mezzanine debt must be at least equal to the debt service coverage ratio of the Rechler Industrial Portfolio – B mortgage loan as of its date of origination and (z) the combined debt yield of the Rechler Industrial Portfolio – B mortgage loan and mezzanine debt must be at least equal to the debt yield of the Rechler Industrial Portfolio – B mortgage loan as of its date of origination. |
| (3) | At the lender’s option, exercisable if the liability or casualty insurance policy maintained by the borrower for the Rechler Industrial Portfolio – B properties (or any portion thereof) is not an approved blanket or umbrella policy pursuant to the terms of the Rechler Industrial Portfolio – B mortgage loan, the borrower must obtain an approved policy and deposit monthly into the insurance reserve account 1/12th of the amount that would be sufficient to pay the insurance premiums due for the renewal of the coverage afforded by the policies. |
| (4) | The borrower is obligated to deposit monthly the sum of $6,100.50 following the first date on which funds on deposit in the TI/LC reserve account are less than $115,000; provided that the borrower is not obligated to make such deposit if it would cause the amount in such reserve account to exceed the cap above. |
| (5) | See “Portfolio Summary” below. |
| (6) | Occupancy is as of the underwritten rent rolls dated between April 18, 2024 and July 6, 2024. |
| THE INFORMATION IN THIS STRUCTURAL AND COLLATERAL TERM SHEET IS NOT COMPLETE AND MAY BE AMENDED PRIOR TO THE TIME OF SALE. THIS TERM SHEET IS NOT AN OFFER TO SELL THESE SECURITIES AND IT IS NOT A SOLICITATION OF AN OFFER TO BUY THESE SECURITIES IN ANY JURISDICTION WHERE THE OFFER OR SALE IS NOT PERMITTED. | ||
| 128 | ||
Industrial – Various Various Various, NY Various
| Collateral Asset Summary – Loan No. 14 Rechler Industrial Portfolio - B | Cut-off Date Balance: Cut-off Date LTV: U/W NCF DSCR: U/W NOI Debt Yield: | $31,915,000 50.3% 1.25x 9.3% |
The following table presents certain information relating to the Rechler Industrial Portfolio – B properties, which are presented in descending order of their allocated loan amounts:
| Rechler Industrial Portfolio – B Portfolio Summary | |||||||||
| Property Subtype(1) | Year Built / Renovated(1) | NRSF(2) | Occ. %(2) | Allocated Loan Amount | % of Allocated Loan Amount | Appraised Value(1) | UW NOI(2) | % of UW NOI(2) | |
Property Name City, State | |||||||||
| 2001 Orville Drive North | Warehouse | 2003 / NAP | 72,000 | 100.0% | $9,130,000 | 28.6% | $17,000,000 | $907,788 | 30.7% |
| Ronkonkoma, NY | |||||||||
| 90 Plant Avenue | Flex | 1972 / NAP | 74,950 | 100.0% | $5,745,000 | 18.0% | $13,000,000 | $621,365 | 21.0% |
| Hauppauge, NY | |||||||||
| 740 Old Willets Path | Flex | 1980 / 2014 | 30,174 | 90.3% | $4,020,000 | 12.6% | $7,400,000 | $333,360 | 11.3% |
| Hauppauge, NY | |||||||||
| 180 Orville Drive | Flex | 1982 / NAP | 38,003 | 100.0% | $3,440,000 | 10.8% | $7,400,000 | $360,915 | 12.2% |
| Bohemia, NY | |||||||||
| 104 Parkway Drive South | Flex | 1985 / NAP | 27,736 | 100.0% | $3,330,000 | 10.4% | $6,500,000 | $331,100 | 11.2% |
| Hauppauge, NY | |||||||||
| 85 Adams Avenue | Flex | 1973 / NAP | 20,000 | 100.0% | $3,040,000 | 9.5% | $5,300,000 | $286,587 | 9.7% |
| Hauppauge, NY | |||||||||
| 225 Oser Avenue | Flex | 1979 / NAP | 9,960 | 100.0% | $1,660,000 | 5.2% | $2,700,000 | $163,831 | 5.5% |
| Hauppauge, NY | |||||||||
| 611 Old Willets Path | Flex | 1963 / NAP | 20,000 | 0.0% | $1,550,000 | 4.9% | $4,200,000 | ($50,485) | (1.7%) |
| Hauppauge, NY | |||||||||
| Total/Weighted Average | 292,823 | 92.2% | $31,915,000 | 100.0% | $63,500,000 | $2,954,460 | 100.0% | ||
| (1) | Source: Appraisals. |
| (2) | Based on the underwritten rent rolls dated between April 18, 2024 and July 6, 2024. |
The following table presents certain information relating to the major tenants at the Rechler Industrial Portfolio - B properties:
| Tenant Summary(1) | ||||||||||||
| Tenant | Property | Credit Rating (Moody’s/S&P/ Fitch) | Net Rentable Area (SF) | % of Total Net Rentable Area | U/W Base Rent | U/W Base Rent Per SF | % of Total U/W Base Rent | Lease Expiration | Termination Option (Y/N) | Renewal Options | ||
| Europastry USA, Inc. | 2001 Orville Drive North | NR/NR/NR | 72,000 | 24.6 | % | $945,540 | $13.13 | 26.7 | % | 12/31/2033 | N | None |
| Gamus, LLC | 104 Parkway Drive South | NR/NR/NR | 27,736 | 9.5 | 399,953 | $14.42 | 11.3 | 5/31/2028 | N | 1 x 5 Yr | ||
| Appliance World of Huntington | 90 Plant Avenue | NR/NR/NR | 41,350 | 14.1 | 393,601 | $9.52 | 11.1 | 11/30/2028 | N | None | ||
| Peerless Electronics(2) | 85 Adams Avenue | NR/NR/NR | 20,000 | 6.8 | 292,600 | $14.63 | 8.3 | 4/30/2029 | Y | None | ||
| Amsco Valley Forge | 90 Plant Avenue | NR/NR/NR | 24,000 | 8.2 | 254,640 | $10.61 | 7.2 | 12/31/2027 | N | None | ||
| SMSB Consulting Group | 740 Old Willets Path | NR/NR/NR | 13,094 | 4.5 | 250,046 | $19.10 | 7.1 | 4/30/2027 | N | None | ||
| Long Island Electric Utility Servco | 740 Old Willets Path | NR/NR/NR | 14,165 | 4.8 | 211,242 | $14.91 | 6.0 | 12/31/2026 | N | None | ||
| Loomstate, LLC | 180 Orville Drive | NR/NR/NR | 18,600 | 6.4 | 206,274 | $11.09 | 5.8 | 8/31/2026 | N | None | ||
| Schaltbau North America, Inc. | 225 Oser Avenue | NR/NR/NR | 9,960 | 3.4 | 201,781 | $20.26 | 5.7 | 12/31/2025 | N | None | ||
| AC Electrical Supplies | 180 Orville Drive | NR/NR/NR | 11,253 | 3.8 | 139,087 | $12.36 | 3.9 | 7/31/2028 | N | None | ||
| Major Tenants Subtotal/Wtd. Avg. | 252,158 | 86.1 | % | $3,294,764 | $13.07 | 93.1 | % | |||||
| Remaining Occupied | 17,750 | 6.1 | % | $245,549 | $13.83 | 6.9 | % | |||||
| Occupied Subtotal/Wtd. Avg. | 269,908 | 92.2 | % | $3,540,313 | $13.12 | 100.0 | % | |||||
| Vacant | 22,915 | 7.8 | % | |||||||||
| Total | 292,823 | 100.0 | % | |||||||||
| (1) | Based on the underwritten rent rolls dated between April 18, 2024 and July 6, 2024, inclusive of contractual rent steps through May 1, 2025. |
| (2) | Peerless Electronics has a one-time right to terminate its lease as of the last day of the 7th lease year (February 28, 2026) with 12 months prior written notice and the payment of a termination fee. |
| THE INFORMATION IN THIS STRUCTURAL AND COLLATERAL TERM SHEET IS NOT COMPLETE AND MAY BE AMENDED PRIOR TO THE TIME OF SALE. THIS TERM SHEET IS NOT AN OFFER TO SELL THESE SECURITIES AND IT IS NOT A SOLICITATION OF AN OFFER TO BUY THESE SECURITIES IN ANY JURISDICTION WHERE THE OFFER OR SALE IS NOT PERMITTED. | ||
| 129 | ||
Industrial – Various Various Various, NY Various
| Collateral Asset Summary – Loan No. 14 Rechler Industrial Portfolio - B | Cut-off Date Balance: Cut-off Date LTV: U/W NCF DSCR: U/W NOI Debt Yield: | $31,915,000 50.3% 1.25x 9.3% |
The following table presents certain information relating to the lease rollover schedule at the Rechler Industrial Portfolio - B properties:
| Lease Rollover Schedule(1)(2) | |||||||||
| Year Ending December 31 | Expiring Owned GLA | % of Owned GLA | Cumulative % of Owned GLA | UW Base Rent | % of Total UW Base Rent | UW Base Rent $ per SF | # of Expiring Leases | ||
| MTM | 0 | 0.0 | % | 0.0% | $0 | 0.0 | % | $0.00 | 0 |
| 2024 | 0 | 0.0 | 0.0% | 0 | 0.0 | $0.00 | 0 | ||
| 2025 | 9,960 | 3.4 | 3.4% | 201,781 | 5.7 | $20.26 | 1 | ||
| 2026 | 32,765 | 11.2 | 14.6% | 417,516 | 11.8 | $12.74 | 2 | ||
| 2027 | 45,244 | 15.5 | 30.0% | 618,234 | 17.5 | $13.66 | 3 | ||
| 2028 | 80,339 | 27.4 | 57.5% | 932,641 | 26.3 | $11.61 | 3 | ||
| 2029 | 29,600 | 10.1 | 67.6% | 424,600 | 12.0 | $14.34 | 2 | ||
| 2030 | 0 | 0.0 | 67.6% | 0 | 0.0 | $0.00 | 0 | ||
| 2031 | 0 | 0.0 | 67.6% | 0 | 0.0 | $0.00 | 0 | ||
| 2032 | 0 | 0.0 | 67.6% | 0 | 0.0 | $0.00 | 0 | ||
| 2033 | 72,000 | 24.6 | 92.2% | 945,540 | 26.7 | $13.13 | 1 | ||
| 2034 | 0 | 0.0 | 92.2% | 0 | 0.0 | $0.00 | 0 | ||
| 2035 & Thereafter | 0 | 0.0 | 92.2% | 0 | 0.0 | $0.00 | 0 | ||
| Vacant | 22,915 | 7.8 | 100.0% | NAP | NAP | NAP | NAP | ||
| Total / Wtd. Avg. | 292,823 | 100.0 | % | $3,540,313 | 100.00 | % | $13.12 | 12 | |
| (1) | Based on the underwritten rent rolls dated between April 18, 2024 and July 6, 2024, inclusive of contractual rent steps through May 1, 2025. |
| (2) | Certain tenants may have termination options that are exercisable prior to the originally stated expiration date of the subject lease and that are not considered in the Lease Rollover Schedule. |
| THE INFORMATION IN THIS STRUCTURAL AND COLLATERAL TERM SHEET IS NOT COMPLETE AND MAY BE AMENDED PRIOR TO THE TIME OF SALE. THIS TERM SHEET IS NOT AN OFFER TO SELL THESE SECURITIES AND IT IS NOT A SOLICITATION OF AN OFFER TO BUY THESE SECURITIES IN ANY JURISDICTION WHERE THE OFFER OR SALE IS NOT PERMITTED. | ||
| 130 | ||
Industrial – Various Various Various, NY Various
| Collateral Asset Summary – Loan No. 14 Rechler Industrial Portfolio - B | Cut-off Date Balance: Cut-off Date LTV: U/W NCF DSCR: U/W NOI Debt Yield: | $31,915,000 50.3% 1.25x 9.3% |
The following table presents certain information relating to the historical operating performance and Underwritten Net Cash Flow at the Rechler Industrial Portfolio - B properties:
| Cash Flow Analysis(1) | ||||||
| 2021 | 2022 | 2023 | TTM 3/31/2024 | U/W | U/W Per SF | |
| Base Rent | $3,233,737 | $3,353,470 | $3,423,700 | $3,479,155 | $3,436,357 | $11.74 |
| Contractual Rent Steps | 0 | 0 | 0 | 0 | $103,956 | $0.36 |
| Potential Income from Vacant Space | 0 | 0 | 0 | 0 | $336,640 | $1.15 |
| Gross Potential Rent | $3,233,737 | $3,353,470 | $3,423,700 | $3,479,155 | $3,876,953 | $13.24 |
| Reimbursements | 342,967 | 415,471 | 475,710 | 486,691 | $431,902 | $1.47 |
| Other Income(2) | 3,136 | 12,834 | 14,198 | 14,198 | $11,877 | $0.04 |
| Total Gross Income | $3,579,840 | $3,781,776 | $3,913,608 | $3,980,045 | $4,320,732 | $14.76 |
| (Vacancy / Credit Loss) | 0 | 0 | 0 | 0 | ($336,640) | ($1.15) |
| Effective Gross Income | $3,579,840 | $3,781,776 | $3,913,608 | $3,980,045 | $3,984,092 | $13.61 |
| Management Fee | 107,395 | 113,453 | 117,408 | 119,401 | $119,523 | $0.41 |
| Real Estate Taxes | 610,134 | 618,264 | 621,682 | 614,898 | $624,220 | $2.13 |
| Insurance | 75,982 | 80,949 | 98,355 | 103,880 | $86,249 | $0.29 |
| Other Expenses(3) | 212,162 | 235,789 | 234,671 | 226,210 | $199,640 | $0.68 |
| Total Expenses | $1,005,672 | $1,048,455 | $1,072,116 | $1,064,390 | $1,029,631 | $3.52 |
| Net Operating Income | $2,574,167 | $2,733,320 | $2,841,493 | $2,915,655 | $2,954,460 | $10.09 |
| Capital Expenditures | 0 | 0 | 0 | 0 | 62,939 | $0.21 |
| TI/LC | 0 | 0 | 0 | 0 | 42,426 | $0.14 |
| Net Cash Flow | $2,574,167 | $2,733,320 | $2,841,493 | $2,915,655 | $2,849,095 | $9.73 |
| Occupancy (%) | 100.0% | 99.3% | 99.2% | 99.2% | 92.2%(4) | |
| NCF DSCR | 1.13x | 1.19x | 1.24x | 1.27x | 1.25x | |
| NOI Debt Yield | 8.1% | 8.6% | 8.9% | 9.1% | 9.3% | |
| (1) | Based on the underwritten rent rolls dated between April 18, 2024 and July 6, 2024, inclusive of contractual rent steps through May 1, 2025. |
| (2) | Other Income includes legal fee recovery income, administrative fee income, and other miscellaneous income. |
| (3) | Other Expenses includes repairs and maintenance and utilities. |
| (4) | U/W Occupancy (%) is based on economic occupancy. |
| THE INFORMATION IN THIS STRUCTURAL AND COLLATERAL TERM SHEET IS NOT COMPLETE AND MAY BE AMENDED PRIOR TO THE TIME OF SALE. THIS TERM SHEET IS NOT AN OFFER TO SELL THESE SECURITIES AND IT IS NOT A SOLICITATION OF AN OFFER TO BUY THESE SECURITIES IN ANY JURISDICTION WHERE THE OFFER OR SALE IS NOT PERMITTED. | ||
| 131 | ||
Retail – Single Tenant 9570 Wilshire Boulevard Beverly Hills, CA 90212
| Collateral Asset Summary – Loan No. 15 Saks Beverly Hills | Cut-off Date Balance: Cut-off Date LTV: U/W NCF DSCR: U/W NOI Debt Yield: | $28,635,000 45.0% 1.71x 13.4% |
| Mortgage Loan Information | Property Information | |||
| Loan Seller: | CREFI | Single Asset / Portfolio: | Single Asset | |
| Loan Purpose: | Refinance | Property Type - Subtype: | Retail – Single Tenant | |
| Borrower Sponsor(s): | A&H Acquisitions, Aurora Capital Associates LLC and Jenel Management Corp. | Collateral: | Leasehold
| |
| Borrower(s): | Flagship Partners II LLC | Location: | Beverly Hills, CA | |
| Original Balance(1): | $28,635,000 | Year Built / Renovated: | 1993 / 2023 | |
| Cut-off Date Balance(1): | $28,635,000 | Property Management: | Jenel Management Corp. | |
| % by Initial UPB: | 2.8% | Size: | 114,978 SF | |
| Interest Rate: | 7.66300% | Appraised Value / Per SF(3): |
$200,000,000 / $1,739
| |
| Note Date: | May 13, 2024 | Appraisal Date: | March 9, 2024 | |
| Original Term: | 60 months | Occupancy: | 100.0% (as of July 5, 2024) | |
| Amortization: | Interest Only | UW Economic Occupancy: | 96.9% | |
| Original Amortization: | NAP | Underwritten NOI: | $12,063,191 | |
| Interest Only Period: | 60 months | Underwritten NCF: | $11,930,966 | |
| First Payment Date: | July 5, 2024 | |||
| Maturity Date: | June 5, 2029 | Historical NOI(4) | ||
| Additional Debt Type(1): | Pari Passu | Most Recent NOI: | NAV | |
| Additional Debt Balance(1): | $61,365,000 | 2023 NOI: | NAV | |
| Call Protection: | L(25),D(29),O(6) | 2022 NOI: | NAV | |
| Lockbox / Cash Management: | Hard / Springing | 2021 NOI: | NAV | |
| Reserves | Financial Information(1) | |||||
| Initial | Monthly | Cap | Cut-off Date Loan Per SF: | $783 | ||
| Taxes: | $296,870 | $74,218 | NAP | Maturity Date Loan Per SF: | $783 | |
| Insurance: | $0 | Springing | NAP | Cut-off Date LTV(3): | 45.0% | |
| Replacement Reserves: | $1,437 | $1,437 | $51,740 | Maturity Date LTV(3): | 45.0% | |
| TI/LC: | $9,582 | $9,582 | $344,934 | UW NOI DY: | 13.4% | |
| Other(2): | $577,686 | Springing | $577,686 | UW NCF DSCR: | 1.71x | |
| Sources and Uses | |||||||
| Sources | Proceeds | % of Total | Uses | Proceeds | % of Total | ||
| Whole Loan(1) | $90,000,000 | 100.0% | Return of Equity(5) | $55,725,980 | 61.9 | % | |
| Loan Payoff | 32,104,252 | 35.7 | |||||
| Closing Costs | 1,284,193 | 1.4 | |||||
| Upfront Reserves | 885,575 | 1.0 | |||||
| Total Sources | $90,000,000 | 100.0% | Total Uses | $90,000,000 | 100.0 | % | |
| (1) | The Saks Beverly Hills mortgage loan is part of a whole loan evidenced by two pari passu senior promissory notes in the aggregate original principal amount of $90,000,000 (the “Saks Beverly Hills Whole Loan”). The Financial Information in the chart above reflects the Saks Beverly Hills Whole Loan. The Saks Beverly Hills Whole Loan was co-originated by JPMorgan Chase Bank, National Association and Citi Real Estate Funding Inc. |
| (2) | Other reserves consist of an (i) initial ground lease reserve deposit of $577,686, (ii) springing monthly ground lease reserve deposits equal to 1/12th of the rents and other charges due under the ground lease during the next ensuing twelve months, subject to a cap equal to three months of ground rent, as long as there is no ongoing event of default. |
| (3) | The appraisal also provides for an “hypothetical - go dark” appraised value of $138,000,000. The “hypothetical - go dark” appraised value results in a Cut-off Date LTV Ratio and Maturity Date LTV Ratio of 65.2% for the Saks Beverly Hills Whole Loan. |
| (4) | Historical financial information is not available due to Saks Fifth Avenue (“Saks”) opening for business at the Saks Beverly Hills property in February 2024. |
| (5) | The sponsor executed a lease with Saks Fifth Avenue in 2019, with the store ultimately opening in February of 2024. Underwritten base rent attributable to the current Saks Fifth Avenue lease of $141.21 per square foot is approximately 242% in excess of the base rent attributable to the prior tenant, Barney’s, prior to such prior tenant vacating. |
| THE INFORMATION IN THIS STRUCTURAL AND COLLATERAL TERM SHEET IS NOT COMPLETE AND MAY BE AMENDED PRIOR TO THE TIME OF SALE. THIS TERM SHEET IS NOT AN OFFER TO SELL THESE SECURITIES AND IT IS NOT A SOLICITATION OF AN OFFER TO BUY THESE SECURITIES IN ANY JURISDICTION WHERE THE OFFER OR SALE IS NOT PERMITTED. | ||
| 132 | ||
Retail – Single Tenant 9570 Wilshire Boulevard Beverly Hills, CA 90212
| Collateral Asset Summary – Loan No. 15 Saks Beverly Hills | Cut-off Date Balance: Cut-off Date LTV: U/W NCF DSCR: U/W NOI Debt Yield: | $28,635,000 45.0% 1.71x 13.4% |
The table below summarizes the promissory notes that comprise the Saks Beverly Hills Whole Loan. The relationship between the holders of the Saks Beverly Hills Whole Loan will be governed by a co-lender agreement as described under “Description of the Mortgage Pool—The Whole Loans—The Non-Serviced Pari Passu Whole Loans” in the Preliminary Prospectus. The Saks Beverly Hills whole loan will be serviced pursuant to the BANK5 2024-5YR7 pooling and servicing agreement. See “Pooling and Servicing Agreement—Servicing of the Non-Serviced Mortgage Loans” in the Preliminary Prospectus.
| Whole Loan Summary | ||||
| Note | Original Balance | Cut-off Date Balance | Note Holder | Controlling Piece |
| A-1 | $61,365,000 | $61,365,000 | BANK5 2024-5YR7 | Yes |
| A-2 | 28,635,000 | 28,635,000 | Benchmark 2024-V8 | No |
| Whole Loan | $90,000,000 | $90,000,000 | ||
The following table presents certain information relating to the tenancy at the Saks Beverly Hills property:
| Tenant Summary(1) | |||||||||
| Tenant | Credit Rating (Moody’s/S&P/Fitch) | Net Rentable Area (SF) | % of Net Rentable Area | U/W Base Rent | U/W Base Rent Per SF | % of Total U/W Base Rent | Lease Expiration | Termination Option (Y/N) | Renewal Options |
| Saks Fifth Avenue | NR/NR/NR | 114,978 | 100.0% | $16,236,482 | $141.21 | 100.0% | 2/28/2049 | N | None |
| Total Occupied | 114,978 | 100.0% | $16,236,482 | $141.21 | 100.0% | ||||
| Vacant | 0 | 0.0 | |||||||
| Total | 114,978 | 100.00% | |||||||
| (1) | Information is based on the underwritten rent roll as of July 5, 2024, inclusive of contractual rent steps through April 1, 2025. |
The following table presents certain information relating to the lease rollover schedule at the Saks Beverly Hills property:
| Lease Rollover Schedule(1) | ||||||||
| Year Ending December 31 | Expiring Owned GLA | % of Owned GLA | Cumulative % of Owned GLA | UW Base Rent | % of Total UW Base Rent | UW Base Rent $ per SF | # of Expiring Leases | |
| MTM | 0 | 0.0 | % | 0.0% | $0 | 0.0% | $0.00 | 0 |
| 2024 | 0 | 0.0 | 0.0% | 0 | 0.0 | 0.00 | 0 | |
| 2025 | 0 | 0.0 | 0.0% | 0 | 0.0 | 0.00 | 0 | |
| 2026 | 0 | 0.0 | 0.0% | 0 | 0.0 | 0.00 | 0 | |
| 2027 | 0 | 0.0 | 0.0% | 0 | 0.0 | 0.00 | 0 | |
| 2028 | 0 | 0.0 | 0.0% | 0 | 0.0 | 0.00 | 0 | |
| 2029 | 0 | 0.0 | 0.0% | 0 | 0.0 | 0.00 | 0 | |
| 2030 | 0 | 0.0 | 0.0% | 0 | 0.0 | 0.00 | 0 | |
| 2031 | 0 | 0.0 | 0.0% | 0 | 0.0 | 0.00 | 0 | |
| 2032 | 0 | 0.0 | 0.0% | 0 | 0.0 | 0.00 | 0 | |
| 2033 | 0 | 0.0 | 0.0% | 0 | 0.0 | 0.00 | 0 | |
| 2034 | 0 | 0.0 | 0.0% | 0 | 0.0 | 0.00 | 0 | |
| 2035 & Thereafter | 114,978 | 100.0 | 100.0% | 16,236,482 | 100.0 | 141.21 | 1 | |
| Vacant | 0 | 0.0 | 100.0% | NAP | NAP | NAP | NAP | |
| Total / Wtd. Avg. | 114,978 | 100.0 | % | $16,236,482 | 100.0% | $141.21 | 1 | |
| (1) | Information is based on the underwritten rent roll as of July 5, 2024, inclusive of contractual rent steps through April 1, 2025. |
| THE INFORMATION IN THIS STRUCTURAL AND COLLATERAL TERM SHEET IS NOT COMPLETE AND MAY BE AMENDED PRIOR TO THE TIME OF SALE. THIS TERM SHEET IS NOT AN OFFER TO SELL THESE SECURITIES AND IT IS NOT A SOLICITATION OF AN OFFER TO BUY THESE SECURITIES IN ANY JURISDICTION WHERE THE OFFER OR SALE IS NOT PERMITTED. | ||
| 133 | ||
Retail – Single Tenant 9570 Wilshire Boulevard Beverly Hills, CA 90212
| Collateral Asset Summary – Loan No. 15 Saks Beverly Hills | Cut-off Date Balance: Cut-off Date LTV: U/W NCF DSCR: U/W NOI Debt Yield: | $28,635,000 45.0% 1.71x 13.4% |
The following table presents certain information relating to the Underwritten Net Cash Flow at the Saks Beverly Hills property:
| Cash Flow Analysis(1) | ||
| U/W(2) | U/W Per SF | |
| Base Rent(2) | $16,236,482 | $141.21 |
| Gross Potential Rent | $16,236,482 | $141.21 |
| Reimbursements | 588,870 | $5.12 |
| Total Gross Income | $16,825,353 | $146.34 |
| (Vacancy / Credit Loss) | (504,761) | ($4.39) |
| Effective Gross Income | $16,320,592 | $141.95 |
| Real Estate Taxes | 1,089,209 | $9.47 |
| Insurance | 147,503 | $1.28 |
| Ground Rent(3) | 2,310,744 | $20.10 |
| Management Fee | 326,412 | $2.84 |
| Business Tax | 383,534 | $3.34 |
| Total Expenses | $4,257,401 | $37.03 |
| Net Operating Income | $12,063,191 | $104.92 |
| Capital Expenditures | 17,247 | $0.15 |
| TI/LC | 114,978 | $1.00 |
| Net Cash Flow | $11,930,966 | $103.77 |
| Occupancy (%)(4) | 96.9% | |
| NCF DSCR(5) | 1.71x | |
| NOI Debt Yield(5) | 13.4% | |
| (1) | Historical financial information is not available due to Saks opening for business at the Saks Beverly Hills property in February 2024. |
| (2) | Based on the underwritten rent roll as of July 5, 2024, inclusive of contractual rent steps through April 1, 2025. |
| (3) | The ground lease expires on July 31, 2088. Current annual ground rent is approximately $2.3 million and is subject to consumer price index increases every seven years, the next of which will be in January 2025. Ground rent was underwritten based on the ground rent currently in place. |
| (4) | Represents the underwritten economic occupancy. |
| (5) | Based on the Saks Beverly Hills Whole Loan. |
| THE INFORMATION IN THIS STRUCTURAL AND COLLATERAL TERM SHEET IS NOT COMPLETE AND MAY BE AMENDED PRIOR TO THE TIME OF SALE. THIS TERM SHEET IS NOT AN OFFER TO SELL THESE SECURITIES AND IT IS NOT A SOLICITATION OF AN OFFER TO BUY THESE SECURITIES IN ANY JURISDICTION WHERE THE OFFER OR SALE IS NOT PERMITTED. | ||
| 134 | ||
STATEMENT REGARDING ASSUMPTIONS AS TO SECURITIES, PRICING ESTIMATES AND
OTHER INFORMATION
This material is for your information, and none of Deutsche Bank Securities Inc., Citigroup Global Markets Inc., Goldman Sachs & Co. LLC, BMO Capital Markets Corp., Barclays Capital Inc., AmeriVet Securities, Inc., Drexel Hamilton, LLC or any other underwriter (the “Underwriters”) are soliciting any action based upon it. This material is not to be construed as an offer to sell or the solicitation of any offer to buy any security in any jurisdiction where such an offer or solicitation would be illegal.
Neither this document nor anything contained herein shall form the basis for any contract or commitment whatsoever. The information contained herein is preliminary as of the date hereof. These materials are subject to change, completion or amendment from time to time. The information contained herein will be superseded by similar information delivered to you as part of the preliminary prospectus relating to the Benchmark 2024-V8 Mortgage Trust Commercial Mortgage Pass-Through Certificates, Series 2024-V8 (the "Offering Document"). The information contained herein supersedes any such information previously delivered and should be reviewed only in conjunction with the entire Offering Document. All of the information contained herein is subject to the same limitations and qualifications contained in the Offering Document. The information contained herein does not contain all relevant information relating to the underlying mortgage loans or mortgaged properties. Such information is described elsewhere in the Offering Document. The information contained herein will be more fully described elsewhere in the Offering Document. The information contained herein should not be viewed as projections, forecasts, predictions or opinions with respect to value. Prior to making any investment decision, prospective investors are strongly urged to read the Offering Document its entirety. Neither the Securities and Exchange Commission nor any state securities commission has approved or disapproved of these securities or determined if this free writing prospectus is truthful or complete. Any representation to the contrary is a criminal offense.
The attached information contains certain tables and other statistical analyses (the “Computational Materials”) which have been prepared in reliance upon information furnished by the Mortgage Loan Sellers. Numerous assumptions were used in preparing the Computational Materials, which may or may not be reflected herein. As such, no assurance can be given as to the Computational Materials’ accuracy, appropriateness or completeness in any particular context; or as to whether the Computational Materials and/or the assumptions upon which they are based reflect present market conditions or future market performance. The Computational Materials should not be construed as either projections or predictions or as legal, tax, financial or accounting advice. You should consult your own counsel, accountant and other advisors as to the legal, tax, business, financial and related aspects of a purchase of these securities. Any weighted average lives, yields and principal payment periods shown in the Computational Materials are based on prepayment and/or loss assumptions, and changes in such prepayment and/or loss assumptions may dramatically affect such weighted average lives, yields and principal payment periods. In addition, it is possible that prepayments or losses on the underlying assets will occur at rates higher or lower than the rates shown in the attached Computational Materials. The specific characteristics of the securities may differ from those shown in the Computational Materials due to differences between the final underlying assets and the preliminary underlying assets used in preparing the Computational Materials. The principal amount and designation of any security described in the Computational Materials are subject to change prior to issuance. None of Underwriters or any of their respective affiliates makes any representation or warranty as to the actual rate or timing of payments or losses on any of the underlying assets or the payments or yield on the securities.
This document contains forward-looking statements. Those statements are subject to certain risks and uncertainties that could cause the success of collections and the actual cash flow generated to differ materially from the information set forth herein. While such information reflects projections prepared in good faith based upon methods and data that are believed to be reasonable and accurate as of the dates thereof, the depositor undertakes no obligation to revise these forward-looking statements to reflect subsequent events or circumstances. Individuals should not place undue reliance on forward-looking statements and are advised to make their own independent analysis and determination with respect to the forecasted periods, which reflect the issuer’s view only as of the date hereof.
IMPORTANT NOTICE RELATING TO AUTOMATICALLY GENERATED EMAIL DISCLAIMERS
Any legends, disclaimers or other notices that may appear at the bottom of the email communication to which this free writing prospectus is attached relating to (1) these materials not constituting an offer (or a solicitation of an offer), (2) no representation being made that these materials are accurate or complete and may not be updated or (3) these materials possibly being confidential, are not applicable to these materials and should be disregarded. Such legends, disclaimers or other notices have been automatically generated as a result of these materials having been sent via Bloomberg or another system.
| THE INFORMATION IN THIS STRUCTURAL AND COLLATERAL TERM SHEET IS NOT COMPLETE AND MAY BE AMENDED PRIOR TO THE TIME OF SALE. THIS TERM SHEET IS NOT AN OFFER TO SELL THESE SECURITIES AND IT IS NOT A SOLICITATION OF AN OFFER TO BUY THESE SECURITIES IN ANY JURISDICTION WHERE THE OFFER OR SALE IS NOT PERMITTED. | ||
| 135 | ||