< ENTERGY >
Statistical Report
&
Investor Guide
2006

At Entergy, we believe it is our responsibility to imagine having it all. First we imagine, and then we aspire and seek to achieve. In setting our aspirations, we adhere to the principles of sustainable growth. It is our firm belief that only by consistently delivering superior financial, operational and societal results can we build a company that is worthy of your investment and trust. We have assembled the statistics and facts in this report to support your review and analysis of Entergy’s results over the last five years. This information is available in electronic form, with Excel spreadsheets, on our Web site at www.entergy.com/ investor_relations, in order to facilitate easier access and analysis.
Entergy Investor Relations
ENTERGY CORPORATION is an integrated energy company engaged primarily in electric power production and retail distribution operations. Entergy owns and operates power plants with approximately 30,000 megawatts of electric generating capacity, and it is the second–largest nuclear generator in the United States. Entergy delivers electricity to 2.6 million utility customers in Arkansas, Louisiana, Mississippi and Texas. Entergy has annual revenues of more than $10 billion and approximately 14,500 employees.
TABLE OF CONTENTS
| | |
ABOUT THIS PUBLICATION | | 2 |
FORWARD-LOOKING INFORMATION | | 2 |
FINANCIAL MEASURES | | 2 |
ENTERGY AT A GLANCE | | 3 – 4 |
EXECUTIVE PROFILES | | 5 – 6 |
| |
ENTERGY CORPORATION AND SUBSIDIARIES | | |
Selected Financial and Operating Data | | 7 |
Selected Financial Data | | 7 |
Utility Electric Operating Data | | 7 |
Employees | | 7 |
Owned and Leased Capability | | 7 |
Consolidated Quarterly Financial Metrics | | 8 |
Consolidated Annual Financial Metrics | | 8 |
Consolidated Financial Results | | 9 |
Consolidated Quarterly Results | | 9 |
Consolidated Quarterly Special Items | | 10 |
Consolidated Annual Results | | 11 |
Consolidated Annual Special Items | | 12 |
Description of Special Items | | 13 |
Consolidated Statements of Income | | 14 |
Consolidating Income Statement | | 15 |
Consolidated Balance Sheets | | 16 – 17 |
Consolidating Balance Sheet | | 18 – 19 |
Consolidated Statements of Cash Flow | | 20 – 21 |
Cash Flow Information by Business | | 21 |
Consolidated Statements of Retained Earnings, Comprehensive Income and Paid–In Capital | | 22 |
Consolidated Capital Expenditures | | 23 |
Entergy Corporation Securities Detail | | 23 |
Entergy Corporation Long-Term Debt | | 23 |
Securities Ratings (Outlook) | | 23 |
| |
UTILITY | | |
Utility Quarterly Financial Metrics | | 24 |
Utility Annual Financial Metrics | | 24 |
Utility Capital Expenditures | | 24 |
Utility Securities Ratings (Outlook) | | 24 |
Utility Financial Results | | 25 |
Utility/Parent/Other Consolidating Income Statement | | 25 |
Utility/Parent/Other Consolidating Balance Sheet | | 26 – 27 |
Utility Selected Annual Financial Metrics | | 28 – 29 |
Utility Securities Detail | | 30 |
Utility Long-Term Debt and Preferred Stock | | 30 |
Entergy Arkansas, Inc. | | 30 |
Entergy Gulf States, Inc. | | 31 |
Entergy Louisiana, LLC. | | 32 |
Entergy Louisiana Holdings, Inc. | | 32 |
Entergy Mississippi, Inc. | | 33 |
Entergy New Orleans, Inc. | | 34 |
System Energy Resources, Inc. | | 34 |
Utility Statistical Information | | 35 |
Utility Total Capability | | 35 |
Utility Selected Operating Data | | 35 |
Utility Consolidating Information | | 36 |
Entergy Arkansas, Inc. | | 37 – 38 |
Entergy Gulf States, Inc. | | 39 – 40 |
Entergy Louisiana, LLC. | | 41 – 42 |
Entergy Mississippi, Inc. | | 43 – 44 |
Entergy New Orleans, Inc. | | 45 – 46 |
System Energy Resources, Inc. | | 46 |
Utility Nuclear Plant Statistics | | 47 |
Utility Regulatory Information | | 48 |
Regulatory Commissions | | 48 |
Commission/Council Members | | 48 |
Select Utility Regulatory Mechanisms | | 49 |
Utility Electric and Gas Fuel Recovery Mechanisms. | | 50 |
| |
COMPETITIVE BUSINESSES | | |
Total Capacity | | 51 |
| |
ENTERGY NUCLEAR (NON-UTILITY) | | |
Entergy Nuclear Quarterly Financial Metrics | | 51 |
Entergy Nuclear Annual Financial Metrics | | 51 |
Entergy Nuclear Quarterly Operational Metrics | | 51 |
Entergy Nuclear Annual Operational Metrics | | 51 |
Entergy Nuclear Plant Statistics | | 52 |
Entergy Nuclear Plant Uprates | | 52 |
Entergy Nuclear Securities Detail | | 53 |
| |
NON-NUCLEAR WHOLESALE ASSETS | | |
Non-Nuclear Wholesale Assets Plant Statistics | | 53 |
Non-Nuclear Wholesale Assets Securities Detail | | 53 |
| |
DEFINITIONS OF OPERATIONAL MEASURES AND | | |
GAAP AND NON-GAAP FINANCIAL MEASURES | | 54 |
| |
REG G RECONCILIATIONS | | |
Pro Forma Financial Results | | 55 – 58 |
Financial Measures | | 59 – 67 |
| |
INVESTOR INFORMATION | | 68 |
1
ABOUT THIS PUBLICATION
This publication is unaudited and should be used in conjunction with Entergy’s 2006 Annual Report to Shareholders and Form 10-K filed with the Securities and Exchange Commission. It has been prepared for information purposes and is not intended for use in connection with any sale or purchase of, or any offer to buy, any securities of Entergy Corporation or its subsidiaries.
FORWARD-LOOKING INFORMATION
In this report and from time to time, Entergy makes statements as a registrant concerning its expectations, beliefs, plans, objectives, goals, strategies, and future events or performance. Such statements are “ forward-looking statements” within the meaning of the Private Securities Litigation Reform Act of 1995. Words such as “believes ,” “intends,” “plans,” “ predicts” and “estimates” and similar expressions are intended to identify forward-looking statements but are not the only means to identify these statements. Although Entergy believes that these forward-looking statements and the underlying assumptions are reasonable, it cannot provide assurance that they will prove correct. Any forward-looking statement is based on information current as of the date of this combined report and speaks only as of the date on which such statement is made. Except to the extent required by the federal securities laws, Entergy undertakes no obligation to publicly update or revise any forward-looking statements, whether as a result of new information, future events, or otherwise.
Forward-looking statements involve a number of risks and uncertainties. There are factors that could cause actual results to differ materially from those expressed or implied in the forward-looking statements, including those factors discussed in (a) Item 1A. Risk Factors, in Entergy’s Form 10-K, (b) Management’s Financial Discussion and Analysis and (c) the following factors (in addition to others described elsewhere in this report and in subsequent securities filings):
| | • | | resolution of pending and future rate cases and negotiations, including various performance-based rate discussions and implementation of Texas legislation, and other regulatory proceedings, including those related to Entergy’s System Agreement, Entergy’s utility supply plan, recovery of storm costs, and recovery of fuel and purchased power costs |
| | • | | Entergy’s and its subsidiaries’ ability to manage their operation and maintenance costs |
| | • | | changes in utility regulation, including the beginning or end of retail and wholesale competition, the ability to recover net utility assets and other potential stranded costs, the implementation of the independent coordinator of transmission that includes Entergy’s utility service territory, and the application of market power criteria by the FERC |
| | • | | the economic climate, and particularly growth in Entergy’s service territory |
| | • | | variations in weather and the occurrence of hurricanes and other storms and disasters, including uncertainties associated with efforts to remediate the effects of Hurricanes Katrina and Rita and recovery of costs associated with restoration including Entergy’s ability to obtain financial assistance from governmental authorities in connection with these storms |
| | • | | the performance of Entergy’s generating plants, and particularly the capacity factors at its nuclear generating facilities |
| | • | | changes in the financial markets, particularly those affecting the availability of capital and Entergy’s ability to refinance existing debt, execute its share repurchase program, and fund investments and acquisitions |
| | • | | actions of rating agencies, including changes in the ratings of debt and preferred stock, changes in general corporate ratings, and changes in the rating agencies’ ratings criteria |
| | • | | changes in inflation, and interest rates |
| | • | | Entergy’s ability to develop and execute on a point of view regarding future prices of electricity, natural gas, and other energy-related commodities |
| | • | | Entergy’s ability to purchase and sell assets at attractive prices and on other attractive terms |
| | • | | prices for power generated by Entergy’s unregulated generating facilities, the ability to hedge, sell power forward or otherwise reduce the market price risk associated with those facilities, including the Non-Utility Nuclear plants, and the prices and availability of fuel and power Entergy must purchase for its utility customers, and Entergy’s ability to meet credit support requirements for fuel and power supply contracts |
| | • | | volatility and changes in markets for electricity, natural gas, uranium, and other energy-related commodities |
| | • | | changes in regulation of nuclear generating facilities and nuclear materials and fuel, including possible shutdown of nuclear generating facilities, particularly those in the northeastern United States |
| | • | | uncertainty regarding the establishment of interim or permanent sites for spent nuclear fuel storage and disposal |
| | • | | resolution of pending or future applications for license extensions or modifications of nuclear generating facilities |
| | • | | changes in law resulting from the new federal energy legislation, including the effects of PUHCA repeal |
| | • | | changes in environmental, tax, and other laws, including requirements for reduced emissions of sulfur, nitrogen, carbon, mercury, and other substances |
| | • | | the potential effects of threatened or actual terrorism and war |
| | • | | the effects of Entergy’s strategies to reduce tax payments |
| | • | | the effects of litigation and government investigations |
| | • | | changes in accounting standards and corporate governance |
| | • | | Entergy’s ability to attract and retain talented management and directors |
FINANCIAL MEASURES
Financial performance measures shown in this report include those calculated and presented in accordance with generally accepted accounting principles (GAAP), as well as those that are considered non-GAAP measures. This report includes non-GAAP measures of operational earnings, operational return on average invested capital, operational return on average common or members’ equity, operational net margin, operational price to earnings ratio and operational common dividend payout ratio, as well as gross liquidity, net debt to net capital, net debt to net capital with off-balance sheet liabilities and pro forma financial results reflecting deconsolidation of Entergy New Orleans, Inc., when describing Entergy’s results of operations and financial performance. We have prepared reconciliations of these measures to the most directly comparable GAAP measures. Reconciliations can be found on pages 9, 11, and 55-67.
2
ENTERGY AT A GLANCE
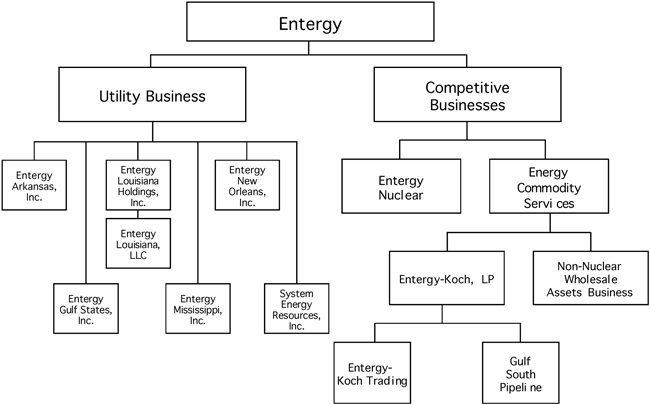
CORPORATE STRUCTURE
CORPORATE PROFILE
Entergy Corporation is a Fortune 500 integrated energy company engaged primarily in electric power production and retail distribution operations.
| | • | | Approximately 30,000 MW electric generating capacity |
| | • | | 2nd-largest U.S. nuclear generator |
| | • | | 2.6 million utility customers |
| | • | | More than $10 billion annual revenues |
| | • | | Approximately 14,500 employees |
| | • | | 97 electric generating units operated |
BUSINESS SEGMENTS
Entergy’s five year results in this report are presented in three business segments:
| | • | | Entergy Nuclear (non-utility nuclear business) |
| | • | | Energy Commodity Services |
Entergy Nuclear and Energy Commodity Services are referred to as Entergy’s Competitive Businesses.
Entergy-Koch, LP sold Entergy-Koch Trading and Gulf South Pipeline in the fourth quarter of 2004, and Entergy-Koch is no longer an operating entity.
3
BUSINESS SEGMENTS (CONTINUED)
UTILITY
Entergy’s utility companies generate, transmit, distribute, and sell electric power, and operate a small natural gas distribution business.
| • | | Five electric utilities with 2.6 million customers |
| • | | Four states – Arkansas, Louisiana, Mississippi, Texas |
| • | | 22,000 MW generating capacity |
| • | | Two gas utilities with 157,000 customers |
ENTERGY ARKANSAS, INC. (EAI )
Entergy Arkansas generates, transmits, distributes, and sells electric power to 679,000 retail customers in portions of Arkansas.
ENTERGY GULF STATES, INC. (EGSI )
Entergy Gulf States generates, transmits, distributes, and sells electric power to 749,000 retail customers in portions of Texas and Louisiana. Entergy Gulf States also provides natural gas utility service to 92,000 customers in the Baton Rouge, Louisiana area.
ENTERGY LOUISIANA, LLC (ELL)
Entergy Louisiana generates, transmits, distributes , and sells electric power to 645,000 retail customers in portions of Louisiana.
ENTERGY MISSISSIPPI, INC. (EMI )
Entergy Mississippi generates, transmits, distributes, and sells electric power to 427,000 retail customers in portions of Mississippi.
ENTERGY NEW ORLEANS, INC. (ENOI)(a)
Entergy New Orleans generates, transmits, distributes, and sells electric power to 95,000 retail customers in the city of New Orleans, Louisiana. Entergy New Orleans also provides natural gas utility service to 65,000 customers in the City of New Orleans .
SYSTEM ENERGY RESOURCES, INC. (SERI )
System Energy owns and leases 90 percent of the Grand Gulf 1 nuclear generating facility. System Energy sells power and capacity from Grand Gulf 1 at wholesale to Entergy Arkansas, Entergy Louisiana, Entergy Mississippi, and Entergy New Orleans.
UTILITY NUCLEAR PLANTS
Entergy owns and operates five nuclear units at four plant sites to serve its regulated utility business: Arkansas Nuclear One (ANO) Units 1 and 2 near Russelville, Arkansas; Grand Gulf Nuclear Station in Port Gibson, Mississippi; River Bend Station in St. Francisville, Louisiana; and Waterford 3 in Taft, Louisiana.
ENTERGY NUCLEAR
Entergy’s non-utility nuclear business owns and operates six nuclear power plants in the northern United States. This business is primarily focused on selling power produced by those plants to wholesale customers. This business also provides operations and management services to nuclear power plants owned by other utilities in the United States.
| • | | Six plants in northern U.S. |
| | • | | Pilgrim Nuclear Station in Plymouth, Massachusetts |
| | • | | James A. FitzPatrick in Oswego, New York |
| | • | | Indian Point Units 2 and 3 in Westchester County, New York |
| | • | | Vermont Yankee in Vernon, Vermont |
| | • | | Palisades Nuclear Energy Plant in South Haven, Michigan (acquired April 2007) |
| • | | 4,998 MW owned generating capacity |
| • | | 800 MW under management services contract |
| | • | | Cooper Nuclear Station located near Brownville, Nebraska |
| • | | Contracts (ongoing and completed) with other nuclear owners to manage decommissioning for 2 plants and license renewal (in partnership with Areva) for 3 plants |
ENERGY COMMODITY SERVICES
The energy commodity services business includes Entergy-Koch and Entergy’s Non-Nuclear Wholesale Assets business. Entergy-Koch engaged in two major businesses: energy commodity marketing and trading through Entergy-Koch Trading, and gas transportation and storage through Gulf South Pipeline. Entergy-Koch sold both of these businesses in the fourth quarter of 2004, and Entergy- Koch is no longer an operating entity.
NON-NUCLEAR WHOLESALE ASSETS BUSINESS
Entergy’s Non-Nuclear Wholesale Assets business sells to wholesale customers the electric power produced by power plants that it owns or controls (1,578 net MW generating capacity) while it focuses on improving performance and exploring sales or restructuring opportunities for its power plants. Such opportunities are evaluated consistent with Entergy’s market-based point-of-view.
(a) | On September 23, 2005, Entergy New Orleans filed a voluntary petition for reorganization under Chapter 11 of the U.S. Bankruptcy Code to protect its customers and ensure continued progress in restoring power and gas service to New Orleans after Hurricane Katrina. As a result of the bankruptcy filing, Entergy discontinued the consolidation of Entergy New Orleans retroactive to January 1, 2005. Entergy New Orleans emerged from Chapter 11 bankruptcy effective May 8, 2007, pursuant to the Confirmation Order from the Bankruptcy Court confirming Entergy New Orleans’ Plan of Reorganization. |
4
EXECUTIVE PROFILES

WAYNE LEONARD – CHAIRMAN AND CHIEF EXECUTIVE OFFICER
Wayne Leonard became Entergy’s chairman and chief executive officer on August 1, 2006 after serving as chief executive officer since January 1, 1999. Leonard joined Entergy in April 1998 as president and chief operating officer of the company’s domestic business, and he assumed additional responsibility for international operations in August 1998. Under Leonard, Entergy has achieved the highest total shareholder return in the industry over the last eight years. In 2006, for the fifth consecutive year, Entergy was named to the Dow Jones Sustainability Index-World and the only U.S. company in the electricity sector listed. In 2005 and 2002, Entergy was honored to receive the electric power industry’s highest honor, the Edison Award, from the Edison Electric Institute. The Platts Global Energy Awards named Leonard 2003 CEO of the Year and Leonard has been a CEO of the Year finalist for the past six consecutive years. Prior to joining Entergy, Leonard was president of Cinergy’s Energy Commodities Strategic Business Unit and president of Cinergy Capital Trading.

RICHARD SMITH – PRESIDENT AND CHIEF OPERATING OFFICER
Rick Smith became president and chief operating officer of Entergy Corporation in April 2007. Smith was previously group president, utility operations (January 2002). In that role he was responsible for the regulated utility financial results, along with operational results of electric and natural gas distribution and customer service; utility regulatory support; and regulated retail activities. Smith joined Entergy in September 1999 as senior vice president, transition management and later served as president of retail operations. Prior to joining Entergy, Smith was president of Cinergy Resources, Inc., a non-regulated retail supply business. Prior to that, he served for three years as vice president of finance for Cinergy’s Energy Services business unit.

LEO DENAULT – EXECUTIVE VICE PRESIDENT AND CHIEF FINANCIAL OFFICER
Leo Denault became executive vice president and chief financial officer in February 2004. He was previously vice president of corporate development and strategic planning. He also held the position of vice president, corporate development, since joining the company in March 1999. Denault assumed responsibility for the areas of strategic planning, the Office of the Chief Risk Officer, and strategic pricing and transmission services in 2002. Prior to joining Entergy, Denault was vice president of corporate development at Cinergy Corporation, where he reviewed every major investment transaction, including the acquisition of generation, distribution and trading businesses in the United States and abroad.

GARY TAYLOR – GROUP PRESIDENT, UTILITY OPERATIONS
Gary Taylor became group president, utility operations in April 2007. He is responsible for the regulated utility financial results, along with operational results of electric and natural gas distribution and customer service. In addition, Taylor oversees utility regulatory support and regulated retail activities. He joined Entergy in March 2000 as chief operating officer of Entergy’s Nuclear South region and became chief executive officer of Entergy’s nuclear business in April 2003. Prior to joining Entergy, Taylor had been vice president of nuclear operations at South Carolina Electric & Gas Company, a subsidiary of SCANA Corporation, since 1995.

MICHAEL KANSLER - PRESIDENT AND CHIEF NUCLEAR OFFICER, ENTERGY NUCLEAR
Michael Kansler became president and chief nuclear officer of Entergy Nuclear in April 2007. He is responsible for all of Entergy’s nuclear plants located throughout New York, Massachusetts, Vermont, Michigan, Louisiana, Mississippi and Arkansas, as well as the company’s management of the Cooper Nuclear Station for the State of Nebraska. Kansler was previously president of Entergy Nuclear Northeast (January 2003) and chief operating officer of Entergy Nuclear Northeast (January 2000). Kansler joined Entergy in 1998 as vice president of operations support, overseeing consolidated support functions for all five of Entergy’s regulated nuclear power units. Prior to joining Entergy, Kansler spent more than 20 years at Virginia Power (now Dominion Resources).

CURT HÉBERT - EXECUTIVE VICE PRESIDENT, EXTERNAL AFFAIRS
Curt Hébert joined Entergy as executive vice president, external affairs in September 2001 after a lengthy career as a government energy regulator at both the federal and state levels. His responsibilities include supervision of the company’s system and federal government relations, system regulatory affairs, external and internal communications, and corporate contribution functions. Prior to joining Entergy, Hébert was chairman of the Federal Energy Regulatory Commission. During Hébert’s four years of service as a member and later chairman, FERC was active in the restructuring of the electric utility and natural gas pipeline industries to promote competition.

MARK SAVOFF - EXECUTIVE VICE PRESIDENT, OPERATIONS
Mark Savoff joined Entergy as executive vice president, operations in December 2003. He is responsible for fossil plant operations, transmission and distribution operations, system environmental and safety, system planning, compliance and performance management. Prior to joining Entergy, Savoff was vice president and corporate officer at GE Power Systems, Nuclear Energy. Before assuming his role as vice president, Nuclear Energy, he was General Manager of GE’s global nuclear fuel business and led the turnaround of GE’s global nuclear services business. He also served as president, Reuter-Stokes, a GE subsidiary.
5
UTILITY OPERATING COMPANY PRESIDENTS

RENAE CONLEY – PRESIDENT & CEO, ENTERGY LOUISIANA AND ENTERGY GULF STATES – LOUISIANA
Renae Conley became president and CEO of Entergy Louisiana and Entergy Gulf States – Louisiana in mid-2000. She is responsible for the Louisiana utilities’ electric and gas distribution systems, customer service, economic development, regulatory and governmental affairs. Prior to joining Entergy in 1999 as vice president of investor relations, Conley was president of The Cincinnati Gas & Electric Company, a subsidiary of Cinergy Corp. Conley also served as president and CEO of Cadence, a joint venture of Cinergy and other utilities that provides energy management services. At Cinergy, Conley was also general manager of corporate communications and investor relations.

JOE DOMINO – PRESIDENT & CEO, ENTERGY GULF STATES – TEXAS
Joe Domino became president and CEO of Entergy Texas in 1998. He is responsible for Entergy Texas’ electric distribution system, customer service, economic development, regulatory and governmental affairs. Prior to being named president, he served as director of Entergy’s distribution operations in Texas and Southwest Louisiana. Domino joined Gulf States Utilities in 1970 as a planning engineer and was appointed director of Southern Region fossil plants in 1994.

HUGH McDONALD – PRESIDENT & CEO, ENTERGY ARKANSAS
Hugh McDonald became president and CEO of Entergy Arkansas in spring 2000. He is responsible for Entergy Arkansas’ electric distribution system, customer service, economic development, regulatory and governmental affairs. Prior to becoming Entergy Arkansas’ president, he led Entergy’s Retail Operations. McDonald joined Entergy in 1982 at the Waterford 3 nuclear plant. In 1989, he became executive assistant to the chairman of Entergy Louisiana/Entergy New Orleans and then led Entergy Louisiana’s Total Quality initiative until 1993. During Entergy’s merger with Gulf States Utilities, McDonald served as the special projects director for the functional integration of the transmission, distribution, and customer service organizations. McDonald has also held the positions of division manager for Entergy Mississippi and director of regulatory affairs, Entergy Gulf States – Texas.

CAROLYN SHANKS – PRESIDENT & CEO, ENTERGY MISSISSIPPI
Carolyn Shanks became president and CEO of Entergy Mississippi in July 1999. She is responsible for Entergy Mississippi’s electric distribution system, customer service, economic development, regulatory and governmental affairs. Shanks joined Entergy in 1983 as an accountant with Entergy Mississippi and later transferred to System Energy Resources, Inc., the subsidiary responsible for the operations of Grand Gulf Nuclear Station. In 1994, she was named director of business services for Entergy Operations, Inc., the subsidiary that manages Entergy’s five nuclear power plants in its retail electric service area. Shanks became vice president, finance and administration of Entergy Nuclear in February 1997.

ROD WEST – PRESIDENT & CEO, ENTERGY NEW ORLEANS
Rod West became president and CEO of Entergy New Orleans on January 1, 2007. He is responsible for Entergy New Orleans’ electric distribution system, customer service, economic development, regulatory and governmental affairs. West was previously director of Entergy New Orleans’ metro distribution operations. West’s primary responsibility during 2006 was restoring New Orleans’ electric distribution system after the devastation brought by Hurricane Katrina. Prior to joining Entergy in April 1999 as senior regulatory counsel, West was senior attorney in the New Orleans office of Vial, Hamilton, Koch and Knox, L.L.P, having previously spent five years with the New Orleans-based firm of Jones, Walker, Waechter, Poitevent, Carrere & Denegre, L.L.P.
6
CONSOLIDATED SELECTED DATA
CONSOLIDATED ENTERGY CORPORATION AND SUBSIDIARIES DATA
SELECTED FINANCIAL AND OPERATING DATA
SELECTED FINANCIAL DATA
| | | | | | | | | | | | | | | | | | | | |
| | | 2006(a) | | | 2005(a) | | | 2004 | | | 2003 | | | 2002 | |
| | | (In millions, except percentages, per share amounts, and ratios) | |
GAAP MEASURES | | | | | | | | | | | | | | | | | | | | |
Operating Revenues | | $ | 10,932 | | | $ | 10,106 | | | $ | 9,686 | | | $ | 9,033 | | | $ | 8,299 | |
As-Reported Earnings | | $ | 1,133 | | | $ | 898 | | | $ | 910 | | | $ | 927 | | | $ | 599 | |
As-Reported Earnings Per Share | | $ | 5.36 | | | $ | 4.19 | | | $ | 3.93 | | | $ | 4.01 | | | $ | 2.64 | |
Shares of Common Stock Outstanding: | | | | | | | | | | | | | | | | | | | | |
End of Year | | | 202.7 | | | | 207.5 | | | | 216.8 | | | | 228.9 | | | | 222.4 | |
Weighted Average – Diluted | | | 211.5 | | | | 214.4 | | | | 231.2 | | | | 231.1 | | | | 227.3 | |
Return on Average Invested Capital – As-Reported | | | 8.5 | % | | | 7.2 | % | | | 7.3 | % | | | 7.4 | % | | | 5.8 | % |
Return on Average Common Equity – As-Reported | | | 14.2 | % | | | 11.2 | % | | | 10.7 | % | | | 11.2 | % | | | 7.8 | % |
Net Cash Flow Provided by Operating Activities | | $ | 3,419 | | | $ | 1,468 | | | $ | 2,929 | | | $ | 2,006 | | | $ | 2,182 | |
Year-End Closing Market Price Per Share of Common Stock | | $ | 92.32 | | | $ | 68.65 | | | $ | 67.59 | | | $ | 57.13 | | | $ | 45.59 | |
Book Value Per Share at End of Year | | $ | 40.45 | | | $ | 37.31 | | | $ | 38.25 | | | $ | 38.02 | | | $ | 35.24 | |
Market Value of Equity at End of Year | | $ | 18,710 | | | $ | 14,247 | | | $ | 14,655 | | | $ | 13,077 | | | $ | 10,140 | |
Price to Earnings Ratio – As-Reported | | | 17.24 | | | | 16.39 | | | | 17.18 | | | | 14.25 | | | | 17.29 | |
Common Dividend Paid Per Share | | $ | 2.16 | | | $ | 2.16 | | | $ | 1.89 | | | $ | 1.60 | | | $ | 1.34 | |
Common Dividend Payout Ratio – As-Reported | | | 40 | % | | | 52 | % | | | 48 | % | | | 40 | % | | | 51 | % |
NON-GAAP MEASURES | | | | | | | | | | | | | | | | | | | | |
Operational Earnings | | $ | 998 | | | $ | 943 | | | $ | 880 | | | $ | 982 | | | $ | 866 | |
Operational Earnings Per Share | | $ | 4.72 | | | $ | 4.40 | | | $ | 3.80 | | | $ | 4.25 | | | $ | 3.81 | |
Special Items Per Share | | $ | 0.64 | | | $ | (0.21 | ) | | $ | 0.13 | | | $ | (0.24 | ) | | $ | (1.17 | ) |
Return on Average Invested Capital – Operational | | | 7.7 | % | | | 7.5 | % | | | 7.1 | % | | | 7.7 | % | | | 7.4 | % |
Return on Average Common Equity – Operational | | | 12.5 | % | | | 11.8 | % | | | 10.4 | % | | | 11.9 | % | | | 11.3 | % |
Price to Earnings Ratio – Operational | | | 19.56 | | | | 15.61 | | | | 17.77 | | | | 13.45 | | | | 11.96 | |
Common Dividend Payout Ratio – Operational | | | 46 | % | | | 49 | % | | | 50 | % | | | 38 | % | | | 35 | % |
|
(a) 2006 and 2005 reflect deconsolidation of Entergy New Orleans, Inc. | |
| | | | | |
UTILITY ELECTRIC OPERATING DATA(a) | | | | | | | | | | | | | | | | | | | | |
| | | | | |
| | | 2006 | | | 2005 | | | 2004 | | | 2003 | | | 2002 | |
Retail Kilowatt-Hour Sales (millions) | | | 100,422 | | | | 99,865 | | | | 102,225 | | | | 99,968 | | | | 101,631 | |
Peak Demand (megawatts) | | | 20,887 | | | | 21,391 | | | | 21,174 | | | | 20,162 | | | | 20,419 | |
Retail Customers – Year End (thousands) | | | 2,595 | | | | 2,629 | | | | 2,662 | | | | 2,631 | | | | 2,597 | |
|
(a) Includes Entergy New Orleans, Inc. | |
| | | | | |
| EMPLOYEES | | | | | | | | | | | | | | | | | | | | |
| | | 2006 | | | 2005 | | | 2004 | | | 2003 | | | 2002 | |
Total Employees – Year End | | | 13,814 | | | | 14,136 | | | | 14,425 | | | | 14,773 | | | | 15,601 | |
OWNED AND LEASED CAPABILITY (MW)(a)
As of April 2007
| | | | | | | | | | | | | | | | | | |
| | | Entergy
Arkansas | | Entergy Gulf States | | Entergy
Louisiana | | Entergy
Mississippi | | Entergy
New Orleans | | System
Energy | | Entergy
Nuclear | | Non- Nuclear
Wholesale(c) | | Total |
Gas/Oil | | 1,390 | | 4,896 | | 4,803 | | 2,809 | | 760 | | — | | — | | 1,317 | | 15,975 |
Coal | | 1,198 | | 627 | | — | | 420 | | — | | — | | — | | 181 | | 2,426 |
Total Fossil | | 2,588 | | 5,523 | | 4,803 | | 3,229 | | 760 | | — | | — | | 1,498 | | 18,401 |
Nuclear | | 1,839 | | 978 | | 1,158 | | — | | — | | 1,139 | | 4,998 | | — | | 10,112 |
Other(b) | | 70 | | — | | — | | — | | — | | — | | — | | 80 | | 150 |
Total | | 4,497 | | 6,501 | | 5,961 | | 3,229 | | 760 | | 1,139 | | 4,998 | | 1,578 | | 28,663 |
(a) | Owned and Leased Capability is the dependable load carrying capability as demonstrated under actual operating conditions based on the primary fuel (assuming no curtailments) that each station was designed to utilize. |
(b) | Other includes Hydro and Wind. |
(c) | Reflects nameplate rating of generating unit. |
7
CONSOLIDATED SELECTED DATA
CONSOLIDATED ENTERGY CORPORATION AND SUBSIDIARIES DATA
CONSOLIDATED QUARTERLY FINANCIAL METRICS
| | | | | | | | | | | | | | | | | | | | | | | |
| | | 1Q | | 2Q | | 2006(a)
3Q | | 4Q | | YTD | | 1Q | | 2Q | | 2005(a)
3Q | | 4Q | | YTD | | YTD %
CHANGE | |
| GAAP MEASURES | | | | | | | | | | | | | | | | | | | | | | | |
As-Reported Earnings ($ millions) | | 193.6 | | 281.8 | | 388.9 | | 268.3 | | 1,132.6 | | 172.0 | | 286.2 | | 350.0 | | 90.2 | | 898.3 | | 26 | |
Return on Average Invested Capital – As-Reported (%)* | | 7.3 | | 7.3 | | 7.5 | | 8.5 | | 8.5 | | 7.0 | | 7.1 | | 7.5 | | 7.2 | | 7.2 | | 18 | |
Return on Average Common Equity – As-Reported (%)* | | 11.5 | | 11.3 | | 11.6 | | 14.2 | | 14.2 | | 10.3 | | 10.7 | | 11.5 | | 11.2 | | 11.2 | | 27 | |
Net Margin – As-Reported (%)* | | 8.7 | | 8.5 | | 8.6 | | 10.4 | | 10.4 | | 9.4 | | 9.5 | | 10.0 | | 8.9 | | 8.9 | | 17 | |
Cash Flow Interest Coverage (# times)* | | 5.0 | | 5.2 | | 6.0 | | 7.2 | | 7.2 | | 7.6 | | 7.1 | | 5.9 | | 4.0 | | 4.0 | | 80 | |
Revolver Capacity ($ millions) | | 2,718 | | 2,710 | | 3,095 | | 2,770 | | 2,770 | | 1,070 | | 1,407 | | 791 | | 2,545 | | 2,545 | | 9 | |
Total Debt ($ millions) | | 9,329 | | 9,402 | | 9,054 | | 9,356 | | 9,356 | | 8,033 | | 8,283 | | 8,865 | | 9,288 | | 9,288 | | 1 | |
Debt to Capital Ratio (%) | | 52.1 | | 52.4 | | 50.4 | | 52.3 | | 52.3 | | 49.0 | | 49.9 | | 51.9 | | 53.1 | | 53.1 | | (2 | ) |
Off-Balance Sheet Liabilities ($ millions) | | 732 | | 671 | | 668 | | 665 | | 665 | | 771 | | 780 | | 779 | | 778 | | 778 | | (15 | ) |
| NON-GAAP MEASURES | | | | | | | | | | | | | | | | | | | | | | | |
Operational Earnings ($ millions) | | 190.2 | | 258.0 | | 382.6 | | 166.9 | | 997.7 | | 173.4 | | 289.0 | | 357.1 | | 123.6 | | 943.0 | | 6 | |
Return on Average Invested Capital – Operational (%)* | | 7.5 | | 7.4 | | 7.5 | | 7.7 | | 7.7 | | 6.9 | | 7.2 | | 7.3 | | 7.5 | | 7.5 | | 3 | |
Return on Average Common Equity – Operational (%)* | | 12.0 | | 11.5 | | 11.6 | | 12.5 | | 12.5 | | 10.2 | | 10.8 | | 11.2 | | 11.8 | | 11.8 | | 6 | |
Net Margin – Operational (%)* | | 9.1 | | 8.6 | | 8.6 | | 9.1 | | 9.1 | | 9.3 | | 9.5 | | 9.7 | | 9.3 | | 9.3 | | (2 | ) |
Total Gross Liquidity ( $ millions) | | 3,470 | | 3,439 | | 3,840 | | 3,786 | | 3,786 | | 1,547 | | 2,014 | | 1,389 | | 3,128 | | 3,128 | | 21 | |
Net Debt to Net Capital Ratio (%) | | 50.0 | | 50.4 | | 48.3 | | 49.4 | | 49.4 | | 47.5 | | 48.0 | | 50.2 | | 51.5 | | 51.5 | | (4 | ) |
Net Debt Ratio Including Off-Balance Sheet Liabilities (%) | | 52.1 | | 52.2 | | 50.2 | | 51.3 | | 51.3 | | 49.9 | | 50.4 | | 52.4 | | 53.7 | | 53.7 | | (4 | ) |
(a) | 2006and 2005 reflect deconsolidation of Entergy New Orleans, Inc. |
| * | Trailing twelve months. Totals may not foot due to rounding. |
CONSOLIDATED ANNUAL FINANCIAL METRICS
| | | | | | | | | | |
| | | 2006(a) | | 2005(a) | | 2004 | | 2003 | | 2002 |
| GAAP MEASURES | | | | | | | | | | |
As-Reported Earnings ($ millions) | | 1,133 | | 898 | | 910 | | 927 | | 599 |
Return on Average Invested Capital – As-Reported (%) | | 8.5 | | 7.2 | | 7.3 | | 7.4 | | 5.8 |
Return on Average Common Equity – As-Reported (%) | | 14.2 | | 11.2 | | 10.7 | | 11.2 | | 7.8 |
Net Margin – As-Reported (%) | | 10.4 | | 8.9 | | 9.4 | | 10.3 | | 7.2 |
Cash Flow Interest Coverage (# times) | | 7.2 | | 4.0 | | 7.1 | | 5.1 | | 4.9 |
Revolver Capacity ($ millions) | | 2,770 | | 2,545 | | 1,490 | | 1,553 | | 1,018 |
Total Debt ($ millions) | | 9,356 | | 9,288 | | 7,807 | | 8,182 | | 8,810 |
Debt to Capital Ratio (%) | | 52.3 | | 53.1 | | 47.4 | | 47.5 | | 51.8 |
Off-Balance Sheet Liabilities ($ millions) | | | | | | | | | | |
Debt of Joint Ventures – Entergy’s Share | | 146 | | 214 | | 173 | | 414 | | 409 |
Leases – Entergy’s Share | | 519 | | 564 | | 596 | | 501 | | 395 |
Total | | 665 | | 778 | | 769 | | 915 | | 804 |
| NON-GAAP MEASURES | | | | | | | | | | |
Operational Earnings ( $ millions) | | 998 | | 943 | | 880 | | 982 | | 866 |
Return on Average Invested Capital – Operational (%) | | 7.7 | | 7.5 | | 7.1 | | 7.7 | | 7.4 |
Return on Average Common Equity – Operational (%) | | 12.5 | | 11.8 | | 10.4 | | 11.9 | | 11.3 |
Net Margin – Operational (%) | | 9.1 | | 9.3 | | 9.1 | | 10.9 | | 10.4 |
Total Gross Liquidity ( $ millions) | | 3,786 | | 3,128 | | 2,110 | | 2,060 | | 2,353 |
Net Debt to Net Capital Ratio (%) | | 49.4 | | 51.5 | | 45.3 | | 45.9 | | 47.7 |
Net Debt Ratio Including Off-Balance Sheet Liabilities (%) | | 51.3 | | 53.7 | | 47.9 | | 48.7 | | 50.3 |
(a) | 2006and 2005 reflect deconsolidation of Entergy New Orleans, Inc. |
8
CONSOLIDATED FINANCIAL RESULTS
FINANCIAL RESULTS
ENTERGY CORPORATION CONSOLIDATED QUARTERLY RESULTS – GAAP TO NON-GAAP RECONCILIATION
| | | | | | | | | | | | | | | | | | | | | | | | | | | | | | | | |
| | | 1Q | | | 2Q | | 2006
3Q | | | 4Q | | | YTD | | | 1Q(a) | | | 2Q(a) | | | 2005
3Q(a) | | | 4Q | | | YTD | | | YTD
CHANGE | |
| | | ($/share) | |
| AS-REPORTED | | | | | | | | | | | | | | | | | | | | | | | | | | | | | | | | |
Utility/Parent/Other | | 0.54 | | | 1.00 | | 1.35 | | | 1.08 | | | 3.97 | | | 0.42 | | | 1.05 | | | 1.35 | | | — | | | 2.82 | | | 1.15 | |
Competitive Businesses | | | | | | | | | | | | | | | | | | | | | | | | | | | | | | | | |
Entergy Nuclear | | 0.39 | | | 0.30 | | 0.50 | | | 0.27 | | | 1.46 | | | 0.36 | | | 0.27 | | | 0.33 | | | 0.37 | | | 1.32 | | | 0.14 | |
Energy Commodity Services | | | | | | | | | | | | | | | | | | | | | | | | | | | | | | | | |
Non-Nuclear Wholesale Assets | | (0.01 | ) | | 0.03 | | (0.02 | ) | | (0.08 | ) | | (0.07 | ) | | 0.01 | | | 0.01 | | | (0.03 | ) | | 0.06 | | | 0.05 | | | (0.12 | ) |
Total Energy Commodity Services | | (0.01 | ) | | 0.03 | | (0.02 | ) | | (0.08 | ) | | (0.07 | ) | | 0.01 | | | 0.01 | | | (0.03 | ) | | 0.06 | | | 0.05 | | | (0.12 | ) |
Total Competitive Businesses | | 0.38 | | | 0.33 | | 0.48 | | | 0.19 | | | 1.39 | | | 0.37 | | | 0.28 | | | 0.30 | | | 0.43 | | | 1.37 | | | 0.02 | |
| Consolidated As-Reported Earnings | | 0.92 | | | 1.33 | | 1.83 | | | 1.27 | | | 5.36 | | | 0.79 | | | 1.33 | | | 1.65 | | | 0.43 | | | 4.19 | | | 1.17 | |
| LESS SPECIAL ITEMS | | | | | | | | | | | | | | | | | | | | | | | | | | | | | | | | |
Utility/Parent/Other | | 0.02 | | | 0.11 | | 0.03 | | | 0.61 | | | 0.77 | | | (0.01 | ) | | (0.01 | ) | | (0.03 | ) | | (0.16 | ) | | (0.21 | ) | | 0.98 | |
Competitive Businesses | | | | | | | | | | | | | | | | | | | | | | | | | | | | | | | | |
Entergy Nuclear | | — | | | — | | — | | | — | | | — | | | — | | | — | | | — | | | — | | | — | | | — | |
Energy Commodity Services | | | | | | | | | | | | | | | | | | | | | | | | | | | | | | | | |
Non-Nuclear Wholesale Assets | | — | | | — | | — | | | (0.13 | ) | | (0.13 | ) | | — | | | — | | | — | | | — | | | — | | | (0.13 | ) |
Total Energy Commodity Services | | — | | | — | | — | | | (0.13 | ) | | (0.13 | ) | | — | | | — | | | — | | | — | | | — | | | (0.13 | ) |
Total Competitive Businesses | | — | | | — | | — | | | (0.13 | ) | | (0.13 | ) | | — | | | — | | | — | | | — | | | — | | | (0.13 | ) |
| Total Special Items | | 0.02 | | | 0.11 | | 0.03 | | | 0.48 | | | 0.64 | | | (0.01 | ) | | (0.01 | ) | | (0.03 | ) | | (0.16 | ) | | (0.21 | ) | | 0.85 | |
| OPERATIONAL | | | | | | | | | | | | | | | | | | | | | | | | | | | | | | | | |
Utility/Parent/Other | | 0.52 | | | 0.89 | | 1.32 | | | 0.47 | | | 3.20 | | | 0.43 | | | 1.06 | | | 1.38 | | | 0.16 | | | 3.03 | | | 0.17 | |
Competitive Businesses | | | | | | | | | | | | | | | | | | | | | | | | | | | | | | | | |
Entergy Nuclear | | 0.39 | | | 0.30 | | 0.50 | | | 0.27 | | | 1.46 | | | 0.36 | | | 0.27 | | | 0.33 | | | 0.37 | | | 1.32 | | | 0.14 | |
Energy Commodity Services | | | | | | | | | | | | | | | | | | | | | | | | | | | | | | | | |
Non-Nuclear Wholesale Assets | | (0.01 | ) | | 0.03 | | (0.02 | ) | | 0.05 | | | 0.06 | | | 0.01 | | | 0.01 | | | (0.03 | ) | | 0.06 | | | 0.05 | | | 0.01 | |
Total Energy Commodity Services | | (0.01 | ) | | 0.03 | | (0.02 | ) | | 0.05 | | | 0.06 | | | 0.01 | | | 0.01 | | | (0.03 | ) | | 0.06 | | | 0.05 | | | 0.01 | |
Total Competitive Businesses | | 0.38 | | | 0.33 | | 0.48 | | | 0.32 | | | 1.52 | | | 0.37 | | | 0.28 | | | 0.30 | | | 0.43 | | | 1.37 | | | 0.15 | |
| Consolidated Operational Earnings | | 0.90 | | | 1.22 | | 1.80 | | | 0.79 | | | 4.72 | | | 0.80 | | | 1.34 | | | 1.68 | | | 0.59 | | | 4.40 | | | 0.32 | |
Weather Impact | | (0.06 | ) | | 0.07 | | 0.06 | | | — | | | 0.07 | | | (0.01 | ) | | — | | | 0.06 | | | 0.05 | | | 0.10 | | | (0.03 | ) |
SHARES OF COMMON STOCK
OUTSTANDING (in millions) | | | | | | | | | | | | | | | | | | | | | | | | | | | | | | | | |
End of Period | | 207.9 | | | 208.1 | | 208.6 | | | 202.7 | | | 202.7 | | | 212.8 | | | 209.9 | | | 207.4 | | | 207.5 | | | 207.5 | | | (4.8 | ) |
Weighted Average - Diluted | | 211.4 | | | 211.6 | | 212.4 | | | 210.6 | | | 211.5 | | | 218.6 | | | 215.6 | | | 212.3 | | | 211.3 | | | 214.4 | | | (2.9 | ) |
(a) | Operationalearnings for first, second, and third quarter 2005 were originally reported as $0.79 per share, $1.33 per share, and $1.65 per share respectively. Following the planned sale of the competitive retail business in Texas announced in fourth quarter 2005, Entergy began treating earnings from this business as a special item, which revises previously reported operational earnings. |
Totals may not foot due to rounding and accretion from share repurchase program.
9
CONSOLIDATED FINANCIAL RESULTS
FINANCIAL RESULTS
ENTERGY CORPORATION CONSOLIDATED QUARTERLY SPECIAL ITEMS (Shown as Positive/(Negative) Impact on Earnings)
| | | | | | | | | | | | | | | | | | | | | | | | | | | | | | | | |
| | | 2006 | | | 2005 | | | YTD
CHANGE | |
| | | 1Q | | | 2Q | | 3Q | | | 4Q | | | YTD | | | 1Q | | | 2Q | | | 3Q | | | 4Q | | | YTD | | |
| | | ($/share) | |
| UTILITY/PARENT/OTHER | | | | | | | | | | | | | | | | | | | | | | | | | | | | | | | | |
| SPECIAL ITEMS | | | | | | | | | | | | | | | | | | | | | | | | | | | | | | | | |
ENOI results | | 0.03 | | | 0.05 | | 0.03 | | | (0.09 | ) | | 0.02 | | | — | | | — | | | — | | | — | | | — | | | 0.02 | |
Entergy-Koch, LP gain | | — | | | — | | — | | | 0.26 | | | 0.26 | | | — | | | — | | | — | | | — | | | — | | | 0.26 | |
Restructuring – Entergy-Koch, LP distribution | | — | | | — | | — | | | 0.49 | | | 0.49 | | | — | | | — | | | — | | | — | | | — | | | 0.49 | |
Retail business discontinued operations | | (0.01 | ) | | 0.06 | | — | | | (0.05 | ) | | — | | | (0.01 | ) | | (0.01 | ) | | (0.03 | ) | | (0.04 | ) | | (0.09 | ) | | 0.09 | |
Retail business impairment reserve | | — | | | — | | — | | | — | | | — | | | — | | | — | | | — | | | (0.12 | ) | | (0.12 | ) | | 0.12 | |
Total | | 0.02 | | | 0.11 | | 0.03 | | | 0.61 | | | 0.77 | | | (0.01 | ) | | (0.01 | ) | | (0.03 | ) | | (0.16 | ) | | (0.21 | ) | | 0.98 | |
| COMPETITIVE BUSINESSES SPECIAL ITEMS | | | | | | | | | | | | | | | | | | | | | | | | | | | | | | | | |
Entergy Nuclear | | — | | | — | | — | | | — | | | — | | | — | | | — | | | — | | | — | | | — | | | — | |
Energy Commodity Services | | | | | | | | | | | | | | | | | | | | | | | | | | | | | | | | |
Non-Nuclear Wholesale Assets | | | | | | | | | | | | | | | | | | | | | | | | | | | | | | | | |
Write-off of tax capital losses | | — | | | — | | — | | | (0.13 | ) | | (0.13 | ) | | — | | | — | | | — | | | — | | | — | | | (0.13 | ) |
Total | | — | | | — | | — | | | (0.13 | ) | | (0.13 | ) | | — | | | — | | | — | | | — | | | — | | | (0.13 | ) |
| TOTAL SPECIAL ITEMS | | 0.02 | | | 0.11 | | 0.03 | | | 0.48 | | | 0.64 | | | (0.01 | ) | | (0.01 | ) | | (0.03 | ) | | (0.16 | ) | | (0.21 | ) | | 0.85 | |
| | | |
| | | 2006 | | | 2005 | | | YTD
CHANGE | |
| | | 1Q | | | 2Q | | 3Q | | | 4Q | | | YTD | | | 1Q | | | 2Q | | | 3Q | | | 4Q | | | YTD | | |
| | | ($ millions) | |
| UTILITY/PARENT/OTHER | | | | | | | | | | | | | | | | | | | | | | | | | | | | | | | | |
| SPECIAL ITEMS | | | | | | | | | | | | | | | | | | | | | | | | | | | | | | | | |
ENOI results | | 5.6 | | | 10.7 | | 7.3 | | | (19.6 | ) | | 4.1 | | | — | | | — | | | — | | | — | | | — | | | 4.1 | |
Entergy-Koch, LP gain | | — | | | — | | — | | | 55.0 | | | 55.0 | | | — | | | — | | | — | | | — | | | — | | | 55.0 | |
Restructuring – Entergy-Koch, LP distribution | | — | | | — | | — | | | 104.0 | | | 104.0 | | | — | | | — | | | — | | | — | | | — | | | 104.0 | |
Retail business discontinued operations | | (2.2 | ) | | 13.1 | | (1.0 | ) | | (10.3 | ) | | (0.5 | ) | | (1.4 | ) | | (2.8 | ) | | (7.1 | ) | | (7.6 | ) | | (18.9 | ) | | 18.4 | |
Retail business impairment reserve | | — | | | — | | — | | | — | | | — | | | — | | | — | | | — | | | (25.8 | ) | | (25.8 | ) | | 25.8 | |
Total | | 3.4 | | | 23.8 | | 6.3 | | | 129.1 | | | 162.6 | | | (1.4 | ) | | (2.8 | ) | | (7.1 | ) | | (33.4 | ) | | (44.7 | ) | | 207.3 | |
| COMPETITIVE BUSINESSES SPECIAL ITEMS | | | | | | | | | | | | | | | | | | | | | | | | | | | | | | | | |
Entergy Nuclear | | — | | | — | | — | | | — | | | — | | | — | | | — | | | — | | | — | | | — | | | — | |
Energy Commodity Services | | | | | | | | | | | | | | | | | | | | | | | | | | | | | | | | |
Non-Nuclear Wholesale Assets | | | | | | | | | | | | | | | | | | | | | | | | | | | | | | | | |
Write-off of tax capital losses | | — | | | — | | — | | | (27.7 | ) | | (27.7 | ) | | — | | | — | | | — | | | — | | | — | | | (27.7 | ) |
Total | | — | | | — | | — | | | (27.7 | ) | | (27.7 | ) | | — | | | — | | | — | | | — | | | — | | | (27.7 | ) |
| TOTAL SPECIAL ITEMS | | 3.4 | | | 23.8 | | 6.3 | | | 101.4 | | | 134.9 | | | (1.4 | ) | | (2.8 | ) | | (7.1 | ) | | (33.4 | ) | | (44.7 | ) | | 179.6 | |
Totals may not foot due to rounding and accretion from share repurchase program.
10
CONSOLIDATED FINANCIAL RESULTS
FINANCIAL RESULTS
ENTERGY CORPORATION CONSOLIDATED ANNUAL RESULTS – GAAP TO NON-GAAP RECONCILIATION
| | | | | | | | | | | | | | | |
| | | 2006 | | | 2005 | | | 2004 | | | 2003 | | | 2002 | |
| | | ($/share) | |
| AS-REPORTED | | | | | | | | | | | | | | | |
Utility/Parent/Other | | 3.97 | | | 2.82 | | | 2.86 | | | 1.93 | | | 2.40 | |
Competitive Businesses | | | | | | | | | | | | | | | |
Entergy Nuclear | | 1.46 | | | 1.32 | | | 1.06 | | | 1.30 | | | 0.88 | |
Energy Commodity Services | | | | | | | | | | | | | | | |
Non-Nuclear Wholesale Assets | | (0.07 | ) | | 0.05 | | | 0.23 | | | (0.10 | ) | | (1.22 | ) |
Entergy-Koch Trading | | — | | | — | | | (0.35 | ) | | 0.80 | | | 0.36 | |
Gulf South Pipeline | | — | | | — | | | 0.13 | | | 0.08 | | | 0.22 | |
Total Energy Commodity Services | | (0.07 | ) | | 0.05 | | | 0.01 | | | 0.78 | | | (0.64 | ) |
Total Competitive Businesses | | 1.39 | | | 1.37 | | | 1.07 | | | 2.08 | | | 0.24 | |
| Consolidated As-Reported Earnings | | 5.36 | | | 4.19 | | | 3.93 | | | 4.01 | | | 2.64 | |
| LESS SPECIAL ITEMS | | | | | | | | | | | | | | | |
Utility/Parent/Other | | 0.77 | | | (0.21 | ) | | 0.07 | | | (0.69 | ) | | — | |
Competitive Businesses | | | | | | | | | | | | | | | |
Entergy Nuclear | | — | | | — | | | — | | | 0.45 | | | — | |
Energy Commodity Services | | | | | | | | | | | | | | | |
Non-Nuclear Wholesale Assets | | (0.13 | ) | | — | | | 0.28 | | | — | | | (1.17 | ) |
Entergy-Koch Trading | | — | | | — | | | (0.35 | ) | | — | | | — | |
Gulf South Pipeline | | — | | | — | | | 0.13 | | | — | | | — | |
Total Energy Commodity Services | | (0.13 | ) | | — | | | 0.06 | | | — | | | (1.17 | ) |
Total Competitive Businesses | | (0.13 | ) | | — | | | 0.06 | | | 0.45 | | | (1.17 | ) |
| Total Special Items | | 0.64 | | | (0.21 | ) | | 0.13 | | | (0.24 | ) | | (1.17 | ) |
| OPERATIONAL | | | | | | | | | | | | | | | |
Utility/Parent/Other | | 3.20 | | | 3.03 | | | 2.79 | | | 2.62 | | | 2.40 | |
Competitive Businesses | | | | | | | | | | | | | | | |
Entergy Nuclear | | 1.46 | | | 1.32 | | | 1.06 | | | 0.85 | | | 0.88 | |
Energy Commodity Services | | | | | | | | | | | | | | | |
Non-Nuclear Wholesale Assets | | 0.06 | | | 0.05 | | | (0.05 | ) | | (0.10 | ) | | (0.05 | ) |
Entergy-Koch Trading | | — | | | — | | | — | | | 0.80 | | | 0.36 | |
Gulf South Pipeline | | — | | | — | | | — | | | 0.08 | | | 0.22 | |
Total Energy Commodity Services | | 0.06 | | | 0.05 | | | (0.05 | ) | | 0.78 | | | 0.53 | |
Total Competitive Businesses | | 1.52 | | | 1.37 | | | 1.01 | | | 1.63 | | | 1.41 | |
| Consolidated Operational Earnings | | 4.72 | | | 4.40 | | | 3.80 | | | 4.25 | | | 3.81 | |
Weather Impact | | 0.07 | | | 0.10 | | | (0.11 | ) | | (0.05 | ) | | (0.01 | ) |
11
CONSOLIDATED FINANCIAL RESULTS
FINANCIAL RESULTS
ENTERGY CORPORATION CONSOLIDATED ANNUAL SPECIAL ITEMS (Shown as Positive/(Negative) Impact on Earnings)
| | | | | | | | | | | | | | | |
| | | 2006 | | | 2005 | | | 2004 | | | 2003 | | | 2002 | |
| | | ($/share) | |
| UTILITY/PARENT/OTHER SPECIAL ITEMS | | | | | | | | | | | | | | | |
ENOI results | | 0.02 | | | — | | | — | | | — | | | — | |
Entergy-Koch, LP gain | | 0.26 | | | — | | | — | | | — | | | — | |
Restructuring – Entergy-Koch, LP distribution | | 0.49 | | | — | | | — | | | — | | | — | |
Retail business impairment reserve | | — | | | (0.12 | ) | | — | | | — | | | — | |
Retail business discontinued operations | | — | | | (0.09 | ) | | — | | | — | | | — | |
Tax benefits – Entergy-Koch investment | | — | | | — | | | 0.07 | | | — | | | — | |
River Bend loss provision | | — | | | — | | | — | | | (0.29 | ) | | — | |
SFAS 143 implementation | | — | | | — | | | — | | | (0.09 | ) | | — | |
Voluntary severance plan | | — | | | — | | | — | | | (0.31 | ) | | — | |
Total | | 0.77 | | | (0.21 | ) | | 0.07 | | | (0.69 | ) | | — | |
| COMPETITIVE BUSINESSES SPECIAL ITEMS | | | | | | | | | | | | | | | |
Entergy Nuclear | | | | | | | | | | | | | | | |
SFAS 143 implementation | | — | | | — | | | — | | | 0.67 | | | — | |
Voluntary severance plan | | — | | | — | | | — | | | (0.22 | ) | | — | |
Energy Commodity Services | | | | | | | | | | | | | | | |
Non-Nuclear Wholesale Assets write-off of tax capital losses | | (0.13 | ) | | — | | | — | | | — | | | — | |
Entergy-Koch Trading earnings | | — | | | — | | | (0.35 | ) | | — | | | — | |
Gulf South Pipeline earnings | | — | | | — | | | 0.13 | | | — | | | — | |
Tax benefits on restructuring | | — | | | — | | | 0.41 | | | — | | | — | |
Asset impairment reserve | | — | | | — | | | (0.15 | ) | | — | | | — | |
Reduction in asset sale reserves | | — | | | — | | | 0.02 | | | — | | | — | |
Gain (loss) on disposition of assets | | — | | | — | | | — | | | — | | | 0.23 | |
Asset and contract impairments | | — | | | — | | | — | | | — | | | (0.62 | ) |
Turbine commitment | | — | | | — | | | — | | | — | | | (0.52 | ) |
Development costs | | — | | | — | | | — | | | — | | | (0.09 | ) |
Restructuring costs | | — | | | — | | | — | | | — | | | (0.17 | ) |
Total | | (0.13 | ) | | — | | | 0.06 | | | 0.45 | | | (1.17 | ) |
| TOTAL SPECIAL ITEMS | | 0.64 | | | (0.21 | ) | | 0.13 | | | (0.24 | ) | | (1.17 | ) |
| | | | | |
| | | 2006 | | | 2005 | | | 2004 | | | 2003 | | | 2002 | |
| | | ($ millions) | |
| UTILITY/PARENT/OTHER SPECIAL ITEMS | | | | | | | | | | | | | | | |
ENOI results | | 4.1 | | | — | | | — | | | — | | | — | |
Entergy-Koch, LP gain | | 55.0 | | | — | | | — | | | — | | | — | |
Restructuring – Entergy-Koch, LP distribution | | 104.0 | | | — | | | — | | | — | | | — | |
Retail business impairment reserve | | — | | | (25.8 | ) | | — | | | — | | | — | |
Retail business discontinued operations | | (0.5 | ) | | (18.9 | ) | | — | | | — | | | — | |
Tax benefits – Entergy-Koch investment | | — | | | — | | | 16.7 | | | — | | | — | |
River Bend loss provision | | — | | | — | | | — | | | (65.6 | ) | | — | |
SFAS 143 implementation | | — | | | — | | | — | | | (21.3 | ) | | — | |
Voluntary severance plan | | — | | | — | | | — | | | (71.0 | ) | | — | |
Total | | 162.6 | | | (44.7 | ) | | 16.7 | | | (157.9 | ) | | — | |
| COMPETITIVE BUSINESSES SPECIAL ITEMS | | | | | | | | | | | | | | | |
Entergy Nuclear | | | | | | | | | | | | | | | |
SFAS 143 implementation | | — | | | — | | | — | | | 154.4 | | | — | |
Voluntary severance plan | | — | | | — | | | — | | | (51.8 | ) | | — | |
Energy Commodity Services | | | | | | | | | | | | | | | |
Non-Nuclear Wholesale Assets write-off of tax capital losses | | (27.7 | ) | | — | | | — | | | — | | | — | |
Entergy-Koch Trading earnings | | — | | | — | | | (79.4 | ) | | — | | | — | |
Gulf South Pipeline earnings | | — | | | — | | | 29.3 | | | — | | | — | |
Tax benefits on restructuring | | — | | | — | | | 93.6 | | | — | | | — | |
Asset impairment reserve | | — | | | — | | | (35.8 | ) | | — | | | — | |
Reduction in asset sale reserves | | — | | | — | | | 5.6 | | | — | | | — | |
Gain (loss) on disposition of assets | | — | | | — | | | — | | | 0.7 | | | 52.3 | |
Asset and contract impairments | | — | | | — | | | — | | | — | | | (141.9 | ) |
Turbine commitment | | — | | | — | | | — | | | — | | | (117.2 | ) |
Development costs | | — | | | — | | | — | | | — | | | (21.3 | ) |
Restructuring costs | | — | | | — | | | — | | | — | | | (39.0 | ) |
Total | | (27.7 | ) | | — | | | 13.3 | | | 103.3 | | | (267.1 | ) |
| TOTAL SPECIAL ITEMS | | 134.9 | | | (44.7 | ) | | 30.0 | | | (54.6 | ) | | (267.1 | ) |
12
CONSOLIDATED FINANCIAL RESULTS
FINANCIAL RESULTS
DESCRIPTION OF ENTERGY CORPORATION CONSOLIDATED SPECIAL ITEMS
| | |
| UTILITY/PARENT/OTHER SPECIAL ITEMS | | Main Earnings Category |
ENOI results | | Other income: equity in earnings (loss) of unconsolidated equity affiliates |
Entergy-Koch, LP gain | | Other income: equity in earnings (loss) of unconsolidated equity affiliates |
Restructuring – Entergy-Koch, LP distribution | | Income taxes |
Retail business impairment reserve | | Discontinued operations |
Retail business discontinued operations | | Discontinued operations |
Tax benefits – Entergy-Koch investment | | Income taxes |
River Bend loss provision | | Other income: miscellaneous-net |
SFAS 143 implementation | | Cumulative effect of accounting changes |
Voluntary severance plan | | Operating expenses: Other operation and maintenance |
| |
| COMPETITIVE BUSINESSES SPECIAL ITEMS | | |
Entergy Nuclear | | |
SFAS 143 implementation | | Cumulative effect of accounting changes |
Voluntary severance plan | | Operating expenses: Other operation and maintenance |
Energy Commodity Services | | |
Non-Nuclear Wholesale Assets write-off of tax capital losses | | Income taxes |
Entergy-Koch Trading earnings | | Other income: equity in earnings (loss) of unconsolidated equity affiliates |
Gulf South Pipeline earnings | | Other income: equity in earnings (loss) of unconsolidated equity affiliates |
Tax benefits on restructuring | | Income taxes |
Asset impairment reserve | | Operating expenses: Provision for turbine commitments, asset impairments and restructuring charges |
Reduction in asset sale reserves | | Operating expenses: Provision for turbine commitments, asset impairments and restructuring charges |
Gain (loss) on disposition of assets | | Operating expenses: Provision for turbine commitments, asset impairments and restructuring charges |
Asset and contract impairments | | Operating expenses: Provision for turbine commitments, asset impairments and restructuring charges |
Turbine commitment | | Operating expenses: Provision for turbine commitments, asset impairments and restructuring charges |
Development costs | | Operating expenses: Provision for turbine commitments, asset impairments and restructuring charges |
Restructuring costs | | Operating expenses: Provision for turbine commitments, asset impairments and restructuring charges |
13
CONSOLIDATED FINANCIAL RESULTS
FINANCIAL RESULTS
CONSOLIDATED STATEMENTS OF INCOME
| | | | | | | | | | | | | | | | | | | | |
| | | 2006(a) | | | 2005(a) | | | 2004(b) | | | 2003 | | | 2002 | |
| | | In thousands, except share data, for the years ended December 31, | |
OPERATING REVENUES: | | | | | | | | | | | | | | | | | | | | |
Domestic electric | | $ | 9,063,135 | | | $ | 8,446,830 | | | $ | 7,932,577 | | | $ | 7,397,175 | | | $ | 6,646,414 | |
Natural gas | | | 84,230 | | | | 77,660 | | | | 208,499 | | | | 186,176 | | | | 125,353 | |
Competitive businesses | | | 1,784,793 | | | | 1,581,757 | | | | 1,544,445 | | | | 1,449,363 | | | | 1,527,285 | |
Total | | | 10,932,158 | | | | 10,106,247 | | | | 9,685,521 | | | | 9,032,714 | | | | 8,299,052 | |
OPERATING EXPENSES: | | | | | | | | | | | | | | | | | | | | |
Operating and maintenance: | | | | | | | | | | | | | | | | | | | | |
Fuel, fuel-related expenses, and gas purchased for resale | | | 3,144,073 | | | | 2,176,015 | | | | 2,488,208 | | | | 1,987,217 | | | | 2,154,596 | |
Purchased power | | | 2,138,237 | | | | 2,521,247 | | | | 1,701,610 | | | | 1,579,057 | | | | 829,995 | |
Nuclear refueling outage expenses | | | 169,567 | | | | 162,653 | | | | 166,072 | | | | 159,995 | | | | 105,592 | |
Provision for turbine commitments, asset impairments, and restructuring charges | | | — | | | | — | | | | 55,000 | | | | (7,743 | ) | | | 428,456 | |
Other operation and maintenance | | | 2,335,364 | | | | 2,122,206 | | | | 2,268,332 | | | | 2,423,951 | | | | 2,468,551 | |
Decommissioning | | | 145,884 | | | | 143,121 | | | | 149,529 | | | | 146,100 | | | | 76,417 | |
Taxes other than income taxes | | | 428,561 | | | | 382,521 | | | | 403,635 | | | | 402,571 | | | | 379,967 | |
Depreciation and amortization | | | 887,792 | | | | 856,377 | | | | 893,574 | | | | 849,771 | | | | 838,472 | |
Other regulatory credits – net | | | (122,680 | ) | | | (49,882 | ) | | | (90,611 | ) | | | (13,761 | ) | | | (141,836 | ) |
Total | | | 9,126,798 | | | | 8,314,258 | | | | 8,035,349 | | | | 7,527,158 | | | | 7,140,210 | |
OPERATING INCOME | | | 1,805,360 | | | | 1,791,989 | | | | 1,650,172 | | | | 1,505,556 | | | | 1,158,842 | |
OTHER INCOME: | | | | | | | | | | | | | | | | | | | | |
Allowance for equity funds used during construction | | | 39,894 | | | | 45,736 | | | | 39,582 | | | | 42,710 | | | | 31,658 | |
Interest and dividend income | | | 198,835 | | | | 150,479 | | | | 109,635 | | | | 87,334 | | | | 118,282 | |
Equity in earnings (loss) of unconsolidated equity affiliates | | | 93,744 | | | | 985 | | | | (78,727 | ) | | | 271,647 | | | | 183,878 | |
Miscellaneous – net | | | 16,114 | | | | 14,251 | | | | 55,509 | | | | (76,376 | ) | | | 13,864 | |
Total | | | 348,587 | | | | 211,451 | | | | 125,999 | | | | 325,315 | | | | 347,682 | |
INTEREST AND OTHER CHARGES: | | | | | | | | | | | | | | | | | | | | |
Interest on long-term debt | | | 498,451 | | | | 440,334 | | | | 463,384 | | | | 485,964 | | | | 526,442 | |
Other interest – net | | | 75,502 | | | | 64,646 | | | | 40,133 | | | | 52,868 | | | | 70,401 | |
Allowance for borrowed funds used during construction | | | (23,931 | ) | | | (29,376 | ) | | | (25,741 | ) | | | (33,191 | ) | | | (24,538 | ) |
Preferred dividend requirements and other | | | 27,783 | | | | 25,427 | | | | 23,525 | | | | 23,524 | | | | 23,712 | |
Total | | | 577,805 | | | | 501,031 | | | | 501,301 | | | | 529,165 | | | | 596,017 | |
INCOME FROM CONTINUING OPERATIONS BEFOREINCOME TAXES AND CUMULATIVE EFFECT OF ACCOUNTING CHANGES | | | 1,576,142 | | | | 1,502,409 | | | | 1,274,870 | | | | 1,301,706 | | | | 910,507 | |
Income taxes | | | 443,044 | | | | 559,284 | | | | 365,305 | | | | 497,433 | | | | 300,592 | |
INCOME FROM CONTINUING OPERATIONS BEFORE CUMULATIVE EFFECT OF ACCOUNTING CHANGES | | | 1,133,098 | | | | 943,125 | | | | 909,565 | | | | 804,273 | | | | 609,915 | |
LOSS FROM DISCONTINUED OPERATIONS (net of income tax expense (benefit) of $67, $(24,051), $603, $(7,359), $(6,654) respectively) | | | (496 | ) | | | (44,794 | ) | | | (41 | ) | | | (14,404 | ) | | | (10,555 | ) |
CUMULATIVE EFFECT OF ACCOUNTING CHANGES (net of income taxes of $ 89,925 in 2003) | | | — | | | | — | | | | — | | | | 137,074 | | | | — | |
CONSOLIDATED NET INCOME | | $ | 1,132,602 | | | $ | 898,331 | | | $ | 909,524 | | | $ | 926,943 | | | $ | 599,360 | |
Basic earnings (loss) per average common share: | | | | | | | | | | | | | | | | | | | | |
Continuing operations | | $ | 5.46 | | | $ | 4.49 | | | $ | 4.01 | | | $ | 3.55 | | | $ | 2.73 | |
Discontinued operations | | | — | | | $ | (0.21 | ) | | | — | | | $ | (0.06 | ) | | $ | (0.04 | ) |
Cumulative effect of accounting changes | | | — | | | | — | | | | — | | | $ | 0.60 | | | | — | |
Basic earnings (loss) per average common share | | $ | 5.46 | | | $ | 4.27 | | | $ | 4.01 | | | $ | 4.09 | | | $ | 2.69 | |
Diluted earnings (loss) per average common share: | | | | | | | | | | | | | | | | | | | | |
Continuing operations | | $ | 5.36 | | | $ | 4.40 | | | $ | 3.93 | | | $ | 3.48 | | | $ | 2.68 | |
Discontinued operations | | | — | | | $ | (0.21 | ) | | | — | | | $ | (0.06 | ) | | $ | (0.04 | ) |
Cumulative effect of accounting changes | | | — | | | | — | | | | — | | | $ | 0.59 | | | | — | |
Diluted earnings (loss) per average common share | | $ | 5.36 | | | $ | 4.19 | | | $ | 3.93 | | | $ | 4.01 | | | $ | 2.64 | |
Dividends declared per common share | | $ | 2.16 | | | $ | 2.16 | | | $ | 1.89 | | | $ | 1.60 | | | $ | 1.34 | |
Average number of common shares outstanding: | | | | | | | | | | | | | | | | | | | | |
Basic | | | 207,456,838 | | | | 210,141,887 | | | | 226,863,758 | | | | 226,804,370 | | | | 223,047,431 | |
Diluted | | | 211,452,455 | | | | 214,441,362 | | | | 231,193,686 | | | | 231,146,040 | | | | 227,303,103 | |
(a) | 2006 and 2005 reflect deconsolidation of Entergy NewOrleans, Inc. |
(b) | Pro Forma Income Statement reflecting deconsolidation of Entergy NewOrleans, Inc. can be found on page 55. |
Certain prior year data has been reclassified to conform with current year presentation.
14
CONSOLIDATED FINANCIAL RESULTS
FINANCIAL RESULTS
2006 CONSOLIDATING INCOME STATEMENT (unaudited)(a)
| | | | | | | | | | | | | | | | |
| | | Utility/
Parent/
Other | | | Competitive
Businesses | | | Eliminations | | | Consolidated | |
| | | In thousands, except share data, for the year ended December 31, 2006. | |
OPERATING REVENUES: | | | | | | | | | | | | | | | | |
Domestic electric | | $ | 9,065,800 | | | $ | — | | | $ | (2,665 | ) | | $ | 9,063,135 | |
Natural gas | | | 84,230 | | | | — | | | | — | | | | 84,230 | |
Competitive businesses | | | 39,817 | | | | 1,780,354 | | | | (35,378 | ) | | | 1,784,793 | |
Total | | | 9,189,847 | | | | 1,780,354 | | | | (38,043 | ) | | | 10,932,158 | |
OPERATING EXPENSES: | | | | | | | | | | | | | | | | |
Operating and maintenance: | | | | | | | | | | | | | | | | |
Fuel, fuel-related expenses, and gas purchased for resale | | | 2,880,857 | | | | 263,215 | | | | — | | | | 3,144,073 | |
Purchased power | | | 2,120,770 | | | | 53,618 | | | | (36,151 | ) | | | 2,138,237 | |
Nuclear refueling outage expenses | | | 78,110 | | | | 91,457 | | | | — | | | | 169,567 | |
Other operation and maintenance | | | 1,614,002 | | | | 723,711 | | | | (2,349 | ) | | | 2,335,364 | |
Decommissioning | | | 82,912 | | | | 62,972 | | | | — | | | | 145,884 | |
Taxes other than income taxes | | | 363,897 | | | | 64,664 | | | | — | | | | 428,561 | |
Depreciation and amortization | | | 808,517 | | | | 79,275 | | | | — | | | | 887,792 | |
Other regulatory credits – net | | | (122,680 | ) | | | — | | | | — | | | | (122,680 | ) |
Total | | | 7,826,385 | | | | 1,338,912 | | | | (38,500 | ) | | | 9,126,798 | |
OPERATING INCOME | | | 1,363,462 | | | | 441,442 | | | | 457 | | | | 1,805,360 | |
OTHER INCOME (DEDUCTIONS): | | | | | | | | | | | | | | | | |
Allowance for equity funds used during construction | | | 39,894 | | | | — | | | | — | | | | 39,894 | |
Interest and dividend income | | | 163,717 | | | | 123,703 | | | | (88,586 | ) | | | 198,835 | |
Equity in earnings (loss) of unconsolidated equity affiliates | | | 95,366 | | | | (1,622 | ) | | | — | | | | 93,744 | |
Miscellaneous – net | | | 555 | | | | 16,016 | | | | (457 | ) | | | 16,114 | |
Total | | | 299,532 | | | | 138,097 | | | | (89,042 | ) | | | 348,587 | |
INTEREST AND OTHER CHARGES: | | | | | | | | | | | | | | | | |
Interest on long-term debt | | | 489,282 | | | | 9,170 | | | | — | | | | 498,451 | |
Other interest – net | | | 99,196 | | | | 64,836 | | | | (88,530 | ) | | | 75,502 | |
Allowance for borrowed funds used during construction | | | (23,931 | ) | | | — | | | | — | | | | (23,931 | ) |
Preferred dividend requirements and other | | | 24,363 | | | | 3,475 | | | | (55 | ) | | | 27,783 | |
Total | | | 588,910 | | | | 77,481 | | | | (88,585 | ) | | | 577,805 | |
INCOME FROM CONTINUING OPERATIONSBEFORE INCOME TAXES | | | 1,074,084 | | | | 502,058 | | | | — | | | | 1,576,142 | |
Income taxes | | | 234,789 | | | | 208,255 | | | | — | | | | 443,044 | |
INCOME FROM CONTINUING OPERATIONS | | | 839,295 | | | | 293,803 | | | | — | | | | 1,133,098 | |
LOSS FROM DISCONTINUED OPERATIONS (net of income tax expense of $67) | | | (496 | ) | | | — | | | | — | | | | (496 | ) |
CONSOLIDATED NET INCOME | | $ | 838,799 | | | $ | 293,803 | | | $ | — | | | $ | 1,132,602 | |
Earnings Per Average Common Share (from continuing operations): | | | | | | | | | | | | | | | | |
Basic | | $ | 4.04 | | | $ | 1.42 | | | $ | — | | | $ | 5.46 | |
Diluted | | $ | 3.97 | | | $ | 1.39 | | | $ | — | | | $ | 5.36 | |
Earnings Per Average Common Share: | | | | | | | | | | | | | | | | |
Basic | | $ | 4.04 | | | $ | 1.42 | | | $ | — | | | $ | 5.46 | |
Diluted | | $ | 3.97 | | | $ | 1.39 | | | $ | — | | | $ | 5.36 | |
(a) | 2006 reflects deconsolidation of Entergy New Orleans, Inc. |
Totals may not foot due to rounding.
15
CONSOLIDATED FINANCIAL RESULTS
FINANCIAL RESULTS
CONSOLIDATED BALANCE SHEETS
| | | | | | | | | | | | | | | | | | | | |
| | | 2006(a) | | | 2005(a) | | | 2004(b) | | | 2003 | | | 2002 | |
| | | In thousands, as of December 31, | |
ASSETS | | | | | | | | | | | | | | | | | | | | |
CURRENT ASSETS: | | | | | | | | | | | | | | | | | | | | |
Cash and cash equivalents: | | | | | | | | | | | | | | | | | | | | |
Cash | | $ | 117,379 | | | $ | 221,773 | | | $ | 79,136 | | | $ | 115,112 | | | $ | 169,788 | |
Temporary cash investments – at cost, which approximates market | | | 898,773 | | | | 361,047 | | | | 540,650 | | | | 392,013 | | | | 1,165,260 | |
Special deposits | | | — | | | | — | | | | — | | | | 308 | | | | 280 | |
Total cash and cash equivalents | | | 1,016,152 | | | | 582,820 | | | | 619,786 | | | | 507,433 | | | | 1,335,328 | |
Other temporary investments | | | — | | | | — | | | | 187,950 | | | | 234,800 | | | | — | |
Notes receivable - Entergy New Orleans DIP loan | | | 51,934 | | | | 90,000 | | | | — | | | | — | | | | — | |
Notes receivable | | | 699 | | | | 3,227 | | | | 3,092 | | | | 1,730 | | | | 2,078 | |
Accounts receivable: | | | | | | | | | | | | | | | | | | | | |
Customer | | | 410,512 | | | | 629,717 | | | | 435,191 | | | | 398,091 | | | | 323,215 | |
Allowance for doubtful accounts | | | (19,348 | ) | | | (30,805 | ) | | | (23,758 | ) | | | (25,976 | ) | | | (27,285 | ) |
Other | | | 487,264 | | | | 459,152 | | | | 342,289 | | | | 246,824 | | | | 244,621 | |
Accrued unbilled revenues | | | 249,165 | | | | 477,570 | | | | 460,039 | | | | 384,860 | | | | 319,133 | |
Total receivables | | | 1,127,593 | | | | 1,535,634 | | | | 1,213,761 | | | | 1,003,799 | | | | 859,684 | |
Deferred fuel costs | | | — | | | | 543,927 | | | | 55,069 | | | | 245,973 | | | | 55,653 | |
Accumulated deferred income taxes | | | 11,680 | | | | — | | | | 76,899 | | | | — | | | | — | |
Fuel inventory – at average cost | | | 193,098 | | | | 206,195 | | | | 127,251 | | | | 110,482 | | | | 96,467 | |
Materials and supplies – at average cost | | | 604,998 | | | | 610,932 | | | | 569,407 | | | | 548,921 | | | | 525,900 | |
Deferred nuclear refueling outage costs | | | 147,521 | | | | 164,152 | | | | 129,718 | | | | 138,836 | | | | 163,646 | |
Prepayments and other | | | 171,759 | | | | 325,795 | | | | 116,279 | | | | 127,270 | | | | 166,827 | |
Total | | | 3,325,434 | | | | 4,062,682 | | | | 3,099,212 | | | | 2,919,244 | | | | 3,205,583 | |
OTHER PROPERTY AND INVESTMENTS: | | | | | | | | | | | | | | | | | | | | |
Investment in affiliates – at equity | | | 229,089 | | | | 296,784 | | | | 231,779 | | | | 1,053,328 | | | | 824,209 | |
Decommissioning trust funds | | | 2,858,523 | | | | 2,606,765 | | | | 2,453,406 | | | | 2,278,533 | | | | 2,069,198 | |
Non-utility property – at cost (less accumulated depreciation) | | | 212,726 | | | | 228,833 | | | | 219,717 | | | | 262,384 | | | | 297,294 | |
Other | | | 47,115 | | | | 81,535 | | | | 90,992 | | | | 152,681 | | | | 277,539 | |
Total | | | 3,347,453 | | | | 3,213,917 | | | | 2,995,894 | | | | 3,746,926 | | | | 3,468,240 | |
PROPERTY, PLANT AND EQUIPMENT: | | | | | | | | | | | | | | | | | | | | |
Electric | | | 30,713,284 | | | | 29,161,027 | | | | 29,053,340 | | | | 28,035,899 | | | | 26,789,538 | |
Property under capital lease | | | 730,182 | | | | 727,565 | | | | 738,554 | | | | 751,815 | | | | 746,624 | |
Natural gas | | | 92,787 | | | | 86,794 | | | | 262,787 | | | | 236,622 | | | | 209,969 | |
Construction work in progress | | | 786,147 | | | | 1,524,085 | | | | 1,197,551 | | | | 1,380,982 | | | | 1,232,891 | |
Nuclear fuel under capital lease | | | 269,485 | | | | 271,615 | | | | 262,469 | | | | 278,683 | | | | 259,433 | |
Nuclear fuel | | | 561,291 | | | | 436,646 | | | | 320,813 | | | | 234,421 | | | | 263,609 | |
Total property, plant and equipment | | | 33,153,176 | | | | 32,207,732 | | | | 31,835,514 | | | | 30,918,422 | | | | 29,502,064 | |
Less - accumulated depreciation and amortization | | | 13,715,099 | | | | 13,010,687 | | | | 13,139,883 | | | | 12,619,625 | | | | 11,837,061 | |
Property, plant and equipment – net | | | 19,438,077 | | | | 19,197,045 | | | | 18,695,631 | | | | 18,298,797 | | | | 17,665,003 | |
DEFERRED DEBITS AND OTHER ASSETS: | | | | | | | | | | | | | | | | | | | | |
Regulatory assets: | | | | | | | | | | | | | | | | | | | | |
SFAS 109 regulatory asset – net | | | 740,110 | | | | 735,221 | | | | 746,413 | | | | 830,539 | | | | 844,105 | |
Other regulatory assets | | | 2,768,352 | | | | 2,133,724 | | | | 1,429,261 | | | | 1,398,323 | | | | 973,185 | |
Deferred fuel costs | | | 168,122 | | | | 120,489 | | | | 30,842 | | | | — | | | | — | |
Long-term receivables | | | 19,349 | | | | 25,572 | | | | 39,417 | | | | 20,886 | | | | 24,703 | |
Goodwill | | | 377,172 | | | | 377,172 | | | | 377,172 | | | | 377,172 | | | | 377,172 | |
Other | | | 898,662 | | | | 991,835 | | | | 918,871 | | | | 935,501 | | | | 946,375 | |
Total | | | 4,971,767 | | | | 4,384,013 | | | | 3,541,976 | | | | 3,562,421 | | | | 3,165,540 | |
TOTAL ASSETS | | $ | 31,082,731 | | | $ | 30,857,657 | | | $ | 28,332,713 | | | $ | 28,527,388 | | | $ | 27,504,366 | |
(a) | 2006 and 2005reflect deconsolidation of Entergy NewOrleans, Inc. |
(b) | ProForma Balance Sheetreflecting deconsolidation of Entergy New Orleans, Inc. can be found on pages 56 – 57. |
Certain prior year data has been reclassified to conform with current year presentation.
16
CONSOLIDATED FINANCIAL RESULTS
FINANCIAL RESULTS
CONSOLIDATED BALANCE SHEETS
| | | | | | | | | | | | | | | | | | | | |
| | | 2006(a) | | | 2005(a) | | | 2004(b) | | | 2003 | | | 2002 | |
| | | In thousands, as of December 31, | |
LIABILITIES AND SHAREHOLDERS’ EQUITY | | | | | | | | | | | | | | | | | | | | |
CURRENT LIABILITIES: | | | | | | | | | | | | | | | | | | | | |
Currently maturing long-term debt | | $ | 181,576 | | | $ | 103,517 | | | $ | 492,564 | | | $ | 524,372 | | | $ | 1,191,320 | |
Notes payable | | | 25,039 | | | | 40,041 | | | | 193 | | | | 351 | | | | 351 | |
Accounts payable | | | 1,122,596 | | | | 1,655,787 | | | | 896,528 | | | | 796,572 | | | | 855,446 | |
Customer deposits | | | 248,031 | | | | 222,206 | | | | 222,320 | | | | 199,620 | | | | 198,442 | |
Taxes accrued | | | 187,324 | | | | 188,159 | | | | 224,011 | | | | 224,926 | | | | 385,315 | |
Accumulated deferred income taxes | | | — | | | | 143,409 | | | | — | | | | 22,963 | | | | 26,468 | |
Nuclear refueling outage costs | | | — | | | | — | | | | — | | | | 8,238 | | | | 14,244 | |
Interest accrued | | | 160,831 | | | | 154,855 | | | | 144,478 | | | | 139,603 | | | | 175,440 | |
Deferred fuel costs | | | 73,031 | | | | — | | | | — | | | | — | | | | — | |
Obligations under capital leases | | | 153,246 | | | | 130,882 | | | | 133,847 | | | | 159,978 | | | | 153,822 | |
Pension and other postretirement liabilities | | | 41,912 | | | | — | | | | — | | | | — | | | | — | |
Other | | | 271,544 | | | | 473,510 | | | | 218,442 | | | | 145,453 | | | | 171,341 | |
Total | | | 2,465,130 | | | | 3,112,366 | | | | 2,332,383 | | | | 2,222,076 | | | | 3,172,189 | |
NON-CURRENT LIABILITIES: | | | | | | | | | | | | | | | | | | | | |
Accumulated deferred income taxes and taxes accrued | | | 5,820,700 | | | | 5,282,759 | | | | 5,070,912 | | | | 4,779,513 | | | | 4,250,800 | |
Accumulated deferred investment tax credits | | | 358,550 | | | | 376,550 | | | | 399,228 | | | | 420,248 | | | | 447,925 | |
Obligations under capital leases | | | 188,033 | | | | 175,005 | | | | 146,060 | | | | 153,898 | | | | 155,943 | |
Other regulatory liabilities | | | 449,237 | | | | 408,667 | | | | 329,767 | | | | 291,239 | | | | 185,579 | |
Decommissioning and retirement cost liabilities | | | 2,023,846 | | | | 1,923,971 | | | | 2,066,277 | | | | 2,215,490 | | | | 2,115,744 | |
Transition to competition | | | 79,098 | | | | 79,101 | | | | 79,101 | | | | 79,098 | | | | 79,098 | |
Regulatory reserves | | | 219 | | | | 18,624 | | | | 103,061 | | | | 69,528 | | | | 56,438 | |
Accumulated provisions | | | 88,902 | | | | 144,880 | | | | 549,914 | | | | 506,960 | | | | 389,868 | |
Pension and other postretirement liabilities | | | 1,410,433 | | | | 1,118,964 | | | | — | | | | — | | | | — | |
Long-term debt | | | 8,798,087 | | | | 8,824,493 | | | | 7,016,831 | | | | 7,322,940 | | | | 7,308,649 | |
Preferred stock with sinking fund | | | 10,500 | | | | 13,950 | | | | 17,400 | | | | 20,852 | | | | — | |
Other | | | 847,196 | | | | 1,184,082 | | | | 1,554,212 | | | | 1,407,551 | | | | 1,145,232 | |
Total | | | 20,074,801 | | | | 19,551,046 | | | | 17,332,763 | | | | 17,267,317 | | | | 16,135,276 | |
Preferred stock with sinking fund | | | — | | | | — | | | | — | | | | — | | | | 24,327 | |
Preferred stock without sinking fund | | | 344,913 | | | | 445,974 | | | | 365,356 | | | | 334,337 | | | | 334,337 | |
SHAREHOLDERS’ EQUITY: | | | | | | | | | | | | | | | | | | | | |
Common stock, $.01 par value, authorized 500,000,000 shares; issued 248,174,087 shares in 2006, 2005, 2004, 2003 and 2002 | | | 2,482 | | | | 2,482 | | | | 2,482 | | | | 2,482 | | | | 2,482 | |
Paid-in capital | | | 4,827,265 | | | | 4,817,637 | | | | 4,835,375 | | | | 4,767,615 | | | | 4,666,753 | |
Retained earnings | | | 6,113,042 | | | | 5,433,931 | | | | 4,989,826 | | | | 4,502,508 | | | | 3,938,693 | |
Accumulated other comprehensive loss | | | (100,512 | ) | | | (343,819 | ) | | | (93,453 | ) | | | (7,795 | ) | | | (22,360 | ) |
Less – treasury stock, at cost (45,506,311 shares in 2006; 40,644,602 shares in 2005; 31,345,028 shares in 2004; 19,276,445 shares in 2003; 25,752,419 shares in 2002) | | | 2,644,390 | | | | 2,161,960 | | | | 1,432,019 | | | | 561,152 | | | | 747,331 | |
Total | | | 8,197,887 | | | | 7,748,271 | | | | 8,302,211 | | | | 8,703,658 | | | | 7,838,237 | |
Commitments and Contingencies | | | | | | | | | | | | | | | | | | | | |
TOTAL LIABILITIES AND SHAREHOLDERS’ EQUITY | | $ | 31,082,731 | | | $ | 30,857,657 | | | $ | 28,332,713 | | | $ | 28,527,388 | | | $ | 27,504,366 | |
(a) | 2006 and 2005 reflectdeconsolidation of Entergy New Orleans,Inc. |
(b) | ProFormaBalance Sheet reflecting deconsolidation of Entergy New Orleans, Inc. can be found on pages 56 – 57. |
Certain prior year data has been reclassified to conform with current year presentation.
17
CONSOLIDATED FINANCIAL RESULTS
FINANCIAL RESULTS
2006 CONSOLIDATING BALANCE SHEET (unaudited)(a)
| | | | | | | | | | | | | | | |
| | | Utility/
Parent/ Other | | | Competitive
Businesses | | Eliminations | | | Consolidated | |
| | | In thousands, as of December 31, 2006. | |
ASSETS | | | | | | | | | | | | | | | |
CURRENT ASSETS: | | | | | | | | | | | | | | | |
Cash and cash equivalents: | | | | | | | | | | | | | | | |
Cash | | $ | 95,468 | | | $ | 21,911 | | $ | — | | | $ | 117,379 | |
Temporary cash investments - at cost, which approximates market | | | 499,942 | | | | 398,831 | | | — | | | | 898,773 | |
Total cash and cash equivalents | | | 595,410 | | | | 420,742 | | | — | | | | 1,016,152 | |
Notes receivable - Entergy New Orleans DIP loan | | | 51,934 | | | | — | | | — | | | | 51,934 | |
Notes receivable | | | 266,717 | | | | 1,280,921 | | | (1,546,939 | ) | | | 699 | |
Accounts receivable: | | | | | | | | | | | | | | | |
Customer | | | 410,512 | | | | — | | | — | | | | 410,512 | |
Allowance for doubtful accounts | | | (19,348 | ) | | | — | | | — | | | | (19,348 | ) |
Associated companies | | | (5,099 | ) | | | 94,549 | | | (89,450 | ) | | | — | |
Other | | | 312,654 | | | | 174,610 | | | — | | | | 487,264 | |
Accrued unbilled revenues | | | 249,165 | | | | — | | | — | | | | 249,165 | |
Total receivables | | | 947,884 | | | | 269,159 | | | (89,450 | ) | | | 1,127,593 | |
Accumulated deferred income taxes | | | 10,498 | | | | 1,182 | | | — | | | | 11,680 | |
Fuel inventory - at average cost | | | 189,829 | | | | 3,269 | | | — | | | | 193,098 | |
Materials and supplies - at average cost | | | 408,279 | | | | 196,719 | | | — | | | | 604,998 | |
Deferred nuclear refueling outage costs | | | 65,349 | | | | 82,172 | | | — | | | | 147,521 | |
Prepayments and other | | | 150,134 | | | | 21,625 | | | — | | | | 171,759 | |
Total | | | 2,686,034 | | | | 2,275,789 | | | (1,636,389 | ) | | | 3,325,434 | |
OTHER PROPERTY AND INVESTMENTS: | | | | | | | | | | | | | | | |
Investment in affiliates - at equity | | | 7,725,189 | | | | 152,066 | | | (7,648,166 | ) | | | 229,089 | |
Decommissioning trust funds | | | 1,274,676 | | | | 1,583,847 | | | — | | | | 2,858,523 | |
Non-utility property - at cost (less accumulated depreciation) | | | 208,956 | | | | 3,770 | | | — | | | | 212,726 | |
Other | | | 39,868 | | | | 7,247 | | | — | | | | 47,115 | |
Total | | | 9,248,689 | | | | 1,746,930 | | | (7,648,166 | ) | | | 3,347,453 | |
PROPERTY, PLANT AND EQUIPMENT: | | | | | | | | | | | | | | | |
Electric | | | 28,405,556 | | | | 2,309,755 | | | (2,027 | ) | | | 30,713,284 | |
Property under capital lease | | | 730,182 | | | | — | | | — | | | | 730,182 | |
Natural gas | | | 92,787 | | | | — | | | — | | | | 92,787 | |
Construction work in progress | | | 609,431 | | | | 176,716 | | | — | | | | 786,147 | |
Nuclear fuel under capital lease | | | 269,485 | | | | — | | | — | | | | 269,485 | |
Nuclear fuel | | | 206,889 | | | | 354,402 | | | — | | | | 561,291 | |
Total property, plant and equipment | | | 30,314,330 | | | | 2,840,873 | | | (2,027 | ) | | | 33,153,176 | |
Less - accumulated depreciation and amortization | | | 13,366,710 | | | | 348,389 | | | — | | | | 13,715,099 | |
Property, plant and equipment - net | | | 16,947,620 | | | | 2,492,484 | | | (2,027 | ) | | | 19,438,077 | |
DEFERRED DEBITS AND OTHER ASSETS: | | | | | | | | | | | | | | | |
Regulatory assets: | | | | | | | | | | | | | | | |
SFAS 109 regulatory asset - net | | | 740,110 | | | | — | | | — | | | | 740,110 | |
Other regulatory assets | | | 2,768,352 | | | | — | | | — | | | | 2,768,352 | |
Deferred fuel costs | | | 168,122 | | | | — | | | — | | | | 168,122 | |
Long-term receivables | | | 19,349 | | | | — | | | — | | | | 19,349 | |
Goodwill | | | 374,099 | | | | 3,073 | | | — | | | | 377,172 | |
Other | | | 736,461 | | | | 781,364 | | | (619,163 | ) | | | 898,662 | |
Total | | | 4,806,493 | | | | 784,437 | | | (619,163 | ) | | | 4,971,767 | |
TOTAL ASSETS | | $ | 33,688,836 | | | $ | 7,299,640 | | $ | (9,905,745 | ) | | $ | 31,082,731 | |
(a) | 2006reflects deconsolidationof Entergy New Orleans, Inc. |
Totals may not foot due to rounding.
18
CONSOLIDATED FINANCIAL RESULTS
FINANCIAL RESULTS
2006 CONSOLIDATING BALANCE SHEET (unaudited)(a)
| | | | | | | | | | | | | | | | |
| | | Utility/
Parent/ Other | | | Competitive
Businesses | | | Eliminations | | | Consolidated | |
| | | In thousands, as of December 31, 2006. | |
LIABILITIES AND SHAREHOLDERS’ EQUITY | | | | | | | | | | | | | | | | |
CURRENT LIABILITIES: | | | | | | | | | | | | | | | | |
Currently maturing long-term debt | | $ | 93,335 | | | $ | 88,241 | | | $ | — | | | $ | 181,576 | |
Notes payable: | | | | | | | | | | | | | | | | |
Associated companies | | | 979,198 | | | | 567,741 | | | | (1,546,939 | ) | | | — | |
Other | | | 25,039 | | | | — | | | | — | | | | 25,039 | |
Accounts payable: | | | | | | | | | | | | | | | | |
Associated companies | | | 69,355 | | | | 17,949 | | | | (87,304 | ) | | | — | |
Other | | | 901,434 | | | | 221,162 | | | | — | | | | 1,122,596 | |
Customer deposits | | | 248,031 | | | | — | | | | — | | | | 248,031 | |
Taxes accrued | | | 167,060 | | | | 20,264 | | | | — | | | | 187,324 | |
Interest accrued | | | 159,527 | | | | 1,304 | | | | — | | | | 160,831 | |
Deferred fuel costs | | | 73,031 | | | | — | | | | — | | | | 73,031 | |
Obligations under capital leases | | | 153,246 | | | | — | | | | — | | | | 153,246 | |
Pension and other postretirement liabilities | | | 39,008 | | | | 2,904 | | | | — | | | | 41,912 | |
Other | | | 100,501 | | | | 171,043 | | | | — | | | | 271,544 | |
Total | | | 3,008,765 | | | | 1,090,608 | | | | (1,634,243 | ) | | | 2,465,130 | |
NON-CURRENT LIABILITIES: | | | | | | | | | | | | | | | | |
Accumulated deferred income taxes and taxes accrued | | | 5,451,700 | | | | 369,000 | | | | — | | | | 5,820,700 | |
Accumulated deferred investment tax credits | | | 358,550 | | | | — | | | | — | | | | 358,550 | |
Obligations under capital leases | | | 188,033 | | | | — | | | | �� | | | | 188,033 | |
Other regulatory liabilities | | | 449,237 | | | | — | | | | — | | | | 449,237 | |
Decommissioning and retirement cost liabilities | | | 1,249,482 | | | | 774,364 | | | | — | | | | 2,023,846 | |
Transition to competition | | | 79,098 | | | | — | | | | — | | | | 79,098 | |
Regulatory reserves | | | 219 | | | | — | | | | — | | | | 219 | |
Accumulated provisions | | | 81,053 | | | | 7,849 | | | | — | | | | 88,902 | |
Pension and other postretirement liabilities | | | 1,125,707 | | | | 284,726 | | | | — | | | | 1,410,433 | |
Long-term debt | | | 8,560,534 | | | | 301,805 | | | | (64,252 | ) | | | 8,798,087 | |
Preferred stock with sinking fund | | | 10,500 | | | | — | | | | — | | | | 10,500 | |
Other | | | 1,173,625 | | | | 233,424 | | | | (559,853 | ) | | | 847,196 | |
Total | | | 18,727,738 | | | | 1,971,168 | | | | (624,105 | ) | | | 20,074,801 | |
Preferred stock without sinking fund | | | 310,751 | | | | 426,099 | | | | (391,937 | ) | | | 344,913 | |
| SHAREHOLDERS’ EQUITY: | | | | | | | | | | | | | | | | |
Common stock, $.01 par value, authorized 500,000,000 shares; issued 248,174,087 shares in 2006 | | | 2,228,350 | | | | 1,068,642 | | | | (3,294,510 | ) | | | 2,482 | |
Paid-in capital | | | 6,668,007 | | | | 1,500,553 | | | | (3,341,295 | ) | | | 4,827,265 | |
Retained earnings | | | 5,592,532 | | | | 1,304,107 | | | | (783,597 | ) | | | 6,113,042 | |
Accumulated other comprehensive income (loss) | | | (82,917 | ) | | | (18,221 | ) | | | 626 | | | | (100,512 | ) |
Less – treasury stock, at cost (45,506,311 shares in 2006) | | | 2,764,390 | | | | 43,316 | | | | (163,316 | ) | | | 2,644,390 | |
Total | | | 11,641,582 | | | | 3,811,765 | | | | (7,255,460 | ) | | | 8,197,887 | |
Commitments and Contingencies | | | | | | | | | | | | | | | | |
TOTAL LIABILITIES AND SHAREHOLDERS’ EQUITY | | $ | 33,688,836 | | | $ | 7,299,640 | | | $ | (9,905,745 | ) | | $ | 31,082,731 | |
(a) | 2006reflects deconsolidation of Entergy New Orleans, Inc. |
Totals may not foot due to rounding.
19
CONSOLIDATED FINANCIAL RESULTS
FINANCIAL RESULTS
CONSOLIDATED STATEMENTS OF CASH FLOW
| | | | | | | | | | | | | | | | | | | | |
| | | 2006(a) | | | 2005(a) | | | 2004(b) | | | 2003 | | | 2002 | |
| | | In thousands, for the years ended December 31, | |
OPERATING ACTIVITIES: | | | | | | | | | | | | | | | | | | | | |
Consolidated net income | | $ | 1,132,602 | | | $ | 898,331 | | | $ | 909,524 | | | $ | 926,943 | | | $ | 599,360 | |
Adjustments to reconcile consolidated net income to net cash flow provided by operating activities: | | | | | | | | | | | | | | | | | | | | |
Reserve for regulatory adjustments | | | 36,352 | | | | (82,033 | ) | | | 33,533 | | | | 13,090 | | | | 18,848 | |
Other regulatory credits - net | | | (122,680 | ) | | | (49,882 | ) | | | (90,611 | ) | | | (13,761 | ) | | | (141,836 | ) |
Depreciation, amortization, and decommissioning | | | 1,035,153 | | | | 1,001,852 | | | | 1,045,122 | | | | 996,603 | | | | 915,597 | |
Deferred income taxes, investment tax credits, and non-current taxes accrued | | | 738,643 | | | | 487,804 | | | | 352,094 | | | | 1,189,531 | | | | (256,664 | ) |
Cumulative effect of accounting changes | | | — | | | | — | | | | — | | | | (137,074 | ) | | | — | |
Equity in earnings (loss) of unconsolidated equity affiliates - net of dividends | | | 4,436 | | | | 4,315 | | | | 608,141 | | | | (176,036 | ) | | | (181,878 | ) |
Provisions for asset impairments and restructuring charges | | | — | | | | 39,767 | | | | 55,000 | | | | (7,743 | ) | | | 428,456 | |
Changes in working capital: | | | | | | | | | | | | | | | | | | | | |
Receivables | | | 408,042 | | | | (367,351 | ) | | | (210,419 | ) | | | (140,612 | ) | | | (43,957 | ) |
Fuel inventory | | | 13,097 | | | | (83,125 | ) | | | (16,769 | ) | | | (14,015 | ) | | | 1,030 | |
Accounts payable | | | (83,884 | ) | | | 303,194 | | | | 95,306 | | | | (60,164 | ) | | | 286,230 | |
Taxes accrued | | | (835 | ) | | | (33,306 | ) | | | (1,581 | ) | | | (882,446 | ) | | | 462,956 | |
Interest accrued | | | 5,975 | | | | 15,133 | | | | 5,269 | | | | (35,837 | ) | | | 7,209 | |
Deferred fuel | | | 582,947 | | | | (236,801 | ) | | | 213,627 | | | | (33,874 | ) | | | 156,181 | |
Other working capital accounts | | | 64,479 | | | | (45,653 | ) | | | 41,008 | | | | 16,809 | | | | (286,232 | ) |
Provision for estimated losses and reserves | | | 39,822 | | | | (3,704 | ) | | | (18,041 | ) | | | 196,619 | | | | 10,533 | |
Changes in other regulatory assets | | | (127,305 | ) | | | (311,934 | ) | | | 48,626 | | | | 22,671 | | | | 71,132 | |
Other | | | (307,429 | ) | | | (68,799 | ) | | | (140,510 | ) | | | 145,116 | | | | 134,738 | |
Net cash flow provided by operating activities | | | 3,419,415 | | | | 1,467,808 | | | | 2,929,319 | | | | 2,005,820 | | | | 2,181,703 | |
INVESTING ACTIVITIES: | | | | | | | | | | | | | | | | | | | | |
Construction/capital expenditures | | | (1,586,016 | ) | | | (1,458,086 | ) | | | (1,410,610 | ) | | | (1,568,943 | ) | | | (1,530,301 | ) |
Allowance for equity funds used during construction | | | 39,894 | | | | 45,736 | | | | 39,582 | | | | 42,710 | | | | 31,658 | |
Nuclear fuel purchases | | | (326,248 | ) | | | (314,414 | ) | | | (238,170 | ) | | | (224,308 | ) | | | (250,309 | ) |
Proceeds from sale/leaseback of nuclear fuel | | | 135,190 | | | | 184,403 | | | | 109,988 | | | | 150,135 | | | | 183,664 | |
Proceeds from sale of assets and businesses | | | 77,159 | | | | — | | | | 75,430 | | | | 25,987 | | | | 215,088 | |
Payment for purchase of plant | | | (88,199 | ) | | | (162,075 | ) | | | — | | | | — | | | | — | |
Investment in non-utility properties | | | — | | | | — | | | | (6,420 | ) | | | (71,438 | ) | | | (216,956 | ) |
Decrease (increase) in other investments | | | (6,353 | ) | | | 9,905 | | | | 383,498 | | | | 172,187 | | | | 38,964 | |
Purchases of other temporary investments | | | — | | | | (1,591,025 | ) | | | (1,629,500 | ) | | | (613,464 | ) | | | — | |
Liquidation of other temporary investments | | | — | | | | 1,778,975 | | | | 1,676,350 | | | | 378,664 | | | | 150,000 | |
Proceeds from nuclear decommissioning trust fund sales | | | 777,584 | | | | 944,253 | | | | 679,466 | | | | 729,440 | | | | 1,504,997 | |
Investment in nuclear decommissioning trust funds | | | (884,123 | ) | | | (1,039,824 | ) | | | (769,273 | ) | | | (820,958 | ) | | | (1,589,911 | ) |
Other regulatory investments | | | (38,037 | ) | | | (390,456 | ) | | | (53,566 | ) | | | (156,446 | ) | | | (39,390 | ) |
Other | | | — | | | | — | | | | — | | | | (11,496 | ) | | | 114,033 | |
Net cash flow used in investing activities | | | (1,899,149 | ) | | | (1,992,608 | ) | | | (1,143,225 | ) | | | (1,967,930 | ) | | | (1,388,463 | ) |
FINANCING ACTIVITIES: | | | | | | | | | | | | | | | | | | | | |
Proceeds from the issuance of: | | | | | | | | | | | | | | | | | | | | |
Long-term debt | | | 1,837,713 | | | | 4,302,570 | | | | 3,653,478 | | | | 4,596,189 | | | | 1,197,330 | |
Preferred stock | | | 73,354 | | | | 127,995 | | | | — | | | | — | | | | — | |
Common stock and treasury stock | | | 70,455 | | | | 106,068 | | | | 170,237 | | | | 217,521 | | | | 130,061 | |
Retirement of long-term debt | | | (1,804,373 | ) | | | (2,689,206 | ) | | | (4,022,548 | ) | | | (5,284,917 | ) | | | (1,341,274 | ) |
Repurchase of common stock | | | (584,193 | ) | | | (878,188 | ) | | | (1,017,996 | ) | | | (8,135 | ) | | | (118,499 | ) |
Redemption of preferred stock | | | (183,881 | ) | | | (33,719 | ) | | | (3,450 | ) | | | (3,450 | ) | | | (1,858 | ) |
Changes in credit line borrowings - net | | | (15,000 | ) | | | 39,850 | | | | (154 | ) | | | — | | | | 244,333 | |
Dividends paid: | | | | | | | | | | | | | | | | | | | | |
Common stock | | | (448,954 | ) | | | (453,508 | ) | | | (427,901 | ) | | | (362,814 | ) | | | (298,991 | ) |
Preferred stock | | | (28,848 | ) | | | (25,472 | ) | | | (23,525 | ) | | | (23,524 | ) | | | (23,712 | ) |
Net cash flow provided by (used in) financing activities | | | (1,083,727 | ) | | | 496,390 | | | | (1,671,859 | ) | | | (869,130 | ) | | | (212,610 | ) |
Effect of exchange rates on cash and cash equivalents | | | (3,207 | ) | | | (602 | ) | | | (1,882 | ) | | | 3,345 | | | | 3,125 | |
Net increase (decrease) in cash and cash equivalents | | | 433,332 | | | | (29,012 | ) | | | 112,353 | | | | (827,895 | ) | | | 583,755 | |
Cash and cash equivalents at beginning of period | | | 582,820 | | | | 619,786 | | | | 507,433 | | | | 1,335,328 | | | | 751,573 | |
Effect of the deconsolidation of Entergy New Orleans on cash and cash equivalents | | | — | | | | (7,954 | ) | | | | | | | | | | | | |
Cash and cash equivalents at end of period | | $ | 1,016,152 | | | $ | 582,820 | | | $ | 619,786 | | | $ | 507,433 | | | $ | 1,335,328 | |
(a) | 2006and 2005 reflect deconsolidation of Entergy New Orleans,Inc. |
(b) | ProForma Statement of Cash Flow reflecting deconsolidation of Entergy New Orleans, Inc. can be found on page 58. |
Certain prior year data has been reclassified to conform with current year presentation.
20
CONSOLIDATED FINANCIAL RESULTS
FINANCIAL RESULTS
CONSOLIDATED STATEMENTS OF CASH FLOW
| | | | | | | | | | | | | | | | | |
| | | 2006(a) | | | 2005(a) | | 2004(b) | | 2003 | | 2002 | |
| | | In thousands, for the years ended December 31, | |
SUPPLEMENTAL DISCLOSURE OF CASH FLOW INFORMATION: | | | | | | | | | | | | | | | | | |
Cash paid (received) during the period for: | | | | | | | | | | | | | | | | | |
Interest – net of amount capitalized | | $ | 526,424 | | | $ | 461,345 | | $ | 477,768 | | $ | 552,017 | | $ | 633,931 | |
Income taxes | | $ | (147,435 | ) | | $ | 116,072 | | $ | 28,241 | | $ | 188,709 | | $ | 57,856 | |
Noncash investing and financing activities: | | | | | | | | | | | | | | | | | |
Debt assumed by the Damhead Creek purchaser | | | — | | | | — | | | — | | | — | | $ | 488,432 | |
Decommissioning trust funds acquired in nuclear power plant acquisitions | | | — | | | | — | | | — | | | — | | $ | 310,000 | |
Long-term debt refunded with proceeds from long-term debt issued in prior period | | | — | | | | — | | | — | | | — | | $ | (47,000 | ) |
(a) | 2006 and 2005 reflect deconsolidation of Entergy New Orleans, Inc. |
(b) | Pro Forma Statement of Cash Flow reflecting deconsolidation of Entergy New Orleans, Inc. can be found on page 58. |
CASH FLOW INFORMATION BY BUSINESS
| | | | | | | | | | | | |
| | | Utility/
Parent/
Other | | | Entergy
Nuclear | | | Energy
Commodity
Services | | | Consolidated | |
| | | For the years ended December 31, 2006, 2005, 2004, 2003, and 2002. ($ thousands) | |
| | | | | | | | | | | | | |
2006(a) | | | | | | | | | | | | |
Net cash flow provided by (used in) operating activities | | 2,680,447 | | | 833,318 | | | (94,350 | ) | | 3,419,415 | |
Net cash flow provided by (used in) investing activities | | (1,458,581 | ) | | (450,219 | ) | | 9,651 | | | (1,899,149 | ) |
Net cash flow provided by (used in) financing activities | | (959,555 | ) | | (211,544 | ) | | 87,372 | | | (1,083,727 | ) |
2005(a) | | | | | | | | | | | | |
Net cash flow provided by (used in) operating activities | | 934,562 | | | 551,263 | | | (18,017 | ) | | 1,467,808 | |
Net cash flow provided by (used in) investing activities | | (1,673,600 | ) | | (368,497 | ) | | 49,489 | | | (1,992,608 | ) |
Net cash flow provided by (used in) financing activities | | 640,489 | | | (110,482 | ) | | (33,617 | ) | | 496,390 | |
2004 | | | | | | | | | | | | |
Net cash flow provided by operating activities | | 2,034,882 | | | 414,518 | | | 479,919 | | | 2,929,319 | |
Net cash flow provided by (used in) investing activities | | (1,005,814 | ) | | (386,023 | ) | | 248,612 | | | (1,143,225 | ) |
Net cash flow used in financing activities | | (909,431 | ) | | (37,894 | ) | | (724,534 | ) | | (1,671,859 | ) |
2003 | | | | | | | | | | | | |
Net cash flow provided by (used in) operating activities | | 1,934,587 | | | 182,524 | | | (111,291 | ) | | 2,005,820 | |
Net cash flow used in investing activities | | (1,704,897 | ) | | (184,913 | ) | | (78,120 | ) | | (1,967,930 | ) |
Net cash flow provided by (used in) financing activities | | (1,028,623 | ) | | (6,672 | ) | | 166,165 | | | (869,130 | ) |
2002 | | | | | | | | | | | | |
Net cash flow provided by (used in) operating activities | | 1,903,828 | | | 281,589 | | | (3,714 | ) | | 2,181,703 | |
Net cash flow used in investing activities | | (949,039 | ) | | (438,664 | ) | | (760 | ) | | (1,388,463 | ) |
Net cash flow provided by (used in) financing activities | | (322,621 | ) | | 176,162 | | | (66,151 | ) | | (212,610 | ) |
(a) | 2006 and 2005 reflect deconsolidation of Entergy New Orleans, Inc. |
Certain prior year data has been reclassified to conform with current year presentation.
21
CONSOLIDATED FINANCIAL RESULTS
FINANCIAL RESULTS
CONSOLIDATED STATEMENTS OF RETAINED EARNINGS, COMPREHENSIVE INCOME, AND PAID–IN CAPITAL
| | | | | | | | | | | | | | | | | | | | | | | | | | | | | | | | | | | | | | | | |
| | | 2006 | | | | | | 2005 | | | | | | 2004 | | | | | | 2003 | | | | | | 2002 | | | | |
| | | In thousands, for the years ended December 31, | |
RETAINED EARNINGS | | | | | | | | | | | | | | | | | | | | | | | | | | | | | | | | | | | | | | | | |
Retained Earnings – Beginning of period | | $ | 5,433,931 | | | | | | | $ | 4,989,826 | | | | | | | $ | 4,502,508 | | | | | | | $ | 3,938,693 | | | | | | | $ | 3,638,448 | | | | | |
Add: | | | | | | | | | | | | | | | | | | | | | | | | | | | | | | | | | | | | | | | | |
Consolidated net income | | | 1,132,602 | | | $ | 1,132,602 | | | | 898,331 | | | $ | 898,331 | | | | 909,524 | | | $ | 909,524 | | | | 926,943 | | | $ | 926,943 | | | | 599,360 | | | $ | 599,360 | |
Adjustment for change in accounting method | | | — | | | | | | | | — | | | | | | | | 5,524 | | | | | | | | — | | | | | | | | — | | | | | |
Total | | | 1,132,602 | | | | | | | | 898,331 | | | | | | | | 915,048 | | | | | | | | 926,943 | | | | | | | | 599,360 | | | | | |
Deduct: | | | | | | | | | | | | | | | | | | | | | | | | | | | | | | | | | | | | | | | | |
Dividends declared on common stock | | | 448,572 | | | | | | | | 453,657 | | | | | | | | 427,740 | | | | | | | | 362,941 | | | | | | | | 299,031 | | | | | |
Capital stock and other expenses | | | 4,919 | | | | | | | | 569 | | | | | | | | (10 | ) | | | | | | | 187 | | | | | | | | 84 | | | | | |
Total | | | 453,491 | | | | | | | | 454,226 | | | | | | | | 427,730 | | | | | | | | 363,128 | | | | | | | | 299,115 | | | | | |
Retained Earnings – End of period | | $ | 6,113,042 | | | | | | | $ | 5,433,931 | | | | | | | $ | 4,989,826 | | | | | | | $ | 4,502,508 | | | | | | | $ | 3,938,693 | | | | | |
ACCUMULATED OTHER COMPREHENSIVE INCOME (LOSS) (Net of taxes) | | | | | | | | | | | | | | | | | | | | | | | | | | | | | | | | | | | | | | | | |
Balance at beginning of period: | | | | | | | | | | | | | | | | | | | | | | | | | | | | | | | | | | | | | | | | |
Accumulated derivative instrument fair value changes | | $ | (392,614 | ) | | | | | | $ | (141,411 | ) | | | | | | $ | (25,811 | ) | | | | | | $ | 17,313 | | | | | | | $ | (17,973 | ) | | | | |
Other accumulated comprehensive (loss) items | | | 48,795 | | | | | | | | 47,958 | | | | | | | | 18,016 | | | | | | | | (39,673 | ) | | | | | | | (70,821 | ) | | | | |
Total | | | (343,819 | ) | | | | | | | (93,453 | ) | | | | | | | (7,795 | ) | | | | | | | (22,360 | ) | | | | | | | (88,794 | ) | | | | |
Net derivative instrument fair value changes arising during the period (net of tax expense (benefit) of $187,462, $(159,236), $(74,082), $(27,862), and $20,264 | | | 287,036 | | | | 287,036 | | | | (251,203 | ) | | | (251,203 | ) | | | (115,600 | ) | | | (115,600 | ) | | | (43,124 | ) | | | (43,124 | ) | | | 35,286 | | | | 35,286 | |
Foreign currency translation (net of tax expense (benefit) of $1,122, $211, $659, $1,459, and $(5,420)) | | | 3,207 | | | | 3,207 | | | | 602 | | | | 602 | | | | 1,882 | | | | 1,882 | | | | 4,169 | | | | 4,169 | | | | 65,948 | | | | (15,487 | ) |
Minimum pension liability (net of tax expense (benefit) of $(5,911) $(9,176), $1,875, $503, and $(6,527)) | | | (7,759 | ) | | | (7,759 | ) | | | (15,773 | ) | | | (15,773 | ) | | | 2,762 | | | | 2,762 | | | | 1,153 | | | | 1,153 | | | | (10,489 | ) | | | (10,489 | ) |
Pension and other postretirement liabilities (net of tax expense (benefit) of $(92,419))(75,805) | | | — | | | | | | | | — | | | | | | | | — | | | | | | | | — | | | | | | | | — | | | | | |
Net unrealized investment gains (losses) (net of tax expense (benefit) of $28,428, $10,573, $16,599, $33,422, and $(19,176)) | | | 36,628 | | | | 36,628 | | | | 16,008 | | | | 16,008 | | | | 25,298 | | | | 25,298 | | | | 52,367 | | | | 52,367 | | | | (24,311 | ) | | | (24,311 | ) |
Balance at end of period: | | | | | | | | | | | | | | | | | | | | | | | | | | | | | | | | | | | | | | | | |
Accumulated derivative instrument fair value changes | | | (105,578 | ) | | | | | | | (392,614 | ) | | | | | | | (141,411 | ) | | | | | | | (25,811 | ) | | | | | | | 17,313 | | | | | |
Other accumulated comprehensive income (loss) items | | | 5,066 | | | | | | | | 48,795 | | | | | | | | 47,958 | | | | | | | | 18,016 | | | | | | | | (39,673 | ) | | | | |
Total | | $ | (100,512 | ) | | | | | | $ | (343,819 | ) | | | | | | $ | (93,453 | ) | | | | | | $ | (7,795 | ) | | | | | | $ | (22,360 | ) | | | | |
Comprehensive Income | | | | | | $ | 1,451,714 | | | | | | | $ | 647,965 | | | | | | | $ | 823,866 | | | | | | | $ | 941,508 | | | | | | | $ | 584,359 | |
PAID-IN CAPITAL | | | | | | | | | | | | | | | | | | | | | | | | | | | | | | | | | | | | | | | | |
Paid-in Capital – Beginning of period | | $ | 4,817,637 | | | | | | | $ | 4,835,375 | | | | | | | $ | 4,767,615 | | | | | | | $ | 4,666,753 | | | | | | | $ | 4,662,704 | | | | | |
Add (Deduct): | | | | | | | | | | | | | | | | | | | | | | | | | | | | | | | | | | | | | | | | |
Issuance of equity units | | | — | | | | | | | | (39,904 | ) | | | | | | | — | | | | | | | | — | | | | | | | | — | | | | | |
Common stock issuances related to stock plans | | | 9,628 | | | | | | | | 22,166 | | | | | | | | 67,760 | | | | | | | | 100,862 | | | | | | | | 4,049 | | | | | |
Paid-in Capital – End of period | | $ | 4,827,265 | | | | | | | $ | 4,817,637 | | | | | | | $ | 4,835,375 | | | | | | | $ | 4,767,615 | | | | | | | $ | 4,666,753 | | | | | |
Certain prior year data has been reclassified to conform with current year presentation.
22
CONSOLIDATED FINANCIAL RESULTS
CONSOLIDATED CAPITAL EXPENDITURES
HISTORICAL CAPITAL EXPENDITURES
| | | | | | | | | | |
| | | 2006 | | 2005 | | 2004 | | 2003 | | 2002 |
| | | ($ millions) |
Utility/Parent/Other | | | | | | | | | | |
Entergy New Orleans | | 76 | | 58 | | 51 | | 66 | | 58 |
All others | | 1,350 | | 1,458 | | 1,115 | | 1,201 | | 1,098 |
Entergy Nuclear | | 303 | | 161 | | 243 | | 281 | | 348 |
Energy Commodity Services | | 21 | | 1 | | 8 | | 92 | | 244 |
Total Historical Capital Expenditures | | 1,750 | | 1,678 | | 1,417 | | 1,640 | | 1,748 |
PLANNED CAPITAL EXPENDITURES EXCLUDING ENTERGY NEW ORLEANS
| | | | | | |
| | | 2007 | | 2008 | | 2009 |
| | | ($ millions) |
Maintenance Capital: | | | | | | |
Utility/Parent/Other | | 788 | | 766 | | 763 |
Entergy Nuclear | | 97 | | 78 | | 82 |
Total Maintenance Capital | | 885 | | 844 | | 845 |
Other Capital Commitments: | | | | | | |
Utility/Parent/Other | | 406 | | 985 | | 482 |
Entergy Nuclear | | 447 | | 172 | | 219 |
Total Other Capital Commitments | | 853 | | 1,157 | | 701 |
Total Planned Capital Expenditures | | 1,738 | | 2,001 | | 1,546 |
ENTERGY CORPORATION SECURITIES DETAIL
ENTERGY CORPORATION LONG-TERM DEBT
| | | | | | | | | | | | | | | | | |
| | | | | | | | | | | | | | As of December 31, |
| CUSIP | | | | Rate | | | Maturity
Date | | First Call
Date | | Current or
First Call Price | | 2006 | | 2005 | | 2004 |
| | | | | | | | | | | | | | ($ millions) |
| | | $2B Bank Credit Facility | | | | | 05/10 | | | | | | 820 | | 785 | | — |
| | | $1.5B Bank Credit Facility(a) | | | | | 12/08 | | | | | | — | | — | | 50 |
| | | Bank Term Loan | | 2.98 | % | | 06/10 | | | | | | 60 | | 60 | | 60 |
| | | Bank Term Loan | | 3.08 | % | | 11/08 | | | | | | 35 | | 35 | | 35 |
29364GA*4 | | 6.17% Notes | | 6.17 | % | | 03/08 | | Now | | MW (T+.50%) | | 72 | | 72 | | 72 |
29364GB*3 | | 6.23% Notes | | 6.23 | % | | 03/08 | | Now | | MW (T+.50%) | | 15 | | 15 | | 15 |
29364GAC7 | | 6.13% Notes | | 6.13 | % | | 09/08 | | Now | | MW (T+.50%) | | 150 | | 150 | | 150 |
29364GAA1 | | 7.75% Notes | | 7.75 | % | | 12/09 | | Now | | MW (T+.50%) | | 267 | | 267 | | 267 |
29364GAB9 | | 6.58% Notes | | 6.58 | % | | 05/10 | | Now | | MW (T+.50%) | | 75 | | 75 | | 75 |
29364GB@1 | | 6.9% Notes | | 6.9 | % | | 11/10 | | Now | | MW (T+.50%) | | 140 | | 140 | | 140 |
29364G202, | | | | | | | | | | | | | | | | | |
29364G301 | | 7.625% Notes(b) | | 7.625 | % | | 02/11 | | | | | | 500 | | 500 | | — |
29364GA@2 | | 7.06% Notes | | 7.06 | % | | 03/11 | | Now | | MW (T+.50%) | | 86 | | 86 | | 86 |
Total | | | | | | | | | | | | | 2,220 | | 2,185 | | 950 |
(a) | At December 31, 2004, Entergy Corporation had in place two separate revolving credit facilities, a 5-year credit facility and a 3-year credit facility. The 5-year credit facility, which expires in December 2009, has a borrowing capacity of $500 million, none of which was outstanding at December 31, 2004. The 3-year credit facility, which expires in May 2007, has a borrowing capacity of $965 million, of which $50 million was outstanding at December 31, 2004. These two facilities were terminated in May 2005. |
(b) | In December 2005, Entergy Corporation sold 10 million equity units with a stated amount of $50 each. An equity unit consists of (1) a note, CUSIP 29364GAD5, initially due February 2011 and initially bearing interest at an annual rate of 5.75% and (2) a purchase contract that obligates the holder of the equity unit to purchase for $50 between 0.5705 and 0.7074 shares of Entergy Corporation common stock on or before February 17, 2009. Entergy will pay the holders quarterly contract adjustment payments of 1.875% per year on the stated amount of $50 per equity unit. Under the terms of the purchase contracts, Entergy Corporation will issue between 5,705,000 and 7,074,000 shares of common stock in the settlement of the purchase contracts (subject to adjustment under certain circumstances). |
SECURITIES RATINGS (OUTLOOK)
| | | | |
| | | Corporate Credit |
| | | MOODY’S | | S&P |
| | | As of April 2007. |
Entergy Corporation | | Baa3 (stable) | | BBB (outlook negative) |
23
UTILITY SELECTED DATA
UTILITY QUARTERLY FINANCIAL METRICS
| | | | | | | | | | | | | | | | | | | | | | | |
| | | 1Q | | 2Q | | 2006(a)
3Q | | 4Q | | YTD | | 1Q | | 2Q | | 2005(a)
3Q | | 4Q | | YTD | | YTD %
CHANGE | |
| GAAP MEASURES | | | | | | | | | | | | | | | | | | | | | | | |
As-Reported Earnings ($ millions) | | 119.8 | | 199.6 | | 290.0 | | 81.8 | | 691.2 | | 90.5 | | 211.7 | | 298.9 | | 58.7 | | 659.8 | | 5 | |
Return on Average Invested Capital – As-Reported (%)* | | 7.4 | | 7.3 | | 7.1 | | 7.2 | | 7.2 | | 7.1 | | 7.2 | | 7.5 | | 7.1 | | 7.1 | | 1 | |
Return on Average Common Equity – As-Reported (%)* | | 11.8 | | 11.5 | | 11.1 | | 11.3 | | 11.3 | | 11.4 | | 11.5 | | 12.0 | | 11.4 | | 11.4 | | (1 | ) |
Debt to Capital Ratio (%) | | 50.4 | | 51.0 | | 50.6 | | 51.3 | | 51.3 | | 51.7 | | 51.4 | | 51.5 | | 51.8 | | 51.8 | | (1 | ) |
| NON-GAAP MEASURES | | | | | | | | | | | | | | | | | | | | | | | |
Operational Earnings ($ millions) | | 114.1 | | 188.9 | | 282.7 | | 101.4 | | 687.1 | | 90.5 | | 211.7 | | 298.9 | | 58.7 | | 659.8 | | 4 | |
Return on Average Invested Capital – Operational (%)* | | 7.4 | | 7.3 | | 7.1 | | 7.2 | | 7.2 | | 7.1 | | 7.2 | | 7.5 | | 7.1 | | 7.1 | | 1 | |
Return on Average Common Equity – Operational (%)* | | 11.8 | | 11.4 | | 11.0 | | 11.2 | | 11.2 | | 11.4 | | 11.5 | | 12.0 | | 11.4 | | 11.4 | | (2 | ) |
Net Debt to Net Capital Ratio (%) | | 49.0 | | 50.0 | | 49.6 | | 49.1 | | 49.1 | | 48.7 | | 49.9 | | 50.8 | | 50.7 | | 50.7 | | (3 | ) |
(a) | 2006 and 2005 reflect deconsolidation of EntergyNew Orleans, Inc. |
| * | Trailing twelve months. Totals may not foot due to rounding. |
UTILITY ANNUAL FINANCIAL METRICS
| | | | | | | | | | |
| | | 2006(a) | | 2005(a) | | 2004 | | 2003 | | 2002 |
| GAAP MEASURES | | | | | | | | | | |
As-Reported Earnings ($ millions) | | 691.2 | | 659.8 | | 643.4 | | 469.1 | | 583.2 |
Return on Average Invested Capital – As-Reported (%) | | 7.2 | | 7.1 | | 7.2 | | 5.9 | | 6.9 |
Return on Average Common Equity – As-Reported (%) | | 11.3 | | 11.4 | | 11.6 | | 8.7 | | 10.7 |
Debt to Capital Ratio (%) | | 51.3 | | 51.8 | | 51.7 | | 54.1 | | 55.5 |
| NON-GAAP MEASURES | | | | | | | | | | |
Operational Earnings ($ millions) | | 687.1 | | 659.8 | | 643.4 | | 626.1 | | 583.2 |
Return on Average Invested Capital – Operational (%) | | 7.2 | | 7.1 | | 7.2 | | 7.1 | | 6.9 |
Return on Average Common Equity – Operational (%) | | 11.2 | | 11.4 | | 11.6 | | 11.5 | | 10.7 |
Net Debt to Net Capital Ratio (%) | | 49.1 | | 50.7 | | 49.3 | | 52.6 | | 51.4 |
(a) | 2006 and 2005 reflect deconsolidation of EntergyNew Orleans, Inc. |
UTILITY HISTORICAL CAPITAL EXPENDITURES
| | | | | | | | | | |
| | | 2006 | | 2005 | | 2004 | | 2003 | | 2002 |
| | | ($ millions) |
Entergy Arkansas | | 259 | | 317 | | 270 | | 335 | | 277 |
Entergy Gulf States | | 376 | | 371 | | 358 | | 349 | | 355 |
Entergy Louisiana | | 449 | | 551 | | 240 | | 258 | | 210 |
Entergy Mississippi | | 212 | | 164 | | 163 | | 189 | | 158 |
System Energy Resources | | 34 | | 37 | | 32 | | 18 | | 40 |
Other | | 18 | | 7 | | 37 | | 18 | | 34 |
Total excluding Entergy New Orleans | | 1,348 | | 1,447 | | 1,101 | | 1,167 | | 1,074 |
Entergy New Orleans | | 76 | | 58 | | 51 | | 66 | | 58 |
Total including Entergy New Orleans | | 1,424 | | 1,505 | | 1,152 | | 1,233 | | 1,132 |
UTILITY PLANNED CAPITAL EXPENDITURES
| | | | | | | | | | | | |
| | | 2007 | | 2008 | | 2009 |
| | | Maintenance
Capital | | Capital
Commitments | | Maintenance
Capital | | Capital
Commitments | | Maintenance
Capital | | Capital
Commitments |
| | | ($ millions) |
Entergy Arkansas | | 201 | | 86 | | 206 | | 317 | | 206 | | 52 |
Entergy Gulf States | | 251 | | 56 | | 222 | | 108 | | 222 | | 44 |
Entergy Louisiana | | 157 | | 143 | | 173 | | 495 | | 173 | | 353 |
Entergy Mississippi | | 132 | | 39 | | 134 | | 27 | | 134 | | 19 |
System Energy Resources | | 16 | | 30 | | 12 | | 25 | | 12 | | 10 |
Other | | 19 | | 52 | | 16 | | 13 | | 15 | | 4 |
Total excluding Entergy New Orleans | | 776 | | 406 | | 763 | | 985 | | 762 | | 482 |
Entergy New Orleans | | 21 | | 6 | | 32 | | 16 | | 33 | | 2 |
Total including Entergy New Orleans | | 797 | | 412 | | 795 | | 1,001 | | 795 | | 484 |
UTILITY SECURITIES RATINGS (OUTLOOK)
| | | | | | | | | | | | | | | | |
| | | Mortgage Bonds | | Preferred Stock |
| | | Moody’s | | S&P | | Fitch | | Moody’s | | S&P | | Fitch |
| | | As of April 2007. |
Entergy Arkansas, Inc. | | Baa1 (stable) | | A– | | (outlook neg.) | | BBB+ | | (stable) | | Ba1 | | BB+ | | BBB– |
Entergy Gulf States, Inc. | | Baa3 (stable) | | BBB+ | | (outlook neg.) | | BBB | | (stable) | | Ba3 | | BB+ | | BB+ |
Entergy Louisiana, LLC | | Baa1 (stable) | | A– | | (outlook neg.) | | BBB+ | | (stable) | | Ba1 | | BB+ | | BBB– |
Entergy Mississippi, Inc. | | Baa2 (stable) | | A– | | (outlook neg.) | | BBB+ | | (stable) | | Ba2 | | BB+ | | BBB– |
Entergy New Orleans, Inc. | | Withdrawn | | D | | | | CCC | | (watch neg.) | | Withdrawn | | D | | CC |
System Energy Resources, Inc. | | Baa3 (stable) | | BBB | | (outlook neg.) | | BBB– | | (stable) | | | | — | | — |
24
UTILITY FINANCIAL RESULTS
2006 UTILITY/PARENT/OTHER CONSOLIDATING INCOME STATEMENT(unaudited)(a)
| | | | | | | | | | | | | | | | | | | | | | | | | | | | | | | | |
| | | EAI | | | EGSI | | | ELL | | | EMI | | | ENOI | | | SERI | | | Parent/Other
Eliminations | | | Utility/
Parent/
Other | |
| | | | In thousands, for the year ending December 31, 2006. | |
OPERATING
REVENUES: | | | | | | | | | | | | | | | | | | | | | | | | | | | | | | | | |
Domestic electric | | $ | 2,092,683 | | | $ | 3,595,343 | | | $ | 2,451,258 | | | $ | 1,450,008 | | | $ | 471,066 | | | $ | 555,459 | | | $ | (1,550,017 | ) | | $ | 9,065,800 | |
Natural gas | | | — | | | | 84,230 | | | | — | | | | — | | | | 100,088 | | | | — | | | | (100,088 | ) | | | 84,230 | |
Competitive businesses | | | — | | | | — | | | | — | | | | — | | | | — | | | | — | | | | 39,817 | | | | 39,817 | |
Total | | | 2,092,683 | | | | 3,679,573 | | | | 2,451,258 | | | | 1,450,008 | | | | 571,154 | | | | 555,459 | | | | (1,610,288 | ) | | | 9,189,847 | |
OPERATING
EXPENSES: | | | | | | | | | | | | | | | | | | | | | | | | | | | | | | | | |
Operation and maintenance: | | | | | | | | | | | | | | | | | | | | | | | | | | | | | | | | |
Fuel, fuel-related expenses, and gas purchased for resale | | | 429,718 | | | | 1,110,987 | | | | 710,746 | | | | 586,625 | | | | 157,535 | | | | 44,062 | | | | (158,816 | ) | | | 2,880,857 | |
Purchased power | | | 614,246 | | | | 1,288,137 | | | | 824,645 | | | | 463,015 | | | | 217,212 | | | | — | | | | (1,286,485 | ) | | | 2,120,770 | |
Nuclear refueling outage expenses | | | 29,478 | | | | 16,653 | | | | 15,337 | | | | — | | | | — | | | | 16,642 | | | | — | | | | 78,110 | |
Other operation and maintenance | | | 437,574 | | | | 510,876 | | | | 394,390 | | | | 206,031 | | | | 78,856 | | | | 108,022 | | | | (121,747 | ) | | | 1,614,002 | |
Decommissioning | | | 30,695 | | | | 10,815 | | | | 17,245 | | | | — | | | | — | | | | 23,919 | | | | 238 | | | | 82,912 | |
Taxes other than income taxes | | | 75,585 | | | | 136,734 | | | | 61,168 | | | | 63,126 | | | | 34,953 | | | | 23,963 | | | | (31,632 | ) | | | 363,897 | |
Depreciation and amortization | | | 216,919 | | | | 206,736 | | | | 186,021 | | | | 75,561 | | | | 31,634 | | | | 118,623 | | | | (26,977 | ) | | | 808,517 | |
Reorganization items | | | — | | | | — | | | | — | | | | — | | | | 26,455 | | | | — | | | | (26,455 | ) | | | — | |
Other regulatory charges (credits) - net | | | (25,794 | ) | | | 5,451 | | | | (26,257 | ) | | | (65,714 | ) | | | 4,160 | | | | (10,366 | ) | | | (4,160 | ) | | | (122,680 | ) |
Total | | | 1,808,421 | | | | 3,286,389 | | | | 2,183,295 | | | | 1,328,644 | | | | 550,805 | | | | 324,865 | | | | (1,656,034 | ) | | | 7,826,385 | |
OPERATING
INCOME | | | 284,262 | | | | 393,184 | | | | 267,963 | | | | 121,364 | | | | 20,349 | | | | 230,594 | | | | 45,746 | | | | 1,363,462 | |
OTHER INCOME: | | | | | | | | | | | | | | | | | | | | | | | | | | | | | | | | |
Allowance for equity funds used during construction | | | 7,630 | | | | 11,808 | | | | 14,229 | | | | 3,942 | | | | 3,078 | | | | 2,285 | | | | (3,078 | ) | | | 39,894 | |
Interest and dividend income | | | 24,720 | | | | 53,922 | | | | 12,997 | | | | 6,435 | | | | 4,363 | | | | 21,511 | | | | 39,769 | | | | 163,717 | |
Equity in earnings (loss) of unconsolidated equity affiliates | | | — | | | | — | | | | — | | | | — | | | | — | | | | — | | | | 95,366 | | | | 95,366 | |
Miscellaneous – net | | | (4,115 | ) | | | 2,933 | | | | 2,725 | | | | (2,348 | ) | | | (543 | ) | | | (392 | ) | | | 2,295 | | | | 555 | |
Total | | | 28,235 | | | | 68,663 | | | | 29,951 | | | | 8,029 | | | | 6,898 | | | | 23,404 | | | | 134,352 | | | | 299,532 | |
INTEREST AND
OTHER CHARGES: | | | | | | | | | | | | | | | | | | | | | | | | | | | | | | | | |
Interest on long-term debt | | | 76,932 | | | | 137,938 | | | | 81,563 | | | | 45,555 | | | | 4,069 | | | | 59,829 | | | | 83,396 | | | | 489,282 | |
Other interest – net | | | 8,877 | | | | 11,842 | | | | 10,653 | | | | 5,661 | | | | 15,260 | | | | 102 | | | | 46,801 | | | | 99,196 | |
Allowance for borrowed funds used during construction | | | (3,290 | ) | | | (6,988 | ) | | | (10,258 | ) | | | (2,675 | ) | | | (2,477 | ) | | | (720 | ) | | | 2,477 | | | | (23,931 | ) |
Total | | | 82,519 | | | | 142,792 | | | | 81,958 | | | | 48,541 | | | | 16,852 | | | | 59,211 | | | | 132,674 | | | | 564,547 | |
INCOME FROM
CONTINUING
OPERATIONS
BEFORE INCOME
TAXES | | | 229,978 | | | | 319,055 | | | | 215,956 | | | | 80,852 | | | | 10,395 | | | | 194,787 | | | | 47,424 | | | | 1,098,447 | |
Income taxes | | | 56,824 | | | | 107,067 | | | | 78,338 | | | | 28,567 | | | | 5,051 | | | | 54,529 | | | | (95,587 | ) | | | 234,789 | |
INCOME FROM CONTINUING OPERATIONS | | | 173,154 | | | | 211,988 | | | | 137,618 | | | | 52,285 | | | | 5,344 | | | | 140,258 | | | | 143,011 | | | | 863,658 | |
LOSS FROM DISCONTINUED OPERATIONS (net
of income tax
expense of
$ 67) | | | — | | | | — | | | | — | | | | — | | | | — | | | | — | | | | (496 | ) | | | (496 | ) |
CONSOLIDATED
NET INCOME | | | 173,154 | | | | 211,988 | | | | 137,618 | | | | 52,285 | | | | 5,344 | | | | 140,258 | | | | 142,515 | | | | 863,162 | |
Preferred dividend requirements and other | | | 7,560 | | | | 3,966 | | | | 6,950 | | | | 2,828 | | | | 1,286 | | | | — | | | | 1,773 | | | | 24,363 | |
EARNINGS
APPLICABLE TO
COMMON
STOCK/EQUITY | | $ | 165,594 | | | $ | 208,022 | | | $ | 130,668 | | | $ | 49,457 | | | $ | 4,058 | | | $ | 140,258 | | | $ | 140,742 | | | | 838,799 | |
(a) | 2006 reflects deconsolidation ofEntergy New Orleans, Inc. |
Totals may not foot due to rounding.
25
UTILITY FINANCIAL RESULTS
2006 UTILITY/PARENT/OTHER CONSOLIDATING BALANCE SHEET (unaudited)(a)
| | | | | | | | | | | | | | | | | | | | | | | | | | | | | | | |
| | | EAI | | | EGSI | | | ELL | | | EMI | | | ENOI | | | SERI | | Parent/Other
Eliminations | | | Utility/
Parent/ Other | |
| | | In thousands, as of December 31, 2006. | |
| ASSETS | | | | | | | | | | | | | | | | | | | | | | | | | | | | | | | |
| CURRENT ASSETS: | | | | | | | | | | | | | | | | | | | | | | | | | | | | | | | |
Cash and cash equivalents: | | | | | | | | | | | | | | | | | | | | | | | | | | | | | | | |
Cash | | $ | 2,849 | | | $ | 2,923 | | | $ | 2,743 | | | $ | 2,128 | | | $ | 3,886 | | | $ | 56 | | $ | 80,883 | | | $ | 95,468 | |
Temporary cash investments – at cost, which approximates market | | | 31,966 | | | | 177,458 | | | | — | | | | 71,289 | | | | 13,207 | | | | 134,956 | | | 71,066 | | | | 499,942 | |
Total cash and cash equivalents | | | 34,815 | | | | 180,381 | | | | 2,743 | | | | 73,417 | | | | 17,093 | | | | 135,012 | | | 151,949 | | | | 595,410 | |
Notes receivable – Entergy New Orleans DIP loan | | | — | | | | — | | | | — | | | | — | | | | — | | | | — | | | 51,934 | | | | 51,934 | |
Notes receivable | | | — | | | | — | | | | — | | | | — | | | | — | | | | — | | | 266,717 | | | | 266,717 | |
Accounts receivable: | | | | | | | | | | | | | | | | | | | | | | | | | | | | | | | |
Customer | | | 105,347 | | | | 146,144 | | | | 97,207 | | | | 61,216 | | | | 58,999 | | | | — | | | (58,401 | ) | | | 410,512 | |
Allowance for doubtful accounts | | | (15,257 | ) | | | (1,618 | ) | | | (1,856 | ) | | | (616 | ) | | | (10,563 | ) | | | — | | | 10,562 | | | | (19,348 | ) |
Associated companies | | | 57,554 | | | | 106,990 | | | | 28,621 | | | | 45,040 | | | | 17,797 | | | | 142,121 | | | (403,222 | ) | | | (5,099 | ) |
Other | | | 114,108 | | | | 50,811 | | | | 22,652 | | | | 9,032 | | | | 8,428 | | | | 3,301 | | | 104,322 | | | | 312,654 | |
Accrued unbilled revenues | | | 66,876 | | | | 79,538 | | | | 69,628 | | | | 32,550 | | | | 23,758 | | | | — | | | (23,185 | ) | | | 249,165 | |
Total receivables | | | 328,628 | | | | 381,865 | | | | 216,252 | | | | 147,222 | | | | 98,419 | | | | 145,422 | | | (369,924 | ) | | | 947,884 | |
Deferred fuel costs | | | 2,157 | | | | — | | | | 46,310 | | | | — | | | | 18,996 | | | | — | | | (67,463 | ) | | | — | |
Accumulated deferred income taxes | | | 19,232 | | | | 20,352 | | | | — | | | | — | | | | — | | | | — | | | (29,086 | ) | | | 10,498 | |
Fuel inventory – at average cost | | | 22,973 | | | | 69,211 | | | | — | | | | 7,645 | | | | 5,041 | | | | — | | | 84,959 | | | | 189,829 | |
Materials and supplies – at average cost | | | 100,061 | | | | 120,245 | | | | 98,284 | | | | 28,607 | | | | 7,825 | | | | 61,097 | | | (7,840 | ) | | | 408,279 | |
Deferred nuclear refueling outage costs | | | 23,678 | | | | 12,971 | | | | 23,639 | | | | — | | | | — | | | | 5,060 | | | — | | | | 65,349 | |
Prepayments and other | | | 6,368 | | | | 16,725 | | | | 5,769 | | | | 107,398 | | | | 5,641 | | | | 1,480 | | | 6,753 | | | | 150,134 | |
Total | | | 537,912 | | | | 801,750 | | | | 392,997 | | | | 364,289 | | | | 153,015 | | | | 348,071 | | | 88,000 | | | | 2,686,034 | |
| OTHER PROPERTY AND INVESTMENTS: | | | | | | | | | | | | | | | | | | | | | | | | |
Investment in affiliates – at equity | | | 11,206 | | | | — | | | | — | | | | 5,531 | | | | 3,259 | | | | — | | | 7,705,193 | | | | 7,725,189 | |
Decommissioning trust funds | | | 439,408 | | | | 344,911 | | | | 208,926 | | | | — | | | | — | | | | 281,430 | | | — | | | | 1,274,676 | |
Non-utility property – at cost (less accumulated depreciation) | | | 1,446 | | | | 94,776 | | | | 1,670 | | | | 6,061 | | | | 1,107 | | | | — | | | 103,896 | | | | 208,956 | |
Other | | | 2,976 | | | | 25,218 | | | | 4 | | | | — | | | | — | | | | — | | | 11,670 | | | | 39,868 | |
Total | | | 455,036 | | | | 464,905 | | | | 210,600 | | | | 11,592 | | | | 4,366 | | | | 281,430 | | | 7,820,759 | | | | 9,248,689 | |
| UTILITY PLANT: | | | | | | | | | | | | | | | | | | | | | | | | | | | | | | | |
Electric | | | 6,599,348 | | | | 8,857,166 | | | | 6,693,633 | | | | 2,692,971 | | | | 698,081 | | | | 3,248,582 | | | (384,225 | ) | | | 28,405,556 | |
Property under capital lease | | | 5,260 | | | | — | | | | 252,972 | | | | 17 | | | | — | | | | 471,933 | | | — | | | | 730,182 | |
Natural gas | | | — | | | | 92,368 | | | | — | | | | — | | | | 186,932 | | | | — | | | (186,513 | ) | | | 92,787 | |
Construction work in progress | | | 113,069 | | | | 149,392 | | | | 190,454 | | | | 79,950 | | | | 21,824 | | | | 38,088 | | | 16,654 | | | | 609,431 | |
Nuclear fuel under capital lease | | | 124,850 | | | | 73,422 | | | | 82,464 | | | | — | | | | — | | | | 55,280 | | | (66,531 | ) | | | 269,485 | |
Nuclear fuel | | | 21,044 | | | | 10,821 | | | | — | | | | — | | | | — | | | | 10,222 | | | 164,802 | | | | 206,889 | |
| Total utility plant | | | 6,863,571 | | | | 9,183,169 | | | | 7,219,523 | | | | 2,772,938 | | | | 906,837 | | | | 3,824,105 | | | (455,813 | ) | | | 30,314,330 | |
Less – accumulated depreciation and amortization | | | 2,986,576 | | | | 4,263,307 | | | | 2,959,422 | | | | 945,548 | | | | 446,673 | | | | 2,000,320 | | | (235,136 | ) | | | 13,366,710 | |
Utility plant – net | | | 3,876,995 | | | | 4,919,862 | | | | 4,260,101 | | | | 1,827,390 | | | | 460,164 | | | | 1,823,785 | | | (220,677 | ) | | | 16,947,620 | |
| DEFERRED DEBITS AND OTHER ASSETS: | | | | | | | | | | | | | | | | | | | | |
Regulatory assets: | | | | | | | | | | | | | | | | | | | | | | | | | | | | | | | |
SFAS 109 regulatory asset – net | | | 93,682 | | | | 465,259 | | | | 157,789 | | | | 26,378 | | | | — | | | | 92,600 | | | (95,598 | ) | | | 740,110 | |
Other regulatory assets | | | 542,052 | | | | 1,001,016 | | | | 539,309 | | | | 186,986 | | | | 295,440 | | | | 293,292 | | | (89,743 | ) | | | 2,768,352 | |
Deferred fuel costs | | | — | | | | 100,124 | | | | 67,998 | | | | — | | | | — | | | | — | | | — | | | | 168,122 | |
Long-term receivables | | | — | | | | 9,833 | | | | 5,986 | | | | 2,288 | | | | 936 | | | | — | | | 306 | | | | 19,349 | |
Goodwill | | | — | | | | — | | | | — | | | | — | | | | — | | | | — | | | 374,099 | | | | 374,099 | |
Other | | | 35,359 | | | | 23,928 | | | | 20,062 | | | | 21,968 | | | | 7,230 | | | | 14,062 | | | 613,852 | | | | 736,461 | |
Total | | | 671,093 | | | | 1,600,160 | | | | 791,144 | | | | 237,620 | | | | 303,606 | | | | 399,954 | | | 802,916 | | | | 4,806,493 | |
| TOTAL ASSETS | | $ | 5,541,036 | | | $ | 7,786,677 | | | $ | 5,654,842 | | | $ | 2,440,891 | | | $ | 921,151 | | | $ | 2,853,240 | | $ | 8,490,998 | | | $ | 33,688,836 | |
(a) | 2006 reflects deconsolidationof Entergy New Orleans, Inc. |
| Totals | may not foot due to rounding. |
26
UTILITY FINANCIAL RESULTS
2006 UTILITY/PARENT/OTHER CONSOLIDATING BALANCE SHEET (unaudited)(a)
| | | | | | | | | | | | | | | | | | | | | | | | | | | | | |
| | | EAI | | EGSI | | | ELL | | | EMI | | | ENOI | | SERI | | Parent/
Other
Eliminations | | | Utility/ Parent/ Other | |
| | | In thousands, as of December 31, 2006. | |
LIABILITIES AND SHAREHOLDERS’ OR MEMBERS’ EQUITY | | | | | | | | | | | | | | | | | | | | | | | | | | | | | |
CURRENT LIABILITIES: | | | | | | | | | | | | | | | | | | | | | | | | | | | | | |
Currently maturing long-term debt | | $ | — | | $ | — | | | $ | — | | | $ | — | | | $ | — | | $ | 93,335 | | $ | — | | | $ | 93,335 | |
DIP credit facility | | | — | | | — | | | | — | | | | — | | | | 51,934 | | | — | | | (51,934 | ) | | | — | |
Notes payable: | | | | | | | | | | | | | | | | | | | | | | | | | | | | | |
Associated companies | | | — | | | — | | | | — | | | | — | | | | — | | | — | | | 979,198 | | | | 979,198 | |
Other | | | — | | | — | | | | — | | | | — | | | | — | | | — | | | 25,039 | | | | 25,039 | |
Accounts payable: | | | | | | | | | | | | | | | | | | | | | | | | | | | | | |
Associated companies | | | 64,546 | | | 79,584 | | | | 160,555 | | | | 59,696 | | | | 94,686 | | | 1,634 | | | (391,346 | ) | | | 69,355 | |
Other | | | 117,655 | | | 200,746 | | | | 203,076 | | | | 38,097 | | | | 76,831 | | | 26,636 | | | 238,393 | | | | 901,434 | |
Customer deposits | | | 49,978 | | | 68,844 | | | | 72,579 | | | | 51,568 | | | | 14,808 | | | — | | | (9,746 | ) | | | 248,031 | |
Taxes accrued | | | 37,161 | | | 27,781 | | | | 6,237 | | | | 45,687 | | | | 2,086 | | | 47,988 | | | 120 | | | | 167,060 | |
Accumulated deferred income taxes | | | — | | | — | | | | 32,026 | | | | 3,963 | | | | 2,924 | | | 1,828 | | | (40,741 | ) | | | — | |
Interest accrued | | | 19,579 | | | 34,483 | | | | 30,489 | | | | 13,063 | | | | 18,004 | | | 46,135 | | | (2,226 | ) | | | 159,527 | |
Deferred fuel costs | | | — | | | 26,262 | | | | — | | | | 95,236 | | | | — | | | — | | | (48,467 | ) | | | 73,031 | |
Obligations under capital leases | | | 56,265 | | | 24,769 | | | | 39,067 | | | | 2 | | | | — | | | 33,142 | | | — | | | | 153,246 | |
Pension and other postretirement liabilities | | | — | | | 7,662 | | | | 8,276 | | | | — | | | | — | | | — | | | 23,070 | | | | 39,008 | |
Other | | | 15,372 | | | 31,933 | | | | 30,425 | | | | 17,622 | | | | 6,154 | | | — | | | (1,005 | ) | | | 100,501 | |
Total | | | 360,556 | | | 502,064 | | | | 582,730 | | | | 324,934 | | | | 267,427 | | | 250,698 | | | 720,355 | | | | 3,008,765 | |
NON-CURRENT LIABILITIES: | | | | | | | | | | | | | | | | | | | | | | | | | | | | | |
Accumulated deferred income taxes and taxes accrued | | | 1,243,855 | | | 1,803,461 | | | | 1,827,900 | | | | 516,558 | | | | 98,884 | | | 304,691 | | | (343,649 | ) | | | 5,451,700 | |
Accumulated deferred investment tax credits | | | 59,834 | | | 127,202 | | | | 89,242 | | | | 11,047 | | | | 3,157 | | | 68,660 | | | (592 | ) | | | 358,550 | |
Obligations under capital leases | | | 73,845 | | | 48,653 | | | | 43,397 | | | | — | | | | — | | | 22,138 | | | — | | | | 188,033 | |
SFAS 109 regulatory liability – net | | | — | | | — | | | | — | | | | — | | | | 71,870 | | | — | | | (71,870 | ) | | | — | |
Other regulatory liabilities | | | 103,350 | | | 53,648 | | | | 50,210 | | | | — | | | | — | | | 242,029 | | | — | | | | 449,237 | |
Decommissioning and retirement cost liabilities | | | 472,810 | | | 191,036 | | | | 238,536 | | | | 4,254 | | | | 2,591 | | | 342,846 | | | (2,591 | ) | | | 1,249,482 | |
Transition to competition | | | — | | | 79,098 | | | | — | | | | — | | | | — | | | — | | | — | | | | 79,098 | |
Regulatory reserves | | | — | | | 219 | | | | — | | | | — | | | | — | | | — | | | — | | | | 219 | |
Accumulated provisions | | | 14,539 | | | 21,245 | | | | 23,798 | | | | 10,036 | | | | 8,385 | | | 2,422 | | | 628 | | | | 81,053 | |
Pension and other postretirement liabilities | | | 259,147 | | | 141,834 | | | | 146,646 | | | | 64,604 | | | | 60,033 | | | 32,060 | | | 421,383 | | | | 1,125,707 | |
Long-term debt | | | 1,306,201 | | | 2,358,327 | | | | 1,147,647 | | | | 795,187 | | | | 229,875 | | | 729,914 | | | 1,993,383 | | | | 8,560,534 | |
Preferred stock with sinking fund | | | — | | | 10,500 | | | | — | | | | — | | | | — | | | — | | | — | | | | 10,500 | |
Other | | | 96,623 | | | 196,512 | | | | 86,428 | | | | 46,253 | | | | 5,161 | | | 396 | | | 742,252 | | | | 1,173,625 | |
Total | | | 3,630,204 | | | 5,031,735 | | | | 3,653,804 | | | | 1,447,939 | | | | 479,956 | | | 1,745,156 | | | 2,738,944 | | | | 18,727,738 | |
Preferred stock without sinking fund | | | 116,350 | | | 47,327 | | | | 100,000 | | | | 50,381 | | | | 19,780 | | | — | | | (23,087 | ) | | | 310,751 | |
SHAREHOLDERS’ OR MEMBERS’ EQUITY: | | | | | | | | | | | | | | | | | | | | | | | | | | | | | |
Common stock or members’ equity | | | 470 | | | 114,055 | | | | 1,344,003 | | | | 199,326 | | | | 33,744 | | | 789,350 | | | (252,598 | ) | | | 2,228,350 | |
Paid-in capital/capital stock expense and other | | | 588,528 | | | 1,457,486 | | | | — | | | | (690 | ) | | | 36,294 | | | — | | | 4,586,389 | | | | 6,668,007 | |
Retained earnings | | | 844,928 | | | 653,924 | | | | — | | | | 419,001 | | | | 83,950 | | | 68,036 | | | 3,522,693 | | | | 5,592,532 | |
Accumulated other comprehensive income (loss) | | | — | | | (19,914 | ) | | | (25,695 | ) | | | — | | | | — | | | — | | | (37,308 | ) | | | (82,917 | ) |
Less – treasury stock, at cost | | | — | | | — | | | | — | | | | — | | | | — | | | — | | | 2,764,390 | | | | 2,764,390 | |
Total | | | 1,433,926 | | | 2,205,551 | | | | 1,318,308 | | | | 617,637 | | | | 153,988 | | | 857,386 | | | 5,054,786 | | | | 11,641,582 | |
Commitments and Contingencies | | | | | | | | | | | | | | | | | | | | | | | | | | | | | |
TOTAL LIABILITIES AND SHAREHOLDERS’ OR MEMBERS’ EQUITY | | $ | 5,541,036 | | $ | 7,786,677 | | | $ | 5,654,842 | | | $ | 2,440,891 | | | $ | 921,151 | | $ | 2,853,240 | | $ | 8,490,998 | | | $ | 33,688,836 | |
(a) | 2006 reflects deconsolidationof Entergy New Orleans, Inc. |
| Totals | may not foot due to rounding. |
27
UTILITY FINANCIAL RESULTS
UTILITY SELECTED ANNUAL FINANCIAL METRICS
| | | | | | | | | | | |
| | | 2006 | | 2005 | | 2004 | | 2003 | | | 2002 |
ENTERGY ARKANSAS, INC | | | | | | | | | | | |
As-Reported Earnings ($ millions) | | 165.6 | | 166.9 | | 134.4 | | 118.2 | | | 127.9 |
Less Special Items ($ millions) | | — | | — | | — | | (28.4 | ) | | — |
Operational Earnings ( $ millions) | | 165.6 | | 166.9 | | 134.4 | | 146.6 | | | 127.9 |
GAAP MEASURES | | | | | | | | | | | |
Return on Average Common Equity – As-Reported (%) | | 11.6 | | 12.1 | | 10.3 | | 9.4 | | | 10.4 |
Return on Average Invested Capital – As-Reported (%) | | 7.6 | | 7.6 | | 6.6 | | 6.2 | | | 6.8 |
Cash Flow Interest Coverage (# times) | | 7.0 | | 7.7 | | 7.9 | | 5.5 | | | 4.7 |
Debt to Capital Ratio (%) | | 48.1 | | 47.5 | | 50.1 | | 51.2 | | | 53.7 |
Total Debt ($ millions) | | 1,436 | | 1,400 | | 1,450 | | 1,465 | | | 1,560 |
Total Preferred ($ millions) | | 116 | | 116 | | 116 | | 116 | | | 116 |
Total Equity ( $ millions) | | 1,434 | | 1,430 | | 1,327 | | 1,278 | | | 1,230 |
NON-GAAP MEASURES | | | | | | | | | | | |
Return on Average Common Equity – Operational (%) | | 11.6 | | 12.1 | | 10.3 | | 11.7 | | | 10.4 |
Return on Average Invested Capital – Operational (%) | | 7.6 | | 7.6 | | 6.6 | | 7.1 | | | 6.8 |
Net Debt to Net Capital Ratio (%) | | 47.5 | | 47.4 | | 48.5 | | 51.1 | | | 52.1 |
ENTERGY GULF STATES, INC. | | | | | | | | | | | |
As-Reported Earnings ($ millions) | | 208.0 | | 202.3 | | 187.8 | | 37.9 | | | 169.2 |
Less Special Items ($ millions) | | — | | — | | — | | (102.4 | ) | | — |
Operational Earnings ( $ millions) | | 208.0 | | 202.3 | | 187.8 | | 140.3 | | | 169.2 |
GAAP MEASURES | | | | | | | | | | | |
Return on Average Common Equity – As-Reported (%) | | 9.4 | | 10.1 | | 10.8 | | 2.2 | | | 10.0 |
Return on Average Invested Capital – As-Reported (%) | | 6.4 | | 6.5 | | 6.6 | | 3.1 | | | 6.3 |
Cash Flow Interest Coverage (# times) | | 6.5 | | 1.5 | | 5.3 | | 4.4 | | | 4.8 |
Debt to Capital Ratio (%) | | 52.0 | | 51.7 | | 53.1 | | 58.3 | | | 57.2 |
Total Debt ($ millions) | | 2,442 | | 2,426 | | 2,078 | | 2,439 | | | 2,401 |
Total Preferred ($ millions) | | 47 | | 47 | | 47 | | 47 | | | 72 |
Total Equity ( $ millions) | | 2,206 | | 2,224 | | 1,785 | | 1,695 | | | 1,725 |
NON-GAAP MEASURES | | | | | | | | | | | |
Return on Average Common Equity – Operational (%) | | 9.4 | | 10.1 | | 10.8 | | 8.2 | | | 10.0 |
Return on Average Invested Capital – Operational (%) | | 6.4 | | 6.5 | | 6.6 | | 5.6 | | | 6.3 |
Net Debt to Net Capital Ratio (%) | | 50.1 | | 51.4 | | 53.0 | | 56.2 | | | 53.7 |
ENTERGY LOUISIANA, LLC(a) | | | | | | | | | | | |
As-Reported Earnings ($ millions) | | 130.7 | | 128.1 | | 127.5 | | 146.1 | | | 144.7 |
Less Special Items ($ millions) | | — | | — | | — | | (12.6 | ) | | — |
Operational Earnings ( $ millions) | | 130.7 | | 128.1 | | 127.5 | | 158.7 | | | 144.7 |
GAAP MEASURES | | | | | | | | | | | |
Return on Average Members’ Equity – As-Reported (%) | | 10.8 | | 12.0 | | 12.4 | | 14.3 | | | 12.9 |
Return on Average Invested Capital – As-Reported (%) | | 7.3 | | 7.8 | | 8.4 | | 8.9 | | | 8.5 |
Cash Flow Interest Coverage (# times) | | 6.1 | | 3.1 | | 8.3 | | 6.0 | | | 11.7 |
Debt to Capital Ratio (%) | | 46.4 | | 51.3 | | 49.6 | | 48.6 | | | 55.0 |
Total Debt ($ millions) | | 1,230 | | 1,271 | | 1,017 | | 968 | | | 1,250 |
Total Preferred ($ millions) | | 100 | | 100 | | — | | — | | | — |
Total Equity ( $ millions) | | 1,318 | | 1,105 | | 1,033 | | 1,022 | | | 1,021 |
NON-GAAP MEASURES | | | | | | | | | | | |
Return on Average Members’ Equity – Operational (%) | | 10.8 | | 12.0 | | 12.4 | | 15.5 | | | 12.9 |
Return on Average Invested Capital – Operational (%) | | 7.3 | | 7.8 | | 8.4 | | 9.5 | | | 8.5 |
Net Debt to Net Capital Ratio (%) | | 46.4 | | 49.2 | | 45.8 | | 48.4 | | | 47.9 |
(a) | EffectiveDecember 31, 2005, Entergy Louisiana, LLC, (ELL), a limited liability company organized under the laws of the State of Texas as part of a restructuring involving a Texas statutory merger-by-division, succeeded to all of the regulated utility operations of Entergy Louisiana, Inc. (ELI). ELL was allocated substantially all of the property and other assets of ELI, including all assets used to provide retail and wholesale electric service to ELI’s retail customers. ELL also assumed substantially all of the liabilities of ELI, including all of its debt securities and leases but excluding the outstanding preferred stock of ELI. Current and prior periods reflect metrics for ELL. |
28
UTILITY FINANCIAL RESULTS
UTILITY SELECTED ANNUAL FINANCIAL METRICS (CONTINUED)
| | | | | | | | | | | | | |
| | | 2006 | | 2005 | | | 2004 | | 2003 | | | 2002 | |
ENTERGY MISSISSIPPI, INC. | | | | | | | | | | | | | |
As-Reported Earnings ($ millions) | | 49.5 | | 58.8 | | | 70.1 | | 63.7 | | | 49.0 | |
Less Special Items ($ millions) | | — | | — | | | — | | (4.5 | ) | | — | |
Operational Earnings ( $ millions) | | 49.5 | | 58.8 | | | 70.1 | | 68.2 | | | 49.0 | |
GAAP MEASURES | | | | | | | | | | | | | |
Return on Average Common Equity – As-Reported (%) | | 8.3 | | 10.6 | | | 13.3 | | 12.8 | | | 10.4 | |
Return on Average Invested Capital – As-Reported (%) | | 5.9 | | 6.7 | | | 7.7 | | 7.2 | | | 6.4 | |
Cash Flow Interest Coverage (# times) | | 9.5 | | 1.1 | | | 7.3 | | 7.3 | | | 4.7 | |
Debt to Capital Ratio (%) | | 54.3 | | 52.7 | | | 54.2 | | 56.4 | | | 59.0 | |
Total Debt ($ millions) | | 795 | | 695 | | | 695 | | 730 | | | 765 | |
Total Preferred ( $ millions) | | 50 | | 50 | | | 50 | | 50 | | | 50 | |
Total Equity ( $ millions) | | 618 | | 573 | | | 537 | | 514 | | | 482 | |
NON-GAAP MEASURES | | | | | | | | | | | | | |
Return on Average Common Equity – Operational (%) | | 8.3 | | 10.6 | | | 13.3 | | 13.7 | | | 10.4 | |
Return on Average Invested Capital – Operational (%) | | 5.9 | | 6.7 | | | 7.7 | | 7.6 | | | 6.4 | |
Net Debt to Net Capital Ratio (%) | | 51.9 | | 52.6 | | | 51.1 | | 54.1 | | | 53.7 | |
ENTERGY NEW ORLEANS, INC. | | | | | | | | | | | | | |
As-Reported Earnings ($ millions) | | 4.1 | | 0.8 | | | 27.1 | | 6.9 | | | (1.2) | |
Less Special Items ($ millions) | | — | | — | | | — | | (3.0 | ) | | — | |
Operational Earnings ( $ millions) | | 4.1 | | 0.8 | | | 27.1 | | 9.9 | | | (1.2) | |
GAAP MEASURES | | | | | | | | | | | | | |
Return on Average Common Equity – As-Reported (%) | | 2.7 | | 0.5 | | | 18.9 | | 5.3 | | | (0.9) | |
Return on Average Invested Capital – As-Reported (%) | | 3.3 | | 1.8 | | | 9.6 | | 4.6 | | | 3.4 | |
Cash Flow Interest Coverage (# times) | | 5.9 | | (1.9 | ) | | 5.2 | | 1.6 | | | 4.4 | |
Debt to Capital Ratio (%) | | 61.9 | | 66.4 | | | 56.9 | | 60.1 | | | 60.7 | |
Total Debt ($ millions) | | | | | | | | | | | | | |
Not Subject to Compromise ($ millions) | | 282 | | 105 | | | 230 | | 229 | | | 229 | |
Subject to Compromise ($ millions) | | — | | 230 | | | — | | — | | | — | |
Total Debt ( $ millions) | | 282 | | 335 | | | 230 | | 229 | | | 229 | |
Total Preferred ( $ millions) | | 20 | | 20 | | | 20 | | 20 | | | 20 | |
Total Equity ( $ millions) | | 154 | | 150 | | | 154 | | 133 | | | 129 | |
NON-GAAP MEASURES | | | | | | | | | | | | | |
Return on Average Common Equity – Operational (%) | | 2.7 | | 0.5 | | | 18.9 | | 7.6 | | | (0.9 | ) |
Return on Average Invested Capital – Operational (%) | | 3.3 | | 1.8 | | | 9.6 | | 5.4 | | | 3.4 | |
Net Debt to Net Capital Ratio (%) | | 60.4 | | 62.8 | | | 56.0 | | 59.6 | | | 52.3 | |
SYSTEM ENERGY RESOURCES, INC. | | | | | | | | | | | | | |
As-Reported Earnings ($ millions) | | 140.3 | | 111.6 | | | 105.9 | | 106.0 | | | 103.4 | |
Less Special Items ($ millions) | | — | | — | | | — | | (6.1 | ) | | — | |
Operational Earnings ( $ millions) | | 140.3 | | 111.6 | | | 105.9 | | 112.1 | | | 103.4 | |
GAAP MEASURES | | | | | | | | | | | | | |
Return on Average Common Equity – As-Reported (%) | | 16.0 | | 12.5 | | | 11.9 | | 11.9 | | | 11.6 | |
Return on Average Invested Capital – As-Reported (%) | | 9.9 | | 8.1 | | | 7.7 | | 7.9 | | | 8.0 | |
Cash Flow Interest Coverage (# times) | | 3.1 | | 5.5 | | | 7.1 | | 2.9 | | | 4.0 | |
Debt to Capital Ratio (%) | | 50.6 | | 51.1 | | | 51.2 | | 51.2 | | | 52.3 | |
Total Debt ($ millions) | | 879 | | 934 | | | 940 | | 936 | | | 979 | |
Total Preferred ( $ millions) | | — | | — | | | — | | — | | | — | |
Total Equity ( $ millions) | | 857 | | 894 | | | 895 | | 893 | | | 892 | |
NON-GAAP MEASURES | | | | | | | | | | | | | |
Return on Average Common Equity – Operational (%) | | 16.0 | | 12.5 | | | 11.9 | | 12.6 | | | 11.6 | |
Return on Average Invested Capital – Operational (%) | | 9.9 | | 8.1 | | | 7.7 | | 8.2 | | | 8.0 | |
29
UTILITY SECURITIES DETAIL
UTILITY LONG-TERM DEBT AND PREFERRED STOCK
ENTERGY ARKANSAS, INC.
| | | | | | | | | | | | | | | | | | | | | | | | | |
BONDS: CUSIP | | | | Type* | | Rate | | | Maturity
Date | | First Call
Date | | Current or First Call Price | | As of December 31, | |
| | | | | | | | 2006 | | | 2005 | | | 2004 | |
| | | | | | | | | | | | | | | | (in millions) | |
29364DAC4 | | 6.125% Series | | M | | 6.125 | % | | 07/05 | | — | | — | | $ | — | | | $ | — | | | $ | 100 | |
29364DAM2 | | 4.50% Series | | M | | 4.50 | % | | 06/10 | | Now | | MW (T + .25%) | | | 100 | | | | 100 | | | | — | |
732835AW3 | | 6.3% Series – Pope County(c) | | G(b) | | 6.3 | % | | 2016 | | Now | | 101% | | | 20 | | | | 20 | | | | 20 | |
472712EQ7 | | 5.6% Series – Jefferson County | | G(b) | | 5.6 | % | | 2017 | | Now | | 100% | | | — | | | | 46 | | | | 46 | |
472712ER5 | | 4.6% Series – Jefferson County(c) | | G(b) | | 4.6 | % | | 10/17 | | 6/13/11 | | 100% | | | 55 | | | | — | | | | — | |
472712DN5 | | 6.3% Series – Jefferson County(c) | | G(b) | | 6.3 | % | | 2018 | | Now | | 101% | | | — | | | | 9 | | | | 9 | |
29364DAE0 | | 5.4% Series | | M | | 5.4 | % | | 05/18 | | Now | | MW (T + .25%) | | | 150 | | | | 150 | | | | 150 | |
29364DAH3 | | 5.0% Series | | M | | 5.0 | % | | 07/18 | | Now | | MW (T + .25%) | | | 115 | | | | 115 | | | | 115 | |
732835BA0 | | 6.3% Series – Pope County | | G(b) | | 6.3 | % | | 2020 | | Now | | 100% | | | 120 | | | | 120 | | | | 120 | |
453424AY9 | | 6.25% Series – Independence County(c) | | G(b) | | 6.25 | % | | 2021 | | — | | — | | | — | | | | — | | | | 45 | |
453424BP | | 5.0% Series – Independence County(c) | | G(b) | | 5.0 | % | | 2021 | | 7/1/10 | | 100% | | | 45 | | | | 45 | | | | — | |
041033CD1 | | 7.0% Series | | M | | 7.0 | % | | 10/23 | | — | | — | | | — | | | | — | | | | 175 | |
29364DAL4 | | 5.66% Series | | M | | 5.66 | % | | 02/25 | | Now | | MW (T + .20%) | | | 175 | | | | 175 | | | | — | |
732840AA1 | | 5.05% Series – Pope County(d) | | G(b) | | 5.05 | % | | 2028 | | — | | — | | | — | | | | — | | | | 47 | |
29364D811 | | 6.7% Series | | M | | 6.7 | % | | 04/32 | | 4/1/07 | | 100% | | | 100 | | | | 100 | | | | 100 | |
29364D795 | | 6.0% Series | | M | | 6.0 | % | | 11/32 | | 11/12/07 | | 100% | | | 100 | | | | 100 | | | | 100 | |
29364DAJ9 | | 5.9% Series | | M | | 5.9 | % | | 06/33 | | Now | | MW (T + .25%) | | | 100 | | | | 100 | | | | 100 | |
29364DAK6 | | 6.38% Series | | M | | 6.38 | % | | 11/34 | | Now | | MW (T + .25%) | | | 60 | | | | 60 | | | | 60 | |
| | | Total bonds | | | | | | | | | | | | | | 1,139 | | | | 1,139 | | | | 1,186 | |
OTHER LONG-TERM DEBT: | |
| | | Long-Term United States Department of Energy Obligation(e) | | | | | | | | | | | | | | 169 | | | | 161 | | | | 156 | |
| | | Unamortized Premium and Discount – Net | | | | | | | | | | | | | | (2 | ) | | | (2 | ) | | | (4 | ) |
| | | Other | | | | | | | | | | | | | | — | | | | — | | | | 1 | |
TOTAL LONG-TERM DEBT | | | | | | | | | | | | | | 1,306 | | | | 1,298 | | | | 1,339 | |
Less Amount Due Within One Year | | | | | | | | | | | | | | — | | | | — | | | | 147 | |
Long-Term Debt Excluding Amount Due Within One Year | | | | | | | | | | | | | $ | 1,306 | | | $ | 1,298 | | | $ | 1,192 | |
Fair Value of Long-Term Debt(a) | | | | | | | | | | | | | $ | 1,113 | | | $ | 1,141 | | | $ | 1,225 | |
| | | | | |
* M = Mortgage; G = Governmental | | | | | | | | | | | | | | | | |
| | | | | | | | |
Weighted-average annualized coupon rate | | | | | | | | | | | | | | 5.6 | % | | | 5.7 | % | | | 6.1 | % |
(a) | Thefair value excludes lease obligations, long-term DOE obligations, and other long-term debt and includes debt due within one year. It is determined using bid prices reported by dealer markets and by nationally recognized investment banking firms. |
(b) | Consistsof pollution control revenue bonds and environmental revenue bonds. |
(c) | Thebonds are secured by a series of collateral first mortgage bonds. |
(d) | Thebonds had a mandatory tender date of September 1, 2005. Entergy Arkansas purchased the bonds from the holders, pursuant to the mandatory tender provision, and has not remarketed the bonds at this time. |
(e) | Pursuant to the Nuclear Waste Policy Act of 1982, Entergy’s nuclear owner/licensee subsidiaries have contracts with the DOE for spent nuclear fuel disposal service. The contracts include a one-time fee for generation prior to April 7, 1983. Entergy Arkansas is the only Entergy company that generated electric power with nuclear fuel prior to that date and includes the one-time fee, plus accrued interest, in long-term debt. |
Totals may not foot due to rounding.
| | | | | | | | | | | | | | | | | | | | | | | |
PREFERRED STOCK: CUSIP | | | | | | | Shares Authorized and Outstanding As
of December 31, | | As of December 31, | | Call Price
Per Share as
of
December 31, 2006 |
| | | | Rate | | | 2006 | | 2005 | | 2004 | | 2006 | | 2005 | | 2004 | |
| | | | | | | | | | | | | | (in millions) | | |
| | | Without sinking fund: | | | | | | | | | | | | | | | | | | | | | |
| | | Cumulative, $100 par value: | | | | | | | | | | | | | | | | | | | | | |
29364D209 | | 4.32% Series | | 4.32 | % | | 70,000 | | 70,000 | | 70,000 | | $ | 7 | | $ | 7 | | $ | 7 | | $ | 103.65 |
29364D506 | | 4.72% Series | | 4.72 | % | | 93,500 | | 93,500 | | 93,500 | | | 9 | | | 9 | | | 9 | | | 107.00 |
29364D308 | | 4.56% Series | | 4.56 | % | | 75,000 | | 75,000 | | 75,000 | | | 8 | | | 8 | | | 8 | | | 102.83 |
29364D407 | | 4.56% 1965 Series | | 4.56 | % | | 75,000 | | 75,000 | | 75,000 | | | 8 | | | 8 | | | 8 | | | 102.50 |
29364D605 | | 6.08% Series | | 6.08 | % | | 100,000 | | 100,000 | | 100,000 | | | 10 | | | 10 | | | 10 | | | 102.83 |
29364D704 | | 7.32% Series | | 7.32 | % | | — | | 100,000 | | 100,000 | | | — | | | 10 | | | 10 | | | — |
29364D803 | | 7.80% Series | | 7.80 | % | | — | | 150,000 | | 150,000 | | | — | | | 15 | | | 15 | | | — |
29364D829 | | 7.40% Series | | 7.40 | % | | — | | 200,000 | | 200,000 | | | — | | | 20 | | | 20 | | | — |
29364D852 | | 7.88% Series | | 7.88 | % | | — | | 150,000 | | 150,000 | | | — | | | 15 | | | 15 | | | — |
| | | Cumulative, $25 par value: | | | | | | | | | | | | | | | | | | | | | |
29364D787 | | 6.45% Series | | 6.45 | % | | 3,000,000 | | — | | — | | | 75 | | | — | | | — | | | 25.00 |
| | | Cumulative, $0.01 par value: | | | | | | | | | | | | | | | | | | | | | |
29364D837 | | $ 1.96 Series(a) | | | | | — | | 600,000 | | 600,000 | | | — | | | 15 | | | 15 | | | — |
| | | Total without sinking fund | | | | | 3,413,500 | | 1,613,500 | | 1,613,500 | | $ | 116 | | $ | 116 | | $ | 116 | | | |
30
UTILITY SECURITIES DETAIL
UTILITY LONG-TERM DEBT AND PREFERRED STOCK
ENTERGY GULF STATES, INC.
| | | | | | | | | | | | | | | | | | | | | | | | | |
BONDS: CUSIP | | | | Type* | | | Rate | | Maturity
Date | | First Call
Date | | Current or First Call Price | | As of December 31, | |
| | | | | | | | | 2006 | | | 2005 | | | 2004 | |
| | | | | | | | | | | | | | | | (in millions) | |
| 402550CG0 | | 6.77% Series | | M | | | 6.77% | | 08/05 | | — | | — | | $ | — | | | $ | — | | | $ | 98 | |
| 29364LAG7 | | 3.6% Series | | M | | | 3.6% | | 06/08 | | Now | | 100% | | | 325 | | | | 325 | | | | 325 | |
| 296364LAW2 | | Libor + 0.75% Series | | M | | | Libor + 0.75% | | 12/08 | | 12/8/06 | | 100% | | | 350 | | | | 350 | | | | — | |
| 29364LAN5 | | Libor + 0.4% Series | | M | | | Libor + 0.4% | | 12/09 | | 12/06 | | 100% | | | 225 | | | | 225 | | | | 225 | |
| 29364LAV4 | | 5.12% Series | | M | | | 5.12% | | 08/10 | | Now | | MW (T + .25%) | | | 100 | | | | 100 | | | | — | |
| 128318BL5 | | 5.45% Series – Calcasieu Parish | | G(b) | | | 5.45% | | 2010 | | Now | | 101% | | | 22 | | | | 22 | | | | 22 | |
| 730816AF9 | | 6.75% Series – Calcasieu Parish | | G(b) | | | 6.75% | | 2012 | | Now | | 100% | | | 48 | | | | 48 | | | | 48 | |
| 29364LAQ5 | | 4.875% Series | | M | | | 4.875% | | 11/11 | | Now | | MW (T + .20%) | | | 200 | | | | 200 | | | | 200 | |
| 29364LAF9 | | 6.0% Series | | M | | | 6.0% | | 12/12 | | Now | | MW (T + .30%) | | | 140 | | | | 140 | | | | 140 | |
| 730816AF9 | | 6.7% Series – Pointe Coupee Parish | | G(b) | | | 6.7% | | 2013 | | Now | | 100% | | | 17 | | | | 17 | | | | 17 | |
| 450877AJ | | 5.7% Series – Iberville Parish | | G(b) | | | 5.7% | | 2014 | | Now | | 100% | | | 22 | | | | 22 | | | | 22 | |
| 952789AT2, | | 7.7% Series – West Feliciana Parish | | G | (b) | | 7.7% | | 2014 | | — | | — | | | — | | | | — | | | | 94 | |
| 952789AU9, | | | | | | | | | | | | | | | | | | | | | | | | | |
| 952789AV7 | | | | | | | | | | | | | | | | | | | | | | | | | |
| 29364LAS1 | | 5.6% Series | | M | | | 5.6% | | 12/14 | | Now | | MW (T + .25%) | | | 50 | | | | 50 | | | | 50 | |
| 29364LAU6 | | 5.70% Series | | M | | | 5.70% | | 06/15 | | Now | | MW (T +. 30%) | | | 200 | | | | 200 | | | | — | |
| 952789AQ8 | | 5.8% Series – West Feliciana Parish | | G(b) | | | 5.8% | | 2015 | | Now | | 100% | | | 28 | | | | 28 | | | | 28 | |
| 952789AW5 | | 7.0% Series – West Feliciana Parish | | G(b) | | | 7.0% | | 2015 | | Now | | 100% | | | 39 | | | | 39 | | | | 39 | |
| 952789AM7 | | 7.5% Series – West Feliciana Parish | | G(b) | | | 7.5% | | 2015 | | — | | — | | | — | | | | — | | | | 42 | |
| 952789AS4 | | 9.0% Series – West Feliciana Parish | | G(b) | | | 9.0% | | 2015 | | — | | — | | | — | | | | — | | | | 45 | |
| 29364LAN2 | | 5.25% Series | | M | | | 5.25% | | 08/15 | | Now | | MW (T + .15%) | | | 200 | | | | 200 | | | | 200 | |
| 952789AR6 | | 5.8% Series – West Feliciana Parish | | G(b) | | | 5.8% | | 2016 | | Now | | 100% | | | 20 | | | | 20 | | | | 20 | |
| 952789BB0 | | 6.6% Series – West Feliciana Parish | | G(b) | | | 6.6% | | 2028 | | Now | | 101% | | | 40 | | | | 40 | | | | 40 | |
| 29364LAL6 | | 6.2% Series | | M | | | 6.2% | | 07/33 | | Now | | MW (T + .15%) | | | 240 | | | | 240 | | | | 240 | |
| 2936LAT9 | | 6.18% Series | | M | | | 6.18% | | 03/35 | | Now | | MW (T + .30%) | | | 85 | | | | 85 | | | | — | |
| | | Total bonds | | | | | | | | | | | | | | 2,352 | | | | 2,352 | | | | 1,895 | |
| OTHER LONG-TERM DEBT: | |
| 2936H200 | | 8.75% Junior Subordinated Deferrable Interest Debentures | | | | | | | | | | | | | | — | | | | — | | | | 88 | |
| | | Unamortized Premium and Discount – Net | | | | | | | | | | | | | | (2 | ) | | | (3 | ) | | | (2 | ) |
| | | Other | | | | | | | | | | | | | | 9 | | | | 9 | | | | 9 | |
| TOTAL LONG-TERM DEBT | | | | | | | | | | | | | | 2,358 | | | | 2,358 | | | | 1,989 | |
| Less Amount Due Within One Year | | | | | | | | | | | | | | — | | | | — | | | | 98 | |
| Long-Term Debt Excluding Amount Due Within One Year | | | | | | | | | | | | | $ | 2,358 | | | $ | 2,358 | | | $ | 1,891 | |
| Fair Value of Long-Term Debt(a) | | | | | | | | | | | | | $ | 2,324 | | | $ | 2,365 | | | $ | 1,999 | |
| | | | | | | | |
| *M = Mortgage; G = Governmental Weighted-average annualized coupon rate | | | | | | | | | | | | | | 5.5 | % | | | 5.3 | % | | | 5.6 | % |
(a) | The fair value excludes lease obligations, long-term DOE obligations, and other long-term debt and includes debt duewithin one year. It is determined using bid prices reported by dealer markets and by nationally recognized investment banking firms. |
(b) | Consists ofpollution control revenue bonds and environmental revenue bonds. |
Totals may not foot due to rounding.
| | | | | | | | | | | | | | | | | | | | | | | |
PREFERRED STOCK: CUSIP | | | | | Shares Authorized and Outstanding As of December 31, | | As of December 31, | | Call Price
Per Share as
of
December 31, |
| | Rate | | | 2006 | | 2005 | | 2004 | | 2006 | | 2005 | | 2004 | | 2006 |
| | | | | | | | | | | | | | (in millions) | | |
| Authorized 6,000,000 shares, $100 par value, cumulative | | | | | | | | | | | | | | | | | | | |
| | | Without sinking fund: | | | | | | | | | | | | | | | | | | | | | |
| 29364L201 | | 4.40% Series | | 4.40 | % | | 51,173 | | 51,173 | | 51,173 | | $ | 5 | | $ | 5 | | $ | 5 | | $ | 108.00 |
| 29364L789 | | 4.50% Series | | 4.50 | % | | 5,830 | | 5,830 | | 5,830 | | | 1 | | | 1 | | | 1 | | | 105.00 |
| 29364L797 | | 4.40% 1949 Series | | 4.40 | % | | 1,655 | | 1,655 | | 1,655 | | | — | | | — | | | — | | | 103.00 |
| 29364L805 | | 4.20% Series | | 4.20 | % | | 9,745 | | 9,745 | | 9,745 | | | 1 | | | 1 | | | 1 | | | 102.82 |
| 29364L300 | | 4.44% Series | | 4.44 | % | | 14,804 | | 14,804 | | 14,804 | | | 1 | | | 1 | | | 1 | | | 103.75 |
| 29364L508 | | 5.00% Series | | 5.00 | % | | 10,993 | | 10,993 | | 10,993 | | | 1 | | | 1 | | | 1 | | | 104.25 |
| 29364L607 | | 5.08% Series | | 5.08 | % | | 26,845 | | 26,845 | | 26,845 | | | 3 | | | 3 | | | 3 | | | 104.63 |
| 29364L409 | | 4.52% Series | | 4.52 | % | | 10,564 | | 10,564 | | 10,564 | | | 1 | | | 1 | | | 1 | | | 103.57 |
| 29364L706 | | 6.08% Series | | 6.08 | % | | 32,829 | | 32,829 | | 32,829 | | | 3 | | | 3 | | | 3 | | | 103.34 |
| 29364L847 | | 7.56% Series | | 7.56 | % | | 308,830 | | 308,830 | | 308,830 | | | 31 | | | 31 | | | 31 | | | 101.80 |
| | | Total without sinking fund | | | | | 473,268 | | 473,268 | | 473,268 | | $ | 47 | | $ | 47 | | $ | 47 | | | |
| | | With sinking fund: | | | | | | | | | | | | | | | | | | | | | |
| 29364L839 | | Adjustable Rate – A, 7.0%(b) | | 7.0 | % | | 60,000 | | 72,000 | | 84,000 | | | 6 | | | 7 | | | 8 | | $ | 100.00 |
| 29364L821 | | Adjustable Rate – B, 7.0%(b) | | 7.0 | % | | 45,000 | | 67,500 | | 90,000 | | | 4 | | | 7 | | | 9 | | | 100.00 |
| | | Total with sinking fund | | | | | 105,000 | | 139,500 | | 174,000 | | $ | 10 | | $ | 14 | | $ | 17 | | | |
| Fair Value of Preferred Stock with sinking fund(a) | | | | | | | | | | | $ | 8 | | $ | 15 | | $ | 15 | | | |
(a) | Fair values were determined using bid prices reported by dealer markets and by nationally recognized investment bankingfirms. |
(b) | Represents weighted-average annualized rates for 2006, 2005, and2004. |
Totals may not foot due to rounding.
31
UTILITY SECURITIES DETAIL
UTILITY LONG-TERM DEBT AND PREFERRED STOCK
ENTERGY LOUISIANA, LLC
| | | | | | | | | | | | | | | | | | | | | | |
BONDS: CUSIP | | | | Type* | | Rate | | Maturity
Date | | First Call
Date | | Current or
First Call Price | | As of December 31, | |
| | | | | | | | 2006 | | 2005 | | 2004 | |
| | | | | | | | | | | | | | | (in millions) | |
| 29364WAD0 | | 4.67% Series | | M | | 4.67% | | 06/10 | | Now | | MW (T + .20%) | | $ | 55 | | $ | 55 | | $ | — | |
| 29364WAG3 | | 5.83% Series | | M | | 5.83% | | 11/10 | | Now | | MW (T + .30%) | | | 150 | | | 150 | | | — | |
| 29364MAC2 | | 5.09% Series | | M | | 5.09% | | 11/14 | | Now | | MW (T + .20%) | | | 115 | | | 115 | | | 115 | |
| 29364WAE8 | | 5.56% Series | | M | | 5.56% | | 09/15 | | Now | | MW (T + .25%) | | | 100 | | | 100 | | | — | |
| 29364WAA6 | | 5.5% Series | | M | | 5.5% | | 04/19 | | Now | | MW (T + .25%) | | | 100 | | | 100 | | | 100 | |
| 788070BQ2 | | 7.5% Series – St. Charles Parish | | G(b) | | 7.5% | | 2021 | | — | | — | | | — | | | — | | | 50 | |
| 788116AB7 | | 7.0% Series – St. Charles Parish | | G(b) | | 7.0% | | 2022 | | — | | — | | | — | | | — | | | 24 | |
| 788116AA9 | | 7.05% Series – St. Charles Parish | | G(b) | | 7.05% | | 2022 | | — | | — | | | — | | | — | | | 20 | |
| 788050AE2 | | 5.95% Series – St. Charles Parish(c) | | G(b) | | 5.95% | | 2023 | | Now | | 101% | | | — | | | 25 | | | 25 | |
| 788050AC6 | | 6.2% Series – St. Charles Parish | | G(b) | | 6.2% | | 2023 | | — | | — | | | — | | | — | | | 33 | |
| 788050AH5 | | 6.875% Series – St. Charles Parish | | G(b) | | 6.875% | | 2024 | | — | | — | | | — | | | — | | | 20 | |
| 788050AP7 | | 6.375% Series – St. Charles Parish | | G(b) | | 6.375% | | 2025 | | — | | — | | | — | | | — | | | 17 | |
| 788070CD0 | | Auction Rate – St. Charles Parish(c) | | G(b) | | 3.5% | | 2030 | | Now | | 100% | | | 60 | | | 60 | | | 60 | |
| 788070CC2 | | 4.9% Series – St. Charles Parish(d) | | G(b) | | 4.9% | | 2030 | | — | | — | | | — | | | — | | | 55 | |
| 29364W207 | | 7.6% Series | | M | | 7.6% | | 04/32 | | 4/1/07 | | 100% | | | 150 | | | 150 | | | 150 | |
| 29364WAB4 | | 6.4% Series | | M | | 6.4% | | 10/34 | | Now | | MW (T + .25%) | | | 70 | | | 70 | | | 70 | |
| 29364WAF5 | | 6.3% Series | | M | | 6.3% | | 09/35 | | Now | | MW (T + .35%) | | | 100 | | | 100 | | | — | |
| | | Total bonds | | | | | | | | | | | | | 900 | | | 925 | | | 739 | |
| OTHER LONG-TERM DEBT: | |
| | | Waterford 3 Lease Obligation 7.45% | | | | 7.45% | | | | | | | | | 248 | | | 248 | | | 248 | |
| | | Unamortized Premium and Discount – Net | | | | | | | | | | | | | — | | | — | | | (1 | ) |
| TOTAL LONG-TERM DEBT | | | | | | | | | | | | | 1,148 | | | 1,172 | | | 986 | |
| Less Amount Due Within One Year | | | | | | | | | | | | | — | | | — | | | 55 | |
Long-Term Debt Excluding Amount Due Within
One Year | | | | | | | | | | | | $ | 1,148 | | $ | 1,172 | | $ | 931 | |
| Fair Value of Long-Term Debt(a) | | | | | | | | | | | | | $ 870 | | $ | 935 | | $ | 763 | |
|
| *M = Mortgage; G = Governmental | |
| | | | | | | | |
| Weighted-average annualized coupon rate | | | | | | | | | | | | | 6.2% | | | 6.2% | | | 5.9% | |
(a) | The using bid prices reported by dealerfair value excludes lease obligations, long-term DOE obligations, and other long-term debt and includes debt due within one year. It is determined markets and by nationally recognized investment banking firms. |
(b) | Consists of pollution control revenue bonds and environmental revenue bonds. |
(c) | The bonds are secured by a series of collateral first mortgage bonds. |
(d) | The bonds had a mandatory tender date of June 1, 2005. Entergy Louisiana purchased the bonds from the holders, pursuant to the mandatory tender provision, and has not remarketed the bonds at this time. |
Totals may not foot due to rounding.
ENTERGY LOUISIANA HOLDINGS, INC.(a)
| | | | | | | | | | | | | | | | | | | | | | |
PREFERRED STOCK:
CUSIP | | | | | | | Shares Authorized and Outstanding As of December 31, | | As of December 31, | | Call Price Per
Share as of
December 31, |
| | | | Rate | | | 2006 | | 2005 | | 2004 | | 2006 | | 2005 | | 2004 | | 2006 |
| | | | | | | | | | | | | | (in millions) | | |
| | | Without sinking fund: | | | | | | | | | | | | | | | | | | | | |
| | | Cumulative, $100 par value: | | | | | | | | | | | | | | | | | | | | |
| 29364M407 | | 4.96% Series | | 4.96 | % | | — | | 60,000 | | 60,000 | | $ | — | | $ | 6 | | $ | 6 | | — |
| 29364M209 | | 4.16% Series | | 4.16 | % | | — | | 70,000 | | 70,000 | | | — | | | 7 | | | 7 | | — |
| 29364M308 | | 4.44% Series | | 4.44 | % | | — | | 70,000 | | 70,000 | | | — | | | 7 | | | 7 | | — |
| 29364M506 | | 5.16% Series | | 5.16 | % | | — | | 75,000 | | 75,000 | | | — | | | 8 | | | 8 | | — |
| 29364M605 | | 5.40% Series | | 5.40 | % | | — | | 80,000 | | 80,000 | | | — | | | 8 | | | 8 | | — |
| 29364M704 | | 6.44% Series | | 6.44 | % | | — | | 80,000 | | 80,000 | | | — | | | 8 | | | 8 | | — |
| 29364M845 | | 7.84% Series | | 7.84 | % | | — | | 100,000 | | 100,000 | | | — | | | 10 | | | 10 | | — |
| 29364M837 | | 7.36% Series | | 7.36 | % | | — | | 100,000 | | 100,000 | | | — | | | 10 | | | 10 | | — |
| | | Cumulative, $25 par value: | | | | | | | | | | | | | | | | | | | | |
| 29364M803 | | 8.00% Series | | 8.00 | % | | — | | 1,480,000 | | 1,480,000 | | | — | | | 37 | | | 37 | | — |
| | | Total without sinking fund | | | | | — | | 2,115,000 | | 2,115,000 | | $ | — | | $ | 101 | | $ | 101 | | — |
(a) | OnDecember 31, 2005, and immediately prior to the formation of Entergy Louisiana, LLC (ELL), Entergy Louisiana, Inc. (ELI) changed its state of incorporation from Louisiana and its name to Entergy Louisiana Holdings, Inc. (ELH). ELH succeeded to ELI’s rights and obligations with respect to ELI’s outstanding preferred stock. Within three to six months of the effective date of the merger-by-division, ELH expects to redeem or repurchase and retire the ELI preferred stock then outstanding and thereafter amend its charter to eliminate authority toissue preferred stock. |
Totals may not foot due to rounding.
ENTERGY LOUISIANA, LLC
PREFERRED STOCK:
| | | | | | | | | | | | | | | | | | | | | |
| | | | | | | | Shares Authorized and
Outstanding As of December 31, | | As of December 31, | | Call Price Per
Share as of
December 31, |
| CUSIP | | | | Rate | | | 2006 | | 2005 | | 2004 | | 2006 | | 2005 | | 2004 | | 2006 |
| | | | | | | | | | | | | | (in millions) | | |
| | | Without sinking fund: | | | | | | | | | | | | | | | | | | | |
| | | Cumulative, $100 par value: | | | | | | | | | | | | | | | | | | | |
| 293649208 | | 6.95% Series(a) | | 6.95 | % | | 1,000,000 | | 1,000,000 | | — | | $ | 100 | | $ | 100 | | — | | — |
(a) | Redeemableon or after December 31, 2010 at the call price of $100 per share. |
32
UTILITY SECURITIES DETAIL
UTILITY LONG-TERM DEBT AND PREFERRED STOCK
ENTERGY MISSISSIPPI, INC.
| | | | | | | | | | | | | | | | | | | | | | | | | | | |
BONDS:
CUSIP | | | | Type* | | Rate | | | Maturity
Date | | First Call
Date | | Current
or First
Call
Price | | | | As of December 31, | |
| | | | | | | | | 2006 | | | 2005 | | | 2004 | |
| | | | | | | | | | | | | | | | | | (in millions) | |
| 29364NAJ7 | | 4.35% Series | | M | | 4.35 | % | | 04/08 | | Now | | 100% | | | | $ | 100 | | | $ | 100 | | | $ | 100 | |
| 29364NAM0 | | 4.65% Series | | M | | 4.65 | % | | 05/11 | | Now | | MW (T + .30%) | | | | | 80 | | | | 80 | | | | 80 | |
| 29364NAH1 | | 5.15% Series | | M | | 5.15 | % | | 02/13 | | Now | | MW (T + .20%) | | | | | 100 | | | | 100 | | | | 100 | |
| 29364NAN8 | | 5.92% Series | | M | | 5.92 | % | | 02/16 | | Now | | MT (T + .30%) | | | | | 100 | | | | — | | | | — | |
| 29364NAK4 | | 4.95% Series | | M | | 4.95 | % | | 06/18 | | Now | | MW (T + .25%) | | | | | 95 | | | | 95 | | | | 95 | |
| 605277AF9 | | 4.60% Series – | | | | | | | | | | | | | | | | | | | | | | | | | |
| | | Mississippi Business Finance Corp.(c) | | G(b) | | 4.60 | % | | 2022 | | 10/1/09 | | 100% | | | | | 16 | | | | 16 | | | | 16 | |
| 453424BN2 | | Auction Rate – Independence County(c) | | G(b) | | 3.60 | % | | 2022 | | Now | | 100% | | | | | 30 | | | | 30 | | | | 30 | |
| 29364N876 | | 6.0% Series | | M | | 6.0 | % | | 11/32 | | 11/1/07 | | 100% | | | | | 75 | | | | 75 | | | | 75 | |
| 29364N868 | | 7.25% Series | | M | | 7.25 | % | | 12/32 | | 11/22/07 | | 100% | | | | | 100 | | | | 100 | | | | 100 | |
| 29364NAL2 | | 6.25% Series | | M | | 6.25 | % | | 04/34 | | Now | | MW (T + .25%) | | | | | 100 | | | | 100 | | | | 100 | |
Total
bonds | | | | | | | | | | | | | | | | | | 796 | | | | 696 | | | | 696 | |
| OTHER LONG-TERM DEBT: | | | | | | | | | | | | | | | | | | | | | | | | | |
| | | Unamortized Premium and Discount – Net | | | | | | | | | | | | | | | | (1 | ) | | | (1 | ) | | | (1 | ) |
| TOTAL LONG-TERM DEBT | | | | | | | | | | | | | | | | 795 | | | | 695 | | | | 695 | |
| Less Amount Due Within One Year | | | | | | | | | | | | | | | | — | | | | — | | | | — | |
| Long-Term Debt Excluding Amount Due Within One Year | | | | | | | | | | | | | | | $ | 795 | | | $ | 695 | | | $ | 695 | |
| Fair Value of Long-Term Debt(a) | | | | | | | | | | | | | | | $ | 779 | | | $ | 698 | | | $ | 716 | |
| | | | | | | | | |
| *M = Mortgage; G = Governmental | | | | | | | | | | | | | | | | | | | | | | | | | |
| | | | | | | | | |
| Weighted-average annualized coupon rate | | | | | | | | | | | | | | | | 5.5 | % | | | 5.4 | % | | | 5.3 | % |
(a) | Theusing bid prices reported by dealer fair value excludes lease obligations, long-term DOE obligations, and other long-term debt and includes debt due within one year. It is determined markets and by nationally recognized investment banking firms. |
(b) | Consistsof pollution control revenue bonds and environmental revenue bonds. |
(c) | Thebonds are secured by a series of collateral first mortgage bonds. |
| Totals | may not foot due to rounding. |
| | | | | | | | | | | | | | | | | | | | | | | |
PREFERRED STOCK: CUSIP | | | | | Shares Authorized and Outstanding As of December 31, | | As of December 31, | | Call Price Per
Share as of
December 31, |
| | Rate | | | 2006 | | 2005 | | 2004 | | 2006 | | 2005 | | 2004 | | 2006 |
| | | | | | | | | | | | | | (in millions) | | |
| | | Without sinking fund: | | | | | | | | | | | | | | | | | | | | | |
| | | Cumulative, $100 par value: | | | | | | | | | | | | | | | | | | | | | |
| 29364N207 | | 4.36% Series | | 4.36 | % | | 59,920 | | 59,920 | | 59,920 | | $ | 6 | | $ | 6 | | $ | 6 | | $ | 103.88 |
| 29364N306 | | 4.56% Series | | 4.56 | % | | 43,887 | | 43,887 | | 43,887 | | | 4 | | | 4 | | | 4 | | | 107.00 |
| 29364N405 | | 4.92% Series | | 4.92 | % | | 100.000 | | 100,000 | | 100,000 | | | 10 | | | 10 | | | 10 | | | 102.88 |
| 29364N603 | | 7.44% Series | | 7.44 | % | | — | | — | | 100,000 | | | — | | | — | | | 10 | | | — |
| 29364N801 | | 8.36% Series | | 8.36 | % | | — | | — | | 200,000 | | | — | | | — | | | 20 | | | — |
| | | Cumulative, $25 par value: | | | | | | | | | | | | | | | | | | | | | |
| 29364N850 | | 6.25% Series(a) | | 6.25 | % | | 1,200,000 | | 1,200,000 | | — | | | 30 | | | 30 | | | — | | | — |
| | | Total without sinking fund | | | | | 1,403,807 | | 1,403,807 | | 503,807 | | $ | 50 | | $ | 50 | | $ | 50 | | | |
(a) | Seriesis non-callable until August 2010; thereafter callable at par. |
Totals may not foot due to rounding.
33
UTILITY SECURITIES DETAIL
UTILITY LONG-TERM DEBT AND PREFERRED STOCK
ENTERGY NEW ORLEANS, INC.
| | | | | | | | | | | | | | | | | | | | | | | | |
BONDS: CUSIP | | | | Type* | | Rate | | Maturity
Date | | First Call
Date | | Current
or First
Call
Price | | As of December 31, | |
| | | | | | | | 2006 | | | 2005 | | | 2004 | |
| | | | | | | | | | | | | | | (in millions) | |
29364PAB9 | | 8.125% Series | | M | | 8.125% | | 07/05 | | — | | — | | $ | — | | | $ | — | | | $ | 30 | |
29364PAE3 | | 3.875% Series | | M | | 3.875% | | 08/08 | | Now | | MW (T + .25%) | | | 30 | | | | 30 | | | | 30 | |
29364PAL7 | | 4.98% Series | | M | | 4.98% | | 07/10 | | Now | | MW (T + .20%) | | | 30 | | | | 30 | | | | — | |
29364PAF0 | | 5.25% Series | | M | | 5.25% | | 08/13 | | Now | | MW (T + .25%) | | | 70 | | | | 70 | | | | 70 | |
29364PAD5 | | 6.75% Series | | M | | 6.75% | | 10/17 | | 10/15/05 | | 100% | | | 25 | | | | 25 | | | | 25 | |
29364PAK9 | | 5.6% Series | | M | | 5.6% | | 09/24 | | 9/1/08 | | 100% | | | 35 | | | | 35 | | | | 35 | |
29364PAJ2 | | 5.65% Series | | M | | 5.65% | | 09/29 | | 9/1/09 | | 100% | | | 40 | | | | 40 | | | | 40 | |
| | | Total bonds | | | | | | | | | | | | | 230 | | | | 230 | | | | 230 | |
OTHER LONG-TERM DEBT: | | | | | | | | | | | | | | | | | | | | | | |
Unamortized Premium and Discount – Net | | | | | | | | | | | | | — | | | | — | | | | — | |
TOTAL LONG-TERM DEBT(b) | | | | | | | | | | | | | 230 | | | | 230 | | | | 230 | |
Less Amount Due Within One Year | | | | | | | | | | | | | — | | | | — | | | | 30 | |
Long-Term Debt Excluding Amount Due Within One Year | | | | | | | | $ | 230 | | | $ | 230 | | | | $200 | |
| | | | | | | | | | | | | | | | | | | | | | | | | |
Fair Value of Long-Term Debt(a) | | | | | | | | $ | 218 | | | $ | 199 | | | $ | 232 | |
| | | | | | | | |
* M = Mortgage; G = Governmental | | | | | | | | | | | | | | | | | | | | | | |
| | | | | | |
Weighted-average annualized coupon rate | | | | | | | | | 5.3 | % | | | 5.3 | % | | | 5.7 | % |
(a) | The fair value excludes lease obligations, long-term DOE obligations, and other long-term debt and includes debt due within one year. It is determined using bid prices reported by dealer markets and by nationally recognized investment banking firms. |
(b) | The 2005 long-term debt is classified as Liabilities Subject to Compromise on the Balance Sheet. |
Totals may not foot due to rounding.
| | | | | | | | | | | | | | | | | | | | | | |
PREFERRED STOCK: CUSIP | | Rate | | Shares Authorized and Outstanding as of December 31, | | As of December 31, | | Call Price Per
Share as of
December 31, |
| | | 2006 | | 2005 | | 2004 | | 2006 | | 2005 | | 2004 | | 2006 |
| | | | | | | | | | | | | (in millions) | | |
| | | Without sinking fund: | | | | | | | | | | | | | | | | | | | | |
| | | Cumulative, $100 par value: | | | | | | | | | | | | | | | | | | | | |
29364P301 | | 4.75% Series | | 4.75% | | 77,798 | | 77,798 | | 77,798 | | $ | 8 | | $ | 8 | | $ | 8 | | $ | 105.00 |
29364P202 | | 4.36% Series | | 4.36% | | 60,000 | | 60,000 | | 60,000 | | | 6 | | | 6 | | | 6 | | | 104.58 |
29364P400 | | 5.56% Series | | 5.56% | | 60,000 | | 60,000 | | 60,000 | | | 6 | | | 6 | | | 6 | | | 102.59 |
| | | Total without sinking fund | | | | 197,798 | | 197,798 | | 197,798 | | $ | 20 | | $ | 20 | | $ | 20 | | | |
SYSTEM ENERGY RESOURCES, INC.
| | | | | | | | | | | | | | | | | | | | | | | | |
BONDS:
CUSIP | | | | Type* | | Rate | | Maturity
Date | | First
Call
Date | | Current or First Call Price | | As of December 31, | |
| | | | | | | | | 2006 | | | 2005 | | | 2004 | |
| | | | | | | | | | | | | | | | |
871911AQ6 | | 4.875% Series | | M | | 4.875% | | 10/07 | | Now | | MW (T + .30%) | | $ | 70 | | | $ | 70 | | | $ | 70 | |
| | | 5.875% Series – | | | | | | | | | | | | | | | | | | | | | | |
179423AC2 | | Mississippi Business Finance Corp. | | G(b) | | 5.875% | | 2022 | | Now | | 101% | | | 216 | | | | 216 | | | | 216 | |
| | | 5.9% Series – | | | | | | | | | | | | | | | | | | | | | | |
605277AC6 | | Mississippi Business Finance Corp. | | G(b) | | 5.9% | | 2022 | | Now | | 102% | | | 103 | | | | 103 | | | | 103 | |
179423AJ7 | | 7.3% Series – Claiborne County | | G(b) | | 7.3% | | 2025 | | — | | — | | | — | | | | — | | | | — | |
179423AK4 | | 6.2% Series – Claiborne County | | G(b) | | 6.2% | | 2026 | | Now | | 100% | | | 90 | | | | 90 | | | | 90 | |
| | | Total bonds | | | | | | | | | | | | | 479 | | | | 479 | | | | 479 | |
OTHER LONG-TERM DEBT: | |
| | | Grand Gulf Lease Obligation 5.62% | | 5.62% | | | | | | | | | 345 | | | | 365 | | | | 397 | |
| | | Unamortized Premium and Discount – Net | | | | | | | | | | | (1 | ) | | | (1 | ) | | | (1 | ) |
TOTAL LONG-TERM DEBT | | | 823 | | | | 843 | | | | 875 | |
Less Amount Due Within One Year | | | 93 | | | | 23 | | | | 25 | |
Long-Term Debt Excluding Amount Due Within One Year | | $ | 730 | | | $ | 820 | | | $ | 850 | |
Fair Value of Long-Term Debt(a) | | $ | 480 | | | $ | 475 | | | $ | 470 | |
| | | |
* M = Mortgage; G = Governmental | | | | | | | | | | | | |
| | | |
Weighted-average annualized coupon rate | | | 5.6 | % | | | 5.6 | % | | | 5.8 | % |
(a) | The fair value excludes lease obligations, long-term DOE obligations, and other long-term debt and includes debt due within one year. It is determined using bid prices reported by dealer markets and by nationally recognized investment banking firms. |
(b) | Consists of pollution control revenue bonds and environmental revenue bonds. |
| Totals | may not foot due to rounding. |
34
UTILITY STATISTICAL INFORMATION
UTILITY TOTAL CAPABILITY
| | | | | | | | |
| As of December 31, 2006. | | Operated | | Owned & Leased (MW)(a) | | Operated
(MW) |
| | Plants | | Units | | |
Plants that use fuel type: | | | | | | | | |
Gas/Oil | | 27 | | 71 | | 14,658 | | 15,392 |
Coal | | 3 | | 5 | | 2,245 | | 3,869 |
Petroleum Coke | | 1 | | 2 | | – | | 200 |
Total Fossil | | 31 | | 78 | | 16,903 | | 19,461 |
Hydro | | 3 | | 7 | | 70 | | 150 |
Nuclear | | 4 | | 5 | | 5,114 | | 5,241 |
Total Capability | | 38 | | 90 | | 22,087 | | 24,852 |
All plants that have units with multiple fuel types are in the Gas & Oil plant count.
| (a) | Owned and Leased Capability is the dependable load carrying capability as demonstrated under actual operating conditions based on the primary fuel (assuming no curtailments) that each station was designed to utilize. |
UTILITY SELECTED OPERATING DATA
| | | | | | | | | | | | | |
| | | 2006 | | | 2005 | | | 2004 | | 2003 | | | 2002 |
SOURCES OF ENERGY (GWh)(a) | | | | | | | | | | | | | |
Net Generation: | | | | | | | | | | | | | |
Gas & Oil | | 18,703 | | | 21,388 | | | 22,619 | | 22,797 | | | 35,195 |
Coal | | 14,383 | | | 13,502 | | | 15,359 | | 14,057 | | | 13,743 |
Nuclear | | 41,687 | | | 38,432 | | | 41,710 | | 40,628 | | | 40,917 |
Hydro | | 74 | | | 97 | | | 151 | | 115 | | | 164 |
Total Net Generation | | 74,847 | | | 73,419 | | | 79,839 | | 77,597 | | | 90,019 |
Purchased Power: | | | | | | | | | | | | | |
Affiliated Companies | | 1,428 | | | 3,501 | | | 1,545 | | 1,027 | | | 11 |
Non-affiliated Companies | | 36,974 | | | 36,689 | | | 36,422 | | 36,660 | | | 27,307 |
Total Purchased Power | | 38,402 | | | 40,190 | | | 37,967 | | 37,687 | | | 27,318 |
Total Sources of Energy | | 113,249 | | | 113,609 | | | 117,806 | | 115,284 | | | 117,337 |
USES OF ENERGY (GWh)(a) | | | | | | | | | | | | | |
Electric Energy Sales: | | | | | | | | | | | | | |
Residential | | 31,665 | | | 31,569 | | | 32,897 | | 32,817 | | | 32,581 |
Commercial | | 25,079 | | | 24,401 | | | 26,468 | | 25,863 | | | 25,354 |
Industrial | | 38,339 | | | 37,615 | | | 40,293 | | 38,637 | | | 41,018 |
Governmental | | 1,580 | | | 1,568 | | | 2,568 | | 2,651 | | | 2,678 |
Total Retail | | 96,663 | | | 95,153 | | | 102,226 | | 99,968 | | | 101,631 |
Sales for Resale | | 10,803 | | | 11,460 | | | 8,623 | | 9,248 | | | 9,828 |
Unbilled Energy | | (167 | ) | | (823 | ) | | 1,140 | | 249 | | | 233 |
Total Electric Energy Sales | | 107,299 | | | 105,790 | | | 111,989 | | 109,465 | | | 111,692 |
Line Losses and Company Usage | | 5,950 | | | 7,819 | | | 5,817 | | 5,819 | | | 5,645 |
Total Uses of Energy | | 113,249 | | | 113,609 | | | 117,806 | | 115,284 | | | 117,337 |
Peak Demand (MW) | | 20,887 | | | 21,391 | | | 21,174 | | 20,162 | | | 20,419 |
Operational Summer Capacity at Peak (MW) | | 22,087 | | | 22,247 | | | 21,207 | | 21,144 | | | 22,373 |
Annual System Load Factor (%) | | 62 | | | 59 | | | 60 | | 62 | | | 62 |
Retail Electric Sales Growth Rate (%)(a) | | 1.6 | | | (1.1 | ) | | 2.3 | | (1.6 | ) | | 1.7 |
Retail Electric Sales Weather-Adjusted Growth Rate (%)(a) | | 1.9 | | | (2.7 | ) | | 2.8 | | (1.4 | ) | | 1.2 |
Regional Gross Domestic Product Rate (%) | | 2.6 | | | (0.3 | ) | | 2.5 | | 2.2 | | | 2.1 |
National Gross Domestic Product Rate (%) | | 3.3 | | | 3.6 | | | 4.4 | | 3.0 | | | 1.9 |
Average Fuel Cost (cents/KWh)(a) | | | | | | | | | | | | | |
Natural Gas | | 7.75 | | | 9.91 | | | 7.31 | | 6.53 | | | 3.88 |
Nuclear Fuel | | 0.51 | | | 0.49 | | | 0.49 | | 0.48 | | | 0.47 |
Coal | | 1.76 | | | 1.57 | | | 1.39 | | 1.26 | | | 1.37 |
Fuel Oil | | 13.34 | | | 7.05 | | | 5.02 | | 5.04 | | | 15.78 |
Purchased Power | | 5.48 | | | 6.37 | | | 4.51 | | 4.24 | | | 2.80 |
(a) | 2006 and 2005 reflect deconsolidation of Entergy New Orleans, Inc. |
35
UTILITY STATISTICAL INFORMATION
2006 CONSOLIDATING UTILITY ELECTRIC STATISTICAL INFORMATION
| | | | | | | | | | | | | | | | | | | | | | | | | | |
| | | EAI | | EGSI | | | ELL | | | EMI | | | ENOI | | | SERI | | | ELIMINATIONS | | | TOTAL(a) | | | % | |
ELECTRIC OPERATING REVENUES ($ thousands) | |
Residential | | 705,998 | | 1,121,721 | | | 797,197 | | | 568,435 | | | 105,924 | | | — | | | (105,924 | ) | | 3,193,351 | | | 35 | % |
Commercial | | 417,914 | | 882,735 | | | 532,999 | | | 484,297 | | | 165,066 | | | — | | | (165,066 | ) | | 2,317,945 | | | 26 | % |
Industrial | | 435,931 | | 1,149,935 | | | 809,237 | | | 235,281 | | | 44,582 | | | — | | | (44,582 | ) | | 2,630,384 | | | 29 | % |
Governmental | | 19,390 | | 49,129 | | | 40,454 | | | 45,433 | | | 59,399 | | | — | | | (59,399 | ) | | 154,406 | | | 2 | % |
Total Retail | | 1,579,233 | | 3,203,520 | | | 2,179,887 | | | 1,333,446 | | | 374,971 | | | — | | | (374,971 | ) | | 8,296,086 | | | 92 | % |
Sales for Resale | | 472,509 | | 343,613 | | | 227,391 | | | 80,445 | | | 91,283 | | | 555,450 | | | (1,158,382 | ) | | 612,309 | | | 7 | % |
Other | | 40,941 | | 48,210 | | | 43,980 | | | 36,117 | | | 4,812 | | | 9 | | | (19,329 | ) | | 154,740 | | | 2 | % |
Total | | 2,092,683 | | 3,595,343 | | | 2,451,258 | | | 1,450,008 | | | 471,066 | | | 555,459 | | | (1,552,682 | ) | | 9,063,135 | | | 100 | % |
FUEL REVENUES (included in above revenues) | |
Residential | | 183,931 | | 636,394 | | | 374,595 | | | 316,861 | | | 51,865 | | | — | | | (51,865 | ) | | 1,511,781 | | | 33 | % |
Commercial | | 139,330 | | 546,690 | | | 249,803 | | | 280,819 | | | 92,894 | | | — | | | (92,894 | ) | | 1,216,642 | | | 27 | % |
Industrial | | 179,291 | | 858,836 | | | 545,040 | | | 157,157 | | | 28,952 | | | — | | | (28,952 | ) | | 1,740,324 | | | 38 | % |
Governmental | | 6,521 | | 28,261 | | | 19,313 | | | 24,908 | | | 34,839 | | | — | | | (34,839 | ) | | 79,003 | | | 2 | % |
Total Retail | | 509,073 | | 2,070,181 | | | 1,188,751 | | | 779,745 | | | 208,550 | | | — | | | (208,550 | ) | | 4,547,750 | | | 100 | % |
SOURCES OF ENERGY (GWh) | |
Net Generation: | | | | | | | | | | | | | | | | | | | | | | | | | | |
Gas & Oil | | 54 | | 7,036 | | | 7,486 | | | 4,127 | | | 773 | | | — | | | (773 | ) | | 18,703 | | | 17 | % |
Coal | | 7,226 | | 4,460 | | | — | | | 2,697 | | | — | | | — | | | — | | | 14,383 | | | 13 | % |
Nuclear | | 15,233 | | 7,461 | | | 9,270 | | | — | | | — | | | 9,723 | | | — | | | 41,687 | | | 37 | % |
Hydro | | 74 | | — | | | — | | | — | | | — | | | — | | | — | | | 74 | | | 0 | % |
Total Net Generation | | 22,587 | | 18,957 | | | 16,756 | | | 6,824 | | | 773 | | | 9,723 | | | (773 | ) | | 74,847 | | | 66 | % |
Purchased Power: | | | | | | | | | | | | | | | | | | | | | | | | | | |
Affiliated Companies | | 3,898 | | 4,664 | | | 6,612 | | | 5,327 | | | 4,445 | | | — | | | (23,518 | ) | | 1,428 | | | 1 | % |
Non-affiliated Companies | | 7,107 | | 18,690 | | | 7,945 | | | 3,232 | | | 41 | | | — | | | (41 | ) | | 36,974 | | | 33 | % |
Total Purchased Power | | 11,005 | | 23,354 | | | 14,557 | | | 8,559 | | | 4,486 | | | — | | | (23,559 | ) | | 38,402 | | | 34 | % |
Total Sources of Energy | | 33,592 | | 42,311 | | | 31,313 | | | 15,383 | | | 5,259 | | | 9,723 | | | (24,332 | ) | | 113,249 | | | 100 | % |
USES OF ENERGY (GWh) | |
Electric Energy Sales: | | | | | | | | | | | | | | | | | | | | | | | | | | |
Residential | | 7,655 | | 10,110 | | | 8,513 | | | 5,387 | | | 914 | | | — | | | (914 | ) | | 31,665 | | | 30 | % |
Commercial | | 5,816 | | 8,838 | | | 5,680 | | | 4,746 | | | 1,666 | | | — | | | (1,666 | ) | | 25,079 | | | 23 | % |
Industrial | | 7,587 | | 15,065 | | | 12,759 | | | 2,927 | | | 547 | | | — | | | (547 | ) | | 38,339 | | | 36 | % |
Governmental | | 273 | | 454 | | | 435 | | | 417 | | | 632 | | | — | | | (632 | ) | | 1,580 | | | 1 | % |
Total Retail | | 21,331 | | 34,467 | | | 27,387 | | | 13,477 | | | 3,759 | | | | | | (3,759 | ) | | 96,663 | | | 90 | % |
Sales for Resale | | 10,608 | | 6,155 | | | 2,470 | | | 900 | | | 1,298 | | | 9,727 | | | (20,355 | ) | | 10,803 | | | 10 | % |
Unbilled Energy | | 21 | | (148 | ) | | (25 | ) | | (15 | ) | | (1 | ) | | — | | | 1 | | | (167 | ) | | 0 | % |
Total Electric Energy Sales | | 31,960 | | 40,474 | | | 29,832 | | | 14,362 | | | 5,056 | | | 9,727 | | | (24,113 | ) | | 107,299 | | | 100 | % |
Line Losses and Company Usage | | 1,632 | | 1,837 | | | 1,481 | | | 1,021 | | | 203 | | | (4 | ) | | (219 | ) | | 5,950 | | | — | |
Total Uses of Energy | | 33,592 | | 42,311 | | | 31,313 | | | 15,383 | | | 5,259 | | | 9,723 | | | (24,332 | ) | | 113,249 | | | — | |
AVERAGE ELECTRIC REVENUE (cents/KWh) | |
Residential | | 9.22 | | 11.10 | | | 9.32 | | | 10.55 | | | 11.59 | | | — | | | — | | | 10.07 | | | — | |
Commercial | | 7.19 | | 9.99 | | | 9.33 | | | 10.21 | | | 9.91 | | | — | | | — | | | 9.23 | | | — | |
Industrial | | 5.75 | | 7.63 | | | 6.34 | | | 8.04 | | | 8.15 | | | — | | | — | | | 6.86 | | | — | |
Governmental | | 7.10 | | 10.82 | | | 9.18 | | | 10.90 | | | 9.40 | | | — | | | — | | | 9.74 | | | — | |
NUMBER OF RETAIL ELECTRIC CUSTOMERS(b)
(as of December 31, 2006) | |
Residential | | 572,865 | | 648,391 | | | 560,462 | | | 357,564 | | | 83,300 | | | — | | | (83,300 | ) | | 2,139,282 | | | 86 | % |
Commercial | | 84,768 | | 87,157 | | | 71,029 | | | 62,594 | | | 10,000 | | | — | | | (10,000 | ) | | 305,548 | | | 12 | % |
Industrial | | 21,026 | | 9,571 | | | 8,563 | | | 3,014 | | | 1,000 | | | — | | | (1,000 | ) | | 42,174 | | | 2 | % |
Governmental | | 662 | | 3,580 | | | 4,858 | | | 4,066 | | | 700 | | | — | | | (700 | ) | | 13,166 | | | 1 | % |
Total Retail Customers | | 679,321 | | 748,699 | | | 644,912 | | | 427,238 | | | 95,000 | | | — | | | (95,000 | ) | | 2,500,170 | | | 100 | % |
(a) | 2006reflects deconsolidation of Entergy New Orleans, Inc. |
(b) | Customercount data reflects estimates of customers in the hardest hit areas affected by Hurricane Katrina. Issues associated with temporary housing and resumption of service at permanent dwellings render precise counts difficult at this time. |
Totals may not foot due to rounding.
36
UTILITY STATISTICAL INFORMATION
ENTERGY ARKANSAS, INC.
| | | | | | | | | | | | |
| | | 2006 | | 2005 | | | 2004 | | 2003 | | | 2002 |
| ELECTRIC OPERATING REVENUES ($ thousands) | | | | | | | | | | | | |
Residential | | 705,998 | | 620,327 | | | 539,293 | | 525,558 | | | 556,314 |
Commercial | | 417,914 | | 347,641 | | | 304,809 | | 291,442 | | | 304,498 |
Industrial | | 435,931 | | 361,879 | | | 318,440 | | 305,333 | | | 329,847 |
Governmental | | 19,390 | | 17,722 | | | 15,796 | | 14,792 | | | 15,358 |
Total Retail | | 1,579,233 | | 1,347,569 | | | 1,178,338 | | 1,137,125 | | | 1,206,017 |
Sales for Resale | | 472,509 | | 403,090 | | | 436,049 | | 421,893 | | | 328,194 |
Other | | 40,941 | | 38,397 | | | 38,758 | | 30,652 | | | 26,899 |
Total Electric Operating Revenues | | 2,092,683 | | 1,789,056 | | | 1,653,145 | | 1,589,670 | | | 1,561,110 |
| FUEL REVENUES (included in above revenues) | | | | | | | | | | | | |
Residential | | 183,931 | | 107,585 | | | 70,315 | | 63,152 | | | 93,116 |
Commercial | | 139,330 | | 81,478 | | | 54,558 | | 47,930 | | | 66,849 |
Industrial | | 179,291 | | 103,181 | | | 69,712 | | 63,204 | | | 87,780 |
Governmental | | 6,521 | | 4,034 | | | 2,741 | | 2,368 | | | 3,341 |
Total Retail Fuel Revenues | | 509,073 | | 296,278 | | | 197,326 | | 176,654 | | | 251,086 |
| SOURCES OF ENERGY (GWh) | | | | | | | | | | | | |
Net Generation: | | | | | | | | | | | | |
Gas & Oil | | 54 | | 266 | | | 158 | | 493 | | | 1,540 |
Coal | | 7,226 | | 6,899 | | | 8,070 | | 7,519 | | | 6,998 |
Nuclear | | 15,233 | | 13,681 | | | 15,442 | | 14,689 | | | 14,559 |
Hydro | | 74 | | 97 | | | 151 | | 115 | | | 164 |
Total Net Generation | | 22,587 | | 20,943 | | | 23,821 | | 22,816 | | | 23,261 |
Purchased Power: | | | | | | | | | | | | |
Affiliated Companies | | 3,898 | | 4,731 | | | 3,471 | | 3,630 | | | 3,439 |
Non-affiliated Companies | | 7,107 | | 5,858 | | | 6,562 | | 7,293 | | | 6,917 |
Total Purchased Power | | 11,005 | | 10,589 | | | 10,033 | | 10,923 | | | 10,356 |
Total Sources of Energy | | 33,592 | | 31,532 | | | 33,854 | | 33,739 | | | 33,617 |
| USES OF ENERGY (GWh) | | | | | | | | | | | | |
Electric Energy Sales: | | | | | | | | | | | | |
Residential | | 7,655 | | 7,653 | | | 7,028 | | 7,057 | | | 7,050 |
Commercial | | 5,816 | | 5,730 | | | 5,428 | | 5,328 | | | 5,221 |
Industrial | | 7,587 | | 7,334 | | | 7,004 | | 6,999 | | | 7,074 |
Governmental | | 273 | | 288 | | | 275 | | 266 | | | 255 |
Total Retail | | 21,331 | | 21,005 | | | 19,735 | | 19,650 | | | 19,600 |
Sales for Resale | | 10,608 | | 8,658 | | | 12,348 | | 12,435 | | | 11,880 |
Unbilled Energy | | 21 | | (83 | ) | | 121 | | (57 | ) | | 111 |
Total Electric Energy Sales | | 31,960 | | 29,580 | | | 32,204 | | 32,028 | | | 31,591 |
Line Losses and Company Usage | | 1,632 | | 1,952 | | | 1,650 | | 1,711 | | | 2,026 |
Total Uses of Energy | | 33,592 | | 31,532 | | | 33,854 | | 33,739 | | | 33,617 |
| AVERAGE ELECTRIC REVENUE (cents/KWh) | | | | | | | | | | | | |
Residential | | 9.22 | | 8.11 | | | 7.67 | | 7.45 | | | 7.89 |
Commercial | | 7.19 | | 6.07 | | | 5.62 | | 5.47 | | | 5.83 |
Industrial | | 5.75 | | 4.93 | | | 4.55 | | 4.36 | | | 4.66 |
Governmental | | 7.10 | | 6.16 | | | 5.75 | | 5.56 | | | 6.02 |
| NUMBER OF RETAIL ELECTRIC CUSTOMERS | | | | | | | | | | | | |
| (as of December 31) | | | | | | | | | | | | |
Residential | | 572,865 | | 571,168 | | | 562,899 | | 557,025 | | | 548,693 |
Commercial | | 84,768 | | 82,508 | | | 82,778 | | 81,082 | | | 79,430 |
Industrial | | 21,026 | | 20,364 | | | 21,212 | | 21,336 | | | 20,045 |
Governmental | | 662 | | 643 | | | 601 | | 564 | | | 526 |
Total Retail Customers | | 679,321 | | 674,683 | | | 667,490 | | 660,007 | | | 648,694 |
37
UTILITY STATISTICAL INFORMATION
ENTERGY ARKANSAS, INC.
GENERATI ON PORTFOLIO
| | | | | | | | | | | | | | | | | | | | | |
| | | Total Plant - 2006 |
| Plant | | Unit | | Ownership | | | Commercial
Operation | | Owned &
Leased
Capability
(MW)(a) | | Fuel Type | | Purpose | | Net
Generation
(MWH) | | | Expenses
Per Net
MWH | | | Total
Production
Expense ($ 000) |
Cecil Lynch | | 2 | | 100 | % | | 1949 | | 68 | | Gas/Oil | | Reserve | | 7,510 | | | 328.76 | | | 2,469 |
| | | 3 | | 100 | % | | 1954 | | 110 | | Gas/Oil | | Reserve | | | | | | | | |
Harvey Couch | | 1 | | 100 | % | | 1943 | | 23 | | Gas/Oil | | Reserve | | 28,891 | | | 235.33 | | | 6,799 |
| | | 2 | | 100 | % | | 1954 | | 125 | | Gas/Oil | | Intermediate | | | | | | | | |
Lake Catherine | | 1 | | 100 | % | | 1950 | | — | | Gas/Oil | | Reserve | | 16,894 | | | 607.67 | | | 10,266 |
| | | 2 | | 100 | % | | 1950 | | — | | Gas/Oil | | Reserve | | | | | | | | |
| | | 3 | | 100 | % | | 1953 | | — | | Gas/Oil | | Reserve | | | | | | | | |
| | | 4 | | 100 | % | | 1970 | | 547 | | Gas/Oil | | Peaking | | | | | | | | |
Hamilton Moses | | 1 | | 100 | % | | 1951 | | 70 | | Gas/Oil | | Reserve | | (313 | ) | | (1,543.13 | ) | | 483 |
| | | 2 | | 100 | % | | 1951 | | 70 | | Gas/Oil | | Reserve | | | | | | | | |
Mabelvale | | 1 | | 100 | % | | 1970 | | 14 | | Gas/Oil | | Peaking | | 2,869 | | | 345.07 | | | 990 |
| | | 2 | | 100 | % | | 1970 | | 14 | | Gas/Oil | | Peaking | | | | | | | | |
| | | 3 | | 100 | % | | 1970 | | 14 | | Gas/Oil | | Peaking | | | | | | | | |
| | | 4 | | 100 | % | | 1970 | | 14 | | Gas/Oil | | Peaking | | | | | | | | |
Robert Ritchie | | 1 | | 100 | % | | 1961 | | 300 | | Gas/Oil | | Reserve | | (1,723 | ) | | (576.32 | ) | | 993 |
| | | 3 | | 100 | % | | 1970 | | 16 | | Gas/Oil | | Peaking | | (11 | ) | | (10,454.55 | ) | | 115 |
Independence | | 1 | | 31.5 | % | | 1983 | | 263 | | Coal | | Base | | 1,712,316 | | | 21.62 | | | 37,023 |
White Bluff | | 1 | | 57 | % | | 1980 | | 465 | | Coal | | Base | | 5,513,798 | | | 21.28 | | | 117,355 |
| | | 2 | | 57 | % | | 1981 | | 470 | | Coal | | Base | | | | | | | | |
Cecil Lynch | | Diesel | | 100 | % | | 1967 | | 5 | | Oil | | Peaking | | — | | | — | | | 31 |
Carpenter | | 1 | | 100 | % | | 1932 | | 29 | | Hydro | | Peaking | | 51,665 | | | 21.21 | | | 1,096 |
| | | 2 | | 100 | % | | 1933 | | 30 | | Hydro | | Peaking | | | | | | | | |
Remmel | | 1 | | 100 | % | | 1923 | | 4 | | Hydro | | Peaking | | 22,482 | | | 23.97 | | | 539 |
| | | 2 | | 100 | % | | 1923 | | 3 | | Hydro | | Peaking | | | | | | | | |
| | | 3 | | 100 | % | | 1923 | | 4 | | Hydro | | Peaking | | | | | | | | |
Arkansas Nuclear One | | 1 | | 100 | % | | 1974 | | 841 | | Nuclear PWR(b) | | Base | | 15,232,577 | | | 15.73 | | | 239,606 |
| | | 2 | | 100 | % | | 1980 | | 998 | | Nuclear PWR(b) | | Base | | | | | | | | |
Total | | | | | | | | | 4,497 | | | | | | 22,586,955 | | | 18.50 | | | 417,765 |
(a) | Ownedand Leased Capability is the dependable load carrying capability as demonstrated under actual operating conditions based on the primary fuel (assuming no curtailments) that each station was designed to utilize. |
(b) | PWR= Pressurized Water Reactor. |
38
UTILITY STATISTICAL INFORMATION
ENTERGY GULF STATES, INC.
| | | | | | | | | | | | | |
| | | 2006 | | | 2005 | | | 2004 | | 2003 | | 2002 | |
ELECTRIC OPERATING REVENUES ($ thousands) | | | | | | | | | | | | | |
Louisiana | | | | | | | | | | | | | |
Residential | | 522,227 | | | 457,498 | | | 412,135 | | 394,512 | | 339,325 | |
Commercial | | 476,537 | | | 406,921 | | | 369,044 | | 345,579 | | 286,408 | |
Industrial | | 686,295 | | | 625,709 | | | 570,130 | | 510,501 | | 424,026 | |
Governmental | | 22,520 | | | 19,562 | | | 17,468 | | 18,253 | | 17,433 | |
Total Retail | | 1,707,579 | | | 1,509,690 | | | 1,368,777 | | 1,268,845 | | 1,067,192 | |
Texas | | | | | | | | | | | | | |
Residential | | 599,494 | | | 502,135 | | | 468,704 | | 434,979 | | 360,575 | |
Commercial | | 406,198 | | | 327,287 | | | 302,699 | | 268,110 | | 215,707 | |
Industrial | | 463,640 | | | 388,285 | | | 405,650 | | 342,693 | | 270,722 | |
Governmental | | 26,609 | | | 21,693 | | | 20,535 | | 20,658 | | 16,525 | |
Total Retail | | 1,495,941 | | | 1,239,400 | | | 1,197,588 | | 1,066,440 | | 863,529 | |
FUEL REVENUES (included in above revenues) | | | | | | | | | | | | | |
Louisiana | | | | | | | | | | | | | |
Residential | | 284,937 | | | 266,854 | | | 203,436 | | 196,097 | | 125,962 | |
Commercial | | 280,628 | | | 252,200 | | | 198,629 | | 186,700 | | 117,513 | |
Industrial | | 508,048 | | | 477,232 | | | 401,413 | | 354,504 | | 248,165 | |
Governmental | | 11,459 | | | 10,645 | | | 7,903 | | 8,398 | | 5,976 | |
Total Retail Fuel Revenues | | 1,085,072 | | | 1,006,931 | | | 811,381 | | 745,699 | | 497,616 | |
Texas | | | | | | | | | | | | | |
Residential | | 351,457 | | | 268,957 | | | 240,147 | | 207,358 | | 139,764 | |
Commercial | | 266,062 | | | 199,093 | | | 177,984 | | 146,502 | | 98,312 | |
Industrial | | 350,788 | | | 284,032 | | | 293,254 | | 236,123 | | 163,419 | |
Governmental | | 16,802 | | | 12,465 | | | 11,330 | | 10,612 | | 6,981 | |
Total Retail Fuel Revenues | | 985,109 | | | 764,547 | | | 722,715 | | 600,595 | | 408,476 | |
SOURCES OF ENERGY (GWh) | | | | | | | | | | | | | |
Net Generation: | | | | | | | | | | | | | |
Gas & Oil | | 7,036 | | | 9,320 | | | 8,496 | | 9,432 | | 14,645 | |
Coal | | 4,460 | | | 4,077 | | | 4,609 | | 3,959 | | 4,168 | |
Nuclear | | 7,461 | | | 7,808 | | | 7,413 | | 7,641 | | 8,467 | |
Hydro | | — | | | — | | | — | | — | | — | |
Total Net Generation | | 18,957 | | | 21,205 | | | 20,518 | | 21,032 | | 27,280 | |
Purchased Power: | | | | | | | | | | | | | |
Affiliated Companies | | 4,664 | | | 3,521 | | | 5,478 | | 3,989 | | 2,703 | |
Non-affiliated Companies | | 18,690 | | | 17,500 | | | 16,072 | | 15,160 | | 10,376 | |
Total Purchased Power | | 23,354 | | | 21,021 | | | 21,550 | | 19,149 | | 13,079 | |
Total Sources of Energy | | 42,311 | | | 42,226 | | | 42,068 | | 40,181 | | 40,359 | |
USES OF ENERGY (GWh) | | | | | | | | | | | | | |
Electric Energy Sales: | | | | | | | | | | | | | |
Louisiana | | | | | | | | | | | | | |
Residential | | 4,899 | | | 4,817 | | | 4,677 | | 4,619 | | 4,520 | |
Commercial | | 4,836 | | | 4,608 | | | 4,628 | | 4,471 | | 4,316 | |
Industrial | | 9,150 | | | 9,317 | | | 9,757 | | 9,145 | | 9,714 | |
Governmental | | 199 | | | 197 | | | 187 | | 205 | | 222 | |
Texas | | | | | | | | | | | | | |
Residential | | 5,211 | | | 5,207 | | | 5,126 | | 5,120 | | 4,982 | |
Commercial | | 4,002 | | | 3,878 | | | 3,816 | | 3,703 | | 3,578 | |
Industrial | | 5,915 | | | 5,650 | | | 6,839 | | 6,272 | | 6,173 | |
Governmental | | 255 | | | 244 | | | 245 | | 270 | | 255 | |
Total Retail | | 34,467 | | | 33,918 | | | 35,275 | | 33,805 | | 33,760 | |
Sales for Resale | | 6,155 | | | 6,017 | | | 4,700 | | 4,543 | | 5,099 | |
Unbilled Energy | | (148 | ) | | (286 | ) | | 420 | | 197 | | (18 | ) |
Total Electric Energy Sales | | 40,474 | | | 39,649 | | | 40,395 | | 38,545 | | 38,841 | |
Line Losses and Company Usage | | 1,837 | | | 2,577 | | | 1,673 | | 1,636 | | 1,518 | |
Total Uses of Energy | | 42,311 | | | 42,226 | | | 42,068 | | 40,181 | | 40,359 | |
39
UTILITY STATISTICAL INFORMATION
ENTERGY GULF STATES, INC. (CONTINUED)
| | | | | | | | | | |
| | | 2006 | | 2005 | | 2004 | | 2003 | | 2002 |
| NUMBER OF RETAIL ELECTRIC CUSTOMERS | | | | | | | | | | |
(as of December 31) | | | | | | | | | | |
Louisiana | | | | | | | | | | |
Residential | | 311,739 | | 305,714 | | 301,014 | | 295,084 | | 292,018 |
Commercial | | 46,351 | | 45,421 | | 45,004 | | 42,490 | | 42,423 |
Industrial | | 4,558 | | 4,268 | | 3,957 | | 3,625 | | 3,687 |
Governmental | | 1,528 | | 1,457 | | 1,431 | | 1,251 | | 1,519 |
Total Retail Customers | | 364,176 | | 356,860 | | 351,406 | | 342,450 | | 339,647 |
Texas | | | | | | | | | | |
Residential | | 336,652 | | 335,089 | | 326,556 | | 321,681 | | 316,942 |
Commercial | | 40,806 | | 40,887 | | 39,680 | | 38,445 | | 37,742 |
Industrial | | 5,013 | | 4,911 | | 4,732 | | 4,722 | | 4,403 |
Governmental | | 2,052 | | 2,017 | | 1,923 | | 2,100 | | 2,176 |
Total Retail Customers | | 384,523 | | 382,904 | | 372,891 | | 366,948 | | 361,263 |
| AVERAGE ELECTRIC REVENUE (cents/KWh) | | | | | | | | | | |
Louisiana | | | | | | | | | | |
Residential | | 10.66 | | 9.50 | | 8.81 | | 8.54 | | 7.51 |
Commercial | | 9.85 | | 8.83 | | 7.97 | | 7.73 | | 6.64 |
Industrial | | 7.50 | | 6.72 | | 5.84 | | 5.58 | | 4.37 |
Governmental | | 11.34 | | 9.94 | | 9.35 | | 8.93 | | 7.85 |
Texas | | | | | | | | | | |
Residential | | 11.50 | | 9.64 | | 9.14 | | 8.49 | | 7.24 |
Commercial | | 10.15 | | 8.44 | | 7.93 | | 7.24 | | 6.03 |
Industrial | | 7.84 | | 6.87 | | 5.93 | | 5.46 | | 4.39 |
Governmental | | 10.41 | | 8.88 | | 8.37 | | 7.65 | | 6.48 |
Totals may not foot due to rounding.
ENTERGY GULF STATES, INC.
GENERATION PORTFOLIO
| | | | | | | | | | | | | | | | | | | |
| | | | | | | | | | | | | | | | Total Plant - 2006
|
Plant | | Unit | | Ownership | | | Commercial
Operation | | Owned &
Leased
Capability
(MW)(a) | | Fuel Type | | Purpose | | Net
Generation
(MWH) | | Expenses
Per Net
MWH | | Total
Production
Expense
($000) |
LA Station 2 | | 7 | | 100 | % | | 1950 | | 40 | | Gas/Oil | | Reserve | | — | | — | | 578 |
| | | 8 | | 100 | % | | 1950 | | 40 | | Gas/Oil | | Reserve | | | | | | |
| | | 9 | | 100 | % | | 1953 | | 58 | | Gas/Oil | | Reserve | | | | | | |
Willow Glen | | 1 | | 100 | % | | 1960 | | 152 | | Gas/Oil | | Peaking | | 58,129 | | 416.09 | | 24,187 |
| | | 2 | | 100 | % | | 1964 | | 205 | | Gas/Oil | | Peaking | | | | | | |
| | | 3 | | 100 | % | | 1968 | | 450 | | Gas/Oil | | Reserve | | | | | | |
| | | 4 | | 100 | % | | 1973 | | 540 | | Gas/Oil | | Peaking | | | | | | |
| | | 5 | | 100 | % | | 1976 | | 485 | | Gas/Oil | | Peaking | | | | | | |
Lewis Creek | | 1 | | 100 | % | | 1970 | | 229 | | Gas/Oil | | Intermediate | | 1,725,076 | | 81.10 | | 139,909 |
| | | 2 | | 100 | % | | 1971 | | 230 | | Gas/Oil | | Intermediate | | | | | | |
Roy S. Nelson | | 3 | | 100 | % | | 1960 | | 153 | | Gas/Oil | | Intermediate | | 799,739 | | 103.97 | | 83,148 |
| | | 4 | | 100 | % | | 1970 | | 500 | | Gas/Oil | | Intermediate | | | | | | |
Sabine | | 1 | | 100 | % | | 1962 | | 212 | | Gas/Oil | | Intermediate | | 4,452,822 | | 79.40 | | 353,546 |
| | | 2 | | 100 | % | | 1962 | | 212 | | Gas/Oil | | Intermediate | | | | | | |
| | | 3 | | 100 | % | | 1966 | | 390 | | Gas/Oil | | Intermediate | | | | | | |
| | | 4 | | 100 | % | | 1974 | | 530 | | Gas/Oil | | Intermediate | | | | | | |
| | | 5 | | 100 | % | | 1979 | | 470 | | Gas/Oil | | Intermediate | | | | | | |
Roy S. Nelson | | 6 | | 70 | % | | 1982 | | 385 | | Coal | | Base | | 2,610,446 | | 23.15 | | 60,421 |
Big Cajun 2 | | 3 | | 42 | % | | 1983 | | 242 | | Coal | | Base | | 1,849,507 | | 22.31 | | 41,266 |
River Bend | | 1 | | 100 | %(c) | | 1986 | | 978 | | Nuclear BWR(b) | | Base | | 7,461,540 | | 20.01 | | 149,331 |
Total | | | | | | | | | 6,501 | | | | | | 18,957,259 | | 44.96 | | 852,386 |
(a) | Ownedand Leased Capability is the dependable load carrying capability as demonstrated under actual operating conditions based on the primary fuel (assuming no curtailments) that each station was designed to utilize. |
(b) | BWR= Boiling Water Reactor. |
(c) | 30%of River Bend is not subject to rate regulation by the Public Utility Commission of Texas, the Louisiana Public Service Commission, nor various municipal authorities. |
40
UTILITY STATISTICAL INFORMATION
ENTERGY LOUISIANA, LLC
| | | | | | | | | | | | |
| | | 2006 | | | 2005 | | | 2004 | | 2003 | | 2002 |
| ELECTRIC OPERATING REVENUES ($ thousands) | | | | | | | | | | | | |
Residential | | 797,197 | | | 827,926 | | | 769,770 | | 739,389 | | 637,901 |
Commercial | | 532,999 | | | 538,683 | | | 501,536 | | 473,351 | | 403,051 |
Industrial | | 809,237 | | | 834,320 | | | 779,103 | | 723,102 | | 636,410 |
Governmental | | 40,454 | | | 40,813 | | | 37,894 | | 40,664 | | 35,914 |
Total Retail | | 2,179,887 | | | 2,241,742 | | | 2,088,303 | | 1,976,506 | | 1,713,276 |
Sales for Resale | | 227,391 | | | 352,544 | | | 109,085 | | 114,311 | | 19,641 |
Other | | 43,980 | | | 55,895 | | | 29,598 | | 74,753 | | 82,435 |
Total Electric Operating Revenues | | 2,451,258 | | | 2,650,181 | | | 2,226,986 | | 2,165,570 | | 1,815,352 |
| FUEL REVENUES (included in above revenues) | | | | | | | | | | | | |
Residential | | 374,595 | | | 430,830 | | | 355,871 | | 327,475 | | 226,887 |
Commercial | | 249,803 | | | 277,180 | | | 230,357 | | 209,032 | | 142,141 |
Industrial | | 545,040 | | | 588,943 | | | 512,924 | | 464,015 | | 359,607 |
Governmental | | 19,313 | | | 21,022 | | | 17,523 | | 18,195 | | 12,878 |
Total Retail Fuel Revenues | | 1,188,751 | | | 1,317,975 | | | 1,116,675 | | 1,018,717 | | 741,513 |
| SOURCES OF ENERGY (GWh) | | | | | | | | | | | | |
Net Generation: | | | | | | | | | | | | |
Gas & Oil | | 7,486 | | | 8,968 | | | 8,486 | | 7,882 | | 11,039 |
Coal | | — | | | — | | | — | | — | | — |
Nuclear | | 9,270 | | | 7,885 | | | 9,654 | | 8,485 | | 8,838 |
Hydro | | — | | | — | | | — | | — | | — |
Total Net Generation | | 16,756 | | | 16,853 | | | 18,140 | | 16,367 | | 19,877 |
Purchased Power: | | | | | | | | | | | | |
Affiliated Companies | | 6,612 | | | 6,027 | | | 4,505 | | 4,484 | | 5,080 |
Non-affiliated Companies | | 7,945 | | | 8,212 | | | 8,416 | | 9,718 | | 6,496 |
Total Purchased Power | | 14,557 | | | 14,239 | | | 12,921 | | 14,202 | | 11,576 |
Total Sources of Energy | | 31,313 | | | 31,092 | | | 31,061 | | 30,569 | | 31,453 |
| USES OF ENERGY (GWh) | | | | | | | | | | | | |
Electric Energy Sales: | | | | | | | | | | | | |
Residential | | 8,513 | | | 8,559 | | | 8,842 | | 8,795 | | 8,780 |
Commercial | | 5,680 | | | 5,554 | | | 5,762 | | 5,622 | | 5,538 |
Industrial | | 12,759 | | | 12,348 | | | 13,140 | | 12,870 | | 14,738 |
Governmental | | 435 | | | 428 | | | 439 | | 491 | | 510 |
Total Retail | | 27,387 | | | 26,889 | | | 28,183 | | 27,778 | | 29,566 |
Sales for Resale | | 2,470 | | | 2,560 | | | 1,251 | | 1,476 | | 285 |
Unbilled Energy | | (25 | ) | | (379 | ) | | 415 | | 42 | | 237 |
Total Electric Energy Sales | | 29,832 | | | 29,070 | | | 29,849 | | 29,296 | | 30,088 |
Line Losses and Company Usage | | 1,481 | | | 2,022 | | | 1,212 | | 1,273 | | 1,365 |
Total Uses of Energy | | 31,313 | | | 31,092 | | | 31,061 | | 30,569 | | 31,453 |
| AVERAGE ELECTRIC REVENUE (cents/KWh) | | | | | | | | | | | | |
Residential | | 9.32 | | | 9.67 | | | 8.71 | | 8.41 | | 7.27 |
Commercial | | 9.33 | | | 9.70 | | | 8.70 | | 8.42 | | 7.28 |
Industrial | | 6.34 | | | 6.76 | | | 5.93 | | 5.62 | | 4.32 |
Governmental | | 9.18 | | | 9.53 | | | 8.63 | | 8.28 | | 7.04 |
| NUMBER OF RETAIL ELECTRIC CUSTOMERS | | | | | | | | | | | | |
| (as of December 31) | | | | | | | | | | | | |
Residential | | 560,462 | | | 539,912 | | | 575,701 | | 571,767 | | 565,824 |
Commercial | | 71,029 | | | 66,897 | | | 73,622 | | 72,901 | | 70,418 |
Industrial | | 8,563 | | | 7,005 | | | 7,858 | | 7,686 | | 7,136 |
Governmental | | 4,858 | | | 4,494 | | | 5,274 | | 4,859 | | 5,532 |
Total Retail Customers | | 644,912 | | | 618,308 | | | 662,455 | | 657,213 | | 648,910 |
41
UTILITY STATISTICAL INFORMATION
ENTERGY LOUISIANA, LLC
GENERATION PORTFOLIO
| | | | | | | | | | | | | | | | | | | | | |
| | | | | | | | | | | | | | | | Total Plant - 2006
|
Plant | | Unit | | Ownership | | | Commercial
Operation | | Owned &
Leased
Capability
(MW)(a) | | Fuel Type | | Purpose | | Net
Generation
(MWH) |
| | Expenses
Per Net
MWH |
| | Total
Production
Expense
($000) |
Buras | | 8 | | 100 | % | | 1971 | | 12 | | Gas/Oil | | Peaking | | 635 | | | 1,012.60 | | | 643 |
Little Gypsy | | 1 | | 100 | % | | 1961 | | 238 | | Gas/Oil | | Intermediate | | 976,165 | | | 114.49 | | | 111,766 |
| | | 2 | | 100 | % | | 1966 | | 415 | | Gas/Oil | | Intermediate | | | | | | | | |
| | | 3 | | 100 | % | | 1969 | | 545 | | Gas/Oil | | Intermediate | | | | | | | | |
Monroe | | 10 | | 100 | % | | 1961 | | — | | Gas/Oil | | Reserve | | (415 | ) | | (809.64 | ) | | 336 |
| | | 11 | | 100 | % | | 1965 | | — | | Gas/Oil | | Reserve | | | | | | | | |
| | | 12 | | 100 | % | | 1968 | | — | | Gas/Oil | | Reserve | | | | | | | | |
Ninemile Point | | 1 | | 100 | % | | 1951 | | 50 | | Gas/Oil | | Peaking | | 4,018,426 | | | 96.73 | | | 388,685 |
| | | 2 | | 100 | % | | 1953 | | 60 | | Gas/Oil | | Peaking | | | | | | | | |
| | | 3 | | 100 | % | | 1955 | | 125 | | Gas/Oil | | Intermediate | | | | | | | | |
| | | 4 | | 100 | % | | 1971 | | 730 | | Gas/Oil | | Intermediate | | | | | | | | |
| | | 5 | | 100 | % | | 1973 | | 740 | | Gas/Oil | | Intermediate | | | | | | | | |
Perryville | | 1 | | 100 | % | | 2002 | | 535 | | Gas | | Intermediate | | 2,082,457 | | | 58.66 | | | 122,167 |
| | | 2 | | 100 | % | | 2002 | | 156 | | Gas | | Peaking | | | | | | | | |
Sterlington | | 6 | | 100 | % | | 1958 | | 212 | | Gas/Oil | | Peaking | | 38,012 | | | 200.99 | | | 7,640 |
| | | 7 | | 100 | % | | 1974 | | 180 | | Gas/Oil | | Intermediate | | | | | | | | |
Waterford | | 1 | | 100 | % | | 1975 | | 400 | | Gas/Oil | | Intermediate | | 371,210 | | | 154.52 | | | 57,359 |
| | | 2 | | 100 | % | | 1975 | | 405 | | Gas/Oil | | Intermediate | | | | | | | | |
Waterford | | 3 | | 100 | % | | 1985 | | 1,158 | | Nuclear PWR(b) | | Base | | 9,269,914 | | | 16.13 | | | 149,517 |
Total | | | | | | | | | 5,961 | | | | | | 16,756,404 | | | 50.02 | | | 838,113 |
(a) | Owned and Leased Capability is the dependable load carrying capability as demonstrated underactual operating conditions based on the primary fuel (assuming no curtailments) that each station was designed to utilize. |
(b) | PWR = PressurizedWater Reactor. |
42
UTILITY STATISTICAL INFORMATION
ENTERGY MISSISSIPPI , INC.
| | | | | | | | | | | | | |
| | | 2006 | | | 2005 | | | 2004 | | 2003 | | 2002 | |
| ELECTRIC OPERATING REVENUES ($ thousands) | | | | | | | | | | | | | |
Residential | | 568,435 | | | 503,232 | | | 467,459 | | 410,231 | | 374,958 | |
Commercial | | 484,297 | | | 420,507 | | | 396,482 | | 341,862 | | 309,525 | |
Industrial | | 235,281 | | | 209,270 | | | 203,603 | | 173,736 | | 164,815 | |
Governmental | | 45,433 | | | 40,605 | | | 38,258 | | 32,393 | | 28,532 | |
Total Retail | | 1,333,446 | | | 1,173,614 | | | 1,105,802 | | 958,222 | | 877,830 | |
Sales for Resale | | 80,445 | | | 98,885 | | | 68,417 | | 42,143 | | 78,004 | |
Other | | 36,117 | | | 34,041 | | | 39,410 | | 34,995 | | 35,261 | |
Total Electric Operating Revenues | | 1,450,008 | | | 1,306,540 | | | 1,213,629 | | 1,035,360 | | 991,095 | |
| FUEL REVENUES (included in above revenues) | | | | | | | | | | | | | |
Residential | | 316,861 | | | 251,338 | | | 229,326 | | 157,624 | | 146,191 | |
Commercial | | 280,819 | | | 220,024 | | | 203,634 | | 139,087 | | 127,484 | |
Industrial | | 157,157 | | | 128,483 | | | 119,811 | | 88,063 | | 82,778 | |
Governmental | | 24,908 | | | 19,440 | | | 17,885 | | 11,885 | | 10,918 | |
Total Retail Fuel Revenues | | 779,745 | | | 619,285 | | | 570,656 | | 396,659 | | 367,371 | |
| SOURCES OF ENERGY (GWh) | | | | | | | | | | | | | |
Net Generation: | | | | | | | | | | | | | |
Gas & Oil | | 4,127 | | | 2,834 | | | 3,333 | | 2,891 | | 5,391 | |
Coal | | 2,697 | | | 2,526 | | | 2,679 | | 2,579 | | 2,577 | |
Nuclear | | — | | | — | | | — | | — | | — | |
Hydro | | — | | | — | | | — | | — | | — | |
Total Net Generation | | 6,824 | | | 5,360 | | | 6,012 | | 5,470 | | 7,968 | |
Purchased Power: | | | | | | | | | | | | | |
Affiliated Companies | | 5,327 | | | 4,924 | | | 5,337 | | 5,984 | | 4,069 | |
Non-affiliated Companies | | 3,232 | | | 5,119 | | | 3,390 | | 2,868 | | 2,476 | |
Total Purchased Power | | 8,559 | | | 10,043 | | | 8,727 | | 8,852 | | 6,545 | |
Total Sources of Energy | | 15,383 | | | 15,403 | | | 14,739 | | 14,322 | | 14,513 | |
| USES OF ENERGY (GWh) | | | | | | | | | | | | | |
Electric Energy Sales: | | | | | | | | | | | | | |
Residential | | 5,387 | | | 5,333 | | | 5,085 | | 5,092 | | 5,092 | |
Commercial | | 4,746 | | | 4,630 | | | 4,518 | | 4,476 | | 4,445 | |
Industrial | | 2,927 | | | 2,967 | | | 2,977 | | 2,939 | | 2,910 | |
Governmental | | 417 | | | 411 | | | 398 | | 384 | | 382 | |
Total Retail | | 13,477 | | | 13,341 | | | 12,978 | | 12,891 | | 12,829 | |
Sales for Resale | | 900 | | | 936 | | | 698 | | 443 | | 1,320 | |
Unbilled Energy | | (15 | ) | | (75 | ) | | 142 | | 45 | | (48 | ) |
Total Electric Energy Sales | | 14,362 | | | 14,202 | | | 13,818 | | 13,379 | | 14,101 | |
Line Losses and Company Usage | | 1,021 | | | 1,201 | | | 921 | | 943 | | 412 | |
Total Uses of Energy | | 15,383 | | | 15,403 | | | 14,739 | | 14,322 | | 14,513 | |
| AVERAGE ELECTRIC REVENUE (cents/KWh) | | | | | | | | | | | | | |
Residential | | 10.55 | | | 9.44 | | | 9.19 | | 8.06 | | 7.36 | |
Commercial | | 10.21 | | | 9.08 | | | 8.78 | | 7.64 | | 6.96 | |
Industrial | | 8.04 | | | 7.05 | | | 6.84 | | 5.91 | | 5.66 | |
Governmental | | 10.90 | | | 9.88 | | | 9.61 | | 8.44 | | 7.47 | |
| NUMBER OF RETAIL ELECTRIC CUSTOMERS | | | | | | | | | | | | | |
| (as of December 31) | | | | | | | | | | | | | |
Residential | | 357,564 | | | 359,538 | | | 351,274 | | 348,019 | | 344,637 | |
Commercial | | 62,594 | | | 60,826 | | | 60,338 | | 59,347 | | 57,146 | |
Industrial | | 3,014 | | | 2,739 | | | 3,915 | | 4,767 | | 3,036 | |
Governmental | | 4,066 | | | 3,856 | | | 4,036 | | 3,884 | | 3,842 | |
Total Retail Customers | | 427,238 | | | 426,959 | | | 419,563 | | 416,017 | | 408,661 | |
43
UTILITY STATISTICAL INFORMATION
ENTERGY MISSISSIPPI, INC.
GENERATION PORTFOLIO
| | | | | | | | | | | | | | | | | | | | | |
| | | | | | | | | | | | | | | | Total Plant - 2006
|
Plant | | Unit | | Ownership | | | Commercial
Operation | | Owned &
Leased
Capability
(MW)(a) | | Fuel Type | | Purpose | | Net
Generation
(MWH) |
| | Expenses
Per Net
MWH |
| | Total
Production
Expense
($000) |
Attala | | 1 | | 100 | % | | 2001 | | 463 | | Gas | | Intermediate | | 2,015,345 | | | 58.08 | | | 117,057 |
Baxter Wilson | | 1 | | 100 | % | | 1966 | | 510 | | Gas/Oil | | Peaking | | 828,014 | | | 106.33 | | | 88,046 |
| | | 2 | | 100 | % | | 1971 | | 595 | | Gas/Oil | | Peaking | | | | | | | | |
Delta | | 1 | | 100 | % | | 1953 | | 97 | | Gas/Oil | | Peaking | | (415 | ) | | (5,130.12 | ) | | 2,129 |
| | | 2 | | 100 | % | | 1953 | | 95 | | Gas/Oil | | Peaking | | | | | | | | |
Gerald Andrus | | 1 | | 100 | % | | 1975 | | 741 | | Gas/Oil | | Intermediate | | 1,127,814 | | | 88.03 | | | 99,285 |
Natchez | | 1 | | 100 | % | | 1951 | | — | | Gas/Oil | | Reserve | | (56 | ) | | (3,303.57 | ) | | 185 |
Rex Brown | | 1 | | 100 | % | | 1948 | | 15 | | Gas | | Reserve | | 156,316 | | | 139.12 | | | 21,746 |
| | | 3 | | 100 | % | | 1951 | | 74 | | Gas/Oil | | Peaking | | | | | | | | |
| | | 4 | | 100 | % | | 1959 | | 210 | | Gas/Oil | | Intermediate | | | | | | | | |
| | | 5 | | 100 | % | | 1968 | | 9 | | Oil | | Peaking | | | | | | | | |
Independence | | 1 | | 25 | % | | 1983 | | 209 | | Coal | | Base | | 28,443,527 | | | 2.07 | | | 58,833 |
Independence | | 2 | | 25 | % | | 1984 | | 211 | | Coal | | Base | | | | | | | | |
Total | | | | | | | | | 3,229 | | | | | | 32,570,545 | | | 11.89 | | | 387,281 |
(a) | Owned and LeasedCapability is the dependable load carrying capability as demonstrated under actual operating conditions based on the primary fuel (assuming no curtailments) that each station was designed to utilize. |
44
UTILITY STATISTICAL INFORMATION
ENTERGY NEW ORLEANS, INC.
| | | | | | | | | | | | |
| | | 2006 | | | 2005 | | 2004 | | 2003 | | 2002 | |
| ELECTRIC OPERATING REVENUES ($ thousands) | | | | | | | | | | | | |
Residential | | 105,924 | | | 150,409 | | 184,155 | | 178,133 | | 170,517 | |
Commercial | | 165,066 | | | 145,321 | | 170,812 | | 161,716 | | 153,776 | |
Industrial | | 44,582 | | | 31,597 | | 34,261 | | 26,416 | | 24,657 | |
Governmental | | 59,399 | | | 59,450 | | 69,680 | | 68,238 | | 65,746 | |
Total Retail | | 374,971 | | | 386,777 | | 458,908 | | 434,503 | | 414,696 | |
Sales for Resale | | 91,283 | | | 138,528 | | 119,407 | | 87,174 | | 8,773 | |
Other | | 4,812 | | | 10,711 | | 10,142 | | 5,983 | | 1,058 | |
Total Electric Operating Revenues | | 471,066 | | | 536,016 | | 588,457 | | 527,660 | | 424,527 | |
| FUEL REVENUES (included in above revenues) | | | | | | | | | | | | |
Residential | | 51,865 | | | 59,361 | | 67,891 | | 65,057 | | 62,192 | |
Commercial | | 92,894 | | | 64,164 | | 71,413 | | 67,552 | | 63,447 | |
Industrial | | 28,952 | | | 17,044 | | 17,706 | | 12,276 | | 11,419 | |
Governmental | | 34,839 | | | 28,496 | | 30,994 | | 30,534 | | 29,324 | |
Total Retail Fuel Revenues | | 208,550 | | | 169,065 | | 188,004 | | 175,419 | | 166,382 | |
| SOURCES OF ENERGY (GWh) | | | | | | | | | | | | |
Net Generation: | | | | | | | | | | | | |
Gas & Oil | | 773 | | | 1,661 | | 2,146 | | 2,099 | | 2,580 | |
Coal | | — | | | — | | — | | — | | — | |
Nuclear | | — | | | — | | — | | — | | — | |
Hydro | | — | | | — | | — | | — | | — | |
Total Net Generation | | 773 | | | 1,661 | | 2,146 | | 2,099 | | 2,580 | |
Purchased Power: | | | | | | | | | | | | |
Affiliated Companies | | 4,445 | | | 4,024 | | 3,880 | | 3,742 | | 2,706 | |
Non-affiliated Companies | | 41 | | | 1,232 | | 1,982 | | 1,621 | | 1,041 | |
Total Purchased Power | | 4,486 | | | 5,256 | | 5,862 | | 5,363 | | 3,747 | |
Total Sources of Energy | | 5,259 | | | 6,917 | | 8,008 | | 7,462 | | 6,327 | |
| USES OF ENERGY (GWh) | | | | | | | | | | | | |
Electric Energy Sales: | | | | | | | | | | | | |
Residential | | 914 | | | 1,616 | | 2,139 | | 2,133 | | 2,158 | |
Commercial | | 1,666 | | | 1,798 | | 2,316 | | 2,262 | | 2,255 | |
Industrial | | 547 | | | 498 | | 575 | | 413 | | 409 | |
Governmental | | 632 | | | 800 | | 1,025 | | 1,036 | | 1,053 | |
Total Retail | | 3,759 | | | 4,712 | | 6,055 | | 5,844 | | 5,875 | |
Sales for Resale | | 1,298 | | | 2,041 | | 1,539 | | 1,340 | | 176 | |
Unbilled Energy | | (1 | ) | | 135 | | 41 | | 22 | | (49 | ) |
Total Electric Energy Sales | | 5,056 | | | 6,888 | | 7,635 | | 7,206 | | 6,002 | |
Line Losses and Company Usage | | 203 | | | 29 | | 373 | | 256 | | 325 | |
Total Uses of Energy | | 5,259 | | | 6,917 | | 8,008 | | 7,462 | | 6,327 | |
| AVERAGE ELECTRIC REVENUE (cents/KWh) | | | | | | | | | | | | |
Residential | | 11.59 | | | 9.31 | | 8.61 | | 8.35 | | 7.90 | |
Commercial | | 9.91 | | | 8.08 | | 7.37 | | 7.15 | | 6.82 | |
Industrial | | 8.15 | | | 6.34 | | 5.96 | | 6.42 | | 6.03 | |
Governmental | | 9.40 | | | 7.43 | | 6.80 | | 6.59 | | 6.24 | |
| NUMBER OF RETAIL ELECTRIC CUSTOMERS(a) | | | | | | | | | | | | |
| (as of December 31) | | | | | | | | | | | | |
Residential | | 83,300 | | | 152,429 | | 169,498 | | 169,878 | | 170,771 | |
Commercial | | 10,000 | | | 14,220 | | 16,376 | | 16,336 | | 16,576 | |
Industrial | | 1,000 | | | 1,161 | | 1,309 | | 1,148 | | 1,141 | |
Governmental | | 700 | | | 858 | | 1,798 | | 1,755 | | 1,632 | |
Total Retail Customers | | 95,000 | | | 168,668 | | 188,981 | | 189,117 | | 190,120 | |
(a) | Customer count data reflects estimates of customers in the hardest hit areas affected by Hurricane Katrina. Issues associated withtemporary housing and resumption of service at permanent dwellings render precise counts difficult at this time. |
45
UTILITY STATISTICAL INFORMATION
ENTERGY NEW ORLEANS, INC.
GENERATION PORTFOLIO
| | | | | | | | | | | | | | | | | | | |
| | | | | | | | | | | | | | | | Total Plant - 2006
|
Plant(b) | | Unit | | Ownership | | | Commercial
Operation | | Owned &
Leased
Capability
(MW)(a) | | Fuel Type | | Purpose | | Net
Generation
(MWH) | | Expenses
Per Net
MWH | | Total
Production
Expense
($000) |
A. B. Paterson | | 3 | | 100 | % | | 1950 | | — | | Gas/Oil | | Reserve | | — | | — | | 205 |
| | | 4 | | 100 | % | | 1954 | | — | | Gas/Oil | | Reserve | | | | | | |
Michoud | | 1 | | 100 | % | | 1957 | | — | | Gas/Oil | | Reserve | | 773,039 | | 98.64 | | 76,251 |
| | | 2 | | 100 | % | | 1963 | | 230 | | Gas/Oil | | Intermediate | | | | | | |
| | | 3 | | 100 | % | | 1967 | | 530 | | Gas/Oil | | Intermediate | | | | | | |
A. B. Paterson | | 5 | | 100 | % | | 1967 | | — | | Oil | | Reserve | | — | | — | | 100 |
Total | | | | | | | | | 760 | | | | | | 773,039 | | 98.77 | | 76,351 |
(a) | Ownedand Leased Capability is the dependable load carrying capability as demonstrated under actual operating conditions based on the primary fuel (assuming no curtailments) that each station was designed to utilize. |
(b) | ENOI’splants were severely damaged by Hurricane Katrina in 2005. Michoud Unit 2 returned to service April 2006 and Unit 3 returned to |
SYSTEM ENERGY RESOURCES, INC.
| | | | | | | | | | | | | |
| | | 2006 | | | 2005 | | | 2004 | | | 2003 | | 2002 |
| ELECTRIC OPERATING REVENUES ( $ thousands) | | 555,459 | | | 533,929 | | | 545,381 | | | 583,820 | | 602,486 |
| SOURCES OF ENERGY (GWh) | | | | | | | | | | | | | |
Net Generation: | | | | | | | | | | | | | |
Gas & Oil | | — | | | — | | | — | | | — | | — |
Coal | | — | | | — | | | — | | | — | | — |
Nuclear | | 9,723 | | | 9,058 | | | 9,202 | | | 9,812 | | 9,053 |
Hydro | | — | | | — | | | — | | | — | | — |
Total Net Generation | | 9,723 | | | 9,058 | | | 9,202 | | | 9,812 | | 9,053 |
Purchased Power | | — | | | — | | | — | | | — | | — |
Total Sources of Energy | | 9,723 | | | 9,058 | | | 9,202 | | | 9,812 | | 9,053 |
| USES OF ENERGY (GWh) | | | | | | | | | | | | | |
Electric Energy Sales | | 9,727 | | | 9,070 | | | 9,212 | | | 9,812 | | 9,053 |
Unbilled Energy | | — | | | — | | | — | | | — | | — |
Line Losses and Company Usage | | (4 | ) | | (12 | ) | | (10 | ) | | — | | — |
Total Uses of Energy | | 9,723 | | | 9,058 | | | 9,202 | | | 9,812 | | 9,053 |
SYSTEM ENERGY RESOURCES, INC.
GENERATION PORTFOLIO
| | | | | | | | | | | | | | | | | | | |
| | | | | | | | | | | | | | | | Total Plant - 2006
|
Production Plant | | Unit | | Ownership | | | Commercial
Operation | | Owned &
Leased
Capability
(MW)(a) | | Fuel Type | | Purpose | | Net
Generation
(MWH) | | Expenses
Per Net
MWH | | Total
Production
Expense
($000) |
Grand Gulf | | 1 | | 90 | % | | 1985 | | 1,139 | | Nuclear BWR(b) | | Base | | 9,723,305 | | 14.72 | | 143,148 |
Total | | | | | | | | | 1,139 | | | | | | 9,723,305 | | 14.72 | | 143,148 |
(a) | Ownedand Leased Capability is the dependable load carrying capability as demonstrated under actual operating conditions based on the primary fuel (assuming no curtailments) that each station was designed to utilize. |
(b) | BWR= Boiling Water Reactor. |
46
UTILITY STATISTICAL INFORMATION
UTILITY NUCLEAR PLANT STATISTICS
The following table shows plant performance for 2002 – 2006 based on 18/24 month operating cycle.
CAPABILITY FACTOR (%)
| | | | | | | | | | |
| | | 2006 | | 2005 | | 2004 | | 2003 | | 2002 |
ANO | | 88.3 | | 88.5 | | 93.3 | | 93.3 | | 93.5 |
Grand Gulf | | 91.9 | | 93.3 | | 93.7 | | 94.5 | | 93.7 |
River Bend | | 90.9 | | 85.8 | | 90.9 | | 92.4 | | 93.4 |
Waterford 3 | | 93.5 | | 89.0 | | 93.6 | | 92.8 | | 94.9 |
Entergy Southeast Average | | 90.6 | | 89.2 | | 92.9 | | 93.3 | | 93.9 |
Industry Average | | 90.5 | | 90.1 | | 89.7 | | 90.0 | | 90.2 |
The following table shows plant performance for 2006 and averages for four three-year periods.
PRODUCTION COST ($/MWh)
| | | | | | | | | | |
| | | 2006 | | 2003– 2005 | | 2002– 2004 | | 2001– 2003 | | 2000-
2002 |
ANO | | 15.7 | | 15.1 | | 14.8 | | 14.8 | | 16.1 |
Grand Gulf | | 14.7 | | 13.7 | | 13.6 | | 13.6 | | 13.7 |
River Bend | | 20.0 | | 17.9 | | 17.0 | | 16.4 | | 17.1 |
Waterford 3 | | 16.1 | | 16.0 | | 15.5 | | 15.4 | | 15.3 |
Entergy Southeast Average | | 16.3 | | 15.5 | | 15.1 | | 15.0 | | 15.5 |
Industry Average | | 17.6 | | 17.0 | | 16.1 | | 16.1 | | 16.2 |
INDIVIDUAL PLANT INFORMATION
| | | | | | | | | | | | | | | |
| | | ANO | | Grand Gulf | | River Bend | | | Waterford 3 |
| | Unit 1 | | | | | | Unit 2 | | | |
Owner | | Entergy
Arkansas |
| | | | | Entergy
Arkansas | | System
Energy-90%
South
Mississippi
Electric Power
Association-
10% | | Entergy Gulf
States |
| | Entergy
Louisiana |
Commercial Operation Date | | December 74 | | | | | | March 80 | | July 85 | | June 86 | | | September 85 |
License Expiration Date | | 5/20/34 | | | | | | 7/17/38 | | 11/1/24 | | 8/29/25 | | | 12/18/24 |
Architect/Engineer | | Bechtel Power | | | | | | Bechtel Power | | Bechtel Power | | Stone & Webster | | | Ebasco |
Reactor Manufacturer | | Babcox & | | | | | | Combustion | | General | | General | | | Combustion |
| | | Wilcox | | | | | | Engineering | | Electric | | Electric | | | Engineering |
Reactor Type | | PWR | | | | | | PWR | | BWR | | BWR | | | PWR |
Turbine Generator Manufacturer | | Westinghouse | | | | | | General Electric | | Kraftwerk Union | | General Electric | | | Westinghouse |
Owned and Leased Capability (MW)(a) | | 841 | | | | | | 998 | | 1,139 | | 978 | (c) | | 1,158 |
Refueling Data: | | | | | | | | | | | | | | | |
Last Date | | 10/4/05- | | | | | | 9/19/06- | | 3/18/07- | | 4/23/06- | | | 11/25/06- |
| | | 12/22/05 | | | | | | 10/28/06 | | 4/12/07 | | 5/13/06 | | | 12/27/06 |
Number of Days | | 79 | (d) | | | | | 39 | | 24 | | 20 | | | 32 |
Next Scheduled Refueling | | Spring 07 | | | | | | Spring 08 | | Fall 08 | | Fall 07 | | | Spring 08 |
2006 Capability Factor (%) | | 84.5 | | | | | | 92.2 | | 91.9 | | 90.9 | | | 93.5 |
($ millions as of December 31, 2006) | | | | | | | | | | | | | | | |
Net Book Value | | | | | 1,170 | (b) | | | | 1,564 | | 1,544 | (c) | | 1,369 |
Decommissioning Trust Fund Balance | | | | | 439 | (b) | | | | 281 | | 345 | (c) | | 209 |
Decommissioning Liability | | | | | 473 | (b) | | | | 343 | | 191 | (c) | | 238 |
(a) | Ownedand Leased Capability is the dependable load carrying capability as demonstrated under actual operating conditions based on the primary fuel (assuming no curtailments) that each station was designed to utilize. Based on the 2006 summer ratings. |
(b) | ANOUnits 1 and 2 are reported together. |
(c) | 30%of River Bend is not subject to rate regulation by the Public Utility Commission of Texas, the Louisiana Public Service Commission, nor various municipal authorities, and is included in non-utility property on the balance sheet. The decommissioning trust fund balance and decommissioning liability include amounts for the 30% not subject to rate regulation. |
(d) | Included steam generator replacement. |
47
UTILITY REGULATORY INFORMATION
STATE REGULATORY COMMISSIONS
| | | | | | | | | | |
| | | Arkansas | | Louisiana | | Mississippi | | New Orleans | | Texas |
Commission | | Arkansas Public
Service
Commission | | Louisiana
Public Service
Commission | | Mississippi
Public Service
Commission | | New Orleans
City Council | | Public Utility
Commission
of Texas |
Number of Commissioners | | 3 | | 5 | | 3 | | 7 | | 3 |
Method of Selection | | Appointed by
Governor | | Elected | | Elected | | Elected | | Appointed by
Governor |
Term of Office | | 6 years –
staggered | | 6 years –
staggered | | 4 years –
concurrent | | 4 years –
concurrent
(2 term limit) | | 6 years –
staggered |
Chair/President | | Appointed by
Governor | | Selected by
peers – 1 year
term | | Rotates every
2 years | | Selected by
peers from two
at-large seats | | Appointed by
Governor |
COMMISSION/COUNCIL MEMBERS
| | | | | | |
| | | Party | | Service Began | | Current
Term Ends |
| ARKANSAS | | | | | | |
Paul Suskie – Chair | | Democrat | | 1/07 | | 1/13 |
Sandra L. Hochstetter | | Republican | | 7/00 | | 1/11 |
Daryl Bassett | | Republican | | 9/02 | | 1/09 |
| | | |
| LOUISIANA | | | | | | |
Jack A. “Jay” Blossman, Jr. – Chair | | Republican | | 1/97 | | 12/08 |
Lambert Boissiere III | | Democrat | | 1/05 | | 12/10 |
C. Dale Sittig | | Democrat | | 11/95 | | 12/10 |
James M. Field | | Republican | | 12/96 | | 12/12 |
Foster L. Campbell, Jr. | | Democrat | | 1/03 | | 12/08 |
| | | |
| MISSISSIPPI | | | | | | |
Nielsen Cochran – Chair | | Republican | | 12/83 | | 12/07 |
Dorlos “Bo” Robinson | | Democrat | | 12/89 | | 12/07 |
Leonard Bentz | | Republican | | 4/06 | | 12/07 |
| | | |
| NEW ORLEANS | | | | | | |
Oliver M. Thomas, Jr. – President(a) | | Democrat | | 5/94 | | 5/10 |
Arnie Fielkow | | Democrat | | 5/06 | | 5/10 |
Shelley Midura | | Democrat | | 5/06 | | 5/10 |
Stacy S. Head | | Democrat | | 5/06 | | 5/10 |
James Carter | | Democrat | | 5/06 | | 5/10 |
Cynthia Hedge-Morrell | | Democrat | | 4/05 | | 5/10 |
Cynthia Willard-Lewis | | Democrat | | 5/02 | | 5/10 |
| | | |
| TEXAS | | | | | | |
Paul Hudson – Chair | | Republican | | 8/03 | | 8/09 |
Julie Caruthers Parsley | | Republican | | 11/02 | | 8/11 |
Barry Smitherman | | Republican | | 4/04 | | 8/07 |
(a) | Oliver Thomas served two terms as Council member representing District B from 1994–2002. In 2002, Councilmember Thomas was elected to his first term of CouncilmemberAt-Large Seat and is now serving his second term as Councilmember At-Large. |
48
UTILITY REGULATORY INFORMATION
SELECT UTILITY REGULATORY MECHANISMS
| | | | | | | | |
| Company | | Last Filed Rate Base ($ billions) | | Allowed Roe (%) | | Jurisdictional Regulatory Mechanisms |
| | | | |
EAI | | 3.6(a)(2006 test year) | | 11 | | Rate Case | | • No fixed schedule for rate filings. EAI filed a rate case on August 15, 2006. |
| | | | | |
EGSI-LA | | 1.6 (2005 test year) | | 9.9 – 11.4
10.65 midpoint
60/40 customer/
company sharing | | FRP | | • Annual filing in May; any change in rates typically effective in September. • $17M annual FRP increase implemented August 2006 consisting of $7M in deferred and ongoing capacity costs and $ 10M for interim storm cost recovery. |
| | | | |
EGSI-TX | | 1.5(b) (2005 test year) | | 10.95 | | Riders | | • 2005 legislation authorized two riders – incremental purchased Power capacity costs up to five percent of annual base rate revenues and transition to competition costs. |
| | | | |
| | | | | | | | | • $18M annual purchased power rider implemented December 2005 with first reconciliation filing in May 2006 reconciling capacity from previous September forward. |
| | | | |
| | | | | | | | | • $14.5M annual TTC rider implemented March 2006. Black box settlement designed to provide a fair return and recovery of costs on the balance sheet. |
| | | | |
| | | | | | | Rate Case | | • Pursuant to the 2005 legislation, EGSI-TX may not file a general rate case before June 30, 2007, with rates effective no earlier than June 30, 2008. |
| | | | |
ELL | | 2.9 (2005 test year) | | 9.45 – 11.05
10.25 midpoint 60/40 customer/
company sharing | | FRP | | • Annual filing in May; any change in rates typically effective in September. • $143M annual FRP increase implemented September 2006 consisting of $119M in deferred and ongoing capacity costs and $24M for interim storm cost recovery. |
| | | | | |
EMI | | 1.4(c) (2006 test year) | | 9.46 – 12.24(c)
10.85 midpoint | | FRP | | • Annual filing in March; any change in rates typically effective in April. |
| | | | |
| | | | | 50/50 customer/
company sharing | | | | |
| | | | |
| | | | | 100bps for
price, reliability,
satisfaction | | | | |
| | | | | |
ENOI | | 0.4 (2005 test year) | | 10.75 | | FRP | | • In October 2006, the City Council of New Orleans unanimously approved a settlement agreement with ENOI that calls for a phased-in rate increase to ensure the company’s ability to focus on restoration of the gas and electric systems. Rate settlement in place until next base rate case to be filed by July 31, 2008. The agreement discontinued FRP, but allows ENOI to seek reinstatement of an appropriate FRP following resetting of rates in 2009. |
SERI | | 1.5 (2005 test year) | | 10.94 | | | | • Real-time recovery mechanism. |
| | | | |
Total | | 12.9 | | | | | | |
(a) | Reflects rate base in EAI’s filed case for June 30, 2006 test year. |
(b) | Reflects rate base in EGSI-TX’s annual earnings filing for 2005 test year. |
(c) | Rate base and allowed ROE reflects the 2006 FRP evaluation report. EMI’s 2006 FRP Evaluation Report is pending approval from the MPSC. Allowed ROE ranges for the 2005 test year was 9.74% – 12.44%. |
49
UTILITY REGULATORY INFORMATION
UTILITY ELECTRIC AND GAS FUEL RECOVERY MECHANISMS
| | | | | | | | | | | | | | |
| | | Deferred Fuel Balance as of December 31, | | | |
| COMPANY | | 2006 | | | 2005 | | 2004 | | 2003 | | 2002 | | | Fuel Recovery Mechanism |
| | | ($ millions) | | | |
EAI | | 2.2 | | | 204.2 | | 7.4 | | 10.6 | | (42.6 | ) | | Annual reset in April based on prior calendar year fuel and purchased power costs adjusted for nuclear refueling outages and projected sales plus any under- or over-recovered fuel balance for the prior calendar year. On June 7, 2006, Entergy Arkansas filed a cost of service study and testimony supporting the redetermined energy cost rate and testimony addressing the prospective elimination of the energy cost recovery rider as ordered by the APSC. A hearing was held in the APSC energy cost recovery investigation on October 12, 2006 and posthearing briefs were filed. No party recommended termination of the energy cost recovery rider. On January 16, 2007, the APSC issued an order stating the issue of whether Entergy Arkansas’ energy cost recovery rider should be terminated, modified, or continued will be deferred and addressed in Entergy Arkansas’ pending rate case. Additionally, in its review of Entergy Arkansas’ interim rate, the APSC found that Entergy Arkansas failed to maintain an adequate coal inventory level going into the summer of 2005 and that Entergy Arkansas should be responsible for any incremental energy costs resulting from two outages caused by employee and contractor error. The coal plant generation curtailments were caused by railroad delivery problems. The APSC staff was directed to perform an analysis with Entergy Arkansas’ assistance to determine the additional fuel and purchased energy costs associated with these findings and file the analysis within 60 days of the order. After a final determination of the costs is made by the APSC, Entergy Arkansas would be directed to refund that amount with interest to its customers as a credit on the energy cost recovery rider that collects fuel and purchased energy costs. Entergy Arkansas has requested rehearing of the order. In March 2007, in order to allow further consideration by the APSC, the APSC granted Entergy Arkansas’ petition for rehearing and for stay of the APSC’s January 2007 order in the proceeding investigating Entergy Arkansas’ interim energy cost rate. |
| | | | | | |
EGSI – TX | | (45.6 | ) | | 203.2 | | 78.5 | | 116.6 | | 91.8 | | | Semi-annual reset of fuel factor in March and September based on the market price of natural gas plus surcharge or refund for material under- or over-recoveries based on actual costs. |
| | | | | | |
EGSI – LA | | 119.5 | | | 121.2 | | 11.6 | | 1.9 | | 8.8 | | | Electric: Monthly reset based on fuel and purchased power costs from two months prior plus surcharge or credit for 1/12 of under- or over-recovered fuel balance. |
| | | | | | |
| | | | | | | | | | | | | | | Gas: Monthly reset based on estimated gas costs plus surcharge or credit for 1/12 of under- or over-recovered fuel balance. |
| | | | | | |
ELL | | 114.3 | | | 21.9 | | 8.7 | | 30.6 | | (25.6) | | | Monthly reset based on fuel and purchased power costs from two months prior plus surcharge or credit for 1/12 of under- or over-recovered fuel balance. |
| | | | | | |
EMI | | (95.2) | | | 114.0 | | (22.8) | | 89.1 | | 38.2 | | | Quarterly reset based on projected fuel and purchased power costs and projected sales plus any under- or over-recovered fuel balance from the second prior quarter. |
Total excluding ENOI | | 95.2 | | | 664.4 | | 83.4 | | 248.7 | | 70.6 | | | |
| | | | | | |
ENOI | | 19.0 | | | 30.6 | | 2.6 | | (2.7) | | (14.9) | | | Electric: Monthly reset based on no more than targeted fuel and purchased power costs and any difference between actual and base rate non-fuel items including Grand Gulf non-fuel costs and Resource Plan non-fuel costs paid by ENOI. A surcharge or credit is calculated on the under- or over- recovered fuel balance based on the most recent 12 months actual kWh sales. |
| | | | | | |
| | | | | | | | | | | | | | | Gas: Monthly reset based on estimated gas costs plus a surcharge or credit for the under- or over-recovered fuel balance based on the most recent 12 months Mcf sales. |
Total including ENOI | | 114.2 | | | 695.1 | | 85.9 | | 246.0 | | 55.7 | | | |
Totals may not foot due to rounding.
50
COMPETITIVE BUSINESSES
TOTAL CAPACITY
| | | | | | | | | | | |
| | | Operated | | | Owned Capacity(c) |
| As of December 31, 2006. | | Plants | | Units | | MW | | | MW | | % |
Gas/Oil | | 1 | | 1 | | 550 | (b) | | 1,317 | | 23 |
Coal | | — | | — | | — | (b) | | 181 | | 3 |
Total Fossil | | 1 | | 1 | | 550 | | | 1,498 | | 26 |
Wind | | — | | — | | — | | | 80 | | 1 |
Nuclear | | 5 | | 6 | | 5,000 | (a) | | 4,200 | | 73 |
Total Capacity | | 6 | | 7 | | 5,550 | | | 5,778 | | 100 |
(a) | Operatedcapacity includes management services contracts. |
(b) | Excludesunits operated by Entergy’s utility companies. |
(c) | Includescapacity under power purchase agreements. |
ENTERGY NUCLEAR (NON-UTILITY)
ENTERGY NUCLEAR QUARTERLY FINANCIAL METRICS
| | | | | | | | | | | | | | | | | | | | | | | |
| | | 2006 | | 2005 | | YTD % Change | |
| | | 1Q | | 2Q | | 3Q | | 4Q | | YTD | | 1Q | | 2Q | | 3Q | | 4Q | | YTD | |
GAAP MEASURES | | | | | | | | | | | | | | | | | | | | | | | |
As-Reported Earnings ($ millions) | | 81.5 | | 63.4 | | 106.9 | | 57.7 | | 309.5 | | 78.0 | | 58.3 | | 69.3 | | 77.1 | | 282.6 | | 10 | |
Return on Average Invested Capital – As-Reported (%)* | | 10.8 | | 10.7 | | 12.1 | | 11.7 | | 11.7 | | 10.2 | | 10.1 | | 10.3 | | 11.6 | | 11.6 | | 1 | |
Return on Average Common Equity – As-Reported (%)* | | | | 14.0 | | 13.9 | | 15.2 | | 14.0 | | 14.0 | | 12.2 | | 12.0 | | 12.1 | | 13.6 | | 13.63 | |
Debt to Capital Ratio (%) | | 19.3 | | 19.1 | | 16.7 | | 14.2 | | 14.2 | | 26.4 | | 26.2 | | 24.8 | | 19.5 | | 19.5 | | (27 | ) |
NON-GAAP MEASURES | | | | | | | | | | | | | | | | | | | | | | | |
Operational Earnings ($ millions) | | 81.5 | | 63.4 | | 106.9 | | 57.7 | | 309.5 | | 78.0 | | 58.3 | | 69.3 | | 77.1 | | 282.6 | | 10 | |
Return on Average Invested Capital – Operational (%)* | | 10.8 | | 10.7 | | 12.1 | | 11.7 | | 11.7 | | 10.2 | | 10.1 | | 10.3 | | 11.6 | | 11.6 | | 1 | |
Return on Average Common Equity – Operational (%)* | | 14.0 | | 13.9 | | 15.2 | | 14.0 | | 14.0 | | 12.2 | | 12.0 | | 12.1 | | 13.6 | | 13.6 | | 3 | |
Net Debt to Net Capital Ratio (%) | | 9.9 | | 7.5 | | 3.9 | | 2.3 | | 2.3 | | 21.9 | | 21.7 | | 15.0 | | 12.4 | | 12.4 | | (81 | ) |
Totals may not foot due to rounding.
ENTERGY NUCLEAR ANNUAL FINANCIAL METRICS
| | | | | | | | | | |
| | | 2006 | | 2005 | | 2004 | | 2003 | | 2002 |
GAAP MEASURES | | | | | | | | | | |
As-Reported Earnings ( $ millions) | | 309.5 | | 282.6 | | 245.0 | | 300.8 | | 200.5 |
Return on Average Invested Capital – As-Reported (%) | | 11.7 | | 11.6 | | 10.1 | | 12.8 | | 10.6 |
Return on Average Common Equity – As-Reported (%) | | 14.0 | | 13.6 | | 12.3 | | 18.2 | | 17.2 |
Debt to Capital Ratio (%) | | 14.2 | | 19.5 | | 27.0 | | 27.7 | | 42.3 |
NON-GAAP MEASURES | | | | | | | | | | |
Operational Earnings ($ millions) | | 309.5 | | 282.6 | | 245.0 | | 198.2 | | 200.5 |
Return on Average Invested Capital – Operational (%) | | 11.7 | | 11.6 | | 10.1 | | 8.6 | | 10.6 |
Return on Average Common Equity – Operational (%) | | 14.0 | | 13.6 | | 12.3 | | 11.9 | | 17.2 |
Net Debt to Net Capital Ratio (%) | | 2.3 | | 12.4 | | 23.1 | | 23.5 | | 38.2 |
ENTERGY NUCLEAR QUARTERLY OPERATIONAL METRICS
| | | | | | | | | | | | | | | | | | | | | | | | | | | | | | | | | | | | | | | | | | |
| | | 2006 | | | 2005 | | | YTD % Change |
| | | 1Q | | | 2Q | | | 3Q | | | 4Q | | | YTD | | | 1Q | | | 2Q | | | 3Q | | | 4Q | | | YTD | | |
Net MW in Operation | | | 4,135 | | | | 4,200 | | | | 4,200 | | | | 4,200 | | | | 4,200 | | | | 4,058 | | | | 4,105 | | | | 4,105 | | | | 4,105 | | | | 4,105 | | | 2 |
Average Realized Price/MWh(a) | | $ | 44.28 | | | $ | 43.76 | | | $ | 44.90 | | | $ | 44.34 | | | $ | 44.33 | | | $ | 41.53 | | | $ | 42.31 | | | $ | 42.42 | | | $ | 42.74 | | | $ | 42.26 | | | 5 |
Production Cost/MWh(a) | | $ | 18.68 | | | $ | 19.61 | | | $ | 18.75 | | | $ | 21.00 | | | $ | 19.50 | | | $ | 18.65 | | | $ | 18.55 | | | $ | 19.55 | | | $ | 19.00 | | | $ | 18.94 | | | 3 |
Billed GWh | | | 8,763 | | | | 8,281 | | | | 9,119 | | | | 8,684 | | | | 34,847 | | | | 8,273 | | | | 8,218 | | | | 8,504 | | | | 8,645 | | | | 33,641 | | | 4 |
Capacity Factor | | | 97 | % | | | 90 | % | | | 99 | % | | | 93 | % | | | 95 | % | | | 93 | % | | | 91 | % | | | 95 | % | | | 95 | % | | | 93 | % | | 2 |
Totals may not foot due to rounding.
| (a) | Average Realized Price/MWh has been restated to reflect Billed GWh. Production Cost/MWh has been restated to exclude purchased power cost. |
ENTERGY NUCLEAR ANNUAL OPERATIONAL METRICS
| | | | | | | | | | | | | | | | | | | | |
| | | 2006 | | | 2005 | | | 2004 | | | 2003 | | | 2002 | |
Net MW in Operation | | | 4,200 | | | | 4,105 | | | | 4,058 | | | | 4,001 | | | | 3,955 | |
Average Realized Price/MWh(a) | | $ | 44.33 | | | $ | 42.26 | | | $ | 41.16 | | | $ | 39.40 | | | $ | 40.10 | |
Production Cost/MWh(a) | | $ | 19.50 | | | $ | 18.93 | | | $ | 19.99 | | | $ | 20.29 | | | $ | 20.12 | |
Billed GWh | | | 34,847 | | | | 33,539 | | | | 32,524 | | | | 32,379 | | | | 29,953 | |
Capacity Factor | | | 95 | % | | | 93 | % | | | 92 | % | | | 92 | % | | | 93 | % |
| (a) | Average Realized Price/MWh has been restated to reflect Billed GWh. Production Cost/MWh has been restated to exclude purchased power cost. |
51
ENTERGY NUCLEAR (NON-UTILITY)
ENTERGY NUCLEAR PLANT STATISTICS
| | | | | | | | | | | | | | | | | | |
| | | James A. Fitzpatrick | | | Indian Point | | | Palisades Nuclear Plant | | | Pilgrim Nuclear station | | | Vermont Yankee | |
| | | Unit 2 | | | Unit 3 | | | | |
Entergy Purchase Date | | 11/21/00 | | | 9/6/01 | | | 11/21/00 | | | 4/11/07 | | | 7/13/99 | | | 7/31/02 | |
Commercial Operation Date | | July 75 | | | August 74 | | | August 76 | | | December 72 | | | December 72 | | | November 72 | |
License Expiration Date | | 10/17/14 | | | 9/28/13 | | | 12/15/15 | | | 3/24/31 | | | 6/8/12 | | | 3/21/12 | |
Architect/Engineer | | Stone &
Webster |
| | United
Engineers &
Constructors |
| | United
Engineers &
Constructors |
| | Combustion
Engineering |
| | Bechtel
Power |
| | Ebasco | |
Reactor Manufacturer | | General
Electric |
| | Westinghouse | | | Westinghouse | | | Combustion
Engineering |
| | General
Electric |
| | General
Electric |
|
Reactor Type | | BWR | | | PWR | | | PWR | | | PWR | | | BWR | | | BWR | |
Turbine Generator Manufacturer | | General
Electric |
| | Westinghouse | | | Westinghouse | | | Westinghouse | | | General
Electric |
| | General
Electric |
|
Maximum Dependable Capacity (MW) | | 838 | | | 1,028 | | | 1,041 | | | 798 | | | 688 | | | 605 | |
(as of December 31, 2006) | | | | | | | | | | | | | | | | | | |
Refueling Data: | | | | | | | | | | | | | | | | | | |
Last Date | | 10/9/06 –
11/4/06 |
| | 4/18/06 –
5/19/06 |
| | 3/6/07 –
3/31/07 |
| | 4/1/06
5/10/06 |
| | 4/18/05 –
5/12/05 |
| | 10/22/05 –
11/11/05 |
|
Number of Days | | 27 | | | 31 | | | 24 | | | 39 | | | 25 | | | 19 | |
Next Scheduled Refueling | | Fall 08 | | | Spring 08 | | | Spring 09 | | | Fall 07 | | | Spring 07 | | | Spring 07 | |
2006 Capacity Factor | | 90 | % | | 89 | % | | 100 | % | | 85 | % | | 97 | % | | 99 | % |
($ millions as of December 31, 2006) | | | | | | | | | | | | | | | | | | |
Net Book Value | | 240 | | | 704 | | | 300 | | | n/a | | | 108 | | | 173 | |
Decommissioning Trust Fund Balance | | | (a) | | 585 | (b) | | | (a) | | n/a | | | 583 | | | 417 | |
Decommissioning Liability | | | (a) | | 288 | (b) | | | (a) | | n/a | | | 236 | | | 250 | |
Nearest Market Hub | | NYISO | | | NYISO | | | NYISO | | | MISO | | | NEPOOL | | | NEPOOL | |
| | | Zone A | (c) | | Zone G | (d) | | Zone G | (d) | | Cinergy | | | Mass Hub | | | Mass Hub | |
Capacity Zone (ICAP/UCAP) | | NYISO | | | NYISO | | | NYISO | | | n/a | | | NEPOOL | | | NEPOOL | |
| | | Rest of State | | | Rest of State | | | Rest of State | | | | | | | | | | |
(a) | NYPAretained the decommissioning trusts and decommissioning liability. NYPA and Entergy executed decommissioning agreements, specifying their decommissioning obligations. NYPA has the right to require Entergy to assume the decommissioning liability provided that it assigns the corresponding decommissioning trust, up to a specified level, to Entergy. If the decommissioning liability is retained by NYPA, Entergy will perform the decommissioning of the plants at a price equal to the lesser of a pre-specified level or the amount in the decommissioning trusts. Entergy believes that the amounts available to it under either scenario are sufficient to cover the future decommissioning costs without any additional contributions to the trusts. |
(b) | Includes amount for Indian Point 1. Indian Point 1 has been shut down and in safe storage sincethe 1970s. |
(c) | James A.FitzPatrick physically located in NYISO Zone C. |
(d) | Indian Pointphysically located in NYISO Zone H. |
ENTERGY NUCLEAR PLANT UPRATES
| | | | | | | | | | | | |
| (MW) | | Capacity
12/31/02 | | 2003 | | 2004 | | 2005 | | 2006 | | Capacity
12/31/06 |
FitzPatrick | | 825 | | — | | 13 | | — | | — | | 838 |
Indian Point 2 | | 970 | | 14 | | 44 | | — | | — | | 1,028 |
Indian Point 3 | | 980 | | 14 | | — | | 47 | | — | | 1,041 |
Pilgrim | | 670 | | 18 | | — | | — | | — | | 688 |
Vermont Yankee | | 510 | | — | | — | | — | | 95 | | 605 |
Total | | 3,955 | | 46 | | 57 | | 47 | | 95 | | 4,200 |
52
ENTERGY NUCLEAR (NON-UTILITY)
ENTERGY NUCLEAR SECURITIES DETAIL
LONG-TERM DEBT:
Note to New York Power Authority (NYPA) relating to the purchase of Fitzpatrick and Indian Point 3
| | | | | | | | | | | | |
| ($ thousands) | | Long-term
debt(a) | | Interest
expense | | Additional
LTD related to purchase of IP2 | | Interest
expense | | Total ending long-term
debt | | Total
interest
expense |
2000 | | 744,405 | | 3,869 | | — | | — | | 744,405 | | 3,869 |
2001 | | 682,512 | | 35,392 | | 74,402 | | 1,190 | | 756,914 | | 36,582 |
2002 | | 604,420 | | 32,540 | | 79,220 | | 3,628 | | 683,640 | | 36,168 |
2003 | | 441,845 | | 27,387 | | 72,863 | | 3,643 | | 514,708 | | 31,030 |
2004 | | 379,405 | | 21,275 | | 66,200 | | 3,337 | | 445,605 | | 24,612 |
2005 | | 313,968 | | 18,277 | | 59,218 | | 3,018 | | 373,186 | | 21,295 |
2006 | | 245,390 | | 15,137 | | 51,900 | | 2,682 | | 297,289 | | 17,819 |
2007 | | 173,520 | | 11,845 | | 44,231 | | 2,331 | | 217,751 | | 14,176 |
2008 | | 161,932 | | 8,412 | | 36,194 | | 1,963 | | 198,126 | | 10,375 |
2009 | | 149,771 | | 7,839 | | 27,772 | | 1,577 | | 177,543 | | 9,416 |
2010 | | 137,026 | | 7,255 | | 18,945 | | 1,173 | | 155,971 | | 8,428 |
2011 | | 123,669 | | 6,643 | | 9,694 | | 750 | | 133,363 | | 7,393 |
2012 | | 109,681 | | 6,012 | | — | | 305 | | 109,681 | | 6,317 |
2013 | | 95,011 | | 5,331 | | — | | — | | 95,011 | | 5,331 |
2014 | | 79,638 | | 4,627 | | — | | — | | 79,638 | | 4,627 |
2015 | | 61,027 | | 3,889 | | — | | — | | 61,027 | | 3,889 |
2016–2035 Average | | — | | 1,755 | | — | | — | | — | | 1,755 |
| (a) | Includes plant, fuel, and license extension payments. Payments for plant and fuel are made annually on 11/21 (anniversary of close). As of 9/30/03, the entire fuel note has been paid off. Life extension payments made on anniversary of license expiration. |
Totals may not foot due to rounding.
NON-NUCLEAR WHOLESALE ASSETS
NON-NUCLEAR WHOLESALE ASSETS PLANT STATISTICS
| | | | | | | | | | | | | | | | | |
| Plant | | Location | | NERC
Region | | Commercial
Operation | | Ownership
Interest | | | Net
MW | | Total
MW | | Fuel Type/
Technology | | Purpose |
Independence – Unit 2 | | Newark, AR | | SERC | | 1983 | | 14 | % | | 121 | | 842 | | Coal | | Base |
Nelson 6 (PPA) | | Westlake, LA | | SERC | | 1982 | | 11 | % | | 60 | | 550 | | Coal | | Base |
Harrison County | | Marshall, TX | | SPP | | 2003 | | 61 | % | | 335 | | 550 | | Combined Cycle | | Intermediate |
RS Cogen | | Lake Charles, LA | | SERC | | 2002 | | 50 | % | | 213 | | 425 | | CCGT Cogen | | Base QF |
Ritchie – Unit 2 | | Helena, AR | | SERC | | 1968 | | 100 | % | | 544 | | 544 | | Gas/Oil | | Peaking |
Warren Power | | Vicksburg, MS | | SERC | | 2001 | | 75 | % | | 225 | | 300 | | Gas Turbine | | Peaking |
Top of Iowa | | Worth County, IA | | MAPP | | 2001 | | 50 | % | | 40 | | 80 | | Wind | | Renewable |
White Deer | | Amarillo, TX | | SPP | | 2001 | | 50 | % | | 40 | | 80 | | Wind | | Renewable |
Total | | | | | | | | | | | 1,578 | | 3,371 | | | | |
NON-NUCLEAR WHOLESALE ASSETS SECURITIES DETAIL
DEBT:
Outstanding as of December 31,
| | | | | | | | | | | | | | |
| (Entergy’s share) | | 2006 | | 2005 | | 2004 | | Maturity | | Rate | |
| | | | | (in millions) | | | | | | | |
RS Cogen Senior Project Debt | | | | | | | | | | | | | | |
Bank Portion(a) | | $ | 65 | | $ | 72 | | $ | 77 | | 10/17/18 | | LIBOR + 1.375 | % |
Institutional Portion | | $ | 38 | | $ | 38 | | $ | 38 | | 10/15/22 | | Fixed 8.73 | % |
Working Capital | | $ | 1 | | $ | — | | $ | — | | Demand | | LIBOR + 1.625 | % |
RS Cogen Subordinated Debt | | $ | 15 | | $ | 16 | | $ | — | | 10/17/17 | | LIBOR + 4.50 | % |
Top Deer Senior Project Debt | | $ | 28 | | $ | 34 | | $ | — | | 06/30/13 | | Fixed 5.43 | % |
(a) | RSCogen spread on bank portion increases over time to 2.375%. |
PREFERRED STOCK:
| | | | | | | | | | | | | | | | | | |
| | | | | | Shares Outstanding As of December 31, | | As of December 31, |
| | | Rate(a) | | | 2006 | | 2005 | | 2004 | | 2006 | | 2005 | | 2004 |
| | | | | | | | | | | | (in millions) |
Authorized 1,000,000 shares, $1 par value, cumulative | | | | | | | | | | | | | | | | | | |
Without Sinking Fund: | | | | | | | | | | | | | | | | | | |
Entergy Asset Management, | | 11.5 | % | | 297,376 | | 297,376 | | 297,376 | | $ | 29.7 | | $ | 29.7 | | $ | 29.7 |
11.50% rate | | | | | | | | | | | | | | | | | | |
Other | | — | | | — | | — | | — | | | 1.1 | | | 1.7 | | | 1.3 |
Total without sinking fund | | | | | 297,376 | | 297,376 | | 297,376 | | $ | 30.8 | | $ | 31.4 | | $ | 31.0 |
(a) | EntergyAsset Management’s stockholders’ agreement provides that at any time during the 180-day period prior to December 31, 2007 or each subsequent December 31 thereafter, either Entergy Asset Management or the preferred shareholders may request that the preferred dividend rate be reset. |
53
DEFINITIONS OF OPERATIONAL MEASURES AND GAAP AND NON-GAAP FINANCIAL MEASURES
NUCLEAR OPERATIONAL MEASURES
| | |
| Net MW in operation | | Installed capacity owned or operated by Entergy Nuclear |
| |
| Average realized price per MWh | | As-Reported revenue per MWh billed for all non-utility nuclear operations |
| |
| Production cost per MWh | | Fuel and non-fuel operation and maintenance expenses according to accounting standards that directly relate to the production of electricity per MWh |
| |
| Billed GWh | | Total number of GWh billed to all customers |
| |
| Capability factor | | The percentage of the maximum energy generation a plant is capable of supplying to the grid, limited only by factors within control of plant management. A high capability factor indicates effective plant programs and practices to minimize unplanned energy losses and to optimize planned Outages |
| |
| Capacity factor | | Normalized percentage of the period that the plant generates power. This is a ratio of the energy that was produced over a given period of time relative to energy that would have been produced had the unit operated continuously at its maximum dependable capacity over the period |
| |
| Refueling outage duration | | Number of days lost for scheduled refueling outage during the period |
Financial measures defined in the below table include measures prepared in accordance with generally accepted accounting principles (GAAP), as well as non-GAAP measures. Non-GAAP measures are included in this report in order to provide metrics that remove the effect of less routine financial impacts from commonly used financial metrics.
FINANCIAL MEASURES – GAAP
| | |
| | |
| Return on average invested capital – As-Reported | | 12-months trailing earnings adjusted to include preferred dividends and tax- effected interest expense divided by average invested capital |
| |
| Return on average common equity – As-Reported | | 12-months trailing earnings divided by average common or members’ equity |
| |
| Net margin – As-Reported | | 12-months trailing earnings divided by 12-months trailing revenue |
| |
| Cash flow interest coverage interest | | 12-months cash flow from operating activities plus 12-months trailing paid, divided by interest expense |
| |
| Book value per share | | Common equity divided by end of period shares outstanding |
| |
| Revolver capacity | | Amount of undrawn capacity remaining on corporate and subsidiary revolvers |
| |
| Total debt | | Sum of short-term and long-term debt, notes payable, capital leases, and preferred stock with sinking fund (beginning in 2003) on the balance sheet, less non-recourse debt, if any |
| |
| Project debt | | Financing at subsidiaries to support specific projects |
| |
| Debt of joint ventures (Entergy’s share) | | Debt issued for Entergy-Koch, LP and Non-Nuclear Wholesale Assets business joint ventures for periods through third quarter 2004. Only Non-Nuclear Wholesale Assets business joint ventures debt included for periods thereafter |
| |
| Leases (Entergy’s share) | | Operating leases held by subsidiaries capitalized at implicit interest rate |
| |
| Debt to capital | | Gross debt divided by total capitalization |
| | |
| FINANCIAL MEASURES – NON-GAAP | | |
| |
| Operational earnings | | As-Reported earnings adjusted to exclude the impact of special items |
| |
| Return on average invested capital – Operational | | 12-months trailing operational earnings adjusted to include preferred dividends and tax-effected interest expense divided by average invested capital |
| |
| Return on average common equity – Operational | | 12-months trailing operational earnings divided by average common or members’ equity |
| |
| Net margin - Operational | | 12-months trailing operational earnings divided by 12-months trailing revenue |
| |
| Total gross liquidity | | Sum of cash and cash equivalents and revolver capacity |
| |
| Net debt to net capital | | Gross debt less cash and cash equivalents divided by total capitalization less cash and cash equivalents |
| |
| Net debt including off-balance sheet liabilities | | Sum of gross debt and off-balance sheet debt less cash and cash equivalents divided by sum of total capitalization and off-balance sheet liabilities less cash and cash equivalents |
54
REG G RECONCILIATIONS
PRO FORMA FINANCIAL RESULTS (Reflects Deconsolidation of Entergy New Orleans) (unaudited)
RECONCILIATION OF GAAP TO NON-GAAP
| | | | | | | | | | | | | | | | | | | | | | | | |
| 2004 PRO FORMA INCOME STATEMENT | | UTILITY/PARENT/OTHER | | | CONSOLIDATED | |
| | | ENOI | | | ENOI | |
| In thousands, as of December 31, 2004. | | GAAP | | | Adjustment* | | | Pro Forma | | | GAAP | | | Adjustment* | | | Pro Forma | |
OPERATING REVENUES: | | | | | | | | | | | | | | | | | | | | | | | | |
Domestic electric | | $ | 7,934,312 | | | $ | (287,783 | ) | | $ | 7,646,529 | | | $ | 7,932,577 | | | $ | (287,783 | ) | | $ | 7,644,794 | |
Natural gas | | | 208,499 | | | | (147,411 | ) | | | 61,088 | | | | 208,499 | | | | (147,411 | ) | | | 61,088 | |
Competitive businesses | | | 48,601 | | | | — | | | | 48,601 | | | | 1,544,445 | | | | — | | | | 1,544,445 | |
Total | | | 8,191,412 | | | | (435,194 | ) | | | 7,756,218 | | | | 9,685,521 | | | | (435,194 | ) | | | 9,250,327 | |
OPERATING EXPENSES: | | | | | | | | | | | | | | | | | | | | | | | | |
Operating and Maintenance: | | | | | | | | | | | | | | | | | | | | | | | | |
Fuel, fuel-related expenses, and gas purchased for resale | | | 2,272,610 | | | | (245,301 | ) | | | 2,027,309 | | | | 2,488,208 | | | | (245,301 | ) | | | 2,242,907 | |
Purchased power | | | 1,716,848 | | | | 39,061 | | | | 1,755,909 | | | | 1,701,610 | | | | 39,061 | | | | 1,740,671 | |
Nuclear refueling outage expenses | | | 66,824 | | | | — | | | | 66,824 | | | | 166,072 | | | | — | | | | 166,072 | |
Provision for turbine commitments, asset impairments, and restructuring charges | | | — | | | | — | | | | — | | | | 55,000 | | | | — | | | | 55,000 | |
Other operation and maintenance | | | 1,578,842 | | | | (102,451 | ) | | | 1,476,391 | | | | 2,268,332 | | | | (102,450 | ) | | | 2,165,882 | |
Decommissioning | | | 91,939 | | | | – | | | | 91,939 | | | | 149,529 | | | | — | | | | 149,529 | |
Taxes other than income taxes | | | 348,376 | | | | (43,577 | ) | | | 304,799 | | | | 403,635 | | | | (43,577 | ) | | | 360,058 | |
Depreciation and amortization | | | 828,445 | | | | (29,657 | ) | | | 798,788 | | | | 893,574 | | | | (29,657 | ) | | | 863,917 | |
Other regulatory credits – net | | | (90,611 | ) | | | 4,670 | | | | (85,941 | ) | | | (90,611 | ) | | | 4,670 | | | | (85,941 | ) |
Total | | | 6,813,273 | | | | (377,255 | ) | | | 6,436,018 | | | | 8,035,349 | | | | (377,254 | ) | | | 7,658,095 | |
OPERATING INCOME | | | 1,378,139 | | | | (57,939 | ) | | | 1,320,200 | | | | 1,650,172 | | | | (57,940 | ) | | | 1,592,232 | |
OTHER INCOME: | | | | | | | | | | | | | | | | | | | | | | | | |
Allowance for equity funds used during construction | | | 39,582 | | | | (1,378 | ) | | | 38,204 | | | | 39,582 | | | | (1,378 | ) | | | 38,204 | |
Interest and dividend income | | | 83,386 | | | | (396 | ) | | | 82,990 | | | | 109,635 | | | | (396 | ) | | | 109,239 | |
Equity in earnings (loss) of unconsolidated equity affiliates | | | (3 | ) | | | 27,107 | | | | 27,104 | | | | (78,727 | ) | | | 27,107 | | | | (51,620 | ) |
Miscellaneous – net | | | 25,460 | | | | (270 | ) | | | 25,190 | | | | 55,509 | | | | (270 | ) | | | 55,240 | |
Total | | | 148,425 | | | | 25,063 | | | | 173,488 | | | | 125,999 | | | | 25,064 | | | | 151,063 | |
INTEREST AND OTHER CHARGES: | | | | | | | | | | | | | | | | | | | | | | | | |
Interest on long-term debt | | | 447,510 | | | | (15,357 | ) | | | 432,153 | | | | 463,384 | | | | (15,357 | ) | | | 448,027 | |
Other interest – net | | | 41,932 | | | | (929 | ) | | | 41,003 | | | | 40,133 | | | | (929 | ) | | | 39,204 | |
Allowance for borrowed funds used during construction | | | (25,741 | ) | | | 1,243 | | | | (24,498 | ) | | | (25,741 | ) | | | 1,243 | | | | (24,498 | ) |
Total | | | 463,701 | | | | (15,043 | ) | | | 448,658 | | | | 477,776 | | | | (15,043 | ) | | | 462,733 | |
INCOME FROM CONTINUING OPERATIONS BEFORE INCOME TAXES | | | 1,062,863 | | | | (17,833 | ) | | | 1,045,030 | | | | 1,298,395 | | | | (17,833 | ) | | | 1,280,562 | |
Income taxes | | | 378,526 | | | | (16,868 | ) | | | 361,658 | | | | 365,305 | | | | (16,868 | ) | | | 348,437 | |
INCOME FROM CONTINUING OPERATIONS | | | 684,337 | | | | (965 | ) | | | 683,372 | | | | 933,090 | | | | (965 | ) | | | 932,125 | |
LOSS FROM DISCONTINUED OPERATIONS (net of income tax expense of $603) | | | (41 | ) | | | — | | | | (41 | ) | | | (41 | ) | | | — | | | | (41 | ) |
CONSOLIDATED NET INCOME | | | 684,296 | | | | (965 | ) | | | 683,331 | | | | 933,049 | | | | (965 | ) | | | 932,084 | |
Preferred dividend requirements and other | | | 23,283 | | | | (965 | ) | | | 22,318 | | | | 23,525 | | | | (965 | ) | | | 22,560 | |
EARNINGS APPLICABLE TO COMMON STOCK | | $ | 661,013 | | | $ | — | | | $ | 661,013 | | | $ | 909,524 | | | $ | — | | | $ | 909,524 | |
*Adjustment to reflect deconsolidation of Entergy New Orleans, Inc.
Totals may not foot due to rounding.
55
REG G RECONCILIATIONS
PRO FORMA FINANCIAL RESULTS (Reflects Deconsolidation of Entergy New Orleans) (unaudited)
RECONCILIATION OF GAAP TO NON-GAAP
2004 PRO FORMA BALANCE SHEET
| | | | | | | | | | | | | | | | | | | | | | | | |
| | | Utility/ Parent/ Other | | | Consolidated | |
| In thousands, as of December 31, 2004. | | GAAP | | | ENOI
Adjustment* | | | Pro Forma | | | GAAP | | | ENOI
Adjustment* | | | Pro Forma | |
ASSETS | | | | | | | | | | | | | | | | | | | | | | | | |
CURRENT ASSETS: | | | | | | | | | | | | | | | | | | | | | | | | |
Cash and cash equivalents: | | | | | | | | | | | | | | | | | | | | | | | | |
Cash | | $ | 62,001 | | | $ | (2,998 | ) | | $ | 59,003 | | | $ | 79,136 | | | $ | (2,998 | ) | | $ | 76,138 | |
Temporary cash investments – at cost, which approximates market | | | 558,971 | | | | (4,956 | ) | | | 554,015 | | | | 540,650 | | | | (4,956 | ) | | | 535,694 | |
Total cash and cash equivalents | | | 620,972 | | | | (7,954 | ) | | | 613,018 | | | | 619,786 | | | | (7,954 | ) | | | 611,832 | |
Other temporary investments | | | 2,236 | | | | — | | | | 2,236 | | | | 187,950 | | | | — | | | | 187,950 | |
Notes receivable | | | — | | | | — | | | | — | | | | 3,092 | | | | — | | | | 3,092 | |
Accounts receivable: | | | | | | | | | | | | | | | | | | | | | | | | |
Customer | | | 435,191 | | | | (16,793 | ) | | | 418,398 | | | | 435,191 | | | | (16,793 | ) | | | 418,398 | |
Allowance for doubtful accounts | | | (21,576 | ) | | | 3,492 | | | | (18,084 | ) | | | (23,758 | ) | | | 3,492 | | | | (20,266 | ) |
Associated companies | | | 7,144 | | | | — | | | | 7,144 | | | | — | | | | — | | | | — | |
Other | | | 185,899 | | | | (7,328 | ) | | | 178,571 | | | | 342,289 | | | | (7,329 | ) | | | 334,960 | |
Accrued unbilled revenues | | | 460,039 | | | | (24,848 | ) | | | 435,191 | | | | 460,039 | | | | (24,848 | ) | | | 435,191 | |
Total receivables | | | 1,066,697 | | | | (45,477 | ) | | | 1,021,220 | | | | 1,213,761 | | | | (45,478 | ) | | | 1,168,283 | |
Deferred fuel costs | | | 55,069 | | | | (2,559 | ) | | | 52,510 | | | | 55,069 | | | | (2,559 | ) | | | 52,510 | |
Accumulated deferred income taxes | | | 76,899 | | | | 1,906 | | | | 78,805 | | | | 76,899 | | | | 1,906 | | | | 78,805 | |
Fuel inventory – at average cost | | | 125,454 | | | | (4,181 | ) | | | 121,273 | | | | 127,251 | | | | (4,181 | ) | | | 123,070 | |
Materials and supplies – at average cost | | | 345,688 | | | | (9,149 | ) | | | 336,539 | | | | 569,407 | | | | (9,150 | ) | | | 560,257 | |
Deferred nuclear refueling outage costs | | | 53,537 | | | | — | | | | 53,537 | | | | 129,718 | | | | — | | | | 129,718 | |
Prepayments and other | | | 89,105 | | | | (3,468 | ) | | | 85,637 | | | | 116,279 | | | | (3,469 | ) | | | 112,810 | |
Total | | | 2,435,657 | | | | (70,882 | ) | | | 2,364,775 | | | | 3,099,212 | | | | (70,885 | ) | | | 3,028,327 | |
OTHER PROPERTY AND INVESTMENTS: | | | | | | | | | | | | | | | | | | | | | | | | |
Investment in affiliates – at equity | | | 8,054,793 | | | | 154,461 | | | | 8,209,254 | | | | 231,779 | | | | 154,461 | | | | 386,240 | |
Decommissioning trust funds | | | 1,051,901 | | | | — | | | | 1,051,901 | | | | 2,453,406 | | | | — | | | | 2,453,406 | |
Non-utility property – at cost | | | | | | | | | | | | | | | | | | | | | | | | |
(less accumulated depreciation) | | | 217,906 | | | | (1 | ) | | | 217,905 | | | | 219,717 | | | | — | | | | 219,717 | |
Other | | | 33,682 | | | | — | | | | 33,682 | | | | 90,992 | | | | — | | | | 90,992 | |
Total | | | 9,358,282 | | | | 154,460 | | | | 9,512,742 | | | | 2,995,894 | | | | 154,461 | | | | 3,150,355 | |
PROPERTY, PLANT AND EQUIPMENT: | | | | | | | | | | | | | | | | | | | | | | | | |
Electric | | | 27,193,633 | | | | (699,072 | ) | | | 26,494,561 | | | | 29,053,340 | | | | (699,072 | ) | | | 28,354,268 | |
Property under capital lease | | | 738,554 | | | | — | | | | 738,554 | | | | 738,554 | | | | — | | | | 738,554 | |
Natural gas | | | 262,787 | | | | (183,728 | ) | | | 79,059 | | | | 262,787 | | | | (183,728 | ) | | | 79,059 | |
Construction work in progress | | | 952,092 | | | | (33,274 | ) | | | 918,818 | | | | 1,197,551 | | | | (33,273 | ) | | | 1,164,278 | |
Nuclear fuel under capital lease | | | 262,469 | | | | — | | | | 262,469 | | | | 262,469 | | | | — | | | | 262,469 | |
Nuclear fuel | | | 34,326 | | | | — | | | | 34,326 | | | | 320,813 | | | | — | | | | 320,813 | |
Total property, plant and equipment | | | 29,443,861 | | | | (916,074 | ) | | | 28,527,787 | | | | 31,835,514 | | | | (916,073 | ) | | | 30,919,441 | |
Less – accumulated depreciation and amortization | | | 12,905,551 | | | | (435,519 | ) | | | 12,470,032 | | | | 13,139,883 | | | | (435,519 | ) | | | 12,704,364 | |
Property, plant and equipment – net | | | 16,538,310 | | | | (480,555 | ) | | | 16,057,755 | | | | 18,695,631 | | | | (480,554 | ) | | | 18,215,077 | |
DEFERRED DEBITS AND OTHER ASSETS: | | | | | | | | | | | | | | | | | | | | | | | | |
Regulatory assets: | | | | | | | | | | | | | | | | | | | | | | | | |
SFAS 109 regulatory asset – net | | | 746,413 | | | | 46,406 | | | | 792,819 | | | | 746,413 | | | | 46,406 | | | | 792,819 | |
Other regulatory assets | | | 1,429,261 | | | | (35,489 | ) | | | 1,393,772 | | | | 1,429,261 | | | | (35,489 | ) | | | 1,393,772 | |
Deferred fuel costs | | | 30,842 | | | | — | | | | 30,842 | | | | 30,842 | | | | — | | | | 30,842 | |
Long-term receivables | | | 39,417 | | | | (2,492 | ) | | | 36,925 | | | | 39,417 | | | | (2,492 | ) | | | 36,925 | |
Goodwill | | | 374,099 | | | | — | | | | 374,099 | | | | 377,172 | | | | — | | | | 377,172 | |
Other | | | 796,166 | | | | (8,884 | ) | | | 787,282 | | | | 918,871 | | | | (8,884 | ) | | | 909,987 | |
Total | | | 3,416,198 | | | | (459 | ) | | | 3,415,739 | | | | 3,541,976 | | | | (459 | ) | | | 3,541,517 | |
TOTAL ASSETS | | $ | 31,748,447 | | | $ | (397,436 | ) | | $ | 31,351,011 | | | $ | 28,332,713 | | | $ | (397,437 | ) | | $ | 27,935,276 | |
| * | Adjustment to reflect deconsolidation of Entergy New Orleans, Inc. |
Totals may not foot due to rounding.
Certain prior year data has been reclassified to conform with current year presentation.
56
REG G RECONCILIATIONS
PRO FORMA FINANCIAL RESULTS (Reflects Deconsolidation of Entergy New Orleans) (unaudited)
RECONCILIATION OF GAAP TO NON-GAAP
2004 PRO FORMA BALANCE SHEET
| | | | | | | | | | | | | | | | | | | | | | |
| | | UTILITY/PARENT/OTHER | | CONSOLIDATED | |
| In thousands, as of December 31, 2004. | | GAAP | | ENOI
Adjustment* | | | Pro Forma | | GAAP | | | ENOI
Adjustment* | | | Pro Forma | |
LIABILITIES AND SHAREHOLDERS’ EQUITY | | | | | | | | | | | | | | | | | | | | | | |
CURRENT LIABILITIES: | | | | | | | | | | | | | | | | | | | | | | |
Currently maturing long-term debt | | $ | 415,266 | | $ | (29,999 | ) | | $ | 385,267 | | $ | 492,564 | | | $ | (30,000 | ) | | $ | 462,564 | |
Notes payable: | | | | | | | | | | | | | | | | | | | | | | |
Associated companies | | | 770,623 | | | 1 | | | | 770,624 | | | — | | | | — | | | | — | |
Other | | | 43 | | | — | | | | 43 | | | 193 | | | | — | | | | 193 | |
Accounts payable: | | | | | | | | | | | | | | | | | | | | | | |
Associated companies | | | 14,781 | | | — | | | | 14,781 | | | — | | | | — | | | | — | |
Other | | | 722,148 | | | (31,926 | ) | | | 690,222 | | | 896,528 | | | | (31,926 | ) | | | 864,602 | |
Customer deposits | | | 222,157 | | | (17,186 | ) | | | 204,971 | | | 222,320 | | | | (17,187 | ) | | | 205,133 | |
Taxes accrued | | | 178,671 | | | (2,592 | ) | | | 176,079 | | | 224,011 | | | | (2,592 | ) | | | 221,419 | |
Interest accrued | | | 142,329 | | | (4,757 | ) | | | 137,572 | | | 144,478 | | | | (4,757 | ) | | | 139,721 | |
Obligations under capital leases | | | 133,847 | | | — | | | | 133,847 | | | 133,847 | | | | — | | | | 133,847 | |
Other | | | 83,478 | | | (10,089 | ) | | | 73,389 | | | 218,442 | | | | (10,088 | ) | | | 208,354 | |
Total | | | 2,683,343 | | | (96,548 | ) | | | 2,586,795 | | | 2,332,383 | | | | (96,550 | ) | | | 2,235,833 | |
NON–CURRENT LIABILITIES: | | | | | | | | | | | | | | | | | | | | | | |
Accumulated deferred income taxes and taxes accrued | | | 5,208,605 | | | (47,062 | ) | | | 5,161,543 | | | 5,070,912 | | | | (47,062 | ) | | | 5,023,850 | |
Accumulated deferred investment tax credits | | | 399,228 | | | (3,997 | ) | | | 395,231 | | | 399,228 | | | | (3,997 | ) | | | 395,231 | |
Obligations under capital leases | | | 146,060 | | | — | | | | 146,060 | | | 146,060 | | | | — | | | | 146,060 | |
Other regulatory liabilities | | | 329,767 | | | — | | | | 329,767 | | | 329,767 | | | | — | | | | 329,767 | |
Decommissioning and retirement cost liabilities | | | 1,327,988 | | | — | | | | 1,327,988 | | | 2,066,277 | | | | — | | | | 2,066,277 | |
Transition to competition | | | 79,101 | | | — | | | | 79,101 | | | 79,101 | | | | — | | | | 79,101 | |
Regulatory reserves | | | 103,061 | | | (233 | ) | | | 102,828 | | | 103,061 | | | | (233 | ) | | | 102,828 | |
Accumulated provisions | | | 346,614 | | | 1,042 | | | | 347,656 | | | 549,914 | | | | 1,042 | | | | 550,956 | |
Long-term debt | | | 6,648,504 | | | (196,647 | ) | | | 6,451,857 | | | 7,016,831 | | | | (196,646 | ) | | | 6,820,185 | |
Preferred stock with sinking fund | | | 17,400 | | | — | | | | 17,400 | | | 17,400 | | | | — | | | | 17,400 | |
Other | | | 1,609,960 | | | (34,213 | ) | | | 1,575,747 | | | 1,554,212 | | | | (34,211 | ) | | | 1,520,001 | |
Total | | | 16,216,288 | | | (281,110 | ) | | | 15,935,178 | | | 17,332,763 | | | | (281,107 | ) | | | 17,051,656 | |
Preferred stock without sinking fund | | | 330,831 | | | (19,780 | ) | | | 311,051 | | | 365,356 | | | | (19,780 | ) | | | 345,576 | |
SHAREHOLDERS’ EQUITY: | | | | | | | | | | | | | | | | | | | | | | |
Common stock, $.01 par value, authorized 500,000,000 shares; issued 248,174,087 shares in 2004 | | | 2,205,191 | | | 1 | | | | 2,205,192 | | | 2,482 | | | | — | | | | 2,482 | |
Paid–in capital | | | 5,940,702 | | | — | | | | 5,940,702 | | | 4,835,375 | | | | — | | | | 4,835,375 | |
Retained earnings | | | 5,919,339 | | | 1 | | | | 5,919,340 | | | 4,989,826 | | | | — | | | | 4,989,826 | |
Accumulated other comprehensive loss | | | 4,772 | | | — | | | | 4,772 | | | (93,453 | ) | | | — | | | | (93,453 | ) |
Less – treasury stock, at cost (31,345,028 shares in 2004) | | | 1,552,019 | | | — | | | | 1,552,019 | | | 1,432,019 | | | | — | | | | 1,432,019 | |
Total | | | 12,517,985 | | | 2 | | | | 12,517,987 | | | 8,302,211 | | | | — | | | | 8,302,211 | |
Commitments and Contingencies | | | | | | | | | | | | | | | | | | | | | | |
TOTAL LIABILITIES AND SHAREHOLDERS’ EQUITY | | $ | 31,748,447 | | $ | (397,436 | ) | | $ | 31,351,011 | | $ | 28,332,713 | | | $ | (397,437 | ) | | $ | 27,935,276 | |
| * | Adjustment to reflect deconsolidation of Entergy New Orleans, Inc. |
| Totals | may not foot due to rounding. |
Certain prior year data has been reclassified to conform with current year presentation.
57
REG G RECONCILIATIONS
PRO FORMA FINANCIAL RESULTS (Reflects Deconsolidation of Entergy New Orleans) (unaudited)
RECONCILIATION OF GAAP TO NON-GAAP
2004 PRO FORMA STATEMENT OF CASH FLOW
| | | | | | | | | | | | |
| | | CONSOLIDATED | |
| In thousands, as of December 31, 2004. | | GAAP | | | ENOI
Adjustment* | | | Pro Forma | |
OPERATING ACTIVITIES: | | | | | | | | | | | | |
Consolidated net income | | $ | 909,524 | | | $ | (965 | ) | | $ | 908,559 | |
Adjustments to reconcile consolidated net income to net cash flow provided by operating activities: | | | | | | | | | | | | |
Reserve for regulatory adjustments | | | 33,533 | | | | 7,363 | | | | 40,896 | |
Other regulatory credits – net | | | (90,611 | ) | | | 4,670 | | | | (85,941 | ) |
Depreciation, amortization, and decommissioning | | | 1,045,122 | | | | (29,657 | ) | | | 1,015,465 | |
Deferred income taxes and investment tax credits | | | 352,094 | | | | (39,782 | ) | | | 312,312 | |
Equity in earnings (loss) of unconsolidated equity affiliates – net of dividends | | | 608,141 | | | | (21,907 | ) | | | 586,234 | |
Provisions for asset impairments and restructuring charges | | | 55,000 | | | | — | | | | 55,000 | |
Changes in working capital: | | | | | | | | | | | | |
Receivables | | | (210,419 | ) | | | 7,757 | | | | (202,662 | ) |
Fuel inventory | | | (16,769 | ) | | | (1,399 | ) | | | (18,168 | ) |
Accounts payable | | | 95,306 | | | | (13,905 | ) | | | 81,401 | |
Taxes accrued | | | (1,581 | ) | | | 13,056 | | | | 11,475 | |
Interest accrued | | | 5,269 | | | | 1,455 | | | | 6,724 | |
Deferred fuel | | | 213,627 | | | | 5,279 | | | | 218,906 | |
Other working capital accounts | | | 41,008 | | | | (2,123 | ) | | | 38,885 | |
Provision for estimated losses and reserves | | | (18,041 | ) | | | 1,863 | | | | (16,178 | ) |
Changes in other regulatory assets | | | 48,626 | | | | 5,380 | | | | 54,006 | |
Other | | | (140,510 | ) | | | 4,539 | | | | (135,971 | ) |
Net cash flow provided by operating activities | | | 2,929,319 | | | | (58,376 | ) | | | 2,870,943 | |
INVESTING ACTIVITIES: | | | | | | | | | | | | |
Construction/capital expenditures | | | (1,410,610 | ) | | | 51,264 | | | | (1,359,346 | ) |
Allowance for equity funds used during construction | | | 39,582 | | | | (1,378 | ) | | | 38,204 | |
Nuclear fuel purchases | | | (238,170 | ) | | | — | | | | (238,170 | ) |
Proceeds from sale/leaseback of nuclear fuel | | | 109,988 | | | | — | | | | 109,988 | |
Proceeds from sale of assets and businesses | | | 75,430 | | | | — | | | | 75,430 | |
Investment in non-utility properties | | | (6,420 | ) | | | — | | | | (6,420 | ) |
Decrease (increase) in other investments | | | 383,498 | | | | — | | | | 383,498 | |
Purchase of other temporary investments | | | (1,629,500 | ) | | | — | | | | (1,629,500 | ) |
Liquidation of other temporary investments | | | 1,676,350 | | | | (606 | ) | | | 1,675,744 | |
Proceeds from nuclear decommissioning trust fund sales | | | 679,466 | | | | — | | | | 679,466 | |
Investment in nuclear decommissioning trust funds | | | (769,273 | ) | | | — | | | | | |
Other regulatory investments | | | (53,566 | ) | | | — | | | | (53,566 | ) |
Net cash flow used in investing activities | | | (1,143,225 | ) | | | 49,280 | | | | (1,093,945 | ) |
FINANCING ACTIVITIES: | | | | | | | | | | | | |
Proceeds from the issuance of: | | | | | | | | | | | | |
Long-term debt | | | 3,653,478 | | | | (72,640 | ) | | | 3,580,838 | |
Common stock and treasury stock | | | 170,237 | | | | — | | | | 170,237 | |
Retirement of long-term debt | | | (4,022,548 | ) | | | 77,487 | | | | (3,945,061 | ) |
Repurchase of common stock | | | (1,017,996 | ) | | | — | | | | (1,017,996 | ) |
Redemption of preferred stock | | | (3,450 | ) | | | — | | | | (3,450 | ) |
Changes in credit line borrowings - net | | | (154 | ) | | | — | | | | (154 | ) |
Dividends paid: | | | | | | | | | | | | |
Common stock | | | (427,901 | ) | | | — | | | | (427,901 | ) |
Preferred stock | | | (23,525 | ) | | | 965 | | | | (22,560 | ) |
Net cash flow used in financing activities | | | (1,671,859 | ) | | | 5,812 | | | | (1,666,047 | ) |
Effect of exchange rates on cash and cash equivalents | | | (1,882 | ) | | | — | | | | (1,882 | ) |
Net increase (decrease) in cash and cash equivalents | | | 112,353 | | | | (3,284 | ) | | | 109,069 | |
Cash and cash equivalents at beginning of period | | | 507,433 | | | | (4,670 | ) | | | 502,763 | |
Cash and cash equivalents at end of period | | $ | 619,786 | | | $ | (7,954 | ) | | $ | 611,832 | |
SUPPLEMENTAL DISCLOSURE OF CASH FLOW INFORMATION: | | | | | | | | | | | | |
Cash paid (received) during the period for: | | | | | | | | | | | | |
Interest - net of amount capitalized | | $ | 477,768 | | | $ | (16,172 | ) | | $ | 461,596 | |
Income taxes | | $ | 28,241 | | | $ | 5,736 | | | $ | 33,977 | |
| * | Adjustment to reflect deconsolidation of Entergy New Orleans, Inc. |
Totals may not foot due to rounding.
Certain prior year data has been reclassified to conform with current year presentation.
58
REG G RECONCILIATIONS
CONSOLIDATED FINANCIAL MEASURES – RECONCILIATION OF GAAP TO NON-GAAP MEASURES 2002-2006
| | | | | | | | | | | | | |
| ($ millions) | | 2006(a) | | 2005(a) | | | 2004 | | 2003 | | | 2002 | |
As-Reported earnings (A) | | 1,133 | | 898 | | | 910 | | 927 | | | 599 | |
Preferred dividends | | 28 | | 25 | | | 24 | | 24 | | | 24 | |
Tax-effected interest expense | | 339 | | 293 | | | 295 | | 311 | | | 353 | |
As-Reported earnings including preferred dividends and tax-effected interest expense (B) | | 1,499 | | 1,217 | | | 1,228 | | 1,262 | | | 976 | |
Special items (C) | | 135 | | (45 | ) | | 30 | | (55 | ) | | (267 | ) |
Operational earnings including preferred dividends and tax-effected interest expense (B-C) | | 1,364 | | 1,262 | | | 1,198 | | 1,317 | | | 1,243 | |
Operational earnings (A-C) | | 998 | | 943 | | | 880 | | 982 | | | 866 | |
Average invested capital (D) | | 17,688 | | 16,850 | | | 16,845 | | 17,114 | | | 16,862 | |
Average common equity (E) | | 7,970 | | 8,020 | | | 8,500 | | 8,271 | | | 7,647 | |
Operating revenues (F) | | 10,932 | | 10,106 | | | 9,686 | | 9,033 | | | 8,299 | |
Gross debt (G) | | 9,356 | | 9,288 | | | 7,807 | | 8,182 | | | 8,810 | |
Less cash and cash equivalents (H) | | 1,016 | | 583 | | | 620 | | 507 | | | 1,335 | |
Net debt (G-H) | | 8,340 | | 8,705 | | | 7,187 | | 7,675 | | | 7,475 | |
Total capitalization (I) | | 17,899 | | 17,477 | | | 16,469 | | 17,220 | | | 17,007 | |
Less cash and cash equivalents (J) | | 1,016 | | 583 | | | 620 | | 507 | | | 1,335 | |
Net capitalization (I-J) | | 16,883 | | 16,894 | | | 15,849 | | 16,713 | | | 15,672 | |
Off-balance sheet liabilities (K) | | 665 | | 778 | | | 769 | | 915 | | | 804 | |
Revolver capacity (L) | | 2,770 | | 2,545 | | | 1,490 | | 1,553 | | | 1,018 | |
Gross liquidity (H+L) | | 3,786 | | 3,128 | | | 2,110 | | 2,060 | | | 2,353 | |
($ per share) | | | | | | | | | | | | | |
As-Reported earnings per share (M) | | 5.36 | | 4.19 | | | 3.93 | | 4.01 | | | 2.64 | |
Operational earnings per share (N) | | 4.72 | | 4.40 | | | 3.80 | | 4.25 | | | 3.81 | |
Common dividend paid per share (O) | | 2.16 | | 2.16 | | | 1.89 | | 1.60 | | | 1.34 | |
Year-end closing market price per share of common stock (P) | | 92.32 | | 68.65 | | | 67.59 | | 57.13 | | | 45.59 | |
(%) | | | | | | | | | | | | | |
Return on average invested capital – As-Reported (B/D) | | 8.5 | | 7.2 | | | 7.3 | | 7.4 | | | 5.8 | |
Return on average invested capital – Operational ((B-C)/D) | | 7.7 | | 7.5 | | | 7.1 | | 7.7 | | | 7.4 | |
Return on average common equity – As-Reported (A/E) | | 14.2 | | 11.2 | | | 10.7 | | 11.2 | | | 7.8 | |
Return on average common equity – Operational ((A-C)/E) | | 12.5 | | 11.8 | | | 10.4 | | 11.9 | | | 11.3 | |
Net margin – As-Reported (A/F) | | 10.4 | | 8.9 | | | 9.4 | | 10.3 | | | 7.2 | |
Net margin – Operational ((A-C)/F) | | 9.1 | | 9.3 | | | 9.1 | | 10.9 | | | 10.4 | |
Debt to capital ratio (G/I) | | 52.3 | | 53.1 | | | 47.4 | | 47.5 | | | 51.8 | |
Net debt to net capital ratio ((G-H)/(I-J)) | | 49.4 | | 51.5 | | | 45.3 | | 45.9 | | | 47.7 | |
Net debt to net capital ratio including off-balance sheet liabilities ((G-H+K)/(I-J+K)) | | 51.3 | | 53.7 | | | 47.9 | | 48.7 | | | 50.3 | |
Common dividend payout ratio – As-Reported (O/M) | | 40 | | 52 | | | 48 | | 40 | | | 51 | |
Common dividend payout ratio – Operational (O/N) | | 46 | | 49 | | | 50 | | 38 | | | 35 | |
(ratio) | | | | | | | | | | | | | |
Price to earnings ratio – As-Reported (P/M) | | 17.24 | | 16.39 | | | 17.18 | | 14.25 | | | 17.29 | |
Price to earnings ratio – Operational (P/N) | | 19.56 | | 15.61 | | | 17.77 | | 13.45 | | | 11.96 | |
(a) | 2006and 2005 reflect deconsolidation of Entergy New Orleans, Inc. |
Calculations may differ due to rounding.
59
REG G RECONCILIATIONS
CONSOLIDATED FINANCIAL MEASURES – RECONCILIATION OF GAAP TO NON-GAAP MEASURES 1Q05-4Q06
| | | | | | | | | | | | | | | | | | | | | | | | |
| ($ millions) | | 1Q05(a) | | | 2Q05(a) | | | 3Q05(a) | | | 4Q05(a) | | | 1Q06(a) | | | 2Q06(a) | | | 3Q06(a) | | | 4Q06(a) | |
For the quarter: | | | | | | | | | | | | | | | | | | | | | | | | |
As-Reported earnings (A) | | 172.0 | | | 286.2 | | | 350.0 | | | 90.2 | | | 193.6 | | | 281.8 | | | 388.9 | | | 268.3 | |
Less special items (B) | | (1.4 | ) | | (2.8 | ) | | (7.1 | ) | | (33.4 | ) | | 3.4 | | | 23.8 | | | 6.3 | | | 101.4 | |
Operational earnings (A-B) | | 173.4 | | | 289.0 | | | 357.1 | | | 123.6 | | | 190.2 | | | 258.0 | | | 382.6 | | | 166.9 | |
As-Reported earnings trailing 12 months (C) | | 874 | | | 895 | | | 963 | | | 898 | | | 920 | | | 916 | | | 955 | | | 1,133 | |
Preferred dividends | | 23 | | | 24 | | | 25 | | | 25 | | | 27 | | | 28 | | | 29 | | | 28 | |
Tax-effected interest expense | | 282 | | | 278 | | | 287 | | | 293 | | | 304 | | | 316 | | | 324 | | | 339 | |
As-Reported earnings, trailing 12 months including preferred dividends and tax-effected interest expense (D) | | 1,180 | | | 1,197 | | | 1,275 | | | 1,217 | | | 1,251 | | | 1,260 | | | 1,308 | | | 1,499 | |
Special items in prior quarters | | 15 | | | — | | | 37 | | | (11 | ) | | (43 | ) | | (37 | ) | | (6 | ) | | 33 | |
Special items 1Q05 through 4Q06 | | | | | | | | | | | | | | | | | | | | | | | | |
Utility/Parent/Other | | | | | | | | | | | | | | | | | | | | | | | | |
ENOI results | | — | | | — | | | — | | | — | | | 6 | | | 11 | | | 7 | | | (20 | ) |
Entergy-Koch, LP gain | | — | | | — | | | — | | | — | | | — | | | — | | | — | | | 55 | |
Retail business impairment reserve | | — | | | — | | | — | | | (26 | ) | | — | | | — | | | — | | | — | |
Retail business retail discontinued operations | | (1 | ) | | (3 | ) | | (7 | ) | | (8 | ) | | (2 | ) | | 13 | | | (1 | ) | | (10 | ) |
Restructuring-Entergy-Koch, LP distribution | | — | | | — | | | — | | | — | | | — | | | — | | | — | | | 104 | |
Energy Commodity Services | | | | | | | | | | | | | | | | | | | | | | | | |
Non-Nuclear Wholesale Assets write-off of tax capital losses | | — | | | — | | | — | | | — | | | — | | | — | | | — | | | (28 | ) |
Total special items (E) | | 13 | | | (2 | ) | | 30 | | | (45 | ) | | (40 | ) | | (13 | ) | | — | | | 135 | |
Operational earnings, trailing 12 months including preferred dividends and tax-effected interest expense (D-E) | | 1,166 | | | 1,199 | | | 1,245 | | | 1,262 | | | 1,291 | | | 1,273 | | | 1,308 | | | 1,364 | |
Operational earnings, trailing 12 months (C-E) | | 861 | | | 898 | | | 933 | | | 943 | | | 960 | | | 929 | | | 955 | | | 998 | |
Average invested capital (F) | | 16,825 | | | 16,806 | | | 17,033 | | | 16,850 | | | 17,140 | | | 17,283 | | | 17,514 | | | 17,688 | |
Average common equity (G) | | 8,452 | | | 8,347 | | | 8,350 | | | 8,020 | | | 8,026 | | | 8,080 | | | 8,208 | | | 7,970 | |
Operating revenues, trailing 12 months (H) | | 9,289 | | | 9,465 | | | 9,661 | | | 10,106 | | | 10,564 | | | 10,747 | | | 11,104 | | | 10,932 | |
Gross debt (I) | | 8,033 | | | 8,283 | | | 8,865 | | | 9,288 | | | 9,329 | | | 9,402 | | | 9,054 | | | 9,356 | |
Less cash and cash equivalents (J) | | 477 | | | 607 | | | 598 | | | 583 | | | 752 | | | 729 | | | 745 | | | 1,016 | |
Net debt (I-J) | | 7,556 | | | 7,676 | | | 8,267 | | | 8,705 | | | 8,576 | | | 8,673 | | | 8,309 | | | 8,340 | |
Total capitalization (K) | | 16,393 | | | 16,609 | | | 17,070 | | | 17,477 | | | 17,888 | | | 17,956 | | | 17,957 | | | 17,899 | |
Less cash and cash equivalents (L) | | 477 | | | 607 | | | 598 | | | 583 | | | 752 | | | 729 | | | 745 | | | 1,016 | |
Net capital (K-L) | | 15,916 | | | 16,002 | | | 16,472 | | | 16,894 | | | 17,135 | | | 17,227 | | | 17,212 | | | 16,883 | |
Off-balance sheet liabilities (M) | | 771 | | | 780 | | | 779 | | | 778 | | | 732 | | | 671 | | | 668 | | | 665 | |
Revolver capacity (N) | | 1,070 | | | 1,407 | | | 791 | | | 2,545 | | | 2,718 | | | 2,710 | | | 3,095 | | | 2,770 | |
Gross liquidity (J+N) | | 1,547 | | | 2,014 | | | 1,389 | | | 3,128 | | | 3,470 | | | 3,439 | | | 3,840 | | | 3,786 | |
(%) | | | | | | | | | | | | | | | | | | | | | | | | |
Return on average invested capital – As-Reported (D/F) | | 7.0 | | | 7.1 | | | 7.5 | | | 7.2 | | | 7.3 | | | 7.3 | | | 7.5 | | | 8.5 | |
Return on average invested capital – Operational ((D-E)/F) | | 6.9 | | | 7.2 | | | 7.3 | | | 7.5 | | | 7.5 | | | 7.4 | | | 7.5 | | | 7.7 | |
Return on average common equity – As-Reported (C/G) | | 10.3 | | | 10.7 | | | 11.5 | | | 11.2 | | | 11.5 | | | 11.3 | | | 11.6 | | | 14.2 | |
Return on average common equity – Operational ((C-E)/G) | | 10.2 | | | 10.8 | | | 11.2 | | | 11.8 | | | 12.0 | | | 11.5 | | | 11.6 | | | 12.5 | |
Net margin – As-Reported (C/H) | | 9.4 | | | 9.5 | | | 10.0 | | | 8.9 | | | 8.7 | | | 8.5 | | | 8.6 | | | 10.4 | |
Net margin – Operational ((C-E)/H) | | 9.3 | | | 9.5 | | | 9.7 | | | 9.3 | | | 9.1 | | | 8.6 | | | 8.6 | | | 9.1 | |
Debt to capital ratio (I/K) | | 49.0 | | | 49.9 | | | 51.9 | | | 53.1 | | | 52.1 | | | 52.4 | | | 50.4 | | | 52.3 | |
Net debt to net capital ratio ((I-J)/(K-L)) | | 47.5 | | | 48.0 | | | 50.2 | | | 51.5 | | | 50.0 | | | 50.4 | | | 48.3 | | | 49.4 | |
Net debt to net capital including off-balancesheet liabilities ((I-J+M)/(K-L+M)) | | 49.9 | | | 50.4 | | | 52.4 | | | 53.7 | | | 52.1 | | | 52.2 | | | 50.2 | | | 51.3 | |
(a) | 2006 and 2005 reflect deconsolidation of Entergy New Orleans, Inc. |
Calculations may differ due to rounding.
60
REG G RECONCILIATIONS
UTILITY FINANCIAL MEASURES – RECONCILIATION OF GAAP TO NON-GAAP MEASURES 2002-2006
| | | | | | | | | | | |
| ($ millions) | | 2006(a) | | 2005(a) | | 2004 | | 2003 | | | 2002 |
As-Reported earnings (A) | | 691.2 | | 659.8 | | 643.4 | | 469.1 | | | 583.2 |
Preferred dividends | | 24.4 | | 22.0 | | 23.3 | | 23.5 | | | 23.7 |
Tax-effected interest expense | | 246.8 | | 224.0 | | 235.9 | | 258.1 | | | 286.9 |
As-Reported earnings including preferred dividends and tax-effected interest expense (B) | | 962.3 | | 905.8 | | 902.6 | | 750.7 | | | 893.8 |
Utility special items | | | | | | | | | | | |
ENOI results | | 4.1 | | — | | — | | — | | | — |
River Bend loss provision | | — | | — | | — | | (65.6 | ) | | — |
SFAS 143 implementation | | — | | — | | — | | (21.3 | ) | | — |
Voluntary severance plan | | — | | — | | — | | (70.1 | ) | | — |
Total special items (C) | | 4.1 | | — | | — | | (157.0 | ) | | — |
Operational earnings including preferred dividends and tax-effected interest expense (B-C) | | 958.2 | | 905.8 | | 902.6 | | 907.7 | | | 893.8 |
Operational earnings (A-C) | | 687.1 | | 659.8 | | 643.4 | | 626.1 | | | 583.2 |
Average invested capital (D) | | 13,254 | | 12,738 | | 12,514 | | 12,796 | | | 12,992 |
Average common equity (E) | | 6,132 | | 5,786 | | 5,539 | | 5,422 | | | 5,470 |
Gross debt (G) | | 6,786 | | 6,990 | | 6,394 | | 6,851 | | | 7,178 |
Less cash and cash equivalents (H) | | 564 | | 301 | | 586 | | 401 | | | 1,088 |
Net debt (G-H) | | 6,222 | | 6,689 | | 5,808 | | 6,450 | | | 6,090 |
Total capitalization (I) | | 13,266 | | 13,502 | | 12,375 | | 12,653 | | | 12,940 |
Less cash and cash equivalents (J) | | 564 | | 301 | | 586 | | 401 | | | 1,088 |
Net capitalization (I-J) | | 12,702 | | 13,201 | | 11,789 | | 12,252 | | | 11,852 |
(%) | | | | | | | | | | | |
Return on average invested capital – As-Reported (B/D) | | 7.2 | | 7.1 | | 7.2 | | 5.9 | | | 6.9 |
Return on average invested capital – Operational ((B-C)/D) | | 7.2 | | 7.1 | | 7.2 | | 7.1 | | | 6.9 |
Return on average common equity – As-Reported (A/E) | | 11.3 | | 11.4 | | 11.6 | | 8.7 | | | 10.7 |
Return on average common equity – Operational ((A-C)/E) | | 11.2 | | 11.4 | | 11.6 | | 11.5 | | | 10.7 |
Debt to capital ratio (G/I) | | 51.3 | | 51.8 | | 51.7 | | 54.1 | | | 55.5 |
Net debt to net capital ratio ((G-H)/(I-J)) | | 49.1 | | 50.7 | | 49.3 | | 52.6 | | | 51.4 |
(a) | 2006 and 2005reflect deconsolidation of Entergy New Orleans, Inc. |
Calculations may differ due to rounding.
61
REG G RECONCILIATIONS
UTILITY FINANCIAL MEASURES – RECONCILIATION OF GAAP TO NON-GAAP MEASURES 1Q05-4Q06
| | | | | | | | | | | | | | | | | | | | |
| ($ millions) | | 1Q05(a) | | 2Q05(a) | | 3Q05(a) | | 4Q05(a) | | 1Q06(a) | | | 2Q06(a) | | | 3Q06(a) | | | 4Q06(a) | |
As-Reported earnings (A) | | 90.5 | | 211.7 | | 298.9 | | 58.7 | | 119.8 | | | 199.6 | | | 290.0 | | | 81.8 | |
Less special items (B) | | — | | — | | — | | — | | 5.6 | | | 10.6 | | | 7.3 | | | (19.6 | ) |
Operational earnings (A-B) | | 90.5 | | 211.7 | | 298.9 | | 58.7 | | 114.1 | | | 188.9 | | | 282.7 | | | 101.4 | |
As-Reported earnings-trailing 12 months (C) | | 618.2 | | 635.0 | | 675.8 | | 659.8 | | 689.0 | | | 676.9 | | | 668.1 | | | 691.2 | |
Preferred dividends | | 23.2 | | 23.2 | | 22.9 | | 22.0 | | 23.7 | | | 25.0 | | | 25.4 | | | 24.4 | |
Tax-effected interest expense | | 221.5 | | 217.3 | | 227.8 | | 224.0 | | 226.0 | | | 232.3 | | | 229.2 | | | 246.8 | |
As-Reported earnings, trailing 12 months including preferred dividends and tax-effected interest expense (D) | | 862.9 | | 875.5 | | 926.5 | | 905.8 | | 938.7 | | | 934.2 | | | 922.7 | | | 962.3 | |
Special items in prior quarters | | — | | — | | — | | — | | (4.7 | ) | | (7.2 | ) | | (2.9 | ) | | 23.7 | |
Special items 1Q05 through 4Q06 | | — | | — | | — | | — | | 5.6 | | | 10.7 | | | 7.3 | | | (19.6 | ) |
Total special items (E) | | — | | — | | — | | — | | 0.9 | | | 3.5 | | | 4.4 | | | 4.1 | |
Operational earnings, trailing 12 months including preferred dividends and tax-effected interest expense (D-E) | | 862.9 | | 875.5 | | 926.5 | | 905.8 | | 937.8 | | | 930.7 | | | 918.3 | | | 958.2 | |
Operational earnings, trailing 12 months (C-E) | | 618.2 | | 635.0 | | 675.8 | | 659.8 | | 688.1 | | | 673.4 | | | 663.7 | | | 687.1 | |
Average invested capital (F) | | 12,187 | | 12,208 | | 12,340 | | 12,738 | | 12,723 | | | 12,782 | | | 12,946 | | | 13,254 | |
Average common equity (G) | | 5,441 | | 5,536 | | 5,631 | | 5,786 | | 5,833 | | | 5,906 | | | 6,023 | | | 6,132 | |
Gross debt (H) | | 6,228 | | 6,300 | | 6,456 | | 6,990 | | 6,749 | | | 6,793 | | | 6,763 | | | 6,786 | |
Less cash and cash equivalents (I) | | 694 | | 381 | | 186 | | 301 | | 354 | | | 278 | | | 276 | | | 564 | |
Net debt (H-I) | | 5,534 | | 5,919 | | 6,270 | | 6,689 | | 6,396 | | | 6,514 | | | 6,488 | | | 6,222 | |
Total capitalization (J) | | 12,048 | | 12,252 | | 12,536 | | 13,502 | | 13,399 | | | 13,311 | | | 13,356 | | | 13,266 | |
Less cash and cash equivalents (K) | | 694 | | 381 | | 186 | | 301 | | 354 | | | 278 | | | 276 | | | 564 | |
Net capital (J-K) | | 11,354 | | 11,871 | | 12,350 | | 13,201 | | 13,046 | | | 13,033 | | | 13,080 | | | 12,702 | |
(%) | | | | | | | | | | | | | | | | | | | | |
Return on average invested capital – As-Reported (D/F) | | 7.1 | | 7.2 | | 7.5 | | 7.1 | | 7.4 | | | 7.3 | | | 7.1 | | | 7.2 | |
Return on average invested capital – Operational ((D-E)/F) | | 7.1 | | 7.2 | | 7.5 | | 7.1 | | 7.4 | | | 7.3 | | | 7.1 | | | 7.2 | |
Return on average common equity – As-Reported (C/G) | | 11.4 | | 11.5 | | 12.0 | | 11.4 | | 11.8 | | | 11.5 | | | 11.1 | | | 11.3 | |
Return on average common equity – Operational ((C-E)/G) | | 11.4 | | 11.5 | | 12.0 | | 11.4 | | 11.8 | | | 11.4 | | | 11.0 | | | 11.2 | |
Debt to capital ratio (H/J) | | 51.7 | | 51.4 | | 51.5 | | 51.8 | | 50.4 | | | 51.0 | | | 50.6 | | | 51.3 | |
Net debt to net capital ratio ((H-I)/(J-K)) | | 48.7 | | 49.9 | | 50.8 | | 50.7 | | 49.0 | | | 50.0 | | | 49.6 | | | 49.1 | |
(a) | 2006and 2005 reflect deconsolidation of Entergy New Orleans, Inc. |
| Calculations | may differ due to rounding. |
62
REG G RECONCILIATIONS
ENTERGY ARKANSAS FINANCIAL MEASURES – RECONCILIATION OF GAAP TO NON-GAAP MEASURES
2002-2006
| | | | | | | | | | | |
| ($ millions) | | 2006 | | 2005 | | 2004 | | 2003 | | | 2002 |
As-Reported earnings (A) | | 165.6 | | 166.9 | | 134.4 | | 118.2 | | | 127.9 |
Preferred dividends | | 7.6 | | 7.8 | | 7.8 | | 7.8 | | | 7.8 |
Tax-effected interest expense | | 50.8 | | 47.1 | | 48.1 | | 51.4 | | | 60.7 |
As-Reported earnings including preferred dividends and tax-effected interest expense (B) | | 224.0 | | 221.8 | | 190.3 | | 177.4 | | | 196.4 |
Special items | | | | | | | | | | | |
Voluntary severance plan | | — | | — | | — | | (28.4 | ) | | — |
Merger Expenses | | — | | — | | — | | — | | | — |
Total special items (C) | | — | | — | | — | | (28.4 | ) | | — |
Operational earnings including preferred dividends and tax-effected interest expense (B-C) | | 224.0 | | 221.8 | | 190.3 | | 205.8 | | | 196.4 |
Operational earnings (A-C) | | 165.6 | | 166.9 | | 134.4 | | 146.6 | | | 127.9 |
Average invested capital (D) | | 2,967 | | 2,920 | | 2,877 | | 2,883 | | | 2,903 |
Average common equity (E) | | 1,432 | | 1,378 | | 1,303 | | 1,254 | | | 1,229 |
Gross debt (F) | | 1,436 | | 1,400 | | 1,450 | | 1,465 | | | 1,560 |
Less cash and cash equivalents (G) | | 35 | | 9 | | 90 | | 9 | | | 96 |
Net debt (F-G) | | 1,401 | | 1,391 | | 1,360 | | 1,456 | | | 1,464 |
Total capitalization (H) | | 2,987 | | 2,946 | | 2,894 | | 2,860 | | | 2,906 |
Less cash and cash equivalents (I) | | 35 | | 9 | | 90 | | 9 | | | 96 |
Net capitalization (H-I) | | 2,952 | | 2,937 | | 2,804 | | 2,851 | | | 2,810 |
(%) | | | | | | | | | | | |
Return on average invested capital - As-Reported (B/D) | | 7.6 | | 7.6 | | 6.6 | | 6.2 | | | 6.8 |
Return on average invested capital - Operational ((B-C)/D) | | 7.6 | | 7.6 | | 6.6 | | 7.1 | | | 6.8 |
Return on average common equity - As-Reported (A/E) | | 11.6 | | 12.1 | | 10.3 | | 9.4 | | | 10.4 |
Return on average common equity - Operational ((A-C)/E) | | 11.6 | | 12.1 | | 10.3 | | 11.7 | | | 10.4 |
Debt to capital ratio (F/H) | | 48.1 | | 47.5 | | 50.1 | | 51.2 | | | 53.7 |
Net debt to net capital ratio ((F-G)/(H-I)) | | 47.5 | | 47.4 | | 48.5 | | 51.1 | | | 52.1 |
ENTERGY GULF STATES FINANCIAL MEASURES – RECONCILIATION OF GAAP TO NON-GAAP MEASURES
2002-2006
| | | | | | | | | | | |
| ($ millions) | | 2006 | | 2005 | | 2004 | | 2003 | | | 2002 |
As-Reported earnings (A) | | 208.0 | | 202.3 | | 187.8 | | 37.9 | | | 169.2 |
Preferred dividends | | 4.0 | | 4.2 | | 4.5 | | 4.7 | | | 4.9 |
Tax-effected interest expense | | 88.0 | | 71.2 | | 76.3 | | 88.7 | | | 83.2 |
As-Reported earnings including preferred dividends and tax-effected interest expense (B) | | 300.0 | | 277.7 | | 268.6 | | 131.3 | | | 257.3 |
Special items | | | | | | | | | | | |
River Bend loss provision | | — | | — | | — | | (65.6 | ) | | — |
SFAS 143 implementation | | — | | — | | — | | (21.3 | ) | | — |
Voluntary severance plan | | — | | — | | — | | (15.5 | ) | | — |
Merger expenses | | — | | — | | — | | — | | | — |
Total special items (C) | | — | | — | | — | | (102.4 | ) | | — |
Operational earnings including preferred dividends and tax-effected interest expense (B-C) | | 300.0 | | 277.7 | | 268.6 | | 233.7 | | | 257.3 |
Operational earnings (A-C) | | 208.0 | | 202.3 | | 187.8 | | 140.3 | | | 169.2 |
Average invested capital (D) | | 4,699 | | 4,304 | | 4,046 | | 4,190 | | | 4,102 |
Average common equity (E) | | 2,217 | | 2,005 | | 1,740 | | 1,710 | | | 1,684 |
Gross debt (F) | | 2,442 | | 2,426 | | 2,078 | | 2,439 | | | 2,401 |
Less cash and cash equivalents (G) | | 180 | | 25 | | 7 | | 206 | | | 318 |
Net debt (F-G) | | 2,262 | | 2,401 | | 2,071 | | 2,233 | | | 2,083 |
Total capitalization (H) | | 4,695 | | 4,697 | | 3,911 | | 4,182 | | | 4,198 |
Less cash and cash equivalents (I) | | 180 | | 25 | | 7 | | 206 | | | 318 |
Net capitalization (H-I) | | 4,515 | | 4,672 | | 3,904 | | 3,976 | | | 3,880 |
(%) | | | | | | | | | | | |
Return on average invested capital - As-Reported (B/D) | | 6.4 | | 6.5 | | 6.6 | | 3.1 | | | 6.3 |
Return on average invested capital - Operational ((B-C)/D) | | 6.4 | | 6.5 | | 6.6 | | 5.6 | | | 6.3 |
Return on average common equity - As-Reported (A/E) | | 9.4 | | 10.1 | | 10.8 | | 2.2 | | | 10.0 |
Return on average common equity - Operational ((A-C)/E) | | 9.4 | | 10.1 | | 10.8 | | 8.2 | | | 10.0 |
Debt to capital ratio (F/H) | | 52.0 | | 51.7 | | 53.1 | | 58.3 | | | 57.2 |
Net debt to net capital ratio ((F-G)/(H-I)) | | 50.1 | | 51.4 | | 53.0 | | 56.2 | | | 53.7 |
Calculations may differ due to rounding.
63
REG G RECONCILIATIONS
ENTERGY LOUISIANA FINANCIAL MEASURES – RECONCILIATION OF GAAP TO NON-GAAP MEASURES 2002-2006
| | | | | | | | | | | |
| ($ millions) | | 2006 | | 2005 | | 2004 | | 2003 | | | 2002 |
As-Reported earnings (A) | | 130.7 | | 128.1 | | 127.5 | | 146.1 | | | 144.7 |
Preferred dividends | | 7.0 | | – | | – | | – | | | – |
Tax-effected interest expense | | 50.5 | | 48.6 | | 42.7 | | 43.9 | | | 59.6 |
As-Reported earnings including preferred dividends and tax-effected interest expense (B) | | 188.2 | | 176.6 | | 170.2 | | 190.0 | | | 204.3 |
Special items | | | | | | | | | | | |
Voluntary severance plan | | – | | – | | – | | (12.6 | ) | | – |
Merger expenses | | – | | – | | – | | – | | | – |
Regulatory and reserve adjustments | | – | | – | | – | | – | | | – |
Total special items (C) | | – | | – | | – | | (12.6 | ) | | – |
Operational earnings including preferred dividends and tax-effected interest expense (B-C) | | 188.2 | | 176.6 | | 170.2 | | 202.6 | | | 204.3 |
Operational earnings (A-C) | | 130.7 | | 128.1 | | 127.5 | | 158.7 | | | 144.7 |
Average invested capital (D) | | 2,562 | | 2,263 | | 2,020 | | 2,130 | | | 2,418 |
Average members’ equity (E) | | 1,212 | | 1,069 | | 1,027 | | 1,021 | | | 1,124 |
Gross debt (F) | | 1,230 | | 1,271 | | 1,017 | | 968 | | | 1,250 |
Less cash and cash equivalents (G) | | 3 | | 105 | | 146 | | 9 | | | 312 |
Net debt (F-G) | | 1,227 | | 1,166 | | 871 | | 959 | | | 938 |
Total capitalization (H) | | 2,648 | | 2,476 | | 2,050 | | 1,989 | | | 2,271 |
Less cash and cash equivalents (I) | | 3 | | 105 | | 146 | | 9 | | | 312 |
Net capitalization (H-I) | | 2,645 | | 2,371 | | 1,904 | | 1,980 | | | 1,959 |
(%) | | | | | | | | | | | |
Return on average invested capital – As-Reported (B/D) | | 7.3 | | 7.8 | | 8.4 | | 8.9 | | | 8.5 |
Return on average invested capital– Operational ((B-C)/D) | | 7.3 | | 7.8 | | 8.4 | | 9.5 | | | 8.5 |
Return on average members’ equity – As-Reported (A/E) | | 10.8 | | 12.0 | | 12.4 | | 14.3 | | | 12.9 |
Return on average members’ equity – Operational ((A-C)/E) | | 10.8 | | 12.0 | | 12.4 | | 15.5 | | | 12.9 |
Debt to capital ratio (F/H) | | 46.4 | | 51.3 | | 49.6 | | 48.6 | | | 55.0 |
Net debt to net capital ratio ((F-G)/(H-I)) | | 46.4 | | 49.2 | | 45.8 | | 48.4 | | | 47.9 |
ENTERGY MISSISSIPPI FINANCIAL MEASURES – RECONCILIATION OF GAAP TO NON-GAAP MEASURES
2002-2006
| | | | | | | | | | | |
| ($ millions) | | 2006 | | 2005 | | 2004 | | 2003 | | | 2002 |
As-Reported earnings (A) | | 49.5 | | 58.8 | | 70.1 | | 63.7 | | | 49.0 |
Preferred dividends | | 2.8 | | 3.3 | | 3.4 | | 3.4 | | | 3.4 |
Tax-effected interest expense | | 29.9 | | 25.3 | | 25.6 | | 26.8 | | | 25.9 |
As-Reported earnings including preferred dividends and tax-effected interest expense (B) | | 82.2 | | 87.4 | | 99.1 | | 93.9 | | | 78.3 |
Special items | | | | | | | | | | | |
Voluntary severance plan | | – | | – | | – | | (4.5 | ) | | – |
Merger expenses | | – | | – | | – | | – | | | – |
Total special items (C) | | – | | – | | – | | (4.5 | ) | | – |
Operational earnings including preferred dividends and tax-effected interest expense (B-C) | | 82.2 | | 87.4 | | 99.1 | | 98.4 | | | 78.3 |
Operational earnings (A-C) | | 49.5 | | 58.8 | | 70.1 | | 68.2 | | | 49.0 |
Average invested capital (D) | | 1,391 | | 1,301 | | 1,289 | | 1,296 | | | 1,232 |
Average common equity (E) | | 595 | | 555 | | 526 | | 498 | | | 471 |
Gross debt (F) | | 795 | | 695 | | 695 | | 730 | | | 765 |
Less cash and cash equivalents (G) | | 73 | | 5 | | 80 | | 64 | | | 148 |
Net debt (F-G) | | 722 | | 690 | | 615 | | 666 | | | 617 |
Total capitalization (H) | | 1,463 | | 1,319 | | 1,283 | | 1,295 | | | 1,298 |
Less cash and cash equivalents (I) | | 73 | | 5 | | 80 | | 64 | | | 148 |
Net capitalization (H-I) | | 1,390 | | 1,314 | | 1,203 | | 1,231 | | | 1,150 |
(%) | | | | | | | | | | | |
Return on average invested capital – As-Reported (B/D) | | 5.9 | | 6.7 | | 7.7 | | 7.2 | | | 6.4 |
Return on average invested capital – Operational ((B-C)/D) | | 5.9 | | 6.7 | | 7.7 | | 7.6 | | | 6.4 |
Return on average common equity – As-Reported (A/E) | | 8.3 | | 10.6 | | 13.3 | | 12.8 | | | 10.4 |
Return on average common equity – Operational ((A-C)/E) | | 8.3 | | 10.6 | | 13.3 | | 13.7 | | | 10.4 |
Debt to capital ratio (F/H) | | 54.3 | | 52.7 | | 54.2 | | 56.4 | | | 59.0 |
Net debt to net capital ratio ((F-G)/(H-I)) | | 51.9 | | 52.6 | | 51.1 | | 54.1 | | | 53.7 |
Calculations may differ due to rounding.
64
REG G RECONCILIATIONS
ENTERGY NEW ORLEANS FINANCIAL MEASURES – RECONCILIATION OF GAAP TO NON-GAAP MEASURES 2002-2006
| | | | | | | | | | | | |
| ($ millions) | | 2006 | | 2005 | | 2004 | | 2003 | | | 2002 | |
As-Reported earnings (A) | | 4.1 | | 0.8 | | 27.1 | | 6.9 | | | (1.2 | ) |
Preferred dividends | | 1.3 | | 0.5 | | 1.0 | | 1.0 | | | 1.0 | |
Tax-effected interest expense | | 10.4 | | 6.7 | | 9.5 | | 9.6 | | | 13.0 | |
As-Reported earnings including preferred dividends and tax-effected interest expense (B) | | 15.8 | | 8.0 | | 37.6 | | 17.5 | | | 12.8 | |
Special items | | | | | | | | | | | | |
Voluntary severance plan | | — | | — | | — | | (3.0 | ) | | — | |
Merger expenses | | — | | — | | — | | — | | | — | |
Total special items (C) | | — | | — | | — | | (3.0 | ) | | — | |
Operational earnings including preferred dividends and tax-effected interest expense (B-C) | | 15.8 | | 8.0 | | 37.6 | | 20.5 | | | 12.8 | |
Operational earnings (A-C) | | 4.1 | | 0.8 | | 27.1 | | 9.9 | | | (1.2 | ) |
Average invested capital (D) | | 480 | | 454 | | 393 | | 380 | | | 379 | |
Average common equity (E) | | 152 | | 152 | | 144 | | 131 | | | 130 | |
Gross debt (F) | | 282 | | 335 | | 230 | | 229 | | | 229 | |
Less cash and cash equivalents (G) | | 17 | | 48 | | 8 | | 5 | | | 66 | |
Net debt (F-G) | | 265 | | 287 | | 222 | | 224 | | | 163 | |
Total capitalization (H) | | 456 | | 505 | | 404 | | 382 | | | 378 | |
Less cash and cash equivalents (I) | | 17 | | 48 | | 8 | | 5 | | | 66 | |
Net capitalization (H-I) | | 438 | | 457 | | 396 | | 377 | | | 312 | |
(%) | | | | | | | | | | | | |
Return on average invested capital – As-Reported (B/D) | | 3.3 | | 1.8 | | 9.6 | | 4.6 | | | 3.4 | |
Return on average invested capital – Operational ((B-C)/ D) | | 3.3 | | 1.8 | | 9.6 | | 5.4 | | | 3.4 | |
Return on average common equity – As-Reported (A/E) | | 2.7 | | 0.5 | | 18.9 | | 5.3 | | | (0.9 | ) |
Return on average common equity – Operational ((A-C)/E) | | 2.7 | | 0.5 | | 18.9 | | 7.6 | | | (0.9 | ) |
Debt to capital ratio (F/H) | | 61.9 | | 66.4 | | 56.9 | | 60.1 | | | 60.7 | |
Net debt to net capital ratio ((F-G)/(H-I)) | | 60.4 | | 62.8 | | 56.0 | | 59.6 | | | 52.3 | |
SYSTEM ENERGY RESOURCES FINANCIAL MEASURES – RECONCILIATION OF GAAP TO NON-GAAP MEASURES 2002-2006
| | | | | | | | | | | |
| ($ millions) | | 2006 | | 2005 | | 2004 | | 2003 | | | 2002 |
As-Reported earnings (A) | | 140.3 | | 111.6 | | 105.9 | | 106.0 | | | 103.4 |
Preferred dividends | | — | | — | | — | | — | | | — |
Tax-effected interest expense | | 36.5 | | 36.9 | | 36.0 | | 39.5 | | | 46.7 |
As-Reported earnings including preferred dividends and tax-effected interest expense (B) | | 176.8 | | 148.5 | | 141.9 | | 145.5 | | | 150.1 |
Special items | | | | | | | | | | | |
Voluntary severance plan | | — | | — | | — | | (6.1 | ) | | — |
Merger expenses | | — | | — | | — | | — | | | — |
Total special items (C) | | — | | — | | — | | (6.1 | ) | | — |
Operational earnings including preferred dividends and tax-effected interest expense (B-C) | | 176.8 | | 148.5 | | 141.9 | | 151.6 | | | 150.1 |
Operational earnings (A-C) | | 140.3 | | 111.6 | | 105.9 | | 112.1 | | | 103.4 |
Average invested capital (D) | | 1,782 | | 1,831 | | 1,832 | | 1,850 | | | 1,877 |
Average common equity (E) | | 876 | | 894 | | 894 | | 893 | | | 891 |
Gross debt (F) | | 879 | | 934 | | 940 | | 936 | | | 979 |
Less cash and cash equivalents (G) | | 135 | | 76 | | 216 | | 53 | | | 113 |
Net debt (F-G) | | 744 | | 858 | | 724 | | 883 | | | 866 |
Total capitalization (H) | | 1,736 | | 1,827 | | 1,835 | | 1,829 | | | 1,871 |
Less cash and cash equivalents (I) | | 135 | | 76 | | 216 | | 53 | | | 113 |
Net capitalization (H-I) | | 1,601 | | 1,751 | | 1,619 | | 1,776 | | | 1,758 |
(%) | | | | | | | | | | | |
Return on average invested capital – As-Reported (B/D) | | 9.9 | | 8.1 | | 7.7 | | 7.9 | | | 8.0 |
Return on average invested capital – Operational ((B-C)/ D) | | 9.9 | | 8.1 | | 7.7 | | 8.2 | | | 8.0 |
Return on average common equity – As-Reported (A/E) | | 16.0 | | 12.5 | | 11.9 | | 11.9 | | | 11.6 |
Return on average common equity – Operational ((A-C)/E) | | 16.0 | | 12.5 | | 11.9 | | 12.6 | | | 11.6 |
Debt to capital ratio (F/H) | | 50.6 | | 51.1 | | 51.2 | | 51.2 | | | 52.3 |
Net debt to net capital ratio ((F-G)/(H-I)) | | 46.4 | | 49.0 | | 44.7 | | 49.7 | | | 49.3 |
Calculations may differ due to rounding.
65
REG G RECONCILIATIONS
ENTERGY NUCLEAR FINANCIAL MEASURES – RECONCILIATION OF GAAP TO NON-GAAP MEASURES
2002 - 2006
| | | | | | | | | | | |
| ($ millions) | | 2006 | | 2005 | | 2004 | | 2003 | | | 2002 |
As-Reported earnings (A) | | 309.5 | | 282.6 | | 245.0 | | 300.8 | | | 200.5 |
Preferred dividends | | — | | — | | — | | — | | | — |
Tax-effected interest expense | | 29.2 | | 31.3 | | 33.0 | | 21.2 | | | 29.1 |
As-Reported earnings including preferred dividends and tax-effected interest expense (B) | | 338.7 | | 313.9 | | 278.0 | | 322.0 | | | 229.6 |
Special items | | | | | | | | | | | |
SFAS 143 implementation | | — | | — | | — | | 154.4 | | | — |
Voluntary severance plan | | — | | — | | — | | (51.8 | ) | | — |
Total special items (C) | | — | | — | | — | | 102.6 | | | — |
Operational earnings including preferred dividends and tax-effected interest expense (B-C) | | 338.7 | | 313.9 | | 278.0 | | 219.4 | | | 229.6 |
Operational earnings (A-C) | | 309.5 | | 282.6 | | 245.0 | | 198.2 | | | 200.5 |
Average invested capital (D) | | 2,893 | | 2,717 | | 2,752 | | 2,526 | | | 2,174 |
Average common equity (E) | | 2,413 | | 2,083 | | 2,000 | | 1,654 | | | 1,164 |
Gross debt (F) | | 448 | | 512 | | 757 | | 747 | | | 997 |
Less cash and cash equivalents (G) | | 384 | | 212 | | 140 | | 149 | | | 158 |
Net debt (F-G) | | 64 | | 300 | | 617 | | 598 | | | 839 |
Total capitalization (H) | | 3,159 | | 2,626 | | 2,808 | | 2,696 | | | 2,356 |
Less cash and cash equivalents (I) | | 384 | | 212 | | 140 | | 149 | | | 158 |
Net capitalization (H-I) | | 2,775 | | 2,414 | | 2,668 | | 2,547 | | | 2,198 |
(%) | | | | | | | | | | | |
Return on average invested capital – As-Reported (B/D) | | 11.7 | | 11.6 | | 10.1 | | 12.8 | | | 10.6 |
Return on average invested capital – Operational ((B-C)/D) | | 11.7 | | 11.6 | | 10.1 | | 8.6 | | | 10.6 |
Return on average common equity – As-Reported (A/E) | | 12.8 | | 13.6 | | 12.3 | | 18.2 | | | 17.2 |
Return on average common equity – Operational ((A-C)/E) | | 12.8 | | 13.6 | | 12.3 | | 11.9 | | | 17.2 |
Debt to capital ratio (F/H) | | 14.2 | | 19.5 | | 27.0 | | 27.7 | | | 42.3 |
Net debt to net capital ratio ((F-G)/(H-I)) | | 2.3 | | 12.4 | | 23.1 | | 23.5 | | | 38.2 |
Calculations may differ due to rounding.
66
REG G RECONCILIATIONS
ENTERGY NUCLEAR FINANCIAL MEASURES – RECONCILIATION OF GAAP TO NON-GAAP MEASURES 1Q05-4Q06
| | | | | | | | | | | | | | | | |
| ($ millions) | | 1Q05 | | 2Q05 | | 3Q05 | | 4Q05 | | 1Q06 | | 2Q06 | | 3Q06 | | 4Q06 |
For the quarter: | | | | | | | | | | | | | | | | |
As-Reported earnings (A) | | 78.0 | | 58.3 | | 69.3 | | 77.1 | | 81.5 | | 63.4 | | 106.9 | | 57.7 |
Less special items (B) | | — | | — | | — | | — | | — | | — | | — | | — |
Operational earnings (A-B) | | 78.0 | | 58.3 | | 69.3 | | 77.1 | | 81.5 | | 63.4 | | 106.9 | | 57.7 |
As-Reported earnings, trailing 12 months (C) | | 254.2 | | 249.4 | | 255.0 | | 282.6 | | 286.2 | | 291.3 | | 328.9 | | 309.5 |
Preferred dividends | | — | | — | | — | | — | | — | | — | | — | | — |
Tax-effected interest expense | | 34.3 | | 34.5 | | 31.7 | | 31.3 | | 31.1 | | 29.3 | | 30.8 | | 29.3 |
As-Reported earnings, trailing 12 months including preferred dividends and tax-effected interest expense (D) | | 288.5 | | 283.9 | | 286.7 | | 313.9 | | 317.3 | | 320.6 | | 359.7 | | 338.8 |
Special items in prior quarters | | — | | — | | — | | — | | — | | — | | — | | — |
Special items 1Q05 through 4Q06 | | — | | — | | — | | — | | — | | — | | — | | — |
Total special items (E) | | — | | — | | — | | — | | — | | — | | — | | — |
Operational earnings, trailing | | | | | | | | | | | | | | | | |
12 months including preferred dividends and tax-effected interest expense (D-E) | | 288.5 | | 283.9 | | 286.7 | | 313.9 | | 317.3 | | 320.6 | | 359.7 | | 338.8 |
Operational earnings, trailing | | | | | | | | | | | | | | | | |
12 months (C-E) | | 254.2 | | 249.4 | | 255.0 | | 282.6 | | 286.2 | | 291.3 | | 328.9 | | 309.5 |
Average invested capital (F) | | 2,824 | | 2,813 | | 2,776 | | 2,717 | | 2,927 | | 2,987 | | 2,972 | | 2,893 |
Average common equity (G) | | 2,088 | | 2,084 | | 2,108 | | 2,083 | | 2,260 | | 2,313 | | 2,364 | | 2,413 |
Gross debt (H) | | 762 | | 767 | | 693 | | 512 | | 572 | | 581 | | 524 | | 448 |
Less cash and cash equivalents (I) | | 166 | | 166 | | 320 | | 212 | | 311 | | 382 | | 418 | | 384 |
Net debt (H-I) | | 596 | | 601 | | 373 | | 300 | | 261 | | 199 | | 106 | | 64 |
Total capitalization (J) | | 2,889 | | 2,930 | | 2,798 | | 2,626 | | 2,965 | | 3,045 | | 3,146 | | 3,159 |
Less cash and cash equivalents (K) | | 166 | | 166 | | 320 | | 212 | | 311 | | 382 | | 418 | | 384 |
Net capital (J-K) | | 2,723 | | 2,764 | | 2,478 | | 2,414 | | 2,655 | | 2,663 | | 2,728 | | 2,775 |
(%) | | | | | | | | | | | | | | | | |
Return on average invested capital – As-Reported (D/F) | | 10.2 | | 10.1 | | 10.3 | | 11.6 | | 10.8 | | 10.7 | | 12.1 | | 11.7 |
Return on average invested capital – Operational ((D-E)/F) | | 10.2 | | 10.1 | | 10.3 | | 11.6 | | 10.8 | | 10.7 | | 12.1 | | 11.7 |
Return on average common equity – As-Reported (C/G) | | 12.2 | | 12.0 | | 12.1 | | 13.6 | | 14.0 | | 13.9 | | 15.2 | | 14.0 |
Return on average common equity – Operational ((C-E)/G) | | 12.2 | | 12.0 | | 12.1 | | 13.6 | | 14.0 | | 13.9 | | 15.2 | | 14.0 |
Debt to capital ratio (H/J) | | 26.4 | | 26.2 | | 24.8 | | 19.5 | | 19.3 | | 19.1 | | 16.7 | | 14.2 |
Net debt to net capital ratio ((H-I)/(J-K)) | | 21.9 | | 21.7 | | 15.0 | | 12.4 | | 9.9 | | 7.5 | | 3.9 | | 2.3 |
Calculations may differ due to rounding.
67
INVESTOR INFORMATION
INVESTOR NEWS
Entergy’s quarterly earnings results, webcasts, presentations, and other news and information of investor interest may be obtained by visiting the investor information page on Entergy’s corporate Web site at www.entergy.com or calling Entergy Shareholder Direct at 1.888.ENTERGY (368.3749).
INVESTOR RELATIONS
Security analysts, portfolio managers, and other members of the financial community may contact:
Michele Lopiccolo
Vice President, Investor Relations
Telephone: 504.576.4879
E–mail: mlopicc@entergy.com
SHAREHOLDER ACCOUNT INFORMATION
Mellon Investor Services, LLC is Entergy’s transfer agent, registrar, dividend disbursing agent, and dividend reinvestment and stock purchase plan agent. Shareholders of record with questions about lost certificates, lost or missing dividend checks or notifications of change of address should contact:
Mellon Investor Services
480 Washington Boulevard
Jersey City, NJ 07310
Telephone: 1.800.333.4368
Internet address: www.melloninvestor.com
CORPORATE GOVERNANCE
Entergy’s Corporate Governance Guidelines, Board Committee Charters for the Corporate Governance, Audit, and Personnel Committees, and Entergy’s Code of Conduct may be accessed electronically be selecting the investor information page on Entergy’s corporate Web site at www.entergy.com.
ADDITIONAL INFORMATION
For copies of the above Corporate Governance documents, Entergy’s 10-K and 10-Q reports filed with the Securities and Exchange Commission, or for other investor information, call 1.888.ENTERGY or write to:
Entergy Corporation
Investor Relations
P.O. Box 61000
New Orleans, LA 70161
COMMON STOCK INFORMATION
The company’s common stock is listed on the New York and Chicago exchanges under the symbol “ETR” (CUSIP 29364G10). The Entergy share price is reported daily in the financial press under “Entergy” in most listings of New York Stock Exchange securities. Entergy common stock is a component of the following indices: S&P 500, S&P Utilities Index, Philadelphia Utility Index and the NYSE Composite Index, among others.
In June 2006, Entergy’s Chief Executive Officer certified to the New York Stock Exchange that he was not aware of any violation of the NYSE corporate governance listing standards. Also, Entergy filed certifications regarding the quality of the company’s public disclosure, required by Section 302 of the Sarbanes-Oxley Act of 2002, as exhibits to its Report on Form 10-K for the fiscal year ended December 31, 2006.
At year-end 2006 there were 202,667,776 shares of Entergy common stock outstanding. Shareholders of record totaled 46,488, and approximately 75,000 investors held Entergy stock in “street name” through a broker.
ENTERGY COMMON STOCK PRICES
The high and low trading prices for each quarterly period in 2006 and 2005 were as follows (in dollars):
| | | | | | | | |
| | | 2006 | | 2005 |
| Quarter | | High | | Low | | High | | Low |
1 | | 72.97 | | 67.97 | | 72.00 | | 64.48 |
2 | | 72.97 | | 66.78 | | 76.60 | | 69.35 |
3 | | 80.00 | | 70.80 | | 79.22 | | 70.52 |
4 | | 94.03 | | 78.38 | | 76.42 | | 67.00 |
DIVIDEND PAYMENTS
The Board of Directors declares dividends quarterly and sets the record and payment dates. Subject to Board discretion, those dates for 2007 are:
| | | | | | |
| Declaration Date | | Record Date | | Payment Date |
January 26 | | February 9 | | | | March 1 |
April 3 | | May 10 | | | | June 1 |
July 27 | | August 10 | | | | September 1 |
October 26 | | November 9 | | | | December 1 |
Quarterly dividend payments (in cents-per-share):
| | | | | | | | | | |
| Quarter | | 2007 | | 2006 | | 2005 | | 2004 | | 2003 |
1 | | 54 | | 54 | | 54 | | 45 | | 35 |
2 | | 54 | | 54 | | 54 | | 45 | | 35 |
3 | | | | 54 | | 54 | | 45 | | 45 |
4 | | | | 54 | | 54 | | 54 | | 45 |
PREFERRED STOCK DIVIDEND PAYMENTS
The board of directors for each preferred stock issuer declares preferred dividends quarterly and sets the record and payment dates. Subject to their discretion, those dates for 2007 are:
| | | | |
| Operating Companies | | Record Date | | Payment Date |
Entergy Arkansas, Inc. | | 3/20/07 | | 4/1/07 |
| | | 6/6/07 | | 7/1/07 |
| | | 9/5/07 | | 10/1/07 |
| | | 12/3/07 | | 1/1/08 |
Entergy Gulf States, Inc. | | 2/21/07 | | 3/15/07 |
| | | 5/21/07 | | 6/15/07 |
| | | 8/22/07 | | 9/15/07 |
| | | 11/16/07 | | 12/15/07 |
Entergy Louisiana, LLC | | 2/21/07 | | 3/15/07 |
| | | 5/21/07 | | 6/15/07 |
| | | 8/22/07 | | 9/15/07 |
| | | 11/16/07 | | 12/15/07 |
Entergy Mississippi, Inc. | | 1/20/07 | | 2/1/07 |
| | | 4/16/07 | | 5/1/07 |
| | | 7/9/07 | | 8/1/07 |
| | | 10/9/07 | | 11/1/07 |
Entergy New Orleans, Inc.* | | 3/1/07 | | 4/2/07 |
| | | 6/1/07 | | 7/2/07 |
| | | 9/4/07 | | 10/1/07 |
| | | 12/3/07 | | 1/2/08 |
| * | ENOI emerged from Chapter 11 bankruptcy effective May 8, 2007, pursuant to the Confirmation Order from the Bankruptcy Court confirming Entergy New Orleans’ Plan of Reorganization. Entergy New Orleans will shortly thereafter pay all accumulated but unpaid dividends on all of ENOI’s series of Preferred Stock and is expected to continue to declare and pay dividends thereafter. |
68

Entergy Corporation
Post Office Box 61000
New Orleans, LA