As filed with the Securities and Exchange Commission on September 16, 2024.
Registration No. 333-______
UNITED STATES
SECURITIES AND EXCHANGE COMMISSION
Washington, D.C. 20549
FORM F-1
REGISTRATION STATEMENT
UNDER
THE SECURITIES ACT OF 1933
Moove Lubricants Holdings
(Exact Name of Registrant as Specified in Its Charter)
| The Cayman Islands | 2992 | N/A |
(State or other jurisdiction of
incorporation or organization) | (Primary Standard Industrial
Classification Code Number) | (I.R.S. Employer
Identification Number) |
| | Av. Brigadeiro Faria Lima, 4,100 –
8th floor São Paulo – SP, 04538-132, Brazil +55 11 4517-1546 | |
| (Address, Including Zip Code, and Telephone Number, Including Area Code, of Registrant’s Principal Executive Offices) |
| | Cogency Global Inc.
122 East 42nd Street, 18th Floor
New York, NY 10168
(212) 947-7200 | |
| (Name, Address, Including Zip Code, and Telephone Number, Including Area Code, of Agent For Service) |
| Copies to: |
Manuel Garciadiaz Davis Polk & Wardwell LLP 450 Lexington Avenue New York, NY 10017 (212) 450-4000 | Jonathan E. Kellner
Colin J. Diamond Grissel Mercado
Alex M. Herman
Paul Hastings LLP
200 Park Avenue New York, NY 10166
(212) 318-6000 |
Approximate date of commencement of proposed sale to the public: As soon as practicable after the effective date of this Registration Statement.
If any of the securities being registered on this Form are to be offered on a delayed or continuous basis pursuant to Rule 415 under the Securities Act of 1933 check the following box. ☐
If this Form is filed to register additional securities for an offering pursuant to Rule 462(b) under the Securities Act, check the following box and list the Securities Act registration statement number of the earlier effective registration statement for the same offering. ☐
If this Form is a post-effective amendment filed pursuant to Rule 462(c) under the Securities Act, check the following box and list the Securities Act registration statement number of the earlier effective registration statement for the same offering. ☐
If this Form is a post-effective amendment filed pursuant to Rule 462(d) under the Securities Act, check the following box and list the Securities Act registration statement number of the earlier effective registration statement for the same offering. ☐
Indicate by check mark whether the registrant is an emerging growth company as defined in Rule 405 of the Securities Act of 1933.
Emerging growth company ☐
If an emerging growth company that prepares its financial statements in accordance with U.S. GAAP, indicate by check mark if the registrant has elected not to use the extended transition period for complying with any new or revised financial accounting standards† provided pursuant to Section 7(a)(2)(B) of the Securities Act. ☐
† The term “new or revised financial accounting standard” refers to any update issued by the Financial Accounting Standards Board to its Accounting Standards Codification after April 5, 2012.
The registrant hereby amends this registration statement on such date or dates as may be necessary to delay its effective date until the registrant will file a further amendment which specifically states that this registration statement will thereafter become effective in accordance with Section 8(a) of the Securities Act of 1933, as amended, or until the registration statement will become effective on such date as the Securities and Exchange Commission, acting pursuant to said Section 8(a), may determine.
The information in this preliminary prospectus is not complete and may be changed. We and the selling shareholders may not sell these securities until the registration statement filed with the Securities and Exchange Commission is effective. This preliminary prospectus is not an offer to sell these securities and it is not soliciting an offer to buy these securities in any jurisdiction where the offer or sale is not permitted.
SUBJECT TO COMPLETION, DATED SEPTEMBER 16, 2024
PRELIMINARY PROSPECTUS

Common Shares
Moove Lubricants Holdings
(incorporated in the Cayman Islands)
This is an initial public offering of common shares of Moove Lubricants Holdings. We are offering common shares, and the selling shareholders identified in this prospectus are offering an additional common shares. We will not receive any proceeds from the sale of common shares by the selling shareholders.
Prior to this offering, there has been no public market for our common shares. It is currently estimated that the initial public offering price per common share will be between US$ and US$ .
We have applied to list our common shares on the New York Stock Exchange under the symbol “MOOV.”
Following this offering, Cosan S.A., or Cosan, will beneficially own % of our outstanding share capital, assuming no exercise of the underwriter’s option to purchase additional shares as further described below.
Following this offering, we will be a “controlled company” within the meaning of the corporate governance rules of the NYSE and as such plan to rely on available exemptions from certain NYSE corporate governance requirements.
Investing in our common shares involves risks. See “Risk Factors” beginning on page 21 of this prospectus.
| | Per common share | Total |
| Initial public offering price | US$ | US$ |
| Underwriting discounts and commissions (1) | US$ | US$ |
| Proceeds, before expenses, to the selling shareholders (2) | US$ | US$ |
| Proceeds, before expenses, to Moove Lubricants Holdings (2) | US$ | US$ |
| (1) | See “Underwriting” for a description of the compensation payable to the underwriters. |
| (2) | Assumes no exercise of the underwriters’ over-allotment option. |
We and the selling shareholders have granted the underwriters an option for a period of 30 days from the date of this prospectus to purchase up to an additional common shares from us and up to an additional common shares from the selling shareholders at the initial public offering price, less underwriting discounts and commissions.
Neither the U.S. Securities and Exchange Commission nor any state securities commission has approved or disapproved of these securities or determined if this prospectus is truthful or complete. Any representation to the contrary is a criminal offense.
The underwriters expect to deliver the common shares to purchasers on or about , 2024.
Global Coordinators
| J.P. Morgan | BofA Securities | Citigroup | Itaú BBA | BTG Pactual | Santander |
Joint Bookrunners
| Goldman Sachs & Co. LLC | Jefferies | Morgan Stanley |
The date of this prospectus is , 2024.


table of contents
Page
This prospectus has been prepared by us solely for use in connection with the proposed offering of common shares in the United States and, to the extent described below, elsewhere. Neither we, the selling shareholders nor any of the underwriters have authorized anyone to provide any information or to make any representations other than those contained in this prospectus or in any free writing prospectuses we have prepared. Neither we, the selling shareholders nor any of the underwriters take responsibility for, and can provide no assurance as to the reliability of, any other information that others may give you. This prospectus is an offer to sell only the shares offered hereby, and only under circumstances and in jurisdictions where it is lawful to do so. The information contained in this prospectus or any applicable free writing prospectus is current only as of the date of this prospectus or of any such free writing prospectus, as applicable, regardless of its time of delivery or of any sale of our common shares.
Neither we, the selling shareholders nor any of the underwriters have taken any action that would permit a public offering of our common shares or possession or distribution of this prospectus in any jurisdiction where action for that purpose is required, other than in the United States. Persons outside the United States who come into possession of this prospectus must inform themselves about, and observe any restrictions relating to, the offering of our common shares and the distribution of this prospectus outside the United States and in their jurisdiction (including Brazil). However, we may make offers and sales outside the United States in circumstances that do not constitute a public offer or distribution under applicable laws and regulations.
Unless otherwise indicated or the context otherwise requires, all references in this prospectus to “Moove” or the “Company,” the “Issuer,” “we,” “our,” “ours,” “us” or similar terms refer to Moove Lubricants Holdings, together with its consolidated subsidiaries.
We own or have rights to trademarks, service marks and trade names that we use in connection with the operation of our business, including our corporate name, logos and website names. Solely for convenience, some of the trademarks, service marks and trade names referred to in this prospectus are listed without the ® and ™ symbols, but we will assert, to the fullest extent under applicable law, our rights to our trademarks, service marks and trade names. Other trademarks, service marks and trade names appearing in this prospectus are the property of their respective owners.
Presentation of Financial and Other Information
Financial Statements
We maintain our books and records in Brazilian reais, the presentation currency for our financial statements. Our annual consolidated financial statements were prepared in accordance with International Financial Reporting Standards, or IFRS, as issued by the International Accounting Standard Board, or IASB. Unless otherwise noted, our consolidated statement of financial position information presented herein as of June 30, 2024 and December 31, 2023 and 2022 and the consolidated statements of profit or loss for the six months ended June 30, 2024 and 2023 and the years ended December 31, 2023, 2022 and 2021 are stated in Brazilian reais, our reporting currency.
Our consolidated financial information contained in this prospectus is derived from (i) our unaudited interim condensed consolidated financial statements as of June 30, 2024 and for the six months ended June 30, 2024 and 2023, together with the notes thereto, included elsewhere in this prospectus, or our unaudited interim condensed consolidated financial statements, and (ii) our audited consolidated financial statements as of December 31, 2023 and 2022 and for the years ended December 31, 2023, 2022 and 2021, together with the notes thereto, or our audited consolidated financial statements. All references herein to “our financial statements,” “our consolidated financial information,” “our unaudited interim condensed consolidated financial statements” and “our audited consolidated financial statements” are to our consolidated financial statements included elsewhere in this prospectus.
This financial information should be read in conjunction with “Management’s Discussion and Analysis of Financial Condition and Results of Operations” and our consolidated financial statements, including the notes thereto, included elsewhere in this prospectus.
As a result of certain acquisitions we have undertaken, our results of operations for the year ended December 31, 2023 are not directly comparable to our results of operations for the years ended December 31, 2022 and 2021, which may make it difficult for you to evaluate our business, financial condition, results of operations and prospects. For more information, see “Management’s Discussion and Analysis of Financial Condition and Results of Operations—Significant Factors Affecting Our Results of Operations—Acquisitions.”
Our fiscal year ends on December 31. References in this prospectus to a fiscal year, such as “fiscal year 2023,” relate to our fiscal year, the 12 months ended December 31, 2023.
Corporate Events
Corporate Reorganization
We are a Cayman Islands exempted company incorporated with limited liability on September 5, 2023. On October 31, 2023, we completed a corporate reorganization whereby Cosan Lubes Investments Limited, a private limited company incorporated under the laws of England and Wales, or CLI, and our previous holding company, contributed its interest in its subsidiaries and remaining cash to Moove Lubricants Holdings, in consideration for the issuance of Moove Lubricants Holdings common shares. As a result of our corporate reorganization, our functional currency was changed from pounds sterling to U.S. dollars, and Moove Lubricants Holdings became our new holding company.
We accounted for the corporate reorganization using the predecessor method of accounting, and the consolidated financial statements are presented “as if” CLI is the predecessor of the Company. Under the predecessor method, the historical operations of CLI are deemed to be those of the Company. Thus, our consolidated financial statements reflect: (i) the historical operating results and financial position of CLI prior to the corporate reorganization; (ii) the consolidated results and financial position of the Company following the corporate reorganization; (iii) the assets and liabilities of the Company at their historical cost; and (iv) that the number of ordinary shares outstanding of the Company is the same as CLI’s. For further information on the accounting for the corporate reorganization, see note 1.2 to our audited consolidated financial statements, included elsewhere in this prospectus.
Please read the information in the section entitled “Business—Our Corporate Structure” for a more thorough description of the operations of our material operating subsidiaries.
Acquisitions of PetroChoice and Tirreno
In May 2022, we completed two acquisitions—one in the United States and one in Brazil. Our wholly owned subsidiary Millennium Moove Corp. acquired 100% of PetroChoice for R$2,342.8 million. Moreover, Moove Brazil acquired 100% of the shares of Tirreno for R$85.2 million. As a result of the aforementioned acquisitions, our results of operations for the year ended December 31, 2023 are not directly comparable to our results of operations for the years ended December 31, 2022 and 2021, which may make it difficult for you to evaluate our business, financial condition, results of operations and prospects.
Financial Information in U.S. Dollars
Solely for the convenience of the reader, we have translated some of the real amounts included in this prospectus from reais into U.S. dollars. You should not construe these convenience translations as representations by us that the amounts actually represent these U.S. dollar amounts or could be converted into U.S. dollars at the rates indicated. Unless otherwise indicated, we have translated real amounts into U.S. dollars using a rate of R$5.5589 to US$1.00, the commercial selling rate for U.S. dollars at June 30, 2024 as reported by the Central Bank.
Special Note Regarding Non-GAAP Financial Measures
This prospectus presents our Adjusted EBITDA, Adjusted EBITDA Margin, Unit Adjusted EBITDA, Cash Flow Conversion, Net Debt, Net Debt to Adjusted EBITDA Ratio, ROIC and Operating Working Capital and their respective reconciliations for the convenience of investors, which are non-GAAP financial measures. A non-GAAP financial measure is generally defined as a numerical measure of historical or future financial performance, financial position, or cash flow that purports to measure financial performance but excludes or includes amounts that would not be so adjusted in the most comparable IFRS measure.
We use these non-GAAP financial measures for decision-making purposes and to assess our financial and operating performance, generate future operating plans and make strategic decisions regarding the allocation of capital. We believe that the disclosure of our non-GAAP measures provides useful supplemental information to investors and financial analysts and other interested parties in their review of our operating performance. Additionally, we believe that non-GAAP financial information, when taken collectively, may be helpful to investors because it provides consistency and comparability with past financial performance and facilitates period-to-period comparisons of results of operations. The non-GAAP financial measures described in this prospectus are not a substitute for the IFRS measures of earnings, income, profitability, indebtedness or cash flow.
Additionally, our calculations of Adjusted EBITDA, Adjusted EBITDA Margin, Unit Adjusted EBITDA, Cash Flow Conversion, Net Debt, Net Debt to Adjusted EBITDA Ratio and ROIC may be different from the calculation used by other companies, including our competitors in the industry, and therefore, our measures may not be comparable to those of other companies. For a reconciliation of Adjusted EBITDA, Adjusted EBITDA Margin, Unit Adjusted EBITDA, Cash Flow Conversion, Net Debt, Net Debt to Adjusted EBITDA Ratio and ROIC, the most directly comparable IFRS measure, see “Summary Consolidated Financial and Other Data—Non-GAAP Financial Measures.”
Adjusted EBITDA and Adjusted EBITDA Margin
We calculate Adjusted EBITDA as profit (loss) for the period/year plus income taxes (current and deferred), financial results, net, depreciation and amortization, non-recurring expenses related to our initial public offering and expenses incurred in connection with our equity-compensation plan linked to the occurrence of our initial public offering.
We calculate Adjusted EBITDA Margin by dividing Adjusted EBITDA by our revenue.
Our management believes that Adjusted EBITDA and Adjusted EBITDA Margin are meaningful for investors because they provide an analysis of our operating results and profitability, a proxy for operating cash generation, and ability to service debt and because Adjusted EBITDA and Adjusted EBITDA Margin are used by our chief
operating decision-makers to track our business evolution, establish operational and strategic targets and capital allocation, and make other important business decisions. Adjusted EBITDA and Adjusted EBITDA Margin are also measures commonly reported and widely used by analysts, investors and other interested parties in our industry to evaluate performance in the ordinary course of business without the impact of one-off and non-recurring events.
Adjusted EBITDA and Adjusted EBITDA Margin are non-GAAP measures. Adjusted EBITDA and Adjusted EBITDA Margin are not substitutes for their component IFRS measures or IFRS measures of earnings or profit (loss) for the period/year. Additionally, our calculations of Adjusted EBITDA and Adjusted EBITDA Margin may be different from the calculation used by other companies, including competitors in our industry, and may therefore not be comparable to similarly named metrics of other companies.
For a reconciliation of Adjusted EBITDA and Adjusted EBITDA Margin to our profit (loss) for the period/year, see “Summary Consolidated Financial and Other Data—Non-GAAP Financial Measures—Adjusted EBITDA and Adjusted EBITDA Margin.”
Unit Adjusted EBITDA
We calculate Unit Adjusted EBITDA as profit (loss) for the period/year plus income taxes (current and deferred), financial results, net, depreciation and amortization, non-recurring expenses related to our initial public offering and expenses incurred in connection with our equity-compensation plan linked to the occurrence of our initial public offering, and divided by volume of lubricants sold.
Our management believes that Unit Adjusted EBITDA is meaningful for investors because it provides an analysis of our operating results and profitability and because Unit Adjusted EBITDA is used by our chief operating decision-makers to track our business evolution, establish operational and strategic targets and capital allocation, and make other important business decisions as well as to evaluate performance in the ordinary course of business without the impact of one-off and non-recurring events.
Unit Adjusted EBITDA is a non-GAAP measure. Unit Adjusted EBITDA is not a substitute for its component IFRS measures or IFRS measures of earnings or profit (loss) for the period/year. Additionally, our calculation of Unit Adjusted EBITDA may be different from the calculation used by other companies, including competitors in our industry, and may therefore not be comparable to similarly named metrics of other companies.
For a reconciliation of Unit Adjusted EBITDA to our profit (loss) for the period/year, see “Summary Consolidated Financial and Other Data—Non-GAAP Financial Measures—Unit Adjusted EBITDA.”
Cash Flow Conversion
We calculate Cash Flow Conversion as free cash flow divided by Adjusted EBITDA.
We calculate free cash flow as net cash flows from operating activities plus acquisition of property, plant and equipment and intangible assets.
Our management believes that Cash Flow Conversion is meaningful for investors because it provides an analysis of our cash flows and liquidity and because Cash Flow Conversion is used by our chief operating decision-makers to track our business evolution, establish operational and strategic targets and capital allocation, and make other important business decisions.
Cash Flow Conversion is a non-GAAP measure. Cash Flow Conversion is not a substitute for its component IFRS measures or IFRS measures of cash flow or liquidity for the period. Additionally, our calculation of Cash Flow Conversion may be different from the calculation used by other companies, including competitors in our industry, and may therefore not be comparable to similarly named metrics of other companies.
For a reconciliation of Cash Flow Conversion to our net cash flows from operating activities for the period/year, see “Summary Consolidated Financial and Other Data—Non-GAAP Financial Measures—Cash Flow Conversion.”
Net Debt and Net Debt to Adjusted EBITDA Ratio
We calculate Net Debt as gross debt less cash and cash equivalents and current marketable securities.
We calculate gross debt as the sum of current and non-current loans and borrowings and current derivative financial instruments.
We calculate Net Debt to Adjusted EBITDA Ratio by dividing Net Debt by our Adjusted EBITDA. We calculate Adjusted EBITDA as profit for the period/year plus income taxes (current and deferred), financial results, net, depreciation and amortization, non-recurring expenses related to our initial public offering and expenses incurred in connection with our equity-compensation plan linked to the occurrence of our initial public offering.
Our management believes that Net Debt and Net Debt to Adjusted EBITDA Ratio are meaningful for investors because they provide an analysis of our earnings, profit for the period/year and ability to service debt and because Net Debt and Net Debt to Adjusted EBITDA Ratio are used by our chief operating decision-makers to track our business evolution, establish operational and strategic targets and capital allocation, and make other important business decisions. Net Debt and Net Debt to Adjusted EBITDA Ratio are also a measure commonly reported and widely used by analysts, investors and other interested parties in our industry.
Net Debt and Net Debt to Adjusted EBITDA Ratio are non-GAAP measures. Net Debt and Net Debt to Adjusted EBITDA Ratio are not a substitute for their component IFRS measures or IFRS measures of earnings or profit (loss) for the period/year, or of indebtedness. Additionally, our calculation of Net Debt and Net Debt to Adjusted EBITDA Ratio may be different from the calculation used by other companies, including competitors in our industry, and may therefore not be comparable to similarly named metrics of other companies.
For a reconciliation of Net Debt and Net Debt to Adjusted EBITDA Ratio to our loans and borrowings (current and non-current) and derivative financial instruments (current), see “Summary Consolidated Financial and Other Data—Non-GAAP Financial Measures—Net Debt and Net Debt to Adjusted EBITDA Ratio.”
ROIC
We calculate ROIC as net operating profit after taxes, or NOPAT, divided by average invested capital.
We calculate NOPAT as the sum of our profit before finance results and taxes, fair value amortization, non-recurring expenses related to our initial public offering and expenses incurred in connection with our equity-compensation plan, less weighted income taxes – nominal.
We calculate weighted income taxes – nominal by multiplying the nominal income tax rate of each country by the sum of profit before finance results and taxes, fair value amortization and non-recurring events.
We calculate average invested capital as the average of the sum of our total equity and our Net Debt between the current period and the prior period.
Our management believes that ROIC is meaningful for investors because it provides an analysis of our cash flows and liquidity and because ROIC is used by our chief operating decision-makers to track our business evolution, establish operational and strategic targets and capital allocation, and make other important business decisions. ROIC is also a measure commonly reported and widely used by analysts, investors and other interested parties in our industry.
ROIC and NOPAT are not substitutes for their respective component IFRS measures or IFRS measures of earnings or profit for the period/year. Additionally, our calculation of ROIC and NOPAT may be different from the calculation used by other companies, including competitors in our industry, and may therefore not be comparable to similarly named metrics of other companies.
For a reconciliation of ROIC to our profit for the period/year, see “Summary Consolidated Financial and Other Data—Non-GAAP Financial Measures—ROIC.”
Operating Working Capital
We calculate Operating Working Capital as the sum of current trade receivables and inventory less current trade payables. Our definition of Operating Working Capital excludes balance sheet items that are related to the capital structure of the business, such as the current portion of long-term debt, which are influenced to a large extent by long-term capital structuring decisions.
Our management believes that Operating Working Capital is meaningful for investors because it provides an analysis of capital structure items that tend to fluctuate on a monthly basis based on decisions made by management and the operation of our business. As a result, management uses operating working capital when measuring the effectiveness with which these key balance sheet items are being managed on a real-time basis.
Operating Working Capital is a non-GAAP measure. Operating Working Capital is not a substitute for its component IFRS measures or IFRS measures of our capital structure or liquidity. Additionally, our calculation of Operating Working Capital may be different from the calculation used by other companies, including competitors in our industry, and may therefore not be comparable to similarly named metrics of other companies.
For a reconciliation of Operating Working Capital to our trade receivables and inventory, see “Summary Consolidated Financial and Other Data—Non-GAAP Financial Measures—Operating Working Capital.”
Market Share and Other Information
We obtained the information included in this prospectus relating to the industry in which we operate, as well as the estimates concerning market shares, from third-party sources including a report by Kline & Company, Inc., or Kline, an independent market research firm commissioned by us that we refer to as the Kline Report, as well as public information and publications on the industry prepared by official public sources, as well as private sources, such as the Central Bank.
We are responsible for all of the disclosure in this prospectus and we believe that each of the publications, studies and surveys used throughout this prospectus are prepared by reputable sources and are generally reliable, though we have not independently verified market and industry data from third-party sources. Other than the Kline Report, none of the publications, reports or other published industry sources referred to in this prospectus were commissioned by us or prepared at our request. We have not sought or obtained the consent of any of these sources other than the Kline Report to include such market data in this prospectus. All of the market data used in this prospectus involves a number of assumptions and limitations and therefore is inherently uncertain and imprecise, and you are cautioned not to give undue weight to such estimates. Projections, assumptions and estimates of our future performance and the future performance of the industry in which we operate are necessarily subject to a high degree of uncertainty and risk due to a variety of factors, including those described in “Risk Factors” in this prospectus. These and other factors could cause results to differ materially from those expressed in our estimates and beliefs and in the estimates prepared by independent parties.
Rounding
We have made rounding adjustments to some of the figures included in this prospectus. Accordingly, numerical figures shown as totals in some tables may not be an arithmetic aggregation of the figures that preceded them.
Certain Definitions
The following industry and other defined terms are used in this prospectus:
“Brazil” means the Federative Republic of Brazil and the “Brazilian government” means the federal government of Brazil.
“CDI Rate” means the Brazilian interbank deposit (certificado de depósito interbancário) rate, which is an average of interbank overnight rates in Brazil.
“Central Bank” means the Brazilian Central Bank (Banco Central do Brasil).
“Cosan” means Cosan S.A., a corporation (sociedade anônima) incorporated under the laws of Brazil and our controlling shareholder.
“Cosan Group” means Cosan and its consolidated subsidiaries.
“CVC” means CVC Capital Partners plc.
“CVC Fund VII” means Galt Lubes Investments Limited, which is indirectly majority owned by CVC Capital Partners VII Associates L.P., CVC Capital Partners Investment Europe VII L.P., and CVC Capital Partners VII (A), L.P., a group of investment limited partnerships indirectly managed or advised by CVC.
“Exchange Act” means the Securities Exchange Act of 1934, as amended.
“ExxonMobil” means ExxonMobil Lubricants Trading Company, a company incorporated under the laws of the State of Delaware.
“IASB” means the International Accounting Standards Board.
“IBP” means Brazilian Petroleum and Gas Institute (Instituto Brasileiro de Petróleo e Gás).
“IFRS” means the International Financial Reporting Standards, as issued by the IASB.
“Moove Brazil” means Cosan Lubrificantes e Especialidades S.A., a corporation (sociedade anônima) incorporated under the laws of Brazil and our subsidiary.
“Moove Corp.” means Moove USA Corp. (formerly known as Commercial Lubricants Moove Corp.), a Delaware corporation and our subsidiary.
“Moove UK” means Moove Lubricants Limited, a private limited company incorporated under the laws of England and Wales and our subsidiary.
“real,” “reais” or “R$” means the Brazilian real, the official currency of Brazil.
“PetroChoice” means Petrochoice Holdings, Inc., a Delaware corporation and our subsidiary, including its operating subsidiaries.
“SEC” means the United States Securities and Exchange Commission.
“Securities Act” means the U.S. Securities Act of 1933, as amended.
“SELIC rate” means the Brazilian base interest rate established by the Brazilian Special Clearance and Custody System (Sistema Especial de Liquidação e Custódia).
“Tirreno” means Tirreno Indústria e Comércio de Produtos Químicos Ltda., a limited liability company (sociedade limitada) incorporated under the laws of Brazil.
“U.S. dollar,” “U.S. dollars” or “US$” means U.S. dollars, the official currency of the United States.
“United Kingdom” or “UK” means the United Kingdom of Great Britain and Northern Ireland.
“United States” or “U.S.” means the United States of America.
Prospectus Summary
This summary highlights selected information that is presented in greater detail elsewhere in this prospectus. This summary does not contain all of the information you should consider before investing in our common shares. You should read this entire prospectus carefully, including the sections titled “Risk Factors” and “Management’s Discussion and Analysis of Financial Condition and Results of Operations” and our consolidated financial statements and notes thereto included elsewhere in this prospectus, before deciding to invest in our common shares.
Overview
Moove is a global lubricants solutions provider. We specialize in the formulation, manufacturing, distribution, marketing, selling and servicing of lubricant products across a diverse range of end markets and customers. We offer a comprehensive portfolio of products and technical support that is highly tailored to our end markets, while optimizing our cost base, physical footprint and working capital needs to drive unit profitability and cash flow generation.
Lubricants are everywhere. We operate in a complex and dynamic market that is critical to the customers we serve, across industrial, commercial and consumer segments. Our customers’ needs are constantly evolving as technology continues to influence the requirements for, and applications of, lubricants. While our products generally represent a small component of our customers’ total running costs, they are crucial to driving efficiencies and maintaining operations, establishing a clear need in the market for our capabilities.
Our business was formed following Cosan’s acquisition of ExxonMobil’s Brazilian lubricant manufacturing and distribution assets in 2008. We have diversified the business significantly over more than 15 years—across suppliers, customers, end markets and geographies—and have maintained and strengthened a highly strategic alliance with ExxonMobil that drives mutual value creation. ExxonMobil’s brand, premium research and development capabilities, proprietary product technology and base oils production are important factors to our marketing strategy and supply chain. We believe that our market intelligence, efficient operations, market know-how and close physical proximity to customers make us a powerful partner of choice for them.
We have pursued a growth-oriented strategy with an intentional focus on lubricants, distinguishing us from other scaled market participants. Our expertise in sourcing, insights into market prices and deep knowledge across the supply chain truly differentiate our model, allowing us to access and optimize raw materials to formulate high-performance products at a lower cost. Furthermore, we believe that our service-oriented and high-touch approach with our customers has strengthened our position with our core clients. Our capabilities and relationships, along with our corporate culture centered around high-performance teams to drive efficiency and business expansion, have translated into margin expansion at the unit level and high cash return on the capital investments we make.
We operate a model requiring low levels of capital expenditures (our total capital expenditures as a percentage of revenue amounted to 1.8%, 1.7%, 1.9%, 1.2% and 0.7% for the six months ended June 30, 2024 and 2023 and for the years ended December 31, 2023, 2022 and 2021, respectively),focused on cost-effective formulation, manufacturing, logistics and services. In contrast, the production of raw materials such as base oils, which is not in our scope, requires intensive capital investments and other capabilities, resulting in a different scale and margin profile within our industry. We believe that our model underpins our ROIC and allows us to optimize our cost base and capital expenditures to support our profitability, Adjusted EBITDA Margin and cash flow generation as we scale and penetrate a market.
The ongoing industry-wide mix shift into premium products that require more technical know-how also provides a meaningful tailwind for our business. We believe we have a competitive advantage in the formulation and supply of these products and have consistently grown at a significantly higher rate than the broader lubricants market. Importantly, our profit pool is only partially influenced by end market volumes.
Our track record of financial performance is reflected in our metrics. Our revenue for the six months ended June 30, 2024 was R$5,024.8 million (US$903.9 million), a decrease of 1.6% compared to the six months ended June 30, 2023, while our profit for the period was R$237.6 million (US$42.7 million), compared to a loss of R$58.4 million (US$10.5 million) in the six months ended June 30, 2023. Our Adjusted EBITDA for the six months ended June 30, 2024 was R$690.2 million (US$124.2 million), a 9.0% increase from R$633.4 million for the six months ended June 30, 2023. Our revenue for the year ended December 31, 2023 was R$10,074.2 million (US$1,812.3
million), while our profit for the year was R$266.0 million (US$47.9 million), an increase of 66.9% and a decrease of 8.3%, respectively, compared to the year ended December 31, 2021. Adjusted EBITDA for the year ended December 31, 2023 was R$1,243.1 million (US$223.6 million), an increase of 107.5% compared to the year ended December 31, 2021. Our profit (loss) margin was 4.7% in the six months ended June 30, 2024 and negative 1.1% in the six months ended June 30, 2023, and our Adjusted EBITDA Margin was 13.7% in the six months ended June 30, 2024 and 12.4% in the six months ended June 30, 2023. From 2021 to 2023, our profit margin decreased from 4.8% for the year ended December 31, 2021 to 2.6% for the year ended December 31, 2023, our Adjusted EBITDA Margin increased to 12.3% for the year ended December 31, 2023 from 9.9% in the year ended December 31, 2021, and our Unit Adjusted EBITDA increased to R$1.87 (US$0.34) per liter for the year ended December 31, 2023 from R$1.54 per liter for the year ended December 31, 2021. These increases were a result of organic growth of 22.5% in our revenue and 74.6% in our Adjusted EBITDA compared to the year ended December 31, 2021, which added to the acquisitions made in the period. The growth of our business from 2021 to 2023 was driven substantially by the acquisitions of PetroChoice in the United States and Tirreno in Brazil, which we completed in May 2022, as further discussed under “Management’s Discussion and Analysis of Financial Condition and Results of Operations—Significant Factors Affecting Our Results of Operations—Acquisitions.” See “Summary Consolidated Financial and Other Data—Non-GAAP Financial Measures” for a reconciliation of Adjusted EBITDA, Unit Adjusted EBITA and Adjusted EBITDA Margin to the most directly comparable GAAP financial measure.
Our revenue for the six months ended June 30, 2024 was generated in the following regions: 47.3% in South America, 29.2% in Europe and 23.5% in North America. For the six months ended June 30, 2024, our Adjusted EBITDA was generated in the following regions: 70.8% in South America, 8.0% in Europe and 21.2% in North America. Our revenue for the year ended December 31, 2023 was generated in the following regions: 45.4% in South America, 30.2% in Europe and 24.4% in North America. For the year ended December 31, 2023, our Adjusted EBITDA was generated in the following regions: 66.4% in South America, 22.0% in North America and 11.6% in Europe.
Our Business
Moove is a global lubricants solutions provider to a wide range of customers, which demand lubricants to an even wider range of applications. We are focused on developing the supply chain needed to service our customers with the best solution possible, leveraging our production facilities and formulation capabilities. We transform base oils and additives into customized, high-performing and high-value lubricant formulations with which we service our customers. This focus allows us to operate with significantly fewer production assets and to direct our capital and expertise on the most attractive “profit pools” in the lubricants value chain. Our high-touch, intimate and service-oriented go-to-market strategy enables us to grow with customers as their needs evolve and their procurement increases in scale or complexity.
Our customers operate across industrial, consumer and commercial channels—including in industrial and manufacturing equipment, passenger and commercial vehicles, marine and aviation. These applications demand the full range of lubricants, including engine oils, automotive and industrial fluids, as well as special application products such as greases, cutting oils, insulating oils, process oils, and car care products. Specifically in the industrial segment, lubricants are essential for production productivity and efficiency. The level of specialization required to properly serve all market segments creates a significant market opportunity for our high-touch, full-service customer relationships.
Our global footprint consists of six production plants and approximately 100 distribution centers, providing us with both a scaled manufacturing base and an optimized distribution network through which we access and service our customers. It is critical in our market to be able to move product quickly and efficiently—and we have been deliberate in configuring a physical footprint that aligns closely with customer and industrial demand. Our largest plant is located in the State of Rio de Janeiro, Brazil, with an annual production capacity of approximately 400 million liters. Our other plants are located in the State of São Paulo, Brazil, where our “Tirreno” products are manufactured (approx. 27 million liters), the United Kingdom (approx. 70 million liters) and the United States (Kansas, approx. 75 million liters; South Carolina, approx. 20 million liters; Indiana, approx. 15 million liters).

We sell lubricants in 10 countries across three regions: South America (Argentina, Brazil, Bolivia, Uruguay and Paraguay), North America (the United States) and Europe (Spain, France, Portugal and the United Kingdom) and our products are exported to over 60 other countries in Europe and Asia. Our continued investment in physical assets, including manufacturing sites, trucking capabilities, information technology systems and an increased distribution center footprint, is a distinct competitive advantage for Moove and provides the business, and by extension our customers, with increased logistics optionality and optimization opportunities as well as reliability of supply. Our operations are supported by a global workforce of over 2,100 employees as of June 30, 2024, many of whom are in highly skilled roles and have significant tenure with the organization.
We blend and produce over 700 different formulations of lubricant products that are distributed through a number of delivery systems and formats. In total, we supply more than 9,000 stock keeping units, or SKUs, across our global network. In support of our production, we purchase hundreds of different raw materials, including base oils, additives and packaging, and have developed long-standing relationships with our key suppliers.
We commenced independent operations in 2008, when Cosan acquired ExxonMobil’s lubricants assets in Brazil and obtained the right to blend, distribute and market premium Mobil branded products in the country. The ability to develop our business pursuant to this arrangement enabled us to expand our footprint to Bolivia, Uruguay and Paraguay in 2011. In 2018, recognizing the success accomplished and strategically aligned plans for future growth, ExxonMobil and Moove signed a 20-year contract extension and added Argentina to the footprint.
Beyond Mobil branded products, we chose to leverage our technical expertise and capabilities in sourcing and formulation to develop specific lubricants for different end uses, enabling us to offer an extensive catalog of lubricants, fluids, greases, insulating oils and process oils. Our more significant proprietary brands include “Comma” (Europe and Asia), “EcoUltra,” “Medallion Plus” and “Dyna-Plex 21C” (North America) and “Tirreno” (South America), which add to a comprehensive portfolio of around 100 brands across all regions.
Focusing on our key strengths gives us the discipline to capitalize on both organic and inorganic growth opportunities with low execution risk. We entered into the European lubricants and specialties market in 2012 through the acquisition of Comma Oil & Chemicals Limited, a former ExxonMobil affiliate in the UK, primarily serving customers in the passenger cars end market. In 2016, we commenced operations in Spain with the focus of developing the Mobil brand and, in 2018, we strengthened our strategic footprint in Europe through the acquisition of Mobil Lubricants Distributors in France (TTA), Portugal (Lubrigrupo), and the UK (WP). The UK is our largest European operation, where we also inherited a niche fuels business serving business-to-business customers.
Following this series of acquisitions and after establishing a relevant position in the lubricants industry in South America and a robust footprint in Europe, we entered into an investment agreement with CVC Fund VII, which we refer to as the CVC investment agreement, for the acquisition of 30% of our equity in 2018, welcoming CVC as a strategic partner in our journey. In addition to providing expertise and a global network of resources, this strategic partnership has acted as a robust governance enabler, providing additional corporate independence from Cosan.
An important strategic milestone for us was to enter the North American lubricants market. In December 2018, we acquired MetroLube, giving us access to market intelligence and the opportunity to establish commercial relationships without making a significant capital investment. In May 2022, we acquired PetroChoice, expanding our Mobil branded footprint in the United States with three lubricant blending plants and more than 50 distribution centers across 25 states, giving us a meaningful presence in the world’s largest market.

Our Industry
The lubricants’ value chain spans from raw materials and base oil manufacturers through to the blending, distribution, sales and marketing and after-market services provided to end customers. The industry is incredibly complex and dynamic, with specialized needs tailored to both the initial raw materials and ultimate end customer.
Base oil and additives are the primary raw materials for lubricants, mainly provided by oil and gas companies. Base oils and additives are then blended by lubricant manufacturers to create specific formulations. Manufacturers require high levels of research and development to create precise formulations that meet the end customers’ ever-evolving needs. Distributors then purchase the lubricants and leverage their supply chain expertise to manage warehousing, storage logistics and inventory management, as well as provide technical support.

The value of the global lubricants market is expected to grow at 1.3% per annum from 2023 to 2033 in real terms, according to Kline, and Moove is focused on specific profit pools within the broader industry. The profit pool of raw material suppliers, in which Moove is not present, expects only marginal growth from 2023 to 2033, according to Kline. Conversely, the profit pool of lubricant manufacturers and distributors is forecast to grow at higher rates, driven by a number of trends including the adoption of higher-value synthetic and semi-synthetic lubricants and consolidation within the highly fragmented distribution market.
With key capabilities in the highest growth lubricant blending and intermediary distribution segments of the value chain, Moove is well positioned to capitalize on these key industry tailwinds.
Our Competitive Strengths
We believe that as a scaled service provider to the lubricants value chain, we can capitalize on a number of favorable trends, particularly in light of the following competitive strengths:
We Have a Pure Strategic Focus on the Lubricants Market, Which We Believe Is Distinctive in Our Industry and Highly Valuable to Our Customers: Unlike many of our competitors, lubricants have been our exclusive focus for the last 15 years, enabling us to shape our operations to the evolving demands of our industry. As the market has grown, there has been an increase in product complexity and end-use requirements for lubricants, raising the barriers to entry for new market participants. The continued proliferation of customer needs and the associated technical expertise required are pushing lubricants producers to supply a broader and more technical range of products. In particular, the required investments in physical assets (plants, distribution centers, transport vehicles and information technology platforms) and working capital to consistently and efficiently service customers at attractive margins are meaningful in our industry.
Our strategic prioritization of lubricants has directed us to make investments that best address the specific needs of our customers – we have established supply chain, engineering, marketing and technical expertise to facilitate them. We have also accrued significant market intelligence and industry relationships through our operating history across our core markets, supporting our ability to determine how best to deploy capital within our portfolio.
As the marketplace has evolved, achieving the appropriate scale to fully address customers’ lubricants needs has also become more important. We are committed to allocating capital that is required for specialized equipment and a more sophisticated sourcing function is needed to offer a comprehensive product portfolio to the largest consumers. Our market penetration and business maturity are higher where we have operated for longer, but we have been thoughtful where and how we have entered markets, focusing on regions where we see clear growth opportunities. We have developed a robust understanding of how lubricants are used and marketed to ensure we can add real value to customers across all segments, such as industrial, consumer and commercial vehicles.
We Are a Customer-Orientated Specialty Lubricants Provider and Are Integrated Across the Value Chain: We focus on creating value from sourcing to end market and have capabilities in the supply of raw materials, formulation, manufacturing, distribution, sales, marketing and after-market services for our products. We operate in a complex industry and believe that our integrated value chain is a key competitive advantage that gives us scale, flexibility and efficiency.
We view product development and supplier relationships as two key enablers of our ability to supply our customers. The wide range of use cases for lubricants necessitates the ability to source a wide range of base stocks and additives to meet customers’ demands. By combining formulation capabilities and strategically selected relationships with both global and local suppliers, we are able to customize formulation, which is a key element to optimize production costs. We believe that our knowledge of and access to raw materials also allow us to capitalize on favorable pricing trends for our input chemicals, lowering our cost of production while maintaining our pricing model.
We have a dedicated team of engineers focused on developing and implementing customized solutions for each customer and industry we serve. We believe that our extensive knowledge of the entire value chain and vast experience in the lubricants market enable us to enhance productivity and improve service levels. Our customers are accustomed to a high level of service, with supply reliability being critical to their own operations, as well as logistical requirements and demand for high-touch service and performance. We believe that our experience, reliability and commitment to service are recognized differentiators in the market.
We Are a Natural Consolidator and Are Positioned to Capture the Tailwinds of a Massive Addressable Market: In our journey so far, we have proven our ability and commitment to also grow inorganically through acquisitions to extend our geographic reach and expand the capabilities that are most relevant to our customers. We actively maintain and monitor a pipeline of potential future acquisition opportunities that we believe could be additive to our business in the long term.
The complexity of the lubricants industry has increased as technology evolves, with the adoption of higher-value synthetic lubricants, and global economic development calls continuously for specialized products and services to meet new demand for the consumer, commercial and industrial sectors. The investments required to bring high-grade services to such a diversified customer portfolio have been one of the key consolidation factors. We believe that this need to invest is likely to reshape this highly fragmented industry, in which the five largest integrated producers represent only 35% of global market share and the remainder of the market is fragmented in over 1,000 independent lubricants producers, with just a few scaled, multinational platforms like our own.
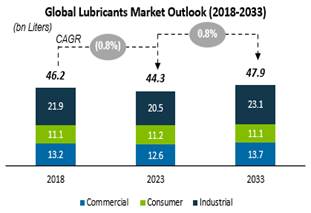
While we have achieved scale across a number of our markets, we believe there is a significant opportunity ahead supported by a large addressable market relative to our current aggregate volume. According to the Kline Report, the global addressable market for lubricants was 44 billion liters and US$162 billion in 2023, of which 21 billion liters and US$92 billion were accounted for by our core markets: North America, Europe and South America. We produced 0.7 billion liters, 0.5 billion liters and 0.4 billion liters in the years ended December 31, 2023, 2022 and 2021, respectively.
Over the next nine years up to 2033, according to the Kline Report, the global lubricants market is expected to grow to 48 billion liters, or to US$184.3 billion, with a total value increase of 14% in real terms over the same period related to a shift in products mix towards more sophisticated, premium formulations.
Our Unique Culture Has Been Fundamental in Delivering Strong Results: Moove has deliberately cultivated a culture that values people as its biggest asset, which we believe empowers us to achieve even greater potential across all the markets in which we operate. With a clear strategy and vision to become a global reference in lubricants, we have aimed to build a culture focused on three main strategic drivers, which support our ability to achieve our results:
| · | High Performance Teams: We foster an environment of trust and full business alignment across all areas of our company, with the appropriate incentives, which enables us to be productive, adaptable, flexible and agile. |
| · | Culture of Efficiency: We are constantly seeking the simplest and most efficient ways to achieve our goals, and we have a continuous improvement mindset that enables us to eliminate inefficiencies and to add value to the products and services we offer to our customers. |
| · | Business Expansion: We have clarity on where, when and how much to invest in human capital, operating assets and market intelligence, which allows us to consistently enhance our core processes and capabilities. |
We are led by a senior leadership team with best-in-class industry experience, including our Chief Executive Officer, Filipe Affonso Ferreira, who has almost eight years’ experience at the company, and our Chief Financial Officer, Lineu Paulo Moran Filho, who has more than two decades’ experience in the industry, including over a decade with Moove. Collectively, the full leadership team consists of eight seasoned professionals with over 80 years of combined industry experience.
We believe that our cultural pillars, which we refer to as the “Moove attitudes,” foster an environment of trust and are conducive to high performance at the senior leadership level and throughout the entire business. The Moove attitudes are: (i) “We are in this together,” a conviction that teamwork beats individualism every time, (ii) “Open Mind,” we encourage decision-makers at all levels to think outside the box, (iii) “Real Talk,” everyone’s frank and unvarnished opinion is expected and encouraged in the spirit of reaching the best outcomes for our business as a whole, (iv) “Always Safe,” we focus on safety across our production, marketing, systems, distribution processes and finance, and (v) “Think Big, Keep it Simple,” we aim high but keep our feet on the ground, with focus on execution.
We Have Instituted a Proprietary Operating Model Across Our Portfolio to Drive Consistency and Aid New Market Penetration—the Moove Performance System: We have developed a proprietary performance methodology, the Moove Performance System, or MPS, which allows us to deliver quality and consistent service and support our financial objectives across all of our markets. MPS starts with the deployment of our culture, the “walk the talk” of our values and principles, and the expected behaviors of our employees, our Moovers. MPS serves as a guideline of value drivers for both customers and the business, constantly striving for continuous improvement and growth, and is centered around the primary value creation levers in our business and our people.
As a business we invest in strategies that create value for all of our stakeholders, in product supply, manufacturing and marketing through a robust portfolio, as well as in enhancing our corporate governance and strengthening our assets—our people, operations and intelligence. This model serves as a blueprint for how we can go to market across new geographies, product lines and services, tailoring our past experiences to the maturity and specific needs of each business and local market to efficiently expand our operations.
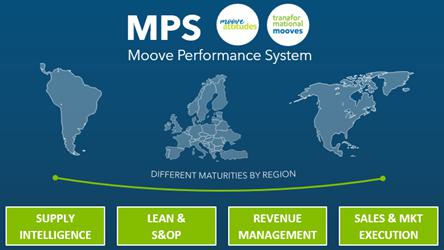
Underpinning MPS are four key value creation levers:
| (i) | Supply Intelligence: We strive to achieve predictability across an integrated value chain by using data to increase efficiency and value extraction. Our strategy includes tools for differentiation, connecting global and national chains, and integrating all areas of the business to access strategic market information, product availability, customer diversification and geographic reach. |
| (ii) | Lean Methodology and Sales and Operations Planning, or S&OP: We value our assets, promote operational dynamism, synchronicity and alignment through S&OP, and believe we have the capacity for analysis, response and agile decision-making. Our lean program serves as the model guiding us toward efficiency, supported by six key tools: 5S, Kaizen, Value Stream Mapping, or VSM, PDCA A3, Standardized Work, or TP, and SMED. |
| (iii) | Revenue Management: We manage revenue by enhancing our customers’ perception of value, through appropriate marketing propositions and intelligent market-back pricing by product, by channel and by region. |
| (iv) | Sales and Marketing Execution: We focus on long-term relationships with our customers, on strong brand communication and on having our sales and marketing people appropriately allocated on the field. Thus, we can provide high service levels, which includes delivering product availability and performance, as well as technical and/or marketing support required to meet and exceed their needs. |
The impact of MPS on our operations is also reflected in our financial performance and the incremental margin we are able to deliver through our network. For example, in our South America business, where we have been able to implement our core initiatives over a longer period, we were able to reach a significant market share (20% in Brazil in 2023, from 10.6% in 2008, according to IBP) and achieve higher margins with strong cash flow generation.
We Have a Highly Strategic Partnership with ExxonMobil and Key Partners That Has Helped Underpin Our Growth in New Markets: ExxonMobil is the largest finished lubricants synthetic marketer, one of the largest and the most reliable supplier of base oils and a global leader in research and development in our industry. Our long-standing relationship with ExxonMobil has given Moove a differentiated knowledge, experience and ability to service Mobil branded products across the value chain, including manufacturing, distribution, sales and marketing. The success of the Strategic Alliance Model in South America, which can be illustrated by the Mobil market share growth in Brazil in the past 15 years, revealed the complementary strengths of both companies and paved the route for Moove’s international expansion.
In our history, we were able to develop long-term-oriented relationships with additive suppliers, which has been fundamental in our growth and international expansion journey. As an example, Moove today is a relevant customer for Infineum and Lubrizol, two of the main global suppliers of additives. In the base oils and specialties universe, beyond the ExxonMobil relationship, we have established strong relationships with Ergon Specialty Oils, S-Oil Corporation and SK Enmove, among others. Focused on servicing all segments, we rely on the joint work among these partners and our technology team to develop and improve our proprietary brands offering, which complements the Mobil branded portfolio, allowing us to provide lubricants solutions to all end markets.
Our Growth Strategy
Our vision is to become a global reference in the lubricants market. To that end, the principal components of our growth strategy are:
MPS Deployment in All Markets in Which We Operate, to Drive Organic Growth, Incremental Adjusted EBITDA and Cash Flow Generation: We are focused on continually improving our core processes and enhancing our capabilities so that our MPS operating model can be enhanced and applied globally in all markets. Our model includes driving incremental value at the unit level by rapidly building market intelligence after entering a new market, adjusting our cost base and working capital requirements to the specific needs of the customers and unlocking incremental profit through revenue management, marketing programs and engineering solutions. This approach has long been active in South America and has translated into significant organic Adjusted EBITDA and ROIC expansion, as well as facilitating an increase of our market share in Brazil.
We are now in the process of enhancing and implementing MPS in all regions in which we operate, including in our recently acquired PetroChoice assets in the United States, where scale and portfolio will offer meaningful opportunities in the short, mid and long term. Also, we are focused on potentializing the impact of the MPS in our operations in Europe, where we just finalized the implementation of a common enterprise resource planning for the region, where the simplification of processes and business will unlock several value creation opportunities.
Expansion through “Organic-Like” M&A Can Unlock Differentiated Growth: In our path to becoming a global reference in lubricants, we prioritize acquisitions to complement organic growth in our current markets and to expand into new markets. This approach is supported by a market structure that remains very regional and fragmented, and that requires deep insights into how to service customers when regulations and product needs can vary between jurisdictions. We have built a robust M&A function to identify potential acquisitions and have invested in personnel experienced in business integration, evidenced by repeated market entry success. We actively monitor potential future acquisition opportunities that we believe could be additive to our business in the long term.
We believe there is a large market opportunity in Europe where our existing systems make operations scalable and able to integrate smaller players. Our focus is on predictable and profitable businesses that are respected by their customers, with opportunities to grow margins through our MPS model. We see a similar opportunity to deploy our expertise at a high return with larger customers with complex procurement needs in North America. We believe that our existing asset base in North America, with a network of 48 distribution centers, will position us to pursue an inorganic growth strategy centered on optimization of supply chains and expansion of our product and customer channels.
Capitalizing on the Increasing Adoption of High-Margin Synthetic Lubricants and E-Fluids: As innovations in the internal combustion engine (in particular) continue to drive greater input requirements across the supply chain, equipment operators are increasingly moving toward lower viscosity synthetic lubricants due to their superior performance, increased efficiency, extended life and better protection. We have technical expertise across the value chain, allowing us to service the premium products applications our customers need. Customers look for our close collaboration for a broader suite of products as their needs evolve. Synthetic lubricants command premium pricing, and as the mix shift in the market plays out, we are able to generate higher unit margins within our portfolio.
A similar effect is evident in the electric vehicle value chain. While these vehicles have fewer moving parts, they require more specialized and higher-performing lubricants and coolants. We have the optionality to leverage our ExxonMobil relationship to access proprietary edge technology and develop solutions in this nascent market.
These premium products command unit margins considerably higher than conventional lubricant products. According to the Kline Report, premium lubricants (that have fully synthetic and semi-synthetic components in their composition) are projected to achieve a market share of 37% by volume globally by 2040 (from 29% in 2023), and account for 56% of the sales revenue (from 43% in 2023), owing to their higher retail prices. This growth in market share of premium lubricants will be the key driver behind global market growth over the forecast period. We believe that our intimate relationships with customers, our deep supplier relationships, our specific formulation and manufacturing capabilities and our infrastructure and logistics expertise will allow us to best serve the premium market.
Recent Developments
On September 4, 2024, our subsidiary Millennium Moove Corp. signed an amendment to our syndicated loan, entered into on May 23, 2022 in connection with our acquisition of PetroChoice. The amendment provides: (i) that the outstanding principal amount will be due in a single installment on the maturity date (May 3, 2027), instead of six bi-annual instalments; (ii) that the interest rate will be equal to term SOFR plus an additional applicable rate which ranges from 1.50% to 1.75% depending on the net leverage ratio (as defined in the facility), instead of ranging from 1.50% to 2.75% depending on the net leverage ratio and the time remaining to maturity; and (iii) for the removal of a mandatory prepayment requirement in the event we raise funds in excess of US$300 million in the capital markets. As a result, the maturity profile of our consolidated outstanding indebtedness increased to 2.7 years from 1.8 years, as of August 31, 2024. See also “Business—Material Agreements—PetroChoice Acquisition Facility.”
Risk Factors Summary
Investing in our common shares involves risks. You should carefully consider the risks described in “Risk Factors” before making a decision to invest in our common shares. If any of these risks actually occur, our business, financial condition or results of operations would likely be materially adversely affected. In such case, the trading price of our common shares would likely decline, and you could lose all or part of your investment. The following is a summary of some of the principal risks we face:
Risks Relating to Our Business and Industry
| · | Our rights to blend, market and sell ExxonMobil products are dependent on our agreements with ExxonMobil, the expiration or termination of which would adversely affect our business, results of operations, financial condition and prospects. |
| · | Our business depends on our relationship with ExxonMobil and changes in this relationship may adversely affect our business, results of operations and financial condition. |
| · | Loss of a significant manufacturing facility or disruptions within our supply chain or in transportation could have a material adverse effect on our business, financial position and results of operations. |
| · | Our ability to maintain and to continue to expand our margins depends, in part, on our ability to pass on raw material costs to our customers, and our inability to do so would harm our margins and prospects. |
| · | We have been and could in the future be the target of attempted cyberattacks, which may adversely affect our business. |
| · | Reliance on a limited base of third-party contract manufacturers, logistics providers and suppliers of raw materials and components may result in disruption to our business and this could adversely affect our financial condition and results of operations. |
| · | We may not be able to maintain or renew certain other agreements with third parties which are important to our business. |
| · | The modification, suspension, cancellation or non-renewal of the tax benefits which we have been granted, changes to current interpretations of tax laws as these apply to us, or any restrictions on the offsetting of tax credits could have a material adverse effect on us. |
| · | Any failure of our information technology systems could adversely affect our operating results and make us more susceptible to cyber threats, adversely affecting our business. |
| · | In certain markets, we rely on our distributor network and third-party delivery services for the distribution and export of certain of our products. A significant disruption in these services due to external competition or factors outside of our control or significant increases in the prices for these services may disrupt our ability to export material or increase our costs. |
| · | We are exposed to the possibility of losses related to natural disasters, catastrophes, accidents, fire, political, social and economic events, terrorist acts, wars, and other events not in our control, which may have a material adverse effect on our business, financial condition and results of operations. |
Risks Relating to the Countries in Which We Operate
| · | Difficult market and geopolitical conditions can adversely affect our business in many ways, each of which could materially reduce our revenue, earnings and cash flow and adversely affect our financial prospects and condition. |
| · | Our business may be materially adversely affected by unfavorable economic, political, social or other developments and risks in the countries in which we operate. |
| · | Inflation and government measures to curb inflation may adversely affect the economies and capital markets in some of the countries in which we operate, and as a result, harm our business, financial condition and results of operations, as well as the trading price of our common shares. |
| · | Changes and uncertainties in the tax system in the countries in which we have operations could materially adversely affect our financial condition and results of operations, and reduce net returns to our shareholders. |
| · | We are subject to financial risks as a result of our operations, including exposure to foreign currency fluctuations and the impact of foreign currency restrictions. |
| · | Political events in the countries in which we operate, particularly in South America, may have an influence on the performance of the local economy and the confidence of investors and the general public. |
| · | Developments and the perception of risk may adversely affect the economies of the countries in which we operate and the trading price of our securities. |
| · | Our operations expose us to political and economic risks in the countries in which we operate. |
| · | We are subject to extensive regulation of our operations that could adversely affect our business and results of operations. |
Risks Relating to Our Common Shares and the Offering
| · | There is no existing market for our common shares, and we do not know whether one will develop to provide you with adequate liquidity. If the trading price of our common shares fluctuates after this offering, you could lose a significant part of your investment. |
| · | Cosan will own % of our common shares after this offering. This concentration of ownership and voting power will limit your ability to influence corporate matters. |
| · | Future sales of a substantial number of common shares in the public market following this offering, or the perception that such sales could occur, could cause the price of our common shares to decline. |
| · | Our Memorandum and Articles of Association contain anti-takeover provisions that may discourage a third party from acquiring us and adversely affect the rights of holders of our common shares. |
| · | If securities or industry analysts do not publish research, or publish inaccurate or unfavorable research, about our business, the price of our common shares and our trading volume could decline. |
| · | We may not pay any cash dividends in the foreseeable future. |
| · | New investors in our common shares will experience immediate and substantial dilution after this offering. |
Corporate Information
We are a Cayman Islands exempted company incorporated with limited liability. We were incorporated as Moove Lubricants Holdings on September 5, 2023. Our principal executive offices are located at Av. Brigadeiro Faria Lima, 4,100 – 8th floor São Paulo – SP, 04538-132, Brazil, and our telephone number at this address is +55 11 4517-1546. Our website address is https://moovelub.com/en.php. Information contained on, or that can be accessed through, our website is not part of, or incorporated by reference into, this prospectus, and inclusions of our website address in this prospectus are inactive textual references only.
Implications of Being a Controlled Company
Upon the completion of this offering, Cosan will continue to control a majority of the voting power of our common shares. As a result, we will be a “controlled company” as defined under the NYSE listing rules because our controlling shareholder will hold more than 50% of the voting power for the election of directors. As a “controlled company,” we may elect not to comply with certain corporate governance standards. See “Risk Factors—Risks Relating to Our Common Shares and the Offering—We are a ‘controlled company’ within the meaning of the NYSE listing standards and, as a result, will qualify for, and intend to rely on, exemptions from certain corporate governance requirements.”
The Offering
This summary highlights information presented in greater detail elsewhere in this prospectus. This summary is not complete and does not contain all the information you should consider before investing in our common shares. You should carefully read this entire prospectus before investing in our common shares, including “Risk Factors” and our consolidated financial statements and notes thereto included elsewhere in this prospectus.
| Issuer | Moove Lubricants Holdings |
| Common shares offered by us | common shares (or common shares if the underwriters exercise in full their over-allotment option). |
| Common shares offered by the selling shareholders | common shares (or common shares if the underwriters exercise in full their over-allotment option). |
| Common shares to be outstanding immediately after this offering | common shares (or common shares if the underwriters exercise in full their over-allotment option). |
Option to purchase additional common
shares | We and the selling shareholders have granted the underwriters the right to purchase up to an additional common shares from us and up to an additional common shares from the selling shareholders within 30 days of the date of this prospectus, at the public offering price, less underwriting discounts and commissions, on the same terms as set forth in this prospectus. We will not receive any proceeds from the sale of common shares by the selling shareholders. |
| Use of proceeds | We estimate that the net proceeds from the sale of our common shares in this offering will be approximately R$ (or approximately R$ if the underwriters’ option to purchase additional common shares is exercised in full), based upon the assumed initial public offering price of R$ per share, which is the midpoint of the estimated offering price range set forth on the cover page of this prospectus, and after deducting estimated underwriting discounts and commissions and estimated offering expenses payable by us. We intend to use the net proceeds from this offering for general corporate purposes, including working capital. Additionally, we may use a portion of the net proceeds to acquire or invest in businesses, products, services or technologies. However, we do not have agreements or commitments for any material acquisitions or investments at this time. We will not receive any proceeds from the sale of common shares by the selling shareholders. See the section titled “Use of Proceeds” for additional information. |
| Concentration of ownership | Upon completion of this offering, Cosan, our executive officers and directors, and holders of 5% or more of our common shares will beneficially own, in the aggregate, approximately % of our outstanding common shares. |
| Voting rights | The common shares will be entitled to one vote per share. |
| Listing | We have applied to list our common shares on the NYSE, under the symbol “MOOV.” |
| Dividend policy | We have not adopted a dividend policy with respect to future distributions of dividends. The amount of any distributions will depend on many factors, such as our results of operations, financial condition, cash requirements, prospects and other factors deemed relevant by our board of directors and controlling shareholders. We may not pay any cash dividends in the foreseeable future. See “Dividends and Dividend Policy” and “Description of Share Capital—Dividends and Capitalization of Profits.” |
| Lock-up agreements | We have agreed with the underwriters, subject to certain exceptions, not to offer, sell or dispose of any shares of our share capital or securities convertible into or exchangeable or exercisable for any shares of our share capital during the 180-day period following the date of this prospectus. Members of our board of directors, our executive officers and our principal shareholders have agreed to substantially similar lock-up provisions, subject to certain exceptions. See “Underwriting.” |
| Risk factors | See “Risk Factors” and the other information included in this prospectus for a discussion of factors you should consider before deciding to invest in our common shares. |
The number of common shares that will be outstanding after this offering is based on common shares outstanding as of , 2024, and excludes ..
All unvested share options under our stock option plan constituting shares in the aggregate will automatically vest upon the consummation of this offering. This will, immediately following this offering, dilute by approximately % the interest in our issued share capital of holders of our common shares.
Unless otherwise indicated, all information contained in this prospectus assumes:
| · | the effectiveness of our amended and restated Memorandum and Articles of Association in the Cayman Islands, which will occur immediately prior to the completion of this offering; and |
| · | no exercise of the option granted to the underwriters to purchase up to additional common shares in connection with this offering. |
Summary Consolidated Financial and Other Data
The following tables set forth, for the periods and as of the dates indicated, our summary financial and operating data. Our historical results are not necessarily indicative of the results that may be expected in the future. This information should be read in conjunction with “Presentation of Financial and Other Information,” “Management’s Discussion and Analysis of Financial Condition and Results of Operations” and our consolidated financial statements, including the notes thereto, included elsewhere in this prospectus.
The summary statements of financial position as of June 30, 2024 and the consolidated statements of profit or loss for the six months ended June 30, 2024 and 2023 have been derived from our unaudited interim condensed consolidated financial statements included elsewhere in this prospectus, prepared in accordance with IFRS, as issued by the IASB. The summary statements of financial position as of December 31, 2023 and 2022 and the consolidated statements of profit or loss for the years ended December 31, 2023, 2022 and 2021 have been derived from our audited consolidated financial statements included elsewhere in this prospectus, prepared in accordance with IFRS, as issued by the IASB.
Statement of Profit or Loss Data
| | | For the Six Months Ended June 30, | | For the Year Ended December 31, |
| | | 2024 | | 2024 | | 2023 | | 2023 | | 2023 | | 2022 | | 2021 |
| | | US$(1) | | R$ | | US$(1) | | R$ |
| | | (in millions, except as otherwise noted) |
| Revenue | | | 903.9 | | | | 5,024.8 | | | | 5,104.3 | | | | 1,812.3 | | | | 10,074.2 | | | | 8,886.3 | | | | 6,036.7 | |
| Cost of sales and services | | | (645.4 | ) | | | (3,587.8 | ) | | | (3,728.6 | ) | | | (1,311.3 | ) | | | (7,289.4 | ) | | | (6,925.6 | ) | | | (4,699.0 | ) |
| Gross profit | | | 258.5 | | | | 1,437.0 | | | | 1,375.6 | | | | 501.0 | | | | 2,784.8 | | | | 1,960.7 | | | | 1,337.7 | |
| Selling expenses | | | (118.1 | ) | | | (656.6 | ) | | | (617.5 | ) | | | (218.5 | ) | | | (1,214.5 | ) | | | (1,122.6 | ) | | | (583.4 | ) |
| General and administrative expenses | | | (73.6 | ) | | | (409.2 | ) | | | (267.8 | ) | | | (113.5 | ) | | | (630.8 | ) | | | (372.2 | ) | | | (275.9 | ) |
| Other operating income (expenses), net | | | 6.2 | | | | 34.6 | | | | (22.2 | ) | | | (3.3 | ) | | | (18.5 | ) | | | 29.0 | | | | 23.4 | |
Profit before finance results and
taxes | | | 73.0 | | | | 405.8 | | | | 468.2 | | | | 165.7 | | | | 920.9 | | | | 495.0 | | | | 501.8 | |
| Financial results, net | | | (8.0 | ) | | | (44.2 | ) | | | (138.2 | ) | | | (57.5 | ) | | | (319.7 | ) | | | (107.1 | ) | | | (63.8 | ) |
| Profit before taxes | | | 65.0 | | | | 361.6 | | | | 330.0 | | | | 108.2 | | | | 601.2 | | | | 387.8 | | | | 438.0 | |
| Income taxes – current | | | (20.8 | ) | | | (115.6 | ) | | | (240.3 | ) | | | (53.4 | ) | | | (296.7 | ) | | | (45.4 | ) | | | (81.7 | ) |
| Income taxes – deferred | | | (1.5 | ) | | | (8.4 | ) | | | (148.1 | ) | | | (6.9 | ) | | | (38.6 | ) | | | 71.7 | | | | (66.2 | ) |
| Total income taxes | | | (22.3 | ) | | | (124.0 | ) | | | (388.4 | ) | | | (60.3 | ) | | | (335.2 | ) | | | 26.3 | | | | (147.9 | ) |
| Profit (loss) for the period/year | | | 42.7 | | | | 237.6 | | | | (58.4 | ) | | | 47.9 | | | | 266.0 | | | | 414.2 | | | | 290.1 | |
| Attributable to equity holders of the parent | | | 42.7 | | | | 237.6 | | | | (58.5 | ) | | | 47.8 | | | | 265.7 | | | | 413.9 | | | | 287.9 | |
| Attributable to non-controlling interests | | | 0.0 | | | | 0.0 | | | | 0.1 | | | | 0.1 | | | | 0.3 | | | | 0.3 | | | | 2.2 | |
| Earnings per share: | | | | | | | | | | | | | | | | | | | | | | | | | | | | |
| Basic and diluted earnings per share (R$) | | | 1.22 | | | | 6.79 | | | | (1.67 | ) | | | 1.37 | | | | 7.60 | | | | 11.84 | | | | 8.23 | |
| (1) | For convenience purposes only, amounts in reais for the six months ended June 30, 2024 and the year ended December 31, 2023 have been translated to U.S. dollars using an exchange rate of R$5.5589 to US$1.00, the commercial selling rate for U.S. dollars as of June 30, 2024 as reported by the Central Bank. These convenience translations should not be considered representations that any such amounts have been, could have been or could be converted at that or any other exchange rate. |
Balance Sheet Data
| | | As of June 30, | | As of December 31, |
| | | 2024 | | 2024 | | 2023 | | 2023 | | 2022 |
| | | US$(1) | | R$ | | US$(1) | | R$ |
| | | (in millions) |
| Total current assets | | | 711.3 | | | | 3,954.1 | | | | 618.4 | | | | 3,437.7 | | | | 3,917.7 | |
| Total non-current assets | | | 876.3 | | | | 4,871.0 | | | | 798.7 | | | | 4,439.9 | | | | 4,983.4 | |
| Total assets | | | 1,587.6 | | | | 8,825.1 | | | | 1,417.1 | | | | 7,877.6 | | | | 8,901.1 | |
| Total current and non-current liabilities | | | 1,277.4 | | | | 7,101.0 | | | | 1,009.8 | | | | 5,613.1 | | | | 6,616.0 | |
| Total equity | | | 310.2 | | | | 1,724.1 | | | | 407.4 | | | | 2,264.5 | | | | 2,285.0 | |
| Total liabilities and equity | | | 1,587.6 | | | | 8,825.1 | | | | 1,417.1 | | | | 7,877.6 | | | | 8,901.1 | |
| (1) | For convenience purposes only, amounts in reais as of June 30, 2024 and December 31, 2023 have been translated to U.S. dollars using an exchange rate of R$5.5589 to US$1.00, the commercial selling rate for U.S. dollars as of June 30, 2024 as reported by the Central Bank. These convenience translations should not be considered representations that any such amounts have been, could have been or could be converted at that or any other exchange rate. |
Non-GAAP Financial Measures
This prospectus presents our Adjusted EBITDA, Adjusted EBITDA Margin, Unit Adjusted EBITDA, Cash Flow Conversion, Net Debt, Net Debt to Adjusted EBITDA Ratio, ROIC and Operating Working Capital and their respective reconciliations for the convenience of investors, which are non-GAAP financial measures. A non-GAAP financial measure is generally defined as a numerical measure of historical or future financial performance, financial position, or cash flow that purports to measure financial performance but excludes or includes amounts that would not be so adjusted in the most comparable IFRS measure. For further information on why our management chooses to use these non-GAAP financial measures, and on the limits of using these non-GAAP financial measures, please see “Presentation of Financial and Other Information—Special Note Regarding Non-GAAP Financial Measures.”
Adjusted EBITDA and Adjusted EBITDA Margin
The following table sets forth a reconciliation of our profit (loss) for the period/year to Adjusted EBITDA and Adjusted EBITDA Margin, for each of the periods indicated.
| | | For the Six Months Ended
June 30, | | For the Year Ended December 31, |
| | | 2024 | | 2024 | | 2023 | | 2023 | | 2023 | | 2022 | | 2021 |
| | | US$(1) | | R$ | | US$(1) | | R$ |
| | | (in millions, except ratios) |
| Profit (loss) for the period/year | | | 42.7 | | | | 237.6 | | | | (58.4 | ) | | | 47.9 | | | | 266.0 | | | | 414.2 | | | | 290.1 | |
| (+) Income taxes (current and deferred) | | | 22.3 | | | | 124.0 | | | | 388.4 | | | | 60.3 | | | | 335.2 | | | | (26.3 | ) | | | 147.9 | |
| (+) Financial results, net | | | 8.0 | | | | 44.2 | | | | 138.2 | | | | 57.5 | | | | 319.7 | | | | 107.1 | | | | 63.8 | |
(+) Depreciation and
amortization | | | 31.3 | | | | 173.8 | | | | 165.2 | | | | 58.0 | | | | 322.2 | | | | 242.6 | | | | 97.2 | |
| (+) Expenses with equity compensation plan (2) | | | 17.6 | | | | 97.8 | | | | — | | | | — | | | | — | | | | — | | | | — | |
| (+) Expenses with initial public offering (3) | | | 2.3 | | | | 12.8 | | | | — | | | | — | | | | — | | | | — | | | | — | |
| Adjusted EBITDA(4) | | | 124.2 | | | | 690.2 | | | | 633.4 | | | | 223.6 | | | | 1,243.1 | | | | 737.6 | | | | 599.0 | |
| Revenue | | | 903.9 | | | | 5,024.8 | | | | 5,104.3 | | | | 1,812.3 | | | | 10,074.2 | | | | 8,886.3 | | | | 6,036.7 | |
| Profit (loss) margin (5) | | | 4.7 | % | | | 4.7 | % | | | (1.1 | )% | | | 2.6 | % | | | 2.6 | % | | | 4.7 | % | | | 4.8 | % |
| Adjusted EBITDA Margin(6) | | | 13.7 | % | | | 13.7 | % | | | 12.4 | % | | | 12.3 | % | | | 12.3 | % | | | 8.3 | % | | | 9.9 | % |
| (1) | For convenience purposes only, amounts in reais for the six months ended June 30, 2024 and the year ended December 31, 2023 have been translated to U.S. dollars using an exchange rate of R$5.5589 to US$1.00, the commercial selling rate for U.S. dollars as of June 30, 2024 as reported by the Central Bank. These convenience translations should not be considered representations that any such amounts have been, could have been or could be converted at that or any other exchange rate. |
| (2) | Expenses incurred in connection with our equity-compensation plan linked to the occurrence of our initial public offering. |
| (3) | Non-recurring expenses related to our initial public offering. |
| (4) | We calculate Adjusted EBITDA as profit (loss) for the period/year plus income taxes (current and deferred), financial results, net, depreciation and amortization, non-recurring expenses related to our initial public offering and expenses incurred in connection with our equity-compensation plan linked to the occurrence of our initial public offering. Adjusted EBITDA is a non-GAAP measure. Adjusted EBITDA is not a substitute for its component IFRS measures or IFRS measures of earnings or profit (loss) for the period/year. Additionally, our calculation of Adjusted EBITDA may be different from the calculation used by other companies, including competitors in our industry, and may therefore not be comparable to similarly named metrics of other companies. For further information, see “Presentation of Financial and Other Information—Special Note Regarding Non-GAAP Financial Measures—Adjusted EBITDA and Adjusted EBITDA Margin.” |
| (5) | We calculate profit (loss) margin by dividing our profit (loss) for the period/year by our revenue. |
| (6) | We calculate Adjusted EBITDA Margin by dividing Adjusted EBITDA by our revenue. Adjusted EBITDA Margin is a non-GAAP measure. Adjusted EBITDA Margin is not a substitute for its component IFRS measures or IFRS measures of earnings or profit (loss) for the period/year. Additionally, our calculation of Adjusted EBITDA Margin may be different from the calculation used by other companies, including competitors in our industry, and may therefore not be comparable to similarly named metrics of other companies. For further information, see “Presentation of Financial and Other Information—Special Note Regarding Non-GAAP Financial Measures—Adjusted EBITDA and Adjusted EBITDA Margin.” |
Unit Adjusted EBITDA
The following table sets forth a reconciliation of our profit (loss) for the period/year to Unit Adjusted EBITDA, for each of the periods indicated.
| | | For the Six Months Ended
June 30, | | For the Year Ended December 31, |
| | | 2024 | | 2024 | | 2023 | | 2023 | | 2023 | | 2022 | | 2021 |
| | | US$(1) | | R$ | | R$ |
| | | (in millions, except ratios) |
| Profit (loss) for the period/year | | | 42.7 | | | | 237.6 | | | | (58.4 | ) | | | 47.9 | | | | 266.0 | | | | 414.2 | | | | 290.1 | |
| (+) Income taxes (current and deferred) | | | 22.3 | | | | 124.0 | | | | 388.4 | | | | 60.3 | | | | 335.2 | | | | (26.3 | ) | | | 147.9 | |
| (+) Financial results, net | | | 8.0 | | | | 44.2 | | | | 138.2 | | | | 57.5 | | | | 319.7 | | | | 107.1 | | | | 63.8 | |
| (+) Depreciation and amortization | | | 31.3 | | | | 173.8 | | | | 165.2 | | | | 58.0 | | | | 322.2 | | | | 242.6 | | | | 97.2 | |
| (+) Expenses with equity compensation plan(2) | | | 17.6 | | | | 97.8 | | | | — | | | | — | | | | — | | | | — | | | | — | |
| (+)Expenses with initial public offering(3) | | | 2.3 | | | | 12.8 | | | | — | | | | — | | | | — | | | | — | | | | — | |
| Adjusted EBITDA(a)(4) | | | 124.2 | | | | 690.2 | | | | 633.4 | | | | 223.6 | | | | 1,243.1 | | | | 737.6 | | | | 599.0 | |
| Volume of lubricants sold (in millions of liters)(b) | | | 324.4 | | | | 324.4 | | | | 327.1 | | | | 665.5 | | | | 665.5 | | | | 524.7 | | | | 388.7 | |
| Unit Adjusted EBITDA((a)/(b))(5) | | | 0.38 | | | | 2.13 | | | | 1.94 | | | | 0.34 | | | | 1.87 | | | | 1.41 | | | | 1.54 | |
| (1) | For convenience purposes only, amounts in reais for the six months ended June 30, 2024 and the year ended December 31, 2023 have been translated to U.S. dollars using an exchange rate of R$5.5589 to US$1.00, the commercial selling rate for U.S. dollars as of June 30, 2024 as reported by the Central Bank. These convenience translations should not be considered representations that any such amounts have been, could have been or could be converted at that or any other exchange rate. |
| (2) | Expenses incurred in connection with our equity-compensation plan linked to the occurrence of our initial public offering. |
| (3) | Non-recurring expenses related to our initial public offering. |
| (4) | We calculate Adjusted EBITDA as profit (loss) for the period/year plus income taxes (current and deferred), financial results, net, depreciation and amortization, non-recurring expenses related to our initial public offering and expenses incurred in connection with our equity-compensation plan linked to the occurrence of our initial public offering. Adjusted EBITDA is a non-GAAP measure. Adjusted EBITDA is not a substitute for its component IFRS measures or IFRS measures of earnings or profit (loss) for the period/year. Additionally, our calculation of Adjusted EBITDA may be different from the calculation used by other companies, including competitors in our industry, and may therefore not be comparable to similarly named metrics of other companies. For further information, see “Presentation of Financial and Other Information—Special Note Regarding Non-GAAP Financial Measures—Adjusted EBITDA and Adjusted EBITDA Margin.” |
| (5) | We calculate Unit Adjusted EBITDA as profit (loss) for the period/year plus income taxes (current and deferred), financial results, net, depreciation and amortization, non-recurring expenses related to our initial public offering and expenses incurred in connection with our equity-compensation plan linked to the occurrence of our initial public offering, and divided by volume of lubricants sold. Unit Adjusted EBITDA is a non-GAAP measure. Unit Adjusted EBITDA is not a substitute for its component IFRS measures or IFRS measures of earnings or profit (loss) for the period/year. Additionally, our calculation of Unit Adjusted EBITDA may be different from the calculation used by other companies, including competitors in our industry, and may therefore not be comparable to similarly named metrics of other companies. For further information, see “Presentation of Financial and Other Information—Special Note Regarding Non-GAAP Financial Measures—Unit Adjusted EBITDA.” |
Cash Flow Conversion
The following table sets forth a reconciliation of our net cash flows from operating activities to Cash Flow Conversion, for each of the periods indicated.
| | | For the Six Months Ended
June 30, | | For the Year Ended December 31, |
| | | 2024 | | 2024 | | 2023 | | 2023 | | 2023 | | 2022 | | 2021 |
| | | US$(1) | | R$ | | US$(1) | | R$ |
| | | (in millions, except ratios) |
| Net cash flows from operating activities | | | 31.6 | | | | 175.4 | | | | 377.5 | | | | 181.4 | | | | 1,008.5 | | | | 700.0 | | | | 59.7 | |
| (+) Acquisition of property, plant and equipment and intangible assets | | | (15.9 | ) | | | (88.2 | ) | | | (87.0 | ) | | | (33.9 | ) | | | (188.7 | ) | | | (109.3 | ) | | | (42.7 | ) |
| Free cash flow | | | 15.7 | | | | 87.2 | | | | 290.5 | | | | 147.5 | | | | 819.8 | | | | 590.7 | | | | 17.0 | |
| Adjusted EBITDA(2) | | | 124.2 | | | | 690.2 | | | | 633.4 | | | | 223.6 | | | | 1,243.1 | | | | 737.6 | | | | 599.0 | |
| Cash Flow Conversion(3) | | | 12.6 | % | | | 12.6 | % | | | 45.9 | % | | | 65.9 | % | | | 65.9 | % | | | 80.1 | % | | | 2.8 | % |
| (1) | For convenience purposes only, amounts in reais for the six months ended June 30, 2024 and the year ended December 31, 2023 have been translated to U.S. dollars using an exchange rate of R$5.5589 to US$1.00, the commercial selling rate for U.S. dollars as of June 30, 2024 as reported by the Central Bank. These convenience translations should not be considered representations that any such amounts have been, could have been or could be converted at that or any other exchange rate. |
| (2) | We calculate Adjusted EBITDA as profit (loss) for the period/year plus income taxes (current and deferred), financial results, net, depreciation and amortization, non-recurring expenses related to our initial public offering and expenses incurred in connection with our equity-compensation plan linked to the occurrence of our initial public offering. Adjusted EBITDA is a non-GAAP measure. Adjusted EBITDA is not a substitute for its component IFRS measures or IFRS measures of earnings or profit (loss) for the period/year. Additionally, our calculation of Adjusted EBITDA may be different from the calculation used by other companies, including competitors in our industry, and may therefore not be comparable to similarly named metrics of other companies. For further information, see “Presentation of Financial and Other Information—Special Note Regarding Non-GAAP Financial Measures—Adjusted EBITDA and Adjusted EBITDA Margin.” |
| (3) | We calculate Cash Flow Conversion as free cash flow divided by Adjusted EBITDA. We calculate free cash flow as net cash flows from operating activities plus acquisition of property, plant and equipment and intangible assets. Cash Flow Conversion is a non-GAAP measure. Cash Flow Conversion is not a substitute for its component IFRS measures or IFRS measures of cash flow or liquidity for the period. Additionally, our calculation of Cash Flow Conversion may be different from the calculation used by other companies, including competitors in our industry, and may therefore not be comparable to similarly named metrics of other companies. For further information, see “Presentation of Financial and Other Information—Special Note Regarding Non-GAAP Financial Measures—Cash Flow Conversion.” |
Net Debt and Net Debt to Adjusted EBITDA Ratio
The following table sets forth a reconciliation of our loans and borrowings (current and non-current) and derivative financial instruments (current) to our Net Debt and our Net Debt to Adjusted EBITDA Ratio, as of each of the dates indicated.
| | | As of and for the Six Months Ended June 30, | | As of and for the Year Ended December 31, |
| | | 2024 | | 2024 | | 2023 | | 2023 | | 2022 |
| | | US$(1) | | R$ | | US$(1) | | R$ |
| | | (in millions) |
| Loans and borrowings (current) | | | 138.3 | | | | 768.6 | | | | 117.5 | | | | 652.9 | | | | 502.2 | |
| (+) Loans and borrowings (non-current) | | | 448.4 | | | | 2,492.4 | | | | 279.6 | | | | 1,554.1 | | | | 2,359.9 | |
| (+) Derivative financial instruments (current) | | | 6.0 | | | | 33.3 | | | | 0.1 | | | | 0.7 | | | | 18.1 | |
| Gross debt | | | 592.6 | | | | 3,294.3 | | | | 397.1 | | | | 2,207.7 | | | | 2,880.2 | |
| (-) Cash and cash equivalents | | | (120.1 | ) | | | (667.5 | ) | | | (139.2 | ) | | | (773.6 | ) | | | (865.4 | ) |
| (-) Marketable securities (current) | | | (21.9 | ) | | | (121.5 | ) | | | (14.0 | ) | | | (77.8 | ) | | | (62.9 | ) |
| Net Debt(2) | | | 450.7 | | | | 2,505.3 | | | | 244.0 | | | | 1,356.3 | | | | 1,951.9 | |
| Adjusted EBITDA (3) | | | 223.6 | | | | 1,243.1 | | | | 223.6 | | | | 1,243.1 | | | | 737.6 | |
| Net Debt to Adjusted EBITDA Ratio(4)(5) | | | 2.0 | x | | | 2.0 | x | | | 1.1 | x | | | 1.1 | x | | | 2.6 | x |
| (1) | For convenience purposes only, amounts in reais as of and for the six months ended June 30, 2024 and as of and for the year ended December 31, 2023 have been translated to U.S. dollars using an exchange rate of R$5.5589 to US$1.00, the commercial selling rate for U.S. dollars as of June 30, 2024 as reported by the |
Central Bank. These convenience translations should not be considered representations that any such amounts have been, could have been or could be converted at that or any other exchange rate.
| (2) | We calculate Net Debt as gross debt less cash and cash equivalents and current marketable securities. We calculate gross debt as the sum of current and non-current loans and borrowings and current derivative financial instruments. Net Debt is a non-GAAP measure. Net Debt is not a substitute for its component IFRS measures or IFRS measures of indebtedness. Additionally, our calculation of Net Debt may be different from the calculation used by other companies, including competitors in our industry, and may therefore not be comparable to similarly named metrics of other companies. For further information, see “Presentation of Financial and Other Information—Special Note Regarding Non-GAAP Financial Measures—Net Debt and Net Debt to Adjusted EBITDA Ratio.” |
| (3) | We calculate Adjusted EBITDA as profit for the period/year plus income taxes (current and deferred), financial results, net, depreciation and amortization, non-recurring expenses related to our initial public offering and expenses incurred in connection with our equity-compensation plan linked to the occurrence of our initial public offering. Adjusted EBITDA is a non-GAAP measure. Adjusted EBITDA is not a substitute for its component IFRS measures or IFRS measures of earnings or profit for the period/year. Additionally, our calculation of Adjusted EBITDA may be different from the calculation used by other companies, including competitors in our industry, and may therefore not be comparable to similarly named metrics of other companies. For further information, see “Presentation of Financial and Other Information—Special Note Regarding Non-GAAP Financial Measures— Adjusted EBITDA.” |
| (4) | Our Net Debt to Adjusted EBITDA Ratio as of and for the six months ended June 30, 2024 is calculated using our Net Debt as of June 30, 2024 divided by our Adjusted EBITDA for the year ended December 31, 2023. |
| (5) | We calculate Net Debt to Adjusted EBITDA Ratio by dividing Net Debt by our Adjusted EBITDA. Net Debt to Adjusted EBITDA Ratio is a non-GAAP measure. Net Debt to Adjusted EBITDA Ratio is not a substitute for its component IFRS measures or IFRS measures of earnings or profit for the period/year or of indebtedness. Additionally, our calculation of Net Debt to Adjusted EBITDA Ratio may be different from the calculation used by other companies, including competitors in our industry, and may therefore not be comparable to similarly named metrics of other companies. For further information, see “Presentation of Financial and Other Information—Special Note Regarding Non-GAAP Financial Measures—Net Debt and Net Debt to Adjusted EBITDA Ratio.” |
ROIC
The following table sets forth a reconciliation of our profit for the period/year to ROIC, for each of the periods indicated.
| | | As of and for the Six Months Ended June 30, | | As of and for the Year Ended December 31, |
| | | 2024 | | 2024 | | 2023 | | 2023 | | 2022 |
| | | US$(1) | | R$ | | US$(1) | | R$ |
| | | (in millions) |
| Profit for the period/year | | | 42.7 | | | | 237.6 | | | | 47.9 | | | | 266.0 | | | | 414.2 | |
| (+) Income taxes (current and deferred) | | | 22.3 | | | | 124.0 | | | | 60.3 | | | | 335.2 | | | | (26.3 | ) |
| (+) Financial results, net | | | 8.0 | | | | 44.2 | | | | 57.5 | | | | 319.7 | | | | 107.1 | |
| Profit before finance results and taxes | | | 73.0 | | | | 405.8 | | | | 165.7 | | | | 920.9 | | | | 495.0 | |
| (+) Fair value amortization(2) | | | 15.4 | | | | 85.5 | | | | 32.3 | | | | 179.6 | | | | 174.0 | |
| (+) Non-recurring events(3) | | | 19.9 | | | | 110.6 | | | | — | | | | — | | | | 47.1 | |
| (-) Weighted income taxes – nominal(4) | | | (32.4 | ) | | | (180.2 | ) | | | (62.3 | ) | | | (346.4 | ) | | | (219.0 | ) |
| NOPAT (a)(5) | | | 75.9 | | | | 421.7 | | | | 135.7 | | | | 754.1 | | | | 497.1 | |
| Average invested capital (b)(6) | | | 706.1 | | | | 3,925.1 | | | | 706.8 | | | | 3,928.9 | | | | 3,067.8 | |
| ROIC ((a)/(b))(7) | | | 10.7 | % | | | 10.7 | % | | | 19.2 | % | | | 19.2 | % | | | 16.2 | % |
| (1) | For convenience purposes only, amounts in reais as of and for the six months ended June 30, 2024 and as of and for the year ended December 31, 2023 have been translated to U.S. dollars using an exchange rate of R$5.5589 to US$1.00, the commercial selling rate for U.S. dollars as of June 30, 2024 as reported by the |
Central Bank. These convenience translations should not be considered representations that any such amounts have been, could have been or could be converted at that or any other exchange rate.
| (2) | Fair value amortization refers to amortization arising from business combinations that occurred in preceding periods. |
| (3) | Non-recurring events refers to costs related to the PetroChoice acquisition, non-recurring expenses related to our initial public offering and expenses incurred in connection with our equity-compensation plan. |
| (4) | We calculate weighted income taxes – nominal by multiplying the nominal income tax rate of each country by the sum of EBIT, fair value amortization and non-recurring events. |
| (5) | We calculate net operating profit after taxes, or NOPAT, as the sum of our profit before finance results and taxes, fair value amortization, non-recurring expenses related to our initial public offering and expenses incurred in connection with our equity-compensation plan, less weighted income taxes – nominal. |
| (6) | We calculate average invested capital as the average of the sum of our total equity and our Net Debt between the current period and the prior period. |
| (7) | We calculate ROIC as NOPAT divided by average invested capital. ROIC and NOPAT are non-GAAP measures. ROIC and NOPAT are not substitutes for their respective component IFRS measures or IFRS measures of earnings or profit for the period/year. Additionally, our calculation of ROIC and NOPAT may be different from the calculation used by other companies, including competitors in our industry, and may therefore not be comparable to similarly named metrics of other companies. For further information, see “Presentation of Financial and Other Information—Special Note Regarding Non-GAAP Financial Measures—ROIC.” |
Operating Working Capital
The following table sets forth a reconciliation of our current trade receivables and inventory to Operating Working Capital as of each of the dates indicated.
| | | As of June 30, | | As of December 31, |
| | | 2024 | | 2024 | | 2023 | | 2023 | | 2022 |
| | | US$(1) | | R$ | | US$(1) | | R$ |
| | | (in millions) |
| Trade receivables, current | | | 247.9 | | | | 1,378.1 | | | | 196.7 | | | | 1,093.4 | | | | 1,099.7 | |
| (+) Inventory, current | | | 270.5 | | | | 1,503.9 | | | | 231.6 | | | | 1,287.7 | | | | 1,509.4 | |
| (-) Trade payables, current | | | 328.1 | | | | 1,824.1 | | | | 268.9 | | | | 1,494.6 | | | | 1,607.9 | |
| Operating Working Capital(2) | | | 190.3 | | | | 1,057.9 | | | | 159.5 | | | | 886.5 | | | | 1,001.2 | |
| (1) | For convenience purposes only, amounts in reais as of June 30, 2024 and December 31, 2023 have been translated to U.S. dollars using an exchange rate of R$5.5589 to US$1.00, the commercial selling rate for U.S. dollars as of June 30, 2024 as reported by the Central Bank. These convenience translations should not be considered representations that any such amounts have been, could have been or could be converted at that or any other exchange rate. |
| (2) | We calculate Operating Working Capital as the sum of current trade receivables and inventory less current trade payables. Operating Working Capital is a non-GAAP measure. Operating Working Capital is not a substitute for its component IFRS measures or IFRS measures of our capital structure or liquidity. Additionally, our calculation of Operating Working Capital may be different from the calculation used by other companies, including competitors in our industry, and may therefore not be comparable to similarly named metrics of other companies. For further information, see “Presentation of Financial and Other Information—Special Note Regarding Non-GAAP Financial Measures—Operating Working Capital.” |
Risk Factors
Investing in our common shares involves a high degree of risk. You should carefully consider the risks and uncertainties described below, together with all of the other information in this prospectus, including the sections titled “Special Note Regarding Forward-Looking Statements” and “Management’s Discussion and Analysis of Financial Condition and Results of Operations” and our consolidated financial statements and related notes, before making a decision to invest in our common shares. In particular, you should consider the risks related to investing in securities of issuers whose operations are located in emerging markets, which involves a higher degree of risk than investing in the securities of issuers whose operations are located in the United States or other more developed countries. If any of the risks discussed in this prospectus actually occur, alone or together with additional risks and uncertainties not currently known to us, or that we currently deem immaterial, our business, financial condition, results of operations and prospects may be materially adversely affected. If this were to occur, the value of our common shares may decline and you may lose all or part of your investment.
Risks Relating to Our Business and Industry
Our rights to blend, market and sell ExxonMobil products are dependent on our agreements with ExxonMobil, the expiration or termination of which would adversely affect our business, results of operations, financial condition and prospects.
We are the manufacturer and exclusive distributor of ExxonMobil lubricants and related products and services in Brazil, Argentina, Bolivia, Paraguay and Uruguay based on formulas that have been provided under our distribution agreements with ExxonMobil. In addition, we are a nonexclusive manufacturer and distributor of ExxonMobil products and services in France, Portugal, Spain, the United States and the United Kingdom.
Our rights to manufacture and sell ExxonMobil-branded products and services in the relevant territories derive exclusively from the rights granted to us by ExxonMobil in our various ExxonMobil distribution agreements. As a result, our ability to continue operating in our current capacity is substantially dependent on the maintenance and renewal of our contractual relationship with ExxonMobil. However, ExxonMobil does not have an obligation to fund our operations. Furthermore, ExxonMobil does not guarantee any of our financial obligations, including trade payables or outstanding indebtedness, and has no obligation to do so.
ExxonMobil has the right, in its absolute discretion, to terminate each of its distribution agreements with respect to the territories in which we operate after the expiration of the terms of such agreements. Our exclusive lubricants blending and distribution agreement with respect to Brazil, Bolivia, Uruguay and Paraguay has a term of 15 years from its effective date, and will remain in effect until December 1, 2033, absent early termination. Following this initial term, such distribution agreement will automatically renew for an additional five years (i.e., December 1, 2038) unless either party provides the other party with written notice of its intent not to renew no later than 13 years following the effective date (i.e., by December 1, 2031). Our non-exclusive distribution agreement with respect to the United States has an initial term of 10 years as of its effective date, and will therefore remain in effect until June 30, 2034. Following this initial term, such distribution agreement will automatically renew for an additional five-year period (i.e., June 30, 2039), unless either party provides the other party with written notice of its intention not to renew no later than eight years following the start of the initial term (i.e., June 30, 2032). If ExxonMobil grants us the option to renew and we elect to exercise the option, then we and ExxonMobil will amend such distribution agreements to reflect the terms of such renewal option, as appropriate. We cannot assure you that ExxonMobil will grant us an option to extend the term of any such distribution agreement or that the terms of any renewal option will be acceptable to us, will be similar to those contained in our existing distribution agreements or will not be less favorable to us than those contained in our existing distribution agreements.
In addition, our ExxonMobil distribution agreements may be terminated by ExxonMobil upon giving the requisite notice or upon the occurrence of certain stipulated events, some of which are not within our control. For example, with respect to the Brazil, Bolivia, Uruguay and Paraguay ExxonMobil lubricants blending and distribution agreement, ExxonMobil has the right upon any change in control, as defined in the agreement, of us or Cosan, our controlling shareholder, to immediately terminate such agreement by written notice of termination to us. Such termination rights related to changes of control can also be exercised by ExxonMobil in the event that we,
without ExxonMobil’s consent, transfer certain of the real estate properties that we own or operate (see “Business—Material Agreements—Our ExxonMobil Distribution Agreements—Change of Control” for additional information). Additionally, with respect to the United States, we are required to purchase a minimum quantity based on the previous year’s purchase volume of ExxonMobil’s products for each line of business for which we are authorized to sell ExxonMobil products (see “Business—Material Agreements—Our ExxonMobil Distribution Agreements—Purchase Obligations” for additional information). As such, there can be no assurance that these arrangements will not be terminated prematurely, and the loss of the distributorship with ExxonMobil would have a material adverse impact on our financial condition and results of operations.
If our ExxonMobil distribution agreements expire or are terminated, we would be required to cease blending and selling ExxonMobil-branded products and services, identifying our business with ExxonMobil and using any of ExxonMobil’s intellectual property. As the ExxonMobil brand and our relationship with ExxonMobil are among our primary competitive strengths, the expiration or termination of our ExxonMobil distribution agreements for any of the reasons described above would materially and adversely affect our business, results of operations, financial condition and prospects.
Our business depends on our relationship with ExxonMobil and changes in this relationship may adversely affect our business, results of operations and financial condition.
Our rights to blend, market and sell ExxonMobil-branded products and services in the territories derive exclusively from the rights granted to us by ExxonMobil in our ExxonMobil distribution agreements. As a result, our revenues are substantially dependent on the continued existence of our contractual relationship with ExxonMobil. However, ExxonMobil does not have an obligation to fund our operations. Furthermore, ExxonMobil does not guarantee any of our financial obligations, including trade payables or outstanding indebtedness, and has no obligation to do so.
Pursuant to certain of the ExxonMobil distribution agreements, ExxonMobil has the ability to exercise substantial influence over the conduct of our business in some of the markets in which we operate. For example, in South America we are generally not permitted to blend, market or sell any competing lubricant or ancillary products, we must comply with ExxonMobil’s high quality standards, we are required to follow ExxonMobil instructions in blending and marketing our products, we are required to follow strict guidelines in using ExxonMobil’s intellectual property in packaging our products and in other aspects of our corporate operations, such as our business ethics guidelines, and ExxonMobil has the right to inspect and audit our operations under certain circumstances. In addition, such distribution agreements may provide that our products may only be blended in certain facilities that are either currently in operation or that are authorized by ExxonMobil. If the terms of the ExxonMobil agreements excessively restrict our ability to operate our business or if we are unable to satisfy our blending, marketing and sales commitments under such ExxonMobil distribution agreements, our business, results of operations and financial condition would be materially and adversely affected.
In addition, our distribution agreements with ExxonMobil in respect of France, Portugal, Spain, the United States and the United Kingdom are nonexclusive in nature, and ExxonMobil reserves the right to directly supply the same products and services that we currently blend, market and sell on its behalf in these territories or to engage other distributors to supply the same products in the United Kingdom and in the United States, which would increase our competition for customers. In this case, our business, results of operations and prospects may be adversely affected.
There is no assurance that there will be no deterioration in our relationship with ExxonMobil, which could affect our ability to blend, market and sell our products and services. In the event ExxonMobil changes its sales or marketing strategy or otherwise appoints other distributors that may compete with us, our business, financial condition and results of operations may be materially and adversely affected.
Loss of a significant manufacturing facility or disruptions within our supply chain or in transportation could have a material adverse effect on our business, financial position and results of operations.
Our manufacturing facilities are located throughout the world. If one of our facilities is forced to shut down or curtail operations because of damage or other factors, including natural disasters, labor difficulties or widespread public health crises, we may not be able to timely supply our customers. This could result in a loss of sales over an
extended period or permanently. While we seek to mitigate this risk through business continuity and contingency planning and other measures, the loss of production in any one region over an extended period of time could have a material adverse effect on our business, financial position and results of operations.
Moreover, shortages in the supply of utilities could lead to instability in the operations of our manufacturing plants, which could adversely affect our reputation and operations. Finally, adverse weather conditions and continuous droughts can interrupt the electricity supply or supply of other utilities and may impact our distribution of water and prevent us from manufacturing our products and operating our business.
Our ability to maintain and to continue to expand our margins depends, in part, on our ability to pass on raw material costs to our customers, and our inability to do so would harm our margins and prospects.
The prices of raw materials used in our business are subject to significant fluctuations depending on market conditions and government policies. The prices we are charged for inputs and services are influenced by several factors over which we have little or no control, including, but not limited to, international and national economic conditions, foreign currency fluctuations, regulations, government policies, the actions of our counterparties, tariff adjustments, global effects of supply and demand, particularly in commodity prices, business and supply chain interruptions and other factors that may lead to price fluctuations. We have traditionally been able to pass on price increases to our customers and have also managed to sustain incremental margin increases if prices decline on the basis of our revenue management strategy. We cannot assure you that we will be able to pass on any increased costs to our customers, which could decrease our profit margin and our ability to achieve our business plan, which could have an adverse effect on our share price.
We have been and could in the future be the target of attempted cyberattacks, which may adversely affect our business.
We face various cybersecurity risks, including but not limited to penetration of our information technology systems and platforms by ill-intentioned third parties, infiltration of malware (such as computer viruses) into our systems, contamination (whether intentional or accidental) of our networks and systems by third parties with whom we exchange data, unauthorized access to confidential customer and/or proprietary data by persons inside or outside our organization and cyberattacks causing systems degradation or service unavailability that may result in business losses. In addition, we may be subject to potential fraud and theft by cybercriminals, who are becoming increasingly sophisticated, seeking to gain unauthorized access to or exploit weaknesses that may exist in our systems.
We continuously monitor and develop our networks and information technology infrastructure. We also conduct annual tests to prevent, detect, address and mitigate the risk of unauthorized access, misuse, computer viruses and other events that could have an impact on our security. However, we cannot guarantee that these measures will be effective in protecting us against cyberattacks and other breaches related to our information technology systems. Techniques used to gain unauthorized, improper or illegal access to our systems, our data or our customers’ data, to disable or degrade service, or to sabotage systems, due to constant evolution, can be difficult to detect quickly and are often not known until used on a target. Unauthorized parties attempt to gain access to our systems or facilities through various means, including, among others, hacking into our systems or those of our customers, partners or vendors, or attempting to fraudulently induce our employees, customers, partners, vendors or other users of our systems to disclose usernames, passwords, financial information or other sensitive information, which may in turn be used to access our information technology systems. Certain efforts by third parties to access our information technology systems may be supported by significant financial and technological resources, making them even more sophisticated and difficult to detect. We have seen in recent years computer systems of businesses and organizations being targeted not only by cybercriminals, but also by rogue activists and states.
Cyberattacks can cause the loss of significant amounts of customer data and other confidential information, as well as significant levels of liquid assets (including cash). In addition, cyberattacks could cause the shutdown of our information technology systems, including systems used to service our customers. We may also be subject to the effects of cyberattacks against critical infrastructure in the countries in which we operate, and we have limited ability to protect our technology systems against such attacks. If we fail to effectively manage our cybersecurity risk, for example, by failing to update our systems and processes in response to new threats, this could harm our reputation and adversely affect our operating results, financial condition and prospects through the payment of customer compensation, regulatory penalties and fines and/or the loss of assets. Furthermore, upon a failure to
comply with applicable laws and regulations, we may be ordered to change our business practices, policies or systems in a manner that adversely impacts our operating results. Moreover, critical infrastructures that our information technology systems rely on in the countries in which we operate may be the target of cyberattacks, which could negatively affect our ability to service our customers.
For instance, on March 11, 2020, we and other entities of the Cosan Group suffered a cyberattack by ransomware that caused a partial and temporary interruption of our operations. Each affected entity within our group implemented its own contingency plans, continued operating partially during the cyberattack and progressively reconnected their operating systems following the attack. Following this incident, we have taken certain additional precautionary measures to reduce cyber risks, including the following: (i) developed a vulnerability management program; (ii) established a security operations center department, with a so-called “blue team” (i.e., defensive security personnel tasked with protecting our critical assets against threats) and a “red team” (i.e., security personnel who act as adversaries to overcome our cybersecurity controls); (iii) improved the continuous monitoring and response to incidents and our risk management and threat intelligence capabilities; (iv) increased the overall seniority of the cybersecurity team; (v) worked to foster a culture of cybersecurity among Moove personnel through internal cybersecurity policies; and (vi) increased focus on the deployment and execution of cybersecurity actions related to the Moove operation technology environment. Moreover, on May 5, 2023, Tirreno suffered a cyberattack exposing its database. Following this incident, we migrated Tirreno’s systems to a new environment to mitigate the risk of new attacks and, following migration, we onboarded Tirreno onto our cybersecurity processes, along with other of our subsidiaries.
We cannot assure you that our security frameworks and measures will be successful in preventing breaches of our cybersecurity. In addition, we expect that the cost to obtain cyber liability insurance in the future should we wish to do so (we do not currently have cyber liability insurance) will be higher than it would otherwise have been as a result of this incident. Further, the incident may have a negative impact on our reputation and cause customers, suppliers and other third parties with whom we maintain relationships to lose confidence in us. We are unable to predict the impact of these or future cybersecurity incidents on these relationships.
Further, we store highly confidential information on our information technology systems, including personal data, financial information, and other types of information related to our products and customers. If our servers or the servers of the third parties on which our data is stored are the subject of a physical or electronic break-in, computer virus or other cyber risks, our confidential information could be stolen, rendered unavailable, devalued or destroyed. Any security breach involving the misappropriation, loss or other unauthorized disclosure or use of confidential information of our suppliers, customers or others, whether by us or a third party, could (i) subject us to civil and criminal penalties, (ii) have a negative impact on our reputation or (iii) expose us to liability to our suppliers, customers, other third parties or government authorities.
We cannot assure you that our information technology systems will not be attacked in the future and that we will be able to adequately protect the confidential information we maintain. If we are the victim of successful cyberattacks or experience cybersecurity incidents in the future, we could incur substantial costs and suffer other negative consequences, such as remediation costs (liabilities for stolen assets or information or repairs of system damage, among others), increased cybersecurity protection costs, lost revenue from unauthorized use of proprietary information or the failure to retain or attract customers after an attack, as mentioned above, litigation and legal risks, increased insurance, reputational damage affecting the trust of our customers and investors, as well as damage to our competitiveness, stock price and long-term shareholder value. Any failure by us to adequately protect our information technology systems and the confidential data which we hold could have a material adverse effect on our business, financial condition and results of operations. Importantly, even when a failure or disruption to our systems or facilities is resolved in a timely manner or an attempted cyber incident or other security breach is successfully prevented or thwarted, substantial resources are typically expended to do so, and we may be required to take actions that could negatively affect customer satisfaction or behavior and could pose a threat to our reputation.
Any of the above developments could adversely affect our business, as well as our financial condition, results of operations and reputation.
Reliance on a limited base of third-party contract manufacturers, logistics providers and suppliers of raw materials and components may result in disruption to our business and this could adversely affect our financial condition and results of operations.
We rely on a limited number of third-party contract suppliers, logistics providers and manufacturers, including single or sole-source suppliers for certain raw materials, packaging, product components and other supplies. We do not have direct control over the management or business of these third parties, except indirectly through terms negotiated in service or supply contracts. As a result, we face substantial risks associated with our reliance on third-party suppliers, logistics providers and/or manufacturers, including but not limited to the following areas:
| · | changes to the terms of doing business with these providers or the production capacity they allocate to our products; |
| · | disagreements or the inability to maintain good relationships with these providers, including the failure of these providers to be aligned with our company values; |
| · | financial difficulties experienced by these providers; |
| · | consolidation of third-party packagers, which could reduce competition in the industry and increase our costs for their services or result in the acquiring company declining to manufacture our products; |
| · | significant disruptions in the production or transportation of our products due to events having regional or global impacts on economic activity, such as public health emergencies, natural disasters or extreme weather conditions; |
| · | significant disruptions in the production or transportation of our products due to competition for materials, components, labor or services from third-party vendors; |
| · | concentration of inventory increasing exposure to risks associated with fire, natural disasters, theft and logistics disruptions to customer order fulfillment; or |
| · | inability to successfully implement new manufacturing processes associated with new facilities or new product lines. |
In addition, if we are unable to contract with suppliers or third-party manufacturers for the quantity and quality levels needed for our business, we could experience disruptions in production and our financial results could be adversely affected. In particular, the COVID-19 pandemic, the ongoing wars between Russia and Ukraine and between Israel and Hamas, extreme weather events and other macroeconomic factors have resulted in significant supply chain constraints and transportation disruptions at times. Some of the challenges that we have experienced include general lubricants-related production capacity constraints and competition for such capacity by other companies who utilize the same third-party manufacturers for their lubricants production.
We have been actively working on various initiatives in partnership with our third-party manufacturers and we have identified and onboarded new third-party manufacturers in recent years in order to increase the capacity and resilience of our supply chain to meet strong end-user demand. When we onboard new third-party manufacturers, it comes with inherent risks and, in the current economic environment, it also potentially comes with higher costs. In addition, actions we have taken to increase inventory levels of certain raw materials and finished goods, given the current challenges within supply chain and increased lead times required by suppliers, have led to higher transportation, storage and distribution costs. We are not able to estimate the degree of the impact or the costs associated with potential future disruptions within our supply chain and distribution networks as these supply chain issues are being resolved.
We may not be able to maintain or renew certain other agreements with third parties which are important to our business.
Our business, financial condition and results of operations may be materially and adversely affected if we are unable to maintain or renew certain agreements (including, without limitation, supply agreements, service contracts,
licensing agreements, distribution agreements, joint ventures, partnerships and others) with third parties which are important to our business and operations. The termination or failure to renew these agreements, or the failure by our counterparties to adequately maintain and protect their intellectual property rights, could materially and adversely affect our results of operations or could require significant unplanned investments by us if we are forced to develop or acquire alternative technology. In the future, it may be necessary or desirable to obtain other third-party technology licenses relating to one or more of our products or relating to current or future technologies to enhance our product offerings. However, we may not be able to obtain licensing rights to the needed technology or components on commercially reasonable terms or at all.
The modification, suspension, cancellation or non-renewal of the tax benefits which we have been granted or from which we may benefit from time to time, changes to current interpretations of tax laws as these apply to us, or any restrictions on the offsetting of tax credits could have a material adverse effect on us.
We have benefited and may from time to time benefit from certain federal, state and municipal tax incentives, benefit programs and special regimes from time to time, including reductions in corporate income tax, reductions in sales taxes on certain activities, and suspensions or reductions in certain other taxes (including import duties and certain other social security charges). We cannot assure you that these tax benefits will be maintained or renewed or that we will be able to obtain new tax benefits. In addition, the applicable governmental body may impose restrictions on the offsetting of our tax credits. If we lose our existing tax benefits and/or cannot offset the tax credits due to noncompliance with future requirements or due to changes in current interpretation of the tax laws applicable to these benefits, or if the current tax programs and agreements from which we benefit are modified, suspended, canceled or not renewed, we could be materially and adversely affected.
Any failure of our information technology systems could adversely affect our operating results and make us more susceptible to cyber threats, adversely affecting our business.
We depend on information technology systems for significant elements of our operations, including the storage of data and retrieval of critical business information. Our information technology systems are vulnerable to damage from a variety of sources, including network failures, malicious human acts and natural disasters. Moreover, despite network security and back-up measures, some of our servers are potentially vulnerable to physical or electronic break-ins, computer viruses and similar disruptive problems. Failures or significant disruptions to our information technology systems or those used by our third-party service providers could prevent us from conducting our general business operations. Any disruption or loss of information technology systems on which critical aspects of our operations depend could have an adverse effect on our business, results of operations and financial condition.
Furthermore, we store highly confidential information on our information technology systems, including information related to our products. If our servers or the servers of the third party on which our data is stored are attacked by a physical or electronic break-in, computer virus or other malicious human action, our confidential information could be stolen or destroyed. Any security breach involving the misappropriation, loss or other unauthorized disclosure or use of confidential information of our suppliers, customers, or others, whether by us or a third party, may (i) subject us to civil and criminal penalties, (ii) adversely impact our reputation and (iii) expose us to liability to our suppliers, customers, other third parties or governmental authorities, among others. Any such developments may adversely affect our business, financial condition and results of operations.
In addition, any failure of our information technology systems to operate effectively or integrate with other systems, or inadequate performance of, or breaches of security regarding, such systems could result in interruptions in the availability of our online resources, delays in delivering products or services and reduced efficiency in our operations. Each of these factors may adversely affect our businesses as well as their financial condition, results of operations and reputation. We also hold certain highly confidential personal and financial data relating to our customers in our information technology systems. Any failures in the information technology systems on which we depend or any breaches resulting in the unauthorized disclosure of the personal or financial data of our customers may adversely affect our business, financial condition, results of operations and reputation.
In certain markets, we rely on our distributor network and third-party delivery services for the distribution and export of certain of our products. A significant disruption in these services due to external competition or factors outside of our control or significant increases in the prices for these services may disrupt our ability to export material or increase our costs.
We ship a significant portion of our products to our customers through our distributor network as well as independent third-party delivery companies. The presence of established blenders and marketers of lubricants and ancillary products with well-established distribution networks and brand recognition, can make it difficult for us to compete effectively and limits the breadth of our distribution channels. If the terms offered to such distributors by our competitors are more favorable than those offered by us, distributors may decline to distribute our products and terminate their arrangements with us. We may be unable to appoint replacement distributors in a timely fashion, or at all, which may reduce our sales volumes and adversely affect our business, financial condition, results of operations, cash flows and prospects.
We have plans to enhance our distribution network with the aim of broadening our geographical reach. However, we anticipate facing competition from similar or alternative businesses in terms of distribution, logistics and products. Consequently, the success of our expansion efforts will rely on several factors. Some of these factors include the level of demand for our brand and products in a particular market and our ability to maintain current distribution relationships or establish and maintain successful relationships with distributors in new geographic areas. These factors are partially outside our control because consumers ultimately determine what they purchase and we cannot control the actions of our distributors. Our inability to achieve any of these factors in a geographic distribution area will have a material adverse effect on our relationships with our third-party distributors in that particular geographic area, thus limiting our ability to maintain and expand our market, which will likely adversely affect our revenues and financial results.
Further, our competitors may have exclusive arrangements with certain distributors who may be unable to stock and distribute our products, which may limit our ability to expand our distribution network. Similarly, our competitors may adopt innovative distribution models, which could be more effective than traditional distribution models resulting in a reduction in the sales of our products. Alternatively, to the extent our distributors are distracted from selling our products or do not expend sufficient efforts in managing and selling our products, our sales will be adversely affected.
Moreover, if any of our key distributors or third-party delivery providers experiences a significant disruption, our products may not be delivered in a timely fashion. Disruptions may occur for various reasons beyond our control, including poor handling by distributors of our products, transportation bottlenecks, natural disasters and labor issues which could lead to delayed or lost deliveries, and any failure to provide distributors with sufficient inventories of our products may result in a reduction in the sales. If our distributors fail to distribute our products in a timely manner, or adhere to the terms of the distribution arrangement, or if our distribution arrangements are terminated, our business, financial condition, results of operations, cash flows and prospects may be adversely affected.
Finally, we do not control the pricing strategies or supply chains of our distributors, each of whom may be impacted by general economic considerations, including inflation and other independent considerations and drivers that are outside our control and each of whom has the ability to set or impact market price for our products or services. If any of our key distributors or third-party delivery providers increase prices and we are not able to pass along these increases to customers, find comparable alternatives or adjust our delivery network, our business, financial condition, results of operations and cash flows could be adversely affected.
We face significant competition, which may have a material adverse effect on our market share and profitability.
We compete with a wide range of businesses, including many which are larger and have substantially greater resources than we do and others which may have more flexible pricing strategies. Some of our competitors may be more flexible in responding to volatile industry or market conditions, such as shortages of base oil and other feedstock or intense price fluctuations. The actions of our competitors could lead to lower prices or reduced margins for our products, as well as reductions in our sales volumes, which could have a material and adverse effect on Moove and on our business, results of operations and financial performance. For more information, see “Business—Competition.”
We are exposed to the possibility of losses related to natural disasters, catastrophes, accidents, fire, political, social and economic events, terrorist acts, wars, and other events not in our control, which may have a material adverse effect on our business, financial condition and results of operations.
Lubricants are non-flammable products. However, in the presence of flammables, they become high complexity fuels. In addition, in certain regions, we also store and sell fuels which are highly flammable products. As a result, our operations are subject to certain risks that affect our properties, facilities, designated walkways, storage areas and inventory, including, among others, fire, which may destroy machinery, equipment and facilities, explosions, leaks of fuel and other flammable products, as well as other environmental events, accidents, business interruptions due to political, social or economic events (whether local or international), civil unrest or other conflicts, labor claims, demonstrations, protests or acts of vandalism by social and/or environmental groups or associations, terrorist acts, strikes or work stoppages (of our own employees or of those linked to entities with which we have a relationship, such as port operators), disease outbreaks, pests, adverse weather conditions, and natural disasters, such as floods, all of which may result in the loss of revenues, assumption of liabilities or cost increases. We are also subject to stoppages and blockades of highways and other public roads. Stoppages and blockages of highways and other public roads may adversely affect our business and results. Moreover, our operations may be periodically affected by crop shortfalls, landslides and other natural disasters.
During the last decade, we experienced three fires in facilities involving Moove inventories. For example, on October 16, 2022, a fire broke out at the warehouse of one of our distributors, which stored certain Moove Brazil inventory. We and our insurance broker assessed the total cost of the damaged inventory as R$61.5 million. We received a partial reimbursement under our former operational risk insurance policy for these damaged products, fire containment expenses, taxes and office equipment of R$30.8 million in July 2023. In addition, in August 2021, there was a fire in an industrial estate where warehouses containing Moove Brazil inventory were located. The total cost of the damaged inventory was R$6.9 million, which was fully recovered as insurance proceeds during 2022. In addition, in the years ended December 31, 2022 and 2021, we received insurance proceeds of R$14.6 million and R$53.9 million, respectively, accounting for the total value of inventory damaged as a result of a fire which took place in March 2021 in a leased warehouse where part of our finished goods inventories was stored. As Moove Corp., which is located in the United States, has general liability and property insurance, a settlement was reached with the insurer to receive a total amount of R$4.1 million in business interruption compensation in 2024 through to the date of this prospectus.
As our insurance does not cover all potential risks and losses we may incur, the occurrence of a natural disaster of large proportions, catastrophes, cyberattacks, pandemics, terrorist activity, mechanical failures, loss of assets or any other of the events referred to above, and any resulting damage to our business, may have a material adverse effect on our business, operating results and financial condition, including as a result of civil, administrative and/or criminal sanctions relating to environmental liability. See “—Our insurance coverage may not be sufficient to fully cover all of our losses arising from our business and operations.”
The production of lubricants and fuels, and the storage and transportation of lubricant and fuel products, are inherently hazardous.
Through our subsidiaries, we manufacture and transport lubricating oil blends and fuels. The complex manufacturing operations we perform at our plants involve a variety of safety and other operating risks, including the handling, production, storage and transportation of toxic materials. These risks could result in personal injury and death, severe damage to or destruction of property and equipment and environmental damage. A material accident at one of these could result in a suspension of operations and result in significant remediation costs and lost revenue. In addition, insurance proceeds, if available, may not be received on a timely basis and may be insufficient to cover all losses, including lost profit. Equipment breakdowns, natural disasters, and delays in obtaining supplies or required replacement parts or equipment could also have a material adverse effect on our manufacturing operations and results of operations. Disruption of transportation and logistics services or insufficient investment in public infrastructure could have a material adverse effect on operating results. In the markets in which we operate, there is a wide range of regulations, norms and standards that regulate the handling, storage, use, transportation and marketing of products considered hazardous.
Furthermore, any contamination of the soil or underground may subject our subsidiaries to administrative sanctions, including, but not limited to, suspension, shutdown, mandatory payment of fines and other expenses, or
an obligation to materially alter or cease particular operations, in addition to subjecting them to criminal and civil proceedings in case of environmental damages, which include the obligation to repair and/or indemnify the contaminated area for any damages caused to the environment, public health and third parties. The proximity of our operation and storage sites to populated areas, including residential, commercial and industrial facilities, may also increase our risk exposure. The costs associated with complying with current and potential legislation relating to environmental protection, health and safety, and liabilities incurred in connection with the leakage or exposure to harmful substances are substantial. Failure to comply with these regulations may result in the filing of administrative proceedings against these companies and the payment of fines, penalties or obligations to indemnify, as well as other sanctions. Any such increase in such costs could have a material adverse impact on our business, our results of operations and the financial standing of our subsidiaries.
Moreover, we may also not receive insurance proceeds, if available, in a timely manner and these may be insufficient to cover all losses, including lost profits. Equipment breakdowns, natural disasters and delays in obtaining necessary replacement supplies may also have a material adverse effect on our business, financial condition and results of operations.
We are subject to extensive environmental regulations and may be exposed to liabilities and reputational damage in the event we fail to comply with these regulations.
Our business activities are subject to extensive laws and regulations concerning environmental protection, which impose on us various environmental obligations, such as environmental licensing requirements, standards for the release of effluents, the management of solid waste, the emission and discharge of hazardous materials and the health and safety of our employees. Failure to comply with such laws and regulations (including a failure to obtain or maintain relevant environmental permits, as well as to comply with technical conditions imposed by environmental permits) may subject the offender to administrative fines, mandatory interruption of activities and criminal sanctions, in addition to the obligation to remedy and pay environmental and third-party damage compensation. If we become subject to environmental liability, any costs we may incur in connection with the indemnification against potential environmental damage would lead to a reduction in the financial resources that would otherwise remain at our disposal for current or future strategic investment, which may materially and adversely affect our business, results of operations or financial condition. Furthermore, failure to comply with environmental laws and regulations and any resulting liability could have a material adverse effect on our reputation.
As environmental laws and their enforcement become increasingly stringent, our expenses for complying with environmental requirements are likely to increase in the future. Furthermore, the possible implementation of new regulations, changes in existing regulations or the adoption of other measures could cause the amount and frequency of our expenditures relating to environmental preservation to vary significantly compared to present estimates or historical costs. Any unplanned future expenses could force us to reduce or forego strategic investments, and as a result, could materially and adversely affect our business, results of operations or financial condition.
The occurrence of environmental damage may lead to the need to make significant financial resources available for both containment and repair of these damages. The occurrence of such events may also lead to a disruption in production due to intervention by government agencies. In either case, financial and/or image impacts may be significant. We may also suffer significant reputational damage if we were to be held responsible for or associated with environmental damage. In addition, the creation of new regulations may lead to the need for greater expenses for environmental preservation. Furthermore, extensive environmental regulation can also lead to delays in the implementation of new projects as bureaucratic procedures for obtaining environmental licenses from various government agencies may take considerable time.
We are party to a number of administrative and judicial proceedings for alleged failures to comply with environmental and health laws, which may result in fines, shutdowns, obligations to remedy or contain the environmental damage caused or other adverse effects on our operations. Claims that give rise to administrative proceedings may also lead to civil or criminal claims against us and our subsidiaries. Our costs of complying with current and future environmental and health and safety laws, and our liabilities arising from past or future claims, could adversely affect our business or financial performance. For more information, see “Business—Legal Proceedings.”
We may not successfully acquire or develop additional production capacity through greenfield projects or expansion of existing facilities.
We may explore growth opportunities in the future through the acquisition or development of greenfield projects or through the expansion of our existing facilities. We may be unable to complete these projects on a timely basis or at all, and may not realize the related benefits we anticipate. The factors which may prevent us from doing so include, among other things, (i) our failure to obtain environmental and other licenses, (ii) our inability to obtain supplies of appropriate equipment or raw materials, (iii) increases in costs and/or decreases in revenue, (iv) a lack of qualified workforce, (v) lack of service providers and (vi) our inability to obtain any required financing on satisfactory terms, or at all.
Our greenfield projects and/or expansion of existing facilities require a significant number of service providers. Any inability on our part to enter into contracts with duly qualified service providers who are able to provide the technical services that we require may prevent us from completing our greenfield projects and/or expansions of existing facilities on a timely basis, or at all. In addition, the integration of greenfield projects or expansion of our existing facilities may result in unforeseen operating difficulties and may require significant financial and managerial resources that would otherwise be used for our current operations. Planned or future greenfield projects or expansions of existing facilities may not enhance our financial performance. Any failure in the implementation of growth projects and/or expansion of existing facilities may have a material adverse effect on our business, financial condition and results of operations.
The expansion of our business through acquisitions and strategic alliances creates risks that may reduce the benefits we anticipate from these transactions to the extent we are unable to fully consummate, finance or successfully integrate future acquisitions, partnerships or other opportunities into our business.
We have grown substantially through acquisitions and intend to continue to grow by acquiring, or investing in, directly or indirectly, from time to time, businesses considered suitable by our management that are consistent with our values and which we believe are conducive to generating results. Additionally, we may enter into strategic alliances to increase our competitiveness in the markets in which we operate.
Despite our recent expansion, our management is unable to predict whether and when any new acquisitions or strategic alliances will occur or the likelihood that any particular transaction will be completed on favorable terms and conditions. Our ability to continue to expand our business through acquisitions or alliances depends on many factors, including our ability to identify acquisition opportunities or access capital markets on acceptable terms. Even if we are able to identify opportunities and obtain the resources necessary to do so, financing these acquisitions could result in an inability to service our debt obligations in the future. In addition, the growth of our business from 2021 to 2023 was driven substantially by the acquisitions of PetroChoice in the United States and Tirreno in Brazil, which we completed in May 2022. We cannot assure you that we will be able to replicate our recent results in future periods.
Acquisitions, particularly those involving sizeable enterprises, may bring managerial and operational challenges, including the diversion of management’s attention from existing operations and difficulties in integrating operations and personnel. The success of these transactions depends on our ability to efficiently complete transactions, integrate assets and personnel acquired in these transactions and apply our internal control processes to these acquired businesses. Any material failure by us in integrating new businesses or in managing any new alliances may adversely affect our business and financial performance. Additionally, some of our major competitors have pursued and may in the future pursue growth through acquisitions and alliances, which may reduce the likelihood that we will be successful in completing acquisitions and alliances. In addition, any major acquisition we consider may be subject to antitrust and other regulatory approvals. We may not be successful in obtaining required approvals on a timely basis or at all.
Acquisitions also expose us to the risk of successor liability-related actions involving any acquired entity, their respective management or contingent liabilities incurred before the acquisition. The due diligence investigation conducted in connection with an acquisition, and any contractual guarantees or indemnities that we may receive from sellers of acquired companies, may not be sufficient to protect us from, or compensate us for, actual liabilities. Material liabilities associated with an acquisition, such as labor or environmental liabilities, could materially and adversely affect our reputation, business, operating results or financial condition, and reduce the benefits that we expect to result from such acquisition.
We may be unable to implement our growth strategy successfully.
Our future growth and financial performance depend, in part, on the successful implementation of our business strategy, including (i) our ability to maintain our existing customer base, increase volume from existing customers in specific markets and locations and attract new customers, (ii) increasing the proportion of our revenues that comes from higher margin premium products consisting of synthetic and semi-synthetic products, (iii) generating additional efficiencies that will drive margin improvements, particularly in markets that we have more recently entered and that are less mature, (iv) our capacity to finance investments (through indebtedness or otherwise) or (v) our ability to increase our operational capacity and expand our current capacity to supply to new markets, among others. We cannot assure you that we will be able to achieve these objectives and/or strategies successfully or at all. Our failure to achieve any of these objectives and/or strategies as a result of competitive difficulties, cost increases or restrictions on our ability to invest, among other factors, may limit our ability to implement our growth strategy successfully. Furthermore, failure to achieve our expected growth may have a material adverse effect on our business, financial condition, results of operations and ability to repay our debt obligations.
Dependence on key customers could adversely affect our business, financial condition and results of operations.
We sell our products through a network of domestic and international distributors and suppliers, and a limited number of customers account for a large percentage of our revenue. In the six months ended June 30, 2024 and the year ended December 31, 2023, our ten largest customers accounted for 13.4% and 13.2% of our revenue, respectively. Although we expect that a significant portion of our revenues will continue to be derived from this limited number of customers, our largest individual customer contributed less than 10% of our consolidated revenue for the six months ended June 30, 2024 and year ended December 31, 2023. However, changes in the strategies of our largest customers may have an adverse impact on our sales. Such changes in customer strategy may include, but are not limited to, a reduction in willingness to transport and store goods of certain hazardous material ratings, a reduction in the number of brands they carry or a shift in shelf space in favor of “private label” or competitors’ products. The loss of, or reduction in, orders from any of our most significant customers could have a material adverse effect on our brand values, business, financial condition and results of operations. Large customers may seek price reductions, added support or promotional concessions. If we agree to such customer demands and/or requests, it could negatively impact our ability to maintain existing profit margins.
In addition, our business is based primarily upon individual sales orders, and we typically do not enter into long-term contracts with our customers. Accordingly, these customers could reduce their purchasing levels or cease buying products from us at any time and for any reason. We are also subject to changes in customer purchasing patterns or the level of promotional activities. These types of changes may result from changes in the manner in which customers purchase and manage inventory levels, or display and promote products within their stores. Other potential factors such as customer disputes regarding shipments, fees, merchandise condition or related matters may also impact operating results. If we cease doing business with a significant customer or if sales of our products to a significant customer materially decrease, our business, financial condition and results of operations could be adversely affected.
Increased competition from electric vehicles could reduce demand for our products and services, which could negatively impact our profitability.
Electric car technology has improved significantly in recent years and many automakers are focusing on electric car technology for automobiles they are releasing or plan to release in the future. Increased reliance on electric vehicle technology is expected to result in decreased demand for oil-based lubricants. Recently, governments and private entities have focused on improving and expanding vehicle recharging stations, which may make electric automobiles more attractive in the market. As gasoline-powered vehicles become a smaller part of the worldwide vehicle fleet, such trend is expected to have a negative impact on gasoline demand, which will also impact the demand for oil-based lubricants. This shift in demand could negatively impact our financial performance and could reduce the value of our shares.
We could be adversely affected by technological advances if we do not adapt our products and services in order to remain competitive.
The development and implementation of new technologies may result in a significant reduction in the costs of the products and services we provide. We cannot predict when new technologies may become available, the rate of acceptance of new technologies by our competitors or the costs associated with such new technologies. Advances in the development of alternatives to the products and services which we currently sell could significantly reduce demand or eliminate the need for them. Any advances in technology which require significant capital expenditures to remain competitive or which otherwise reduce demand for our products and services will have a material adverse effect on our business and financial performance. Any other alternative products or technological advances which reduce demand for our products may have a material adverse effect on our results of operations and financial condition.
A failure by ExxonMobil to protect its intellectual property rights, including its brand image, could harm our results of operations.
The profitability of our business depends in part on consumers’ perception of the strength of the ExxonMobil brand. Under the terms of the ExxonMobil Agreements, we are required to monitor the use of certain ExxonMobil proprietary marks by sub-distributors and sellers appointed by us and to report any instance of non-compliance to ExxonMobil. Nevertheless, any failure by ExxonMobil to protect its proprietary rights in the territories in which we operate or elsewhere could harm its brand image, which could affect our competitive position and our results of operations.
Under the ExxonMobil Agreements, we and our affiliates, and certain of our sub-distributors, may use ExxonMobil intellectual property for the purposes of identifying, advertising, promoting, and selling ExxonMobil products and services to the extent specified therein. If we or ExxonMobil fail to identify unauthorized filings of ExxonMobil trademarks and imitations thereof, and we or ExxonMobil do not adequately protect ExxonMobil trademarks and copyrights, the infringement of ExxonMobil’s intellectual property rights by others may cause harm to ExxonMobil’s brand image and decrease our sales.
We engage in hedging transactions and other financial instruments to protect us from foreign exchange exposure in connection with the import of raw materials and our indebtedness, which involve risks that may adversely affect our financial condition.
We are exposed to market risks arising from the conduct of our business activities—in particular, market risks arising from changes in the price of commodities and other raw materials, exchange rates or interest rates. In an attempt to minimize the effects of the volatility of prices and exchange rates on our cash flows and results of operations, for example, we engage in hedging transactions involving commodities and exchange rate futures, options, forwards and swaps.
We also engage in interest rate-related hedging transactions from time to time. Hedging transactions expose us to the risk of financial loss in situations where the counterparty to the hedging contract defaults on its contract or there is a change in the expected differential between the underlying price in the hedging agreement and the actual price of commodities or the exchange rate. We may incur significant hedging-related losses in the future. Since we record derivatives at fair value, to the extent that the market prices of our products exceed the fixed price under our hedging policy, our results will be lower than they would have been if we had not engaged in such transactions as a result of the related non-cash derivative expenses. As a result, our financial performance would be adversely affected during periods in which commodities prices increase. Alternatively, we may choose not to engage in hedging transactions in the future, which could have a material adverse effect on our financial performance during periods in which commodities prices decrease.
Failure to comply with, obtain or renew the licenses and permits required for each of the sectors in which we operate may have a material adverse effect on us.
We are required to obtain specific licenses with respect to certain of our facilities from the applicable environmental authorities, which are required in connection with the emission, ejection and emanation of products and by-products resulting from distribution activities. The laws and regulations which govern these licenses may
occasionally require us to purchase and install costly pollution control equipment or to make operational changes to limit our impact on the environment and/or the health of our employees. Any failure to comply with the terms of such laws, regulations and licenses and permits may result in significant financial penalties, criminal sanctions, revocation of operating licenses and permits, and/or the prohibition of certain of our activities. In addition, we may not be able to renew licenses that are currently in effect or obtain new licenses necessary to operate new ventures, which could affect our results or impact the development of our business plans, growth and expansion.
Certain of our products may have adverse effects on consumers (including certain components, raw materials and supplies used to produce these products), including as a result of product contamination or subsequent errors in the production or distribution chain. Contamination of any of our products may result in a need for recalls or the beginning of legal and administrative proceedings against us, which may adversely affect our reputation, our business, the operation of our production facilities, our financial condition and our results of operations, leading to judicial and administrative proceedings and/or resulting in the closure of our production facilities. Any damage to our reputation could have a material adverse effect on us.
We are exposed to credit and other counterparty risks of our customers in the ordinary course of our business.
We have various credit terms with various types of customers, including wholesalers and retailers. Our customers have varying degrees of creditworthiness and are subject to different rules and regulations depending on the industries in which they operate and the terms of our contractual arrangements. We are therefore exposed to the risk of nonpayment or other defaults under our contracts and other arrangements with them. In the event that a significant number of material customers default on their payment obligations to us, our financial condition, results of operations or cash flows, could be materially and adversely affected. Any of these risks could have an adverse effect on our business, financial condition and results of operations.
We may be adversely affected by unfavorable outcomes in pending legal proceedings or our inability to post judicial collateral or provide guarantees in pending legal or administrative proceedings.
We are involved in a significant number of tax, civil and environmental and labor proceedings. See “Business—Legal Proceedings.” As of June 30, 2024, we had recorded a provision for legal proceedings totaling R$451.5 million in which we deem the risk of loss as probable and had made legal deposits of R$174.6 million in connection with such proceedings. Of this total amount of R$451.5 million, R$4.4 million relates to proceedings for which Moove is ultimately responsible, whereas R$447.1 million relates to proceedings for which Cosan has an obligation to reimburse Moove. We cannot predict whether we will prevail in these or other proceedings, or whether we will have to pay significant amounts, including penalties and interest, as payment for our liabilities, which would materially and adversely impact our business and financial performance.
In addition, unfavorable decisions in criminal proceedings involving members of our management may have a material adverse effect on us. See “Management – Proceedings Involving Management.” In the event of a final non-appealable conviction, one or more of these officers may be barred from holding executive positions within the Company, and depending on the development of the proceedings, our reputation in the opinion of our customers, suppliers and investors may be materially adversely affected.
We cannot predict whether we will prevail in these or other proceedings, or whether we will have to pay significant amounts, including penalties and interest, as payment for our liabilities, which would materially and adversely impact our business, financial condition and results of operations. If we are the subject of an unfavorable outcome in any of these legal proceedings, the amount of such unfavorable decisions will have a material adverse effect on our financial position and operating results.
Moreover, we may not have sufficient funds to post collateral or provide guarantees in judicial or administrative proceedings involving substantial amounts. Even if we do not post such collateral or provide guarantees, we will be liable for paying any amounts due pursuant to any unfavorable outcomes in legal proceedings. We cannot assure you that, if we cannot make such payments, our assets, including financial assets, will not be attached or that we will be able to obtain tax good-standing certificates, all of which may have a material adverse effect on our business, financial condition and results of operations.
We may not be able to access the capital markets or secure bank financing in the amounts necessary to meet our financial obligations due to adverse developments and instability in financial institutions and markets.
Our ability to obtain funding to finance our growth or operate our business depends on several factors, including our level of indebtedness and market conditions. Substantial volatility in the global capital markets, high interest rates, high inflation, unavailability of financing in the global capital markets at reasonable rates, and credit market disruptions have had a significant negative impact on global financial markets. In particular, the cost of financing in the global debt markets has increased substantially, restricting the availability of funds in such markets. Substantial volatility in the financial and capital markets, the unavailability of financing at reasonable rates, recent and ongoing increases in inflation and interest rates globally, and disruptions in the credit market and increasing inflation in the world’s largest economies may have a significant negative impact on overall conditions for fundraising. Although we believe our cash and cash equivalents, together with cash we expect to generate from operations and unused capacity available under our existing credit facilities, provide adequate resources to fund ongoing operating requirements, we may need to seek additional financing to compete effectively.
If we are unable to obtain capital on commercially reasonable terms or in a timely manner, it could:
| · | adversely affect our ability to honor our financial obligations; |
| · | reduce funds available to us for purposes such as working capital, capital expenditures, research and development, strategic acquisitions and other general corporate purposes; |
| · | restrict our ability to introduce new products or exploit business opportunities; |
| · | increase our vulnerability to economic downturns and competitive pressures in the markets in which we operate; and |
| · | place us at a competitive disadvantage. |
If we decide to increase our debt levels, we may be subject to risks, including our inability to pay outstanding debt, which may adversely affect our financial condition. In addition, in connection with any new indebtedness we incur, we may be required to meet certain covenants in our financing arrangements, such as maintaining financial ratios, and may be subject to restrictions on our ability to incur new debt or make new investments. A breach of these covenants may result in a mandatory prepayment or acceleration of the maturity of our outstanding debt. In the event of a prepayment or acceleration, our assets and cash flow might not be sufficient to pay the full amount due, which would have a material adverse effect on our financial condition.
We may be unable to comply with restrictive covenants under our financing agreements.
We are subject to certain restrictive covenants based on certain financial and nonfinancial indicators which are set forth in the majority of the indebtedness and finance agreements to which we are a party. Certain of such covenants relate to requirements to comply with certain predetermined levels of leverage. Any failure by us to comply with the restrictive covenants in our credit agreements as a result of adverse conditions in our business environment may trigger the acceleration of part of our indebtedness, limit our access to new credit facilities as well as adversely affect our business and results of operations.
Changes in the secured overnight financing rate, or SOFR, could adversely affect the amount of interest that accrues on SOFR-linked instruments.
Our current syndicated loan includes floating rates based, in part, on SOFR. Because SOFR is published by the Federal Reserve Bank of New York, or the FRBNY, based on data received from other sources, we have no control over its determination, calculation or publication. There can be no assurance that SOFR will not be discontinued or fundamentally altered in a manner that is materially adverse to the interests of debtors in SOFR-linked instruments. If the manner in which SOFR is calculated is changed, that change may result in a change in the amount of interest that accrues on any SOFR-linked instruments. In addition, the interest rate on SOFR-linked instruments may for any day not be adjusted for any modification or amendments to SOFR for that day that the FRBNY may publish if the interest rate for that day has already been determined prior to such determination. There is no assurance that changes
in SOFR could not have a material adverse effect on the yield on, value of, and market for SOFR-linked instruments.
Further, SOFR is a relatively new interest rate, and the FRBNY or any successor, as administrator of SOFR, may make methodological or other changes that could change the value of SOFR, including changes related to the methodology by which SOFR is calculated, eligibility criteria applicable to the transactions used to calculate SOFR or timing related to the publication of SOFR. If the manner in which SOFR is calculated is changed, the change may result in an increase in the amount of interest payable on loans we owe from the lenders. The administrator of SOFR may withdraw, modify, suspend or discontinue the calculation or dissemination of SOFR in its sole discretion and without notice, and has no obligation to consider the interests of lenders in calculating, withdrawing, modifying, amending, suspending or discontinuing SOFR.
In addition to SOFR, we have entered and may in the future enter into financing arrangements with floating rates tied to other benchmarks, such as the Sterling Overnight Index Average, or SONIA.
See “Management’s Discussion and Analysis of Financial Condition and Results of Operations—Liquidity and Capital Resources—Indebtedness” for additional information.
Failure to work within our financial framework and a suitable capital structure could impact our ability to operate and result in financial loss and a material decrease in returns on investment in our common shares.
Failure to accurately forecast or work within our financial framework could impact our ability to operate and result in financial loss. Trade and other receivables, including overdue receivables, may not be recovered, divestments may not be successfully completed and a substantial and unexpected cash call or funding request could disrupt our financial framework or overwhelm our ability to meet our obligations.
An event such as a significant operational incident, legal proceedings or a geopolitical event in an area where we have significant activities, could reduce our financial liquidity and our credit ratings. Credit rating downgrades could potentially increase financing costs and limit access to financing or engagement in our trading activities on acceptable terms, which could put pressure on the group’s liquidity.
In the event of extended constraints on our ability to obtain financing, we could be required to reduce capital expenditure or increase asset disposals in order to provide additional liquidity, which could lead to a material decrease in returns on investment in our common shares.
Our insurance coverage may not be sufficient to fully cover all of our losses arising from our business and operations.
Our operations are subject to a number of hazards and risks that may not be covered by insurance policies. We maintain insurance at levels that are customary in our industry to protect against these liabilities; however, our insurance may not be adequate to cover all losses or liabilities that might be incurred in our operations.
For example, pollution, environmental risks and the risk of natural disasters generally are not fully insurable, and, as a result, we are not fully insured against all risks associated with pollution, contamination and other environmental incidents or impacts. In addition, we do not maintain insurance coverage for all business interruptions causes. If, for example, our workers were to strike, the resulting work stoppages could have a substantial and adverse effect on us. In addition, we do not insure most of its assets against war or sabotage. Therefore, an attack or an operational incident causing an interruption of our business activities could have a material and adverse effect on our performance.
As described above, during the last decade, we have had three fires in facilities involving the loss of our inventories. See “—We are exposed to the possibility of losses related to natural disasters, catastrophes, accidents, fire, political, social and economic events, terrorist acts, wars, and other events not in our control, which may have a material adverse effect on our business, financial condition and results of operations.”
Moreover, we will be subject to the risk that we may not be able to renew, maintain or obtain insurance of the type and amount desired at reasonable rates. If we were to incur a significant liability for which we are not fully covered, it could have a materially adverse effect on our business, financial condition and results of operations.
Our governance processes, compliance policies and internal controls may not be sufficient to prevent regulatory penalties and reputational damage.
Our compliance and governance policies, which include the review of internal controls over financial reporting, may not be sufficient to ensure that we are able to comply with existing and future legal, regulatory (including applicable anti-corruption and antitrust laws), accounting and other corporate governance requirements and standards. Accordingly, we, our subsidiaries and our affiliates may be subject to violations of our code of conduct and anti-corruption policies, and cases of fraudulent behavior or corrupt or anti-competitive practices by employees, contractors or other agents.
In particular, given the complexity and breadth of our business, and the particular sensitivity of the industries in which we operate to anti-competitive practices, we cannot assure you that our processes, such as our governance and compliance programs as well as our internal controls, are sufficient to avoid risks of investigation of illicit or irregular conduct and possible penalties. Despite the existence of our internal procedures, we may be subject to, among other things, litigation, investigations, expenses, fines, administrative and criminal sanctions and penalties by different authorities (including arrests and coercive conduction of its representatives, employees, contractors or other collaborators), in addition to the loss of licenses, permits or other regulatory instruments necessary for its operations, search and apprehension, and damage to its image and reputation.
Failure to comply with the applicable rules and legislation may subject us, our subsidiaries, our affiliates, our employees, contractors or other agents, to, among other things, litigation, investigations, expenses, fines, loss of operating licenses, reputation damage, preventive arrest warrants, coercive measures and other applicable sanctions, penalties and damage, each of which may adversely affect our business, financial condition and results of operations.
Volatility in the price of the products we sell may have a material adverse effect on us.
Our results of operations may be significantly affected by volatility in the prices of the products we sell. The prices of these products are subject to significant fluctuation as a result of domestic and international demand, production volumes and global stock levels. Price volatility may have a significant impact on our results of operations, particularly if our revenues fall below our production costs.
The prices at which we are able to sell their products depend on local and global market conditions, which are outside of our control, including natural disasters, governmental policies, trade policies, changes in supply and demand patterns, increases or decreases in purchasing power and the production of similar or competing products. The prices at which we are able to sell their products have a significant impact on our results of operations. Any significant or prolonged decrease in the price of our products may have adverse effects on our business, financial condition and results of operations.
Climate change can create financial risks, particularly as a result of transition, physical, regulatory and other risks, all of which could materially and adversely affect us.
Climate risk is a transversal risk that can be an aggravating factor for the types of traditional risks that we manage in the ordinary course of business, including without limitation the risks described in this “Risk Factors” section. Based on the classifications used by Task-Force on Climate-Related Financial Disclosures and by the International Sustainability Standards Board, we consider that there are two primary sources of climate change-related financial risks: physical and transition.
Physical risks resulting from climate change can be event-driven (acute) or long-term shifts (chronic) in climate patterns:
| · | Acute physical risks include increased severity of extreme weather events, such as drought, hurricanes; or floods. |
| · | Chronic physical risks include changes in precipitation patterns and extreme variability in weather patterns, rising mean temperatures, chronic heat waves or rising sea levels. |
Rainfall patterns in particular have been constantly changing, causing certain regions to experience rainfall volumes far above historical averages, resulting in floods and inundations and landslides in hillside and mountain regions. Such changes in rainfall patterns could have an adverse effect on our production and distribution capacity, affecting our ability to distribute our products and provide services to our customers. The occurrence of storms and floods may also influence the cost to insure our assets, especially those in high-risk regions, where storms, tornadoes and other extreme events are more pronounced. In periods of scarcity of rain, water deficiency occurs because of the decrease in the levels of water reservoirs, with an influence on the availability and costs of electric energy, considering the dependence on energy generated through hydroelectric plants, as well as on crop harvests. The scarcity of rains combined with low levels of reservoirs can lead governments and authorities to restrict industrial activities and direct water for human consumption. The increase in average temperatures may have an impact on our operating costs due to the greater demand for cooling and air conditioning to produce, store and transport some of our products. Historically, in periods of water scarcity, governmental authorities have authorized an increase in the energy prices as a measure to stimulate the reduction of consumption, which can create inflationary pressure, with impacts on the income levels of the population in general, on production costs and on the final price of products, which consequently affects our revenues and results.
Extreme and prolonged changes in rainfall patterns and an increase in temperatures can influence production cycles in certain regions, and droughts can influence the increase in fires and devastation, which may adversely affect our facilities. Additionally, they can also cause a reduction in revenue and an increase in costs due to negative impacts on our employees and suppliers, such as increased absenteeism and issues involving health and safety.
Transition risks refer to actions taken to address mitigation and adaptation requirements related to climate change, and they can fall into various categories such as market, technology and market changes:
| · | Market risk may manifest through shifts in supply and demand for certain commodities, products, and services, as climate-related risks and opportunities are increasingly taken into account. |
| · | Technology risk arises from improvements or innovations to support the transition to a lower-carbon, energy-efficient economic system that can have a significant impact on companies to the extent that new technology displaces old systems and disrupts some parts of the existing economic system. |
| · | Policy actions generally fall into two categories—those that attempt to constrain actions that contribute to the adverse effects of climate change and those that seek to promote adaptation to climate change. The risk associated with, and the financial impact of, policy changes depend on the nature and timing of the policy change. |
With respect to regulatory risks, the outcome of new or potential legislation or regulation in the jurisdictions in which we operate may result in new or additional requirements, additional charges to fund energy efficiency activities, fees or restrictions on certain activities. Compliance with these initiatives may also result in additional costs to us, including, among other things, increased production costs, additional taxes, reduced emission allowances or additional restrictions on production or operations. Any climate change regulations enacted in the future could also negatively impact our ability to compete with companies situated in areas not subject to such limitations. Even without such regulation, increased public awareness and adverse publicity about potential impacts on climate change emanating from us or our industry could harm us. We may not be able to recover the cost of compliance with new or more stringent laws and regulations, which could adversely affect our business and negatively impact our growth.
These requirements may increase going forward as a result of the increasing importance of environmental matters, which could expose us to increased compliance costs and limit our ability to pursue certain business opportunities and provide certain products and services, each of which could adversely affect our business, financial condition and results of operations.
We may not be successful in meeting our environmental, social and corporate governance, or ESG, commitments, which may have an adverse effect on our business, financial condition, reputation and results of operations.
The market is increasingly concerned with how companies assess and manage ESG risks to protect themselves and create opportunities to generate value. As part of this trend, we have made certain ESG commitments, and we
strive to maintain socially responsible business practices, including fostering social investments and structuring programs to generate a positive social impact in areas related to our business, such as renewable energy, employability, education, and culture. Failure to meet our ESG commitments or to pursue these socially responsible business practices, partially or at all, may have a material adverse effect on our business, reputation, financial condition and results of operations.
There has been an increase in ESG rules and regulations applicable to our business and we expect this tendency to continue. Given the pace of legislative developments in this area, we may not be able to comply with the new regulations in their totality. We are also exposed to the risk that future ESG rules and regulations may adversely affect our ability to conduct our business by requiring us to reduce the value of our assets or reduce their useful life, facing increased compliance costs or taking other actions that may be adverse to us.
In addition, our suppliers or dealers may engage in conduct that violates human rights and for which we may be held liable in civil, labor, criminal and administrative proceedings, including for damages and remediation costs. As a result, we may face difficulties in obtaining or maintaining operating licenses, and their reputation may be negatively affected.
We may be unable to protect our intellectual property rights and may be accused of violating third-party property, which could adversely affect our liquidity, financial position and results of operations.
If we are unable to protect our intellectual property rights, or those of subsidiaries, our ability to operate our business and to compete in the markets in which we operate could be adversely affected. Among other factors, the success of our business also depends on the effective protection of our trademarks, patents, domain names, trade secrets, know-how and intellectual property rights and those held by our subsidiaries.
There is a risk that we may not be successful in renewing our title or licensing certain intellectual property rights in a timely manner or at all, or that the validity of such rights may be successfully challenged by third parties. In addition, we may not be able to enforce intellectual property rights in certain countries where our subsidiaries, investees or common controlled company operate as the laws of certain foreign countries, including those in many emerging markets, may not fully protect these rights. The costs required to maintain proper registration and protect such rights can be substantial and affect the result of our operations.
We cannot assure you that third parties will not infringe or misappropriate intellectual property rights, despite our efforts to actively monitor against their unauthorized use. In addition, we are not able to guarantee that the measures taken by companies to protect our intellectual property rights will be sufficient. For this reason, we may need to engage in legal proceedings to defend our rights and there can be no guarantees that we will be successful. The improper or unauthorized use of such intellectual property rights could decrease the value of our brands, adversely affect our reputation, cause a decline in sales, and have a material adverse effect on our business, financial condition and results of operations.
If we are sued for infringing intellectual property rights of third parties, it may be costly and time-consuming, and an unfavorable outcome in any litigation could harm our business.
We cannot assure you that our activities will not, unintentionally or otherwise, infringe on the patents, trademarks or other intellectual property rights owned by others. Third parties may claim that the products or services provided by our subsidiaries violate their intellectual property rights, and we may spend significant time and effort and incur significant litigation costs if we are required to defend ourselves against claims of intellectual property rights infringement brought against us, regardless of whether the claims have merit. If we are found to have infringed on the patents, trademarks or other intellectual property rights of others, we may be subject to substantial claims for damages, which could materially impact our business, financial condition, results of operations and cash flow. We may also be required to cease development, use or sale of the relevant products or processes, or we may be required to obtain a license on the disputed rights, which may not be available on commercially reasonable terms, if at all.
We have identified material weaknesses in our internal control over financial reporting as of December 31, 2023 and, if we fail to remediate such deficiencies (or identify and remediate other material weaknesses) and maintain effective internal controls over financial reporting, we may be unable to accurately report our financial results of operations, meet our reporting obligations or prevent fraud.
Prior to this offering, we were not an SEC registrant and were not required to assess or report on the effectiveness of our internal control over financial reporting under the Sarbanes-Oxley Act of 2002.
Our management has not completed the assessment of the effectiveness of our internal control over financial reporting under the Sarbanes-Oxley Act of 2002 and our independent registered public accounting firm has not conducted an audit of our internal control over financial reporting. In connection with the audit of our consolidated financial statements as of December 31, 2023, we and our independent registered public accounting firm identified certain material weaknesses in our internal control over financial reporting related to (i) the lack of sufficient information technology general controls designed and implemented in the information technology environment for certain smaller group entities (e.g., BR Fluids and France); and (ii) inadequate internal controls framework in respect to design of process level controls, including lack of transactional level controls and management review controls with insufficient level of precision on our oversight review process over the financial statements and over significant unusual and complex transactions.
A material weakness is a deficiency or combination of deficiencies in internal control over financial reporting such that there is a reasonable possibility that a material misstatement of the annual or interim consolidated financial statements will not be prevented or detected on a timely basis.
We are committed to adopting remediation measures with respect to the material weaknesses identified above within the next 12 months, implementing new processes and enhancing oversight review procedures over the financial reporting and information technology controls framework. We believe these measures, once implemented, should adequately remediate the material weaknesses identified above.
We cannot guarantee that the measures we take and actions we may take in the future will be sufficient to remediate the control deficiencies that led to our material weaknesses in our internal control over financial reporting or that they will prevent or avoid potential future material weaknesses. Any failure to maintain effective internal control over financial reporting could severely inhibit our ability to accurately report our consolidated financial condition or results of operations, which could cause investors to lose confidence in our financial statements and the trading price of our common shares to decline.
Under Section 404 of the Sarbanes-Oxley Act of 2002, our management is not required to assess or report on the effectiveness of our internal control over financial reporting in our annual report on Form 20-F for the year ending December 31, 2024. We are only required to provide such a report for the year ending December 31, 2025. During the course of documenting and testing our internal control procedures, in order to satisfy the requirements of Section 404 of the Sarbanes-Oxley Act of 2002, we may identify other weaknesses and deficiencies in our internal control over financial reporting. In addition, if we fail to maintain the adequacy of our internal control over financial reporting, as these standards are modified, supplemented or amended from time to time, we may not be able to conclude on an ongoing basis that we have effective internal control over financial reporting in accordance with Section 404 of the Sarbanes-Oxley Act of 2002. If we fail to achieve and maintain an effective internal control environment, we could suffer material misstatements in our consolidated financial statements, fail to meet our reporting obligations or fail to prevent fraud, which would likely cause investors to lose confidence in our reported financial information. This would, in turn, limit our access to capital markets, harm our results of operations, and lead to a decline in the trading price of our common shares. Additionally, ineffective internal control over financial reporting would expose us to increased risk of fraud, misuse of corporate assets and shareholder litigation, and could subject us to potential delisting from the NYSE, regulatory investigations and civil or criminal sanctions.
Disclosure controls and procedures over financial reporting may not prevent or detect all errors or acts of fraud.
Disclosure controls and procedures, including internal controls over financial reporting, are designed to provide reasonable assurance that information required to be disclosed by the company in reports filed or submitted under the U.S. Securities Exchange Act of 1934, as amended, or the Exchange Act, is accumulated and communicated to management, and recorded, processed, summarized and reported within the time periods specified in the SEC’s rules and forms.
These disclosure controls and procedures have inherent limitations, which include the possibility that judgments in decision-making can be faulty and result in errors or mistakes. Additionally, controls can be circumvented by any unauthorized override of the controls. Consequently, our business is exposed to risk from potential noncompliance with policies, employee misconduct, negligence and fraud, which could result in regulatory sanctions, civil claims and serious reputational or financial harm. In particular, it is not always possible to deter employee misconduct, and the precautions we take to prevent and detect this activity may not always be effective. Accordingly, because of the inherent limitations in the control system, misstatements due to error or fraud may occur and not be detected.
We may also acquire businesses with unknown liabilities, contingent liabilities, internal control deficiencies or other risks. We have plans and procedures to review potential acquisition candidates for a variety of due diligence matters, including compliance with applicable regulations and laws prior to acquisition. Despite these efforts, realization of any of these liabilities or deficiencies may increase our expenses, adversely affect our financial position or cause us to fail to meet our public financial reporting obligations (including as a result of difficulties in integrating different internal control systems with our existing internal control systems).
We are subject to a wide variety of complex domestic and foreign laws, rules and regulations, compliance with which could adversely affect our results of operations, cash flow or financial condition.
We are subject to a wide variety of complex domestic and foreign laws, rules and regulations, and legal compliance risks, including securities laws, tax laws, employment and pension-related laws, competition laws, U.S. and foreign export and trading laws, data privacy and cybersecurity laws, and laws governing improper business practices. We are affected by new laws and regulations, and changes to existing laws and regulations, including interpretations by courts and regulators. From time to time, we, our operations and the industries in which we operate may be reviewed or investigated by regulators, which could lead to enforcement actions or the assertion of private litigation claims and damages.
Although we believe we have adopted appropriate risk management and compliance programs to mitigate these risks, the global and diverse nature of our operations means compliance risks will continue to exist. Investigations, examinations and other proceedings, the nature and outcome of which cannot be predicted, likely may arise from time to time. These investigations, examinations and other proceedings could subject us to significant liability and require us to take significant accruals or pay significant settlements, fines and penalties, which could have a material adverse effect on our results of operations, cash flow or financial condition.
Our business is subject to a number of laws and regulations in various jurisdictions governing data privacy and security.
In the ordinary course of business, we collect, store, and transmit information, including personal information, in relation to our current, past or potential customers, business partners, employees and contractors. We therefore face particular privacy, data security and data protection risks in connection with requirements of certain laws, rules and regulations, including the GDPR, national implementing legislation of the GDPR, the UK GDPR and UK Data Protection Act 2018, and other data protection regulations in the European Economic Area, or the EEA, the United Kingdom, and in other jurisdictions, such as Brazilian Law No. 13,709/2018, or the Brazilian General Data Protection Law (Lei Geral de Proteção de Dados Pessoais), or the LGPD.
The LGPD, which came into force on September 18, 2020, regulates the processing of personal data in Brazil. It applies to any processing activities conducted by any natural person or legal entity, public or private, regardless of the processing method, the country or location of the entity’s headquarters, or the data’s location, provided that the activity: (i) is carried out in Brazil; (ii) is aimed at offering or providing goods or services in Brazil or to individuals located in Brazil; or (iii) involves personal data collected in Brazil. This comprehensive regulatory framework impacts all sectors of the economy and establishes, among other measures, protection rights for the data subjects. In cases where the processing of personal data is permitted through legal bases, there are obligations and requirements related to information security incidents, such as leakage of personal data and transfer of personal data, as well as sanctions for non-compliance. In addition, the LGPD authorized the creation of the National Data Protection Authority (Autoridade Nacional de Proteção de Dados, or the “ANPD”), which exercises a triple role of (i) investigation, comprising the power to issue standards and procedures, deliberate on the interpretation of the LGPD and request information from data controllers and processors; (ii) sanctioning, in cases of non-compliance with the law, through administrative proceedings; and (iii) education, with the responsibility of disseminating information
and promoting knowledge of the LGPD and security measures, promoting standards of services and products that facilitate data control and preparing studies on national and international practices for the protection of personal data and privacy, among others.
The administrative sanctions provided for in the LGPD (articles 52, 53 and 54) came into effect on August 1, 2021, under Law no. 14,010/2020. Non-compliance with the LGPD may expose us to the following sanctions, either individually or cumulatively: (i) a warning, with an indication of the deadline for adopting measures; (ii) fines of up to 2% of the revenue of the group’s last fiscal year, excluding taxes, up to an overall amount of R$50 million per violation; (iii) daily fines up to the limit referred to in the previous item; (iv) an offense disclosure obligation; (v) temporary blocking and/or deletion of personal data; (vi) partial suspension of the database to which the infraction relates for a period of up to six months, extendable for the same period, until the personal data processing is regularized; (vii) suspension of the exercise of the personal data processing activity to which the infraction relates for a period of up to six months, extendable for the same period; and (viii) partial or total prohibition from exercising activities related to data processing. In addition, other authorities in Brazil may initiate investigations, complaints or administrative or legal actions based on violations of the LGPD. Moreover, individuals and non-governmental or private associations can also initiate complaints and administrative or legal actions based on violations of the LGPD that have caused or may cause harm to individuals. Such claims may result in compensations and fines. Therefore, failures in the protection of personal data processed by us, or non-compliance with applicable legislation, may result in severe fines, mandatory incident disclosure, elimination of personal data from our databases, and even suspension of activities. These outcomes could result in costs that may have an adverse and negative effect on our reputation, results of operations and the value of our common shares.
In addition, among other stringent requirements, the GDPR and UK GDPR restrict transfers of data outside of the EEA and UK to third countries deemed to lack adequate privacy protections (such as the United States), unless the appropriate safeguard specified is implemented and, the ability of companies to lawfully transfer personal data from the EEA and the United Kingdom to the United States and other third countries is presently complex and uncertain. Other countries have enacted or are considering enacting similar cross-border data transfer rules, such as Brazil, or data localization requirements. As this area and the enforcement landscape relating to it further develop, we could: suffer additional costs, complaints and/or regulatory investigations or fines; have to stop using certain tools and vendors and make other operational changes; have to implement new and/or revised standard contractual clauses for existing intragroup, customer and vendor arrangements within required time frames; or otherwise see our future ability to deliver our products in the EEA, the United Kingdom and other foreign markets affected. Fines for certain breaches of the GDPR and the UK GDPR are significant, up to the greater of €20 million/£17.5 million or 4% of total global annual turnover. In addition to the foregoing, a breach of the GDPR or UK GDPR could result in regulatory investigations, reputational damage, orders to cease or change our processing of our data, enforcement notices and/or assessment notices (for a compulsory audit). We may also face civil claims including representative actions and other class action-type litigation (where individuals have suffered harm), potentially amounting to significant compensation or damages liabilities, as well as associated costs, diversion of internal resources and reputational harm.
In the United States, there are numerous federal and state data privacy and security laws and regulations governing the collection, storage, transmission, disclosure, retention, management, use and other processing of personal information, including federal and state data privacy laws, data breach notification laws and consumer protection laws. We may become subject to these laws and regulations. For example, the Federal Trade Commission, or the FTC, and many state attorneys general are interpreting federal and state consumer protection laws to impose standards for the online collection, use, dissemination and security of data. Such standards would require us to publish statements that describe how we handle personal data and choices individuals may have about the way we handle their personal data. If the information we publish is considered untrue or inaccurate, we may be subject to government claims of unfair or deceptive trade practices, which could lead to significant liabilities and consequences. Moreover, according to the FTC, violating consumers’ privacy rights or failing to take appropriate steps to keep consumers’ personal data secure may constitute unfair acts or practices in or affecting commerce in violation of Section 5(a) of the Federal Trade Commission Act. At the federal level, the U.S. Congress is also considering various proposals for comprehensive federal data privacy legislation and, while no comprehensive federal data privacy law currently exists, we are subject to applicable existing federal laws and regulations. State consumer protection laws provide causes of action similar to those available under the FTC for unfair or deceptive practices. Some states, such as California, have passed specific laws mandating reasonable security measures for the handling of consumer data. Further, privacy advocates and industry groups have regularly proposed and sometimes
approved, and may propose and approve in the future, self-regulatory standards with which we must legally comply or that contractually apply to us.
Security incidents can result in misappropriation of our information and/or our customers’ information or affect our servers or operations, which can materially and adversely affect us. In the event of a security incident in our systems that results in leakage, misappropriation, loss or unauthorized access to personal data, deletion or modification of information about our customers, service blocking or other interruption of business operations, we may be subject to (i) the abovementioned penalties, (ii) damage to our reputation causing us to lose existing or potential customers and strategic partnerships and (iii) adverse effects on our business, impacting our operating and financial results. Any loss of intellectual property, trade secrets or other sensitive business information or the interruption of our operations may adversely affect our financial results and our reputation.
The scope of data privacy and security laws, rules and regulations continues to evolve, and we believe that the adoption of increasingly restrictive regulations in this area may be likely within the jurisdictions in which we operate. Compliance with data privacy and security restrictions could increase the cost of our operations and failure to comply with such restrictions could subject us to criminal and civil sanctions as well as other penalties. In addition, a growing number of other global jurisdictions are considering or have passed legislation implementing data protection requirements or requiring local storage and processing of data or similar requirements that could increase the cost and complexity of our business. If we are unable to meet these evolving legal requirements or if we violate or are perceived to have violated any laws, rules, regulations or other obligations relating to privacy, data protection or information security, we may harm our reputation and become subject to investigations, claims and other remedies that would expose us to significant fines, penalties, and other damages, all of which would harm our business.
Failure to comply with the anti-corruption, anti-bribery, anti-money laundering and other international trade laws and regulations could negatively impact our reputation and results of operations.
As a result of doing business in foreign countries, including through partners and agents, we are exposed to a risk of violating anti-corruption laws and sanctions regulations. Some of the international locations in which we operate have developing legal systems and may have higher levels of corruption than more developed nations. Our continued expansion and worldwide operations, including in developing countries, the development of joint venture and third-party distributor relationships worldwide increase the risk of violations of anti-corruption laws and economic and trade sanctions. Violations of anti-corruption laws and economic and trade sanctions are punishable by civil penalties, including fines, denial of export privileges, injunctions, asset seizures, debarment from government contracts (and termination of existing contracts) and revocations or restrictions of licenses, as well as criminal fines and imprisonment. In addition, any major violations could have a significant impact on our reputation and consequently on our ability to win future business.
Moreover, our anti-corruption policies and procedures designed to prevent governmental corruption violations may not prevent our management, employees or third parties acting on our behalf in the countries in which we operate from taking actions that violate applicable laws and regulations on improper payments to government officials for the purpose of obtaining or keeping business or business advantages. Laws prohibiting such behaviors include (but are not limited to) laws relating to the Organisation for Economic Cooperation and Development’s 1997 Convention on Combating Bribery of Foreign Public Officials in International Business Transactions, such as the U.S. Foreign Corrupt Practices Act and Brazilian Anticorruption Law No. 12,846/2013, or the Anti-Corruption Act, which has been in effect since January 29, 2014. Any breach thereof may have a material adverse effect on our business, financial condition and results of operations, including access to financing, as well as the acceleration of loans and financing. Consequently, if we, our management, our employees or third parties acting on our behalf in the countries in which we operate and sell our products become involved in any corruption or criminal investigations or proceedings in connection with our business in the countries in which we operate, our business could be materially adversely affected.
Moreover, if any person in the Cayman Islands knows or suspects, or has reasonable grounds for knowing or suspecting that another person is engaged in criminal conduct or money laundering, or is involved with terrorism or terrorist financing and property, and the information for that knowledge or suspicion came to their attention in the course of business in the regulated sector, or other trade, profession, business or employment, the person will be required to report such knowledge or suspicion to (i) the Financial Reporting Authority of the Cayman Islands, or
the FRA, pursuant to the Proceeds of Crime Act (As Revised) of the Cayman Islands, if the disclosure relates to criminal conduct or money laundering, or (ii) a police officer of the rank of constable or higher, or the FRA, pursuant to the Terrorism Act (As Revised) of the Cayman Islands, if the disclosure relates to involvement with terrorism or terrorist financing and property. Such report shall not be treated as a breach of confidence or of any restriction upon the disclosure of information imposed by any enactment or otherwise.
In addition, economic sanctions programs restrict our dealings with certain sanctioned countries, individuals and entities. Although we have internal policies and procedures designed to ensure compliance with applicable anti-fraud, anti-bribery and anti-corruption laws and sanctions regulations, potential violations of anti-corruption laws have been identified on occasion as part of our compliance and internal control processes. When such issues arise, we attempt to act promptly to learn relevant facts, conduct appropriate due diligence and take any appropriate remedial action to address the risk. Given the size of our operations and the complexity of the production chain, there can be no assurance that our internal policies and procedures will be sufficient to prevent or detect all inappropriate practices, fraud or violations of law by our employees, directors, officers, partners, agents and service providers or that such persons will not take actions in violation of our policies and procedures (or otherwise in violation of the relevant anti-corruption laws and sanctions regulations) for which we or they may be ultimately held responsible. Violations of anti-bribery and anti-corruption laws and sanctions regulations could have a material adverse effect on our business, reputation, results of operations and financial condition. In addition, we may be subject to one or more enforcement actions, investigations and proceedings by authorities for alleged infringements of these laws. These proceedings may result in penalties, fines, sanctions or other forms of liability and could have a material adverse effect on our reputation, business, financial condition and results of operations.
Requirements associated with being a public company in the United States will require significant company resources and management attention.
Upon completion of this offering, we will be subject to certain reporting requirements of the Exchange Act and the other rules and regulations of the SEC and the NYSE. We will also be subject to various other regulatory requirements, including the Sarbanes-Oxley Act. We expect these rules and regulations to increase our legal, accounting and financial compliance costs and to make some activities more time-consuming and costly. For example, we expect these rules and regulations to make it more difficult and more expensive for us to obtain director and officer liability insurance, and we may be required to accept reduced policy limits and coverage or incur substantial costs to maintain the same or similar coverage.
New rules and regulations relating to disclosure, financial reporting and controls and corporate governance, which could be adopted by the SEC, NYSE or other regulatory bodies or exchange entities from time to time, could result in a significant increase in legal, accounting and compliance costs and make certain corporate activities more time-consuming and costly, which could materially affect our business, financial condition and results of operations. These rules and regulations may also make it more difficult for us to attract and retain qualified persons to serve on our board of directors or as executive officers. These obligations will also require substantial attention from our senior management and could divert their attention away from the day-to-day management of our business. Given that most of the individuals who now constitute our management team have limited experience managing a publicly traded company and complying with the increasingly complex laws pertaining to public companies, initially, these new obligations could demand even greater attention. These cost increases and the diversion of management’s attention could materially and adversely affect our business, financial condition and results of operations.
Our business and financial results could suffer if we are unable to attract, retain and motivate talented employees, including senior management, and maintain our corporate culture.
Our success depends in part on our ability to identify, attract and onboard qualified candidates with the requisite education, background, skills and experience and our ability to retain, develop, progress and engage qualified employees across our business, including our stores, manufacturing, information technology, corporate and other operations and functions. To the extent we are unable to remain competitive in our compensation practices, talent management strategy, inclusive workplace culture and related inclusion, diversity and equity and employee engagement strategies, initiatives, programs and practices, or if qualified candidates or employees become more difficult to attract or retain under reasonable terms, we may experience higher labor-related costs and may be unable to attract, retain, develop and progress a qualified global workforce, which could adversely affect our business and future success and impair our ability to meet our strategic objectives and the needs of our customers.
Our success also depends in significant part on maintaining high levels of employee engagement and nurturing our values and culture. We also believe that our company culture is a critical driver of our success and we invest substantial time and resources in building, maintaining and evolving our culture. Any failure to preserve and evolve our culture could negatively affect our future success, including our ability to retain and recruit employees.
Further, our ability to successfully execute organizational changes, including succession planning and the transition of our executive officers and key employees, is critical to the continued success of our business. The unexpected loss of the services of key employees or executive officers could have a material adverse effect on our business and prospects.
Impairment evaluations of goodwill, intangible assets, investments or other long-lived assets could result in a reduction in our recorded asset values which could have a material adverse effect on our financial position and results of operations.
We perform reviews of goodwill and indefinite-lived intangible assets on an annual basis, or more frequently if triggering events indicate a possible impairment. We test goodwill at the reporting unit level by comparing the carrying value of the net assets of the reporting unit, including goodwill, to the reporting unit’s fair value. Similarly, we test indefinite-lived intangible assets by comparing the fair value of the assets to their carrying values. If the carrying values of goodwill or indefinite-lived intangible assets exceed their fair value, the goodwill or indefinite-lived intangible assets would be considered impaired. In addition, we perform a review of a definite-lived intangible asset or other long-lived asset when changes in circumstances or events indicate a possible impairment. If any impairment or related charge is warranted, then our financial position and results of operations could be materially affected.
Volatility and uncertainty in fuel, crude and other raw material prices can affect our operational margins and competitive position.
Fuel, crude and other raw material prices have historically been volatile and may continue to be so in the future. Fuel, crude and other raw material prices are influenced by numerous factors including, among others, demand and supply, processing, transportation allotment and availability, price and availability of alternative fuel sources, weather conditions, natural disasters and political conditions or hostilities in oil-producing regions, besides the political factors related to government pricing policy.
In our operations, we may need to contract freight services provided by outsourced truck drivers to carry out the distribution of our products, and the costs of these types of services are strongly linked to the cost of fuels, especially that of diesel, which may adversely affect our business, financial condition and results of operations. Accordingly, any significant variations in fuel prices may have a material adverse effect on our business, financial condition and results of operations.
The growth of our business may adversely affect the communities adjacent to our facilities, which may have a material adverse effect on our reputation.
Our activities may impact the lives and socioeconomic dynamics of communities, especially those neighboring our manufacturing plants and distribution centers. These impacts may include truck, train, vehicle and pedestrian traffic, construction, property expropriation, and the displacement of communities. As a result, there may be stoppages in our operations by virtue of demonstrations in surrounding communities, as well as investigations and judicial measures by public prosecutors and other authorities. Such demonstrations or investigations may be motivated by a lack of dialogue with the communities surrounding our units and may have a material adverse effect on our reputation.
Damage to our reputation and to the reputation of our key shareholders, suppliers and partners could have a material adverse effect on our business, financial condition and results of operations.
The good reputation of our brand is a key factor in the success of our business. We may be affected by negative news about ExxonMobil and the Mobil brand published in the media and picked up by news outlets, as it could lead to the incorrect assumption by the public that it relates to Moove or to our brands. We may also be adversely affected by negative news about our controlling shareholder, Cosan, given the inherent association by the public between Moove and the economic group of which we are a part. If we are unable to quickly and effectively respond
to negative reports, comments or posts in the media and social media platforms, we may suffer damage to our reputation or loss of consumer confidence in our products, which could adversely affect our business, results of operations, cash flows and financial condition, as well as be required to expend resources to rebuild our reputation.
In addition, actual or alleged incidents at any of our manufacturing facilities or distribution centers or those of ExxonMobil or Cosan could result in harmful publicity. Any actual or perceived issue with our products or those of ExxonMobil or Cosan could also result in harmful publicity. Even incidents occurring at our suppliers or partners or in the supply chain generally could result in negative publicity that could harm our industry and thus, indirectly, our brand.
Moreover, in recent years, there has been a marked increase in the use of social media platforms and similar devices which give individuals access to a broad audience of consumers and other interested persons. Many social media platforms immediately publish the content their participants post, often without filters or checks on accuracy of the content posted. A variety of risks are associated with the dissemination of this information online, including the improper disclosure of proprietary information, negative comments about our company, exposure of personally identifiable information, fraud or outdated information. The inappropriate use of social media platforms by ExxonMobil or Cosan, suppliers and partners or other persons could increase our costs, lead to litigation or result in negative publicity that could damage our reputation.
Our holding company structure makes us dependent on the operations of our subsidiaries.
Our holding company has no business operations of its own. The only material asset of our holding company will be all of the outstanding capital stock of our operating subsidiaries. As such, we will be dependent on the earnings and cash flow of, and dividends and distributions from, our operating subsidiaries to pay our expenses incidental to being a public holding company and to pay any cash dividend or distribution on our common shares, in each case that may be authorized by our board of directors. Our operating subsidiaries may not generate sufficient cash flow to pay dividends or distribute funds to us because, for example, our operating subsidiaries may not generate sufficient cash or profit; local laws may restrict or prohibit our operating subsidiaries from issuing dividends or making distributions unless our operating subsidiaries have sufficient surplus or net profits, which they may not have; or contractual restrictions may prohibit or limit such dividends or distributions.
Furthermore, we may be adversely affected if the governments of the countries in which we operate impose legal restrictions or taxes on dividend distributions by our subsidiaries, and exchange rate fluctuations will affect the U.S. dollar value of any distributions our subsidiaries make with respect to our equity interests in those subsidiaries. For further information, see “—Risks Relating to the Countries in Which We Operate—The Brazilian political environment has historically influenced and continues to influence the performance of the Brazilian economy and the confidence of investors and the general public” and “Dividends and Dividend Policy.”
We may not be able to keep in force or timely renew all permits and/or licenses for use and operation necessary for the development of our activities.
We may not be able to keep in force or renew with the appropriate public authorities all permits and/or licenses for use and operation necessary for the development of our activities, which are issued by the municipalities’ mayors’ offices and by the appropriate fire department. Additionally, we cannot guarantee that licenses, permits, licenses and authorizations, such as use and operating permits and/or documents relating to the regularity of built-up areas, have not been breached in the past when in the process of obtaining or renewing them.
If we are unable to obtain or renew such permits, we may be subject to fines and the closing of any irregular facilities, with the interruption of the activities carried out by us at such facilities. Any factors that impact the failure to obtain or renew such licenses and permits may cause us to incur additional costs, which may force us to reallocate resources to meet any additional charges.
Furthermore, conducting our business without the appropriate licenses or failure to comply with the licenses and their technical requirements can result in various penalties that may be applied according to the severity of the non-compliance with the corresponding licensing, such as: (i) resulting in infraction notices; (ii) the imposition of successive fines; (iii) preventing the opening and operation of units, even temporarily; (iv) interdiction or closure of units, even temporarily; (v) exposing us to additional risks or loss of insurance coverage in the event of a safety and security accident or similar event; (vi) adversely affect such facility while a license is pending; and (vii) expose us and our representatives to criminal sanctions, in the event of carrying out activities without the proper licenses.
We may not be able to maintain or renew the lease agreements, or even enter into lease agreements on favorable terms.
We conduct a significant portion of our business in properties owned by third parties and occupied by means of leases. Our business may be adversely affected if we are unable to maintain or renew such leases on favorable terms or at all.
We may be adversely affected if: (i) a significant number of its lease agreements are terminated or not renewed on favorable terms; or (ii) it is unable to enter into lease agreements for new properties in strategic locations or such lease agreements are not entered into on satisfactory terms. We may also face competition for commercial space, and consequently, the loss of any of our strategic locations could adversely affect our operating results and financial condition.
The existence of encumbrances or legal restrictions on the properties we occupy may have a negative impact on us.
Some of the properties we lease are subject to liens, encumbrances and legal restrictions registered with the respective real estate registries. If there were to be a default on the underlying obligations which these restrictions secure, the creditors may enforce the guarantee, in which case the properties may be sold at auction, or the property may be consolidated in the creditor’s own name to satisfy the debt, resulting in the transfer of ownership to third parties with whom we have no relationship. Such an event could require us to negotiate new contractual terms and conditions with the new owners or the termination of the existing lease agreements, which may result in terms that are not favorable to us or may even result in us having to vacate such properties, which could have a material adverse effect on us.
Risks Relating to the Countries in Which We Operate
Difficult market and geopolitical conditions can adversely affect our business in many ways, each of which could materially reduce our revenue, earnings and cash flow and adversely affect our financial prospects and condition.
We may be materially adversely affected by unfavorable political and economic developments in any of the countries in which we operate. Our business, financial performance and results of operations may be adversely affected by changes in policy and regulations involving or affecting certain factors, such as:
| · | exchange rate variations; |
| · | exchange rate control policies; |
| · | interest rate fluctuations; |
| · | liquidity available in the capital, credit and financial markets; |
| · | expansion or contraction of the economies of the countries in which we operate, as measured by rates of growth in GDP; |
| · | global economic and political events, such as the ongoing war between Russia and Ukraine and the war between Israel and Hamas; |
| · | ports, customs and tax authorities’ strikes; |
| · | changes in transportation market regulations; |
| · | supply chains and logistics; |
| · | price increases of oil and other inputs; |
| · | social and political instability, including allegations of corruption against political parties, civil servants and others; |
| · | labor, employment and social security laws and regulation; |
| · | energy and water shortages and rationing; |
| · | other economic, political, diplomatic and social developments in or affecting Latin America, Europe, the United States or any other countries or regions where we operate. |
We conduct most of our operations in emerging markets, where we plan on expanding through additional stores and operations. Future developments in emerging market economies may affect GDP growth rates and, consequently, the consumption of our products. As a result, these developments could adversely affect our business strategies, results of operations and financial condition. For instance, modifications to laws and regulations in emerging markets according to political, social and economic interests have often involved, among other measures, increases or decreases in interest rates, changes in fiscal and tax policies, wage and price controls, foreign exchange rate controls, blocking access to bank accounts, currency devaluations, capital controls and import restrictions. We have no control over and cannot predict the measures or policies that the governments of the countries in which we operate may take in the future.
Developments in the other markets in which we operate may also have a material adverse effect on us. The adverse effects—global or localized—of the ongoing war between Russia and Ukraine, the war between Israel and Hamas, and/or economic sanctions and import and/or export controls imposed on the Russian government by the Americas, the United Kingdom, the European Union, or the EU, or others, and the adverse effect on the wider global economy and market conditions could, in turn, have a material adverse effect on our business, financial condition and results of operations. Furthermore, continued uncertainty around the terms of the United Kingdom’s relationship with the EU and the lack of a comprehensive trade agreement may negatively impact the economic growth of both regions, as well as the wider global economy, market conditions and investor confidence. This could, in turn, have a material adverse effect on our operations, financial condition and prospects.
There have also been concerns over conflicts, unrest and terrorist threats in the Middle East, Europe and Africa, which have resulted in volatility in oil and other markets. The EU, the United States and Russia have been at odds over Ukraine and Eastern Europe. An escalation of the tensions between the European Union, the United States and Russia could adversely affect the global economy. The United States and China have recently been involved in disputes regarding Taiwan, rights to navigation in the South China Sea, alleged human rights abuses in China and trade barriers in China that threatened a trade war between the countries. Sustained tension between the United States and China over these and other matters could significantly undermine the stability of the global economy. It is unclear whether these challenges and uncertainties will be contained or resolved, and what effects they may have on the global political and economic conditions in the long term.
Additionally, economic conditions in the countries in which we operate may also be affected by political developments in the United States. We cannot assure you that any developments in the United States or elsewhere will not materially and adversely affect us in the future.
Our business may be materially adversely affected by unfavorable economic, political, social or other developments and risks in the countries in which we operate.
We may be materially adversely affected by unfavorable economic developments in any of the countries where we have distribution networks, or production facilities. In particular, our business is dependent on general economic
conditions in our most important markets, including in Latin America, Europe and the United States. A significant deterioration in economic conditions in any of our important markets, including economic slowdowns or recessions, inflationary pressures and/or disruptions to credit and capital markets, could lead to decreased consumer confidence and consumer spending more generally, thus reducing demand for our products. Unfavorable economic conditions could also negatively impact our customers, suppliers and financial counterparties, who may experience cash flow problems, increased credit defaults or other financial issues. In addition, volatility in the credit and capital markets caused by unfavorable economic developments and uncertainties could result in a reduction in the availability of, or an increase in the cost of, our financing. Our business could also be affected by other economic developments such as fluctuations in currency exchange rates, the imposition of import, investment or currency restrictions, including tariffs and import quotas, or any restrictions on the repatriation of earnings and capital. Any of these developments may have a material adverse effect on our business and financial results.
Our operations are also subject to a variety of other risks and uncertainties related to our global operations, including adverse political, social or other developments. Political and/or social unrest or uncertainties, potential health issues, natural disasters, disease outbreaks or pandemics, such as COVID-19, wars and conflicts, such as the ongoing war between Russia and Ukraine and the war between Israel and Hamas, politically motivated violence and terrorist threats and/or acts may also occur in countries where we have operations. Any of the foregoing could have a material adverse effect on our business, financial condition and performance.
Many of the above risks are heightened, or occur more frequently, in emerging markets. In general, emerging markets are also exposed to relatively higher risks of liquidity constraints, inflation, devaluation, price volatility, currency convertibility, corruption, crime and lack of law enforcement, expropriation of assets, and sovereign default, as well as additional legal and regulatory risks and uncertainties. Developments in emerging markets can affect our ability to import or export products and to repatriate funds, as well as impact levels of consumer demand and therefore our levels of sales or profitability. Any of these factors may affect us disproportionately or in a different manner from our competitors, depending on our specific exposure to any particular emerging market, and could have a material adverse effect on our business and financial results.
Inflation and government measures to curb inflation may adversely affect the economies and capital markets in some of the countries in which we operate, and as a result, harm our business, financial condition and results of operations, as well as the trading price of our common shares.
High levels of inflation have adversely affected the economies and financial markets of some of the countries in which we operate, and the ability of their governments to create conditions that stimulate or maintain economic growth. Brazil has experienced extremely high rates of inflation in the past, which, according to the General Market Price Index (Índice Geral de Preços – Mercado), a general price inflation index, reached 17.8% as of December 31, 2021, 5.5% as of December 31, 2022 and (3.2)% as of December 31, 2023 (10.1% as of December 31, 2021, 5.8% as of December 31, 2022 and 3.7% as of December 31, 2023 according to the National Consumer Price Index (Índice Nacional de Preços ao Consumidor Amplo)). The United States, the United Kingdom and other areas in which we do business are also experiencing inflation levels that are higher than at any point in the past few decades. Argentina is also currently experiencing hyperinflation, which is affecting our operations in that market. Inflationary pressures may lead governments to intervene in the economy, including through the implementation of government policies that may have an adverse effect on us and our customers, especially in a context of increased market volatility given the impacts of COVID-19, and any continued increase of such interest rates may negatively affect our profits and results of operations, thereby increasing the costs of financing our operations.
Moreover, governmental measures to curb inflation and speculation about possible future governmental measures have contributed to the negative economic impact of inflation and have created general economic uncertainty and heightened volatility in the capital markets. Inflation may adversely affect our sales, revenue and profit as a decrease in our consumers’ purchasing power may lead them to switch to lower cost products. Inflation may also result in an increase in costs which we may not be able to pass on to consumers, particularly if consumers are already considering lower cost options as a result of inflationary pressures on their purchasing power. Either of these circumstances could adversely affect our earnings and results of operations. If the countries in which we operate continue to experience high inflation rates, we may not be able to adjust the prices of our products in order to compensate for the effects of inflation in our costs structure, which may have an adverse effect on us.
High interest rates may impact our cost of obtaining loans and also the cost of indebtedness, resulting in an increase in our financial expenses. For example, the Brazilian government’s measures to control inflation have frequently included maintaining a restrictive monetary policy with high interest rates, thereby limiting the availability of credit and reducing economic growth. Official interest rates in Brazil as of December 31, 2023, 2022 and 2021 were 11.65%, 13.75% and 9.25% per year, respectively, as established by the monetary policy committee of the Central Bank (Comitê de Política Monetária). As of the date of this prospectus, the official interest rate in Brazil was 10.50%. This increase may adversely affect our ability to pay our financial obligations, as it reduces our cash availability. Mismatches between contracted indexes for assets versus liabilities and/or high volatilities in interest rates may result in financial losses for us. Any increase of such interest rates may negatively affect our profits and results of operations, thereby increasing the costs of financing our operations.
Changes and uncertainties in the tax system in the countries in which we have operations could materially adversely affect our financial condition and results of operations, and reduce net returns to our shareholders.
We are subject to tax laws and regulations in the numerous other jurisdictions in which we operate. These laws and regulations are inherently complex, and we will be obligated to make judgments and interpretations about the application of these laws and regulations to us and our operations and businesses. The interpretation and application of these laws and regulations could be challenged by the relevant governmental authorities, which could result in administrative or judicial proceedings, actions or sanctions, which could be material.
Moreover, we file income tax returns in multiple jurisdictions. Our consolidated effective income tax rate, and the tax treatment of the beneficial ownership of our common shares, could be materially adversely affected by several factors, including: changing tax laws, regulations and treaties, or the interpretation thereof; tax policy initiatives and reforms; the practices of tax authorities in jurisdictions in which we operate; and the resolution of issues arising from tax audits or examinations and any related interest or penalties. Such changes may include (but are not limited to) changes to the taxation of operating income, investment income and dividends received or (in the specific context of withholding tax) dividends paid.
We are unable to predict what tax reform may be proposed or enacted in the future or what effect such changes would have on our business, but such changes, to the extent they are brought into tax legislation, regulations, policies or practices in jurisdictions in which we operate, could increase the estimated tax liability that we have expensed to date and paid or accrued on our balance sheets, and otherwise affect our financial position, future results of operations, cash flows in a particular period and overall or effective tax rates in the future in countries where we have operations, reduce post-tax returns to our shareholders and increase the complexity, burden and cost of tax compliance.
For example, on December 20, 2023, the Brazilian Congress enacted Constitutional Amendment No. 132. This amendment provides for a comprehensive reform of the Brazilian tax system, entailing the elimination of various taxes currently applicable to goods and services, including social contributions, federal tax on industrialized products, municipal tax on services, and tax on the circulation of goods and services (the “indirect taxes”), and the creation of three new taxes on operations with goods and services: a Goods and Services Tax (“IBS”), a Federal Contribution on Goods and Services (“CBS”) and an Excise Tax (“IS”).
Constitutional Amendment No. 132 is subject to a transition period of seven years starting in 2026, and it will fully come into force in 2032. The current indirect taxes (ICMS, IPI, ISS and PIS/COFINS) will continue to exist and will be gradually replaced by IBS, CBS and IS by 2032.
A tax reform on income and payroll taxation is also on the Brazilian government’s agenda. Constitutional Amendment No. 132 stipulates that the executive branch of the Brazilian government must submit bills of law for income and payroll tax reforms to the National Congress in the first half of 2024. Even though the original deadline was not met, the executive branch can still submit a proposed bill of law. As of the date of this prospectus, the executive branch had not submitted these bills of law to the national congress.
In 2021, an attempt to reform income taxation was made through Bill of Law No. 2,337/2021. Although the House of Representatives approved this bill on September 2, 2021, it has since stalled in the Senate, which is scheduled to vote on it next. This initiative proposes significant changes to income tax legislation, including repealing the exemption from income tax on the distribution of dividends by Brazilian companies (and imposing a
general 15% income tax rate), gradually decreasing combined Brazilian corporate income tax rates, and extinguishing the possibility of deducting expenses from the payment of interest on shareholder’s equity (juros sobre o capital próprio – JCP). It is likely that the income and payroll taxation reform resulting from Constitutional Amendment No. 132 will include similar provisions to those in Bill of Law No. 2,337/2021.
The effects of any proposed Brazilian tax reforms on our business have not yet been quantified and/or assessed. Furthermore, the final outcome of any Brazilian tax reforms is outside of our control, and any failure to comply with new tax rules may adversely affect our business and results of operations.
We are subject to financial risks as a result of our operations, including exposure to foreign currency fluctuations and the impact of foreign currency restrictions.
Foreign currency fluctuations may affect our financial position and results of operations. Because our subsidiaries generally invoice their sales in reais, devaluation of the real against foreign currencies may generate losses from our foreign currency-denominated liabilities as well as an increase in our funding costs with a negative impact on our ability to finance our operations through access to the international capital markets and on the market value of the shares. A strengthening of the real in relation to the U.S. dollar generally has the opposite effect, which may adversely affect our operating margins. Our exposure to foreign currencies may increase as we expand our business in foreign markets.
In addition, our indebtedness has both pre-fixed and post-fixed rates and is therefore exposed to the risk of interest rate variations. If interest rates increase, our financial results may be adversely affected. Further devaluations of the Brazilian currency may occur and impact our business in the future. These foreign exchange and monetary gains or losses can be substantial, which can significantly impact our earnings from one period to the next. In addition, depreciation of the real relative to the U.S. dollar could (1) result in additional inflationary pressures in Brazil by generally increasing the price of imported products and services and requiring recessionary government policies to curb demand, and (2) weaken investor confidence in Brazil and reduce the market price of the shares. On the other hand, further appreciation of the real against the U.S. dollar may lead to a deterioration of the country’s current account and the balance of payments and may dampen export-driven growth.
Moreover, certain of the countries in which we operate, particularly emerging markets, have experienced strong currency devaluations and shortages in foreign currency reserves, and their respective governments have adopted restrictions on the ability to transfer funds out of the country and convert local currencies into U.S. dollars. This may increase our costs and limit our ability to convert local currency into U.S. dollars and transfer funds out of certain countries, including for the purchase of dollar-denominated inputs. In the event that any of our subsidiaries are unable to transfer funds to us due to currency restrictions, we are responsible for any resulting shortfall.
In addition, we are active in the capital markets, obtaining funds denominated in national and foreign currencies to finance our investments and working capital. Our current and non-current loans and borrowings denominated in foreign currency as of June 30, 2024 were R$3,261.0 million compared to R$2,207.0 million at December 31, 2023. We manage a portion of our exchange rate risk through foreign currency derivative instruments. Our foreign currency debt obligations are not completely hedged, as a portion of our perpetual notes are unhedged. As a result, the possible depreciation of the real against the U.S. dollar could increase the cost of our obligations in foreign currency, and therefore significantly affect our statement of profit or loss in the short term. The depreciation of the real may limit our access to international capital markets and may favor state intervention in the economy, including the imposition of potentially recessionary policies.
Political events in the countries in which we operate, particularly in South America, may have an influence on the performance of the local economy and the confidence of investors and the general public.
Political events may affect the economies of the countries in which we operate, particularly in South America. We cannot assure you that the governments of the countries in which we operate will maintain policies designed to promote macroeconomic stability, fiscal discipline, low levels of public debt, and domestic and foreign investments, or that they will not be subject to corruption, anti-money laundering and other investigations. Failure on the part of such governments to do so may adversely impact the economies of the countries in which we operate, the prices of securities of issuers with significant operations in those countries such as us and ultimately our business, financial condition and results of operations.
Moreover, the governments of the countries in which we operate may be subject to internal pressure to change their current macroeconomic policies in order to achieve higher rates of economic growth. We cannot predict what policies will be adopted by such governments. Any indecisiveness in implementing changes to certain policies or regulations may contribute to economic uncertainty in those countries and adversely affect our business, financial condition and results of operations.
In addition, the executive branches of the countries in which we operate have the power to enact policies and issue orders relating to their respective local economies, including in the sector in which we operate, through specific regulations, which could affect our operations and financial performance. Political and economic uncertainty and any new policies or changes in current policies could have a material adverse effect on our business, operating results, financial condition and prospects. Any difficulty by the governments of the countries in which we operate in obtaining a majority in the legislature could result in stalemate, political unrest and demonstrations and/or strikes that could adversely affect our operations. Uncertainties in relation to the implementation of changes related to monetary, fiscal and social security policies, as well as to the pertinent legislation, can contribute to economic instability.
Finally, global economic conditions as well as internal developments may affect the economies of the countries in which we operate and demand for our products and services. We have indebtedness linked to certain interest rates and, therefore, are exposed to interest rate risk. Our financial results could be adversely affected if interest rates continue to rise or if they remain at elevated rates for a prolonged period. A global or local economic recession may lead to reduced demand for our products, either because of lower levels of consumption or because of protectionist measures being put in place. In both cases, the result would be a decrease in the price of our products and a decrease in the volumes of products we sell. Moreover, in 2023, and mid 2024 through the date of this prospectus, markets and the global economy have been adversely affected by the ongoing war between Russia and Ukraine and the related sanctions imposed on Russia by the United States and its allies, the ongoing banking crisis in the United States and Europe, tensions between the United States and China, the ongoing war between Israel and Hamas and other global developments. The ongoing U.S. presidential elections may have global political, economic and financial implications, including without limitation for U.S. relations with other countries, the strength of the U.S. economy (where a significant portion of our operations are conducted), U.S. trade policy, capital markets and exchange rates. Any such developments would have a material adverse effect on our business, financial condition and results of operations.
Developments and the perception of risk may adversely affect the economies of the countries in which we operate and the trading price of our securities.
The market value of securities of listed issuers is affected by economic and market conditions globally, including the United States, European countries, and in Latin American and emerging market countries. Investors’ reactions to developments in the world’s largest economies and financial markets, such as the U.S. and Europe, may have an adverse effect on the market value of our securities. Additionally, crises in emerging market countries may diminish investor interest in securities of issuers with significant operations in emerging markets, including our securities, as well as adversely affect the availability of credit in the international markets to companies with significant operations in emerging markets. This could adversely affect the market price of our securities, restrict our access to capital markets and compromise our ability to finance our operations in the future on favorable terms, or at all.
In 2023 and mid 2024 through the date of this prospectus, markets and the global economy have been adversely affected by the ongoing war between Russia and Ukraine and the related sanctions imposed on Russia by the United States and its allies. An escalation of the war between Ukraine and Russia or an escalation of the tensions between the United States and Russia could have a material adverse effect on the global and Brazilian economies, and ultimately on our business. A banking crisis is also ongoing in the United States and in Europe, which has adversely affected financial markets and the availability of credit globally. There have also been concerns over conflicts, unrest and terrorist threats in the Middle East, Europe and Africa, which have resulted in volatility in oil and other markets. The United States and China have recently been involved in disputes regarding Taiwan, rights to navigation in the South China Sea, alleged human rights abuses in China, as well as in a controversy over trade barriers in China that threatened a trade war between the countries. Sustained tension between the United States and China over these and other matters could significantly undermine the stability of the global economy. Moreover, global markets are affected by Israel’s ongoing war against Hamas and related conflicts between other entities or
countries in the Middle East. It is unclear whether these challenges and uncertainties will be contained or resolved, and what effects they may have on the global political and economic conditions in the long term.
A global economic slowdown, especially in the United States and countries in emerging markets, including as a result of the effects of the Russian-Ukraine and/or Israel-Hamas wars, tensions between the United States and China, or other factors beyond our control, may adversely affect the global economy and the economies of the countries in which we operate and have a material adverse effect on our business.
In addition, we continue to be exposed to disruptions and volatility in the global financial markets because of their effects on the financial and economic environment, such as a slowdown in the economy, an increase in the unemployment rate, a decrease in the purchasing power of consumers and the lack of credit availability.
Disruption or volatility in the global financial markets could further increase negative effects on the financial and economic environment in the countries in which we operate, which could have a material adverse effect on our business, financial condition and results of operations.
Our operations expose us to political and economic risks in the countries in which we operate.
Our exports (sales to countries where we do not operate directly) represented 2.7% and 2.6% of our revenue for the six months ended June 30, 2024 and for the year ended December 31, 2023, respectively. Our international activities expose us to risks not faced by companies that operate solely in Brazil. Risks associated with our operations include: (i) foreign exchange controls; (ii) changes in the political or economic conditions in a specific country or region, especially in emerging markets; (iii) potentially negative consequences resulting from changes to regulatory requirements; (iv) difficulties and costs associated with our observance of different laws, treaties and complex international regulations; (v) tax rates that may exceed those applicable in Brazil and other countries or gains that may be subject to withholding regimes and an increase in repatriation taxes; (vi) imposition of trade barriers; and (vii) limitations on the repatriation of undistributed profits. The realization of any of these risks may have a material adverse effect on our business, results of operations or financial condition.
Moreover, we have exported certain of our products to Russia and Ukraine in the past. These export sales were suspended during the first quarter of 2022. While as of the date of this prospectus there have not been any material impacts from the ongoing war between Russia and Ukraine on our business, we are continuously monitoring the developments to assess any potential future impacts that may arise as a result of the ongoing war. The ongoing war between Russia and Ukraine, and/or economic sanctions and import and/or export controls to be imposed by the United States, the UK, the EU or others, and their adverse effects on the wider global economy and market conditions could have a material adverse effect on our business, financial condition and results of operations.
Risks Relating to Our Common Shares and the Offering
There is no existing market for our common shares, and we do not know whether one will develop to provide you with adequate liquidity. If the trading price of our common shares fluctuates after this offering, you could lose a significant part of your investment.
Prior to this offering, there has not been a public market for our common shares. We cannot predict the extent to which investor interest in our company will lead to the development of an active trading market on the NYSE, or otherwise or how liquid that market might become. If an active trading market does not develop, you may have difficulty selling any of our common shares that you buy. The initial public offering price for the common shares will be determined by negotiations between us and the underwriters and may not be indicative of prices that will prevail in the open market following this offering. Consequently, you may not be able to sell our common shares at prices equal to or greater than the price paid by you in this offering. The market price of our common shares may be influenced by many factors, some of which are beyond our control, including:
| · | announcements by us or our competitors of significant developments; |
| · | technological innovations by us or our competitors; |
| · | the failure of financial analysts to cover our common shares after this offering or changes in financial estimates by analysts; |
| · | changes in financial estimates by financial analysts, or any failure by us to meet or exceed any of these estimates, or changes in the recommendations of any financial analysts that elect to follow our common shares or the shares of our competitors; |
| · | actual or anticipated variations in our operating results; |
| · | future sales of our shares; and |
| · | investor perceptions of us and the industries in which we operate. |
In addition, the stock market in general has experienced substantial price and volume fluctuations that have often been unrelated or disproportionate to the operating performance of particular companies affected. These broad market and industry factors may materially harm the market price of our common shares, regardless of our operating performance. In the past, following periods of volatility in the market price of certain companies’ securities, securities litigation has been instituted against these companies. This litigation, if instituted against us, could adversely affect our financial condition or results of operations.
Cosan will own % of our common shares after this offering. This concentration of ownership and voting power will limit your ability to influence corporate matters.
Following this offering, Cosan will continue to control our Company through its beneficial ownership of % of our common shares (or % if the underwriters exercise the over-allotment option in full). As a result, so long as Cosan beneficially owns % of our outstanding common shares, Cosan will be able to effectively control our decisions requiring shareholder approval and will be able to elect a majority of the members of our board of directors. The decisions of Cosan on these matters may be contrary to your expectations or preferences, and they may take actions that could be contrary to your interests. For further information regarding shareholdings in our company, see the section titled “Principal and Selling Shareholders.”
Future sales of a substantial number of common shares in the public market following this offering, or the perception that such sales could occur, could cause the price of our common shares to decline.
The market price of our common shares could decline as a result of substantial sales of our common shares, particularly sales by our directors, executive officers and significant shareholders, a large number of common shares becoming available for sale or the perception in the market that such sales could occur. Upon the closing of this offering, we will have approximately common shares outstanding (or common shares, if the underwriters exercise in full their over-allotment option). Subject to the lock-up agreements described below, the common shares sold in this offering will be freely tradable without restriction or further registration under the Securities Act by persons other than our affiliates within the meaning of Rule 144 of the Securities Act.
Our shareholders or entities controlled by them or their permitted transferees will, subject to the lock-up agreements described below, be able to sell their common shares in the public market from time to time without registering them, subject to certain limitations on the timing, amount and method of those sales imposed by regulations promulgated by the SEC. If any of our shareholders, the affiliated entities controlled by them or their respective permitted transferees were to sell a large number of their common shares, the market price of our common shares may decline significantly. In addition, the perception in the public markets that sales by them might occur may also cause the trading price of our common shares to decline.
We, all of our executive officers and directors and the holders of all of our equity securities have entered into lock-up agreements with the underwriters of this offering that restrict our and our equityholders’ ability to transfer our securities, subject to certain exceptions, during the period ending on the 180th day following the date of this prospectus. However, may, in their sole discretion and without notice, release all or any portion of the shares from the restrictions in any of the lock-up agreements described above. In addition, these lock-up agreements are subject to the exceptions described in the section titled “Underwriting,” including our right to issue new shares if we carry out an acquisition or enter into a merger, joint venture or strategic participation.
In addition, based on our capitalization as of June 30, 2024, shares issuable upon exercise of outstanding options will also be eligible for sale upon expiration of the lock-up period. We intend to register all of
the shares underlying outstanding options and any shares underlying other equity incentives we may grant in the future for public resale under the Securities Act. Accordingly, these shares will be able to be freely sold in the public market upon issuance to the extent permitted by any applicable vesting requirements and the lock-up agreements described above.
Sales of a substantial number of our common shares, including upon expiration of the lock-up agreements, the perception that such sales may occur, or early release of these lock-up periods, could cause the trading price of our common shares to fall or make it more difficult for you to sell your common shares at a time and price that you deem appropriate.
Our Memorandum and Articles of Association contain anti-takeover provisions that may discourage a third party from acquiring us and adversely affect the rights of holders of our common shares.
Our Memorandum and Articles of Association contain certain provisions that could limit the ability of others to acquire control of our company, including provisions that:
| · | authorize our board of directors to issue, without further action by the shareholders, undesignated preferred shares with terms, rights and preferences determined by our board of directors that may be senior to our common shares; |
| · | institute a staggered board of directors and restrictions on our shareholders to fill a vacancy on the board of directors; |
| · | impose advance notice requirements for shareholder proposals; |
| · | limit our shareholders’ ability to call special meetings; and |
| · | require approval from the holders of at least two-thirds in voting power of all outstanding shares entitled to vote thereon to amend a provision of our Memorandum and Articles of Association. |
These provisions could discourage, delay or prevent a transaction involving a change in control of our company. These provisions could also make it more difficult for you and other stockholders to elect directors of your choosing and cause us to take other corporate actions than you desire.
We have granted in the past and intend to grant in the future share and other equity incentives, which may result in increased share and other equity-based compensation expenses.
We believe that the granting of share and other equity-based compensation is of significant importance to our ability to attract and retain key personnel and employees, and as such, we plan on continuing to grant share and other equity-based compensation to our executives and employees, including pursuant to our stock option plan and phantom shares plan, which may result in increased equity-based compensation expenses. As a result, expenses associated with share or other equity-based compensation may increase, which may have an adverse effect on our business and results of operations. See “Management—Compensation of Directors and Officers—Stock Option Plan” and “Management—Compensation of Directors and Officers—Phantom Shares Plan.”
If securities or industry analysts do not publish research, or publish inaccurate or unfavorable research, about our business, the price of our common shares and our trading volume could decline.
The trading market for our common shares depends in part on the research and reports that securities or industry analysts publish about us or our business. If one or more of the analysts who cover us downgrade our common shares or publish inaccurate or unfavorable research about our business, the price of our common shares would likely decline. If one or more of these analysts cease coverage of our company or fail to publish reports on us regularly, demand for our common shares could decrease, which might cause the price of our common shares and trading volume to decline.
We may not pay any cash dividends in the foreseeable future.
The declaration, payment and amount of any future dividends will be made at the discretion of our board of directors and will depend upon, among other things, the results of operations, cash flows and financial condition, operating and capital requirements, and other factors as our board of directors considers relevant. There is no assurance that future dividends will be paid, and if dividends are paid, there is no assurance with respect to the amount of any such dividend.
New investors in our common shares will experience immediate and substantial dilution after this offering.
The initial public offering price of our common shares will be substantially higher than the pro forma net tangible book value per share of the outstanding common shares immediately after this offering. Based on an assumed initial public offering price of US$ per share (the midpoint of the price range set forth on the cover of this prospectus) and our net tangible book value as of June 30, 2024, if you purchase our common shares in this offering you will pay more for your shares than the amounts paid by our existing shareholders for their shares and you will suffer immediate dilution of approximately US$ per share in pro forma net tangible book value. See the section titled “Dilution.”
As a foreign private issuer, we have different disclosure and other requirements than U.S. domestic registrants.
As a foreign private issuer, we may be subject to different disclosure and other requirements than domestic U.S. registrants. For example, as a foreign private issuer, in the United States, we are not subject to the same disclosure requirements as a domestic U.S. registrant under the Exchange Act, including the requirements to prepare and issue quarterly reports on Form 10-Q or to file current reports on Form 8-K upon the occurrence of specified significant events, the proxy rules applicable to domestic U.S. registrants under Section 14 of the Exchange Act or the insider reporting and short-swing profit rules applicable to domestic U.S. registrants under Section 16 of the Exchange Act. In addition, we intend to rely on exemptions from certain U.S. rules which will permit us to follow Cayman Islands legal requirements rather than certain of the requirements that are applicable to U.S. domestic registrants. However, Cayman Islands laws and regulations applicable to Cayman Islands companies do not contain any provisions comparable to the U.S. proxy rules, the U.S. rules relating to the filing of reports on Form 10-Q or 8-K or the U.S. rules relating to liability for insiders who profit from trades made in a short period of time.
Furthermore, foreign private issuers are required to file their annual report on Form 20-F within 120 days after the end of each fiscal year, while U.S. domestic issuers that are accelerated filers are required to file their annual report on Form 10-K within 75 days after the end of each fiscal year. Foreign private issuers are also exempt from Regulation Fair Disclosure, aimed at preventing issuers from making selective disclosures of material information, although we will be subject to Cayman Islands laws and regulations having substantially the same effect as Regulation Fair Disclosure. As a result of the above, even though we are required to file reports on Form 6-K disclosing the limited information which we have made or are required to make public pursuant to Cayman Islands law, or are required to distribute to shareholders generally, and that is material to us, you may not receive information of the same type or amount that is required to be disclosed to shareholders of a U.S. company.
Moreover, we are not required to file periodic reports and financial statements with the SEC as frequently or within the same time frames as U.S. companies with securities registered under the Exchange Act. We currently prepare our financial statements in accordance with IFRS. We will not be required to file financial statements prepared in accordance with or reconciled to U.S. generally accepted accounting principles, or U.S. GAAP, so long as our financial statements are prepared in accordance with IFRS as issued by the IASB.
We cannot predict if investors will find our common shares less attractive because we will rely on these exemptions. If some investors find our common shares less attractive as a result, there may be a less active trading market for our common shares and our share price may be more volatile.
See “Description of Share Capital—Principal Differences between Cayman Islands and U.S. Corporate Law.”
We may lose our foreign private issuer status, which would then require us to comply with the Exchange Act’s domestic reporting regime and cause us to incur significant legal, accounting and other expenses.
In order to maintain our current status as a foreign private issuer, either (a) more than 50% of our common shares must be either directly or indirectly owned of record by non-residents of the United States or (b)(1) a majority of our executive officers or directors must not be U.S. citizens or residents; (2) more than 50% of our assets cannot be located in the United States; and (3) our business must be administered principally outside the United States. If we lose this status, we would be required to comply with the Exchange Act reporting and other requirements applicable to U.S. domestic issuers, which are more detailed and extensive than the requirements for foreign private issuers. We may also be required to make changes in our corporate governance practices in accordance with various SEC and NYSE rules. The regulatory and compliance costs to us under U.S. securities laws if we are required to comply with the reporting requirements applicable to a U.S. domestic issuer may be significantly higher than the costs we will incur as a foreign private issuer.
We are a “controlled company” within the meaning of the NYSE listing standards and, as a result, will qualify for, and intend to rely on, exemptions from certain corporate governance requirements.
Upon the completion of this offering, Cosan will continue to control a majority of the voting power of our common shares. As a result, we will be a “controlled company” within the meaning of the NYSE listing standards. Under these rules, a company of which more than 50% of the voting power is held by an individual, a group or another company is a “controlled company” and may elect not to comply with certain corporate governance requirements of the NYSE, including (1) the requirement that a majority of the board of directors consist of independent directors, (2) the requirement that we have a nominating and corporate governance committee that is comprised entirely of independent directors with a written charter addressing the committee’s purpose and responsibilities and (3) the requirement that we have a compensation committee that is comprised entirely of independent directors with a written charter addressing the committee’s purpose and responsibilities. Following this offering, we intend to rely on some or all of these exemptions. As a result, we will not have a majority of independent directors and our remuneration committee will not consist entirely of independent directors. Accordingly, you will not have the same protections afforded to shareholders of companies that are subject to all of the corporate governance requirements of the NYSE.
We are a Cayman Islands exempted company with limited liability. The rights of our shareholders, including with respect to fiduciary duties and corporate opportunities, may be different from the rights of shareholders governed by the laws of U.S. jurisdictions.
We are a Cayman Islands exempted company with limited liability. Our corporate affairs are governed by our Memorandum and Articles of Association, by the Companies Act (As Revised) of the Cayman Islands, or the Companies Act, and the common law of the Cayman Islands. The rights of shareholders and the responsibilities of members of our board of directors may be different from the rights of shareholders and responsibilities of directors in companies governed by the laws of U.S. jurisdictions. In particular, as a matter of Cayman Islands law, directors of a Cayman Islands company owe fiduciary duties to the company and separately a duty of care, diligence and skill to the company. Under Cayman Islands law, directors and officers owe the following fiduciary duties: (1) duty to act in good faith in what the director or officer believes to be in the best interests of the company as a whole; (2) duty to exercise powers for the purposes for which those powers were conferred and not for a collateral purpose; (3) directors should not improperly fetter the exercise of future discretion; (4) duty to exercise powers fairly as between different sections of shareholders; (5) duty to exercise independent judgment; and (6) duty not to put themselves in a position in which there is a conflict between their duty to the company and their personal interests. Our Memorandum and Articles of Association have varied this last obligation by providing that a director must disclose the nature and extent of his or her interest in any contract or arrangement, and following such disclosure and subject to any separate requirement under applicable law or the listing rules of the NYSE, and unless disqualified by the chairman of the relevant meeting, such director may vote in respect of any transaction or arrangement in which he or she is interested and may be counted in the quorum at the meeting. Conversely, under Delaware corporate law, a director has a fiduciary duty to the corporation and its shareholders (made up of two components) and the director’s duties prohibit self-dealing by a director and mandate that the best interests of the corporation and its shareholders take precedence over any interest possessed by a director, officer or controlling shareholder and not shared by the shareholders generally. See the section titled “Description of Share Capital—Principal Differences between Cayman Islands and U.S. Corporate Law.”
Our shareholders may face difficulties in protecting their interests because we are a Cayman Islands exempted company.
Our corporate affairs are governed by our Memorandum and Articles of Association, the Companies Act and the common law of the Cayman Islands. The rights of shareholders to take action against our directors, actions by minority shareholders and the fiduciary responsibilities of our directors to us under Cayman Islands law are to a large extent governed by the common law of the Cayman Islands. The common law of the Cayman Islands is derived in part from comparatively limited judicial precedent in the Cayman Islands as well as from English common law, which has persuasive, not binding, authority on a court in the Cayman Islands. The rights of our shareholders and the fiduciary responsibilities of our directors under Cayman Islands law are not as clearly established as they would be under statutes or judicial precedent in some jurisdictions in the United States. In particular, the Cayman Islands has a less exhaustive body of securities laws than the United States. In addition, some U.S. states, such as Delaware, have more fulsome and judicially interpreted bodies of corporate law than the Cayman Islands.
As a result of all of the above, public shareholders may have more difficulty in protecting their interests in the face of actions taken by management, members of the board of directors or controlling shareholders than they would as shareholders of a corporation incorporated in a jurisdiction in the United States.
In addition, shareholders of Cayman Islands exempted companies have no general rights under Cayman Islands law to inspect corporate records and accounts or to obtain copies of lists of shareholders. Our directors have discretion under our Memorandum and Articles of Association to determine whether or not, and under what conditions, our corporate records may be inspected by our shareholders, but are not obliged to make them available to our shareholders. This may make it more difficult for you to obtain information needed to establish any facts necessary for a shareholder motion.
United States civil liabilities and certain judgments obtained against us by our shareholders may not be enforceable.
We are a Cayman Islands exempted company and substantially all of our assets are located outside of the United States. In addition, the majority of our directors and officers are nationals and residents of countries other than the United States, and a substantial portion of the assets of these persons is located outside of the United States. As a result, it may be difficult to effect service of process within the United States upon these persons. It may also be difficult to enforce in U.S. courts judgments obtained in U.S. courts based on the civil liability provisions of the U.S. federal securities laws against us and our officers and directors who are not resident in the United States and the substantial majority of whose assets are located outside of the United States.
Further, it is unclear if original actions predicated on civil liabilities based solely upon U.S. federal securities laws are enforceable in courts outside the United States, including in the Cayman Islands. Courts of the Cayman Islands may not, in an original action in the Cayman Islands, recognize or enforce judgments of U.S. courts predicated upon the civil liability provisions of the securities laws of the United States or any state of the United States on the grounds that such provisions are penal in nature. Although there is no statutory enforcement in the Cayman Islands of judgments obtained in the United States, courts of the Cayman Islands will recognize and enforce a foreign judgment of a court of competent jurisdiction if such judgment is final, for a liquidated sum, provided it is not in respect of taxes or a fine or penalty, is not inconsistent with a Cayman Islands judgment in respect of the same matters, and was not obtained in a manner which is contrary to the public policy of the Cayman Islands. In addition, a Cayman Islands court may stay proceedings if concurrent proceedings are being brought elsewhere.
If we are a “passive foreign investment company” (a “PFIC”) in the year of the offering or in any future year, a U.S. Holder (as defined in “Taxation—U.S. Federal Income Tax Considerations”) may be subject to adverse U.S. federal income tax consequences.
Under the Internal Revenue Code of 1986, as amended (the “Code”), a non-U.S. corporation will be a PFIC for any taxable year in which either (i) 75% or more of our gross income consists of “passive income” or (ii) 50% or more of the average quarterly value of our assets consist of assets that produce, or are held for the product of, “passive income.” For this purpose, subject to certain exceptions, passive income includes, among other things, interest, dividends, rents and gains from transactions in commodities. A non-U.S. corporation will be treated as
owning its proportionate share of assets and earning its proportionate share of the income of any other corporation in which it owns, directly or indirectly, more than 25% (by value) of the stock.
We do not believe we were a PFIC for our 2023 taxable year, and based on our current operations, income, assets and certain estimates and projections, including as to the relative values of our assets, we do not expect to be a PFIC for our current taxable year or to become one in the foreseeable future. However, because our PFIC status depends on the composition of our income and assets and the market value of our assets from time to time, there can be no assurance that we will not be a PFIC for any taxable year. Moreover, because we will hold a substantial amount of cash following this offering, we may be or become a PFIC if we do not deploy significant amounts of cash for active purposes. If we were a PFIC for any year during which a U.S. Holder holds our common shares, we generally would continue to be treated as a PFIC with respect to that U.S. Holder for all succeeding years during which the U.S. Holder holds the common shares, even if we ceased to meet the threshold requirements for PFIC status.
Certain adverse U.S. federal income tax consequences could apply to U.S. Holders if we are treated as a PFIC for any taxable year during which such U.S. Holders hold our ordinary shares, subject to certain elections. For further discussion, see “Taxation—U.S. Federal Income Tax Considerations.”
Special Note Regarding Forward-Looking Statements
This prospectus contains forward-looking statements within the meaning of the federal securities laws, which statements involve substantial risks and uncertainties. Forward-looking statements generally relate to future events or our future financial or operating performance. In some cases, you can identify forward-looking statements because they contain words such as “may,” “will,” “should,” “expect,” “plan,” “anticipate,” “could,” “intend,” “target,” “project,” “contemplate,” “believe,” “estimate,” “predict,” “potential,” or “continue,” or the negative of these words or other similar terms or expressions that concern our expectations, strategy, plans or intentions. Forward-looking statements contained in this prospectus include statements about:
| · | general economic, political, demographic and business conditions in the markets in which we operate (including any impact resulting from the ongoing wars between Russia and Ukraine and between Israel and Hamas); |
| · | our ability to implement our expansion strategy across international markets through organic growth or acquisitions; |
| · | competitive developments in the segments in which we operate, including our ability to compete and conduct our businesses in the future; |
| · | factors affecting our selling prices, including, for example, inflation (and governmental measures to fight inflation), interest rates, levels of employment, population growth, consumer confidence and liquidity in the credit, financial and capital markets; |
| · | the effects of global financial and economic crises in the markets in which we operate; |
| · | our ability to successfully compete in all segments and geographical markets where we currently conduct business or may conduct businesses in the future; |
| · | our ability to implement our capital expenditure plan, including our ability to arrange financing when required and on reasonable terms; |
| · | government intervention resulting in changes to the economy, taxes and tariffs, regulatory environment or regulation in markets in which we operate, including the effects of tax reform in the countries in which we operate and its impact on the distribution of dividends; |
| · | adverse weather conditions, including those related to climate change events causing physical and transition risks in the markets in which we operate; |
| · | changes in customer demand; |
| · | technological advances in the lubricants sector, including developments of lubricants for use in other applications, and advances in the development of alternatives to oil-based lubricants; |
| · | changes in global energy supply or usage, including as a result of climactic conditions leading to shortfalls in the supply of electricity; |
| · | appreciation and depreciation of the real against the U.S. dollar, the pound sterling and the euro, which has experienced significant volatility in recent years; |
| · | any modification, suspension, cancellation or non-renewal of the tax benefits which we have been granted, changes to current interpretations of tax laws as these apply to us or any restrictions on the offsetting of tax credits; |
| · | other factors that may affect our financial condition, liquidity and results of operations; and |
| · | other risk factors discussed under “Risk Factors.” |
We caution you that the foregoing list may not contain all of the forward-looking statements made in this prospectus.
You should not rely upon forward-looking statements as predictions of future events. We have based the forward-looking statements contained in this prospectus primarily on our current expectations and projections about future events and trends that we believe may affect our business, financial condition, results of operations and prospects. The outcome of the events described in these forward-looking statements is subject to risks, uncertainties and other factors, including those described in the section titled “Risk Factors” and elsewhere in this prospectus. Moreover, we operate in a very competitive and rapidly changing environment. New risks and uncertainties emerge from time to time and it is not possible for us to predict all risks and uncertainties that could have an impact on the forward-looking statements contained in this prospectus. We cannot assure you that the results, events and circumstances reflected in the forward-looking statements will be achieved or occur, and actual results, events or circumstances could differ materially from those described in the forward-looking statements.
Neither we nor any other person assumes responsibility for the accuracy and completeness of any of these forward-looking statements. Moreover, the forward-looking statements made in this prospectus relate only to events as of the date on which the statements are made. We undertake no obligation to update any forward-looking statements made in this prospectus to reflect events or circumstances after the date of this prospectus or to reflect new information or the occurrence of unanticipated events, except as required by law. We may not actually achieve the plans, intentions, or expectations disclosed in our forward-looking statements and you should not place undue reliance on our forward-looking statements. Our forward-looking statements do not reflect the potential impact of any future acquisitions, mergers, dispositions, joint ventures or investments we may make.
In addition, statements that “we believe” and similar statements reflect our beliefs and opinions on the relevant subject. These statements are based upon information available to us as of the date of this prospectus, and while we believe such information forms a reasonable basis for such statements, such information may be limited or incomplete, and our statements should not be read to indicate that we have conducted an exhaustive inquiry into, or review of, all potentially available relevant information. These statements are inherently uncertain and investors are cautioned not to unduly rely upon these statements.
Use of Proceeds
We estimate that the net proceeds to us from the sale of common shares in this offering will be approximately US$ , based upon the assumed initial public offering price of US$ per share, which is the midpoint of the estimated offering price range set forth on the cover page of this prospectus, and after deducting estimated underwriting discounts and commissions and estimated offering expenses payable by us. If the underwriters’ option to purchase additional common shares from us is exercised in full, we estimate that the net proceeds to us would be approximately US$ , after deducting underwriting discounts and commissions and estimated offering expenses payable by us. We will not receive any proceeds from the sale of common shares by the selling shareholders.
Each US$1.00 increase or decrease in the assumed initial public offering price of US$ per share, which is the midpoint of the estimated offering price range set forth on the cover page of this prospectus, would increase or decrease the net proceeds that we receive from this offering by approximately R$ , assuming that the number of shares offered by us, as set forth on the cover page of this prospectus, remains the same and after deducting the estimated underwriting discounts and commissions payable by us. Similarly, each increase or decrease of 1.0 million in the number of common shares offered by us would increase or decrease the net proceeds that we receive from this offering by approximately R$ , assuming the assumed initial public offering price remains the same and after deducting the estimated underwriting discounts and commissions payable by us.
We intend to use the net proceeds from this offering for general corporate purposes, including working capital. Additionally, we may use a portion of the net proceeds to acquire or invest in businesses, products, services or technologies. However, we do not have agreements or commitments for any material acquisitions or investments at this time.
Although we currently anticipate that we will use the net proceeds from this offering as described above, there may be circumstances where a reallocation of funds is necessary. The amounts and timing of our actual expenditures will depend upon numerous factors, including the factors described under “Risk Factors” in this prospectus. Accordingly, our management will have flexibility in applying the net proceeds from this offering. An investor will not have the opportunity to evaluate the economic, financial or other information on which we base our decisions on how to use the proceeds.
Pending our use of the net proceeds from this offering, we intend to invest the net proceeds in a variety of capital preservation investments, including but not limited to short-term, investment-grade, interest-bearing instruments and U.S. government securities. No assurance can be given that we will invest the net proceeds from this offering in a manner that produces income or that does not result in a loss in value.
We will not receive any proceeds from the sale of common shares by the selling shareholders.
Dividends and Dividend Policy
On June 12, 2024, we declared a dividend of R$900 million, which we subsequently paid to our shareholders on June 21, 2024. In addition, we distributed dividends of R$246.1 million in the year ended December 31, 2023, and R$248.9 million in the year ended December 31, 2022. We have not adopted a dividend policy with respect to future distributions of dividends. We intend to continue to distribute part of our future earnings to shareholders at the discretion of our board of directors, subject to applicable laws, and such determinations will depend on a number of factors, including our financial condition, results of operations, capital requirements, contractual restrictions, general business conditions and other factors that our board of directors may deem relevant.
Certain Cayman Islands Legal Requirements Related to Dividends
Under the Companies Act and our Memorandum and Articles of Association, a Cayman Islands company may pay a dividend out of either its profit or share premium account, but a dividend may not be paid if this would result in the company being unable to pay its debts as they fall due in the ordinary course of business. According to our Memorandum and Articles of Association, dividends can be declared and paid out of funds lawfully available to us, which include the share premium account. Dividends, if any, would be paid in proportion to the number of common shares a shareholder holds. For further information, see “Taxation—Cayman Islands Tax Considerations.”
Additionally, please refer to “Risk Factors—Risks Relating to Our Business and Industry—Our holding company structure makes us dependent on the operations of our subsidiaries.” Our ability to pay dividends is directly related to positive and distributable net results from our subsidiaries. We depend on dividend distributions by our subsidiaries, and we may be adversely affected if the performance of our subsidiaries is not positive. If, for any legal reasons due to new laws or bilateral agreements between countries, they are unable to pay dividends to Cayman Islands companies, or if a Cayman Islands company becomes incapable of receiving them, we may not be able to make any dividend payments in the future.
Certain Brazilian Legal Requirements Related to Dividends
Our ability to pay dividends is directly related to positive and distributable net results from our Brazilian subsidiary. See “Risk Factors—Risks Relating to Our Business and Industry—Our holding company structure makes us dependent on the operations of our subsidiaries.” Our Brazilian subsidiaries that are incorporated as a Brazilian corporation (sociedade anônima) are required under Federal Law No. 6,404 dated December 15, 1976, as amended, to distribute a mandatory minimum dividend to shareholders each year, which cannot be lower than a given percentage established in the relevant corporation’s bylaws of its profit for the prior year, which percentage will be considered as 25% in case nothing is said in the bylaws, after 5% of the profits are directed to a legal reserve, unless such distribution is suspended by a decision of such subsidiary’s shareholders at its annual shareholders’ meeting based on a report by its board of directors that such distribution would be incompatible with its financial condition at that time. Our Brazilian subsidiaries that are organized as a Brazilian limited liability company (sociedade limitada) may also have specific mandatory dividend payment rules pursuant to their bylaws. In addition, if for any legal reasons due to new laws or bilateral agreements between countries, our Brazilian subsidiaries are unable to pay dividends to Cayman Islands companies, or if a Cayman Islands company becomes incapable of receiving them, we may not be able to make any dividend payments in the future.
Capitalization
The following table sets forth our total capitalization (defined as the sum of our current and non-current loans and borrowings, current derivative financial instruments and total equity), as of June 30, 2024 as follows:
| · | on an as adjusted basis, giving effect to the sale and issuance by us of common shares in this offering, based upon the assumed initial public offering price of R$ per share, which is the midpoint of the estimated offering price range set forth on the cover page of this prospectus, and after deducting underwriting discounts and commissions and estimated offering expenses payable by us. |
The as adjusted information set forth in the table below is illustrative only and will be adjusted based on the actual initial public offering price and other terms of this offering determined at pricing. You should read this table together with our consolidated financial statements and related notes appearing elsewhere in this prospectus, and the sections titled “Presentation of Financial and Other Information,” “Summary Consolidated Financial and Other Data” and “Management’s Discussion and Analysis of Financial Condition and Results of Operations” that are included elsewhere in this prospectus.
| | | As of June 30, 2024 |
| | | Actual | | As adjusted(1) |
| | | US$(2) | | R$ | | US$(2) | | R$ |
| | | (in millions) |
| Loans and borrowings (current and non-current) | | | 586.6 | | | | 3,261.0 | | | | | | | | | |
| Derivative financial instruments (current) | | | 6.0 | | | | 33.3 | | | | | | | | | |
| Total equity | | | 310.2 | | | | 1,724.1 | | | | | | | | | |
| Total capitalization(3) | | | 902.8 | | | | 5,018.4 | | | | | | | | | |
| (1) | Each US$1.00 increase (decrease) in the offering price per common share would increase (decrease) our total capitalization and equity by R$ million. |
| (2) | For convenience purposes only, amounts in reais as of June 30, 2024 have been translated to U.S. dollars using an exchange rate of R$5.5589 to US$1.00, the commercial selling rate for U.S. dollars as of June 30, 2024 as reported by the Central Bank. These convenience translations should not be considered representations that any such amounts have been, could have been or could be converted at that or any other exchange rate. |
| (3) | Total capitalization consists of the sum of our current and non-current loans and borrowings, current derivative financial instruments and total equity. |
Other than as set forth above, there have been no material changes to our capitalization since June 30, 2024.
Dilution
If you invest in our common shares in this offering, your ownership interest will be diluted to the extent of the difference between the initial public offering price per share of our common shares (when converted into reais) and the pro forma as adjusted net tangible book value per share of our common shares immediately after this offering. Net tangible book value dilution per share to new investors represents the difference between the amount per share paid by purchasers of common shares in this offering and the pro forma as adjusted net tangible book value per share of our common shares immediately after completion of this offering.
Net tangible book value (deficit) per share is determined by dividing our total tangible assets less our total liabilities by the number of our shares outstanding. Our historical net tangible book value (deficit) as of June 30, 2024 was R$ million, or R$ per share.
After giving effect to the sale by us of common shares in this offering at the assumed initial public offering price of US$ per share, which is the midpoint of the estimated offering price range set forth on the cover page of this prospectus, and after deducting underwriting discounts and commissions and estimated offering expenses payable by us, our pro forma as adjusted net tangible book value as of June 30, 2024 would have been US$ , or US$ per share. This represents an immediate increase in pro forma net tangible book value of US$ per share to our existing shareholders and an immediate dilution in pro forma net tangible book value of US$ per share to investors purchasing common shares in this offering at the assumed initial public offering price.
The following table illustrates this dilution to new investors purchasing common shares in this offering:
| Assumed initial public offering price per share | US$ |
| Increase in pro forma net tangible book value per share attributable to new investors purchasing common shares in this offering | US$ |
| Pro forma as adjusted net tangible book value per share immediately after this offering | US$ |
| Dilution in pro forma net tangible book value per share to new investors in this offering | US$ |
Each US$1.00 increase or decrease in the assumed initial public offering price of US$ per share, which is the midpoint of the estimated offering price range set forth on the cover page of this prospectus, would increase or decrease, as applicable, our pro forma as adjusted net tangible book value per share to new investors by US$ , and would increase or decrease, as applicable, dilution per share to new investors purchasing common shares in this offering by US$ , assuming that the number of shares offered by us, as set forth on the cover page of this prospectus, remains the same and after deducting underwriting discounts and commissions and estimated offering expenses payable by us. Similarly, each increase or decrease of 1.0 million shares in the number of common shares offered by us would increase or decrease, as applicable, our pro forma as adjusted net tangible book value by approximately US$ per share and increase or decrease, as applicable, the dilution to new investors purchasing common shares in this offering by US$ per share, assuming the assumed initial public offering price remains the same, and after deducting underwriting discounts and commissions and estimated offering expenses payable by us.
If the underwriters’ option to purchase additional common shares from us is exercised in full, the pro forma as adjusted net tangible book value per share of our common shares, as adjusted to give effect to this offering, would be US$ per share, and the dilution in pro forma net tangible book value per share to new investors purchasing common shares in this offering would be US$ per share.
Each US$1.00 increase or decrease in the assumed initial public offering price of R$ per share, which is the midpoint of the estimated offering price range set forth on the cover page of this prospectus, would increase or decrease, as applicable, the total consideration paid by new investors and total consideration paid by all shareholders by R$ million, assuming that the number of common shares offered by us, as set forth on the cover page of this prospectus, remains the same and after deducting underwriting discounts and commissions and estimated offering expenses payable by us. Similarly, each increase or decrease of 1.0 million in the number of common shares offered by us would increase or decrease the total consideration paid by new investors and total consideration paid by all shareholders by R$ , assuming the assumed initial public offering price remains the same and after deducting the estimated underwriting discounts and commissions payable by us.
The following table summarizes, on the same pro forma as adjusted basis as of June 30, 2024, the number of common shares acquired from us, the total cash consideration paid and the average price per common share paid to us by our existing shareholders and by new investors purchasing common shares from us in this offering. As the table shows, new investors purchasing shares in this offering will pay an average price per common share substantially higher than our existing shareholders paid. This information is based on the initial public offering price of US$ per common share, before deducting the underwriting discounts and commissions and estimated offering expenses payable by us in connection with this offering.
| | Common Shares Purchased | Total Consideration | Average Price per Common Share (US$) |
| | Amount | Percentage of Total Common Shares | Amount | Percentage |
| Existing shareholders | | % | | % | |
| New investors | | | | | |
| Total | | 100.0% | | 100.0% | |
Except as otherwise indicated, the above discussion and tables assume no exercise of the underwriters’ option to purchase additional common shares from us. If the underwriters’ option to purchase additional common shares were exercised in full, our existing shareholders would own % and our new investors would own % of the total number of common shares outstanding upon completion of this offering.
To the extent that any outstanding options to purchase our common shares are exercised, restricted share units are settled or new awards are granted under our equity compensation plan, there will be further dilution to investors participating in this offering.
Management’s Discussion and Analysis of Financial Condition and Results of Operations
The following discussion of our financial condition and results of operations should be read in conjunction with our audited consolidated financial statements as of June 30, 2024 and December 31, 2023 and 2022 and for the six months ended June 30, 2024 and 2023 and the years ended December 31, 2023, 2022 and 2021 and the notes thereto, included elsewhere in this prospectus, as well as the information presented under “Presentation of Financial and Other Information” and “Summary Financial Information and Other Data.”
The following discussion contains forward-looking statements that involve risks and uncertainties. Our actual results and the timing of events may differ materially from those expressed or implied in such forward-looking statements as a result of various factors, including those set forth in “Special Note Regarding Forward-Looking Statements” and “Risk Factors.”
Overview
Moove is a global lubricants solutions provider. We specialize in the formulation, manufacturing, distribution, marketing, selling and servicing of lubricant products across a diverse range of end markets and customers. We offer a comprehensive portfolio of products and technical support that is highly tailored to our end markets, while optimizing our cost base, physical footprint and working capital needs to drive unit profitability and cash flow generation.
Lubricants are everywhere. We operate in a complex and dynamic market that is critical to the customers we serve, across industrial, commercial and consumer segments. Our customers’ needs are constantly evolving as technology continues to influence the requirements for, and applications of, lubricants. While our products generally represent a small component of our customers’ total running costs, they are crucial to driving efficiencies and maintaining operations, establishing a clear need in the market for our capabilities.
We operate a model requiring low levels of capital expenditures (our total capital expenditures as a percentage of revenue amounted to 1.8%, 1.7%, 1.9%, 1.2% and 0.7% for the six months ended June 30, 2024 and 2023 and for the years ended December 31, 2023, 2022 and 2021, respectively),focused on cost-effective formulation, manufacturing, logistics and services. In contrast, the production of raw materials such as base oils, which is not in our scope, requires intensive capital investments and other capabilities, resulting in a different scale and margin profile within our industry. We believe that our model underpins our ROIC and allows us to optimize our cost base and capital expenditures to support our profitability, Adjusted EBITDA Margin and cash flow generation as we scale and penetrate a market.
Our track record of financial performance is reflected in our metrics. Our revenue for the six months ended June 30, 2024 was R$5,024.8 million (US$903.9 million), a decrease of 1.6% compared to the six months ended June 30, 2023, while our profit for the period was R$237.6 million (US$42.7 million), compared to a loss of R$58.4 million (US$10.5 million) in the six months ended June 30, 2023. Our Adjusted EBITDA for the six months ended June 30, 2024 was R$690.2 million (US$124.2 million), a 9.0% increase from R$633.4 million for the six months ended June 30, 2023. Our revenue for the year ended December 31, 2023 was R$10,074.2 million (US$1,812.3 million), while our profit for the year was R$266.0 million (US$47.9 million), an increase of 66.9% and a decrease of 8.3%, respectively, compared to the year ended December 31, 2021. Adjusted EBITDA for the year ended December 31, 2023 was R$1,243.1 million (US$223.6 million), an increase of 107.5% compared to the year ended December 31, 2021. Our profit (loss) margin was 4.7% in the six months ended June 30, 2024 and negative 1.1% in the six months ended June 30, 2023, and our Adjusted EBITDA Margin was 13.7% in the six months ended June 30, 2024 and 12.4% in the six months ended June 30, 2023. From 2021 to 2023, our profit margin decreased from 4.8% for the year ended December 31, 2021 to 2.6% for the year ended December 31, 2023, our Adjusted EBITDA Margin increased to 12.3% for the year ended December 31, 2023 from 9.9% in the year ended December 31, 2021, and our Unit Adjusted EBITDA increased to R$1.87 (US$0.34) per liter for the year ended December 31, 2023 from R$1.54 per liter for the year ended December 31, 2021. These increases were a result of organic growth of 22.5% in our revenue and 74.6% in our Adjusted EBITDA compared to the year ended December 31, 2021, which added to the acquisitions made in the period. The growth of our business from 2021 to 2023 was driven substantially by the acquisitions of PetroChoice in the United States and Tirreno in Brazil, which we completed in May 2022, as further discussed under “—Significant Factors Affecting Our Results of Operations—Acquisitions.” See “Summary Consolidated Financial and Other Data—Non-GAAP Financial Measures” for a reconciliation of Adjusted EBITDA, Unit Adjusted EBITA and Adjusted EBITDA Margin to the most directly comparable GAAP financial measure.
Our revenue for the six months ended June 30, 2024 was generated in the following regions: 47.3% in South America, 29.2% in Europe and 23.5% in North America. For the six months ended June 30, 2024, our Adjusted EBITDA was generated in the following regions: 70.8% in South America, 8.0% in Europe and 21.2% in North America. Our revenue for the year ended December 31, 2023 was generated in the following regions: 45.4% in South America, 30.2% in Europe and 24.4% in North America. For the year ended December 31, 2023, our Adjusted EBITDA was generated in the following regions: 66.4% in South America, 22.0% in North America and 11.6% in Europe.
Key Business Metrics
We review our volume of lubricants sold to evaluate our business, measure our performance, identify trends affecting our business, formulate business plans, and make strategic decisions. In addition, our volume of lubricants sold and a discussion of the changes in such volume for the six months ended June 30, 2024 and 2023 and the years ended December 31, 2023, 2022 and 2021 are presented to assist investors to better understand our business and how it operates.
The following table presents our volume of lubricants sold for the periods indicated on a consolidated basis and by segment:
| | | For the Six Months
Ended June 30, (1) | | For the Year Ended December 31, (1) |
| | | 2024 | | 2023 | | 2023 | | 2022 | | 2021 |
| | | (in millions of liters) |
| South America | | | 179.3 | | | | 172.8 | | | | 360.6 | | | | 301.6 | | | | 298.9 | |
| North America | | | 114.8 | | | | 117.6 | | | | 230.9 | | | | 150.0 | | | | 13.4 | |
| Europe | | | 30.2 | | | | 36.7 | | | | 74.0 | | | | 73.1 | | | | 76.4 | |
| Total volume of lubricants sold | | | 324.4 | | | | 327.1 | | | | 665.5 | | | | 524.7 | | | | 388.7 | |
| (1) | We include the following in calculating the volume of lubricants sold: lubricants, base oils, additives, greases, fluids and ancillaries. These volumes are on a consolidated basis excluding intercompany amounts. |
Our volume of lubricants sold decreased by 2.8 million liters, or 0.8%, to 324.4 million liters for the six months ended June 30, 2024 from 327.1 million liters for the six months ended June 30, 2023, primarily as a result of a decrease of 9.3 million liters in the volume of lubricants sold in the Europe and North America regions, partially offset by an increase of 6.5 million liters in the volume of lubricants sold in South America. Our volume of lubricants sold increased by 140.8 million liters, or 26.8%, to 665.5 million liters for the year ended December 31, 2023 from 524.7 million liters for the year ended December 31, 2022, primarily as a result of (i) the addition of 80.9 million liters as a result of the acquisition of PetroChoice in May 2022, which was consolidated for the full year ended December 31, 2023 but only for seven months for the year ended December 31, 2022, and (ii) organic growth, virtually all in South America where the volume of lubricants sold increased by 59.0 million liters, or 19.6%, to 360.6 million liters for the year ended December 31, 2023 from 301.6 million liters for the year ended December 31, 2022. The organic growth in South America was driven by the successful application of the Moove Performance System, including but not limited to an assertive sales and marketing execution, both directly with the addition of relevant business-to-business clients and in the indirect channel where we reached 102 thousand points of sales as of December 31, 2023 (from 92 thousand as of December 31, 2022) through our exclusive distribution network.
Our volume of lubricants sold increased by 136.0 million liters, or 35.0%, to 524.7 million liters for the year ended December 31, 2022 from 388.7 million liters for the year ended December 31, 2021, primarily as a result of the addition of 136.6 million liters resulting from the acquisition of PetroChoice in May 2022. Volumes in South America and Europe remained substantially the same.
Significant Factors Affecting Our Results of Operations
Our financial condition and results of operations are affected by a number of factors, including factors which are outside of our control.
Our Growth
The most important drivers of our results of operations are the organic growth in South America, where we have doubled our market share since 2008, and the acquisition of PetroChoice in North America. In our South America segment, revenue was R$2,378.9 million for the six months ended June 30, 2024, an increase of R$92.3 million, or 4.0%, compared to R$2,286.6 million for the six months ended June 30, 2023. This was primarily attributable to an increase in the volume of lubricants sold. In our South America segment, revenue was R$4,571.8 million for the year ended December 31, 2023, an increase of R$555.7 million, or 13.8%, compared to R$4,016.1 million for the year ended December 31, 2022. This was primarily attributable to organic growth in terms of volume of lubricants sold and our revenue management strategy. For the year ended December 31, 2022, revenue in our South America segment was R$4,016.1 million, an increase of R$644.0 million, or 19.1%, compared to R$3,372.1 million for the year ended December 31, 2021. This was primarily due to a combination of our supply intelligence and revenue management strategy, which focus on expanding our Unit Adjusted EBITDA per liter consistently, in a way that enables us to pass on higher costs through pricing when our cost per liter increases, and experience lower declines in prices per liter when our cost per liter decreases.
Ability to Grow Our Customer Base
We have a large and diverse customer base, which encompasses all kinds of businesses such as consumer automotive, commercial fleets and industrial clients, with our ten largest customers representing only 13.4% and 13.2% of our revenue for the six months ended June 30, 2024 and the year ended December 31, 2023, respectively. Appropriate service level is essential for us to remain competitive in the lubricants market, while preserving our ability to achieve and maintain profitability in the future. Our ability to attract new customers also depends on the scale and efficiency of our sales network and marketing channels. We seek to grow volumes across all geographies through a combination of attracting new customers and increasing the volumes sold to current customers by offering different products to them, in a cost-efficient manner and engaging in various marketing activities. We believe that enhanced customer satisfaction will help to drive word-of-mouth referrals, which we expect may reduce our customer acquisition costs. Our ability to grow our customer base and to maintain existing customer relationships is also contingent on our ability to offer engineering and post-sales services to corporate customers, particularly in the industrial products segment.
Cost Structure
We incur variable product costs, fixed manufacturing expenses, depreciation expense and freight expenses. Variable product costs include all raw materials, energy and packaging costs that are directly related to the manufacturing process. Fixed manufacturing expenses include all plant employment costs, manufacturing overhead and periodic maintenance costs.
The key raw materials used by our business are base oils, additives and packaging materials (such as high density polyethylene bottles and steel drums). We continuously monitor global supply and cost trends of these key raw materials. We obtain these raw materials from a diversified network of large global suppliers and regional providers. Our sourcing strategy is to ensure supply through contracting a diversified supply base while leveraging market conditions to take advantage of spot opportunities whenever such conditions are available. We leverage our worldwide spend to obtain favorable contract terms from the global suppliers and use the regional providers to ensure market competitiveness and reliability in our supply chain. We closely monitor our supply chain and conduct annual supply risk assessments of our critical suppliers to reduce risk.
We seek to actively manage fluctuations in supply costs, product selling prices and the timing thereof to preserve unit margins. The prices of many of our products fluctuate based on the price of base oils and additives, which is a large percentage of our cost of sales. Historically, base oil prices and additives have been volatile, which sometimes causes sharp cost increases during periods of short supply. The effects of COVID-19 and the war between Russia and Ukraine has caused an imbalance in supply and demand for a range of products and services, including base oils and additives, in addition to increased uncertainty regarding the global macroeconomic environment and energy prices. As part of our strategy to mitigate the impact of base oil and additives volatility, we have used our revenue management strategy, as detailed under “—Our Growth” above, raw material physical hedges and financial hedge instruments, and we have continuously sought to diversify our portfolio of suppliers. In addition, as a result of the fact that lubricants are a mission-critical product for customers but do not account for a significant
portion of customers’ costs, we have generally been successful in adjusting product selling prices to account for changes in base oil and additives costs in order to preserve unit margins (while relying on supply intelligence and revenue management to drive margin improvements).
Moreover, our results of operations are affected by our energy consumption, manufacturing costs and efficiency improvements. Our management seeks to continue to improve long-term profitability and operating efficiencies to maintain our competitive position. These efforts include identifying operations whose costs are disproportionate to related revenues, especially operations with significant fixed costs that could negatively impact our margins. We have implemented and intend to continue to implement production and energy efficiency initiatives. In particular, we have implemented a series of initiatives that focus on increasing energy and production efficiency in our operation and we have applied the lean methodology detailed under “Business—Our Unique Approach—Our Proprietary Business Model” since 2017.
Acquisitions
Our vision is to be a global reference in the lubricants sector. We have grown organically in the regions in which we operate and acquisitions are a key component of our business strategy to assist us in expanding our business into new markets or territories, enhancing critical mass, strengthening our operational facilities network, bolstering our competitive edge or acquiring and accessing new technologies and skill sets.
In May 2022, we completed two acquisitions—one in the United States and one in Brazil. Our wholly owned subsidiary Millennium Moove Corp. acquired 100% of PetroChoice for R$2,342.8 million. PetroChoice specializes in the blending, distribution and sale of lubricants and related product solutions serving a wide range of customers in the industrial, commercial and passenger vehicle segments. PetroChoice is one of the largest lubricant distributors in the United States, operating 50 strategically located distribution centers across 25 U.S. states. PetroChoice has strategic partnerships with major brands and also has a comprehensive offering of its own branded products. Moreover, in May 2022, Moove Brazil acquired 100% of the shares of Tirreno for R$85.2 million. Tirreno is a Brazilian chemical company that has been active since 1967 in the industrial oils market, producing and selling specialty oils, among others, and supplying the automotive, steel and metal-mechanic industries in general. Tirreno has also been active in the automotive fluids market since 1990, focusing on the supply of brake fluids, hydraulic clutch fluids and additives for radiators.
As a result of the aforementioned acquisitions, our results of operations for the year ended December 31, 2023 are not directly comparable to our results of operations for the years ended December 31, 2022 and 2021, which may make it difficult for you to evaluate our organic business, financial condition, results of operations and prospects.
Macroeconomic and Geopolitical Environment
Our results of operations are impacted, to a large extent, by the macroeconomic and geopolitical environment. Supply and demand dynamics globally, as well as the occurrence of geopolitical events affecting global supply and demand dynamics, as in any other business, can affect our results. See also “Risk Factors—Risks Relating to the Countries in Which We Operate.”
Global Demand for Lubricants
The level of demand for our products is influenced by many factors, including exchange rate fluctuations, inflation, interest rates and the occurrence of significant geopolitical events. Demand for premium lubricants, encompassing greases, fluids, specialty products and basic oils spanning the production and distribution chains, varies across the consumer, commercial and industrial segments. Specialized lubrication solutions and applications are increasingly sought after by various customers to enhance efficiency, performance and sustainability of equipment across sectors and automotive vehicles. The level of demand for premium, synthetic lubricants is driven by the increasing demands on, and complexity of, industrial and automotive (passenger and commercial) equipment given that conventional, mineral-based lubricants have a more limited capacity to service more sophisticated applications. For further information, see “Industry Overview—Global Lubricants Market Outlook.”
Currency Fluctuations
Our presentation currency is the Brazilian real. However, as a result of our international operations, we are subject to risks associated with the fluctuations between different foreign currencies. This affects our consolidated financial statements and results of operations in various ways. As part of our consolidation each period, we translate the financial statements of those entities in our group that have functional currencies other than the Brazilian real into reais at the period-end exchange rates (in the case of the balance sheet amounts) and the exchange rates prevailing at the average exchange rate during the applicable period (in the case of income statement and cash flow amounts). The translated values in respect of each entity fluctuate over time with the movement of the exchange rate for the entity’s functional currency against the Brazilian real. We refer to this as the currency translation risk.
Moreover, a significant proportion of our debt is denominated in U.S. dollars. A depreciation of the real against these currencies would increase our debt burden and our related financial expenses. However, we have receivables and other financial assets denominated in U.S. dollars, which would partially offset the impact that a depreciation of the real would have on our financial position. An appreciation of the real against the U.S. dollar would have the opposite effect.
See also “—Quantitative and Qualitative Disclosure About Market Risk.”
Inflation
We believe that recent inflationary pressures as a result of disruptions in global supply chains, an increase in energy and utility prices globally, the effect of such increased prices on energy-intensive products, increases in transportation costs and the ongoing wars between Russia and Ukraine and Israel and Hamas may lead to a significant increase in the rate of inflation globally.
Argentina is currently classified as a hyperinflationary economy. In the year ended December 31, 2023, accumulated inflation in Argentina, as measured by the Federación Argentina de Consejos Profesionales de Ciencias Económicas (the Argentine Federation of Professional Councils of Economic Sciences), stood at 211% (95% in the year ended December 31, 2022). We recognized R$6.0 million and R$0.4 million in our statement of profit or loss as monetary variation due to Argentine inflation for the years ended December 31, 2023 and 2022, respectively, while the impact of inflation on other comprehensive income was not considered material.
Accumulated inflation rates in Brazil were 10.1% in the year ended December 31, 2021, 5.8% in the year ended December 31, 2022 and 4.6% in the year ended December 31, 2023, as measured by the National Consumer Price Index (Índice Nacional de Preços ao Consumidor Amplo), published by the Brazilian Institute of Geography and Statistics (Instituto Brasileiro de Geografia e Estatística). This decrease indicates a positive outlook regarding the potential impact of global inflationary pressures on the demand for our products. Inflation can negatively affect consumer confidence and the purchasing power of our customers in other regions. However, we do not anticipate any issues in passing on price increases, either partially or in full, to our customers, which would otherwise adversely impact our profit margins. See “Risk Factors—Risks Relating to the Countries in Which We Operate—Inflation and government measures to curb inflation may adversely affect the economies and capital markets in some of the countries in which we operate, and as a result, harm our business, financial condition and results of operations, as well as the trading price of our common shares.”
Interest Rates
Inflationary pressures can lead governments to intervene in the economy, including through the implementation of government policies that may have an adverse effect on us and our customers, such as increasing interest rates. We are exposed to interest rate risk primarily on our loans as we are directly exposed to variations in our floating-rate loans, in particular with respect to SOFR. High interest rates may impact our cost of obtaining loans and also the cost of any future indebtedness, resulting in an increase in our financial expenses. As such, this increase may adversely affect our ability to pay our financial obligations, as it reduces our cash availability.
Seasonality
We have experienced in the past, and expect to continue to experience, seasonal fluctuations in our revenues. Historically, our revenues have been strongest during the first, second and third quarters of each year. Economic conditions have altered, and could continue to alter, seasonal patterns.
Description of Principal Line Items
Revenue
We recognize revenues of two different natures:
| · | Product sales: lubricants, base oils, fluids, ancillaries and fuels. |
| · | Services: intermediate logistics fees (buyback), territorial concession, consultancy, used oil analysis, tank and storage rental, engineering solutions. |
Costs of Sales and Services
Cost of sales consist of raw materials, indirect production costs, depreciation and amortization, and other costs.
Operating expenses
Operating expenses consist of selling expenses and general and administrative expenses. Selling expenses consist of employee expenses, freight and logistics expenses, depreciation and amortization, marketing expenses, third-party services, travel expenses and other selling expenses. General and administrative expenses consist of employee expenses, depreciation and amortization, third-party services, travel expenses, marketing expenses, freight logistics expenses and other general and administrative expenses.
Financial results, net
Financial results, net, consist of financial expense, financial income and exchange variation, net. Financial income consists of income from financial investments, miscellaneous interest income from assets, hyperinflation, other financial income, fair value adjustment of debt and derivative financial instruments. Financial expense consists of interest on loans, derivative financial instruments, other financial expenses, interest on taxes, interest on actuarial liabilities, interest on leasing, fair value adjustment for debt, interest on amounts refundable by Cosan and miscellaneous interest expenses relating to liabilities. Exchange variation, net consists of the net effect of variations in exchange rates on our financial assets and liabilities.
Income taxes
Income taxes consist primarily of current and deferred income taxes. Income taxes are calculated based on tax laws enacted or substantively enacted at the end of the reporting period in the countries in which we operate and generate taxable income.
Segment Reporting
We have identified three segments for purposes of our financial reporting, South America, North America and Europe, which are aligned with our business units and reflect the structure used by our chief operating decision-maker, or CODM—which is currently our chief executive officer—to make decisions about resource and capital allocation and assess performance, as detailed below:
| · | South America: consists mainly of results from the production of lubricants, fluids and ancillaries and the distribution of lubricants sold in Argentina, Bolivia, Brazil, Paraguay and Uruguay; |
| · | North America: consists mainly of results arising from the production of lubricants and distribution of lubricants and fuels sold in the United States of America; and |
| · | Europe: consists mainly of results arising from the production of lubricants and the distribution of lubricants and fuels sold in Europe and Asia. |
The CODM separately monitors operating results by segment to enable decision-making about resource and capital allocation and evaluate performance. The performance of our segments is evaluated based on adjusted earnings before interest, taxes, depreciation and amortization (Adjusted EBITDA). The adjustments to earnings before interest, taxes, depreciation and amortization are related to the effect of initial public offering expenses, stock option plan expenses linked to the liquidity event and financial results other than interest. Other statement of profit and loss, statement of financial position and cash flow statement line items are not provided to or monitored by our CODM by segment on a regular basis, just considered on a consolidated basis, and are therefore not disclosed. For more information, see “—Segment Results of Operations.”
The tables below set forth the Adjusted EBITDA by segment for each of our segments for the periods indicated.
| | | For the Six Months Ended June 30, 2024 |
| | | South America | | North America | | Europe | | Consolidated |
| | | (in millions of R$) |
| Revenue | | | 2,378.9 | | | | 1,180.7 | | | | 1,465.2 | | | | 5,024.8 | |
| Cost of sales and services and operating expenses | | | (2,020.9 | ) | | | (1,163.7 | ) | | | (1,434.4 | ) | | | (4,619.0 | ) |
| Profit before finance results and taxes | | | 358.0 | | | | 17.0 | | | | 30.8 | | | | 405.8 | |
| (+) Depreciation and amortization | | | 25.1 | | | | 125.8 | | | | 23.0 | | | | 173.8 | |
| (+) Expenses with equity compensation plan (1) | | | 97.8 | | | | — | | | | — | | | | 97.8 | |
| (+) Expenses with initial public offering (2) | | | 8.1 | | | | 3.5 | | | | 1.2 | | | | 12.8 | |
| Adjusted EBITDA by Segment(3) | | | 488.9 | | | | 146.2 | | | | 55.0 | | | | 690.2 | |
| (1) | Expenses incurred in connection with our equity-compensation plan linked to the occurrence of our initial public offering. |
| (2) | Non-recurring expenses related to our initial public offering. |
| (3) | We calculate Adjusted EBITDA by segment as profit before finance results and taxes plus depreciation and amortization plus expenses incurred in connection with our equity-compensation plan linked to the occurrence of our initial public offering and non-recurring expenses related to our initial public offering. |
| | | For the Six Months Ended June 30, 2023 |
| | | South America | | North America | | Europe | | Consolidated |
| | | (in millions of R$) |
| Revenue | | | 2,286.6 | | | | 1,273.8 | | | | 1,543.9 | | | | 5,104.3 | |
| Cost of sales and services and operating expenses | | | (1,873.8 | ) | | | (1,273.5 | ) | | | (1,488.9 | ) | | | (4,636.1 | ) |
| Profit before finance results and taxes | | | 412.8 | | | | 0.3 | | | | 55.0 | | | | 468.2 | |
| (+) Depreciation and amortization | | | 21.0 | | | | 126.5 | | | | 17.8 | | | | 165.2 | |
| (+) Expenses with equity compensation plan (1) | | | — | | | | — | | | | — | | | | — | |
| (+) Expenses with initial public offering (2) | | | — | | | | — | | | | — | | | | — | |
| Adjusted EBITDA by Segment(3) | | | 433.8 | | | | 126.8 | | | | 72.8 | | | | 633.4 | |
| (1) | Expenses incurred in connection with our equity-compensation plan linked to the occurrence of our initial public offering. |
| (2) | Non-recurring expenses related to our initial public offering. |
| (3) | We calculate Adjusted EBITDA by segment as profit before finance results and taxes plus depreciation and amortization plus expenses incurred in connection with our equity-compensation plan linked to the occurrence of our initial public offering and non-recurring expenses related to our initial public offering. |
| | | For the Year Ended December 31, 2023 |
| | | South America | | North America | | Europe | | Consolidated |
| | | (in millions of R$) |
| Revenue | | | 4,571.8 | | | | 2,456.7 | | | | 3,045.7 | | | | 10,074.2 | |
| Cost of sales and services and operating expenses | | | (3,790.9 | ) | | | (2,425.2 | ) | | | (2,937.2 | ) | | | (9,153.2 | ) |
| Profit before finance results and taxes | | | 780.9 | | | | 31.5 | | | | 108.6 | | | | 920.9 | |
| (+) Depreciation and amortization | | | 44.8 | | | | 241.3 | | | | 36.1 | | | | 322.2 | |
| (+) Expenses with equity compensation plan (1) | | | — | | | | — | | | | — | | | | — | |
| (+) Expenses with initial public offering (2) | | | — | | | | — | | | | — | | | | — | |
| Adjusted EBITDA by Segment(3) | | | 825.7 | | | | 272.9 | | | | 144.6 | | | | 1,243.1 | |
| (1) | Expenses incurred in connection with our equity-compensation plan linked to the occurrence of our initial public offering. |
| (2) | Non-recurring expenses related to our initial public offering. |
| (3) | We calculate Adjusted EBITDA by segment as profit before finance results and taxes plus depreciation and amortization plus expenses incurred in connection with our equity-compensation plan linked to the occurrence of our initial public offering and non-recurring expenses related to our initial public offering. |
| | | For the Year Ended December 31, 2022 |
| | | South America | | North America | | Europe | | Consolidated |
| | | (in millions of R$) |
| Revenue | | | 4,016.1 | | | | 1,763.6 | | | | 3,106.6 | | | | 8,886.3 | |
| Cost of sales and services and operating expenses | | | (3,507.1 | ) | | | (1,863.5 | ) | | | (3,020.7 | ) | | | (8,391.4 | ) |
| Profit before finance results and taxes | | | 508.9 | | | | (99.9 | ) | | | 85.9 | | | | 495.0 | |
| (+) Depreciation and amortization | | | 41.4 | | | | 163.8 | | | | 37.4 | | | | 242.6 | |
| (+) Expenses with equity compensation plan (1) | | | — | | | | — | | | | — | | | | — | |
| (+) Expenses with initial public offering (2) | | | — | | | | — | | | | — | | | | — | |
| Adjusted EBITDA by Segment(3) | | | 550.3 | | | | 63.9 | | | | 123.3 | | | | 737.6 | |
| (1) | Expenses incurred in connection with our equity-compensation plan linked to the occurrence of our initial public offering. |
| (2) | Non-recurring expenses related to our initial public offering. |
| (3) | We calculate Adjusted EBITDA by segment as profit before finance results and taxes plus depreciation and amortization plus expenses incurred in connection with our equity-compensation plan linked to the occurrence of our initial public offering and non-recurring expenses related to our initial public offering. |
| | | For the Year Ended December 31, 2021 |
| | | South America | | North America | | Europe | | Consolidated |
| | | (in millions of R$) |
| Revenue | | | 3,372.1 | | | | 71.1 | | | | 2,593.5 | | | | 6,036.7 | |
| Cost of sales and services and operating expenses | | | (2,923.7 | ) | | | (83.7 | ) | | | (2,527.5 | ) | | | (5,534.9 | ) |
| Profit before finance results and taxes | | | 448.4 | | | | (12.6 | ) | | | 66.0 | | | | 501.8 | |
| (+) Depreciation and amortization | | | 41.1 | | | | 13.2 | | | | 43.0 | | | | 97.2 | |
| (+) Expenses with equity compensation plan (1) | | | — | | | | — | | | | — | | | | — | |
| (+) Expenses with initial public offering (2) | | | — | | | | — | | | | — | | | | — | |
| Adjusted EBITDA by Segment(3) | | | 489.4 | | | | 0.6 | | | | 109.0 | | | | 599.0 | |
| (1) | Expenses incurred in connection with our equity-compensation plan linked to the occurrence of our initial public offering. |
| (2) | Non-recurring expenses related to our initial public offering. |
| (3) | We calculate Adjusted EBITDA by segment as profit before finance results and taxes plus depreciation and amortization plus expenses incurred in connection with our equity-compensation plan linked to the occurrence of our initial public offering and non-recurring expenses related to our initial public offering. |
See note 4 to our unaudited interim condensed consolidated financial statements and note 2.7 “Segment information” to our audited consolidated financial statements, each included elsewhere in this prospectus, for additional information regarding our operating segments.
Consolidated Results of Operations
Six months ended June 30, 2024 Compared to Six months ended June 30, 2023
The following table sets forth our consolidated statement of profit or loss data for the periods indicated.
| | | For the Six Months Ended June 30, |
| | | 2024 | | 2023 | | Variation |
| | | (in R$ millions) | | (%) |
| Revenue | | | 5,024.8 | | | | 5,104.3 | | | | (1.6 | )% |
| Cost of sales and services | | | (3,587.8 | ) | | | (3,728.6 | ) | | | (3.8 | )% |
| Gross profit | | | 1,437.0 | | | | 1,375.6 | | | | 4.5 | % |
| Selling expenses | | | (656.6 | ) | | | (617.5 | ) | | | 6.3 | % |
| General and administrative expenses | | | (409.2 | ) | | | (267.8 | ) | | | 52.8 | % |
| Other operating income (expenses), net | | | 34.6 | | | | (22.2 | ) | | | n.m. | |
| Profit before finance results and taxes | | | 405.8 | | | | 468.2 | | | | (13.3 | )% |
| Financial results, net | | | (44.2 | ) | | | (138.2 | ) | | | (68.0 | )% |
| Profit before taxes | | | 361.6 | | | | 330.0 | | | | 9.6 | % |
| Income taxes – current | | | (115.6 | ) | | | (240.3 | ) | | | (51.9 | )% |
| Income taxes – deferred | | | (8.4 | ) | | | (148.1 | ) | | | (94.3 | )% |
| Total income taxes | | | (124.0 | ) | | | (388.4 | ) | | | (68.1 | )% |
| Profit (loss) for the period | | | 237.6 | | | | (58.4 | ) | | | n.m. | |
n.m. = not meaningful
Revenue
Revenue for the six months ended June 30, 2024 was R$5,024.8 million, a decrease of R$79.5 million, or 1.6%, from R$5,104.3 million for the six months ended June 30, 2023, which was primarily attributable to a lower volume of lubricants sold during the period.
Cost of sales and services
Cost of sales and services for the six months ended June 30, 2024 was R$3,587.8 million, a decrease of R$140.8 million, or 3.8%, from R$3,728.6 million for the six months ended June 30, 2023, which was primarily attributable to a decrease in the volume of lubricants sold and the results of our supply and raw material strategy execution with well positioned long-term agreements and strategic sourcing in addition to a decrease in base oil prices. As a percentage of revenue, our cost of sales and services decreased 1.6 percentage points, from 73.0% for the six months ended June 30, 2023 to 71.4% for the six months ended June 30, 2024.
Gross profit
As a result of the foregoing, gross profit for the six months ended June 30, 2024 was R$1,437.0 million, an increase of R$61.4 million, or 4.5%, from R$1,375.6 million for the six months ended June 30, 2023.
Selling expenses
Selling expenses for the six months ended June 30, 2024 were R$656.6 million, an increase of R$39.1 million, or 6.3%, from R$617.5 million for the six months ended June 30, 2023, which was primarily attributable to a 14.6% increase in employee expenses driven by increases in salary and annual bonus payments and a 29.2% increase in marketing expenses.
General and administrative expenses
General and administrative expenses for the six months ended June 30, 2024 were R$409.2 million, an increase of R$141.4 million, or 52.8%, from R$267.8 million for the six months ended June 30, 2023, which was primarily attributable to an increase in third-party services costs and a 52.9% increase in employee expenses related to provisions related to our equity compensation plan linked to the occurrence of our initial public offering.
Other operating income (expenses), net
Other operating income, net for the six months ended June 30, 2024 were R$34.6 million, a variation of R$56.8 million from other operating expenses, net of R$22.2 million for the six months ended June 30, 2023. This variation was primarily due to income of R$18.4 million related to a debt negotiation with ExxonMobil in Argentina, litigation gains of R$3.9 million and a R$8.4 million recognition of extemporaneous value-added tax credits (IPI) recognized during the six months ended June 30, 2024, compared to expenses of R$10.7 million of write-off of value added tax credits (ICMS) and expenses with legal proceedings and fines of R$4.5 million which occurred during the six months ended June 30, 2023.
Profit before finance results and taxes
For the reasons described above, our profit before finance results and taxes for the six months ended June 30, 2024 was R$405.8 million, a decrease of R$62.4 million, or 13.3%, from R$468.2 million for the six months ended June 30, 2023.
Financial results, net
Financial results, net for the six months ended June 30, 2024 were an expense of R$44.2 million, a decrease of R$94.0 million, or 68.0%, from an expense of R$138.2 million for the six months ended June 30, 2023, which was primarily attributable to mark to market of derivative financial instruments which amounted to an income of R$19.3 million for the six months ended June 30, 2024 compared to an expense of R$36.7 million for the six months ended June 30, 2023 and other additional increase of financial revenues for the six months ended June 30, 2024 compared to the six months ended June 30, 2023.
Profit before taxes
Our profit before taxes for the six months ended June 30, 2024 was R$361.6 million, an increase of R$31.6 million, or 9.6%, from R$330.0 million for the six months ended June 30, 2023.
Income taxes
Our current income taxes expense for the six months ended June 30, 2024 was R$115.6 million, a decrease of R$124.7 million, from R$240.3 million for the six months ended June 30, 2023, which was primarily attributable to the adverse effects of a decision by the Brazilian Superior Court of Justice (Superior Tribunal de Justiça), or STJ, in April 2023, which halted the practice (i.e., tax benefit) of excluding value-added taxes (ICMS) from the calculation bases for income taxes and social contribution, thereby leading to an increase in our taxable rate as we were required to recognize the use of tax losses when recalculating our current income taxes since 2016.
Our deferred income taxes for the six months ended June 30, 2024 amounted to an expense of R$8.4 million, a variation of R$139.7 million from an expense of R$148.1 million for the six months ended June 30, 2023, which was primarily attributable to the reversal of the deferred taxes portion of the tax benefit arising from excluding value-added taxes (ICMS) from the calculation base for income taxes and social contribution, as mentioned above, which was disallowed in April 2023 by a ruling of the STJ. Additionally, in April 2024, when we effectively started taking part in the tax settlement program, the final amount agreed generated an additional reversal of tax losses of R$37.0 million.
Profit (loss) for the period
Profit for the six months ended June 30, 2024 was R$237.6 million, a variation of R$296.0 million from a loss of R$58.4 million for the six months ended June 30, 2023, which was primarily attributable to a positive outcome in our financial results, net and income taxes (current and deferred), despite our operational performance as measured by the ratio between our profit before finance results and taxes and our revenue, which decreased from 9.2% for the six months ended June 30, 2023 to 8.1% for the six months ended June 30, 2024.
Year Ended December 31, 2023 Compared to Year Ended December 31, 2022
The following table sets forth our consolidated statement of profit or loss data for the periods indicated.
| | | For the Year Ended December 31, |
| | | 2023 | | 2022 | | Variation |
| | | (in R$ millions) | | (%) |
| Revenue | | | 10,074.2 | | | | 8,886.3 | | | | 13.4 | % |
| Cost of sales and services | | | (7,289.4 | ) | | | (6,925.6 | ) | | | 5.3 | % |
| Gross profit | | | 2,784.8 | | | | 1,960.7 | | | | 42.0 | % |
| Selling expenses | | | (1,214.5 | ) | | | (1,122.6 | ) | | | 8.2 | % |
| General and administrative expenses | | | (630.8 | ) | | | (372.2 | ) | | | 69.5 | % |
| Other operating income (expenses), net | | | (18.5 | ) | | | 29.0 | | | | n.m. | |
| Profit before finance results and taxes | | | 920.9 | | | | 495.0 | | | | 86.0 | % |
| Financial results, net | | | (319.7 | ) | | | (107.1 | ) | | | 198.5 | % |
| Profit before taxes | | | 601.2 | | | | 387.8 | | | | 55.0 | % |
| Income taxes – current | | | (296.7 | ) | | | (45.4 | ) | | | 553.5 | % |
| Income taxes – deferred | | | (38.6 | ) | | | 71.7 | | | | n.m. | |
| Total income taxes | | | (335.2 | ) | | | 26.3 | | | | n.m. | |
| Profit for the year | | | 266.0 | | | | 414.2 | | | | (35.8 | )% |
n.m. = not meaningful
Revenue
Revenue for the year ended December 31, 2023 was R$10,074.2 million, an increase of R$1,187.9 million, or 13.4%, from R$8,886.3 million for the year ended December 31, 2022, which was primarily attributable to our acquisition of PetroChoice and Tirreno, given that, in 2022, these entities only contributed to our results of operations for seven months, as compared to a full year in 2023. From our total increase in revenue for the year
ended December 31, 2023, 68.1% was generated by PetroChoice, 23.5% by the organic growth of our business and 8.4% by Tirreno.
Excluding the effects of the acquisitions of PetroChoice and Tirreno, our revenue increased R$278.5 million, or 3.9%, for the year ended December 31, 2023 compared to the year ended December 31, 2022. This was primarily due to an increase of 11% in the volume of lubricants sold to 421 million liters in the year ended December 31, 2023 from 379 million liters in the year ended December 31, 2022.
Cost of sales and services
Cost of sales and services for the year ended December 31, 2023 was R$7,289.4 million, an increase of R$363.8 million, or 5.3%, from R$6,925.6 million for the year ended December 31, 2022, which was primarily attributable to the increase in sales due to the growth of our business as described in “—Revenue” above, and the fact that given our acquisitions of PetroChoice and Tirreno occurred in May 2022, these entities only contributed to our results of operations for seven months in 2022, as compared to a full year in 2023. As a percentage of revenue, our cost of sales and services decreased 5.6 percentage points, from 77.9% for the year ended December 31, 2022 to 72.4% for the year ended December 31, 2023 despite a substantial increase in the cost of raw materials for the year ended December 31, 2023, as a result of our supply strategy execution and a lower cost base at PetroChoice compared to our business pre-acquisition.
Gross profit
As a result of the foregoing, gross profit for the year ended December 31, 2023 was R$2,784.8 million, an increase of R$824.1 million, or 42.0%, from R$1,960.7 million for the year ended December 31, 2022.
Selling expenses
Selling expenses for the year ended December 31, 2023 were R$1,214.5 million, an increase of R$91.9 million, or 8.2%, from R$1,122.6 million for the year ended December 31, 2022, which was primarily attributable to the fact that our selling expenses for the year ended December 31, 2022 only contain seven months of PetroChoice’s selling expenses while our selling expenses for the year ended December 31, 2023 contained a full 12 months of PetroChoice’s selling expenses. However, for the year ended December 31, 2022, PetroChoice reported all its operational expenses as selling expenses without distinction between selling and general and administrative expenses. As a percentage of our revenue, selling expenses varied from 12.6% for the year ended December 31, 2022 to 12.1% for the year ended December 31, 2023.
Excluding the effects of the acquisitions of PetroChoice and Tirreno, our selling expenses increased R$8.9 million, or 1.5%, for the year ended December 31, 2023 compared to the year ended December 31, 2022. This was primarily due to increases in expenses with communications and marketing activities, administrative and commercial expenses and third-party contractor expenses.
General and administrative expenses
General and administrative expenses for the year ended December 31, 2023 were R$630.8 million, an increase of R$258.6 million, or 69.5%, from R$372.2 million for the year ended December 31, 2022, which was primarily attributable to the correct allocation of PetroChoice’s general and administrative expenses for the year ended December 31, 2023.
Excluding the effects of the acquisitions of PetroChoice and Tirreno, our general and administrative expenses increased R$57.8 million, or 18.0%, in the year ended December 31, 2023 compared to the year ended December 31, 2022. This was primarily due to an increase in third-party contractor expenses and other expected losses over other accounts receivables for sale of investment interests.
Other operating income (expenses), net
Other operating expenses, net for the year ended December 31, 2023 were R$18.5 million, a variation of R$47.5 million from other operating income, net of R$29.0 million for the year ended December 31, 2022. This variation was substantially due to the recognition in the year ended December 31, 2023 of expenses with legal proceedings and fines of R$15.5 million, expenses of R$10.7 million of write-off of value added tax credits (ICMS), partially offset by R$4.1 million in income from an insurance claim for business interruption in connection with a 2021 fire incident, compared to income from extemporaneous value-added PIS/COFINS tax credits of R$14.2 million and value-added IPI tax credits of R$14.0 million recognized in the year ended December 31, 2022.
Profit before finance results and taxes
For the reasons described above, our profit before finance results and taxes for the year ended December 31, 2023 was R$920.9 million, an increase of R$425.9 million, or 86.0%, from R$495.0 million for the year ended December 31, 2022.
Financial results, net
Financial results, net for the year ended December 31, 2023 were an expense of R$319.7 million, an increase of R$212.6 million, or 198.5%, from an expense of R$107.1 million for the year ended December 31, 2022, which was primarily attributable to (i) financial expenses arising out of the interest accruals of the loan we secured to finance the PetroChoice acquisition, which amounted to R$165.6 million for the year ended December 31, 2023; and (ii) a net adverse result from exchange variation, net due to different currencies fluctuations in the aggregate amount of R$137.4 million for the year ended December 31, 2023, of which R$116.0 million resulted from our Argentinian operation (following the significant depreciation of the Argentinian peso against the U.S. dollar and the Brazilian real). The foregoing was offset in part by an increase in income from financial investments of R$32.5 million.
Profit before taxes
Our profit before taxes for the year ended December 31, 2023 was R$601.2 million, an increase of R$213.4 million, or 55.0%, from R$387.8 million for the year ended December 31, 2022, which was primarily attributable to synergies and the stabilization of operations acquired for the year ended December 31, 2022, together with a strong cost management posture.
Income taxes
Our current income taxes expense for the year ended December 31, 2023 was R$296.7 million, an increase of R$251.3 million, from R$45.4 million for the year ended December 31, 2022, which was primarily attributable to the adverse effects of a decision by the Brazilian Superior Court of Justice (Superior Tribunal de Justiça), or STJ, in April 2023, which halted the practice (i.e., tax benefit) of excluding value-added taxes (“ICMS”) from the calculation bases for income taxes and social contribution, thereby leading to an increase in our taxable rate as we were required to recognize the use of tax losses when recalculating our current income taxes since 2016.
Our deferred income taxes for the year ended December 31, 2023 amounted to an expense of R$38.6 million, a variation of R$110.3 million from a gain of R$71.7 million for the year ended December 31, 2022, which was primarily attributable to the aforementioned STJ decision, which required us to recognize the use of tax losses when recalculating our current income taxes since 2016.
Profit for the year
Profit for the year ended December 31, 2023 was R$266.0 million, a decrease of R$148.2 million, or 35.8%, from R$414.2 million for the year ended December 31, 2022, which was primarily attributable to an adverse outcome in our financial results, net and income taxes (current and deferred). This was offset by our improved operational performance (as measured by the ratio between our profit before finance results and taxes and our revenue, which increased from 5.6% in the year ended December 31, 2022 to 9.1% in the year ended December 31, 2023) as a result of continuous sales growth and the bolstering of our cost management posture.
Year Ended December 31, 2022 Compared to Year Ended December 31, 2021
The following table sets forth our consolidated statement of profit or loss data for the periods indicated.
| | | For the Year Ended December 31, |
| | | 2022 | | 2021 | | Variation |
| | | (in R$ millions) | | (%) |
| Revenue | | | 8,886.3 | | | | 6,036.7 | | | | 47.2 | % |
| Cost of sales and services | | | (6,925.6 | ) | | | (4,699.0 | ) | | | 47.4 | % |
| Gross profit | | | 1,960.7 | | | | 1,337.7 | | | | 46.6 | % |
| Selling expenses | | | (1,122.6 | ) | | | (583.4 | ) | | | 92.4 | % |
| General and administrative expenses | | | (372.2 | ) | | | (275.9 | ) | | | 34.9 | % |
| Other operating income, net | | | 29.0 | | | | 23.4 | | | | 23.9 | % |
| Profit before finance results and taxes | | | 495.0 | | | | 501.8 | | | | (1.4 | )% |
| Financial results, net | | | (107.1 | ) | | | (63.8 | ) | | | 67.9 | % |
| Profit before taxes | | | 387.8 | | | | 438.0 | | | | (11.5 | )% |
| Income taxes – current | | | (45.4 | ) | | | (81.7 | ) | | | (44.4 | )% |
| Income taxes – deferred | | | 71.7 | | | | (66.2 | ) | | | n.m. | |
| Total income taxes | | | 26.3 | | | | (147.9 | ) | | | n.m. | |
| Profit for the year | | | 414.2 | | | | 290.1 | | | | 42.8 | % |
n.m. = not meaningful
Revenue
Revenue for the year ended December 31, 2022 was R$8,886.3 million, an increase of R$2,849.6 million, or 47.2%, from R$6,036.7 million for the year ended December 31, 2021, which was primarily attributable to our acquisition of PetroChoice in the United States and Tirreno in Brazil, which increased our revenue by R$1,639.7 million and R$132.6 million, respectively, and accounted for 62.2% of our revenue increase for the year ended December 31, 2022.
Excluding the effects of the acquisitions of PetroChoice and Tirreno, our revenue increased R$1,077.3 million, or 17.8%, for the year ended December 31, 2022 compared to the year ended December 31, 2021. This was primarily due to the execution of our revenue management strategy, which resulted in a better unit price point.
Cost of sales and services
Cost of sales and services for the year ended December 31, 2022 was R$6,925.6 million, an increase of R$2,226.6 million, or 47.4%, from R$4,699.0 million for the year ended December 31, 2021, which was primarily attributable to an increase in sales due to the growth of our business as described in “—Revenue” above and our acquisitions of PetroChoice and Tirreno in May 2022, with these entities contributing to our results of operations for seven months in 2022. As a percentage of revenue, our cost of sales and services increased 0.1 percentage points, from 77.8% for the year ended December 31, 2021 to 77.9% for the year ended December 31, 2022, despite a substantial increase in the cost of raw materials for the year ended December 31, 2022 due to our assertive supply chain management strategy and higher operating efficiency.
Gross profit
As a result of the foregoing, gross profit for the year ended December 31, 2022 was R$1,960.7 million, an increase of R$623.0 million, or 46.6%, from R$1,337.7 million for the year ended December 31, 2021.
Selling expenses
Selling expenses for the year ended December 31, 2022 was R$1,122.6 million, an increase of R$539.2 million, or 92.4%, from R$583.4 million for the year ended December 31, 2021, which was primarily attributable to the acquisition of PetroChoice, which was responsible for a R$519.0 million increase in selling expenses, or 96.3% of our aggregate increase in selling expenses in 2022, primarily composed of employee expenses, freight and logistics costs and depreciation and amortization.
Excluding the effects of the acquisitions of PetroChoice and Tirreno, our selling expenses increased R$7.7 million, or 1.3%, for the year ended December 31, 2022 compared to the year ended December 31, 2021. This was primarily due to increases in freight and logistics costs and personnel expenses as a result of the amounts paid under the relevant agreements being indexed to inflation.
General and administrative expenses
General and administrative expenses for the year ended December 31, 2022 were R$372.2 million, an increase of R$96.3 million, or 34.9%, from R$275.9 million for the year ended December 31, 2021, which was primarily attributable to the acquisition of PetroChoice, which was responsible for a R$45.6 million increase in general and administrative expenses, or 47.4% of our aggregate increase in general and administrative expenses in 2022. Nonetheless, as a percentage of revenue, our general and administrative expenses decreased from 4.6% for the year ended December 31, 2021 to 4.2% for the year ended December 31, 2022.
Excluding the effects of the acquisitions of PetroChoice and Tirreno, our general and administrative expenses increased R$44.7 million, or 16.2%, for the year ended December 31, 2022 and compared to the year ended December 31, 2021. This was primarily due to increases in employee expenses and third-party contractor costs.
Other operating income, net
Other operating income, net for the year ended December 31, 2022 was R$29.0 million, an increase of R$5.6 million, or 23.9%, from R$23.4 million for the year ended December 31, 2021. This increase was primarily due to the recognition of extemporaneous value-add tax credits (PIS/COFINS) from past periods registered during the year ended December 31, 2022 of R$14.2 million. This was offset in part by the net effect of legal proceedings expenses as a result of a greater amount of provisions for the year ended December 31, 2022 compared to the year ended December 31, 2021.
Profit before finance results and taxes
For the reasons described above, our profit before finance results, net and taxes for the year ended December 31, 2022 was R$495.0 million, a decrease of R$6.8 million, or 1.4%, from R$501.8 million for the year ended December 31, 2021.
Financial results, net
Financial results, net for the year ended December 31, 2022 were R$107.1 million, an increase of R$43.3 million, or 67.9%, from R$63.8 million for the year ended December 31, 2021, which was primarily attributable to (i) financial expenses arising out of the interest accruals of the loan we secured to finance the PetroChoice acquisition, which amounted to R$61.5 million for the year ended December 31, 2022; and (ii) R$48.0 million in expenses for the year ended December 31, 2022 compared to a gain of R$6.1 million for the year ended December 31, 2021, as a result of the settlement of derivative financial instruments relating to certain loans into which we entered for the year ended December 31, 2022. The foregoing was offset in part by an increase in income from financial investments of R$34.8 million and a favorable result from exchange variation, net due to the fluctuation of different currencies in the amount of R$48.0 million.
Profit before taxes
Profit before taxes for the year ended December 31, 2022 was R$387.8 million, a decrease of R$50.2 million, or 11.5%, from R$438.0 million for the year ended December 31, 2021, which was primarily attributable to an increase in operating expenses as well as an increase in finance expenses as a result of a change in our capital financing structure, offset by the business growth in our sales volume and the maintenance of cost structure.
Income taxes
Our current income taxes expense for the year ended December 31, 2022 was R$45.4 million, a decrease of R$36.3 million, or 44.4%, from R$81.7 million for the year ended December 31, 2021, which was primarily attributable to our then prevailing practice (i.e., tax benefit) of excluding ICMS taxes from the calculation bases of our income taxes, in part because the case law and the legal opinion of our legal advisors at such time indicated that
it was unlikely that the STJ would halt this practice (as described above in “—Year Ended December 31, 2023 Compared to Year Ended December 31, 2022—Income taxes”).
Our deferred income taxes for the year ended December 31, 2022 amounted to a gain of R$71.7 million, a variation of R$137.9 million from an expense of R$66.2 million for the year ended December 31, 2021, which was primarily attributable to the recognition of deferred tax credits since 2016 as a result of the then prevailing practice (i.e., tax benefit) of excluding ICMS taxes from the calculation bases of our income taxes and social contribution, which practice led us to recognize deferred tax credits of R$30.5 million for the year ended December 31, 2022 and recognize tax losses of R$76.7 million for the year ended December 31, 2021.
Profit for the year
Profit for the year ended December 31, 2022 was R$414.2 million, an increase of R$124.1 million, or 42.8%, from R$290.1 million for the year ended December 31, 2021, which was primarily attributable to the business growth in our sales volume and the maintenance of cost structure, despite an increase in finance expenses as a result of additional loans contracted in the year ended December 31, 2022, as described above.
Segment Results of Operations
Six Months Ended June 30, 2024 Compared to Six Months Ended June 30, 2023
The following table sets forth our statement of profit or loss data by segment for the periods indicated. For more information, see “—Segment Reporting.”
| | | For the Six Months Ended June 30, |
| | | 2024 | | 2023 |
| | | South America | | North
America | | Europe | | Consolidated | | South America | | North America | | Europe | | Consolidated |
| | | (in R$ millions) |
| Revenue | | | 2,378.9 | | | | 1,180.7 | | | | 1,465.2 | | | | 5,024.8 | | | | 2,286.6 | | | | 1,273.8 | | | | 1,543.9 | | | | 5,104.3 | |
Cost of sales and services and operating
expenses | | | (2,020.9 | ) | | | (1,163.7 | ) | | | (1,434.4 | ) | | | (4,619.0 | ) | | | (1,873.8 | ) | | | (1,273.5 | ) | | | (1,488.9 | ) | | | (4,636.1 | ) |
Profit before finance results and
taxes | | | 358.0 | | | | 17.0 | | | | 30.8 | | | | 405.8 | | | | 412.8 | | | | 0.3 | | | | 55.0 | | | | 468.2 | |
| (+) Depreciation and amortization | | | 25.1 | | | | 125.8 | | | | 23.0 | | | | 173.8 | | | | 21.0 | | | | 126.5 | | | | 17.8 | | | | 165.2 | |
| (+) Expenses with equity compensation plan (1) | | | 97.8 | | | | — | | | | — | | | | 97.8 | | | | — | | | | — | | | | — | | | | — | |
| (+) Expenses with initial public offering (2) | | | 8.1 | | | | 3.5 | | | | 1.2 | | | | 12.8 | | | | — | | | | — | | | | — | | | | — | |
| Adjusted EBITDA by Segment(3) | | | 488.9 | | | | 146.3 | | | | 55.0 | | | | 690.2 | | | | 433.8 | | | | 126.8 | | | | 72.8 | | | | 633.4 | |
| (1) | Expenses incurred in connection with our equity-compensation plan linked to the occurrence of our initial public offering. |
| (2) | Non-recurring expenses related to our initial public offering. |
| (3) | We calculate Adjusted EBITDA by segment as profit before finance results and taxes plus depreciation and amortization plus expenses incurred in connection with our equity-compensation plan linked to the occurrence of our initial public offering and non-recurring expenses related to our initial public offering. |
Revenue
Our revenue for each of our segments for the six months ended June 30, 2024 compared to the six months ended June 30, 2023 were driven by the following:
| · | In our South America segment, revenue was R$2,378.9 million for the six months ended June 30, 2024, an increase of R$92.3 million, or 4.0%, compared to R$2,286.6 million for the six months ended June 30, 2023. This was primarily attributable to an increase of 3.8% in the volume of lubricants sold; |
| · | In our North America segment, revenue was R$1,180.7 million for the six months ended June 30, 2024, a decrease of R$93.1 million, or 7.3%, compared to R$1,273.8 million for the six months ended June 30, |
2023. This was primarily attributable to a decrease of 5.1% in prices and 2.3% in volume of lubricants sold; and
| · | In our Europe segment, revenue was R$1,465.2 million for the six months ended June 30, 2024, a decrease of R$78.7 million, or 5.1%, compared to R$1,543.9 million for the six months ended June 30, 2023. This was primarily attributable to a decrease of 17.8% in the volume of goods sold in connection as a result of our strategy of putting in place a new operational system in the region by the end of first quarter of 2024, which resulted in a learning curve affecting our revenue. |
Cost of sales and services and operating expenses
Our cost of sales and services and operating expenses for each of our segments for the six months ended June 30, 2024 compared to the six months ended June 30, 2023 was driven by the following:
| · | In our South America segment, cost of sales and services and operating expenses were R$2,020.9 million for the six months ended June 30, 2024, an increase of R$147.1 million, or 7.9%, compared to R$1,873.8 million for the six months ended June 30, 2023. This was primarily due to the growth in our operations, and expenses related to equity compensation plan in addition to expenses related to the initial public offering for the six months ended June 30, 2024; |
| · | In our North America segment, cost of sales and services and operating expenses were R$1,163.7 million for the six months ended June 30, 2024, a decrease of R$109.8 million, or 8.6%, compared to R$1,273.5 million for the six months ended June 30, 2023. We recorded a decrease in our cost of sales and services and operating expenses as a percentage of revenue to 98.6% for the six months ended June 30, 2024 from 100.0% for the six months ended June 30, 2023, primarily due to a decrease in our cost of sales and services and operating expenses as a result of cost management efficiency, changes in product and services mix of sales and a decrease in inbound freight rates; and |
| · | In our Europe segment, cost of sales and services and operating expenses were R$1,434.4 million for the six months ended June 30, 2024, a decrease of R$54.5 million, or 3.7%, compared to R$1,488.9 million for the six months ended June 30, 2023. This was primarily due to the aforementioned decrease in the volume of sales, offset by the increase of expenses related to marketing and third-party contractors. Our cost of sales and services and operating expenses as a percentage of revenue was materially unchanged (97.9% for the six months ended June 30, 2024 compared to 96.4% for the six months ended June 30, 2023). |
Adjusted EBITDA by segment
Our Adjusted EBITDA for each of our segments for the six months ended June 30, 2024 compared to the six months ended June 30, 2023 was driven by the following:
| · | In our South America segment, our Adjusted EBITDA was R$488.9 million for the six months ended June 30, 2024, an increase of R$55.1 million, or 12.7%, compared to R$433.8 million for the six months ended June 30, 2023. This was primarily attributable to an increase in revenue driven by a 3.8% increase in volume of lubricants sold and the execution of our cost management strategy with respect to our raw materials, in addition to a global decrease in base oil prices; |
| · | In our North America segment, our Adjusted EBITDA was R$146.3 million for the six months ended June 30, 2024, an increase of R$19.5 million, or 15.4%, compared to R$126.8 million for the six months ended June 30, 2023. This was primarily attributable to a decrease in our cost of sales and services and operating expenses as a result of our cost management efficiency, and decreases in inbound freight costs, partially offset by the lower volume of lubricants sold and a decrease in unit selling prices; and |
| · | In our Europe segment, our Adjusted EBITDA was R$55.0 million for the six months ended June 30, 2024, a decrease of R$17.8 million, or 24.5%, compared to R$72.8 million for the six months ended June 30, 2023, primarily attributable to the aforementioned decrease of 17.8% in volume of goods sold as a result of sales reduction due to the learning curve associated with the rolling out of a new operational system in the region. |
Our Adjusted EBITDA for each of our segments for the six months ended June 30, 2024 compared to the six months ended June 30, 2023 was driven by the incurrence of expenses in relation to our initial public offering of R$12.8 million and expenses related to our equity-compensation plan linked to the occurrence the occurrence of our initial public offering of R$97.8 million in the six months ended June 30, 2024. There is no impact from either of these expenses in the six months ended June 30, 2023. Expenses relate to our initial public offering are allocated to each of our segments according to where they occur. Expenses related to equity compensation plan are allocated to South America segment and do not impact our North America or Europe segments, considering they are corporate events registered in our holding company books and the corporate headquarter is located in this region.
Year Ended December 31, 2023 Compared to Year Ended December 31, 2022
The following table sets forth our statement of profit or loss data by segment for the periods indicated. For more information, see “—Segment Reporting.”
| | | For the Year Ended December 31, |
| | | 2023 | | 2022 |
| | | South America | | North
America | | Europe | | Consolidated | | South America | | North America | | Europe | | Consolidated |
| | | (in R$ millions) |
| Revenue | | | 4,571.8 | | | | 2,456.7 | | | | 3,045.7 | | | | 10,074.2 | | | | 4,016.1 | | | | 1,763.6 | | | | 3,106.6 | | | | 8,886.3 | |
Cost of sales and services and operating
expenses | | | (3,790.9 | ) | | | (2,425.2 | ) | | | (2,937.2 | ) | | | (9,153.2 | ) | | | (3,507.1 | ) | | | (1,863.5 | ) | | | (3,020.7 | ) | | | (8,391.4 | ) |
Profit before finance results and
taxes | | | 780.9 | | | | 31.5 | | | | 108.6 | | | | 920.9 | | | | 508.9 | | | | (99.9 | ) | | | 85.9 | | | | 495.0 | |
| Depreciation and amortization | | | 44.8 | | | | 241.3 | | | | 36.1 | | | | 322.2 | | | | 41.4 | | | | 163.8 | | | | 37.4 | | | | 242.6 | |
| Expenses with equity compensation plan (1) | | | — | | | | — | | | | — | | | | — | | | | — | | | | — | | | | — | | | | — | |
| Expenses with initial public offering (2) | | | — | | | | — | | | | — | | | | — | | | | — | | | | — | | | | — | | | | — | |
| Adjusted EBITDA by Segment(3) | | | 825.7 | | | | 272.9 | | | | 144.6 | | | | 1,243.1 | | | | 550.3 | | | | 63.9 | | | | 123.3 | | | | 737.5 | |
| (1) | Expenses incurred in connection with our equity-compensation plan linked to the occurrence of our initial public offering. |
| (2) | Non-recurring expenses related to our initial public offering. |
| (3) | We calculate Adjusted EBITDA by segment as profit before finance results and taxes plus depreciation and amortization plus expenses incurred in connection with our equity-compensation plan linked to the occurrence of our initial public offering and non-recurring expenses related to our initial public offering. |
Revenue
Our revenue for each of our segments for the year ended December 31, 2023 compared to the year ended December 31, 2022 were driven by the following:
| · | In our South America segment, revenue was R$4,571.8 million for the year ended December 31, 2023, an increase of R$555.7 million, or 13.8%, compared to R$4,016.1 million for the year ended December 31, 2022. This was primarily attributable to: (i) organic growth of this segment driven by an 18.0% increase in the volume of lubricants sold, excluding the effects of the acquisition of Tirreno which accounted for R$455.7 million, or 82.0%, of the total increase in revenue for this segment; and (ii) the integration of Tirreno into our business, which entity only contributed to our results for seven months for the year ended December 31, 2022 as compared to the full 12 months for the year ended December 31, 2023; |
| · | In our North America segment, revenue was R$2,456.7 million for the year ended December 31, 2023, an increase of R$693.1 million, or 39.3%, compared to R$1,763.6 million for the year ended December 31, 2022. In light of the steady invoicing in our North America segment, this increase was primarily attributable to the fact that PetroChoice only contributed to our results for this segment for seven months for the year ended December 31, 2022 as compared to the full 12 months for the year ended December 31, 2023; and |
| · | In our Europe segment, revenue was R$3,045.7 million for the year ended December 31, 2023, a decrease of R$60.9 million, or 2.0%, compared to R$3,106.6 million for the year ended December 31, 2022. This |
was primarily attributable to a small decrease in the volume of our lubricant sales in this segment and in the sales of non-core business lines.
Cost of sales and services and operating expenses
Our cost of sales and services and operating expenses for each of our segments for the year ended December 31, 2023 compared to the year ended December 31, 2022 was driven by the following:
| · | In our South America segment, cost of sales and services and operating expenses were R$3,790.9 million for the year ended December 31, 2023, an increase of R$283.8 million, or 8.1%, compared to R$3,507.1 million for the year ended December 31, 2022. This was primarily due to the increase in the volume of our operations and revenue, as shown by the decrease in our cost of sales and services and operational expenses as a percentage of revenue to 82.9% for the year ended December 31, 2023 from 87.3% for the year ended December 31, 2022. This 4.4 percentage point decrease, in turn, was primarily attributable to our supply chain management strategy and higher operating efficiency; |
| · | In our North America segment, cost of sales and services and operating expenses were R$2,425.2 million for the year ended December 31, 2023, an increase of R$561.7 million, or 30.1%, compared to R$1,863.5 million for the year ended December 31, 2022. This was primarily due to the fact that PetroChoice only contributed to our results for seven months for the year ended December 31, 2022 as compared to the full 12 months for the year ended December 31, 2023. We recorded a decrease in our cost of sales and services and operating expenses as a percentage of revenue to 98.7% for the year ended December 31, 2023 from 105.7% for the year ended December 31, 2022. This 6.9 percentage point decrease was primarily due to a decrease in our cost of sales and services and operating expenses as a direct result of cost management efficiency, synergies captured after a business acquisition, changes in product and services mix of sales and a decrease in inbound freight rates; and |
| · | In our Europe segment, cost of sales and services and operating expenses were R$2,937.2 million for the year ended December 31, 2023, a decrease of R$83.5 million, or 2.8%, compared to R$3,020.7 million for the year ended December 31, 2022. This was primarily due to the aforementioned decrease in the volume of sales. Our cost of sales and services and operating expenses as a percentage of revenue was materially unchanged (96.4% for the year ended December 31, 2023 compared to 97.2% for the year ended December 31, 2022). |
Adjusted EBITDA by segment
Our Adjusted EBITDA for each of our segments for the year ended December 31, 2023 compared to the year ended December 31, 2022 was driven by the following:
| · | In our South America segment, our Adjusted EBITDA was R$825.7 million for the year ended December 31, 2023, an increase of R$275.4 million, or 50.0%, compared to R$550.3 million for the year ended December 31, 2022. This was primarily attributable to: (i) an increase in revenue, both through organic growth and as a result of the consolidation of Tirreno’s operations for the year ended December 31, 2022; and (ii) the execution of our cost management strategy with respect to our raw materials, which we believe helped us avoid a disproportionate increase in purchase prices in this segment despite unfavorable market conditions; |
| · | In our North America segment, our Adjusted EBITDA was R$272.9 million for the year ended December 31, 2023, an increase of R$209.0 million, or 327.1%, compared to R$63.9 million for the year ended December 31, 2022. This was primarily attributable to: (i) the fact that PetroChoice only contributed to our results for seven months for the year ended December 31, 2022 as compared to the full 12 months for the year ended December 31, 2023; (ii) a decrease in our cost of sales and services and operating expenses as a result of our cost management efficiency, synergies captured after a business acquisition, changes in product and services mix and decreases in inbound freight costs; and (iii) a R$40.5 million non-recurring and non-cash transaction related to one-off amortization of fair value step up arising from inventory acquired in connection with the business combination with PetroChoice; and |
| · | In our Europe segment, our Adjusted EBITDA was R$144.6 million for the year ended December 31, 2023, an increase of R$21.3 million, or 17.3%, compared to R$123.3 million for the year ended December 31, 2022, which shows our Adjusted EBITDA was consistent in this segment year-over-year capturing a slightly better mix of products sold. |
Year Ended December 31, 2022 Compared to Year Ended December 31, 2021
The following table sets forth our statement of profit or loss data by segment for the periods indicated. For more information, see “—Segment Reporting.”
| | | For the Year Ended December 31, |
| | | 2022 | | 2021 |
| | | South America | | North America | | Europe | | Consolidated | | South America | | North America | | Europe | | Consolidated |
| | | (in R$ millions) |
| Revenue | | | 4,016.1 | | | | 1,763.6 | | | | 3,106.6 | | | | 8,886.3 | | | | 3,372.1 | | | | 71.7 | | | | 2,593.5 | | | | 6,036.7 | |
| Cost of sales and services and operating expenses | | | (3,507.1 | ) | | | (1,863.5 | ) | | | (3,020.7 | ) | | | (8,391.4 | ) | | | (2,923.7 | ) | | | (83.7 | ) | | | (2,527.5 | ) | | | (5,534.9 | ) |
| Profit before finance results and taxes | | | 508.9 | | | | (99.9 | ) | | | 85.9 | | | | 495.0 | | | | 448.4 | | | | (12.6 | ) | | | 66.0 | | | | 501.8 | |
| Depreciation and amortization | | | 41.4 | | | | 163.8 | | | | 37.4 | | | | 242.6 | | | | 41.1 | | | | 13.2 | | | | 43.0 | | | | 97.2 | |
| Expenses with equity compensation plan (1) | | | — | | | | — | | | | — | | | | — | | | | — | | | | — | | | | — | | | | — | |
| Expenses with initial public offering (2) | | | — | | | | — | | | | — | | | | — | | | | — | | | | — | | | | — | | | | — | |
| Adjusted EBITDA by Segment(3) | | | 550.3 | | | | 63.9 | | | | 123.3 | | | | 737.6 | | | | 489.4 | | | | 0.6 | | | | 109.0 | | | | 599.0 | |
| (1) | Expenses incurred in connection with our equity-compensation plan linked to the occurrence of our initial public offering. |
| (2) | Non-recurring expenses related to our initial public offering. |
| (3) | We calculate Adjusted EBITDA by segment as profit before finance results and taxes plus depreciation and amortization plus expenses incurred in connection with our equity-compensation plan linked to the occurrence of our initial public offering and non-recurring expenses related to our initial public offering. |
Revenue
Our revenue for each of our segments for the year ended December 31, 2022 compared to the year ended December 31, 2021 was driven by the following:
| · | In our South America segment, revenue was R$4,016.1 million for the year ended December 31, 2022, an increase of R$644.0 million, or 19.1%, compared to R$3,372.1 million for the year ended December 31, 2021. This was primarily due to: (i) our revenue management strategy which resulted in a better unit price point and accounted for R$511.4 million, or 79.4%, of the total increase in revenue for this segment; and (ii) the integration of Tirreno into our business, which contributed to our results for seven months for the year ended December 31, 2022 and accounted for R$132.6 million, or 20.6%, of the total increase in revenue for this segment. |
| · | In our North America segment, revenue was R$1,763.6 million for the year ended December 31, 2022, an increase of R$1,692.5 million, compared to R$71.1 million for the year ended December 31, 2021. This was primarily attributable to the integration of PetroChoice in our business, which contributed to our results for seven months for the year ended December 31, 2022 and accounted for R$1,639.7 million, or 96.9%, of the total increase in revenue for this segment; and |
| · | In our Europe segment, revenue for the year was R$3,106.6 million for the year ended December 31, 2022, an increase of R$513.1 million, or 19.8%, compared to R$2,593.5 million for the year ended December 31, 2021. This was primarily attributable to our non-core fuel business serving business-to-business customers in the region, which saw a significant increase in sales prices given the constraints on supply to Europe beginning in March 2022. |
Cost of sales and services and operating expenses
Our cost of sales and services and operating expenses for each of our segments for the year ended December 31, 2022 compared to the year ended December 31, 2021 was driven by the following:
| · | In our South America segment, cost of sales and services and operating expenses were R$3,507.1 million for the year ended December 31, 2022, an increase of R$583.4 million, or 20.0%, compared to R$2,923.7 million for the year ended December 31, 2021. This was primarily due to (i) the organic growth of the business, which accounted for R$463.5 million, or 79.4%, of the total increase in our cost of sales and services and operating expenses for this segment; and (ii) the integration of Tirreno into our business, which contributed to our results for seven months for the year ended December 31, 2022 and accounted for R$120.0 million, or 20.6%, of the total increase in our cost of sales and services and operating expenses for this segment. As a percentage of our revenue, our cost of sales and services and operating expenses for this segment was materially unchanged (87.3% for the year ended December 31, 2022 compared to 86.7% for the year ended December 31, 2021); |
| · | In our North America segment, cost of sales and services and operating expenses were R$1,863.5 million for the year ended December 31, 2022, an increase of R$1,779.8 million, compared to R$83.7 million for the year ended December 31, 2021. This was primarily due to the PetroChoice acquisition, which closed in May 2022 and significantly impacted our operations in this segment. As a percentage of our revenue, our cost of sales and services and operating expenses for this segment decreased by 12.1 percentage points, to 105.7% for the year ended December 31, 2022 from 117.7% for the year ended December 31, 2021, which was primarily due to the cost management efficiency of this new business; and |
| · | In our Europe segment, cost of sales and services and operating expenses were R$3,020.7 million for the year ended December 31, 2022, an increase of R$493.2 million, or 19.5%, compared to R$2,527.5 million for the year ended December 31, 2021. This was primarily a result of the significant increase in sales in our fuels division. We recorded an immaterial variation of our cost of sales and services and operating expenses as a percentage of revenue (97.2% for the year ended December 31, 2022 compared to 97.5% for the year ended December 31, 2021). |
Adjusted EBITDA by segment
Our Adjusted EBITDA for each of our segments for the year ended December 31, 2022 compared to the year ended December 31, 2021 was driven by the following:
| · | In our South America segment, our Adjusted EBITDA was R$550.3 million for the year ended December 31, 2022, an increase of R$60.9 million, or 12.4%, compared to R$489.4 million for the year ended December 31, 2021. This was primarily due to the increase in revenue, both through organic growth and through the acquisition of Tirreno for the year ended December 31, 2022. |
| · | In our North America segment, our Adjusted EBITDA was R$63.9 million for the year ended December 31, 2022, an increase of R$63.3 million, compared to R$0.6 million for the year ended December 31, 2021. This was primarily due to the PetroChoice acquisition, which significantly increased the size of the business and brought an important improvement in our cost management efficiency. |
| · | In our Europe segment, our Adjusted EBITDA was R$123.3 million for the year ended December 31, 2022, an increase of R$14.3 million, or 13.1%, compared to R$109.0 million for the year ended December 31, 2021. This was primarily due to our non-core fuel business serving business-to-business customers and the aforementioned increase in its sales prices as a result of the constraints on supply to Europe beginning in March 2022. |
Liquidity and Capital Resources
Our financial condition and liquidity are influenced by several factors, including:
| · | our ability to generate cash flow from our operations; |
| · | the level of our outstanding indebtedness and related accrued interest, which affects our net financial expenses; |
| · | prevailing interest rates, which affect our debt service requirements; |
| · | exchange rate variations, which can affect both our foreign currency-denominated debt and our U.S. dollar-denominated supply agreements; and |
| · | credit ratings, including factors that may materially influence credit ratings, implications of potential changes in ratings and management’s expectations; and covenant compliance, including the implications of a breach of financial or other covenants and our capacity for additional borrowing under its covenants. |
Our cash needs have traditionally consisted of working capital requirements, servicing of our indebtedness, capital expenditures related to investments in operations, maintenance and expansion of plant facilities, as well as acquisitions. Our sources of liquidity have traditionally consisted of cash flows from our operations and short- and long-term borrowings. We have financed acquisitions through seller financing, third-party financing or capital contributions by our shareholders. We believe that our current working capital is sufficient for our present requirements and would expect to meet any potential shortfalls in our working capital needs through short- and long-term borrowings or offerings of debt or equity securities in the domestic and international capital markets.
For the six months ended June 30, 2024 and 2023 and the years ended December 31, 2023, 2022 and 2021, the cash flow used in investing activities was funded mainly by increased borrowing and also by the operational cash flows of our subsidiaries. As of June 30, 2024, our consolidated cash and cash equivalents amounted to R$667.5 million, compared to R$773.6 million as of December 31, 2023.
Cash Flows
The following table shows the generation and use of cash for the periods indicated:
| | | For the Six Months
Ended June 30, | | For the Year Ended December 31, |
| | | 2024 | | 2023 | | 2023 | | 2022 | | 2021 |
| | | (R$ millions) |
| Net cash flows from operating activities | | | 175.4 | | | | 377.5 | | | | 1,008.5 | | | | 700.0 | | | | 59.7 | |
| Net cash flows (used in) generated from investing activities | | | (145.1 | ) | | | (51.3 | ) | | | (192.2 | ) | | | (2,396.8 | ) | | | 1.1 | |
| Net cash flows (used in) generated from financing activities | | | (206.7 | ) | | | (388.6 | ) | | | (817.2 | ) | | | 1,650.5 | | | | 39.4 | |
| Effects of exchange rate changes on cash and cash equivalents | | | 70.3 | | | | (67.1 | ) | | | (90.9 | ) | | | (148.2 | ) | | | 23.3 | |
| Net (decrease) increase in cash and cash equivalents | | | (106.1 | ) | | | (129.5 | ) | | | (91.8 | ) | | | (194.5 | ) | | | 123.5 | |
Our cash and cash equivalents include current account balances, time deposits and financial investments. For more information, see note 7 to our unaudited interim condensed consolidated financial statements and note 3 to our audited consolidated financial statements, each included elsewhere in this prospectus.
Operating Activities
Our net cash flows from operating activities for the six months ended June 30, 2024 amounted to R$175.4 million, a decrease of R$202.1 million compared to the net cash flows from operating activities of R$377.5 million
for the six months ended June 30, 2023. This decrease was primarily driven by: (i) a R$77.7 million increase in working capital used in trade receivables due to an expansion in industrial customers with a longer days sales outstanding cycle and worse performance in terms of collection of accounts receivables for the six months ended June 30, 2024 compared with the six months ended June 30, 2023; (ii) a R$44.7 million net increase in working capital used in inventories and trade payables due to a supply chain strategy of having larger inventory positions given the economic scenario characterized by low prices of raw materials for the six months ended June 30, 2024 compared with the six months ended June 30, 2023; and (iii) income tax paid of R$79.9 million for the six months ended June 30, 2024, compared to R$17.3 million for the six months ended June 30, 2023 due to the adverse effects of a decision by the Brazilian Superior Court of Justice (Superior Tribunal de Justiça), or STJ, which halted the practice (i.e., tax benefit) of excluding value-added taxes (ICMS) from the calculation that resulted in the payment of higher income tax.
Our net cash flows from operating activities for the year ended December 31, 2023 amounted to R$1,008.5 million, an increase of R$308.5 million compared to the net cash flows of R$700.0 million for the year ended December 31, 2022. This increase was primarily driven by: (i) a R$213.4 million increase in profit before taxes for the year ended December 31, 2023, attributed to synergies and operational stabilization achieved from acquisitions made in 2022, coupled with robust cost management practices; (ii) a variation in working capital changes totaling R$191.9 million for the year ended December 31, 2023, compared to R$251.9 million for the year ended December 31, 2022, mainly due to significant changes in trade receivables, trade payables, and inventory resulting from our expansion efforts, positive finance results, utilization of tax credits for income tax payments and receipt of insurance claim proceeds; and (iii) interest paid of R$176.4 million for the year ended December 31, 2023, compared to R$79.5 million for the year ended December 31, 2022.
Our net cash flows from operating activities for the year ended December 31, 2022 amounted to R$700.0 million, an increase of R$640.3 million compared to the net cash flows of R$59.7 million for the year ended December 31, 2021. This increase was primarily driven by: (i) acquisitions conducted in 2022, significantly expanding our operations and cash flows; and (ii) a cash outflow event for the year ended December 31, 2021 totaling R$208.1 million, which did not recur for the year ended December 31, 2022, following an agreement with ExxonMobil regarding the acquisition of certain tax credits.
Investing Activities
Our net cash flows used in investing activities for the six months ended June 30, 2024 amounted to R$145.1 million, an increase of R$93.8 million compared to the net cash flows used in investing activities of R$51.3 million for the six months ended June 30, 2023. This increase was mainly due to (i) R$43.8 million related to the purchase of bonds issued by the government of Argentina, and (ii) acquisition cost net of cash acquired of new business in an amount of R$17.0 million for the six months ended June 30, 2024 paid as the second installment of price of the acquisition of Tirreno.
Our net cash flows used in investing activities for the year ended December 31, 2023 amounted to R$192.2 million, a decrease of R$2,204.6 million compared to the net cash flows used in investing activities of R$2,396.8 million for the year ended December 31, 2022. This decrease was mainly due to the absence of significant investment activities in 2023, in which year we only made acquisitions of property, plant and equipment and intangible assets amounting to R$188.7 million for the year ended December 31, 2023 as part of our regular operations. In contrast, our investing activities for the year ended December 31, 2022 included the acquisition of subsidiaries net of cash acquired (PetroChoice and Tirreno), which contributed to cash used of R$2,392.7 million, along with ordinary acquisitions of property, plant and equipment and intangible assets totaling R$109.3 million, among other less significant changes.
Our net cash flows used in investing activities for the year ended December 31, 2022 amounted to R$2,396.8 million, a variation of R$2,397.9 million compared to the net cash flows generated from investing activities of R$1.1 million for the year ended December 31, 2021. This variation was primarily attributed to the acquisition of PetroChoice and Tirreno, as described above, and the absence of significant investment activities in 2021.
Financing Activities
Our net cash flows used in financing activities for the six months ended June 30, 2024 amounted to R$206.7 million, a decrease of R$181.9 million as compared to net cash flows used in financing activities of R$388.6 million for the six months ended June 30, 2023. This decrease was primarily due to proceeds from borrowing of R$1,078.8 million received in the six months ended June 30, 2024, which were partially offset by (i) dividends paid of R$900 million for the six months ended June 30, 2024 compared to R$246.1 million for the six months ended June 30, 2023, and, (ii) an increase of R$252.5 million in repayment of principal borrowings.
Our net cash flows used in financing activities for the year ended December 31, 2023 amounted to R$817.2 million, a variation of R$2,467.7 million as compared to net cash flows generated from financing activities of
R$1,650.5 million for the year ended December 31, 2022. This variation was primarily since, for the year ended December 31, 2023, we only had cash consumption activities, the primary of these being repayment of principal on our borrowings of R$469.4 million and dividends paid in the amount of R$246.1 million for the year ended December 31, 2023. By contrast, for the year ended December 31, 2022: (i) we generated a significant amount of cash from financing activities given our syndicated loan we obtained to finance the PetroChoice acquisition of R$2,229.9 million; and (ii) we had payments of principal on our loans and borrowings of R$272.3 million and dividends paid of R$248.9 million for the year ended December 31, 2022.
Our net cash flows generated from financing activities for the year ended December 31, 2022 amounted to R$1,650.5 million, an increase of R$1,611.1 million as compared to net cash flows generated from financing activities of R$39.4 million for the year ended December 31, 2021. This increase was primarily due to: (i) increased proceeds from borrowings of R$418.7 million for the year ended December 31, 2021, an increase of R$1,811.2 million as compared to R$2,229.9 million for the year ended December 31, 2022 and repayment of principal borrowings R$272.3 million for the year ended December 31, 2022, an increase of R$159.2 million as compared to R$431.5 million for the year ended December 31, 2021; and (ii) less significant financing activities in the year ended December 31, 2021, which were essentially composed of the receipt of R$69.2 million for the year ended December 31, 2021 from the final installment of the earn-out under the CVC investment agreement and the acquisition of a non-controlling interest of 25% of the shares in our subsidiary TTA for R$32.0 million for the year ended December 31, 2021.
Indebtedness
As of June 30, 2024, our outstanding debt (represented by current and non-current loans and borrowings) totaled R$3,261.0 million (US$586.6 million), of which R$768.6 million (US$138.3 million) was short-term debt. As of December 31, 2023, our outstanding debt (represented by current and non-current loans and borrowings) totaled R$2,207.0 million (US$397.0 million), of which R$652.9 million (US$117.5 million) was short-term debt. Our debt consisted entirely of foreign currency-denominated debt.
As of June 30, 2024, we had six outstanding financings:
| (i) | a US$450 million syndicated loan, entered into on May 23, 2022 among Millennium Moove Corp. as borrower, certain guarantors and JPMorgan Chase Bank, N.A., Bank of America, N.A., Citibank N.A., MUFG Bank, Ltd., Itaú Unibanco S.A. – Nassau Branch and The Bank of Nova Scotia, as lenders, in connection with our acquisition of PetroChoice. The loan is a senior secured loan that accrues interest per annum at a rate equal to term SOFR plus an additional applicable rate. The syndicated loan matures on May 3, 2027, as further described below under “Business—Material Agreements—PetroChoice Acquisition Facility”; |
| (ii) | a US$9.5 million loan entered into in March 2022 by Cosan Lubrificantes S.R.L. as borrower to finance imports in foreign currency; |
| (iii) | a US$50.0 million loan entered into in June 2024 by Cosan Lubrificantes e Especialidades as a borrower in the form of an export credit note. The loan matures on June 14, 2027; |
| (iv) | a US$100.0 million loan entered into in June 2024 by Cosan Lubrificantes e Especialidades as borrower in the form of export prepayment facility agreement. The loan matures on June 14, 2027; |
| (v) | a £35.0 million Senior Term Loan Facility Agreement entered into in June 2024 by Moove Lubricants Limited as borrower to be used for working capital purposes. The loan matures on June 15, 2026; and |
| (vi) | a £2.5 million Trade Loan Facility Agreement entered into in June 2024 by Moove Lubricants Limited as borrower to be used for funding the purchase of goods or raw material. The loan matures on August 13, 2024. |
Our total debt (represented by current and non-current loans and borrowings) of R$3,261.0 million as of June 30, 2024 increased by 47.8% as compared to our total debt of R$2,207.0 million as of December 31, 2023, which was primarily due to: (i) four new financing agreements entered into for financing the purchase of goods and raw materials and for working capital purposes; and (ii) the appreciation of the U.S. dollar against the Brazilian real, which significantly impacted our US-dollar denominated indebtedness.
Certain of our long-term debt agreements require us or certain of our subsidiaries, as applicable, to comply with certain financial covenants, including in the case of our syndicated loan, maintaining a net leverage ratio of less than 3.5x and an interest coverage ratio greater than 2.5x (in each case as defined in the syndicated loan), which limit our ability to, among other things, raise new loans. As of June 30, 2024 and the date of this prospectus, we and our subsidiaries were in compliance with our debt covenants.
Unused Sources of Liquidity
As of June 30, 2024 and December 31, 2023, we and our subsidiaries had no unused available credit lines.
Working Capital
As of June 30, 2024, we had working capital (total current assets less total current liabilities) of R$762.1 million, compared to R$722.8 million as of December 31, 2023. The difference between the position as of June 30, 2024 and December 31, 2023 was mainly attributable to an increase in trade receivables and inventory, and, to a lesser extent, an increase in payables.
As of December 31, 2023, we had working capital (total current assets less total current liabilities) of R$722.8 million, compared to R$1,181.4 million as of December 31, 2022. The difference between the position as of December 31, 2023 and December 31, 2022 was mainly attributable to a decrease in trade receivables and inventory on one hand, and to an increase in payables on the other.
Capital Expenditures
For the six months ended June 30, 2024 and 2023 and the years ended December 31, 2023, 2022 and 2021, we made capital expenditures (consisting of acquisitions of property, plant and equipment and intangible assets) of R$88.2 million, R$87.0 million, R$188.7 million, R$109.3 million and R$42.7 million, respectively. Total capital expenditures as a percentage of revenue amounted to 1.8%, 1.7%, 1.9%, 1.2% and 0.7% for the six months ended June 30, 2024 and 2023 and for the years ended December 31, 2023, 2022 and 2021, respectively. These capital expenditures mainly include expenditures related to the modernization and maintenance of our assets and systems. For the year ended December 31, 2022, we also had capital expenditures related to acquisition of subsidiaries net of cash acquired of R$2,392.7 million.
For the six months ended June 30, 2024, our additions in capital expenditure (acquisitions of subsidiaries net of cash acquired and property, plant and equipment, and intangible assets) totaled R$88.2 million, of which 62.3%, or R$55.0 million, was invested in our North America operations, 24.6% was invested in our Brazilian operations and 13.1% was invested in our European operations.
For the year ended December 31, 2023, our additions in capital expenditure (acquisitions of subsidiaries net of cash acquired and property, plant and equipment, and intangible assets) totaled R$188.7 million, of which 50.0%, or R$99.7 million, was invested in our North America operations, 26.3% was invested in our Brazilian operations and 23.6% was invested in our European operations. Of this amount, R$146.5 million was invested in projects in North America and Brazil, while approximately all amounts invested in Europe were directed to system improvement projects. The funds used by us for making capital expenditures are generated from our working capital and existing or new indebtedness.
For the year ended December 31, 2024, our principal anticipated expenditures include approximately R$273.0 million.
To the extent the proceeds of this offering and cash from our business activities are insufficient to fund future capital requirements, including potential future acquisitions, we may need to seek equity or debt financing in the future. We will continue to make capital expenditures to support the expected growth of our business.
Contractual Financial Obligations
The following table sets forth the maturity schedule of our material contractual financial obligations (contracted undiscounted cash flows basis) as of June 30, 2024:
| | | Up to
1 year | | 1 to 2 years | | 3 to 5 years | | Over
5 years | | As of June 30, 2024 |
| | | (in millions of reais) |
| Trade payables | | | (1,845.8 | ) | | | — | | | | — | | | | — | | | | (1,845.8 | ) |
| Loans and borrowings | | | (939.8 | ) | | | (1,383.2 | ) | | | (1,049.0 | ) | | | — | | | | (3,372.0 | ) |
| Salaries and wages | | | (115.2 | ) | | | — | | | | — | | | | — | | | | (115.2 | ) |
| Derivative financial instruments | | | (36.6 | ) | | | (12.9 | ) | | | 84.6 | | | | — | | | | 35.1 | |
| Lease liabilities | | | (79.9 | ) | | | (57.7 | ) | | | (100.9 | ) | | | (29.9 | ) | | | (268.4 | ) |
| Payables to related parties | | | (21.1 | ) | | | (117.6 | ) | | | — | | | | — | | | | (138.6 | ) |
| Other financial liabilities | | | (0.6 | ) | | | — | | | | — | | | | — | | | | (0.6 | ) |
| Total | | | (3,038.9 | ) | | | (1,571.4 | ) | | | (1,065.3 | ) | | | (29.9 | ) | | | (5,705.5 | ) |
Since June 30, 2024, there have been no material changes to the contractual obligations described above.
Off-Balance Sheet Arrangements
We have no off-balance sheet arrangements to finance our operations. We have no subsidiaries in which we hold a majority or minority stake that are not included in our consolidated financial statements, nor do we have any interests in or relationships with any special purpose companies that are not reflected in our consolidated financial statements.
Critical Accounting Estimates and Judgments
Our audited consolidated financial statements are prepared in conformity with IFRS. In preparing our audited consolidated financial statements, we make assumptions, judgments and estimates that can have a significant impact on amounts reported in our audited consolidated financial statements. We base our assumptions, judgments and estimates on historical experience and various other factors that we believe to be reasonable under the circumstances. Actual results could differ materially from these estimates under different assumptions or conditions. We regularly reevaluate our assumptions, judgments and estimates.
Our policies related to critical accounting estimates and judgments are detailed in notes 2.8 (Impairment of goodwill and long-term non-financial assets), 10 (Business combination), 17 (Shared-based payments), 18.2 (Post-employment benefits) and 19 (Contingent liabilities and deposits) to our audited consolidated financial statements included elsewhere in this prospectus and summarized below:
Impairment of goodwill and long-term non-financial assets
The value in use of an asset or group of assets is calculated based on a discounted cash flow model using pre-tax cash flow projections based on financial budgets approved by management covering a five-year period. Cash flows beyond the five-year period are extrapolated into perpetuity using the final year of the cash flow projections. The determination of the recoverable amount of an asset depends on certain key assumptions, which are influenced by the market, technological and economic conditions in force at the time of the impairment test, therefore it is impossible to determine whether impairments charges will occur in the future and, if they do, whether they will be material. The key assumptions for the first years of the model consider the inflation and the GDP growth of the region in which the assets are located together with our strategies and market opportunities. The key assumptions considered for the remaining years of the model are related to inflation, and the industry’s long term growth rate. The discount rate used is the weighted average cost of capital of the cash-generating unit, for which the key assumptions are: risk-free rate (the rate of return of an investment with no risk of loss), market risk premium (an excess return earned for an investment in the stock market over a risk-free rate) and inflation. Most of the assumptions are obtained from external sources of information. We perform annually a sensitivity analysis on the key assumptions used to conclude if impairment would result from a reasonably possible change in key assumptions. No impairment or reversal was recognized for the financial periods covered by the financial statements.
Business combination
Business combinations are accounted for using the acquisition method when control of a business is obtained by the Company. The consideration transferred in the acquisition is generally measured at fair value, as are the identifiable net assets acquired and liabilities assumed. Any goodwill that arises is tested annually for impairment. In measuring fair values, valuation techniques considering discounted cash flow method were used with the key inputs being market prices for similar items, the discount rate, long-term growth rate, inflation, among others. The discount rate is the most sensitive input to the model. The discount rate used is the weighted average cost of capital of the cash-generating unit, for which the key assumptions are: risk-free rate (the rate of return of an investment with no risk of loss), market risk premium (an excess return earned for an investment in the stock market over a risk-free rate) and inflation. Most of the assumptions are obtained from external sources of information or considered from historical data from the target Company to be acquired after due-diligence process.
Share-based payments (Stock Option Plan)
The fair value of share-based payment benefits at the grant date is recognized as employee benefit expenses with a corresponding increase in shareholders’ equity for the period in which employees unconditionally acquire the right to benefits. The amounts are recognized during the vesting period established for each program and should be reviewed by the end of each end of reporting period. The current program of Company is conditioned to the occurrence of a liquidity event defined in the program (non-market performance condition) and linked to a service condition as beneficiaries should be employed until the liquidity event.
In measuring the fair value of options as of the grant date, we used a binomial pricing model with a protective put structure, considering the terms, lock-up period and conditions upon which the options were granted is used. The key assumptions of the model are weighted average share price, exercise share price, risk-free interest rate, expected volatility, vesting period and dividend yield. The stock option plan expenses are accrued over the vesting period based on the Company’s best estimate of the vesting date and the number of equity instruments ultimately expected to vest that can change by the end of each reporting period. We present further details in note 18 to our unaudited interim condensed consolidated financial statements included elsewhere in this prospectus.
Post-employment benefits
The cost of defined benefit pension plans and other post-employment benefits and the present value of the pension obligation is determined using actuarial valuations. An actuarial valuation involves the use of various assumptions which may differ from actual results in the future. These include the determination of the discount rate, future salary increases, mortality rates and future pension increases. The defined benefit obligation is highly sensitive to changes in the discount rate. We perform annually a sensitivity analysis on the discount rate, as the most significant actuarial assumption, to conclude if defined benefit pension would result from a reasonably possible change on this assumption.
Contingent liabilities
Provisions for the judicial and administrative proceedings are recorded when the risk of loss of administrative or judicial proceeding is considered probable and the amounts can be reliably measured, based on the nature, complexity and history of lawsuits and the opinion of internal and external legal counsel. Provisions are made when the risk of loss of judicial or administrative proceedings is assessed as probable and the amounts involved can be measured with sufficient accuracy, based on best available information. They are fully or partially reversed when the obligations cease to exist or are reduced. Given the uncertainties arising from the proceedings, it is not practicable to determine the timing of any outflow (cash disbursement). Provisions are sensitive to changes in the estimates of outcomes to the Company’s judicial and administrative proceedings.
Recent Accounting Pronouncements
For information about recent accounting pronouncements that will apply to us in the near future, see note 3.3 to our unaudited interim condensed consolidated financial statements and note 2.2 to our audited consolidated financial statements, each included elsewhere in this prospectus.
Quantitative and Qualitative Disclosure About Market Risk
Risk Management Strategy
Our management has overall responsibility for the establishment and oversight of our risk management framework. Our board of directors has established the risk management committee, which is responsible for developing and monitoring our risk management policies. The committee reports to our board of directors on its activities.
Our risk management policies are established to identify and analyze the risks that we face, to set appropriate risk limits and controls and to monitor risks and adherence to limits. Risk management policies and systems are reviewed to reflect changes in market conditions and our activities. Our management, through its training, standards and procedures, aims to maintain a disciplined and constructive control environment.
Our hedging strategy primarily seeks to protect our cash flows from risks arising from exchange rate fluctuations on raw materials purchases. Accordingly, as of December 31, 2023, certain of our derivative financial instruments have been designated for hedge accounting, namely, four non-deliverable forwards, or NDFS, due in the months of January and February 2024.
See note 5 to our unaudited interim condensed consolidated financial statements and note 2.9 to our audited consolidated financial statements, each included elsewhere in this prospectus, for further information.
Market Risk
We consider market risk to be the potential loss arising from adverse changes in market rates and prices. The Company and its subsidiaries are exposed to market risks, chief of which are: (1) fair value and cash flow risks associated to interest rates; (2) foreign exchange risk; (3) credit risk; and (4) liquidity risk. In order to manage our market risks, we have adopted policies and procedures which establish limits and monitor risk exposure and counterparties and approve financial instruments. Risk and financial instrument management activities are carried out through the definition of strategies, establishment of control systems and determination of limits to exposure to market risks. We periodically review our exposure to market risks and determine at the senior management level how to manage and reduce the impact of these risks.
We use derivatives solely to manage market risk, especially commodity price and foreign exchange rate fluctuations. Although the value of these hedge instruments varies, these variations are usually offset by the value of the related hedged item. The parties to these agreements are financial institutions in the case of foreign exchange derivatives and interest rate swaps. We do not use derivatives or other hedge instruments for speculative purposes.
As a result, we do not believe that we are subject to any material credit risk arising from these contracts, and accordingly, we do not anticipate any material credit-related losses.
Interest Rate Risk
We have fixed and floating rate indebtedness and, therefore, we are exposed to market risk as a result of changes in interest rates (see “—Liquidity and Capital Resources—Indebtedness” for further information). Our interest rate risk refers to the impact of an increase in SOFR, the SELIC, the General Market Price Index (Índice Geral de Preços – Mercado), the National Consumer Price Index (Índice Nacional de Preços ao Consumidor Amplo) and the CDI rate on our financial results. The majority of our debt is U.S. dollar-denominated with variable interest rates, and most of our outstanding debt is linked to SOFR. We have a substantial amount of cash and cash equivalents in sweep accounts indexed to the Federal Funds Effective Rate, which provides a partial natural hedge to our interest rate exposure of our U.S. dollar-denominated debts.
The following table presents an analysis of sensitivity to interest rates (CDI, SOFR and SELIC, which drives the remaining Brazilian interest rates) as of June 30, 2024:
| | | | As of
June 30, 2024 | | | | 25 | % | | | 50 | % | | | -25 | % | | | -50 | % |
| | | | (in millions of reais) | |
| Cash and cash equivalents | | | 667.5 | | | | 53.2 | | | | 63.9 | | | | 31.9 | | | | 21.3 | |
| Marketable securities | | | 121.5 | | | | 10.0 | | | | 12.0 | | | | 6.0 | | | | 4.0 | |
| Restricted cash | | | 8.4 | | | | 0.5 | | | | 0.6 | | | | 0.3 | | | | 0.2 | |
| Derivative financial instruments | | | 806.2 | | | | (52.5 | ) | | | (100.4 | ) | | | 57.8 | | | | 121.6 | |
| Loans and borrowings | | | 3,261.0 | | | | (227.1 | ) | | | (261.7 | ) | | | (157.9 | ) | | | (123.3 | ) |
Foreign Currency Exchange Rate Risk
Foreign exchange risk is our exposure to fluctuations in currency exchange rates resulting from our commercial, operational, and financial relationships, and which may have an impact on our cash flows or results.
The main risk factors which may impact these amounts are the exposure to currency exchange rate fluctuations. The scenarios for these factors are prepared using market data and consider the average and maximum absolute monthly variation of the pool of currencies under analysis for the last twelve months, or LTM.
The sensitivity to a reasonably possible change in exchange rates for the main currencies to which we are exposed as of June 30, 2024 are presented below:
| | | | | Average LTM | | Maximum LTM |
| Changes in Foreign Exchange Rate | | Net exposure | | +2%(1) | | -2%(1) | | +7%(2) | | -7%(2) |
| | | (in millions of reais) |
| US$ | | | (392.4 | ) | | | (400.2 | ) | | | (384.5 | ) | | | (419.8 | ) | | | (364.9 | ) |
| € | | | 10.7 | | | | 10.9 | | | | 10.5 | | | | 11.4 | | | | 9.9 | |
| Kr$ | | | 0.0 | | | | 0.0 | | | | 0.0 | | | | 0.0 | | | | 0.0 | |
| Total as of June 30, 2024 | | | (381.6 | ) | | | (389.3 | ) | | | (374.0 | ) | | | (408.3 | ) | | | (354.9 | ) |
| (1) | The average variation in end exchange rate of Euro, US Dollar and Norwegian Krone for the last 12 months. |
| (2) | The maximum variation in end exchange rate of Euro, US Dollar and Norwegian Krone for the last 12 months. |
Credit Risk
Credit risk is the risk that a counterparty will not meet its obligations under a financial instrument or customer contract, leading to a financial loss. We are exposed to credit risk from our operating activities (primarily trade receivables) and from our investing activities, including deposits with banks and financial institutions, foreign exchange transactions and other financial instruments.
The limits on our exposure to each financial counterparty are determined by our financial policy.
Management periodically evaluates whether the credit risk on a financial instrument has increased significantly, considering reasonable and supportable information available, in order to compare the risk of a default occurring at the reporting date with the risk of a default occurring at initial recognition of the financial instrument. This evaluation considers the expected credit losses model and is built based on past history of uncollectable accounts and relevant prospective data.
The following financial assets are subject to the calculation of expected credit losses according to our accounting policy: (i) trade receivables; and (ii) financial assets measured at amortized cost.
The accounting policy for the impairment of trade receivables and the reconciliation of the expected credit losses are included in note 10 to our unaudited interim condensed consolidated financial statements and note 6 to our audited consolidated financial statements, each included elsewhere in this prospectus.
Liquidity Risk
Liquidity risk is managed based on our financial policy, which aims to ensure the availability of sufficient funds to honor our short-term commitments.
The table below analyzes our main financial liabilities by maturity, corresponding to the period remaining from the balance sheet date to the contractual maturity date. Derivative financial liabilities are considered in the analysis as their contractual maturities are essential to understand our cash flow in the short and medium terms. The outstanding principal and interest, if applicable, are shown at the maturity dates. In the case of fixed-rate liabilities, interest expense was calculated based on the rate established in each debt contract. Interest expense on floating-rate liabilities was calculated based on a market forecast for each period.
The amounts included in the table represent the undiscounted contractual future cash flows; these amounts may not reconcile directly with the amounts in the balance sheet.
| | | Up to 1 year | | 1 to 2 years | | 3 to 5 years | | Over 5 years | | As of
June 30, 2024 |
| | | (in millions of reais) |
| Trade payables | | | (1,845.8 | ) | | | — | | | | — | | | | — | | | | (1,845.8 | ) |
| Loans and borrowings | | | (939.8 | ) | | | (1,383.2 | ) | | | (1,049.0 | ) | | | — | | | | (3,372.0 | ) |
| Salaries and wages | | | (115.2 | ) | | | — | | | | — | | | | — | | | | (115.2 | ) |
| Derivative financial instruments | | | (36.6 | ) | | | (12.9 | ) | | | 84.6 | | | | — | | | | 35.1 | |
| Lease liabilities | | | (79.9 | ) | | | (57.7 | ) | | | (100.9 | ) | | | (29.9 | ) | | | (268.4 | ) |
| Payables to related parties | | | (21.1 | ) | | | (117.6 | ) | | | — | | | | — | | | | (138.6 | ) |
| Other financial liabilities | | | (0.6 | ) | | | — | | | | — | | | | — | | | | (0.6 | ) |
| Liquidity risk | | | (3,038.9 | ) | | | (1,571.4 | ) | | | (1,065.3 | ) | | | (29.9 | ) | | | (5,705.5 | ) |
Industry Overview
The information presented in this section has been derived from an industry report dated July 4, 2024 prepared by Kline & Company, Inc., or Kline, an independent research firm, to provide information regarding our industry and our market. We refer to the report as the “Kline Report.”
Lubricant products and related services are mission-critical for regular operations of a wide range of equipment, engines and machines and, while they represent a small amount within overall maintenance budgets, the impact of lubricants on customers is meaningful. Lubricants can reduce machinery downtime, improve output and production and extend lifetime. In addition, in many of their applications, lubricants are enablers of lower emissions and energy consumption, which in the current scope of higher environmental, social and governance standards can help customers to reduce their environmental impact and achieve regulatory compliance. The complexity of lubricant formulations is increasing as technology has evolved, and demand for tailored solutions that address issues across end markets has also increased.
Overview of Lubricants Market and Value Chain
The lubricants value chain spans several areas, including raw materials and base oils and additives production, formulation and blending, distribution and after-market services. The principal participants within this value chain are as follows:
| · | Base Oil Manufacturers: The vast majority of producers extract crude oil from refineries and supply raw materials downstream to lubricants manufacturers. |
| · | Additives Manufacturers: Develop and supply chemical compounds that impart desirable properties to base oils, improving the functionality of lubricants. |
| · | Lubricants Manufacturers: Blend base oils and additives sourced from upstream suppliers, and package and sell lubricants to distributors as well as to end customers. |
| · | Distributors: Supply a variety of products to end customers, adding value by providing technical support as well as developing and maintaining key customer relationships. |
Each of these value chain participants play a critical role in ensuring high-quality products and services are delivered in an orderly manner to intermediate and end customers. Some companies specialize in their role while others serve in a range of capacities, all contributing essential processes in the consumer, commercial and industrial segments. The investment required to provide high-grade products and services to a diversified range of customers has been one of the key drivers of industry consolidation and is likely to continue reshaping this highly fragmented industry.
Moove, operating across the lubricant manufacturing and intermediary distribution segments of the value chain, delivers a range of solutions to its customers with end-to-end visibility of their products and needs.
The image below illustrates the lubricants value chain:
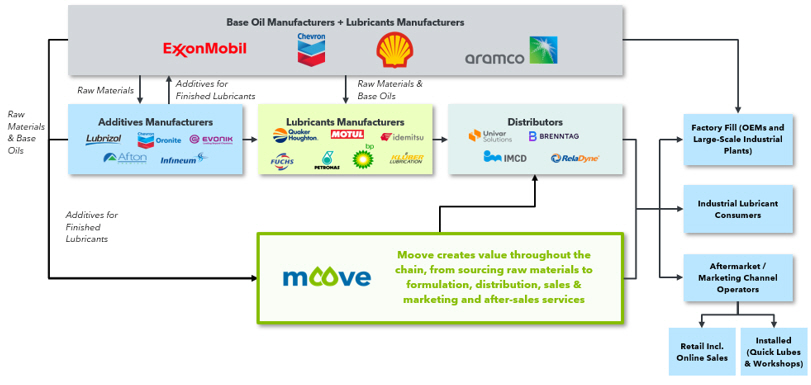
The primary raw material for lubricants is base oil, which can be derived from crude oil (mineral base oil), synthesized through chemical processes (synthetic base oil) or derived from biomass materials. Base oil selection depends on the desired properties of the final lubricant product. Premium lubricants are fully synthetic and semi-synthetic lubricants that address the most recent technology, equipment and machinery needs, delivering superior performance relative to conventional lubricants, which generally refer to lubricants formulated with mineral base oils. These synthetics require different specifications than conventional formulations and are typically more expensive and result in a higher quality product.
Lubricant product formulations are the main driver of competitive differentiation in the industry. Novel formulations can be achieved through three routes: (1) major base oil and lubricants manufacturers’ development of proprietary formulations, primarily to support novel technology needs of original equipment manufacturers, or OEM, as well as to meet evolving industry requirements and increasingly stringent standards; (2) additive manufacturers’ development of formulations that meet specific application requirements; and (3) blenders’ development of specific formulations with support from additive manufacturers to address specific customers’ needs.
Lubricant manufacturers then access formulations, blend base oils and additives sourced from various suppliers, and package and sell lubricants to distributors and end users. The focus on innovation across product and service quality allows independent multiregional lubricant blenders (such as Moove, Fuchs and Quaker Chemicals) to differentiate themselves by offering specialty applications driven by specific customer needs across diverse end markets. Several oil and gas companies that manufacture base oils also have lubricant manufacturing operations, benefiting from vertical integration with raw material supply and, in some cases, lubricant additives; however, they rarely compete on distribution and service as they operate under a different business model.
The key end customers of lubricant products, including industrial consumers, after-market workshops, service centers, vehicle fleet owners and individual vehicle owners, are primarily supplied through intermediary distribution channels. While direct sales from major base oil and lubricants manufacturers to OEMs and large-scale industrial plants also occur, they are limited in volume compared to intermediary distribution and aftermarket sales. Distributors serve several key functions, namely warehousing, storage, logistics and inventory management to ensure the correct quantities of lubricants are available as needed, as well as providing technical support for personalized service and maintaining key customer relationships to grow sales.
In direct sales channels, a few more sophisticated lubricant manufacturers such as Moove supply their products to end customers while also engaging in collaborative development of innovative products with superior performance that must meet strict application requirements. Through testing and optimizing techniques, these lubricant manufacturers have the capability to meet the growing demand for niche products with numerous product specifications.
In addition to supplying lubricants to end customers, distributors also supply products to the services channel that leverage partnerships with manufacturers and distributors to drive sales. These channels include installed operators like auto workshops that benefit from consumer tailwinds in “premiumization” and “do-it-for-me” instead of “do-it-yourself” approaches, as well as retail channels such as online sites that are adversely impacted by these trends.
Global Lubricants Market Outlook
The value of the global lubricants market is expected to grow at a 1.3% compound annual growth rate from 2023 to approximately US$184 billion in 2033 (at current retail prices), driven primarily by the increasing premiumization of the market through the penetration of synthetics and higher complexity in industrial and automotive (passenger and commercial) equipment. Due to these trends, premium lubricants are projected to achieve a market share of 52% by value globally by 2033 from 43% in 2023.
Demand for premium lubricants, encompassing greases, fluids, specialty products and base oils spanning the production and distribution chains, varies across the consumer, commercial and industrial segments. Specialized lubrication solutions and applications are increasingly sought after by various customers to enhance efficiency, performance and sustainability of equipment across sectors and automotive vehicles.
Global volumetric growth is projected to be relatively muted with a compound annual growth rate of 0.8% from 2023 to 2033, with emerging markets such as Southeast Asia, the Indian subcontinent, Africa and South America driving demand.
| Note: | Market size estimate is based on retail price paid by end customer. |
| Note: | Market size compound annual growth rate, or CAGR, is real growth rate and assumes prices for lubricants do not change over the next 10 years. |
Consumer Lubricants Market and Trends
The consumer lubricants market, which includes sales of passenger car motor oils, or PCMO, and two-stroke and four-stroke motorcycle engine lubricants, is expected to grow at a 0.8% CAGR from 2023 to approximately US$60 billion in 2033 according to the Kline Report. The report also indicates the market share of premium lubricants by value during 2023 was approximately 69% of the consumer lubricants market and is expected to reach 79% of the consumer lubricants market by 2033. Although demand for consumer lubricants is expected to stay volumetrically flat and is driven by electrification, the timing and degree of such impact is expected to vary by region as countries are at various stages of electric vehicle adoption.

| Note: | Market size estimate is based on retail price paid by end user. |
| Note: | Market size CAGR is real growth rate and assumes prices for lubricants do not change over the next 10 years. |
The consumer lubricants market is expected to benefit from increasing performance requirements leading to a shift to higher quality oils:
| · | Shift to Low Viscosity Synthetic Lubricants: Manufacturers of lubricants are increasingly moving toward lower viscosity synthetic lubricants (e.g., 0Ws and 5Ws) due to their superior performance, increased |
efficiency, extended life and better protection. This shift is largely influenced by advancements in internal combustion engine, or ICE, technologies that require lubricants capable of operating efficiently under more demanding conditions. As OEMs continue to innovate, the demand for these high-performance, low viscosity lubricants is expected to grow.
| · | Stringent Emission Regulations: Regulatory requirements for clean emissions and fuel efficiency promote the use of more advanced lubricants that help engines produce less emissions and run more efficiently. High-quality lubricants reduce engine wear, improve combustion efficiency and minimize the emission of harmful pollutants. As regulations become more rigorous, the demand for lubricants that can meet these new standards is expected to increase. |
| · | Expanding Aftermarket Services: Proliferation of car service centers and quick-lube stations has enhanced the accessibility and availability of various lubricants products. Additionally, consumers are holding on to their cars for longer periods, thereby supporting more regular vehicle maintenance and creating an increased interest for high-mileage engine oils. |
| · | OEM Recommendations: OEMs specify particular types of lubricants that are best suited to their vehicle models to ensure optimal performance and longevity. These recommendations often include synthetic and high-performance lubricants designed to meet the specific needs of modern ICE engines. |
| · | Growth in Emerging Markets: Rapid urbanization, growing disposable income, and improving living standards in China, India, Southeast Asia and South America are leading to increased vehicle ownership. This increase in car and motorcycle sales (the latter being particularly strong in South America) is expected to translate into higher demand for lubricants. Furthermore, the expanding middle class in these regions is more likely to invest in vehicle maintenance driving the consumption of premium lubricants. |
| · | Long Tail in ICEs: Despite the forecasted decline in internal combustion new car sales over the next two decades, the ICE fleet is expected to persist on the road as implied by ICE demand. Consumer lubricants are expected to have a long tail period before a meaningful impact from electric vehicles. |
| · | E-Fluids Sales: Although electric vehicles have fewer moving parts than ICE vehicles, they require highly specialized lubricants and coolants to ensure the efficient operation of electric drivetrains and batteries. Products tailored to the unique requirements of electric vehicles present a unique opportunity to capture position in a growing market. Dielectric fluids used for battery thermal management also presents a long-term opportunity as an attractive EV-related product. |
| · | Increased Demand for Motorcycle Oil, or MCO: Despite the decline in demand volume and market value of MCO post-2033, the increased penetration of electric vehicle two-wheelers and stringent emission norms being introduced across the world support the growing demand for MCO in the short- to mid-term. The demand in mature economies is skewed towards premium lubricants while the demand in development economies is driven by conventional lubricants. The increasing population of two-wheelers in developing countries, increased usage for two-wheelers for commercial transportation, increasing penetration of two-wheelers in rural and semi-urban areas and the shift towards higher cylinder capacity are positive factors underpinning the positive outlook for MCO. |
Commercial Lubricants Market and Trends
The commercial lubricants market, which includes sales of heavy duty motor oils, or HDMO, and high temperature heat transfer fluid, is expected to grow at a 1.6% CAGR from 2023 to reach approximately US$52 billion in 2033. During that time, the market share of premium lubricants is expected to grow from 24% to 40% of the commercial lubricants market by value. Unlike the consumer lubricants market, current market penetration of premium lubricants is low in the commercial market as fleet operators have prioritized higher viscosity HDMO for cost effectiveness; however, increasing emissions regulations impacting diesel engines are driving the shift to lower viscosity oils.
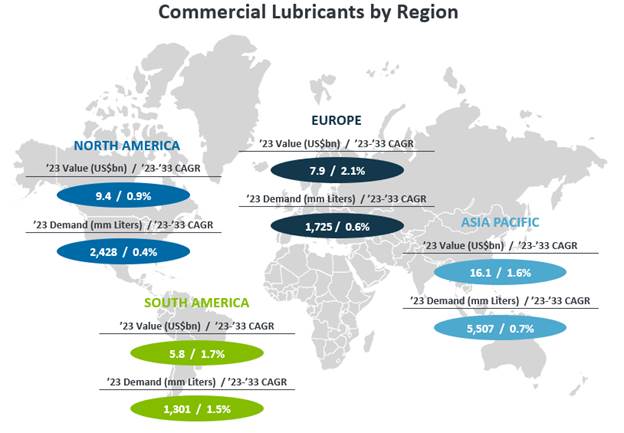
| Note: | Market size estimate is based on retail price paid by end user. |
| Note: | Market size CAGR is real growth rate and assumes prices for lubricants do not change over the next 10 years. |
The commercial lubricants market benefits from drivers similar to the consumer lubricants market, in addition to various secular trends specific to this market:
| · | HDMO Shift to Low Viscosity: HDMO, accounting for 65% of commercial lubricants demand in 2023, is moving towards higher consumption of low viscosity, premium grades of which are designed to provide improved fuel efficiency and lower emissions on commercial vehicles. Additionally, low viscosity oils offer better cold-start performance, crucial for heavy-duty vehicles operating in diverse climatic conditions. |
| · | Adoption of Sustainable Liquid Fuels: Faced with increasing regulations on emissions, several segments of the commercial market are expected to transition to sustainable liquid fuels in the long term as battery technology still lacks the maturity to support many heavy-duty applications and likely will be unable to be suitable for commercial applications such as aviation, maritime and long-haul heavy trucks. Sustainable |
liquid fuels, such as biodiesel and ethanol blends, necessitate the development of compatible lubricants to address issues such as increased acidity and oxidation stability to ensure engine protection and performance.
| · | Focus on Maintenance and Downtime Reduction: Fleet operators are prioritizing reducing maintenance costs and vehicle downtime to improve overall operational efficiency and profitability, driving demand for lubricants that extend service intervals while improving vehicle reliability. Additionally, fleet operators are investing in predictive maintenance that relies on digital capabilities to measure and enhance real-time fleet performance. This trend is expected to support high-quality lubricant providers elevating their offering using a solution-driven approach. |
Industrial Lubricants Market and Trends
The industrial lubricants market, which includes sales of lubricants such as hydraulic oils, process oils, metalworking fluids, industrial gear oils and industrial engine oils, is expected to grow at a 1.5% CAGR from 2023 to reach approximately US$73 billion in 2033. Similar to the automotive markets, high-quality synthetic lubricants are expected to take market share over the next decade, growing from 31% in 2023 to 38% in 2033 in value terms. Asia Pacific and South America are projected to be the fastest-growing regions in the industrial lubricants market in terms of value due to industrial expansion, particularly in countries such as China, India and Brazil. North America is the largest market in value as the region is home to an advanced manufacturing base using higher quality lubricants with optimized maintenance and fluid management patterns, which has resulted in lower lubricant consumption as a result of efficiency.
 |  |

| Note: | Market size estimate is based on retail price paid by end user. |
| Note: | Market size CAGR is real growth rate and assumes prices for lubricants do not change over the next 10 years. |
The global market for industrial lubricants is resilient, but highly complex as underlying industrial segments (such as machine shops and machinery, power generation, agriculture, construction, mining and steel mills) have varying sector-specific needs, often requiring high service levels and expertise.
The industrial lubricants market growth is supported by various secular trends:
| · | Adoption of Synthetic Lubricants: Industrial end customers are increasingly adopting synthetic lubricants due to superior performance against conventional lubricants, including thermal stability, oxidation resistance and viscosity control at high temperatures, resulting in improved throughput and extended equipment life. |
| · | Stringent Environmental Regulations: Tightening energy consumption standards in addition to regulatory requirements for biodegradability and lower toxicity of lubricants used in industrial operations are driving demand for advanced lubricants that allow manufacturers to meet these standards while maintaining operational efficiency and reducing overall cost. |
| · | More Complex Machinery: Modern industrial machinery and equipment are designed to operate at higher speeds and under more demanding conditions resulting in increased loads and placing heavier demand on the lubricant. |
| · | Growing Demand from Developing Countries: Increasing activity across a number of industrial sectors in emerging markets, in particular in Asia Pacific, is driving demand for industrial lubricants globally. |
Profit Pools Outlook Across the Lubricants Value Chain
The following chart illustrates the lubricants profit pools, or share of cumulative operating profit directly associated with operations within the lubricants supply chain, as well as the forecasted annualized growth rate for these profit pools from 2023 through 2033. Profit pools were determined through analysis of representative public companies serving each lubricants profit pool, with Kline determining historical figures by multiplying the global revenue pool for each sector, which is defined as global market size, by the respective normalized 2023 gross profit margin. Forecasted values were determined by estimating growth rates based on market segments as well as geographic distribution for both volume and value. It is important to note that the growth rates and forecasted values do not account for price inflation and represent “real” growth/change in the market, with 2023 serving as the base year.

The growth outlook for profit pools varies across the different segments of the lubricants ecosystem value chain. The share of profits earned at each position along the value chain is influenced by several factors, including the scale of operations, company cost structure, the ability to integrate operations, financial position and growth trends, among others.
Raw materials suppliers find themselves in a less attractive position due to marginal growth in lubricant volumes, which will impact the market size negatively. This effect is partially offset by pockets of growth in Asia and increasing global demand for high performance base stocks (such as synthetics). The profit pool size for raw materials suppliers tends to fluctuate annually, impacted by the dynamics of crude oil prices. An increase in crude oil prices leads to an increase in the operating profit margins of base oil manufacturers, while the opposite effect occurs as well.
Raw materials suppliers are predicted to see a marginal increase in the profit pool from US$8.5 billion in 2023 to US$8.6 billion in 2033. Base oils suppliers are expected to explore opportunities in the growing value of formulated products by expanding downstream through acquisitions, while novel base oils, such as bio-based and re-refined, offer additional growth avenues.
Conversely, the profit pool for lubricants manufacturers is forecast to grow at a 1.2% CAGR, increasing from US$10.8 billion in 2023 to US$12.2 billion in 2033, mainly driven by specialized multiregional players that are forecast to grow at a 3.2% CAGR over the same period. The adoption of higher-value premium lubricants and market consolidation are expected to be key drivers in the positive outlook for lubricant manufacturers; however, the scale of the participants will be critical in determining their prospects.
Multi-regional lubricants manufacturers are expected to grow significantly, driven by their footprint in resilient market segments, a differentiated business model and specialized capabilities allowing them to gain market share from smaller, local players and increasingly compete with international oil and gas companies. Regional champions are expected to further strengthen their position by leveraging their local knowledge and network to offer a suite of services catering to their customers’ needs. International oil and gas companies are expected to continue to grow their share of the lubricants manufacturers profit pool, supported by global scale, vertical integration and well-established brands. Smaller local players are likely to lose market share as they lack the scale and capabilities to continue to be relevant in an evolving industry. Process oil specialists mostly operate as commodity suppliers deeply integrated with specific applications reflecting local demand, are unlikely to outgrow the broader market.
Intermediary distributors and marketing operators are expected to experience similar levels of profit growth as lubricant manufacturers from 2023 to 2033 at CAGRs of 1.2% and 1.3%, respectively. The projected growth in the profit pool for intermediary distributors from US$2.2 billion in 2023 to US$2.5 billion in 2033 is a result of expected consolidation among distributors and the rise in high-scale, highly sophisticated players. Installed marketing operators are expected to perform strongly over the 2023 to 2033 time horizon, growing at a 1.9% CAGR from US$6.0 billion to US$7.2 billion as “do-it-for-me” trends prevail supporting workshops but are offset by retail operators’ declining CAGR of negative 1.3% from 2023 to 2033, shrinking the retail profit pool from US$1.5 billion to US$1.3 billion.
Regulatory Overview
Regulation in the United States and Europe
We operate to maintain compliance with various federal, provincial, state, and local laws and governmental regulations relating to the operation of our business, including those regarding employment and labor practices; workplace safety; building and zoning requirements; the handling, storage and disposal of hazardous substances contained in the products used in service, including used motor oil; and the ownership, construction and operation of real property, among others. We maintain policies and procedures to control risks and monitor compliance with applicable laws and regulations. These laws and regulations require us to obtain and comply with permits, registrations or other authorizations issued by governmental authorities. These authorities can modify or revoke our permits, registrations or other authorizations and can enforce compliance through fines, sanctions and injunctions.
We are also subject to regulation by various U.S. federal regulatory agencies and by the applicable regulatory authorities in locations where our products are marketed and our services are offered. Such regulations principally relate to the operation of our production and other facilities and the advertising and marketing of our products and services. We believe we comply, in all material respects, with laws, regulations, statutes and ordinances, including, but not limited to, those protecting the environment, as well as those related to the management and stewardship of chemicals. We have policies and procedures in place that establish regular reviews of our regulatory and environmental compliance and product stewardship, and actively monitor any significant existing or potential regulatory changes or environmental issues that could materially affect the company.
Environmental Regulation
Federal, state and local laws and regulations relating to the protection of the environment have a significant impact on how we conduct our businesses. In addition, our operations outside the United States are subject to the environmental laws of the countries in which they are located. These laws include regulation of air emissions and water discharges, waste handling, remediation and product inventory, registration and regulation. New laws and regulations may be enacted or adopted by various regulatory agencies globally. The costs of compliance with any new laws or regulations cannot be estimated until the manner in which they will be implemented has been more precisely defined. For information on Brazilian environmental regulation, see “—Regulation in Brazil—Environmental Regulation.”
Product Control, Registration and Inventory
In the United States, we are subject to various federal, state, and local environmental laws and regulations governing the storage, distribution, and transportation of lubricants and the operation of bulk storage facilities, as well as laws and regulations governing environmental protection, including those addressing the discharge of materials into the environment or otherwise relating to protection of the environment. Generally, these laws (i) regulate air and water quality, impose limitations on the discharge of pollutants and establish standards for the handling of solid and hazardous wastes; (ii) subject our operations to certain permitting and registration requirements; (iii) may result in the suspension or revocation of necessary permits, licenses and authorizations; (iv) impose substantial liabilities on us for pollution resulting from our operations; (v) require remedial measures to mitigate pollution from former or ongoing operations; and (vi) may result in the assessment of administrative, civil and criminal penalties for failure to comply with such laws. To that end, Moove Corp. has bulk storage tank registration in several states, including Pennsylvania, Kansas, Florida, Alabama and Maryland.
Elsewhere, many of our products and operations are subject to the chemical control laws of the countries in which they are located. These laws include regulation of chemical substances and inventories under the Registration, Evaluation and Authorization of Chemicals, or REACH regulation. Under the REACH regulation, additional testing requirements, documentation, risk assessments and registrations are occurring and will continue to occur and may adversely affect our costs of products produced in or imported into the EU. In addition, REACH regulation requires most of the substances in our products to be registered with the European Chemicals Agency. Under this legislation, we have to demonstrate that the substances we use in our products are safe for use and appropriate for their intended purposes in the EU. During this registration and continual evaluation process, we incur expenses to test and register substances we manufacture or import in the EU.
Moreover, following the end of the Brexit transition process, on January 11, 2021 the UK government introduced UK REACH regulations with the same registration requirements for substances produced in or imported into the UK. These registration-based regulatory regimes will result in increasing test expenses and registration fees to ensure our products remain compliant with the appropriate regulations and can continue to be sold in these markets.
Examples of other product control regulations include right to know laws under the Global Harmonized System for hazard communication, regulation of chemicals used in the manufacture of pharmaceuticals and personal care products and that contact food under the Framework Regulation in Europe and other product control requirements for chemical weapons, drug precursors and import/export. The Green Deal in the EU, specifically Chemicals Strategy for Sustainability, or CSS, will require additional information to be developed on hazard communication and risk assessment of both chemical substances and finished products. Similarly, EU Regulation No. 1272/2008 of 16 December 2008 on classification, labeling and packaging of substances and mixtures (“CLP Regulation”) sets various obligations with respect to the labeling and packaging of concerned substances and mixtures. New laws and regulations may be enacted or adopted by various regulatory agencies globally. The costs of compliance with any new laws or regulations cannot be estimated until the manner in which they will be implemented has been more precisely defined.
Remediation
We currently operate, and in the past have operated, various facilities at which, during the normal course of business, releases of hazardous substances have occurred. Additionally, we have known or alleged potential environmental liabilities at a number of third-party sites. Federal and state laws, including but not limited to the Resource Conservation and Recovery Act, or the RCRA, the Comprehensive Environmental Response, Compensation and Liability Act of 1980, or CERCLA, and various other remediation laws, require that contamination caused by hazardous substance releases be assessed and, if necessary, remediated to meet applicable standards. Some of these laws also provide for liability for related damage to natural resources and claims for alleged property and personal injury damage which can also arise related to contaminated sites. Laws in other jurisdictions in which we operate require that contamination caused by such releases at these sites be assessed and, if necessary, remediated to meet applicable standards.
Solid Waste
Our businesses are subject to various laws relating to and establishing standards for the management of hazardous and solid waste. In the United States, our facilities are subject to the RCRA and its regulations governing generators of hazardous waste. We have implemented systems to oversee compliance with the RCRA regulations, and our Wichita facility maintains a small quantity generator permit for disposing of hazardous waste. In addition to regulating current waste disposal practices, the RCRA also addresses the environmental effects of certain past waste disposal operations, the recycling of wastes and the storage of regulated substances in underground tanks. We have the remediation liability for certain facilities subject to these regulations. Other countries where we operate also have laws and regulations relating to hazardous and solid waste, and we have systems in place to oversee compliance.
Water
Our businesses maintain numerous discharge permits. The Clean Water Act established a control program for ensuring that communities have clean water by regulating the release of contaminants into waterways. Permits that limit the amounts of pollutants discharged are required for all wastewater dischargers under the National Pollutant Discharge Elimination System, or the NPDES, permit program. In accordance with the NPDES permit program, the implementing states set maximum discharge limits for wastewater effluents and overflows from wastewater collection systems. Discharges that exceed the limits specified under the NPDES permit program can lead to the imposition of penalties.
In the United States, such permits may be required by the National Pollutant Discharge Elimination System of the Clean Water Act and similar state programs. Several Moove Corp. facilities maintain National Pollutant Discharge Elimination System permits under the Clean Water Act. Other countries have similar laws and regulations requiring permits and controls relating to water discharge.
Climate Change and Related Regulatory Developments
We have been collecting energy use data and calculating greenhouse gas, or GHG, emissions for many years. We evaluate the physical and transitional risks and opportunities from both climate change and the anticipated GHG regulations to facilities, products and other business interests, as well as the strategies commonly considered by the industrial sector to reduce the potential impact of these risks. These risks are generally grouped as impacts from legislative, regulatory and international developments, impacts from business and investment trends and impacts to our assets from the physical effects of climate change.
North American, European and other regional regulatory developments (most notably the pending SEC and approved Corporate Sustainability Reporting Directive climate disclosure regulations) are monitored continuously for material impacts to our operations, and some facilities and subsidiaries are subject to promulgated rules. Proposed and pending climate legislation is monitored for impact and we are taking steps to strengthen climate reporting to meet anticipated disclosure requirements. Other requirements requiring additional product-level climate disclosures or supply chain transparency are also approved and in draft or finalized status and could impact the requirements for disclosure and restrictions on sourcing of raw materials. Regulations such as the polyfluoroalkyl substances restrictions and microplastics ban in the EU have potential business interruption impacts where they limit the type and availability of raw materials that may be used.
Given the ongoing regulatory and policy focus on climate change, business and investment trends are expected to drive an increase in the demand for products that improve energy efficiency, reduce energy use and increase the use of renewable resources. At this time, we cannot estimate the impact of this expected demand increase to our businesses. Physical effects from climate change have the potential to affect our assets in areas prone to sea level rise or extreme weather events much as they do the general public and other businesses. Due to the uncertainty of these matters, we cannot estimate the impact at this time of GHG-related developments on our operations or financial condition.
Consumer and Product Liability Regulations
We are subject to laws relating to information security, privacy, cashless payments and customer credit, protection and fraud. An increasing number of governments and industry groups have established data privacy laws and standards for the protection of personal information, including financial information (e.g., credit card numbers), social security numbers and health information.
Moreover, we operate in a number of domestic and foreign jurisdictions and are subject to various types of governmental regulation relating to use, labeling, packaging, storage and distribution of chemicals and hazardous substances. The development, manufacture and sale of lubricants involve an inherent risk of exposure to product liability claims, product recalls, product seizures and related adverse publicity. Such lubricant products are subject to rigorous specifications and quality standards, with an expectation from our customers around these strict requirements. A product liability claim, recall or judgment against us, or a customer complaint on product specifications, could also result in substantial and unexpected expenditures, affect consumer or customer confidence in our products and divert management’s attention from other responsibilities. Similarly, a product recall or a partially or completely uninsured product liability judgment against us could have a material adverse effect on our reputation, results of operations and financial condition.
Transportation Regulations
Transportation of Hazardous Materials
The transportation of hazardous materials is a significant part of our business and is regulated by the U.S. Department of Transportation under federal hazardous materials transportation law, or the FHMTL, and its implementing regulations, the hazardous materials regulations, or the HMR. The HMR regulate the handling of hazardous materials, hazardous wastes, hazardous substances and marine pollutants, and establish rules applicable to myriad aspects of the transportation process, including employee training, incident notification, labeling and placarding of shipments, shipment preparation, carriage of hazardous materials, emergency response and the development of safety and security plans. Several DOT agencies, including the Federal Railroad Administration and
the Federal Motor Carrier Safety Administration, share responsibility for enforcing the FHMTL. Moove Corp.’s commercial fleet must maintain an annual hazardous materials transportation certification under such regulations.
Certain international standards and regulations also govern the transportation of hazardous materials shipments within, to and from the United States. Such standards and regulations prescribe, among other things, requirements for packaging, maximum weight and handling of hazardous materials. U.S. agencies have sought to harmonize their rules with international standards and regulations, but when hazardous materials are transported to, from and within the U.S. in accordance with one or more of these international standards or regulations, U.S. HMR requirements must still be followed.
Our logistics activities include the transport of hazardous materials through highway transportation. The Transportation Security Administration requires any driver seeking to obtain, renew, or transfer a hazardous materials endorsement on a state-issued commercial driver’s license to undergo a security threat assessment. Moreover, per Moove Corp. policy, all applicants are subject to pre-employment drug and alcohol testing, and commercial drivers are subject to random testing per the U.S. Department of Transportation regulations.
Other Transportation Regulations
The International Registration Plan, or the IRP, is a cooperative registration agreement among all the states in the continental United States, the District of Columbia and Canadian Provinces. Moove Corp. participates in sharing of state registration fees during interstate travel under the IRP. Moreover, Moove Corp. pays International Fuel Tax Agreement taxes based on the cost of the fuel used in the commercial fleet under a program that shares the taxes across all jurisdictions where our fleet travels.
Occupational Health and Safety
We are subject to various laws and regulations relating to occupational health and safety, including the federal Occupational Safety and Health Act, as amended, and comparable state laws. These laws and regulations strictly govern the protection of the health and safety of employees. We maintain workers’ compensation insurance to cover us for costs and expenses we may incur due to injuries to our employees, but this insurance may not provide adequate coverage against potential liabilities.
In addition, OSHA’s hazard communication standard, the EPA’s community right-to-know regulations under Title III of CERCLA and the Emergency Planning and Community Right-to-Know Act of 1986, or the EPCRA, in addition to similar state statutes, require that we maintain information about hazardous materials used or produced in our operations and provide this information to employees, contractors, state and local government authorities and customers. For instance, the California Safe Drinking Water and Toxic Enforcement Act of 1986 (commonly known as Proposition 65) requires, with a few exceptions, that a specific warning appear on any consumer product sold in California that contains a substance, above certain levels, listed by that state as having been found to cause cancer or birth defects. This law exposes all lubricants producers to the possibility of having to provide warnings on their products.
Moreover, the EPCRA requires facilities manufacturing, processing or storing designated hazardous chemicals to report certain information about their products to state and local officials and fire departments. These reporting obligations are intended to assist state and local governments in developing emergency response plans in the case of a chemical release and to provide information to the public regarding the type and amount of toxic or hazardous chemicals stored at a particular facility. In addition, facilities releasing toxic chemicals into the environment above certain thresholds must report such releases to the EPA as part of the facilities’ “Toxics Release Inventory.” Because our facilities in Wichita and Indianapolis handle hazardous chemicals, we are subject to the reporting requirements under the EPCRA.
We maintain safety and training programs for service providers as part of our ongoing efforts to ensure compliance with applicable laws and regulations. We conduct periodic audits of Process Safety Management, or PSM, systems at each of our locations subject to the PSM standard. Our compliance with applicable health and safety laws and regulations has required, and continues to require, substantial expenditures. Changes in occupational safety and health laws and regulations or a finding of non-compliance with current laws and regulations could result
in additional capital expenditures or operating expenses, as well as civil penalties and, in the event of a serious injury or fatality, criminal charges.
Data Protection and Privacy
We receive, maintain, transmit, store and otherwise process proprietary, sensitive and confidential data, including public and nonpublic personal information of our customers, employees, counterparties and other third parties, including, but not limited to, personally identifiable information and personal financial information. The collection, sharing, use, retention, disclosure, protection, transfer and other processing of this information is governed by stringent federal, state, local and foreign laws, rules, regulations and standards, and the regulatory framework for data privacy and cybersecurity is in considerable flux and evolving rapidly. As data privacy and cybersecurity risks for banking organizations and the broader financial system have significantly increased in recent years, data privacy and cybersecurity issues have become the subject of increasing legislative and regulatory focus. Internationally, virtually every jurisdiction in which we operate has established its own data privacy and cybersecurity legal framework with which we must comply.
In the United States, federal, state and local governments have enacted numerous data privacy and security laws, including data breach notification laws, personal data privacy laws, and consumer protection laws (e.g., Section 5 of the Federal Trade Commission Act), and other similar laws (e.g., wiretapping laws). For example, the California Consumer Privacy Act of 2018, or the CCPA, imposes obligations on businesses to which it applies, such as providing specific disclosures in privacy notices and affording California residents certain rights related to their personal data, and applies to personal information of consumers, business representatives and employees who are California residents. The CCPA provides for civil penalties of up to US$7,500 per violation and allows private litigants affected by certain data breaches to recover significant statutory damages. In addition, the California Privacy Rights Act of 2020, or the CPRA, effective January 1, 2023, expands the CCPA, including by establishing a new California Privacy Protection Agency to implement and enforce the CPRA and adding a new right for individuals to correct their personal information. Other states have also enacted data privacy laws, including Virginia and Colorado. In addition, data privacy and security laws have been proposed at the federal, state and local levels in recent years, which could further complicate compliance efforts.
For example, on May 25, 2018, the Regulation (EU) 2016/279 of the European Parliament and of the Council of April 27, 2016, on the protection of natural persons with regard to the processing of personal data and on the free movement of such data (the General Data Protection Regulation, or the GDPR) became directly applicable in all member states of the EU. Additionally, following the UK’s withdrawal from the EU, we also are subject to the UK General Data Protection Regulation, or the UK GDPR (i.e., a version of the GDPR as implemented into UK law). Although a number of basic existing principles have remained the same, the GDPR and UK GDPR introduced extensive new obligations on both data controllers and processors, as well as rights for data subjects. The GDPR and UK GDPR, together with national legislation, regulations and guidelines of the EU member states and the UK governing the processing of personal data, impose strict obligations and restrictions on the ability to collect, use, retain, protect, disclose, transfer and otherwise process personal data. In particular, the GDPR and UK GDPR include obligations and restrictions concerning the security and confidentiality of personal data, such as obtaining consent from the individuals to whom the personal data relates for certain processing activities, using safeguards on transfers of personal data out of the EEA and the UK, respectively, and making notifications with respect to certain security breaches, among others. The GDPR and the UK GDPR also impose significant fines and penalties for non-compliance of up to the higher of 4% of annual worldwide turnover or EUR 20 million (or GBP 17.5 million under the UK GDPR) and, for other specified infringements, fines and penalties of up to the higher of 2% of annual worldwide turnover or EUR 10 million (or GBP 8.7 million under the UK GDPR). European data protection authorities have already imposed fines for GDPR violations up to, in some cases, hundreds of millions of euros. While the UK GDPR currently imposes substantially the same obligations as the GDPR, the UK GDPR will not automatically incorporate changes to the GDPR going forward (which would need to be specifically incorporated by the UK government). Moreover, the UK government has publicly announced plans to reform the UK GDPR in ways that, if formalized, are likely to deviate from the GDPR, all of which creates a risk of divergent parallel regimes and related uncertainty, along with the potential for increased compliance costs and risks for affected businesses.
The implementation of the GDPR, UK GDPR and other data protection regimes has required substantial amendments to our procedures and policies. The changes have impacted, and could further adversely impact, our business by increasing our operational and compliance costs. We expect the number of jurisdictions adopting their
own data privacy and cybersecurity laws to increase, which will likely require us to devote additional significant operational resources for our compliance efforts and incur additional significant expenses. This legal environment is also likely to increase our exposure to risk of claims alleging non-compliance with all applicable data privacy and cybersecurity laws, rules, regulations and standards.
Regulation in Brazil
Regulation of the Oil and Gas Industry
The ANP is a federal agency responsible for the control, supervision and implementation of the government’s oil, gas and biofuel regulations. The ANP regulates all aspects of the production, distribution and sale of oil, natural gas and biofuel products in Brazil. With respect to regulation relating to gasoline, diesel and biofuels, the ANP determines: (i) standards and restrictions applicable to the companies which it regulates; (ii) the product quality standards and minimum storage capacities required to be maintained by regulated agents; (iii) the limits of fuel and biofuels volume purchased by certain agents based on their storage capacity; and (iv) the criteria applicable to the authorization for the construction, operation and usage of the infrastructure used to handle and store fuels and biofuels. The ANP is also responsible for regulating multiple activities involving lubricants, including import and export and registration of products. The performance of any activity without the proper authorization may expose the infringing party to penalties that vary from fines to the inability to carry out business. These penalties may be applied cumulatively and tend to be more severe depending on the economic capacity of the party and recidivism.
Environmental health and safety standards
Fuel distributors are subject to Brazilian federal, state and municipal laws and regulations relating to environmental protection, safety, and occupational health and safety licensing by fire departments, environment and transport authorities. The National Environmental Council (Conselho Nacional do Meio Ambiente), or CONAMA, is the main government body responsible for issuing environmental standards and regulations at the federal level. The Brazilian Institute of Environment and Renewable Natural Resources (Instituto Brasileiro do Meio Ambiente e dos Recursos Naturais Renováveis) also issues environmental regulations at the federal level. State agencies and municipal departments are responsible for establishing and supervising complementary laws and regulations within their areas of operation, according to Federal Supplementary Law No. 140/2011.
Fuel distributors must obtain authorizations and/or licenses from federal, state and/or municipal environmental agencies, regulatory agencies, police and fire departments to implement and operate their facilities and are subject to extensive registration and operational requirements resulting in certain limitations to, among others: (i) the distribution of liquid fuels; (ii) the distribution of aviation fuels; (iii) liquid and aviation fuels storage; (iv) liquid products storage and handling; and (v) ethanol production. Furthermore, fuel distributors are required to develop programs to control air, soil and water pollution, including the management of hazardous waste.
Port Regulation
The Brazilian port sector is regulated by (1) the Brazilian Ministry of Ports and Airports (Ministério de Portos e Aeroportos), (2) the National Water Transportation Agency (Agência Nacional de Transportes Aquaviários), or the ANTAQ, which is currently linked to the Ministry of Ports and Airports, (3) the National Secretariat of Ports (Secretaria Nacional de Portos), or the SNP, which is also linked to the Ministry of Ports and Airports, and (4) local port authorities. Since 2012, the Brazilian port sector has undergone a number of regulatory changes, including the enactment of Federal Law No. 12,815/2013, as amended (regulated by Decree No. 8,033/2013, as amended). One of the most important changes brought about by this new regulatory framework is the abolition of the distinction between “own cargo” and “third-party cargo” for the development and operation of private use terminals, or TUPs, which are terminals located outside of “organized” ports (i.e. public ports, managed by authorities or a concessionaire). Authorizations to operate TUPs are granted by “authorizations” preceded by public calls (chamadas públicas) or public announcements (anúncios públicos) and, as applicable, a public bidding procedure. Authorizations to operate terminals inside organized ports are granted pursuant to lease agreements, the execution of which are preceded by public bidding procedures.
Data Protection and Privacy
On September 18, 2020, the LGPD came into effect to regulate the processing of personal data in Brazil. The LGPD establishes general principles, obligations and detailed rules to be observed by individuals or public or private companies in operations involving the processing of personal data. It has a wide scope of applicability and extends to individuals and public and private entities, regardless of the country where they are headquartered or where the data is hosted, as long as (i) the data processing occurs in Brazil, (ii) the data processing activity is intended to offer or provide goods or services to or process data from individuals located in Brazil or (iii) data subjects are located in Brazil at the time their personal data is collected. Processing activities include the collection, use, processing and storage of personal data, affecting all economic sectors, including the relationship between customers and suppliers of goods and services, employees and employers, and other relationships in which personal data is processed, whether in a digital or physical environment. The LGPD provides for, among other things, the rights of data subjects, the legal bases applicable to the processing of personal data, the requirements to obtain consent, the obligations and requirements related to security incidents and data breaches, and transfers of data, as well as the creation of the ANPD, which is responsible for inspection, promotion, disclosure, regulation, the establishment of guidelines and application of the LGPD.
In case of noncompliance with the LGPD, we can be subject to administrative sanctions applicable by the ANPD on an isolated or cumulative basis. These sanctions, which came into effect on August 1, 2021, can range from a warning, obligation to disclose incidents, temporary blocking and/or elimination of personal data related to the infraction, a simple fine of up to 2.0% of our revenue, or revenue of the company or group of companies in Brazil for the last fiscal year, excluding taxes, up to the aggregate amount of R$50.0 million per violation, a daily fine, up to the aforementioned global limit, suspension of the operation of the database related to the infraction for a maximum period of six months, which can be extended for an equal period, up to the regularization of the processing by the controlling shareholder, suspension of activities related to processing of personal data related to the infraction for a period of six months, which can be extended for an equal period, and partial or total prohibition to exercise activities related to data processing.
The administrative sanctions set forth in the LGPD do not prevent the imposition of administrative sanctions set forth by other laws that address issues related to data privacy and protection, such as the Brazilian Code of Consumer Defense and the Brazilian Civil Rights Framework for the Internet. These administrative sanctions can be applied by other public authorities, such as public prosecutors and consumer protection agencies. We can also be subject to civil liabilities for violation of these laws. In addition to the administrative sanctions due to non-compliance with the obligations established by the LGPD, we can be held liable for individual or collective material damages, and non-material damages caused to holders of personal data, including when caused by service providers, including software-as-a-service partners, that serve as processors of personal data on our behalf.
Although we do not believe that compliance with these laws and regulations will have a material adverse effect on our business, financial condition or results of operations, the enactment of new data protection and privacy laws and regulations may increasingly affect the operation of our business, directly and indirectly, which could result in substantial regulatory compliance costs, litigation expense, adverse publicity, the loss of revenue, and decreased profitability. To this end, we have taken steps towards compliance with the LGPD through the year ended December 31, 2023 and intend to continue to take complementary actions toward fully complying with the LGPD in 2024.
For more information, see “Risk Factors—Risks Relating to Our Business and Industry—Our business is subject to a number of laws and regulations in various jurisdictions governing data privacy and security.”
Anti-Corruption and Sanctions
We are subject to anti-corruption, anti-bribery, anti-money laundering and sanction laws and regulations, including the Brazilian Anti-Corruption Act. Such act prohibits corporations and individuals from engaging in improper activities to obtain or retain business or to influence a person working in an official capacity. Additionally, this act prohibits, among other things, providing, directly or indirectly, anything of value to any foreign government official, or any political party or official thereof, or candidate for political influence to improperly influence such a person.
For more information, see “Risk Factors—Risks Relating to Our Business and Industry—Failure to comply with the anti-corruption, anti-bribery, anti-money laundering and other international trade laws and regulations could negatively impact our reputation and results of operations.”
Environmental Regulation
General overview and environmental liability
Brazil has extensive federal, state and municipal laws and regulations concerning environmental protection, which impose various environmental obligations. These include obtaining environmental permits, complying with the technical conditions set forth in such permits and adhering to standards for air emissions, discharge of effluents and management of solid waste. Additionally, there are regulations for the protection of legal reserves, indigenous lands, traditional community areas, conservation units, artistic, historical, cultural, and archaeological sites, permanent preservation areas, and endangered species and requirements for authorizations for the use of water and controlled products, as well as for vegetation removal. Other regulations, registers, permits, licenses, authorizations and impoundments may apply to specific activities.
Failure to comply with these laws and regulations, including obtaining, maintaining and/or renewing environmental licenses and complying with their conditions, may subject the violator to administrative and criminal penalties, regardless of the obligation to redress occasional damages.
Federal Law No. 9,605/98 and Federal Decree No. 6,514/2008 set forth that all actions or omissions violating the legal rules for environment use, enjoyment, promotion, protection, and recovery are deemed an administrative infraction, regardless of the existence of actual environmental damage. Such legislation also indicates specific types of conduct that are deemed administrative infractions and asserts the applicable penalties. These may include warnings, fines of up to R$50.0 million (for worst case scenarios), seizure of areas (embargoes), interruptions of activities and the withdrawal of tax incentives and benefits.
Criminal liability may arise depending on whether there was willful misconduct or gross negligence in the unlawful conduct of the agent, provided by Federal Law No. 9,605/98. Pursuant to Brazilian law, both natural and legal persons can be subject to criminal liability. Individuals responsible for the decisions that resulted in the criminal conduct (such as directors, officers, administrators, board members, members of technical committees, auditors, managers, agents or representatives) may also be penalized to the extent of their culpability. Criminal sanctions for individuals may include imprisonment, which can be replaced by right-restrictive penalties such as community service and/or fines. For legal entities, the criminal sanctions may include fines, community services, dissolution or certain restrictions of rights.
Regarding civil liability, Brazilian environmental law adopts a joint, several and strict liability system for environmental damages, which makes the polluter liable regardless of fault or intentional misconduct, requiring only the existence of a causal link between the polluter and the damage. According to Federal Law No. 6,938/1981, all those who somehow contribute to the occurrence of the environmental damage, directly or indirectly, will be held liable, regardless of their level of participation in the damage. Each of those involved may be held liable for the full extent of the damage but will then be entitled to file a recourse action against the other responsible parties. The engagement of outsourced service providers, such as waste disposal service providers, does not exempt one from being held liable for potential environmental damages caused by such providers, including damage to third parties. There is no statute of limitations for claims seeking compensation for environmental damages. Public attorneys’ offices, foundations, state agencies, state-owned companies and environmental protection associations are authorized by law to file public civil actions seeking indemnification and/or reparation of environmental damages.
Environmental licensing
Several of the activities we perform are considered potentially polluting and are, therefore, subject to the environmental licensing procedure. The Brazilian Federal Constitution grants the federal government, state governments and municipalities the power to enact environmental protection laws, issue regulations under such laws and inspect activities to ensure compliance. The environmental licensing procedure is conducted by a single authority (federal, state or municipal environmental agency).
Federal Law No. 6,938/1981 requires the issuance of environmental licenses to ensure the feasibility and regularity of potentially polluting activities or activities that use natural resources. The criteria for environmental licensing are defined and regulated by CONAMA, particularly through Resolution No. 237/1997, which is responsible for issuing rules and resolutions on environmental licensing at a national level, and by Complementary Law No. 140/2011. CONAMA Resolution No. 237/1997 and Complementary Law No. 140/2011 establish that the government may issue three types of licenses:
| · | Preliminary License (Licença Prévia, or LP): Issued during the preliminary phase of the project or activity, approving its location and design, certifying the environmental feasibility and establishing the basic requirements and conditions to be met during the subsequent stages of implementation. |
| · | Installation License (Licença de Instalação, or LI): authorizes the construction of the project or activity in accordance with the specifications set forth in the plans, programs and projects approved by the relevant authority, including environmental control measures and other conditions. |
| · | Operation License (Licença de Operação, or LO): authorizes the operation of the activity or project upon verification of compliance with the previous licenses, environmental control measures and conditions specified for the operation. |
Such licenses have an expiration date and, pursuant to the applicable regulations, the renewal of environmental licenses must generally be requested within 120 days prior to their respective expiration dates. If the renewal of a license is timely requested, its effectiveness is automatically extended until the issuance of a final opinion by the environmental agency on that request. Conversely, if the request is untimely, the license will be deemed to have expired. Moreover, the validity of licenses depends on compliance with the technical conditions established by the competent environmental agency, which are included in the relevant licenses.
Federal Law No. 9,985/2000 regulates the National System of Conservation Units (Sistema Nacional de Unidades de Conservação). According to this law and Federal Decrees No. 4,340/2002 and No. 6,848/2009, certain activities deemed to cause an actual or potential significant environmental impact (i.e., those that depend on an environmental impact assessment and respective environmental impact report) must pay a certain amount to maintain or restore conservation units. This amount will be calculated by the licensing authority, based on the impact caused by each activity, according to a specific formula, and can range up to 0.5% of the total cost of the investment made for the installation of the project, which does not include the amount related to the implementation and adoption of environmental programs and plans necessary to mitigate environmental damage.
The lack of environmental licenses to construct, implement, operate, expand or enlarge an enterprise or activity that causes significant environmental impact subjects the wrongdoers to criminal and administrative sanctions, despite the legal obligation to remedy the eventual damages caused. In the administrative sphere, the federal rules in force authorize the imposition of fines ranging from R$500 to R$10.0 million, in addition to other penalties such as warnings, embargoes or suspension of activities, according to Federal Decree No. 6,514/2008. These sanctions also apply if the entrepreneur fails to comply with the technical conditions established in the related environmental license.
Registry of Potentially Polluting Activities
Several of the activities we perform require us to register with the Technical Federal Registry of Potentially Polluting Activities (Cadastro Técnico Federal de Atividades Potencialmente Poluidoras e/ou Utilizadoras de Recursos Ambientais, or the CTF/APP). The activities that are subject to enrollment before IBAMA in the CTF/APP are listed in IBAMA’s Normative Instruction No. 13/2021. Potentially polluting activities, such as several activities we perform, require the payment of an amount to IBAMA, prior to the last day of each quarter, i.e., the environmental inspection and control fee (Taxa de Controle e Fiscalização Ambiental, or the TCFA), which varies depending on the size/polluting potential of the company. The TCFA is paid for the control and inspection of the potentially polluting activities and of the activities that use natural resources. In case of failure to comply with the payment obligation, TCFA may be charged along with surcharges. In addition, failure to register with IBAMA in the CTF/APP may subject the offender to fines from R$50 to R$9,000, as per article 76 of Federal Decree No. 6,514/2008.
Natural people and legal entities that develop such potentially polluting activities shall also submit to IBAMA, by March 31 of each year, the annual report on activities carried out in the previous year. Failure to present the annual activities report before March 31 of every year could subject us to fines equal to 20% of the TCFA due, according to Federal Law No. 6,938/1981.
Use of Water
We use water from rivers and artesian wells and, therefore, are bound to comply with applicable legislation, especially Federal Law No. 9,433/1997, which established the national policy on use of water resources. Under state regulations, to impound water from rivers or artesian wells and discharge effluents into water bodies, we must hold specific permits (outorgas) issued by federal or state environmental agencies, as well as comply with applicable parameters and standards.
Like environmental licenses, water permits usually have an expiry date and must be periodically renewed. There is a risk that we might not be able to obtain all necessary permits or renew our permits in a timely manner.
Federal Law No. 9,433/1997 establishes that the use of water resources without due authorization may subject wrongdoers to penalties such as warnings, seizure of areas (embargo) and fines, which may range from R$100.0 to R$50.0 million.
Controlled substances
Certain laws and regulations require us to obtain permits, licenses and certificates from governmental authorities to use controlled substances in our activities. Decree No. 10,030/2019 regulates the Brazilian Army’s control over explosive substances and mandates that those who manufacture, store or sell such substances must obtain a registration certificate, which must be periodically renewed. Ordinance No. 204, dated October 21, 2022, regulates procedures for control and supervision on the use of chemical substances subject to control by the Federal Police Department (Department de Polícia Federal), which require the attainment of applicable certificates that must be periodically renewed. State legislation empowers each state’s respective Civil Police (Polícia Civil) to grant licenses for the use, storage, marketing, importation and exportation of certain chemical products, typically consisting of an inspection certificate and an operating license.
Noncompliance with the applicable regulations concerning controlled substances can result in warnings, fines, interdictions, apprehension of products and suspension or cancellation of the corresponding certificates and licenses. Failure to comply with these laws and regulations may also lead to civil and criminal repercussions.
Air Emissions
The applicable standards for air emissions are defined by different Brazilian federal, state and municipal rules. It is also worth noting that, regarding environmental legislation, it is expected that the legal provisions will become progressively stricter, especially in the context of intensification of discussions on climate change, requirements from stakeholders and climate litigation. In addition, considering the potential creation of a regulated carbon market in Brazil, it is possible that new obligations will be established for our sector regarding greenhouse gases emissions.
Irregularities may result in fines ranging from R$5,000 to R$50.0 million, warnings, embargoes on activities, and partial or total suspension of activities (per articles 2 and 62, item II, of Federal Decree No. 6,514/2008) and the obligation to redress occasional damages.
If air emissions arising from our activities cause damages at levels that result or may result in harm to human health or that cause the death of animals or significant destruction of flora, prosecutors may also initiate a police investigation and hold the company and its officers liable in the criminal sphere.
Solid Waste Management and Take-Back Policies (Logística Reversa)
Federal Law No. 12,305/2010 instituted the national solid waste policy to ensure environmentally friendly integrated management of solid waste by establishing the correct segregation, storage, transportation, destination and final disposal of such waste.
Failure to implement the necessary measures for the management of solid waste generated (including the drafting and implementation of the Solid Waste Management Plan, or PGRS) by our activities may lead to administrative and criminal sanctions, regardless of the obligation to redress any environmental damages caused in the civil sphere.
Liabilities are also applicable in the case of inadequate management of solid waste (which may result in the occurrence of pollution and/or environmental damage). In the event an environmental accident is caused by third parties or service providers involving the waste generated by Moove or occurring at its sites, we may be held jointly and severally liable with the third parties or service providers for remediation and indemnification measures. According to Federal Decree No. 6,514/2008, administrative sanctions, such as penalties of a fine up to R$50.0 million (depending on the severity of the infraction and the economic capacity of the wrongdoer) and partial or total suspension of activities may be applied.
In addition, Federal Law No. 9,605/1998 determines that handling, packing, storing, collecting, transporting, reusing, recycling or providing a final destination to hazardous waste without compliance to the law is an environmental crime.
At last, occasional contamination of soil, water bodies and groundwater due to inadequate management of solid waste may entail the adoption of measures for the management of contaminated areas (which are usually time-consuming and involve significant costs).
It is also worth noting that Federal Law No. 12,305/2010 also mandates that manufacturers, importers, distributors and traders of certain products implement and execute a take-back policy (política de logística reversa). The take-back policy is an instrument of economic and social development that comprises a set of actions, procedures and means aiming to enable the collection and restitution of solid waste to the corporate sector, for its reuse or final disposal.
The implementation and execution of take-back systems are already mandatory at the federal level for all those involved in the production chain of lubricating oils, plastic packaging of lubricating oils, lamps, packaging in general, electronic products, medicine, tires, pesticides’ packages and batteries. Irregularities in this area may result in administrative sanctions, such as fines ranging from R$5,000.0 to R$50.0 million, as well as in difficulties or impossibility in obtaining environmental licenses.
Miscellaneous
Our Brazilian operations are subject to several other environmental laws and regulations regarding the impact of our activities on natural resources, relating to themes such as biodiversity, vegetation, solid waste management (including generation, storage, handling, use, transportation and discharge of hazardous materials into the ground, air and water) and contamination, among others.
Other Regulation
Our non-U.S. sales are subject to both U.S. and non-U.S. governmental regulations and procurement policies and practices, including regulations relating to import-export control, tariffs, investment, exchange controls, anti-corruption and repatriation of earnings. Non-U.S. sales are also subject to varying currency, political and economic risks.
Business
Overview
Moove is a global lubricants solutions provider. We specialize in the formulation, manufacturing, distribution, marketing, selling and servicing of lubricant products across a diverse range of end markets and customers. We offer a comprehensive portfolio of products and technical support that is highly tailored to our end markets, while optimizing our cost base, physical footprint and working capital needs to drive unit profitability and cash flow generation.
Lubricants are everywhere. We operate in a complex and dynamic market that is critical to the customers we serve, across industrial, commercial and consumer segments. Our customers’ needs are constantly evolving as technology continues to influence the requirements for, and applications of, lubricants. While our products generally represent a small component of our customers’ total running costs, they are crucial to driving efficiencies and maintaining operations, establishing a clear need in the market for our capabilities.
Our business was formed following Cosan’s acquisition of ExxonMobil’s Brazilian lubricant manufacturing and distribution assets in 2008. We have diversified the business significantly over more than 15 years—across suppliers, customers, end markets and geographies—and have maintained and strengthened a highly strategic alliance with ExxonMobil that drives mutual value creation. ExxonMobil’s brand, premium research and development capabilities, proprietary product technology and base oils production are important factors to our marketing strategy and supply chain. We believe that our market intelligence, efficient operations, market know-how and close physical proximity to customers make us a powerful partner of choice for them.
We have pursued a growth-oriented strategy with an intentional focus on lubricants, distinguishing us from other scaled market participants. Our expertise in sourcing, insights into market prices and deep knowledge across the supply chain truly differentiate our model, allowing us to access and optimize raw materials to formulate high-performance products at a lower cost. Furthermore, we believe that our service-oriented and high-touch approach with our customers has strengthened our position with our core clients. Our capabilities and relationships, along with our corporate culture centered around high-performance teams to drive efficiency and business expansion, have translated into margin expansion at the unit level and high cash return on the capital investments we make.
We operate a model requiring low levels of capital expenditures (our total capital expenditures as a percentage of revenue amounted to 1.8%, 1.7%, 1.9%, 1.2% and 0.7% for the six months ended June 30, 2024 and 2023 and for the years ended December 31, 2023, 2022 and 2021, respectively),focused on cost-effective formulation, manufacturing, logistics and services. In contrast, the production of raw materials such as base oils, which is not in our scope, requires intensive capital investments and other capabilities, resulting in a different scale and margin profile within our industry. We believe that our model underpins our ROIC and allows us to optimize our cost base and capital expenditures to support our profitability, Adjusted EBITDA Margin and cash flow generation as we scale and penetrate a market.
The ongoing industry-wide mix shift into premium products that require more technical know-how also provides a meaningful tailwind for our business. We believe we have a competitive advantage in the formulation and supply of these products and have consistently grown at a significantly higher rate than the broader lubricants market. Importantly, our profit pool is only partially influenced by end market volumes.
Our Culture
As a multinational company focused on lubricant solutions, our success has been enabled by defining, in 2017, a clear strategy and culture focused on performance, efficiency and business expansion. We intentionally consolidated a culture that values people as our biggest asset and empowers us to achieve high performance. We engaged in a collaborative effort, together with our leaders, to cultivate and enhance our people’s development and performance.
Our teams are driven by a continuous improvement mindset and have high execution capabilities. Our way of working, driven by “Moove attitudes,” fosters high performance teams, trust and a strong alignment between business areas. It has enabled an adaptable, flexible and agile organization, overseen by a deeply experienced senior leadership and operating team.

Our strategic priorities are intentionally designed to be transferable across all markets in which we operate, enabling our business to grow both organically and inorganically. We believe that our expected behaviors, which we refer to as the “Moove attitudes,” are conducive to high performance at both the senior leadership level and throughout the entire business.
Our purpose is “To move people and business the right way for all.” We believe that acting responsibly lets us build an engaged production chain, ensuring the longevity of our business and long-term relationships. Our efforts are focused on providing lubricant solutions that generate value and positive impact for our customers, as they increase the efficiency, performance and sustainability of automotive and commercial vehicles and industrial equipment across a diverse range of industries.
We believe there is a significant correlation between culture and performance. With the capability to build high performance teams, our “Moovers,” we built a reliable business: Moovers have the power to achieve, potentialize results and enact our commitments with all stakeholders. Our culture is a unique asset, and it has underpinned our financial performance.
Our History
Our business was formed following Cosan’s acquisition of ExxonMobil’s Brazilian lubricant manufacturing and distribution assets in 2008, marking a significant beginning of Moove’s journey into production, sale and distribution operations. In 2011, we expanded our operations by acquiring exclusive distribution rights for Mobil lubricants in Paraguay, Uruguay and Bolivia.
Since 2011, we have been pursuing international expansion. Through strategic acquisitions and global partnerships as well as innovative solutions to assist our clients in protecting their vehicles and machinery, we have established ourselves as a relevant player in the lubricants and automotive services industry. In 2012, we acquired Comma Oil & Chemicals Limited (now d/b/a Moove UK) in the United Kingdom, in furtherance of our strategy to enter into the European lubricants and specialties markets. The Moove UK acquisition allowed us to diversify our portfolio to include a comprehensive range of automotive chemical specialty products, from maintenance to products specifically designed for winter use (such as antifreeze) and car care items, which are marketed to over 60 countries in Europe and Asia.
In 2015, we acquired ExxonMobil’s chemicals terminal (which has its own pier and a large tank capacity adjacent to our manufacturing facility) in Ilha do Governador, State of Rio de Janeiro, Brazil, which added value to our business.
In 2016, to expand our reach in Europe, we secured distribution rights for Mobil in Spain, further enhancing our market presence. The following year, we expanded our distribution network in the United Kingdom with the acquisition of Stanbridge Group Limited (f/k/a Stanbridge North West Limited) and its subsidiaries, a distributor of Mobil products in England and Scotland.
In 2018, we entered into a distribution agreement with ExxonMobil covering Brazil, Bolivia, Uruguay and Paraguay and also secured exclusive distribution rights for Mobil brand products in Argentina. See “—Our Material Agreements—Our ExxonMobil Distribution Agreements.”
In 2018, we also significantly expanded our operations in Europe when we acquired Techniques et Technologies Appliquées, or TTA, and Lubrigrupo II – Comércio e Distribuição de Lubrificantes, S.A., or Lubrigrupo, the Mobil distributors in France and Portugal, respectively.
In 2018, we entered into an investment agreement with CVC Fund VII pursuant to which CVC Fund VII subscribed for shares in our capital in a total amount of R$588.6 million (which was equivalent to 30% of our share capital). The transaction closed on March 29, 2019, and we welcomed CVC as a strategic partner, which we believe will better position us for further growth and expansion. In December 2018, we also entered the U.S. lubricants market through our acquisition of Commercial Lubricants, LLC (d/b/a Metrolube), now known as Moove USA Corp.
In 2022, our operations in the United States were further expanded through our acquisition of PetroChoice from Golden Gate Capital for R$2,342.8 million. PetroChoice is one of the leading solutions providers and manufacturers of value-added lubricant solutions in the United States. By acquiring PetroChoice, we believe we secured a strong position in the most important market in the world in terms of volume of lubricants sold, the United States, which is six times larger than the Brazilian market, according to the Kline Report.
In May 2022, we also acquired Tirreno, a Brazilian manufacturer of chemicals, fluids and lubricants in the automotive and industrial business lines—a business profile that closely aligns with our product offerings and customer base. We believe this acquisition will enable us to increase our automotive and industrial product offerings through technology, manufacturing, distribution and cross-selling opportunities.
Our Corporate Structure
Our group is currently composed of 27 entities, four of which are incorporated in Brazil and 23 of which are incorporated in other countries.
A simplified organizational chart showing our corporate structure as of the date of this prospectus is set forth below.

A simplified organizational chart showing our corporate structure following this offering is set forth below.
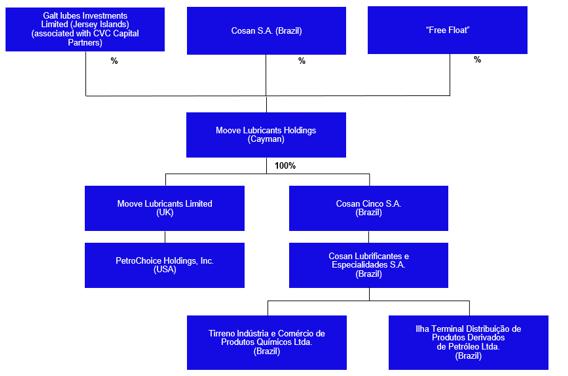
Our Solutions
Overview
Lubricants are everywhere and play a crucial role across various industries, offering significant opportunities for value creation. They are essential for the operation of vehicles, equipment, machinery and airplanes, among others. The complexity of the lubricants industry has increased as technology evolves, with the adoption of higher-value synthetic lubricants. In addition, the development of the global economy continuously calls for specialized product and service offerings to meet new demands from the consumer, commercial and industrial segments.
We are lubricants experts and develop proprietary and customized solutions for several businesses. Our customers operate across industrial, consumer and commercial channels, including passenger and commercial
vehicles, marine, aviation, industrial equipment and manufacturing. Our focus on lubricants, market penetration and business maturity has given us a robust understanding of how lubricants are used and marketed and how we can add real value to customers across all segments in which we operate.
Our global portfolio encompasses a full range of lubricants, including engine oils, automotive and industrial fluids, as well as special application products such as greases, cutting oils, insulating oils, process oils and car care products. We also offer a premium lubricants portfolio, which includes higher value-added synthetic oils in their composition and comprehensive engineering services. Our customers operate across industrial, consumer and commercial channels—including in passenger and commercial vehicles, marine, aviation, industrial equipment and manufacturing.
We offer the following benefits to our customers:
| · | greater equipment efficiency; |
| · | reduced downtime, faster machine startups and shorter process cycle times; |
| · | extended lifespan of machines and decreased maintenance cost; |
| · | lowered operational risks during machinery and equipment maintenance; |
| · | significant prevention of equipment failures. According to a study conducted by SKF, in a typical machine, lubricants amount to approximately 2% to 3% of running costs, whereas approximately 40% of maintenance costs arise from poor lubrication; |
| · | minimized environmental footprint through prolonged component lifespan and reduced maintenance-related waste disposal; |
| · | reduced plastic usage through bulk sales and increased circularity of plastic packaging via investments in recycled resins; and |
| · | lower energy consumption and greenhouse gas emissions through friction-reducing lubricants. |
In addition to lubricant products, our specialized engineering, marketing and sales teams have deep knowledge of our customers and deliver customized solutions according to their needs, such as condition monitoring, oil and filter changes, equipment upgrades, storage, handling and other technical services. We believe that our experience, reliability and intellectual capital are recognized differentials in the market.
Moove is leading the application of new technologies and the development of synthetic products through research and field tests. We believe that our commitment to meeting the needs and exceeding the expectations of our customers has been pivotal in building a solid and consistent reputation.
Our Reach Across the Lubricants Value Chain
We focus on creating value from sourcing to end markets by being involved in the formulation, manufacturing, distribution, sales and marketing and after-market services for the products we sell to our customers. Unlike our most direct competitors, lubricants are our specialty. Our vast experience in the lubricants market has given us the expertise in sourcing, insight into market prices and reach across the supply chain needed to enhance our efficiency and service levels for our end customers.
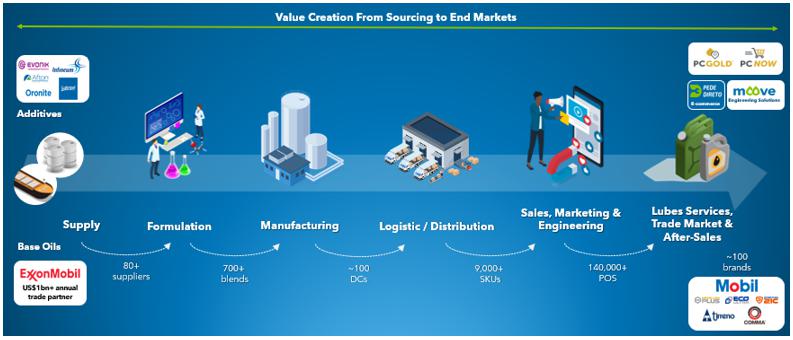
The approach to our value chain is strategic, encompassing employees, customers, suppliers, banks, investors and society, among other stakeholders. As a global company, we access a complex chain of more than 80 suppliers worldwide ranging from base oils, additives and packages. Across our six plants more than 700 blends are produced, filling more than 9,000 SKUs among more than 100 brands. We focus on developing the supply chain needed to service our customers with the best solution possible, leveraging our production facilities and formulation capabilities. Collaborating with some of the largest global suppliers of base stocks, additives and packaging, we employ an integrated logistics system to ensure customer fulfillment while adhering to inventory level policies, as described in the following diagram:

We maintain a dashboard to assess delivery and compliance with labor documentation. Contracts are based on prerogatives outlined in the Procurements Policy and documents from our Integrated Operations Management System, or IOMS.
We believe that our product development and our relationships with suppliers, which we refer to as supply intelligence, enable us to offer our customers the best lubricants for their intended purposes. By combining product development and strategically selected supplier relationships, we are able to combine ExxonMobil and other supplier products to produce a range of thousands of different solutions to meet customer’s needs.
In response to the global supply chain issues the global economy faced in 2022, we prioritized supply intelligence. The development of alternative product formulations, exploration of new options in global logistics and ongoing cultivation of long-term partnerships with suppliers were pivotal in supporting us during this challenging period. Through strategic planning and procurement actions, we successfully transformed challenges into opportunities, surpassing our peers in terms of service levels, product availability and production chain efficiency.
Suppliers
We use a variety of raw materials and chemicals in our manufacturing and blending processes and believe that the sources of these are adequate for our current operations. The primary raw materials for our products are base oils and additives.
We take a focused approach to our supply chain. We consciously choose to work with a limited number of high-quality third-party suppliers, from global oil companies to local independent producers, from whom we purchase significant volumes over extended periods. We believe that this enables us to form deep and mutually beneficial relationships with our suppliers and makes us a priority customer for them. We manufacture certain chemical components and blend these components to create a wide range of solutions designed to meet industry and customer specifications. This enables us to offer a full line of lubricant solutions, each of which is composed of component chemicals specially selected to perform desired functions.
As the performance requirements of our products become more complex, we often work with highly specialized suppliers. In some cases, we even source from a single supplier. In cases where we decide to source from a single supplier, we manage our risk by maintaining a safety stock of the raw material or qualifying alternate suppliers, which could take additional time to implement, but we are confident we can ensure continued supply for our customers.
Our approach to suppliers is designed to ensure flexibility and efficiency in production. By combining formulation capabilities and strategically selected relationships with suppliers, we are able to produce the same product specification in different ways. For example, we were able to produce a specific engine oil for motorcycles in Brazil that has resulted in significant savings in the production of that product since 2022. By leveraging these diverse production techniques, Moove can select the most cost-effective and efficient methods for each component or process, leading to significant cost optimization. This adaptability not only helps in minimizing production costs but also in maintaining consistent product quality and meeting market demands promptly.
For a description of the risks associated with relying on a limited number of suppliers, see “Risk Factors—Risks Relating to Our Business and Industry—Reliance on a limited base of third-party contract manufacturers, logistics providers and suppliers of raw materials and components may result in disruption to our business, and this could adversely affect our financial condition and results of operations.”
Product Development
The functionality of lubricants is created through an exact balance between a base fluid and performance-enhancing additives. Lubricant additive components are generally classified based upon their intended functionality.
We recognize the importance of innovation and renovation to our long-term success and are focused on and committed to research and new product development activities. Our product development team works closely with our supply team to source the base fluids, additives and other materials necessary to manufacture our wide range of products. In addition, the product development team engages in activities and product development efforts which are necessary to ensure that we meet all regulatory requirements for the formulation of our products.
Our Products
Our customers operate across industrial, consumer and commercial segments. They demand all kinds of lubricants, including engine oils, automotive and industrial fluids as well as special application products such as greases, cutting oils, insulating oils, process oils and car care products. Specifically in the industrial segment, lubricants are essential for production productivity and efficiency. To meet these needs, we blend and produce over 700 different formulations of lubricant products that are distributed through a number of delivery systems and presentations, and in total, we supply more than 9,000 stock-keeping units across our global network.
Industrial Products
We cultivate customer intimacy with our industrial clients by engaging in a collaborative approach that prioritizes our understanding of our client’s unique operational needs and challenges. Our technical experts gain firsthand insights into the specific machinery, operating conditions, and performance goals of each client.
This allows us to identify the need for tailored lubricant solutions and alternative formulations that are designed in cooperation with ExxonMobil and with our main additives’ suppliers and that directly address equipment downtime, enhancing energy efficiency and improving overall productivity. Additionally, our commitment to continuous support, including regular performance monitoring and maintenance recommendations, ensures that clients receive not only superior products but also expert guidance, fostering a sense of partnership and trust that reinforces long-term customer loyalty and satisfaction.
| · | Gas Engines: The Mobil Pegasus Series aims to enhance engine life and decrease maintenance costs for customers. For example, the Mobil Pegasus 1100 Series increases oil drain intervals, protects gas engines, improves output and reduces downtime. |
| · | Pulp and Paper: Mobil SHC PF 462 high temperature grease offers lubricity, corrosion resistance, stability and chemical inertness for customers. Mobil synthetic SHC oils and greases are designed for prolonged use in challenging environments. For example, Mobil SHC PF 462 high temperature grease offers lubricity, corrosion resistance, stability and chemical inertness. |
| · | Food and Beverage: We provide NSF H1-registered lubricants suitable for food processing for customers. The Mobil SHC Cibus Series and Mobilgrease FM Series are designed for diverse operating conditions, including Halal and Kosher (Parve) food preparation. |
| · | Plastics: Mobil Industrial Lubricants, such as the Mobil DTE 10 Excel Series, meet the needs of modern hydraulic systems in the plastics industry. |
| · | Oil and Gas: Our Mobil Industrial Lubricants and technical services aim to enhance machine component lifespan, equipment reliability and energy efficiency in the oil and gas industry. |
| · | Utilities: Mobil SHC synthetic lubricants address specific challenges in the water utilities industry and ensure efficient equipment operation. |
| · | Processing Plants: Our Mobil Industrial Lubricants protect processing equipment operating under challenging conditions, offering proven performance and long oil life. Similarly, our Tirroil Gear from Tirreno lubricants reduces operating wear and tear in high load services. |
| · | Agriculture: Our Mobil Delvac and Mobifluid Series offer a full range of viscosity and technology specifications to address all the needs of our customers in the agribusiness sector. |
| · | Marine: ExxonMobil Marine is a world leader in the supply of high-quality marine products and services to help vessel owners and operations achieve outstanding performance, reliability and cost-effectiveness operations in a diverse range of marine applications. |
| · | Aviation: Mobil Jet oils, grease and fluids deliver performance to more than 11,000 engines (commercial, military and aircraft-type gas turbine) and are designed to address current and future aviation challenges. |
Consumer Vehicle Products
Powerful wear protection, cold weather startup, high-temperature performance and engine cleanliness are among the qualities that we believe have made Mobil 1 a global leader in synthetic engine oil. From Mercedes-AMG to Porsche, vehicle manufacturers trust Mobil 1 oil as the factory fill and recommended service fill to help protect their modern turbocharged engines. Specifically formulated to help engines achieve an optimal balance of power, fuel economy and lower emissions, it is used by leading manufacturers such as Porsche, Mercedes-AMG, Aston Martin, and Bentley.
Our strategic partnership with ExxonMobil, coupled with our extensive logistics network, enables us to deliver tailored solutions utilizing Mobil 1, and the Mobil Super family of premium motor oils across the UK. Similarly, our Comma brand offers engine oils with nearly 100% coverage of the European market as well as gear and transmission oils, brake and hydraulic fluids and other essential maintenance products.
In South America, our Mobil line of products brings leading synthetic engine oil enabling powerful wear protection, cold weather startup, high-temperature performance and superb engine cleanliness. We are able to develop custom formulated lubricants to enable engines to achieve an optimal balance of power, fuel economy and lower emissions. Moreover, we are leaders in motorcycle oils in Brazil, offering exclusive formulations in partnership with the main producers in this category.
| · | Independent Workshops: Concerned about the quality and correct application of the lubricants they stock, more workshops are turning to Mobil 1, the world’s leading synthetic engine oil. Mobil 1 features anti-wear technology that provides performance beyond conventional engine oils. This technology allows Mobil 1 to exceed the toughest standards of European, U.S., and Japanese car builders, such as Porsche, Chevrolet and Nissan, respectively. Our synthetic engine oil can meet such strict standards better than conventional engine oils due to the more advanced technology employed. Mobil 1 also provides exceptional protection against engine wear under normal or extreme conditions. |
| · | Car Dealerships: Through a deep knowledge of the franchise car dealership sector obtained by working extensively in this market over a number of years, we understand the complexities of the car dealership business and aftermarket. As the official lubricant to the Red Bull Racing Formula 1 team, watched by approximately 1.54 billion people in 2022, a partnership with the powerful Mobil 1 brand is the perfect solution for privately owned, leased or fleet vehicles. |
Commercial Vehicle Products
We understand the importance of cost-effective solutions for fleet management, and offer Mobil Delvac, our main lubricant product for the commercial segment. Lubricants meet and exceed the demanding needs of heavy-duty, commercial vehicles and offer solutions to improve fuel economy and extend oil drain intervals while ensuring superior engine protection for our customers. Mobil Delvac has more than 90 years of experience in the heavy-duty lubricants industry.
In addition, our new Mobil Delvac light-duty range is suitable for light-duty, stop-start city driving. Choosing the right engine oil is crucial for vehicle performance, especially in challenging conditions. We offer synthetic and semi-synthetic commercial light duty engine oils designed for long engine life and protection for our customers. These low ash oils adhere to original equipment manufacturers’ specifications, reducing the risk of breakdowns and vehicle downtime, thus protecting warranties.
Our Services
As a global lubricants solutions provider, we provide bespoke engineering and consultancy services alongside our product offerings, including lubricants solution management, condition monitoring, oil and filter changes, equipment upgrades, storage, handling, technical services and on-site training tailored to meet customer needs. We believe that our service-oriented and high-touch approach with our customers has strengthened our position with our core clients.
To foster innovative solutions, in 2022, we launched our engineering solutions platform (Moove Engineering Solutions), which identifies the services needed to complete our product range based on industry needs, such as vibration analysis, contamination control, change interval optimization and leak detection, among others. The platform offers solutions that extend beyond lubricants, developed in collaboration with startups, partner companies and the expertise of our team. This portfolio of services incorporates elements of industry 4.0, such as data mining, analytics, machine learning and the internet of things to offer a portfolio of services including the following:
| · | Vibration Analysis: Monitoring solution to identify deviations from standard patterns and reduce unscheduled downtime. Our lubrication specialists collect data on-site and our specialists analyze it remotely, which enables the customer to keep the equipment in operation. |
| · | Data analysis: Extract maximum intelligence from in-service oil analysis by performing oil condition and machinery analysis. The Moove platform creates a management view of the alarms generated by the analysis program. |
| · | Energy efficiency: Study to quantify the reduction of energy consumption in machinery and equipment with the use of Mobil™ technology. |
| · | Contaminant Control: Quantitative and qualitative analysis of the contamination of lubricating oils. |
| · | Leakage Detection: Reduce the consumption of lubricating oils and environmental risks by performing oil volume measurements and machinery inspections. |
| · | 3D Gear Scanning: With Moove inspections (which consist of an open gear inspection that allows for 3D scanning the component, to create a detailed computerized profile of that gear), it is possible to measure the wear rate and estimate the remaining service life of the gears. |
Our Proprietary Business Model
We have developed our own proprietary performance system, the MPS, which we believe allows us to replicate our performance across new geographic markets regardless of our level of maturity in the market. MPS serves as a value-generating platform for stakeholders, constantly striving for improvement and continuous growth, whether organically or through strategic acquisitions. The value drivers within MPS are scalable and replicable across different regions and businesses, enhancing our capability to efficiently expand our operations while leveraging intelligence gained from these experiences.
Set forth below are select components and benefits of the MPS:
| · | Supply Intelligence: We strive to achieve predictability across the value chain by using data to increase efficiency and value extraction. We continue to evolve through the establishment of a lean center of excellence that operates effectively across multiple geographies. We believe that this model is applicable in new geographies and aligns with trained local teams, ensuring excellence in customer service. Our strategy includes tools for differentiation, such as internal formulations, connecting global and national chains, and integrating all areas of the business to access strategic market information, product availability, customer diversification and geographic reach. |
| · | Lean Methodology and S&OP: Our culture of efficiency is one of our strategic priorities to leverage our growth. Continuous improvement is integral to the way we conduct our business and is essential in our quest to foster operational excellence. We invest in developing increasingly efficient operations and possess deep knowledge of processes and efficiency methodologies. We value our assets, and strive to promote operational dynamism and synchronicity. We believe we have the capacity for analysis, response and agile decision-making. Our lean program serves as the model guiding us toward efficiency, supported by six key tools: (i) 5S; (ii) Kaizen; (iii) Value Stream Mapping (VSM); (iv) PDCA A3; (v) Standardized Work (or TP); and (vi) SMED. |
| · | Revenue Management: Managing revenue means enhancing our customers’ perception of the value of our offerings through appropriate propositions and fair and intelligent pricing. We prioritize optimizing value-based pricing extraction throughout the chain. |
| · | Sales and Marketing Execution: We believe that having products consistently available enhances the perceived value and credibility of the brand, ensuring supply certainty. Moove provides a level of service crucial in the lubricants industry, focusing on availability, quality, technology and service. We endeavor to focus on long-term relationships with our customers, providing high service levels, which include delivering product availability, performance, and technical and/or marketing support required to meet and exceed their needs. We believe that this approach builds credibility, fosters customer loyalty and drives profitability for the business. |
Our Operations
Our Global Presence
Moove is a multinational company serving in approximately 140,000 clients, present in 10 countries in South America (Argentina, Brazil, Bolivia, Uruguay and Paraguay), in North America (the United States of America) and in Europe (Spain, France, Portugal and the United Kingdom).
For a breakdown of our results of operations by geographical area, see “Management’s Discussion and Analysis of Financial Condition and Results of Operations—Segment Results of Operations.”
South America
We are a Brazilian company with global operations. Our story starts in South America, and since 2008, we have been developing our business with high execution capabilities that have allowed us to expand our operations worldwide.
In South America, we have two plants in Brazil, at Rio de Janeiro and São Paulo. Our Rio de Janeiro plant is our largest plant with an annual production capacity of 400 million liters, extensive tank capacity and a proprietary pier. Its operation is nestled in Guanabara Bay, where we produce Mobil brand lubricants for Brazil, Argentina, Bolivia, Uruguay and Paraguay. In addition, we have a production plant in the State of São Paulo where we manufacture our “Tirreno” products. This plant has an annual production capacity of approximately 27 million liters.
We have more than 35 distribution centers in Brazil and an exclusive network of 17 distributors that reached over 100 thousand sales outlets in the region as of December 31, 2023, compared to 92 thousand sales outlets as of December 31, 2022. Our business model is unique and this competitive advantage ensures product availability and penetration in the market, and allows us to address our clients’ needs and also deliver sustainable operations and financial results. In addition to our portfolio of premium lubricants, we are one of the largest importers of base oils in Brazil.
Moreover, we launched “Pede Direto” in 2022, an online sales channel integrated into the services of our distributors. This platform is a differential in this segment and now offers the option to purchase our lubricants for the automotive and industrial sectors virtually. Distributors handle sales, delivery, exchanges, returns and customer service, while customers have access to product information, technical and safety data sheets, 24/7 service, purchase history, promotions and other benefits.
North America
In December 2018, we began operating in the United States through our acquisition of Commercial Lubricants, LLC (d/b/a Metrolube), now known as Moove USA Corp.
In May 2022, we expanded our operations in the United States with the acquisition of PetroChoice, expanding our Mobil-branded footprint in the United States with three lubricant blending plants and 50 distribution centers across 25 states. With this transaction, Moove became a relevant player in North America, making the region an important platform for new business development and growth.
In North America, we offer an extensive range of high-quality products, including Mobil lubricants, and manufacture and distribute proprietary brands. Moove plays a significant role in the United States lubricants sector and has considerable growth potential. The U.S. market, being the largest globally, is nearly six times larger than the Brazilian market, with an annual consumption of approximately 8.4 billion liters of lubricants, according to the Kline Report.
The following image showcases our over 50 distribution centers and three production plants in the United States as of the date of this prospectus:

Europe
In July 2012, Moove acquired Comma Oil & Chemicals Limited (now d/b/a Moove Lubricants Limited) in the United Kingdom, in furtherance of our strategy to enter into the European lubricants and specialties markets. As a result, there are agreements in place allowing us to distribute select Mobil-brand lubricants into specific sales channels (including OEM, direct sales and distributors) in the United Kingdom and to continue to manufacture and distribute a range of seasonal and ancillary automotive products to ExxonMobil and other Mobil distributors in Europe and Asia.
Since December 2016, we have had distribution rights for Mobil brand products in Spain and, more recently, in the United Kingdom, France and Portugal. The UK is our largest European operation, where we also inherited a niche fuel business serving business-to-business customers.
In France, we are also a leader in the industrial segment. With strong experience in differentiation and value creation based on engineering services, we have the opportunity to replicate our offerings to other countries and customers.
Moove also produces and sells Comma Oil and private label lubricants. Our European plant is in Gravesend, United Kingdom, with an annual production capacity of about 70 million liters per year, where we produce lubricants under the Comma Oil brand, which is one of our white-label brands, and market them to more than 60 countries in Europe and Asia through six distribution centers across Europe.
Our Competitive Strengths
We believe that as a scaled service provider to the lubricants value chain, we can capitalize on a number of favorable trends, particularly in light of the following competitive strengths:
We Have a Pure Strategic Focus on the Lubricants Market, Which We Believe Is Distinctive in Our Industry and Highly Valuable to Our Customers: Unlike many of our competitors, lubricants have been our exclusive focus for the last 15 years, enabling us to shape our operations to the evolving demands of our industry. As the market has grown, there has been an increase in product complexity and end-use requirements for lubricants, raising the barriers to entry for new market participants. The continued proliferation of customer needs and the associated technical expertise required are pushing lubricants producers to supply a broader and more technical range of products. In particular, the required investments in physical assets (plants, distribution centers, transport vehicles and information technology platforms) and working capital to consistently and efficiently service customers at attractive margins are meaningful in our industry.
Our strategic prioritization of lubricants has directed us to make investments that best address the specific needs of our customers – we have established supply chain, engineering, marketing and technical expertise to facilitate them. We have also accrued significant market intelligence and industry relationships through our operating history across our core markets, supporting our ability to determine how best to deploy capital within our portfolio.
As the marketplace has evolved, achieving the appropriate scale to fully address customers’ lubricants needs has also become more important. We are committed to allocating capital that is required for specialized equipment and a more sophisticated sourcing function is needed to offer a comprehensive product portfolio to the largest consumers. Our market penetration and business maturity are higher where we have operated for longer, but we have been thoughtful where and how we have entered markets, focusing on regions where we see clear growth opportunities. We have developed a robust understanding of how lubricants are used and marketed to ensure we can add real value to customers across all segments, such as industrial, consumer and commercial vehicles.
We Are a Customer-Orientated Specialty Lubricants Provider and Are Integrated Across the Value Chain: We focus on creating value from sourcing to end market and have capabilities in the supply of raw materials, formulation, manufacturing, distribution, sales, marketing and after-market services for our products. We operate in a complex industry and believe that our integrated value chain is a key competitive advantage that gives us scale, flexibility and efficiency.
We view product development and supplier relationships as two key enablers of our ability to supply our customers. The wide range of use cases for lubricants necessitates the ability to source a wide range of base stocks and additives to meet customers’ demands. By combining formulation capabilities and strategically selected relationships with both global and local suppliers, we are able to customize formulation, which is a key element to optimize production costs. We believe that our knowledge of and access to raw materials also allow us to capitalize on favorable pricing trends for our input chemicals, lowering our cost of production while maintaining our pricing model.
We have a dedicated team of engineers focused on developing and implementing customized solutions for each customer and industry we serve. We believe that our extensive knowledge of the entire value chain and vast experience in the lubricants market enable us to enhance productivity and improve service levels. Our customers are accustomed to a high level of service, with supply reliability being critical to their own operations, as well as logistical requirements and demand for high-touch service and performance. We believe that our experience, reliability and commitment to service are recognized differentiators in the market.
We Are a Natural Consolidator and Are Positioned to Capture the Tailwinds of a Massive Addressable Market: In our journey so far, we have proven our ability and commitment to also grow inorganically through acquisitions to extend our geographic reach and expand the capabilities that are most relevant to our customers. We actively maintain and monitor a pipeline of potential future acquisition opportunities that we believe could be additive to our business in the long term.
The complexity of the lubricants industry has increased as technology evolves, with the adoption of higher-value synthetic lubricants, and global economic development calls continuously for specialized products and services to meet new demand for the consumer, commercial and industrial sectors. The investments required to bring high-grade services to such a diversified customer portfolio have been one of the key consolidation factors. We believe that this need to invest is likely to reshape this highly fragmented industry, in which the five largest integrated producers represent only 35% of global market share and the remainder of the market is fragmented in over 1,000 independent lubricants producers, with just a few scaled, multinational platforms like our own.
While we have achieved scale across a number of our markets, we believe there is a significant opportunity ahead supported by a large addressable market relative to our current aggregate volume. According to the Kline Report, the global addressable market for lubricants was 44 billion liters and US$162 billion in 2023, of which 21 billion liters and US$92 billion were accounted for by our core markets: North America, Europe and South America. We produced 0.7 billion liters, 0.5 billion liters and 0.4 billion liters in the years ended December 31, 2023, 2022 and 2021, respectively.
Over the next nine years up to 2033, according to the Kline Report, the global lubricants market is expected to grow to 48 billion liters, or to US$184.3 billion, with a total value increase of 14% in real terms over the same period related to a shift in products mix towards more sophisticated, premium formulations.
Our Unique Culture Has Been Fundamental in Delivering Strong Results: Moove has deliberately cultivated a culture that values people as its biggest asset, which we believe empowers us to achieve even greater potential across all the markets in which we operate. With a clear strategy and vision to become a global reference in lubricants, we have aimed to build a culture focused on three main strategic drivers, which support our ability to achieve our results:
| · | High Performance Teams: We foster an environment of trust and full business alignment across all areas of our company, with the appropriate incentives, which enables us to be productive, adaptable, flexible and agile. |
| · | Culture of Efficiency: We are constantly seeking the simplest and most efficient ways to achieve our goals, and we have a continuous improvement mindset that enables us to eliminate inefficiencies and to add value to the products and services we offer to our customers. |
| · | Business Expansion: We have clarity on where, when and how much to invest in human capital, operating assets and market intelligence, which allows us to consistently enhance our core processes and capabilities. |
We are led by a senior leadership team with best-in-class industry experience, including our Chief Executive Officer, Filipe Affonso Ferreira, who has almost eight years’ experience at the company, and our Chief Financial Officer, Lineu Paulo Moran Filho, who has more than two decades’ experience in the industry, including over a decade with Moove. Collectively, the full leadership team consists of eight seasoned professionals with over 80 years of combined industry experience.
We believe that our cultural pillars, which we refer to as the “Moove attitudes,” foster an environment of trust and are conducive to high performance at the senior leadership level and throughout the entire business. The Moove attitudes are: (i) “We are in this together,” a conviction that teamwork beats individualism every time, (ii) “Open Mind,” we encourage decision-makers at all levels to think outside the box, (iii) “Real Talk,” everyone’s frank and unvarnished opinion is expected and encouraged in the spirit of reaching the best outcomes for our business as a whole, (iv) “Always Safe,” we focus on safety across our production, marketing, systems, distribution processes and finance, and (v) “Think Big, Keep it Simple,” we aim high but keep our feet on the ground, with focus on execution.
We Have Instituted a Proprietary Operating Model Across Our Portfolio to Drive Consistency and Aid New Market Penetration—the Moove Performance System: We have developed a proprietary performance methodology, the Moove Performance System, or MPS, which allows us to deliver quality and consistent service and support our financial objectives across all of our markets. MPS starts with the deployment of our culture, the “walk the talk” of our values and principles, and the expected behaviors of our employees, our Moovers. MPS serves as a guideline of value drivers for both customers and the business, constantly striving for continuous improvement and growth, and is centered around the primary value creation levers in our business and our people.
As a business we invest in strategies that create value for all of our stakeholders, in product supply, manufacturing and marketing through a robust portfolio, as well as in enhancing our corporate governance and strengthening our assets—our people, operations and intelligence. This model serves as a blueprint for how we can go to market across new geographies, product lines and services, tailoring our past experiences to the maturity and specific needs of each business and local market to efficiently expand our operations.

Underpinning MPS are four key value creation levers:
| (i) | Supply Intelligence: We strive to achieve predictability across an integrated value chain by using data to increase efficiency and value extraction. Our strategy includes tools for differentiation, connecting global and national chains, and integrating all areas of the business to access strategic market information, product availability, customer diversification and geographic reach. |
| (ii) | Lean Methodology and Sales and Operations Planning, or S&OP: We value our assets, promote operational dynamism, synchronicity and alignment through S&OP, and believe we have the capacity for analysis, response and agile decision-making. Our lean program serves as the model guiding us toward efficiency, supported by six key tools: 5S, Kaizen, Value Stream Mapping, or VSM, PDCA A3, Standardized Work, or TP, and SMED. |
| (iii) | Revenue Management: We manage revenue by enhancing our customers’ perception of value, through appropriate marketing propositions and intelligent market-back pricing by product, by channel and by region. |
| (iv) | Sales and Marketing Execution: We focus on long-term relationships with our customers, on strong brand communication and on having our sales and marketing people appropriately allocated on the field. Thus, we can provide high service levels, which includes delivering product availability and performance, as well as technical and/or marketing support required to meet and exceed their needs. |
The impact of MPS on our operations is also reflected in our financial performance and the incremental margin we are able to deliver through our network. For example, in our South America business, where we have been able to implement our core initiatives over a longer period, we were able to reach a significant market share (20% in Brazil in 2023, from 10.6% in 2008, according to IBP) and achieve higher margins with strong cash flow generation.
We Have a Highly Strategic Partnership with ExxonMobil and Key Partners That Has Helped Underpin Our Growth in New Markets: ExxonMobil is the largest finished lubricants synthetic marketer, one of the largest and the most reliable supplier of base oils and a global leader in research and development in our industry. Our long-standing relationship with ExxonMobil has given Moove a differentiated knowledge, experience and ability to service Mobil branded products across the value chain, including manufacturing, distribution, sales and marketing. The success of the Strategic Alliance Model in South America, which can be illustrated by the Mobil market share growth in Brazil in the past 15 years, revealed the complementary strengths of both companies and paved the route for Moove’s international expansion.
In our history, we were able to develop long-term-oriented relationships with additive suppliers, which has been fundamental in our growth and international expansion journey. As an example, Moove today is a relevant customer for Infineum and Lubrizol, two of the main global suppliers of additives. In the base oils and specialties universe, beyond the ExxonMobil relationship, we have established strong relationships with Ergon Specialty Oils, S-Oil
Corporation and SK Enmove, among others. Focused on servicing all segments, we rely on the joint work among these partners and our technology team to develop and improve our proprietary brands offering, which complements the Mobil branded portfolio, allowing us to provide lubricants solutions to all end markets.
Our Growth Strategy
Our vision is to become a global reference in the lubricants market. To that end, the principal components of our growth strategy are:
MPS Deployment in All Markets in Which We Operate, to Drive Organic Growth, Incremental Adjusted EBITDA and Cash Flow Generation: We are focused on continually improving our core processes and enhancing our capabilities so that our MPS operating model can be enhanced and applied globally in all markets. Our model includes driving incremental value at the unit level by rapidly building market intelligence after entering a new market, adjusting our cost base and working capital requirements to the specific needs of the customers and unlocking incremental profit through revenue management, marketing programs and engineering solutions. This approach has long been active in South America and has translated into significant organic Adjusted EBITDA and ROIC expansion, as well as facilitating an increase of our market share in Brazil.
We are now in the process of enhancing and implementing MPS in all regions in which we operate, including in our recently acquired PetroChoice assets in the United States, where scale and portfolio will offer meaningful opportunities in the short, mid and long term. Also, we are focused on potentializing the impact of the MPS in our operations in Europe, where we just finalized the implementation of a common enterprise resource planning for the region, where the simplification of processes and business will unlock several value creation opportunities.
Expansion through “Organic-Like” M&A Can Unlock Differentiated Growth: In our path to becoming a global reference in lubricants, we prioritize acquisitions to complement organic growth in our current markets and to expand into new markets. This approach is supported by a market structure that remains very regional and fragmented, and that requires deep insights into how to service customers when regulations and product needs can vary between jurisdictions. We have built a robust M&A function to identify potential acquisitions and have invested in personnel experienced in business integration, evidenced by repeated market entry success. We actively monitor potential future acquisition opportunities that we believe could be additive to our business in the long term.
We believe there is a large market opportunity in Europe where our existing systems make operations scalable and able to integrate smaller players. Our focus is on predictable and profitable businesses that are respected by their customers, with opportunities to grow margins through our MPS model. We see a similar opportunity to deploy our expertise at a high return with larger customers with complex procurement needs in North America. We believe that our existing asset base in North America, with a network of 48 distribution centers, will position us to pursue an inorganic growth strategy centered on optimization of supply chains and expansion of our product and customer channels.
Capitalizing on the Increasing Adoption of High-Margin Synthetic Lubricants and E-Fluids: As innovations in the internal combustion engine (in particular) continue to drive greater input requirements across the supply chain, equipment operators are increasingly moving toward lower viscosity synthetic lubricants due to their superior performance, increased efficiency, extended life and better protection. We have technical expertise across the value chain, allowing us to service the premium products applications our customers need. Customers look for our close collaboration for a broader suite of products as their needs evolve. Synthetic lubricants command premium pricing, and as the mix shift in the market plays out, we are able to generate higher unit margins within our portfolio.
A similar effect is evident in the electric vehicle value chain. While these vehicles have fewer moving parts, they require more specialized and higher-performing lubricants and coolants. We have the optionality to leverage our ExxonMobil relationship to access proprietary edge technology and develop solutions in this nascent market.
These premium products command unit margins considerably higher than conventional lubricant products. According to the Kline Report, premium lubricants (that have fully synthetic and semi-synthetic components in their composition) are projected to achieve a market share of 37% by volume globally by 2040 (from 29% in 2023), and account for 56% of the sales revenue (from 43% in 2023), owing to their higher retail prices. This growth in market share of premium lubricants will be the key driver behind global market growth over the forecast period. We believe
that our intimate relationships with customers, our deep supplier relationships, our specific formulation and manufacturing capabilities and our infrastructure and logistics expertise will allow us to best serve the premium market.
Competition
We are among the top three companies in the industry in terms of market share in Brazil with the Mobil brand, which is the largest in the premium lubricants segment in the country according to the Kline Report. In the United States, we have a market share of 3.0% and in the countries in which we operate in Europe we have a market share of 4.0%, according to the Kline Report. Our major competitors are: in Brazil: Iconic, Vibra and Raízen; in the United States: Shell and Chevron; in the United Kingdom: Shell and BP; and in Europe: Shell, BP and Total. In addition, there are several other regional and local players we compete with in the multiple sectors in the industry. We believe there is significant opportunity for us to grow our market share in North America and in Europe due to our focus on lubricants, unique culture and the MPS execution system that we believe will position us to benefit from consolidation trends in those regions.
Our products compete both within their own product categories as well as within product distribution channels, contending with many other products for store placement and shelf space. Competition is based on several key criteria, including product performance and quality, price, availability and security of supply, responsiveness of product development in cooperation with customers, customer service, industry knowledge and technical capability. The industry has become increasingly complex due to global industry consolidation trends, cost pressures and new technologies. To improve our competitive position, as we narrow our focus, we are building and leveraging our corporate brand as a differentiator to create value and better communicate our capabilities, making it easier to introduce new product lines and applications.
For information on risks relating to competition in our industry, see “Risk Factors—Risks Relating to Our Business and Industry—We face significant competition, which may have a material adverse effect on our market share and profitability.”
Corporate Social Responsibility
We are committed to building a more efficient and sustainable world, and to achieve this, we have invested in our purpose. Our economics, environment, social and governance journey, or EESG journey, is a structured process aimed at advancing our ambitions in a legitimate manner. Guided by our environmental management stewardship policies, we adhere to best practices related to greenhouse gas emissions, energy efficiency, water, wastewater and waste management. This includes the recycling of packaging and materials in our plants in Brazil and the United Kingdom. We count on the support of our sustainability committee and development groups to explore better initiatives covering the environment, people (our team members and communities) and business efficiency. Recognizing the importance of engagement in sustainability topics, we utilize the World Environment Day in June to conduct interactive activities demonstrating how sustainable development is integrated into our culture and strategy. We also emphasize how the Sustainable Development Goals, or SDGs, can guide our actions in alignment with the 10 principles of the 2030 Agenda.
We believe in making a positive difference in the communities where we operate and contributing to local development. Recognizing the significant role that companies play in this process, we are committed to our responsibility to the communities surrounding our operations, both within and outside Brazil. Sustainability, for us, is a journey that is built through collaboration and engagement with all stakeholders. Therefore, we strive to engage responsibly with 100% of the communities we interact with, aiming to improve the quality of life for residents. To achieve this goal, we have developed various initiatives tailored to the specific needs and expectations of each community. We proactively listen to the feedback and suggestions of individuals and key stakeholders through a 24-hour channel established for receiving community input.
As part of our supplier precautions, all contracts and purchase orders include clauses to ensure environmental compliance and zero tolerance for slave labor, child labor, or racial, social or gender discrimination, and to prohibit illicit activities on our premises or in supplier management. Additionally, there are requirements related to health and safety, anti-corruption policies and antitrust legislation.
Human Capital
Overview
As of June 30, 2024 and December 31, 2023, 2022 and 2021, we had 2,199, 2,158, 2,036 and 1,192 employees, respectively. As of June 30, 2024, our employees were based in Brazil, the United Kingdom, France, Spain, Portugal, Argentina, the United States and the Netherlands.
The table below breaks down our full-time personnel by function as of June 30, 2024:
| Function | | Number of Employees | | % of Total |
| Management | | | 9 | | | | 0.4 | % |
| Technology | | | 41 | | | | 1.9 | % |
| Sales and Marketing | | | 483 | | | | 22.0 | % |
| Customer Support | | | 103 | | | | 4.7 | % |
| Operations | | | 495 | | | | 22.5 | % |
| General and Administrative | | | 1,068 | | | | 48.6 | % |
| Total | | | 2,199 | | | | 100 | % |
The table below breaks down our full-time personnel by location as of June 30, 2024:
| Country | | Number of Employees | | % of Total |
| Brazil | | | 1,047 | | | | 47.6 | % |
| United States | | | 690 | | | | 31.4 | % |
| United Kingdom | | | 311 | | | | 14.1 | % |
| France | | | 88 | | | | 4.0 | % |
| Spain | | | 27 | | | | 1.2 | % |
| Argentina | | | 27 | | | | 1.2 | % |
| Other | | | 9 | | | | 0.4 | % |
| Total | | | 2,199 | | | | 100 | % |
Certain of our employees, particularly those in Brazil, are affiliated with the unions of independent sales agents and of consulting, information, research and accounting firms. We believe we have a constructive relationship with these unions, as we have never experienced strikes, work stoppages or disputes leading to any form of downtime.
Talent Attraction, Retention and Development
A key pillar of our business is high performance teams. To maintain coherence and consistency, our culture permeates all our people processes—hiring, onboarding, development, retention and performance.
High-performance teams are focused on delivering business priorities, have clear priorities, a continuous improvement mindset, and care about the “how”—the expected behaviors (Moove attitudes)—to create an environment of trust for the best people to achieve the best performance.
We are dedicated to attracting and retaining professionals who are eager to work together and contribute to our growth. Our recruiting strategy seeks to bring the right people to the right places. To that end, our leadership is engaged in the hiring and decision-making process for key positions, such as new managers.
Our talent attraction policy provides clear guidelines and criteria for recruitment and selection processes, always aligned with our Moove attitudes. Additionally, we conduct internal referral campaigns, allowing our team members to recommend candidates for selection processes conducted internally. These candidates then undergo the same journey as any external candidate.
Our compensation strategy is a key driver for performance. We offer a competitive compensation and benefits package compared to the market, which enhances talent attraction and retention. We offer fixed, variable and long-term incentives, which are approved by our remuneration committee and board of directors. Our bonus is composed of both business (70%) and individual (30%) factors to prioritize business goals rather than individual performance. Furthermore, we offer a comprehensive benefits package that extends to dependents, including health and dental plans, life insurance, access to discounted medications (through payroll deduction), disability and impairment assistance, concierge services for scheduling exams and appointments, programs for pregnant employees and those with chronic illnesses, and a fitness incentivization app. Our international growth also provides our team members with opportunities to work in other countries.
We are committed to developing our Moovers for leadership positions through comprehensive development cycles focused on people and performance. These cycles aim to strengthen empathy and enhance the versatility of each individual’s story and personal journey. By embarking on this learning and self-discovery journey, leaders gain awareness of their specific traits and are better equipped to respect differences and motivate elite teams. We have development tools for continuous improvement and rewarding of our teams.
In our efforts to foster closer ties with academia, we engage universities through internship and trainee programs. Through our Open Mindset platform, we have partnered with PriG – Instituto Primeira Geração to provide opportunities for first-generation college students.
To gauge employee engagement, we conduct an annual survey across all our operations. The engagement survey includes questions about well-being, career and development opportunities, cooperation and teamwork, workplace safety and other relevant aspects.
We also regularly review our selection processes and succession plans to promote diversity and inclusivity. We incentivize diversity in our teams using a range of initiatives. For six years, we had a plurality committee which focused on dealing with issues related to diversity and inclusion, especially those linked to minority groups. We then further subdivided our efforts into cells called colors, pride, disabilities and gender, respectively, to address these issues through a very clear strategy of raising awareness of the unconscious biases. The aim of these initiatives is to create a more inclusive culture and a more diverse team. We have publicly committed to having 30% of leadership positions held by women by 2025, and we achieved this rating at the end of 2023. We also cofounded Mover—an initiative for racial equity made up of more than 50 global and Brazilian companies. In 2023, we also launched a trainee program specifically aimed at minorities.
Our code of conduct outlines clear guidelines for decisions regarding Moovers, including hiring, promotions and terminations, which are guided by the Moove attitudes. Additionally, we offer a career transition program for leadership and strategic positions, providing guidance to employees in developing an action plan for their next career stage or retirement.
Occupational Health and Safety
Ensuring the health and safety of our team members and the communities surrounding our operational units is a top priority for us. To achieve this, we have developed a comprehensive management system that complies with current legislation and standards. As a preventive measure, all team members and service providers undergo training in the tools of the Alerta! System, which provides guidance on safe behavior and establishes control measures to eliminate or minimize risks in the workplace, operations and product transportation. This proactive approach enables us to respond effectively to potential incidents and emergencies.
We believe in maintaining a safe work environment through our “Always Safe” mindset, with the ultimate goal of achieving zero incidents. Our Integrated Occupational Management System, or IOMS, is implemented across all operations in Brazil and the United Kingdom. IOMS consists of 10 elements that address the health and safety of our team members, allowing for the assignment of responsibilities, and standardization and systematic monitoring of occupational health and safety indicators. Additionally, both our Brazil and United Kingdom units adhere to our EMS, which was certified in accordance with the NBR ISO 14001:2015 standard, ensuring order to support our compliance with necessary legal and regulatory requirements.
We conduct periodic risk assessments of processes and continually present actions to minimize or eliminate short-, medium- and long-term occupational risks, with established control measures. Critical activities undergo an additional risk assessment through the permit-to-work procedure, ensuring safety measures are implemented before task initiation. Team members and contractors can report hazards or unsafe conditions through the online channel “Deviation Report,” facilitating prompt resolution of issues.
Our Material Agreements
Our ExxonMobil Distribution Agreements
We are currently the licensor of ExxonMobil products across the jurisdictions in which we operate. We believe that higher product quality and advanced technology lead to benefits for customers, such as increased efficiency, productivity and reliability. Set forth below is a list of the material agreements governing our ExxonMobil license:
| · | With respect to Brazil, Bolivia, Uruguay and Paraguay (“BBUP”), we are a party to a lubricants blending and distribution agreement with ExxonMobil; and |
| · | With respect to the United States, we are a party to a lubricants distributor agreement with ExxonMobil Oil Corporation. |
The material provisions of our ExxonMobil distribution agreements, as may be amended from time to time, are set forth below. The following is a summary only of such ExxonMobil distribution agreements and does not purport to be a complete description of all the terms, provisions, covenants and agreements contained in each ExxonMobil distribution agreement, and is subject to and qualified in its entirety by reference to the full text of the ExxonMobil distribution agreements, which are filed herewith as Exhibits 10.3 and 10.4 to the registration statement of which this prospectus forms a part.
Terms of Appointment. Pursuant to the ExxonMobil distribution agreements, we were appointed and authorized on an exclusive basis (in BBUP) or on a non-exclusive basis (in the United States) to be the designated manufacturer, blender, packager, importer, marketer, seller, distributor and provider of certain ExxonMobil products, supply products and services. Our appointment covers the territories set forth in each of the ExxonMobil distribution agreements, and during the term of the agreements that contain exclusivity provisions, ExxonMobil has agreed not to appoint any other person as a manufacturer, blender, packager, importer, marketer, seller, distributor and provider of the relevant products and services within the respective territories.
Non-compete. Pursuant to the ExxonMobil distribution agreements, we have generally agreed not to directly or indirectly import, market, commercialize or sell, in the relevant territories, products and/or services supplied by a third party that compete in any respect with the relevant ExxonMobil products and services during the term of these agreements. We have also agreed to remain single-branded such that we will exclusively represent, blend, package, import, market, sell, deliver and/or otherwise provide ExxonMobil products and services in the relevant territories. Notwithstanding the foregoing, our sale, distribution and marketing of certain products, including “Comma”-branded products manufactured by us that are not lubricating fluids, greases, lubricant additives or finished lubricants, may not be deemed to violate the terms of all such distribution agreements. With respect to the United States, we have also agreed not to, without ExxonMobil’s prior written consent, individually or in partnership or jointly or in conjunction with any other party, as principal, agent, franchisee, licensee, shareholder, director, investor, lender, employer, employee, co-venturer, guarantor, contractor, consultant, advisor or in any manner whatsoever, directly or indirectly, carry on, be engaged in or concerned with, or interested in or advise in the operation of any business which involves promoting, selling or distributing products that compete in any respect with the relevant ExxonMobil products during the term of the agreement.
Use of Proprietary Marks. The ExxonMobil distribution agreements grant us the nontransferable right to use the certain ExxonMobil proprietary marks associated with the products and services that these agreements govern for purposes of carrying out our obligations thereunder. Our right to use such proprietary marks is nonexclusive and does not include the right to sublicense and/or allow others to use such proprietary marks without ExxonMobil’s prior written permission. We have agreed to monitor the use of certain ExxonMobil proprietary marks by sub-distributors and sellers appointed by us and to report any instance of non-compliance to ExxonMobil.
Term. Unless earlier terminated in accordance with its terms, the ExxonMobil distribution agreements have fixed terms, as set forth below.
| · | With respect to Brazil, our distribution agreement has a term of 15 years as of its effective date, and will therefore remain in effect until December 1, 2033, absent early termination. Following this initial term, such distribution agreement will automatically renew for an additional five years (i.e., December 1, 2038) unless either party provides the other party with written notice of its intent not to renew no later than 13 years following the effective date (i.e., by December 1, 2031); and |
| · | With respect to the United States, our distribution agreement, as amended, has an initial term of 10 years as of its effective date, and will therefore remain in effect until June 30, 2034. Following this initial term, such distribution agreement will automatically renew for an additional five year-period (i.e., June 30, 2039), unless either party provides the other party with written notice of its intention not to renew no later than eight years following the start of the initial term (i.e., June 30, 2032). |
Product Blending. With respect to BBUP, the products we are authorized to blend and the ExxonMobil requirements stipulated to blend such products are set out in the ExxonMobil lubricants blending and distribution agreement. Products must only be blended at certain approved plants, and the approval process for new plants includes product testing for compliance with specifications, product performance testing and performance claims testing in accordance with the products approval process, among other criteria. To help ensure and protect confidentiality, products and certain components thereof may only be available to us in blind-coded, technology-free form, and it would be a material breach of certain of these ExxonMobil distribution agreements by us if we seek to analyze, determine or disclose any trade names, chemical composition, chemical analysis or recipes of the products or raw materials, components or finished products contained in any of the foregoing. We may use ExxonMobil requirements solely for the purpose of blending such products solely for sale within the applicable territories, and for no other products or purposes whatsoever. We will also apply and maintain a quality control system for such products blended by us that meets or exceeds ExxonMobil’s quality control requirements, as applicable to our operations.
Performance Objectives. In connection with the BBUP lubricants blending and distribution agreement, we are generally required to meet certain performance objectives set forth therein with respect to our market share, business growth, product and brand integrity and business value in the relevant territories. We have agreed to meet the performance objectives set forth in each such ExxonMobil distribution agreement relative to the products and services that we have licensed, and in the event such objectives are not met or complied with for certain periods of time, the relevant ExxonMobil lubricants blending and distribution agreement is subject to termination.
Purchase Obligations. With respect to the United States, we are required to purchase a certain minimum quantity of ExxonMobil’s products for each line of business for which we are authorized to sell ExxonMobil products. We have also agreed to limit our purchases of ExxonMobil’s product to a certain maximum quantity for each line of business for which we are authorized to sell ExxonMobil products. In addition, ExxonMobil may from time to time set temporary maximum quantities for such products in connection with a change in price for such products. In the event such minimum and maximum purchase obligations are not met, the relevant ExxonMobil distribution agreement is subject to termination.
Product Quality. Under the ExxonMobil distribution agreements, we have generally agreed to abide by certain quality control requirements, including certain ExxonMobil product quality practices and guidelines, ExxonMobil’s third-party product integrity manual and the ExxonMobil distributor product integrity manual. Among other things, we have agreed to not sell or distribute any product that does not meet the relevant specifications, substitute any product for or mix any product with the products for sale under the ExxonMobil proprietary marks, adulterate products in any way, or use ExxonMobil proprietary marks in connection with the handling, storage and sale of any adulterated, mixed, substituted or previously used products. ExxonMobil may (as its cost and option) inspect and take and test samples from storage tanks, drums, sampling points at filling equipment and tanks of delivery vehicles to determine that products meet such quality control requirements. We have also agreed to ExxonMobil’s audit and inspection rights as set forth in such quality control requirements, and if an ExxonMobil audit results in finding a material violation of the quality control requirements applicable to our operations, ExxonMobil may have the right to suspend deliveries or suspend our authority to blend until effective corrective actions are implemented to cure the violation.
Fees. With respect to BBUP, as consideration under the ExxonMobil lubricant blending and distribution agreement, we are required to pay certain fees to ExxonMobil. Such fees may include a variable component (e.g., fees based on the number of barrels of ExxonMobil products (including branded and unbranded products) blended and sold by us or our affiliates), and a fixed component (e.g., an amount per period as set forth in such agreements). For the six months ended June 30, 2024 and 2023 and the years ended December 31, 2023, 2022 and 2021, we paid ExxonMobil a total of R$71.7 million, R$52.4 million, R$48.0 million, R$47.2 million and R$51.7 million, respectively, in fees under the ExxonMobil distribution agreement.
Change in Control. With respect to the BBUP ExxonMobil lubricants blending and distribution agreement, ExxonMobil shall have the right upon any change in control to immediately terminate such agreement by written notice of termination to us. Subject to the terms of such agreement, a change of control may include the following: (a) any event as a result of which a person becomes a beneficial owner of ownership interests representing 50% or more of the voting power of the outstanding ownership interests in the Company or Cosan, or is entitled to elect the majority of the directors of the Company or Cosan, as applicable, (b) any direct sale, assignment, exchange, gift or other transfer or disposition of any equity securities of the Company to a competitor of the Company in the lubricants field, (c) a transfer of 15% or more of equity interests in Cosan to any person or entity directly or indirectly engaged in the research, development, manufacture, production or blending of lubricants, lubricant-related materials or finished lubricant products pursuant to certain criteria set forth in the distribution agreements who should hold such interests for at least nine months after such transfer, or the execution of any shareholders agreement of Cosan in connection with any transfer of such interests, (d) any direct sale, assignment, exchange, gift or other transfer or disposition of the lube oil blending plants owned, operated or leased by the Company and (e) any direct sale, assignment, exchange, gift or other transfer or disposition of the lube oil blending plants owned, operated or leased by the Company, which would cause ExxonMobil to be in violation in any material respect of any applicable law. With respect to the United States ExxonMobil distribution agreement, ExxonMobil has the right to consent to any sale, assignment or other transfer of the Company’s interests in the distribution agreement or the Company’s distribution business or a change of control, and ExxonMobil has the right upon any of the aforementioned transfers to immediately terminate such agreement if such transfers are conducted without ExxonMobil’s prior written consent. Subject to the terms of such agreement, a change of control may include the following: (a) any event as a result of which a person becomes a direct or indirect beneficial owner of ownership interests representing 50% or more of the voting power of the outstanding ownership interests in the Company or becomes a direct owner of ownership interests representing 50% or more of the voting power of the outstanding ownership interests in CLI, or is entitled to elect the majority of the directors of the Company or CLI, as applicable, (b) any direct sale, assignment, exchange, gift or other transfer or disposition of any equity securities, voting securities or any other form of ownership interest in and of the Company or CLI (excluding transactions creating liens over the Company’s or CLI’s assets for purposes of pledging collateral in certain financing transactions) to a competitor in the lubricants field or (c) any such transaction involving the Company not entered into with a competitor in the lubricants field that, exclusively as a result of such transaction, would cause ExxonMobil to be in violation in any material respect of any applicable laws.
Right of First Refusal. Pursuant to certain of our ExxonMobil distribution agreements, in connection with any proposed change in control, including a transfer of Cosan-level equity interests, to a competitor of the Company in the lubricants field, ExxonMobil may have the right to match the offer of any proposed transferee and acquire the relevant assets to be transferred pursuant to the terms, the applicable purchase price and conditions as those contained in such offer with respect to the offered assets. In addition, under the United States lubricants distributor agreement, ExxonMobil may also have the alternative to substitute the Company as a party by assigning the contract to a third-party transferee that is creditworthy and aligned with ExxonMobil’s policies, pursuant to the terms, the applicable purchase price and conditions as those contained in the offer with respect to the offered assets.
Material Breach. Generally, parties may terminate the relevant ExxonMobil distribution agreement if the other party has materially breached any of its obligations under any such agreements or certain ancillary agreements, such as trademark license agreements or services agreements, and fails to remedy that breach within the specified period of time set forth in such distribution agreements after receipt of notice of a breach. Acts or events that are within the control of each such party and thus are liable to result in a material breach by such party may include the following:
| · | with respect to ExxonMobil, any false statements or detrimental behavior by ExxonMobil with respect to ExxonMobil proprietary marks or to the reputation or goodwill associated with the Company and its affiliates; the termination of certain ancillary agreements; any material change in the applicable laws and subsequent failure to successfully renegotiate the terms of the relevant distribution agreements; any |
material failure to comply with the applicable laws; any breach of confidentiality obligations; a failure by ExxonMobil to maintain our exclusive appointment within territories subject to exclusivity covenants; any materially adverse product removal, changes or discontinuances; and failure of certain performance objectives for the periods of time set forth in such agreements; and
| · | with respect to the Company, any unauthorized change of control; any adverse changes to our active management, ownership, financial assets, real or personal property, or effective control; any materially adverse suspension, loss or condemnation of our facilities; any false statements or detrimental behavior by the Company with respect to the ExxonMobil proprietary marks or to the reputation or goodwill associated with ExxonMobil; any material misrepresentation by the Company of the representations and warranties made under the distribution agreements; any submission by the Company of misleading, false or fraudulent reports or statements, including claims for any refund, credit, rebate, incentive, allowance, discount, reimbursement or other payment from ExxonMobil; certain third-party trademark infringement claims attributable to any act by us or our affiliates with respect to ExxonMobil products; any breach of certain export controls and trade sanctions; any material failure to comply with the applicable laws; criminal conviction of, or a finding of, civil liability against the Company or any of the Company’s principal owners or managers of any crime or violation of law that in ExxonMobil’s opinion may adversely affect the reputation or interests of the Company or ExxonMobil; noncompliance with certain anti-corruption commitments and representations; a material violation of certain ExxonMobil quality control requirements applicable to our operations; any breach of confidentiality obligations; any failure to comply and to correct or have corrected any deficiencies pursuant to the applicable quality control requirements; the occurrence of certain material adverse effects; failure by us to operate our distributorship in the ordinary course of business; a continuing default in the payment of fees and that is not subject to good faith dispute resolution or not remedied within the time period provided; upon the termination of certain ancillary agreements; any material change in the applicable laws and subsequent failure to successfully renegotiate the terms of the relevant distribution agreement; any action by us or certain of our agents that is likely to cause material harm within the applicable territories to the value and reputation of the ExxonMobil proprietary marks; the unauthorized appointment of sub-distributors by us; any unacceptably high level of liabilities to assets or other financial instability in our audited financial statements (or in those of our successors) or any determination by ExxonMobil that it has insufficient security for payment of amounts owed by the Company; any material loss of business from a direct account caused by our negligence or that of any of our sub-distributors, agents or consultants; any judicial conviction for violation of antitrust laws designed to regulate monopoly and restraint of trade; any default in certain of our other ExxonMobil distribution agreements; the failure of our performance objectives or minimum or maximum purchase obligations for the periods of time set forth in such agreements; the Company’s conversion, or attempt to convert, the sales of ExxonMobil’s products or services; and the dissolution or liquidation, or commencement of an insolvency or bankruptcy proceeding, of the Company or Cosan, as applicable. |
Liquidated Damages. Certain of our ExxonMobil distribution agreements may set forth formulas for the calculation of damages that the breaching party will pay to the non-breaching party as liquidated damages if such distribution agreements are terminated prior to the expiration of their respective terms. Liquidated damages may be calculated by reference to the annual average of fees that were due and payable for the three-year period preceding the date of such termination.
Indemnification. Certain of our ExxonMobil distribution agreements require us to indemnify, defend and hold harmless ExxonMobil, its affiliates and their respective officers, directors, employees, agents and representatives and all of their respective successors and assigns from and against, and reimburse the aforementioned parties from any losses they may suffer or incur, arising from, in connection with or as a result of, the following events: any failure of any representation or warranty made by the Company in the distribution agreements to be true and correct; the Company’s breach of any covenant, agreement or obligation under the distribution agreements; the Company’s negligence, gross negligence or willful misconduct in the course of performing its obligations under the distribution agreements; any infringement of ExxonMobil’s intellectual property resulting from the Company’s failure to abide by certain of ExxonMobil’s quality control requirements or distribution guidelines; any breach of certain export controls and trade sanctions provisions of the distribution agreements; any contamination, adulteration, mislabeling, misidentification, misrepresentation or misdelivery of certain ExxonMobil products; recommendations or representations made by the Company to customers in connection with ExxonMobil products that are inconsistent with or supplemental to the product information provided by ExxonMobil; and claims and suits relating to
relationships the Company may have with any sub-distributors or seller of ExxonMobil’s products, including any relationship with a sub-representative, dealer, representative or agent of the Company, whether or not approved by ExxonMobil.
Firewall Agreement. In connection with the distribution agreement in Brazil, we and ExxonMobil entered into a firewall agreement (as superseded by a revised firewall agreement dated August 30, 2021). Such agreement acknowledges the existence of competitors of ExxonMobil in the lubricants and base stocks businesses inside and outside of such territories—namely, Raízen S.A. and the Comma line of lubricant and ancillary produced by us—and imposes certain obligations on us in order to guarantee and maintain the strict confidentiality of any commercially sensitive, confidential and/or proprietary information of ExxonMobil. In particular, we have agreed to take measures as these relate to Cosan’s business support center and Cosan and Raízen employees, board members, third parties, contractors and agents, our information technology systems, infrastructure, customer services, accounting, treasury back-office, human resources, procurement and operational departments in order to ensure the strict handling of any ExxonMobil confidential information by our employees and agents. The firewall agreement shall be effective during the time and for a period of 12 months after the date in which any such competitor affiliates cease to perform any activities for us.
PetroChoice Acquisition Facility
On May 23, 2022, our subsidiary Millennium Moove Corp., as borrower, entered into a senior secured term loan facility in an aggregate principal amount of US$450 million with JPMorgan Chase Bank, N.A., as administrative agent, JPMorgan Chase Bank, N.A., Bank of America, N.A., Citibank N.A., MUFG Bank, Ltd., Itaú Unibanco S.A. – Nassau Branch and The Bank of Nova Scotia, as lenders, Moove Lubricants Limited, Cosan Lubrificantes e Especialidades S.A., Cosan Lubes Investments Limited, Stryker Intermediate Holdings, Inc. (a former holding company of the PetroChoice group), or Stryker, and certain affiliates of Stryker as guarantors, and Delaware Trust Company, as collateral agent, for the purpose of financing the acquisition price and certain costs and expenses payable in relation to the acquisition by the borrower of all of the issued and outstanding shares of common stock of Stryker. The maturity date of the facility is May 3, 2027.
On September 4, 2024, our subsidiary Millennium Moove Corp. signed an amendment to our syndicated loan, entered into on May 23, 2022 in connection with our acquisition of PetroChoice. The amendment provides: (i) that the outstanding principal amount will be due in a single installment on the maturity date (May 3, 2027), instead of six bi-annual instalments; (ii) that the interest rate will be equal to term SOFR plus an additional applicable rate which ranges from 1.50% to 1.75% depending on the net leverage ratio (as defined in the facility), instead of ranging from 1.50% to 2.75% depending on the net leverage ratio and the time remaining to maturity; and (iii) for the removal of a mandatory prepayment requirement in the event we raise funds in excess of US$300 million in the capital markets. As a result, the maturity profile of our consolidated outstanding indebtedness increased to 2.7 years from 1.8 years, as of August 31, 2024. As of the date of this prospectus the outstanding amount under this facility is US$385.9 million.
The borrower’s obligations under the facility are secured by a lien on, and pledge of, all of the equity interests held directly or indirectly by the borrower in Stryker and its subsidiaries and certain assets and properties of Stryker and its subsidiaries, subject to customary exclusions, thresholds and baskets for dispositions.
The facility contains customary representations and warranties by the borrower and the guarantors, as applicable, as well as customary affirmative and negative covenants. The facility also contains optional and mandatory prepayment provisions. In addition, the facility also requires us, as successor in interest of the borrower’s ultimate parent under the facility, to maintain the following financial ratios through maturity of the facility: (i) net leverage ratio as of the end of any of our fiscal quarters shall not exceed 3.50:1.00; and (ii) interest coverage ratio (as defined in the facility) as of the end of any of our fiscal quarters shall not be less than 2.50:1:00. The facility also contains certain customary events of default, including an event of default relating to the termination of certain distribution agreements entered into by and among ExxonMobil, us and certain of our subsidiaries.
Properties
Our corporate headquarters are located in Rio de Janeiro, which include the majority of our product development, and our main office is located in São Paulo, State of São Paulo, where our principal executive offices,
sales, marketing and business operations are located. Our principal executive offices consist of approximately 15,000 square feet of space under two leasing agreements, one for each half of the building, which expire in March 2027 and November 2028, respectively. We also have offices in several other locations, including in the United Kingdom (Gravesend), in the United States (King of Prussia), in Argentina (Buenos Aires), in France (Lonrai) and in Portugal (Lisbon). We believe that our facilities are sufficient for our current needs.
We own six properties and lease 56 in the United States, in the states of Alabama, Colorado, Florida, Illinois, Indiana, Iowa, Kansas, Louisiana, Maryland, Minnesota, Missouri, New Jersey, New York, North Carolina, North Dakota, Ohio, Oklahoma, Pennsylvania, South Carolina, South Dakota, Tennessee and Texas. We own six properties in Brazil, in the state of Rio de Janeiro, and lease 28 properties in the Brazilian states of Alagoas, Amazonas, Bahia, Ceará, Espírito Santo, Goiás, Maranhão, Minas Gerais, Mato Grosso do Sul, Mato Grosso, Paraíba, Pernambuco, Piauí, Paraná, Rio de Janeiro, Rio Grande do Norte, Roraima, Rio Grande do Sul, Santa Catarina, Sergipe, São Paulo and Tocantins, which leases are located in our sub-distributor warehouses for the purpose of facilitating the issuance of invoices at the time of sale of our products. We also lease eight other properties in Brazil, three properties in Argentina and 11 in Europe, and own one property in the United Kingdom, which is our site in Gravesend that is described below.
We have six production plants. Two of our production plants are located in Brazil, one in the State of São Paulo where our “Tirreno” products are manufactured with an annual production capacity of approximately 27 million liters per year, and another one in the State of Rio de Janeiro, which is our largest plant, with an annual production capacity of approximately 400 million liters per year. We also have one plant in Gravesend, United Kingdom, with an annual production capacity of about 70 million liters per year. Our remaining three plants are in the United States, one in Wichita, Kansas, with an annual production capacity of about 80 million liters per year, one in Indianapolis, Indiana, with an annual production capacity of about nine million liters per year and another one in Charleston, South Carolina, with an annual production capacity of 20 million liters per year (as of December 31, 2023).
As of November 2019, we had a services agreement with a data center service provider for the provision of data services to us from its data centers in Pennsylvania and Georgia, both in the United States, and also had services agreements as of October 2015 and May 2018 from data centers providers in the United Kingdom.
We believe that our facilities are suitable and adequate for our business as presently conducted; however, we periodically review our facility requirements and may acquire new space to meet the needs of our business or consolidate and dispose of facilities that are no longer required. To the extent that demand for lubricants generally and demand for our products in particular increases, we may be required to expand our manufacturing facilities and/or purchase property and equipment for our existing manufacturing and research and development facilities. Any such capacity expansions will require significant additional capital expenditures and will require corresponding expansion of our supporting infrastructure, further development of our sales and marketing team, expansion of our customer base and strengthened quality control.
Intellectual Property
We rely on a combination of trademark, domain names and trade secret laws, as well as employee and third-party non-disclosure, confidentiality and other types of contractual arrangements to establish, maintain and enforce our intellectual property rights, including with respect to our proprietary rights related to our products and services. In addition, we license technology from third parties.
As of June 30, 2024, we did not own any copyrights but we did own three patents in Colombia, the United Kingdom and Argentina. We own over 250 trademarks, including “Moove,” “Comma,” “Petrochoice,” “Tirreno,” “TTA,” “Xflow” and “Ecofi,” and other valuable trademarks and designs covering various brands, products, programs and services, including “Moove Engineering Solutions,” “Cosan Lubrificantes,” “Petrochoice Gold,” “PCNow,” “Pede Direto,” “Medallion Plus,” “Eco Ultra” and “Dyna-Plex 21C.” We also own over 100 domain names registered in Brazil and abroad, including “moovelub.com,” “Commaoil.com,” Petrochoice.com,” “Tirreno.onmicrosoft.com,” “moovelubsolutions.com.br,” “estoquemoove.com.br,” “moovelubs.com.br,” “mooveservices.com.br,” “petrochoicegold.com,” “pcnow.store,” “medallion-plus.com,” “eco-ultra.com” and “dynaplex21c.com.”
Legal Proceedings
From time to time, we are involved in disputes that arise in the ordinary course of our business. Any claims against us, whether meritorious or not, can be time-consuming, result in costly litigation, require significant management time and result in the diversion of significant operational resources.
We are subject to a number of judicial and administrative proceedings, including civil and environmental, labor and tax law and social security claims and other proceedings, which we believe are common and incidental to business operations in general. We recognize provisions for legal proceedings in our financial statements, in accordance with accounting rules, when we are advised by independent outside counsel that (1) it is probable that an outflow of resources will be required to settle the obligation; and (2) a reliable estimate can be made of the amount of the obligation. The assessment of the likelihood of loss includes analysis by outside counsel of available evidence, the hierarchy of laws, available case law, recent court rulings and their relevance in the legal system. Our provisions for probable losses arising from these matters are estimated and periodically adjusted by management. In making these adjustments, our management relies on the opinions of our external legal advisors.
As of June 30, 2024, we have provisions recorded in our unaudited interim consolidated financial statements in connection with legal proceedings for which we believe a loss is probable in accordance with accounting rules, in an aggregate amount of R$451.5 million (R$485.5 million as of December 31, 2023). Provisions relating to probable losses are categorized into tax, civil and environmental, and labor, as described below. In addition, there are currently certain legal proceedings pending in which we are involved for which we have not recorded provisions, as we deem the likelihood of loss as possible. If adverse decisions are rendered against us in any of these legal proceedings, our results of operations or financial condition could be materially and adversely affected. The aggregate amount involved in proceedings for which our risk of loss has been deemed possible as of June 30, 2024 totaled R$4,308.5 million (R$4,066.1 million as of December 31, 2023), of which R$3,503.0 million (R$3,291.7 million as of December 31, 2023), R$536.6 million (R$517.3 million as of December 31, 2023), R$258.5 million (R$246.6 million as of December 31, 2023) and R$10.4 million (R$10.5 million as of December 31, 2023) were related to tax, civil, environmental and labor claims, respectively. The principal proceedings for which we deem the risk of loss as possible are described below.
Legal proceedings are inherently unpredictable and subject to significant uncertainties. If one or more cases were to result in a judgment against us in any reporting period for amounts that exceeded our management’s expectations, the impact on our results of operations or financial condition for that reporting period could be material. See “Risk Factors—Risks Relating to Our Business and Industry—We may be adversely affected by unfavorable outcomes in pending legal proceedings or our inability to post judicial collateral or provide guarantees in pending legal or administrative proceedings.”
Pursuant to an agreement entered into by us with Cosan in connection with CVC Fund VII’s investment in Moove, Cosan has agreed to reimburse, indemnify and hold us harmless for certain amounts we are held liable for and that arise out of certain legal proceedings. Of the total amount of provisions of R$451.5 million, R$4.4 million relates to proceedings for which Moove is ultimately responsible, whereas R$447.1 million relates to proceedings for which Cosan has an obligation to reimburse Moove.
For further information, see note 19 to our unaudited interim condensed consolidated financial statements and note 19 to our audited consolidated financial statements, each included elsewhere in this prospectus.
Tax Proceedings
As of June 30, 2024, we were defendants in 249 tax proceedings. We recorded provisions of R$419.5 million and R$422.2 million for tax proceedings involving probable risk of loss as of June 30, 2024 and December 31, 2023, respectively.
FINSOCIAL – set-off applications. Brazilian federal tax authorities are contesting Moove Brazil’s applications to offset credits resulting from overpaid FINSOCIAL taxes against other federal tax debts, arguing that the COFINS immunity applied only to the fiscal year in which the lawsuit was filed (i.e., in 1992). No judicial deposits were made for these proceedings. The provision for these proceedings amounted to R$331.8 million and R$326.2 million as of June 30, 2024 and December 31, 2023, respectively. The risk of loss in these proceedings is classified as probable. Amounts which we may have to pay pursuant to this legal proceeding are subject to reimbursement by Cosan.
Federal income tax – capital gain ExxonMobil. Brazilian federal tax authorities issued a tax assessment against Moove Brazil, holding the company accountable for withholding income tax allegedly owed on capital gains realized by ExxonMobil International Holdings B.V. and ExxonMobil Brasil Holdings B.V., foreign entities, concerning the sale of cooperatives based in the Netherlands. The portion of the assessment related to the application of the 150% penalty remains under consideration in the administrative courts, awaiting judgment on a special appeal. As of June 30, 2024, the total amount in dispute was R$1,424.6 million. The risk of loss is classified as possible for R$1,023.0 million and remote for R$401.4 million. Amounts which we may have to pay pursuant to this legal proceeding are subject to reimbursement by Cosan.
Goodwill on the acquisition of Esso. Brazilian federal tax authorities have issued four tax assessments against Moove Brazil regarding the collection of IRPJ and CSLL for the calendar years 2009 through 2018. Moove Brazil is contesting the assessments for the years 2012 through 2018 in administrative proceedings, while those for 2009 through 2011 are being challenged in judicial courts. As of June 30, 2024, the disputed amounts were as follows: R$652.8 million (for assessments relating to 2009, 2010 and 2011), R$191.4 million (for 2012), R$205.9 million (for 2013), R$47.1 million (for 2014 and 2015), R$52.7 million (for 2016) and R$117.5 million (for 2017 and 2018). The risk of loss in these proceedings is classified as possible for the disputed amounts. Amounts which we may have to pay pursuant to this legal proceeding are subject to reimbursement by Cosan.
ICMS. Moove Brazil is involved in a legal challenge against the Rio de Janeiro fiscal equilibrium fund (Fundo Estadual de Equilíbrio Fiscal), or FEEF, which has been replaced by the temporary budget fund (Fundo Orçamentário Temporário), or FOT (a deposit of 10% of ICMS tax exempted using tax benefits) imposed by certain Brazilian states on the industrialization and commercialization of lube oils. As of June 30, 2024 and December 31, 2023, judicial deposits of FEEF and FOT have been made totaling R$27.1 million and R$70.0 million, respectively. Additionally, there is a dispute over the collection of ICMS on certain amounts paid by exclusive distributors not connected with the sale of goods, such as territorial concession, support services for logistics and marketing optimization, and reimbursement of expenses. The total amount involved in these proceedings as of June 30, 2024 was R$354.5 million. The risk of loss in these proceedings is classified as possible.
Tax assessment notices. Moove Brazil is subject to tax claims relating to its reliance on the exemption of certain oil-derived lubricants from the tax on industrialized products (imposto sobre produtos industrializados), or IPI. The risk of loss is classified as possible for most of these tax claims in the amount of R$2,231.1 million and probable in the amount of R$6.8 million as of June 30, 2024.
Reassessment of the Chance of Loss in Certain Proceedings. According to the tax legislation in effect since 2014, amended in 2017, taxpayers benefiting from certain ICMS tax incentives can exclude the value of these incentives from the calculation basis for corporate income tax, subject to specific requirements and conditions. Moove benefits from these specific ICMS tax incentives. Therefore, we have adopted this tax treatment based on our comprehensive understanding of the matter, supported by the opinion of our external legal advisors. However, in 2023, a decision issued by the Brazilian Superior Court of Justice (Superior Tribunal de Justiça) introduced uncertainty regarding which types of ICMS tax incentives can and cannot be subjected to this tax treatment. Consequently, due to the uncertainty created by these developments, we evaluated that the likelihood of loss in certain legal proceedings involving Moove has increased from possible to probable. In April 2024, Moove joined the tax debt installment program set up by the Brazilian government and began paying these debts. As of June 30, 2024, the outstanding balance payable was R$44.2 million.
Civil and Environmental Proceedings
As of June 30, 2024, we were defendants in 184 civil proceedings. We recorded provisions of R$25.1 million and R$55.7 million for civil and environmental proceedings involving probable risk of loss as of June 30, 2024 and December 31, 2023, respectively.
Petroleum Comércio e Representações Ltda.’s breach of contract claim. Moove Brazil is the defendant in an indemnity lawsuit filed by Petroleum Comércio e Representações Ltda. The claimant seeks compensation for losses and damages arising from an alleged breach of contract. A first instance court ruled against Moove, requiring Moove
to pay an amount of R$11.2 million to the claimant. Moove successfully appealed the decision, and a counter-appeal by the claimant was rejected. The case is now due to be sent back to the first instance court for judgment. The aggregate amount involved is R$168.1 million. The risk of loss in these proceedings is classified as possible. Amounts which we may have to pay pursuant to this legal proceeding are subject to reimbursement by Cosan.
Environmental civil class action. Moove Brazil and ExxonMobil Química are being sued by the Prosecutor’s Office of the state of Rio de Janeiro for damages in an amount of R$30 million and an obligation to repair in relation to an alleged soil contamination at Moove Brazil’s operational complex, located in Rio de Janeiro’s Ilha do Governador neighborhood. The lawsuit is in the stage of production and presentation of evidence. As of June 30, 2024, the amount involved was R$133.9 million. The risk of loss in these proceedings is classified as possible. In the event of a loss, Moove Brazil may be required to implement environmental remediation measures and pay compensation in an amount to be determined. Amounts which we may have to pay pursuant to this legal proceeding are subject to reimbursement by Cosan.
Environmental civil class action. Moove Brazil, along with many other companies, is being sued by the Prosecutor’s Office of the municipality of São José dos Pinhais, State of Paraná, in connection with soil contamination. The municipality of São José dos Pinhais is seeking damages in a total amount of R$10.0 million. The lawsuit is currently pending the presentation of evidence. However, it has been suspended since March 2019. As of June 30, 2024, the amount involved was R$35.8 million. The risk of loss in these proceedings is classified as possible. Amounts which we may have to pay pursuant to this legal proceeding are subject to reimbursement by Cosan.
Environmental civil class action. Moove Brazil is being sued by the Municipality of Ulianópolis, by means of a civil class action for environmental damages related to alleged irregular waste disposal in a landfill located in the Municipality of Ulianópolis, in the state of Pará. The civil class action seeks compensation and environmental recovery for the environmental damages caused by pollution of an area formerly managed by a company that engaged in bauxite mining that began to provide industrial waste incineration services. The company in question went bankrupt and soil groundwater of the landfill is now contaminated. Eight other companies are involved in the same lawsuit and similar lawsuits have been filed against several other companies that the public prosecutor’s office claims have sent waste to such landfill. As a consequence, the plaintiff intends to declare all of the defendants as jointly and severally liable for restoring the environmental damage (i.e., contamination) involved therein and for providing indemnification for the damage caused to the environment, pursuant to Brazilian environment law and regulation. This lawsuit is in its initial phase, with no relevant progress following the presentation of Moove Brazil’s defense. The updated amount under discussion is approximately R$2.0 million, according to an opinion issued by the Public Prosecutor’s Office of the State of Pará (Ministério Público do Estado do Pará). The risk of loss in these proceedings is classified as possible. Amounts which we may have to pay pursuant to this legal proceeding are subject to reimbursement by Cosan.
Criminal proceeding. Moove Brazil is party to a criminal proceeding commenced by the Public Prosecutor’s Office of Pará for the alleged environmental crime of pollution. The underlying facts are the same as those in the environmental civil class action referred to immediately above. In March 2017, a decision was rendered recognizing that the statute of limitations had expired against the Public Prosecutor’s Office claim against Moove Brazil. The prosecution filed an appeal, which the court of appeals has allowed to proceed. We are currently awaiting service of process for the recommencement of the criminal proceeding. Potential sanctions were Moove Brazil to be held liable include fines as well as the imposition of penalties that restrict certain rights, such as the suspension of activities or prohibition to enter into contracts with public authorities. The risk of loss has been classified as possible. Amounts which we may have to pay pursuant to this legal proceeding are subject to reimbursement by Cosan.
Administrative fine. Moove Brazil is being fined in the amount R$35 million by the State Environment Agency (Instituto Estadual do Ambiente) of Rio de Janeiro, for allegedly releasing liquid waste into the Guanabara Bay, in violation of the requirements established by laws and environmental regulations. An anticipated production of evidence action was filed. The expert evidence was favorable to Moove Brazil, as it demonstrates that Moove Brazil did not engage in any irregularities. The expert evidence has already been ratified by the court and submitted to the administrative prosecution. We are currently awaiting the analysis of the abovementioned evidence and the administrative judgment of the State Environment Agency of Rio de Janeiro. As of June 30, 2024, the amount involved was R$62.7 million. The risk of loss in these proceedings is classified as possible.
Labor Proceedings
As of June 30, 2024, we were defendants in 74 labor proceedings. We recorded provisions of R$6.8 million and R$7.6 million for labor proceedings involving probable risk of loss as of June 30, 2024 and December 31, 2023, respectively.
Management
We are managed by our board of directors and by our senior management, pursuant to our Memorandum and Articles of Association and the Companies Act.
Board of Directors
As of the date of this prospectus, our board of directors is composed of eight members. Within one year of the date of this prospectus, the size of our board of directors is expected to increase to nine members to add an independent, Class III, director. Each director holds office for the term, if any, fixed by the shareholder resolution that appointed him or her, or, if no term is fixed on the appointment of the director, until the earlier of his or her removal from or vacating office as a director in accordance with our Memorandum and Articles of Association. Directors appointed by the board of directors hold office until the next annual general meeting. Our directors do not have a retirement age requirement under our Memorandum and Articles of Association.
The following table presents the names of the current members of our board of directors.
Name | Age | Class | Position(s) |
| Rubens Ometto Silveira Mello | 73 | I | Chairman |
| Filipe Affonso Ferreira(2) | 58 | I | Director |
| Marcelo Eduardo Martins(2) | 56 | I | Director |
| Nelson Roseira Gomes Neto | 53 | II | Director |
| Fernando Pinto | 48 | II | Director |
| Jean-Marc Etlin(2) | 61 | II | Director |
| (1) | | III | Independent Director |
| (1) | | III | Independent Director |
| (1) | Member of the Audit Committee. |
| (2) | Member of the Remuneration Committee. |
The following is a brief summary of the business experience of our directors. Unless otherwise indicated, the current business addresses for our directors is Av. Brigadeiro Faria Lima, 4,100 – 8th floor São Paulo – SP, 04538-132, Brazil.
Rubens Ometto Silveira Mello. Mr. Mello is the chairman of our board of directors, a position he has held since November 2023. He was the chairman of the board of directors of Cosan Lubes Investments Limited, our prior holding company, starting in June 2012. He is also chairman of the board of directors of Cosan S.A., since 2000, chairman of the board of directors of Compass Gás e Energia S.A., since 2014, chairman of the board of directors of Grupo Radar, since 2008, chairman of the board of directors of Rumo S.A., since 2015, chairman of the board of directors of Raízen S.A., since 2011, and a member of the board of directors of many subsidiaries within the foregoing business groups, as well as the controlling shareholder of the Cosan Group. He was also chairman of the board of directors of Companhia de Gás de São Paulo – Comgás from 2012 until 2024. Mr. Mello has more than 50 years of experience in the management of large companies. He has also served as planning supervisor, financial manager and as administrative and financial superintendent of Costa Pinto S.A., from 1983 to 1990, and officer and chairman of the board of directors of Aguassanta Participações S.A., since 2001. He is also one of the founders of UNICA, the Sugarcane Agroindustry Association of the state of São Paulo (UNICA – União da Agroindústria Canavieira do Estado de São Paulo). Prior to joining Cosan S.A., Mr. Mello worked from 1971 to 1973 as an advisor to the board of executive officers of UNIBANCO – União de Bancos Brasileiros S.A., and from 1973 to 1980 as chief financial officer of Indústrias Votorantim S.A. He holds a bachelor’s degree in mechanical engineering from the Escola Politécnica da Universidade de São Paulo, with a postgraduate degree in finance from the Universidade Metodista de Piracicaba – UNIMEP and an MBA in business management from Fundação Getúlio Vargas – FGV and also studied at Ohio University.
Marcelo Eduardo Martins. Mr. Martins is a member of our board of directors, a position he has held since November 2023. He was a member of the board of directors of Cosan Lubes Investments Limited, our prior holding company, starting from May 2012 to March 2019, and now again since August 2020. He was also member of the
board of directors of Cosan S.A. from 2010 until March 2019, and now again since January 2021. Mr. Martins was an officer of Cosan S.A. from 2009 until 2015, and now again since 2017. He was a member of the board of Radar II Propriedades Agrícolas S. A., from September 2012 until November 2016. He is currently a member of the board of directors of Compass Gás e Energia S.A., since 2019, a member of the board of directors of Rumo S.A., since 2019, a member of the board of directors of Raízen S.A., since 2011, and a member of the board of directors of many subsidiaries within the foregoing business groups. He was also a member of the board of Companhia de Gás de São Paulo – Comgás from November 2012 until June 2023. Mr. Martins became an executive officer of Aguassanta Participações S.A. in July 2007. He is the chief strategy officer and former chief financial officer and investor relations officer of Cosan S.A. Prior to joining the Cosan Group, Mr. Martins was the chief financial and business development officer of Votorantim Cimentos between July 2003 and July 2007 and, before that, the head of Latin American Fixed Income at Salomon Smith Barney (Citigroup) in New York. He has significant experience in capital markets, having worked at Citibank (where he began his career as a trainee in 1989), Unibanco, UBS and FleetBoston. He has a bachelor’s degree in business administration from Fundação Getulio Vargas – FGV, specializing in finance.
Nelson Roseira Gomes Neto. Mr. Gomes Neto is a member of our board of directors, a position he has held since November 2023. He was a member of the board of directors of Cosan Lubes Investments Limited, our prior holding company, from October 2012 until March 2019. He has been the Chief Executive Officer of Cosan S.A. since January 2024. He is also chairman of the board of directors of Companhia de Gás de São Paulo – Comgás, since April 2024, having served as its chief executive officer and investor relations officer from November 2015 until October 2020. He is a member of the board of directors of Compass Gás e Energia S.A., since 2019, where he also served as an executive officer from 2020 until December 2023. He is also a member of the board of directors of Raízen S.A., since January 2024. He joined ExxonMobil Corporation in 1991 as a trainee. Throughout the course of his career, he has served in positions of increasing managerial responsibility in several business lines such as Fuels Marketing, Convenience Retailing, Natural Gas, and since 2001 as part of Lubricants business. In February 2008, he was appointed Brazil Lubricants Officer to Esso Brasileira de Petroleo Limitada, and in December 2008, he was appointed as Vice President of the Lubricants segment. Mr. Gomes Neto holds a bachelor’s degree in engineering from Catholic University of Paraná, a master’s degree in corporate finance at Fundação Getulio Vargas – FGV and an MBA from Coppead – Universidade Federal do Rio de Janeiro.
Fernando de Oliveira Pinto. Mr. Pinto is a member of our board of directors, a position he has held since March 2019. He joined CVC in 2016 and is currently a partner and Head of Latin America. Mr. Pinto has served as an administrator of CVC Advisers Latam Representação Consultoria Ltd. since February 2016. Mr. Pinto is based in São Paulo and oversees CVC’s private equity activities across Latin America. Prior to joining CVC, he worked as a managing director at the Carlyle South America buyout fund from 2008 to 2016. He has a bachelor’s degree in public administration from Fundação Getulio Vargas – FGV, a law degree from the University of São Paulo and an MBA from the Stanford Graduate School of Business.
Jean-Marc Robert Nogueira Baptista Etlin. Mr. Etlin is a member of our board of directors, a position he has held since March 2019. He joined CVC Capital Partners in 2016 and is currently Senior Advisor for Latin America. Prior to joining CVC, Mr. Etlin was the chief executive officer of Itaú BBA Investment Bank and member of the bank’s Management Committee from 2005 to 2015. From 1997 to 2004, he was a Managing Director at UBS Investment Bank and Co-Head of Latin America Investment Banking. From 1992 to 1995, Mr. Etlin was a partner of Montemayor Asset Management, a New York-based hedge fund. From 1984 to 1987 and from 1989 to 1991, Mr. Etlin was at J.P. Morgan & Co., finishing as a Vice President, with various assignments in São Paulo, New York and Paris. In addition, Mr. Etlin is administrator of Lhoist S.A. in Brussels, since January 2012, a member of SHV Holdings N.V.’s supervisory board in Utrecht, since January 2015, a member of Sotheby’s International advisory board in New York, since January 2015, a board member of the São Paulo Museum of Modern Art (MAM), since 2011, and a board member of RenovaBR in São Paulo, since June 2020. He has a bachelor’s degree in business administration from Fundação Getulio Vargas – FGV and holds an MBA from INSEAD.
Filipe Affonso Ferreira. Mr. Ferreira is a member of our board of directors, a position he has held since November 2023. He was a member of the board of directors of Cosan Lubes Investments Limited, our prior holding company, starting from March 2019. Mr. Ferreira has served as the chief executive officer of Moove Brazil since January 2017. He began his career in finance, covering the areas of strategic planning and business management in large multinational companies such as Alcoa, Mars, from 1998 to 2004 and 2009 to 2011, Goodyear, from 2012 to 2013, and Bunge, from 2012 to 2016. At the last three companies, he held the position of chief executive officer for
Brazil and Latin America. Mr. Ferreira holds a bachelor’s degree in business administration from Pontifícia Universidade Católica de Campinas.
Executive Officers
Our executive officers are responsible for the management and representation of our company.
The following table lists our current executive officers:
Name | Age | Position(s) |
| Filipe Affonso Ferreira | 58 | Chief Executive Officer |
| Lineu Paulo Moran Filho | 48 | Chief Financial Officer |
| Gerson Francisco | 55 | Vice-President, South America |
| José Alexandre Magalhães Baptista | 51 | Vice-President, Planning and Supply Strategy |
| Alexandra Sabiá | 52 | Vice-President, People and Culture |
| Mara Justo Pezzotti | 57 | Vice-President, Europe and Marketing Solutions |
| José Carlos Torresan Rapacci | 53 | Vice-President, North America |
The following is a brief summary of the business experience of our executive officers. Unless otherwise indicated, the current business addresses for our executive officers is Av. Brigadeiro Faria Lima, 4,100 – 8th floor São Paulo – SP, 04538-132, Brazil.
Filipe Affonso Ferreira. See “—Board of Directors” above.
Lineu Paulo Moran Filho. Mr. Moran is Vice-President of Finance, a position he has held since late 2017. He has over 25 years’ experience in the fuels and lubricants industry, as well as working in the aeronautics sector. He has been at Moove since 2010, including eight years as chief financial officer, and has experience in strategic planning activities, business development, M&A projects and joint ventures, in Brazil and abroad. Before that, he led the Business Development and Aircraft Maintenance Business Unit at Lider Aviação for three years, from 2008 to 2010 and, in the 10 years he spent at ExxonMobil, from 1998 to 2008, he worked in the commercial, marketing and planning areas in Brazil and South America. He has a bachelor’s degree in production engineering and postgraduate qualifications in business management from Fundação Getulio Vargas – FGVSP/Brazil and Coppead/Brazil – Universidade Federal do Rio de Janeiro.
Gerson Francisco. Mr. Francisco is Vice-President of the South America Business Unit of Moove, a position he has held since 2018. Mr. Francisco has worked in the commercial areas of large national and multinational companies such as Johnson & Johnson, for two years from 1991 to 1993, as a sales promoter, Bauducco, from September 1998 to January 2006, as Sales Supervisor, Key Account Manager and National Manager, Mars, from 1993 to 1995 at sales and then from 2006 to 2011, as National Key Accounts Manager, Sales Manager, Business Officer and Sale Strategies Officer, LBR, from 2011 to 2013, as commercial and marketing officer, and Bunge, from 2013 to 2017, as consumption officer. He has a bachelor’s degree in communication from Pontifícia Universidade Católica do Paraná and holds an MBA in business administration from Fundação Getúlio Vargas – FGV.
José Alexandre Magalhães Baptista. Mr. Baptista is Vice-President of Planning and Supply Strategy at Moove, a position he has held since 2016. With 30 years’ experience, he began his career in the technical area of ExxonMobil’s additive and chemicals division in Rio de Janeiro and worked his way up in the company in the areas of quality, planning management, production and administration, from 1991 to 2008. Mr. Baptista was the former Chief Operation Officer from 2008 to 2015 at Ilha do Governador plant in Rio de Janeiro and led the team during a period of volume growth and modernization in Moove’s operational activities. Today, he supports the company’s internationalization by being responsible for base oils and additives global negotiations and supply, finished lubes formulations and product line management as well as the base oils distribution business. He has a bachelor’s degree in chemical engineering and postgraduate qualifications in strategic business management and productivity and quality management technologies from Universidade Estadual do Rio de Janeiro, Universidade Federal do Rio de Janeiro, Universidade Federal Fluminense and Institute for Management Development (IMD).
Alexandra Sabiá. Ms. Sabiá is Vice-President of People and Culture at Moove, a position she has held since 2024. She has been at Moove for five years. She has extensive experience in strategic Human Resources planning and management and cultural development in major national and multinational companies in the health and beauty, metallurgy, food and telecommunications segments, such as Johnson & Johnson, from 2010 to 2017, as Brazil Human Resources officer & LATAM Talent Management officer, Van Melle, from 1987 to 1989, as Human Resources Assistant, Itautec Philco, from 1989 to 1997, as Training & Development Analyst, and Motorola, from 1997 to 2010, as manager, where she worked in Monterrey, in Mexico, for two years as head of new business start-ups at Home & Networks. She has a bachelor’s degree in education and a postgraduate qualification in people management in a changing environment from Fundação Getúlio Vargas – FGV and Leadership & Culture at Cornell University.
Mara Lourdes Justo Pezzotti. Ms. Pezzotti is Vice-President for Europe and Marketing Solutions at Moove, a position she has held since 2017. She is currently responsible for global marketing, trade and revenue management, as well as in the leadership of European business. She has over 25 years’ experience in marketing, consumer insight and strategic planning. She has led successful turnaround and brand building processes. She started her career at Kimberly-Clark, from 1992 to 1996, as Brand Manager, and worked for more than 10 years in different positions at Unilever, from 1996 to 2007, leading businesses and brands such as Seda, Dove and Comfort. She was general manager at Weleda Brasil, from 2007 to 2011, as well as working at Cosan Alimentos, from 2011 to 2012, with the União brand and Bunge, from 2014 to 2017. She has a bachelor’s degree in literature from Pontifícia Universidade Católica de São Paulo, with an MBA in marketing and business from ESPM Escola Superior de Propaganda e Marketing, and a Post MBA in Advanced Boardroom Program for Women from Saint Paul Escola de Negócios. She was also a member of the board of directors of Instituto Luísa Pinho Sartori, a nonprofit supporting conservation projects and related scientific research, from May 2021 to March 2023, and of Brado Logística, a container logistics intelligence company, from May 2022 to December 2023.
José Carlos Torresan Rapacci. Mr. Rapacci is head of Moove’s North American operations, a position he has held since June 2022. He is a seasoned senior executive, with over 30 years of experience, with an extensive international background in marketing, sales and operations management in large fast-moving consumer goods companies. Mr. Rapacci worked at Reckitt-Benckiser from 2000 to 2002 as regional category manager; at Kimberly-Clark from 2002 to 2004, as Latin America Marketing Manager and from 2004 to 2007 as Personal Care Regional Marketing Manager; and Mars from 2007 to 2012, as marketing director, from 2012 to 2015, as sales director and from 2015 to 2022, as chief executive officer of the pet food business in Brazil. He has extensive skills in portfolio management, brand building, category development, route-to-market strategies, customer relationships, and point-of-sales execution. Mr. Rapacci holds a bachelor’s degree in Business Administration from Fundação Getúlio Vargas – FGV.
Family Relationships
There are no family relationships among any of our executive officers or directors.
Classified Board of Directors
We intend to adopt an amended and restated Memorandum and Articles of Association that will become effective immediately prior to the completion of this offering. Our amended and restated Memorandum and Articles of Association will provide that, immediately after the completion of this offering, our board of directors will be divided into three classes with staggered three-year terms. Only one class of directors will be elected at each annual meeting of shareholders, with the other classes continuing for the remainder of their respective three-year terms. Our current directors will be divided among the three classes as follows:
| · | the Class I directors will be Rubens Ometto Silveira Mello, Filipe Affonso Ferreira and Marcelo Eduardo Martins, and their terms will expire at the annual meeting of shareholders to be held in 2025; |
| · | the Class II directors will be Nelson Roseira Gomes Neto, Fernando Pinto and Jean-Marc Etlin, and their terms will expire at the annual meeting of shareholders to be held in 2026; and |
| · | the Class III directors will be , and their terms will expire at the annual meeting of shareholders to be held in 2027. |
Each director’s term will continue until the election and qualification of his or her successor, or his or her earlier death, resignation or removal. Any increase or decrease in the number of directors will be distributed among the three classes so that, as nearly as possible, each class will consist of one-third of our directors.
This classification of our board of directors may have the effect of delaying or preventing changes in control of our company.
Foreign Private Issuer Status
NYSE listing rules include certain accommodations in the corporate governance requirements that allow foreign private issuers, such as us, to follow “home country” corporate governance practices in lieu of the otherwise applicable corporate governance standards of the NYSE, except that we are required: (i) to have an audit committee or audit board that meets certain requirements, pursuant to an exemption available to foreign private issuers (subject to the phase-in rules described under “—Committees of the Board of Directors—Audit Committee”); (ii) to provide prompt certification by our chief executive officer of any material noncompliance with any corporate governance rules; and (iii) to provide a brief description of the significant differences between our corporate governance practices and the NYSE corporate governance practice required to be followed by U.S. listed companies.
We currently follow the corporate governance practices of the Cayman Islands in lieu of the corporate governance requirements of the NYSE in respect of the following:
| · | the majority independent director requirement under Section 303A.01 of the NYSE listing rules—as allowed by the laws of the Cayman Islands, independent directors do not comprise a majority of our board of directors; |
| · | the requirement under Section 303A.05 of the NYSE listing rules that a compensation committee comprised solely of independent directors governed by a compensation committee charter oversee executive compensation—as allowed by the laws of the Cayman Islands, our remuneration committee is not comprised solely of independent directors; |
| · | the requirement under Section 303A.04 of the NYSE listing rules that director nominees be selected or recommended for selection by either a majority of the independent directors or a nominating committee comprised solely of independent directors—as allowed by the laws of the Cayman Islands, we currently do not have a nominating committee; |
| · | the requirement under Section 303A.08 of the NYSE listing rules that a listed issuer obtain shareholder approval when it establishes or materially amends a share option or purchase plan or other arrangement pursuant to which shares may be acquired by officers, directors, employees or consultants; |
| · | the requirement under Section 312.03 of the NYSE listing rules that a listed issuer obtain shareholder approval prior to issuing or selling securities (or securities convertible into or exercisable for common or ordinary shares) that equal 20% or more of the issuer’s outstanding common or ordinary shares or voting power prior to such issuance or sale; and |
| · | the requirement under Section 303A.03 of the NYSE listing rules that the independent directors have regularly scheduled meetings with only the independent directors present—the laws of the Cayman Islands do not require that independent directors regularly have scheduled meetings at which only independent directors are present. |
Cayman Islands law does not impose a requirement that the board consist of a majority of independent directors or that such independent directors meet regularly without other members present. Nor does Cayman Islands law impose specific requirements on the establishment of a compensation committee or nominating committee or nominating process.
Director Independence
Our board of directors has undertaken a review of the independence of each director. Based on information provided by each director concerning his background, employment and affiliations, our board of directors has
determined that do not have a relationship that would interfere with the exercise of independent judgment in carrying out the responsibilities of a director and that each of these directors is “independent” as that term is defined under the listing standards of the NYSE. In making these determinations, our board of directors considered the current and prior relationships that each non-employee director has with our company and all other facts and circumstances our board of directors deemed relevant in determining their independence, including the beneficial ownership of our share capital by each non-employee director, and the transactions involving them described in the section titled “Certain Relationships and Related Party Transactions.”
Audit Committee
Our audit committee consists of , with serving as chairperson. Our board of directors has determined that meets the requirements for independence under the listing standards of the NYSE and SEC rules and regulations. Each member of our audit committee also meets the financial literacy and sophistication requirements of the listing standards of the NYSE. In addition, our board of directors has determined that is an audit committee financial expert within the meaning of Item 407(d) of Regulation S-K under the Securities Act. Following the completion of this offering, our audit committee will, among other things:
| · | select a qualified firm to serve as the independent registered public accounting firm to audit our financial statements; |
| · | help to ensure the independence and performance of the independent registered public accounting firm; |
| · | discuss the scope and results of the audit with the independent registered public accounting firm, and review, with management and the independent registered public accounting firm, our interim and year-end results of operations; |
| · | develop procedures for employees to submit concerns anonymously about questionable accounting or audit matters; |
| · | review our policies on risk assessment and risk management; |
| · | review related party transactions; and |
| · | approve or, as required, pre-approve, all audit and all permissible non-audit services, other than de minimis non-audit services, to be performed by the independent registered public accounting firm. |
Our audit committee will operate under a written charter, to be effective prior to the completion of this offering, that satisfies the applicable rules and regulations of the SEC and the listing standards of the NYSE.
Remuneration Committee
Our remuneration committee consists of Filipe Affonso Ferreira, Marcelo Eduardo Martins and Jean-Marc Etlin with serving as chairperson. Following the completion of this offering, our remuneration committee will, among other things:
| · | oversee our executive compensation and benefit plans; |
| · | assist our board of directors in the management of our stock option plan, phantom shares plan and other equity-based incentive plans; |
| · | oversee the evaluation process for our executive officers; and |
| · | assist our board of directors with its executive officer succession plan. |
Our remuneration committee operates under a written charter adopted by our board of directors. As permitted by the listing requirements of the NYSE, we have opted out of Section 303A.05 of the NYSE listing rules, which requires that a remuneration committee consist entirely of independent directors.
Controlled Company Exception
Immediately after the completion of this offering, Cosan will beneficially own % of our common shares, representing % of the voting power of our outstanding share capital (or % if the underwriters exercise their option to purchase additional common shares in full). As a result, we will be a “controlled company” within the meaning of the corporate governance standards of the NYSE corporate governance rules. Under these rules, a company of which more than 50% of the voting power in the election of directors is held by an individual, group or another company is a “controlled company” and may elect not to comply with certain corporate governance requirements.
As a “controlled company,” we may elect not to comply with certain corporate governance standards, including the requirements (1) that a majority of our board of directors consist of independent directors; (2) that our board of directors have a compensation committee that is comprised entirely of independent directors with a written charter addressing the committee’s purpose and responsibilities; and (3) that our board of directors have a nominating and corporate governance committee that is comprised entirely of independent directors with a written charter addressing the committee’s purpose and responsibilities. For so long as we qualify as a controlled company, we may take advantage of these exemptions. Accordingly, our shareholders may not have the same protections afforded to shareholders of companies that are subject to all of these corporate governance requirements. In the event that we cease to be a “controlled company” and our common shares continue to be listed on the NYSE, we will be required to comply with the corporate governance standards within the applicable transition periods.
Code of Business Conduct and Ethics
Our board of directors has adopted a code of business conduct and ethics that applies to all of our employees, officers and directors, including our chief executive officer, chief financial officer, and other executive and senior financial officers. The full text of our code of business conduct and ethics will be posted on the investor relations page on our website. We intend to disclose any amendments to our code of business conduct and ethics, or waivers of its requirements, on our website or in public filings. The information on our website is not incorporated by reference into this prospectus, and you should not consider information contained on our website to be a part of this prospectus.
Compensation of Directors and Officers
Overview
Under Cayman Islands law, we are not required to disclose compensation paid to our senior management on an individual basis and we have not otherwise publicly disclosed this information elsewhere. Our executive officers, directors and management receive fixed and variable compensation. They also receive benefits in line with market practice in our industry. The fixed component of their compensation is set on market terms and adjusted annually.
The compensation granted to our senior management will be subject to reduction, cancellation or recoupment under any written clawback policy that we are required to adopt pursuant to the listing standards of the New York Stock Exchange or as is otherwise required under applicable law, including the final rule issued by the SEC implementing the provisions of the Dodd-Frank Wall Street Reform and Consumer Protection Act relating to recoupment of incentive-based compensation.
For the six months ended June 30, 2024 and the years ended December 31, 2023, 2022 and 2021, the aggregate compensation expense for the members of the board of directors and our executive officers for services in all capacities was R$49.0 million, R$45.4 million, R$43.9 million and R$32.0 million, respectively, which includes both benefits paid in kind and compensation. See note 8 to our audited consolidated financial statements included elsewhere in this prospectus.
Stock Option Plan
Existing Stock Option Plan
We put in place a stock option plan in 2023. Grants under the stock option plan are conditioned on length of service (service condition) and linked to the occurrence of a liquidity event defined in the program (performance conditions). We currently have four separate programs to grant rights in place under the share option plan:
Program | Grant Date | Number of Shares
at Grant Date | Unit Fair Value
at Grant Date
(in R$) |
| SOP Program A | July 1, 2023 | 699,276 | 142.62 |
| SOP Program B | July 1, 2023 | 279,710 | 88.32 |
| SOP Program C | July 1, 2023 | 223,768 | 76.54 |
| SOP Program D | July 1, 2023 | 139,855 | 71.45 |
| Total | | 1,342,609 | |
The options granted to participants may only be exercised after they become vested options, and the maximum period for exercising such options is six years from the date of grant. The exercise price of the options covered by this program varies between R$50.05 for program A, R$106.28 for program B and R$135.05 for programs C and D, and is payable through the delivery of equity instruments concurrently with the acquisition of shares. A binomial model is used to measure fair value, with assumptions such as price of the base asset, distribution of dividends (a nil percent dividend yield), exercise price according to each model within the program, risk-free rate, volatility and effect of lock-up period linked to the exercise of vested options (program A immediately, programs B and C in one year and a half, and in two years and a half for program D).
The grant took place on July 1, 2023. The expense for the year ended December 31, 2023 is R$10.3 million (nil as of December 31, 2022). The expense in the six months ended June 30, 2024 is R$75.6 million.
All unvested share options under our stock option plan constituting shares in the aggregate will automatically vest upon the consummation of this offering. This will, immediately following this offering, dilute by approximately % the interest in our issued share capital of holders of our common shares.
See also note 18 to our unaudited condensed interim financial statements and note 17.2 to our audited consolidated financial statements included elsewhere in this prospectus.
New Equity Incentive Plan
Following the consummation of this offering, we may establish a new equity incentive plan with the purpose of advancing the interests of our shareholders by enhancing our ability to attract, retain and motivate talented individuals to perform at the highest level. The new equity incentive plan will govern issuances of equity incentive awards following the closing of this offering. We intend to reserve up to % of our common shares for issuance under the new equity incentive plan.
Phantom Shares Plan
On July 31, 2019, our board of directors approved a share-based compensation plan, or our phantom shares plan. The objective of this plan is to grant certain of our executive officers or employees, subject to certain conditions, rights over the appreciation of our shares, with settlement in cash, in order to: (i) stimulate the expansion, success, and achievement of our corporate objectives and the interests of our shareholders; and (ii) enable us to effectively attract and retain the services of high-quality management and employees. For the purposes of this plan, a “phantom share” means a unit representing a participant’s right to receive the full value corresponding to a certain number of shares on the calculation date, a measure created with the aim of facilitating the implementation of the plan and the calculation of any amount due to a participant.
Pursuant to our phantom shares plan, a specific number of units, referenced to a theoretical share price calculated based on our EBITDA, are nominally granted to beneficiaries. These units are paid out in cash upon meeting contractual conditions and after a vesting period of three to five years. Payments occur at the end of each
vesting cycle, determined by the converted value of the share at that time. Future payment provisions are accrued monthly based on EBITDA projections, which are reviewed quarterly by management. Beneficiary selection for the program is discussed and voted on by our board of directors and remuneration committee.
The right to receive phantom shares is conditioned upon the participant fulfilling certain conditions, including remaining continuously affiliated as our executive or employee during the vesting period, which shall commence on the date that an agreement is entered into with the participant and ends on the third to fifth anniversary thereof. The plan sets forth a formula for calculating the amounts and terms of any phantom shares granted. As of June 30, 2024 and December 31, 2023, we had the following phantom share plans in effect and phantom shares outstanding:
Phantom Share Plan | Grant Date | Vesting Date | Number of Shares | Unit Fair Value at Grant Date (in R$) |
| Phantom Share Plan I | July 31, 2019 | July 31, 2024 | 132,670 | 50.79 |
| Phantom Share Plan II | July 31, 2020 | July 31, 2025 | 106,952 | 61.89 |
| Phantom Share Plan III | July 31, 2021 | July 31, 2024 | 80,729 | 102.73 |
| Phantom Share Plan IV | July 31, 2022 | July 31, 2025 | 77,967 | 135.05 |
| Phantom Share Plan V | July 31, 2023 | July 31, 2026 | 82,204 | 150.98 |
| Total | | | 480,522 | |
In August 2024, plans I and III were liquidated and fully paid off.
For more information, see note 17 to our audited consolidated financial statements, included elsewhere in this prospectus.
Employment Agreements
None of our directors or executive officers have entered into service or employment agreements, as applicable, with the Company.
Directors’ and Officers’ Insurance
Prior to the consummation of this offering, we intend to contract civil liability insurance coverage for acts carried out by our directors and executive officers in the course of their duties.
Share Ownership
The shares and any other equity interests outstanding that are beneficially owned by our directors and officers and/or entities affiliated with these individuals are disclosed in the section entitled “Principal and Selling Shareholders.”
Shareholders’ Agreement
The following is a description of the principal terms of the shareholders’ agreement entered into on March 29, 2019 (as amended on November 28, 2023), among the Company (as successor in interest to Cosan Lubes Investments Limited), Cosan and CVC Fund VII, or the Shareholders’ Agreement. The discussion that follows is a summary of the Shareholders’ Agreement and is qualified in its entirety by reference to the full text of the Shareholders’ Agreement.
Voting Rights. The Shareholders’ Agreement grants CVC Fund VII certain qualified voting rights with respect to certain matters that may be put to a shareholder or board vote. For so long as CVC Fund VII holds at least 15% of our outstanding voting shares, we will not be able to take certain actions without CVC Fund VII’s consent, including any change to our organizational documents, tax policies, tax jurisdiction and material businesses; the approval of our annual budget in the event that we are financially underperforming; any disposition of assets or businesses, or the entry into any capital investments, commitments or transactions that meet certain thresholds set forth therein; creating, authorizing, allotting or issuing any equity securities or convertible debt securities in certain circumstances; any capital reductions or share repurchases, redemptions or conversions that meet certain conditions set forth therein; certain transactions with related parties or revisions of our employee stock option or equity compensation
plans; incurring indebtedness in certain circumstances; and certain other material events including our liquidation or dissolution or certain offerings or listings of our common shares, among other actions. These approval rights will lapse in part if CVC Fund VII’s equity interest falls below 15% and continues above 10% of our outstanding voting shares, and will lapse entirely if CVC Fund VII holds less than 10% of our outstanding voting shares.
Voting Governance. The Shareholders’ Agreement grants CVC Fund VII the right to (i) appoint two directors to our board of directors for so long as it holds 15% of our outstanding voting shares; and (ii) appoint one director to our board of directors for so long as it holds at least 10% but less than 15% of our outstanding voting shares. It also grants CVC Fund VII certain procedural and attendance rights should it come to hold a smaller interest of our outstanding voting shares. The agreement also provides that we shall be required to maintain a risk and audit committee and a compensation committee, and that CVC Fund VII shall have the right to appoint one member to each committee of the board, including the risk and audit committee and the compensation committee, for so long as it holds 15% of our outstanding voting shares. CVC Fund VII is also granted certain assessment, appointment and removal rights with respect to our chief executive and financial officers and shall have the right to meet periodically with such officers, provided in each case that certain conditions set forth in the Shareholders’ Agreement are met. We are also required to maintain a stock option plan limited to 4% of our aggregate share capital for our directors, executives and certain key employees, to be administered by our board of directors.
Non-Compete and Non-Solicitation. Pursuant to the Shareholders’ Agreement, CVC Fund VII has agreed not to directly or indirectly invest in, acquire securities (whether debt of equity) in, or enter into joint ventures, partnerships, profit sharing or similar arrangements with certain restricted businesses that compete with our business for up to nine months after the earlier of the termination of such agreement, our qualified initial public offering or such time as it comes to hold less than 10% of our outstanding voting shares. CVC Fund VII is also prohibited from employing or soliciting the employment of our senior employees during such term, subject to certain opportunities that it will be permitted to pursue as set forth in the Shareholders’ Agreement.
Transfer Restrictions. Cosan and CVC Fund VII have granted to each other certain transfer rights and agreed to certain transfer restrictions during the term of the Shareholders’ Agreement. Subject to certain exceptions, each such shareholder shall have a right of first offer in the event the other shareholder wishes to transfer its common shares; CVC Fund VII shall have tag along rights should Cosan wish to transfer its common shares to a third party; and both shareholders shall have preemptive rights in the event we decide to issue new common shares. Such restrictions shall generally lapse upon the occurrence or in connection with a qualified public offering of our common shares. Where CVC Fund VII is permitted to transfer its common shares pursuant to the terms of the Shareholders’ Agreement, it has agreed that certain restricted buyers, including certain of our competitors, will ultimately not be entitled to exercise the voting, governance and other rights that it currently enjoys under the Shareholders’ Agreement.
Qualified Public Offering. Cosan and CVC Fund VII are granted certain participation rights in the event we decide to carry out a qualified public offering. In particular, Cosan is permitted to appoint one or more financial intermediaries as lead managers and bookrunners, and both shareholders are permitted to participate in a secondary component of such offering, provided, that such participation is not deemed to jeopardize the offering as a whole by the relevant underwriters, provided further, that we are required to include in a secondary component of such offering a minimum of two of our common shares held by CVC Fund VII for every one common share we issue pursuant to a primary offering.
Miscellaneous. Cosan and CVC Fund VII have agreed to abide by certain customary covenants and confidentiality obligations and are granted certain customary information rights during the term of the Shareholders’ Agreement.
Termination. The Shareholders’ Agreement shall be terminated (i) if, upon a qualified public offering of our common shares, the equity interest of our largest shareholder drops below 50% of our total issued share capital, (ii) upon written agreement or (iii) upon our liquidation.
Proceedings Involving Management
Proceedings Involving Members of Our Management
Certain members of our management are parties to ongoing proceedings, as follows:
Mr. Rubens Mello
Mr. Rubens Mello and others were named as defendants in a criminal complaint filed on August 28, 2014 to determine whether they have committed tax evasion in connection with the alleged failure to adequately pay state value-added taxes (Imposto sobre Circulação de Mercadorias e Prestação de Serviços), or ICMS. The determination as to whether outstanding taxes are in fact due is at issue in a separate tax collection enforcement proceeding that is independent of the criminal proceeding. Bank letters of credit and insurance guarantees have been deposited with the relevant court in order to secure the amount in controversy. Given the fact that the crime of tax evasion requires there to be an actual loss to the tax authorities, such deposits have generally been interpreted by the Brazilian courts to eliminate criminal liability given that there would no longer exist a direct or indirect risk of harm to the public treasury and the allegedly illicit conduct of the defendants would no longer constitute a crime. This understanding, however, may change depending on the judge’s final decision. In view of the foregoing, the defense filed a motion requesting that the criminal proceedings (which are currently suspended) be terminated for lack of cause. As of the date of this prospectus, this criminal proceeding is stayed and awaiting final judgment of a motion to stay enforcement of the related tax proceedings. In the opinion of counsel responsible for the defense, the likelihood of a decision favorable to the defendants is possible. In any event the payment of the amounts due would be sufficient to extinguish criminal liability.
Mr. Rubens Mello and others were named as defendants in a criminal complaint filed on May 16, 2019 to determine whether they have committed tax evasion in connection with the alleged failure to adequately pay ICMS. The determination as to whether outstanding taxes are in fact due is at issue in a separate tax collection enforcement proceeding that is independent of the criminal proceeding. Bank letters of credit and insurance guarantees have been deposited with the relevant court in order to secure the amount in controversy. Given the fact that the crime of tax evasion requires there to be an actual loss to the tax authorities, such deposits have generally been interpreted by the Brazilian courts to eliminate criminal liability given that there would no longer exist a direct or indirect risk of harm to the public treasury and the allegedly illicit conduct of the defendants would no longer constitute a crime. This understanding, however, may change depending on the judge’s final decision. In September 2023, the court confirmed the previous decision that the criminal proceedings will be suspended until the final decision in motion to stay execution on tax sphere. In the opinion of counsel responsible for the defense, the likelihood of a decision favorable to the defendant is possible.
Mr. Rubens Mello and Mr. Marcelo Martins
Mr. Martins and Mr. Mello, together with other individuals, are named defendants in their capacities as executive officers and accountants of Nova América S/A Comercial, in certain criminal complaints filed by the prosecutors of the state of Rio de Janeiro in connection with the alleged commission of crimes against the tax order related to the alleged failure to adequately pay ICMS by Nova América. Mr. Martins and Mr. Mello and the other defendants were summoned and presented their defenses. In December 2021, the court ruled that the criminal complaint be suspended until the final decision in the motion to stay execution on the tax proceedings. As a result, this proceeding is currently stayed. In the opinion of the counsel responsible for the defense, the likelihood of a decision favorable to the defendant is possible.
Certain Relationships and Related Party Transactions
The agreements described in this section, or forms of such agreements as they will be in effect at the time of this offering, are filed as exhibits to the registration statement of which this prospectus forms a part, and the following descriptions are qualified by reference thereto. See also note 8 to our audited consolidated financial statements included elsewhere in this prospectus.
Limitation of Liability and Indemnification of Officers and Directors
Our Articles of Association provide that we shall indemnify and hold harmless our directors and officers against all actions, proceedings, costs, charges, expenses, losses, damages, liabilities, judgments, fines, settlements and other amounts incurred or sustained by such directors or officers, other than by reason of such person’s actual fraud, willful neglect or willful default, in or about the conduct of our company’s business or affairs (including as a result of any mistake of judgment) or in the execution or discharge of his duties, powers, authorities or discretions, including without prejudice to the generality of the foregoing, any costs, expenses, losses or liabilities incurred by such director or officer in defending (whether successfully or otherwise) any civil, criminal or other proceedings concerning us or our affairs in any court whether in the Cayman Islands or elsewhere.
Further, we have entered into or will enter into indemnification agreements with each of our directors and executive officers that may be broader than the specific indemnification provisions contained in the Delaware General Corporation Law. These indemnification agreements require us, among other things, to indemnify our directors and executive officers against liabilities that may arise by reason of their status or service. These indemnification agreements also require us to advance all expenses incurred by the directors and executive officers in investigating or defending any such action, suit or proceeding. We believe that these agreements are necessary to attract and retain qualified individuals to serve as directors and executive officers.
The limitation of liability and indemnification provisions that are expected to be included in our Memorandum and Articles of Association and in indemnification agreements that we have entered into or will enter into with our directors and executive officers may discourage shareholders from bringing a lawsuit against our directors and executive officers for breach of their fiduciary duties. They may also reduce the likelihood of derivative litigation against our directors and executive officers, even though an action, if successful, might benefit us and other shareholders. Further, a shareholder’s investment may be adversely affected to the extent that we pay the costs of settlement and damage awards against directors and executive officers as required by these indemnification provisions. At present, we are not aware of any pending litigation or proceeding involving any person who is or was one of our directors, officers, employees or other agents or is or was serving at our request as a director, officer, employee or agent of another corporation, partnership, joint venture, trust or other enterprise, for which indemnification is sought, and we are not aware of any threatened litigation that may result in claims for indemnification.
Prior to the consummation of this offering, we intend to obtain insurance policies under which, subject to the limitations of the policies, coverage will be provided to our directors and executive officers against loss arising from claims made by reason of breach of fiduciary duty or other wrongful acts as a director or executive officer, including claims relating to public securities matters, and to us with respect to payments that may be made by us to these directors and executive officers pursuant to our indemnification obligations or otherwise as a matter of law.
Certain of our non-employee directors may, through their relationships with their employers, be insured or indemnified against certain liabilities incurred in their capacity as members of our board of directors.
The underwriting agreement will provide for indemnification by the underwriters of us and our officers and directors for certain liabilities arising under the Securities Act or otherwise.
Insofar as indemnification for liabilities arising under the Securities Act may be permitted to directors, officers or persons controlling our company pursuant to the foregoing provisions, we have been informed that, in the opinion of the SEC, such indemnification is against public policy as expressed in the Securities Act and is therefore unenforceable.
Policies and Procedures for Related Party Transactions
Following the completion of this offering, our audit committee will have the primary responsibility for reviewing and approving or disapproving transactions with related parties. Our related party transaction policy states that any related party transaction must be approved or ratified by our audit committee, board of directors or a designated committee thereof. In determining whether to approve or ratify a transaction with a related person, our audit committee, board of directors or the designated committee will consider all relevant facts and circumstances, including without limitation the commercial reasonableness of the terms of the transaction, the benefit and perceived benefit, or lack thereof, to us, opportunity costs of alternate transactions, the materiality and character of the related person’s direct or indirect interest and the actual or apparent conflict of interest of the related person. Our audit committee, board of directors or the designated committee will not approve or ratify a related party transaction unless it has determined that, upon consideration of all relevant information, such transaction is in, or not inconsistent with, our best interests and the best interests of our shareholders.
Certain Related Party Transactions
We enter into transactions with entities which are part of the Cosan Group, including Raízen S.A. and Rumo S.A., which are owned 33.6% and 30.3% by Cosan S.A., respectively. In the normal course of our operations, we enter into agreements with these parties relating to the purchase and sale of finished products and raw materials, loans, leases of assets, and rendering of services. Related-party transactions between us and each of these entities are carried out by us under similar conditions to transactions with independent third parties, considering the usual market prices and conditions and, therefore, do not generate any undue benefit to our counterparties or losses to us.
The outstanding balances with related parties at the end of the fiscal year are not subject to interest and are paid in cash. No guarantees were given or received on any accounts receivable or payable involving related parties. At the end of each period, a recovery analysis of amounts receivable is made, and in the six months ended June 30, 2024 and year ended December 31, 2023 no provision was recognized.
The following table sets out information regarding the impact of our related party transactions on our balance sheet:
| | | As of
June 30, | | As of December 31, |
| | | 2024 | | 2023 | | 2022 |
| | | (in millions of reais) |
| Vale S.A. | | | 10.3 | | | | — | | | | — | |
| Raízen S.A. and subsidiaries | | | 8.2 | | | | 10.3 | | | | 16.5 | |
| Rumo S.A. | | | 5.5 | | | | 6.4 | | | | 8.5 | |
| Other | | | — | | | | 0.0 | | | | 0.0 | |
| Commercial transactions(1) | | | 24.0 | | | | 16.7 | | | | 25.0 | |
| | | | | | | | | | | | | |
| Cosan S.A.(2) | | | 17.9 | | | | 13.0 | | | | 7.6 | |
| Financial and corporate transactions | | | 17.9 | | | | 13.0 | | | | 7.6 | |
| | | | | | | | | | | | | |
| Total current assets | | | 41.9 | | | | 29.7 | | | | 32.6 | |
| | | | | | | | | | | | | |
| Cosan S.A.(2) | | | 629.0 | | | | 655.7 | | | | 765.1 | |
| Financial and corporate transactions | | | 629.0 | | | | 655.7 | | | | 765.1 | |
| | | | | | | | | | | | | |
| Total non-current assets | | | 629.0 | | | | 655.7 | | | | 765.1 | |
| | | | | | | | | | | | | |
| Total assets | | | 671.0 | | | | 685.4 | | | | 797.7 | |
| | | | | | | | | | | | | |
| Raízen S.A. and subsidiaries | | | 3.0 | | | | 2.5 | | | | 0.1 | |
| Rumo S.A. | | | 0.0 | | | | 0.0 | | | | 0.0 | |
| | | As of
June 30, | | As of December 31, |
| | | 2024 | | 2023 | | 2022 |
| Other | | | — | | | | — | | | | 0.1 | |
| Commercial transactions(3) | | | 3.0 | | | | 2.5 | | | | 0.2 | |
| | | | | | | | | | | | | |
| Cosan S.A.(2) | | | 14.3 | | | | 12.9 | | | | 111.2 | |
| Raízen S.A. and subsidiaries | | | 1.7 | | | | 1.4 | | | | 3.3 | |
| Cosan Luxembourg S.A. | | | 2.1 | | | | 1.8 | | | | 1.9 | |
| Financial and corporate transactions(4) | | | 18.0 | | | | 16.1 | | | | 116.5 | |
| | | | | | | | | | | | | |
| Total current liabilities | | | 21.1 | | | | 18.6 | | | | 116.7 | |
| | | | | | | | | | | | | |
| Non-current liabilities | | | | | | | | | | | | |
| Cosan S.A.(2) | | | 117.6 | | | | 127.8 | | | | 206.4 | |
| Financial and corporate transactions | | | 117.6 | | | | 127.8 | | | | 206.4 | |
| | | | | | | | | | | | | |
| Total non-current liabilities | | | 117.6 | | | | 127.8 | | | | 206.4 | |
| | | | | | | | | | | | | |
| Total liabilities | | | 138.6 | | | | 146.4 | | | | 323.1 | |
| (1) | Consists of sales of lubricants and the rental of storage tanks. |
| (2) | On December 31, 2018, Moove Brazil and Cosan S.A. entered into an agreement to transfer to Cosan S.A. assets and liabilities related to Moove Brazil’s fuel business from the acquisition of Esso Brasileira de Petróleo Ltda., or Esso. This resulted in an increase in our related parties’ assets and liabilities accounts for the recharge of contingencies and tax discussions related to the assets and liabilities subject to the transfer of the business. |
| (3) | Consists of maritime transport freight cost splits and logistic services. |
| (4) | Consists of expenses from services provided from a shared services center and expenses in connection with a financing agreement. |
The following table sets out information regarding the impact of our related party transactions on our income statement:
| | | For the Six Months
Ended June 30, | | For the Year
Ended December 31, |
| | | 2024 | | 2023 | | 2023 | | 2022 | | 2021 |
| | | (in millions of reais) |
| Sale of products, net of returns(1) | | | | | | | | | | |
| Raízen S.A. and subsidiaries | | | 39.0 | | | | 52.6 | | | | 86.8 | | | | 93.0 | | | | 74.0 | |
| Rumo S.A. | | | 32.7 | | | | 32.4 | | | | 62.6 | | | | 62.3 | | | | 56.2 | |
| Vale S.A. | | | 30.9 | | | | — | | | | — | | | | — | | | | — | |
| Other | | | — | | | | — | | | | — | | | | 0.1 | | | | 2.0 | |
| | | | 102.6 | | | | 85.0 | | | | 149.3 | | | | 155.3 | | | | 132.2 | |
| Purchase of goods and services(2) | | | | | | | | | | | | | | | | | | | | |
| Raízen S.A. and subsidiaries | | | (5.3 | ) | | | (3.1 | ) | | | (5.8 | ) | | | (7.5 | ) | | | (4.2 | ) |
| Rumo S.A. | | | — | | | | — | | | | (0.0 | ) | | | — | | | | — | |
| | | | (5.3 | ) | | | (3.1 | ) | | | (5.8 | ) | | | (7.5 | ) | | | (4.2 | ) |
| Shared expenses(3) | | | | | | | | | | | | | | | | | | | | |
| Raízen S.A. and subsidiaries | | | (6.4 | ) | | | (8.4 | ) | | | (18.4 | ) | | | (12.6 | ) | | | (9.2 | ) |
| Cosan S.A. | | | (2.5 | ) | | | (2.2 | ) | | | (5.3 | ) | | | (3.8 | ) | | | (3.4 | ) |
| | | | (9.0 | ) | | | (10.6 | ) | | | (23.6 | ) | | | (16.4 | ) | | | (12.5 | ) |
| (1) | Consists of sales of lubricants and the rental of storage tanks. |
| (2) | Consists of maritime transport freight cost splits and logistic services. |
| (3) | Consists of services provided from a shared services center. |
Principal and Selling Shareholders
The following table and accompanying footnotes present information relating to the beneficial ownership of our common shares (1) immediately prior to the completion of this offering; (2) following the sale of common shares in this offering, assuming no exercise of the underwriters’ option to purchase additional common shares; and (3) following the sale of common shares in this offering, assuming the underwriters’ option to purchase additional common shares is exercised in full, by:
| · | each person, or group of affiliated persons, known by us to own beneficially 5% or more of each class of our outstanding voting shares; |
| · | each of our directors and executive officers, individually; |
| · | all directors and executive officers as a group; and |
| · | the selling shareholders, which consist of the entities shown as having shares listed in the column “Shares to be Sold in the Offering.” |
The number of common shares beneficially owned by each entity, person, executive officer or director is determined in accordance with the rules of the SEC, and the information is not necessarily indicative of beneficial ownership for any other purpose. Under such rules, beneficial ownership includes any shares over which the individual has sole or shared voting power or investment power as well as any shares that the individual has the right to acquire within 60 days through the exercise of any option, warrant or other right. Except as otherwise indicated, and subject to applicable community property laws, we believe that each shareholder identified in the table below possesses sole voting and investment power over all the common shares shown as beneficially owned by the shareholder in the table.
The percentages of beneficial ownership in the table below are calculated on the basis of the following numbers of common shares outstanding:
| · | Immediately prior to the completion of this offering: common shares; |
| · | following the sale of common shares in this offering, assuming no exercise of the underwriters’ option to purchase additional common shares: common shares; and |
| · | following the sale of common shares in this offering, assuming exercise in full of the underwriters’ option to purchase additional common shares: common shares. |
Unless otherwise indicated, the address of each beneficial owner listed in the table below is c/o Moove Lubricants Holdings, Av. Brigadeiro Faria Lima, 4,100 – 8th floor São Paulo – SP, 04538-132, Brazil.
| | Shares Beneficially Owned Prior to
Offering | Shares to be Sold in Offering | Shares Beneficially Owned After
Offering Without Exercise of
Underwriters’ Option | Additional Common Shares To Be Sold In Offering With Full Exercise of Underwriters’ Option | Shares Beneficially Owned After
Offering With Full Exercise of
Underwriters’ Option |
Shareholders | Shares | % | Shares | % | Shares | % |
| Executive Officers and Directors(1): | | | | | | | | | | | | | | |
| Rubens Ometto Silveira Mello | | | | | | | | | | | | | | |
| Filipe Affonso Ferreira | | | | | | | | | | | | | | |
| Marcelo Eduardo Martins | | | | | | | | | | | | | | |
| | | | | | | | | | | | | | | |
| Nelson Roseira Gomes Neto | | | | | | | | | | | | | | |
| Fernando Pinto | | | | | | | | | | | | | | |
| Jean-Marc Etlin | | | | | | | | | | | | | | |
| | | | | | | | | | | | | | | |
| All executive officers and directors as a group ( persons) | | | | | | | | | | | | | | |
| | | | | | | | | | | | | | | |
| 5% Shareholders: | | | | | | | | | | | | | | |
| Cosan(2) | | | | | | | | | | | | | | |
| CVC Fund VII(3) | | | | | | | | | | | | | | |
| * | Represents beneficial ownership of less than one percent (1%) of the outstanding shares of our common shares. |
| (1) | Unless otherwise noted, the business address of our directors and executive officers is Av. Brigadeiro Faria Lima, 4,100 – 8th floor São Paulo – SP, 04538-132, Brazil. |
| (2) | Cosan is controlled by Rubens Ometto Silveira Mello, the chairman of our board of directors and chairman of the board of directors of Cosan. Mr. Ometto Silveira Mello is the beneficial owner of approximately 35.9% of the share capital of Cosan. The principal business address of Cosan is Av. Brigadeiro Faria Lima, 4100, – 16th floor, São Paulo, SP 04538-132 Brazil. |
| (3) | Represents shares held by Galt Lubes Investments Limited (“Galt”). Galt is an investment vehicle majority owned by Otto Lubes Investments Limited (“Otto”), which is wholly owned by CVC Capital Partners VII Associates L.P., CVC Capital Partners Investment Europe VII L.P. and CVC Capital Partners VII (A), L.P (the “CVC VII limited partnerships”). Each of the entities described in this footnote (other than to the extent it directly holds securities as described herein) may be deemed to beneficially own the shares directly or indirectly controlled by such entities. CVC Capital Partners VII Limited is the sole general partner of each of the CVC VII limited partnerships. CVC Capital Partners VII Limited is managed by a three-member board of directors consisting of Ms. Victoria Emma Cabot and Messrs. Carl John Hansen and Jonathan George Wrigley. Under the so-called “rule of three,” because voting and dispositive decisions are made by a majority of CVC Capital Partners VII Limited’s directors, none of the directors is deemed to be a beneficial owner of the securities which CVC Capital Partners VII Limited may be deemed to beneficially own. The business address of each of Galt, Otto, each of the CVC limited partnerships and CVC Capital Partners VII Limited is 27 Esplanade, St Helier, Jersey JE1 1SG. |
Description of Share Capital
General
The following description summarizes certain important terms of our share capital, as they are expected to be in effect immediately prior to the completion of this offering. We expect to adopt an amended and restated Memorandum and Articles of Association that will become effective immediately prior to the completion of this offering, and this description summarizes the provisions that are expected to be included in such documents. Because it is only a summary, it does not contain all the information that may be important to you. For a complete description of the matters set forth in this section titled “Description of Share Capital,” you should refer to our amended and restated Memorandum and Articles of Association, which is included as exhibits to the registration statement of which this prospectus forms a part, and to the applicable provisions of Cayman Islands law.
The following is a summary of the material provisions of our authorized share capital and our Memorandum and Articles of Association.
Share Capital
Our amended and restated Memorandum and Articles of Association authorize a single class of common shares which are entitled to one vote per share.
Immediately following the completion of this offering, our authorized share capital will be US$ , consisting of common shares of par value US$0.001 each.
The authorized but unissued shares may be issued by our board of directors as common shares of any class or as shares with preferred, deferred or other special rights or restrictions.
Treasury Stock
At the date of this prospectus, we have no shares in treasury.
Issuance of Shares
Except as expressly provided in the amended and restated Memorandum and Articles of Association, our board of directors has general and unconditional authority to allot, grant options over, offer or otherwise deal with or dispose of any unissued shares in the company’s capital without the approval of our shareholders (whether forming part of the original or any increased share capital), either at a premium or at par, with or without preferred, deferred or other special rights or restrictions, whether in regard to dividend, voting, return of capital or otherwise and to such persons, on such terms and conditions, and at such times as the directors may decide, but so that no share shall be issued at a discount, except in accordance with the provisions of the Companies Act.
Common Shares
Dividend Rights
Subject to preferences that may apply to any preferred shares outstanding at the time, the holders of our common shares are entitled to receive dividends out of funds legally available if our board of directors, in its discretion, determines to issue dividends and then only at the times and in the amounts that our board of directors may determine. See the section titled “Dividend Policy” for additional information.
Voting Rights
The holders of the common shares are entitled to one vote per share.
Our Articles of Association provide as follows regarding the respective rights of holders of common shares:
(1) class consents from the holders of common shares shall be required for any variation to the rights attached to their respective class of shares, however, the directors may treat the two classes of shares as forming one class if they consider that both such classes would be affected in the same way by the proposal;
(2) the rights conferred on holders of common shares shall not be deemed to be varied by the creation or issue of further common shares and vice versa; and
(3) the rights attaching to the common shares shall not be deemed to be varied by the creation or issue of shares with preferred or other rights, including, without limitation, shares with enhanced or weighted voting rights.
We have not provided for cumulative voting for the election of directors in our amended and restated Memorandum and Articles of Association. Our amended and restated Memorandum and Articles of Association establishes a classified board of directors that is divided into three classes with staggered three-year terms. Only the directors in one class will be subject to appointment by ordinary resolution at each annual meeting of shareholders, with the directors in the other classes continuing for the remainder of their respective three-year terms.
Preemptive or Similar Rights
Holders of our common shares are not entitled to preemptive or similar rights.
Right to Receive Liquidation Distributions
If we become subject to a liquidation, dissolution or winding-up, the assets legally available for distribution to our shareholders would be distributable ratably among the holders of our common shares and any participating preferred shares outstanding at that time, subject to prior satisfaction of all outstanding debt and liabilities and the preferential rights of and the payment of liquidation preferences, if any, on any outstanding shares of preferred shares.
Preferred Shares
After the completion of this offering, no preferred shares will be outstanding. Pursuant to our amended and restated Memorandum and Articles of Association that will become effective immediately prior to the completion of this offering, our board of directors will have the authority, subject to limitations prescribed by Cayman Islands law, to issue preferred shares in one or more series, to establish from time to time the number of shares to be included in each series and to fix the designation, powers, preferences, and rights of the shares of each series and any of its qualifications, limitations, or restrictions, in each case without further vote or action by our shareholders. Our board of directors can also increase or decrease the number of shares of any series of preferred shares, but not below the number of shares of that series then outstanding, without any further vote or action by our shareholders. Our board of directors may authorize the issuance of preferred shares with voting or conversion rights that could adversely affect the voting power or other rights of the holders of our common shares. The issuance of preferred shares, while providing flexibility in connection with possible acquisitions and other corporate purposes, could, among other things, have the effect of delaying, deferring or preventing a change in control of our company and might adversely affect the market price of our common shares and the voting and other rights of the holders of our common shares. We have no current plan to issue any preferred shares.
Record Dates
For the purpose of determining shareholders entitled to notice of, or to vote at any general meeting of shareholders or any adjournment thereof, or shareholders entitled to receive dividend or other distribution payments, or in order to make a determination of shareholders for any other purpose, our board of directors may set a record date which shall not exceed forty (40) clear days prior to the date where the determination will be made.
General Meetings of Shareholders
As a condition of admission to a shareholders’ meeting, a shareholder must be duly registered as a shareholder of Moove at the applicable record date for that meeting and, in order to vote, all calls or installments then payable by such shareholder to us in respect of the shares that such shareholder holds must have been paid.
Subject to any special rights or restrictions as to voting then attached to any shares, at any general meeting every shareholder who is present in person or by proxy (or, in the case of a shareholder being a corporation, by its duly authorized representative not being himself or herself a shareholder entitled to vote) shall have one vote per common share.
As a Cayman Islands exempted company, we are not obliged by the Companies Act to call annual general meetings; however, the Memorandum and Articles of Association provide that in each year the company will hold an annual general meeting of shareholders, within the first four months following the end of our fiscal year, provided that our board of directors has the discretion whether or not to hold an annual general meeting in 2024. For the annual general meeting of shareholders the agenda will include, among other things, the presentation of the annual accounts and the report of the directors (if any). In addition, the agenda for an annual general meeting of shareholders will only include such items as have been included therein by the board of directors.
Also, we may, but are not required to (unless required by the laws of the Cayman Islands), hold other extraordinary general meetings during the year. General meetings of shareholders are generally expected to take place in São Paulo, Brazil, but may be held elsewhere if the directors so decide.
The Companies Act provides shareholders a limited right to request a general meeting, and does not provide shareholders with any right to put any proposal before a general meeting in default of a company’s Memorandum and Articles of Association. However, these rights may be provided in a company’s Memorandum and Articles of Association. Our Memorandum and Articles of Association provide that upon the requisition of one or more shareholders representing not less than one-third of the voting rights entitled to vote at general meetings, the board will convene an extraordinary general meeting and put the resolutions so requisitioned to a vote at such meeting. The Memorandum and Articles of Association provide no other right to put any proposals before annual general meetings or extraordinary general meetings.
Subject to regulatory requirements, the annual general meeting and any extraordinary general meetings must be called by not less than eight (8) days’ notice prior to the relevant shareholders meeting and convened by a notice discussed below. Alternatively, upon the prior consent of all holders entitled to receive notice, with regards to the annual general meeting, and the holders of 95% in par value of the shares entitled to attend and vote at an extraordinary general meeting, that meeting may be convened by a shorter notice and in a manner deemed appropriate by those holders.
We will give notice of each general meeting of shareholders by publication on our website and in any other manner that it may be required to follow in order to comply with Cayman Islands law, NYSE and SEC requirements. The holders of registered shares may be given notice of a shareholders’ meeting by means of letters sent to the addresses of those shareholders as registered in our shareholders’ register, or, subject to certain statutory requirements, by electronic means.
Holders whose shares are registered in the name of DTC or its nominee, which we expect will be the case for the majority of the holders of common shares, will not be a shareholder or member of the company and must rely on the procedures of DTC regarding notice of shareholders’ meetings and the exercise of rights of a holder of the common shares.
A quorum for a general meeting consists of any one or more persons holding or representing by proxy not less than one-third of the aggregate voting power of all shares in issue and entitled to vote upon the business to be transacted. If a quorum is not present within half an hour from the time appointed for the meeting to commence or if during such a meeting a quorum ceases to be present, a second meeting may be called with at least five days’ notice to shareholders specifying the place, the day and the hour of the second meeting, as the Directors may determine, and if at the second meeting a quorum is not present within half an hour from the time appointed for the meeting to commence, the shareholders present shall be a quorum.
A resolution put to a vote at a general meeting shall be decided on a poll. An ordinary resolution to be passed by the shareholders at a general meeting requires the affirmative vote of a simple majority of the votes cast by, or on behalf of, the shareholders entitled to vote, present in person or by proxy and voting at the meeting and a special resolution requires the affirmative vote on a poll of no less than two-thirds of the votes cast by the shareholders entitled to vote who are present in person or by proxy and voting at a general meeting. Both ordinary resolutions and
special resolutions may also be passed by a unanimous written resolution signed by all the shareholders of our Company, as permitted by the Companies Act and our Memorandum and Articles of Association.
Pursuant to our Memorandum and Articles of Association, general meetings of shareholders are to be chaired by the chairman of our board of directors or in his absence the vice-chairman of the board of directors or any other person nominated by our board of directors. If the chairman or vice-chairman of our board of directors or other person appointed by our board of directors is absent, the directors present at the meeting shall appoint one of them to be chairman of the general meeting. If neither the chairman nor another director is present at the general meeting within 15 minutes after the time appointed for holding the meeting, the shareholders present in person or by proxy and entitled to vote may elect any one of the shareholders to be chairman. The order of business at each meeting shall be determined by the chairman of the meeting, and he or she shall have the right and authority to prescribe such rules, regulations and procedures and to do all such acts and things as are necessary or desirable for the proper conduct of the meeting, including, without limitation, the establishment of procedures for the maintenance of order and safety, limitations on the time allotted to questions or comments on the affairs of the Company, restrictions on entry to such meeting after the time prescribed for the commencement thereof, and the opening and closing of the polls.
Changes to Capital
Pursuant to our Memorandum and Articles of Association, we may from time to time by ordinary resolution:
| · | increase our share capital by such sum, to be divided into shares of such amount, as the resolution shall prescribe; |
| · | consolidate and divide all or any of our share capital into shares of a larger amount than our existing shares; |
| · | convert all or any of our paid-up shares into stock and reconvert that stock into paid up shares of any denomination; |
| · | subdivide our existing shares or any of them into shares of a smaller amount, provided that in the subdivision the proportion between the amount paid and the amount, if any, unpaid on each reduced share shall be the same as it was in the case of the share from which the reduced share is derived; or |
| · | cancel any shares which, at the date of the passing of the resolution, have not been taken or agreed to be taken by any person and diminish the amount of our share capital by the amount of the shares so cancelled. |
Our shareholders may by special resolution, subject to confirmation by the Grand Court of the Cayman Islands on an application by the Company for an order confirming such reduction, reduce our share capital or any capital redemption reserve in any manner permitted by law.
In addition, subject to the provisions of the Companies Act and our Memorandum and Articles of Association and the Shareholders’ Agreement, we may:
| · | issue shares on terms that they are to be redeemed or are liable to be redeemed; |
| · | purchase our own shares (including any redeemable shares); and |
| · | make a payment in respect of the redemption or purchase of our own shares in any manner authorized by the Companies Act, including out of our own capital. |
Transfer of Shares
Subject to any applicable restrictions set forth in the Memorandum and Articles of Association and the Shareholders’ Agreement, any shareholder of Moove may transfer all or any of his or her common shares by an instrument of transfer in the usual or common form or in the form prescribed by the NYSE or any other form approved by the Company’s board of directors.
The common shares sold in this offering will be traded on the NYSE in book-entry form and may be transferred in accordance with our Articles of Association and NYSE’s rules and regulations.
However, our board of directors may, in its absolute discretion, decline to register any transfer of any common share which is either not fully paid up to a person of whom it does not approve or is issued under any share incentive scheme for employees which contains a transfer restriction that is still applicable to such common share. The board of directors may also decline to register any transfer of any common share unless:
| · | the instrument of transfer is lodged with us, accompanied by the certificate (if any) for the common shares to which it relates and such other evidence as our board of directors may reasonably require to show the right of the transferor to make the transfer; |
| · | the instrument of transfer is in respect of only one class of shares; |
| · | the instrument of transfer is properly stamped, if required; |
| · | the common shares transferred are free of any lien in favor of us; and |
| · | in the case of a transfer to joint holders, the transfer is not to more than four joint holders. |
If the directors refuse to register a transfer they are required, within two months after the date on which the instrument of transfer was lodged, to send to the transferee notice of such refusal.
Share Repurchase
The Companies Act and our Memorandum and Articles of Association permit us to purchase our own shares, subject to certain restrictions. Our board of directors may only exercise this power on behalf of Moove, subject to the Companies Act and the Memorandum and Articles of Association, the Shareholders’ Agreement and to any applicable requirements imposed from time to time by the SEC, the NYSE, or by any recognized stock exchange on which our securities are listed.
Dividends and Capitalization of Profits
We have not adopted a dividend policy with respect to payments of any future dividends. Subject to the Companies Act, our shareholders may, by resolution passed by a simple majority of the voting rights entitled to vote at a general meeting, declare dividends (including interim dividends) to be paid to shareholders but no dividend shall be declared in excess of the amount recommended by the board of directors. The board of directors may also declare dividends. Dividends may be declared and paid out of funds lawfully available to us. Except as otherwise provided by the rights attached to shares and our Memorandum and Articles of Association, all dividends shall be paid in proportion to the number of common shares a shareholder holds at the date the dividend is declared (or such other date as may be set as a record date); but, (1) if any share is issued on terms providing that it shall rank for dividend as from a particular date, that share shall rank for dividend accordingly; and (2) where we have shares in issue which are not fully paid up (as to par value), we may pay dividends in proportion to the amounts paid up on each share.
The holders of common shares shall be entitled to share equally in any dividends that may be declared in respect of our common shares from time to time.
Appointment, Disqualification and Removal of Directors
We are managed by our board of directors. Our Memorandum and Articles of Association provide that the board of directors will be composed of such number of directors as a majority of directors in office may determine, being up to directors on the date of adoption of the Memorandum and Articles of Association. There are no provisions relating to retirement of directors upon reaching any age limit. The Memorandum and Articles of Association also provide that, while our shares are admitted to trading on NYSE, our board of directors must always comply with the residency and citizenship requirements of the U.S. securities laws applicable to foreign private issuers.
The Memorandum and Articles of Association provide that directors shall be divided into three (3) classes designated as Class I, Class II and Class III, with as nearly equal a number of directors in each group as possible. Subject to our Memorandum and Articles of Association, directors must be assigned to each class in accordance with a resolution or resolutions adopted by the board of directors. Moreover, director nominees must be elected by an ordinary resolution in accordance with our Memorandum and Articles of Association at each annual general meeting of our shareholders to fill the seats of those directors whose terms expire at such annual general meeting and the persons to stand for election at each annual general meeting of our shareholders shall be nominated by the directors. For illustrative purposes, at the 2025 annual general meeting, the term of office of the Class I directors shall expire and Class I directors shall be elected for a full term of three (3) years. At the 2026 annual general meeting, the term of office of the Class II directors shall expire and Class II directors shall be elected for a full term of three (3) years. At the 2027 annual general meeting, the term of office of the Class III directors shall expire and Class III directors shall be elected for a full term of three (3) years. Subject to our Memorandum and Articles of Association, at each succeeding annual general meeting, directors shall be elected for a full term of three (3) years to succeed the directors of the class whose terms expire at such annual general meeting.
By the listing date of this offering, the directors will be , and are “independent” as that term is defined under Rule 10A-3 under the Exchange Act and the NYSE rules applicable to audit committees. We intend to appoint one additional independent director within one year after our registration statement on Form F-1, of which this prospectus forms a part, becomes effective.
Any vacancies on the board of directors that arise other than upon the removal of a director by resolution passed at a general meeting can be filled by the remaining directors (notwithstanding that they may constitute less than a quorum). Any such appointment shall be as an interim director of the same class as the director being replaced to fill such vacancy until the end of the term of the director being replaced.
Additions to the existing board (within the limits set pursuant to the Articles of Association) may be made by ordinary resolution of the shareholders.
Upon the completion of this offering, the board of directors will have in place an audit committee. See “Management—Audit Committee.”
Grounds for Removing a Director
A director may be removed with cause by ordinary resolution. The notice of general meeting must contain a statement of the intention to remove the director and must be served on the director not less than ten calendar days before the meeting. The director is entitled to attend the meeting and be heard on the motion for his removal.
The office of a director will be vacated automatically if he or she (1) becomes prohibited by law from being a director; (2) becomes bankrupt or makes an arrangement or composition with his creditors; (3) dies or is in the opinion of all his co-directors, incapable by reason of mental disorder of discharging his duties as director; (4) resigns his office by notice to us; or (5) has for more than six months been absent without permission of the directors from meetings of the board of directors held during that period, and the remaining directors resolve that his or her office be vacated.
Proceedings of the Board of Directors
The Memorandum and Articles of Association provide that our business is to be managed and conducted by the board of directors. The quorum necessary for the board meeting shall be a simple majority of the directors then in office, which majority must include such directors as may be specified in the Shareholders’ Agreement, and business at any meeting shall be decided by a majority of votes. In the case of an equality of votes, the chairman shall not have a casting vote.
Subject to the provisions of the Memorandum and Articles of Association, the board of directors may regulate its proceedings as they determine is appropriate. Board meetings shall be held at least once every calendar quarter and shall take place either in São Paulo, Brazil or at such other place as the directors may determine.
Subject to the provisions of the Memorandum and Articles of Association, to any directions given by ordinary resolution of the shareholders and the listing rules of the NYSE, the board of directors may from time to time at its
discretion exercise all powers of Moove, including, subject to the Companies Act, the power to issue debentures, bonds and other securities of the company, whether outright or as collateral security for any debt, liability or obligation of our company or of any third party.
Inspection of Books and Records
Holders of our common shares will have no general right under Cayman Islands law to inspect or obtain copies of the list of shareholders or corporate records of the Company. However, the board of directors may determine from time to time whether and to what extent our accounting records and books shall be open to inspection by shareholders who are not members of the board of directors. Notwithstanding the above, the Memorandum and Articles of Association provide shareholders with the right to receive annual financial statements. Such right to receive annual financial statements may be satisfied by publishing the same on the company’s website or filing such annual reports as we are required to file with the SEC.
Register of Shareholders
The common shares offered in this offering will be held through DTC, and DTC or Cede & Co., as nominee for DTC, will be recorded in the shareholders’ register as the holder of our common shares.
Under Cayman Islands law, we must keep a register of shareholders that includes:
| · | the names and addresses of the shareholders, a statement of the shares held by each member, and of the amount paid or agreed to be considered as paid, on the shares of each member; |
| · | whether voting rights attach to the shares in issue; |
| · | the date on which the name of any person was entered on the register as a member; and |
| · | the date on which any person ceased to be a member. |
Under Cayman Islands law, our register of shareholders is prima facie evidence of the matters set out therein (i.e., the register of shareholders will raise a presumption of fact on the matters referred to above unless rebutted) and a shareholder registered in the register of shareholders is deemed as a matter of Cayman Islands law to have prima facie legal title to the shares as set against his or her name in the register of shareholders. Upon the completion of this offering, the register of shareholders will be immediately updated to record and give effect to the issuance of new common shares in this offering. Once the register of shareholders has been updated, the shareholders recorded in the register of shareholders should be deemed to have legal title to the shares set against their name.
However, there are certain limited circumstances where an application may be made to a Cayman Islands court for a determination on whether the register of members reflects the correct legal position. Further, the Cayman Islands court has the power to order that the register of members maintained by a company should be rectified where it considers that the register of members does not reflect the correct legal position. If an application for an order for rectification of the register of members were made in respect of our common shares, then the validity of such shares may be subject to re-examination by a Cayman Islands court.
Exempted Company
We are an exempted company with limited liability under the Companies Act. The Companies Act distinguishes between ordinary resident companies and exempted companies. Any company that is registered in the Cayman Islands but conducts business mainly outside of the Cayman Islands may apply to be registered as an exempted company. The requirements for an exempted company are essentially the same as for an ordinary company except for the exemptions and privileges listed below:
| · | an exempted company does not have to file an annual return of its shareholders with the Registrar of Companies; |
| · | an exempted company’s register of shareholders is not open to inspection; |
| · | an exempted company does not have to hold an annual general meeting; |
| · | an exempted company may issue shares with no par value; |
| · | an exempted company may obtain an undertaking against the imposition of any future taxation (such undertakings are usually given for 20 years in the first instance); |
| · | an exempted company may register by way of continuation in another jurisdiction and be deregistered in the Cayman Islands; |
| · | an exempted company may register as a limited duration company; and |
| · | an exempted company may register as a segregated portfolio company. |
“Limited liability” means that the liability of each shareholder is limited to the amount unpaid by the shareholder on the shares of the company (except in exceptional circumstances, such as involving fraud, the establishment of an agency relationship or an illegal or improper purpose or other circumstances in which a court may be prepared to pierce or lift the corporate veil).
Upon the closing of this offering, we will be subject to reporting and other informational requirements of the Exchange Act, as applicable to foreign private issuers. Except as otherwise disclosed in this prospectus, we intend to comply with the NYSE rules in lieu of following home country practice after the closing of this offering.
Anti-Takeover Provisions in Our Memorandum and Articles of Association
Some provisions of the Memorandum and Articles of Association may discourage, delay or prevent a change in control of our company or management that shareholders may consider favorable. In particular, our capital structure concentrates ownership of voting rights in the hands of Cosan, our controlling shareholder. In addition, as described in “—Appointment, Disqualification and Removal of Directors” above, our Memorandum and Articles of Association provide that our board of directors will be classified into three classes of directors. As a result, in most circumstances, a person can gain control of our board only by successfully engaging in a proxy contest at two or more annual general meetings.
These provisions are expected to discourage coercive takeover practices and inadequate takeover bids. These provisions are also designed to encourage persons seeking to acquire control of our company to first negotiate with the board of directors. However, these provisions could also have the effect of discouraging others from attempting hostile takeovers and, as a consequence, they may also inhibit temporary fluctuations in the market price of the common shares that often result from actual or rumored hostile takeover attempts. These provisions may also have the effect of preventing changes in our management. It is possible that these provisions could make it more difficult to accomplish transactions that shareholders may otherwise deem to be in their best interests.
Common Shares Held by our Controlling Shareholder
Following this offering, Cosan will beneficially own % of our outstanding share capital. As a result, Cosan will have the ability to elect a majority of the directors and to determine the outcome of most matters submitted to a vote of shareholders. This concentrated voting control could discourage others from initiating any potential merger, takeover, or other change of control transaction that other shareholders may view as beneficial.
So long as Cosan has the ability to determine the outcome of all matters submitted to a vote of shareholders, third parties may be deterred in their willingness to make an unsolicited merger, takeover, or other change of control proposal, or to engage in a proxy contest for the election of directors. See also “Risk Factors—Risks Relating to Our Common Shares and the Offering—Our Memorandum and Articles of Association contain anti-takeover provisions that may discourage a third party from acquiring us and adversely affect the rights of holders of our common shares.”
Preferred Shares
Our board of directors has wide powers to issue one or more classes or series of shares with preferred rights. Such preferences may include, for example, dividend rights, conversion rights, redemption privileges, enhanced voting powers and liquidation preferences.
Despite the anti-takeover provisions described above, under Cayman Islands law, our board of directors may only exercise the rights and powers granted to them under the Memorandum and Articles of Association, for what they believe in good faith to be in our best interests.
Protection of Non-Controlling Shareholders
The Grand Court of the Cayman Islands may, on the application of shareholders holding not less than one fifth of our shares in issue, appoint an inspector to examine our affairs and report thereon in a manner as the Grand Court shall direct.
Subject to the provisions of the Companies Act, any shareholder may petition the Grand Court of the Cayman Islands which may make a winding up order, if the court is of the opinion that this winding up is just and equitable.
Notwithstanding the U.S. securities laws and regulations that are applicable to us, general corporate claims against us by our shareholders must, as a general rule, be based on the general laws of contract or tort applicable in the Cayman Islands or their individual rights as shareholders as established by our Memorandum and Articles of Association.
The Cayman Islands courts ordinarily would be expected to follow English case law precedents, which permit a minority shareholder to commence a representative action against us, or derivative actions in our name, to challenge (1) an act which is ultra vires or illegal; (2) an act which constitutes a fraud against the minority and the wrongdoers themselves control our company; and (3) an irregularity in the passing of a resolution that requires a qualified (or special) majority.
Registration Rights and Restricted Shares
Although none of our shareholders have formal registration rights, they or entities controlled by them or their permitted transferees will, subject to the lock-up agreements described below, be able to sell their shares in the public market from time to time without registering them, subject to certain limitations on the timing, amount and method of those sales imposed by regulations promulgated by the SEC. Our existing shareholders, our executive officers and directors who will hold shares upon completion of this offering and our existing shareholders have agreed to lock-up agreements that restrict us and them, subject to specified exceptions, from selling or otherwise disposing of any shares for a period of 180 days after the date of this prospectus without the prior consent of the representatives for the underwriters. However, the underwriters may, in their sole discretion and without notice, release all or any portion of the shares from the restrictions in any of the lock-up agreements described above. In addition, these lock-up agreements are subject to the exceptions described in “Common Shares Eligible for Future Sale,” including our right to issue new shares if we carry out an acquisition or enter into a merger, joint venture or strategic participation.
Transfer Agent and Registrar
Upon the completion of this offering, the transfer agent and registrar for our common shares will be Computershare Trust Company, N.A. The transfer agent and registrar’s address is 480 Washington Boulevard, Jersey City, New Jersey, United States of America, 07310.
Principal Differences between Cayman Islands and U.S. Corporate Law
The Companies Act was modeled originally after similar laws in England and Wales but does not follow subsequent statutory enactments in England and Wales. In addition, the Companies Act differs from laws applicable to U.S. corporations and their shareholders. Set forth below is a summary of the significant differences between the provisions of the Companies Act applicable to us and the laws applicable to companies incorporated in the United States and their shareholders.
Mergers and Similar Arrangements
In certain circumstances the Companies Act allows for mergers or consolidations between two Cayman Islands companies, or between a Cayman Islands company and a company incorporated in another jurisdiction (provided that is facilitated by the laws of that other jurisdiction).
Where the merger or consolidation is between two Cayman Islands companies, the directors of each company must approve a written plan of merger or consolidation containing certain prescribed information. That plan of merger or consolidation must then be authorized by either (a) a special resolution (usually a majority of 66 2/3% in value) of the shareholders of each company; or (b) such other authorization, if any, as may be specified in such constituent company’s articles of association. A shareholder has the right to vote on a merger or consolidation regardless of whether the shares that he holds otherwise give him voting rights. No shareholder resolution is required for a merger between a parent company (i.e., a company that owns at least 90% of the issued shares of each class in a subsidiary company) and its subsidiary company. The consent of each holder of a fixed or floating security interest of a constituent company must be obtained, unless the court waives such requirement. If the Cayman Islands Registrar of Companies is satisfied that the requirements of the Companies Act (which includes certain other formalities) have been complied with, the Registrar of Companies will register the plan of merger or consolidation.
Where the merger or consolidation involves a foreign company, the procedure is similar, save that with respect to the foreign company, the director of the Cayman Islands company is required to make a declaration to the effect that, having made due enquiry, he is of the opinion that the requirements set out below have been met: (i) that the merger or consolidation is permitted or not prohibited by the constitutional documents of the foreign company and by the laws of the jurisdiction in which the foreign company is incorporated, and that those laws and any requirements of those constitutional documents have been or will be complied with; (ii) that no petition or other similar proceeding has been filed and remains outstanding or order made or resolution adopted to wind up or liquidate the foreign company in any jurisdictions; (iii) that no receiver, trustee, administrator or other similar person has been appointed in any jurisdiction and is acting in respect of the foreign company, its affairs or its property or any part thereof; (iv) that no scheme, order, compromise or other similar arrangement has been entered into or made in any jurisdiction whereby the rights of creditors of the foreign company are and continue to be suspended or restricted.
Where the surviving company is the Cayman Islands company, the director of the Cayman Islands company is further required to make a declaration to the effect that, having made due enquiry, he is of the opinion that the requirements set out below have been met: (i) that the foreign company is able to pay its debts as they fall due and that the merger or consolidation is bona fide and not intended to defraud unsecured creditors of the foreign company; (ii) that in respect of the transfer of any security interest granted by the foreign company to the surviving or consolidated company (a) consent or approval to the transfer has been obtained, released or waived; (b) the transfer is permitted by and has been approved in accordance with the constitutional documents of the foreign company; and (c) the laws of the jurisdiction of the foreign company with respect to the transfer have been or will be complied with; (iii) that the foreign company will, upon the merger or consolidation becoming effective, cease to be incorporated, registered or exist under the laws of the relevant foreign jurisdiction; and (iv) that there is no other reason why it would be against the public interest to permit the merger or consolidation.
Where the above procedures are adopted, the Companies Act provides for a right of dissenting shareholders to be paid a payment of the fair value of his shares upon their dissenting to the merger or consolidation if they follow a prescribed procedure. In essence, that procedure is as follows (a) the shareholder must give his written objection to the merger or consolidation to the constituent company before the vote on the merger or consolidation, including a statement that the shareholder proposes to demand payment for his shares if the merger or consolidation is authorized by the vote; (b) within 20 days following the date on which the merger or consolidation is approved by the shareholders, the constituent company must give written notice to each shareholder who made a written objection; (c) a shareholder must within 20 days following receipt of such notice from the constituent company, give the constituent company a written notice of his intention to dissent including, among other details, a demand for payment of the fair value of his shares; (d) within seven days following the date of the expiration of the period set out in paragraph (b) above or seven days following the date on which the plan of merger or consolidation is filed, whichever is later, the constituent company, the surviving company or the consolidated company must make a written offer to each dissenting shareholder to purchase his shares at a price that the company determines is the fair value and if the company and the shareholder agree on the price within 30 days following the date on which the
offer was made, the company must pay the shareholder such amount; (e) if the company and the shareholder fail to agree on a price within such 30-day period, within 20 days following the date on which such 30-day period expires, the company (and any dissenting shareholder) must file a petition with the Cayman Islands Grand Court to determine the fair value and such petition must be accompanied by a list of the names and addresses of the dissenting shareholders with whom agreements as to the fair value of their shares have not been reached by the company. At the hearing of that petition, the court has the power to determine the fair value of the shares together with a fair rate of interest, if any, to be paid by the company upon the amount determined to be the fair value. Any dissenting shareholder whose name appears on the list filed by the company may participate fully in all proceedings until the determination of fair value is reached. These rights of a dissenting shareholder may not be available in certain circumstances, for example, to dissenters holding shares of any class in respect of which an open market exists on a recognized stock exchange or recognized interdealer quotation system at the relevant date or where the consideration for such shares to be contributed are shares of any company listed on a national securities exchange or shares of the surviving or consolidated company.
Moreover, Cayman Islands law also has separate statutory provisions that facilitate the reconstruction or amalgamation of companies in certain circumstances, which will generally be more suited for complex mergers or other transactions involving widely held companies, commonly referred to in the Cayman Islands as a “scheme of arrangement” which may be tantamount to a merger. In the event that a merger was sought pursuant to a scheme of arrangement (the procedure of which are more rigorous and take longer to complete than the procedures typically required to consummate a merger in the United States), the arrangement in question must be approved by, for a shareholder scheme, three-fourths in value of each class of shareholders with whom the arrangement is to be made and, for a creditor scheme, a majority in number of each class of creditors with whom the arrangement is to be made, and who must in addition represent three-fourths in value of each such class of creditors, as the case may be, that are present and voting either in person or by proxy at a meeting, or meeting summoned for that purpose. The convening of the meetings and subsequently the terms of the arrangement must be sanctioned by the Grand Court of the Cayman Islands. While a dissenting shareholder would have the right to express to the court the view that the transaction should not be approved, the court can be expected to approve the arrangement if it satisfies itself that:
| · | we are not proposing to act illegally or beyond the scope of our corporate authority and the statutory provisions as to majority vote have been complied with; |
| · | the shareholders have been fairly represented at the meeting in question; |
| · | the arrangement is such as a businessman would reasonably approve; and |
| · | the arrangement is not one that would more properly be sanctioned under some other provision of the Companies Act or that would amount to a “fraud on the minority.” |
If a scheme of arrangement or takeover offer (as described below) is approved, any dissenting shareholder would have no rights comparable to appraisal rights, which would otherwise ordinarily be available to dissenting shareholders of United States corporations, providing rights to receive payment in cash for the judicially determined value of the shares.
Squeeze-out Provisions
When a takeover offer is made and accepted by holders of 90% of the shares to whom the offer is made within four months, the offeror may, within a two-month period, require the holders of the remaining shares to transfer such shares on the terms of the offer. An objection can be made to the Grand Court of the Cayman Islands but this is unlikely to succeed unless there is evidence of fraud, bad faith, collusion or inequitable treatment of the shareholders.
Further, transactions similar to a merger, reconstruction and/or an amalgamation may in some circumstances be achieved through other means to these statutory provisions, such as a share capital exchange, asset acquisition or control, through contractual arrangements, of an operating business.
Shareholders’ Suits
Our Cayman Islands counsel is not aware of any reported class action having been brought in a Cayman Islands court. Derivative actions have been brought in the Cayman Islands courts, and the Cayman Islands courts have confirmed the availability for such actions. In most cases, we will be the proper plaintiff in any claim based on a breach of duty owed to us, and a claim against (for example) our officers or directors usually may not be brought by a shareholder. However, based on English authorities, which would in all likelihood be of persuasive authority and be applied by a court in the Cayman Islands, exceptions to the foregoing principle apply in circumstances in which:
| · | a company is acting or proposing to act illegally or beyond the scope of its authority; |
| · | the act complained of, although not beyond the scope of the authority, could be effected if duly authorized by more than the number of votes which have actually been obtained; or |
| · | those who control the company are perpetrating a “fraud on the minority.” |
A shareholder may have a direct right of action against us where the individual rights of that shareholder have been infringed or are about to be infringed.
Corporate Governance
Cayman Islands law restricts transactions between a company and its directors unless there are provisions in the Articles of Association which provide a mechanism to alleviate possible conflicts of interest. Additionally, Cayman Islands law imposes on directors’ duties of care and skill and fiduciary duties to the companies which they serve. Under our Articles of Association, a director must disclose the nature and extent of his interest in any contract or arrangement, and following such disclosure and subject to any separate requirement under applicable law or the listing rules of the NYSE, and unless disqualified by the chairman of the relevant meeting, the interested director may vote in respect of any transaction or arrangement in which he or she is interested. The interested director shall be counted in the quorum at such meeting and the resolution may be passed by a majority of the directors present at the meeting.
Subject to the foregoing and our Articles of Association, our directors may exercise all of our powers to vote compensation to themselves or any member of their body in the absence of an independent quorum. Our Articles of Association provide that, our remuneration committee shall be made up of such number of independent directors as is required from time to time by the NYSE rules (or as otherwise may be required by law).
As a foreign private issuer, we are permitted to follow home country practice in lieu of certain NYSE corporate governance rules, subject to certain requirements. For more information, see “Management—Foreign Private Issuer Status.”
Borrowing Powers
Our directors may exercise all the powers of Moove to borrow money and to mortgage or charge its undertaking, property and assets (present and future) and uncalled capital or any part thereof and to issue debentures, debenture stock, mortgages, bonds and other such securities whether outright or as security for any debt, liability or obligation of Moove or of any third party. Such powers may be varied by a special resolution of shareholders (requiring a two-thirds majority vote of those shareholders attending and voting at a quorate meeting).
Indemnification of Directors and Executive Officers and Limitation of Liability
The Companies Act does not limit the extent to which a company’s articles of association may provide for indemnification of directors and officers, except to the extent that it may be held by the Cayman Islands courts to be contrary to public policy, such as to provide indemnification against civil fraud or the consequences of committing a crime. Our Articles of Association provide that we shall indemnify and hold harmless our directors and officers against all actions, proceedings, costs, charges, expenses, losses, damages, liabilities, judgments, fines, settlements and other amounts incurred or sustained by such directors or officers, other than by reason of such person’s actual fraud, willful neglect or willful default, in or about the conduct of our company’s business or affairs (including as a result of any mistake of judgment) or in the execution or discharge of his duties, powers, authorities or discretions,
including without prejudice to the generality of the foregoing, any costs, expenses, losses or liabilities incurred by such director or officer in defending (whether successfully or otherwise) any civil, criminal or other proceedings concerning us or our affairs in any court whether in the Cayman Islands or elsewhere. This standard of conduct is generally the same as permitted under the Delaware General Corporation Law for a Delaware corporation.
Insofar as indemnification for liabilities arising under the Securities Act may be permitted to our directors, officers or persons controlling us under the foregoing provisions, we have been informed that, in the opinion of the SEC, this indemnification is against public policy as expressed in the Securities Act and is therefore unenforceable.
Directors’ Fiduciary Duties
As a matter of Cayman Islands law, a director of a Cayman Islands company is in the position of a fiduciary with respect to the company. Accordingly, directors and officers owe the following fiduciary duties: (1) duty to act in good faith in what the director or the officer believes to be in the best interests of the company as a whole; (2) duty to exercise powers for the purposes for which those powers were conferred and not for collateral purposes; (3) directors should not improperly fetter the exercise of future discretion; (4) duty to exercise powers fairly as between different sections of shareholders; (5) duty to exercise independent judgment; and (6) duty not to put themselves in a position in which there is a conflict between their duty to the company and their personal interests. However, this obligation may be varied by the company’s articles of association, which may permit a director to vote on a matter in which he has a personal interest provided that he has disclosed that nature of his interest to the board of directors. With respect to the duty of directors to avoid conflicts of interests, our Articles of Association vary from the applicable provisions of Cayman Islands law mentioned above by providing that a director must disclose the nature and extent of his or her interest in any contract or arrangement, and following such disclosure and subject to any separate requirement under applicable law or the listing rules of the NYSE, and unless disqualified by the chairman of the relevant meeting, such director may vote in respect of any transaction or arrangement in which he or she is interested and may be counted in the quorum at the meeting. In addition to the above, under Cayman Islands law, directors also owe a duty of care which is not fiduciary in nature. This duty has been defined as a requirement to act as a reasonably diligent person having both the general knowledge, skill and experience that may reasonably be expected of a person carrying out the same functions as are carried out by that director in relation to the company and the general knowledge skill and experience which that director has. As set out above, directors have a duty not to put themselves in a position of conflict and this includes a duty not to engage in self-dealing, or to otherwise benefit as a result of their position. However, in some instances what would otherwise be a breach of this duty can be forgiven and/or authorized in advance by the shareholders provided that there is full disclosure by the directors. This can be done by way of permission granted in the memorandum and articles of association or alternatively by shareholder approval at general meetings. Accordingly, as a result of multiple business affiliations, our officers and directors may have similar legal obligations relating to presenting business opportunities meeting the above-listed criteria to multiple entities. In addition, conflicts of interest may arise when our board evaluates a particular business opportunity with respect to the above-listed criteria. We cannot assure you that any of the abovementioned conflicts will be resolved in our favor. Furthermore, each of our officers and directors may have pre-existing fiduciary obligations to other businesses of which they are officers or directors.
A director of a Cayman Islands company also owes to the company duties to exercise independent judgment in carrying out his functions and to exercise reasonable skill, care and diligence, which has both objective and subjective elements. Recent Cayman Islands case law confirmed that directors must exercise the care, skill and diligence that would be exercised by a reasonably diligent person having the general knowledge, skill and experience reasonably to be expected of a person acting as a director. Additionally, a director must exercise the knowledge, skill and experience which he or she actually possesses.
A general notice may be given to the board of directors to the effect that (1) the director is a member or officer of a specified company or firm and is to be regarded as interested in any contract or arrangement which may after the date of the notice be made with that company or firm; or (2) he or she is to be regarded as interested in any contract or arrangement which may after the date of the notice to the board of directors be made with a specified person who is connected with him or her, will be deemed sufficient declaration of interest. This notice shall specify the nature of the interest in question. Following the disclosure being made pursuant to our Articles of Association and subject to any separate requirement under applicable law or the listing rules of the NYSE, and unless disqualified by the chairman of the relevant meeting, a director may vote in respect of any transaction or arrangement in which he or she is interested and may be counted in the quorum at the meeting.
In comparison, under Delaware corporate law, a director of a Delaware corporation has a fiduciary duty to the corporation and its shareholders. This duty has two components: the duty of care and the duty of loyalty. The duty of care requires that a director act in good faith, with the care that an ordinarily prudent person would exercise under similar circumstances. Under this duty, a director must inform himself or herself of, and disclose to shareholders, all material information reasonably available regarding a significant transaction. The duty of loyalty requires that a director act in a manner he or she reasonably believes to be in the best interests of the corporation. He or she must not use his or her corporate position for personal gain or advantage. This duty prohibits self-dealing by a director and mandates that the best interest of the corporation and its shareholders take precedence over any interest possessed by a director, officer or controlling shareholder and not shared by the shareholders generally. In general, actions of a director are presumed to have been made on an informed basis, in good faith and in the honest belief that the action taken was in the best interests of the corporation. However, this presumption may be rebutted by evidence of a breach of one of the fiduciary duties. Should such evidence be presented concerning a transaction by a director, a director must prove the procedural fairness of the transaction, and that the transaction was of fair value to the corporation.
Shareholder Proposals
Under the Delaware General Corporation Law, a shareholder has the right to put any proposal before the annual meeting of shareholders, provided it complies with the notice provisions in the governing documents. The Delaware General Corporation Law does not provide shareholders an express right to put any proposal before the annual meeting of shareholders, but Delaware corporations generally afford shareholders an opportunity to make proposals and nominations provided that they comply with the notice provisions in the certificate of incorporation or bylaws. A special meeting may be called by the board of directors or any other person authorized to do so in the governing documents, but shareholders may be precluded from calling special meetings.
The Companies Act provides shareholders with only limited rights to requisition a general meeting, and does not provide shareholders with any right to put any proposal before a general meeting. However, these rights may be provided in a company’s articles of association. Our Articles of Association provide that upon the requisition of one or more shareholders representing not less than one-third of the voting rights entitled to vote at general meetings, the board will convene an extraordinary general meeting and put the resolutions so requisitioned to a vote at such meeting. The Articles of Association provide no other right to put any proposals before annual general meetings or extraordinary general meetings.
Cumulative Voting
Under the Delaware General Corporation Law, cumulative voting for elections of directors is not permitted unless the corporation’s certificate of incorporation specifically provides for it. Cumulative voting potentially facilitates the representation of minority shareholders on a board of directors since it permits the minority shareholder to cast all the votes to which the shareholder is entitled on a single director, which increases the shareholder’s voting power with respect to electing such director. As permitted under Cayman Islands law, our Articles of Association do not provide for cumulative voting. As a result, our shareholders are not afforded any less protections or rights on this issue than shareholders of a Delaware corporation.
Removal of Directors
The office of a director shall be vacated automatically if, among other things, he or she (1) becomes prohibited by law from being a director; (2) becomes bankrupt or makes an arrangement or composition with his creditors; (3) dies or is in the opinion of all his co-directors, incapable by reason of mental disorder of discharging his duties as director; (4) resigns his office by notice to us; or (5) has for more than six months been absent without permission of the directors from meetings of the board of directors held during that period, and the remaining directors resolve that his/her office be vacated.
Transactions with Interested Shareholders
The Delaware General Corporation Law provides that; unless the corporation has specifically elected not to be governed by this statute, it is prohibited from engaging in certain business combinations with an “interested shareholder” for three years following the date that this person becomes an interested shareholder. An interested
shareholder generally is a person or a group who or which owns or owned 15% or more of the target’s outstanding voting shares or who or which is an affiliate or associate of the corporation and owned 15% or more of the corporation’s outstanding voting shares within the past three years. This has the effect of limiting the ability of a potential acquirer to make a two-tiered bid for the target in which all shareholders would not be treated equally. The statute does not apply if, among other things, prior to the date on which the shareholder becomes an interested shareholder, the board of directors approves either the business combination or the transaction which resulted in the person becoming an interested shareholder. This encourages any potential acquirer of a Delaware corporation to negotiate the terms of any acquisition transaction with the target’s board of directors.
Cayman Islands law has no comparable statute. As a result, we cannot avail ourselves of the types of protections afforded by the Delaware business combination statute. However, although Cayman Islands law does not regulate transactions between a company and its significant shareholders, it does provide that the board of directors owe duties to ensure that these transactions are entered into bona fide in the best interests of the company and for a proper corporate purpose and, as noted above, a transaction may be subject to challenge if it has the effect of constituting a fraud on the minority shareholders.
Dissolution; Winding Up
Under the Delaware General Corporation Law, unless the board of directors approves the proposal to dissolve, dissolution must be approved by shareholders holding 100% of the total voting power of the corporation. If the dissolution is initiated by the board of directors it may be approved by a simple majority of the corporation’s outstanding shares. Delaware law allows a Delaware corporation to include in its certificate of incorporation a supermajority voting requirement in connection with dissolutions initiated by the board. Under Cayman Islands law, a company may be wound up by either an order of the courts of the Cayman Islands or by a special resolution of its members or, if the company resolves by ordinary resolution that it be wound up because it is unable to pay its debts as they fall due. The court has authority to order winding up in a number of specified circumstances including where it is, in the opinion of the court, just and equitable to do so.
Under the Companies Act, we may be dissolved, liquidated or wound up by a special resolution of shareholders (requiring a two-thirds majority vote of those shareholders attending and voting at a quorate meeting). Our Articles of Association also give our board of directors authority to petition the Cayman Islands Court to wind up Moove.
Variation of Rights of Shares
Under the Delaware General Corporation Law, a corporation may vary the rights of a class of shares with the approval of a majority of the outstanding shares of that class, unless the certificate of incorporation provides otherwise. Under our Articles of Association, if the share capital is divided into more than one class of shares, the rights attached to any class may only be varied with the written consent of the holders of two-thirds of the shares of that class or the sanction of a special resolution passed at a separate meeting of the holders of the shares of that class.
Also, except with respect to share capital (as described above), alterations to our Articles of Association may only be made by special resolution of shareholders (requiring a two-thirds majority vote of those shareholders attending and voting at a quorate meeting).
Amendment of Governing Documents
Under the Delaware General Corporation Law, a corporation’s certificate of incorporation may be amended only if adopted and declared advisable by the board of directors and approved by a majority of the outstanding shares entitled to vote, and the bylaws may be amended with the approval of a majority of the outstanding shares entitled to vote and may, if so provided in the certificate of incorporation, also be amended by the board of directors. Under Cayman Islands law, our Articles of Association generally (and save for certain amendments to share capital described in this section) may only be amended by special resolution of shareholders (requiring a two-thirds majority vote of those shareholders attending and voting at a quorate meeting).
Rights of Non-Resident or Foreign Shareholders
There are no limitations imposed by our Articles of Association on the rights of non-resident or foreign shareholders to hold or exercise voting rights on our shares. In addition, there are no provisions in the Articles of Association governing the ownership threshold above which shareholder ownership must be disclosed.
Limitations of Liability and Indemnification
See the section titled “Certain Relationships and Related Party Transactions—Limitation of Liability and Indemnification of Officers and Directors.”
Listing
We have applied to list our common shares on NYSE under the symbol “MOOV.”
Common Shares Eligible for Future Sale
Prior to this offering, there has been no public market for our common shares. Future sales of substantial amounts of common shares, including shares issued upon the exercise of outstanding options, in the public market after this offering, or the possibility of these sales occurring, could adversely affect the prevailing market price for our common shares or impair our ability to raise equity capital.
Upon the completion of this offering, we will have an aggregate of common shares outstanding. Of these shares, the common shares sold in this offering by us or the selling shareholders will be freely tradable without restriction or further registration under the Securities Act, unless purchased by “affiliates” as that term is defined under Rule 144 of the Securities Act, who may sell only the volume of shares described below and whose sales would be subject to additional restrictions described below. The remaining common shares, representing % of our issued and outstanding shares will be held by our existing shareholders. These shares will be “restricted securities” as that phrase is defined in Rule 144 under the Securities Act. Subject to certain contractual restrictions, including the lock-up agreements described below, holders of restricted shares will be entitled to sell those shares in the public market pursuant to an effective registration statement under the Securities Act or if they qualify for an exemption from registration under Rule 144. Sales of these shares in the public market after the restrictions under the lock-up agreements lapse, or the perception that those sales may occur, could cause the prevailing market price to decrease or to be lower than it might be in the absence of those sales or perceptions. As a result of lock-up agreements and market standoff agreements described below, and the provisions of Rules 144 and 701 under the Securities Act, the restricted securities will be available for sale in the public market.
In addition, based on our capitalization as of June 30, 2024, shares issuable upon exercise of outstanding options will also be eligible for sale upon expiration of the lock-up period. We intend to register all of the shares underlying outstanding options and any shares underlying other equity incentives we may grant in the future for public resale under the Securities Act. Accordingly, these shares will be able to be freely sold in the public market upon issuance to the extent permitted by any applicable vesting requirements and the lock-up agreements described above.
Sales of these shares in the public market after the restrictions under the lock-up agreements lapse, or the perception that those sales may occur, could cause the prevailing market price to decrease or to be lower than it might be in the absence of those sales or perceptions.
Lock-up Agreements
We, our directors, executive officers and our existing shareholders, have agreed, subject to certain exceptions, not to sell or transfer any common shares or securities convertible into, exchangeable for, exercisable for, or repayable with common shares, for 180 days after the date of this prospectus without first obtaining the written consent of . See “Underwriting.”
Eligibility of Restricted Shares for Sale in the Public Market
The common shares that are not being sold in this offering, but which will be outstanding at the time this offering is complete, will be eligible for sale into the public market, under the provisions of Rule 144 commencing after the expiration of the restrictions under the lock-up agreements, subject to volume restrictions discussed below under “—Rule 144.”
Rule 144
In general, under Rule 144 under the Securities Act, a person (or persons whose shares are aggregated) who is not deemed to have been an affiliate of ours at any time during the three months preceding a sale, and who has beneficially owned restricted securities within the meaning of Rule 144 for at least six months (including any period of consecutive ownership of preceding non-affiliated holders) would be entitled to sell those shares, subject only to the availability of current public information about us. A non-affiliated person who has beneficially owned restricted securities within the meaning of Rule 144 for at least one year would be entitled to sell those shares without regard to the provisions of Rule 144.
A person (or persons whose shares are aggregated) who is deemed to be an affiliate of ours and who has beneficially owned restricted securities within the meaning of Rule 144 for at least six months would be entitled to sell within any three-month period a number of shares that does not exceed the greater of one percent of the then issued and outstanding common shares or the average weekly trading volume of our common shares during the four calendar weeks preceding such sale. Such sales are also subject to certain manner of sale provisions, notice requirements and the availability of current public information about us.
Taxation
The following summary contains a description of certain Cayman Islands and U.S. federal income tax consequences of the acquisition, ownership and disposition of our common shares. It does not purport to be a comprehensive description of all the tax considerations that may be relevant to a decision to purchase the common shares, is not applicable to all categories of investors, some of which may be subject to special rules, and does not address all of the Cayman Islands and U.S. federal income tax considerations applicable to any particular holder. The summary is based upon the tax laws of the Cayman Islands and regulations thereunder and upon the tax laws of the United States and regulations thereunder as of the date hereof, which are subject to change.
Prospective purchasers of our common shares should consult their own tax advisors about the particular Cayman Islands and U.S. federal, state, local and other tax consequences to them of the acquisition, ownership and disposition of our common shares.
Cayman Islands Tax Considerations
The Cayman Islands laws currently levy no taxes on individuals or corporations based upon profits, income, gains or appreciation and there is no taxation in the nature of inheritance tax or estate duty or withholding tax applicable to us or to any holder of common shares. There are no other taxes likely to be material to us levied by the government of the Cayman Islands except for stamp duties which may be applicable on instruments executed in, or after execution brought within the jurisdiction of the Cayman Islands. No stamp duty is payable in the Cayman Islands on transfers of shares of Cayman Islands companies except those which hold interests in land in the Cayman Islands. The Cayman Islands is not party to any double tax treaties which are applicable to any payments made by or to our company. There are no exchange control regulations or currency restrictions in the Cayman Islands.
As a Cayman Islands exempted company with limited liability, we have applied for and received an undertaking as to tax concessions pursuant to Section 6 of the Tax Concessions Act (As Revised). On September 8, 2023, we received this undertaking which provides that, for a period of 20 years from the date of issue of the undertaking, no law thereafter enacted in the Cayman Islands imposing any taxes to be levied on profits, income, gains or appreciation will apply to us or our operations.
Payments of dividends and capital in respect of our common shares will not be subject to taxation in the Cayman Islands and no withholding will be required on the payment of a dividend or capital to any holder of our common shares, nor will gains derived from the disposal of our common shares be subject to Cayman Islands income or corporation tax. The Cayman Islands currently have no income, corporation or capital gains tax and no estate duty, inheritance tax or gift tax.
There is no income tax treaty or convention currently in effect between the United States and the Cayman Islands.
U.S. Federal Income Tax Considerations
In the opinion of Davis Polk & Wardwell LLP, the following summary describes the material U.S. federal income tax consequences of the acquisition, ownership and disposition of our common shares, but it does not purport to be a comprehensive description of all of the tax considerations that may be relevant to a particular person’s decision to acquire such securities.
This summary applies only to U.S. Holders (as defined below) that hold our common shares as capital assets for tax purposes. In addition, it does not describe all of the tax consequences that may be relevant in light of a U.S. Holder’s particular circumstances, including alternative minimum tax consequences, the potential application of the provisions of the Internal Revenue Code of 1986, as amended (the “Code”), known as the Medicare contribution tax, and tax consequences applicable to U.S. Holders subject to special rules, such as:
| · | certain financial institutions; |
| · | real estate investment trusts or regulated investment companies; |
| · | dealers or traders in securities that use a mark-to-market method of tax accounting; |
| · | persons holding common shares as part of a hedging transaction, straddle, wash sale, conversion transaction or other integrated transaction, or persons entering into a constructive sale with respect to such common shares; |
| · | persons whose functional currency for U.S. federal income tax purposes is not the U.S. dollar; |
| · | tax-exempt entities, including an “individual retirement account” or “Roth IRA;” |
| · | entities classified as partnerships for U.S. federal income tax purposes; |
| · | persons that own or are deemed to own ten percent or more of our stock, by vote or value; or |
| · | persons holding our common shares in connection with a trade or business conducted outside of the United States. |
If an entity or arrangement that is classified as a partnership for U.S. federal income tax purposes holds our common shares, the U.S. federal income tax treatment of a partner will generally depend on the status of the partner and the activities of the partnership. Partnerships holding our common shares and partners in such partnerships should consult their tax advisors as to the particular U.S. federal income tax consequences of holding and disposing of the common shares.
This discussion is based on the Code, administrative pronouncements, judicial decisions, final, temporary and proposed Treasury regulations, all as of the date hereof, any of which is subject to change or differing interpretations, possibly with retroactive effect.
A “U.S. Holder” is a holder who, for U.S. federal income tax purposes, is a beneficial owner of our common shares and is:
| · | an individual that is a citizen or resident of the United States; |
| · | a corporation, or other entity taxable as a corporation, created or organized in or under the laws of the United States, any state therein or the District of Columbia; or |
| · | an estate or trust the income of which is subject to U.S. federal income taxation regardless of its source. |
U.S. Holders should consult their tax advisors concerning the U.S. federal, state, local and non-U.S. tax consequences of owning and disposing of our common shares in their particular circumstances.
Except where noted, this discussion assumes that we are not, and will not become, a passive foreign investment company, or a “PFIC,” as described below.
Taxation of Distributions
Subject to the discussion below under “—Passive Foreign Investment Company Rules,” distributions paid on our common shares, other than certain pro rata distributions of common shares, will be treated as dividends for U.S. federal income tax purposes to the extent paid out of our current or accumulated earnings and profits (as determined under U.S. federal income tax principles). Because we do not maintain calculations of our earnings and profits under U.S. federal income tax principles, we expect that distributions generally will be reported to U.S. Holders as dividends. Subject to applicable limitations, dividends paid to certain non-corporate U.S. Holders may be eligible for taxation as “qualified dividend income” and therefore may be taxable at rates applicable to long-term capital gains, so long as our common shares are listed and readily traded on the NYSE or are readily tradable on another established securities market in the United States, and we are not a PFIC (as discussed below under “—Passive Foreign Investment Company Rules”) for the taxable year in which the dividend is paid and the preceding taxable year. U.S. Holders should consult their tax advisors regarding the availability of the reduced tax rate on dividends in their particular circumstances.
The amount of any dividend will generally be treated as foreign-source dividend income to U.S. Holders and will not be eligible for the dividends-received deduction generally available to U.S. corporations under the Code. Dividends will be included in a U.S. Holder’s income on the date of the U.S. Holder’s receipt of the dividend.
A U.S. Holder generally will be entitled, subject to certain limitations, to a credit against its U.S. federal income tax liability, or to a deduction, if elected, in computing its U.S. federal taxable income, for non-refundable non-U.S. income taxes withheld from dividends. For purposes of the foreign tax credit limitation, dividends paid by us generally will constitute foreign source income in the “passive category income” basket. The rules relating to the foreign tax credit or deduction, if elected, are complex and U.S. Holders should consult their tax advisors concerning their availability in their particular circumstances.
Sale or Other Disposition of Common Shares
Subject to the discussion below under “—Passive Foreign Investment Company Rules,” for U.S. federal income tax purposes, gain or loss realized on the sale or other disposition of our common shares will be capital gain or loss and will be long-term capital gain or loss if the U.S. Holder held the common shares for more than one year. The amount of the gain or loss will equal the difference between the U.S. Holder’s tax basis in the common shares disposed of and the amount realized on the disposition. This gain or loss will generally be U.S.-source gain or loss for foreign tax credit purposes. The deductibility of capital losses is subject to various limitations. U.S. Holders should consult their own tax advisors concerning the creditability or deductibility of any non-U.S. income tax imposed on the disposition of common shares in their particular circumstances.
Passive Foreign Investment Company Rules
A non-U.S. corporation will be a PFIC for any taxable year in which either (1) 75% or more of its gross income consists of “passive income,” or (2) 50% or more of the average quarterly value of its assets consist of assets that produce, or are held for the production of, “passive income.” For this purpose, subject to certain exceptions, passive income includes interest, dividends, rents and gains from transactions in commodities. A non-U.S. corporation will be treated as owning its proportionate share of the assets and earning its proportionate share of the income of any other corporation in which it owns, directly or indirectly, more than 25% (by value) of the stock.
We do not believe we were a PFIC for our 2023 taxable year, and based on our current operations, income, assets and certain estimates and projections, including as to the relative values of our assets, we do not expect to be a PFIC for our current taxable year or to become one in the foreseeable future. However, because PFIC status depends on the composition of a company’s income and assets and the market value of its assets from time to time, there can be no assurance that we will not be a PFIC for any taxable year. Moreover, because we will hold a substantial amount of cash following this offering, we may be or become a PFIC if we do not deploy significant amounts of cash for active purposes. If we were a PFIC for any year during which a U.S. Holder holds our common shares, we generally would continue to be treated as a PFIC with respect to that U.S. Holder for all succeeding years during which the U.S. Holder holds the common shares, even if we ceased to meet the threshold requirements for PFIC status.
If we were a PFIC for any taxable year during which a U.S. Holder held our common shares (assuming such U.S. Holder has not made a timely election described below), gain recognized by a U.S. Holder on a sale or other disposition (including certain pledges) of the common shares would be allocated ratably over the U.S. Holder’s holding period for the common shares. The amounts allocated to the taxable year of the sale or other disposition and to any year before we became a PFIC would be taxed as ordinary income. The amount allocated to each other taxable year would be subject to tax at the highest rate in effect for individuals or corporations, as appropriate, for that taxable year, and an interest charge would be imposed on the tax on such amount. Further, to the extent that any distribution received by a U.S. Holder on its common shares exceeds 125% of the average of the annual distributions on the common shares received during the preceding three years or the U.S. Holder’s holding period, whichever is shorter, that distribution would be subject to taxation in the same manner as gain, described immediately above. If we are a PFIC in any year, certain elections may be available that would result in alternative tax consequences (such as mark-to-market treatment) of owning and disposing of the common shares. U.S. Holders should consult their tax advisors to determine whether any of these elections would be available and, if so, what the consequences of the alternative treatments would be in their particular circumstances.
In addition, if we were a PFIC or, with respect to a particular U.S. Holder, were treated as a PFIC for the taxable year in which we paid a dividend or for the prior taxable year, the preferential dividend rates discussed above with respect to dividends paid to certain non-corporate U.S. Holders would not apply.
If a U.S. Holder owns common shares during any year in which we are a PFIC, the holder generally must file an annual report containing such information as the U.S. Treasury may require on IRS Form 8621 (or any successor form) with respect to us, generally with the holder’s federal income tax return for that year.
U.S. Holders should consult their tax advisors concerning our potential PFIC status and the potential application of the PFIC rules.
Information Reporting and Backup Withholding
Payments of dividends and sales proceeds that are made within the United States or through certain U.S.-related financial intermediaries generally are subject to information reporting, and may be subject to backup withholding, unless (1) the U.S. Holder is a corporation or other exempt recipient or (2) in the case of backup withholding, the U.S. Holder provides a correct taxpayer identification number and certifies that it is not subject to backup withholding.
Backup withholding is not an additional tax. The amount of any backup withholding from a payment to a U.S. Holder will be allowed as a credit against such holder’s U.S. federal income tax liability and may entitle it to a refund, provided that the required information is timely furnished to the IRS. U.S. Holders should consult their tax advisors regarding the application of the U.S. information reporting and backup withholding rules.
Information with Respect to Foreign Financial Assets
Certain U.S. Holders may be required to report information on their U.S. federal income tax returns relating to an interest in our common shares, subject to certain exceptions (including an exception for common shares held in accounts maintained by certain U.S. financial institutions). U.S. Holders should consult their tax advisors regarding the effect, if any, of this requirement on their ownership and disposition of the common shares.
Each prospective investor should consult its own tax advisor regarding the particular U.S. federal, state, and local and non-U.S. tax consequences of purchasing, holding, and disposing of our common shares, including the consequences of any proposed change in applicable laws.
Underwriting
We are offering the common shares described in this prospectus through a number of underwriters. J.P. Morgan Securities LLC, BofA Securities, Inc. and Citigroup Global Markets Inc. are acting as representatives of the underwriters. We will enter into an underwriting agreement with the underwriters. Subject to the terms and conditions of the underwriting agreement, we will agree to sell to the underwriters and each underwriter will severally agree to purchase, at the public offering price less the underwriting discounts and commissions set forth on the cover page of this prospectus, the number of common shares listed next to its name in the following table:
Name | Number of Shares |
| J.P. Morgan Securities LLC | |
| BofA Securities, Inc. | |
| Citigroup Global Markets Inc. | |
| Itau BBA USA Securities, Inc. | |
| Banco BTG Pactual S.A. – Cayman Branch | |
| Santander US Capital Markets LLC | |
| Goldman Sachs & Co. LLC | |
| Jefferies LLC | |
| Morgan Stanley & Co. LLC | |
| Total | |
Banco BTG Pactual S.A. – Cayman Branch is not a broker-dealer registered with the SEC, and therefore may not make sales of any common shares in the United States or to U.S. persons except in compliance with applicable U.S. laws and regulations. To the extent Banco BTG Pactual S.A. – Cayman Branch intends to effect sales of the common shares in the United States, it will do so only through BTG Pactual US Capital, LLC or one or more U.S. registered broker-dealers, or otherwise as permitted by applicable U.S. law.
The underwriters will be committed, severally and not jointly, to purchase all the common shares offered by us if they purchase any shares. The underwriting agreement will also provide that if an underwriter defaults, the purchase commitments of non-defaulting underwriters may also be increased or this offering may be terminated.
The underwriters propose to offer the common shares directly to the public at the initial public offering price set forth on the cover page of this prospectus and to certain dealers at that price less a concession not in excess of US$ per share. After the initial offering of the shares to the public, the offering price and other selling terms may be changed by the underwriters. Sales of shares made outside of the United States may be made by affiliates of the underwriters.
The underwriters will have an option to buy up to additional common shares from us. The underwriters will have 30 days from the date of this prospectus to exercise this option to purchase additional shares. If any shares are purchased with this option to purchase additional shares, the underwriters will purchase shares in approximately the same proportion as shown in the table above. If any additional common shares are purchased, the underwriters will offer the additional shares on the same terms as those on which the shares are being offered.
The underwriting fee is equal to the public offering price per share of common shares less the amount paid by the underwriters to us per share of common shares. The underwriting fee is US$ per share. The following table shows the per share and total underwriting discounts and commissions to be paid to the underwriters assuming both no exercise and full exercise of the underwriters’ option to purchase additional shares.
| | Without option to purchase additional shares exercise | With full option to purchase additional shares exercise |
| Per Share | US$ | US$ |
| Total | US$ | US$ |
We estimate that the total expenses of this offering, including registration, filing and listing fees, printing fees, and legal and accounting expenses, but excluding the underwriting discounts and commissions, will be
approximately US$ . We will agree to reimburse the underwriters for certain of their expenses in an amount up to US$ .
A prospectus in electronic format may be made available on the web sites maintained by one or more underwriters, or selling group members, if any, participating in this offering. The underwriters may agree to allocate a number of shares to underwriters and selling group members for sale to their online brokerage account holders. Internet distributions will be allocated by the representatives to underwriters and selling group members that may make Internet distributions on the same basis as other allocations.
We will agree that we will not (i) offer, pledge, announce the intention to sell, sell, contract to sell, sell any option or contract to purchase, purchase any option or contract to sell, grant any option, right or warrant to purchase or otherwise dispose of, directly or indirectly, or file with the SEC a registration statement under the Securities Act relating to, any common shares or securities convertible into or exchangeable or exercisable for any common shares, or publicly disclose the intention to make any offer, sale, pledge, disposition or filing or (ii) enter into any swap or other arrangement that transfers all or a portion of the economic consequences associated with the ownership of any common shares or any such other securities (regardless of whether any of these transactions are to be settled by the delivery of common shares or such other securities, in cash or otherwise), in each case without the prior written consent of for a period of days after the date of this prospectus, other than the common shares to be sold hereunder and certain other exceptions.
Our directors, our executive officers, and existing shareholders have entered or will enter into lock-up agreements with the underwriters prior to the commencement of this offering pursuant to which each of these persons or entities, with limited exceptions, for a period of 180 days after the date of this prospectus, may not, without the prior written consent of , (i) offer, pledge, announce the intention to sell, sell, contract to sell, sell any option or contract to purchase, purchase any option or contract to sell, grant any option, right or warrant to purchase, or otherwise transfer or dispose of, directly or indirectly, any common shares or any securities convertible into or exercisable or exchangeable for our common shares (including, without limitation, common shares or such other securities which may be deemed to be beneficially owned by such directors, executive officers and shareholders in accordance with the rules and regulations of the SEC and securities which may be issued upon exercise of a share option or warrant); (ii) enter into any swap or other agreement that transfers, in whole or in part, any of the economic consequences of ownership of the common shares or such other securities, whether any such transaction described in clause (i) or (ii) above is to be settled by delivery of common shares or such other securities, in cash or otherwise; or (iii) make any demand for or exercise any right with respect to the registration of any common shares or any security convertible into or exercisable or exchangeable for our common shares.
We will agree to indemnify the underwriters against certain liabilities, including liabilities under the Securities Act.
We have applied to have our common shares approved for listing/quotation on NYSE under the symbol “MOOV.”
In connection with this offering, the underwriters may engage in stabilizing transactions, which involves making bids for, purchasing, and selling common shares in the open market for the purpose of preventing or retarding a decline in the market price of the common shares while this offering is in progress. These stabilizing transactions may include making short sales of the common shares, which involves the sale by the underwriters of a greater number of common shares than they are required to purchase in this offering and purchasing common shares on the open market to cover positions created by short sales. Short sales may be “covered” shorts, which are short positions in an amount not greater than the underwriters’ option to purchase additional shares referred to above, or may be “naked” shorts, which are short positions in excess of that amount. The underwriters may close out any covered short position either by exercising their option to purchase additional shares, in whole or in part, or by purchasing shares in the open market. In making this determination, the underwriters will consider, among other things, the price of shares available for purchase in the open market compared to the price at which the underwriters may purchase shares through the option to purchase additional shares. A naked short position is more likely to be created if the underwriters are concerned that there may be downward pressure on the price of the common shares in
the open market that could adversely affect investors who purchase in this offering. To the extent that the underwriters create a naked short position, they will purchase shares in the open market to cover the position.
These activities may have the effect of raising or maintaining the market price of the common shares or preventing or retarding a decline in the market price of the common shares and, as a result, the price of the common shares may be higher than the price that otherwise might exist in the open market. If the underwriters commence these activities, they may discontinue them at any time. The underwriters may carry out these transactions on , in the over-the-counter market or otherwise.
Prior to this offering, there has been no public market for our common shares. The initial public offering price will be determined by negotiations between us and the representatives of the underwriters. In determining the initial public offering price, we and the representatives of the underwriters expect to consider a number of factors including:
| · | the information set forth in this prospectus and otherwise available to the representatives; |
| · | our prospects and the history and prospects for the industry in which we compete; |
| · | an assessment of our management; |
| · | our prospects for future earnings; |
| · | the general condition of the securities markets at the time of this offering; |
| · | the recent market prices of and demand for, publicly traded common shares of generally comparable companies; and |
| · | other factors deemed relevant by the underwriters and us. |
Neither we nor the underwriters can assure investors that an active trading market will develop for our common shares, or that the shares will trade in the public market at or above the initial public offering price.
Other Relationships
Some of the underwriters and their affiliates have engaged in, and may in the future engage in, investment banking and other commercial dealings in the ordinary course of business with us or our affiliates. They have received, or may in the future receive, customary fees and commissions for these transactions. Specifically, certain of the underwriters or their respective affiliates were lenders under the US$450 million syndicated loan entered into on May 23, 2022, among Millennium Moove Corp. as borrower, certain guarantors and JPMorgan Chase Bank, N.A., Bank of America, N.A., Citibank N.A., MUFG Bank, Ltd., Itaú Unibanco S.A. – Nassau Branch and The Bank of Nova Scotia, as lenders, in connection with our acquisition of PetroChoice. The syndicated loan is a senior secured loan that accrues interest per annum at a rate equal to term SOFR plus an additional applicable rate. The syndicated loan matures on May 3, 2027.
The underwriters and their respective affiliates are full service financial institutions engaged in various activities, which may include sales and trading, commercial and investment banking, advisory, investment management, investment research, principal investment, hedging, market making, brokerage and other financial and non-financial activities and services. Certain of the underwriters and their respective affiliates have provided, and may in the future provide, a variety of these services to us and to persons and entities with relationships with us, for which they received or will receive customary fees and expenses. In addition, in the ordinary course of their business activities, the underwriters and their affiliates may make or hold a broad array of investments and actively trade debt and equity securities (or related derivative securities) and financial instruments (including bank loans) for their own account and for the accounts of their customers. Such investments and securities activities may involve securities and/or instruments of ours or our affiliates. The underwriters and their affiliates may also make investment recommendations and/or publish or express independent research views in respect of such securities or financial instruments and may hold, or recommend to clients that they acquire, long and/or short positions in such securities and instruments.
Selling Restrictions
Other than in the United States, no action has been taken by us or the underwriters that would permit a public offering of the securities offered by this prospectus in any jurisdiction where action for that purpose is required. The securities offered by this prospectus may not be offered or sold, directly or indirectly, nor may this prospectus or any other offering material or advertisements in connection with the offer and sale of any such securities be distributed or published in any jurisdiction, except under circumstances that will result in compliance with the applicable rules and regulations of that jurisdiction. Persons into whose possession this prospectus comes are advised to inform themselves about and to observe any restrictions relating to this offering and the distribution of this prospectus. This prospectus does not constitute an offer to sell or a solicitation of an offer to buy any securities offered by this prospectus in any jurisdiction in which such an offer or a solicitation is unlawful.
Notice to Prospective Investors in Canada
Our common shares may be sold in Canada only to purchasers purchasing, or deemed to be purchasing, as principal that are accredited investors, as defined in National Instrument 45-106 Prospectus Exemptions or subsection 73.3(1) of the Securities Act (Ontario), and are permitted clients, as defined in National Instrument 31-103 Registration Requirements, Exemptions, and Ongoing Registrant Obligations. Any resale of common shares must be made in accordance with an exemption from, or in a transaction not subject to, the prospectus requirements of applicable securities laws.
Securities legislation in certain provinces or territories of Canada may provide a purchaser with remedies for rescission or damages if this prospectus (including any amendment thereto) contains a misrepresentation, provided that the remedies for rescission or damages are exercised by the purchaser within the time limit prescribed by the securities legislation of the purchaser’s province or territory. The purchaser should refer to any applicable provisions of the securities legislation of the purchaser’s province or territory for particulars of these rights or consult with a legal advisor.
Pursuant to section 3A.3 of National Instrument 33-105 Underwriting Conflicts, or NI 33-105, the underwriters are not required to comply with the disclosure requirements of NI 33-105 regarding underwriter conflicts of interest in connection with this offering.
Notice to Prospective Investors in the European Economic Area
In relation to each Member State of the European Economic Area, or each, a Relevant Member State, no offer of shares may be made to the public in that Relevant Member State other than:
| A. | to any legal entity which is a qualified investor as defined in the Prospectus Directive; |
| B. | to fewer than 100 or, if the Relevant Member State has implemented the relevant provision of the 2010 PD Amending Directive, 150, natural or legal persons (other than qualified investors as defined in the Prospectus Directive), as permitted under the Prospectus Directive, subject to obtaining the prior consent of the representatives; or |
| C. | in any other circumstances falling within Article 3(2) of the Prospectus Directive, |
provided that no such offer of shares shall require the Company or the representatives to publish a prospectus pursuant to Article 3 of the Prospectus Directive or supplement a prospectus pursuant to Article 16 of the Prospectus Directive.
Each person in a Relevant Member State who initially acquires any shares or to whom any offer is made will be deemed to have represented, acknowledged, and agreed that it is a “qualified investor” within the meaning of the law in that Relevant Member State implementing Article 2(1)(e) of the Prospectus Directive. In the case of any shares being offered to a financial intermediary as that term is used in Article 3(2) of the Prospectus Directive, each such financial intermediary will be deemed to have represented, acknowledged, and agreed that the shares acquired by it in the offer have not been acquired on a non-discretionary basis on behalf of, nor have they been acquired with a view to their offer or resale to, persons in circumstances which may give rise to an offer of any shares to the public
other than their offer or resale in a Relevant Member State to qualified investors as so defined or in circumstances in which the prior consent of the representatives has been obtained to each such proposed offer or resale.
The Company, the representatives, and their affiliates will rely upon the truth and accuracy of the foregoing representations, acknowledgements, and agreements.
This prospectus has been prepared on the basis that any offer of shares in any Relevant Member State will be made pursuant to an exemption under the Prospectus Directive from the requirement to publish a prospectus for offers of shares. Accordingly any person making or intending to make an offer in that Relevant Member State of shares which are the subject of this offering contemplated in this prospectus may only do so in circumstances in which no obligation arises for the Company or any of the underwriters to publish a prospectus pursuant to Article 3 of the Prospectus Directive in relation to such offer. Neither the Company nor the underwriters have authorized, nor do they authorize, the making of any offer of shares in circumstances in which an obligation arises for the Company or the underwriters to publish a prospectus for such offer.
For the purpose of the above provisions, the expression “an offer to the public” in relation to any shares in any Relevant Member State means the communication in any form and by any means of sufficient information on the terms of the offer and the shares to be offered so as to enable an investor to decide to purchase or subscribe the shares, as the same may be varied in the Relevant Member State by any measure implementing the Prospectus Directive in the Relevant Member State and the expression “Prospectus Directive” means Directive 2003/71/EC (including the 2010 PD Amending Directive, to the extent implemented in the Relevant Member States) and includes any relevant implementing measure in the Relevant Member State and the expression “2010 PD Amending Directive” means Directive 2010/73/EU.
Notice to Prospective Investors in the United Kingdom
In addition, in the United Kingdom, this document is being distributed only to and is directed only at and any offer subsequently made may only be directed at persons who are “qualified investors” (as defined in the Prospectus Directive) (i) who have professional experience in matters relating to investments falling within Article 19(5) of the Financial Services and Markets Act 2000 (Financial Promotion) Order 2005, as amended, or the Order, or (ii) who are high net worth companies (or persons to whom it may otherwise be lawfully communicated) falling within Article 49(2)(a) to (d) of the Order (all such persons together being referred to as relevant persons).
Any person in the United Kingdom that is not a relevant person should not act or rely on the information included in this document or use it as a basis for taking any action. In the United Kingdom, any investment or investment activity that this document relates to may be made or taken exclusively by relevant persons. Any person in the United Kingdom that is not a relevant person should not act or rely on this document or any of its contents.
Notice to Prospective Investors in Argentina
The common shares are not authorized for public offering in Argentina by the Comisión Nacional de Valores pursuant to Argentine Public Offering Law No. 17,811, as amended, and they shall not be sold publicly. Therefore, any transaction carried out in Argentina must be made privately.
Notice to Prospective Investors in Australia
No placement document, prospectus, product disclosure statement or other disclosure document has been lodged or will be lodged with the Australian Securities and Investments Commission (ASIC), in relation to this offering. This document does not constitute a prospectus, product disclosure statement or other disclosure document under the Corporations Act 2001 (the Corporations Act) and does not purport to include the information required for a prospectus, product disclosure statement or other disclosure document under the Corporations Act.
Any offer in Australia of the common shares may only be made to persons (the Exempt Investors) who are “sophisticated investors” (within the meaning of section 708(8) of the Corporations Act), “professional investors” (within the meaning of section 708(11) of the Corporations Act) or otherwise pursuant to one or more exemptions contained in section 708 of the Corporations Act so that it is lawful to offer the common shares without disclosure to investors under Chapter 6D of the Corporations Act.
The common shares applied for by Exempt Investors in Australia must not be offered for sale in Australia in the period of 12 months after the date of allotment under the offering, except in circumstances where disclosure to investors under Chapter 6D of the Corporations Act would not be required pursuant to an exemption under section 708 of the Corporations Act or otherwise or where the offer is pursuant to a disclosure document which complies with Chapter 6D of the Corporations Act. Any person acquiring common shares must observe such Australian on-sale restrictions.
The Company is not licensed in Australia to provide financial product advice in relation to the common shares. This prospectus contains general information only and does not take account of the investment objectives, financial situation or particular needs of any particular person. It does not contain any securities recommendations or financial product advice. Any advice contained in this document is general advice only. Before making an investment decision on the basis of this document, investors should consider the appropriateness of the information in this document, having regard to their own objectives, financial situation and needs, and, if necessary, seek expert advice on those matters. No cooling off period applies to an acquisition of the common shares.
Notice to Prospective Investors in Brazil
The offer and sale of the Shares will not be carried out by any means that would constitute a public offering in Brazil under Law No. 6,385, dated December 7, 1976, as amended, and under CVM Resolution (Resolução) No. 160, dated July 13, 2022, as amended, or “CVM Resolution 160”. The offer and sale of the Shares have not been and will not be registered with the Comissão de Valores Mobiliários in Brazil. The Shares may not be offered or sold in Brazil except pursuant to an exemption from the registration requirements of applicable Brazilian securities laws. Any representation to the contrary is untruthful.
The Shares may be offered or sold in Brazil only to professional investors, as defined in, and in reliance upon, article 11 of CVM Resolution No. 30, dated May 11, 2021, and article 8, item VI, of CVM Resolution 160. This Prospectus is being addressed to the addressee personally, and for its sole benefit. Distribution of this Prospectus to any other person other than the addressee specified by the Agents or its affiliates, representatives, or those persons, if any, retained to advise the addressee, and any disclosure of its contents is prohibited.
Therefore, as this prospectus does not constitute or form part of any public offering to sell or solicitation of a public offering to buy any shares or assets, the offering and THE COMMON SHARES OFFERED HEREBY HAVE NOT BEEN, AND WILL NOT BE, AND MAY NOT BE OFFERED FOR SALE OR SOLD IN BRAZIL EXCEPT IN CIRCUMSTANCES WHICH DO NOT CONSTITUTE A PUBLIC OFFERING OR DISTRIBUTION UNDER BRAZILIAN LAWS AND REGULATIONS. DOCUMENTS RELATING TO THE COMMON SHARES, AS WELL AS THE INFORMATION CONTAINED THEREIN, MAY NOT BE SUPPLIED TO THE PUBLIC, AS A PUBLIC OFFERING IN BRAZIL OR BE USED IN CONNECTION WITH ANY OFFER FOR SUBSCRIPTION OR SALE OF THE COMMON SHARES TO THE PUBLIC IN BRAZIL.
Notice to Prospective Investors in the Cayman Islands
This prospectus does not constitute an offer or invitation to the public in the Cayman Islands for the common shares, whether by way of sale or subscription. The common shares have not been offered or sold, and will not be offered or sold, directly or indirectly, in the Cayman Islands.
Notice to Prospective Investors in Chile
The offer of the common shares is subject to CMF Rule 336. The common shares being offered will not be registered under the Chilean Securities Market Law in the Securities Registry (Registro de Valores) or in the Foreign Securities Registry (Registro de Valores Extranjeros) of the CMF and, therefore, the common shares are not subject to the supervision of the CMF. As unregistered securities, we are not required to disclose public information about the common shares in Chile. Accordingly, the common shares cannot and will not be publicly offered to persons in Chile unless they are registered in the corresponding securities registry. The common shares may only be offered in Chile in circumstances that do not constitute a public offering under Chilean law or in compliance with CMF Rule 336. Pursuant to CMF Rule 336, the common shares may be privately offered in Chile to certain “qualified investors” identified as such therein (which in turn are further described in Rule No. 216, dated June 12, 2008 and in Rule No. 410, dated July 27, 2016, both issued by the CMF).
LA OFERTA DE LAS ACCIONES COMUNES SE ACOGE A LA NORMA DE CARÁCTER GENERAL Nº336 DE LA CMF. LAS ACCIONES COMUNES QUE SE OFRECEN NO ESTÁN INSCRITOS BAJO LA LEY DE MERCADO DE VALORES EN EL REGISTRO DE VALORES O EN EL REGISTRO DE VALORES EXTRANJEROS QUE LLEVA LA CMF, POR LO QUE TALES VALORES NO ESTÁN SUJETOS A LA FISCALIZACIÓN DE ÉSTA. POR TRATARSE DE VALORES NO INSCRITOS, NO EXISTE OBLIGACIÓN
POR PARTE DEL EMISOR DE ENTREGAR EN CHILE INFORMACIÓN PÚBLICA RESPECTO DE ESTOS VALORES. LAS ACCIONES COMUNES NO PODRÁN SER OBJETO DE OFERTA PÚBLICA EN CHILE MIENTRAS NO SEAN INSCRITOS EN EL REGISTRO DE VALORES CORRESPONDIENTE. LAS ACCIONES COMUNES SOLO PODRÁN SER OFRECIDOS EN CHILE EN CIRCUNSTANCIAS QUE NO CONSTITUYAN UNA OFERTA PÚBLICA O CUMPLIENDO CON LO DISPUESTO EN LA NORMA DE CARÁCTER GENERAL Nº336 DE LA CMF. EN CONFORMIDAD CON LO DISPUESTO POR LA NORMA DE CARÁCTER GENERAL Nº336, LAS ACCIONES COMUNES PODRÁN SER OFRECIDOS PRIVADAMENTE A CIERTOS “INVERSIONISTAS CALIFICADOS,” IDENTIFICADOS COMO TAL EN DICHA NORMA (Y QUE A SU VEZ ESTÁN DESCRITOS EN LA NORMA DE CARÁCTER GENERAL Nº216 DE LA CMF DE FECHA 12 DE JUNIO DE 2008 Y EN LA NORMA DE CARÁCTER GENERAL Nº410 DE LA CMF DE FECHA 27 DE JULIO DE 2016).
Notice to Prospective Investors in China
The common shares may not be offered or sold directly or indirectly to the public in the People’s Republic of China (China) and neither this prospectus, which has not been submitted to the Chinese Securities and Regulatory Commission, nor any offering material or information contained herein relating to the common shares may be supplied to the public in China or used in connection with any offer for the subscription or sale of common shares to the public in China. The common shares may only be offered or sold to China-related organizations which are authorized to engage in foreign exchange business and offshore investment from outside of China. Such China-related investors may be subject to foreign exchange control approval and filing requirements under the relevant Chinese foreign exchange regulations. For the purpose of this paragraph, China does not include Taiwan and the special administrative regions of Hong Kong and Macau.
Notice to Prospective Investors in Colombia
The common shares have not been and will not be registered on the Colombian National Registry of Securities and Issuers or in the Colombian Stock Exchange. Therefore, the common shares may not be publicly offered in Colombia. This material is for your sole and exclusive use as a determined entity, including any of your shareholders, administrators or employees, as applicable. You acknowledge the Colombian laws and regulations (specifically foreign exchange and tax regulations) applicable to any transaction or investment consummated pursuant hereto and represent that you are the sole liable party for full compliance with any such laws and regulations.
Notice to Prospective Investors in France
Neither this prospectus nor any other offering material relating to the shares described in this prospectus has been submitted to the clearance procedures of the Autorité des Marchés Financiers or of the competent authority of another member state of the European Economic Area and notified to the Autorité des Marchés Financiers. The shares have not been offered or sold and will not be offered or sold, directly or indirectly, to the public in France. Neither this prospectus nor any other offering material relating to the shares has been or will be:
| · | released, issued, distributed or caused to be released, issued or distributed to the public in France; or |
| · | used in connection with any offer for subscription or sale of the shares to the public in France. |
Such offers, sales, and distributions will be made in France only:
| · | to qualified investors (investisseurs qualifiés) or to a restricted circle of investors (cercle restreint d’investisseurs), in each case investing for their own account, all as defined in and in accordance with articles L.411-2, D.411-1, D.411-2, D.734-1, D.744-1, D.754-1 and D.764-1 of the French Code monétaire et financier; |
| · | to investment services providers authorized to engage in portfolio management on behalf of third parties; or |
| · | in a transaction that, in accordance with article L.411-2-II-1°-or-2°-or 3° of the French Code monétaire et financier and article 211-2 of the General Regulations (Règlement Général) of the Autorité des Marchés Financiers, does not constitute a public offer (appel public à l’épargne). |
The shares may be resold directly or indirectly, only in compliance with articles L.411-1, L.411-2, L.412-1, and L.621-8 through L.621-8-3 of the French Code monétaire et financier.
Notice to Prospective Investors in Germany
The common shares will not be offered, sold or publicly promoted or advertised in the Federal Republic of Germany other than in compliance with the German Securities Prospectus Act (Gesetz uber die Erstellung, Billigung und Veroffentlichung des Prospekts, der beim offentlicken Angebot von Wertpapieren oder bei der Zulassung von Wertpapieren zum Handel an einem organisierten Markt zu veroffenlichen ist — Wertpapierprospektgesetz) as of June 22, 2005, effective as of July 1, 2005, as amended, or any other laws and regulations applicable in the Federal Republic of Germany governing the issue, offering and sale of securities. No selling prospectus (Verkaufsprospeckt) within the meaning of the German Securities Selling Prospectus Act has been or will be registered within the Financial Supervisory Authority of the Federal Republic of Germany or otherwise published in Germany.
Notice to Prospective Investors in Hong Kong
The shares may not be offered or sold in Hong Kong by means of any document other than (i) in circumstances which do not constitute an offer to the public within the meaning of the Companies Ordinance (Cap. 32, Laws of Hong Kong), or (ii) to “professional investors” within the meaning of the Securities and Futures Ordinance (Cap. 571, Laws of Hong Kong) and any rules made thereunder, or (iii) in other circumstances which do not result in the document being a “prospectus” within the meaning of the Companies Ordinance (Cap. 32, Laws of Hong Kong) and no advertisement, invitation, or document relating to the shares may be issued or may be in the possession of any person for the purpose of issue (in each case whether in Hong Kong or elsewhere), which is directed at, or the contents of which are likely to be accessed or read by, the public in Hong Kong (except if permitted to do so under the laws of Hong Kong) other than with respect to shares which are or are intended to be disposed of only to persons outside of Hong Kong or only to “professional investors” within the meaning of the Securities and Futures Ordinance (Cap. 571, Laws of Hong Kong) and any rules made thereunder.
Notice to Prospective Investors in Ireland
The common shares will not be placed in or involving Ireland otherwise than in conformity with the provisions of the Intermediaries Act 1995 of Ireland (as amended) including, without limitation, Sections 9 and 23 (including advertising restrictions made thereunder) thereof and the codes of conduct made under Section 37 thereof.
Notice to Prospective Investors in Israel
This document does not constitute a prospectus under the Israeli Securities Law, 5728-1968, or the Securities Law, and has not been filed with or approved by the Israel Securities Authority. In Israel, this prospectus is being distributed only to, and is directed only at, and any offer of the common shares is directed only at, (1) a limited number of persons in accordance with the Israeli Securities Law and (2) investors listed in the first addendum, or the Addendum, to the Israeli Securities Law, consisting primarily of joint investment in trust funds, provident funds, insurance companies, banks, portfolio managers, investment advisors, members of the Tel Aviv Stock Exchange, underwriters, venture capital funds, entities with equity in excess of NIS 50 million and “qualified individuals,” each as defined in the Addendum (as it may be amended from time to time), collectively referred to as qualified investors (in each case, purchasing for their own account or, where permitted under the Addendum, for the accounts of their clients who are investors listed in the Addendum). Qualified investors are required to submit written confirmation that they fall within the scope of the Addendum, are aware of its meaning and agree to it.
Notice to Prospective Investors in Italy
The offering of the common shares has not been registered pursuant to Italian securities legislation and, accordingly, no common shares may be offered or sold in the Republic of Italy in a solicitation to the public, and sales of the common shares in the Republic of Italy shall be effected in accordance with all Italian securities, tax and exchange control and other applicable laws and regulation.
No offer, sale or delivery of the common shares or distribution of copies of any document relating to the common shares will be made in the Republic of Italy except: (a) to “Professional Investors,” as defined in Article 31.2 of Regulation No. 11522 of 1 July 1998 of the Commissione Nazionale per la Società e la Borsa, or the CONSOB, as amended, or CONSOB Regulation No. 11522, pursuant to Article 30.2 and 100 of Legislative Decree No. 58 of 24 February 1998, as amended, or the Italian Financial Act; or (b) in any other circumstances where an express exemption from compliance with the solicitation restrictions applies, as provided under the Italian Financial Act or Regulation No. 11971 of 14 May 1999, as amended.
Any such offer, sale or delivery of the common shares or any document relating to the common shares in the Republic of Italy must be: (1) made by investment firms, banks or financial intermediaries permitted to conduct such activities in the Republic of Italy in accordance with Legislative Decree No. 385 of 1 September 1993 as amended, the Italian Financial Act, CONSOB Regulation No. 11522 and any other applicable laws and regulations; and (2) in compliance with any other applicable notification requirement or limitation which may be imposed by CONSOB or the Bank of Italy.
Investors should also note that, in any subsequent distribution of the common shares in the Republic of Italy, Article 100-bis of the Italian Financial Act may require compliance with the law relating to public offers of securities. Furthermore, where the common shares are placed solely with professional investors and are then systematically resold on the secondary market at any time in the 12 months following such placing, purchasers of common shares who are acting outside of the course of their business or profession may in certain circumstances be entitled to declare such purchase void and to claim damages from any authorized person at whose premises the common shares were purchased, unless an exemption provided for under the Italian Financial Act applies.
Notice to Prospective Investors in Japan
The shares offered in this prospectus have not been and will not be registered under the Financial Instruments and Exchange Law of Japan. The shares have not been offered or sold and will not be offered or sold, directly or indirectly, in Japan or to or for the account of any resident of Japan (including any corporation or other entity organized under the laws of Japan), except (i) pursuant to an exemption from the registration requirements of the Financial Instruments and Exchange Law and (ii) in compliance with any other applicable requirements of Japanese law.
Notice to Prospective Investors in Kuwait
The common shares have not been authorized or licensed for offering, marketing or sale in the State of Kuwait. The distribution of this prospectus and the offering and sale of the common shares in the State of Kuwait is restricted by law unless a license is obtained from the Kuwait Ministry of Commerce and Industry in accordance with Law 31 of 1990. Persons into whose possession this prospectus comes are required by us and the international underwriters to inform themselves about and to observe such restrictions. Investors in the State of Kuwait who approach us or any of the international underwriters to obtain copies of this prospectus are required by us and the international underwriters to keep such prospectus confidential and not to make copies thereof or distribute the same to any other person and are also required to observe the restrictions provided for in all jurisdictions with respect to offering, marketing and the sale of the common shares.
Notice to Prospective Investors in Mexico
The common shares have not been registered in Mexico with the Securities Section (Sección de Valores) of the National Securities Registry (Registro Nacional de Valores) maintained by the Comisión Nacional Bancaria y de Valores, and that no action has been or will be taken that would permit the offer or sale of the common shares in Mexico absent an available exemption under Article 8 of the Mexican Securities Market Law (Ley del Mercado de Valores).
Notice to Prospective Investors in the Netherlands
The common shares may not be offered, sold, transferred or delivered, in or from the Netherlands, as part of the initial distribution or as part of any reoffering, and neither this prospectus nor any other document in respect of the international offering may be distributed in or from the Netherlands, other than to individuals or legal entities who or which trade or invest in securities in the conduct of their profession or trade (which includes banks, investment
banks, securities firms, insurance companies, pension funds, other institutional investors and treasury departments and finance companies of large enterprises), in which case, it must be made clear upon making the offer and from any documents or advertisements in which a forthcoming offering of common shares is publicly announced that the offer is exclusively made to said individuals or legal entities.
Notice to Prospective Investors in Peru
The common shares and this prospectus have not been registered in Peru under the Decreto Supremo Nº 093-2002-EF: Texto Único Ordenado de la Ley del Mercado de Valores (the “Peruvian Securities Law”) or before the Superintendencia del Mercado de Valores and cannot be offered or sold in Peru except in a private offering under the meaning of the Peruvian Securities Laws. The Peruvian Securities Law provides that an offering directed exclusively to “institutional investors” (as defined in the Institutional Investors Market Regulations) qualifies as a private offering. The common shares acquired by institutional investors in Peru cannot be transferred to a third party, unless such transfer is made to another institutional investor or the common shares have been previously registered with the Registro Público del Mercado de Valores.
Notice to Prospective Investors in Portugal
No document, circular, advertisement or any offering material in relation to the share has been or will be subject to approval by the Portuguese Securities Market Commission (Comissão do Mercado de Valores Mobiliários), or the CMVM. No common shares may be offered, re-offered, advertised, sold, re-sold or delivered in circumstances which could qualify as a public offer (oferta pública) pursuant to the Portuguese Securities Code (Código dos Valores Mobiliários), and/or in circumstances which could qualify the issue of the common shares as an issue or public placement of securities in the Portuguese market. This prospectus and any document, circular, advertisements or any offering material may not be directly or indirectly distributed to the public. All offers, sales and distributions of the common shares have been and may only be made in Portugal in circumstances that, pursuant to the Portuguese Securities Code, qualify as a private placement (oferta particular), all in accordance with the Portuguese Securities Code. Pursuant to the Portuguese Securities Code, the private placement in Portugal or to Portuguese residents of the common shares by public companies (sociedades abertas) or by companies that are issuers of securities listed on a market must be notified to the CMVM for statistical purposes. Any offer or sale of the common shares in Portugal must comply with all applicable provisions of the Portuguese Securities Code and any applicable CMVM Regulations and all relevant Portuguese laws and regulations. The placement of the common shares in the Portuguese jurisdiction or to any entities which are resident in Portugal, including the publication of a prospectus, when applicable, must comply with all applicable laws and regulations in force in Portugal and with the Prospectus Directive, and such placement shall only be performed to the extent that there is full compliance with such laws and regulations.
Notice to Prospective Investors in Qatar
The common shares described in this prospectus have not been, and will not be, offered, sold or delivered, at any time, directly or indirectly in the State of Qatar in a manner that would constitute a public offering. This prospectus has not been, and will not be, registered with or approved by the Qatar Financial Markets Authority or Qatar Central Bank and may not be publicly distributed. This prospectus is intended for the original recipient only and must not be provided to any other person. It is not for general circulation in the State of Qatar and may not be reproduced or used for any other purpose.
Notice to Prospective Investors in Saudi Arabia
Any investor in the Kingdom of Saudi Arabia or who is a Saudi person (a Saudi Investor) who acquires the common shares pursuant to the offering should note that the offer of the common shares is an exempt offer under sub-paragraph (3) of paragraph (a) of Article 16 of the “Offer of Securities Regulations” as issued by the Board of the Capital Market Authority resolution number 2-11-2004 dated October 4, 2004 and amended by the resolution of the Board of Capital Market Authority resolution number 1-33-2004 dated December 21, 2004 (the KSA Regulations). The common shares may be offered to no more than 60 Saudi Investors and the minimum amount payable per Saudi Investor must not be less than Saudi Riyal (SR) 1 million or an equivalent amount. The offer of common shares is therefore exempt from the public offer provisions of the KSA Regulations, but is subject to the following restrictions on secondary market activity: (a) A Saudi Investor (the transferor) who has acquired common
shares pursuant to this exempt offer may not offer or sell common shares to any person (referred to as a transferee) unless the price to be paid by the transferee for such common shares equals or exceeds SR1 million. (b) If the provisions of paragraph (a) cannot be fulfilled because the price of the common shares being offered or sold to the transferee has declined since the date of the original exempt offer, the transferor may offer or sell the common shares to the transferee if their purchase price during the period of the original exempt offer was equal to or exceeded SR1 million. (c) If the provisions of paragraphs (a) and (b) cannot be fulfilled, the transferor may offer or sell the common shares if he/she sells his entire holding of the common shares to one transferee.
Notice to Prospective Investors in Singapore
This prospectus has not been registered as a prospectus with the Monetary Authority of Singapore. Accordingly, this prospectus and any other document or material in connection with the offer or sale, or invitation for subscription or purchase, of the shares may not be circulated or distributed, nor may the shares be offered or sold, or be made the subject of an invitation for subscription or purchase, whether directly or indirectly, to persons in Singapore other than (i) to an institutional investor under Section 274 of the Securities and Futures Act, Chapter 289 of Singapore, or the SFA, (ii) to a relevant person pursuant to Section 275(1), or any person pursuant to Section 275(1A) and in accordance with the conditions specified in Section 275 of the SFA, or (iii) otherwise pursuant to and in accordance with the conditions of, any other applicable provision of the SFA, in each case subject to compliance with conditions set forth in the SFA.
Where the shares are subscribed or purchased under Section 275 of the SFA by a relevant person that is:
| · | a corporation (which is not an accredited investor (as defined in Section 4A of the SFA)), the sole business of which is to hold investments, and the entire share capital of which is owned by one or more individuals, each of whom is an accredited investor; or |
| · | a trust (where the trustee is not an accredited investor) whose sole purpose is to hold investments and each beneficiary of the trust is an individual who is an accredited investor, |
shares, debentures, and units of shares and debentures of that corporation or the beneficiaries’ rights and interest (howsoever described) in that trust shall not be transferred within six months after that corporation or that trust has acquired the shares pursuant to an offer made under Section 275 of the SFA except:
| · | to an institutional investor (for corporations, under Section 274 of the SFA) or to a relevant person defined in Section 275(2) of the SFA, or to any person pursuant to an offer that is made on terms that such shares, debentures, and units of shares and debentures of that corporation or such rights and interest in that trust are acquired at a consideration of not less than US$200,000 (or its equivalent in a foreign currency) for each transaction, whether such amount is to be paid for in cash or by exchange of securities or other assets and further for corporations, in accordance with the conditions specified in Section 275 of the SFA; |
| · | where no consideration is or will be given for the transfer; or |
| · | where the transfer is by operation of law. |
Notice to Prospective Investors in South Korea
The common shares have not been and will not be registered with the Financial Services Commission of Korea for public offering in Korea under the Financial Investment Services and Capital Markets Act, or the FSCMA. The common shares may not be offered, sold or delivered, or offered or sold for re-offering or resale, directly or indirectly, in Korea or to any Korean resident (as such term is defined in the Foreign Exchange Transaction Law of Korea, or FETL) other than the Accredited Investors (as such term is defined in Article 11 of the Presidential Decree of the FSCMA), for a period of one year from the date of issuance of the common shares except pursuant to the applicable laws and regulations of Korea, including the FSCMA and the FETL and the decrees and regulations thereunder. The common shares may not be resold to Korean residents unless the purchaser of the common shares complies with all applicable regulatory requirements (including but not limited to government reporting requirements under the FETL and its subordinate decrees and regulations) in connection with the purchase of the common shares.
Notice to Prospective Investors in Spain
The common shares have not been registered with the Spanish National Commission for the Securities Market and, therefore, no common shares may be publicly offered, sold or delivered, nor any public offer in respect of the common shares made, nor may any prospectus or any other offering or publicity material relating to the common shares be distributed in Spain by the international agents or any person acting on their behalf, except in compliance with Spanish laws and regulations.
Notice to Prospective Investors in Switzerland
The common shares may not be publicly offered in Switzerland and will not be listed on the SIX Swiss Exchange, or SIX, or on any other stock exchange or regulated trading facility in Switzerland. This prospectus has been prepared without regard to the disclosure standards for issuance prospectuses under art. 652a or art. 1156 of the Swiss Code of Obligations or the disclosure standards for listing prospectuses under art. 27 ff. of the SIX Listing Rules or the listing rules of any other stock exchange or regulated trading facility in Switzerland. Neither this prospectus nor any other offering or marketing material relating to the common shares or the offering may be publicly distributed or otherwise made publicly available in Switzerland.
Neither this document nor any other offering or marketing material relating to the offering, the Company, the common shares have been or will be filed with or approved by any Swiss regulatory authority. In particular, this document will not be filed with, and the offer of common shares will not be supervised by, the Swiss Financial Market Supervisory Authority, and the offer of common shares has not been and will not be authorized under the Swiss Federal Act on Collective Investment Schemes, or CISA. The investor protection afforded to acquirers of interests in collective investment schemes under the CISA does not extend to acquirers of common shares.
Notice to Prospective Investors in United Arab Emirates
The common shares have not been, and are not being, publicly offered, sold, promoted or advertised in the United Arab Emirates (including the Dubai International Financial Centre) other than in compliance with the laws of the United Arab Emirates (and the Dubai International Financial Centre) governing the issue, offering and sale of securities. Further, this prospectus does not constitute a public offer of securities in the United Arab Emirates (including the Dubai International Financial Centre) and is not intended to be a public offer. This prospectus has not been approved by or filed with the Central Bank of the United Arab Emirates, the Securities and Commodities Authority or the Dubai Financial Services Authority.
Cayman Data Protection – Privacy Notice
We have certain duties under the Data Protection Act (As Revised) of the Cayman Islands, or the DPA, based on internationally accepted principles of data privacy.
Privacy Notice
This privacy notice puts our shareholders on notice that through your investment in us you will provide us with certain personal information which constitutes personal data within the meaning of the DPA, or personal data.
Investor Data
We will collect, use, disclose, retain and secure personal data to the extent reasonably required only and within the parameters that could be reasonably expected during the normal course of business. We will only process, disclose, transfer or retain personal data to the extent legitimately required to conduct our activities of an ongoing basis or to comply with legal and regulatory obligations to which we are subject. We will only transfer personal data in accordance with the requirements of the DPA, and will apply appropriate technical or organizational information security measures designed to protect against unauthorized or unlawful processing of the personal data and against the accidental loss, destruction or damage to the personal data.
In our use of this personal data, we will be characterized as a “data controller” for the purposes of the DPA, while our affiliates and service providers who may receive this personal data from us in the conduct of our activities
may either act as our “data processors” for the purposes of the DPA or may process personal information for their own lawful purposes in connection with services provided to us.
We may also obtain personal data from other public sources. Personal data includes, without limitation, the following information relating to a shareholder and/or any individuals connected with a shareholder as an investor name, residential address, email address, contact details, corporate contact information, signature, nationality, place of birth, date of birth, tax identification, credit history, correspondence, records, passport number, bank account details, source of funds details and details relating to the shareholder’s investment activity.
Who This Affects
If you are a natural person, this will affect you directly. If you are a corporate investor (including, for these purposes, legal arrangements such as trusts or exempted limited partnerships) that provides us with personal data on individuals connected to you for any reason in relation to your investment in us, this will be relevant for those individuals and you should transmit the content of this Privacy Notes to such individuals or otherwise advise them of its contents.
How We May Use a Shareholder’s Personal Data
We may, as the data controller, collect, store and use personal data for lawful purposes, including, in particular: (i) where this is necessary for the performance of our rights and obligations under any agreements; (ii) where this is necessary for compliance with a legal and regulatory obligation to which we are or may be subject (such as compliance with anti-money laundering and FATCA/CRS requirements); and/or (iii) where this is necessary for the purposes of our legitimate interests and such interests are not overridden by your interests, fundamental rights or freedoms.
Should we wish to use personal data for other purposes (including, if applicable, any purpose that requires your consent), we will contact you.
Why We May Transfer Your Personal Data
In certain circumstances we may be legally obliged to share personal data and other information with respect to your shareholding with the relevant regulatory authorities such as the Cayman Islands Monetary Authority or the Tax Information Authority. They, in turn, may exchange this information with foreign authorities, including tax authorities.
We anticipate disclosing personal data to persons who provide services to us and their respective affiliates (which may include certain entities located outside the U.S., the Cayman Islands or the European Economic Area), who will process your personal data on our behalf.
The Data Protection Measures We Take
Any transfer of personal data by us or our duly authorized affiliates and/or delegates outside of the Cayman Islands shall be in accordance with the requirements of the DPA.
We and our duly authorized affiliates and/or delegates shall apply appropriate technical and organizational information security measures designed to protect against unauthorized or unlawful processing of personal data, and against accidental loss or destruction of, or damage to, personal data.
We shall notify you of any personal data breach that is reasonably likely to result in a risk to your interests, fundamental rights or freedoms or those data subjects to whom the relevant personal data relates.
Anti-Money Laundering
If any person in the Cayman Islands knows or suspects, or has reasonable grounds for knowing or suspecting that another person is engaged in criminal conduct or money laundering, or is involved with terrorism or terrorist financing and property, and the information for that knowledge or suspicion came to their attention in the course of business in the regulated sector, or other trade, profession, business or employment, the person will be required to
report such knowledge or suspicion to (i) the Financial Reporting Authority of the Cayman Islands (“FRA”), pursuant to the Proceeds of Crime Law (As Revised) of the Cayman Islands, if the disclosure relates to criminal conduct or money laundering, or (ii) a police officer of the rank of constable or higher, or the FRA, pursuant to the Terrorism Law (As Revised) of the Cayman Islands, if the disclosure relates to involvement with terrorism or terrorist financing and property.
Handling of Mail
Mail addressed to the Company and received at its registered office will be forwarded unopened to the forwarding address supplied by Company to be dealt with. None of the Company, its directors, officers, advisors or service providers (including the organization which provides registered office services in the Cayman Islands) will bear any responsibility for any delay howsoever caused in mail reaching the forwarding address.
Expenses of the Offering
The following table sets forth all expenses to be paid by us, other than underwriting discounts and commissions, upon completion of this offering. All amounts shown are estimates except for the SEC registration fee, the FINRA filing fee and the exchange listing fee.
Expenses | Amount |
| U.S. Securities and Exchange Commission registration fee | US$ |
| FINRA filing fee | |
| Exchange listing fee | |
| Printing and engraving expenses | |
| Legal fees and expenses | |
| Accounting fees and expenses | |
| Transfer agent and registrar fees | |
| Miscellaneous expenses | |
| Total | US$ |
All amounts in the table are estimates except the U.S. Securities and Exchange Commission registration fee, the NYSE listing fee and the FINRA filing fee. The Company will pay most of the expenses of this offering.
Legal Matters
Certain matters of U.S. federal and New York State law will be passed upon for us and Cosan S.A., as selling shareholder, by Davis Polk & Wardwell LLP, and for the underwriters by Paul Hastings LLP. Certain matters of U.S. federal and New York State and Jersey law will be passed upon for CVC Fund VII, as selling shareholder, by White & Case LLP and Mourant Ozannes (Jersey) LLP, respectively. The validity of the common shares offered in this offering and other legal matters as to Cayman Islands law will be passed upon for us by Maples and Calder (Cayman) LLP. Certain other matters of Brazilian law will be passed upon for us by Pinheiro Neto Advogados and for the underwriters by Lefosse Advogados.
Experts
The financial statements of Moove Lubri cants Holdings as of December 31, 2023 and 2022 and for the years ended December 31, 2023, 2022 and 2021, appearing in this prospectus and registration statement have been audited by Ernst & Young Auditores Independentes S/S Ltda., independent registered public accounting firm, as set forth in their report thereon appearing elsewhere herein, and are included in reliance upon such report given on the authority of such firm as experts in accounting and auditing.
Enforceability of Civil Liabilities
Cayman Islands
We are incorporated under the laws of the Cayman Islands as an exempted company with limited liability. We are incorporated in the Cayman Islands because of certain benefits associated with being a Cayman Islands company, such as political and economic stability, an effective judicial system, a favorable tax system, the absence of foreign exchange control or currency restrictions and the availability of professional and support services. However, the Cayman Islands have a less prescriptive body of securities laws as compared to the United States and some U.S. states, such as Delaware, have more fulsome and judicially interpreted bodies of corporate law than the Cayman Islands. We have been advised by our Cayman Islands legal counsel, Maples and Calder (Cayman) LLP, that the courts of the Cayman Islands are likely (i) to recognize or enforce against us judgments of courts of the United States predicated upon the civil liability provisions of the securities laws of the United States or any States; and (ii) in original actions brought in the Cayman Islands, to impose liabilities against us predicted upon the civil liability provisions of the securities laws of the United States or any State, so far as the liabilities imposed by those provisions are penal in nature. In those circumstances, although there is no statutory enforcement in the Cayman Islands of judgments obtained in the United States, the courts of the Cayman Islands will recognize and enforce a foreign money judgment of a foreign court of competent jurisdiction without retrial on the merits based on the principle that a judgment of a competent foreign court imposes upon the judgment debtor an obligation to pay the sum for which judgment has been given provided certain conditions are met. For a foreign judgment to be enforced in the Cayman Islands, such judgment must be final and conclusive and for a liquidated sum, and must not be in respect of taxes or a fine or penalty, inconsistent with a Cayman Islands judgment in respect of the same matter, impeachable on the grounds of fraud or obtained in a manner, and/or be of a kind the enforcement of which is, contrary to natural justice or the public policy of the Cayman Islands (awards of punitive or multiple damages may well be held to be contrary to public policy). A Cayman Islands Court may stay enforcement proceedings if concurrent proceedings are being brought elsewhere.
Brazil
The enforcement of awards arising out of any of these judgments in Brazil is possible without review and reconsideration of the merits, upon confirmation of that judgment by the Brazilian Superior Court (Superior Tribunal de Justiça), or STJ, which is the highest court in Brazil for non-constitutional matters by the Homologação de Sentença Estrangeira (Recognition of a Foreign Award) mechanism (“Recognition”). The Recognition is a mandatory step for the enforcement of the award in Brazil and, as determined in Article 963 of the Brazilian Code of Civil Procedure (Código de Processo Civil, Law No. 13,105 of March 16, 2016, as amended), will only be granted if the foreign decision:
| · | fulfills all formalities required for its enforcement under the laws of the jurisdiction where the decision was made; |
| · | is issued by a court with competence and jurisdiction to hear the case, and, after proper and valid service of process on the parties, in accordance with the law applicable where the act was made (if service of process was made in Brazil, service must comply with Brazilian law), or after sufficient evidence of the parties’ absence has been given, as requested under applicable laws (Article 963, I and II); |
| · | is final or not subject to appeal (res judicata) (Article 963, III); |
| · | is apostilled by a competent authority of the United States of America, which is a signatory of the Hague Convention of 5 October 1961 and is accompanied by a sworn translation into Portuguese, except if such procedure was exempted by an international treaty to which Brazil is a signatory (Article 963, V); |
| · | does not violate a final unappealable decision issued by a Brazilian court (Article 963, IV); |
| · | does not violate the exclusive jurisdiction of Brazilian courts (Article 963, I); |
| · | is not contrary to Brazilian national sovereignty or public policy or public morality (as set forth in Brazilian law) or is in violation of the dignity of the human person (Article 963, VI); and |
| · | is not based on the same grounds and does not have the same parties and subject matter as any proceeding that has already been judged by a Brazilian court (Article 963, IV). |
The Recognition described above may be time-consuming and may also give rise to difficulties in enforcing the foreign judgment in Brazil. Accordingly, we cannot assure the success of the Recognition, nor that it would be conducted in a timely manner or that a Brazilian court would enforce a monetary judgment for violation of the securities laws of countries other than Brazil. The confirmation of the foreign judgment can be partial and preliminary injunctive reliefs can be granted while the recognition procedure is pending.
The defendant has 15 business days to challenge the request, which will be limited to the authenticity of the documentation and fulfillment of the formal requirements listed above. A recognized foreign judgment has the status of an enforceable judicial title (título executivo judicial), the same as a Brazilian court judgment.
Claims against Brazilian companies, executives living in Brazil or pertaining to a contract concerning obligations to be performed in Brazil must be presented before Brazilian courts (articles 21 and 22 of the Brazilian Code of Civil Procedure).
Where You Can Find More Information
We have filed with the U.S. Securities and Exchange Commission a registration statement (including amendments and exhibits to the registration statement) on Form F-1 under the Securities Act. This prospectus, which is part of the registration statement, does not contain all of the information set forth in the registration statement and the exhibits and schedules to the registration statement. For further information, we refer you to the registration statement and the exhibits and schedules filed as part of the registration statement. If a document has been filed as an exhibit to the registration statement, we refer you to the copy of the document that has been filed. Each statement in this prospectus relating to a document filed as an exhibit is qualified in all respects by the filed exhibit.
Upon completion of this offering, we will be subject to the informational requirements of the Exchange Act that are applicable to foreign private issuers. Accordingly, we will be required to file or furnish reports and other information with the SEC, including annual reports on Form 20-F and reports on Form 6-K. You may inspect and copy the reports and other information to be filed with the SEC at the public reference facilities maintained by the SEC at 100 F Street, N.E., Washington, D.C. 20549. Copies of the materials may be obtained from the Public Reference Room of the SEC at 100 F Street, N.E., Washington, D.C. 20549 at prescribed rates. The public may obtain information on the operation of the SEC’s Public Reference Room by calling the SEC in the United States at 1-800-SEC-0330. In addition, the SEC maintains an Internet website at http://www.sec.gov, from which you can electronically access the registration statement and its materials.
As a foreign private issuer, we are exempt under the Exchange Act from, among other things, the rules prescribing the furnishing and content of proxy statements, and our executive officers, directors, principal shareholders and the selling shareholders are exempt from the reporting and short-swing profit recovery provisions contained in Section 16 of the Exchange Act. In addition, we will not be required under the Exchange Act to file periodic reports and financial statements with the SEC as frequently or as promptly as U.S. companies whose securities are registered under the Exchange Act.
We will send the transfer agent a copy of all notices of shareholders’ meetings and other reports, communications and information that are made generally available to shareholders. The transfer agent has agreed to mail to all shareholders a notice containing the information (or a summary of the information) contained in any notice of a meeting of our shareholders received by the transfer agent and will make available to all shareholders such notices and all such other reports and communications received by the transfer agent.
Investors, the media and others should note that, following the completion of this offering, we intend to announce material information to the public through filings with the SEC, the investor relations page on our website, press releases, public conference calls, and webcasts. The information disclosed by the foregoing channels could be deemed to be material information. As such, we encourage investors, the media, and others to follow the channels listed above and to review the information disclosed through such channels. Any updates to the list of disclosure channels through which we will announce information will be posted on the investor relations page on our website.
Index to Consolidated Financial Statements
Page
| Audited Consolidated Financial Statements as of December 31, 2023 and 2022 and for the years ended December 31, 2023, 2022 and 2021 | |
| Report of Independent Registered Public Accounting Firm (PCAOB ID 1448) | F-28 |
| Consolidated Statement of Financial Position as of December 31, 2023 and 2022 | F-30 |
| Consolidated Statement of Profit or Loss for the years ended December 31, 2023, 2022 and 2021 | F-32 |
| Consolidated Statement of Other Comprehensive Income for the years ended December 31, 2023, 2022 and 2021 | F-33 |
| Consolidated Statement of Changes in Equity for the years ended December 31, 2023, 2022 and 2021 | F-34 |
| Consolidated Statement of Cash Flows for the years ended December 31, 2023, 2022 and 2021 | F-35 |
| Notes to the Consolidated Financial Statements | F-36 |
| Moove Lubricants Holdings Interim Condensed Consolidated Financial Statements At June 30, 2024 
|
Moove Lubricants Holdings
Interim Consolidated Statement of Financial Position
At June 30, 2024 and December 31, 2023
(In thousands of Brazilian Reais (R$), unless otherwise stated)
| | | Notes | | 6/30/2024 | | 12/31/2023 |
| Assets | | | | | | | | | | | | |
| Current assets | | | | | | | | | | | | |
| Cash and cash equivalents | | | 7. | | | | 667,490 | | | | 773,551 | |
| Marketable securities | | | 7. | | | | 121,539 | | | | 77,814 | |
| Restricted cash | | | | | | | 8,435 | | | | 7,282 | |
| Trade receivables | | | 10. | | | | 1,378,099 | | | | 1,093,434 | |
| Inventories | | | 11. | | | | 1,503,905 | | | | 1,287,710 | |
| Receivables from related parties | | | 12. | | | | 41,912 | | | | 29,714 | |
| Advances to suppliers | | | | | | | 26,750 | | | | 15,415 | |
| Taxes recoverable | | | | | | | 92,239 | | | | 77,828 | |
| Other current financial assets | | | | | | | 687 | | | | 690 | |
| Other current assets | | | | | | | 113,055 | | | | 74,256 | |
| | | | | | | | 3,954,111 | | | | 3,437,694 | |
| | | | | | | | | | | | | |
| Non-current assets | | | | | | | | | | | | |
| Trade receivables | | | 10. | | | | 755 | | | | 765 | |
| Receivables from related parties | | | 12. | | | | 629,041 | | | | 655,731 | |
| Deferred income tax | | | | | | | 28,916 | | | | 16,215 | |
| Judicial deposits | | | 19. | | | | 174,570 | | | | 167,194 | |
| Derivative financial Instruments | | | 8. | | | | 52,525 | | | | - | |
| Non-current taxes recoverable | | | | | | | 12,161 | | | | 14,853 | |
| Other non-current financial assets | | | | | | | 11,200 | | | | 10,684 | |
| Other non-current assets | | | | | | | 16,982 | | | | 12,911 | |
| Right-of-use assets | | | 15. | | | | 259,366 | | | | 195,159 | |
| Property, plant and equipment | | | 13. | | | | 851,659 | | | | 768,532 | |
| Intangible assets | | | 14. | | | | 2,833,777 | | | | 2,597,854 | |
| | | | | | | | 4,870,952 | | | | 4,439,898 | |
| | | | | | | | | | | | | |
| Total assets | | | | | | | 8,825,063 | | | | 7,877,592 | |
F-3

Moove Lubricants Holdings
Interim Consolidated Statement of Financial Position
At June 30, 2024 and December 31, 2023
(In thousands of Brazilian Reais (R$), unless otherwise stated)
| | | Notes | | 6/30/2024 | | 12/31/2023 |
| Liabilities | | | | | | | | | | | | |
| Current liabilities | | | | | | | | | | | | |
| Trade payables | | | | | | | 1,824,081 | | | | 1,494,583 | |
| Loans and borrowings | | | 16. | | | | 768,640 | | | | 652,935 | |
| Salaries and wages | | | | | | | 110,792 | | | | 147,293 | |
| Other taxes payable | | | | | | | 177,386 | | | | 210,547 | |
| Payables to related parties | | | 12. | | | | 21,071 | | | | 18,586 | |
| Derivative financial instruments | | | 8. | | | | 33,269 | | | | 742 | |
| Lease liabilities | | | | | | | 79,865 | | | | 50,768 | |
| Strategic alliance payable | | | | | | | 38,200 | | | | 57,513 | |
| Other current financial liabilities | | | | | | | 569 | | | | 681 | |
| Other current liabilities | | | | | | | 138,160 | | | | 81,228 | |
| | | | | | | | 3,192,033 | | | | 2,714,876 | |
| | | | | | | | | | | | | |
| Non-current liabilities | | | | | | | | | | | | |
| Loans and borrowings | | | 16. | | | | 2,492,362 | | | | 1,554,093 | |
| Deferred income tax | | | | | | | 168,193 | | | | 115,452 | |
| Payables to related parties | | | 12. | | | | 117,559 | | | | 127,834 | |
| Post-employment benefits | | | | | | | 182,021 | | | | 175,150 | |
| Provision for contingent liabilities | | | 19. | | | | 451,481 | | | | 485,541 | |
| Lease liabilities | | | | | | | 188,534 | | | | 148,895 | |
| Strategic alliance payable | | | | | | | 157,988 | | | | 145,581 | |
| Other non-current liabilities | | | | | | | 150,817 | | | | 145,709 | |
| | | | | | | | 3,908,955 | | | | 2,898,255 | |
| | | | | | | | | | | | | |
| Total liabilities | | | | | | | 7,100,988 | | | | 5,613,131 | |
| | | | | | | | | | | | | |
| Equity | | | | | | | | | | | | |
| Share capital | | | | | | | 177 | | | | 177 | |
| Share premium | | | | | | | 1,356,853 | | | | 2,256,853 | |
| Reserves | | | | | | | 294,348 | | | | (18,783 | ) |
| Other equity components | | | | | | | 71,980 | | | | 25,587 | |
| Equity attributable to equity holders of the parent | | | | | | | 1,723,358 | | | | 2,263,834 | |
| | | | | | | | | | | | | |
| Non-controlling interest | | | | | | | 717 | | | | 627 | |
| | | | | | | | | | | | | |
| Total equity | | | | | | | 1,724,075 | | | | 2,264,461 | |
| | | | | | | | | | | | | |
| Total liabilities and equity | | | | | | | 8,825,063 | | | | 7,877,592 | |
F-4
Moove Lubricants Holdings
Interim Consolidated Statement of Profit or Loss
For the six and three months ended June 30, 2024 and 2023
(In thousands of Brazilian Reais (R$), unless otherwise stated)
| | | Note | | 1/1/2024 to 6/30/2024 | | 1/1/2023 to 6/30/2023 | | 4/1/2024 to 6/30/2024 | | 4/1/2023 to 6/30/2023 |
| | | | | | | | | | | |
| Revenue | | | 20. | | | | 5,024,807 | | | | 5,104,291 | | | | 2,579,624 | | | | 2,517,118 | |
| Cost of sales and services | | | 21. | | | | (3,587,821 | ) | | | (3,728,645 | ) | | | (1,830,238 | ) | | | (1,789,686 | ) |
| Gross profit | | | | | | | 1,436,986 | | | | 1,375,646 | | | | 749,386 | | | | 727,432 | |
| | | | | | | | | | | | | | | | | | | | | |
| Selling expenses | | | 21. | | | | (656,629 | ) | | | (617,546 | ) | | | (336,178 | ) | | | (308,429 | ) |
| General and administrative expenses | | | 21. | | | | (409,159 | ) | | | (267,778 | ) | | | (205,989 | ) | | | (139,453 | ) |
| Other operating income (expenses), net | | | | | | | 34,600 | | | | (22,154 | ) | | | 10,823 | | | | (11,458 | ) |
| Operating expenses | | | | | | | (1,031,188 | ) | | | (907,478 | ) | | | (531,344 | ) | | | (459,340 | ) |
| | | | | | | | | | | | | | | | | | | | | |
| Profit before finance results and taxes | | | | | | | 405,798 | | | | 468,168 | | | | 218,042 | | | | 268,092 | |
| | | | | | | | | | | | | | | | | | | | | |
| Financial expense | | | 22. | | | | (115,538 | ) | | | (170,969 | ) | | | (61,412 | ) | | | (77,895 | ) |
| Financial income | | | 22. | | | | 139,893 | | | | 64,772 | | | | 60,203 | | | | 40,012 | |
| Foreign exchange, net | | | 22. | | | | (68,603 | ) | | | (31,956 | ) | | | (45,441 | ) | | | (21,579 | ) |
| Financial results, net | | | | | | | (44,248 | ) | | | (138,153 | ) | | | (46,650 | ) | | | (59,462 | ) |
| | | | | | | | | | | | | | | | | | | | | |
| Profit before taxes | | | | | | | 361,550 | | | | 330,015 | | | | 171,392 | | | | 208,630 | |
| | | | | | | | | | | | | | | | | | | | | |
| Income taxes | | | | | | | | | | | | | | | | | | | | |
| Current | | | | | | | (115,567 | ) | | | (240,297 | ) | | | (78,218 | ) | | | (71,744 | ) |
| Deferred | | | | | | | (8,402 | ) | | | (148,103 | ) | | | 57,105 | | | | (9,114 | ) |
| | | | | | | | (123,969 | ) | | | (388,400 | ) | | | (21,113 | ) | | | (80,858 | ) |
| | | | | | | | | | | | | | | | | | | | | |
| Profit (loss) for the period | | | | | | | 237,581 | | | | (58,385 | ) | | | 150,279 | | | | 127,772 | |
| | | | | | | | | | | | | | | | | | | | | |
| Attributable to: | | | | | | | | | | | | | | | | | | | | |
| Equity holders of the parent | | | | | | | 237,556 | | | | (58,518 | ) | | | 150,219 | | | | 127,700 | |
| Non-controlling interests | | | | | | | 25 | | | | 133 | | | | 60 | | | | 72 | |
| | | | | | | | 237,581 | | | | (58,385 | ) | | | 150,279 | | | | 127,772 | |
| | | | | | | | | | | | | | | | | | | | | |
| Earnings per share | | | | | | | | | | | | | | | | | | | | |
| Basic and diluted earnings per share | | | 23.4 | | | | R$ 6.79 | | | | R$ (1.67) | | | | R$ 4.30 | | | | R$ 3.65 | |
F-5
Moove Lubricants Holdings
Interim Consolidated Statement of Other Comprehensive Income
For the six and three months ended June 30, 2024 and 2023
(In thousands of Brazilian Reais (R$), unless otherwise stated)
| | | 1/1/2024 to 6/30/2024 | | 1/1/2023 to 6/30/2023 | | 4/1/2024 to 6/30/2024 | | 4/1/2023 to 6/30/2023 |
| | | | | | | | | |
| Profit (loss) for the period | | | 237,581 | | | | (58,385 | ) | | | 150,279 | | | | 127,772 | |
| | | | | | | | | | | | | | | | | |
Items that may be reclassified to profit and loss in subsequent periods | | | | | | | | | | | | | | | | |
| Foreign currency translation effect | | | 45,968 | | | | (56,574 | ) | | | 72,410 | | | | (73,855 | ) |
| Cash flow hedge accounting reserve | | | 490 | | | | 344 | | | | - | | | | 847 | |
| | | | 46,458 | | | | (56,230 | ) | | | 72,410 | | | | (73,008 | ) |
| | | | | | | | | | | | | | | | | |
| Total other comprehensive income (loss), net of tax | | | 46,458 | | | | (56,230 | ) | | | 72,410 | | | | (73,008 | ) |
| | | | | | | | | | | | | | | | | |
| Total comprehensive income (loss) | | | 284,039 | | | | (114,615 | ) | | | 222,689 | | | | 54,764 | |
| | | | | | | | | | | | | | | | | |
| Attributable to: | | | | | | | | | | | | | | | | |
| Equity holders of the parent | | | 283,949 | | | | (114,689 | ) | | | 222,573 | | | | 54,749 | |
| Non-controlling interests | | | 90 | | | | 74 | | | | 116 | | | | 15 | |
| | | | 284,039 | | | | (114,615 | ) | | | 222,689 | | | | 54,764 | |
F-6
Moove Lubricants Holdings
Interim Consolidated Statement of Changes in Equity
For the six months ended June 30, 2024 and 2023
(In thousands of Brazilian Reais (R$), unless otherwise stated)
| | | Note | | Share capital | | Share premium | | Reserves | | Other Equity Components | | Equity attributable to owners of the parent | | Non-Controlling interest | | Total Equity |
| At January 1, 2023 | | | | 561,085 | | - | | 1,638,026 | | 85,146 | | 2,284,257 | | 762 | | 2,285,019 |
| Profit for the year | | | | - | | - | | (58,518) | | - | | (58,518) | | 133 | | (58,385) |
| Other comprehensive income for the period | | | | - | | - | | - | | (56,171) | | (56,171) | | (59) | | (56,230) |
| Dividends paid | | 23.5. | | - | | - | | (246,096) | | - | | (246,096) | | - | | (246,096) |
| At June 30, 2023 | | | | 561,085 | | - | | 1,333,412 | | 28,975 | | 1,923,472 | | 836 | | 1,924,308 |
| | | | | | | | | | | | | | | | | |
| | | | | | | | | | | | | | | | | |
| | | | | | | | | | | | | | | | | |
| | | Note | | Share capital | | Share premium | | Reserves | | Other Equity Components | | Equity attributable to owners of the parent | | Non-Controlling interest | | Total Equity |
| At January 1, 2024 | | | | 177 | | 2,256,853 | | (18,783) | | 25,587 | | 2,263,834 | | 627 | | 2,264,461 |
| Profit for the year | | | | - | | - | | 237,556 | | - | | 237,556 | | 25 | | 237,581 |
| Other comprehensive income for the period | | | | - | | - | | | | 46,393 | | 46,393 | | 65 | | 46,458 |
| Stock option plan | | | | - | | - | | 75,575 | | - | | 75,575 | | - | | 75,575 |
| Dividends paid | | 23.5. | | - | | (900,000) | | - | | - | | (900,000) | | - | | (900,000) |
| At June 30, 2024 | | | | 177 | | 1,356,853 | | 294,348 | | 71,980 | | 1,723,358 | | 717 | | 1,724,075 |
F-7
Moove Lubricants Holdings
Interim Consolidated Statement of Cash Flows
For the six months ended June 30, 2024 and 2023
(In thousands of Brazilian Reais (R$), unless otherwise stated)
| | | Notes | | 2024 | | 2023 |
| | | | | | | |
| Profit before taxes | | | | | | | 361,550 | | | | 330,015 | |
| Adjustments to reconcile profit before taxes to net cash flows: | | | | | | | | | | | | |
| Depreciation and amortization | | | 21. | | | | 173,832 | | | | 165,243 | |
| Financial results, net | | | | | | | 42,644 | | | | 136,482 | |
| Provision for legal proceedings | | | | | | | 3,499 | | | | (42,787 | ) |
| Provision for bonus | | | | | | | 41,454 | | | | 25,744 | |
| Provision for stock option plan | | | 18. | | | | 97,788 | | | | - | |
| Miscellaneous provisions, net | | | | | | | 52,357 | | | | (33,414 | ) |
| Other | | | | | | | 5,505 | | | | (30,520 | ) |
| | | | | | | | | | | | | |
| Working capital changes | | | | | | | | | | | | |
| (Increase) in trade receivables | | | | | | | (157,878 | ) | | | (80,150 | ) |
| (Increase) decrease in inventories | | | | | | | (120,651 | ) | | | 56,733 | |
| (Increase) decrease in advances to suppliers | | | | | | | (8,870 | ) | | | 38,931 | |
| Increase (decrease) in trade payables | | | | | | | 130,191 | | | | (2,540 | ) |
| Increase (decrease) in other payables and other current liabilities | | | | | | | (24,707 | ) | | | (52,305 | ) |
| Derivative financial instruments | | | | | | | - | | | | 6,353 | |
| Related parties | | | | | | | 13,518 | | | | 2,325 | |
| Employee benefits | | | | | | | (83,254 | ) | | | (68,505 | ) |
| Income tax | | | | | | | - | | | | (229 | ) |
| Other taxes | | | | | | | (64,599 | ) | | | 38,823 | |
| Contingent liabilities | | | | | | | (44,051 | ) | | | (99,110 | ) |
| Judicial deposits | | | | | | | (1,646 | ) | | | 42,360 | |
| Strategic alliance fees | | | | | | | (71,730 | ) | | | (52,441 | ) |
| Other non-current assets and liabilities, net | | | | | | | (15,888 | ) | | | 73,894 | |
| | | | | | | | | | | | | |
| Interest paid | | | | | | | (91,881 | ) | | | (87,274 | ) |
| Interest received | | | | | | | 18,099 | | | | 27,223 | |
| Income tax paid | | | | | | | (79,883 | ) | | | (17,335 | ) |
| Net Cash flows from operating activities | | | | | | | 175,399 | | | | 377,516 | |
| | | | | | | | | | | | | |
| Acquisition of subsidiaries net of cash acquired | | | | | | | (17,047 | ) | | | - | |
| Acquisition of property, plant and equipment and intangible assets | | | | | | | (88,248 | ) | | | (86,977 | ) |
| Marketable securities | | | | | | | (39,334 | ) | | | 43,094 | |
| Other investing movements | | | | | | | (422 | ) | | | (7,441 | ) |
| Net cash flows (used in) generated from investing activities | | | | | | | (145,051 | ) | | | (51,324 | ) |
| | | | | | | | | | | | | |
| Proceeds from borrowings | | | 16. | | | | 1,078,788 | | | | - | |
| Repayment of borrowings - principal | | | 16. | | | | (356,391 | ) | | | (103,928 | ) |
| Derivative financial instruments - debt | | | | | | | - | | | | (16,366 | ) |
| Payment of lease liabilities - principal | | | | | | | (29,091 | ) | | | (22,247 | ) |
| Dividends paid | | | 23.5 | | | | (900,000 | ) | | | (246,096 | ) |
| Net cash flows (used in) generated from financing activities | | | | | | | (206,694 | ) | | | (388,637 | ) |
| | | | | | | | | | | | | |
| Net (decrease) increase in cash and cash equivalents | | | | | | | (106,061 | ) | | | (129,502 | ) |
| Effects of exchange rate changes on cash and cash equivalents | | | | | | | 70,285 | | | | (67,057 | ) |
| Cash and cash equivalents at January 1 | | | | | | | 773,551 | | | | 865,370 | |
| | | | | | | | | | | | | |
| Cash and cash equivalents at June 30 | | | | | | | 667,490 | | | | 735,868 | |
Non-cash transactions
The Group presents cash flows using the indirect method. The Group had the following non-cash transactions that are not reflected in the statement of cash flows:
F-8
Moove Lubricants Holdings
Interim Consolidated Statement of Cash Flows
For the six months ended June 30, 2024 and 2023
(In thousands of Brazilian Reais (R$), unless otherwise stated)
| i. | Additions to right-of-use assets and lease liabilities of R$ 73,985 in the six months of 2024 (R$10,927 in the six months of 2023), for changes in future payments that depend on inflation indices and for new leases (Note 15). |
F-9
Moove Lubricants Holdings
Notes to Interim Condensed Consolidated Financial Statements
June 30, 2024
(In thousands of Brazilian Reais (R$), unless otherwise stated)
1. General information
The interim condensed consolidated financial statements of Moove Lubricants Holdings (the “Company”) and its subsidiaries (collectively, the “Group”) for the six months ended June 30, 2024 were authorized for issue in accordance with a resolution of the directors on September 11, 2024.
Moove Lubricants Holdings is an exempt company with limited liability formed under the laws of the Cayman Islands. The registered number is MC-403038 and the registered address is PO Box 309, Ugland House, Grand Cayman, KY1-1104. The Group is principally engaged in the manufacturing, distribution and trading of lubricants solutions for automotive, industrial and retail customers throughout South and North America and Europe.
2. Operational context
The Group is headquartered in Brazil and is one of the largest manufacturers and distributors of high-performance lubricants, base oils and specialties in the world, which has been consolidating itself as a relevant global player present in 10 countries in South America, North America, and Europe, providing products and services that are essential for moving people and business in industrial, commercial and passenger/cargo vehicles markets.
The Group operates 6 manufacturing plants globally located in Brazil, the United Kingdom, and the United States of America and more than 100 warehouses in the three regions. The Group blends, distributes, and sells lubricants and specialties under Mobil and proprietary brands.
The Company is a private limited company registered in the Cayman Islands that acts as an investment holding company, with the objective of investing in and supporting its subsidiaries. The Company is controlled by Cosan S.A., a Brazilian company listed on the New York Stock Exchange (NYSE) and on the São Paulo Stock, Commodities and Futures Exchange (B3 S.A. – Brasil, Bolsa, Balcão). The ultimate controlling shareholder is Mr. Rubens Ometto Silveira Mello.
2.1. Relevant events of the period
There were no relevant events in the period. For previous relevant events, see Note 1.2 of the Group’s annual consolidated financial statements as of December 31, 2023.
3. Basis of preparation and presentation of interim condensed consolidated financial statements
3.1. Basis of preparation
The interim condensed consolidated financial statements for the six months ended June 30, 2024 have been prepared in accordance with IAS 34 - Interim Financial Reporting, issued by the International Accounting Standards Board (IASB).
The interim condensed consolidated financial statements do not include all the information and disclosures required in the annual financial statements and should be read in conjunction with the Group’s annual consolidated financial statements as of December 31, 2023.
The interim condensed consolidated financial statements are presented in Brazilian Reais and all amounts are rounded to the nearest thousand, unless otherwise stated.
F-10
Moove Lubricants Holdings
Notes to Interim Condensed Consolidated Financial Statements
June 30, 2024
(In thousands of Brazilian Reais (R$), unless otherwise stated)
The accounting policies adopted in this interim reporting period are consistent with those of the previous financial year.
The Group has prepared the financial statements on the basis that it will continue to operate as a going concern.
The entities included in the Group’s consolidated financial statements were the same as of the Group’s annual consolidated financial statements for the year ended December 31, 2023.
3.2. Critical accounting estimates and judgments
The Company monitors its critical accounting estimates and judgments, as well as related accounting policies. For the interim period ended June 30, 2024 the Company has included the share-based payments (stock option plan) as a critical accounting estimate. There were no other changes in estimates and assumptions that present significant risks of assets and liabilities for the interim period, in relation to those detailed in Note 2.6. of the Group’s annual consolidated financial statements for the year ended December 31, 2023.
3.3. New and amended standards and interpretations adopted by the Group
The accounting policies adopted in the preparation of the interim condensed consolidated financial statements are consistent with those followed in the preparation of the Group’s annual consolidated financial statements for the year ended December 31, 2023. The Group has not early adopted any standard, interpretation or amendment that has been issued but is not yet effective.
The following amendments apply for the first time in 2024, but do not have an impact on the interim condensed consolidated financial statements of the Group.
| I. | Supplier Finance Arrangements - Amendments to IAS 7 and IFRS 7 |
| II. | Lease Liability in a Sale and Leaseback - Amendments to IFRS 16 |
| III. | Classification of Liabilities as Current and Non-current - Amendments to IAS 1 |
3.4. Functional and presentation currency
The interim condensed consolidated financial statements are presented in Brazilian Reais (R$). Whilst the functional currency of the Company is U.S. Dollar (US$).
3.5. Hyperinflationary economies
Argentina was identified as a hyperinflationary economy in 2018. As the Group has operations in Argentina (Cosan Lubricantes S.R.L), whose functional currency is the Argentine Peso, therefore required to apply IAS 29 - Financial Reporting in Hyperinflationary Economies for those operations.
The amount recognized in the statement of profit or loss as monetary variation is R$ 79,945 on June 30, 2024 (R$ 15,476 in June 30, 2023). On June 30, 2024, the inflation index presented by resolution JG 553/19 of the Argentinian Federation of Professional Councils of Economic Sciences (FACPCE1) for 6 months was 79.8% (50.7% on June 30, 2023).
1 FACPCE: entity which prescribes the indices to be used by entities with a functional currency of the Argentine peso for the application of the restatement procedures
F-11
Moove Lubricants Holdings
Notes to Interim Condensed Consolidated Financial Statements
June 30, 2024
(In thousands of Brazilian Reais (R$), unless otherwise stated)
4. Segment information
The Company’s operating segments are reported in a manner consistent with the internal reporting provided to and regularly reviewed by the chief operating decision maker (“CODM”), the Chief Executive Officer (“CEO”). The CODM reviews operating results and makes capital allocation decisions based on business from a geographic region perspective. Geographic regions that meet the quantitative threshold of 10% of total sales for all operating segments are presented independently as reportable segments, of which there are currently three: South America, North Americas and Europe.
Corporate overhead expenses, including the stock option plan linked to a specific liquidity event, are allocated to the South America segment, as the headquarters of the Group and senior management are located in Brazil. The Company's financial results and income taxes are managed at the Group level and are not allocated to individual operating segments.
The CODM uses the measure of Adjusted EBITDA to assess operating segments’ performance to make decisions regarding the allocation of resources. The adjustments to earnings before interest, taxes, depreciation and amortization are related to the effect of initial public offering expenses, stock option plan expenses linked to the liquidity event and financial results other than interest.
The following tables present the Adjusted EBITDA reconciliation for the Company’s operating segments for the six months ended 30 June 2024 and 2023 and second quarter of 2024 and 2023.
| | | 1/1/2024 to 6/30/2024 |
| | | South America | | North America | | Europe | | Consolidated |
| Revenue | | | 2,378,876 | | | | 1,180,729 | | | | 1,465,202 | | | | 5,024,807 | |
| Cost of sales and services and operating expenses | | | (2,020,919 | ) | | | (1,163,730 | ) | | | (1,434,360 | ) | | | (4,619,009 | ) |
| Profit before finance results and taxes | | | 357,957 | | | | 16,999 | | | | 30,842 | | | | 405,798 | |
| (+) Depreciation and amortization | | | 25,090 | | | | 125,756 | | | | 22,986 | | | | 173,832 | |
| (+) Expenses with stock option plan | | | 97,787 | | | | — | | | | — | | | | 97,787 | |
| (+) Expenses with initial public offering | | | 8,054 | | | | 3,492 | | | | 1,236 | | | | 12,782 | |
| Adjusted EBITDA | | | 488,888 | | | | 146,247 | | | | 55,064 | | | | 690,199 | |
| Financial results, net | | | | | | | | | | | | | | | (44,248 | ) |
| Income taxes | | | | | | | | | | | | | | | (123,969 | ) |
| Profit (loss) for the period | | | | | | | | | | | | | | | 237,581 | |
| | | 1/1/2023 to 6/30/2023 |
| | | South America | | North America | | Europe | | Consolidated |
| Revenue | | | 2,286,570 | | | | 1,273,800 | | | | 1,543,921 | | | | 5,104,291 | |
| Cost of sales and services and operating expenses | | | (1,873,754 | ) | | | (1,273,466 | ) | | | (1,488,903 | ) | | | (4,636,123 | ) |
| Profit before finance results and taxes | | | 412,816 | | | | 334 | | | | 55,018 | | | | 468,168 | |
| (+) Depreciation and amortization | | | 20,962 | | | | 126,452 | | | | 17,829 | | | | 165,243 | |
| (+) Expenses with stock option plan | | | — | | | | — | | | | — | | | | — | |
| (+) Expenses with initial public offering | | | — | | | | — | | | | — | | | | — | |
| Adjusted EBITDA | | | 433,778 | | | | 126,786 | | | | 72,847 | | | | 633,411 | |
| Financial results, net | | | | | | | | | | | | | | | (138,153 | ) |
| Income taxes | | | | | | | | | | | | | | | (388,400 | ) |
| Profit (loss) for the period | | | | | | | | | | | | | | | (58,385 | ) |
| | | 4/1/2024 to 6/30/2024 |
| | | South America | | North America | | Europe | | Consolidated |
| Revenue | | | 1,201,026 | | | | 610,135 | | | | 768,463 | | | | 2,579,624 | |
| Cost of sales and services and operating expenses | | | (1,005,012 | ) | | | (604,093 | ) | | | (752,477 | ) | | | (2,361,582 | ) |
| Profit before finance results and taxes | | | 196,014 | | | | 6,042 | | | | 15,986 | | | | 218,042 | |
| (+) Depreciation and amortization | | | 12,580 | | | | 64,345 | | | | 12,709 | | | | 89,634 | |
| (+) Expenses with stock option plan | | | 24,703 | | | | — | | | | — | | | | 24,703 | |
| (+) Expenses with initial public offering | | | 8,054 | | | | 3,492 | | | | 1,236 | | | | 12,782 | |
| Adjusted EBITDA | | | 241,351 | | | | 73,879 | | | | 29,931 | | | | 345,161 | |
| Financial results, net | | | | | | | | | | | | | | | (46,650 | ) |
| Income taxes | | | | | | | | | | | | | | | (21,113 | ) |
| Profit (loss) for the period | | | | | | | | | | | | | | | 150,279 | |
| | | 4/1/2023 to 6/30/2023 |
| | | South America | | North America | | Europe | | Consolidated |
| Revenue | | | 1,165,654 | | | | 620,132 | | | | 731,332 | | | | 2,517,118 | |
| Cost of sales and services and operating expenses | | | (926,402 | ) | | | (613,005 | ) | | | (709,619 | ) | | | (2,249,026 | ) |
| Profit before finance results and taxes | | | 239,252 | | | | 7,127 | | | | 21,713 | | | | 268,092 | |
| (+) Depreciation and amortization | | | 11,709 | | | | 62,391 | | | | 8,774 | | | | 82,874 | |
| (+) Expenses with stock option plan | | | — | | | | — | | | | — | | | | — | |
| (+) Expenses with initial public offering | | | — | | | | — | | | | — | | | | — | |
| Adjusted EBITDA | | | 250,961 | | | | 69,518 | | | | 30,487 | | | | 350,966 | |
| Financial results, net | | | | | | | | | | | | | | | (59,462 | ) |
| Income taxes | | | | | | | | | | | | | | | (80,858 | ) |
| Profit (loss) for the period | | | | | | | | | | | | | | | 127,772 | |
F-12
Moove Lubricants Holdings
Notes to Interim Condensed Consolidated Financial Statements
June 30, 2024
(In thousands of Brazilian Reais (R$), unless otherwise stated)
5. Financial risk management
The Group's activities expose it to several financial risks: (a) market risk (including foreign exchange risk currency and interest rate risk); (b) credit risk and (c) liquidity risk. The products and services offered by the Group are denominated in several currencies due to its global positioning, and potential risks of currency mismatches between income and costs can arise.
The accounting policy for all Risk Management related topics is included in Note 2.9 of the annual consolidated financial statements.
5.1. Market risk
5.1.1. Foreign exchange risk
The sensitivity to a reasonably possible change in exchange rates for the main currencies to which the Group is exposed as at June 30, 2024 is presented below:
| | | | | Average LTM2 | | Maximum LTM² |
| Changes in FX rate | | | Net exposure | | | | +2% 3 | | | | -2% 3 | | | | +7% 4 | | | | -7% 4 | |
| US$ | | | (392,350 | ) | | | (400,197 | ) | | | (384,503 | ) | | | (419,815 | ) | | | (364,886 | ) |
| € | | | 10,696 | | | | 10,910 | | | | 10,482 | | | | 11,445 | | | | 9,947 | |
| kr$ | | | 31 | | | | 32 | | | | 30 | | | | 33 | | | | 29 | |
| Total | | | (381,623 | ) | | | (389,255 | ) | | | (373,991 | ) | | | (408,337 | ) | | | (354,909 | ) |
5.1.2. Fair value and cash flow risks associated to interest rates
The main risk factor impacting the fair value of financial instruments is the Group’s exposure to interest rate changes (CDI5, SOFR6 and SELIC7). Scenarios for these instruments are prepared using market data and specialized sources based on the Group’s governance framework. The analysis of the sensitivity to the amounts exposed to changes in interest rates in each year are presented below.
| | | | 6/30/2024 | | | | 25 | % | | | 50 | % | | | -25 | % | | | -50 | % |
| Cash and cash equivalents | | | 667,490 | | | | 53,240 | | | | 63,888 | | | | 31,944 | | | | 21,296 | |
| Marketable securities | | | 121,539 | | | | 10,039 | | | | 12,047 | | | | 6,024 | | | | 4,016 | |
| Restricted cash | | | 8,435 | | | | 501 | | | | 601 | | | | 301 | | | | 200 | |
| Derivative financial instruments | | | 806,170 | | | | (52,521 | ) | | | (100,369 | ) | | | 57,810 | | | | 121,629 | |
| Loans and borrowings | | | 3,261,002 | | | | (227,095 | ) | | | (261,683 | ) | | | (157,920 | ) | | | (123,332 | ) |
5.2. Credit risk
Credit risk is the risk that a counterparty will not meet its obligations under a financial instrument or customer contract, leading to a financial loss. The Group is exposed to credit risk from its operating activities (primarily trade receivables) and from its investing activities, including deposits with banks and financial institutions, foreign exchange transactions and other financial instruments.
2 LTM: last twelve months.
3 The average variation in end exchange rate of Euro, US Dollar and Norwegian Krone for the last 12 months
4 The maximum variation in end exchange rate of Euro, US Dollar and Norwegian Krone for the last 12 months.
5 CDI: Brazilian Interbank Deposit Certificate.
6 SOFR: Secured Overnight Financing Rate
7 SELIC: Brazilian Central bank reference interest rate
F-13
Moove Lubricants Holdings
Notes to Interim Condensed Consolidated Financial Statements
June 30, 2024
(In thousands of Brazilian Reais (R$), unless otherwise stated)
The limits on the exposure of the Group to each financial counterparty are determined by the Group’s financial policy.
The accounting policy for the impairment of Trade receivables is included in Note 6. of the Group’s annual consolidated financial statements. The reconciliation of the expected credit losses in the period is included in Note 10.
5.3. Liquidity risk
Liquidity risk is managed based on the financial policy of the Group, which aims to ensure the availability of sufficient funds to honor the Group’s short-term commitments.
The amounts included in the table represent the undiscounted contractual future cash flows; these amounts may not reconcile directly with the amounts in the statement of financial position.
| | | Up to 1 year | | 1 to 2 years | | 3 to 5 years | | Over 5 years | | 6/30/2024 |
| Trade payables | | | (1,845,847 | ) | | | - | | | | - | | | | - | | | | (1,845,847 | ) |
| Loans and borrowings | | | (939,780 | ) | | | (1,383,218 | ) | | | (1,048,998 | ) | | | - | | | | (3,371,996 | ) |
| Salaries and wages | | | (115,226 | ) | | | - | | | | - | | | | - | | | | (115,226 | ) |
| Derivative financial instruments | | | (36,576 | ) | | | (12,866 | ) | | | 84,566 | | | | - | | | | 35,124 | |
| Lease liabilities | | | (79,865 | ) | | | (57,723 | ) | | | (100,884 | ) | | | (29,926 | ) | | | (268,398 | ) |
| Payables to related parties | | | (21,071 | ) | | | (117,559 | ) | | | | | | | | | | | (138,630 | ) |
| Other financial liabilities | | | (569 | ) | | | - | | | | - | | | | - | | | | (569 | ) |
| Total | | | (3,038,934 | ) | | | (1,571,366 | ) | | | (1,065,316 | ) | | | (29,926 | ) | | | (5,705,542 | ) |
6. Financial instruments and fair value measurement
See below the amount of financial assets and liabilities:
| | | Notes | | 6/30/2024 | | 12/31/2023 |
| Financial Assets | | | | | | | | | | | | |
| Fair value through profit or loss | | | | | | | | | | | | |
| Marketable securities | | | 7. | | | | 121,539 | | | | 77,814 | |
| Derivative financial instruments | | | 8. | | | | 19,256 | | | | - | |
| | | | | | | | 140,795 | | | | 77,814 | |
| | | | | | | | | | | | | |
| Amortized cost | | | | | | | | | | | | |
| Cash and cash equivalents | | | 7. | | | | 667,490 | | | | 773,551 | |
| Trade receivables | | | 10. | | | | 1,378,854 | | | | 1,094,199 | |
| Receivables of related parties | | | 12. | | | | 670,953 | | | | 685,445 | |
| Other financial assets | | | | | | | 11,887 | | | | 11,374 | |
| | | | | | | | 2,729,184 | | | | 2,564,569 | |
| | | | | | | | | | | | | |
| Total | | | | | | | 2,869,979 | | | | 2,642,383 | |
| | | Notes | | 6/30/2024 | | 12/31/2023 |
| Financial Liabilities | | | | | | | | | | | | |
| Fair value through profit or loss | | | | | | | | | | | | |
| Loans and borrowings | | | 16. | | | | 832,241 | | | | - | |
| Derivative financial instruments | | | 8. | | | | - | | | | 742 | |
| | | | | | | | 832,241 | | | | 742 | |
F-14
Moove Lubricants Holdings
Notes to Interim Condensed Consolidated Financial Statements
June 30, 2024
(In thousands of Brazilian Reais (R$), unless otherwise stated)
| Amortized cost | | | | | | |
| Trade payables | | | | | | | 1,824,081 | | | | 1,494,583 | |
| Loans and borrowings | | | 16. | | | | 2,428,761 | | | | 2,207,028 | |
| Strategic alliance payable | | | | | | | 196,188 | | | | 203,094 | |
| Payables of related parties | | | 12. | | | | 138,630 | | | | 146,420 | |
| Other financial liabilities | | | | | | | 569 | | | | 681 | |
| | | | | | | | 4,588,229 | | | | 4,051,806 | |
| | | | | | | | | | | | | |
| Total | | | | | | | 5,420,470 | | | | 4,052,548 | |
There were no changes in the Group’s valuation processes, valuation techniques, and types of inputs used in the fair value measurement during the period.
The Group discloses fair value measurements based on the hierarchy level of the main assets and liabilities, as shown below:
| | | Notes | | Book value | | Level 2 | | Book value | | Level 2 |
| Financial instruments measured at fair value | | | | | | | | | | | | | | | | | | | | |
| Marketable securities | | | 7. | | | | 121,539 | | | | 121,539 | | | | 77,814 | | | | 77,814 | |
| Derivative financial instruments | | | 8. | | | | 19,256 | | | | 19,256 | | | | (742 | ) | | | (742 | ) |
| Loans and Borrowings | | | 16. | | | | (832,241 | ) | | | (832,241 | ) | | | - | | | | - | |
| Total | | | | | | | (691,446 | ) | | | (691,446 | ) | | | 77,072 | | | | 77,072 | |
| | | | | | | | | | | | | | | | | | | | | |
| Fair value disclosures of financial instruments measured at amortized cost | | | | | | | | | | | | | | | | | | | | |
| Loans and Borrowings | | | 16. | | | | (2,428,761 | ) | | | (2,471,228 | ) | | | (2,207,028 | ) | | | (2,290,813 | ) |
| Total | | | | | | | (2,428,761 | ) | | | (2,471,228 | ) | | | (2,207,028 | ) | | | (2,290,813 | ) |
7. Cash and cash equivalents
For the purpose of the interim statement of cash flows, cash and cash equivalents are comprised of the following:
| | | 6/30/2024 | | 12/31/2023 |
| Cash | | | 16 | | | | 12 | |
| Bank accounts | | | 38,023 | | | | 48,543 | |
| Savings account | | | 400,769 | | | | 210,025 | |
| Financial investments | | | 228,682 | | | | 514,971 | |
| Cash and cash equivalents | | | 667,490 | | | | 773,551 | |
| | | | | | | | | |
| Marketable securities | | | 121,539 | | | | 77,814 | |
8. Derivative financial instruments
On June 30, 2024, the Group had two outstanding derivatives, all were swap contracts. On December 31, 2023, the Group had four outstanding derivatives, all were Non-Deliverable Forward contracts (NDFs).
| | | 6/30/2024 | | 12/31/2023 |
| Long-term derivative financial instrument assets | | | 52,525 | | | | - | |
| Short-term derivative financial instrument liabilities | | | (33,269 | ) | | | (742 | ) |
| | | | 19,256 | | | | (742 | ) |
F-15
Moove Lubricants Holdings
Notes to Interim Condensed Consolidated Financial Statements
June 30, 2024
(In thousands of Brazilian Reais (R$), unless otherwise stated)
9. Hedge accounting
The Group designates all derivatives related to the process of raw material import as hedging instruments in cash flow hedge relationships.
On June 30, 2024 all the hedge accounting transactions were effective.
The Group has designated the amount of R$ 169,981 of cash flow hedge during 2024 (R$ 709,895 during 2023), which had as hedge objects highly probable imports in US$ and Non-Deliverable Forward (NDF) contracts as hedge instruments.
The fair value of the hedge instruments as at June 30, 2024, using the exchange rate R$/US$, are presented as follows:
| Derivative financial instrument - Inventories |
| Balance at December 31, 2023 | | (742) |
| Additions/Mark-to-market (MTM) Movements | | (397) |
| Settlement | | 1,139 |
| Balance at June 30, 2024 | | - |
The fair value of the hedge instruments at June 30, 2024, using the exchange rate R$/US$, are presented as follows:
| Derivative financial instrument - Debt |
| Balance at December 31, 2023 | | - |
| Additions/Mark-to-market (MTM) Movements | | 19,256 |
| Balance at June 30, 2024 | | 19,256 |
Presented below are the movements and balances of hedge accounting recognized at Other Comprehensive Income on June 30, 2024:
| Hedge accounting recognized in other comprehensive income |
| Balance at December 31, 2023 | | (490) |
| Mark-to-market (MTM) | | 1,718 |
| Exchange rate effect | | (2,114) |
| Settlement | | 1,138 |
| Income taxes (34%) | | (252) |
| Balance at June 30, 2024 | | - |
10. Trade receivables
Set out below, is an overview of trade receivables held by the Group as at June 30, 2024 and December 31, 2023:
| | | 6/30/2024 | | 12/31/2023 |
| Trade receivables - current | | | 1,405,306 | | | | 1,113,113 | |
| Trade receivables - non-current | | | 755 | | | | 765 | |
| | | | 1,406,061 | | | | 1,113,878 | |
| | | | | | | | | |
| Trade expected credit losses | | | (27,207 | ) | | | (19,679 | ) |
| | | | 1,378,854 | | | | 1,094,199 | |
| | | | | | | | | |
F-16
Moove Lubricants Holdings
Notes to Interim Condensed Consolidated Financial Statements
June 30, 2024
(In thousands of Brazilian Reais (R$), unless otherwise stated)
| Current | | | 1,378,099 | | | | 1,093,434 | |
| Non-current | | | 755 | | | | 765 | |
| | | | 1,378,854 | | | | 1,094,199 | |
| | | 6/30/2024 | | 12/31/2023 |
| Not overdue | | | 1,210,209 | | | | 960,794 | |
| Overdue | | | | | | | | |
| From 1 to 30 days | | | 99,767 | | | | 103,632 | |
| From 31 to 60 days | | | 40,515 | | | | 22,037 | |
| From 61 to 90 days | | | 23,919 | | | | 6,888 | |
| More than 90 days | | | 31,651 | | | | 20,527 | |
| Expected Credit Losses | | | (27,207 | ) | | | (19,679 | ) |
| | | | 1,378,854 | | | | 1,094,199 | |
11. Inventories
Set out below, is an overview of inventories held by the Group as at June 30, 2024 and December 31, 2023:
| | | 6/30/2024 | | 12/31/2023 |
| Finished goods | | | 1,208,029 | | | | 1,007,055 | |
| Raw material, base oil and packing | | | 334,205 | | | | 320,900 | |
| (-) Provision for realization and obsolescence | | | (38,329 | ) | | | (40,245 | ) |
| | | | 1,503,905 | | | | 1,287,710 | |
12. Related parties
| | | 6/30/2024 | | 12/31/2023 |
| Current assets | | | | | | | | |
| Commercial operations | | | | | | | | |
| Vale S.A. | | | 10,255 | | | | - | |
| Raízen S.A. and subsidiaries | | | 8,238 | | | | 10,281 | |
| Rumo S.A. | | | 5,497 | | | | 6,379 | |
| Other | | | - | | | | 40 | |
| | | | 23,990 | | | | 16,700 | |
| | | | | | | | | |
| Financial and corporate operations | | | | | | | | |
| Cosan S.A. ¹ | | | 17,922 | | | | 13,014 | |
| | | | 17,922 | | | | 13,014 | |
| | | | | | | | | |
| Total current assets | | | 41,912 | | | | 29,714 | |
| | | | | | | | | |
| Non-current assets | | | | | | | | |
| Financial and corporate operations | | | | | | | | |
| Cosan S.A. ¹ | | | 629,041 | | | | 655,731 | |
| | | | 629,041 | | | | 655,731 | |
| | | | | | | | | |
| Total assets | | | 670,953 | | | | 685,445 | |
| | | | | | | | | |
| Current liabilities | | | | | | | | |
| Commercial operations | | | | | | | | |
| Raízen S.A. and subsidiaries | | | 3,043 | | | | 2,482 | |
| Rumo S.A. | | | 2 | | | | 4 | |
| | | | 3,045 | | | | 2,486 | |
F-17
Moove Lubricants Holdings
Notes to Interim Condensed Consolidated Financial Statements
June 30, 2024
(In thousands of Brazilian Reais (R$), unless otherwise stated)
| Financial and corporate operations | | | | |
| Cosan S.A. ¹ | | | 14,262 | | | | 12,904 | |
| Raízen S.A. and subsidiaries | | | 1,695 | | | | 1,395 | |
| Cosan Luxembourg S.A. | | | 2,069 | | | | 1,801 | |
| | | | 18,026 | | | | 16,100 | |
| | | | | | | | | |
| Total current liabilities | | | 21,071 | | | | 18,586 | |
| | | | | | | | | |
| Non-current liabilities | | | | | | | | |
| Financial and corporate operations | | | | | | | | |
| Cosan S.A. ¹ | | | 117,559 | | | | 127,834 | |
| | | | 117,559 | | | | 127,834 | |
| | | | | | | | | |
| Total liabilities | | | 138,630 | | | | 146,420 | |
¹ On December 31, 2018, the Group and Cosan S.A. entered into an agreement to transfer to Cosan S.A. certain assets and liabilities related to the fuel business arising from the acquisition of Esso Brasileira de Petróleo Ltda., or Esso. This resulted in an increase in the Group’s related parties’ assets and liabilities accounts for the recharge of contingencies and tax discussions from events that occurred prior to the contract.
Income statement impacts due to related party transactions:
| | | 1/1/2024 to 6/30/2024 | | 1/1/2023 to 6/30/2023 | | 4/1/2024 to 6/30/2024 | | 4/1/2023 to 6/30/2023 |
| Sale of products, net of returns | | | | | | | | | | | | | | | | |
| Raízen S.A. and subsidiaries | | | 38,984 | | | | 52,582 | | | | 10,239 | | | | 19,742 | |
| Rumo S.A | | | 32,702 | | | | 32,409 | | | | 17,407 | | | | 18,993 | |
| Vale S.A. | | | 30,907 | | | | - | | | | 14,032 | | | | - | |
| | | | 102,593 | | | | 84,991 | | | | 41,678 | | | | 38,735 | |
| | | | | | | | | | | | | | | | | |
| Purchase of goods and services | | | | | | | | | | | | | | | | |
| Raízen S.A. and subsidiaries | | | (5,274 | ) | | | (3,050 | ) | | | (2,834 | ) | | | (1,600 | ) |
| | | | (5,274 | ) | | | (3,050 | ) | | | (2,834 | ) | | | (1,600 | ) |
| | | | | | | | | | | | | | | | | |
| Shared expenses | | | | | | | | | | | | | | | | |
| Raízen S.A. and subsidiaries | | | (6,416 | ) | | | (8,424 | ) | | | (3,520 | ) | | | (3,943 | ) |
| Cosan S.A. | | | (2,546 | ) | | | (2,220 | ) | | | (949 | ) | | | (1,057 | ) |
| | | | (8,962 | ) | | | (10,644 | ) | | | (4,469 | ) | | | (5,000 | ) |
13. Property, plant and equipment
During the six months ended June 30, 2024, the group acquired assets with a cost of R$ 69,191 (R$ 58,377 on June 30, 2023). The effect of exchange rates fluctuations was R$ 123,086 during the six months ended June 30, 2024 (R$52,802 in the six months ended June 30, 2023). The depreciation charge for the year in the first six months of 2024 was R$ 59,225 and R$ 71,621 in the same period of 2023.
14. Intangible assets
During the six months ended June 30, 2024, the most relevant impact in the cost of intangible assets was the effect of exchange rates fluctuations of R$ 320,734 and (R$168,186) in the same period of 2023. Additionally, during the six months ended June 30,2024, the group acquired intangibles assets with a cost of R$ 19,057 (R$28,600 in the six months ended June 30, 2023). The amortization charge for the year in the first six months of 2024 was R$ 79,786 and R$ 69,017 in the same period of 2023.
F-18
Moove Lubricants Holdings
Notes to Interim Condensed Consolidated Financial Statements
June 30, 2024
(In thousands of Brazilian Reais (R$), unless otherwise stated)
15. Right of use assets and lease liabilities
During the six months ended June 30, 2024, the group added new contracts in the amount of R$ 73,985 (R$10,927 in the same period of 2023). The amortization charge for the year in the first six months of 2024 was R$ 34,812 and R$ 24,604 in the same period of 2023.
16. Loans and borrowings
As of June 30, 2024, R$ 25,371 (R$ 31,931 in 2023) of the Group’s borrowings were guaranteed by sureties from related parties at an average annual cost of 0.26% in June 2024 and 0.23% in December 2023.
The loans and borrowings have indexes such as SOFR or CDI or are fixed. See below the amount in the following currencies and the average annual interest rate.
| | | 6/30/2024 | | 12/31/2023 |
| | | Average annual rate | | Book value | | Average annual rate | | Book value |
| Dollar (US$) | | | 6.39 | % | | | 2,996,740 | | | | 6.22 | % | | | 2,207,028 | |
| Pound Sterling (£) | | | 6.50 | % | | | 264,262 | | | | | | | | - | |
| | | | | | | | 3,261,002 | | | | | | | | 2,207,028 | |
In June 2024, Cosan Lubrificantes e Especialidades contracted two loans, one in the form of export prepayment and the other in the form of export credit note, in the amounts of R$806,170 (US$150,000). The export prepayment loan has semi-annual interest payments and repayments will occur in June 2026 and June 2027, while the export credit loan has annual interest payments with the principal due in June 2027.
In addition, Moove Lubricants Limited contracted three loans, in the amounts of R$272,618 (£40,000). One of the loans was paid during the first half of the year. Of the two outstanding loans, one pays interest in a quarterly basis, and the principal is due in June 2026, while for the other one, interest and principal payments are due in August 2024.
Two borrowings include a swap agreement (derivative financial instruments), aimed at exchanging the rate from Sofr to CDI and the currency form US Dollar to Brazilian Reais. The terms and conditions of the borrowings are equivalent to those of the respective derivatives.
The difference in the measurement between the two instruments (borrowing at amortized cost and derivative at fair value), creates an accounting mismatch on the profit or loss and to eliminate this accounting mismatch, the contracts were designated as fair value hedges, with the effect being from this designation the measurement of debt at fair value through profit or loss.
The fair value of these financial instruments considers the entity’s credit risk, which is calculated based on market curves, and the change in the fair value of a financial liability that is attributable to changes in credit risk is recorded in the Statement of Profit or Loss to avoid an accounting mismatch.
Under the term of the major borrowing facilities, the group is required to comply with the following financial covenants:
- Net Leverage Ratio less than 3.5x.
- Interest Coverage Ratio greater than 2.5x.
F-19
Moove Lubricants Holdings
Notes to Interim Condensed Consolidated Financial Statements
June 30, 2024
(In thousands of Brazilian Reais (R$), unless otherwise stated)
The group has complied with these covenants throughout the reporting period. As at June 30, 2024, the Net Leverage Ratio was 2.08x and the Interest Coverage Ratio was 5.35x. As at December 31, 2023, the Net Leverage Ratio was 1.09x and the Interest Coverage Ratio was 5.43x.
The changes in loans and borrowings are as follows:
| At December 31, 2022 | | | 2,862,154 | |
| Payment of principal | | | (103,928 | ) |
| Payment of interest | | | (82,818 | ) |
| Exchange variation | | | (206,233 | ) |
| Interest accrual and others | | | 89,385 | |
| At June 30, 2023 | | | 2,558,560 | |
| | | | | |
| At December 31, 2023 | | | 2,207,028 | |
| Addition | | | 1,078,788 | |
| Payment of principal | | | (356,391 | ) |
| Payment of interest | | | (84,762 | ) |
| Exchange variation | | | 332,538 | |
| Interest accrual and others | | | 83,801 | |
| At June 30, 2024 | | | 3,261,002 | |
Loans maturities are as follows, excluding transaction costs:
| | 6/30/2024 | | 12/31/2023 |
| Up to 12 months | 775,603 | | 671,110 |
| 13 to 24 months | 992,660 | | 622,453 |
| 25 to 36 months | 1,512,468 | | 622,453 |
| 37 to 48 months | - | | 311,226 |
| | 3,280,731 | | 2,227,242 |
17. Taxation
Income Taxes
The Group calculates and presents the period income tax expense using the estimated annual effective tax rate on profit before tax. The amounts recognized for regular business operations are presented segregated from discrete items and have one-off impacts on certain periods. The amounts of income tax expense in the interim consolidated statement of profit or loss are:
| | | 01/01/2024 to 06/30/2024 | | 01/01/2023 to 06/30/2023 | | 04/01/2024 to 06/30/2024 | | 04/01/2023 to 06/30/2023 |
| Income taxes (Regular business) | | | (134,559 | ) | | | (118,493 | ) | | | (63,787 | ) | | | (74,910 | ) |
| Estimate Annual Effective Tax Rate | | | -37 | % | | | -36 | % | | | -37 | % | | | -36 | % |
| | | | | | | | | | | | | | | | | |
| Discrete items: | | | | | | | | | | | | | | | | |
| Brazil - Reversal of tax benefits due to legal decision8 | | | 37,025 | | | | (261,995 | ) | | | 37,025 | | | | — | |
| Cayman - Stock option plan conditioned to a liquidity event9 | | | (28,696 | ) | | | — | | | | (5,374 | ) | | | — | |
| Expenses related to initial public offering | | | 5,395 | | | | — | | | | 5,395 | | | | — | |
| Others | | | (3,134 | ) | | | (7,912 | ) | | | 5,628 | | | | (5,948 | ) |
| Total income taxes | | | (123,969 | ) | | | (388,400 | ) | | | (21,113 | ) | | | (80,858 | ) |
8 In 2022 the Company had recognized an out of period tax benefit called "Pacto Federativo", however this was disallowed in April of 2023 by a ruling of the Superior Justice Tribunal affecting corporate income taxpayers in Brazil. In December 2023, a new tax law was approved by Brazilian Government where special conditions for settlement of these tax debits with discount was promoted. Based on that, the Company reviewed its estimation and reduced the due amount to R$ 47,095 as of December 31, 2023. In April 2024, when the Company effectively took part in this tax settlement program, the final amount agreed generated an additional reversal of R$37,025.
9 Related to the Stock option plan detailed in Note 18. (Share-based payments)
F-20
Moove Lubricants Holdings
Notes to Interim Condensed Consolidated Financial Statements
June 30, 2024
(In thousands of Brazilian Reais (R$), unless otherwise stated)
The group is within the scope of the OECD Pillar Two model rules. The group applies the IAS 12 exception to recognizing and disclosing information about deferred tax assets and liabilities related to Pillar Two income taxes. Until the issue date of these Interim Financial Statements, no material impact has been identified related to Pillar Two.
18. Share-based payments
In July 2023 an incentive program called “Stock Option Plan - SOP” was created, and 1,342,609 options were granted. The incentive program is conditioned to the occurrence of a liquidity event defined in the program (non-market performance condition) and linked to a service condition as beneficiaries should be employed until the liquidity event. All unvested share options will automatically vest upon the consummation of the Company’s initial public offering. During the six months ended 30 June 2024, no new share options were granted.
The exercise share price of the options covered by this Program varies between R$50.05 and R$135.05 (“Exercise Share Price”) and are paid through the delivery of equity instruments, simultaneously with the formalization of the subscription or purchase. The lock-up period linked to the exercise of vested options are immediately for program A, one year and a half for programs B and C and two years and a half for program D. There is no cash settlement alternative of the options.
The fair value at the grant date is estimated using a binomial pricing model, considering the terms and conditions upon which the options were granted. The contractual life of each option granted is six years. The fair value of options granted was estimated on the date of grant using the following assumptions:
| | | A | | B | | C | | D |
| Stock options granted | | | 699,276 | | | | 279,710 | | | | 223,768 | | | | 139,855 | |
| Grant date | | | 7/1/2023 | | | | 7/1/2023 | | | | 7/1/2023 | | | | 7/1/2023 | |
| Dividend yield | | | 0 | % | | | 0 | % | | | 0 | % | | | 0 | % |
| Expected volatility10 | | | 42.85 | % | | | 42.85 | % | | | 42.85 | % | | | 42.85 | % |
| Risk-free interest rate | | | 4.05 | % | | | 4.05 | % | | | 4.05 | % | | | 4.05 | % |
| Exercise share price | | R$ | 50.05 | | | R$ | 106.28 | | | R$ | 135.05 | | | R$ | 135.05 | |
| Weighted average share price | | R$ | 185.67 | | | R$ | 185.67 | | | R$ | 185.67 | | | R$ | 185.67 | |
| Fair value option at grant | | R$ | 142.62 | | | R$ | 88.32 | | | R$ | 76.54 | | | R$ | 71.45 | |
For the six months ended 30 June 2024, the Group has recognized R$ 97,788 of SOP expense and related payroll taxes in the statement of profit or loss (nil for the six months ended June 30, 2023) and the impact in changes in equity was R$ 75,575 (nil for the six months ended June 30, 2023). The SOP expense is accrued over the vesting period based on the Company’s best estimate of the vesting date (12/31/2024 as of June 30, 2024 compared to 12/31/2025 as of December 31, 2023), and the number of equity instruments ultimately expected to vest.
10 Volatility is determined based on the average volatility of the last 6 years of the shares of Cosan S.A., the parent company of the Group, with same lifetime of the options granted. The value used was 42.85%, which refers to the calculation of the standard deviation of the value of the shares between 06/30/2017 and 06/30/2023.
F-21
Moove Lubricants Holdings
Notes to Interim Condensed Consolidated Financial Statements
June 30, 2024
(In thousands of Brazilian Reais (R$), unless otherwise stated)
19. Provision for contingent liabilities and judicial deposits
On June 30, 2024 and 2023, the Group had legal provisions and deposits related to:
| | | Provision for legal proceedings |
| | | 6/30/2024 | | 12/31/2023 |
| Tax | | 419,542 | | 422,167 |
| Civil and environmental | | 25,095 | | 55,749 |
| Labor | | 6,844 | | 7,625 |
| | | 451,481 | | 485,541 |
| | | 6/30/2024 | | 12/31/2023 |
| Tax | | 166,812 | | 159,504 |
| Civil and environmental | | 6,987 | | 6,887 |
| Labor | | 771 | | 803 |
| | | 174,570 | | 167,194 |
| | | Tax | | Civil and environmental | | Labor | | Total |
| At 31 December 2022 | | | 410,320 | | | | 220,093 | | | | 8,752 | | | | 639,165 | |
| Additional provisions | | | 15,693 | | | | 18,357 | | | | 1,932 | | | | 35,982 | |
| Settlement / Write-offs | | | (257 | ) | | | (163,392 | ) | | | (3,221 | ) | | | (166,870 | ) |
| Exchange variation | | | (6 | ) | | | - | | | | - | | | | (6 | ) |
| At 30 June 2023 | | | 425,750 | | | | 75,058 | | | | 7,463 | | | | 508,271 | |
| | | | | | | | | | | | | | | | | |
| | | Tax | | Civil and environmental | | Labor | | Total |
| At 31 December 2023 | | | 422,167 | | | | 55,749 | | | | 7,625 | | | | 485,541 | |
| Additional provisions | | | 8,323 | | | | 4,315 | | | | 663 | | | | 13,301 | |
| Settlement / Write-offs | | | (10,959 | ) | | | (34,969 | ) | | | (1,444 | ) | | | (47,372 | ) |
| Exchange variation | | | 11 | | | | - | | | | - | | | | 11 | |
| At 30 June 2024 | | | 419,542 | | | | 25,095 | | | | 6,844 | | | | 451,481 | |
19.1. Assessment of loss probability
The main lawsuits where the risk of loss is probable and for which a provision has been accounted are as follows:
| | | 6/30/2024 | | 12/31/2023 |
| FINSOCIAL tax compensation11 | | 331,828 | | 326,222 |
| Brazilian State VAT - ICMS12 tax credit | | 9,362 | | 14,893 |
| Brazilian Federal Income tax | | 2,919 | | 5,205 |
| Other | | 75,433 | | 75,847 |
| Probable losses (Tax) | | 419,542 | | 422,167 |
11 Brazilian federal tax authorities are contesting Cosan Lubrificantes e Especialidades S.A. (CLE) applications to offset credits resulting from overpaid FINSOCIAL taxes against other federal tax debts, arguing that the COFINS immunity applied only to the fiscal year in which the lawsuit was filed (i.e., in 1992). No judicial deposits were made for these proceedings. Amounts which we may have to pay pursuant to this legal proceeding are subject to reimbursement by Cosan.
12 Tax on Operations relating to the Circulation of Goods and on Provision of Interstate and Intermunicipal Transport and Communication Services.
F-22
Moove Lubricants Holdings
Notes to Interim Condensed Consolidated Financial Statements
June 30, 2024
(In thousands of Brazilian Reais (R$), unless otherwise stated)
| ii. | Civil and environmental |
The Group is party to a series of lawsuits related to (a) indemnity for material and moral damages; (b) termination of different types of contracts and collection of contractual taxes (c) environmental issues related to the recovery of degraded areas; and (d) other matters.
The Group is party to labor claims filed by former employees and service providers about the payment of overtime, recognition of employment relationships, union membership, unhealthy work and hazardous work, possible non-compliance with regulatory rules of the Ministry of Labor and Employment, reinstatement in the employment, indemnity for moral and material damages on several grounds, subsidiary liability for third party labor debts, and reimbursement of payroll discounts as a union contribution.
The main lawsuits where the risk of loss is considered by the Group to be possible (and no provision has been accounted for as the outflow is not probable) are described below:
| | | 6/30/2024 | | 12/31/2023 |
| Tax | | 3,503,045 | | 3,291,659 |
| Environmental | | 258,537 | | 246,586 |
| Civil | | 536,557 | | 517,344 |
| Labor | | 10,385 | | 10,473 |
| | | 4,308,524 | | 4,066,062 |
The breakdown of the possible losses relating to taxes is as follows:
| | | 6/30/2024 | | 12/31/2023 |
| Brazilian Federal Income taxes13 | | 1,395,578 | | 1,319,898 |
| Brazilian Federal Income taxes withheld at source14 | | 1,043,098 | | 1,025,684 |
| Brazilian State VAT - ICMS15 | | 677,849 | | 599,301 |
| IPI – Brazilian Excise tax credit – NT16 | | 150,844 | | 141,007 |
| PIS/COFINS (Brazil Social security contribution) | | 75,321 | | 57,668 |
| INSS - Brazil Social security | | 5,895 | | 5,907 |
| Other | | 154,460 | | 142,194 |
| Possible losses (Tax) | | 3,503,045 | | 3,291,659 |
13 Brazilian federal tax authorities have issued four tax assessments against CLE regarding the collection of federal corporate income taxes for the calendar years 2009 through 2018. The Group is contesting the assessments for the years 2012 through 2018 in administrative proceedings, while those for 2009 through 2011 are being challenged in judicial courts. The risk of loss in these proceedings is classified as possible for the disputed amounts. The amounts which we may have to pay pursuant to this legal proceeding are subject to reimbursement by Cosan.
14 Brazilian federal tax authorities issued a tax assessment against CLE, holding the company accountable for withholding income tax allegedly owed on capital gains realized by ExxonMobil International Holdings B.V. and ExxonMobil Brasil Holdings B.V., foreign entities, concerning the sale of cooperatives based in the Netherlands. The portion of the assessment related to the application of the 150% penalty remains under consideration in the administrative courts, awaiting judgment on a special appeal. The amounts which we may have to pay pursuant to this legal proceeding are subject to reimbursement by Cosan.
15 CLE is involved in a legal challenge against the Rio de Janeiro fiscal equilibrium fund (Fundo Estadual de Equilíbrio Fiscal), or FEEF, which has been replaced by the temporary budget fund (Fundo Orçamentário Temporário), or FOT (a deposit of 10% of ICMS tax exempted using tax benefits) imposed by certain Brazilian states on the industrialization and commercialization of lube oils. As of December 31, 2023, judicial deposits of FEEF and FOT have been. Additionally, there is a dispute over the collection of ICMS on certain amounts paid by exclusive distributors not connected with the sale of goods, such as territorial concession, support services for logistics and marketing optimization, and reimbursement of expenses. The risk of loss in these proceedings is classified as possible.
16 CLE is subject to tax claims relating to its reliance on the exemption of certain oil derived lubricants from the tax on industrialized products (imposto sobre produtos industrializados), or IPI. The risk of loss in these proceedings is classified as possible.
F-23
Moove Lubricants Holdings
Notes to Interim Condensed Consolidated Financial Statements
June 30, 2024
(In thousands of Brazilian Reais (R$), unless otherwise stated)
20. Revenue
Below the revenue by products and services:
| | | 1/1/2024 to 6/30/2024 | | 1/1/2023 to 6/30/2023 | | 4/1/2024 to 6/30/2024 | | 4/1/2023 to 6/30/2023 |
| Finished goods | | | 4,279,210 | | | | 4,603,061 | | | | 2,210,631 | | | | 2,226,369 | |
| Base oil and specialties | | | 318,429 | | | | 375,654 | | | | 148,346 | | | | 225,507 | |
| Services | | | 427,168 | | | | 125,576 | | | | 220,647 | | | | 65,242 | |
| Revenue | | | 5,024,807 | | | | 5,104,291 | | | | 2,579,624 | | | | 2,517,118 | |
Below the revenue by destination geographical area:
| | | 1/1/2024 to 6/30/2024 | | 1/1/2023 to 6/30/2023 | | 4/1/2024 to 6/30/2024 | | 4/1/2023 to 6/30/2023 |
| South America17 | | | 2,399,522 | | | | 2,321,537 | | | | 1,215,699 | | | | 1,193,699 | |
| Europe and Other18 | | | 1,444,184 | | | | 1,516,347 | | | | 753,657 | | | | 714,618 | |
| North America | | | 1,181,101 | | | | 1,266,407 | | | | 610,268 | | | | 608,801 | |
| Revenue | | | 5,024,807 | | | | 5,104,291 | | | | 2,579,624 | | | | 2,517,118 | |
21. Cost and Expenses by nature
| | | 1/1/2024 to 6/30/2024 | | 1/1/2023 to 6/30/2023 | | 4/1/2024 to 6/30/2024 | | 4/1/2023 to 6/30/2023 |
| Raw materials | | | (3,543,832 | ) | | | (3,690,311 | ) | | | (1,808,215 | ) | | | (1,770,172 | ) |
| Depreciation and amortization | | | (9,218 | ) | | | (7,872 | ) | | | (4,217 | ) | | | (5,040 | ) |
| Other costs | | | (34,771 | ) | | | (30,462 | ) | | | (17,806 | ) | | | (14,474 | ) |
| Cost of sales | | | (3,587,821 | ) | | | (3,728,645 | ) | | | (1,830,238 | ) | | | (1,789,686 | ) |
| | | 1/1/2024 to 6/30/2024 | | 1/1/2023 to 6/30/2023 | | 4/1/2024 to 6/30/2024 | | 4/1/2023 to 6/30/2023 |
| Employee expense | | | (261,234 | ) | | | (228,044 | ) | | | (135,920 | ) | | | (113,441 | ) |
| Freight and logistics expenses | | | (124,943 | ) | | | (148,432 | ) | | | (62,318 | ) | | | (74,238 | ) |
| Depreciation and amortization | | | (109,512 | ) | | | (110,410 | ) | | | (55,190 | ) | | | (54,803 | ) |
| Marketing expenses | | | (50,012 | ) | | | (38,712 | ) | | | (26,722 | ) | | | (20,795 | ) |
| Third party services | | | (32,788 | ) | | | (35,371 | ) | | | (17,718 | ) | | | (15,619 | ) |
| Travel expenses | | | (19,466 | ) | | | (15,443 | ) | | | (10,158 | ) | | | (7,625 | ) |
| Other selling expenses | | | (58,674 | ) | | | (41,134 | ) | | | (28,152 | ) | | | (21,908 | ) |
| Selling expenses | | | (656,629 | ) | | | (617,546 | ) | | | (336,178 | ) | | | (308,429 | ) |
| | | | | | | | | | | | | | | | | |
| | | | 1/1/2024 to 6/30/2024 | | | | 1/1/2023 to 6/30/2023 | | | | 4/1/2024 to 6/30/2024 | | | | 4/1/2023 to 6/30/2023 | |
| Employee expenses19 | | | (234,171 | ) | | | (153,201 | ) | | | (95,499 | ) | | | (75,613 | ) |
| Depreciation and amortization | | | (55,102 | ) | | | (46,962 | ) | | | (30,227 | ) | | | (23,031 | ) |
| Third party services20 | | | (68,091 | ) | | | (30,174 | ) | | | (50,596 | ) | | | (16,539 | ) |
| Telecommunications expenses | | | (12,296 | ) | | | (13,398 | ) | | | (6,247 | ) | | | (8,181 | ) |
| Corporate shared expenses | | | (8,458 | ) | | | (5,954 | ) | | | (4,297 | ) | | | (2,662 | ) |
| Travel expenses | | | (4,052 | ) | | | (5,528 | ) | | | (2,133 | ) | | | (2,961 | ) |
| Fines, taxes and fees | | | (8,621 | ) | | | (5,591 | ) | | | (6,237 | ) | | | (2,884 | ) |
| Marketing expenses | | | (4,326 | ) | | | (1,944 | ) | | | (2,180 | ) | | | (1,108 | ) |
| Maintenance and repair expenses | | | (717 | ) | | | (2,253 | ) | | | (251 | ) | | | (1,070 | ) |
| Freight and logistics expenses | | | (425 | ) | | | (933 | ) | | | (250 | ) | | | (300 | ) |
| Other general and administrative expenses | | | (12,900 | ) | | | (1,840 | ) | | | (8,072 | ) | | | (5,104 | ) |
| General and administrative expenses | | | (409,159 | ) | | | (267,778 | ) | | | (205,989 | ) | | | (139,453 | ) |
17 Main countries: Brazil, Argentina, Bolivia, Paraguay and Uruguay
18 Main countries: United Kingdom, France, Spain and Portugal
19 Including Stock option plan expenses (Note 18.) of R$ 97,788 in the six months ended June 30, 2024 (nil for the six months ended June 30, 2023) and R$24,703 in the second quarter of 2024 (nil for the second quarter of 2023). The full amount of expenses is added back to compose the Company’s Adjusted EBITDA.
20 Including initial public offering expenses of R$12,782 in the six months ended June 30, 2024 (nil for the six months ended June 30, 2023) and the same amount in the second quarter of 2024 (nil for the second quarter of 2023). The full amount of expenses is added back to compose the Company’s Adjusted EBITDA.
F-24
Moove Lubricants Holdings
Notes to Interim Condensed Consolidated Financial Statements
June 30, 2024
(In thousands of Brazilian Reais (R$), unless otherwise stated)
22. Financial Results, net
| | | 1/1/2024 to 6/30/2024 | | 1/1/2023 to 6/30/2023 | | 4/1/2024 to 6/30/2024 | | 4/1/2023 to 6/30/2023 |
| Financial expense | | | | | | | | | | | | | | | | |
| Interest on loans | | | (88,274 | ) | | | (79,516 | ) | | | (44,492 | ) | | | (40,489 | ) |
| Derivative financial instruments | | | - | | | | (36,654 | ) | | | - | | | | (21,081 | ) |
| Other financial expense | | | (7,706 | ) | | | (7,701 | ) | | | (3,653 | ) | | | (4,052 | ) |
| Interest on taxes | | | (126 | ) | | | (23,928 | ) | | | - | | | | - | |
| Actuarial liabilities | | | (7,196 | ) | | | (5,543 | ) | | | (6,748 | ) | | | (3,820 | ) |
| Miscellaneous interest expense - liabilities | | | (1,743 | ) | | | (9,437 | ) | | | (1,140 | ) | | | (4,227 | ) |
| Interest on lease liabilities | | | (6,813 | ) | | | (4,397 | ) | | | (4,040 | ) | | | (2,163 | ) |
| Fair value adjustment - debt | | | - | | | | (1,390 | ) | | | - | | | | (1,964 | ) |
| Interest on amounts refundable by Cosan | | | (3,680 | ) | | | (2,403 | ) | | | (1,339 | ) | | | (99 | ) |
| | | | (115,538 | ) | | | (170,969 | ) | | | (61,412 | ) | | | (77,895 | ) |
| | | | | | | | | | | | | | | | | |
| | | | | | | | | | | | | | | | | |
| Financial income | | | | | | | | | | | | | | | | |
| Income from financial investments | | | 22,490 | | | | 34,537 | | | | 8,675 | | | | 16,353 | |
| Miscellaneous interest income - assets | | | 13,196 | | | | 14,114 | | | | 7,088 | | | | 7,295 | |
| Hyperinflation | | | 79,945 | | | | 15,476 | | | | 19,635 | | | | 7,967 | |
| Other financial income | | | 962 | | | | 645 | | | | 859 | | | | 386 | |
| Fair value adjustment - debt | | | 4,044 | | | | - | | | | 4,044 | | | | - | |
| Interest on taxes | | | - | | | | - | | | | 646 | | | | 8,011 | |
| Derivative financial instruments | | | 19,256 | | | | - | | | | 19,256 | | | | - | |
| | | | 139,893 | | | | 64,772 | | | | 60,203 | | | | 40,012 | |
| | | | | | | | | | | | | | | | | |
| Exchange variation, net | | | (68,603 | ) | | | (31,956 | ) | | | (45,441 | ) | | | (21,579 | ) |
| | | | | | | | | | | | | | | | | |
| Financial result, net | | | (44,248 | ) | | | (138,153 | ) | | | (46,650 | ) | | | (59,462 | ) |
23. Equity
23.1. Share Capital and Share Premium
On June 30, 2024, the Company’s share capital is R$ 177 (R$ 177 on December 31, 2023) and the Company’s share premium is R$ 1,356,853 (R$ 2,256,853 on December 31, 2023). The number of ordinary shares issued is 34,963,764 (34,963,764 on December 31, 2023) and their nominal value is US$ 0.001 (US$ 0.001 on December 31, 2023).
The dividends distributed in 2024 were from share premium (nil on 2023), according to Note 23.5.
23.2. Reserves
The Company’s reserves are held to reinforce working capital, finance maintenance, expansion, and development of activities, subject to the Group’s strategy.
The dividends distributed in 2023 were from the profit reserve, according to Note 23.5.
23.3. Other Equity Components
The Company’s Other Equity Components is reflected below for the six months ended in June:
F-25
Moove Lubricants Holdings
Notes to Interim Condensed Consolidated Financial Statements
June 30, 2024
(In thousands of Brazilian Reais (R$), unless otherwise stated)
| At 31 December 2022 | | | 85,146 | |
| Cash flow hedge accounting | | | 344 | |
| Foreign currency translation effects | | | (56,515 | ) |
| At 30 June 2023 | | | 28,975 | |
| | | | | |
| | | | | |
| At 31 December 2023 | | | 25,587 | |
| Cash flow hedge accounting | | | 490 | |
| Foreign currency translation effects | | | 45,903 | |
| At 30 June 2024 | | | 71,980 | |
23.4. Earnings per share
The following table sets forth the calculation of earnings per share (in thousands of Brazilian Reais, except amounts per share):
| | | 1/1/2024 to 6/30/2024 | | 1/1/2023 to 6/30/2023 | | 4/1/2024 to 6/30/2024 | | 4/1/2023 to 6/30/2023 |
| Profit attributable to ordinary equity holders for earnings | | | 237,556 | | | | (58,518 | ) | | | 150,219 | | | | 127,700 | |
| Weighted-average number of ordinary shares | | | 34,963,764 | | | | 34,963,764 | | | | 34,963,764 | | | | 34,963,764 | |
| Earnings per share - basic and diluted | | | R$ 6.79 | | | | R$ (1.67) | | | | R$ 4.30 | | | | R$ 3.65 | |
23.5. Dividends
On the General Meeting held on June 12, 2024, the shareholders approved the distribution of dividends in the amount of US$ 167 million (R$ 900,000). These dividends were fully paid in June 2024.
On the General Meeting held on June 01, 2023, the shareholders approved the distribution of dividends in the amount of £ 40 million (R$ 246,096). These dividends were fully paid in June 2023.
24. Subsequent events
On September 04, 2024 the subsidiary Millennium Moove Corp. signed an amendment to Senior Secured Term Loan Agreement modifying the following conditions: (i) Principal payment date from six installments biannually to a single installment (US$ 385.7 million) at the maturity date (May 3, 2027); (ii) Applicable interest rate changed from SOFR + 225 bps to SOFR + 150 bps; (iii) Exclusion one of the clauses of mandatory prepayment in case of raising funds above US$ 300 million whether Equity Capital Market or Debt Capital Market.
F-26
| Moove Lubricants Holdings Consolidated financial statements For the years ended December 31, 2023, December 31, 2022 and December 31, 2021. |
Report of Independent Registered Public Accounting Firm
To the Shareholders and the Board of Directors of
Moove Lubricants Holdings
Opinion on the Financial Statements
We have audited the accompanying consolidated statements of financial position of Moove Lubricants Holdings (the Company) as of December 31, 2023 and 2022, the related consolidated statements of profit or loss, other comprehensive income, changes in equity and cash flows for each of the three years in the period ended December 31, 2023, and the related notes (collectively referred to as the “consolidated financial statements”).
In our opinion, the consolidated financial statements present fairly, in all material respects, the financial position of the Company at December 31, 2023 and 2022, and the results of its operations and its cash flows for each of the three years in the period ended December 31, 2023, in conformity with International Financial Reporting Standards (IFRS) as issued by the International Accounting Standards Board (IASB).
Basis for Opinion
These financial statements are the responsibility of the Company's management. Our responsibility is to express an opinion on the Company’s financial statements based on our audit. We are a public accounting firm registered with the Public Company Accounting Oversight Board (United States) (PCAOB) and are required to be independent with respect to the Company in accordance with the U.S. federal securities laws and the applicable rules and regulations of the Securities and Exchange Commission and the PCAOB.
We conducted our audit in accordance with the standards of the PCAOB. Those standards require that we plan and perform the audit to obtain reasonable assurance about whether the financial statements are free of material misstatement, whether due to error or fraud. The Company is not required to have, nor were we engaged to perform, an audit of its internal control over financial reporting. As part of our audit we are required to obtain an understanding of internal control over financial reporting but not for the purpose of expressing an opinion on the effectiveness of the Company's internal control over financial reporting. Accordingly, we express no such opinion.
Our audit included performing procedures to assess the risks of material misstatement of the financial statements, whether due to error or fraud, and performing procedures that respond to those risks. Such procedures included examining, on a test basis, evidence regarding the amounts and disclosures in the financial statements. Our audit also included evaluating the accounting principles used and significant estimates made by management, as well as evaluating the overall presentation of the financial statements. We believe that our audit provides a reasonable basis for our opinion.
Critical Audit Matter
The critical audit matter communicated below is a matter arising from the current period audit of the financial statements that was communicated or required to be communicated to the audit committee and that: (1) relates to accounts or disclosures that are material to the financial statements and (2) involved our especially challenging, subjective or complex judgments. The communication of the critical audit matter does not alter in any way our opinion on the consolidated financial statements, taken as a whole, and we are not, by communicating the critical audit matter below, providing a separate opinion on the critical audit matter or on the account or disclosure to which it relates.
F-28
| | Impairment of Goodwill |
| | |
| Description of the Matter | As of December 31, 2023, the Company's goodwill amounted to R$ 1,254,054 thousand. As discussed in Note 2.8 to the consolidated financial statements, the Company performs goodwill impairment testing annually by comparing the carrying amounts of the cash generating units to which goodwill and other indefinite life intangible assets have been allocated to their recoverable amounts. Auditing the Company’s annual goodwill impairment test was complex and highly judgmental due to the significant estimation required to determine the value in use of the cash generating units (CGUs) utilizing a discounted cash flows model. The significant assumptions used to estimate value in use included revenue growth rate and the discount rate, which could be affected by expectations about future market or economic conditions of each of the Company’s CGUs. |
| | |
| How We Addressed the Matter in Our Audit | To test management’s estimate of the value in use of the Company’s CGUs, we performed audit procedures that included, among others, involving our valuation specialists to assist with our evaluation of the significant assumptions and the valuation methodology used by the Company. For example, we along with the valuation specialists, performed independent sensitivity analyses of significant assumptions, such as the revenue growth rate and the discount rate, to evaluate the changes in the value in use of the CGUs that would result from changes in the assumptions. We, with the support of our valuation specialists, compared each of the significant assumptions used in the cash flows model mentioned above with economic, market and industry (peer) data. We assessed the historical accuracy of management’s estimates. We also tested, with the support of the valuation specialists, the completeness and accuracy of the underlying data used by the Company in its goodwill impairment testing. We also assessed the adequacy of the Company`s related disclosures in Note 2.8 to the consolidated financial statements with respect to the impairment test of goodwill. |
/s/ Ernst & Young Auditores Independentes S/S Ltda.
We have served as the Company's auditor since 2024.
São Paulo, Brazil
July 9, 2024
F-29
Moove Lubricants Holdings
Consolidated Statement of Financial Position
At December 31
(In thousands of Brazilian Reais (R$), unless otherwise stated)
| | | Notes | | 2023 | | 2022 |
| Assets | | | | | | | | | | | | |
| Current assets | | | | | | | | | | | | |
| Cash and cash equivalents | | | 3. | | | | 773,551 | | | | 865,370 | |
| Marketable securities | | | 3. | | | | 77,814 | | | | 62,919 | |
| Restricted cash | | | | | | | 7,282 | | | | 8,024 | |
| Trade receivables | | | 6. | | | | 1,093,434 | | | | 1,099,725 | |
| Inventories | | | 7. | | | | 1,287,710 | | | | 1,509,357 | |
| Receivables from related parties | | | 8. | | | | 29,714 | | | | 32,597 | |
| Advances to suppliers | | | | | | | 15,415 | | | | 58,640 | |
| Taxes recoverable | | | 9. | | | | 77,828 | | | | 197,436 | |
| Other current financial assets | | | | | | | 690 | | | | 450 | |
| Other current assets | | | | | | | 74,256 | | | | 83,168 | |
| | | | | | | | 3,437,694 | | | | 3,917,686 | |
| | | | | | | | | | | | | |
| Non-current assets | | | | | | | | | | | | |
| Trade receivables | | | 6. | | | | 765 | | | | 823 | |
| Receivables from related parties | | | 8. | | | | 655,731 | | | | 765,148 | |
| Deferred income tax | | | 16.3. | | | | 16,215 | | | | 78,556 | |
| Judicial deposits | | | 19. | | | | 167,194 | | | | 153,359 | |
| Non-current taxes recoverable | | | 9. | | | | 14,853 | | | | 89,987 | |
| Other non-current financial assets | | | | | | | 10,684 | | | | 64,731 | |
| Other non-current assets | | | | | | | 12,911 | | | | 19,398 | |
| Right-of-use assets | | | 13. | | | | 195,159 | | | | 169,326 | |
| Property, plant and equipment | | | 11. | | | | 768,532 | | | | 817,953 | |
| Intangible assets | | | 12. | | | | 2,597,854 | | | | 2,824,090 | |
| | | | | | | | 4,439,898 | | | | 4,983,371 | |
| | | | | | | | | | | | | |
| Total assets | | | | | | | 7,877,592 | | | | 8,901,057 | |
F-30
Moove Lubricants Holdings
Consolidated Statement of Financial Position
At December 31
(In thousands of Brazilian Reais (R$), unless otherwise stated)
| | | Notes | | 2023 | | 2022 |
| Liabilities | | | | | | | | | | | | |
| Current liabilities | | | | | | | | | | | | |
| Trade payables | | | | | | | 1,494,583 | | | | 1,607,933 | |
| Loans and borrowings | | | 14. | | | | 652,935 | | | | 502,213 | |
| Salaries and wages | | | | | | | 147,293 | | | | 112,569 | |
| Other taxes payable | | | | | | | 210,547 | | | | 80,399 | |
| Payables to related parties | | | 8. | | | | 18,586 | | | | 116,679 | |
| Derivative financial instruments | | | 4. | | | | 742 | | | | 18,146 | |
| Lease liabilities | | | 13. | | | | 50,768 | | | | 72,908 | |
| Strategic alliance payable | | | 15. | | | | 57,513 | | | | 60,384 | |
| Other current financial liabilities | | | | | | | 681 | | | | 64,099 | |
| Other current liabilities | | | | | | | 81,228 | | | | 100,993 | |
| | | | | | | | 2,714,876 | | | | 2,736,323 | |
| | | | | | | | | | | | | |
| Non-current liabilities | | | | | | | | | | | | |
| Loans and borrowings | | | 14. | | | | 1,554,093 | | | | 2,359,941 | |
| Deferred income tax | | | 16.3. | | | | 115,452 | | | | 127,679 | |
| Payables to related parties | | | 8. | | | | 127,834 | | | | 206,446 | |
| Post-employment benefits | | | 18.2. | | | | 175,150 | | | | 127,654 | |
| Provisions for contingent liabilities | | | 19. | | | | 485,541 | | | | 639,165 | |
| Lease liabilities | | | 13. | | | | 148,895 | | | | 94,442 | |
| Strategic alliance payable | | | 15. | | | | 145,581 | | | | 166,301 | |
| Other non-current liabilities | | | | | | | 145,709 | | | | 158,087 | |
| | | | | | | | 2,898,255 | | | | 3,879,715 | |
| | | | | | | | | | | | | |
| Total current and non-current liabilities | | | | | | | 5,613,131 | | | | 6,616,038 | |
| | | | | | | | | | | | | |
| Equity | | | 23. | | | | | | | | | |
| Share capital | | | 23.1. | | | | 177 | | | | 561,085 | |
| Share premium | | | 23.1. | | | | 2,256,853 | | | | — | |
| Reserves | | | | | | | (18,783 | ) | | | 1,638,026 | |
| Other equity components | | | 23.3. | | | | 25,587 | | | | 85,146 | |
| Equity attributable to equity holders of the parent | | | | | | | 2,263,834 | | | | 2,284,257 | |
| | | | | | | | | | | | | |
| Non-controlling interest | | | | | | | 627 | | | | 762 | |
| | | | | | | | | | | | | |
| Total equity | | | | | | | 2,264,461 | | | | 2,285,019 | |
| | | | | | | | | | | | | |
| Total liabilities and equity | | | | | | | 7,877,592 | | | | 8,901,057 | |
F-31
Moove Lubricants Holdings
Consolidated Statement of Profit or Loss
For the years ended December 31
(In thousands of Brazilian Reais (R$), unless otherwise stated)
| | | Note | | 2023 | | 2022 | | 2021 |
| | | | | | | | | |
| Revenue | | | 20. | | | | 10,074,174 | | | | 8,886,286 | | | | 6,036,701 | |
| Cost of sales and services | | | 21. | | | | (7,289,407 | ) | | | (6,925,610 | ) | | | (4,699,005 | ) |
| Gross profit | | | | | | | 2,784,767 | | | | 1,960,676 | | | | 1,337,696 | |
| | | | | | | | | | | | | | | | | |
| Selling expenses | | | 21. | | | | (1,214,537 | ) | | | (1,122,558 | ) | | | (583,418 | ) |
| General and administrative expenses | | | 21. | | | | (630,766 | ) | | | (372,202 | ) | | | (275,874 | ) |
| Other operating income (expenses), net | | | | | | | (18,510 | ) | | | 29,002 | | | | 23,414 | |
| Operating expenses | | | | | | | (1,863,813 | ) | | | (1,465,758 | ) | | | (835,878 | ) |
| | | | | | | | | | | | | | | | | |
| Profit before finance results and taxes | | | | | | | 920,954 | | | | 494,918 | | | | 501,818 | |
| | | | | | | | | | | | | | | | | |
| Financial expense | | | 22. | | | | (300,342 | ) | | | (180,009 | ) | | | (68,530 | ) |
| Financial income | | | 22. | | | | 117,993 | | | | 91,057 | | | | 70,851 | |
| Foreign exchange, net | | | 22. | | | | (137,373 | ) | | | (18,117 | ) | | | (66,116 | ) |
| Financial results, net | | | | | | | (319,722 | ) | | | (107,069 | ) | | | (63,795 | ) |
| | | | | | | | | | | | | | | | | |
| Profit before taxes | | | | | | | 601,232 | | | | 387,849 | | | | 438,023 | |
| | | | | | | | | | | | | | | | | |
| Income taxes | | | 16.1. | | | | | | | | | | | | | |
| Current | | | | | | | (296,652 | ) | | | (45,413 | ) | | | (81,736 | ) |
| Deferred | | | | | | | (38,596 | ) | | | 71,744 | | | | (66,177 | ) |
| | | | | | | | (335,248 | ) | | | 26,331 | | | | (147,913 | ) |
| | | | | | | | | | | | | | | | | |
| Profit for the year | | | | | | | 265,984 | | | | 414,180 | | | | 290,110 | |
| | | | | | | | | | | | | | | | | |
| Attributable to: | | | | | | | | | | | | | | | | |
| Equity holders of the parent | | | | | | | 265,694 | | | | 413,887 | | | | 287,887 | |
| Non-controlling interests | | | | | | | 290 | | | | 293 | | | | 2,223 | |
| | | | | | | | 265,984 | | | | 414,180 | | | | 290,110 | |
| | | | | | | | | | | | | | | | | |
| Earnings per share | | | | | | | | | | | | | | | | |
| Basic and diluted earnings per share | | | 23.4. | | | | R$7.60 | | | | R$11.84 | | | | R$8.23 | |
F-32
Moove Lubricants Holdings
Consolidated Statement of Other Comprehensive Income
For the years ended December 31
(In thousands of Brazilian Reais (R$), unless otherwise stated)
| | | Notes | | 2023 | | 2022 | | 2021 |
| | | | | | | | | |
| Profit for the year | | | | | | | 265,984 | | | | 414,180 | | | | 290,110 | |
| | | | | | | | | | | | | | | | | |
| Items not reclassified to profit and loss in subsequent periods | | | | | | | | | | | | | | | | |
| Actuarial gain (loss) on defined benefit plan | | | 18.2.2 | | | | 48,536 | | | | 24,984 | | | | (28,354 | ) |
| Pension obligation refundable by Cosan SA | | | | | | | (48,565 | ) | | | (24,990 | ) | | | 28,339 | |
| | | | | | | | (29 | ) | | | (6 | ) | | | (15 | ) |
| | | | | | | | | | | | | | | | | |
| Items that may be reclassified to profit and loss in subsequent periods | | | | | | | | | | | | | | | | |
| Foreign currency translation effect | | | | | | | (50,233 | ) | | | (154,893 | ) | | | 34,998 | |
| Cash flow hedge accounting reserve | | | 23.3 | | | | (490 | ) | | | (8,508 | ) | | | 7,749 | |
| | | | | | | | (50,723 | ) | | | (163,401 | ) | | | 42,747 | |
| | | | | | | | | | | | | | | | | |
| Total other comprehensive income (loss), net of tax | | | | | | | (50,752 | ) | | | (163,407 | ) | | | 42,732 | |
| | | | | | | | | | | | | | | | | |
| Total comprehensive income | | | | | | | 215,232 | | | | 250,773 | | | | 332,842 | |
| | | | | | | | | | | | | | | | | |
| Attributable to: | | | | | | | | | | | | | | | | |
| Equity holders of the parent | | | | | | | 215,367 | | | | 250,527 | | | | 330,598 | |
| Non-controlling interests | | | | | | | (135 | ) | | | 246 | | | | 2,244 | |
| | | | | | | | 215,232 | | | | 250,773 | | | | 332,842 | |
F-33
Moove Lubricants Holdings
Consolidated Statement of Changes in Equity
For the years ended December 31
(In thousands of Brazilian Reais (R$), unless otherwise stated)
| | | Notes | | Share capital | | Share premium | | Reserves | | Other Equity Components | | Equity attributable to owners of the parent | | Non-Controlling interest | | Total Equity |
| At 1 January 2021 | | | | | | | 561,085 | | | | — | | | | 1,200,032 | | | | 205,044 | | | | 1,966,161 | | | | 16,128 | | | | 1,982,289 | |
| Profit for the year | | | | | | | — | | | | — | | | | 287,887 | | | | — | | | | 287,887 | | | | 2,223 | | | | 290,110 | |
| Other comprehensive income for the period | | | | | | | — | | | | — | | | | | | | | 42,711 | | | | 42,711 | | | | 21 | | | | 42,732 | |
| Acquisition of non-controlling interests | | | | | | | — | | | | | | | | (14,925 | ) | | | 751 | | | | (14,174 | ) | | | (17,856 | ) | | | (32,030 | ) |
| At 31 December 2021 | | | | | | | 561,085 | | | | — | | | | 1,472,994 | | | | 248,506 | | | | 2,282,585 | | | | 516 | | | | 2,283,101 | |
| Profit for the year | | | | | | | — | | | | | | | | 413,887 | | | | | | | | 413,887 | | | | 293 | | | | 414,180 | |
| Other comprehensive income for the period | | | | | | | — | | | | — | | | | — | | | | (163,360 | ) | | | (163,360 | ) | | | (47 | ) | | | (163,407 | ) |
| Dividends paid | | | 23.5. | | | | — | | | | — | | | | (248,854 | ) | | | — | | | | (248,854 | ) | | | — | | | | (248,854 | ) |
| At 31 December 2022 | | | | | | | 561,085 | | | | — | | | | 1,638,026 | | | | 85,146 | | | | 2,284,258 | | | | 762 | | | | 2,285,020 | |
| Profit for the year | | | | | | | — | | | | — | | | | 265,694 | | | | — | | | | 265,694 | | | | 290 | | | | 265,984 | |
| Other comprehensive income for the period | | | | | | | — | | | | — | | | | (8,798 | ) | | | (41,529 | ) | | | (50,327 | ) | | | (425 | ) | | | (50,752 | ) |
| Dividends paid | | | 23.5. | | | | — | | | | — | | | | (246,096 | ) | | | — | | | | (246,096 | ) | | | — | | | | (246,096 | ) |
| Stock option plan | | | 17.2. | | | | — | | | | — | | | | 10,306 | | | | — | | | | 10,306 | | | | — | | | | 10,306 | |
| Corporate reorganization | | | | | | | (560,908 | ) | | | 2,256,853 | | | | (1,677,915 | ) | | | (18,030 | ) | | | — | | | | — | | | | — | |
| At 31 December 2023 | | | | | | | 177 | | | | 2,256,853 | | | | (18,783 | ) | | | 25,587 | | | | 2,263,834 | | | | 627 | | | | 2,264,461 | |
F-34
Moove Lubricants Holdings
Statement of cash flows
At December 31
(In thousands of Brazilian Reais (R$), unless otherwise stated)
| | | Notes | | 2023 | | 2022 | | 2021 |
| | | | | | | | | |
| Profit before taxes | | | | | | | 601,232 | | | | 387,849 | | | | 438,023 | |
| Adjustments to reconcile profit before taxes to net cash flows: | | | | | | | | | | | | | | | | |
| Depreciation and amortization | | | | | | | 322,183 | | | | 242,566 | | | | 97,243 | |
| Financial results, net | | | | | | | 293,222 | | | | 102,500 | | | | 61,756 | |
| Provision for legal proceedings | | | | | | | (44,587 | ) | | | 79,563 | | | | 9,030 | |
| Provision for bonus | | | | | | | 63,030 | | | | 94,036 | | | | 67,652 | |
| Miscellaneous provisions | | | | | | | 88,240 | | | | 141,838 | | | | 55,506 | |
| Extemporaneous tax credit | | | | | | | — | | | | (12,775 | ) | | | (35,246 | ) |
| Other | | | | | | | 17,309 | | | | 14,903 | | | | 2,934 | |
| | | | | | | | | | | | | | | | | |
| Working capital changes | | | | | | | | | | | | | | | | |
| (Increase) in trade receivables | | | | | | | (33,665 | ) | | | (212,864 | ) | | | (127,277 | ) |
| (Increase) decrease in inventories | | | | | | | 125,826 | | | | (421,425 | ) | | | (226,949 | ) |
| (Increase) decrease in advances to suppliers | | | | | | | 33,128 | | | | (54,094 | ) | | | 85,738 | |
| Increase (decrease) in trade payables | | | | | | | (28,226 | ) | | | 624,192 | | | | 133,866 | |
| Increase (decrease) in other payables and other current liabilities | | | | | | | (63,240 | ) | | | (68,890 | ) | | | 6,557 | |
| Derivative financial instruments | | | | | | | 7,842 | | | | (21,020 | ) | | | — | |
| Related parties | | | | | | | (211,219 | ) | | | 99,064 | | | | (69,899 | ) |
| Employee benefits | | | | | | | (78,633 | ) | | | (67,942 | ) | | | (33,515 | ) |
| Income tax | | | | | | | (107,724 | ) | | | 21,598 | | | | (105,262 | ) |
| Other taxes | | | | | | | 193,524 | | | | 34,351 | | | | 56,518 | |
| Contingent liabilities | | | | | | | (115,142 | ) | | | (73,824 | ) | | | (13,864 | ) |
| Judicial deposits | | | | | | | 37,924 | | | | (24,309 | ) | | | (16,341 | ) |
| Strategic alliance tax transaction¹ | | | | | | | — | | | | — | | | | (208,118 | ) |
| Strategic alliance fees | | | | | | | (48,008 | ) | | | (47,240 | ) | | | (51,722 | ) |
| Other non-current assets and liabilities, net | | | | | | | 95,739 | | | | (39,741 | ) | | | (40,225 | ) |
| | | | | | | | | | | | | | | | | |
| Interest paid | | | | | | | (176,393 | ) | | | (79,478 | ) | | | (20,708 | ) |
| Interest received | | | | | | | 74,119 | | | | 30,668 | | | | 13,547 | |
| Income tax paid | | | | | | | (38,000 | ) | | | (49,501 | ) | | | (19,523 | ) |
| Net Cash flows from operating activities | | | | | | | 1,008,481 | | | | 700,025 | | | | 59,721 | |
| | | | | | | | | | | | | | | | | |
| Acquisition of subsidiaries net of cash acquired | | | 10. | | | | — | | | | (2,392,650 | ) | | | — | |
| Acquisition of property, plant and equipment and intangible assets | | | 11./12. | | | | (188,719 | ) | | | (109,264 | ) | | | (42,670 | ) |
| Marketable securities | | | | | | | (3,167 | ) | | | 89,106 | | | | 43,610 | |
| Other investing movements | | | | | | | (331 | ) | | | 15,976 | | | | 152 | |
| Net cash flows (used in) generated from investing activities | | | | | | | (192,217 | ) | | | (2,396,832 | ) | | | 1,092 | |
| | | | | | | | | | | | | | | | | |
| Proceeds from borrowings | | | 14. | | | | — | | | | 2,229,887 | | | | 418,666 | |
| Repayment of borrowings – principal | | | 14. | | | | (469,398 | ) | | | (272,252 | ) | | | (431,549 | ) |
| Derivative financial instruments – debt | | | | | | | (53,553 | ) | | | (27,730 | ) | | | 26,149 | |
| Payment of lease liabilities – principal | | | 13. | | | | (48,171 | ) | | | (30,537 | ) | | | (11,031 | ) |
| Dividends paid | | | 23.5. | | | | (246,096 | ) | | | (248,855 | ) | | | — | |
| Proceeds from shareholder contribution | | | | | | | — | | | | — | | | | 69,155 | |
| Acquisition of non-controlling interest | | | | | | | — | | | | — | | | | (32,030 | ) |
| Net cash flows (used in) generated from financing activities | | | | | | | (817,218 | ) | | | 1,650,513 | | | | 39,360 | |
| | | | | | | | | | | | | | | | | |
| Net (decrease) increase in cash and cash equivalents | | | | | | | (91,819 | ) | | | (194,496 | ) | | | 123,521 | |
| Effects of exchange rate changes on cash and cash equivalents | | | | | | | (90,865 | ) | | | (148,202 | ) | | | 23,348 | |
| Cash and cash equivalents at 1 January | | | | | | | 865,370 | | | | 1,059,866 | | | | 936,345 | |
| | | | | | | | | | | | | | | | | |
| Cash and cash equivalents at 31 December | | | | | | | 773,551 | | | | 865,370 | | | | 1,059,866 | |
¹ On October 19, 2021, under the Amendment to the Sale and Purchase of Member Interests, Cosan S.A. and ExxonMobil International Holdings B.V. agreed on the payment made by Cosan Lubrificantes e Especialidades S.A. (CLE) of R$ 208,118 related to tax credits granted during the Tax Optimization Program that CLE has entered into. The payment was made on October 29, 2021 and CLE has now the full right of these tax credits.
Non-cash transactions
The Group presents cash flows using the indirect method. The Group had the following non-cash transactions that are not reflected in the statement of cash flows:
| i) | Additions to right-of-use assets and lease liabilities of R$101,366 in the year ended December 31, 2023 (R$35,584 in the year ended December 31, 2022 and R$23,625 in the year ended December 31, 2021), for changes in future payments that depend on inflation indices and for new leases (Note 13). |
F-35
Moove Lubricants Holdings
Notes to the consolidated financial statements
For the years ended December 31, 2023, 2022 and 2021
(In thousands of Brazilian Reais (R$), unless otherwise stated)
1. General information
The consolidated financial statements of Moove Lubricants Holdings (the “Company”) and its subsidiaries (collectively, the “Group”) for the years ended December 31, 2023, 2022 and 2021 were authorized for issue in accordance with a resolution of the Board of Directors on July 8, 2024.
Moove Lubricants Holdings is an exempt company with limited liability formed under the laws of the Cayman Islands. The registered number is MC-403038 and the registered address is PO Box 309, Ugland House, Grand Cayman, KY1-1104. The Group is principally engaged in the manufacturing, distribution and trading of lubricants solutions for automotive, industrial and retail customers throughout South and North America and Europe.
1.1. Operational context
The Group is headquartered in Brazil and is one of the largest manufacturers and distributors of high-performance lubricants, base oils and specialties in the world, which has been consolidating itself as a relevant global player present in 11 countries in South America, North America, and Europe, providing products and services that are essential for moving people and business in industrial, commercial and passenger/cargo vehicles markets.
The Group operates 5 manufacturing plants globally located in Brazil, the United Kingdom, and the United States of America and more than 90 warehouses in the three regions. The Group blends, distributes, and sells lubricants and specialties under Mobil and proprietary brands.
The Company is a private limited company registered in the Cayman Islands that acts as an investment holding company, with the objective of investing in and supporting its subsidiaries. The Company is controlled by Cosan S.A., a Brazilian company listed on the New York Stock Exchange (NYSE) and on the São Paulo Stock, Commodities and Futures Exchange (B3 S.A. – Brasil, Bolsa, Balcão). The ultimate controlling shareholder is Mr. Rubens Ometto Silveira Mello.
1.2. Corporate and business events
The Group experienced events which played a strategic and important role in its business objectives. The main events are described below.
Corporate reorganization
On October 31, 2023, a corporate reorganization was completed, whereby Cosan Lubes Investments Limited, a private limited company incorporated under the laws of England and Wales, or CLI, which was previously the parent company of the Group, contributed its interest in its subsidiaries and remaining cash to Moove Lubricants Holdings, in consideration for common shares issued by Moove Lubricants Holdings.
As of October 31, 2023, the new parent company of the Group is Moove Lubricants Holdings with 34,963,764 shares issued at a nominal value of US$0.001 each.
IFRS provides no guidelines for the accounting of corporate reorganizations among entities under common control, as such, based on the guidance of International Accounting Standards (“IAS”) 8, Accounting Policies, Changes in Accounting Estimates and Errors, paragraphs 10 through 12, the Company developed and applied and accounting policy, considering the most recent pronouncements of
F-36
Moove Lubricants Holdings
Notes to the consolidated financial statements
For the years ended December 31, 2023, 2022 and 2021
(In thousands of Brazilian Reais (R$), unless otherwise stated)
other standard-setting bodies that use a similar conceptual framework to develop accounting standards other accounting literature and industry practices.
As a result, the Company accounted for the corporate reorganization using the predecessor method of accounting, and these consolidated financial statements are presented “as if” CLI is the predecessor of the Company. Under the predecessor method, the historical operations of CLI are deemed to be those of the Company. Thus, these consolidated financial statements reflect:
| i) | the historical operating results and financial position of CLI prior to the corporate reorganization; |
| ii) | the consolidated results and financial position of the Company following the corporate reorganization; |
| iii) | the assets and liabilities of the Company at their historical cost; |
| iv) | the number of ordinary shares outstanding of the Company is the same as had been issue by CLI. |
External conflicts
With respect to the war between Russia and Ukraine and also instability in the Middle East, we analyzed the possible direct and indirect impacts on Group's operations and concluded there is no significant impact on operations and no indication of continuity problems for the business or material impacts in the medium and long term in macroeconomic indicators that may influence in the Group's financial projections, to the point of causing impairment of assets.
Inventory fire
On October 16, 2022, a fire broke out in the warehouse of a distributor located in Piracicaba (São Paulo - Brazil) in which a portion of the Group’s finished product inventories was stored. The Group, together with its insurance broker, assessed the total cost of inventory of the damaged products at R$ 61,548. In July 2023the Group received insurance claim proceeds of R$ 30,785 under its former operational risk insurance policy for these damaged products, fire containment expenses, taxes and office equipment.
In August 2021, there was a fire in the industrial condominium located in Jaboatão dos Guararapes (Pernambuco – Brazil), where a portion of the Group’s finished goods inventories was stored. During 2022, the Group received insurance claim proceeds of R$6,913 that covered 100% of the value of the damaged items.
On March 31, 2021, a fire broke out in a leased warehouse in the USA where a portion of the finished goods inventories of the subsidiary Moove Corp, was stored. During 2022, insurance claim proceeds of R$ 14,568 (R$ 53,896 in 2021) were received related to this event. As the subsidiary has general liability and property (with business interruption), an agreement was reached with the insurer to receive in 2024 a total amount of R$ 4,059 thereby resulting in the recovery of 100% of the loss.
Business acquisitions
On May 23, 2022, one of the Company’s wholly owned subsidiaries, Millennium Moove Corp, acquired 100% of Stryker Intermediate Holdings and its operating subsidiaries (“PetroChoice”), a Delaware corporation. PetroChoice specializes in the blending, distribution and sale of lubricants and related product solutions, serving a wide range of customers in the industrial, commercial and passenger vehicle segments. PetroChoice is one of the largest lubricant distributors in the United States, operating 50
F-37
Moove Lubricants Holdings
Notes to the consolidated financial statements
For the years ended December 31, 2023, 2022 and 2021
(In thousands of Brazilian Reais (R$), unless otherwise stated)
strategically located distribution centers across 25 US states. PetroChoice has strategic partnerships with major brands and also has a comprehensive offering of its own branded products. The total consideration for this acquisition was R$ 2,342,820 and goodwill of R$ 400,196 was recognized.
On May 31, 2022, Cosan Lubrificantes e Especialidades S.A. (“CLE”), a wholly owned subsidiary, acquired 100% of the shares of Tirreno Indústria e Comércio de Produtos Químicos Ltda (“Tirreno”), a Brazilian chemical company that has been active since 1967 in the industrial oils market, producing and selling protective, cutting, grinding, and stamping oils, among others, and supplying the automotive, steel, and metal-mechanic industries in general. Tirreno has also been active in the automotive fluids market since 1990, focusing on the supply of brake fluids, hydraulic clutch fluids, and additives for radiators. The total consideration for the acquisition was R$ 85,188 and goodwill of R$ 1,238 was recognized.
2. General Accounting Policies
2.1. Basis of preparation
The consolidated financial statements of the Group have been prepared in accordance with International Financial Reporting Standards (IFRS) as issued by the International Accounting Standards Board (IASB).
The consolidated financial statements have been prepared on a historical cost basis, except for the financial assets and liabilities measured at fair value.
The consolidated financial statements are presented in Brazilian Reais and all amounts are rounded to the nearest thousand, unless otherwise stated.
The preparation of these financial statements requires the use of relevant accounting estimates as well as the exercise of judgment by management in the process of applying the accounting policies. Areas that require greater judgment and that are more complex, as well as areas in which assumptions and estimates are significant to the financial statements are disclosed in Note 2.6.
The Group has prepared the financial statements on the basis that it will continue to operate as a going concern.
2.2. New and amended standards and interpretations
2.2.1. New and amended standards and interpretations effective from 1 January 2023
The following standards and amendments to standards are effective from January 1, 2023, none of which had any significant impact to the Group’s consolidated financial statements:
| I. | IFRS 17 – Insurance Contracts. |
| II. | Amendments to IAS 8 – Definition of Accounting Estimates. |
| III. | Amendments to IAS 1 and IFRS Practice Statement 2 – Disclosure of Accounting Policies. |
| IV. | Amendment to IAS 12 – Deferred Tax related to Assets and Liabilities arising from a Single Transaction. |
| V. | Amendment to IAS 12 – International Tax Reform—Pillar Two Model Rules. |
F-38
Moove Lubricants Holdings
Notes to the consolidated financial statements
For the years ended December 31, 2023, 2022 and 2021
(In thousands of Brazilian Reais (R$), unless otherwise stated)
2.2.2. Standards issued but not yet effective
The Group has not early adopted any standard, interpretation or amendment that has been issued but is not yet effective. For annual reporting periods beginning on or after January 1, 2024 the following amendments are expected to be adopted:
| I. | Amendments to IAS 1 - Presentation of Financial Statements – “Classification of Liabilities as Current or Non-current”: The amendments provide a more general approach to the classification of liabilities under IAS 1 based on the contractual arrangements in place at the reporting date. The amendments are effective for annual reporting periods beginning on or after January 1, 2024 and must be applied retrospectively. |
| II. | Amendments to IFRS 16: Lease Liability in a Sale and Leaseback - In September 2022, the IASB issued amendments to IFRS 16 to specify the requirements that a seller-lessee use in measuring the lease liability arising in a sale and leaseback transaction, to ensure the seller-lessee does not recognize any amount of the gain or loss that relates to the right of use it retains. The amendments are effective for annual reporting periods beginning on or after January 1, 2024 and must applied retrospectively to sale and leaseback transactions entered into after the date of initial application of IFRS 16. |
| III. | Amendments to IAS 7 – Supplier Finance Arrangements - In May 2023, the IASB issued amendments to IAS 7: The amendments require disclosures to clarify the characteristics of supplier finance arrangements and require additional disclosure of such arrangements. The disclosure requirements in the amendments are intended to assist users of financial statements in understanding the effects of supplier finance arrangements on an entity’s liabilities, cash flows and exposure to liquidity risk. The amendments will be effective for annual reporting periods beginning on or after January 1, 2024. |
| IV. | Amendments to IAS 21: Lack of Exchangeability: In August 2023, the IASB issued an amendment to IAS 21. An entity is impacted by the amendments when it has a transaction or an operation in a foreign currency that is not exchangeable into another currency at a measurement date for a specified purpose. A currency is exchangeable when there is an ability to obtain the other currency (with a normal administrative delay), and the transaction would take place through a market or exchange mechanism that creates enforceable rights and obligations. The amendment will be effective for annual reporting periods beginning on or after January 1, 2025, with early adoption available. |
As of the date of issuance of these consolidated financial statements, the Group has not identified any significant impacts that will arise from the adoption of the amendments listed above.
2.3. Basis of consolidation method
The consolidated financial statements of the Group comprise the financial statements of the Company and its subsidiaries as at December 31, 2023 and 2022 and for the years ended December 31, 2023, 2022 and 2021.
The Group controls an entity when it is exposed to, or has rights to, variable returns from its involvement with the entity and has the ability to affect those returns through its power over the entity. The acquisition date is the date on which control is transferred to the acquirer. The financial results of subsidiaries are included in the consolidated financial statements from the date that control commences until the date that control ceases.
F-39
Moove Lubricants Holdings
Notes to the consolidated financial statements
For the years ended December 31, 2023, 2022 and 2021
(In thousands of Brazilian Reais (R$), unless otherwise stated)
Changes to the Company’s interest in subsidiaries and transactions with non-controlling shareholders - that do not generate loss of control - are accounted for in equity.
Intra-group balances and transactions, including any unrealized income and expenses, are eliminated upon consolidation. Unrealized losses are eliminated in the same way as unrealized gains, but only to the extent that there is no evidence of impairment. Losses applicable to the non-controlling interests in a subsidiary are allocated to non-controlling interests even if doing so causes the non-controlling interests to have a deficit balance.
The entities included in the Group’s consolidated financial statements are:
Interest of Parent Company in its controlled entities | | Region | | 12/31/2023 | | 12/31/2022 | | 12/31/2021 |
| Airport Energy Limited | | United Kingdom | | | 100.00 | % | | | 100.00 | % | | | 100.00 | % |
| Airport Energy Services Limited | | United Kingdom | | | 100.00 | % | | | 100.00 | % | | | 100.00 | % |
| Comma Oil & Chemicals Marketing BV | | Netherlands | | | 100.00 | % | | | 100.00 | % | | | 100.00 | % |
| Comma Oil & Chemicals Marketing LLC | | Russia | | | 100.00 | % | | | 100.00 | % | | | 100.00 | % |
| Comma Oil & Chemicals Marketing SLR¹ | | Romania | | | 0.00 | % | | | 0.00 | % | | | 100.00 | % |
Comma Otomotiv Yag Ve Kimyasallari
Pazarlama Limited Sirketi¹ | | Turkey | | | 0.00 | % | | | 0.00 | % | | | 100.00 | % |
| Commercial Lubrificants Moove Corp | | United States of America | | | 100.00 | % | | | 100.00 | % | | | 100.00 | % |
| Cosan Cinco S.A. | | Brazil | | | 100.00 | % | | | 100.00 | % | | | 100.00 | % |
| Cosan Lubrificantes e Especialidades S.A. | | Brazil | | | 100.00 | % | | | 100.00 | % | | | 100.00 | % |
| Cosan Lubrificantes España S.L.U. | | Spain | | | 100.00 | % | | | 100.00 | % | | | 100.00 | % |
| Cosan Lubrificantes S.R.L | | Argentina | | | 100.00 | % | | | 100.00 | % | | | 100.00 | % |
| Cosan Paraguay Sociedad Anonima | | Paraguay | | | 97.50 | % | | | 97.50 | % | | | 97.50 | % |
| Cosan U.S. Inc. | | United States of America | | | 100.00 | % | | | 100.00 | % | | | 100.00 | % |
Ilha Terminal Distribuição de Produtos
Químicos Ltda | | Brazil | | | 100.00 | % | | | 100.00 | % | | | 100.00 | % |
Lubigrupo II - Comércio e Distribuição
de Lubrificantes S.A. | | Portugal | | | 100.00 | % | | | 100.00 | % | | | 100.00 | % |
| Millennium Moove Corp² | | United States of America | | | 100.00 | % | | | 100.00 | % | | | 0.00 | % |
| Miller Industrial Fluids LLC³ | | United States of America | | | 0.00 | % | | | 100.00 | % | | | 0.00 | % |
| Moove Lubricants Limited | | United Kingdom | | | 100.00 | % | | | 100.00 | % | | | 100.00 | % |
| Petrochoice Dynamo LLC² | | United States of America | | | 100.00 | % | | | 100.00 | % | | | 0.00 | % |
| Petrochoice Holdings INC² | | United States of America | | | 100.00 | % | | | 100.00 | % | | | 0.00 | % |
| Petrochoice LLC² | | United States of America | | | 100.00 | % | | | 100.00 | % | | | 0.00 | % |
| Petrochoice Transport² | | United States of America | | | 100.00 | % | | | 100.00 | % | | | 0.00 | % |
| Stanbridge Group Limited | | United Kingdom | | | 100.00 | % | | | 100.00 | % | | | 100.00 | % |
| Stryker Intermediate Holdings³ | | United States of America | | | 0.00 | % | | | 100.00 | % | | | 0.00 | % |
| Stryker Parent Corp³ | | United States of America | | | 0.00 | % | | | 100.00 | % | | | 0.00 | % |
Techniques ET Technologies
Appliquees SAS | | France | | | 100.00 | % | | | 100.00 | % | | | 100.00 | % |
| The Lubricant Store LLC² | | United States of America | | | 100.00 | % | | | 100.00 | % | | | 0.00 | % |
Tirreno Indústria e Comércio de
Produtos Químicos LTDA² | | Brazil | | | 100.00 | % | | | 100.00 | % | | | 0.00 | % |
| Wessex Petroleum Limited | | United Kingdom | | | 100.00 | % | | | 100.00 | % | | | 100.00 | % |
¹ Companies terminated and merged into their immediate parent company in 2022.
² Business combination occurred in 2022 as per Note 10.
³ Companies terminated and merged into their immediate parent company in 2023.
2.4. Functional and presentation currency
The consolidated financial statements are presented in Brazilian Reais (R$). The functional currency of the Company is the U.S. Dollar (US$). The main functional currencies for subsidiaries located outside of
F-40
Moove Lubricants Holdings
Notes to the consolidated financial statements
For the years ended December 31, 2023, 2022 and 2021
(In thousands of Brazilian Reais (R$), unless otherwise stated)
the Cayman Islands are the Brazilian Real (R$), U.S. Dollar (US$), Pound Sterling (£), Euro (€) and Argentine Peso ($).
Transactions in foreign currency are converted into the respective functional currencies of each subsidiary using the exchange rates on the date of the transactions. Monetary assets and liabilities denominated in foreign currencies are converted into the functional currency at the exchange rate determined at the reporting date. Foreign exchange differences arising on translation are recognized in the profit or loss.
On consolidation, the assets and liabilities of foreign operations are translated into Brazilian Reais, the Group’s presentation currency at the rate of exchange prevailing at the reporting date and their statements of profit or loss are translated at exchange rates prevailing at the dates of the transactions. The exchange differences arising on translation for consolidation are recognized in other comprehensive income (“OCI”). On disposal of a foreign operation, the component of OCI relating to that foreign operation is reclassified to profit or loss.
Any goodwill arising on the acquisition of a foreign operation and any fair value adjustments to the carrying amounts of assets and liabilities arising on the acquisition are treated as assets and liabilities of the foreign operation and translated at the spot rate of exchange at the reporting date.
The foreign currency denominated assets, liabilities, equity, income and expenses of hyperinflation entities are converted at the exchange rate on the reporting date.
Exchange differences arising from this translation of foreign operations and financial instruments designated as hedge instruments are reported as an item of OCI and accumulated as a translation reserve.
2.5. Hyperinflationary economies
Argentina was classified as a hyperinflationary economy in 2018. As the Group has operations in Argentina (Cosan Lubricantes S.R.L), whose functional currency is the Argentine Peso, it applies IAS 29 - Financial Reporting in Hyperinflationary Economies for those operations.
Non-monetary assets and liabilities, shareholders' equity and the statement of profit or loss of subsidiaries that operate in highly inflationary economies are restated by the change in the general purchasing power of the currency, applying a general inflation index accepted for the country to restate the information reported.
The amount recognized in profit or loss as monetary variation is (R$ 5,999) in 2023 (R$ 360 in 2022 and R$ 2,167 in 2021). The effect on OCI is not material. In 2023, the inflation index presented by the resolution JG 533/19 of the Argentinian Federation of Professional Councils of Economic Sciences (FACPCE1) was 211% (95% in 2022 and 51% in 2021).
When the economy is no longer considered hyperinflationary and the investee discontinues the preparation and presentation of its financial information in accordance with IAS 29, the monetarily adjusted amounts become the base carrying amount for subsequent periods.
1 FACPCE: entity which prescribes the indices to be used by entities with a functional currency of the Argentine peso for the application of the restatement procedures.
F-41
Moove Lubricants Holdings
Notes to the consolidated financial statements
For the years ended December 31, 2023, 2022 and 2021
(In thousands of Brazilian Reais (R$), unless otherwise stated)
2.6. Use of judgments and estimates
To prepare the consolidated financial statements in accordance with IFRS, management is required to make judgments, estimates and assumptions that affect the application of accounting policies and the reported amounts of assets, liabilities, revenue, and expenses at the end of the reporting period. Actual results may differ from these estimates.
Estimates and underlying assumptions are reviewed on an ongoing basis and changes are recognized prospectively. Information about critical judgments, assumptions, and estimation uncertainties in applying accounting policies that have the most significant effect on the amounts recognized in the consolidated financial statements is listed below:
| I. | 2.8. – Impairment of goodwill and long-term non-financial assets |
| II. | 2.10. – Measurements of financial instruments |
| III. | 10. – Business combination |
| IV. | 16.1. – Income tax (current and deferred) |
| V. | 18.2. – Post-employment benefits |
| VI. | 19. – Contingent liabilities and deposits |
2.7. Segment information
The operating segments reflect the Group's management structure and the way in which financial information is regularly reviewed by the Group's Chief Operating Decision Maker (CODM), which is the Chief Executive Officer (CEO).
The CODM reviews operating results and makes capital allocation decisions based on business from a geographic region perspective. Geographic regions that meet the quantitative threshold of 10% of total sales for all operating segments are presented independently as reportable segments, of which there are currently three:
South America: Consists mainly of results from the production of lubricants and additives and distribution of base oils, lubricants and additives sold in Argentina, Bolivia, Brazil, Paraguay, Uruguay.
North America: Consists mainly of results arising from the production of lubricants and distribution of lubricants and fuels sold within the United States of America.
Europe: Consists mainly of results arising from the production of lubricants and distribution of lubricants and fuels sold within Europe and exported to Asia.
The CODM separately monitors the operating results of the segments to be able to make decisions about resource allocation and performance assessment. The performance of the segments is evaluated based on Earnings Before Interest, Taxes, Depreciation and Amortization (EBITDA). The Group's financial results and taxes on profit are managed at the Group level and are not allocated to individual operating segments. Other Statement of Profit and Loss, Statement of Financial Position and Cash Flow Statement lines items are not provided to or monitored by the CODM on a regular basis; and are therefore not disclosed.
Transfer prices between operating segments are determined independently, in a similar way to transactions carried out with third parties. Transactions between segments are eliminated at the buyer
F-42
Moove Lubricants Holdings
Notes to the consolidated financial statements
For the years ended December 31, 2023, 2022 and 2021
(In thousands of Brazilian Reais (R$), unless otherwise stated)
segment. Corporate overhead expenses are allocated to the South America segment, as the headquarters of the Group and senior management are located in Brazil.
No impairment loss or reversal was identified in any segment during the years, please refer to Note 2.9. for further information on impairment procedures. No changes regarding the segment information provided regularly to the CODM have arisen from the corporate reorganization described in Note 1.2.
| | | 2023 |
| | | South America | | North America | | Europe | | Consolidated |
| Revenue | | | 4,571,775 | | | | 2,456,686 | | | | 3,045,713 | | | | 10,074,174 | |
| Cost of sales and services and operating expenses | | | (3,790,884 | ) | | | (2,425,174 | ) | | | (2,937,162 | ) | | | (9,153,220 | ) |
| Profit before finance results and taxes | | | 780,891 | | | | 31,512 | | | | 108,551 | | | | 920,954 | |
| (-) Depreciation and amortization | | | 44,773 | | | | 241,348 | | | | 36,062 | | | | 322,183 | |
| EBITDA | | | 825,664 | | | | 272,860 | | | | 144,613 | | | | 1,243,137 | |
| Financial results, net | | | | | | | | | | | | | | | (319,722 | ) |
| Income taxes | | | | | | | | | | | | | | | (335,248 | ) |
| Profit for the year | | | | | | | | | | | | | | | 265,984 | |
| | | 2022 |
| | | South America | | North America | | Europe | | Consolidated |
| Revenue | | | 4,016,079 | | | | 1,763,610 | | | | 3,106,597 | | | | 8,886,286 | |
| Cost of sales and services and operating expenses | | | (3,507,137 | ) | | | (1,863,528 | ) | | | (3,020,703 | ) | | | (8,391,368 | ) |
| Profit (loss) before finance results and taxes | | | 508,942 | | | | (99,918 | ) | | | 85,894 | | | | 494,918 | |
| (-) Depreciation and amortization | | | 41,367 | | | | 163,812 | | | | 37,387 | | | | 242,566 | |
| EBITDA | | | 550,309 | | | | 63,894 | | | | 123,281 | | | | 737,484 | |
| Financial results, net | | | | | | | | | | | | | | | (107,069 | ) |
| Income taxes | | | | | | | | | | | | | | | 26,331 | |
| Profit for the year | | | | | | | | | | | | | | | 414,180 | |
| | | 2021 |
| | | South America | | North America | | Europe | | Consolidated |
| Revenue | | | 3,372,056 | | | | 71,117 | | | | 2,593,528 | | | | 6,036,701 | |
| Cost of sales and services and operating expenses | | | (2,923,673 | ) | | | (83,705 | ) | | | (2,527,506 | ) | | | (5,534,883 | ) |
| Profit (loss) before finance results and taxes | | | 448,383 | | | | (12,588 | ) | | | 66,022 | | | | 501,818 | |
| (-) Depreciation and amortization | | | 41,060 | | | | 13,171 | | | | 43,012 | | | | 97,243 | |
| EBITDA | | | 489,443 | | | | 583 | | | | 109,034 | | | | 599,060 | |
| Financial results, net | | | | | | | | | | | | | | | (63,795 | ) |
| Income taxes | | | | | | | | | | | | | | | (147,913 | ) |
| Profit for the year | | | | | | | | | | | | | | | 290,110 | |
2.8. Impairment of goodwill and long-term non-financial assets
Non-financial assets with indefinite useful lives, such as goodwill, are not subject to amortization and are tested for impairment at least annually. Assets that are subject to depreciation/amortization are reviewed for indicators of impairment annually and whenever events or changes in circumstances indicate that the carrying amount may not be recoverable.
F-43
Moove Lubricants Holdings
Notes to the consolidated financial statements
For the years ended December 31, 2023, 2022 and 2021
(In thousands of Brazilian Reais (R$), unless otherwise stated)
In accordance with IAS 36, an impairment loss is recognized in profit or loss for the amount by which the asset’s carrying amount exceeds its recoverable amount. The recoverable amount is the higher of an asset’s fair value less cost of disposal and its value in use.
The recoverable amount is determined for an individual asset, unless the asset does not generate cash inflows independently of those of other assets or groups of assets. If this is the case, the recoverable amount is determined for the cash-generating unit (CGU) to which the asset belongs. Goodwill arising on acquisitions is allocated to a CGU or group of CGUs, with each CGU or group of CGUs being the lowest level at which goodwill is monitored for internal management purposes and not being larger than an operating segment.
The value in use of a CGU is calculated based on a discounted cash flow model using pre-tax cash flow projections based on financial budgets approved by management covering a five-year period and that the Group is not yet committed to or significant future investments that will enhance the performance of the assets of the CGU being tested.
Cash flows beyond the five-year period are extrapolated into perpetuity using the final year of the cash flow projections. The perpetuity growth rates used do not exceed the long-term average growth rate for the corresponding business.
2.8.1. Identification of the cash generating unit (“CGU”)
The identification of a cash-generating unit of the asset involves judgment. If the recoverable amount cannot be determined for an individual asset, the Group must identify the smallest aggregate of assets that generates largely independent cash inflows.
Management monitors and makes decisions about operations by assessment of its cross-business segments in each region where it operates.
Corporate assets are allocated to each CGU under review.
The identified CGUs or group of CGUs to which Goodwill is allocated are South America (Cosan Lubrificantes e Especialidades S.A., Cosan Lubrificantes S.R.L, Cosan Paraguay Sociedad Anonima, and Ilha Terminal Distribuição de Produtos Químicos Ltda), BR Fluids (Tirreno Indústria e Comércio de Produtos Químicos LTDA), North America, UK Lubes, UK Fuels, France and Portugal. Spain is a CGU to which no goodwill is allocated.
2.8.2. Key assumptions
The determination of the recoverable amount of an asset depends on certain key assumptions, which are influenced by the market, technological and economic conditions in force at the time of the impairment test, therefore it is impossible to determine whether impairments charges will occur in the future and, if they do, whether they will be material.
The key assumptions for the first year of the model consider the inflation and the GDP growth of the region in which the CGU is located together with the Group’s strategies and market opportunities. The key assumptions considered for the remaining years of the model are related to inflation, and the industry’s long term growth rate. The discount rate used is the WACC of the CGU, for which the key assumptions are: risk-free rate (the rate of return of an investment with no risk of loss), market risk premium (an excess return earned for an investment in the stock market over a risk-free rate) and inflation. Most of the assumptions are obtained from external sources of information.
F-44
Moove Lubricants Holdings
Notes to the consolidated financial statements
For the years ended December 31, 2023, 2022 and 2021
(In thousands of Brazilian Reais (R$), unless otherwise stated)
In 2023, no changes were made on the key assumptions on which management based its determination of the cash generating unit's value in use.
| | | | | 2023 | | 2022 |
| | | | | Pre-Taxes | | Pre-Taxes |
| CGU | | Currency | | Nominal WACC | | Growth Rate (Inflation) | | Nominal WACC | | Growth Rate (Inflation) |
| South America | | | R$ | | | | 16.52 | % | | | 3.76 | % | | | 17.30 | % | | | 3.90 | % |
| BR Fluids | | | R$ | | | | 15.88 | % | | | 3.76 | % | | | 15.80 | % | | | 3.90 | % |
| North America | | | US$ | | | | 8.51 | % | | | 2.00 | % | | | 8.50 | % | | | 2.30 | % |
| France | | | € | | | | 9.83 | % | | | 2.08 | % | | | 10.80 | % | | | 3.00 | % |
| Portugal | | | € | | | | 10.36 | % | | | 1.90 | % | | | 12.80 | % | | | 3.00 | % |
| Spain | | | € | | | | 11.34 | % | | | 1.96 | % | | | 12.90 | % | | | 3.00 | % |
| UK Fuels | | | £ | | | | 8.99 | % | | | 2.00 | % | | | 9.70 | % | | | 2.60 | % |
| UK Lubes | | | £ | | | | 9.42 | % | | | 2.00 | % | | | 10.30 | % | | | 2.60 | % |
The Group performed a sensitivity analysis on the key assumptions used and concluded that no impairment would result from a reasonably possible change in key assumptions.
2.8.3. Impairment test for the period
The future cash flows were determined considering (i) projected EBITDA (Earnings Before Interest, Tax, Depreciation, and Amortization) for the cash-generating unit, for a period of 5 years, adjusted by other material operational cash items and recurrent capital expenditure, (ii) the CGU’s discount rate (WACC) before taxes, and (iii) a perpetuity growth rate beyond 5 years is calculated using projected inflation per region.
The carrying amounts of goodwill acquired through business combinations and trademarks with indefinite useful lives allocated to each of the CGUs is as follows:
| | | 12/31/2023 | | 12/31/2022 |
| | | Goodwill | | Trademarks | | Goodwill | | Trademarks |
| South America | | | 582,805 | | | | — | | | | 582,805 | | | | — | |
| BR Fluids | | | 1,238 | | | | 2,439 | | | | 1,238 | | | | 2,439 | |
| UK Lubes | | | 62,077 | | | | 47,015 | | | | 63,286 | | | | 47,931 | |
| UK Fuels | | | 67,838 | | | | — | | | | 69,159 | | | | — | |
| France | | | 32,166 | | | | — | | | | 32,859 | | | | — | |
| Portugal | | | 8,597 | | | | — | | | | 8,764 | | | | — | |
| USA | | | 499,333 | | | | 96,826 | | | | 538,155 | | | | 104,354 | |
| Total | | | 1,254,054 | | | | 146,280 | | | | 1,296,266 | | | | 154,724 | |
For the years ended December 31, 2023, 2022 and 2021, no impairment charge was recognized.
2.9. Financial risk management
The Group's activities expose it to several financial risks: (a) market risk (including foreign exchange risk currency and interest rate risk); (b) credit risk and (c) liquidity risk. The products and services offered by
F-45
Moove Lubricants Holdings
Notes to the consolidated financial statements
For the years ended December 31, 2023, 2022 and 2021
(In thousands of Brazilian Reais (R$), unless otherwise stated)
the Group are denominated in several currencies due to its global positioning, and potential risks of currency mismatches between income and costs can arise.
The Group has loans linked to different index and denominated in foreign currencies, which may have an impact on its cash flows (Note 14.).
Our management has overall responsibility for the establishment and oversight of our risk management framework. Our board of directors has established the risk management committee, which is responsible for developing and monitoring our risk management policies. The committee reports to our board of directors on its activities.
Our risk management policies are established to identify and analyze the risks that we face, to set appropriate risk limits and controls and to monitor risks and adherence to limits. Risk management policies and systems are reviewed to reflect changes in market conditions and our activities. Our management, through its training, standards and procedures, aims to maintain a disciplined and constructive control environment.
Our hedging strategy primarily seeks to protect our cash flows from risks arising from exchange rate fluctuations on raw materials purchases.
2.9.1. Market risk
2.9.1.1. Foreign exchange risk
Foreign exchange risk is the exposure of the Group to significant fluctuations in currency exchange rates for commercial, operational and financial relationships that consequently have an impact on its cash flows or results.
The group has assets and liabilities denominated in foreign at the end of the reporting period. The most relevant amounts are trade and other payables and loans and borrowings, and foreign currency transactions are mostly in US Dollars.
The main risk factors with an impact on the pricing of these amounts are the exposure to the fluctuations of the foreign currencies. The scenarios for these factors are prepared using market data and considers the average and maximum absolute monthly variation of the pool of currencies under analysis for the last twelve months (LTM). The sensitivity to a reasonably possible change in exchange rates for the main currencies to which the Group is exposed as of December 31, 2023 and 2022 are presented below:
| | | | | Average LTM | | Maximum LTM |
| Changes in FX rate | | | Net exposure | | | | +2% ¹ | | | | -2% ¹ | | | | +5% ² | | | | -5% ² | |
| US$ | | | (196,503 | ) | | | (200,433 | ) | | | (192,573 | ) | | | (206,328 | ) | | | (186,678 | ) |
| € | | | (17,325 | ) | | | (17,672 | ) | | | (16,979 | ) | | | (18,191 | ) | | | (16,459 | ) |
| £ | | | 889 | | | | 907 | | | | 871 | | | | 933 | | | | 845 | |
| kr$ | | | 94 | | | | 96 | | | | 92 | | | | 99 | | | | 89 | |
| On December 31, 2023 | | | (212,845 | ) | | | (217,102 | ) | | | (208,589 | ) | | | (223,487 | ) | | | (202,203 | ) |
| | | | | | | | | | | | | | | | | | | | | |
F-46
Moove Lubricants Holdings
Notes to the consolidated financial statements
For the years ended December 31, 2023, 2022 and 2021
(In thousands of Brazilian Reais (R$), unless otherwise stated)
| | | | | Average LTM | | Maximum LTM |
| Changes in FX rate | | | Net exposure | | | | +4% ¹ | | | | -4% ¹ | | | | +11% ² | | | | -11% ² | |
| US$ | | | (459,419 | ) | | | (477,796 | ) | | | (441,042 | ) | | | (509,955 | ) | | | (408,883 | ) |
| € | | | (24,466 | ) | | | (25,445 | ) | | | (23,487 | ) | | | (27,157 | ) | | | (21,775 | ) |
| £ | | | (475 | ) | | | (494 | ) | | | (456 | ) | | | (527 | ) | | | (422 | ) |
| On December 31, 2022 | | | (484,360 | ) | | | (503,735 | ) | | | (464,985 | ) | | | (537,639 | ) | | | (431,080 | ) |
¹ The average variation in end exchange rate of Pounds Sterling, Euro, US Dollar and Norwegian Krone for the last 12 months.
² The maximum variation in end exchange rate of Pounds Sterling, Euro, US Dollar and Norwegian Krone for the last 12 months.
2.9.1.2. Fair value and cash flow risks associated to interest rates
The main risk factor impacting the fair value of financial instruments is the Group’s exposure to interest rate changes (CDI2, SOFR3 and SELIC4). Scenarios for these instruments are prepared using market data and specialized sources based on the Group’s governance framework. The analysis of the sensitivity to the amounts exposed to changes in interest rates in each year are presented below:
| | | | 12/31/2023 | | | | 25% | | | | 50% | | | | -25% | | | | -50% | |
| Cash and cash equivalents | | | 38,067 | | | | 47,584 | | | | 57,101 | | | | 28,551 | | | | 19,034 | |
| Marketable securities | | | 7,753 | | | | 9,691 | | | | 11,629 | | | | 5,815 | | | | 3,876 | |
| Restricted cash | | | 309 | | | | 386 | | | | 463 | | | | 231 | | | | 154 | |
| Loans and borrowings | | | (131,174 | ) | | | (154,256 | ) | | | (177,494 | ) | | | (107,779 | ) | | | (84,541 | ) |
| | | | | | | | | | | | | | | | | | | | | |
| | | | 12/31/2022 | | | | 25% | | | | 50% | | | | -25% | | | | -50% | |
| Cash and cash equivalents | | | 55,271 | | | | 58,585 | | | | 70,302 | | | | 35,151 | | | | 23,434 | |
| Marketable securities | | | 8,402 | | | | 10,503 | | | | 12,603 | | | | 6,302 | | | | 4,201 | |
| Restricted cash | | | 1,069 | | | | 1,337 | | | | 1,604 | | | | 802 | | | | 535 | |
| Derivatives | | | (18,049 | ) | | | (6,244 | ) | | | (12,231 | ) | | | 6,521 | | | | 13,342 | |
| Loans and borrowings | | | (162,707 | ) | | | (23,175 | ) | | | (53,027 | ) | | | 36,529 | | | | 66,381 | |
2.9.2. Credit risk
Credit risk is the risk that a counterparty will not meet its obligations under a financial instrument or customer contract, leading to a financial loss. The Group is exposed to credit risk from its operating activities (primarily trade receivables) and from its investing activities, including deposits with banks and financial institutions, foreign exchange transactions and other financial instruments.
The limits on the exposure of the Group to each financial counterparty is determined by the Group’s financial policy.
Management periodically evaluates whether the credit risk on a financial instrument has increased significantly, considering reasonable and supportable information available, in order to compare the risk of a default occurring at the reporting date with the risk of a default occurring at initial recognition of the financial instrument. This evaluation considers the expected credit losses model and it is built based on past history of uncollectable accounts and relevant prospective data.
2 CDI: Brazilian Interbank Deposit Certificate.
3 Sofr: Secured Overnight Financing Rate.
4 SELIC: Brazilian Central bank reference interest rate.
F-47
Moove Lubricants Holdings
Notes to the consolidated financial statements
For the years ended December 31, 2023, 2022 and 2021
(In thousands of Brazilian Reais (R$), unless otherwise stated)
The following financial assets are subject to the estimation of expected credit losses according to the Group’s accounting policy:
| II. | Financial assets measured at amortized cost. |
The accounting policy for the impairment of trade receivables and the reconciliation of the expected credit losses are included in Note 6.
2.9.3. Liquidity risk
Liquidity risk is managed based on the financial policy of the Group, which aims to ensure the availability of sufficient funds to honor the Group’s short-term commitments.
The table below presents a maturity analysis of the Group's financial liabilities. Derivative financial liabilities are considered in the analysis when their contractual maturities are essential to understand the Group’s cash flow in the short and medium term. The outstanding principal and interest, if applicable, are shown at the maturity dates. In the case of fixed rate liabilities, interest expense was calculated based on the rate established in each debt contract. Interest expense on floating rate liabilities was calculated based on a market forecast for each period.
The amounts included in the table represent the undiscounted contractual future cash flows; these amounts may not reconcile directly with the amounts in the statement of financial position.
| | | Up to 1 year | | 1 to 2 years | | 3 to 5 years | | Over 5 years | | 12/31/2023 |
| Trade payables | | | (1,494,568 | ) | | | — | | | | — | | | | — | | | | (1,494,568 | ) |
| Loans and borrowings | | | (671,110 | ) | | | (622,453 | ) | | | (933,679 | ) | | | — | | | | (2,227,242 | ) |
| Salaries and wages | | | (147,313 | ) | | | — | | | | — | | | | — | | | | (147,313 | ) |
| Derivative financial instruments | | | (742 | ) | | | — | | | | — | | | | — | | | | (742 | ) |
| Lease liabilities | | | (30,297 | ) | | | (31,920 | ) | | | (84,584 | ) | | | (49,152 | ) | | | (195,953 | ) |
| Payables to related parties | | | (18,586 | ) | | | (127,834 | ) | | | — | | | | — | | | | (146,420 | ) |
| Strategic alliance payable | | | (8,472 | ) | | | (8,472 | ) | | | (16,945 | ) | | | (119,706 | ) | | | (153,595 | ) |
| Other financial liabilities | | | (681 | ) | | | — | | | | — | | | | — | | | | (681 | ) |
| Liquidity risk | | | (2,371,769 | ) | | | (790,679 | ) | | | (1,035,208 | ) | | | (168,858 | ) | | | (4,366,514 | ) |
| | | | | | | | | | | | | | | | | | | | | |
| | | | Up to 1 year | | | | 1 to 2 years | | | | 3 to 5 years | | | | Over 5 years | | | | 12/31/2022 | |
| Trade payables | | | (1,602,955 | ) | | | — | | | | — | | | | — | | | | (1,602,955 | ) |
| Loans and borrowings | | | (497,146 | ) | | | (45,124 | ) | | | (2,347,965 | ) | | | — | | | | (2,890,235 | ) |
| Salaries and wages | | | (112,569 | ) | | | — | | | | — | | | | — | | | | (112,569 | ) |
| Derivative financial instruments | | | (19,206 | ) | | | — | | | | — | | | | — | | | | (19,206 | ) |
| Lease liabilities | | | (43,240 | ) | | | (35,209 | ) | | | (65,843 | ) | | | (25,828 | ) | | | (170,120 | ) |
| Payables to related parties | | | (116,614 | ) | | | (206,446 | ) | | | — | | | | — | | | | (323,060 | ) |
| Strategic alliance payable | | | (9,131 | ) | | | (9,131 | ) | | | (27,393 | ) | | | (129,592 | ) | | | (175,247 | ) |
| Other financial liabilities | | | (64,099 | ) | | | — | | | | — | | | | — | | | | (64,099 | ) |
| Liquidity risk | | | (2,464,960 | ) | | | (295,910 | ) | | | (2,441,201 | ) | | | (155,420 | ) | | | (5,357,491 | ) |
F-48
Moove Lubricants Holdings
Notes to the consolidated financial statements
For the years ended December 31, 2023, 2022 and 2021
(In thousands of Brazilian Reais (R$), unless otherwise stated)
2.10. Measurement of financial instruments
See below the amount of financial assets and liabilities segregated by measurement method:
| | | Notes | | 12/31/2023 | | 12/31/2022 |
| Financial Assets | | | | | | | | | | | | |
| Fair value through profit or loss | | | | | | | | | | | | |
| Marketable securities | | | 3. | | | | 77,814 | | | | 62,919 | |
| | | | | | | | 77,814 | | | | 62,919 | |
| Amortized cost | | | | | | | | | | | | |
| Cash and cash equivalents | | | 3. | | | | 773,551 | | | | 865,370 | |
| Trade receivables | | | 6. | | | | 1,094,199 | | | | 1,100,548 | |
| Receivables of related parties | | | 8. | | | | 685,445 | | | | 797,745 | |
| Other financial assets | | | | | | | 11,374 | | | | 65,181 | |
| | | | | | | | 2,564,569 | | | | 2,828,844 | |
| | | | | | | | | | | | | |
| Total | | | | | | | 2,642,383 | | | | 2,891,763 | |
| | | | | | | | | | | | | |
| | | | Notes | | | | 12/31/2023 | | | | 12/31/2022 | |
| Financial Liabilities | | | | | | | | | | | | |
| Fair value through profit or loss | | | | | | | | | | | | |
| Loans and borrowings | | | 14. | | | | — | | | | 256,539 | |
| Derivative financial instruments | | | 4. | | | | 742 | | | | 18,146 | |
| | | | | | | | 742 | | | | 274,685 | |
| Amortized cost | | | | | | | | | | | | |
| Trade payables | | | | | | | 1,494,583 | | | | 1,607,933 | |
| Loans and borrowings | | | 14. | | | | 2,207,028 | | | | 2,605,615 | |
| Strategic alliance payable | | | 15. | | | | 203,094 | | | | 226,685 | |
| Payables of related parties | | | 8. | | | | 146,420 | | | | 323,125 | |
| Other financial liabilities | | | | | | | 681 | | | | 64,099 | |
| | | | | | | | 4,051,806 | | | | 4,827,457 | |
| | | | | | | | | | | | | |
| Total | | | | | | | 4,052,548 | | | | 5,102,142 | |
Financial assets are derecognized when the rights to receive cash flows from these assets have expired, or when the Group has transferred substantially all the risks and benefits.
The Group derecognizes a financial liability when its contractual obligations are withdrawn, cancelled or expired or when its terms are modified, and the cash flows of the modified liability are substantially different, in which case a new financial liability based on the modified terms is recognized.
All financial instruments are initially measured at fair value plus or minus, in the case of a financial asset or financial liability not at fair value through profit or loss, transaction costs.
Financial assets are classified into two categories - those measured at amortized cost and those measured at fair value. Where assets are measured at fair value, gains and losses are either recognized entirely in profit or loss (fair value through profit or loss, FVTPL), or recognized in other comprehensive income (fair value through other comprehensive income, FVTOCI).
When measuring the fair value of an asset or liability, the Group uses observable market data as much as possible. Fair values are categorized into different levels on a fair value hierarchy, based on the entries used in appraisal techniques, as follows:
F-49
Moove Lubricants Holdings
Notes to the consolidated financial statements
For the years ended December 31, 2023, 2022 and 2021
(In thousands of Brazilian Reais (R$), unless otherwise stated)
| - | Level 1: inputs represent quoted prices not adjusted for identical instruments traded in active markets. |
| - | Level 2: inputs include directly or indirectly observable data (except for Level 1 data), such as prices quoted for similar financial instruments traded in active markets, prices quoted for identical or similar financial instruments traded in inactive markets, and other observable market data. The fair value of most of the Group’s investments in securities, derivative agreements and bonds are disclosed at this level. |
| - | Level 3: inputs for the assets or liabilities that are not based on observable market data (non-observable inputs). Management must use its own assumptions of non-observable inputs, since there is little market activity for these instruments or related observable data that can be verified on the measurement date. |
The Group regularly reviews significant unobservable inputs and valuation adjustments. If third party information, such as broker quotes or pricing services, is used to measure fair values, then the treasury department assesses the evidence obtained from the third parties to support the conclusion that these valuations meet the requirements of Group’s policy, including the level in the fair value hierarchy in which the valuations should be classified.
When the fair value of financial assets and liabilities cannot be derived from active markets, it is determined by using appraisal techniques, including the discounted cash flow model. Inputs for these models are obtained in observable markets, when possible, but a level of judgment is necessary to determine the fair value if there is no observable data. Judgment is required to determine data such as liquidity risk, credit risk, and volatility. Changes in these variables could affect the reported fair value of financial instruments.
The carrying value of current financial assets and liabilities approximates their fair value due to the short-term nature of the financial instruments.
Specific techniques for appraising financial instruments include:
| I. | The use of quoted market prices; |
| II. | For swaps, we use the present value of estimated future cash flows, based on curves that are observable in the market; and |
| III. | For other financial instruments, we analyze the discounted cash flow. |
The Group discloses fair value measurements based on the hierarchy level of the main assets and liabilities measured at fair value, and discloses a comparison, by class, of the carrying amounts and fair values of the Group’s financial instruments, other than those with carrying amounts that are reasonable approximations of fair values, as shown below:
| | | | | | | | 12/31/2023 | | | | 12/31/2022 | |
| | | | Notes | | | | Book value | | | | Level 2 | | | | Book value | | | | Level 2 | |
| Financial instruments measured at fair value | | | | | | | | | | | | | | | | | | | | |
| Marketable securities | | | 3. | | | | 77,814 | | | | 77,814 | | | | 62,919 | | | | 62,919 | |
| Derivative financial instruments | | | 4. | | | | (742 | ) | | | (742 | ) | | | (18,146 | ) | | | (18,146 | ) |
| Loans and Borrowings | | | 14. | | | | — | | | | — | | | | (256,539 | ) | | | (256,539 | ) |
| Total | | | | | | | 77,072 | | | | 77,072 | | | | (211,766 | ) | | | (211,766 | ) |
F-50
Moove Lubricants Holdings
Notes to the consolidated financial statements
For the years ended December 31, 2023, 2022 and 2021
(In thousands of Brazilian Reais (R$), unless otherwise stated)
Fair value disclosures of financial instruments measured at amortized cost | | | | | | | | | | |
| Loans and Borrowings | | | | | | | (2,207,028 | ) | | | (2,290,813 | ) | | | (2,605,615 | ) | | | (2,657,897 | ) |
| Total | | | | | | | (2,207,028 | ) | | | (2,290,813 | ) | | | (2,605,615 | ) | | | (2,657,897 | ) |
If the data used to measure the fair value of an asset or liability fall on different levels of the fair value hierarchy, then the fair value measurement is categorized in full at the same level of fair value hierarchy as the lowest input level that is significant for the measurement. There were no changes in the fair value hierarchy levels during the year.
3. Cash, cash equivalents and marketable securities
Cash and cash equivalents comprise cash balances, call deposits and bank overdrafts.
Cash and short-term deposits in the statement of financial position comprise cash in banks and on hand and short-term highly liquid investments with maturities of less than 90 days that are readily convertible to a known amount of cash and subject to an insignificant risk of changes in value.
The marketable securities comprise an investment fund. The portfolio consists of government bonds which are highly liquid investments indexed by SELIC (Sistema Especial de Liquidação e de Custódia), and have maturity date up to five years.
| | | | 12/31/2023 | | | | 12/31/2022 | |
| Cash | | | 12 | | | | 8 | |
| Bank accounts | | | 48,543 | | | | 58,135 | |
| Savings account | | | 210,025 | | | | 622,082 | |
| Financial investments | | | 514,971 | | | | 185,145 | |
| Cash and cash equivalents | | | 773,551 | | | | 865,370 | |
| | | | | | | | | |
| Marketable securities | | | 77,814 | | | | 62,919 | |
4. Derivative financial instruments
Derivative financial instruments are measured at fair value through profit and loss, except for derivatives designated as hedging instruments in cash flow hedge relationships, which require specific accounting treatment as described in Note 5.
On December 31, 2023, the Group had four outstanding derivatives, all were Non-Deliverable Forward contracts (NDFs). On December 31, 2022 there were two, both were interest and currency swaps held for the purposes of economic hedging.
| | | | 12/31/2023 | | | | 12/31/2022 | |
| Short-term derivative financial instrument liabilities | | | (742 | ) | | | (18,146 | ) |
5. Hedge accounting
To qualify for hedge accounting, the hedging relationship must meet all the following requirements:
| · | there is an economic relationship between the hedged item and the hedging instrument; |
F-51
Moove Lubricants Holdings
Notes to the consolidated financial statements
For the years ended December 31, 2023, 2022 and 2021
(In thousands of Brazilian Reais (R$), unless otherwise stated)
| · | the effect of credit risk does not dominate the value changes that result from that economic relationship, and; |
| · | the hedge ratio of the hedging relationship is the same as that resulting from the quantity of the hedged item that the entity hedges and the quantity of the hedging instrument that the entity uses to hedge that quantity of hedged item. |
Hedge effectiveness is the extent to which changes in the fair value or cash flows of the hedge instrument offset changes in the fair value or cash flows of the hedged item. The Group contracts derivative instruments only with top-tier financial institutions. In addition, the terms of the operations are relatively short, at most one year, which does not generate distortions in the future credit and interest curves. Even so, the Group calculates the mark-to-market of financial instruments every month, including credit risk and thus monitoring the occurrence of any material changes.
According to hedge effectiveness requirements, the hedge ratio of the hedging relationship is the same as that resulting from the quantity of the hedged item that the entity actually hedges and the quantity of the hedging instrument that the entity actually uses to hedge that quantity of hedged item.
To the extent that the hedge is effective, changes in the fair value of derivatives designated as hedging instruments in cash flow hedges are recognized in OCI and included within the cash flow hedge reserve in equity. Any ineffectiveness in the hedge relationship is recognized immediately in the profit or loss.
When the hedged item affects profit or loss, any gain or loss previously recognized in OCI is reclassified from equity to profit or loss and presented as a reclassification adjustment within OCI. When the hedged item is a forecast transaction which subsequently results in the recognition of a non–financial asset or non–financial liability, or a hedged forecast transaction for a non–financial asset or a non–financial liability becomes a firm commitment for which fair value hedge accounting is applied, the amount from the cash flow hedge reserve is removed and included directly in the initial cost or other carrying amount of the asset or the liability.
The Group monitors any changes in profit and loss between budget and actual. For each firm purchase commitment, what was projected is verified and, if there is any significant change, the alternatives for adjustments are assessed and, finally, the decision is made to finalize the purchase.
If the hedging relationship ceases to meet the effectiveness conditions, hedge accounting is discontinued, and the related gain or loss is held in the profit and loss until the forecast transaction occurs.
As of June 2020, the Group decided to include as a strategy of risk management the use of Hedge Accounting, to protect its Brazilian subsidiary imports cash flow from exchange rate fluctuations (currency exposure). The hedge object can be classified as an unrecognized firm commitment for purchases of imported products whose risk to be eliminated, total or partial, is the exchange variation.
The Group designates all derivatives related to the process of raw material import as hedging instruments in cash flow hedge relationships.
The Group has designated the amount of R$ 709,895 of cash flow hedge during 2023 (R$ 684,236 in 2022), which had as hedge objects highly probable imports in US$ and Non-Deliverable Forward (NDF) contracts as hedge instruments.
F-52
Moove Lubricants Holdings
Notes to the consolidated financial statements
For the years ended December 31, 2023, 2022 and 2021
(In thousands of Brazilian Reais (R$), unless otherwise stated)
The fair value of the hedge instruments, using the exchange rate R$/US$ as base, are presented as follows:
| Derivative financial instrument - Inventories | | | | |
| Balance at 31 December 2020 | | | 5,395 | |
| Additions/Mark-to-market (MTM) Movements | | | 20,403 | |
| Settlement | | | (5,317 | ) |
| Balance at 31 December 2021 | | | 20,481 | |
| Additions/Mark-to-market (MTM) Movements | | | 3,839 | |
| Settlement | | | (24,320 | ) |
| Balance at 31 December 2022 | | | — | |
| Additions/Mark-to-market (MTM) Movements | | | 3,692 | |
| Settlement | | | (4,434 | ) |
| Balance at 31 December 2023 | | | (742 | ) |
The fair value of the financial instruments, using the exchange rate R$/US$ as base, are presented as follows:
| Derivative financial instrument - Debt | | | | |
| Balance at 31 December 2020 | | | 22,720 | |
| Additions/Mark-to-market (MTM) Movements | | | 9,973 | |
| Settlement | | | (26,661 | ) |
| Balance at 31 December 2021 | | | 6,032 | |
| Additions/Mark-to-market (MTM) Movements | | | 3,552 | |
| Settlement | | | (27,730 | ) |
| Balance at 31 December 2022 | | | (18,146 | ) |
| Additions/Mark-to-market (MTM) Movements | | | 71,699 | |
| Settlement | | | (53,553 | ) |
| Balance at 31 December 2023 | | | — | |
Presented below are the movements and balances of hedge accounting recognized in other comprehensive income:
| Balance at 31 December 2020 | | | 759 | |
| Mark-to-market (MTM) | | | 37,120 | |
| Exchange rate effect | | | (34,820 | ) |
| Settlement | | | 9,756 | |
| Income taxes (34%) | | | (4,307 | ) |
| Balance at 31 December 2021 | | | 8,508 | |
| Mark-to-market (MTM) | | | (48,393 | ) |
| Exchange rate effect | | | 11,257 | |
| Settlement | | | 24,321 | |
| Income taxes (34%) | | | 4,307 | |
| Balance at 31 December 2022 | | | — | |
| Mark-to-market (MTM) | | | 13,224 | |
| Exchange rate effect | | | (9,532 | ) |
| Settlement | | | (4,434 | ) |
| Income taxes (34%) | | | 252 | |
| Balance at 31 December 2023 | | | (490 | ) |
F-53
Moove Lubricants Holdings
Notes to the consolidated financial statements
For the years ended December 31, 2023, 2022 and 2021
(In thousands of Brazilian Reais (R$), unless otherwise stated)
6. Trade receivables
The Group has trade accounts receivable from customers for goods sold or services rendered in the ordinary course of the Company’s business, with the purpose of receiving contractual cash flows. They are initially recognized at fair value and subsequently measured at amortized cost using the effective interest rate method, less a provision for expected credit losses.
Expected loss rates are based on corresponding historical credit losses suffered in the last 12 months. Historical loss rates may be adjusted to reflect current and forward-looking information regarding macroeconomic factors that affect the customers’ ability to settle the receivables.
To measure expected credit losses, receivables are grouped based on the credit risk characteristics and days past due. The credit risk has not increased significantly through 2023 and 2022, and the overdue position for the past thirty-six months has been around 2%.
| | | 12/31/2023 | | 12/31/2022 |
| Trade receivables - current | | | 1,113,113 | | | | 1,120,972 | |
| Trade receivables - non-current | | | 765 | | | | 823 | |
| | | | 1,113,878 | | | | 1,121,795 | |
| | | | | | | | | |
| Trade expected credit losses | | | (19,679 | ) | | | (21,247 | ) |
| | | | 1,094,199 | | | | 1,100,548 | |
| | | | | | | | | |
| Current | | | 1,093,434 | | | | 1,099,725 | |
| Non-current | | | 765 | | | | 823 | |
| | | 12/31/2023 | | 12/31/2022 |
| Not overdue | | | 960,794 | | | | 957,834 | |
| Overdue | | | | | | | | |
| From 1 to 30 days | | | 103,632 | | | | 117,638 | |
| From 31 to 60 days | | | 22,037 | | | | 20,621 | |
| From 61 to 90 days | | | 6,888 | | | | 8,341 | |
| More than 90 days | | | 20,527 | | | | 17,361 | |
| Expected Credit Losses | | | (19,679 | ) | | | (21,247 | ) |
| | | | 1,094,199 | | | | 1,100,548 | |
Below is the reconciliation of the expected credit losses:
| At December 2020 | | | (18,065 | ) |
| (Additions)/ reversals | | | (8,333 | ) |
| Write-off | | | 11,076 | |
| Exchange variation | | | (342 | ) |
| At December 2021 | | | (15,664 | ) |
| (Additions) / reversals | | | (7,190 | ) |
| Write-off | | | 6,511 | |
| Exchange rate variation | | | (4,904 | ) |
| At December 2022 | | | (21,247 | ) |
| (Additions) / reversals | | | (4,939 | ) |
| Write-off | | | 5,154 | |
| Exchange rate variation | | | 1,353 | |
| At December 2023 | | | (19,679 | ) |
F-54
Moove Lubricants Holdings
Notes to the consolidated financial statements
For the years ended December 31, 2023, 2022 and 2021
(In thousands of Brazilian Reais (R$), unless otherwise stated)
7. Inventories
Inventories are stated at the lower of acquisition cost and realizable net value (the estimated sale price in the ordinary course of business, less the estimated costs required to make the sale). The cost of finished goods and goods in production comprises direct materials, direct labor and a proportion of production overheads based on normal operating capacity. Costs are attributed to individual items in inventory based on the weighted average costs.
A provision for obsolete inventories is made for risks associated with the realization and sale of inventories due to obsolescence, and measured at net realizable value or cost, whichever is lower.
| | | 12/31/2023 | | | 12/31/2022 | |
| Finished goods | | | 1,007,055 | | | | 1,163,036 | |
| Raw material, base oil and packaging | | | 320,900 | | | | 381,301 | |
| (-) Provision for Realization and Obsolescence | | | (40,245 | ) | | | (34,980 | ) |
| | | 1,287,710 | | | | 1,509,357 | |
Below is the reconciliation of the provision for realization and obsolescence:
| At December 2020 | | | (17,244 | ) |
| (Additions) / reversals | | | (23,274 | ) |
| Write-off | | | 21,152 | |
| Exchange variation | | | (2,243 | ) |
| At December 2021 | | | (21,609 | ) |
| (Additions) / reversals | | | (20,148 | ) |
| Write-off | | | 5,017 | |
| Exchange rate variation | | | 1,760 | |
| At December 2022 | | | (34,980 | ) |
| (Additions) / reversals | | | (13,794 | ) |
| Write-off | | | 2,958 | |
| Exchange rate variation | | | 5,571 | |
| At December 2023 | | | (40,245 | ) |
8. Related parties
The outstanding balances with related parties at the end of the reporting period are not subject to interest and are to be settled in cash. No guarantees were given or received on any accounts receivable or payable involving related parties. At the end of each period, a recovery analysis of amounts receivable is made, and no provision was recognized.
Related-party transactions are carried out by the Group under similar conditions to other transactions, considering the usual market prices and conditions and, therefore, do not generate any undue benefit to its counterparties or losses to the Group. In the normal course of its operations, the Group enters into agreements with related parties, related to the purchase and sale of finished products and raw materials, loans, leases of assets, and rendering of services.
| | | | 12/31/2023 | | | | 12/31/2022 | |
| Raízen S.A. and subsidiaries | | | 10,284 | | | | 16,474 | |
| Rumo S.A. | | | 6,376 | | | | 8,460 | |
| Other | | | 40 | | | | 17 | |
| Commercial operations | | | 16,700 | | | | 24,951 | |
| | | | | | | | | |
F-55
Moove Lubricants Holdings
Notes to the consolidated financial statements
For the years ended December 31, 2023, 2022 and 2021
(In thousands of Brazilian Reais (R$), unless otherwise stated)
| Cosan S.A. ¹ | | | 13,014 | | | | 7,646 | |
| Financial and corporate operations | | | 13,014 | | | | 7,646 | |
| | | | | | | | | |
| Total current assets | | | 29,714 | | | | 32,597 | |
| | | | | | | | | |
| Cosan S.A. ¹ | | | 655,731 | | | | 765,148 | |
| Financial and corporate operations | | | 655,731 | | | | 765,148 | |
| | | | | | | | | |
| Total non-current assets | | | 655,731 | | | | 765,148 | |
| | | | | | | | | |
| Total assets | | | 685,445 | | | | 797,745 | |
| | | | | | | | | |
| | | | | | | | | |
| Raízen S.A. and subsidiaries | | | 2,482 | | | | 137 | |
| Rumo S.A. | | | 4 | | | | 2 | |
| Other | | | — | | | | 88 | |
| Commercial operations | | | 2,486 | | | | 227 | |
| | | | | | | | | |
| Cosan S.A. ¹ | | | 12,904 | | | | 111,178 | |
| Raízen S.A. and subsidiaries | | | 1,395 | | | | 3,332 | |
| Cosan Luxembourg S.A. | | | 1,801 | | | | 1,942 | |
| Financial and corporate operations | | | 16,100 | | | | 116,452 | |
| | | | | | | | | |
| Total current liabilities | | | 18,586 | | | | 116,679 | |
| | | | | | | | | |
| Non-current liabilities | | | | | | | | |
| Cosan S.A. ¹ | | | 127,834 | | | | 206,446 | |
| Financial and corporate operations | | | 127,834 | | | | 206,446 | |
| | | | | | | | | |
| Total non-current liabilities | | | 127,834 | | | | 206,446 | |
| | | | | | | | | |
| Total liabilities | | | 146,420 | | | | 323,125 | |
Below the information regarding the impact of our related party transactions on our income statement:
| | | | 12/31/2023 | | | | 12/31/2022 | | | | 12/31/2021 | |
| Sale of products, net of returns | | | | | | | | | | | | |
| Raízen S.A. and subsidiaries | | | 86,776 | | | | 92,957 | | | | 73,991 | |
| Rumo S.A. | | | 62,555 | | | | 62,274 | | | | 56,212 | |
| Other | | | — | | | | 58 | | | | 2,042 | |
| | | | 149,331 | | | | 155,289 | | | | 132,245 | |
| Purchase of goods and services | | | | | | | | | | | | |
| Raízen S.A. and subsidiaries | | | (5,809 | ) | | | (7,452 | ) | | | (4,153 | ) |
| Rumo S.A. | | | (4 | ) | | | — | | | | — | |
| | | | (5,813 | ) | | | (7,452 | ) | | | (4,153 | ) |
| Shared expenses | | | | | | | | | | | | |
| Raízen S.A. and subsidiaries | | | (18,354 | ) | | | (12,581 | ) | | | (9,165 | ) |
| Cosan S.A. | | | (5,275 | ) | | | (3,816 | ) | | | (3,374 | ) |
| | | | (23,629 | ) | | | (16,397 | ) | | | (12,539 | ) |
¹ On December 31, 2018, the Group and Cosan S.A. entered into an agreement to transfer to Cosan S.A. certain assets and liabilities related to the fuel business arising from the acquisition of Esso Brasileira de Petróleo Ltda., or Esso. This resulted in an increase in the Group’s related parties’ assets and liabilities accounts for the recharge of contingencies and tax discussions from events that occurred prior to the contract.
F-56
Moove Lubricants Holdings
Notes to the consolidated financial statements
For the years ended December 31, 2023, 2022 and 2021
(In thousands of Brazilian Reais (R$), unless otherwise stated)
In the year ended December 31, 2023, December 31, 2022 and December 31, 2021 the expenses related to compensation of key executives, including the Board of Directors, the Management and Executive Committees are presented as follow:
| | | | 12/31/2023 | | | | 12/31/2022 | | | | 12/31/2021 | |
| Short-term remuneration and profit sharing | | | 29,095 | | | | 40,063 | | | | 24,122 | |
| Stock option plan | | | 10,306 | | | | — | | | | — | |
| Post-employment benefits | | | 520 | | | | 470 | | | | 373 | |
| Long-Term share-based payments | | | 5,468 | | | | 3,408 | | | | 7,490 | |
| | | | 45,389 | | | | 43,941 | | | | 31,985 | |
9. Taxes recoverable
Tax receivables expected to be recovered as refunds from tax authorities or as a reduction for future tax obligations.
| | | 12/31/2023 | | 12/31/2022 |
| Argentinian recoverable value added taxes (VAT) | | | 28,758 | | | | 2,465 | |
| Brazilian state tax on the circulation of goods and services - ICMS | | | 18,560 | | | | 20,093 | |
| Compensation for Brazilian federal taxes - PIS / COFINS | | | 8,889 | | | | 193,912 | |
| Income tax | | | — | | | | 31,510 | |
| Brazilian tax input on purchase of manufactured products – IPI | | | 5,412 | | | | 6,583 | |
| Withholding income tax | | | 4,555 | | | | 7,210 | |
| Other recoverable tax | | | 26,507 | | | | 25,650 | |
| | | | 92,681 | | | | 287,423 | |
| | | | | | | | | |
| Current | | | 77,828 | | | | 197,436 | |
| Non-current | | | 14,853 | | | | 89,987 | |
| | | | 92,681 | | | | 287,423 | |
10. Business combination
The acquisition method is used to account for all business combinations. The consideration transferred for the acquisition of a business comprises the:
| - | fair values of the assets transferred |
| - | liabilities incurred to the former owners of the acquired business |
| - | equity interests issued by the Group |
| - | fair value of any asset or lability resulting from a contingent consideration arrangement, and |
| - | fair value of any pre-existing equity interest in the entity. |
Identifiable assets acquired and liabilities and contingent liabilities assumed in a business combination are, with limited exceptions, measured initially at their fair values at the acquisition date. The Group recognizes any non-controlling interest in the acquired entity on an acquisition-by-acquisition basis either at fair value or at the non-controlling interest’s proportionate share of the acquired entity’s net identifiable assets.
Acquisition-related costs are expensed as incurred.
F-57
Moove Lubricants Holdings
Notes to the consolidated financial statements
For the years ended December 31, 2023, 2022 and 2021
(In thousands of Brazilian Reais (R$), unless otherwise stated)
Goodwill is measured as the excess of the (i) consideration transferred; (ii) amount of any non-controlling interest in the acquired entity, and (iii) acquisition-date fair value of any previous equity interest in the acquired entity over the fair value of the net identifiable assets acquired.
Where settlement of any part of cash consideration is deferred, the amounts payable in the future are discounted to their present value as at the date of exchange. The discount rate used is the entity’s incremental borrowing rate, being the rate at which a similar borrowing could be obtained from an independent financier under comparable terms and conditions.
Contingent consideration is classified either as equity or as a financial liability. Amounts classified as a financial liability are subsequently remeasured to fair value, with changes in fair value recognized in profit or loss.
In 2022, the Group, through its subsidiaries, concluded the acquisition of investments in Tirreno and PetroChoice. In the table below, we demonstrate the consideration paid and the fair value of the assets acquired, and liabilities assumed on the acquisition date.
| | | PetroChoice | | Tirreno | | Total |
| Transferred consideration - 1st/single installment | | | 2,342,820 | | | | 70,189 | | | | 2,413,009 | |
| Transferred consideration - 2nd installment ¹ | | | — | | | | 15,000 | | | | 15,000 | |
| Total consideration transferred | | | 2,342,820 | | | | 85,189 | | | | 2,428,009 | |
| | | | | | | | | | | | | |
Recognized amounts of identifiable assets acquired and liabilities assumed | | | | | | | | | | | | |
| Cash, cash equivalents and restricted cash | | | 18,883 | | | | 1,476 | | | | 20,359 | |
| Accounts receivable from customers | | | 305,588 | | | | 35,882 | | | | 341,470 | |
| Inventories | | | 417,365 | | | | 19,121 | | | | 436,486 | |
| Tax credits | | | — | | | | 2,134 | | | | 2,134 | |
| Right of use assets | | | 93,811 | | | | 16,664 | | | | 110,475 | |
| Property, plant and equipment | | | 478,563 | | | | 5,015 | | | | 483,578 | |
| Intangibles (other than goodwill) | | | 1,103,379 | | | | 57,851 | | | | 1,161,230 | |
| Goodwill | | | 400,196 | | | | 1,238 | | | | 401,434 | |
| Other credits | | | 46,525 | | | | 5,026 | | | | 51,551 | |
| Trade payables | | | (187,767 | ) | | | (22,048 | ) | | | (209,815 | ) |
| Loans and borrowings | | | — | | | | (12,825 | ) | | | (12,825 | ) |
| Income and deferred taxes | | | (96,272 | ) | | | (1,825 | ) | | | (98,097 | ) |
| Lease liabilities and asset retirement obligation | | | (144,454 | ) | | | (16,664 | ) | | | (161,118 | ) |
| Provision for legal proceedings ² | | | — | | | | (2,714 | ) | | | (2,714 | ) |
| Other obligations | | | (92,997 | ) | | | (3,142 | ) | | | (96,139 | ) |
| Net assets acquired | | | 2,342,820 | | | | 85,189 | | | | 2,428,009 | |
| | | | | | | | | | | | | |
| Less cash and cash equivalents acquired | | | (18,883 | ) | | | (1,476 | ) | | | (20,359 | ) |
| Total amount of identifiable net assets acquired | | | 2,323,937 | | | | 83,713 | | | | 2,407,650 | |
¹ The second Tirreno installment will be paid in 2024.
² There were 2 legal proceedings recognized in Tirreno, which one is Tax related (R$ 2,534) and the other one is Labor related (R$ 180).
If the business combinations had taken place at the beginning of 2022, the Group's revenues would have been R$ 9,975,392, and the profit for the year would have been R$ 405,787.
10.1. PetroChoice
On May 23, 2022, the Group, through its subsidiary Millennium Moove Corp acquired 100% of Stryker Intermediate Holdings and its operating subsidiaries (PetroChoice), a limited company incorporated in Delaware - USA.
F-58
Moove Lubricants Holdings
Notes to the consolidated financial statements
For the years ended December 31, 2023, 2022 and 2021
(In thousands of Brazilian Reais (R$), unless otherwise stated)
PetroChoice's consolidated financial statements were prepared in accordance with Accounting Principles Generally Accepted in the United States of America (“U.S. GAAP”) issued by the Financial Accounting Standards Board (“FASB”). Differences between these policies and the accounting practices adopted in IFRSs were adjusted and consolidated in these financial statements.
Goodwill of R$ 400,196 was recognized, which represents the expected future economic benefit from the synergies arising from the acquisition.
(a) Acquired receivables
The fair value of acquired trade receivables is R$ 305,588. The gross contractual amount for trade receivables due is R$ 311,287.
(b) Revenue and profit contribution
The acquired business contributed revenues of R$ 1,639,657 and a net loss of R$ 7,087 to the Group for the period from acquisition to December 31, 2022.
(c) Costs related to the acquisition
Acquisition-related costs of R$ 47,082 are included in the statement of income under “Other operating income, net”.
10.2. Tirreno
On May 31, 2022, the Group, through its subsidiary Cosan Lubrificantes e Especialidades S.A. acquired 100% of the shares of Tirreno, a privately held company based in Brazil, specialized in the production and sale of lubricating oils, additives and fluids. The acquisition aims to increase synergies in automotive and industrial products through technology and manufacturing, distribution and cross-selling opportunities and brands.
Goodwill of R$ 1,238 was recognized, which represents the expected future economic benefit from the synergies arising from the acquisition.
(a) Acquired receivables
The fair value of acquired trade receivables is R$ 35,882. The gross contractual amount for trade receivables due is R$ 35,882.
(b) Revenue and profit contribution
The acquired business contributed revenues of R$ 132,623 and a net profit of R$ 9,536 to the Group for the period from acquisition to December 31, 2022.
(c) Costs related to the acquisition
There were no significant acquisition-related costs related to the acquisition of Tirreno.
F-59
Moove Lubricants Holdings
Notes to the consolidated financial statements
For the years ended December 31, 2023, 2022 and 2021
(In thousands of Brazilian Reais (R$), unless otherwise stated)
11. Property, plant and equipment
Items of property, plant and equipment are measured at cost, less accumulated depreciation and any accumulated impairment losses.
Subsequent expenses are capitalized only when the future economic benefits associated with the expenses are likely to flow to the Group. Regular repairs and maintenance are accounted for in the profit or loss account when incurred.
Assets are depreciated as from the date when they are available for use or, regarding assets built, as from the date when the asset is completed and ready for use.
Depreciation is calculated based on the cost of property, plant and equipment less the residual values estimated using the straight-line method over their estimated useful life, which is recognized in the statement of profit or loss unless it is capitalized as part of the cost of another asset. Land is not depreciated.
Depreciation methods, useful life and residual values, are revised at the end of each year or whenever there is a significant change without an expected consumption pattern, such as a relevant incident or technical obsolescence. Adjustments are recognized prospectively as changes to accounting estimates, if appropriate.
Gains and losses on disposals are determined by comparing the proceeds with the carrying amount and are recognized within “Other operating income (expenses), net” in the statement of profit and loss (Note 22.).
F-60
Moove Lubricants Holdings
Notes to the consolidated financial statements
For the years ended December 31, 2023, 2022 and 2021
(In thousands of Brazilian Reais (R$), unless otherwise stated)
| Cost | | Land, Buildings and improvements | | Machinery, equipment and facilities | | Vehicles | | Fixtures, Fittings and Computer Equipment | | Construction in progress | | TOTAL |
| At December 31, 2020 | | | 250,595 | | | | 280,372 | | | | 53,026 | | | | 29,709 | | | | 29,874 | | | | 643,576 | |
| Additions for the year | | | 265 | | | | 7,180 | | | | — | | | | 696 | | | | 34,154 | | | | 42,295 | |
| Disposals | | | (27 | ) | | | (3,278 | ) | | | (1,824 | ) | | | (822 | ) | | | — | | | | (5,951 | ) |
| Transfers¹ | | | 9,073 | | | | 18,883 | | | | — | | | | 1,691 | | | | (35,643 | ) | | | (5,996 | ) |
| Monetary variation² | | | 970 | | | | 118 | | | | — | | | | 122 | | | | 77 | | | | 1,287 | |
| Effect of exchange rate fluctuations | | | 4,739 | | | | 7,454 | | | | 3,062 | | | | 469 | | | | 36 | | | | 15,760 | |
| At December 31, 2021 | | | 265,615 | | | | 310,729 | | | | 54,264 | | | | 31,865 | | | | 28,498 | | | | 690,971 | |
| Additions for the year | | | 6,473 | | | | 11,054 | | | | 8,147 | | | | 1,463 | | | | 57,766 | | | | 84,903 | |
| Disposals | | | (934 | ) | | | (13,331 | ) | | | (4,790 | ) | | | (1,320 | ) | | | (9,024 | ) | | | (29,399 | ) |
| Transfers¹ | | | 5,073 | | | | 11,723 | | | | 4,774 | | | | 454 | | | | (27,839 | ) | | | (5,815 | ) |
| Business Combination | | | 91,149 | | | | 230,065 | | | | 148,955 | | | | 4,992 | | | | 8,418 | | | | 483,579 | |
| Monetary variation² | | | 970 | | | | 263 | | | | — | | | | 495 | | | | (86 | ) | | | 1,642 | |
| Effect of exchange rate fluctuations | | | (5,457 | ) | | | 13,161 | | | | 10,404 | | | | (4,997 | ) | | | 5,049 | | | | 18,160 | |
| At December 31, 2022 | | | 362,889 | | | | 563,664 | | | | 221,754 | | | | 32,952 | | | | 62,782 | | | | 1,244,041 | |
| Additions for the year | | | 4,919 | | | | 19,081 | | | | 15,039 | | | | 1,108 | | | | 95,353 | | | | 135,500 | |
| Disposals | | | (1,037 | ) | | | (21,234 | ) | | | (14,373 | ) | | | (2,568 | ) | | | (299 | ) | | | (39,511 | ) |
| Transfers¹ | | | 14,089 | | | | 29,202 | | | | 18,840 | | | | 1,555 | | | | (70,455 | ) | | | (6,769 | ) |
| Monetary variation² | | | 17 | | | | 225 | | | | — | | | | 923 | | | | (62 | ) | | | 1,103 | |
| Effect of exchange rate fluctuations | | | (11,306 | ) | | | (22,909 | ) | | | (14,063 | ) | | | (1,903 | ) | | | (1,561 | ) | | | (51,742 | ) |
| At December 31, 2023 | | | 369,571 | | | | 568,029 | | | | 227,197 | | | | 32,067 | | | | 85,758 | | | | 1,282,622 | |
| | | | | | | | | | | | | | | | | | | | | | | | | |
F-61
Moove Lubricants Holdings
Notes to the consolidated financial statements
For the years ended December 31, 2023, 2022 and 2021
(In thousands of Brazilian Reais (R$), unless otherwise stated)
| Depreciation | | Land, Buildings and improvements | | Machinery, equipment and facilities | | Vehicles | | Fixtures, Fittings and Computer Equipment | | Construction in progress | | TOTAL |
| At December 31, 2020 | | | (97,307 | ) | | | (157,168 | ) | | | (27,317 | ) | | | (21,381 | ) | | | — | | | | (303,173 | ) |
| Charge for the year | | | (8,410 | ) | | | (24,561 | ) | | | (4,590 | ) | | | (2,129 | ) | | | — | | | | (39,690 | ) |
| Disposals | | | 22 | | | | 2,309 | | | | 1,771 | | | | 805 | | | | — | | | | 4,907 | |
| Transfers¹ | | | 15 | | | | — | | | | — | | | | (15 | ) | | | — | | | | — | |
| Monetary variation² | | | (488 | ) | | | (194 | ) | | | — | | | | (95 | ) | | | — | | | | (777 | ) |
| Effect of exchange rate fluctuations | | | (2,125 | ) | | | (1,413 | ) | | | (1,595 | ) | | | (464 | ) | | | — | | | | (5,597 | ) |
| At December 31, 2021 | | | (108,293 | ) | | | (181,027 | ) | | | (31,731 | ) | | | (23,279 | ) | | | — | | | | (344,330 | ) |
| Charge for the year | | | (12,949 | ) | | | (46,499 | ) | | | (47,370 | ) | | | (2,586 | ) | | | — | | | | (109,404 | ) |
| Disposals | | | 400 | | | | 12,802 | | | | 3,810 | | | | 1,281 | | | | — | | | | 18,293 | |
| Transfers¹ | | | 4 | | | | (84 | ) | | | 571 | | | | 121 | | | | — | | | | 612 | |
| Monetary variation² | | | (1,389 | ) | | | (157 | ) | | | — | | | | (262 | ) | | | — | | | | (1,808 | ) |
| Effect of exchange rate fluctuations | | | 7,954 | | | | (4,134 | ) | | | 5,199 | | | | 1,530 | | | | — | | | | 10,549 | |
| At December 31, 2022 | | | (114,273 | ) | | | (219,099 | ) | | | (69,521 | ) | | | (23,195 | ) | | | — | | | | (426,088 | ) |
| Charge for the year | | | (14,142 | ) | | | (59,563 | ) | | | (51,862 | ) | | | (3,182 | ) | | | — | | | | (128,749 | ) |
| Disposals | | | 1,316 | | | | 11,606 | | | | 12,321 | | | | 2,365 | | | | — | | | | 27,608 | |
| Monetary variation² | | | (17 | ) | | | (56 | ) | | | — | | | | (497 | ) | | | — | | | | (570 | ) |
| Effect of exchange rate fluctuations | | | 3,339 | | | | 5,262 | | | | 4,121 | | | | 987 | | | | — | | | | 13,709 | |
| At December 31, 2023 | | | (123,777 | ) | | | (261,850 | ) | | | (104,941 | ) | | | (23,522 | ) | | | — | | | | (514,090 | ) |
| | | | | | | | | | | | | | | | | | | | | | | | | |
| Net book value at 31 December 2021 | | | 157,322 | | | | 129,702 | | | | 22,533 | | | | 8,586 | | | | 28,498 | | | | 346,641 | |
| Net book value at 31 December 2022 | | | 248,616 | | | | 344,565 | | | | 152,233 | | | | 9,757 | | | | 62,782 | | | | 817,953 | |
| Net book value at 31 December 2023 | | | 245,794 | | | | 306,179 | | | | 122,256 | | | | 8,545 | | | | 85,758 | | | | 768,532 | |
| Annual depreciation rates | | | 3% to 18% | | | | 3% to 33% | | | | 10% to 33% | | | | 6% to 33% | | | | N/A | | | | | |
¹ There were transfers between construction in progress in Property, Plant and Equipment and Intangible assets. (Note 12.)
² Argentina’s hyperinflation effect. (Note 2.5.)
F-62
Moove Lubricants Holdings
Notes to the consolidated financial statements
For the years ended December 31, 2023, 2022 and 2021
(In thousands of Brazilian Reais (R$), unless otherwise stated)
12. Intangible assets
Intangible assets acquired separately are measured on initial recognition at cost. The cost of intangible assets acquired in a business combination is their fair value at the date of acquisition.
Following initial recognition, intangible assets are carried at cost less any accumulated amortization and accumulated impairment losses. Internally generated intangibles, excluding capitalized development costs, are not capitalized and the related expenditure is reflected in profit or loss in the period in which the expenditure is incurred.
The useful lives of intangible assets are assessed as either finite or indefinite.
Intangible assets with finite lives are amortized over the useful economic life, using the straight-line method, and assessed for impairment whenever there is an indication that the intangible asset may be impaired. The amortization period and the amortization method for an intangible asset with a finite useful life are reviewed at least at the end of each reporting period. Changes in the expected useful life or the expected pattern of consumption of future economic benefits embodied in the asset are considered to modify the amortization period or method, as appropriate, and are treated prospectively as changes in accounting estimates. The amortization expense on intangible assets with finite lives is recognized in profit or loss in the expense category that is consistent with the function of the intangible assets.
Intangible assets with indefinite useful lives are not amortized, but are tested for impairment annually, either individually or at the cash-generating unit level. The assessment of indefinite life is reviewed annually to determine whether the indefinite life continues to be supportable. If not, the change in useful life from indefinite to finite is made on a prospective basis.
An intangible asset is derecognized upon disposal (i.e., at the date the recipient obtains control) or when no future economic benefits are expected from its use or disposal. Any gain or loss arising upon derecognition of the asset (calculated as the difference between the net disposal proceeds and the carrying amount of the asset) is included in the statement of profit or loss.
The useful life of relevant intangible assets was defined by internal employees, supported by independent appraiser reports.
If events or change in circumstances occur which indicate that the book value of an asset or group of assets may not be recoverable based on future cash flows, Management will adjust the balance to its recoverable value (Note 2.8.).
12.1 Goodwill
Goodwill is initially measured at cost (being the excess of the aggregate of the consideration transferred and the amount recognized for non-controlling interests and any previous interest held over the net identifiable assets acquired and liabilities assumed).
After initial recognition, goodwill is measured at cost less any accumulated impairment losses. For the purpose of impairment testing (Note 2.8.), goodwill acquired in a business combination is, from the acquisition date, allocated to the Group’s Cash Generating Units (“CGUs”) or group of CGUs, which will benefit from the synergies of the combination.
F-63
Moove Lubricants Holdings
Notes to the consolidated financial statements
For the years ended December 31, 2023, 2022 and 2021
(In thousands of Brazilian Reais (R$), unless otherwise stated)
| Cost | | Goodwill | | Trademarks¹ | | Customer relationship ² | | Software | | Rights of services and operations ² | | Other 3 | | TOTAL |
| At December 31, 2020 | | | 882,416 | | | | 54,208 | | | | 281,571 | | | | 64,849 | | | | 207,249 | | | | — | | | | 1,490,293 | |
| Additions for the year | | | — | | | | — | | | | — | | | | 374 | | | | — | | | | — | | | | 374 | |
| Disposals | | | (224 | ) | | | — | | | | — | | | | — | | | | — | | | | — | | | | (224 | ) |
| Transfers 4 | | | — | | | | — | | | | — | | | | 5,996 | | | | — | | | | — | | | | 5,996 | |
| Monetary variation 5 | | | — | | | | — | | | | — | | | | — | | | | 11,888 | | | | — | | | | 11,888 | |
| Effect of exchange rate fluctuations | | | 19,626 | | | | 3,232 | | | | 13,645 | | | | 95 | | | | (285 | ) | | | — | | | | 36,313 | |
| At December 31, 2021 | | | 901,818 | | | | 57,440 | | | | 295,216 | | | | 71,314 | | | | 218,852 | | | | — | | | | 1,544,640 | |
| Additions for the year | | | — | | | | — | | | | — | | | | 7 | | | | — | | | | 24,354 | | | | 24,361 | |
| Disposals | | | | | | | — | | | | — | | | | (11 | ) | | | — | | | | (16 | ) | | | (27 | ) |
| Transfers 4 | | | — | | | | — | | | | — | | | | 5,205 | | | | — | | | | — | | | | 5,205 | |
| Business Combination | | | 401,434 | | | | 98,381 | | | | 1,062,829 | | | | — | | | | — | | | | 16 | | | | 1,562,660 | |
| Monetary variation 5 | | | — | | | | — | | | | — | | | | 90 | | | | 32,032 | | | | 162 | | | | 32,284 | |
| Effect of exchange rate fluctuations | | | (6,985 | ) | | | (1,097 | ) | | | 44,397 | | | | (481 | ) | | | (27,665 | ) | | | — | | | | 8,169 | |
| At December 31, 2022 | | | 1,296,267 | | | | 154,724 | | | | 1,402,442 | | | | 76,124 | | | | 223,219 | | | | 24,516 | | | | 3,177,292 | |
| Additions for the year | | | — | | | | — | | | | — | | | | 16,280 | | | | — | | | | 36,939 | | | | 53,219 | |
| Disposals | | | — | | | | — | | | | — | | | | (1,855 | ) | | | — | | | | (138 | ) | | | (1,993 | ) |
| Transfers 4 | | | — | | | | — | | | | — | | | | 6,536 | | | | — | | | | 235 | | | | 6,771 | |
| Monetary variation 5 | | | — | | | | — | | | | — | | | | 218 | | | | 47,509 | | | | — | | | | 47,727 | |
| Effect of exchange rate fluctuations | | | (42,212 | ) | | | (8,443 | ) | | | (83,279 | ) | | | (741 | ) | | | (67,184 | ) | | | (891 | ) | | | (202,750 | ) |
| At December 31, 2023 | | | 1,254,055 | | | | 146,281 | | | | 1,319,163 | | | | 96,562 | | | | 203,544 | | | | 60,661 | | | | 3,080,266 | |
| | | | | | | | | | | | | | | | | | | | | | | | | | | | | |
| | | | | | | | | | | | | | | | | | | | | | | | | | | | | |
| Amortization | | | | | | | | | | | | | | | | | | | | | | | | | | | | |
| At December 31, 2020 | | | — | | | | — | | | | (111,315 | ) | | | (55,667 | ) | | | (54,153 | ) | | | — | | | | (221,135 | ) |
| Charge for the year | | | — | | | | — | | | | (22,401 | ) | | | (4,272 | ) | | | (16,695 | ) | | | — | | | | (43,368 | ) |
| Monetary variation 5 | | | — | | | | — | | | | — | | | | — | | | | (2,524 | ) | | | — | | | | (2,524 | ) |
| Effect of exchange rate fluctuations | | | — | | | | — | | | | (4,077 | ) | | | (40 | ) | | | (2,537 | ) | | | — | | | | (6,654 | ) |
| At December 31, 2021 | | | — | | | | — | | | | (137,793 | ) | | | (59,979 | ) | | | (75,909 | ) | | | — | | | | (273,681 | ) |
| Charge for the year | | | — | | | | — | | | | (86,338 | ) | | | (4,623 | ) | | | (7,354 | ) | | | — | | | | (98,315 | ) |
| Disposals | | | — | | | | — | | | | — | | | | 9 | | | | — | | | | — | | | | 9 | |
| Monetary variation 5 | | | — | | | | — | | | | — | | | | (22 | ) | | | (7,664 | ) | | | — | | | | (7,686 | ) |
| Effect of exchange rate fluctuations | | | — | | | | — | | | | 18,493 | | | | 369 | | | | 7,609 | | | | — | | | | 26,471 | |
| At December 31, 2022 | | | — | | | | — | | | | (205,638 | ) | | | (64,246 | ) | | | (83,318 | ) | | | — | | | | (353,202 | ) |
| Charge for the year | | | — | | | | — | | | | (124,574 | ) | | | (5,980 | ) | | | (7,122 | ) | | | (124 | ) | | | (137,800 | ) |
| Monetary variation 5 | | | — | | | | — | | | | — | | | | (83 | ) | | | (17,230 | ) | | | — | | | | (17,313 | ) |
| Effect of exchange rate fluctuations | | | — | | | | — | | | | 6,223 | | | | 243 | | | | 19,436 | | | | 1 | | | | 25,903 | |
| At December 31, 2023 | | | — | | | | — | | | | (323,989 | ) | | | (70,066 | ) | | | (88,234 | ) | | | (123 | ) | | | (482,412 | ) |
| | | | | | | | | | | | | | | | | | | | | | | | | | | | | |
F-64
Moove Lubricants Holdings
Notes to the consolidated financial statements
For the years ended December 31, 2023, 2022 and 2021
(In thousands of Brazilian Reais (R$), unless otherwise stated)
| At December 31, 2021 | | | 901,818 | | | | 57,440 | | | | 157,423 | | | | 11,335 | | | | 142,943 | | | | — | | | | 1,270,959 | |
| At December 31, 2022 | | | 1,296,267 | | | | 154,724 | | | | 1,196,804 | | | | 11,878 | | | | 139,901 | | | | 24,516 | | | | 2,824,090 | |
| At December 31, 2023 | | | 1,254,055 | | | | 146,281 | | | | 995,174 | | | | 26,496 | | | | 115,310 | | | | 60,538 | | | | 2,597,854 | |
| Annual amortization rates | | | Indefinite | | | | Indefinite | | | | 5% to 15% | | | | 20% to 33% | | | | 5 | % | | | 20 | % | | | | |
¹ Trademarks: the Group operates in the production and distribution of lubricants under the brand Comma, Medallion Plus, Dyna-Plex21C and Eco Ultra which has an undefined useful life.
² Customer relationship and rights of services and operations: client portfolio and agreements for right of use and operation arising from business combinations are initially recognized as intangible assets at fair value and amortized over the agreement period.
3 Other: the relevant additions for the period are due to intangible in progress.
4 There were transfers between construction in progress in Property, Plant and Equipment and Intangible assets. (Note 11.)
5 Argentina’s hyperinflation effect. (Note 2.5.)
F-65
Moove Lubricants Holdings
Notes to the consolidated financial statements
For the years ended December 31, 2023, 2022 and 2021
(In thousands of Brazilian Reais (R$), unless otherwise stated)
13. Right of use assets and lease liabilities
The Group leases warehouses, buildings, lands, vehicles, equipment, and machinery. The Group assesses at contract inception whether a contract is, or contains, a lease. That is, if the contract conveys the right to control the use of an identified asset for a period in exchange for consideration.
The Group applies the following recognition exemptions permitted by IFRS 16: (i) to short-term leases of less than 12 months; and (ii) to leases of assets that are considered to be of low value.
Lease payments on short-term leases and leases of low-value assets are recognized as an expense on a straight-line basis over the lease term.
The Group recognizes right-of-use assets at the commencement date of the lease (i.e., the date the underlying asset is available for use). Right-of-use assets are measured at cost, less any accumulated depreciation and impairment losses, and adjusted for any remeasurement of lease liabilities. The cost of right-of-use assets includes the amount of lease liabilities recognized, initial direct costs incurred, and lease payments made at or before the commencement date less any lease incentives received. Right-of-use assets are depreciated on a straight-line basis over the shorter of the lease term and the estimated useful lives of the assets.
At the commencement date of the lease, the Group recognizes lease liabilities measured at the present value of lease payments to be made over the lease term. The lease payments include fixed payments (including in-substance fixed payments) less any lease incentives receivable, variable lease payments that depend on an index or a rate, and amounts expected to be paid under residual value guarantees. The lease payments also include the exercise price of a purchase option reasonably certain to be exercised by the Group and payments of penalties for terminating the lease, if the lease term reflects the Group exercising the option to terminate.
Variable lease payments that do not depend on an index or a rate are recognized as expenses (unless they are incurred to produce inventories) in the period in which the event or condition that triggers the payment occurs.
In calculating the present value of lease payments, the Group uses its incremental borrowing rate at the lease commencement date because the interest rate implicit in the lease is not readily determinable. After the commencement date, the amount of lease liabilities is increased to reflect the accretion of interest and reduced for the lease payments made. In addition, the carrying amount of lease liabilities is remeasured if there is a modification, a change in the lease term, a change in the lease payments (e.g., changes to future payments resulting from a change in an index or rate used to determine such lease payments) or a change in the assessment of an option to purchase the underlying asset.
The amortization expense on the right-of-use asset is recognized in profit or loss in “Cost of sales and services” or “Operating expense”, depending on the characteristics of use of the leased asset, and the interest expense of discounting the lease liability to its present value is recognized in the “Financial results, net”.
The carrying amounts of right-of-use assets recognized and movements during the period are presented below:
F-66
Moove Lubricants Holdings
Notes to the consolidated financial statements
For the years ended December 31, 2023, 2022 and 2021
(In thousands of Brazilian Reais (R$), unless otherwise stated)
| Cost | | Land and buildings | | Machinery and equipment | | Vehicles | | Total |
| At December 31, 2020 | | | 38,286 | | | | 15,735 | | | | — | | | | 54,021 | |
| Additions and new contracts | | | 2,001 | | | | 19,593 | | | | 2,031 | | | | 23,625 | |
| Disposals | | | (1,280 | ) | | | (2,788 | ) | | | — | | | | (4,068 | ) |
| Exchange variation | | | 1,530 | | | | 2,515 | | | | (86 | ) | | | 3,959 | |
| At December 31, 2021 | | | 40,537 | | | | 35,055 | | | | 1,945 | | | | 77,537 | |
| Business Combination | | | 107,739 | | | | 2,693 | | | | 43 | | | | 110,475 | |
| Additions and new contracts | | | 24,438 | | | | 9,971 | | | | 4,483 | | | | 38,892 | |
| Disposals | | | (1,638 | ) | | | (724 | ) | | | (175 | ) | | | (2,537 | ) |
| Exchange rate variation | | | 4,829 | | | | (2,237 | ) | | | (282 | ) | | | 2,310 | |
| At December 31, 2022 | | | 175,905 | | | | 44,758 | | | | 6,014 | | | | 226,677 | |
| Additions and new contracts | | | 71,193 | | | | 11,975 | | | | 18,197 | | | | 101,365 | |
| Disposals | | | (2,162 | ) | | | (6,988 | ) | | | — | | | | (9,150 | ) |
| Exchange rate variation | | | (11,346 | ) | | | (11,589 | ) | | | (120 | ) | | | (23,055 | ) |
| At December 31, 2023 | | | 233,590 | | | | 38,156 | | | | 24,091 | | | | 295,837 | |
| | | | | | | | | | | | | | | | | |
| Amortization | | | | | | | | | | | | | | | | |
| At December 31, 2020 | | | (7,075 | ) | | | (7,376 | ) | | | — | | | | (14,451 | ) |
| Charge for the year | | | (5,450 | ) | | | (7,377 | ) | | | (1,358 | ) | | | (14,185 | ) |
| Disposals | | | 731 | | | | 2,229 | | | | — | | | | 2,960 | |
| Exchange variation | | | (265 | ) | | | (1,506 | ) | | | 33 | | | | (1,738 | ) |
| At December 31, 2021 | | | (12,059 | ) | | | (14,030 | ) | | | (1,325 | ) | | | (27,414 | ) |
| Charge for the year | | | (26,624 | ) | | | (5,242 | ) | | | (2,981 | ) | | | (34,847 | ) |
| Disposals | | | 262 | | | | 710 | | | | 943 | | | | 1,915 | |
| Exchange rate variation | | | 1,577 | | | | 1,246 | | | | 172 | | | | 2,995 | |
| At December 31, 2022 | | | (36,844 | ) | | | (17,316 | ) | | | (3,191 | ) | | | (57,351 | ) |
| Charge for the year | | | (40,740 | ) | | | (8,687 | ) | | | (6,207 | ) | | | (55,634 | ) |
| Disposals | | | 14 | | | | 1,077 | | | | — | | | | 1,091 | |
| Exchange rate variation | | | 2,911 | | | | 8,187 | | | | 118 | | | | 11,216 | |
| At December 31, 2023 | | | (74,659 | ) | | | (16,739 | ) | | | (9,278 | ) | | | (100,678 | ) |
| | | | | | | | | | | | | | | | | |
| Balance at 31 December 2021 | | | 28,478 | | | | 21,025 | | | | 620 | | | | 50,123 | |
| Balance at 31 December 2022 | | | 139,061 | | | | 27,442 | | | | 2,823 | | | | 169,326 | |
| Balance at 31 December 2023 | | | 158,931 | | | | 21,417 | | | | 14,811 | | | | 195,159 | |
The carrying amounts of lease liabilities and movements during the period are as follows:
| At December 31, 2020 | | | 41,299 | |
| Additions/Disposals | | | 21,539 | |
| Interest accrual | | | 2,678 | |
| Payment of rent | | | (11,031 | ) |
| Payment of interests | | | (2,657 | ) |
| Exchange variation | | | 1,608 | |
| At December 31, 2021 | | | 53,436 | |
| Additions/Disposals | | | 37,025 | |
| Business combination | | | 110,475 | |
| Interest accrual | | | 7,112 | |
| Payment of rent | | | (30,537 | ) |
| Payment of interests | | | (6,950 | ) |
| Exchange rate variation | | | (3,211 | ) |
| At December 31, 2022 | | | 167,350 | |
| Additions/Disposals | | | 92,010 | |
| Interest accrual | | | 10,220 | |
| Payment of rent | | | (48,171 | ) |
| Payment of interest | | | (10,065 | ) |
| Exchange rate variation | | | (11,681 | ) |
| At December 31, 2023 | | | 199,663 | |
F-67
Moove Lubricants Holdings
Notes to the consolidated financial statements
For the years ended December 31, 2023, 2022 and 2021
(In thousands of Brazilian Reais (R$), unless otherwise stated)
The following table sets out a maturity analysis of lease payments, presenting the contractual undiscounted cashflows after the reporting date.
| | | | 12/31/2023 | | | | 12/31/2022 | |
| Up to 1 year | | | 29,503 | | | | 42,446 | |
| 1 to 2 years | | | 31,920 | | | | 35,209 | |
| 3 to 5 years | | | 84,584 | | | | 65,843 | |
| More than 5 years | | | 49,152 | | | | 25,828 | |
| Total | | | 195,159 | | | | 169,326 | |
14. Loans and borrowings
Loans and borrowings are initially measured at fair value, net of directly attributable transaction costs.
After initial recognition, interest-bearing loans and borrowings are subsequently measured at amortized cost using the effective interest rate (EIR) method. Gains and losses are recognized in profit or loss when the liabilities are derecognized as well as through the EIR amortization process.
Amortized cost is calculated by taking into account any discount or premium on acquisition and fees or costs that are an integral part of the EIR. The EIR amortization is included as financial expense in the statement of profit or loss.
A financial liability is derecognized when the obligation under the liability is discharged or cancelled or expires. When an existing financial liability is replaced by another from the same lender on substantially different terms, or the terms of an existing liability are substantially modified, such an exchange or modification is treated as the derecognition of the original liability and the recognition of a new liability. The difference in the respective carrying amounts is recognized in the statement of profit or loss.
Loans and borrowings are classified as current liabilities unless there is an unconditional right to defer the payment of the liability for at least 12 months after the reporting date.
None of the borrowings include a swap agreement (derivative financial instruments) in 2023. In 2022 two borrowings include a swap agreement (derivative financial instruments). The US$30,000 thousands contract with an interest rate of 1.27% per year used the SWAP contract to change the index to CDI+0.70% per year and an amount of R$157,800. The US$20,000 thousand contract with an interest rate of 1.59% per year used the SWAP contract to change the index to CDI+0.80% per year and an amount of R$110,400.
In 2023, R$ 31,931 (R$ 44,813 in 2022) of the Group’s borrowings were guaranteed by sureties from related parties at an average annual cost of 0.23% in 2023 and 0.22% in 2022.
The loans and borrowings have indexes such as SOFR or CDI or are fixed. See below the amount in the following currencies and the average annual interest rate.
| | | | 12/31/2023 | | | | 12/31/2022 | |
| | | | Average annual rate | | | | Book value | | | | Average annual rate | | | | Book value | |
| Dollar (US$) | | | 6.22 | % | | | 2,207,028 | | | | 5.38 | % | | | 2,636,277 | |
| Pound Sterling (£) | | | | | | | — | | | | 1.90 | % | | | 125,707 | |
| Reais (R$) | | | | | | | — | | | | 15.47 | % | | | 100,170 | |
| | | | | | | | 2,207,028 | | | | | | | | 2,862,154 | |
Under the terms of the major borrowing facilities, since the Millennium Moove Corp loan has taken in 2022, the group is required to comply with the following financial covenants:
- Net Leverage Ratio less than 3.5x;
F-68
Moove Lubricants Holdings
Notes to the consolidated financial statements
For the years ended December 31, 2023, 2022 and 2021
(In thousands of Brazilian Reais (R$), unless otherwise stated)
- Interest Coverage Ratio greater than 2.5x.
The group has complied with these covenants throughout the reporting period. As at December 31, 2023, the Net Leverage Ratio was 1.09x and the Interest Coverage Ratio was 5.43x. As at December 31, 2022, the Net Leverage Ratio was 2.65x and the Interest Coverage Ratio was 3.31x.
The changes in loans and borrowings are as follows:
| At December 31, 2020 | | | 802,938 | |
| Addition | | | 418,666 | |
| Payment of principal | | | (431,549 | ) |
| Payment of interest | | | (17,098 | ) |
| Exchange variation | | | 23,349 | |
| Interest accrual and others | | | 34,842 | |
| At December 31, 2021 | | | 831,148 | |
| Addition | | | 2,229,887 | |
| Payment of principal | | | (272,252 | ) |
| Payment of interest | | | (72,483 | ) |
| Exchange rate variation | | | 53,431 | |
| Interest accrual and others | | | 92,423 | |
| At December 31, 2022 | | | 2,862,154 | |
| Payment of principal | | | (469,398 | ) |
| Payment of interest | | | (166,328 | ) |
| Exchange rate variation | | | (200,648 | ) |
| Interest accrual and others | | | 181,248 | |
| At December 31, 2023 | | | 2,207,028 | |
Loans maturities are as follows:
| | | 12/31/2023 | | 12/31/2022 |
| Up to 12 months | | | | 671,110 | | | | 497,146 | |
| 13 to 24 months | | | | 622,453 | | | | 45,124 | |
| 25 to 36 months | | | | 622,453 | | | | 782,655 | |
| 37 to 48 months | | | | 311,226 | | | | 782,655 | |
| Over 49 months | | | | — | | | | 782,655 | |
| | | | | 2,227,242 | | | | 2,890,235 | |
15. Strategic Alliance Payables
In 2018 the Group entered in an agreement with Exxon Mobil, which grants to Cosan Lubrificantes e Especialidades S.A., Cosan Lubrificantes S.R.L and Cosan Paraguay Sociedad Anonima the right to manufacture, import, distribute and sell lubricants and other products related to the Mobil brand. This agreement is a strategic alliance, non-sublicensable and non-transferable. At December 31, 2023 the total contract liability is US$ 39,268 thousands that will be paid in annual installments, until 30 November 2038.
This is composed of: (i) consideration payable related to the intangible asset of the contract with ExxonMobil in the amount of R$ 153,595 (R$ 175,247 on December 31, 2022) and (ii) variable consideration and royalties payable of R$ 49,499 (R$ 51,438 on December 31, 2022).
F-69
Moove Lubricants Holdings
Notes to the consolidated financial statements
For the years ended December 31, 2023, 2022 and 2021
(In thousands of Brazilian Reais (R$), unless otherwise stated)
| | | | 12/31/2023 | | | | 12/31/2022 | |
| Short-term Royalties Consideration Exxon Mobil | | | 35,354 | | | | 37,424 | |
| Short-term Fixed Consideration Exxon Mobil | | | 8,014 | | | | 8,946 | |
| Short-term Variable Consideration Exxon Mobil | | | 14,145 | | | | 14,014 | |
| | | | 57,513 | | | | 60,384 | |
| | | | | | | | | |
| Long-term Fixed Consideration Exxon Mobil | | | 145,581 | | | | 166,301 | |
| | | | 145,581 | | | | 166,301 | |
| | | | | | | | | |
| Strategic alliance payable | | | 203,094 | | | | 226,685 | |
The table below shows the changes in the strategic alliance payable:
| At 31 December 2020 | | | 224,787 | |
| Addition | | | 43,253 | |
| Payments | | | (51,722 | ) |
| Exchange variation | | | 18,642 | |
| At 31 December 2021 | | | 234,960 | |
| Addition | | | 44,371 | |
| Payments | | | (47,240 | ) |
| Exchange rate variation | | | (5,406 | ) |
| At 31 December 2022 | | | 226,685 | |
| Addition | | | 32,835 | |
| Payments | | | (48,008 | ) |
| Exchange rate variation | | | (8,418 | ) |
| At 31 December 2023 | | | 203,094 | |
16. Taxation
16.1. Income Taxes
The current income tax is calculated based on tax rates and laws enacted or substantially enacted up to the reporting date in the countries where the Group operates and generates income.
The amounts recognized in profit or losses are detailed bellow:
| | | 12/31/2023 | | 12/31/2022 | | 12/31/2021 |
| Current income tax | | | | | | | | | | | | |
| Movement in respect of prior year tax adjustment¹ | | | 35,741 | | | | (74,550 | ) | | | (3,717 | ) |
| Movement in respect of current year tax | | | (332,393 | ) | | | 29,137 | | | | (78,019 | ) |
| Total current income tax | | | (296,652 | ) | | | (45,413 | ) | | | (81,736 | ) |
| | | | | | | | | | | | | |
| Deferred tax | | | | | | | | | | | | |
| Movement in respect of prior year tax adjustment¹ | | | 47,297 | | | | (29,923 | ) | | | — | |
| Movement in respect of current year tax | | | (85,893 | ) | | | 101,667 | | | | (66,177 | ) |
| Total Deferred tax | | | (38,596 | ) | | | 71,744 | | | | (66,177 | ) |
| | | | | | | | | | | | | |
| Total tax | | | (335,248 | ) | | | 26,331 | | | | (147,913 | ) |
¹ In 2022 the company had recognized an out of period tax benefit, however this was disallowed in April of 2023 by a ruling of the Superior Justice Tribunal affecting corporate income taxpayers in Brazil.
F-70
Moove Lubricants Holdings
Notes to the consolidated financial statements
For the years ended December 31, 2023, 2022 and 2021
(In thousands of Brazilian Reais (R$), unless otherwise stated)
The following is a reconciliation of income tax expenses starting from the reported pretax profit (loss) for the year, applying the combined Brazilian statutory rate of 34%:
| | | 12/31/2023 | | 12/31/2022 | | 12/31/2021 |
| Profit before Income Tax | | | 601,233 | | | | 387,849 | | | | 438,022 | |
| Income Tax nominal rate - 34% | | | (204,419 | ) | | | (131,869 | ) | | | (148,928 | ) |
| | | | | | | | | | | | | |
| Adjustments to determine the effective rate | | | | | | | | | | | | |
| Adjustments in respect of current income tax of previous years¹ | | | (47,095 | ) | | | 104,472 | | | | 3,717 | |
| Current year tax benefits¹ | | | 2,544 | | | | 77,130 | | | | 18,349 | |
Differences in tax rates on earnings / losses of overseas companies
outside of Brazil² | | | (12,539 | ) | | | 25,371 | | | | 11,899 | |
| Deferred tax not recognized | | | (54,493 | ) | | | (32,760 | ) | | | (3,460 | ) |
| Non-deductible expenses (donations, gifts etc.) | | | (8,795 | ) | | | (16,017 | ) | | | (30,736 | ) |
| Other | | | (10,451 | ) | | | 3 | | | | 1,247 | |
| Income tax (expense) benefit current and deferred | | | (335,248 | ) | | | 26,331 | | | | (147,913 | ) |
| | | | | | | | | | | | | |
| Effective Tax Rate | | | 56 | % | | | -7 | % | | | 34 | % |
¹ In 2022 the company had recognized an out of period tax benefit, however this was disallowed in April of 2023 the Superior Justice Tribunal.
² Refers to the difference between the nominal rate of the Group and its subsidiaries.
16.2. Current income tax
The current income tax is the tax payable or receivable on taxable profit or loss for the year, considering the enacted rates in effect on the reporting date, as well as adjustments to taxes payable applicable to the prior fiscal years.
16.3. Deferred income tax
Deferred tax is measured by the rates the Group expects will be applied to temporary differences upon their reversal.
The balance of deferred taxes is recognized based on all temporary differences originated between the book value of the assets and liabilities and the respective amounts for tax, but not reversed by the reporting date of the financial position, except if:
| I. | The recognition of assets for deferred taxes is limited to the extent it is likely that these taxes are recovered via reversal of liabilities by deferred taxes or other future taxable profits; and |
| II. | Any balances of deferred tax assets are reversed if and when all conditions for the withholding of taxes associated with licenses have been met. |
The balances of deferred tax assets are not recognized based on permanent differences, except for business combinations, when the deferred tax is recognized based on differences between the fair values of assets acquired and the future tax deductions available to them and the differences between the fair value of liabilities and the tax amount to be assessed. Deferred tax is determined using the tax rates and tax laws enacted or substantially enacted on the reporting date.
Deferred taxes on assets and liabilities are offset when there is a legal right to offset current tax assets and liabilities and if they pertain to taxes imposed by the same tax authority on the same taxable entity.
F-71
Moove Lubricants Holdings
Notes to the consolidated financial statements
For the years ended December 31, 2023, 2022 and 2021
(In thousands of Brazilian Reais (R$), unless otherwise stated)
I. Tax exposure
When determining the current and deferred tax value, the Group considers the impact of uncertain tax positions and whether any additional taxes and interest are payable. This assessment is based on estimates and guidelines and may involve a series of judgments on future events. New information may become available, which could cause the Group to modify its judgment with regard existing tax liabilities, with such changes in tax obligations impacting tax expenses in the period in which the determination is made.
II. Recoverability of deferred income taxes
The recognition and value of deferred taxes depend on the use of estimates related to the Group’s future performance. Deferred taxes assets are only recognized when there is reasonable expectation about the future taxable profits.
When assessing the recoverability of deferred taxes, the Management considers projections of future taxable profit and the changes to temporary differences. These estimates are included in a long-term plan, which is revised annually by Management and submitted to the Board of Directors for approval. This plan is prepared based on macroeconomic variables, such as foreign exchange and interest rates; industry variables as projected supply/demand curves and sales prices; and operating variables as projected production costs and volumes. These variables combined determine the degree of the Group’s judgment of these assumptions and uncertainties regarding their realization.
When it is unlikely that all or parts of the taxes will be recognized, the tax asset is reversed. With the exception of Argentina, where the term for using the tax loss is 5 years and where is no limits to its use, there is no specific period for the use of tax losses and negative tax bases in the other countries, but the use of these accrued losses from prior years is limited in some of the Company’s subsidiaries.
III. Deferred tax balances
The tax effects of temporary differences that originate from the Group's deferred tax assets and liabilities are presented below:
| | | 12/31/2023 | | 12/31/2022 |
| Assets credits of: | | | | | | | | |
| Income tax loss carryforwards | | | 180,863 | | | | 266,117 | |
| | | | | | | | | |
| Temporary differences | | | | | | | | |
| Foreign exchange - Loans and borrowings | | | 8,568 | | | | 4,072 | |
| Provisions for employee benefits | | | 45,487 | | | | 39,034 | |
| Unrealized (losses) / gains on derivatives instruments | | | 915 | | | | 8,628 | |
| Allowance for doubtful accounts | | | 3,591 | | | | 3,189 | |
| Impairment of tax credit | | | 35,091 | | | | 32,339 | |
| Provisions | | | 79,071 | | | | 130,538 | |
| Interest expense limitation | | | 101,101 | | | | 83,791 | |
| Intangibles assets | | | 136,834 | | | | 125,963 | |
| | | | 410,658 | | | | 427,554 | |
| | | | | | | | | |
| Deferred Tax Assets | | | 591,521 | | | | 693,671 | |
F-72
Moove Lubricants Holdings
Notes to the consolidated financial statements
For the years ended December 31, 2023, 2022 and 2021
(In thousands of Brazilian Reais (R$), unless otherwise stated)
| | | | | | | | | |
| Liabilities credits of: | | | | | | | | |
| Legal proceedings provision | | | (25 | ) | | | (25 | ) |
| Business combination – Property, plant and equipment | | | (90,757 | ) | | | (120,233 | ) |
| Tax deductible goodwill¹ | | | (587,948 | ) | | | (606,946 | ) |
| Capital allowance | | | (12,028 | ) | | | (15,590 | ) |
| Deferred Tax Liabilities | | | (690,758 | ) | | | (742,794 | ) |
| | | | | | | | | |
| Total of deferred taxes recorded | | | (99,237 | ) | | | (49,123 | ) |
| | | | | | | | | |
| | | | 12/31/2023 | | | | 12/31/2022 | |
| Deferred income tax – Assets | | | 16,215 | | | | 78,556 | |
| Deferred income tax - Liabilities | | | (115,452 | ) | | | (127,679 | ) |
| | | | (99,237 | ) | | | (49,123 | ) |
¹ The variation between the periods is due to exchange variation, considering that the original balance is in US dollars.
IV. Unrecognized deferred tax
The Group has accumulated tax loss carryforwards in some subsidiaries in the amount of R$ 352,990 (R$139,972 on December 31, 2022) for which a deferred tax asset was not recognized (R$ 90,829 on December 31, 2023 and R$ 36,413 on December 31,2022) and are available indefinitely for offsetting against future taxable profits of the companies in which the losses arose, except for Argentina (R$ 94,837 on December 31,2023 and zero on December 31, 2022), where the period for using tax losses carryforwards is 5 years. Deferred tax assets have not been recognized with respect of these losses as they cannot be used to offset taxable profits between subsidiaries of the Group, and there is no other evidence of recoverability in the near future.
V. Pillar Two considerations
In 2023 several countries enacted tax regulations aimed to implement the global anti-erosion tax base model rules (GloBE model rules) that are part of the project called "Pillar Two" and coordinated by the Organization for Economic Cooperation and Development (OECD), this legislation raised concerns about the calculation of deferred tax assets and liabilities in the context of IAS 12 - Income Taxes.
Facing this scenario, the IASB proposed changes to IAS 12. These changes brought a mandatory temporary exemption regarding the recognition and disclosure of deferred tax assets and liabilities related to Pillar Two income taxes (item 4A of IAS 12). The Group reports that this temporary exemption was applied on December 31, 2023.
Until the issue date of these Financial Statements, no material impact has been identified related to Pillar Two.
17. Share-based payments
17.1. Moove Phantom Share Program
On July 31, 2019, the Group granted a Long-Term Incentive Plan (LTIP): “Moove Phantom Shares”. It is a phantom share plan, in which a specific number of units referenced to a theoretical price of shares calculated based on the Group’s EBITDA of each year, is granted nominally to beneficiaries. The units will be paid in cash, upon fulfilment of the contractual conditions and 3 to 5 years of vesting period. Payments happen at the end of each vesting cycle, based on the referenced converted value of the share at that time.
The provision for future payment is accrued monthly based on EBITDA projections which are reviewed every quarter-end by Management. The amounts are recognized as a financial liability against the Statement of Profit or Loss.
F-73
Moove Lubricants Holdings
Notes to the consolidated financial statements
For the years ended December 31, 2023, 2022 and 2021
(In thousands of Brazilian Reais (R$), unless otherwise stated)
The election of beneficiaries to the program is discussed and voted on by the Board of Directors and the Remuneration Committee of the Group. This type of plan aims to reward and retain the key employees of the Group.
The unit fair value at December 31, 2023 is R$ 237.81, R$ 170.67 at December 31, 2022 and R$ 158.32 at December 31, 2021.
The phantom shares plan in effect is as follow:
| Program | | Grant date | | Vesting date | | Group | | Nº of Shares at Grant Date | | Unit Fair Value at Grant Date (R$) |
| Moove Phantom Share - I | | 7/31/2019 | | 07/31/2024 | | CLE | | | 95,653 | | | | | |
| | | | (5 years) | | Moove Lubricant Limited | | | 37,017 | | | | | |
| | | | | | | Subtotal | | | 132,670 | | | | 50.79 | |
| Moove Phantom Share - II | | 7/31/2020 | | 07/31/2025
| | CLE | | | 83,684 | | | | | |
| | | | (5 years) | | Moove Lubricant Limited | | | 21,168 | | | | | |
| | | | | | Cosan Argentina | | | 2,100 | | | | | |
| | | | | | | Subtotal | | | 106,952 | | | | 61.89 | |
| Moove Phantom Share - III | | 7/31/2021 | | 07/31/2024
| | CLE | | | 66,370 | | | | | |
| | | | (3 years) | | Moove Lubricant Limited | | | 730 | | | | | |
| | | | | | Cosan Argentina | | | 13,629 | | | | | |
| | | | | | | Subtotal | | | 80,729 | | | | 102.73 | |
| | | | | | CLE | | | 55,168 | | | | | |
| Moove Phantom Share - IV | | 7/31/2022 | | 07/31/2025
| | Moove Lubricant Limited | | | 10,829 | | | | | |
| | | | (3 years) | | Cosan Argentina | | | 482 | | | | | |
| | | | | | PetroChoice LLC | | | 11,488 | | | | | |
| | | | | | | Subtotal | | | 77,967 | | | | 135.05 | |
| | | | | | CLE | | | 55,178 | | | | | |
| Moove Phantom Share - V | | 7/31/2023 | | 07/31/2026
| | Moove Lubricant Limited | | | 8,428 | | | | | |
| | | | (3 years) | | Cosan Argentina | | | 465 | | | | | |
| | | | | | PetroChoice LLC | | | 18,133 | | | | | |
| | | | | | | Subtotal | | | 82,204 | | | | 150.98 | |
| | | | | | | Total | | | 480,522 | | | | | |
The movements in the number of phantom shares were presented below:
| Units in December 31, 2020 | | | 239,622 | |
| Granted | | | 80,729 | |
| Units in December 31, 2021 | | | 320,351 | |
| Granted | | | 77,967 | |
| Forfeited/ Cancelled | | | (33,940 | ) |
| Exercised | | | (263 | ) |
| Units in December 31, 2022 | | | 364,115 | |
| Granted | | | 82,204 | |
| Forfeited/ Cancelled | | | (55,134 | ) |
| Exercised | | | (5,707 | ) |
| Units in December 31, 2023 | | | 385,478 | |
F-74
Moove Lubricants Holdings
Notes to the consolidated financial statements
For the years ended December 31, 2023, 2022 and 2021
(In thousands of Brazilian Reais (R$), unless otherwise stated)
The phantom shares accruals were:
| Accrual in December 31, 2020 | | | | 5,906 | |
| Additions | | | | 11,664 | |
| Accrual in December 31, 2021 | | | | 17,570 | |
| Additions | | | | 14,589 | |
| Accrual in December 31, 2022 | | | | 32,159 | |
| Additions | | | | 53,735 | |
| Accrual in December 31, 2023 | | | | 85,894 | |
| | | | 12/31/2023 | | | | 12/31/2022 | | | | 12/31/2021 | |
| Units issue | | | 24,075 | | | | 13,928 | | | | 6,284 | |
| Fair Value update | | | 61,819 | | | | 18,231 | | | | 11,286 | |
| Accrual | | | 85,894 | | | | 32,159 | | | | 17,570 | |
The Unit value is determined based on two main variables – EBITDA and Net Debt (Financial Debt minus Cash and Cash Equivalents) - and three other secondary variables – Industry EBITDA/EV multiple, Exit Rate and Charges.
Sensitivity analysis related to changes in Unit Fair Value using the key variables which determine it, are as follows:
| | | | -5% | | | | Base | | | | 5% | |
| EBITDA¹ | | | 1,134,102 | | | | 1,193,792 | | | | 1,253,482 | |
| Unit Fair Value | | | 223.16 | | | | 237.81 | | | | 252.45 | |
| | | | | | | | | | | | | |
| | | | -5% | | | | Base | | | | 5% | |
| Net Debt ² | | | 1,599,402 | | | | 1,683,581 | | | | 1,767,760 | |
| Unit Fair Value | | | 240.56 | | | | 237.81 | | | | 235.05 | |
¹ EBITDA considers the amount from December 2022 to November 2023.
² Net debt is calculated using the average (from December 2022 to November 2023) of loans and borrowings minus the average (from December 2022 to November 2023 cash and equivalents).
17.2. Moove Special Program and Stock Option Plan
In July 2022 the Group granted an incentive plan referred to as the Moove Special Program for the Senior Management pursuant to which 615,362 units were granted at a unit fair value of R$ 50.05. In a similar way to the Phantom Share Program, units referenced a theoretical share price calculated based on the Group’s EBITDA and an EBITDA/EV multiple. The payable amounts were recognized as a financial liability and the corresponding expense in profit or loss. The accrual on December 31, 2022 was R$ 44,672 and in July 2023 the plan was suspended and replaced by the Stock Option Plan.
In 2023 an incentive program called “Stock Option Plan - SOP” was created. The incentive program is conditioned on length of service (service condition) and linked to the occurrence of a liquidity event defined in the program (performance conditions). The options granted to participants may only be exercised after they vest, and the maximum period for exercising the options is 6 (six) years from the date of grant. The exercise price of the options covered by this Program varies between R$50.05 and R$135.05 (“Exercise Price”) and are paid through the delivery of equity instruments, simultaneously with the formalization of the subscription or purchase. To measure fair value, the binomial model is used with assumptions such as price of the base asset, distribution of dividends (0% dividend yield), exercise price according to each Model within the program, expected average exit rate, risk-free rate, volatility and effect of lock-up linked to the exercise of options.
F-75
Moove Lubricants Holdings
Notes to the consolidated financial statements
For the years ended December 31, 2023, 2022 and 2021
(In thousands of Brazilian Reais (R$), unless otherwise stated)
The grant took place on July 1, 2023. The accrual amount in 2023 is R$10,306 (nil in 2022 and 2021) and was recognized as an expense in profit or loss and corresponding increase to equity.
On December 31, 2023, the Stock Option Plan in effect is as follows:
| Program | | Grant date | | Vesting date | | Nº of Shares at Grant Date | | Unit Fair Value at Grant Date (R$) |
| SOP Program A | | 7/1/2023 | | 12/31/2025 | | | 699,276 | | | | 142.62 | |
| SOP Program B | | 7/1/2023 | | 12/31/2025 | | | 279,710 | | | | 88.32 | |
| SOP Program C | | 7/1/2023 | | 12/31/2025 | | | 223,768 | | | | 76.54 | |
| SOP Program D | | 7/1/2023 | | 12/31/2025 | | | 139,855 | | | | 71.45 | |
| | | | | Total | | | 1,342,609 | | | | | |
The movements in the number of Stock Option Plan shares and accrual are presented below:
| | | Units | | Accrual |
| | In December 31, 2022 | | | | — | | | | — | |
| | Granted/additions | | | | 1,342,609 | | | | 10,306 | |
| | In December 31, 2023 | | | | 1,342,609 | | | | 10,306 | |
18. Employee benefits
18.1. Retention Plan
In 2021 a remuneration program referred to as the “Retention Plan - Special bonus” was created. It is a two-year program available to Cosan Lubrificantes S.R.L., CLE, Cosan Lubrificantes España S.L.U., Moove Lubricants Limited and Lubigrupo II - Comércio e Distribuição de Lubrificantes S.A.. Payments are made at the end of each cycle, based on the fixed value of salaries and wages contracted at that time. The concession cycle is revised on an annual basis, and the provision is updated on a quarterly basis with the payment occurring every August. The amounts are recognized as a financial liability and the corresponding expense in profit or loss. The accrual amount in 2023 is R$ 1,524 (R$ 386 in 2022 and R$201 in 2021).
18.2. Post-employment benefits
The cost of defined benefit pension plans and other post-employment benefits including the present value of the pension obligation is determined using actuarial valuations. An actuarial valuation involves the use of various assumptions which may differ from actual results in the future. These include the determination of the discount rate, future salary increases, mortality rates and future pension increases. A defined benefit obligation is highly sensitive to changes in these assumptions. All assumptions are reviewed by management at each reporting date.
On December 31, 2018 a contract between Cosan Lubrificantes e Especialidades S.A. and Cosan S.A. was signed to transfer the assets and liabilities related to the fuels business, upon the acquisition of Esso Brasileira de Petróleo Ltda. (“Esso”). This includes the post-employment benefits of Futura and Futura II. The first plan is fully refunded by Cosan S.A., and the second plan is 80% refunded by Cosan. S.A..
F-76
Moove Lubricants Holdings
Notes to the consolidated financial statements
For the years ended December 31, 2023, 2022 and 2021
(In thousands of Brazilian Reais (R$), unless otherwise stated)
The amounts recognized in Statement of Financial Position for post-employment benefits is as follows:
| | | | 12/31/2023 | | | | 12/31/2022 | |
| Futura | | | 175,150 | | | | 127,473 | |
| Other post-employment benefits | | | — | | | | 181 | |
| | | | 175,150 | | | | 127,654 | |
18.2.1. Defined contribution (Futura II)
A defined contribution plan is a post-employment benefit plan under which an entity pays fixed contributions into a separate entity and has no legal or constructive obligation to pay further amounts. Obligations for contributions to defined contribution plans are recognized as an employee benefit expense in the profit or loss account in the periods during which related services are rendered by employees.
The Group provides defined contribution plan to Cosan Lubrificantes e Especialidades S.A.’s employees. The plan assets are held in Futura II plan (Futura II – Supplementary Pension Entity). The Company and its subsidiaries do not have a legal or constructive obligation to pay further contributions if the fund does not have sufficient assets to pay all of the benefits owed.
During the year ended December 31, 2023, the net amount of the defined contribution recognized in the Statement of Profit or Loss is R$ 330 (R$ 303 at December 31, 2022).
18.2.2. Defined benefits (Futura)
The Group is the sponsor of a defined benefit pension plan for some of its employees. This plan has been closed to new members since May 5, 2011 after approval by the competent authorities.
The liability recognized in the Statement of Financial Position in respect of defined benefit pension plans is the present value of the defined benefit obligation at the end of the reporting period less the fair value of the plan assets. The defined benefit obligation is calculated annually by independent actuaries using the projected unit credit method.
The present value of the defined benefit obligation is determined by discounting the estimated future cash outflows, using interest rates that are denominated in the currency in which the benefits will be paid, and that have terms approximating to the terms of the related obligation. Gains and losses arising from experience adjustments and changes in actuarial assumptions are recognized in the period in which they occur, directly in other comprehensive income. Changes in the present value of the defined benefit obligation resulting from plan amendments or curtailments are recognized immediately in profit or loss as past service costs. Interest on actuarial obligation is recognized as operational expenses on the Statement of Profit or Loss.
Some of the Group’s pension plan, even though it is substantially defined contribution, has a variable component, whose risk is linked to the payment of minimum benefit and to the increase of the future contributions of the sponsors in the benefits in the event of Death Tax of the active taxpayer as well as in Disability Retirement, limited to three times salary. Any actuarial liability calculated is recorded by the Group.
The main actuarial risks are:
F-77
Moove Lubricants Holdings
Notes to the consolidated financial statements
For the years ended December 31, 2023, 2022 and 2021
(In thousands of Brazilian Reais (R$), unless otherwise stated)
| I. | Higher survival to that specified in mortality tables; |
| II. | The return on equity under the actuarial discount rate plus the accumulated IGP-DI; and |
| III. | Number of dependents in the same household. |
The Company’s subsidiary, Cosan Lubrificantes e Especialidades S.A., sponsors Futura – Entidade de Previdência Complementar (“Futura”), former Previd Exxon – Supplementary Pension Entity, which is mainly focused on complementary benefits, within certain limits established in the Retirement Plan rules.
On December 31, 2018, Cosan Lubrificantes e Especialidades S.A. and Cosan S.A. entered into agreement whereby Cosan S.A. assumed assets and liabilities related to fuel business by making a capital contribution to Cosan Lubrificantes e Especialidades S.A. for the net amount of R$ 75 million. While the assets and liabilities remain legally on the balance sheet of Cosan Lubrificantes e Especialidades S.A., under this agreement the related movements in these assets and liabilities are refundable by Cosan S.A. This pension scheme is under this agreement.
During the year ended December 31, 2023, the amounts of contributions amounted to R$ (13,199) (R$ (60,827) on December 31, 2022 and R$ (5,166) on December 31, 2021). The weighted average duration of the plan is 8.9 years (8.7 years on December 31, 2022 and 9.6 on December 31, 2021). The contribution expected to be made next year is R$13,316 (R$11,755 on December 31, 2022 and R$60,560 on December 31, 2021) related to this defined benefit plan.
The maturity profile of the defined benefit obligation is:
| | | | 12/31/2023 | | | | 12/31/2022 | |
| Expected benefits payments for December 2023 | | | — | | | | 63,471 | |
| Expected benefits payments for December 2024 | | | 61,382 | | | | 59,795 | |
| Expected benefits payments for December 2025 | | | 62,309 | | | | 60,953 | |
| Expected benefits payments for December 2026 to 2033 | | | 537,987 | | | | 457,898 | |
Details of the present value of the defined-benefit obligation and of the fair value of the plan’s assets are as follows:
| | | 12/31/2023 | | 12/31/2022 |
| Initial defined benefit obligation | | | 649,040 | | | | 683,655 | |
| Interest on actuarial obligation | | | 61,916 | | | | 56,528 | |
| Actuarial (gain) loss - financial assumptions | | | 39,054 | | | | (62,088 | ) |
| Actuarial loss - experience assumptions | | | 7,183 | | | | 28,948 | |
| Benefits paid | | | (58,301 | ) | | | (58,003 | ) |
| Final defined benefit obligation | | | 698,892 | | | | 649,040 | |
| | | | | | | | | |
| Initial fair value of plan assets | | | (521,568 | ) | | | (484,895 | ) |
| Interest income | | | (49,720 | ) | | | (41,971 | ) |
| Return on plan assets | | | 2,299 | | | | 8,156 | |
| Contributions from the employer | | | (13,055 | ) | | | (60,861 | ) |
| Benefits paid | | | 58,302 | | | | 58,004 | |
| Final fair value of the plan’s assets | | | (523,742 | ) | | | (521,567 | ) |
| | | | | | | | | |
| Deficit for the period | | | 175,150 | | | | 127,473 | |
| | | | | | | | | |
| Net liability of defined benefit | | | 175,150 | | | | 127,473 | |
F-78
Moove Lubricants Holdings
Notes to the consolidated financial statements
For the years ended December 31, 2023, 2022 and 2021
(In thousands of Brazilian Reais (R$), unless otherwise stated)
The total expense recognized in the profit or loss account is as follows:
| | | | 12/31/2023 | | | | 12/31/2022 | | | | 12/31/2021 | |
| Interest on actuarial obligation | | | 12,196 | | | | 14,557 | | | | 11,637 | |
| | | | 12,196 | | | | 14,557 | | | | 11,637 | |
The total amount recognized as other comprehensive income:
| | | | 12/31/2023 | | | | 12/31/2022 | | | | 12/31/2021 | |
| Actuarial (gain) loss - financial assumptions | | | 39,054 | | | | (62,088 | ) | | | (77,055 | ) |
| Actuarial loss - experience assumptions | | | 7,183 | | | | 28,948 | | | | 81,479 | |
| Return on plan assets | | | 2,299 | | | | 8,156 | | | | 23,930 | |
| | | | 48,536 | | | | (24,984 | ) | | | 28,354 | |
The plan’s assets are broken down as follows:
| | | | 12/31/2023 | | | | 12/31/2022 | |
| | | | Value | | | | % | | | | Value | | | | % | |
| Government bonds | | | 523,743 | | | | 100.00 | % | | | 496,950 | | | | 95.28 | % |
| Other | | | — | | | | 0.00 | % | | | 24,618 | | | | 4.72 | % |
| | | | 523,743 | | | | 100.00 | % | | | 521,568 | | | | 100.00 | % |
The main assumptions used to determine the Group’s benefit obligations are as follows:
| | | | 12/31/2023 | | | | 12/31/2022 | |
| Discount rate | | | 9.29 | % | | | 10.03 | % |
| Inflation rate | | | 3.50 | % | | | 3.50 | % |
| Future pension increases | | | 3.50 | % | | | 3.50 | % |
Changes in the discount rate at the reporting date are considered the only significant actuarial assumption. if the following changes to the discount rate occurred, they would have affected the defined benefit obligation as shown below:
| | | Discount Rate |
| | | | 12/31/2023 | | | | 12/31/2022 | |
| | | | Increase 0.50% | | | | Reduction (0.50%) | | | | Increase 0.50% | | | | Reduction (0.50%) | |
| Futura | | | 672,044 | | | | 727,827 | | | | 624,936 | | | | 674,988 | |
19. Contingent liabilities and deposits
The Group is party to tax, labor, civil and environmental administrative proceedings and litigation. The provision for contingent liabilities is estimated and periodically adjusted by Management based on their evaluation and supported by the opinion of internal and external counsels and is subject to a high level of judgment.
Provisions for legal proceedings are recognized as a non-current liability in the Statement of Financial Position with the corresponding expense recognized in “Other operating income (expenses), net” in the Statements of Profit or Loss when the Group has a present legal or constructive obligation as a result of past events; it is probable that an outflow of resources will be required to settle the obligation; and the amount can be reliably estimated.
F-79
Moove Lubricants Holdings
Notes to the consolidated financial statements
For the years ended December 31, 2023, 2022 and 2021
(In thousands of Brazilian Reais (R$), unless otherwise stated)
The assessment of probability of loss includes the available evidence, hierarchy of laws, jurisprudence, the most recent court decisions and relevance in the legal system, as well as the opinion of external counsel. Provisions are reviewed and adjusted according to specific circumstances, such as any limitation period, the conclusions of tax inspections or additional liabilities identified based on new matters or court decisions.
Judicial deposits are cash deposits made in connection with judicial or administrative proceedings which the Group is involved in. They are recognized as a non-current asset until they are either (i) used to liquidated obligations related to the legal proceedings to which they were connected; or (ii) recovered and, therefore, reclassified to cash and cash and equivalents.
On December 31, 2023, 2022 and 2021, the Group had provisions for tax, civil, environmental, and labor losses and deposits related to:
| | | Provision |
| | | | 12/31/2023 | | | | 12/31/2022 | |
| Tax | | | 422,167 | | | | 410,320 | |
| Civil and environmental | | | 55,749 | | | | 220,093 | |
| Labor | | | 7,625 | | | | 8,752 | |
| | | | 485,541 | | | | 639,165 | |
| | | | Judicial deposits | |
| | | | 12/31/2023 | | | | 12/31/2022 | |
| Tax | | | 159,504 | | | | 141,542 | |
| Civil and environmental | | | 6,887 | | | | 9,964 | |
| Labor | | | 803 | | | | 1,853 | |
| | | | 167,194 | | | | 153,359 | |
| | | Tax | | Civil and environmental | | Labor | | Total |
| At 31 December 2020 | | | 392,232 | | | | 101,418 | | | | 11,089 | | | | 504,739 | |
| Additional provisions | | | 5,461 | | | | 13,690 | | | | 4,371 | | | | 23,522 | |
| Settlement / Write-offs | | | (19,059 | ) | | | (5,274 | ) | | | (5,795 | ) | | | (30,128 | ) |
| Monetary variation ¹ | | | 7,106 | | | | 9,569 | | | | 1,135 | | | | 17,810 | |
| At 31 December 2021 | | | 385,740 | | | | 119,403 | | | | 10,800 | | | | 515,943 | |
| Additional provisions | | | 9,149 | | | | 49,277 | | | | 1,106 | | | | 59,532 | |
| Settlement / Write-offs | | | (9,042 | ) | | | (92,427 | ) | | | (4,096 | ) | | | (105,565 | ) |
| Business combination | | | 2,534 | | | | — | | | | 180 | | | | 2,714 | |
| Monetary variation ¹ | | | 21,939 | | | | 143,840 | | | | 762 | | | | 166,541 | |
| At 31 December 2022 | | | 410,320 | | | | 220,093 | | | | 8,752 | | | | 639,165 | |
| Additional provisions | | | 32,389 | | | | 23,956 | | | | 5,014 | | | | 61,359 | |
| Settlement / Write-offs | | | (20,538 | ) | | | (188,300 | ) | | | (6,141 | ) | | | (214,979 | ) |
| Monetary variation ¹ | | | (4 | ) | | | — | | | | — | | | | (4 | ) |
| At 31 December 2023 | | | 422,167 | | | | 55,749 | | | | 7,625 | | | | 485,541 | |
¹ Monetary variation is the changing on a contract or lawsuit which is regulated by an interest rate in a period.
F-80
Moove Lubricants Holdings
Notes to the consolidated financial statements
For the years ended December 31, 2023, 2022 and 2021
(In thousands of Brazilian Reais (R$), unless otherwise stated)
19.1 Assessment of loss probability
The main lawsuits where the risk of loss is probable and for which a provision has been accounted are as follows:
| | | | 12/31/2023 | | | | 12/31/2022 | |
| FINSOCIAL tax compensation ¹ | | | 326,222 | | | | 312,721 | |
| Brazilian State VAT - ICMS² tax credit | | | 14,893 | | | | 12,259 | |
| Brazilian Federal Income tax | | | 5,205 | | | | 7,586 | |
| Other | | | 75,847 | | | | 77,754 | |
| Probable losses (Tax) | | | 422,167 | | | | 410,320 | |
¹ Brazilian federal tax authorities are contesting Moove Brazil’s applications to offset credits resulting from overpaid FINSOCIAL taxes against other federal tax debts, arguing that the COFINS immunity applied only to the fiscal year in which the lawsuit was filed (i.e., in 1992). No judicial deposits were made for these proceedings. Amounts which we may have to pay pursuant to this legal proceeding are subject to reimbursement by Cosan.
² Tax on Operations relating to the Circulation of Goods and on Provision of Interstate and Intermunicipal Transport and Communication Services.
| ii. | Civil and environmental |
The Group is party to litigations and administrative proceedings related to (a) indemnity for material and moral damages; (b) termination of different types of contracts and collection of contractual taxes (c) environmental issues related to the recovery of degraded areas; and (d) other matters.
The Group is party to labor claims filed by former employees and service providers about the payment of overtime, recognition of employment relationships, union membership, unhealthy work and hazardous work, possible non-compliance with regulatory rules of the Ministry of Labor and Employment, reinstatement in the employment, indemnity for moral and material damages on several grounds, subsidiary liability for third party labor debts, and reimbursement of payroll discounts as a union contribution.
The main lawsuits where the risk of loss is considered by the Group to be possible (and no provision has been accounted for as the outflow is not probable) are described below:
| | | 12/31/2023 | | 12/31/2022 |
| Tax | | | 3,291,659 | | | | 3,096,816 | |
| Environmental | | | 246,586 | | | | 691,643 | |
| Civil | | | 517,344 | | | | 423,111 | |
| Labor | | | 10,473 | | | | 8,041 | |
| | | | 4,066,062 | | | | 4,219,611 | |
F-81
Moove Lubricants Holdings
Notes to the consolidated financial statements
For the years ended December 31, 2023, 2022 and 2021
(In thousands of Brazilian Reais (R$), unless otherwise stated)
The breakdown of the possible losses relating to taxes is as follows:
| | | | 12/31/2023 | | | | 12/31/2022 | |
| Brazilian Federal Income taxes¹ | | | 1,319,898 | | | | 1,021,515 | |
| Brazilian Federal Income taxes withheld at source ² | | | 1,025,684 | | | | 1,178,853 | |
| Brazilian State VAT – ICMS³ | | | 599,301 | | | | 519,042 | |
| IPI – Brazilian Excise tax credit – NT⁴ | | | 141,007 | | | | 147,090 | |
| PIS/COFINS (Brazil Social security contribution) | | | 57,668 | | | | 53,154 | |
| INSS – Brazil Social security | | | 5,907 | | | | 18,283 | |
| Other | | | 142,194 | | | | 158,879 | |
| Possible losses (Tax) | | | 3,291,659 | | | | 3,096,816 | |
¹ Brazilian federal tax authorities have issued four tax assessments against CLE regarding the collection of federal corporate income taxes for the calendar years 2009 through 2018. The Group is contesting the assessments for the years 2012 through 2018 in administrative proceedings, while those for 2009 through 2011 are being challenged in judicial courts. The risk of loss in these proceedings is classified as possible for the disputed amounts. The amounts which we may have to pay pursuant to this legal proceeding are subject to reimbursement by Cosan.
² Brazilian federal tax authorities issued a tax assessment against Moove Brazil, holding the company accountable for withholding income tax allegedly owed on capital gains realized by ExxonMobil International Holdings B.V. and ExxonMobil Brasil Holdings B.V., foreign entities, concerning the sale of cooperatives based in the Netherlands. The portion of the assessment related to the application of the 150% penalty remains under consideration in the administrative courts, awaiting judgment on a special appeal. The amounts which we may have to pay pursuant to this legal proceeding are subject to reimbursement by Cosan.
³ CLE is involved in a legal challenge against the Rio de Janeiro fiscal equilibrium fund (Fundo Estadual de Equilíbrio Fiscal), or FEEF, which has been replaced by the temporary budget fund (Fundo Orçamentário Temporário), or FOT (a deposit of 10% of ICMS tax exempted using tax benefits) imposed by certain Brazilian states on the industrialization and commercialization of lube oils. As of December 31, 2023, judicial deposits of FEEF and FOT have been. Additionally, there is a dispute over the collection of ICMS on certain amounts paid by exclusive distributors not connected with the sale of goods, such as territorial concession, support services for logistics and marketing optimization, and reimbursement of expenses. The risk of loss in these proceedings is classified as possible.
⁴ CLE is subject to tax claims relating to its reliance on the exemption of certain oil derived lubricants from the tax on industrialized products (imposto sobre produtos industrializados), or IPI. The risk of loss in these proceedings is classified as possible.
20. Revenue
The Group recognizes revenues of two different natures:
| I. | Product sales: Lubricants, base oils, fuels, fluids and ancillaries. |
| II. | Services: Buy back, territorial concession, consultancy, used oil analysis, tank and storage rental, engineering solutions. |
Revenues of product sales are recognized at a specific point in time, when the control of products are transferred to the customer and, the revenues of services rendered are recognized as the service is provided, both cases for the value of the consideration the Group expects to be entitled, deducted from expected losses and events that impact measuring the value of the transaction, in accordance with the performance obligations defined in the contract. The policy related to expected credit losses provisions is described at Note 6. - Trade Receivables.
The transaction price is allocated to different performance obligations to be fulfilled based on the individual sales price for each product and/or service.
Incremental costs incurred to obtain contracts - commissions and marketing assistance programs - are recognized as contract assets and the amortization is recognized consistent with the transfer to the customer of the goods or services to which the asset relates as a reduction in the transaction price (revenue deduction).
Consideration payable to customers is recognized for financial reimbursement obligations arising from rebates programs, which are settled in cash or products to be delivered free of charge when certain established purchase volumes are reached and are recognized as a reduction in the transaction price.
F-82
Moove Lubricants Holdings
Notes to the consolidated financial statements
For the years ended December 31, 2023, 2022 and 2021
(In thousands of Brazilian Reais (R$), unless otherwise stated)
The Group consistently applies the expected value method to contracts that have Rebates, using the actual volume as a calculation basis as a percentage of the total target, reviewing estimates at each period end and allocating changes to the transaction price performance obligations identified in the contract.
Product returns only occur in the event of error in products specifications or damage, and the exchange of a “defective” product for a non-defective one, for a product of the same type, quality, condition and price are not considered returns, but as part of a guarantee and are accounted for when the probability of a refund occurring is greater than the probability of it not occurring and the probability of disbursement in settlement of the obligation is not remote.
Thus, revenue is presented net of value added tax, returns, trade discounts, rebates and commissions.
A contract liability is recognized when the Group has an obligation to transfer products or services to a customer from whom the consideration has already been received. The recognition of the contractual liability occurs at the time when the consideration is received and, when the entity complies with the performance obligation the contract liability is derecognized and the corresponding revenue is recognized. Such contract liabilities are presented as advances from customers on the Statement of Financial Position.
No customer, individually, is responsible for 10% or more of the Group's net revenue.
Below the revenue by products and services:
| | | 12/31/2023 | | 12/31/2022 | | 12/31/2021 |
| Finished goods | | 8,378,454 | | 7,656,080 | | 5,042,003 |
| Base oil and specialties | | 765,408 | | 596,443 | | 457,991 |
| Services | | 930,312 | | 633,763 | | 536,707 |
| Revenue | | 10,074,174 | | 8,886,286 | | 6,036,701 |
Below the revenue by destination geographical area:
| | | 12/31/2023 | | 12/31/2022 | | 12/31/2021 |
| South America ¹ | | 4,560,653 | | 3,974,866 | | 3,333,568 |
| Europe and other² | | 3,064,044 | | 3,140,933 | | 2,621,749 |
| North America | | 2,449,477 | | 1,770,487 | | 81,384 |
| Revenue | | 10,074,174 | | 8,886,286 | | 6,036,701 |
¹ Main countries: Brazil, Argentina, Bolivia, Paraguay and Uruguay.
² Main countries: United Kingdom, France, Spain and Portugal.
21. Cost and Expenses by nature
Cost and expenses associated with operating activities are recognized in the Statement of Profit or Loss in the period they were incurred.
| | | 12/31/2023 | | 12/31/2022 | | 12/31/2021 |
| Raw materials | | (7,218,013) | | (6,850,174) | | (4,625,849) |
| Depreciation and amortization (Notes 10, 11 and 12) | | (17,592) | | (15,160) | | (14,820) |
| Other costs | | (53,802) | | (60,276) | | (58,336) |
| Cost of sales | | (7,289,407) | | (6,925,610) | | (4,699,005) |
F-83
Moove Lubricants Holdings
Notes to the consolidated financial statements
For the years ended December 31, 2023, 2022 and 2021
(In thousands of Brazilian Reais (R$), unless otherwise stated)
| | | 12/31/2023 | | 12/31/2022 | | 12/31/2021 |
| Employee expense | | | (454,011 | ) | | | (449,501 | ) | | | (236,946 | ) |
| Freight and logistics expenses | | | (286,937 | ) | | | (237,498 | ) | | | (164,159 | ) |
| Depreciation and amortization (Notes 10, 11 and 12) | | | (209,771 | ) | | | (202,889 | ) | | | (56,104 | ) |
| Marketing expenses | | | (91,656 | ) | | | (63,762 | ) | | | (67,066 | ) |
| Third party services | | | (56,468 | ) | | | (45,896 | ) | | | (55,843 | ) |
| Travel expenses | | | (30,655 | ) | | | (28,830 | ) | | | (8,520 | ) |
| Other selling expenses | | | (85,039 | ) | | | (94,182 | ) | | | 5,220 | |
| Selling expenses | | | (1,214,537 | ) | | | (1,122,558 | ) | | | (583,418 | ) |
| | | | | | | | | | | | | |
| | | | 12/31/2023 | | | | 12/31/2022 | | | | 12/31/2021 | |
| Employee expenses | | | (306,681 | ) | | | (186,418 | ) | | | (157,068 | ) |
| Depreciation and amortization (Notes 10, 11 and 12) | | | (94,820 | ) | | | (24,517 | ) | | | (26,319 | ) |
| Third party services | | | (86,223 | ) | | | (41,950 | ) | | | (30,080 | ) |
| Telecommunications expenses | | | (27,349 | ) | | | (9,759 | ) | | | (9,991 | ) |
| Corporate shared expenses | | | (24,582 | ) | | | (19,557 | ) | | | (17,543 | ) |
| Travel expenses | | | (11,875 | ) | | | (7,245 | ) | | | (2,442 | ) |
| Fines, taxes and fees | | | (9,422 | ) | | | (54,948 | ) | | | (8,579 | ) |
| Marketing expenses | | | (5,621 | ) | | | (8,632 | ) | | | (6,155 | ) |
| Maintenance and repair expenses | | | (4,203 | ) | | | (335 | ) | | | (5,013 | ) |
| Freight and logistics expenses | | | (1,726 | ) | | | (2,364 | ) | | | (2,727 | ) |
| Other general and administrative expenses | | | (58,264 | ) | | | (16,477 | ) | | | (9,957 | ) |
| General and administrative expenses | | | (630,766 | ) | | | (372,202 | ) | | | (275,874 | ) |
| | | | | | | | | | | | | |
| Selling, general and administrative expenses | | | (1,845,303 | ) | | | (1,494,760 | ) | | | (859,292 | ) |
22. Financial results, net
| | | 12/31/2023 | | 12/31/2022 | | 12/31/2021 |
| | | | | | | |
| Income from financial investments | | | 85,847 | | | | 53,303 | | | | 18,476 | |
| Miscellaneous interest income - assets | | | 36,592 | | | | 33,547 | | | | 42,426 | |
| Hyperinflation (Note 2.5.) | | | (5,999 | ) | | | 360 | | | | 2,167 | |
| Other financial income | | | 1,553 | | | | 272 | | | | 11 | |
| Fair value adjustment - debt | | | — | | | | 3,575 | | | | 1,651 | |
| Derivative financial instruments | | | — | | | | — | | | | 6,120 | |
| Financial income | | | 117,993 | | | | 91,057 | | | | 70,851 | |
| | | | | | | | | | | | | |
| | | | | | | | | | | | | |
| Interest on loans | | | (181,125 | ) | | | (91,435 | ) | | | (17,870 | ) |
| Derivative financial instruments | | | (37,175 | ) | | | (48,046 | ) | | | — | |
| Other financial expense | | | (20,058 | ) | | | (15,163 | ) | | | (9,266 | ) |
| Interest on taxes | | | (18,787 | ) | | | (266 | ) | | | (31 | ) |
| Interest on actuarial liabilities | | | (12,924 | ) | | | (14,147 | ) | | | (11,655 | ) |
| Interest on leasing | | | (10,220 | ) | | | (7,112 | ) | | | (2,678 | ) |
| Fair value adjustment - debt | | | (5,013 | ) | | | — | | | | (3,471 | ) |
| Interest on amounts refundable by Cosan | | | (4,078 | ) | | | (1,283 | ) | | | — | |
| Miscellaneous interest expense - liabilities | | | (10,962 | ) | | | (2,557 | ) | | | (23,559 | ) |
| Financial expense | | | (300,342 | ) | | | (180,009 | ) | | | (68,530 | ) |
| | | | | | | | | | | | | |
| Exchange variation, net | | | (137,373 | ) | | | (18,117 | ) | | | (66,116 | ) |
| | | | | | | | | | | | | |
| Financial result, net | | | (319,722 | ) | | | (107,069 | ) | | | (63,795 | ) |
F-84
Moove Lubricants Holdings
Notes to the consolidated financial statements
For the years ended December 31, 2023, 2022 and 2021
(In thousands of Brazilian Reais (R$), unless otherwise stated)
23. Equity
23.1. Share Capital
On December 31, 2023, the Company’s share capital is R$ 177 (R$ 561,085 on December 31, 2022 and December 31, 2021) and the Company’s share premium is R$ 2,256,853 (nil on December 31, 2022 and December 31, 2021). The number of ordinary shares issued is 34,963,764 (34,963,764 on December 31, 2022 and December 31, 2021) and their nominal value is US$ 0.001 (£1 on December 31, 2022 and December 31, 2021).
23.2. Reserves
The Company’s reserves are held to reinforce working capital, finance maintenance, expansion, and development of activities, subject to the Group’s strategy.
Dividends were distributed from reserves according to Note 23.5.
23.3. Other Equity Components
The Company’s Other Equity Components is reflected below:
| At 31 December 2020 | | | 205,044 | |
| Actuarial loss, net of tax | | | (15 | ) |
| Cash flow hedge accounting | | | 7,749 | |
| Foreign currency translation effects | | | 35,728 | |
| At 31 December 2021 | | | 248,506 | |
| Actuarial loss, net of tax | | | (6 | ) |
| Cash flow hedge accounting | | | (8,508 | ) |
| Foreign currency translation effects | | | (154,846 | ) |
| At 31 December 2022 | | | 85,146 | |
| Actuarial loss, net of tax | | | (29 | ) |
| Cash flow hedge accounting | | | (490 | ) |
| Corporate reorganization | | | (18,030 | ) |
| Foreign currency translation effects | | | (41,010 | ) |
| At 31 December 2023 | | | 25,587 | |
23.4. Earnings per share
Basic earnings per share are calculated by dividing:
I. The profit attributable to owners of the company, excluding any costs of servicing equity other than ordinary shares; and
II. By the weighted average number of ordinary shares outstanding during the financial year, adjusted for bonus elements in ordinary shares issued during the year and excluding treasury shares.
The following table sets forth the calculation of earnings per share (in thousands of Brazilian Reais, except amounts per share):
F-85
Moove Lubricants Holdings
Notes to the consolidated financial statements
For the years ended December 31, 2023, 2022 and 2021
(In thousands of Brazilian Reais (R$), unless otherwise stated)
| | | 12/31/2023 | | 12/31/2022 | | 12/31/2021 |
| Profit attributable to ordinary equity holders for earnings | | | 265,694 | | | | 413,887 | | | | 287,887 | |
| Weighted-average number of ordinary shares | | | 34,963,764 | | | | 34,963,764 | | | | 34,963,764 | |
| Earnings per share - basic and diluted | | | R$7.60 | | | | R$11.84 | | | | R$8.23 | |
Potential ordinary shares under the stock option plan described in Note 17.2. are issuable contingent on the occurrence of a liquidity event, conditions which were not met at the end of the reporting period. Therefore, there are no dilutive potential ordinary shares impacting earnings per share.
23.5. Dividends
According to schedule 1.1 (xxiii) of the shareholders' agreement, Cosan Lubes Investments Limited's dividend policy consists of not making any sort of profit distribution. However, upon further deliberation and agreement between the interested parties, at the Extraordinary General Meeting held on June 1, 2023, the shareholders approved the distribution of dividends in the amount of £ 40 million (R$ 246,096), from the Profit Reserve. These dividends were fully paid in the period. In 2022 the distribution was in the amount of £ 39 million (R$ 248,854) and in 2021 there was no distribution of dividends.
24. Subsequent events
On the General Meeting held on June 12, 2024, the shareholders approved the distribution of dividends in the amount of US$167,003 thousands (R$ 900,000). These dividends were fully paid in June 2024.
On the General Meeting held on June 12, 2024, the Company, through its subsidiaries Moove Lubricants Limited and Cosan Lubrificantes e Especialidades S.A., approved with its shareholders the entering into loan agreements with Bank of America and Citibank in the amount of £ 35,000 thousands (R$ 242,396) and US$50,000 thousands (R$ 269,456).
F-86
common shares

Moove Lubricants Holdings
PROSPECTUS
| J.P. Morgan | BofA Securities | Citigroup | Itaú BBA | BTG Pactual | Santander |
Joint Bookrunners
| Goldman Sachs & Co. LLC | Jefferies | Morgan Stanley |
, 2024
Through and including , 2024 (the 25th day after the date of this prospectus), all dealers effecting transactions in our common shares, whether or not participating in this offering, may be required to deliver a prospectus. This is in addition to a dealer’s obligation to deliver a prospectus when acting as an international underwriter and with respect to an unsold allotment or subscription.
Part II
Information Not Required in Prospectus
ITEM 6. INDEMNIFICATION OF DIRECTORS AND OFFICERS.
Cayman Islands law does not limit the extent to which a company’s articles of association may provide indemnification of officers and directors, except to the extent that it may be held by the Cayman Islands courts to be contrary to public policy, such as providing indemnification against civil fraud or the consequences of committing a crime.
Our Articles of Association provide that we shall indemnify and hold harmless our directors and officers against all actions, proceedings, costs, charges, expenses, losses, damages, liabilities, judgments, fines, settlements and other amounts incurred or sustained by such directors or officers, other than by reason of such person’s actual fraud, willful neglect or willful default, in or about the conduct of our company’s business or affairs (including as a result of any mistake of judgment) or in the execution or discharge of his duties, powers, authorities or discretions, including without prejudice to the generality of the foregoing, any costs, expenses, losses or liabilities incurred by such director or officer in defending (whether successfully or otherwise) any civil, criminal or other proceedings concerning us or our affairs in any court whether in the Cayman Islands or elsewhere.
Further, we have entered into or will enter into indemnification agreements with each of our directors and executive officers that may be broader than the specific indemnification provisions contained in the Delaware General Corporation Law. These indemnification agreements require us, among other things, to indemnify our directors and executive officers against liabilities that may arise by reason of their status or service. These indemnification agreements also require us to advance all expenses incurred by the directors and executive officers in investigating or defending any such action, suit or proceeding. We believe that these agreements are necessary to attract and retain qualified individuals to serve as directors and executive officers.
The limitation of liability and indemnification provisions that are expected to be included in our Memorandum and Articles of Association and in indemnification agreements that we have entered into or will enter into with our directors and executive officers may discourage shareholders from bringing a lawsuit against our directors and executive officers for breach of their fiduciary duties. They may also reduce the likelihood of derivative litigation against our directors and executive officers, even though an action, if successful, might benefit us and other shareholders. Further, a shareholder’s investment may be adversely affected to the extent that we pay the costs of settlement and damage awards against directors and executive officers as required by these indemnification provisions. At present, we are not aware of any pending litigation or proceeding involving any person who is or was one of our directors, officers, employees or other agents or is or was serving at our request as a director, officer, employee or agent of another corporation, partnership, joint venture, trust or other enterprise, for which indemnification is sought, and we are not aware of any threatened litigation that may result in claims for indemnification.
Prior to the consummation of this offering, we intend to obtain insurance policies under which, subject to the limitations of the policies, coverage will be provided to our directors and executive officers against loss arising from claims made by reason of breach of fiduciary duty or other wrongful acts as a director or executive officer, including claims relating to public securities matters, and to us with respect to payments that may be made by us to these directors and executive officers pursuant to our indemnification obligations or otherwise as a matter of law.
Certain of our non-employee directors may, through their relationships with their employers, be insured or indemnified against certain liabilities incurred in their capacity as members of our board of directors.
The underwriting agreement to be filed as Exhibit 1.1 to this registration statement will provide for indemnification by the underwriters of us and our officers and directors for certain liabilities arising under the Securities Act or otherwise.
ITEM 7. RECENT SALES OF UNREGISTERED SECURITIES.
During the past three years, we have not issued any securities exempt from registration under the Securities Act.
ITEM 8. EXHIBITS AND FINANCIAL STATEMENT SCHEDULES.
(a) Exhibits.
The following documents are filed as part of this registration statement:
Exhibit No. | Description |
| 1.1* | Form of Underwriting Agreement. |
| 3.1 | Amended and Restated Memorandum and Articles of Association of the registrant, as currently in effect. |
| 3.2* | Form of Amended and Restated Memorandum and Articles of Association of the registrant, to be in effect upon completion of this offering. |
| 5.1 | Form of opinion of Maples and Calder (Cayman) LLP, Cayman Islands counsel of Moove, as to the validity of the common shares. |
| 10.1 | Form of Indemnification Agreement between the registrant and each of its directors and executive officers. |
| 10.2# | Cosan Lubes Investments Limited Share-Based Compensation Plan with Cash Settlement – Phantom Shares, dated July 31, 2019. |
| 10.3# | Cosan Lubes Investments Limited Share Purchase Option Granting Program. |
| 10.4+ | Lubricants Blending and Distribution Agreement, dated as of December 1, 2018, among ExxonMobil Lubricants Trading Company and Cosan Lubrificantes e Especialidades S.A. |
| 10.5+ | Amendment, dated as of August 27, 2021, to the Lubricants Blending and Distribution Agreement among ExxonMobil Lubricants Trading Company and Cosan Lubrificantes e Especialidades S.A. |
| 10.6+ | Lubricants Distributor Agreement dated as of July 15, 2021, among ExxonMobil Oil Corporation and PetroChoice LLC, as amended on July 1, 2024. |
| 10.7+ | Syndicated Loan among Millennium Moove Corp. as borrower, certain guarantors, the lenders party thereto, J.P. Morgan Chase Bank, N.A., as administrative agent, and Delaware Trust Company as the collateral agent, as amended on September 4, 2024. |
| 10.8+ | Shareholders’ Agreement, dated as of March 29, 2019, relating to Cosan Lubes Investments Limited among Cosan S.A., Galt Lubes Investments Limited and Cosan Lubes Investments Limited. |
| 10.9 | Amendment, dated as of November 28, 2023, to the Shareholders’ Agreement relating to Cosan Lubes Investments Limited among Cosan S.A., Galt Lubes Investments Limited, Moove Lubricants Holdings and Cosan Lubes Investments Limited. |
| 21.1 | List of subsidiaries of the registrant. |
| 23.1 | Consent of Ernst & Young Auditores Independentes S/S Ltda., Independent Registered Public Accounting Firm. |
| 23.2 | Consent of Maples and Calder (Cayman) LLP (included in Exhibit 5.1). |
| 23.3 | Consent of Kline & Company, Inc. |
| 24.1 | Power of Attorney (included on signature page to the registration statement). |
| 107 | Calculation of Filing Fee Table. |
| # | Indicates management contract or compensatory plan or arrangement. |
| * | To be filed by amendment. All other exhibits are submitted herewith. |
| + | Portions of this exhibit have been omitted as the registrant has determined that (i) the omitted information is not material and (ii) the omitted information is of the type that the registrant customarily and actually treats as private or confidential. |
(b) Financial Statement Schedules.
No financial statement schedules are provided because the information called for is not applicable or is shown in the financial statements or notes thereto.
ITEM 9. UNDERTAKINGS
The undersigned hereby undertakes:
| (a) | The undersigned registrant hereby undertakes to provide to the underwriter at the closing specified in the underwriting agreements, certificates in such denominations and registered in such names as required by the underwriter to permit prompt delivery to each purchaser. |
| (b) | Insofar as indemnification for liabilities arising under the Securities Act of 1933 may be permitted to directors, officers, and controlling persons of the registrant pursuant to the foregoing provisions, or otherwise, the registrant has been advised that in the opinion of the U.S. Securities and Exchange Commission such indemnification is against public policy as expressed in the Act and is, therefore, unenforceable. In the event that a claim for indemnification against such liabilities (other than the payment by the registrant of expenses incurred or paid by a director, officer or controlling person of the registrant in the successful defense of any action, suit or proceeding) is asserted by such director, officer or controlling person in connection with the securities being registered, the registrant will, unless in the opinion of its counsel the matter has been settled by controlling precedent, submit to a court of appropriate jurisdiction the question of whether such indemnification by it is against public policy as expressed in the Act and will be governed by the final adjudication of such issue. |
| (c) | The undersigned registrant hereby undertakes that: |
| (1) | For purposes of determining any liability under the Securities Act of 1933, the information omitted from the form of prospectus filed as part of this registration statement in reliance upon Rule 430A and contained in a form of prospectus filed by the Registrant pursuant to Rule 424(b)(1) or (4) or 497(h) under the Securities Act shall be deemed to be part of this registration statement as of the time it was declared effective. |
| (2) | For the purpose of determining any liability under the Securities Act of 1933, each post-effective amendment that contains a form of prospectus shall be deemed to be a new registration statement relating to the securities offered therein, and the offering of such securities at that time shall be deemed to be the initial bona fide offering thereof. |
SIGNATURES
Pursuant to the requirements of the Securities Act of 1933, the registrant certifies that it has reasonable grounds to believe that it meets all of the requirements for filing on Form F-1 and has duly caused this registration statement to be signed on its behalf by the undersigned, thereunto duly authorized, in the city of São Paulo, Brazil, on this sixteenth day of September 2024.
| | Moove Lubricants Holdings |
| | |
| | |
| | By: | /s/ Filipe Affonso Ferreira |
| | | Name: | Filipe Affonso Ferreira |
| | | Title: | Chief Executive Officer |
| | |
| | By: | /s/ Lineu Paulo Moran Filho |
| | | Name: | Lineu Paulo Moran Filho |
| | | Title: | Chief Financial Officer |
POWER OF ATTORNEY
KNOW ALL PERSONS BY THESE PRESENTS, that each person whose signature appears below hereby constitutes and appoints Filipe Affonso Ferreira and Lineu Paulo Moran Filho, and each of them, individually, as his or her true and lawful attorneys-in-fact and agents, with full power of substitution and resubstitution, for him or her and in their name, place and stead, in any and all capacities, to sign any and all amendments (including post-effective amendments) to this registration statement, and to sign any registration statement for the same offering covered by this registration statement that is to be effective on filing pursuant to Rule 462(b) under the U.S. Securities Act of 1933 and to file the same, with all exhibits thereto and other documents in connection therewith, with the U.S. Securities and Exchange Commission, granting unto such attorneys-in-fact and agents, and each of them, full power and authority to do and perform each and every act and thing requisite and necessary to be done in connection therewith, as fully to all intents and purposes as he or she might or could do in person, hereby ratifying and confirming all that said attorneys-in-fact and agents or any of them, or his or her substitute or substitutes, may lawfully do or cause to be done by virtue hereof.
Pursuant to the requirements of the Securities Act of 1933, as amended, this registration statement has been signed by the following persons in the capacities and on the dates indicated:
Name | Title | Date |
| | | |
| /s/ Filipe Affonso Ferreira | Chief Executive Officer
and Director
(principal executive officer) | September 16, 2024 |
| Filipe Affonso Ferreira | |
| | | |
| /s/ Lineu Paulo Moran Filho | Chief Financial Officer
(principal financial officer and
principal accounting officer) | September 16, 2024 |
| Lineu Paulo Moran Filho | |
| | | |
| Director | |
| Rubens Ometto Silveira Mello | | |
| | | |
| /s/ Marcelo Eduardo Martins | Director | September 16, 2024 |
| Marcelo Eduardo Martins | | |
| | | |
| /s/ Nelson Roseira Gomes Neto | Director | September 16, 2024 |
| Nelson Roseira Gomes Neto | | |
| | | |
| /s/ Fernando Pinto | Director | September 16, 2024 |
| Fernando Pinto | | |
| | | |
| /s/ Jean-Marc Etlin | Director | September 16, 2024 |
| Jean-Marc Etlin | | |
AUTHORIZED REPRESENTATIVE
Pursuant to the requirements of the Securities Act of 1933, as amended, the undersigned has signed this registration statement, solely in the capacity as the duly authorized representative of the Registrant, in the City of New York, New York, on September 16, 2024.
| | Authorized U.S. Representative — Cogency Global Inc. |
| | |
| | |
| | By: | /s/ Colleen A. De Vries |
| | | Name: Colleen A. De Vries |
| | | Title: Sr. Vice President on behalf of Cogency Global Inc. |