UNITED STATES
SECURITIES AND EXCHANGE COMMISSION
Washington, D.C. 20549
FORM N-CSR
CERTIFIED SHAREHOLDER REPORT OF REGISTERED MANAGEMENT INVESTMENT COMPANIES
Investment Company Act file number: 811-02661
Name of Fund: BlackRock Funds VII, Inc.
| | | BlackRock Sustainable International Equity Fund |
| | | BlackRock Sustainable U.S. Growth Equity Fund |
| | | BlackRock Sustainable U.S. Value Equity Fund |
| Fund Address: | | 100 Bellevue Parkway, Wilmington, DE 19809 |
Name and address of agent for service: John M. Perlowski, Chief Executive Officer, BlackRock Funds VII, Inc., 50 Hudson Yards, New York, NY 10001
Registrant’s telephone number, including area code: (800) 441-7762
Date of fiscal year end: 04/30/2024
Date of reporting period: 04/30/2024
Item 1 – Report to Stockholders
(a) The Report to Shareholders is attached herewith.
| | |

| | APRIL 30, 2024 |
BlackRock Funds VII, Inc.
| · | | BlackRock Sustainable International Equity Fund |
| · | | BlackRock Sustainable U.S. Growth Equity Fund |
| · | | BlackRock Sustainable U.S. Value Equity Fund |
|
Not FDIC Insured • May Lose Value • No Bank Guarantee |
The Markets in Review
Dear Shareholder,
The combination of continued economic growth and cooling inflation provided a supportive backdrop for investors during the 12-month reporting period ended April 30, 2024. Higher interest rates helped to rein in inflation, and the Consumer Price Index decelerated substantially while remaining above pre-pandemic levels. A moderating labor market helped ease inflationary pressure, although wages continued to grow. Wage and job growth powered robust consumer spending, backstopping the economy. On October 7, 2023, Hamas launched a horrific attack on Israel. The ensuing war has had a significant humanitarian impact and could lead to heightened economic and market volatility. We see geopolitics as a structural market risk going forward. See our geopolitical risk dashboard at blackrock.com for more details.
Equity returns were robust during the period, as interest rates stabilized and the economy proved to be more resilient than many investors expected. The U.S. economy continued to show strength, and growth further accelerated in the second half of 2023. Large-capitalization U.S. stocks posted particularly substantial gains, supported by the performance of a few notable technology companies, while small-capitalization U.S. stocks’ advance was slower but still impressive. Meanwhile, both international developed market equities and emerging market stocks also gained, albeit at a notably slower pace than that of U.S. stocks.
The 10-year U.S. Treasury yield rose during the reporting period, driving its price down, as investors reacted to elevated inflation and attempted to anticipate future interest rate changes. However, higher yields drove solid gains in shorter-duration U.S. Treasuries. The corporate bond market benefited from improving economic sentiment, although high-yield corporate bond prices fared significantly better than investment-grade bonds as demand from yield-seeking investors remained strong.
The U.S. Federal Reserve (the “Fed”), attempting to manage persistent inflation, raised interest rates twice during the 12-month period, but paused its tightening after its July meeting. The Fed also continued to reduce its balance sheet by not replacing some of the securities that reach maturity.
Supply constraints appear to have become an embedded feature of the new macroeconomic environment, making it difficult for developed economies to increase production without sparking higher inflation. Geopolitical fragmentation and an aging population risk further exacerbating these constraints, keeping the labor market tight and wage growth high. Although the Fed has stopped tightening for now, we believe that the new economic regime means that the Fed will need to maintain high rates for an extended period, and recent statements from the Fed seem to support this view. In this new regime, we anticipate greater volatility and dispersion of returns, creating more opportunities for selective portfolio management.
Looking at developed market stocks, we have an overweight stance on U.S. stocks overall, particularly given the promise of emerging AI technologies. We are also overweight Japanese stocks as shareholder-friendly policies generate increased investor interest, although we maintain an underweight stance on European stocks. In credit, we believe there are selective opportunities in the near term despite tighter credit and financial conditions. For fixed income investing with a six- to twelve-month horizon, we see the most attractive investments in short-term U.S. Treasuries and hard-currency emerging market bonds.
Overall, our view is that investors need to think globally, position themselves to be prepared for a decarbonizing economy, and be nimble as market conditions change. We encourage you to talk with your financial advisor and visit blackrock.com for further insight about investing in today’s markets.
Sincerely,

Rob Kapito
President, BlackRock Advisors, LLC

Rob Kapito
President, BlackRock Advisors, LLC
| | | | | | | | |
| Total Returns as of April 30, 2024 | |
| | | 6-Month | | | 12-Month | |
U.S. large cap equities (S&P 500® Index) | | | 20.98% | | | | 22.66% | |
U.S. small cap equities (Russell 2000® Index) | | | 19.66 | | | | 13.32 | |
International equities (MSCI Europe, Australasia, Far East Index) | | | 18.63 | | | | 9.28 | |
Emerging market equities (MSCI Emerging Markets Index) | | | 15.40 | | | | 9.88 | |
3-month Treasury bills (ICE BofA 3-Month U.S. Treasury Bill Index) | | | 2.66 | | | | 5.36 | |
U.S. Treasury securities (ICE BofA 10-Year U.S. Treasury Index) | | | 3.66 | | | | (6.40) | |
U.S. investment grade bonds (Bloomberg U.S. Aggregate Bond Index) | | | 4.97 | | | | (1.47) | |
Tax-exempt municipal bonds (Bloomberg Municipal Bond Index) | | | 7.06 | | | | 2.08 | |
U.S. high yield bonds (Bloomberg U.S. Corporate High Yield 2% Issuer Capped Index) | | | 8.99 | | | | 9.01 | |
Past performance is not an indication of future results. Index performance is shown for illustrative purposes only. You cannot invest directly in an index. | |
| | |
| 2 | | THIS PAGE IS NOT PART OF YOUR FUND REPORT |
Table of Contents

| | |
| Fund Summary as of April 30, 2024 | | BlackRock Sustainable International Equity Fund |
Investment Objective
BlackRock Sustainable International Equity Fund’s (the “Fund”) investment objective is to seek to maximize total return while seeking to maintain certain environmental, social and governance (“ESG”) characteristics, climate risk exposure and climate opportunities relative to the Fund’s benchmark.
Portfolio Management Commentary
How did the Fund perform?
For the 12-month period ended April 30, 2024, all of the Fund’s share classes underperformed its benchmark, the MSCI EAFE Index.
What factors influenced performance?
The largest detractor from the Fund’s relative performance during the reporting period was the Fund’s underweight to and stock selection within the financials sector. Stock selection within materials and an overweight to and stock selection in consumer staples also detracted.
The largest positive contributors during the period included the Fund’s overweight position in the industrials sector, along with security selection within healthcare and information technology.
Describe recent portfolio activity.
During the period, a combination of portfolio trading activity and market price changes resulted in increased exposure to information technology and industrials and decreased exposure to healthcare and communication services.
Describe portfolio positioning at period end.
Relative to the MSCI EAFE Index benchmark, the Fund’s largest overweight allocations were to the industrials, information technology and health care sectors. The Fund’s most significant relative underweights were in the materials, energy and consumer staples sectors.
The views expressed reflect the opinions of BlackRock as of the date of this report and are subject to change based on changes in market, economic or other conditions. These views are not intended to be a forecast of future events and are no guarantee of future results.
| | |
| 4 | | 2 0 2 4 BLACK ROCK ANNUAL REPORT TO SHAREHOLDERS |
| | |
| Fund Summary as of April 30, 2024 (continued) | | BlackRock Sustainable International Equity Fund |
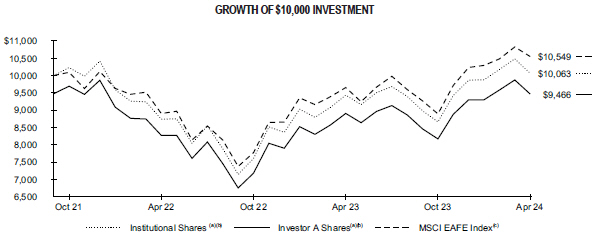
| The | Fund commenced operations on October 18, 2021. |
| (a) | Assuming maximum sales charges, if any, transaction costs and other operating expenses, including investment advisory fees and administration fees, if any. Institutional Shares do not have a sales charge. |
| (b) | Under normal circumstances, the Fund seeks to invest at least 80% of its net assets, plus the amount of any borrowings for investment purposes, in non-U.S. equity securities of companies that are components of, or have characteristics similar to, the companies included in the MSCI EAFE Index, and derivatives with similar economic characteristics. |
| (c) | An equity index which captures large- and mid-cap representation across certain developed markets countries around the world, excluding the United States and Canada. The index covers approximately 85% of the free float adjusted market capitalization in each country. |
Performance
| | | | | | | | | | | | | | | | |
| | | Average Annual Total Returns(a) | |
| | |
| | | 1 Year | | | Since Inception(b) | |
| | | | |
| | | Without
Sales
Charge | | | With
Sales
Charge | | | Without
Sales
Charge | | | With
Sales
Charge | |
| | | | |
Institutional | | | 6.66 | % | | | N/A | | | | 0.25 | % | | | N/A | |
Investor A | | | 6.28 | | | | 0.70 | % | | | (0.04 | ) | | | (2.15 | )% |
Class K | | | 6.58 | | | | N/A | | | | 0.27 | | | | N/A | |
| | | | |
MSCI EAFE Index | | | 9.28 | | | | N/A | | | | 2.13 | | | | N/A | |
| (a) | Assuming maximum sales charges, if any. Average annual total returns with and without sales charges reflect reductions for distribution and service fees. See “About Fund Performance” for a detailed description of share classes, including any related sales charges and fees. |
| (b) | The Fund commenced operations on October 18, 2021. |
N/A - Not applicable as share class and index do not have a sales charge.
Past performance is not an indication of future results.
Performance results may include adjustments made for financial reporting purposes in accordance with U.S. generally accepted accounting principles.
Expense Example
| | | | | | | | | | | | | | | | | | | | | | | | | | | | | | |
| | | | | | Actual | | | | | | | | Hypothetical 5% Return | | | | |
| | | | | | | | | | | | | | |
| | | | | | | | |
| | |
| Beginning
Account Value
(11/01/23) |
| |
| Ending
Account Value
(04/30/24) |
| |
| Expenses
Paid During
the Period |
(a) | | | |
| Beginning
Account Value
(11/01/23) |
| |
| Ending
Account Value
(04/30/24) |
| |
| Expenses
Paid During
the Period |
(a) | |
| Annualized
Expense
Ratio |
|
| | | | | | | | |
Institutional | | $ | 1,000.00 | | | $ | 1,161.60 | | | $ | 3.50 | | | | | $ | 1,000.00 | | | $ | 1,021.63 | | | $ | 3.27 | | | | 0.65 | % |
Investor A | | | 1,000.00 | | | | 1,158.60 | | | | 4.85 | | | | | | 1,000.00 | | | | 1,020.37 | | | | 4.52 | | | | 0.90 | |
Class K | | | 1,000.00 | | | | 1,160.50 | | | | 3.27 | | | | | | 1,000.00 | | | | 1,021.84 | | | | 3.07 | | | | 0.61 | |
| (a) | For each class of the Fund, expenses are equal to the annualized expense ratio for the class, multiplied by the average account value over the period, multiplied by 182/366 (to reflect the one-half year period shown). |
See “Disclosure of Expenses” for further information on how expenses were calculated.
| | |
| Fund Summary as of April 30, 2024 (continued) | | BlackRock Sustainable International Equity Fund |
Portfolio Information
| | | | |
| TEN LARGEST HOLDINGS | |
| | |
| Security(a) | | Percent of
Net Assets | |
Novo Nordisk A/S, Class B | | | 6.4 | % |
ASML Holding NV | | | 6.0 | |
AstraZeneca PLC | | | 5.8 | |
Allianz SE, Registered Shares | | | 5.1 | |
RELX PLC | | | 4.7 | |
Schneider Electric SE | | | 4.4 | |
Mastercard, Inc., Class A | | | 4.2 | |
Dai-ichi Life Holdings, Inc. | | | 4.0 | |
Sony Group Corp. | | | 3.8 | |
SGS SA, Registered Shares | | | 3.7 | |
| | | | |
| GEOGRAPHIC ALLOCATION | |
| | |
| Country | | Percent of
Net Assets | |
United Kingdom | | | 20.5 | % |
Japan | | | 20.1 | |
United States | | | 10.3 | |
Germany | | | 9.8 | |
France | | | 8.1 | |
Switzerland | | | 7.0 | |
Denmark | | | 6.4 | |
Netherlands | | | 6.0 | |
Singapore | | | 3.3 | |
Spain | | | 3.1 | |
Finland | | | 3.0 | |
Sweden | | | 2.8 | |
Liabilities in Excess of Other Assets | | | (0.4 | ) |
| (a) | Excludes short-term securities. |
| | |
| 6 | | 2 0 2 4 BLACK ROCK ANNUAL REPORT TO SHAREHOLDERS |
| | |
| Fund Summary as of April 30, 2024 | | BlackRock Sustainable U.S. Growth Equity Fund |
Investment Objective
BlackRock Sustainable U.S. Growth Equity Fund’s (the “Fund”) investment objective is to seek to maximize total return while seeking to maintain certain environmental, social and governance (“ESG”) characteristics, climate risk exposure and climate opportunities relative to the Fund’s benchmark.
Portfolio Management Commentary
How did the Fund perform?
For the 12-month period ended April 30, 2024, all of the Fund’s share classes underperformed its benchmark, the Russell 1000® Growth Index.
What factors influenced performance?
Selection in healthcare was the largest detractor from performance, primarily as a result of an out-of-benchmark position in Lonza Group AG. Stock selection in financials also detracted, with an out-of-benchmark holding in Ayden NV having the largest adverse effect. Selection in the consumer discretionary sector further weighed on relative performance due to an out-of-benchmark position in the luxury goods producer Kering SA.
Security selection in the information technology sector made the largest contribution to relative performance, led by an underweight in Apple, Inc. Positioning in consumer staples also added value due largely to zero weightings in the beverage and household products industries. A zero weighting in specialized real estate investment trusts in the real estate sector was a further contributor.
Describe recent portfolio activity.
The investment adviser increased the Fund’s allocations to the information technology and communication services sectors, and it reduced its positions in industrials and healthcare.
Describe portfolio positioning at period end.
The Fund’s leading overweights were in the financials, healthcare and materials sectors. Its largest underweights were in communication services, consumer discretionary and consumer staples.
The views expressed reflect the opinions of BlackRock as of the date of this report and are subject to change based on changes in market, economic or other conditions. These views are not intended to be a forecast of future events and are no guarantee of future results.
| | |
| Fund Summary as of April 30, 2024 (continued) | | BlackRock Sustainable U.S. Growth Equity Fund |
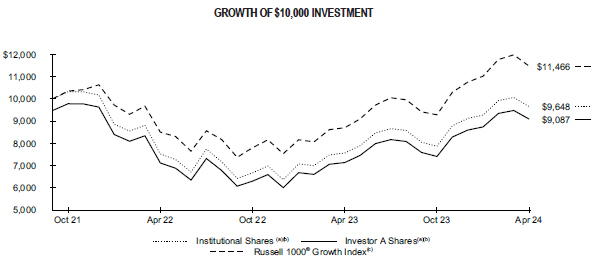
The Fund commenced operations on October 18, 2021.
| (a) | Assuming maximum sales charges, if any, transaction costs and other operating expenses, including investment advisory fees and administration fees, if any. Institutional Shares do not have a sales charge. |
| (b) | Under normal circumstances, the Fund seeks to invest at least 80% of its net assets, plus the amount of any borrowings for investment purposes, in equity securities of U.S. issuers and derivatives with similar economic characteristics. |
| (c) | An index that measures the performance of the large-cap growth segment of the U.S. equity universe. It includes those Russell 1000® companies with higher price-to-book ratios and higher forecasted growth values. |
Performance
| | | | | | | | | | | | | | | | |
| | | Average Annual Total Returns(a) | |
| | |
| | | 1 Year | | | Since Inception(b) | |
| | | | |
| | | Without
Sales
Charge | | | With
Sales
Charge | | | Without
Sales
Charge | | | With
Sales
Charge | |
| | | | |
Institutional | | | 27.52 | % | | | N/A | | | | (1.41 | )% | | | N/A | |
Investor A | | | 27.36 | | | | 20.67 | % | | | (1.64 | ) | | | (3.71 | )% |
Class K | | | 27.67 | | | | N/A | | | | (1.34 | ) | | | N/A | |
| | | | |
Russell 1000® Growth Index | | | 31.80 | | | | N/A | | | | 5.55 | | | | N/A | |
| (a) | Assuming maximum sales charges, if any. Average annual total returns with and without sales charges reflect reductions for distribution and service fees. See “About Fund Performance” for a detailed description of share classes, including any related sales charges and fees. |
| (b) | The Fund commenced operations on October 18, 2021. |
N/A - Not applicable as share class and index do not have a sales charge.
Past performance is not an indication of future results.
Performance results may include adjustments made for financial reporting purposes in accordance with U.S. generally accepted accounting principles.
Expense Example
| | | | | | | | | | | | | | | | | | | | | | | | | | | | | | |
| | | | | | Actual | | | | | | | | Hypothetical 5% Return | | | | |
| | | | | | | | | | | | | | |
| | | | | | | | |
| | |
| Beginning
Account Value
(11/01/23) |
| |
| Ending
Account Value
(04/30/24) |
| |
| Expenses
Paid During
the Period |
(a) | | | |
| Beginning
Account Value
(11/01/23) |
| |
| Ending
Account Value
(04/30/24) |
| |
| Expenses
Paid During
the Period |
(a) | |
| Annualized
Expense
Ratio |
|
| | | | | | | | |
Institutional | | $ | 1,000.00 | | | $ | 1,226.50 | | | $ | 3.72 | | | | | $ | 1,000.00 | | | $ | 1,021.52 | | | $ | 3.37 | | | | 0.67 | % |
Investor A | | | 1,000.00 | | | | 1,226.30 | | | | 5.11 | | | | | | 1,000.00 | | | | 1,020.27 | | | | 4.62 | | | | 0.92 | |
Class K | | | 1,000.00 | | | | 1,227.70 | | | | 3.46 | | | | | | 1,000.00 | | | | 1,021.76 | | | | 3.12 | | | | 0.62 | |
| (a) | For each class of the Fund, expenses are equal to the annualized expense ratio for the class, multiplied by the average account value over the period, multiplied by 182/366 (to reflect the one-half year period shown). |
See “Disclosure of Expenses” for further information on how expenses were calculated.
| | |
| 8 | | 2 0 2 4 BLACK ROCK ANNUAL REPORT TO SHAREHOLDERS |
| | |
| Fund Summary as of April 30, 2024 (continued) | | BlackRock Sustainable U.S. Growth Equity Fund |
Portfolio Information
| | | | |
| TEN LARGEST HOLDINGS | |
| | |
| Security(a) | | Percent of
Net Assets | |
Microsoft Corp. | | | 13.4 | % |
NVIDIA Corp. | | | 11.0 | |
Amazon.com, Inc. | | | 9.2 | |
Apple Inc. | | | 6.9 | |
Alphabet, Inc., Class A | | | 6.4 | |
Visa, Inc., Class A | | | 4.9 | |
ASML Holding NV, Registered Shares | | | 4.0 | |
Intuit, Inc. | | | 3.8 | |
S&P Global, Inc. | | | 3.6 | |
UnitedHealth Group, Inc. | | | 3.1 | |
| | | | |
| SECTOR ALLOCATION | |
| | |
| Sector(b) | | Percent of
Net Assets | |
Information Technology | | | 45.4 | % |
Health Care | | | 13.5 | |
Consumer Discretionary | | | 12.1 | |
Financials | | | 10.5 | |
Communication Services | | | 6.4 | |
Industrials | | | 4.0 | |
Materials | | | 3.3 | |
Real Estate | | | 1.6 | |
Consumer Staples | | | 1.6 | |
Short-Term Securities | | | 1.9 | |
Liabilities in Excess of Other Assets | | | (0.3 | ) |
| (a) | Excludes short-term securities. |
| (b) | For Fund compliance purposes, the Fund’s sector classifications refer to one or more of the sector sub-classifications used by one or more widely recognized market indexes or ratings group indexes, and/or as defined by the investment adviser. These definitions may not apply for purposes of this report, which may combine such sector sub-classifications for reporting ease. |
| | |
| Fund Summary as of April 30, 2024 | | BlackRock Sustainable U.S. Value Equity Fund |
Investment Objective
BlackRock Sustainable U.S. Value Equity Fund’s (the “Fund”) investment objective is to seek to maximize total return while seeking to maintain certain environmental, social and governance (“ESG”) characteristics, climate risk exposure and climate opportunities relative to the Fund’s benchmark.
Portfolio Management Commentary
How did the Fund perform?
For the 12-month period ended April 30, 2024, all of the Fund’s share classes underperformed its benchmark, the Russell 1000® Value Index.
What factors influenced performance?
Stock selection in the consumer staples, materials, energy, communication services, and financials sectors detracted from relative performance. Underweights in energy and communication services detracted, as well.
On the positive side, the Fund benefited from favorable stock selection in healthcare, information technology, industrials, and consumer discretionary. Underweights in real estate and utilities also contributed, as did an overweight in information technology.
Describe recent portfolio activity.
The Fund’s weightings in the communication services and industrials sectors rose due to the combination of trading activity and market price changes. Conversely, the Fund’s allocations to the healthcare and energy sectors decreased.
Describe portfolio positioning at period end.
The Fund’s largest sector overweights were in healthcare, consumer discretionary, and communication services, and its largest underweights were in industrials, real estate, and financials.
The views expressed reflect the opinions of BlackRock as of the date of this report and are subject to change based on changes in market, economic or other conditions. These views are not intended to be a forecast of future events and are no guarantee of future results.
| | |
| 10 | | 2 0 2 4 BLACK ROCK ANNUAL REPORT TO SHAREHOLDERS |
| | |
| Fund Summary as of April 30, 2024 (continued) | | BlackRock Sustainable U.S. Value Equity Fund |
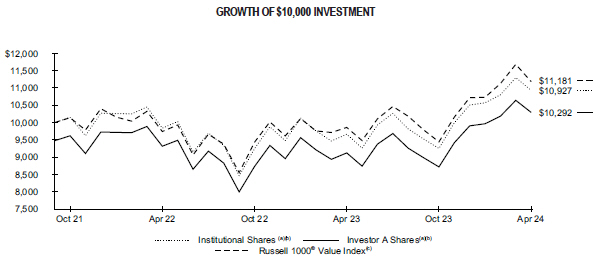
The Fund commenced operations on October 18, 2021.
| (a) | Assuming maximum sales charges, if any, transaction costs and other operating expenses, including investment advisory fees and administration fees, if any. Institutional Shares do not have a sales charge. |
| (b) | Under normal circumstances, the Fund seeks to invest at least 80% of its net assets, plus the amount of any borrowings for investment purposes, in equity securities of U.S. issuers and derivatives with similar economic characteristics. |
| (c) | An index that measures the performance of the large-cap value segment of the U.S. equity universe. It includes those Russell 1000® companies with lower price-to-book ratios and lower expected growth values. |
Performance
| | | | | | | | | | | | | | | | |
| | | Average Annual Total Returns(a) | |
| | |
| | | 1 Year | | | Since Inception(b) | |
| | | | |
| | | Without
Sales
Charge | | | With
Sales
Charge | | | Without
Sales
Charge | | | With
Sales
Charge | |
| | | | |
Institutional | | | 13.08 | % | | | N/A | | | | 3.56 | % | | | N/A | |
Investor A | | | 12.82 | | | | 6.90 | % | | | 3.32 | | | | 1.14 | % |
Class K | | | 13.12 | | | | N/A | | | | 3.64 | | | | N/A | |
| | | | |
Russell 1000® Value Index | | | 13.42 | | | | N/A | | | | 4.51 | | | | N/A | |
| (a) | Assuming maximum sales charges, if any. Average annual total returns with and without sales charges reflect reductions for distribution and service fees. See “About Fund Performance” for a detailed description of share classes, including any related sales charges and fees. |
| (b) | The Fund commenced operations on October 18, 2021. |
N/A - Not applicable as share class and index do not have a sales charge.
Past performance is not an indication of future results.
Performance results may include adjustments made for financial reporting purposes in accordance with U.S. generally accepted accounting principles.
Expense Example
| | | | | | | | | | | | | | | | | | | | | | | | | | | | | | |
| | | | | | Actual | | | | | | | | Hypothetical 5% Return | | | | |
| | | | | | | | | | | | | | |
| | | | | | | | |
| | |
| Beginning
Account Value
(11/01/23) |
| |
| Ending
Account Value
(04/30/24) |
| |
| Expenses
Paid During
the Period |
(a) | | | |
| Beginning
Account Value
(11/01/23) |
| |
| Ending
Account Value
(04/30/24) |
| |
| Expenses
Paid During
the Period |
(a) | |
| Annualized
Expense
Ratio |
|
| | | | | | | | |
Institutional | | $ | 1,000.00 | | | $ | 1,180.90 | | | $ | 2.88 | | | | | $ | 1,000.00 | | | $ | 1,022.22 | | | $ | 2.66 | | | | 0.53 | % |
Investor A | | | 1,000.00 | | | | 1,180.50 | | | | 4.25 | | | | | | 1,000.00 | | | | 1,020.97 | | | | 3.92 | | | | 0.78 | |
Class K | | | 1,000.00 | | | | 1,182.40 | | | | 2.62 | | | | | | 1,000.00 | | | | 1,022.46 | | | | 2.41 | | | | 0.48 | |
| (a) | For each class of the Fund, expenses are equal to the annualized expense ratio for the class, multiplied by the average account value over the period, multiplied by 182/366 (to reflect the one-half year period shown). |
See “Disclosure of Expenses” for further information on how expenses were calculated.
| | |
| Fund Summary as of April 30, 2024 (continued) | | BlackRock Sustainable U.S. Value Equity Fund |
Portfolio Information
| | | | |
| TEN LARGEST HOLDINGS | |
| | |
| Security(a) | | Percent of
Net Assets | |
Citigroup, Inc. | | | 3.4 | % |
Shell PLC | | | 2.9 | |
American International Group, Inc. | | | 2.8 | |
Kraft Heinz Co. (The) | | | 2.7 | |
Dollar Tree, Inc. | | | 2.6 | |
Johnson Controls International PLC | | | 2.5 | |
Baxter International, Inc. | | | 2.4 | |
Cardinal Health, Inc. | | | 2.3 | |
Hasbro, Inc. | | | 2.2 | |
Verizon Communications, Inc. | | | 2.2 | |
| | | | |
| SECTOR ALLOCATION | |
| | |
| Sector(b) | | Percent of
Net Assets | |
Financials | | | 21.6 | % |
Health Care | | | 17.1 | |
Information Technology | | | 11.4 | |
Industrials | | | 8.2 | |
Consumer Staples | | | 8.1 | |
Consumer Discretionary | | | 7.8 | |
Energy | | | 7.4 | |
Communication Services | | | 6.9 | |
Utilities | | | 5.4 | |
Materials | | | 4.1 | |
Real Estate | | | 1.6 | |
Short-Term Securities | | | 0.8 | |
Liabilities in Excess of Other Assets | | | (0.4 | ) |
| (a) | Excludes short-term securities. |
| (b) | For Fund compliance purposes, the Fund’s sector classifications refer to one or more of the sector sub-classifications used by one or more widely recognized market indexes or ratings group indexes, and/or as defined by the investment adviser. These definitions may not apply for purposes of this report, which may combine such sector sub-classifications for reporting ease. |
| | |
| 12 | | 2 0 2 4 BLACK ROCK ANNUAL REPORT TO SHAREHOLDERS |
About Fund Performance
Institutional and Class K Shares are not subject to any sales charge. These shares bear no ongoing distribution or service fees and are available only to certain eligible investors.
Investor A Shares are subject to a maximum initial sales charge (front-end load) of 5.25% and a service fee of 0.25% per year (but no distribution fee). Certain redemptions of these shares may be subject to a contingent deferred sales charge (“CDSC”) where no initial sales charge was paid at the time of purchase. These shares are generally available through financial intermediaries.
Past performance is not an indication of future results. Financial markets have experienced extreme volatility and trading in many instruments has been disrupted. These circumstances may continue for an extended period of time and may continue to affect adversely the value and liquidity of each Fund’s investments. As a result, current performance may be lower or higher than the performance data quoted. Refer to blackrock.com to obtain performance data current to the most recent month-end. Performance results do not reflect the deduction of taxes that a shareholder would pay on Fund distributions or the redemption of Fund shares. Figures shown in the performance tables assume reinvestment of all distributions, if any, at net asset value (“NAV”) on the ex-dividend date or payable date, as applicable. Investment return and principal value of shares will fluctuate so that shares, when redeemed, may be worth more or less than their original cost. Distributions paid to each class of shares will vary because of the different levels of service, distribution and transfer agency fees applicable to each class, which are deducted from the income available to be paid to shareholders.
BlackRock Advisors, LLC (the “Manager”), each Fund’s investment adviser, has contractually and/or voluntarily agreed to waive and/or reimburse a portion of each Fund’s expenses. Without such waiver(s) and/or reimbursement(s), each Fund’s performance would have been lower. With respect to each Fund’s voluntary waiver(s), if any, the Manager is under no obligation to waive and/or reimburse or to continue waiving and/or reimbursing its fees and such voluntary waiver(s) may be reduced or discontinued at any time. With respect to each Fund’s contractual waiver(s), if any, the Manager is under no obligation to continue waiving and/or reimbursing its fees after the applicable termination date of such agreement. See the Notes to Financial Statements for additional information on waivers and/or reimbursements.
Disclosure of Expenses
Shareholders of each Fund may incur the following charges: (a) transactional expenses, such as sales charges; and (b) operating expenses, including investment advisory fees, administration fees, service and distribution fees, including 12b-1 fees, acquired fund fees and expenses, and other fund expenses. The expense examples shown (which are based on a hypothetical investment of $1,000 invested at the beginning of the period and held through the end of the period) are intended to assist shareholders both in calculating expenses based on an investment in each Fund and in comparing these expenses with similar costs of investing in other mutual funds.
The expense examples provide information about actual account values and actual expenses. Annualized expense ratios reflect contractual and voluntary fee waivers, if any. In order to estimate the expenses a shareholder paid during the period covered by this report, shareholders can divide their account value by $1,000 and then multiply the result by the number corresponding to their Fund and share class under the heading entitled “Expenses Paid During the Period.”
The expense examples also provide information about hypothetical account values and hypothetical expenses based on a Fund’s actual expense ratio and an assumed rate of return of 5% per year before expenses. In order to assist shareholders in comparing the ongoing expenses of investing in these Funds and other funds, compare the 5% hypothetical examples with the 5% hypothetical examples that appear in shareholder reports of other funds.
The expenses shown in the expense examples are intended to highlight shareholders’ ongoing costs only and do not reflect transactional expenses, such as sales charges, if any. Therefore, the hypothetical examples are useful in comparing ongoing expenses only and will not help shareholders determine the relative total expenses of owning different funds. If these transactional expenses were included, shareholder expenses would have been higher.
| | |
ABOUT FUND PERFORMANCE / DISCLOSURE OF EXPENSES | | 13 |
| | |
Schedule of Investments April 30, 2024 | | BlackRock Sustainable International Equity Fund (Percentages shown are based on Net Assets) |
| | | | | | | | |
| Security | | Shares | | | Value | |
|
Common Stocks | |
|
| Denmark — 6.4% | |
Novo Nordisk A/S, Class B | | | 2,505 | | | $ | 321,247 | |
| | | | | | | | |
| | |
| Finland — 3.0% | | | | | | |
Kone Oyj, Class B | | | 3,080 | | | | 150,141 | |
| | | | | | | | |
| | |
| France — 8.1% | | | | | | |
L’Oreal SA | | | 389 | | | | 182,384 | |
Schneider Electric SE | | | 970 | | | | 221,173 | |
| | | | | | | | |
| | |
| | | | | | | 403,557 | |
| | |
| Germany — 9.8% | | | | | | |
Allianz SE, Registered Shares | | | 905 | | | | 256,826 | |
Puma SE | | | 2,996 | | | | 138,328 | |
Symrise AG | | | 861 | | | | 92,292 | |
| | | | | | | | |
| | |
| | | | | | | 487,446 | |
| | |
| Japan — 20.1% | | | | | | |
Dai-ichi Life Holdings, Inc. | | | 8,700 | | | | 201,501 | |
Ebara Corp. | | | 1,600 | | | | 131,895 | |
Kurita Water Industries Ltd. | | | 3,700 | | | | 146,535 | |
Recruit Holdings Co. Ltd. | | | 3,800 | | | | 163,656 | |
Sony Group Corp. | | | 2,300 | | | | 190,098 | |
Toyota Motor Corp. | | | 7,500 | | | | 171,064 | |
| | | | | | | | |
| | |
| | | | | | | 1,004,749 | |
| | |
| Netherlands — 6.0% | | | | | | |
ASML Holding NV | | | 343 | | | | 298,757 | |
| | | | | | | | |
| | |
| Singapore — 3.3% | | | | | | |
STMicroelectronics NV | | | 4,119 | | | | 163,050 | |
| | | | | | | | |
| | |
| Spain — 3.1% | | | | | | |
Iberdrola SA | | | 12,624 | | | | 154,790 | |
| | | | | | | | |
| | |
| Sweden — 2.8% | | | | | | |
Beijer Ref AB, Class B | | | 9,951 | | | | 140,243 | |
| | | | | | | | |
| | |
| Switzerland — 7.0% | | | | | | |
Roche Holding AG, NVS | | | 671 | | | | 160,781 | |
SGS SA, Registered Shares | | | 2,124 | | | | 187,030 | |
| | | | | | | | |
| | |
| | | | | | | 347,811 | |
| | | | | | | | |
| Security | | Shares | | | Value | |
| | |
| United Kingdom — 20.5% | | | | | | |
Ashtead Group PLC | | | 1,730 | | | $ | 125,619 | |
AstraZeneca PLC | | | 1,903 | | | | 287,827 | |
Prudential PLC | | | 13,255 | | | | 115,283 | |
Reckitt Benckiser Group PLC | | | 661 | | | | 36,955 | |
RELX PLC | | | 5,678 | | | | 233,291 | |
Rentokil Initial PLC | | | 26,648 | | | | 134,518 | |
Spirax-Sarco Engineering PLC | | | 837 | | | | 92,101 | |
| | | | | | | | |
| | |
| | | | | | | 1,025,594 | |
| | |
| United States — 6.8% | | | | | | |
Mastercard, Inc., Class A | | | 467 | | | | 210,710 | |
Microsoft Corp | | | 338 | | | | 131,594 | |
| | | | | | | | |
| | |
| | | | | | | 342,304 | |
| | | | | | | | |
| |
Total Long-Term Investments — 96.9%
(Cost: $4,401,902) | | | | 4,839,689 | |
| | | | | | | | |
| | |
Short-Term Securities | | | | | | | | |
| | |
| Money Market Funds — 3.5% | | | | | | |
BlackRock Liquidity Funds, T-Fund, Institutional Shares, 5.18%(a)(b) | | | 173,846 | | | | 173,846 | |
| | | | | | | | |
| |
Total Short-Term Securities — 3.5%
(Cost: $173,846) | | | | 173,846 | |
| | | | | | | | |
| |
Total Investments — 100.4%
(Cost: $4,575,748) | | | | 5,013,535 | |
| | |
Liabilities in Excess of Other Assets — (0.4)% | | | | | | | (21,966 | ) |
| | | | | | | | |
| | |
Net Assets — 100.0% | | | | | | $ | 4,991,569 | |
| | | | | | | | |
| (a) | Affiliate of the Fund. |
| (b) | Annualized 7-day yield as of period end. |
Affiliates
Investments in issuers considered to be affiliate(s) of the Fund during the year ended April 30, 2024 for purposes of Section 2(a)(3) of the Investment Company Act of 1940, as amended, were as follows:
| | | | | | | | | | | | | | | | | | | | | | | | | | | | | | | | | | | | |
| | | | | | | | | | |
| Affiliated Issuer | | Value at
04/30/23 | | | Purchases
at Cost | | | Proceeds
from Sales | | | Net
Realized
Gain (Loss) | | | Change in
Unrealized
Appreciation
(Depreciation) | | | Value at
04/30/24 | | | Shares
Held at
04/30/24 | | | Income | | | Capital
Gain
Distributions
from Underlying
Funds | |
BlackRock Liquidity Funds, T-Fund, Institutional Shares | | $ | 215,150 | | | $ | — | | | $ | (41,304 | )(a) | | $ | — | | | $ | — | | | $ | 173,846 | | | | 173,846 | | | $ | 9,381 | | | $ | — | |
| | | | | | | | | | | | | | | | | | | | | | | | | | | | | | | | | | | | |
| | (a) | Represents net amount purchased (sold). | |
| | |
| 14 | | 2 0 2 4 BLACK ROCK ANNUAL REPORT TO SHAREHOLDERS |
| | |
Schedule of Investments (continued) April 30, 2024 | | BlackRock Sustainable International Equity Fund |
Fair Value Hierarchy as of Period End
Various inputs are used in determining the fair value of financial instruments. For a description of the input levels and information about the Fund’s policy regarding valuation of financial instruments, refer to the Notes to Financial Statements.
The following table summarizes the Fund’s financial instruments categorized in the fair value hierarchy. The breakdown of the Fund’s financial instruments into major categories is disclosed in the Schedule of Investments above.
| | | | | | | | | | | | | | | | |
| | | | | |
| | | Level 1 | | | Level 2 | | | Level 3 | | | Total | |
| | | | |
Assets | | | | | | | | | | | | | | | | |
Investments | | | | | | | | | | | | | | | | |
Long-Term Investments | | | | | | | | | | | | | | | | |
Common Stocks | | | | | | | | | | | | | | | | |
Denmark | | $ | — | | | $ | 321,247 | | | $ | — | | | $ | 321,247 | |
Finland | | | — | | | | 150,141 | | | | — | | | | 150,141 | |
France | | | — | | | | 403,557 | | | | — | | | | 403,557 | |
Germany | | | — | | | | 487,446 | | | | — | | | | 487,446 | |
Japan | | | — | | | | 1,004,749 | | | | — | | | | 1,004,749 | |
Netherlands | | | — | | | | 298,757 | | | | — | | | | 298,757 | |
Singapore | | | — | | | | 163,050 | | | | — | | | | 163,050 | |
Spain | | | — | | | | 154,790 | | | | — | | | | 154,790 | |
Sweden | | | — | | | | 140,243 | | | | — | | | | 140,243 | |
Switzerland | | | — | | | | 347,811 | | | | — | | | | 347,811 | |
United Kingdom | | | — | | | | 1,025,594 | | | | — | | | | 1,025,594 | |
United States | | | 342,304 | | | | — | | | | — | | | | 342,304 | |
| | | | |
Short-Term Securities | | | | | | | | | | | | | | | | |
Money Market Funds | | | 173,846 | | | | — | | | | — | | | | 173,846 | |
| | | | | | | | | | | | | | | | |
| | $ | 516,150 | | | $ | 4,497,385 | | | $ | — | | | $ | 5,013,535 | |
| | | | | | | | | | | | | | | | |
See notes to financial statements.
| | |
SCHEDULES OF INVESTMENTS | | 15 |
| | |
Schedule of Investments April 30, 2024 | | BlackRock Sustainable U.S. Growth Equity Fund (Percentages shown are based on Net Assets) |
| | | | | | | | |
| Security | | Shares | | | Value | |
|
Common Stocks | |
|
| Broadline Retail — 9.2% | |
Amazon.com, Inc.(a) | | | 2,573 | | | $ | 450,275 | |
| | | | | | | | |
| | |
| Capital Markets — 3.6% | | | | | | |
S&P Global, Inc. | | | 426 | | | | 177,144 | |
| | | | | | | | |
| | |
| Chemicals — 2.1% | | | | | | |
Ecolab, Inc. | | | 452 | | | | 102,220 | |
| | | | | | | | |
| | |
| Commercial Services & Supplies — 2.6% | | | | | | |
Copart, Inc.(a) | | | 2,319 | | | | 125,945 | |
| | | | | | | | |
| | |
| Containers & Packaging — 1.2% | | | | | | |
Ball Corp. | | | 881 | | | | 61,291 | |
| | | | | | | | |
| | |
| Financial Services — 6.9% | | | | | | |
Mastercard, Inc., Class A | | | 213 | | | | 96,106 | |
Visa, Inc., Class A | | | 902 | | | | 242,286 | |
| | | | | | | | |
| | |
| | | | | | | 338,392 | |
| | |
| Health Care Equipment & Supplies — 1.5% | | | | | | |
IDEXX Laboratories, Inc.(a) | | | 148 | | | | 72,928 | |
| | | | | | | | |
| | |
| Health Care Providers & Services — 3.1% | | | | | | |
UnitedHealth Group, Inc. | | | 319 | | | | 154,300 | |
| | | | | | | | |
| | |
| Interactive Media & Services — 6.4% | | | | | | |
Alphabet, Inc., Class A(a) | | | 1,918 | | | | 312,212 | |
| | | | | | | | |
| | |
| IT Services — 1.5% | | | | | | |
Shopify, Inc., Class A(a) | | | 1,036 | | | | 72,727 | |
| | | | | | | | |
| | |
| Life Sciences Tools & Services — 6.0% | | | | | | |
Danaher Corp. | | | 404 | | | | 99,634 | |
Lonza Group AG, Registered Shares | | | 148 | | | | 81,695 | |
Thermo Fisher Scientific, Inc. | | | 197 | | | | 112,038 | |
| | | | | | | | |
| | |
| | | | | | | 293,367 | |
| | |
| Machinery — 1.4% | | | | | | |
Xylem, Inc. | | | 520 | | | | 67,964 | |
| | | | | | | | |
| | |
| Personal Care Products — 1.6% | | | | | | |
L’Oreal SA | | | 166 | | | | 77,830 | |
| | | | | | | | |
| | |
| Pharmaceuticals — 2.8% | | | | | | |
Eli Lilly & Co. | | | 180 | | | | 140,598 | |
| | | | | | | | |
| | | | | | | | |
| Security | | Shares | | | Value | |
| | |
| Real Estate Management & Development — 1.6% | | | | | | |
CoStar Group, Inc.(a) | | | 870 | | | $ | 79,631 | |
| | | | | | | | |
|
| Semiconductors & Semiconductor Equipment — 17.0% | |
Advanced Micro Devices, Inc.(a) | | | 612 | | | | 96,929 | |
ASML Holding NV, Registered Shares | | | 223 | | | | 194,561 | |
NVIDIA Corp. | | | 626 | | | | 540,876 | |
| | | | | | | | |
| | |
| | | | | | | 832,366 | |
| | |
| Software — 20.1% | | | | | | |
Cadence Design Systems, Inc.(a) | | | 292 | | | | 80,484 | |
Intuit, Inc. | | | 294 | | | | 183,932 | |
Microsoft Corp. | | | 1,684 | | | | 655,632 | |
Roper Technologies, Inc. | | | 126 | | | | 64,444 | |
| | | | | | | | |
| | |
| | | | | | | 984,492 | |
|
| Technology Hardware, Storage & Peripherals — 6.9% | |
Apple Inc. | | | 1,981 | | | | 337,424 | |
| | | | | | | | |
| | |
| Textiles, Apparel & Luxury Goods — 2.9% | | | | | | |
Kering SA | | | 160 | | | | 56,075 | |
Lululemon Athletica, Inc.(a) | | | 245 | | | | 88,347 | |
| | | | | | | | |
| | |
| | | | | | | 144,422 | |
| | | | | | | | |
| |
Total Long-Term Investments — 98.4%
(Cost: $4,130,180) | | | | 4,825,528 | |
| | | | | | | | |
| | |
Short-Term Securities | | | | | | | | |
| | |
| Money Market Funds — 1.9% | | | | | | |
BlackRock Liquidity Funds, T-Fund, Institutional Shares, 5.18%(b)(c) | | | 91,359 | | | | 91,359 | |
| | | | | | | | |
| |
Total Short-Term Securities — 1.9%
(Cost: $91,359) | | | | 91,359 | |
| | | | | | | | |
| |
Total Investments — 100.3%
(Cost: $4,221,539) | | | | 4,916,887 | |
| | |
Liabilities in Excess of Other Assets — (0.3)% | | | | | | | (15,755 | ) |
| | | | | | | | |
| | |
Net Assets — 100.0% | | | | | | $ | 4,901,132 | |
| | | | | | | | |
| (a) | Non-income producing security. |
| (b) | Affiliate of the Fund. |
| (c) | Annualized 7-day yield as of period end. |
| | |
| 16 | | 2 0 2 4 BLACK ROCK ANNUAL REPORT TO SHAREHOLDERS |
| | |
Schedule of Investments (continued) April 30, 2024 | | BlackRock Sustainable U.S. Growth Equity Fund |
Affiliates
Investments in issuers considered to be affiliate(s) of the Fund during the year ended April 30, 2024 for purposes of Section 2(a)(3) of the Investment Company Act of 1940, as amended, were as follows:
| | | | | | | | | | | | | | | | | | | | | | | | | | | | | | | | | | | | |
| | | | | | | | | | |
| Affiliated Issuer | | Value at
04/30/23 | | | Purchases
at Cost | | | Proceeds
from Sales | | | Net
Realized
Gain (Loss) | | | Change in
Unrealized
Appreciation
(Depreciation) | | | Value at
04/30/24 | | | Shares
Held at
04/30/24 | | | Income | | | Capital
Gain
Distributions
from Underlying
Funds | |
BlackRock Cash Funds: Institutional, SL Agency Shares(a) | | $ | — | | | $ | — | (b) | | $ | — | | | $ | — | | | $ | — | | | $ | — | | | | — | | | $ | 1 | (c) | | $ | — | |
BlackRock Liquidity Funds, T-Fund, Institutional Shares | | | 63,963 | | | | 27,396 | (b) | | | — | | | | — | | | | — | | | | 91,359 | | | | 91,359 | | | | 2,797 | | | | — | |
SL Liquidity Series, LLC, Money Market Series(a) | | | — | | | | — | (b) | | | — | | | | — | | | | — | | | | — | | | | — | | | | 38 | (c) | | | — | |
| | | | | | | | | | | | | | | | | | | | | | | | | | | | | | | | | | | | |
| | | | | | | | | | | | | | $ | — | | | $ | — | | | $ | 91,359 | | | | | | | $ | 2,836 | | | $ | — | |
| | | | | | | | | | | | | | | | | | | | | | | | | | | | | | | | | | | | |
| | (a) | As of period end, the entity is no longer held. | |
| | (b) | Represents net amount purchased (sold). | |
| | (c) | All or a portion represents securities lending income earned from the reinvestment of cash collateral from loaned securities, net of fees and collateral investment expenses, and other payments to and from borrowers of securities. | |
For purposes of this report, industry and sector sub-classifications may differ from those utilized by the Fund for compliance purposes.
Fair Value Hierarchy as of Period End
Various inputs are used in determining the fair value of financial instruments. For a description of the input levels and information about the Fund’s policy regarding valuation of financial instruments, refer to the Notes to Financial Statements.
The following table summarizes the Fund’s financial instruments categorized in the fair value hierarchy. The breakdown of the Fund’s financial instruments into major categories is disclosed in the Schedule of Investments above.
| | | | | | | | | | | | | | | | |
| | | | | |
| | | Level 1 | | | Level 2 | | | Level 3 | | | Total | |
Assets | | | | | | | | | | | | | | | | |
Investments | | | | | | | | | | | | | | | | |
Long-Term Investments | | | | | | | | | | | | | | | | |
Common Stocks | | | | | | | | | | | | | | | | |
Broadline Retail | | $ | 450,275 | | | $ | — | | | $ | — | | | $ | 450,275 | |
Capital Markets | | | 177,144 | | | | — | | | | — | | | | 177,144 | |
Chemicals | | | 102,220 | | | | — | | | | — | | | | 102,220 | |
Commercial Services & Supplies | | | 125,945 | | | | — | | | | — | | | | 125,945 | |
Containers & Packaging | | | 61,291 | | | | — | | | | — | | | | 61,291 | |
Financial Services | | | 338,392 | | | | — | | | | — | | | | 338,392 | |
Health Care Equipment & Supplies | | | 72,928 | | | | — | | | | — | | | | 72,928 | |
Health Care Providers & Services | | | 154,300 | | | | — | | | | — | | | | 154,300 | |
Interactive Media & Services | | | 312,212 | | | | — | | | | — | | | | 312,212 | |
IT Services | | | 72,727 | | | | — | | | | — | | | | 72,727 | |
Life Sciences Tools & Services | | | 211,672 | | | | 81,695 | | | | — | | | | 293,367 | |
Machinery | | | 67,964 | | | | — | | | | — | | | | 67,964 | |
Personal Care Products | | | — | | | | 77,830 | | | | — | | | | 77,830 | |
Pharmaceuticals | | | 140,598 | | | | — | | | | — | | | | 140,598 | |
Real Estate Management & Development | | | 79,631 | | | | — | | | | — | | | | 79,631 | |
Semiconductors & Semiconductor Equipment | | | 832,366 | | | | — | | | | — | | | | 832,366 | |
Software | | | 984,492 | | | | — | | | | — | | | | 984,492 | |
Technology Hardware, Storage & Peripherals | | | 337,424 | | | | — | | | | — | | | | 337,424 | |
Textiles, Apparel & Luxury Goods | | | 88,347 | | | | 56,075 | | | | — | | | | 144,422 | |
Short-Term Securities | | | | | | | | | | | | | | | | |
Money Market Funds | | | 91,359 | | | | — | | | | — | | | | 91,359 | |
| | | | | | | | | | | | | | | | |
| | $ | 4,701,287 | | | $ | 215,600 | | | $ | — | | | $ | 4,916,887 | |
| | | | | | | | | | | | | | | | |
See notes to financial statements.
| | |
SCHEDULES OF INVESTMENTS | | 17 |
| | |
Schedule of Investments April 30, 2024 | | BlackRock Sustainable U.S. Value Equity Fund (Percentages shown are based on Net Assets) |
| | | | | | | | |
| Security | | Shares | | | Value | |
|
Common Stocks | |
|
| Automobile Components — 1.7% | |
Aptiv PLC(a) | | | 1,260 | | | $ | 89,460 | |
| | | | | | | | |
| | |
| Automobiles — 1.9% | | | | | | |
General Motors Co. | | | 2,248 | | | | 100,103 | |
| | | | | | | | |
| | |
| Banks — 8.4% | | | | | | |
Citigroup, Inc. | | | 2,945 | | | | 180,617 | |
Citizens Financial Group, Inc. | | | 1,552 | | | | 52,939 | |
First Citizens BancShares, Inc., Class A | | | 60 | | | | 101,205 | |
Wells Fargo & Co. | | | 1,919 | | | | 113,835 | |
| | | | | | | | |
| | |
| | | | | | | 448,596 | |
| | |
| Beverages — 1.5% | | | | | | |
Diageo PLC, ADR | | | 576 | | | | 79,580 | |
| | | | | | | | |
| | |
| Building Products — 4.2% | | | | | | |
Allegion PLC | | | 748 | | | | 90,927 | |
Johnson Controls International PLC | | | 2,029 | | | | 132,027 | |
| | | | | | | | |
| | |
| | | | | | | 222,954 | |
| | |
| Capital Markets — 2.7% | | | | | | |
Raymond James Financial, Inc. | | | 778 | | | | 94,916 | |
UBS Group AG, Registered Shares | | | 1,917 | | | | 50,347 | |
| | | | | | | | |
| | |
| | | | | | | 145,263 | |
| | |
| Chemicals — 1.4% | | | | | | |
International Flavors & Fragrances, Inc. | | | 859 | | | | 72,714 | |
| | | | | | | | |
| | |
| Communications Equipment — 1.5% | | | | | | |
Cisco Systems, Inc. | | | 1,755 | | | | 82,450 | |
| | | | | | | | |
| | |
| Consumer Finance — 1.5% | | | | | | |
American Express Co. | | | 347 | | | | 81,208 | |
| | | | | | | | |
| | |
| Consumer Staples Distribution & Retail — 2.6% | | | | | | |
Dollar Tree, Inc.(a) | | | 1,154 | | | | 136,461 | |
| | | | | | | | |
| | |
| Containers & Packaging — 2.7% | | | | | | |
Crown Holdings, Inc. | | | 860 | | | | 70,580 | |
Sealed Air Corp. | | | 2,370 | | | | 74,608 | |
| | | | | | | | |
| | |
| | | | | | | 145,188 | |
| | |
| Diversified Telecommunication Services — 2.2% | | | | | | |
Verizon Communications, Inc. | | | 2,925 | | | | 115,508 | |
| | | | | | | | |
| | |
| Electric Utilities — 2.5% | | | | | | |
Exelon Corp. | | | 2,207 | | | | 82,939 | |
PG&E Corp. | | | 3,089 | | | | 52,853 | |
| | | | | | | | |
| | |
| | | | | | | 135,792 | |
| | |
| Electrical Equipment — 1.0% | | | | | | |
Sensata Technologies Holding PLC | | | 1,436 | | | | 55,013 | |
| | | | | | | | |
|
| Electronic Equipment, Instruments & Components — 1.2% | |
Avnet, Inc. | | | 1,274 | | | | 62,260 | |
| | | | | | | | |
| | |
| Entertainment — 1.5% | | | | | | |
Electronic Arts, Inc. | | | 630 | | | | 79,897 | |
| | | | | | | | |
| | |
| Financial Services — 2.1% | | | | | | |
Fidelity National Information Services, Inc. | | | 1,664 | | | | 113,019 | |
| | | | | | | | |
| | |
| Food Products — 2.7% | | | | | | |
Kraft Heinz Co. (The) | | | 3,718 | | | | 143,552 | |
| | | | | | | | |
| | |
| Health Care Equipment & Supplies — 2.4% | | | | | | |
Baxter International, Inc. | | | 3,126 | | | | 126,197 | |
| | | | | | | | |
| | |
| Health Care Providers & Services — 6.7% | | | | | | |
Cardinal Health, Inc. | | | 1,189 | | | | 122,515 | |
Cigna Group (The) | | | 250 | | | | 89,260 | |
| | | | | | | | |
| Security | | Shares | | | Value | |
| | |
| Health Care Providers & Services (continued) | | | | | | |
Elevance Health, Inc. | | | 154 | | | $ | 81,401 | |
Humana, Inc. | | | 222 | | | | 67,064 | |
| | | | | | | | |
| | |
| | | | | | | 360,240 | |
| | |
| Household Durables — 2.1% | | | | | | |
Sony Group Corp., ADR | | | 1,368 | | | | 112,956 | |
| | | | | | | | |
| | |
| Insurance — 6.9% | | | | | | |
American International Group, Inc. | | | 2,001 | | | | 150,695 | |
Fidelity National Financial, Inc., Class A | | | 748 | | | | 37,026 | |
Prudential PLC | | | 7,820 | | | | 68,013 | |
Willis Towers Watson PLC | | | 447 | | | | 112,260 | |
| | | | | | | | |
| | |
| | | | | | | 367,994 | |
| | |
| IT Services — 1.5% | | | | | | |
Cognizant Technology Solutions Corp., Class A | | | 1,252 | | | | 82,231 | |
| | | | | | | | |
| | |
| Leisure Products — 2.2% | | | | | | |
Hasbro, Inc. | | | 1,900 | | | | 116,470 | |
| | | | | | | | |
| | |
| Life Sciences Tools & Services — 4.9% | | | | | | |
Avantor, Inc.(a) | | | 2,521 | | | | 61,084 | |
Fortrea Holdings, Inc.(a) | | | 2,655 | | | | 97,146 | |
Thermo Fisher Scientific, Inc. | | | 186 | | | | 105,782 | |
| | | | | | | | |
| | |
| | | | | | | 264,012 | |
| | |
| Machinery — 3.0% | | | | | | |
CNH Industrial NV | | | 5,075 | | | | 57,855 | |
Westinghouse Air Brake Technologies Corp. | | | 620 | | | | 99,870 | |
| | | | | | | | |
| | |
| | | | | | | 157,725 | |
| | |
| Media — 3.2% | | | | | | |
Comcast Corp., Class A | | | 2,535 | | | | 96,609 | |
WPP PLC | | | 7,581 | | | | 75,986 | |
| | | | | | | | |
| | |
| | | | | | | 172,595 | |
| | |
| Multi-Utilities — 2.8% | | | | | | |
Public Service Enterprise Group, Inc. | | | 1,020 | | | | 70,462 | |
Sempra | | | 1,127 | | | | 80,727 | |
| | | | | | | | |
| | |
| | | | | | | 151,189 | |
| | |
| Oil, Gas & Consumable Fuels — 7.4% | | | | | | |
Cheniere Energy, Inc. | | | 679 | | | | 107,160 | |
Kosmos Energy Ltd.(a) | | | 13,164 | | | | 74,640 | |
Shell PLC | | | 4,346 | | | | 154,494 | |
Woodside Energy Group Ltd. | | | 3,442 | | | | 61,670 | |
| | | | | | | | |
| | |
| | | | | | | 397,964 | |
| | |
| Personal Care Products — 1.3% | | | | | | |
Unilever PLC, ADR | | | 1,359 | | | | 70,464 | |
| | | | | | | | |
| | |
| Pharmaceuticals — 3.1% | | | | | | |
Eli Lilly & Co. | | | 70 | | | | 54,677 | |
Sanofi SA | | | 1,108 | | | | 109,463 | |
| | | | | | | | |
| | |
| | | | | | | 164,140 | |
|
| Semiconductors & Semiconductor Equipment — 1.1% | |
Texas Instruments, Inc. | | | 322 | | | | 56,807 | |
| | | | | | | | |
| | |
| Software — 1.4% | | | | | | |
Microsoft Corp. | | | 189 | | | | 73,583 | |
| | | | | | | | |
| | |
| Specialized REITs — 1.6% | | | | | | |
Crown Castle, Inc. | | | 931 | | | | 87,309 | |
| | | | | | | | |
|
| Technology Hardware, Storage & Peripherals — 4.7% | |
HP, Inc. | | | 1,923 | | | | 54,017 | |
| | |
| 18 | | 2 0 2 4 BLACK ROCK ANNUAL REPORT TO SHAREHOLDERS |
| | |
Schedule of Investments (continued) April 30, 2024 | | BlackRock Sustainable U.S. Value Equity Fund (Percentages shown are based on Net Assets) |
| | | | | | | | |
| Security | | Shares | | | Value | |
|
| Technology Hardware, Storage & Peripherals (continued) | |
Samsung Electronics Co. Ltd. | | | 1,595 | | | $ | 88,661 | |
Western Digital Corp.(a) | | | 1,529 | | | | 108,299 | |
| | | | | | | | |
| | |
| | | | | | | 250,977 | |
| | | | | | | | |
| |
Total Long-Term Investments — 99.6%
(Cost: $5,117,606) | | | | 5,321,871 | |
| | | | | | | | |
| | |
Short-Term Securities | | | | | | | | |
| | |
| Money Market Funds — 0.8% | | | | | | |
BlackRock Liquidity Funds, T-Fund, Institutional Shares, 5.18%(b)(c) | | | 45,525 | | | | 45,525 | |
| | | | | | | | |
| |
Total Short-Term Securities — 0.8%
(Cost: $45,525) | | | | 45,525 | |
| | | | | | | | |
| |
Total Investments — 100.4%
(Cost: $5,163,131) | | | | 5,367,396 | |
Liabilities in Excess of Other Assets — (0.4)% | | | | | | | (22,511 | ) |
| | | | | | | | |
Net Assets — 100.0% | | | | | | $ | 5,344,885 | |
| | | | | | | | |
| (a) | Non-income producing security. |
| (b) | Affiliate of the Fund. |
| (c) | Annualized 7-day yield as of period end. |
Affiliates
Investments in issuers considered to be affiliate(s) of the Fund during the year ended April 30, 2024 for purposes of Section 2(a)(3) of the Investment Company Act of 1940, as amended, were as follows:
| | | | | | | | | | | | | | | | | | | | | | | | | | | | | | | | | | | | |
| | | | | | | | | | |
| Affiliated Issuer | | Value at
04/30/23 | | | Purchases
at Cost | | | Proceeds
from Sales | | | Net
Realized
Gain (Loss) | | | Change in
Unrealized
Appreciation
(Depreciation) | | | Value at
04/30/24 | | | Shares
Held at
04/30/24 | | | Income | | | Capital
Gain
Distributions
from Underlying
Funds | |
BlackRock Liquidity Funds, T-Fund, Institutional Shares | | $ | 77,979 | | | $ | — | | | $ | (32,454 | )(a) | | $ | — | | | $ | — | | | $ | 45,525 | | | | 45,525 | | | $ | 1,866 | | | $ | — | |
SL Liquidity Series, LLC, Money Market Series(b) | | | 195,459 | | | | — | | | | (195,470 | )(a) | | | 20 | | | | (9 | ) | | | — | | | | — | | | | 129 | (c) | | | — | |
| | | | | | | | | | | | | | | | | | | | | | | | | | | | | | | | | | | | |
| | | | | | | | | | | | | | $ | 20 | | | $ | (9 | ) | | $ | 45,525 | | | | | | | $ | 1,995 | | | $ | — | |
| | | | | | | | | | | | | | | | | | | | | | | | | | | | | | | | | | | | |
| | (a) | Represents net amount purchased (sold). | |
| | (b) | As of period end, the entity is no longer held. | |
| | (c) | All or a portion represents securities lending income earned from the reinvestment of cash collateral from loaned securities, net of fees and collateral investment expenses, and other payments to and from borrowers of securities. | |
For purposes of this report, industry and sector sub-classifications may differ from those utilized by the Fund for compliance purposes.
Fair Value Hierarchy as of Period End
Various inputs are used in determining the fair value of financial instruments. For a description of the input levels and information about the Fund’s policy regarding valuation of financial instruments, refer to the Notes to Financial Statements.
The following table summarizes the Fund’s financial instruments categorized in the fair value hierarchy. The breakdown of the Fund’s financial instruments into major categories is disclosed in the Schedule of Investments above.
| | | | | | | | | | | | | | | | |
| | | | | |
| | | Level 1 | | | Level 2 | | | Level 3 | | | Total | |
Assets | | | | | | | | | | | | | | | | |
Investments | | | | | | | | | | | | | | | | |
Long-Term Investments | | | | | | | | | | | | | | | | |
Common Stocks | | | | | | | | | | | | | | | | |
Automobile Components | | $ | 89,460 | | | $ | — | | | $ | — | | | $ | 89,460 | |
| | |
SCHEDULES OF INVESTMENTS | | 19 |
| | |
Schedule of Investments (continued) April 30, 2024 | | BlackRock Sustainable U.S. Value Equity Fund |
Fair Value Hierarchy as of Period End (continued)
| | | | | | | | | | | | | | | | |
| | | | | |
| | | Level 1 | | | Level 2 | | | Level 3 | | | Total | |
Common Stocks (continued) | | | | | | | | | | | | | | | | |
Automobiles | | $ | 100,103 | | | $ | — | | | $ | — | | | $ | 100,103 | |
Banks | | | 448,596 | | | | — | | | | — | | | | 448,596 | |
Beverages | | | 79,580 | | | | — | | | | — | | | | 79,580 | |
Building Products | | | 222,954 | | | | — | | | | — | | | | 222,954 | |
Capital Markets | | | 94,916 | | | | 50,347 | | | | — | | | | 145,263 | |
Chemicals | | | 72,714 | | | | — | | | | — | | | | 72,714 | |
Communications Equipment | | | 82,450 | | | | — | | | | — | | | | 82,450 | |
Consumer Finance | | | 81,208 | | | | — | | | | — | | | | 81,208 | |
Consumer Staples Distribution & Retail | | | 136,461 | | | | — | | | | — | | | | 136,461 | |
Containers & Packaging | | | 145,188 | | | | — | | | | — | | | | 145,188 | |
Diversified Telecommunication Services | | | 115,508 | | | | — | | | | — | | | | 115,508 | |
Electric Utilities | | | 135,792 | | | | — | | | | — | | | | 135,792 | |
Electrical Equipment | | | 55,013 | | | | — | | | | — | | | | 55,013 | |
Electronic Equipment, Instruments & Components | | | 62,260 | | | | — | | | | — | | | | 62,260 | |
Entertainment | | | 79,897 | | | | — | | | | — | | | | 79,897 | |
Financial Services | | | 113,019 | | | | — | | | | — | | | | 113,019 | |
Food Products | | | 143,552 | | | | — | | | | — | | | | 143,552 | |
Health Care Equipment & Supplies | | | 126,197 | | | | — | | | | — | | | | 126,197 | |
Health Care Providers & Services | | | 360,240 | | | | — | | | | — | | | | 360,240 | |
Household Durables | | | 112,956 | | | | — | | | | — | | | | 112,956 | |
Insurance | | | 299,981 | | | | 68,013 | | | | — | | | | 367,994 | |
IT Services | | | 82,231 | | | | — | | | | — | | | | 82,231 | |
Leisure Products | | | 116,470 | | | | — | | | | — | | | | 116,470 | |
Life Sciences Tools & Services | | | 264,012 | | | | — | | | | — | | | | 264,012 | |
Machinery | | | 157,725 | | | | — | | | | — | | | | 157,725 | |
Media | | | 96,609 | | | | 75,986 | | | | — | | | | 172,595 | |
Multi-Utilities | | | 151,189 | | | | — | | | | — | | | | 151,189 | |
Oil, Gas & Consumable Fuels | | | 181,800 | | | | 216,164 | | | | — | | | | 397,964 | |
Personal Care Products | | | 70,464 | | | | — | | | | — | | | | 70,464 | |
Pharmaceuticals | | | 54,677 | | | | 109,463 | | | | — | | | | 164,140 | |
Semiconductors & Semiconductor Equipment | | | 56,807 | | | | — | | | | — | | | | 56,807 | |
Software | | | 73,583 | | | | — | | | | — | | | | 73,583 | |
Specialized REITs | | | 87,309 | | | | — | | | | — | | | | 87,309 | |
Technology Hardware, Storage & Peripherals | | | 162,316 | | | | 88,661 | | | | — | | | | 250,977 | |
Short-Term Securities | | | | | | | | | | | | | | | | |
Money Market Funds | | | 45,525 | | | | — | | | | — | | | | 45,525 | |
| | | | | | | | | | | | | | | | |
| | $ | 4,758,762 | | | $ | 608,634 | | | $ | — | | | $ | 5,367,396 | |
| | | | | | | | | | | | | | | | |
See notes to financial statements.
| | |
| 20 | | 2 0 2 4 BLACK ROCK ANNUAL REPORT TO SHAREHOLDERS |
Statements of Assets and Liabilities
April 30, 2024
| | | | | | | | | | | | |
| | | BlackRock
Sustainable
International
Equity
Fund | | | BlackRock
Sustainable
U.S. Growth
Equity
Fund | | | BlackRock
Sustainable
U.S. Value
Equity
Fund | |
| | | |
ASSETS | | | | | | | | | | | | |
Investments, at value — unaffiliated(a) | | $ | 4,839,689 | | | $ | 4,825,528 | | | $ | 5,321,871 | |
Investments, at value — affiliated(b) | | | 173,846 | | | | 91,359 | | | | 45,525 | |
Foreign currency, at value(c) | | | 2,466 | | | | — | | | | — | |
Receivables: | | | | | | | | | | | | |
Investments sold | | | — | | | | 16,362 | | | | — | |
Securities lending income — affiliated | | | — | | | | 1 | | | | — | |
Dividends — unaffiliated | | | 23,981 | | | | 1,373 | | | | 8,241 | |
Dividends — affiliated | | | 686 | | | | 344 | | | | 181 | |
From the Manager | | | 20,761 | | | | 22,149 | | | | 22,892 | |
Prepaid expenses | | | 14,938 | | | | 14,921 | | | | 14,927 | |
| | | | | | | | | | | | |
Total assets | | | 5,076,367 | | | | 4,972,037 | | | | 5,413,637 | |
| | | | | | | | | | | | |
| | | |
LIABILITIES | | | | | | | | | | | | |
Payables: | | | | | | | | | | | | |
Accounting services fees | | | 12,057 | | | | 12,056 | | | | 12,062 | |
Custodian fees | | | 5,119 | | | | 5,807 | | | | 2,914 | |
Directors’ and Officer’s fees | | | 10 | | | | 9 | | | | 10 | |
Other accrued expenses | | | 5,113 | | | | 4,033 | | | | 4,742 | |
Printing fees | | | 9,460 | | | | 2,301 | | | | 2,294 | |
Professional fees | | | 53,013 | | | | 46,667 | | | | 46,679 | |
Service fees | | | 26 | | | | 32 | | | | 51 | |
| | | | | | | | | | | | |
Total liabilities | | | 84,798 | | | | 70,905 | | | | 68,752 | |
| | | | | | | | | | | | |
Commitments and contingent liabilities | | | | | | | | | | | | |
| | | |
NET ASSETS | | $ | 4,991,569 | | | $ | 4,901,132 | | | $ | 5,344,885 | |
| | | | | | | | | | | | |
| | | |
NET ASSETS CONSIST OF: | | | | | | | | | | | | |
Paid-in capital | | $ | 5,075,068 | | | $ | 5,059,611 | | | $ | 5,136,381 | |
Accumulated earnings (loss) | | | (83,499 | ) | | | (158,479 | ) | | | 208,504 | |
| | | | | | | | | | | | |
NET ASSETS | | $ | 4,991,569 | | | $ | 4,901,132 | | | $ | 5,344,885 | |
| | | | | | | | | | | | |
| | | |
(a) Investments, at cost — unaffiliated | | $ | 4,401,902 | | | $ | 4,130,180 | | | $ | 5,117,606 | |
(b) Investments, at cost — affiliated | | $ | 173,846 | | | $ | 91,359 | | | $ | 45,525 | |
(c) Foreign currency, at cost | | $ | 2,479 | | | $ | — | | | $ | — | |
Statements of Assets and Liabilities (continued)
April 30, 2024
| | | | | | | | | | | | |
| | | BlackRock
Sustainable
International
Equity
Fund | | | BlackRock
Sustainable
U.S. Growth
Equity
Fund | | | BlackRock
Sustainable
U.S. Value
Equity
Fund | |
| | | |
NET ASSET VALUE | | | | | | | | | | | | |
| | | |
| Institutional | | | | | | | | | |
Net assets | | $ | 163,189 | | | $ | 117,520 | | | $ | 118,695 | |
| | | | | | | | | | | | |
Shares outstanding | | | 16,659 | | | | 12,185 | | | | 11,442 | |
| | | | | | | | | | | | |
Net asset value | | $ | 9.80 | | | $ | 9.64 | | | $ | 10.37 | |
| | | | | | | | | | | | |
Shares authorized | | | 500 million | | | | 500 million | | | | 500 million | |
| | | | | | | | | | | | |
Par value | | $ | 0.10 | | | $ | 0.10 | | | $ | 0.10 | |
| | | | | | | | | | | | |
| | | |
| Investor A | | | | | | | | | |
Net assets | | $ | 123,954 | | | $ | 151,467 | | | $ | 245,780 | |
| | | | | | | | | | | | |
Shares outstanding | | | 12,669 | | | | 15,795 | | | | 23,725 | |
| | | | | | | | | | | | |
Net asset value | | $ | 9.78 | | | $ | 9.59 | | | $ | 10.36 | |
| | | | | | | | | | | | |
Shares authorized | | | 100 million | | | | 100 million | | | | 100 million | |
| | | | | | | | | | | | |
Par value | | $ | 0.10 | | | $ | 0.10 | | | $ | 0.10 | |
| | | | | | | | | | | | |
| | | |
| Class K | | | | | | | | | |
Net assets | | $ | 4,704,426 | | | $ | 4,632,145 | | | $ | 4,980,410 | |
| | | | | | | | | | | | |
Shares outstanding | | | 480,000 | | | | 480,000 | | | | 480,000 | |
| | | | | | | | | | | | |
Net asset value | | $ | 9.80 | | | $ | 9.65 | | | $ | 10.38 | |
| | | | | | | | | | | | |
Shares authorized | | | 500 million | | | | 500 million | | | | 500 million | |
| | | | | | | | | | | | |
Par value | | $ | 0.10 | | | $ | 0.10 | | | $ | 0.10 | |
| | | | | | | | | | | | |
See notes to financial statements.
| | |
| 22 | | 2 0 2 4 BLACK ROCK ANNUAL REPORT TO SHAREHOLDERS |
Statements of Operations
Year Ended April 30, 2024
| | | | | | | | | | | | |
| | | BlackRock
Sustainable
International
Equity
Fund | | | BlackRock
Sustainable
U.S. Growth
Equity
Fund | | | BlackRock
Sustainable
U.S. Value
Equity
Fund | |
| | | |
INVESTMENT INCOME | | | | | | | | | | | | |
Dividends — unaffiliated | | $ | 105,005 | | | $ | 23,420 | | | $ | 115,212 | |
Dividends — affiliated | | | 9,381 | | | | 2,797 | | | | 1,866 | |
Securities lending income — affiliated — net | | | — | | | | 39 | | | | 129 | |
Foreign taxes withheld | | | (11,090 | ) | | | (1,314 | ) | | | (1,229 | ) |
| | | | | | | | | | | | |
Total investment income | | | 103,296 | | | | 24,942 | | | | 115,978 | |
| | | | | | | | | | | | |
| | | |
EXPENSES | | | | | | | | | | | | |
Professional | | | 114,256 | | | | 106,945 | | | | 108,314 | |
Registration | | | 49,505 | | | | 49,472 | | | | 49,472 | |
Accounting services | | | 36,711 | | | | 36,693 | | | | 36,724 | |
Investment advisory | | | 28,495 | | | | 27,372 | | | | 23,922 | |
Printing and postage | | | 24,228 | | | | 18,648 | | | | 17,254 | |
Directors and Officer | | | 6,098 | | | | 6,093 | | | | 6,100 | |
Administration | | | 2,018 | | | | 1,876 | | | | 2,118 | |
Custodian | | | 1,236 | | | | — | | | | 886 | |
Administration — class specific | | | 950 | | | | 883 | | | | 997 | |
Transfer agent — class specific | | | 293 | | | | 570 | | | | 730 | |
Service — class specific | | | 250 | | | | 273 | | | | 568 | |
Miscellaneous | | | 14,124 | | | | 12,965 | | | | 14,373 | |
| | | | | | | | | | | | |
Total expenses excluding interest expense | | | 278,164 | | | | 261,790 | | | | 261,458 | |
Interest expense | | | 2 | | | | 4 | | | | 10 | |
| | | | | | | | | | | | |
Total expenses | | | 278,166 | | | | 261,794 | | | | 261,468 | |
Less: | | | | | | | | | | | | |
Administration fees waived | | | (2,018 | ) | | | (1,876 | ) | | | (2,118 | ) |
Administration fees waived by the Manager — class specific | | | (935 | ) | | | (877 | ) | | | (983 | ) |
Fees waived and/or reimbursed by the Manager | | | (245,882 | ) | | | (230,634 | ) | | | (232,978 | ) |
Transfer agent fees waived and/or reimbursed by the Manager — class specific | | | (198 | ) | | | (476 | ) | | | (574 | ) |
Total expenses after fees waived and/or reimbursed | | | 29,133 | | | | 27,931 | | | | 24,815 | |
| | | | | | | | | | | | |
Net investment income (loss) | | | 74,163 | | | | (2,989 | ) | | | 91,163 | |
| | | | | | | | | | | | |
| | | |
REALIZED AND UNREALIZED GAIN (LOSS) | | | | | | | | | | | | |
Net realized gain (loss) from: | | | | | | | | | | | | |
Investments — unaffiliated | | | (148,791 | ) | | | (205,736 | ) | | | 68,709 | |
Investments — affiliated | | | — | | | | — | | | | 20 | |
Foreign currency transactions | | | (1,294 | ) | | | 27 | | | | 77 | |
| | | | | | | | | | | | |
| | | (150,085 | ) | | | (205,709 | ) | | | 68,806 | |
| | | | | | | | | | | | |
Net change in unrealized appreciation (depreciation) on: | | | | | | | | | | | | |
Investments — unaffiliated | | | 385,748 | | | | 1,258,771 | | | | 464,065 | |
Investments — affiliated | | | — | | | | — | | | | (9 | ) |
Foreign currency translations | | | (712 | ) | | | 25 | | | | 32 | |
| | | | | | | | | | | | |
| | | 385,036 | | | | 1,258,796 | | | | 464,088 | |
| | | | | | | | | | | | |
Net realized and unrealized gain | | | 234,951 | | | | 1,053,087 | | | | 532,894 | |
| | | | | | | | | | | | |
NET INCREASE IN NET ASSETS RESULTING FROM OPERATIONS | | $ | 309,114 | | | $ | 1,050,098 | | | $ | 624,057 | |
| | | | | | | | | | | | |
See notes to financial statements.
Statements of Changes in Net Assets
| | | | | | | | | | | | | | | | | | | | |
| | | BlackRock Sustainable International Equity
Fund | | | | | | BlackRock Sustainable U.S. Growth Equity
Fund | |
| | | Year Ended
04/30/24 | | | Year Ended
04/30/23 | | | | | | Year Ended
04/30/24 | | | Year Ended
04/30/23 | |
| | | | |
INCREASE (DECREASE) IN NET ASSETS | | | | | | | | | | | | | | | | | |
| | | | | |
OPERATIONS | | | | | | | | | | | | | | | | | | | | |
Net investment income (loss) | | $ | 74,163 | | | $ | 68,024 | | | | | | | $ | (2,989 | ) | | $ | (547 | ) |
Net realized loss | | | (150,085 | ) | | | (274,200 | ) | | | | | | | (205,709 | ) | | | (468,112 | ) |
Net change in unrealized appreciation (depreciation) | | | 385,036 | | | | 548,954 | | | | | | | | 1,258,796 | | | | 491,427 | |
| | | | | | | | | | | | | | | | | | | | |
Net increase in net assets resulting from operations | | | 309,114 | | | | 342,778 | | | | | | | | 1,050,098 | | | | 22,768 | |
| | | | | | | | | | | | | | | | | | | | |
| | | | | |
DISTRIBUTIONS TO SHAREHOLDERS(a) | | | | | | | | | | | | | | | | | | | | |
Institutional | | | (2,050 | ) | | | (1,095 | ) | | | | | | | (4 | ) | | | (54 | ) |
Investor A | | | (997 | ) | | | (899 | ) | | | | | | | — | | | | — | |
Class K | | | (60,601 | ) | | | (54,092 | ) | | | | | | | (753 | ) | | | (3,821 | ) |
| | | | | | | | | | | | | | | | | | | | |
Decrease in net assets resulting from distributions to shareholders | | | (63,648 | ) | | | (56,086 | ) | | | | | | | (757 | ) | | | (3,875 | ) |
| | | | | | | | | | | | | | | | | | | | |
| | | | | |
CAPITAL SHARE TRANSACTIONS | | | | | | | | | | | | | | | | | | | | |
Net increase in net assets derived from capital share transactions | | | 85,714 | | | | 90 | | | | | | | | 61,571 | | | | 6,832 | |
| | | | | | | | | | | | | | | | | | | | |
| | | | | |
NET ASSETS | | | | | | | | | | | | | | | | | | | | |
Total increase in net assets | | | 331,180 | | | | 286,782 | | | | | | | | 1,110,912 | | | | 25,725 | |
Beginning of year | | | 4,660,389 | | | | 4,373,607 | | | | | | | | 3,790,220 | | | | 3,764,495 | |
| | | | | | | | | | | | | | | | | | | | |
End of year | | $ | 4,991,569 | | | $ | 4,660,389 | | | | | | | $ | 4,901,132 | | | $ | 3,790,220 | |
| | | | | | | | | | | | | | | | | | | | |
| (a) | Distributions for annual periods determined in accordance with U.S. federal income tax regulations. | |
See notes to financial statements.
| | |
| 24 | | 2 0 2 4 BLACK ROCK ANNUAL REPORT TO SHAREHOLDERS |
Statements of Changes in Net Assets (continued)
| | | | | | | | |
| | | BlackRock Sustainable U.S. Value Equity
Fund | |
| | | Year Ended
04/30/24 | | | Year Ended
04/30/23 | |
| | |
INCREASE (DECREASE) IN NET ASSETS | | | | | | | | |
| | |
OPERATIONS | | | | | | | | |
Net investment income | | $ | 91,163 | | | $ | 99,319 | |
Net realized gain (loss) | | | 68,806 | | | | (94,504 | ) |
Net change in unrealized appreciation (depreciation) | | | 464,088 | | | | (96,194 | ) |
| | | | | | | | |
Net increase (decrease) in net assets resulting from operations | | | 624,057 | | | | (91,379 | ) |
| | | | | | | | |
| | |
DISTRIBUTIONS TO SHAREHOLDERS(a) | | | | | | | | |
Institutional | | | (2,152 | ) | | | (2,854 | ) |
Investor A | | | (3,918 | ) | | | (4,651 | ) |
Class K | | | (92,544 | ) | | | (133,232 | ) |
| | | | | | | | |
Decrease in net assets resulting from distributions to shareholders | | | (98,614 | ) | | | (140,737 | ) |
| | | | | | | | |
| | |
CAPITAL SHARE TRANSACTIONS | | | | | | | | |
Net increase in net assets derived from capital share transactions | | | 9,649 | | | | 99,362 | |
| | | | | | | | |
| | |
NET ASSETS | | | | | | | | |
Total increase (decrease) in net assets | | | 535,092 | | | | (132,754 | ) |
Beginning of year | | | 4,809,793 | | | | 4,942,547 | |
| | | | | | | | |
End of year | | $ | 5,344,885 | | | $ | 4,809,793 | |
| | | | | | | | |
| (a) | Distributions for annual periods determined in accordance with U.S. federal income tax regulations. | |
See notes to financial statements.
Financial Highlights
(For a share outstanding throughout each period)
| | | | | | | | | | | | |
| | | BlackRock Sustainable International Equity Fund | |
| | | Institutional | |
| | | |
| | |
| Year Ended
04/30/24 |
| |
| Year Ended
04/30/23 |
| |
| Period from
10/18/21 to 04/30/22 |
(a) |
| | | | |
Net asset value, beginning of period | | $ | 9.31 | | | $ | 8.74 | | | $ | 10.00 | |
| | | | | | | | | | | | |
Net investment income(b) | | | 0.13 | | | | 0.13 | | | | 0.03 | |
Net realized and unrealized gain (loss) | | | 0.48 | | | | 0.55 | | | | (1.29) | |
| | | | | | | | | | | | |
Net increase (decrease) from investment operations | | | 0.61 | | | | 0.68 | | | | (1.26) | |
| | | | | | | | | | | | |
Distributions from net investment income(c) | | | (0.12 | ) | | | (0.11 | ) | | | — | |
| | | | | | | | | | | | |
| | | |
Net asset value, end of period | | $ | 9.80 | | | $ | 9.31 | | | $ | 8.74 | |
| | | | | | | | | | | | |
| | | |
Total Return(d) | | | | | | | | | | | | |
Based on net asset value | | | 6.66 | % | | | 7.94 | % | | | (12.60 | )%(e) |
| | | | | | | | | | | | |
| | | |
Ratios to Average Net Assets(f) | | | | | | | | | | | | |
Total expenses | | | 5.96 | % | | | 7.53 | % | | | 4.76 | %(g)(h) |
| | | | | | | | | | | | |
Total expenses after fees waived and/or reimbursed | | | 0.65 | % | | | 0.65 | % | | | 0.65 | %(g) |
| | | | | | | | | | | | |
Net investment income | | | 1.42 | % | | | 1.59 | % | | | 0.60 | %(g) |
| | | | | | | | | | | | |
| | | |
Supplemental Data | | | | | | | | | | | | |
Net assets, end of period (000) | | $ | 163 | | | $ | 93 | | | $ | 87 | |
| | | | | | | | | | | | |
Portfolio turnover rate | | | 36 | % | | | 29 | % | | | 20 | % |
| | | | | | | | | | | | |
| (a) | Commencement of operations. |
| (b) | Based on average shares outstanding. |
| (c) | Distributions for annual periods determined in accordance with U.S. federal income tax regulations. |
| (d) | Where applicable, assumes the reinvestment of distributions. |
| (f) | Excludes fees and expenses incurred indirectly as a result of investments in underlying funds. |
| (h) | Audit, offering, organization and printing costs were not annualized in the calculation of the expense ratios. If these expenses were annualized, the total expenses would have been 6.80%. |
See notes to financial statements.
| | |
| 26 | | 2 0 2 4 BLACK ROCK ANNUAL REPORT TO SHAREHOLDERS |
Financial Highlights (continued)
(For a share outstanding throughout each period)
| | | | | | | | | | | | |
| | | BlackRock Sustainable International Equity Fund
(continued) | |
| | | Investor A | |
| | | |
| | |
| Year Ended
04/30/24 |
| |
| Year Ended
04/30/23 |
| |
| Period from
10/18/21 to 04/30/22 |
(a) |
| | | | |
Net asset value, beginning of period | | $ | 9.30 | | | $ | 8.73 | | | $ | 10.00 | |
| | | | | | | | | | | | |
Net investment income(b) | | | 0.13 | | | | 0.11 | | | | 0.02 | |
Net realized and unrealized gain (loss) | | | 0.45 | | | | 0.55 | | | | (1.29 | ) |
| | | | | | | | | | | | |
Net increase (decrease) from investment operations | | | 0.58 | | | | 0.66 | | | | (1.27 | ) |
| | | | | | | | | | | | |
Distributions from net investment income(c) | | | (0.10 | ) | | | (0.09 | ) | | | — | |
| | | | | | | | | | | | |
| | | |
Net asset value, end of period | | $ | 9.78 | | | $ | 9.30 | | | $ | 8.73 | |
| | | | | | | | | | | | |
| | | |
Total Return(d) | | | | | | | | | | | | |
Based on net asset value | | | 6.28 | % | | | 7.67 | % | | | (12.70 | )%(e) |
| | | | | | | | | | | | |
| | | |
Ratios to Average Net Assets(f) | | | | | | | | | | | | |
Total expenses | | | 6.24 | % | | | 7.82 | % | | | 5.01 | %(g)(h) |
| | | | | | | | | | | | |
Total expenses after fees waived and/or reimbursed | | | 0.90 | % | | | 0.90 | % | | | 0.90 | %(g) |
| | | | | | | | | | | | |
Net investment income | | | 1.35 | % | | | 1.34 | % | | | 0.36 | %(g) |
| | | | | | | | | | | | |
| | | |
Supplemental Data | | | | | | | | | | | | |
Net assets, end of period (000) | | $ | 124 | | | $ | 94 | | | $ | 89 | |
| | | | | | | | | | | | |
Portfolio turnover rate | | | 36 | % | | | 29 | % | | | 20 | % |
| | | | | | | | | | | | |
| (a) | Commencement of operations. |
| (b) | Based on average shares outstanding. |
| (c) | Distributions for annual periods determined in accordance with U.S. federal income tax regulations. |
| (d) | Where applicable, excludes the effects of any sales charges and assumes the reinvestment of distributions. |
| (f) | Excludes fees and expenses incurred indirectly as a result of investments in underlying funds. |
| (h) | Audit, offering, organization and printing costs were not annualized in the calculation of the expense ratios. If these expenses were annualized, the total expenses would have been 7.05%. |
See notes to financial statements.
Financial Highlights (continued)
(For a share outstanding throughout each period)
| | | | | | | | | | | | |
| | | BlackRock Sustainable International Equity Fund
(continued) | |
| | | Class K | |
| | | |
| | |
| Year Ended
04/30/24 |
| |
| Year Ended
04/30/23 |
| |
| Period from
10/18/21 to 04/30/22 |
(a) |
| | | | |
Net asset value, beginning of period | | $ | 9.32 | | | $ | 8.74 | | | $ | 10.00 | |
| | | | | | | | | | | | |
Net investment income(b) | | | 0.15 | | | | 0.14 | | | | 0.03 | |
Net realized and unrealized gain (loss) | | | 0.46 | | | | 0.55 | | | | (1.29 | ) |
| | | | | | | | | | | | |
Net increase (decrease) from investment operations | | | 0.61 | | | | 0.69 | | | | (1.26 | ) |
| | | | | | | | | | | | |
Distributions from net investment income(c) | | | (0.13 | ) | | | (0.11 | ) | | | — | |
| | | | | | | | | | | | |
| | | |
Net asset value, end of period | | $ | 9.80 | | | $ | 9.32 | | | $ | 8.74 | |
| | | | | | | | | | | | |
| | | |
Total Return(d) | | | | | | | | | | | | |
Based on net asset value | | | 6.58 | % | | | 8.09 | % | | | (12.60 | )%(e) |
| | | | | | | | | | | | |
| | | |
Ratios to Average Net Assets(f) | | | | | | | | | | | | |
Total expenses | | | 5.85 | % | | | 6.91 | % | | | 4.39 | %(g)(h) |
| | | | | | | | | | | | |
Total expenses after fees waived and/or reimbursed | | | 0.61 | % | | | 0.60 | % | | | 0.60 | %(g) |
| | | | | | | | | | | | |
Net investment income | | | 1.57 | % | | | 1.64 | % | | | 0.65 | %(g) |
| | | | | | | | | | | | |
| | | |
Supplemental Data | | | | | | | | | | | | |
Net assets, end of period (000) | | $ | 4,704 | | | $ | 4,473 | | | $ | 4,198 | |
| | | | | | | | | | | | |
Portfolio turnover rate | | | 36 | % | | | 29 | % | | | 20 | % |
| | | | | | | | | | | | |
| (a) | Commencement of operations. |
| (b) | Based on average shares outstanding. |
| (c) | Distributions for annual periods determined in accordance with U.S. federal income tax regulations. |
| (d) | Where applicable, assumes the reinvestment of distributions. |
| (f) | Excludes fees and expenses incurred indirectly as a result of investments in underlying funds. |
| (h) | Audit, offering, organization and printing costs were not annualized in the calculation of the expense ratios. If these expenses were annualized, the total expenses would have been 6.43% |
See notes to financial statements.
| | |
| 28 | | 2 0 2 4 BLACK ROCK ANNUAL REPORT TO SHAREHOLDERS |
Financial Highlights (continued)
(For a share outstanding throughout each period)
| | | | | | | | | | | | |
| | | BlackRock Sustainable U.S. Growth Equity Fund | |
| | | Institutional | |
| | | |
| | |
| Year Ended
04/30/24 |
| |
| Year Ended
04/30/23 |
| |
| Period from
10/18/21 to 04/30/22 |
(a) |
| | | | |
Net asset value, beginning of period | | $ | 7.56 | | | $ | 7.52 | | | $ | 10.00 | |
| | | | | | | | | | | | |
Net investment loss(b) | | | (0.01 | ) | | | (0.00 | )(c) | | | (0.02 | ) |
Net realized and unrealized gain (loss) | | | 2.09 | | | | 0.05 | | | | (2.46 | ) |
| | | | | | | | | | | | |
Net increase (decrease) from investment operations | | | 2.08 | | | | 0.05 | | | | (2.48 | ) |
| | | | | | | | | | | | |
Distributions from net investment income(d) | | | (0.00 | )(c) | | | (0.01 | ) | | | — | |
| | | | | | | | | | | | |
| | | |
Net asset value, end of period | | $ | 9.64 | | | $ | 7.56 | | | $ | 7.52 | |
| | | | | | | | | | | | |
| | | |
Total Return(e) | | | | | | | | | | | | |
Based on net asset value | | | 27.52 | % | | | 0.61 | % | | | (24.80 | )%(f) |
| | | | | | | | | | | | |
| | | |
Ratios to Average Net Assets(g) | | | | | | | | | | | | |
Total expenses | | | 6.11 | % | | | 7.58 | % | | | 4.69 | %(h)(i) |
| | | | | | | | | | | | |
Total expenses after fees waived and/or reimbursed | | | 0.67 | % | | | 0.67 | % | | | 0.67 | %(h) |
| | | | | | | | | | | | |
Net investment loss | | | (0.11 | )% | | | (0.06 | )% | | | (0.31 | )%(h) |
| | | | | | | | | | | | |
| | | |
Supplemental Data | | | | | | | | | | | | |
Net assets, end of period (000) | | $ | 118 | | | $ | 79 | | | $ | 76 | |
| | | | | | | | | | | | |
Portfolio turnover rate | | | 24 | % | | | 17 | % | | | 7 | % |
| | | | | | | | | | | | |
| (a) | Commencement of operations. |
| (b) | Based on average shares outstanding. |
| (c) | Amount is greater than $(0.005) per share. |
| (d) | Distributions for annual periods determined in accordance with U.S. federal income tax regulations. |
| (e) | Where applicable, assumes the reinvestment of distributions. |
| (g) | Excludes fees and expenses incurred indirectly as a result of investments in underlying funds. |
| (i) | Audit, offering, organization and printing costs were not annualized in the calculation of the expense ratios. If these expenses were annualized, the total expenses would have been 6.73%. |
See notes to financial statements.
Financial Highlights (continued)
(For a share outstanding throughout each period)
| | | | | | | | | | | | |
| | | BlackRock Sustainable U.S. Growth Equity Fund
(continued) | |
| | | Investor A | |
| | | |
| | |
| Year Ended
04/30/24 |
| |
| Year Ended
04/30/23 |
| |
| Period from
10/18/21 to 04/30/22 |
(a) |
| | | | |
Net asset value, beginning of period | | $ | 7.53 | | | $ | 7.51 | | | $ | 10.00 | |
| | | | | | | | | | | | |
Net investment loss(b) | | | (0.03 | ) | | | (0.02 | ) | | | (0.03 | ) |
Net realized and unrealized gain (loss) | | | 2.09 | | | | 0.04 | | | | (2.46 | ) |
| | | | | | | | | | | | |
Net increase (decrease) from investment operations | | | 2.06 | | | | 0.02 | | | | (2.49 | ) |
| | | | | | | | | | | | |
| | | |
Net asset value, end of period | | $ | 9.59 | | | $ | 7.53 | | | $ | 7.51 | |
| | | | | | | | | | | | |
| | | |
Total Return(c) | | | | | | | | | | | | |
Based on net asset value | | | 27.36 | % | | | 0.27 | % | | | (24.90 | )%(d) |
| | | | | | | | | | | | |
| | | |
Ratios to Average Net Assets(e) | | | | | | | | | | | | |
Total expenses | | | 6.51 | % | | | 8.17 | % | | | 4.94 | %(f)(g) |
| | | | | | | | | | | | |
Total expenses after fees waived and/or reimbursed | | | 0.92 | % | | | 0.92 | % | | | 0.92 | %(f) |
| | | | | | | | | | | | |
Net investment loss | | | (0.36 | )% | | | (0.31 | )% | | | (0.56 | )%(f) |
| | | | | | | | | | | | |
| | | |
Supplemental Data | | | | | | | | | | | | |
Net assets, end of period (000) | | $ | 151 | | | $ | 82 | | | $ | 77 | |
| | | | | | | | | | | | |
Portfolio turnover rate | | | 24 | % | | | 17 | % | | | 7 | % |
| | | | | | | | | | | | |
| (a) | Commencement of operations. |
| (b) | Based on average shares outstanding. |
| (c) | Where applicable, excludes the effects of any sales charges and assumes the reinvestment of distributions. |
| (e) | Excludes fees and expenses incurred indirectly as a result of investments in underlying funds. |
| (g) | Audit, offering, organization and printing costs were not annualized in the calculation of the expense ratios. If these expenses were annualized, the total expenses would have been 6.98%. |
See notes to financial statements.
| | |
| 30 | | 2 0 2 4 BLACK ROCK ANNUAL REPORT TO SHAREHOLDERS |
Financial Highlights (continued)
(For a share outstanding throughout each period)
| | | | | | | | | | | | |
| | | BlackRock Sustainable U.S. Growth Equity Fund (continued) | |
| | | Class K | |
| | | |
| | |
| Year Ended
04/30/24 |
| |
| Year Ended
04/30/23 |
| |
| Period from
10/18/21 to 04/30/22 |
(a) |
| | | | |
Net asset value, beginning of period | | $ | 7.56 | | | $ | 7.52 | | | $ | 10.00 | |
| | | | | | | | | | | | |
Net investment loss(b) | | | (0.01 | ) | | | (0.00 | )(c) | | | (0.01 | ) |
Net realized and unrealized gain (loss) | | | 2.10 | | | | 0.05 | | | | (2.47 | ) |
| | | | | | | | | | | | |
Net increase (decrease) from investment operations | | | 2.09 | | | | 0.05 | | | | (2.48 | ) |
| | | | | | | | | | | | |
Distributions from net investment income(d) | | | (0.00 | )(c) | | | (0.01 | ) | | | — | |
| | | | | | | | | | | | |
| | | |
Net asset value, end of period | | $ | 9.65 | | | $ | 7.56 | | | $ | 7.52 | |
| | | | | | | | | | | | |
| | | |
Total Return(e) | | | | | | | | | | | | |
Based on net asset value | | | 27.67 | % | | | 0.65 | % | | | (24.80 | )%(f) |
| | | | | | | | | | | | |
| | | |
Ratios to Average Net Assets(g) | | | | | | | | | | | | |
Total expenses | | | 5.91 | % | | | 7.10 | % | | | 4.31 | %(h)(i) |
| | | | | | | | | | | | |
Total expenses after fees waived and/or reimbursed | | | 0.62 | % | | | 0.62 | % | | | 0.62 | %(h) |
| | | | | | | | | | | | |
Net investment loss | | | (0.06 | )% | | | (0.01 | )% | | | (0.26 | )%(h) |
| | | | | | | | | | | | |
| | | |
Supplemental Data | | | | | | | | | | | | |
Net assets, end of period (000) | | $ | 4,632 | | | $ | 3,629 | | | $ | 3,611 | |
| | | | | | | | | | | | |
Portfolio turnover rate | | | 24 | % | | | 17 | % | | | 7 | % |
| | | | | | | | | | | | |
| (a) | Commencement of operations. |
| (b) | Based on average shares outstanding. |
| (c) | Amount is greater than $(0.005) per share. |
| (d) | Distributions for annual periods determined in accordance with U.S. federal income tax regulations. |
| (e) | Where applicable, assumes the reinvestment of distributions. |
| (g) | Excludes fees and expenses incurred indirectly as a result of investments in underlying funds. |
| (i) | Audit, offering, organization and printing costs were not annualized in the calculation of the expense ratios. If these expenses were annualized, the total expenses would have been 6.36%. |
See notes to financial statements.
Financial Highlights (continued)
(For a share outstanding throughout each period)
| | | | | | | | | | | | |
| | | BlackRock Sustainable U.S. Value Equity Fund | |
| | | Institutional | |
| | | |
| | |
| Year Ended
04/30/24 |
| |
| Year Ended
04/30/23 |
| |
| Period from
10/18/21 to 04/30/22 |
(a) |
| | | | |
Net asset value, beginning of period | | $ | 9.35 | | | $ | 9.81 | | | $ | 10.00 | |
| | | | | | | | | | | | |
Net investment income(b) | | | 0.17 | | | | 0.19 | | | | 0.09 | |
Net realized and unrealized gain (loss) | | | 1.04 | | | | (0.37 | ) | | | (0.25 | ) |
| | | | | | | | | | | | |
Net increase (decrease) from investment operations | | | 1.21 | | | | (0.18 | ) | | | (0.16 | ) |
| | | | | | | | | | | | |
| | | |
Distributions(c) | | | | | | | | | | | | |
From net investment income | | | (0.19 | ) | | | (0.20 | ) | | | (0.03 | ) |
From net realized gain | | | — | | | | (0.08 | ) | | | (0.00 | )(d) |
| | | | | | | | | | | | |
Total distributions | | | (0.19 | ) | | | (0.28 | ) | | | (0.03 | ) |
| | | | | | | | | | | | |
Net asset value, end of period | | $ | 10.37 | | | $ | 9.35 | | | $ | 9.81 | |
| | | | | | | | | | | | |
| | | |
Total Return(e) | | | | | | | | | | | | |
Based on net asset value | | | 13.08 | % | | | (1.78 | )% | | | (1.63 | )%(f) |
| | | | | | | | | | | | |
| | | |
Ratios to Average Net Assets(g) | | | | | | | | | | | | |
Total expenses | | | 5.28 | % | | | 5.70 | % | | | 4.18 | %(h)(i) |
| | | | | | | | | | | | |
Total expenses after fees waived and/or reimbursed | | | 0.53 | % | | | 0.53 | % | | | 0.53 | %(h)(i) |
| | | | | | | | | | | | |
Net investment income | | | 1.79 | % | | | 2.05 | % | | | 1.57 | %(h) |
| | | | | | | | | | | | |
| | | |
Supplemental Data | | | | | | | | | | | | |
Net assets, end of period (000) | | $ | 119 | | | $ | 102 | | | $ | 98 | |
| | | | | | | | | | | | |
Portfolio turnover rate | | | 71 | % | | | 61 | % | | | 40 | % |
| | | | | | | | | | | | |
| (a) | Commencement of operations. |
| (b) | Based on average shares outstanding. |
| (c) | Distributions for annual periods determined in accordance with U.S. federal income tax regulations. |
| (d) | Amount is greater than $(0.005) per share. |
| (e) | Where applicable, assumes the reinvestment of distributions. |
| (g) | Excludes fees and expenses incurred indirectly as a result of investments in underlying funds. |
| (i) | Audit, excise tax, offering, organization and printing costs were not annualized in the calculation of the expense ratios. If these expenses were annualized, the total expenses and total expenses after fees waived and/or reimbursed would have been 6.03% and 0.54%, respectively. |
See notes to financial statements.
| | |
| 32 | | 2 0 2 4 BLACK ROCK ANNUAL REPORT TO SHAREHOLDERS |
Financial Highlights (continued)
(For a share outstanding throughout each period)
| | | | | | | | | | | | |
| | | BlackRock Sustainable U.S. Value Equity Fund (continued) | |
| | | Investor A | |
| | | |
| | |
| Year
Ended
04/30/24 |
| |
| Year
Ended
04/30/23 |
| |
| Period from
10/18/21 to 04/30/22 |
(a) |
| | | | |
Net asset value, beginning of period | | $ | 9.34 | | | $ | 9.81 | | | $ | 10.00 | |
| | | | | | | | | | | | |
Net investment income(b) | | | 0.15 | | | | 0.17 | | | | 0.08 | |
Net realized and unrealized gain (loss) | | | 1.03 | | | | (0.38 | ) | | | (0.25 | ) |
| | | | | | | | | | | | |
Net increase (decrease) from investment operations | | | 1.18 | | | | (0.21 | ) | | | (0.17 | ) |
| | | | | | | | | | | | |
| | | |
Distributions(c) | | | | | | | | | | | | |
From net investment income | | | (0.16 | ) | | | (0.18 | ) | | | (0.02 | ) |
From net realized gain | | | — | | | | (0.08 | ) | | | (0.00 | )(d) |
| | | | | | | | | | | | |
Total distributions | | | (0.16 | ) | | | (0.26 | ) | | | (0.02 | ) |
| | | | | | | | | | | | |
Net asset value, end of period | | $ | 10.36 | | | $ | 9.34 | | | $ | 9.81 | |
| | | | | | | | | | | | |
| | | |
Total Return(e) | | | | | | | | | | | | |
Based on net asset value | | | 12.82 | % | | | (2.08 | )% | | | (1.68 | )%(f) |
| | | | | | | | | | | | |
| | | |
Ratios to Average Net Assets(g) | | | | | | | | | | | | |
Total expenses | | | 5.73 | % | | | 5.77 | % | | | 4.39 | %(h)(i) |
| | | | | | | | | | | | |
Total expenses after fees waived and/or reimbursed | | | 0.78 | % | | | 0.78 | % | | | 0.78 | %(h)(i) |
| | | | | | | | | | | | |
Net investment income | | | 1.55 | % | | | 1.80 | % | | | 1.39 | %(h) |
| | | | | | | | | | | | |
| | | |
Supplemental Data | | | | | | | | | | | | |
Net assets, end of period (000) | | $ | 246 | | | $ | 217 | | | $ | 134 | |
| | | | | | | | | | | | |
Portfolio turnover rate | | | 71 | % | | | 61 | % | | | 40 | % |
| | | | | | | | | | | | |
| (a) | Commencement of operations. |
| (b) | Based on average shares outstanding. |
| (c) | Distributions for annual periods determined in accordance with U.S. federal income tax regulations. |
| (d) | Amount is greater than $(0.005) per share. |
| (e) | Where applicable, excludes the effects of any sales charges and assumes the reinvestment of distributions. |
| (g) | Excludes fees and expenses incurred indirectly as a result of investments in underlying funds. |
| (i) | Audit, excise tax, offering, organization and printing costs were not annualized in the calculation of the expense ratios. If these expenses were annualized, the total expenses and total expenses after fees waived and/or reimbursed would have been 6.21% and 0.79%, respectively. |
See notes to financial statements.
Financial Highlights (continued)
(For a share outstanding throughout each period)
| | | | | | | | | | | | |
| | | BlackRock Sustainable U.S. Value Equity Fund (continued) | |
| | | Class K | |
| | | |
| | |
| Year Ended
04/30/24 |
| |
| Year Ended
04/30/23 |
| |
| Period from
10/18/21 to 04/30/22 |
(a) |
| | | | |
Net asset value, beginning of period | | $ | 9.36 | | | $ | 9.81 | | | $ | 10.00 | |
| | | | | | | | | | | | |
Net investment income(b) | | | 0.18 | | | | 0.20 | | | | 0.09 | |
Net realized and unrealized gain (loss) | | | 1.03 | | | | (0.37 | ) | | | (0.25 | ) |
| | | | | | | | | | | | |
Net increase (decrease) from investment operations | | | 1.21 | | | | (0.17 | ) | | | (0.16 | ) |
| | | | | | | | | | | | |
| | | |
Distributions(c) | | | | | | | | | | | | |
From net investment income | | | (0.19 | ) | | | (0.20 | ) | | | (0.03 | ) |
From net realized gain | | | — | | | | (0.08 | ) | | | (0.00 | )(d) |
| | | | | | | | | | | | |
Total distributions | | | (0.19 | ) | | | (0.28 | ) | | | (0.03 | ) |
| | | | | | | | | | | | |
Net asset value, end of period | | $ | 10.38 | | | $ | 9.36 | | | $ | 9.81 | |
| | | | | | | | | | | | |
| | | |
Total Return(e) | | | | | | | | | | | | |
Based on net asset value | | | 13.12 | % | | | (1.64 | )% | | | (1.61 | )%(f) |
| | | | | | | | | | | | |
| | | |
Ratios to Average Net Assets(g) | | | | | | | | | | | | |
Total expenses | | | 5.22 | % | | | 5.23 | % | | | 3.83 | %(h)(i) |
| | | | | | | | | | | | |
Total expenses after fees waived and/or reimbursed | | | 0.48 | % | | | 0.48 | % | | | 0.48 | %(h)(i) |
| | | | | | | | | | | | |
Net investment income | | | 1.84 | % | | | 2.11 | % | | | 1.62 | %(h) |
| | | | | | | | | | | | |
| | | |
Supplemental Data | | | | | | | | | | | | |
Net assets, end of period (000) | | $ | 4,980 | | | $ | 4,490 | | | $ | 4,711 | |
| | | | | | | | | | | | |
Portfolio turnover rate | | | 71 | % | | | 61 | % | | | 40 | % |
| | | | | | | | | | | | |
| (a) | Commencement of operations. |
| (b) | Based on average shares outstanding. |
| (c) | Distributions for annual periods determined in accordance with U.S. federal income tax regulations. |
| (d) | Amount is greater than $(0.005) per share. |
| (e) | Where applicable, assumes the reinvestment of distributions. |
| (g) | Excludes fees and expenses incurred indirectly as a result of investments in underlying funds. |
| (i) | Audit, excise tax, offering, organization and printing costs were not annualized in the calculation of the expense ratios. If these expenses were annualized, the total expenses and total expenses after fees waived and/or reimbursed would have been 5.68% and 0.49%, respectively. |
See notes to financial statements.
| | |
| 34 | | 2 0 2 4 BLACK ROCK ANNUAL REPORT TO SHAREHOLDERS |
Notes to Financial Statements
1. ORGANIZATION
BlackRock Funds VII, Inc. (the “Corporation”) is registered under the Investment Company Act of 1940, as amended (the “1940 Act”), as an open-end management investment company. The Corporation is organized as a Maryland corporation. The following, each of which is a series of the Corporation, are referred to herein collectively as the “Funds” or individually as a “Fund”:
| | | | |
| | | |
| Fund Name | | Herein Referred To As | | Diversification Classification |
BlackRock Sustainable International Equity Fund | | Sustainable International Equity | | Non-Diversified |
BlackRock Sustainable U.S. Growth Equity Fund | | Sustainable U.S. Growth Equity | | Non-Diversified |
BlackRock Sustainable U.S. Value Equity Fund | | Sustainable U.S. Value Equity | | Non-Diversified |
Each Fund offers multiple classes of shares. All classes of shares have identical voting, dividend, liquidation and other rights and are subject to the same terms and conditions, except that certain classes bear expenses related to the shareholder servicing and distribution of such shares. Institutional and Class K Shares are sold only to certain eligible investors. Investor A Shares bear certain expenses related to shareholder servicing of such shares. Investor A Shares are generally available through financial intermediaries. Each class has exclusive voting rights with respect to matters relating to its shareholder servicing and distribution expenditures.
| | | | | | | | |
| | | | |
| Share Class | | Initial Sales Charge | | CDSC | | | Conversion Privilege |
Institutional and Class K Shares | | No | | | No | | | None |
Investor A Shares | | Yes | | | No | (a) | | None |
| | (a) | Investor A Shares may be subject to a contingent deferred sales charge (“CDSC”) for certain redemptions where no initial sales charge was paid at the time of purchase. | |
The Funds, together with certain other registered investment companies advised by BlackRock Advisors, LLC (the “Manager”) or its affiliates, are included in a complex of funds referred to as the BlackRock Multi-Asset Complex.
2. SIGNIFICANT ACCOUNTING POLICIES
The financial statements are prepared in conformity with accounting principles generally accepted in the United States of America (“U.S. GAAP”), which may require management to make estimates and assumptions that affect the reported amounts of assets and liabilities in the financial statements, disclosure of contingent assets and liabilities at the date of the financial statements and the reported amounts of increases and decreases in net assets from operations during the reporting period. Actual results could differ from those estimates. Each Fund is considered an investment company under U.S. GAAP and follows the accounting and reporting guidance applicable to investment companies. Below is a summary of significant accounting policies:
Investment Transactions and Income Recognition: For financial reporting purposes, investment transactions are recorded on the dates the transactions are executed. Realized gains and losses on investment transactions are determined using the specific identification method. Dividend income and capital gain distributions, if any, are recorded on the ex-dividend dates. Non-cash dividends, if any, are recorded on the ex-dividend dates at fair value. Dividends from foreign securities where the ex-dividend dates may have passed are subsequently recorded when the Funds are informed of the ex-dividend dates. Under the applicable foreign tax laws, a withholding tax at various rates may be imposed on capital gains, dividends and interest. Income, expenses and realized and unrealized gains and losses are allocated daily to each class based on its relative net assets.
Foreign Currency Translation: Each Fund’s books and records are maintained in U.S. dollars. Securities and other assets and liabilities denominated in foreign currencies are translated into U.S. dollars using exchange rates determined as of the close of trading on the New York Stock Exchange (“NYSE”). Purchases and sales of investments are recorded at the rates of exchange prevailing on the respective dates of such transactions. Generally, when the U.S. dollar rises in value against a foreign currency, the investments denominated in that currency will lose value; the opposite effect occurs if the U.S. dollar falls in relative value.
Each Fund does not isolate the effect of fluctuations in foreign exchange rates from the effect of fluctuations in the market prices of investments for financial reporting purposes. Accordingly, the effects of changes in exchange rates on investments are not segregated in the Statements of Operations from the effects of changes in market prices of those investments, but are included as a component of net realized and unrealized gain (loss) from investments. Each Fund reports realized currency gains (losses) on foreign currency related transactions as components of net realized gain (loss) for financial reporting purposes, whereas such components are generally treated as ordinary income for U.S. federal income tax purposes.
Foreign Taxes: The Funds may be subject to foreign taxes (a portion of which may be reclaimable) on income, stock dividends, capital gains on investments, or certain foreign currency transactions. All foreign taxes are recorded in accordance with the applicable foreign tax regulations and rates that exist in the foreign jurisdictions in which each Fund invests. These foreign taxes, if any, are paid by each Fund and are reflected in its Statements of Operations as follows: foreign taxes withheld at source are presented as a reduction of income, foreign taxes on securities lending income are presented as a reduction of securities lending income, foreign taxes on stock dividends are presented as “Foreign taxes withheld”, and foreign taxes on capital gains from sales of investments and foreign taxes on foreign currency transactions are included in their respective net realized gain (loss) categories. Foreign taxes payable or deferred as of April 30, 2024, if any, are disclosed in the Statements of Assets and Liabilities.
The Funds file withholding tax reclaims in certain jurisdictions to recover a portion of amounts previously withheld. The Funds may record a reclaim receivable based on collectability, which includes factors such as the jurisdiction’s applicable laws, payment history and market convention. The Statements of Operations include tax reclaims recorded as well as professional and other fees, if any, associated with recovery of foreign withholding taxes.
Bank Overdraft: The Funds had outstanding cash disbursements exceeding deposited cash amounts at the custodian during the reporting period. The Funds are obligated to repay the custodian for any overdraft, including any related costs or expenses, where applicable. For financial reporting purposes, overdraft fees, if any, are included in interest expense in the Statements of Operations.
| | |
NOTES TO FINANCIAL STATEMENTS | | 35 |
Notes to Financial Statements (continued)
Distributions: Distributions paid by the Funds are recorded on the ex-dividend dates. The character and timing of distributions are determined in accordance with U.S. federal income tax regulations, which may differ from U.S. GAAP.
Indemnifications: In the normal course of business, a Fund enters into contracts that contain a variety of representations that provide general indemnification. A Fund’s maximum exposure under these arrangements is unknown because it involves future potential claims against a Fund, which cannot be predicted with any certainty.
Other: Expenses directly related to a Fund or its classes are charged to that Fund or the applicable class. Expenses directly related to the Funds and other shared expenses prorated to the Funds are allocated daily to each class based on their relative net assets or other appropriate methods. Other operating expenses shared by several funds, including other funds managed by the Manager, are prorated among those funds on the basis of relative net assets or other appropriate methods.
The Funds have an arrangement with their custodian whereby credits are earned on uninvested cash balances. For financial reporting purposes, custodian credits, if any, are included in interest income in the Statements of operations.
3. INVESTMENT VALUATION AND FAIR VALUE MEASUREMENTS
Investment Valuation Policies: Each Fund’s investments are valued at fair value (also referred to as “market value” within the financial statements) each day that the Fund is open for business and, for financial reporting purposes, as of the report date. U.S. GAAP defines fair value as the price a fund would receive to sell an asset or pay to transfer a liability in an orderly transaction between market participants at the measurement date. The Board of Directors of the Corporation (the “Board”) has approved the designation of each Fund’s Manager as the valuation designee for each Fund. Each Fund determines the fair values of its financial instruments using various independent dealers or pricing services under the Manager’s policies. If a security’s market price is not readily available or does not otherwise accurately represent the fair value of the security, the security will be valued in accordance with the Manager’s policies and procedures as reflecting fair value. The Manager has formed a committee (the “Valuation Committee”) to develop pricing policies and procedures and to oversee the pricing function for all financial instruments, with assistance from other BlackRock pricing committees.
Fair Value Inputs and Methodologies: The following methods and inputs are used to establish the fair value of each Fund’s assets and liabilities:
| | • | | Equity investments traded on a recognized securities exchange are valued at that day’s official closing price, as applicable, on the exchange where the stock is primarily traded. Equity investments traded on a recognized exchange for which there were no sales on that day may be valued at the last available bid (long positions) or ask (short positions) price. |
| | • | | Investments in open-end U.S. mutual funds (including money market funds) are valued at that day’s published net asset value (“NAV”). |
Generally, trading in foreign instruments is substantially completed each day at various times prior to the close of trading on the NYSE. Each business day, the Funds use current market factors supplied by independent pricing services to value certain foreign instruments (“Systematic Fair Value Price”). The Systematic Fair Value Price is designed to value such foreign securities at fair value as of the close of trading on the NYSE, which follows the close of the local markets.
If events (e.g., market volatility, company announcement or a natural disaster) occur that are expected to materially affect the value of such investment, or in the event that application of these methods of valuation results in a price for an investment that is deemed not to be representative of the market value of such investment, or if a price is not available, the investment will be valued by the Valuation Committee in accordance with the Manager’s policies and procedures as reflecting fair value (“Fair Valued Investments”). The fair valuation approaches that may be used by the Valuation Committee include market approach, income approach and cost approach. Valuation techniques such as discounted cash flow, use of market comparables and matrix pricing are types of valuation approaches and are typically used in determining fair value. When determining the price for Fair Valued Investments, the Valuation Committee seeks to determine the price that each Fund might reasonably expect to receive or pay from the current sale or purchase of that asset or liability in an arm’s-length transaction. Fair value determinations shall be based upon all available factors that the Valuation Committee deems relevant and consistent with the principles of fair value measurement.
Fair Value Hierarchy: Various inputs are used in determining the fair value of financial instruments. These inputs to valuation techniques are categorized into a fair value hierarchy consisting of three broad levels for financial reporting purposes as follows:
| | • | | Level 1 – Unadjusted price quotations in active markets/exchanges for identical assets or liabilities that each Fund has the ability to access; |
| | • | | Level 2 – Other observable inputs (including, but not limited to, quoted prices for similar assets or liabilities in markets that are active, quoted prices for identical or similar assets or liabilities in markets that are not active, inputs other than quoted prices that are observable for the assets or liabilities (such as interest rates, yield curves, volatilities, prepayment speeds, loss severities, credit risks and default rates) or other market–corroborated inputs); and |
| | • | | Level 3 – Unobservable inputs based on the best information available in the circumstances, to the extent observable inputs are not available (including the Valuation Committee’s assumptions used in determining the fair value of financial instruments). |
The hierarchy gives the highest priority to unadjusted quoted prices in active markets for identical assets or liabilities (Level 1 measurements) and the lowest priority to unobservable inputs (Level 3 measurements). Accordingly, the degree of judgment exercised in determining fair value is greatest for instruments categorized in Level 3. The inputs used to measure fair value may fall into different levels of the fair value hierarchy. In such cases, for disclosure purposes, the fair value hierarchy classification is determined based on the lowest level input that is significant to the fair value measurement in its entirety. Investments classified within Level 3 have significant unobservable inputs used by the Valuation Committee in determining the price for Fair Valued Investments. Level 3 investments include equity or debt issued by privately held companies or funds that may not have a secondary market and/or may have a limited number of investors. The categorization of a value determined for financial instruments is based on the pricing transparency of the financial instruments and is not necessarily an indication of the risks associated with investing in those securities.
| | |
| 36 | | 2 0 2 4 BLACK ROCK ANNUAL REPORT TO SHAREHOLDERS |
Notes to Financial Statements (continued)
4. SECURITIES AND OTHER INVESTMENTS
Securities Lending: The Funds may lend their securities to approved borrowers, such as brokers, dealers and other financial institutions. The borrower pledges and maintains with the Funds collateral consisting of cash, an irrevocable letter of credit issued by a bank, or securities issued or guaranteed by the U.S. Government. The initial collateral received by each Fund is required to have a value of at least 102% of the current value of the loaned securities for securities traded on U.S. exchanges and a value of at least 105% for all other securities. The collateral is maintained thereafter at a value equal to at least 100% of the current market value of the securities on loan. The market value of the loaned securities is determined at the close of each business day of the Fund and any additional required collateral is delivered to the Fund, or excess collateral returned by the Fund, on the next business day. During the term of the loan, the Funds are entitled to all distributions made on or in respect of the loaned securities, but do not receive interest income on securities received as collateral. Loans of securities are terminable at any time and the borrower, after notice, is required to return borrowed securities within the standard time period for settlement of securities transactions.
As of period end, any securities on loan were collateralized by cash and/or U.S. Government obligations. Cash collateral invested by the securities lending agent, BlackRock Investment Management, LLC (“BIM”), if any, is disclosed in the Schedules of Investments. Any non-cash collateral received cannot be sold, re-invested or pledged by the Fund, except in the event of borrower default. The securities on loan, if any, are disclosed in the Funds’ Schedules of Investments. The market value of any securities on loan and the value of related collateral, if any, are shown separately in the Statements of Assets and Liabilities as a component of investments at value – unaffiliated and collateral on securities loaned, respectively.
Securities lending transactions are entered into by the Funds under Master Securities Lending Agreements (each, an “MSLA”), which provide the right, in the event of default (including bankruptcy or insolvency), for the non-defaulting party to liquidate the collateral and calculate a net exposure to the defaulting party or request additional collateral. In the event that a borrower defaults, the Funds, as lender, would offset the market value of the collateral received against the market value of the securities loaned. When the value of the collateral is greater than that of the market value of the securities loaned, the lender is left with a net amount payable to the defaulting party. However, bankruptcy or insolvency laws of a particular jurisdiction may impose restrictions on or prohibitions against such a right of offset in the event of an MSLA counterparty’s bankruptcy or insolvency. Under the MSLA, absent an event of default, the borrower can resell or re-pledge the loaned securities, and the Funds can reinvest cash collateral received in connection with loaned securities. Upon an event of default, the parties’ obligations to return the securities or collateral to the other party are extinguished, and the parties can resell or re-pledge the loaned securities or the collateral received in connection with the loaned securities in order to satisfy the defaulting party’s net payment obligation for all transactions under the MSLA. The defaulting party remains liable for any deficiency.
The risks of securities lending include the risk that the borrower may not provide additional collateral when required or may not return the securities when due. To mitigate these risks, the Funds benefit from a borrower default indemnity provided by BIM. BIM’s indemnity allows for full replacement of the securities loaned to the extent the collateral received does not cover the value on the securities loaned in the event of borrower default. Each Fund could incur a loss if the value of an investment purchased with cash collateral falls below the market value of loaned securities or if the value of an investment purchased with cash collateral falls below the value of the original cash collateral received. Such losses are borne entirely by the Funds.
5. INVESTMENT ADVISORY AGREEMENT AND OTHER TRANSACTIONS WITH AFFILIATES
Investment Advisory: The Corporation, on behalf of the Funds, entered into an Investment Advisory Agreement with the Manager, the Funds’ investment adviser and an indirect, wholly-owned subsidiary of BlackRock, Inc. (“BlackRock”), to provide investment advisory services. The Manager is responsible for the management of each Fund’s portfolio and provides the personnel, facilities, equipment and certain other services necessary to the operations of each Fund.
For such services, each Fund pays the Manager a monthly fee at an annual rate equal to the following percentages of the average daily value of each Fund’s net assets:
| | | | | | | | | | | | |
| | | Investment Advisory Fees | |
| Average Daily Net Assets | | Sustainable
International
Equity | | | Sustainable
U.S. Growth
Equity | | | Sustainable
U.S. Value
Equity | |
First $1 billion | | | 0.60 | % | | | 0.62 | % | | | 0.48 | % |
$1 billion - $3 billion | | | 0.56 | | | | 0.58 | | | | 0.45 | |
$3 billion - $5 billion | | | 0.54 | | | | 0.56 | | | | 0.43 | |
$5 billion - $10 billion | | | 0.52 | | | | 0.54 | | | | 0.42 | |
Greater than $10 billion | | | 0.51 | | | | 0.53 | | | | 0.41 | |
With respect to Sustainable International Equity, the Manager entered into a sub-advisory agreement with BlackRock International Limited (“BIL”), an affiliate of the Manager. The Manager pays BIL for services it provides for that portion of the Fund for which BIL acts as sub-adviser, a monthly fee that is equal to a percentage of the investment advisory fees paid by the Fund to the Manager.
Service and Distribution Fees: The Corporation, on behalf of the Funds, entered into a Distribution Agreement and a Distribution and Service Plan with BlackRock Investments, LLC (“BRIL”), an affiliate of the Manager. Pursuant to the Distribution and Service Plan and in accordance with Rule 12b-1 under the 1940 Act, each Fund pays BRIL ongoing service and distribution fees. The fees are accrued daily and paid monthly at annual rates based upon the average daily net assets of the relevant share class of each Fund as follows:
| | | | | | | | |
| | | |
| Share Class | | Service Fees | | | Distribution Fees | |
Investor A | | | 0.25 | % | | | N/A | |
| | |
NOTES TO FINANCIAL STATEMENTS | | 37 |
Notes to Financial Statements (continued)
BRIL and broker-dealers, pursuant to sub-agreements with BRIL, provide shareholder servicing and distribution services to the Funds. The ongoing service and/or distribution fee compensates BRIL and each broker-dealer for providing shareholder servicing and/or distribution related services to shareholders.
For the year ended April 30, 2024, the following table shows the class specific service and distribution fees borne directly by each share class of each Fund:
| | | | | | | | |
| | | |
| Fund Name | | Investor A | | | Total | |
Sustainable International Equity | | $ | 250 | | | $ | 250 | |
Sustainable U.S. Growth Equity | | | 273 | | | | 273 | |
Sustainable U.S. Value Equity | | | 568 | | | | 568 | |
Administration: The Corporation, on behalf of the Funds, entered into an Administration Agreement with the Manager, an indirect, wholly-owned subsidiary of BlackRock, to provide administrative services. For these services, the Manager receives an administration fee computed daily and payable monthly, based on a percentage of the average daily net assets of each Fund. The administration fee, which is shown as administration in the Statements of Operations, is paid at the annual rates below.
| | |
| | |
| Average Daily Net Assets | | Administration Fees |
First $500 million | | 0.0425% |
$500 million - $1 billion | | 0.0400 |
$1 billion - $2 billion | | 0.0375 |
$2 billion - $4 billion | | 0.0350 |
$4 billion - $13 billion | | 0.0325 |
Greater than $13 billion | | 0.0300 |
In addition, the Manager charges each of the share classes an administration fee, which is shown as administration — class specific in the Statements of Operations, at an annual rate of 0.02% of the average daily net assets of each respective class.
For the year ended April 30, 2024, the following table shows the class specific administration fees borne directly by each share class of each Fund:
| | | | | | | | | | | | | | | | |
| | | | | |
| Fund Name | | Institutional | | | Investor A | | | Class K | | | Total | |
Sustainable International Equity | | $ | 29 | | | $ | 20 | | | $ | 901 | | | $ | 950 | |
Sustainable U.S. Growth Equity | | | 19 | | | | 22 | | | | 842 | | | | 883 | |
Sustainable U.S. Value Equity | | | 22 | | | | 45 | | | | 930 | | | | 997 | |
Transfer Agent: Pursuant to written agreements, certain financial intermediaries, some of which may be affiliates, provide the Funds with sub-accounting, recordkeeping, sub-transfer agency and other administrative services with respect to servicing of underlying investor accounts. For these services, these entities receive an asset-based fee or an annual fee per shareholder account, which will vary depending on share class and/or net assets. For the year ended April 30, 2024, the Funds did not pay any amounts to affiliates in return for these services.
For the year ended April 30, 2024, the following table shows the class specific transfer agent fees borne directly by each share class of each Fund:
| | | | | | | | | | | | | | | | |
| | | | | |
| Fund Name | | Institutional | | | Investor A | | | Class K | | | Total | |
Sustainable International Equity | | $ | 104 | | | $ | 143 | | | $ | 46 | | | $ | 293 | |
Sustainable U.S. Growth Equity | | | 183 | | | | 343 | | | | 44 | | | | 570 | |
Sustainable U.S. Value Equity | | | 56 | | | | 609 | | | | 65 | | | | 730 | |
Other Fees: For the year ended April 30, 2024, affiliates earned underwriting discounts, direct commissions and dealer concessions on sales of each Fund’s Investor A Shares as follows:
| | | | |
| | |
| Fund Name | | Amounts | |
Sustainable International Equity | | $ | 73 | |
Sustainable U.S. Growth Equity | | | 73 | |
Sustainable U.S. Value Equity | | | 36 | |
Expense Limitations, Waivers, Reimbursements, and Recoupments: With respect to each Fund, the Manager contractually agreed to waive its investment advisory fees by the amount of investment advisory fees each Fund pays to the Manager indirectly through its investment in affiliated money market funds (the “affiliated money market fund waiver”) through June 30, 2025. The contractual agreement may be terminated upon 90 days’ notice by a majority of the directors who are not “interested persons” of the Corporation, as defined in the 1940 Act (“Independent Directors”), or by a vote of a majority of the outstanding voting securities of a Fund. The amount of waivers and/or reimbursements of fees and expenses made pursuant to the expense limitation described below will be reduced by the amount of the affiliated money market fund waiver. These amounts are included in fees waived and/or reimbursed by the Manager in the Statements of Operations. For the year ended April 30, 2024, the amounts waived were as follows:
| | | | |
| | |
| Fund Name | | Amounts Waived | |
Sustainable International Equity | | $ | 136 | |
Sustainable U.S. Growth Equity | | | 41 | |
Sustainable U.S. Value Equity | | | 27 | |
| | |
| 38 | | 2 0 2 4 BLACK ROCK ANNUAL REPORT TO SHAREHOLDERS |
Notes to Financial Statements (continued)
The Manager has contractually agreed to waive its investment advisory fee with respect to any portion of each Fund’s assets invested in affiliated equity and fixed-income mutual funds and affiliated exchange-traded funds that have a contractual management fee through June 30, 2025. The contractual agreement may be terminated upon 90 days’ notice by a majority of the Independent Directors, or by a vote of a majority of the outstanding voting securities of a Fund. For the year ended April 30, 2024, there were no fees waived and/or reimbursed by the Manager pursuant to this arrangement.
With respect to each Fund, the Manager contractually agreed to waive and/or reimburse fees or expenses in order to limit expenses, excluding interest expense, dividend expense, tax expense, acquired fund fees and expenses, and certain other fund expenses, which constitute extraordinary expenses not incurred in the ordinary course of each Fund’s business (“expense limitation”). The expense limitations as a percentage of average daily net assets are as follows:
| | | | | | | | | | | | |
| | | | |
| Share Class | | Sustainable
International
Equity | | | Sustainable
U.S. Growth
Equity | | | Sustainable
U.S. Value
Equity | |
Institutional | | | 0.65 | % | | | 0.67 | % | | | 0.53 | % |
Investor A | | | 0.90 | | | | 0.92 | | | | 0.78 | |
Class K | | | 0.60 | | | | 0.62 | | | | 0.48 | |
The Manager has agreed not to reduce or discontinue the contractual expense limitations through June 30, 2025, unless approved by the Board, including a majority of the Independent Directors, or by a vote of a majority of the outstanding voting securities of a Fund.
For the year ended April 30, 2024, the Manager waived and/or reimbursed investment advisory fees, which is included in fees waived and/or reimbursed by the Manager in the Statements of Operations, as follows:
| | | | |
| | |
| Fund Name | | Amounts Waived | |
Sustainable International Equity | | $ | 245,746 | |
Sustainable U.S. Growth Equity | | | 230,593 | |
Sustainable U.S. Value Equity | | | 232,951 | |
The following Funds also had a waiver of administration fees, which are included in Administration fees waived in the Statements of Operations. For the year ended April 30, 2024, the amounts were as follows:
| | | | |
| | |
| Fund Name | | Amounts Waived | |
Sustainable International Equity | | $ | 2,018 | |
Sustainable U.S. Growth Equity | | | 1,876 | |
Sustainable U.S. Value Equity | | | 2,118 | |
In addition, these amounts waived and/or reimbursed by the Manager are included in administration fees waived by the Manager — class specific and transfer agent fees waived and/or reimbursed by the Manager — class specific, respectively, in the Statements of Operations. For the year ended April 30, 2024, class specific expense waivers and/or reimbursements were as follows:
| | | | | | | | | | | | | | | | |
| | | Administration Fees Waived by the Manager -
Class Specific | |
| Fund Name | | Institutional | | | Investor A | | | Class K | | | Total | |
Sustainable International Equity | | $ | 17 | | | $ | 20 | | | $ | 898 | | | $ | 935 | |
Sustainable U.S. Growth Equity | | | 15 | | | | 22 | | | | 840 | | | | 877 | |
Sustainable U.S. Value Equity | | | 11 | | | | 45 | | | | 927 | | | | 983 | |
| | | | | | | | | | | | | | | | |
| | | Transfer Agent Fees Waived and/or Reimbursed by the Manager - Class Specific | |
| Fund Name | | Institutional | | | Investor A | | | Class K | | | Total | |
Sustainable International Equity | | $ | 56 | | | $ | 96 | | | $ | 46 | | | $ | 198 | |
Sustainable U.S. Growth Equity | | | 142 | | | | 290 | | | | 44 | | | | 476 | |
Sustainable U.S. Value Equity | | | 14 | | | | 495 | | | | 65 | | | | 574 | |
With respect to the contractual expense limitation, if during a Fund’s fiscal year the operating expenses of a share class, that at any time during the prior two fiscal years received a waiver and/or reimbursement from the Manager, are less than the current expense limitation for that share class, the Manager is entitled to be reimbursed by such share class up to the lesser of: (a) the amount of fees waived and/or expenses reimbursed during those prior two fiscal years under the agreement and (b) an amount not to exceed either the current expense limitation of that share class or the expense limitation of the share class in effect at the time that the share class received the applicable waiver and/or reimbursement, provided that:
| | (1) | each Fund, of which the share class is a part, has more than $50 million in assets for the fiscal year, and |
| | (2) | the Manager or an affiliate continues to serve as a Fund’s investment adviser or administrator. |
This repayment applies only to the contractual expense limitation on net expenses and does not apply to the contractual investment advisory fee waiver described above or any voluntary waivers that may be in effect from time to time. Effective October 19, 2028, the repayment arrangement between each Fund and the Manager pursuant to which such Fund may be required to repay amounts waived and/or reimbursed under each Fund’s contractual caps on net expenses will be terminated.
| | |
NOTES TO FINANCIAL STATEMENTS | | 39 |
Notes to Financial Statements (continued)
As of April 30, 2024, the fund level and class specific waivers and/or reimbursements subject to possible future recoupment under the expense limitation agreement were as follows:
| | | | | | | | |
| | | Expiring April 30, | |
| Fund Name/Fund Level/Share Class | | 2025 | | | 2026 | |
Sustainable International Equity | | | | | | | | |
Fund Level | | $ | 261,562 | | | $ | 247,764 | |
Institutional | | | 500 | | | | 73 | |
Investor A | | | 541 | | | | 116 | |
Class K | | | 1,055 | | | | 944 | |
Sustainable U.S. Growth Equity | | | | | | | | |
Fund Level | | | 225,509 | | | | 232,469 | |
Institutional | | | 335 | | | | 157 | |
Investor A | | | 582 | | | | 312 | |
Class K | | | 1,215 | | | | 884 | |
Sustainable U.S. Value Equity | | | | | | | | |
Fund Level | | | 223,571 | | | | 235,069 | |
Institutional | | | 461 | | | | 25 | |
Investor A | | | 542 | | | | 540 | |
Class K | | | 1,459 | | | | 992 | |
The following fund level and class specific waivers and/or reimbursements previously recorded by the Fund, which were subject to recoupment by the Manager, expired on April 30, 2024:
| | | | |
| | |
| Fund Name/Fund Level/Share Class | | Amounts | |
Sustainable International Equity | | | | |
Fund Level | | $ | 141,908 | |
Institutional | | | 179 | |
Investor A | | | 178 | |
Class K | | | 689 | |
Sustainable U.S. Growth Equity | | | | |
Fund Level | | | 132,882 | |
Institutional | | | 178 | |
Investor A | | | 179 | |
Class K | | | 666 | |
Sustainable U.S. Value Equity | | | | |
Fund Level | | | 133,001 | |
Institutional | | | 178 | |
Investor A | | | 177 | |
Class K | | | 714 | |
Securities Lending: The U.S. Securities and Exchange Commission (“SEC”) has issued an exemptive order which permits BIM, an affiliate of the Manager, to serve as securities lending agent for the Funds, subject to applicable conditions. As securities lending agent, BIM bears all operational costs directly related to securities lending. The Funds are responsible for fees in connection with the investment of cash collateral received for securities on loan (the “collateral investment fees”). The cash collateral is invested in a money market fund, BlackRock Cash Funds: Institutional, managed by the Manager or its affiliates. However, BIM has agreed to reduce the amount of securities lending income it receives in order to effectively limit the collateral investment fees the Funds bear to an annual rate of 0.04%. The SL Agency Shares of such money market fund will not be subject to a sales load, redemption fee, distribution fee or service fee. The money market fund in which the cash collateral has been reinvested may impose a discretionary liquidity fee of up to 2% of the value redeemed, if such fee, is determined to be in the best interests of such money market fund.
Securities lending income is generally equal to the total of income earned from the reinvestment of cash collateral, (and excludes collateral investment fees), and any fees or other payments to and from borrowers of securities. Each Fund retains a portion of the securities lending income and remits the remaining portion to BIM as compensation for its services as securities lending agent.
Pursuant to the current securities lending agreement, (i) Sustainable U.S. Growth Equity and Sustainable U.S. Value Equity retain 81% of securities lending income (which excludes collateral investment expenses); and (ii) Sustainable International Equity retains 82% of securities lending income (which excludes collateral investment expenses), and these amounts retained can never be less than 70% of the total of securities lending income plus the collateral investment expenses.
In addition, commencing the business day following the date that the aggregate securities lending income earned across the BlackRock Multi-Asset Complex in a calendar year exceeds a specified threshold, Sustainable U.S. Growth Equity and Sustainable U.S. Value Equity, pursuant to the securities lending agreement, will retain for the remainder of that calendar year securities lending income in an amount equal to 81% of securities lending income (which excludes collateral investment expenses), and this amount retained can never be less than 70% of the total of securities lending income plus the collateral investment expenses.
In addition, commencing the business day following the date that the aggregate securities lending income earned across the BlackRock Multi-Asset Complex in a calendar year exceeds a specified threshold, Sustainable International Equity, pursuant to the securities lending agreement, will retain for the remainder of that calendar year securities
| | |
| 40 | | 2 0 2 4 BLACK ROCK ANNUAL REPORT TO SHAREHOLDERS |
Notes to Financial Statements (continued)
lending income in an amount equal to 85% of securities lending income (which excludes collateral investment expenses), and this amount retained can never be less than 70% of the total of securities lending income plus the collateral investment expenses.
The share of securities lending income earned by each Fund is shown as securities lending income — affiliated — net in the Statements of Operations. For the year ended April 30, 2024, each Fund paid BIM the following amounts for securities lending agent services:
| | | | |
| | |
| Fund Name | | Amounts | |
Sustainable U.S. Growth Equity | | $ | 7 | |
Sustainable U.S. Value Equity | | | 28 | |
Interfund Lending: In accordance with an exemptive order (the “Order”) from the SEC, each Fund may participate in a joint lending and borrowing facility for temporary purposes (the “Interfund Lending Program”), subject to compliance with the terms and conditions of the Order, and to the extent permitted by each Fund’s investment policies and restrictions. Each Fund is currently permitted to borrow and lend under the Interfund Lending Program.
A lending BlackRock fund may lend in aggregate up to 15% of its net assets but may not lend more than 5% of its net assets to any one borrowing fund through the Interfund Lending Program. A borrowing BlackRock fund may not borrow through the Interfund Lending Program or from any other source more than 33 1/3% of its total assets (or any lower threshold provided for by the fund’s investment restrictions). If a borrowing BlackRock fund’s total outstanding borrowings exceed 10% of its total assets, each of its outstanding interfund loans will be subject to collateralization of at least 102% of the outstanding principal value of the loan. All interfund loans are for temporary or emergency purposes and the interest rate to be charged will be the average of the highest current overnight repurchase agreement rate available to a lending fund and the bank loan rate, as calculated according to a formula established by the Board.
During the year ended April 30, 2024, the Funds did not participate in the Interfund Lending Program.
Directors and Officers: Certain directors and/or officers of the Corporation are directors and/or officers of BlackRock or its affiliates. The Funds reimburse the Manager for a portion of the compensation paid to the Corporation’s Chief Compliance Officer, which is included in Directors and Officer in the Statements of Operations.
6. PURCHASES AND SALES
For the year ended April 30, 2024 purchases and sales of investments, excluding short-term securities, were as follows:
| | | | | | | | |
| | | |
| Fund Name | | Purchases | | | Sales | |
Sustainable International Equity | | $ | 1,825,245 | | | $ | 1,650,053 | |
Sustainable U.S. Growth Equity | | | 1,129,701 | | | | 1,064,953 | |
Sustainable U.S. Value Equity | | | 3,598,747 | | | | 3,512,948 | |
7. INCOME TAX INFORMATION
It is each Fund’s policy to comply with the requirements of the Internal Revenue Code of 1986, as amended, applicable to regulated investment companies, and to distribute substantially all of its taxable income to its shareholders. Therefore, no U.S. federal income tax provision is required.
Each Fund files U.S. federal and various state and local tax returns. No income tax returns are currently under examination. The statute of limitations on each Fund’s U.S. federal tax returns generally remains open for a period of three years after they are filed. The statutes of limitations on each Fund’s state and local tax returns may remain open for an additional year depending upon the jurisdiction.
Management has analyzed tax laws and regulations and their application to the Funds as of April 30, 2024, inclusive of the open tax return years, and does not believe that there are any uncertain tax positions that require recognition of a tax liability in the Funds’ financial statements.
U.S. GAAP requires that certain components of net assets be adjusted to reflect permanent differences between financial and tax reporting. These reclassifications have no effect on net assets or NAVs per share. As of period end, permanent differences attributable to the net operating loss were reclassified to the following accounts:
| | | | |
| | |
| | | Sustainable
U.S. Growth
Equity | |
Paid-in capital | | $ | (1,011 | ) |
Accumulated earnings (loss) | | | 1,011 | |
| | |
NOTES TO FINANCIAL STATEMENTS | | 41 |
Notes to Financial Statements (continued)
The tax character of distributions paid was as follows:
| | | | | | | | | | | | | | | | |
| | | | | |
| | | Period | | | Sustainable
International
Equity | | | Sustainable
U.S. Growth
Equity | | | Sustainable
U.S. Value
Equity | |
Ordinary income | | | 04/30/24 | | | $ | 63,648 | | | $ | 757 | | | $ | 98,614 | |
| | | 04/30/23 | | | | 56,086 | | | | 3,875 | | | | 138,868 | |
Long-term capital gains | | | 04/30/23 | | | | — | | | | — | | | | 1,869 | |
| | | | | | | | | | | | | | | | |
Total | | | 04/30/24 | | | $ | 63,648 | | | $ | 757 | | | $ | 98,614 | |
| | | | | | | | | | | | | | | | |
| | | 04/30/23 | | | $ | 56,086 | | | $ | 3,875 | | | $ | 140,737 | |
| | | | | | | | | | | | | | | | |
| | | | | | | | | | | | | | | | | |
As of April 30, 2024, the tax components of accumulated net earnings (loss) were as follows:
| | | | | | | | | | | | | | | | | | | | |
| | | | | | |
| Fund Name | | Undistributed
Ordinary Income | | | Non-expiring
Capital Loss
Carryforwards(a) | | | Net Unrealized
Gains (Losses)(b) | | | Qualified Late-Year
Ordinary Losses | | | Total | |
Sustainable International Equity | | $ | 36,872 | | | $ | (552,422 | ) | | $ | 432,051 | | | $ | — | | | $ | (83,499 | ) |
Sustainable U.S. Growth Equity | | | — | | | | (851,872 | ) | | | 695,344 | | | | (1,951 | ) | | | (158,479 | ) |
Sustainable U.S. Value Equity | | | 29,622 | | | | (798 | ) | | | 179,680 | | | | — | | | | 208,504 | |
| (a) | Amounts available to offset future realized capital gains. | |
| (b) | The difference between book-basis and tax-basis net unrealized gains (losses) was attributable primarily to the tax deferral of losses on wash sales. | |
During the year ended April 30, 2024, Sustainable U.S. Value Equity utilized $85,086 of its capital loss carryforward.
As of April 30, 2024, gross unrealized appreciation and depreciation based on cost of investments (including short positions and derivatives, if any) for U.S. federal income tax purposes were as follows:
| | | | | | | | | | | | | | | | |
| | | | | |
| Fund Name | | Tax Cost | | | Gross Unrealized
Appreciation | | | Gross Unrealized
Depreciation | | | Net Unrealized
Appreciation
(Depreciation) | |
Sustainable International Equity | | $ | 4,580,966 | | | $ | 810,079 | | | $ | (377,510 | ) | | $ | 432,569 | |
Sustainable U.S. Growth Equity | | | 4,221,539 | | | | 841,451 | | | | (146,103 | ) | | | 695,348 | |
Sustainable U.S. Value Equity | | | 5,187,709 | | | | 488,494 | | | | (308,807 | ) | | | 179,687 | |
8. BANK BORROWINGS
The Corporation, on behalf of the Funds, along with certain other funds managed by the Manager and its affiliates (“Participating Funds”), is party to a 364-day, $2.40 billion credit agreement with a group of lenders. Under this agreement, the Funds may borrow to fund shareholder redemptions. Excluding commitments designated for certain individual funds, the Participating Funds, including the Funds, can borrow up to an aggregate commitment amount of $1.75 billion at any time outstanding, subject to asset coverage and other limitations as specified in the agreement. The credit agreement has the following terms: a fee of 0.10% per annum on unused commitment amounts and interest at a rate equal to the higher of (a) Overnight Bank Funding Rate (“OBFR”) (but, in any event, not less than 0.00%) on the date the loan is made plus 0.80% per annum, (b) the Fed Funds rate (but, in any event, not less than 0.00%) in effect from time to time plus 0.80% per annum on amounts borrowed or (c) the sum of (x) Daily Simple Secured Overnight Financing Rate (“SOFR”) (but, in any event, not less than 0.00%) on the date the loan is made plus 0.10% and (y) 0.80% per annum. The agreement expires in April 2025 unless extended or renewed. These fees were allocated among such funds based upon portions of the aggregate commitment available to them and relative net assets of Participating Funds. During the year ended April 30, 2024, the Funds did not borrow under the credit agreement.
9. PRINCIPAL RISKS
In the normal course of business, the Funds invest in securities or other instruments and may enter into certain transactions, and such activities subject each Fund to various risks, including among others, fluctuations in the market (market risk) or failure of an issuer to meet all of its obligations. The value of securities or other instruments may also be affected by various factors, including, without limitation: (i) the general economy; (ii) the overall market as well as local, regional or global political and/or social instability; (iii) regulation, taxation or international tax treaties between various countries; or (iv) currency, interest rate and price fluctuations. Local, regional or global events such as war, acts of terrorism, the spread of infectious illness or other public health issues, recessions, or other events could have a significant impact on the Funds and their investments. Each Fund’s prospectus provides details of the risks to which each Fund is subject.
Valuation Risk: The market values of equities, such as common stocks and preferred securities or equity related investments, such as futures and options, may decline due to general market conditions which are not specifically related to a particular company. They may also decline due to factors which affect a particular industry or industries. A Fund may invest in illiquid investments. An illiquid investment is any investment that a Fund reasonably expects cannot be sold or disposed of in current market conditions in seven calendar days or less without the sale or disposition significantly changing the market value of the investment. A Fund may experience difficulty in selling illiquid investments in a timely manner at the price that it believes the investments are worth. Prices may fluctuate widely over short or extended periods in response to company, market or economic news. Markets also tend to move in cycles, with periods of rising and falling prices. This volatility may cause each Fund’s NAV to experience significant
| | |
| 42 | | 2 0 2 4 BLACK ROCK ANNUAL REPORT TO SHAREHOLDERS |
Notes to Financial Statements (continued)
increases or decreases over short periods of time. If there is a general decline in the securities and other markets, the NAV of a Fund may lose value, regardless of the individual results of the securities and other instruments in which a Fund invests.
Counterparty Credit Risk: The Funds may be exposed to counterparty credit risk, or the risk that an entity may fail to or be unable to perform on its commitments related to unsettled or open transactions, including making timely interest and/or principal payments or otherwise honoring its obligations. The Funds manage counterparty credit risk by entering into transactions only with counterparties that the Manager believes have the financial resources to honor their obligations and by monitoring the financial stability of those counterparties. Financial assets, which potentially expose the Funds to market, issuer and counterparty credit risks, consist principally of financial instruments and receivables due from counterparties. The extent of the Funds’ exposure to market, issuer and counterparty credit risks with respect to these financial assets is approximately their value recorded in the Statements of Assets and Liabilities, less any collateral held by the Funds.
Geographic/Asset Class Risk: A diversified portfolio, where this is appropriate and consistent with a fund’s objectives, minimizes the risk that a price change of a particular investment will have a material impact on the NAV of a fund. The investment concentrations within each Fund’s portfolio are disclosed in its Schedule of Investments.
Certain Funds invest a significant portion of their assets in securities within a single or limited number of market sectors. When a fund concentrates its investments in this manner, it assumes the risk that economic, regulatory, political and social conditions affecting such sectors may have a significant impact on the Fund and could affect the income from, or the value or liquidity of, the Fund’s portfolio. Investment percentages in specific sectors are presented in the Schedule of Investments.
Certain Funds invest a significant portion of their assets in securities of issuers located in Europe or with significant exposure to European issuers or countries. The European financial markets have recently experienced volatility and adverse trends due to concerns about economic downturns in, or rising government debt levels of, several European countries as well as acts of war in the region. These events may spread to other countries in Europe and may affect the value and liquidity of certain of the Funds’ investments.
Responses to the financial problems by European governments, central banks and others, including austerity measures and reforms, may not work, may result in social unrest and may limit future growth and economic recovery or have other unintended consequences. Further defaults or restructurings by governments and others of their debt could have additional adverse effects on economies, financial markets and asset valuations around the world. The United Kingdom has withdrawn from the European Union, and one or more other countries may withdraw from the European Union and/or abandon the Euro, the common currency of the European Union. These events and actions have adversely affected, and may in the future adversely affect, the value and exchange rate of the Euro and may continue to significantly affect the economies of every country in Europe, including countries that do not use the Euro and non-European Union member states. The impact of these actions, especially if they occur in a disorderly fashion, is not clear but could be significant and far reaching. In addition, Russia launched a large-scale invasion of Ukraine on February 24, 2022. The extent and duration of the military action, resulting sanctions and resulting future market disruptions in the region are impossible to predict, but have been, and may continue to be, significant and have a severe adverse effect on the region, including significant negative impacts on the economy and the markets for certain securities and commodities, such as oil and natural gas, as well as other sectors.
Certain Funds invest a significant portion of their assets in securities of issuers located in the United States. A decrease in imports or exports, changes in trade regulations, inflation and/or an economic recession in the United States may have a material adverse effect on the U.S. economy and the securities listed on U.S. exchanges. Proposed and adopted policy and legislative changes in the United States may also have a significant effect on U.S. markets generally, as well as on the value of certain securities. Governmental agencies project that the United States will continue to maintain elevated public debt levels for the foreseeable future which may constrain future economic growth. Circumstances could arise that could prevent the timely payment of interest or principal on U.S. government debt, such as reaching the legislative “debt ceiling.” Such non-payment would result in substantial negative consequences for the U.S. economy and the global financial system. If U.S. relations with certain countries deteriorate, it could adversely affect issuers that rely on the United States for trade. The United States has also experienced increased internal unrest and discord. If these trends were to continue, they may have an adverse impact on the U.S. economy and the issuers in which certain Funds invest.
Significant Shareholder Redemption Risk: Certain shareholders may own or manage a substantial amount of fund shares and/or hold their fund investments for a limited period of time. Large redemptions of fund shares by these shareholders may force a fund to sell portfolio securities, which may negatively impact the fund’s NAV, increase the fund’s brokerage costs, and/or accelerate the realization of taxable income/gains and cause the fund to make additional taxable distributions to shareholders.
10. CAPITAL SHARE TRANSACTIONS
Transactions in capital shares for each class were as follows:
| | | | | | | | | | | | | | | | |
| | | Year Ended 04/30/24 | | | Year Ended 04/30/23 | |
| Fund Name/Share Class | | Shares | | | Amount | | | Shares | | | Amount | |
Sustainable International Equity | | | | | | | | | | | | | | | | |
Institutional | | | | | | | | | | | | | | | | |
Shares sold | | | 6,572 | | | $ | 60,000 | | | | — | | | $ | — | |
Shares issued in reinvestment of distributions | | | 87 | | | | 814 | | | | — | | | | — | |
| | | | | | | | | | | | | | | | |
| | | 6,659 | | | $ | 60,814 | | | | — | | | $ | — | |
| | | | | | | | | | | | | | | | |
| | |
NOTES TO FINANCIAL STATEMENTS | | 43 |
Notes to Financial Statements (continued)
| | | | | | | | | | | | | | | | |
| | | Year Ended 04/30/24 | | | Year Ended 04/30/23 | |
| Fund Name/Share Class | | Shares | | | Amount | | | Shares | | | Amount | |
Sustainable International Equity (continued) | | | | | | | | | | | | | | | | |
Investor A | | | | | | | | | | | | | | | | |
Shares sold | | | 2,660 | | | $ | 26,259 | | | | 8 | | | $ | 77 | |
Shares issued in reinvestment of distributions | | | 1 | | | | 7 | | | | 2 | | | | 13 | |
Shares redeemed | | | (148 | ) | | | (1,366 | ) | | | — | | | | — | |
| | | | | | | | | | | | | | | | |
| | | 2,513 | | | $ | 24,900 | | | | 10 | | | $ | 90 | |
| | | | | | | | | | | | | | | | |
| | | 9,172 | | | $ | 85,714 | | | | 10 | | | $ | 90 | |
| | | | | | | | | | | | | | | | |
Sustainable U.S. Growth Equity | | | | | | | | | | | | | | | | |
Institutional | | | | | | | | | | | | | | | | |
Shares sold | | | 2,111 | | | $ | 18,953 | | | | 359 | | | $ | 2,500 | |
Shares issued in reinvestment of distributions | | | — | (a) | | | — | (a) | | | — | (a) | | | 1 | |
Shares redeemed | | | (355 | ) | | | (3,050 | ) | | | — | | | | — | |
| | | | | | | | | | | | | | | | |
| | | 1,756 | | | $ | 15,903 | | | | 359 | | | $ | 2,501 | |
| | | | | | | | | | | | | | | | |
Investor A | | | | | | | | | | | | | | | | |
Shares sold | | | 5,689 | | | $ | 53,101 | | | | 718 | | | $ | 5,111 | |
Shares redeemed | | | (812 | ) | | | (7,433 | ) | | | (115 | ) | | | (780 | ) |
| | | | | | | | | | | | | | | | |
| | | 4,877 | | | $ | 45,668 | | | | 603 | | | $ | 4,331 | |
| | | | | | | | | | | | | | | | |
| | | 6,633 | | | $ | 61,571 | | | | 962 | | | $ | 6,832 | |
| | | | | | | | | | | | | | | | |
Sustainable U.S. Value Equity | | | | | | | | | | | | | | | | |
Institutional | | | | | | | | | | | | | | | | |
Shares sold | | | 521 | | | $ | 5,000 | | | | 881 | | | $ | 7,957 | |
Shares issued in reinvestment of distributions | | | 28 | | | | 268 | | | | 12 | | | | 113 | |
| | | | | | | | | | | | | | | | |
| | | 549 | | | $ | 5,268 | | | | 893 | | | $ | 8,070 | |
| | | | | | | | | | | | | | | | |
Investor A | | | | | | | | | | | | | | | | |
Shares sold | | | 2,626 | | | $ | 26,233 | | | | 11,258 | | | $ | 106,111 | |
Shares issued in reinvestment of distributions | | | 235 | | | | 2,268 | | | | 231 | | | | 2,102 | |
Shares redeemed | | | (2,416 | ) | | | (24,120 | ) | | | (1,858 | ) | | | (16,921 | ) |
| | | | | | | | | | | | | | | | |
| | | 445 | | | $ | 4,381 | | | | 9,631 | | | $ | 91,292 | |
| | | | | | | | | | | | | | | | |
| | | 994 | | | $ | 9,649 | | | | 10,524 | | | $ | 99,362 | |
| | | | | | | | | | | | | | | | |
| | (a) | Rounds to less than 1. | |
As of April 30, 2024, shares owned by BlackRock Financial Management, Inc., an affiliate of the Funds, were as follows:
| | | | | | | | | | | | |
| | | | |
| Share Class | | Sustainable
International
Equity | | | Sustainable
U.S. Growth
Equity | | | Sustainable
U.S. Value
Equity | |
Institutional | | | 10,000 | | | | 10,000 | | | | 10,000 | |
Investor A | | | 10,000 | | | | 10,000 | | | | 10,000 | |
Class K | | | 480,000 | | | | 480,000 | | | | 480,000 | |
11. SUBSEQUENT EVENTS
Management’s evaluation of the impact of all subsequent events on the Funds’ financial statements was completed through the date the financial statements were issued and the following item was noted:
On May 16, 2024, the Board approved a proposal to close Sustainable International Equity and Sustainable U.S. Growth Equity to purchases and thereafter to liquidate each Fund. Accordingly, effective on August 6, 2024, each Fund will no longer accept purchase orders. On or about August 13, 2024 (the “Liquidation Date”), each Fund’s assets will be liquidated completely, the shares of any shareholders on the Liquidation Date will be redeemed at the NAV per share and each Fund will then be terminated.
| | |
| 44 | | 2 0 2 4 BLACK ROCK ANNUAL REPORT TO SHAREHOLDERS |
Report of Independent Registered Public Accounting Firm
To the Shareholders of BlackRock Sustainable International Equity Fund, BlackRock Sustainable U.S. Growth Equity Fund, and BlackRock Sustainable U.S. Value Equity Fund and the Board of Directors of BlackRock Funds VII, Inc.:
Opinion on the Financial Statements and Financial Highlights
We have audited the accompanying statements of assets and liabilities of BlackRock Sustainable International Equity Fund, BlackRock Sustainable U.S. Growth Equity Fund, and BlackRock Sustainable U.S. Value Equity Fund of BlackRock Funds VII, Inc. (the “Funds”), including the schedules of investments, as of April 30, 2024, the related statements of operations for the year then ended, the statements of changes in net assets for each of the two years in the period then ended, the financial highlights for each of the two years in the period then ended and for the period from October 18, 2021 (commencement of operations) through April 30, 2022, and the related notes. In our opinion, the financial statements and financial highlights present fairly, in all material respects, the financial position of the Funds as of April 30, 2024, and the results of their operations for the year then ended, the changes in their net assets for each of the two years in the period then ended, and the financial highlights for each of the two years in the period then ended, and for the period from October 18, 2021 (commencement of operations) through April 30, 2022, in conformity with accounting principles generally accepted in the United States of America.
Basis for Opinion
These financial statements and financial highlights are the responsibility of the Funds’ management. Our responsibility is to express an opinion on the Funds’ financial statements and financial highlights based on our audits. We are a public accounting firm registered with the Public Company Accounting Oversight Board (United States) (PCAOB) and are required to be independent with respect to the Funds in accordance with the U.S. federal securities laws and the applicable rules and regulations of the Securities and Exchange Commission and the PCAOB.
We conducted our audits in accordance with the standards of the PCAOB. Those standards require that we plan and perform the audit to obtain reasonable assurance about whether the financial statements and financial highlights are free of material misstatement, whether due to error or fraud. The Funds are not required to have, nor were we engaged to perform, an audit of their internal control over financial reporting. As part of our audits we are required to obtain an understanding of internal control over financial reporting but not for the purpose of expressing an opinion on the effectiveness of the Funds’ internal control over financial reporting. Accordingly, we express no such opinion.
Our audits included performing procedures to assess the risks of material misstatement of the financial statements and financial highlights, whether due to error or fraud, and performing procedures that respond to those risks. Such procedures included examining, on a test basis, evidence regarding the amounts and disclosures in the financial statements and financial highlights. Our audits also included evaluating the accounting principles used and significant estimates made by management, as well as evaluating the overall presentation of the financial statements and financial highlights. Our procedures included confirmation of securities owned as of April 30, 2024, by correspondence with custodians or counterparties; when replies were not received, we performed other auditing procedures. We believe that our audits provide a reasonable basis for our opinion.
Deloitte & Touche LLP
Boston, Massachusetts
June 24, 2024
We have served as the auditor of one or more BlackRock investment companies since 1992.
| | |
REPORT OF INDEPENDENT REGISTERED PUBLIC ACCOUNTING FIRM | | 45 |
Important Tax Information (unaudited)
The following amounts, or maximum amounts allowable by law is hereby designated as qualified dividend income for individuals for the fiscal year ended April 30, 2024:
| | | | |
| | |
| Fund Name | | Qualified Dividend
Income | |
Sustainable International Equity | | $ | 82,416 | |
Sustainable U.S. Value Equity | | | 91,421 | |
The Funds intend to pass through to its shareholders the following amounts, or maximum amount allowable by law, of the foreign source income earned and foreign taxes paid for the fiscal year ended April 30, 2024:
| | | | | | | | |
| | | |
| Fund Name | | Foreign Source
Income Earned | | | Foreign Taxes
Paid | |
Sustainable International Equity | | $ | 75,753 | | | $ | 9,547 | |
The Funds hereby designate the following amounts, or maximum amounts allowable by law, of distributions from direct federal obligation interest for the fiscal year ended April 30, 2024:
| | | | |
| | |
| Fund Name | | Federal Obligation
Interest | |
Sustainable International Equity | | $ | 1,087 | |
Sustainable U.S. Value Equity | | | 230 | |
The law varies in each state as to whether and what percent of ordinary income dividends attributable to federal obligations is exempt from state income tax. Shareholders are advised to check with their tax advisers to determine if any portion of the dividends received is exempt from state income tax.
The following percentage, or maximum percentage allowable by law, of ordinary income distributions paid during the fiscal year ended April 30, 2024 qualified for the dividends-received deduction for corporate shareholders:
| | | | |
| | |
| Fund Name | | Dividends-Received
Deduction | |
Sustainable International Equity | | | 5.79 | % |
Sustainable U.S. Value Equity | | | 80.87 | |
The Funds hereby designate the following amounts, or maximum amounts allowable by law, as interest income eligible to be treated as a Section 163(j) interest dividend for the fiscal year ended April 30, 2024:
| | | | |
| | |
| Fund Name | | Interest Dividends | |
Sustainable International Equity | | $ | 6,929 | |
Sustainable U.S. Value Equity | | | 1,458 | |
The Funds hereby designate the following amounts, or maximum amounts allowable by law, as interest-related dividends eligible for exemption from U.S. withholding tax for nonresident aliens and foreign corporations for the fiscal year ended April 30, 2024:
| | | | |
| | |
| Fund Name | | Interest-Related
Dividends | |
Sustainable International Equity | | $ | 6,929 | |
Sustainable U.S. Value Equity | | | 1,458 | |
| | |
| 46 | | 2 0 2 4 BLACK ROCK ANNUAL REPORT TO SHAREHOLDERS |
Statement Regarding Liquidity Risk Management Program
In compliance with Rule 22e-4 under the Investment Company Act of 1940, as amended (the “Liquidity Rule”), BlackRock Funds VII, Inc. (the “Corporation”) has adopted and implemented a liquidity risk management program (the “Program”) for BlackRock Sustainable International Equity Fund, BlackRock Sustainable U.S. Growth Equity Fund and BlackRock Sustainable U.S. Value Equity Fund (the “Funds”), each a series of the Corporation, which is reasonably designed to assess and manage each Fund’s liquidity risk.
The Board of Directors (the “Board”) of the Corporation, on behalf of the Funds, met on November 16-17, 2023 (the “Meeting”) to review the Program. The Board previously appointed BlackRock Advisors, LLC or BlackRock Fund Advisors (“BlackRock”), each an investment adviser to certain BlackRock funds, as the program administrator for each Fund’s Program, as applicable. BlackRock also previously delegated oversight of the Program to the 40 Act Liquidity Risk Management Committee (the “Committee”). At the Meeting, the Committee, on behalf of BlackRock, provided the Board with a report that addressed the operation of the Program and assessed its adequacy and effectiveness of implementation, including the management of each Fund’s Highly Liquid Investment Minimum (“HLIM”) where applicable, and any material changes to the Program (the “Report”). The Report covered the period from October 1, 2022 through September 30, 2023 (the “Program Reporting Period”).
The Report described the Program’s liquidity classification methodology for categorizing each Fund’s investments (including derivative transactions) into one of four liquidity buckets. It also referenced the methodology used by BlackRock to establish each Fund’s HLIM and noted that the Committee reviews and ratifies the HLIM assigned to each Fund no less frequently than annually. The Report also discussed notable events affecting liquidity over the Program Reporting Period, including the imposition of capital controls in certain countries.
The Report noted that the Program complied with the key factors for consideration under the Liquidity Rule for assessing, managing and periodically reviewing each Fund’s liquidity risk, as follows:
| | a) | The Fund’s investment strategy and liquidity of portfolio investments during both normal and reasonably foreseeable stressed conditions. During the Program Reporting Period, the Committee reviewed whether each Fund’s strategy is appropriate for an open-end fund structure with a focus on funds with more significant and consistent holdings of less liquid and illiquid assets. The Committee also factored a fund’s concentration in an issuer into the liquidity classification methodology by taking issuer position sizes into account. Where a fund participated in borrowings for investment purposes (such as tender option bonds or reverse repurchase agreements), such borrowings were factored into the Program’s calculation of a fund’s liquidity bucketing. A fund’s derivative exposure was also considered in such calculation. |
| | b) | Short-term and long-term cash flow projections during both normal and reasonably foreseeable stressed conditions. During the Program Reporting Period, the Committee reviewed historical redemption activity and used this information as a component to establish each Fund’s reasonably anticipated trading size utilized for liquidity classifications. Each Fund has adopted an in-kind redemption policy which may be utilized to meet larger redemption requests. The Committee may also take into consideration a fund’s shareholder ownership concentration (which, depending on product type and distribution channel, may or may not be available), a fund’s distribution channels, and the degree of certainty associated with a fund’s short-term and long-term cash flow projections. |
| | c) | Holdings of cash and cash equivalents, as well as borrowing arrangements. The Committee considered the terms of the credit facility committed to each Fund, the financial health of the institution providing the facility and the fact that the credit facility is shared among multiple funds (including that a portion of the aggregate commitment amount is specifically designated for BlackRock Floating Rate Income Portfolio, a series of BlackRock Funds V, and BlackRock Floating Rate Loan ETF, a series of BlackRock ETF Trust II). The Committee also considered other types of borrowing available to the funds, such as the ability to use reverse repurchase agreements and interfund lending, as applicable. |
There were no material changes to the Program during the Program Reporting Period other than the enhancement of certain model components in the Program’s classification methodology. The Report provided to the Board stated that the Committee concluded that based on the operation of the functions, as described in the Report, the Program is operating as intended and is effective in implementing the requirements of the Liquidity Rule.
| | |
STATEMENT REGARDING LIQUIDITY RISK MANAGEMENT PROGRAM | | 47 |
Director and Officer Information
| | | | | | | | |
| Independent Directors(a) |
| | | | | |
Name Year of Birth(b) | | Position(s) Held (Length of Service)(c) | | Principal Occupation(s) During Past 5 Years | | Number of BlackRock-Advised Registered Investment Companies (“RICs”) Consisting of Investment Portfolios (“Portfolios”) Overseen | | Public Company
and Other Investment Company Directorships Held During Past 5 Years |
| | | | |
Mark Stalnecker 1951 | | Chair of the Board (Since 2019) and Director (Since 2015) | | Chief Investment Officer, University of Delaware from 1999 to 2013; Trustee and Chair of the Finance and Investment Committees, Winterthur Museum and Country Estate from 2005 to 2016; Member of the Investment Committee, Delaware Public Employees’ Retirement System since 2002; Member of the Investment Committee, Christiana Care Health System from 2009 to 2017; Member of the Investment Committee, Delaware Community Foundation from 2013 to 2014; Director and Chair of the Audit Committee, SEI Private Trust Co. from 2001 to 2014. | | 28 RICs consisting of 164 Portfolios | | None |
| | | | |
Susan J. Carter 1956 | | Director (Since 2016) | | Trustee, Financial Accounting Foundation from 2017 to 2021; Advisory Board Member, Center for Private Equity and Entrepreneurship at Tuck School of Business from 1997 to 2021; Director, Pacific Pension Institute from 2014 to 2018; Senior Advisor, Commonfund Capital, Inc. (“CCI”) (investment adviser) in 2015; Chief Executive Officer, CCI from 2013 to 2014; President & Chief Executive Officer, CCI from 1997 to 2013; Advisory Board Member, Girls Who Invest from 2015 to 2018 and Board Member thereof from 2018 to 2022; Advisory Board Member, Bridges Fund Management from 2016 to 2018; Practitioner Advisory Board Member, Private Capital Research Institute (“PCRI”) since 2017; Lecturer in the Practice of Management, Yale School of Management since 2019; Advisor to Finance Committee, Altman Foundation since 2020; Investment Committee Member, Tostan since 2021; Member of the President’s Counsel, Commonfund since 2023. | | 28 RICs consisting of
164 Portfolios | | None |
| | | | |
Collette Chilton 1958 | | Director (Since 2015) | | Senior advisor, Insignia since 2024; Chief Investment Officer, Williams College from 2006 to 2023; Chief Investment Officer, Lucent Asset Management Corporation from 1998 to 2006; Director, Boys and Girls Club of Boston since 2017; Director, B1 Capital since 2018; Director, David and Lucile Packard Foundation since 2020. | | 28 RICs consisting of 164 Portfolios | | None |
| | | | |
Neil A. Cotty 1954 | | Director (Since 2016) | | Bank of America Corporation from 1996 to 2015, serving in various senior finance leadership roles, including Chief Accounting Officer from 2009 to 2015, Chief Financial Officer of Global Banking, Markets and Wealth Management from 2008 to 2009, Chief Accounting Officer from 2004 to 2008, Chief Financial Officer of Consumer Bank from 2003 to 2004, Chief Financial Officer of Global Corporate Investment Bank from 1999 to 2002. | | 28 RICs consisting of 164 Portfolios | | None |
| | | | |
Lena G. Goldberg 1949 | | Director (Since 2019) | | Director, Pioneer Public Interest Law Center since 2023; Director, Charles Stark Draper Laboratory, Inc. from 2013 to 2021; Senior Lecturer, Harvard Business School, from 2008 to 2021; FMR LLC/Fidelity Investments (financial services) from 1996 to 2008, serving in various senior roles including Executive Vice President - Strategic Corporate Initiatives and Executive Vice President and General Counsel; Partner, Sullivan & Worcester LLP from 1985 to 1996 and Associate thereof from 1979 to 1985. | | 28 RICs consisting of 164 Portfolios | | None |
| | |
| 48 | | 2 0 2 4 BLACK ROCK ANNUAL REPORT TO SHAREHOLDERS |
Director and Officer Information (continued)
| | | | | | | | |
| Independent Directors(a) |
| | | | | |
Name Year of Birth(b) | | Position(s) Held (Length of Service)(c) | | Principal Occupation(s) During Past 5 Years | | Number of BlackRock-Advised Registered Investment Companies (“RICs”) Consisting of Investment Portfolios (“Portfolios”) Overseen | | Public Company and Other Investment Company Directorships Held During Past 5 Years |
| | | | |
Henry R. Keizer 1956 | | Director (Since 2019) | | Director, Park Indemnity Ltd. (captive insurer) from 2010 to 2022. | | 28 RICs consisting of 164 Portfolios | | GrafTech International Ltd. (materials manufacturing); Sealed Air Corp. (packaging); WABCO (commercial vehicle safety systems) from 2015 to 2020; Hertz Global Holdings (car rental) from 2015 to 2021. |
| | | | |
Cynthia A. Montgomery 1952 | | Director (Since 2007) | | Professor, Harvard Business School since 1989. | | 28 RICs consisting of 164 Portfolios | | None |
| | | | |
Donald C. Opatrny 1952 | | Director (Since 2019) | | Chair of the Board of Phoenix Art Museum since 2022 and Trustee thereof since 2018; Chair of the Investment Committee of The Arizona Community Foundation since 2022 and Trustee thereof since 2020; Director, Athena Capital Advisors LLC (investment management firm) from 2013 to 2020; Trustee, Vice Chair, Member of the Executive Committee and Chair of the Investment Committee, Cornell University from 2004 to 2019; Member of Affordable Housing Supply Board of Jackson, Wyoming from 2017 to 2022; Member, Investment Funds Committee, State of Wyoming from 2017 to 2023; Trustee, Artstor (a Mellon Foundation affiliate) from 2010 to 2015; Member of the Investment Committee, Mellon Foundation from 2009 to 2015; President, Trustee and Member of the Investment Committee, The Aldrich Contemporary Art Museum from 2007 to 2014; Trustee and Chair of the Investment Committee, Community Foundation of Jackson Hole since 2014. | | 28 RICs consisting of 164 Portfolios | | None |
| | | | |
Kenneth L. Urish 1951 | | Director (Since 2007) | | Managing Partner, Urish Popeck & Co., LLC (certified public accountants and consultants) since 1976; Past-Chairman of the Professional Ethics Committee of the Pennsylvania Institute of Certified Public Accountants and Committee Member thereof since 2007; Member of External Advisory Board, The Pennsylvania State University Accounting Department since 2001, Emeritus since 2022; Principal, UP Strategic Wealth Investment Advisors, LLC since 2013; Trustee, The Holy Family Institute from 2001 to 2010; President and Trustee, Pittsburgh Catholic Publishing Associates from 2003 to 2008; Director, Inter-Tel from 2006 to 2007; Member, Advisory Board, ESG Competent Boards since 2020. | | 28 RICs consisting of 164 Portfolios | | None |
| | |
DIRECTOR AND OFFICER INFORMATION | | 49 |
Director and Officer Information (continued)
| | | | | | | | |
| Independent Directors(a) |
| | | | | |
Name Year of Birth(b) | | Position(s) Held (Length of Service)(c) | | Principal Occupation(s) During Past 5 Years | | Number of BlackRock-Advised Registered Investment Companies (“RICs”) Consisting of Investment Portfolios (“Portfolios”) Overseen | | Public Company
and Other
Investment
Company
Directorships
Held During Past 5 Years |
| | | | |
Claire A. Walton 1957 | | Director (Since 2016) | | Advisory Board Member, Grossman School of Business at the University of Vermont since 2023; Advisory Board Member, Scientific Financial Systems since 2022; General Partner of Neon Liberty Capital Management, LLC from 2003 to 2023; Chief Operating Officer and Chief Financial Officer of Liberty Square Asset Management, LP from 1998 to 2015; Director, Boston Hedge Fund Group from 2009 to 2018; Director, Massachusetts Council on Economic Education from 2013 to 2015; Director, Woodstock Ski Runners from 2013 to 2022. | | 28 RICs consisting of 166 Portfolios | | None |
|
| Interested Directors(a)(d) |
| | | | | |
Name Year of Birth(b) | | Position(s) Held (Length of Service)(c) | | Principal Occupation(s) During Past 5 Years | | Number of BlackRock-Advised Registered Investment Companies (“RICs”) Consisting of Investment Portfolios (“Portfolios”) Overseen | | Public Company
and Other
Investment
Company
Directorships Held During Past 5Years |
| | | | |
Robert Fairbairn 1965 | | Director (Since 2018) | | Vice Chairman of BlackRock, Inc. since 2019; Member of BlackRock’s Global Executive and Global Operating Committees; Co-Chair of BlackRock’s Human Capital Committee; Senior Managing Director of BlackRock, Inc. from 2010 to 2019; oversaw BlackRock’s Strategic Partner Program and Strategic Product Management Group from 2012 to 2019; Member of the Board of Managers of BlackRock Investments, LLC from 2011 to 2018; Global Head of BlackRock’s Retail and iShares® businesses from 2012 to 2016. | | 96 RICs consisting of 266 Portfolios | | None |
| | | | |
John M. Perlowski(e) 1964 | | Director (Since 2015) President and Chief Executive Officer (Since 2010) | | Managing Director of BlackRock, Inc. since 2009; Head of BlackRock Global Accounting and Product Services since 2009; Advisory Director of Family Resource Network (charitable foundation) since 2009. | | 98 RICs consisting of 268 Portfolios | | None |
| (a) | The address of each Director is c/o BlackRock, Inc., 50 Hudson Yards, New York, New York 10001. |
| (b) | Independent Directors serve until their resignation, retirement, removal or death, or until December 31 of the year in which they turn 75. The Board may determine to extend the terms of Independent Directors on a case-by-case basis, as appropriate. |
| (c) | Following the combination of Merrill Lynch Investment Managers, L.P. (“MLIM”) and BlackRock, Inc. in September 2006, the various legacy MLIM and legacy BlackRock fund boards were realigned and consolidated into three new fund boards in 2007. Furthermore, effective January 1, 2019, three BlackRock Fund Complexes were realigned and consolidated into two BlackRock Fund Complexes. As a result, although the chart shows the year that each Independent Director joined the Board, certain Independent Directors first became members of the boards of other BlackRock-advised Funds, legacy MLIM funds or legacy BlackRock funds as follows: Cynthia A. Montgomery, 1994; Kenneth L. Urish, 1999; Lena G. Goldberg, 2016; Henry R. Keizer, 2016; Donald C. Opatrny, 2015. |
| (d) | Mr. Fairbairn and Mr. Perlowski are both “interested persons,” as defined in the 1940 Act, of the Corporation based on their positions with BlackRock, Inc. and its affiliates. Mr. Fairbairn and Mr. Perlowski are also board members of the BlackRock Fixed-Income Complex. |
| (e) | Mr. Perlowski is also a trustee of the BlackRock Credit Strategies Fund and BlackRock Private Investments Fund. |
| | |
| 50 | | 2 0 2 4 BLACK ROCK ANNUAL REPORT TO SHAREHOLDERS |
Director and Officer Information (continued)
| | | | |
| Officers Who Are Not Directors(a) |
| | | |
Name Year of Birth(b) | | Position(s) Held (Length of Service) | | Principal Occupation(s) During Past 5 Years |
| | |
Jennifer McGovern 1977 | | Vice President (Since 2014) | | Managing Director of BlackRock, Inc. since 2016. |
| | |
Trent Walker 1974 | | Chief Financial Officer (Since 2021) | | Managing Director of BlackRock, Inc. since September 2019; Executive Vice President of PIMCO from 2016 to 2019. |
| | |
Jay M. Fife 1970 | | Treasurer (Since 2007) | | Managing Director of BlackRock, Inc. since 2007. |
| | |
Aaron Wasserman 1974 | | Chief Compliance Officer (Since 2023) | | Managing Director of BlackRock, Inc. since 2018; Chief Compliance Officer of the BlackRock-advised funds in the BlackRock Multi-Asset Complex, the BlackRock Fixed-Income Complex and the iShares Complex since 2023; Deputy Chief Compliance Officer for the BlackRock- advised funds in the BlackRock Multi-Asset Complex, the BlackRock Fixed-Income Complex and the iShares Complex from 2014 to 2023. |
| | |
Lisa Belle 1968 | | Anti-Money Laundering Compliance Officer (Since 2019) | | Managing Director of BlackRock, Inc. since 2019; Global Financial Crime Head for Asset and Wealth Management of JP Morgan from 2013 to 2019. |
| | |
Janey Ahn 1975 | | Secretary (Since 2019) | | Managing Director of BlackRock, Inc. since 2018. |
| (a) | The address of each Officer is c/o BlackRock, Inc., 50 Hudson Yards, New York, New York 10001. |
| (b) | Officers of the Corporation serve at the pleasure of the Board. |
Further information about the Corporation’s Directors and Officers is available in the Corporation’s Statement of Additional Information, which can be obtained without charge by calling (800) 441-7762.
Effective July 1, 2023, Aaron Wasserman replaced Charles Park as Chief Compliance Officer of the Trust.
Effective June 1, 2024, Lori Richards was appointed as a Director of the Trust.
| | |
DIRECTOR AND OFFICER INFORMATION | | 51 |
Additional Information
Tailored Shareholder Reports for Open-End Mutual Funds and ETFs
Effective January 24, 2023, the SEC adopted rule and form amendments to require open-end mutual funds and ETFs to transmit concise and visually engaging streamlined annual and semiannual reports to shareholders that highlight key information. Other information, including financial statements, will no longer appear in a streamlined shareholder report but must be available online, delivered free of charge upon request, and filed on a semiannual basis on Form N-CSR. The rule and form amendments have a compliance date of July 24, 2024. At this time, management is evaluating the impact of these amendments on the shareholder reports for the Funds.
General Information
Quarterly performance, semi-annual and annual reports, current net asset value and other information regarding the Funds may be found on BlackRock’s website, which can be accessed at blackrock.com. Any reference to BlackRock’s website in this report is intended to allow investors public access to information regarding the Funds and does not, and is not intended to, incorporate BlackRock’s website in this report.
Householding
The Funds will mail only one copy of shareholder documents, including prospectuses, annual and semi-annual reports, Rule 30e-3 notices and proxy statements, to shareholders with multiple accounts at the same address. This practice is commonly called “householding” and is intended to reduce expenses and eliminate duplicate mailings of shareholder documents. Mailings of your shareholder documents may be householded indefinitely unless you instruct us otherwise. If you do not want the mailing of these documents to be combined with those for other members of your household, please call the Funds at (800) 441-7762.
Availability of Quarterly Schedule of Investments
The Funds file their complete schedules of portfolio holdings with the SEC for the first and third quarters of each fiscal year as an exhibit to their reports on Form N-PORT. The Funds’ Forms N-PORT are available on the SEC’s website at sec.gov. Additionally, each Fund makes its portfolio holdings for the first and third quarters of each fiscal year available at blackrock.com/fundreports.
Availability of Proxy Voting Policies, Procedures and Voting Records
A description of the policies and procedures that the Funds use to determine how to vote proxies relating to portfolio securities and information about how the Funds voted proxies relating to securities held in the Funds’ portfolios during the most recent 12-month period ended June 30 is available without charge, upon request (1) by calling (800) 441-7762; (2) on the BlackRock website at blackrock.com; and (3) on the SEC’s website at sec.gov.
BlackRock’s Mutual Fund Family
BlackRock offers a diverse lineup of open-end mutual funds crossing all investment styles and managed by experts in equity, fixed-income and tax-exempt investing. Visit blackrock.com for more information.
Shareholder Privileges
Account Information
Call us at (800) 441-7762 from 8:00 AM to 6:00 PM ET on any business day to get information about your account balances, recent transactions and share prices. You can also visit blackrock.com for more information.
Automatic Investment Plans
Investor class shareholders who want to invest regularly can arrange to have $50 or more automatically deducted from their checking or savings account and invested in any of the BlackRock funds.
Systematic Withdrawal Plans
Investor class shareholders can establish a systematic withdrawal plan and receive periodic payments of $50 or more from their BlackRock funds, as long as their account balance is at least $10,000.
Retirement Plans
Shareholders may make investments in conjunction with Traditional, Rollover, Roth, Coverdell, Simple IRAs, SEP IRAs and 403(b) Plans.
BlackRock Privacy Principles
BlackRock is committed to maintaining the privacy of its current and former fund investors and individual clients (collectively, “Clients”) and to safeguarding their non-public personal information. The following information is provided to help you understand what personal information BlackRock collects, how we protect that information and why in certain cases we share such information with select parties.
| | |
| 52 | | 2 0 2 4 BLACK ROCK ANNUAL REPORT TO SHAREHOLDERS |
Additional Information (continued)
If you are located in a jurisdiction where specific laws, rules or regulations require BlackRock to provide you with additional or different privacy-related rights beyond what is set forth below, then BlackRock will comply with those specific laws, rules or regulations.
BlackRock obtains or verifies personal non-public information from and about you from different sources, including the following: (i) information we receive from you or, if applicable, your financial intermediary, on applications, forms or other documents; (ii) information about your transactions with us, our affiliates, or others; (iii) information we receive from a consumer reporting agency; and (iv) from visits to our websites.
BlackRock does not sell or disclose to non-affiliated third parties any non-public personal information about its Clients, except as permitted by law or as is necessary to respond to regulatory requests or to service Client accounts. These non-affiliated third parties are required to protect the confidentiality and security of this information and to use it only for its intended purpose.
We may share information with our affiliates to service your account or to provide you with information about other BlackRock products or services that may be of interest to you. In addition, BlackRock restricts access to non-public personal information about its Clients to those BlackRock employees with a legitimate business need for the information. BlackRock maintains physical, electronic and procedural safeguards that are designed to protect the non-public personal information of its Clients, including procedures relating to the proper storage and disposal of such information.
Fund and Service Providers
| | |
| Investment Adviser and Administrator | | Independent Registered Public Accounting Firm |
| BlackRock Advisors, LLC | | Deloitte & Touche LLP |
| Wilmington, DE 19809 | | Boston, MA 02116 |
| |
| Sub-Adviser(a) | | Distributor |
| BlackRock International Limited | | BlackRock Investments, LLC |
| Edinburgh, EH3 8BL | | New York, NY 10001 |
| United Kingdom | | |
| | Legal Counsel |
| Accounting Agent and Transfer Agent | | Sidley Austin LLP |
| BNY Mellon Investment Servicing (US) Inc. | | New York, NY 10019 |
| Wilmington, DE 19809 | | |
| | Address of the Corporation |
| Custodian | | 100 Bellevue Parkway |
| The Bank of New York Mellon | | Wilmington, DE 19809 |
| New York, NY 10286 | | |
| |
(a) For BlackRock Sustainable International Equity Fund. | | |
| | |
ADDITIONAL INFORMATION | | 53 |
Glossary of Terms Used in this Report
| | |
| Portfolio Abbreviation |
| |
| ADR | | American Depositary Receipt |
| |
| NVS | | Non-Voting Shares |
| | |
| 54 | | 2 0 2 4 BLACK ROCK ANNUAL REPORT TO SHAREHOLDERS |
THIS PAGE INTENTIONALLY LEFT BLANK.
Want to know more?
blackrock.com | 800-441-7762
This report is intended for current holders. It is not authorized for use as an offer of sale or a solicitation of an offer to buy shares of the Funds unless preceded or accompanied by the Funds’ current prospectus. Past performance results shown in this report should not be considered a representation of future performance. Investment returns and principal value of shares will fluctuate so that shares, when redeemed, may be worth more or less than their original cost. Statements and other information herein are as dated and are subject to change.
SEF-04/24-AR
(b) Not Applicable
| Item 2 – | Code of Ethics – The registrant (or the “Fund”) has adopted a code of ethics, as of the end of the period covered by this report, applicable to the registrant’s principal executive officer, principal financial officer, principal accounting officer or controller, or persons performing similar functions. During the period covered by this report, the code of ethics was amended to update certain information and to make other non-material changes. During the period covered by this report, there have been no waivers granted under the code of ethics. The registrant undertakes to provide a copy of the code of ethics to any person upon request, without charge, who calls 1-800-441-7762. |
| Item 3 – | Audit Committee Financial Expert – The registrant’s board of directors (the “board of directors”), has determined that (i) the registrant has the following audit committee financial experts serving on its audit committee and (ii) each audit committee financial expert is independent: |
Neil A. Cotty
Henry R. Keizer
Kenneth L. Urish
Under applicable securities laws, a person determined to be an audit committee financial expert will not be deemed an “expert” for any purpose, including without limitation for the purposes of Section 11 of the Securities Act of 1933, as a result of being designated or identified as an audit committee financial expert. The designation or identification of a person as an audit committee financial expert does not impose on such person any duties, obligations, or liabilities greater than the duties, obligations, and liabilities imposed on such person as a member of the audit committee and board of directors in the absence of such designation or identification. The designation or identification of a person as an audit committee financial expert does not affect the duties, obligations, or liability of any other member of the audit committee or board of directors.
| Item 4 – | Principal Accountant Fees and Services |
The following table presents fees billed by Deloitte & Touche LLP (“D&T”) in each of the last two fiscal years for the services rendered to the Fund:
| | | | | | | | | | | | | | | | |
| | | (a) Audit Fees | | (b) Audit-Related Fees1 | | (c) Tax Fees2 | | (d) All Other Fees |
| Entity Name | | Current
Fiscal Year
End | | Previous
Fiscal Year
End | | Current
Fiscal Year
End | | Previous
Fiscal Year
End | | Current
Fiscal Year
End | | Previous
Fiscal Year
End | | Current
Fiscal Year
End | | Previous
Fiscal Year
End |
BlackRock Sustainable International Equity Fund | | $31,824 | | $31,824 | | $407 | | $44 | | $16,328 | | $23,150 | | $0 | | $0 |
BlackRock Sustainable U.S. Growth Equity Fund | | $26,520 | | $26,520 | | $407 | | $44 | | $15,288 | | $21,650 | | $0 | | $0 |
BlackRock Sustainable U.S. Value Equity Fund | | $26,520 | | $26,520 | | $407 | | $44 | | $15,288 | | $21,650 | | $0 | | $0 |
The following table presents fees billed by D&T that were required to be approved by the registrant’s audit committee (the “Committee”) for services that relate directly to the operations or financial reporting of the Fund and that are rendered on behalf of BlackRock Advisors, LLC (the “Investment Adviser” or “BlackRock”) and entities controlling, controlled by, or under common control with BlackRock (not including any sub-adviser whose role is primarily portfolio management and is subcontracted with or
2
overseen by another investment adviser) that provide ongoing services to the Fund (“Affiliated Service Providers”):
| | | | |
| | | Current Fiscal Year End | | Previous Fiscal Year End |
(b) Audit-Related Fees1 | | $0 | | $0 |
(c) Tax Fees2 | | $0 | | $0 |
(d) All Other Fees3 | | $2,149,000 | | $2,154,000 |
1 The nature of the services includes assurance and related services reasonably related to the performance of the audit or review of financial statements not included in Audit Fees, including accounting consultations, agreed-upon procedure reports, attestation reports, comfort letters, out-of-pocket expenses and internal control reviews not required by regulators.
2 The nature of the services includes tax compliance and/or tax preparation, including services relating to the filing or amendment of federal, state or local income tax returns, regulated investment company qualification reviews, taxable income and tax distribution calculations.
3 Non-audit fees of $2,149,000 and $2,154,000 for the current fiscal year and previous fiscal year, respectively, were paid to the Fund’s principal accountant in their entirety by BlackRock, in connection with services provided to the Affiliated Service Providers of the Fund and of certain other funds sponsored and advised by BlackRock or its affiliates for a service organization review and an accounting research tool subscription. These amounts represent aggregate fees paid by BlackRock and were not allocated on a per fund basis.
(e)(1) Audit Committee Pre-Approval Policies and Procedures:
The Committee has adopted policies and procedures with regard to the pre-approval of services. Audit, audit-related and tax compliance services provided to the registrant on an annual basis require specific pre-approval by the Committee. The Committee also must approve other non-audit services provided to the registrant and those non-audit services provided to the Investment Adviser and Affiliated Service Providers that relate directly to the operations and the financial reporting of the registrant. Certain of these non-audit services that the Committee believes are (a) consistent with the SEC’s auditor independence rules and (b) routine and recurring services that will not impair the independence of the independent accountants may be approved by the Committee without consideration on a specific case-by-case basis (“general pre-approval”). The term of any general pre-approval is 12 months from the date of the pre-approval, unless the Committee provides for a different period. Tax or other non-audit services provided to the registrant which have a direct impact on the operations or financial reporting of the registrant will only be deemed pre-approved provided that any individual project does not exceed $10,000 attributable to the registrant or $50,000 per project. For this purpose, multiple projects will be aggregated to determine if they exceed the previously mentioned cost levels.
Any proposed services exceeding the pre-approved cost levels will require specific pre-approval by the Committee, as will any other services not subject to general pre-approval (e.g., unanticipated but permissible services). The Committee is informed of each service approved subject to general pre-approval at the next regularly scheduled in-person board meeting. At this meeting, an analysis of such services is presented to the Committee for ratification. The Committee may delegate to the Committee Chairman the authority to approve the provision of and fees for any specific engagement of permitted non-audit services, including services exceeding pre-approved cost levels.
(e)(2) None of the services described in each of Items 4(b) through (d) were approved by the Committee pursuant to the de minimis exception in paragraph (c)(7)(i)(C) of Rule 2-01 of Regulation S-X.
(f) Not Applicable
3
(g) The aggregate non-audit fees, defined as the sum of the fees shown under “Audit-Related Fees,” “Tax Fees” and “All Other Fees,” paid to the accountant for services rendered by the accountant to the registrant, the Investment Adviser and the Affiliated Service Providers were:
| | | | |
| Entity Name | | Current Fiscal Year End | | Previous Fiscal Year End |
BlackRock Sustainable International Equity Fund | | $16,735 | | $23,194 |
BlackRock Sustainable U.S. Growth Equity Fund | | $15,695 | | $21,694 |
BlackRock Sustainable U.S. Value Equity Fund | | $15,695 | | $21,694 |
Additionally, the amounts billed by D&T in connection with services provided to the Affiliated Service Providers of the Fund and of other funds sponsored and advised by BlackRock or its affiliates during the current and previous fiscal years for a service organization review and an accounting research tool subscription were:
| | |
Current Fiscal Year End | | Previous Fiscal Year End |
$2,149,000 | | $2,154,000 |
These amounts represent aggregate fees paid by BlackRock and were not allocated on a per fund basis.
(h) The Committee has considered and determined that the provision of non-audit services that were rendered to the Investment Adviser and the Affiliated Service Providers that were not pre-approved pursuant to paragraph (c)(7)(ii) of Rule 2-01 of Regulation S-X is compatible with maintaining the principal accountant’s independence.
(i) – Not Applicable
(j) – Not Applicable
| Item 5 – | Audit Committee of Listed Registrant – Not Applicable |
(a) The registrant’s Schedule of Investments is included as part of the Report to Stockholders filed under Item 1(a) of this Form.
(b) Not Applicable due to no such divestments during the semi-annual period covered since the previous Form N-CSR filing.
| Item 7 – | Disclosure of Proxy Voting Policies and Procedures for Closed-End Management Investment Companies – Not Applicable |
4
| Item 8 – | Portfolio Managers of Closed-End Management Investment Companies – Not Applicable |
| Item 9 – | Purchases of Equity Securities by Closed-End Management Investment Company and Affiliated Purchasers – Not Applicable |
| Item 10 – | Submission of Matters to a Vote of Security Holders – There have been no material changes to these procedures. |
| Item 11 – | Controls and Procedures |
(a) The registrant’s principal executive and principal financial officers, or persons performing similar functions, have concluded that the registrant’s disclosure controls and procedures (as defined in Rule 30a-3(c) under the Investment Company Act of 1940, as amended (the “1940 Act”)) are effective as of a date within 90 days of the filing of this report based on the evaluation of these controls and procedures required by Rule 30a-3(b) under the 1940 Act and Rule 15d-15(b) under the Securities Exchange Act of 1934, as amended.
(b) There were no changes in the registrant’s internal control over financial reporting (as defined in Rule 30a-3(d) under the 1940 Act) that occurred during the period covered by this report that have materially affected, or are reasonably likely to materially affect, the registrant’s internal control over financial reporting.
| Item 12 – | Disclosure of Securities Lending Activities for Closed-End Management Investment Companies – Not Applicable |
| Item 13 – | Recovery of Erroneously Awarded Compensation – Not Applicable |
| Item 14 – | Exhibits attached hereto |
(a)(1) Code of Ethics – See Item 2
(a)(2) Any policy required by the listing standards adopted pursuant to Rule 10D-1 under the Exchange Act (17 CFR 240.10D-1) by the registered national securities exchange or registered national securities association upon which the Registrant’s securities are listed – Not Applicable
(a)(3) Section 302 Certifications are attached
(a)(4) Any written solicitation to purchase securities under Rule 23c-1 – Not Applicable
(a)(5) Change in Registrant’s independent public accountant – Not Applicable
(b) Section 906 Certifications are attached
5
Pursuant to the requirements of the Securities Exchange Act of 1934 and the Investment Company Act of 1940, the registrant has duly caused this report to be signed on its behalf by the undersigned, thereunto duly authorized.
BlackRock Funds VII, Inc.
| | | | |
| | By: | | /s/ John M. Perlowski |
| | | | John M. Perlowski |
| | | | Chief Executive Officer (principal executive officer) of |
| | | | BlackRock Funds VII, Inc. |
Date: June 24, 2024
Pursuant to the requirements of the Securities Exchange Act of 1934 and the Investment Company Act of 1940, this report has been signed below by the following persons on behalf of the registrant and in the capacities and on the dates indicated.
| | | | |
| | By: | | /s/ John M. Perlowski |
| | | | John M. Perlowski |
| | | | Chief Executive Officer (principal executive officer) of |
| | | | BlackRock Funds VII, Inc. |
Date: June 24, 2024
| | | | |
| | By: | | /s/ Trent Walker |
| | | | Trent Walker |
| | | | Chief Financial Officer (principal financial officer) of |
| | | | BlackRock Funds VII, Inc. |
Date: June 24, 2024
6