Wells Fargo Commercial Mortgage Trust 2024-5C1
Filed: 8 Jul 24, 4:33pm
| FREE WRITING PROSPECTUS | ||
| FILED PURSUANT TO RULE 433 | ||
| REGISTRATION FILE NO.: 333-257991-11 |
 |  |  |  |
Free Writing Prospectus
Structural and Collateral Term Sheet
$731,866,360
(Approximate Initial Pool Balance)
$646,786,000
(Approximate Aggregate Certificate Balance of Offered Certificates)
Wells Fargo Commercial Mortgage Trust 2024-5C1
as Issuing Entity
Wells Fargo Commercial Mortgage Securities, Inc.
as Depositor
Wells Fargo Bank, National Association
Argentic Real Estate Finance 2 LLC
Citi Real Estate Funding Inc.
LMF Commercial, LLC
Goldman Sachs Mortgage Company
UBS AG
BSPRT CMBS Finance, LLC
as Sponsors and Mortgage Loan Sellers
Commercial Mortgage Pass-Through Certificates
Series 2024-5C1
July 8, 2024
| WELLS FARGO SECURITIES | CITIGROUP | GOLDMAN SACHS & CO. LLC | UBS SECURITIES |
Co-Lead Manager and Joint Bookrunner | Co-Lead Manager and Joint Bookrunner | Co-Lead Manager and Joint Bookrunner | Co-Lead Manager and Joint Bookrunner |
Academy Securities, Inc. Co-Manager | Drexel Hamilton Co-Manager | Siebert Williams Shank Co-Manager |
STATEMENT REGARDING THIS FREE WRITING PROSPECTUS
The depositor has filed a registration statement (including a prospectus) with the Securities and Exchange Commission (“SEC”) (SEC File No. 333-257991) for the offering to which this communication relates. Before you invest, you should read the prospectus in the registration statement and other documents the depositor has filed with the SEC for more complete information about the depositor, the issuing entity and this offering. You may get these documents for free by visiting EDGAR on the SEC Web site at www.sec.gov. Alternatively, the depositor, any underwriter, or any dealer participating in the offering will arrange to send you the prospectus after filing if you request it by calling toll free 1-800-745-2063 (8 a.m. – 5 p.m. Eastern Time) or by emailing wfs.cmbs@wellsfargo.com.
Nothing in this document constitutes an offer of securities for sale in any jurisdiction where the offer or sale is not permitted. The information contained herein is preliminary as of the date hereof, supersedes any such information previously delivered to you and will be superseded by any such information subsequently delivered and ultimately by the final prospectus relating to the securities. These materials are subject to change, completion, supplement or amendment from time to time.
This free writing prospectus has been prepared by the underwriters for information purposes only and does not constitute, in whole or in part, a prospectus for the purposes of (i) Regulation (EU) 2017/1129 (as amended), (ii) such Regulation as it forms part of UK domestic law, or (iii) Part VI of the UK Financial Services and Markets Act 2000, as amended; and does not constitute an offering document for any other purpose.
STATEMENT REGARDING ASSUMPTIONS AS TO SECURITIES, PRICING ESTIMATES AND OTHER INFORMATION
The attached information contains certain tables and other statistical analyses (the “Computational Materials”) which have been prepared in reliance upon information furnished by the Mortgage Loan Sellers. Numerous assumptions were used in preparing the Computational Materials, which may or may not be reflected herein. As such, no assurance can be given as to the Computational Materials’ accuracy, appropriateness or completeness in any particular context; or as to whether the Computational Materials and/or the assumptions upon which they are based reflect present market conditions or future market performance. The Computational Materials should not be construed as either projections or predictions or as legal, tax, financial or accounting advice. You should consult your own counsel, accountant and other advisors as to the legal, tax, business, financial and related aspects of a purchase of these securities. Any weighted average lives, yields and principal payment periods shown in the Computational Materials are based on prepayment and/or loss assumptions, and changes in such prepayment and/or loss assumptions may dramatically affect such weighted average lives, yields and principal payment periods. In addition, it is possible that prepayments or losses on the underlying assets will occur at rates higher or lower than the rates shown in the attached Computational Materials. The specific characteristics of the securities may differ from those shown in the Computational Materials due to differences between the final underlying assets and the preliminary underlying assets used in preparing the Computational Materials. The principal amount and designation of any security described in the Computational Materials are subject to change prior to issuance. None of Wells Fargo Securities, LLC, Citigroup Global Markets Inc., Goldman Sachs & Co. LLC, UBS Securities LLC, Academy Securities, Inc., Drexel Hamilton, LLC, Siebert Williams Shank & Co., LLC or any of their respective affiliates, make any representation or warranty as to the actual rate or timing of payments or losses on any of the underlying assets or the payments or yield on the securities. The information in this presentation is based upon management forecasts and reflects prevailing conditions and management’s views as of this date, all of which are subject to change. In preparing this presentation, we have relied upon and assumed, without independent verification, the accuracy and completeness of all information available from public sources or which was provided to us by or on behalf of the Mortgage Loan Sellers or which was otherwise reviewed by us.
This free writing prospectus contains certain forward-looking statements. If and when included in this free writing prospectus, the words “expects”, “intends”, “anticipates”, “estimates” and analogous expressions and all statements that are not historical facts, including statements about our beliefs or expectations, are intended to identify forward-looking statements. Any forward-looking statements are made subject to risks and uncertainties which could cause actual results to differ materially from those stated. Those risks and uncertainties include, among other things, declines in general economic and business conditions, increased competition, changes in demographics, changes in political and social conditions, regulatory initiatives and changes in customer preferences, many of which are beyond our control and the control of any other person or entity related to this offering. The forward-looking statements made in this free writing prospectus are made as of the date stated on the cover. We have no obligation to update or revise any forward-looking statement.
Wells Fargo Securities is the trade name for the capital markets and investment banking services of Wells Fargo & Company and its subsidiaries, including but not limited to Wells Fargo Securities, LLC, a member of NYSE, FINRA, NFA and SIPC, Wells Fargo Prime Services, LLC, a member of FINRA, NFA and SIPC, and Wells Fargo Bank, N.A. Wells Fargo Securities, LLC and Wells Fargo Prime Services, LLC are distinct entities from affiliated banks and thrifts.
IMPORTANT NOTICE REGARDING THE OFFERED CERTIFICATES
The information herein is preliminary and may be supplemented or amended prior to the time of sale. In addition, the Offered Certificates referred to in these materials and the asset pool backing them are subject to modification or revision (including the possibility that one or more classes of certificates may be split, combined or eliminated at any time prior to issuance or availability of a final prospectus) and are offered on a “when, as and if issued” basis.
The underwriters described in these materials may from time to time perform investment banking services for, or solicit investment banking business from, any company named in these materials. The underwriters and/or their affiliates or respective employees may from time to time have a long or short position in any security or contract discussed in these materials.
The information contained herein supersedes any previous such information delivered to any prospective investor and will be superseded by information delivered to such prospective investor prior to the time of sale.
IMPORTANT NOTICE RELATING TO AUTOMATICALLY-GENERATED EMAIL DISCLAIMERS
Any legends, disclaimers or other notices that may appear at the bottom of any email communication to which this free writing prospectus is attached relating to (1) these materials not constituting an offer (or a solicitation of an offer), (2) any representation that these materials are accurate or complete and may not be updated or (3) these materials possibly being confidential, are not applicable to these materials and should be disregarded. Such legends, disclaimers or other notices have been automatically generated as a result of these materials having been sent via Bloomberg or another system.
| THE INFORMATION IN THIS STRUCTURAL AND COLLATERAL TERM SHEET IS NOT COMPLETE AND MAY BE AMENDED PRIOR TO THE TIME OF SALE. THIS TERM SHEET IS NOT AN OFFER TO SELL THESE SECURITIES AND IT IS NOT A SOLICITATION OF AN OFFER TO BUY THESE SECURITIES IN ANY JURISDICTION WHERE THE OFFER OR SALE IS NOT PERMITTED. | ||
| 2 | ||
| Wells Fargo Commercial Mortgage Trust 2024-5C1 | Certificate Structure |
| I. | Certificate Structure |
| Class | Expected Ratings (Fitch/KBRA/Moody’s)(1) | Approximate Initial Certificate Balance or Notional Amount(2) | Approximate Initial Available Certificate Balance or Notional Amount(2) | Approximate Initial Retained Certificate Balance or Notional Amount(2)(3) | Approx. Initial Credit Support(4) | Pass-Through Rate Description | Weighted Average Life (Years)(5) | Expected Principal Window(5) | Certificate Principal to Value Ratio(6) | Certificate Principal U/W NOI Debt Yield(7) |
| Offered Certificates | ||||||||||
| A-1 | AAAsf/AAA(sf)/Aaa(sf) | $9,386,000 | $9,174,000 | $212,000 | 30.000% | (8) | 2.40 | 08/24-02/29 | 41.1% | 17.0% |
| A-2 | AAAsf/AAA(sf)/Aaa(sf) | (9) | (9) | (9) | 30.000% | (8) | (9) | (9) | 41.1% | 17.0% |
| A-3 | AAAsf/AAA(sf)/Aaa(sf) | (9) | (9) | (9) | 30.000% | (8) | (9) | (9) | 41.1% | 17.0% |
| X-A | AAAsf/AAA(sf)/Aaa(sf) | $512,306,000(10) | $500,779,000(10) | $11,527,000(10) | N/A | Variable(11) | N/A | N/A | N/A | N/A |
| X-B | A-sf/AAA(sf)/NR | $134,480,000(12) | $131,454,000(12) | $3,026,000(12) | N/A | Variable(13) | N/A | N/A | N/A | N/A |
| A-S | AAAsf/AAA(sf)/Aa2(sf) | $68,612,000 | $67,068,000 | $1,544,000 | 20.625% | (8) | 4.97 | 07/29-07/29 | 46.6% | 15.0% |
| B | AA-sf/AA(sf)/NR | $37,509,000 | $36,665,000 | $844,000 | 15.500% | (8) | 4.97 | 07/29-07/29 | 49.6% | 14.0% |
| C | A-sf/A(sf)/NR | $28,359,000 | $27,720,000 | $639,000 | 11.625% | (8) | 4.97 | 07/29-07/29 | 51.8% | 13.4% |
| Non-Offered Certificates | ||||||||||
| X-D | BBB-sf/BBB+(sf)/NR | $25,616,000(14) | $25,039,000(14) | $577,000(14) | N/A | Variable(15) | N/A | N/A | N/A | N/A |
| X-F | BB-sf/BB+(sf)/NR | $16,467,000(16) | $16,096,000(16) | $371,000(16) | N/A | Variable(17) | N/A | N/A | N/A | N/A |
| D | BBBsf/BBB+(sf)/NR | $17,382,000 | $16,990,000 | $392,000 | 9.250% | (8) | 4.97 | 07/29-07/29 | 53.2% | 13.1% |
| E | BBB-sf/BBB+(sf)/NR | $8,234,000 | $8,048,000 | $186,000 | 8.125% | (8) | 4.97 | 07/29-07/29 | 53.9% | 12.9% |
| F | BB-sf/BB+(sf)/NR | $16,467,000 | $16,096,000 | $371,000 | 5.875% | (8) | 4.97 | 07/29-07/29 | 55.2% | 12.6% |
| G-RR | B-sf/BB-(sf)/NR | $10,978,000 | $10,730,000 | $248,000 | 4.375% | (8) | 4.97 | 07/29-07/29 | 56.1% | 12.4% |
| J-RR | NR/NR/NR | $32,019,359 | $31,298,359 | $721,000 | 0.000% | (8) | 4.97 | 07/29-07/29 | 58.6% | 11.9% |
Notes:
| (1) | The expected ratings presented are those of Fitch Ratings, Inc. (“Fitch”), Kroll Bond Rating Agency, LLC (“KBRA”) and Moody’s Investors Service, Inc. (“Moody’s”), which the depositor hired to rate the Offered Certificates. One or more other nationally recognized statistical rating organizations that were not hired by the depositor may use information they receive pursuant to Rule 17g-5 under the Securities Exchange Act of 1934, as amended (the “Exchange Act”) or otherwise, to rate or provide market reports and/or published commentary related to the Offered Certificates. We cannot assure you as to what ratings a non-hired nationally recognized statistical rating organization would assign or that its reports will not express differing, possibly negative, views of the mortgage loans and/or the Offered Certificates. The ratings of each Class of Offered Certificates address the likelihood of the timely distribution of interest and, except in the case of the Class X-A and X-B Certificates, the ultimate distribution of principal due on those Classes on or before the Rated Final Distribution Date. See “Risk Factors—Other Risks Relating to the Certificates—Nationally Recognized Statistical Rating Organizations May Assign Different Ratings to the Certificates; Ratings of the Certificates Reflect Only the Views of the Applicable Rating Agencies as of the Dates Such Ratings Were Issued; Ratings May Affect ERISA Eligibility; Ratings May Be Downgraded” and “Ratings” in the Preliminary Prospectus, expected to be dated July 8, 2024 (the “Preliminary Prospectus”). Fitch, KBRA and Moody’s have informed us that the “sf” designation in their ratings represents an identifier for structured finance product ratings. |
| (2) | The Certificate Balances and Notional Amounts set forth in the table are approximate. The actual initial Certificate Balances and Notional Amounts may be larger or smaller in connection with any variation in the Certificate Balance of the VRR Interest and/or the Horizontal Risk Retention Certificates following the calculation of the actual fair value of all of the ABS interests (as such term is defined in the Credit Risk Retention Rules) issued by the issuing entity, as described under “Credit Risk Retention” in the Preliminary Prospectus. The actual initial Certificate Balances and Notional Amounts also depend on the initial pool balance of the mortgage loans definitively included in the pool of mortgage loans, which aggregate cut-off date balance may be as much as 5% larger or smaller than the amount presented in the Preliminary Prospectus. In addition, the Notional Amounts of the Class X-A, X-B, X-D and X-F Certificates may vary depending upon the final pricing of the Classes of Principal Balance Certificates (as defined below) and, if, as a result of such pricing, the pass-through rate of any of the Class X-A, X-B, X-D and X-F Certificates, as applicable, would be equal to zero at all times, such Class of Certificates may not be issued on the closing date of this securitization. |
| (3) | On the closing date, the Certificates with the initial Certificate Balances or Notional Amounts, as applicable, set forth in the table above under “Approximate Initial Retained Certificate Balance or Notional Amount” (such Certificates, collectively the “VRR Interest”) are expected to be purchased for cash from the underwriters by a majority-owned affiliate of Argentic Real Estate Finance 2 LLC (a sponsor and affiliate of the special servicer), as the “retaining sponsor” (as such term is defined in the Credit Risk Retention Rules), as further described in “Credit Risk Retention” in the Preliminary Prospectus. |
| (4) | The approximate initial credit support with respect to the Class A-1, A-2 and A-3 Certificates represents the approximate credit enhancement for the Class A-1, A-2 and A-3 Certificates in the aggregate. |
| (5) | Weighted Average Lives and Expected Principal Windows are calculated based on an assumed prepayment rate of 0% CPR and the “Structuring Assumptions” described under “Yield and Maturity Considerations—Weighted Average Life” in the Preliminary Prospectus. |
| (6) | The Certificate Principal to Value Ratio for each Class of Certificates (other than the Class A-1, A-2 and A-3 Certificates) is calculated as the product of (a) the weighted average Cut-off Date LTV Ratio for the mortgage loans and (b) a fraction, the numerator of which is the total initial Certificate Balance of such Class of Certificates and all Classes of Principal Balance Certificates senior to such Class of Certificates and the denominator of which is the total initial Certificate Balance of all of the Classes of Principal Balance Certificates. The Certificate Principal to Value Ratio for each of the Class A-1, A-2 and A-3 Certificates is calculated in the aggregate for those Classes as if they were a single Class and is calculated as the product of (a) the weighted average Cut-off Date LTV Ratio for the mortgage loans and (b) a fraction, the numerator of which is the total initial Certificate Balance of such Classes of Certificates and the denominator of which is the total initial Certificate Balance of all of the Classes of Principal Balance Certificates. In any event, however, excess mortgaged property value associated with a mortgage loan will not be available to offset losses on any other mortgage loan. |
| (7) | The Certificate Principal U/W NOI Debt Yield for each Class of Certificates (other than the Class A-1, A-2 and A-3 Certificates) is calculated as the product of (a) the weighted average U/W NOI Debt Yield for the mortgage loans and (b) a fraction, the numerator of which is the total initial Certificate Balance of all of the Classes of Principal Balance Certificates and the denominator of which is the total initial Certificate Balance of such Class of Certificates and all Classes of Principal Balance Certificates senior to such Class of Certificates. The Certificate Principal U/W NOI Debt Yield for each of the Class A-1, A-2 and A-3 Certificates is calculated in the aggregate for those Classes as if they were a single Class and is calculated as the product of (a) the weighted average U/W NOI Debt Yield for the mortgage loans and (b) a fraction, the numerator of which is the total initial Certificate Balance of all of the Classes of Principal Balance Certificates and the denominator of which is the total initial Certificate Balance of such Classes of Certificates. In any event, however, cash flow from each mortgaged property supports only the related mortgage loan and will not be available to support any other mortgage loan. |
| THE INFORMATION IN THIS STRUCTURAL AND COLLATERAL TERM SHEET IS NOT COMPLETE AND MAY BE AMENDED PRIOR TO THE TIME OF SALE. THIS TERM SHEET IS NOT AN OFFER TO SELL THESE SECURITIES AND IT IS NOT A SOLICITATION OF AN OFFER TO BUY THESE SECURITIES IN ANY JURISDICTION WHERE THE OFFER OR SALE IS NOT PERMITTED. | ||
| 3 | ||
| Wells Fargo Commercial Mortgage Trust 2024-5C1 | Certificate Structure |
| (8) | The pass-through rates for the Class A-1, A-2, A-3, A-S, B, C, D, E, F, G-RR and J-RR Certificates (collectively, the “Principal Balance Certificates”) for any distribution date, in each case, will be one of the following: (i) a fixed rate per annum, (ii) a variable rate per annum equal to the weighted average of the net mortgage interest rates on the mortgage loans for the related distribution date, (iii) a variable rate per annum equal to the lesser of (a) a fixed rate and (b) the weighted average of the net mortgage interest rates on the mortgage loans for the related distribution date or (iv) a variable rate per annum equal to the weighted average of the net mortgage interest rates on the mortgage loans for the related distribution date minus a specified percentage. For purposes of the calculation of the weighted average of the net mortgage interest rates on the mortgage loans for each distribution date, the mortgage interest rates will be adjusted as necessary to a 30/360 basis. |
| (9) | The exact initial Certificate Balances of the Class A-2 and A-3 Certificates are unknown and will be determined based on the final pricing of the Certificates. However, the initial Certificate Balances, weighted average lives and principal windows of the Class A-2 and A-3 Certificates are expected to be within the applicable ranges reflected in the following chart. The aggregate initial Certificate Balance of the Class A-2 and A-3 Certificates is expected to be approximately $502,920,000, subject to a variance of plus or minus 5%. In the event that the Class A-3 Certificates are issued with the maximum certificate balance (i.e., with an initial certificate balance of $502,920,000), the Class A-2 Certificates will not be issued. |
Class of Certificates | Expected Range of Approximate Initial Certificate Balance | Expected Range of Weighted Average Life (Years) | Expected Range of Principal Window | |
| Class A-2 | $0 – $225,000,000 | N/A – 4.87 | N/A / 02/29 – 06/29 | |
| Class A-3 | $277,920,000 – $502,920,000 | 4.91 – 4.94 | 02/29 – 07/29 / 06/29 – 07/29 |
| (10) | The Class X-A Certificates are notional amount certificates. The Notional Amount of the Class X-A Certificates will be equal to the aggregate Certificate Balance of the Class A-1, A-2 and A-3 Certificates outstanding from time to time. The Class X-A Certificates will not be entitled to distributions of principal. |
| (11) | The pass-through rate for the Class X-A Certificates for any distribution date will be a per annum rate equal to the excess, if any, of (a) the weighted average of the net mortgage interest rates on the mortgage loans for the related distribution date, over (b) the weighted average of the pass-through rates on the Class A-1, A-2 and A-3 Certificates for the related distribution date, weighted on the basis of their respective Certificate Balances outstanding immediately prior to that distribution date. For purposes of the calculation of the weighted average of the net mortgage interest rates on the mortgage loans for each distribution date, the mortgage interest rates will be adjusted as necessary to a 30/360 basis. |
| (12) | The Class X-B Certificates are notional amount certificates. The Notional Amount of the Class X-B Certificates will be equal to the aggregate Certificate Balance of the Class A-S, B and C Certificates outstanding from time to time. The Class X-B Certificates will not be entitled to distributions of principal. |
| (13) | The pass-through rate for the Class X-B Certificates for any distribution date will be a per annum rate equal to the excess, if any, of (a) the weighted average of the net mortgage interest rates on the mortgage loans for the related distribution date, over (b) the weighted average of the pass-through rates on the Class A-S, B and C Certificates for the related distribution date, weighted on the basis of their respective Certificate Balances outstanding immediately prior to that distribution date. For purposes of the calculation of the weighted average of the net mortgage interest rates on the mortgage loans for each distribution date, the mortgage interest rates will be adjusted as necessary to a 30/360 basis. |
| (14) | The Class X-D Certificates are notional amount certificates. The Notional Amount of the Class X-D Certificates will be equal to the aggregate Certificate Balance of the Class D and E Certificates outstanding from time to time. The Class X-D Certificates will not be entitled to distributions of principal. |
| (15) | The pass-through rate for the Class X-D Certificates for any distribution date will be a per annum rate equal to the excess, if any, of (a) the weighted average of the net mortgage interest rates on the mortgage loans for the related distribution date, over (b) the weighted average of the pass-through rates on the Class D and E Certificates for the related distribution date, weighted on the basis of their respective Certificate Balances outstanding immediately prior to that distribution date. For purposes of the calculation of the weighted average of the net mortgage interest rates on the mortgage loans for each distribution date, the mortgage interest rates will be adjusted as necessary to a 30/360 basis. |
| (16) | The Class X-F Certificates are notional amount certificates. The Notional Amount of the Class X-F Certificates will be equal to the Certificate Balance of the Class F Certificates outstanding from time to time. The Class X-F Certificates will not be entitled to distributions of principal. |
| (17) | The pass-through rate for the Class X-F Certificates for any distribution date will be a per annum rate equal to the excess, if any, of (a) the weighted average of the net mortgage interest rates on the mortgage loans for the related distribution date, over (b) the pass-through rate on the Class F Certificates for the related distribution date. For purposes of the calculation of the weighted average of the net mortgage interest rates on the mortgage loans for each distribution date, the mortgage interest rates will be adjusted as necessary to a 30/360 basis. |
| THE INFORMATION IN THIS STRUCTURAL AND COLLATERAL TERM SHEET IS NOT COMPLETE AND MAY BE AMENDED PRIOR TO THE TIME OF SALE. THIS TERM SHEET IS NOT AN OFFER TO SELL THESE SECURITIES AND IT IS NOT A SOLICITATION OF AN OFFER TO BUY THESE SECURITIES IN ANY JURISDICTION WHERE THE OFFER OR SALE IS NOT PERMITTED. | ||
| 4 | ||
| Wells Fargo Commercial Mortgage Trust 2024-5C1 | Transaction Highlights |
| II. | Transaction Highlights |
Mortgage Loan Sellers:
Mortgage Loan Seller | Number of | Number of | Aggregate Cut-off Date Balance | % of Initial Pool | |
| Wells Fargo Bank, National Association | 6 | 15 | $183,422,953 | 25.1 | % |
| Argentic Real Estate Finance 2 LLC | 6 | 6 | 141,400,000 | 19.3 | |
| Citi Real Estate Funding Inc. | 5 | 6 | 90,200,000 | 12.3 | |
| Wells Fargo Bank, National Association / Argentic Real Estate Finance 2 LLC | 1 | 1 | 73,000,000 | 10.0 | |
| LMF Commercial, LLC | 4 | 4 | 67,200,000 | 9.2 | |
| Goldman Sachs Mortgage Company | 2 | 2 | 61,650,000 | 8.4 | |
| UBS AG | 4 | 10 | 42,200,000 | 5.8 | |
| BSPRT CMBS Finance, LLC | 3 | 3 | 40,543,407 | 5.5 | |
| Citi Real Estate Funding Inc. / Argentic Real Estate Finance 2 LLC | 1 | 1 | 32,250,000 | 4.4 | |
Total | 32 | 48 | $731,866,360 | 100.0% |
|
Loan Pool:
| Initial Pool Balance: | $731,866,360 |
| Number of Mortgage Loans: | 32 |
| Average Cut-off Date Balance per Mortgage Loan: | $22,870,824 |
| Number of Mortgaged Properties: | 48 |
| Average Cut-off Date Balance per Mortgaged Property(1): | $15,247,216 |
| Weighted Average Mortgage Interest Rate: | 6.9082% |
| Ten Largest Mortgage as % of Initial Pool Balance: | 61.8% |
| Weighted Average Original Term to Maturity (months): | 60 |
| Weighted Average Remaining Term to Maturity (months): | 59 |
| Weighted Average Original Amortization Term (months)(2): | 351 |
| Weighted Average Remaining Amortization Term (months)(2): | 351 |
| Weighted Average Seasoning (months): | 1 |
| (1) | Information regarding mortgage loans secured by multiple properties is based on an allocation according to relative appraised values or the allocated loan amounts or property-specific release prices set forth in the related loan documents or such other allocation as the related mortgage loan seller deemed appropriate. |
| (2) | Excludes any mortgage loan that does not amortize and 640 5th Avenue which is on a planned amortization schedule. |
Credit Statistics:
| Weighted Average U/W Net Cash Flow DSCR(1): | 1.53x |
| Weighted Average U/W Net Operating Income Debt Yield(1): | 11.9% |
| Weighted Average Cut-off Date Loan-to-Value Ratio(1): | 58.6% |
| Weighted Average Balloon Loan-to-Value Ratio(1): | 58.0% |
| % of Mortgage Loans with Additional Subordinate Debt(2): | 6.9% |
| % of Mortgage Loans with Single Tenants(3): | NAP |
| (1) | With respect to any mortgage loan that is part of a whole loan, loan-to-value ratio, debt service coverage ratio and debt yield calculations include the related pari passu companion loan(s) but exclude any related subordinate companion loan(s) (unless otherwise stated). The debt service coverage ratio, debt yield and loan-to-value ratio information do not take into account any subordinate debt (whether or not secured by the related mortgaged property), that currently exists or is allowed under the terms of any mortgage loan. See “Description of the Mortgage Pool—Mortgage Pool Characteristics” in the Preliminary Prospectus and Annex A-1 to the Preliminary Prospectus. |
| (2) | The percentage figure expressed as “% of Mortgage Loans with Additional Subordinate Debt” is determined as a percentage of the initial pool balance and does not take into account any future subordinate debt (whether or not secured by the mortgaged property), if any, that may be permitted under the terms of any mortgage loan or the pooling and servicing agreement. See “Description of the Mortgage Pool—Additional Indebtedness” in the Preliminary Prospectus. |
| (3) | Excludes mortgage loans that are secured by multiple single tenant properties. |
| THE INFORMATION IN THIS STRUCTURAL AND COLLATERAL TERM SHEET IS NOT COMPLETE AND MAY BE AMENDED PRIOR TO THE TIME OF SALE. THIS TERM SHEET IS NOT AN OFFER TO SELL THESE SECURITIES AND IT IS NOT A SOLICITATION OF AN OFFER TO BUY THESE SECURITIES IN ANY JURISDICTION WHERE THE OFFER OR SALE IS NOT PERMITTED. | ||
| 5 | ||
| Wells Fargo Commercial Mortgage Trust 2024-5C1 | Transaction Highlights |
Loan Structural Features:
Amortization: Based on the Initial Pool Balance, 24.0% of the mortgage pool (5 mortgage loans) has scheduled amortization, as follows:
4.4% (1 mortgage loan) provide for an interest-only period followed by an amortization period; and
19.6% (4 mortgage loans) require amortization during the entire loan term.
Interest-Only: Based on the Initial Pool Balance, 76.0% of the mortgage pool (27 mortgage loans) provide for interest-only payments during the entire loan term through maturity. The Weighted Average Cut-off Date Loan-to-Value Ratio and Weighted Average U/W Net Cash Flow DSCR for those mortgage loans are 61.1% and 1.50x, respectively.
Hard Lockboxes: Based on the Initial Pool Balance, 39.5% of the mortgage pool (11 mortgage loans) have hard lockboxes in place.
Reserves: The mortgage loans require amounts to be escrowed monthly as follows (excluding any mortgage loans with springing provisions):
| Real Estate Taxes: | 93.1% of the pool |
| Insurance: | 41.7% of the pool |
| Capital Replacements: | 87.7% of the pool |
| TI/LC: | 68.4% of the pool(1) |
| (1) | The percentage of Initial Pool Balance for mortgage loans with TI/LC reserves is based on the aggregate principal balance allocable to loans that include office, retail, mixed use and industrial properties. |
Call Protection/Defeasance: Based on the Initial Pool Balance, the mortgage pool has the following call protection and defeasance features:
93.4% of the mortgage pool (29 mortgage loans) feature a lockout period, then defeasance only until an open period;
6.6% of the mortgage pool (3 mortgage loans) feature a lockout period, then the greater of a prepayment premium (1%) or yield maintenance until an open period;
Prepayment restrictions for each mortgage loan reflect the entire life of the mortgage loan. Please refer to Annex A-1 to the Preliminary Prospectus and the footnotes related thereto for further information regarding individual loan call protection.
| THE INFORMATION IN THIS STRUCTURAL AND COLLATERAL TERM SHEET IS NOT COMPLETE AND MAY BE AMENDED PRIOR TO THE TIME OF SALE. THIS TERM SHEET IS NOT AN OFFER TO SELL THESE SECURITIES AND IT IS NOT A SOLICITATION OF AN OFFER TO BUY THESE SECURITIES IN ANY JURISDICTION WHERE THE OFFER OR SALE IS NOT PERMITTED. | ||
| 6 | ||
| Wells Fargo Commercial Mortgage Trust 2024-5C1 | Issue Characteristics |
| III. | Issue Characteristics |
| Securities Offered: | $646,786,000 approximate monthly pay, multi-class, commercial mortgage REMIC pass-through certificates consisting of eight classes (Classes A-1, A-2, A-3, A-S, B, C, X-A and X-B), which are offered pursuant to a registration statement filed with the SEC (such classes of certificates, the “Offered Certificates”). | |
| Mortgage Loan Sellers: | Wells Fargo Bank, National Association (“WFB”), Argentic Real Estate Finance 2 LLC (“AREF2”), Citi Real Estate Funding Inc. (“CREFI”), LMF Commercial, LLC (“LMF”), Goldman Sachs Mortgage Company (“GSMC”), UBS AG (“UBS”) and BSPRT CMBS Finance, LLC (“BSPRT”) | |
| Joint Bookrunners and Co- Lead Managers: | Wells Fargo Securities, LLC, Citigroup Global Markets Inc., Goldman Sachs & Co. LLC and UBS Securities LLC | |
| Co-Managers: | Academy Securities, Inc., Drexel Hamilton, LLC and Siebert Williams Shank & Co., LLC | |
| Rating Agencies: | Fitch Ratings, Inc., Kroll Bond Rating Agency, LLC and Moody’s Investors Service, Inc. | |
| Master Servicer: | Wells Fargo Bank, National Association | |
| Special Servicer: | Argentic Services Company LP | |
| Certificate Administrator: | Computershare Trust Company, N.A. | |
| Trustee: | Computershare Trust Company, N.A. | |
| Operating Advisor: | Pentalpha Surveillance LLC | |
| Asset Representations Reviewer: | Pentalpha Surveillance LLC | |
| Initial Majority Controlling Class Certificateholder: | Argentic Securities Holdings 2 Cayman Limited, an affiliate of Argentic Real Estate Finance 2 LLC and Argentic Services Company LP | |
| U.S. Credit Risk Retention: | For a discussion on the manner in which the U.S. credit risk retention requirements will be satisfied by Argentic Real Estate Finance 2 LLC, as the retaining sponsor, see “Credit Risk Retention” in the Preliminary Prospectus. Argentic Real Estate Finance 2 LLC, the retaining sponsor, intends to cause Argentic Securities Holdings 2 Cayman Limited, a majority-owned affiliate, to retain (i) an “eligible horizontal residual interest”, in the form of certificates representing approximately 2.80% of the fair value of all of the ABS interests issued, which will be comprised of the Class G-RR and J-RR certificates (other than the portion that comprises the VRR Interest) and (ii) an “eligible vertical interest”, in the form of certificates representing approximately 2.25% of the certificate balance, notional amount or percentage interest of each class of certificates (other than the Class R certificates) in a manner that satisfies the U.S. credit risk retention requirements. Under the U.S. credit risk retention rules, Argentic Real Estate Finance 2 LLC or the applicable majority-owned affiliate will be permitted to transfer the horizontal risk retention certificates to a subsequent third-party purchaser. For additional information, see “Credit Risk Retention” in the Preliminary Prospectus. | |
| EU/UK Credit Risk Retention | None of the sponsors, the depositor, the underwriters, or their respective affiliates, or any other party to the transaction intends to retain a material net economic interest in the securitization constituted by the issue of the Certificates, or take any other action in respect of such securitization, in a manner prescribed or contemplated by (i) Regulation (EU) 2017/2402, or (ii) such Regulation as it forms part of UK domestic law. In particular, no such person undertakes to take any action which may be required by any investor for the purposes of its compliance with any applicable requirement under either such Regulation. Furthermore, the arrangements described under “Credit Risk Retention” in the Preliminary Prospectus have not been structured with the objective of ensuring compliance by any person with any requirements of either such Regulation. See “Risk Factors—Other Risks Relating to the Certificates—EU Securitization Regulation and UK Securitization Regulation Due Diligence Requirements” in the Preliminary Prospectus. | |
| Cut-off Date: | The Cut-off Date with respect to each mortgage loan is the payment due date for the monthly debt service payment that is due in July 2024 (or, in the case of any mortgage loan that has its first payment due date in July 2024, the date that would have been its payment due date in July 2024 under the terms of that mortgage loan if a monthly debt service payment were scheduled to be due in that month). | |
| Expected Closing Date: | On or about July 25, 2024. | |
| Determination Dates: | The 11th day of each month (or if that day is not a business day, the next succeeding business day), commencing in August 2024. |
| THE INFORMATION IN THIS STRUCTURAL AND COLLATERAL TERM SHEET IS NOT COMPLETE AND MAY BE AMENDED PRIOR TO THE TIME OF SALE. THIS TERM SHEET IS NOT AN OFFER TO SELL THESE SECURITIES AND IT IS NOT A SOLICITATION OF AN OFFER TO BUY THESE SECURITIES IN ANY JURISDICTION WHERE THE OFFER OR SALE IS NOT PERMITTED. | ||
| 7 | ||
| Wells Fargo Commercial Mortgage Trust 2024-5C1 | Issue Characteristics |
| Distribution Dates: | The 4th business day following the Determination Date in each month, commencing in August 2024. | |
| Rated Final Distribution Date: | The Distribution Date in July 2057. | |
| Interest Accrual Period: | With respect to any Distribution Date, the calendar month immediately preceding the month in which such Distribution Date occurs. | |
| Day Count: | The Offered Certificates will accrue interest on a 30/360 basis. | |
| Minimum Denominations: | $10,000 for each Class of Offered Certificates (other than the Class X-A and X-B Certificates) and $1,000,000 for the Class X-A and X-B Certificates. Investments may also be made in any whole dollar denomination in excess of the applicable minimum denomination. | |
| Clean-up Call: | 1.0% | |
| Delivery: | DTC, Euroclear and Clearstream Banking | |
| ERISA/SMMEA Status: | Each Class of Offered Certificates is expected to be eligible for exemptive relief under ERISA. No Class of Offered Certificates will be SMMEA eligible. | |
| Risk Factors: | THE CERTIFICATES INVOLVE CERTAIN RISKS AND MAY NOT BE SUITABLE FOR ALL INVESTORS. SEE THE “RISK FACTORS” SECTION OF THE PRELIMINARY PROSPECTUS. | |
| Bond Analytics Information: | The Certificate Administrator will be authorized to make distribution date statements, CREFC® reports and certain supplemental reports (other than confidential information) available to certain financial modeling and data provision services, including Bloomberg, L.P., CRED iQ, Trepp, LLC, Intex Solutions, Inc., Interactive Data Corp., Markit Group Limited, BlackRock Financial Management, Inc., CMBS.com, Inc., Moody’s Analytics, Inc., Morningstar Credit Information & Analytics, LLC, KBRA Analytics, LLC, MBS Data, LLC, Thomson Reuters Corporation and RealINSIGHT. | |
| Tax Treatment | For U.S. federal income tax purposes, the issuing entity will consist of one or more REMICs arranged in a tiered structure and a trust (the “grantor trust”). The Offered Certificates will represent REMIC regular interests. |
| THE INFORMATION IN THIS STRUCTURAL AND COLLATERAL TERM SHEET IS NOT COMPLETE AND MAY BE AMENDED PRIOR TO THE TIME OF SALE. THIS TERM SHEET IS NOT AN OFFER TO SELL THESE SECURITIES AND IT IS NOT A SOLICITATION OF AN OFFER TO BUY THESE SECURITIES IN ANY JURISDICTION WHERE THE OFFER OR SALE IS NOT PERMITTED. | ||
| 8 | ||
| Wells Fargo Commercial Mortgage Trust 2024-5C1 | Characteristics of the Mortgage Pool |
| IV. | Characteristics of the Mortgage Pool(1) |
| A. | Ten Largest Mortgage Loans |
| Mortgage Loan Seller | Mortgage Loan Name | City | State | Number of Mortgage Loans / Mortgaged Properties | Mortgage Loan Cut-off Date Balance ($) | % of Initial Pool Balance(%) | Property Type | Number of SF/Units /Rooms | Cut-off Date Balance Per SF/Unit/Room ($) | Cut-off Date LTV Ratio (%) | Balloon LTV Ratio (%) | U/W NCF DSCR (x) | U/W NOI Debt Yield (%) | ||||
| WFB, AREF2 | 9950 Woodloch | The Woodlands | TX | 1 / 1 | $73,000,000 | 9.9 | 7% | Office | 601,151 | $216 | 56.2% | 53.3 | % | 1.50 | x | 13.1 | % |
| WFB | Falls Houston Multifamily Portfolio | Houston | TX | 1 / 3 | 64,500,000 | 8.8 | Multifamily | 942 | 68,471 | 62.4 | 62.4 | 1.35 | 9.9 | ||||
| GSMC | 640 5th Avenue | New York | NY | 1 / 1 | 50,400,000 | 6.9 | Mixed Use | 314,533 | 954 | 41.7 | 38.1 | 2.04 | 18.7 | ||||
| CREFI | Lotus 315 & Essence 144 | East Orange | NJ | 1 / 2 | 50,000,000 | 6.8 | Multifamily | 336 | 256,250 | 69.6 | 69.6 | 1.23 | 8.1 | ||||
| AREF2 | The Archive Apartments | Minneapolis | MN | 1 / 1 | 47,850,000 | 6.5 | Multifamily | 200 | 239,250 | 67.4 | 67.4 | 1.23 | 8.8 | ||||
| AREF2 | 3060 Olympic | Los Angeles | CA | 1 / 1 | 45,500,000 | 6.2 | Multifamily | 226 | 201,327 | 62.1 | 62.1 | 1.26 | 8.4 | ||||
| WFB | ExchangeRight 67 | Various | Various | 1 / 8 | 33,522,953 | 4.6 | Various | 369,844 | 91 | 46.8 | 46.8 | 1.90 | 12.9 | ||||
| CREFI, AREF2 | 132 West 36th Street | New York | NY | 1 / 1 | 32,250,000 | 4.4 | Office | 195,054 | 165 | 53.8 | 52.4 | 1.26 | 11.6 | ||||
| AREF2 | Solon Park Apartments | Solon | OH | 1 / 1 | 28,000,000 | 3.8 | Multifamily | 240 | 116,667 | 74.9 | 74.9 | 1.31 | 9.1 | ||||
| LMF | Marriott Hartford Windsor Airport | Windsor | CT | 1 / 1 | 27,000,000 | 3.7 | Hospitality | 302 | 89,404 | 48.8 | 48.8 | 2.03 | 17.2 | ||||
| Top Three Total/Weighted Average | 3 / 5 | $187,900,000 | 25.7 | % | 54.4% | 52.3 | % | 1.59 | x | 13.5 | % | ||||||
| Top Five Total/Weighted Average | 5 / 8 | $285,750,000 | 39.0 | % | 59.3% | 57.9 | % | 1.47 | x | 11.8 | % | ||||||
| Top Ten Total/Weighted Average | 10 / 20 | $452,022,953 | 61.8 | % | 58.6% | 57.6 | % | 1.49 | x | 11.7 | % | ||||||
| Non-Top Ten Total/Weighted Average | 22 / 28 | $279,843,407 | 38.2 | % | 58.8% | 58.5 | % | 1.59 | x | 12.2 | % | ||||||
| (1) | With respect to any mortgage loan that is part of a whole loan, Cut-off Date Balance Per SF/Unit/Room, loan-to-value ratio, debt service coverage ratio and debt yield calculations include the related pari passu companion loan(s) (unless otherwise stated). With respect to each mortgage loan, debt service coverage ratio, debt yield and loan-to-value ratio information do not take into account subordinate debt (whether or not secured by the related mortgaged property), if any, that currently exists or is allowed under the terms of such mortgage loan. |
| THE INFORMATION IN THIS STRUCTURAL AND COLLATERAL TERM SHEET IS NOT COMPLETE AND MAY BE AMENDED PRIOR TO THE TIME OF SALE. THIS TERM SHEET IS NOT AN OFFER TO SELL THESE SECURITIES AND IT IS NOT A SOLICITATION OF AN OFFER TO BUY THESE SECURITIES IN ANY JURISDICTION WHERE THE OFFER OR SALE IS NOT PERMITTED. | ||
| 9 | ||
| Wells Fargo Commercial Mortgage Trust 2024-5C1 | Characteristics of the Mortgage Pool |
| B. | Summary of the Whole Loans |
| No. | Property Name | Mortgage Loan Seller in WFCM 2024-5C1 | Mortgage Loan Cut-off Date Balance | Aggregate Pari-Passu Companion Loan Cut-off Date Balance(1) | Combined Cut-off Date Balance | Controlling Pooling / Trust and Servicing Agreement | Master Servicer | Special Servicer | Related Pari Passu Companion Loan(s) Securitizations | Combined UW NCF DSCR(2) | Combined UW NOI Debt Yield(2) | Combined Cut-off Date LTV(2) |
| 1 | 9950 Woodloch | WFB, AREF2 | $73,000,000 | $57,000,000 | $130,000,000 | WFCM 2024-5C1 | Wells Fargo Bank, National Association | Argentic Services Company LP | Future Securitization | 1.50x | 13.1% | 56.2% |
| 3 | 640 5th Avenue | GSMC | $50,400,000 | $249,600,000 | $300,000,000 | Future Securitization | Wells Fargo Bank, National Association | LNR Partners, LLC | BBCMS 2024-5C27; Benchmark 2024-V8 | 2.04x | 18.7% | 41.7% |
| 4 | Lotus 315 & Essence 144 | CREFI | $50,000,000 | $36,100,000 | $86,100,000 | WFCM 2024-5C1 | Wells Fargo Bank, National Association | Argentic Services Company LP | Benchmark 2024-V8 | 1.23x | 8.1% | 69.6% |
| 11 | Cummins Station | WFB | $25,000,000 | $110,000,000 | $135,000,000 | Future Securitization | Wells Fargo Bank, National Association | Argentic Services Company LP | Future Securitization | 1.40x | 10.2% | 58.8% |
| 14 | Park Parthenia | BSPRT | $22,500,000 | $10,000,000 | $32,500,000 | WFCM 2024-5C1 | Wells Fargo Bank, National Association | Argentic Services Company LP | Future Securitization | 2.14x | 16.4% | 33.2% |
| 19 | Euclid Apartments | LMF | $13,000,000 | $40,000,000 | $53,000,000 | WFCM 2024-5C1 | Wells Fargo Bank, National Association | Argentic Services Company LP | BMO 2024-5C4; BBCMS 2024-C26 | 1.64x | 12.1% | 68.8% |
| (1) | The Aggregate Pari Passu Companion Loan Cut-off Date Balance excludes any related Subordinate Companion Loans. |
| (2) | DSCR, Debt Yield and LTV calculations include any related pari passu companion loans and exclude any subordinate companion loans and/or mezzanine loans, as applicable. |
| THE INFORMATION IN THIS STRUCTURAL AND COLLATERAL TERM SHEET IS NOT COMPLETE AND MAY BE AMENDED PRIOR TO THE TIME OF SALE. THIS TERM SHEET IS NOT AN OFFER TO SELL THESE SECURITIES AND IT IS NOT A SOLICITATION OF AN OFFER TO BUY THESE SECURITIES IN ANY JURISDICTION WHERE THE OFFER OR SALE IS NOT PERMITTED. | ||
| 10 | ||
| Wells Fargo Commercial Mortgage Trust 2024-5C1 | Characteristics of the Mortgage Pool |
| C. | Mortgage Loans with Additional Secured and Mezzanine Financing |
| Loan No. | Mortgage Loan Seller | Mortgage Loan Name | Mortgage Loan Cut-off Date Balance ($) | % of Initial Pool Balance (%) | Sub Debt Cut-off Date Balance ($) | Mezzanine Debt Cut-off Date Balance ($) | Total Debt Interest Rate (%)(1) | Mortgage Loan U/W NCF DSCR (x)(2) | Total Debt U/W NCF DSCR (x) | Mortgage Loan Cut-off Date U/W NOI Debt Yield (%)(2) | Total Debt Cut-off Date U/W NOI Debt Yield (%) | Mortgage Loan Cut-off Date LTV Ratio (%)(2) | Total Debt Cut-off Date LTV Ratio (%) |
| 3 | GSMC | 640 5th Avenue | $50,400,000 | 6.9% | NAP | $100,000,000 | 7.4720% | 2.04x | 1.31x | 18.7% | 14.0% | 41.7% | 55.6% |
| Total/Weighted Average | $50,400,000 | 6.9% | $100,000,000 | 7.4720% | 2.04x | 1.31x | 18.7% | 14.0% | 41.7% | 55.6% | |||
| (1) | Total Debt Interest Rate for any specified mortgage loan reflects the weighted average of the interest rates on the respective components of the total debt. |
| (2) | With respect to any mortgage loan that is part of a whole loan, the loan-to-value ratio, debt service coverage ratio and debt yield calculations include the related pari passu companion loan(s) but excludes any related subordinate companion loan. |
| THE INFORMATION IN THIS STRUCTURAL AND COLLATERAL TERM SHEET IS NOT COMPLETE AND MAY BE AMENDED PRIOR TO THE TIME OF SALE. THIS TERM SHEET IS NOT AN OFFER TO SELL THESE SECURITIES AND IT IS NOT A SOLICITATION OF AN OFFER TO BUY THESE SECURITIES IN ANY JURISDICTION WHERE THE OFFER OR SALE IS NOT PERMITTED. | ||
| 11 | ||
| Wells Fargo Commercial Mortgage Trust 2024-5C1 | Characteristics of the Mortgage Pool |
| D. | Previous Securitization History(1) |
| Loan No. | Mortgage Loan Seller | Mortgage Loan or Mortgaged Property Name | City | State | Property Type | Mortgage Loan or Mortgaged Property Cut-off Date Balance ($) | % of Cut-off Date Pool Balance (%) | Previous Securitization | |
| 2.02 | WFB | Falls Of Braeburn | Houston | TX | Multifamily | $18,226,279 | 2.5 | % | FREMF 2022-KF142 |
| 4.01 | CREFI | Lotus 315 | East Orange | NJ | Multifamily | 29,529,617 | 4.0 | ARCLO 2021-FL3 | |
| 4.02 | CREFI | Essence 144 | East Orange | NJ | Multifamily | 20,470,383 | 2.8 | UBSCM 2017-C4 | |
| 9.00 | AREF2 | Solon Park Apartments | Solon | OH | Multifamily | 28,000,000 | 3.8 | AREIT 2022-CRE6; AM1006 | |
| 14.00 | BSPRT | Park Parthenia | Northridge | CA | Multifamily | 22,500,000 | 3.1 | LBUBS 2004-C4 | |
| 16.00 | CREFI | Escarlata 31 | Phoenix | AZ | Multifamily | 15,000,000 | 2.0 | FRESB 2019-SB63, RCMT 2021-FL5 | |
| 17.00 | WFB | Dadeland West Office Park | Miami | FL | Office | 14,100,000 | 1.9 | GSMS 2015-GC28 | |
| 19.00 | LMF | Euclid Apartments | Euclid | OH | Multifamily | 13,000,000 | 1.8 | ARBOR 2022-Q021 | |
| 21.00 | CREFI | Escarlata 29 | Phoenix | AZ | Multifamily | 12,000,000 | 1.6 | RCMT 2021-FL5 | |
| 23.00 | BSPRT | Holiday Inn Hammond | Hammond | LA | Hospitality | 10,843,407 | 1.5 | WFRBS 2013-C16 | |
| 27.00 | BSPRT | Mitchell Lofts | Dallas | TX | Multifamily | 7,200,000 | 1.0 | FREMF 2014-K38 | |
| 28.00 | UBS | 220 Jackson Street | San Francisco | CA | Mixed Use | 6,200,000 | 0.8 | JPMBB 2014-C22 | |
| 30.00 | LMF | Extra Space Self Storage Baca Lane | Santa Fe | NM | Self Storage | 5,200,000 | 0.7 | JPMBB 2014-C23 | |
| Total | $202,269,686 | 27.6 | % | ||||||
| (1) | The table above represents the most recent securitization with respect to the mortgaged property securing the related mortgage loan, based on information provided by the related borrower or obtained through searches of a third-party database. While loans secured by the above mortgaged properties may have been securitized multiple times in prior transactions, mortgage loans in this securitization are only listed in the above chart if the mortgage loan paid off a loan in another securitization. The information has not otherwise been confirmed by the mortgage loan sellers. |
| THE INFORMATION IN THIS STRUCTURAL AND COLLATERAL TERM SHEET IS NOT COMPLETE AND MAY BE AMENDED PRIOR TO THE TIME OF SALE. THIS TERM SHEET IS NOT AN OFFER TO SELL THESE SECURITIES AND IT IS NOT A SOLICITATION OF AN OFFER TO BUY THESE SECURITIES IN ANY JURISDICTION WHERE THE OFFER OR SALE IS NOT PERMITTED. | ||
| 12 | ||
| Wells Fargo Commercial Mortgage Trust 2024-5C1 | Characteristics of the Mortgage Pool |
| F. | Property Type Distribution(1) |
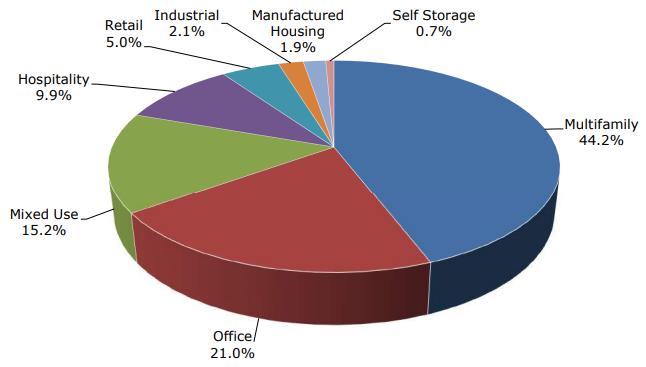
| Property Type | Number of Mortgaged Properties | Aggregate Cut-off Date Balance ($) | % of Initial Pool Balance (%) | Weighted Average Cut-off Date LTV Ratio (%) | Weighted Average Balloon LTV Ratio (%) | Weighted Average U/W NCF DSCR (x) | Weighted Average U/W NOI Debt Yield (%) | Weighted Average U/W NCF Debt Yield (%) | Weighted Average Mortgage Rate (%) | |||||||
| Multifamily | 16 | $323,200,000 | 44.2 | % | 63.9 | % | 63.9 | % | 1.35 | x | 9.6 | % | 9.4 | % | 6.8070 | % |
| Garden | 9 | 160,000,000 | 21.9 | 61.9 | 61.9 | 1.45 | 10.6 | 10.2 | 6.9012 | |||||||
| Mid Rise | 6 | 142,729,617 | 19.5 | 65.3 | 65.3 | 1.26 | 8.8 | 8.7 | 6.7570 | |||||||
| High Rise | 1 | 20,470,383 | 2.8 | 69.6 | 69.6 | 1.23 | 8.1 | 8.0 | 6.4200 | |||||||
| Office | 6 | 153,411,037 | 21.0 | 56.5 | 54.9 | 1.50 | 12.5 | 11.7 | 7.1452 | |||||||
| Suburban | 2 | 78,600,000 | 10.7 | 56.8 | 54.1 | 1.53 | 13.2 | 12.2 | 7.0598 | |||||||
| CBD | 3 | 71,350,000 | 9.7 | 56.7 | 56.1 | 1.44 | 11.7 | 11.0 | 7.2730 | |||||||
| Medical | 1 | 3,461,037 | 0.5 | 46.8 | 46.8 | 1.90 | 12.9 | 12.4 | 6.4500 | |||||||
| Mixed Use | 5 | 111,600,000 | 15.2 | 53.9 | 52.3 | 1.70 | 14.0 | 12.7 | 6.5445 | |||||||
| Office/Retail | 2 | 56,600,000 | 7.7 | 41.7 | 38.5 | 2.13 | 18.9 | 16.4 | 6.1433 | |||||||
| Medical Office/Retail | 1 | 23,000,000 | 3.1 | 69.9 | 69.9 | 1.21 | 8.4 | 8.2 | 6.7050 | |||||||
| Office/Retail/Multifamily | 1 | 22,000,000 | 3.0 | 62.9 | 62.9 | 1.29 | 9.7 | 9.5 | 7.2700 | |||||||
| Multifamily/Retail | 1 | 10,000,000 | 1.4 | 66.7 | 66.7 | 1.26 | 9.1 | 8.8 | 6.8500 | |||||||
| Hospitality | 4 | 72,393,407 | 9.9 | 54.3 | 53.9 | 1.95 | 16.5 | 14.7 | 7.4158 | |||||||
| Full Service | 2 | 37,843,407 | 5.2 | 53.1 | 52.4 | 1.86 | 16.5 | 14.5 | 7.6110 | |||||||
| Select Service | 1 | 23,300,000 | 3.2 | 57.2 | 57.2 | 1.91 | 15.6 | 14.1 | 7.2890 | |||||||
| Extended Stay | 1 | 11,250,000 | 1.5 | 52.3 | 52.3 | 2.33 | 18.3 | 16.6 | 7.0220 | |||||||
| Retail | 8 | 36,440,477 | 5.0 | 46.3 | 45.2 | 1.80 | 14.1 | 13.6 | 6.9516 | |||||||
| Anchored | 2 | 22,000,000 | 3.0 | 46.0 | 44.2 | 1.73 | 14.9 | 14.4 | 7.2809 | |||||||
| Single Tenant | 6 | 14,440,477 | 2.0 | 46.8 | 46.8 | 1.90 | 12.9 | 12.4 | 6.4500 | |||||||
| Industrial | 1 | 15,621,439 | 2.1 | 46.8 | 46.8 | 1.90 | 12.9 | 12.4 | 6.4500 | |||||||
| Warehouse | 1 | 15,621,439 | 2.1 | 46.8 | 46.8 | 1.90 | 12.9 | 12.4 | 6.4500 | |||||||
| Manufactured Housing | 7 | 14,000,000 | 1.9 | 66.3 | 66.3 | 1.31 | 9.4 | 9.3 | 7.0340 | |||||||
| Manufactured Housing | 5 | 9,805,404 | 1.3 | 66.3 | 66.3 | 1.31 | 9.4 | 9.3 | 7.0340 | |||||||
| Manufactured Housing/RV Park | 2 | 4,194,596 | 0.6 | 66.3 | 66.3 | 1.31 | 9.4 | 9.3 | 7.0340 | |||||||
| Self Storage | 1 | 5,200,000 | 0.7 | 56.5 | 56.5 | 1.34 | 10.5 | 10.5 | 7.6800 | |||||||
| Self Storage | 1 | 5,200,000 | 0.7 | 56.5 | 56.5 | 1.34 | 10.5 | 10.5 | 7.6800 | |||||||
| Total/Weighted Average | 48 | $731,866,360 | 100.0 | % | 58.6 | % | 58.0 | % | 1.53 | x | 11.9 | % | 11.2 | % | 6.9082 | % |
| (1) | Because this table presents information relating to the mortgaged properties and not the mortgage loans, the information for mortgage loans secured by more than one mortgaged property is based on allocated loan amounts (allocating the principal balance of the mortgage loan to each of those properties according to the relative appraised values of the mortgaged properties or the allocated loan amounts or property-specific release prices set forth in the related mortgage loan documents or such other allocation as the related mortgage loan seller deemed appropriate). With respect to any mortgage loan that is part of a whole loan, the loan-to-value ratio, debt service coverage ratio and debt yield calculations include the related pari passu companion loan(s) but exclude any related subordinate secured loan(s) (unless otherwise stated). With respect to each mortgage loan, debt service coverage ratio, debt yield and loan-to-value ratio information do not take into account any subordinate debt (whether or not secured by the related mortgaged property) that currently exists or is allowed under the terms of such mortgage loan. See Annex A-1 to the Preliminary Prospectus. |
| THE INFORMATION IN THIS STRUCTURAL AND COLLATERAL TERM SHEET IS NOT COMPLETE AND MAY BE AMENDED PRIOR TO THE TIME OF SALE. THIS TERM SHEET IS NOT AN OFFER TO SELL THESE SECURITIES AND IT IS NOT A SOLICITATION OF AN OFFER TO BUY THESE SECURITIES IN ANY JURISDICTION WHERE THE OFFER OR SALE IS NOT PERMITTED. | ||
| 13 | ||
| Wells Fargo Commercial Mortgage Trust 2024-5C1 | Characteristics of the Mortgage Pool |
| G. | Geographic Distribution(1)(2) |
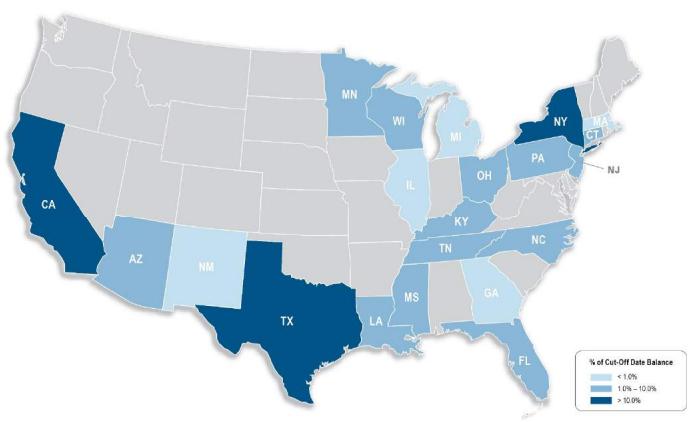
| Location | Number of Mortgaged Properties | Aggregate Cut-off Date Balance ($) | % of Initial Pool Balance (%) | Weighted Average Cut-off Date LTV Ratio (%) | Weighted Average Balloon LTV Ratio (%) | Weighted Average U/W NCF DSCR (x) | Weighted Average U/W NOI Debt Yield (%) | Weighted Average U/W NCF Debt Yield (%) | Weighted Average Mortgage Rate (%) | |||||||
| Texas | 5 | $144,700,000 | 19.8 | % | 58.3 | % | 56.8 | % | 1.42 | x | 11.5 | % | 10.8 | % | 7.0348 | % |
| New York | 6 | 140,850,000 | 19.2 | 54.8 | 53.2 | 1.54 | 13.1 | 11.9 | 6.7688 | |||||||
| California | 4 | 83,200,000 | 11.4 | 49.8 | 49.3 | 1.69 | 12.4 | 12.1 | 6.7644 | |||||||
| Southern California | 3 | 77,000,000 | 10.5 | 50.5 | 49.9 | 1.59 | 11.8 | 11.6 | 6.8052 | |||||||
| Northern California | 1 | 6,200,000 | 0.8 | 41.3 | 41.3 | 2.90 | 20.2 | 18.4 | 6.2570 | |||||||
| New Jersey | 2 | 50,000,000 | 6.8 | 69.6 | 69.6 | 1.23 | 8.1 | 8.0 | 6.4200 | |||||||
| Minnesota | 1 | 47,850,000 | 6.5 | 67.4 | 67.4 | 1.23 | 8.8 | 8.7 | 6.9200 | |||||||
| Ohio | 3 | 43,432,080 | 5.9 | 71.5 | 71.5 | 1.44 | 10.2 | 9.9 | 6.7744 | |||||||
| Connecticut | 2 | 36,450,000 | 5.0 | 55.0 | 55.0 | 1.87 | 15.7 | 14.0 | 7.4156 | |||||||
| Other(3) | 25 | 185,384,280 | 25.3 | 58.3 | 58.2 | 1.64 | 12.4 | 11.7 | 7.0403 | |||||||
| Total/Weighted Average | 48 | 731,866,360 | 100.0 | % | 58.6 | % | 58.0 | % | 1.53 | x | 11.9 | % | 11.2 | % | 6.9082 | % |
| (1) | The mortgaged properties are located in 21 states. |
| (2) | Because this table presents information relating to the mortgaged properties and not the mortgage loans, the information for mortgage loans secured by more than one mortgaged property is based on allocated loan amounts (allocating the principal balance of the mortgage loan to each of those properties according to the relative appraised values of the mortgaged properties or the allocated loan amounts or property-specific release prices set forth in the related mortgage loan documents or such other allocation as the related mortgage loan seller deemed appropriate). With respect to any mortgage loan that is part of a whole loan, the loan-to-value ratio, debt service coverage ratio and debt yield calculations include the related pari passu companion loan(s) but exclude any related subordinate secured loan(s) (unless otherwise stated). With respect to each mortgage loan, debt service coverage ratio, debt yield and loan-to-value ratio information do not take into account any subordinate debt (whether or not secured by the related mortgaged property) that currently exists or is allowed under the terms of such mortgage loan. See Annex A-1 to the Preliminary Prospectus. |
| (3) | Includes 14 other states. |
| THE INFORMATION IN THIS STRUCTURAL AND COLLATERAL TERM SHEET IS NOT COMPLETE AND MAY BE AMENDED PRIOR TO THE TIME OF SALE. THIS TERM SHEET IS NOT AN OFFER TO SELL THESE SECURITIES AND IT IS NOT A SOLICITATION OF AN OFFER TO BUY THESE SECURITIES IN ANY JURISDICTION WHERE THE OFFER OR SALE IS NOT PERMITTED. | ||
| 14 | ||
| Wells Fargo Commercial Mortgage Trust 2024-5C1 | Characteristics of the Mortgage Pool |
| H. | Characteristics of the Mortgage Pool(1) |
| CUT-OFF DATE BALANCE | ||||
| Range of Cut-off Date Balances ($) | Number of Mortgage Loans | Aggregate Cut-off Date Balance ($) | Percent by Aggregate Cut-off Date Pool Balance (%) | |
| 3,200,000 - 5,000,000 | 2 | $8,200,000 | 1.1 | % |
| 5,000,001 - 15,000,000 | 15 | 155,843,407 | 21.3 | |
| 15,000,001 - 30,000,000 | 7 | 170,800,000 | 23.3 | |
| 30,000,001 - 50,000,000 | 5 | 209,122,953 | 28.6 | |
| 50,000,001 - 70,000,000 | 2 | 114,900,000 | 15.7 | |
| 70,000,001 - 73,000,000 | 1 | 73,000,000 | 10.0 | |
| Total: | 32 | $731,866,360 | 100.0 | % |
| Average: | $22,870,824 | |||
| UNDERWRITTEN NOI DEBT SERVICE COVERAGE RATIO | ||||
| Range of U/W NOI DSCRs (x) | Number of Mortgage Loans | Aggregate Cut-off Date Balance ($) | Percent by Aggregate Cut-off Date Pool Balance (%) | |
| 1.23 - 1.50 | 18 | $419,150,000 | 57.3 | % |
| 1.51 - 2.00 | 6 | 152,366,360 | 20.8 | |
| 2.01 - 3.19 | 8 | 160,350,000 | 21.9 | |
| Total: | 32 | $731,866,360 | 100.0 | % |
| Weighted Average: | 1.62x | |||
| UNDERWRITTEN NOI DEBT YIELD | ||||
| Range of U/W NOI Debt Yields (%) | Number of Mortgage Loans | Aggregate Cut-off Date Balance ($) | Percent by Aggregate Cut-off Date Pool Balance (%) | |
| 8.1 - 12.0 | 18 | $419,150,000 | 57.3 | % |
| 12.1 - 16.0 | 8 | 186,366,360 | 25.5 | |
| 16.1 - 20.0 | 5 | 120,150,000 | 16.4 | |
| 20.1 - 20.2 | 1 | 6,200,000 | 0.8 | |
| Total: | 32 | $731,866,360 | 100.0 | % |
| Weighted Average: | 11.9% | |||
| LOAN PURPOSE | ||||
| Loan Purpose | Number of Mortgage Loans | Aggregate Cut-off Date Balance ($) | Percent by Aggregate Cut-off Date Pool Balance (%) | |
| Refinance | 28 | $659,993,407 | 90.2 | % |
| Acquisition | 3 | 48,572,953 | 6.6 | |
| Recapitalization | 1 | 23,300,000 | 3.2 | |
| Total: | 32 | $731,866,360 | 100.0 | % |
| MORTGAGE RATE | ||||
| Range of Mortgage Rates (%) | Number of Mortgage Loans | Aggregate Cut-off Date Balance ($) | Percent by Aggregate Cut-off Date Pool Balance (%) | |
| 6.1293 - 6.5000 | 7 | $203,822,953 | 27.8 | % |
| 6.5001 - 7.0000 | 8 | 199,950,000 | 27.3 | |
| 7.0001 - 7.5000 | 13 | 289,600,000 | 39.6 | |
| 7.5001 - 8.0000 | 3 | 27,650,000 | 3.8 | |
| 8.0001 - 8.4850 | 1 | 10,843,407 | 1.5 | |
| Total: | 32 | $731,866,360 | 100.0 | % |
| Weighted Average: | 6.9082% | |||
| UNDERWRITTEN NCF DEBT SERVICE COVERAGE RATIO | ||||
| Range of U/W NCF DSCRs (x) | Number of Mortgage Loans | Aggregate Cut-off Date Balance ($) | Percent by Aggregate Cut-off Date Pool Balance (%) | |
| 1.21 - 1.50 | 20 | $502,993,407 | 68.7 | % |
| 1.51 - 2.00 | 7 | 111,522,953 | 15.2 | |
| 2.01 - 2.90 | 5 | 117,350,000 | 16.0 | |
| Total: | 32 | $731,866,360 | 100.0 | % |
| Weighted Average: | 1.53x | |||
| UNDERWRITTEN NCF DEBT YIELD | ||||
| Range of U/W NCF Debt Yields (%) | Number of Mortgage Loans | Aggregate Cut-off Date Balance ($) | Percent by Aggregate Cut-off Date Pool Balance (%) | |
| 8.0 | 2 | $65,000,000 | 8.9 | % |
| 8.1 - 12.0 | 17 | 367,150,000 | 50.2 | |
| 12.1 - 16.0 | 8 | 200,366,360 | 27.4 | |
| 16.1 - 18.4 | 5 | 99,350,000 | 13.6 | |
| Total: | 32 | $731,866,360 | 100.0 | % |
| Weighted Average: | 11.2% | |||
| (1) | With respect to any mortgage loan that is part of a whole loan, the loan-to-value ratio, debt service coverage ratio and debt yield calculations include the related pari passu companion loan(s) but exclude any related subordinate debt (unless otherwise stated). With respect to each mortgage loan, debt service coverage ratio, debt yield and loan-to-value ratio information do not take into account any subordinate debt (whether or not secured by the related mortgaged property) that currently exists or is allowed under the terms of such mortgage loan. See Annex A-1 to the Preliminary Prospectus. Prepayment provisions for each mortgage loan reflects the entire life of the loan (from origination to maturity) and may be currently prepayable. |
| THE INFORMATION IN THIS STRUCTURAL AND COLLATERAL TERM SHEET IS NOT COMPLETE AND MAY BE AMENDED PRIOR TO THE TIME OF SALE. THIS TERM SHEET IS NOT AN OFFER TO SELL THESE SECURITIES AND IT IS NOT A SOLICITATION OF AN OFFER TO BUY THESE SECURITIES IN ANY JURISDICTION WHERE THE OFFER OR SALE IS NOT PERMITTED. | ||
| 15 | ||
| Wells Fargo Commercial Mortgage Trust 2024-5C1 | Characteristics of the Mortgage Pool |
| ORIGINAL TERM TO MATURITY | ||||
| Original Terms to Maturity (months) | Number of Mortgage Loans | Aggregate Cut- off Date Balance | Percent by Aggregate Cut-off Date Pool Balance (%) | |
| 60 | 32 | $731,866,360 | 100.0% | |
| Total: | 32 | $731,866,360 | 100.0% | |
| Weighted Average: | 60 months | |||
| REMAINING TERM TO MATURITY | ||||
| Range of Remaining Terms to Maturity (months) | Number of Mortgage Loans | Aggregate Cut- off Date Balance | Percent by Aggregate Cut-off Date Pool Balance (%) | |
| 55 - 60 | 32 | $731,866,360 | 100.0 | % |
| Total: | 32 | $731,866,360 | 100.0 | % |
| Weighted Average: | 59 months | |||
| ORIGINAL AMORTIZATION TERM(1) | ||||
| Original Amortization Terms (months) | Number of Mortgage Loans | Aggregate Cut- off Date Balance | Percent by Aggregate Cut-off Date Pool Balance (%) | |
| Non-Amortizing | 27 | $556,372,953 | 76.0 | % |
| Planned Amortization | 1 | 50,400,000 | 6.9 | |
| 240 | 1 | 9,000,000 | 1.2 | |
| 360 | 3 | 116,093,407 | 15.9 | |
| Total: | 32 | $731,866,360 | 100.0 | % |
| Weighted Average(3): | 351 months | |||
| REMAINING AMORTIZATION TERM(2) | ||||
| Range of Remaining Amortization Terms (months) | Number of Mortgage Loans | Aggregate Cut- off Date Balance | Percent by Aggregate Cut-off Date Pool Balance (%) | |
| Non-Amortizing | 27 | $556,372,953 | 76.0 | % |
| Planned Amortization | 1 | 50,400,000 | 6.9 | |
| 240 | 1 | 9,000,000 | 1.2 | |
| 359 - 360 | 3 | 116,093,407 | 15.9 | |
| Total: | 32 | $731,866,360 | 100.0 | % |
| Weighted Average(3): | 351 months | |||
| LOCKBOXES | ||||
| Type of Lockbox | Number of Mortgage Loans | Aggregate Cut- off Date Balance | Percent by Aggregate Cut-off Date Pool Balance (%) | |
| Springing | 16 | $256,943,407 | 35.1 | % |
| Hard/ Springing Cash Management | 9 | 213,672,953 | 29.2 | |
| Soft/ Springing Cash Management | 5 | 185,850,000 | 25.4 | |
| Hard/ In Place Cash Management | 2 | 75,400,000 | 10.3 | |
| Total: | 32 | $731,866,360 | 100.0 | % |
| PREPAYMENT PROVISION SUMMARY | ||||
| Prepayment Provision | Number of Mortgage Loans | Aggregate Cut- off Date Balance | Percent by Aggregate Cut-off Date Pool Balance (%) | |
| Lockout / Defeasance / Open | 29 | $683,216,360 | 93.4 | % |
| Lockout / GRTR 1% or YM / Open | 3 | 48,650,000 | 6.6 | |
| Total: | 32 | $731,866,360 | 100.0 | % |
CUT-OFF DATE LOAN-TO-VALUE RATIO | ||||
| Range of Cut-off Date LTV Ratios (%) | Number of Mortgage Loans | Aggregate Cut- off Date Balance | Percent by Aggregate Cut-off Date Pool Balance (%) | |
| 33.2 - 40.0 | 2 | $31,500,000 | 4.3 | % |
| 40.1 - 50.0 | 5 | 124,322,953 | 17.0 | |
| 50.1 - 60.0 | 8 | 197,100,000 | 26.9 | |
| 60.1 - 70.0 | 15 | 341,493,407 | 46.7 | |
| 70.1 - 74.9 | 2 | 37,450,000 | 5.1 | |
| Total: | 32 | $731,866,360 | 100.0 | % |
| Weighted Average: | 58.6% | |||
| BALLOON LOAN-TO-VALUE RATIO | ||||
| Range of Balloon LTV Ratios (%) | Number of Mortgage Loans | Aggregate Cut- off Date Balance | Percent by Aggregate Cut-off Date Pool Balance (%) | |
| 30.2 - 40.0 | 3 | $81,900,000 | 11.2 | % |
| 40.1 - 50.0 | 4 | 73,922,953 | 10.1 | |
| 50.1 - 60.0 | 8 | 197,100,000 | 26.9 | |
| 60.1 - 70.0 | 15 | 341,493,407 | 46.7 | |
| 70.1 - 74.9 | 2 | 37,450,000 | 5.1 | |
| Total: | 32 | $731,866,360 | 100.0 | % |
| Weighted Average: | 58.0% | |||
| AMORTIZATION TYPE | ||||
| Amortization Type | Number of Mortgage Loans | Aggregate Cut- off Date Balance | Percent by Aggregate Cut-off Date Pool Balance (%) | |
| Interest Only | 27 | $556,372,953 | 76.0 | % |
| Amortizing Balloon | 4 | 143,243,407 | 19.6 | |
| Interest Only, Amortizing Balloon | 1 | 32,250,000 | 4.4 | |
| Total: | 32 | $731,866,360 | 100.0 | % |
| ORIGINAL TERM OF INTEREST-ONLY PERIOD FOR PARTIAL IO LOANS | ||||
| IO Terms (months) | Number of Mortgage Loans | Aggregate Cut- off Date Balance | Percent by Aggregate Cut-off Date Pool Balance (%) | |
| 24 | 1 | $32,250,000 | 4.4% | |
| Total: | 1 | $32,250,000 | 4.4% | |
| Weighted Average: | 24 months | |||
| SEASONING | ||||
| Seasoning (months) | Number of Mortgage Loans | Aggregate Cut- off Date Balance | Percent by Aggregate Cut-off Date Pool Balance (%) | |
| 0 | 14 | $391,450,000 | 53.5 | % |
| 1 | 16 | 320,216,360 | 43.8 | |
| 2 | 1 | 7,200,000 | 1.0 | |
| 5 | 1 | 13,000,000 | 1.8 | |
| Total: | 32 | $731,866,360 | 100.0 | % |
| Weighted Average: | 1 month | |||
(1) | The original amortization term shown for any mortgage loan that is interest only for part of its term does not include the number of months in its interest only period and reflects only the number of months as of the commencement of amortization remaining from the end of such interest-only period. |
| (2) | The remaining amortization term shown for any mortgage loan that is interest only for part of its term does not include the number of months in its interest only period and reflects only the number of months as of the commencement of amortization remaining from the end of such interest-only period |
| (3) | Excludes the non-amortizing mortgage loans and 640 5th Avenue which is on a planned amortization schedule. |
| THE INFORMATION IN THIS STRUCTURAL AND COLLATERAL TERM SHEET IS NOT COMPLETE AND MAY BE AMENDED PRIOR TO THE TIME OF SALE. THIS TERM SHEET IS NOT AN OFFER TO SELL THESE SECURITIES AND IT IS NOT A SOLICITATION OF AN OFFER TO BUY THESE SECURITIES IN ANY JURISDICTION WHERE THE OFFER OR SALE IS NOT PERMITTED. | ||
| 16 | ||
| Wells Fargo Commercial Mortgage Trust 2024-5C1 | Certain Terms and Conditions |
| V. | Certain Terms and Conditions |
| Interest Entitlements: | The interest entitlement of each Class of Certificates on each Distribution Date generally will be the interest accrued during the related Interest Accrual Period on the related Certificate Balance or Notional Amount at the related pass-through rate, net of any prepayment interest shortfalls allocated to that Class for such Distribution Date as described below. If prepayment interest shortfalls arise from voluntary prepayments (without the Master Servicer’s consent) on particular non-specially serviced loans during any collection period, the Master Servicer is required to make a compensating interest payment to offset those shortfalls, generally up to an amount equal to the portion of its master servicing fees that accrue at 0.25 basis points per annum. The remaining amount of prepayment interest shortfalls will be allocated to reduce the interest entitlement on all Classes of Certificates that are entitled to interest, on a pro rata basis, based on their respective amounts of accrued interest for the related Distribution Date. If a Class receives less than the entirety of its interest entitlement on any Distribution Date, then the shortfall (excluding any shortfall due to prepayment interest shortfalls), together with interest thereon, will be added to its interest entitlement for the next succeeding Distribution Date. |
| Principal Distribution Amount: | The Principal Distribution Amount for each Distribution Date generally will be the aggregate amount of principal received or advanced in respect of the mortgage loans, net of any non-recoverable advances and interest thereon and workout-delayed reimbursement amounts that are reimbursed to the Master Servicer, the Special Servicer or the Trustee during the related collection period. Non-recoverable advances and interest thereon are reimbursable from principal collections and advances before reimbursement from other amounts. Workout-delayed reimbursement amounts are reimbursable from principal collections. |
| Subordination, Allocation of Losses and Certain Expenses | The chart below describes the manner in which the payment rights of certain Classes of Certificates will be senior or subordinate, as the case may be, to the payment rights of other Classes of Certificates. The chart also shows the corresponding entitlement to receive principal and/or interest of certain Classes of Certificates on any distribution date in descending order. It also shows the manner in which losses are allocated to certain Classes of Certificates in ascending order (beginning with the Non-Offered Certificates, other than the Class X-D, X-F and Class R Certificates) to reduce the Certificate Balance of each such Class to zero; provided that no principal payments or mortgage loan losses will be allocated to the Class X-A, X-B, X-D, X-F or R Certificates, although principal payments and losses may reduce the Notional Amounts of the Class X-A, X-B, X-D and X-F Certificates and, therefore, the amount of interest they accrue. |
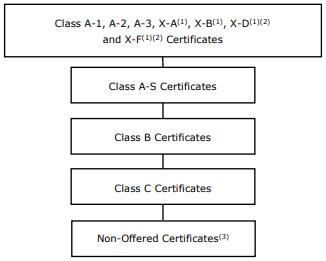 |
| (1) | The Class X-A, X-B, X-D and X-F Certificates are interest-only certificates. | |
| (2) | Non-Offered Certificates. | |
| (3) | Other than the Class X-D, X-F and R Certificates |
| Distributions: | On each Distribution Date, funds available for distribution from the mortgage loans, net of specified trust fees, expenses and reimbursements will generally be distributed in the following amounts and order of priority (in each case to the extent of remaining available funds): |
1. Class A-1, A-2, A-3, X-A, X-B, X-D and X-F Certificates: To interest on the Class A-1, A-2, A-3, X-A, X-B, X-D and X-F Certificates, pro rata, according to their respective interest entitlements. |
| THE INFORMATION IN THIS STRUCTURAL AND COLLATERAL TERM SHEET IS NOT COMPLETE AND MAY BE AMENDED PRIOR TO THE TIME OF SALE. THIS TERM SHEET IS NOT AN OFFER TO SELL THESE SECURITIES AND IT IS NOT A SOLICITATION OF AN OFFER TO BUY THESE SECURITIES IN ANY JURISDICTION WHERE THE OFFER OR SALE IS NOT PERMITTED. | ||
| 17 | ||
| Wells Fargo Commercial Mortgage Trust 2024-5C1 | Certain Terms and Conditions |
2. Class A-1, A-2 and A-3 Certificates: To principal on the Class A-1, A-2 and A-3 Certificates in the following amounts and order of priority: (i) first, to principal on the Class A-1 Certificates until their Certificate Balance is reduced to zero; (ii) second, to principal on the Class A-2 Certificates until their Certificate Balance is reduced to zero, up to the remainder of the Principal Distribution Amount for such Distribution Date; (iii) third, to principal on the Class A-3 Certificates until their Certificate Balance is reduced to zero, up to the remainder of the Principal Distribution Amount for such Distribution Date. However, if the Certificate Balance of each and every Class of Principal Balance Certificates, other than the Class A-1, A-2 and A-3 Certificates, has been reduced to zero as a result of the allocation of Mortgage Loan losses and expenses and any of the Class A-1, A-2 and A-3 Certificates remains outstanding, then the Principal Distribution Amount will be distributed to the Class A-1, A-2 and A-3 Certificates, pro rata, based on their respective outstanding Certificate Balances, until their Certificate Balances have been reduced to zero. | |
3. Class A-1, A-2 and A-3 Certificates: To reimburse the holders of the Class A-1, A-2 and A-3 Certificates, pro rata, on the basis of previously allocated unreimbursed losses, for any previously unreimbursed losses (plus interest thereon) on the mortgage loans that were previously allocated in reduction of the Certificate Balances of such Classes. | |
4. Class A-S Certificates: To make distributions on the Class A-S Certificates as follows: (a) first, to interest on the Class A-S Certificates in the amount of the interest entitlement for that Class; (b) next, to the extent of the portion of the Principal Distribution Amount remaining after distributions in respect of principal to each Class with a higher distribution priority (in this case, the Class A-1, Class A-2 and A-3 Certificates), to principal on the Class A-S Certificates until their Certificate Balance is reduced to zero; and (c) next, to reimburse the holders of the Class A-S Certificates for any previously unreimbursed losses (plus interest thereon) on the mortgage loans that were previously allocated to that Class in reduction of their Certificate Balance. 5. Class B Certificates: To make distributions on the Class B Certificates as follows: (a) first, to interest on the Class B Certificates in the amount of the interest entitlement for that Class; (b) next, to the extent of the portion of the Principal Distribution Amount remaining after distributions in respect of principal to each Class with a higher distribution priority (in this case, the Class A-1, A-2, A-3 and A-S Certificates), to principal on the Class B Certificates until their Certificate Balance is reduced to zero; and (c) next, to reimburse the holders of the Class B Certificates for any previously unreimbursed losses (plus interest thereon) on the mortgage loans that were previously allocated to that Class in reduction of their Certificate Balance. 6. Class C Certificates: To make distributions on the Class C Certificates as follows: (a) first, to interest on the Class C Certificates in the amount of the interest entitlement for that Class; (b) next, to the extent of the portion of the Principal Distribution Amount remaining after distributions in respect of principal to each Class with a higher distribution priority (in this case, the Class A-1, A-2, A-3, A-S and B Certificates), to principal on the Class C Certificates until their Certificate Balance is reduced to zero; and (c) next, to reimburse the holders of the Class C Certificates for any previously unreimbursed losses (plus interest thereon) on the mortgage loans that were previously allocated to that Class in reduction of their Certificate Balance. 7. After the Class A-1, A-2, A-3, A-S, B and C Certificates are paid all amounts to which they are entitled, the remaining funds available for distribution will be used to pay interest, principal and loss reimbursement amounts on the Class D, E, F, G-RR and J-RR Certificates sequentially in that order in a manner analogous to the Class C Certificates. | |
| Allocation of Yield Maintenance Charges and Prepayment Premiums: | If any Yield Maintenance Charge or Prepayment Premium is collected during any particular collection period with respect to any mortgage loan, then on the Distribution Date corresponding to that collection period, the certificate administrator will pay that Yield Maintenance Charge or Prepayment Premium (net of liquidation fees payable therefrom) in the following manner: (1) to each class of the Class A-1, A-2, A-3, A-S, B, C, D and E Certificates, the product of (a) such Yield Maintenance Charge or Prepayment Premium, (b) the related Base Interest Fraction for such class and the applicable principal prepayment, and (c) a fraction, the numerator of which is equal to the amount of principal distributed to such class for that Distribution Date, and the denominator of which is the total amount of principal distributed to the Class A-1, A-2, A-3, A-S, B, C, D, E, F, G-RR and J-RR Certificates for that Distribution Date, |
| THE INFORMATION IN THIS STRUCTURAL AND COLLATERAL TERM SHEET IS NOT COMPLETE AND MAY BE AMENDED PRIOR TO THE TIME OF SALE. THIS TERM SHEET IS NOT AN OFFER TO SELL THESE SECURITIES AND IT IS NOT A SOLICITATION OF AN OFFER TO BUY THESE SECURITIES IN ANY JURISDICTION WHERE THE OFFER OR SALE IS NOT PERMITTED. | ||
| 18 | ||
| Wells Fargo Commercial Mortgage Trust 2024-5C1 | Certain Terms and Conditions |
(2) to the Class X-A Certificates, the excess, if any, of (a) the product of (i) such Yield Maintenance Charge or Prepayment Premium and (ii) a fraction, the numerator of which is equal to the total amount of principal distributed to the Class A-1, A-2 and the Class A-3 Certificates for that Distribution Date, and the denominator of which is the total amount of principal distributed to the Class A-1, A-2, A-3, A-S, B, C, D, E, F, G-RR and J-RR Certificates for that Distribution Date, over (b) the total amount of such Yield Maintenance Charge or Prepayment Premium distributed to the Class A-1, A-2 and A-3 Certificates as described above, (3) to the holders of the Class X-B Certificates, the excess, if any, of (a) the product of (i) such Yield Maintenance Charge or Prepayment Premium and (ii) a fraction, the numerator of which is equal to the total amount of principal distributed to the Class A-S, B and C Certificates for that Distribution Date, and the denominator of which is the total amount of principal distributed to the Class A-1, A-2, A-3, A-S, B, C, D, E, F, G-RR and J-RR Certificates for that Distribution Date, over (b) the total amount of such Yield Maintenance Charge or Prepayment Premium distributed to the Class A-S, Class B and Class C Certificates as described above, and (4) to the Class X-D Certificates, any remaining portion of such Yield Maintenance Charge or Prepayment Premium not distributed as described above; provided, however, that after the Certificate Balances of the Class A-1, A-2, A-3, A-S, B, C, D and E Certificates have been reduced to zero, all prepayment premiums and yield maintenance charges with respect to the mortgage loans will be allocated among the holders of the Class F, G-RR and J-RR Certificates as provided in the WFCM 2024-5C1 pooling and servicing agreement. No Prepayment Premiums or Yield Maintenance Charges will be distributed to the holders of the Class X-F or R Certificates. For a description of when Prepayment Premiums and Yield Maintenance Charges are generally required on the mortgage loans, see Annex A-1 to the Preliminary Prospectus. See also “Risk Factors—Risks Relating to the Mortgage Loans—Risks Relating to Enforceability of Yield Maintenance Charges, Prepayment Premiums or Defeasance Provisions” and “Risk Factors—Other Risks Relating to the Certificates—Your Yield May Be Affected by Defaults, Prepayments and Other Factors” in the Preliminary Prospectus. Prepayment Premiums and Yield Maintenance Charges will be distributed on each Distribution Date only to the extent they are actually received on the mortgage loans as of the related Determination Date. | |
| Realized Losses: | The Certificate Balances of the Class A-1, A-2, A-3, A-S, B, C, D, E, F, G-RR and J-RR Certificates will be reduced without distribution on any Distribution Date as a write-off to the extent of any losses realized on the mortgage loans allocated to such Class on such Distribution Date. Such losses will be applied in the following order, in each case until the related Certificate Balance is reduced to zero: first, to the Class J-RR Certificates; second, to the Class G-RR Certificates; third, to the Class F Certificates; fourth, to the Class E Certificates; fifth, to the Class D Certificates; sixth, to the Class C Certificates; seventh, to the Class B Certificates; eighth, to the Class A-S Certificates; and, finally, pro rata, to the Class A-1, A-2 and A-3 Certificates based on their outstanding Certificate Balances. The Notional Amount of the Class X-A Certificates will be reduced by the amount of all losses that are allocated to the Class A-1, A-2 and A-3 Certificates as write-offs in reduction of their Certificate Balances. The Notional Amount of the Class X-B Certificates will be reduced by the amount of all losses that are allocated to the Class A-S, B and C Certificates as write-offs in reduction of their Certificate Balances. |
| P&I Advances: | The Master Servicer or, if the Master Servicer fails to do so, the Trustee, will be obligated to advance delinquent debt service payments (other than balloon payments and default interest) and assumed debt service payments on mortgage loans with delinquent balloon payments (excluding any related companion loan), except to the extent any such advance is deemed non-recoverable from collections on the related mortgage loan. In addition, if an Appraisal Reduction Amount exists for a given mortgage loan, the interest portion of any P&I advance for such mortgage loan will be reduced, which will have the effect of reducing the amount of interest available for distribution to the Certificates in reverse alphabetical order of their Class designations (except that interest payments on the Class A-1, A-2, A-3, X-A, X-B, X-D and X-F Certificates would be affected on a pari passu basis). |
| Servicing Advances: | The Master Servicer or, if the Master Servicer fails to do so, the Trustee, will be obligated to make servicing advances, including the payment of delinquent property taxes, insurance premiums and ground rent, except to the extent that those advances are deemed non-recoverable from |
| THE INFORMATION IN THIS STRUCTURAL AND COLLATERAL TERM SHEET IS NOT COMPLETE AND MAY BE AMENDED PRIOR TO THE TIME OF SALE. THIS TERM SHEET IS NOT AN OFFER TO SELL THESE SECURITIES AND IT IS NOT A SOLICITATION OF AN OFFER TO BUY THESE SECURITIES IN ANY JURISDICTION WHERE THE OFFER OR SALE IS NOT PERMITTED. | ||
| 19 | ||
| Wells Fargo Commercial Mortgage Trust 2024-5C1 | Certain Terms and Conditions |
| collections on the related mortgage loan. The Master Servicer or the Trustee, as applicable, will have the primary obligation to make any required servicing advances with respect to any serviced whole loan. With respect to any non-serviced whole loan, the master servicer or trustee, as applicable, under the related lead securitization servicing agreement will have the primary obligation to make any required servicing advances with respect to such non-serviced whole loan. | |
Appraisal Reduction Amounts and Collateral Deficiency Amounts: | An “Appraisal Reduction Amount” generally will be created in the amount, if any, by which the principal balance of a required appraisal loan (which is a mortgage loan (other than a non-serviced mortgage loan) with respect to which certain defaults, modifications or insolvency events have occurred as further described in the Preliminary Prospectus) plus other amounts overdue or advanced in connection with such mortgage loan exceeds 90% of the appraised value of the related mortgaged property plus certain escrows and reserves (including letters of credit) held with respect to the mortgage loan. With respect to any serviced whole loan, any Appraisal Reduction Amount will be allocated, pro rata, to the related mortgage loan and the related pari passu companion loan(s). With respect to any non-serviced mortgage loan, appraisal reduction amounts are expected to be calculated in a similar manner under the related non-serviced pooling and servicing agreement. A mortgage loan will cease to be a required appraisal loan when the same has ceased to be a specially serviced loan (if applicable), has been brought current for at least three consecutive months and no other circumstances exist that would cause such mortgage loan to be a required appraisal loan. A “Collateral Deficiency Amount” will exist with respect to any mortgage loan that is modified into an AB loan structure and remains a corrected mortgage loan and will generally equal the excess of (i) the stated principal balance of such AB modified loan (taking into account the related junior note(s) and any pari passu notes included therein), over (ii) the sum of (in the case of a whole loan, solely to the extent allocable to the subject mortgage loan) (x) the most recent appraised value of the related mortgaged property plus (y) solely to the extent not reflected or taken into account in such appraised value and to the extent on deposit with, or otherwise under the control of, the lender as of the date of such determination, any capital or additional collateral contributed by the related borrower at the time the mortgage loan (and as part of the modification thereto) became an AB modified loan plus (z) any other escrows or reserves (in addition to any amounts set forth in the immediately preceding clause (y) and solely to the extent not reflected or taken into account in the calculation of any related Appraisal Reduction Amount) held by the lender with respect to the mortgage loan as of the date of such determination. A “Cumulative Appraisal Reduction Amount” with respect to any mortgage loan will be the sum of any Appraisal Reduction Amount and any Collateral Deficiency Amount. Appraisal Reduction Amounts will affect the amount of debt service advances in respect of the related mortgage loan. Additionally, Cumulative Appraisal Reduction Amounts will be taken into account in the determination of the identity of the Class whose majority constitutes the “majority controlling class certificateholder” and is entitled to appoint the directing certificateholder. |
Clean-Up Call and Exchange Termination: | On each Distribution Date occurring after the aggregate unpaid principal balance of the pool of mortgage loans is less than 1.0% of the principal balance of the mortgage loans as of the cut-off date, certain specified persons will have the option to purchase all of the remaining mortgage loans (and the trust’s interest in all property acquired through exercise of remedies in respect of any mortgage loan) at the price specified in the Preliminary Prospectus. Exercise of the option will terminate the trust and retire the then-outstanding Certificates. If the aggregate Certificate Balances of each of the Class A-1, A-2, A-3, B, C, D and E Certificates have been reduced to zero, the trust may also be terminated in connection with an exchange of all the then-outstanding Certificates (other than the Class R Certificates) for the mortgage loans and REO properties then remaining in the issuing entity, subject to payment of a price specified in the Preliminary Prospectus, but all of the holders of those outstanding Classes of Certificates (other than the Class R Certificates) would have to voluntarily participate in the exchange. |
| Liquidation Loan Waterfall: | Following the liquidation of any mortgage loan or mortgaged property, the net liquidation proceeds generally will be applied (after reimbursement of advances and certain trust fund expenses), first, as a recovery of accrued interest, other than delinquent interest that was not advanced as a result of Appraisal Reduction Amounts, second, as a recovery of principal until all principal has been recovered, and then as a recovery of delinquent interest that was not advanced as a result of Appraisal Reduction Amounts. Please see “Description of the Certificates—Distributions—Application Priority of Mortgage Loan Collections or Whole Loan Collections” in the Preliminary Prospectus. |
| Control Eligible Certificates: | The Class G-RR and J-RR Certificates. |
| THE INFORMATION IN THIS STRUCTURAL AND COLLATERAL TERM SHEET IS NOT COMPLETE AND MAY BE AMENDED PRIOR TO THE TIME OF SALE. THIS TERM SHEET IS NOT AN OFFER TO SELL THESE SECURITIES AND IT IS NOT A SOLICITATION OF AN OFFER TO BUY THESE SECURITIES IN ANY JURISDICTION WHERE THE OFFER OR SALE IS NOT PERMITTED. | ||
| 20 | ||
| Wells Fargo Commercial Mortgage Trust 2024-5C1 | Certain Terms and Conditions |
| Directing Certificateholder/ Controlling Class: | A directing certificateholder may be appointed by the “majority controlling class certificateholder”, which will be the holder(s) of a majority of the Controlling Class. The “Controlling Class” will be, as of any time of determination, the most subordinate Class of Control Eligible Certificates then outstanding that has an aggregate Certificate Balance (as notionally reduced by any Cumulative Appraisal Reduction Amounts allocable to such Class(es)) at least equal to 25% of the initial Certificate Balance of that Class; provided, however, that if at any time the Certificate Balances of the Certificates other than the Control Eligible Certificates have been reduced to zero as a result of principal payments on the Mortgage Loans, then the Controlling Class will be the most subordinate Class of Control Eligible Certificates that has a Certificate Balance greater than zero without regard to any Cumulative Appraisal Reduction Amounts. The Controlling Class as of the closing date will be the Class J-RR Certificates. |
| Control and Consultation: | The rights of various parties to replace the Special Servicer and approve or consult with respect to major actions of the Special Servicer will vary according to defined periods. A “Control Termination Event” will occur when (i) the Class G-RR Certificates have a Certificate Balance (taking into account the application of any Cumulative Appraisal Reduction Amounts to notionally reduce the Certificate Balance of such Class) of less than 25% of the initial Certificate Balance of that Class or (ii) a holder of the Class G-RR Certificates is the majority Controlling Class Certificateholder and has irrevocably waived its right, in writing, to exercise any of the rights of the Controlling Class Certificateholder and such rights have not been reinstated to a successor controlling class certificateholder as described below; provided that a Control Termination Event will not be deemed continuing in the event that the Certificate Balances of the Certificates other than the Control Eligible Certificates have been reduced to zero as a result of principal payments on the mortgage loans. A “Consultation Termination Event” will occur when (i) there is no Class of Control Eligible Certificates that has a then-outstanding Certificate Balance at least equal to 25% of the initial Certificate Balance of that Class, in each case, without regard to the application of any Cumulative Appraisal Reduction Amounts; or (ii) a holder of the Class G-RR certificates is the majority Controlling Class Certificateholder and has irrevocably waived its right, in writing, to exercise any of the rights of the Controlling Class Certificateholder and such rights have not been reinstated to a successor controlling class certificateholder pursuant to the terms of the WFCM 2024-5C1 pooling and servicing agreement; provided that no Consultation Termination Event resulting solely from the operation of clause (ii) will be deemed to have existed or be in continuance with respect to a successor holder of the Class G-RR certificates that has not irrevocably waived its right to exercise any of the rights of the Controlling Class Certificateholder; provided, further, that a Consultation Termination Event will not be deemed continuing in the event that the Certificate Balances of the Certificates other than the Control Eligible Certificates have been reduced to zero as a result of principal payments on the mortgage loans. If no Control Termination Event has occurred and is continuing, except with respect to the Excluded Loans (as defined below) (i) the directing certificateholder will be entitled to grant or withhold approval of asset status reports prepared, and material servicing actions proposed, by the Special Servicer, and (ii) the directing certificateholder will be entitled to terminate and replace the Special Servicer with or without cause, and appoint itself or another person as the successor special servicer. It will be a condition to such appointment that Fitch, KBRA and Moody’s (and any rating agency rating any securities backed by any pari passu companion loan(s) serviced under this transaction) confirm that the appointment would not result in a qualification, downgrade or withdrawal of any of their then-current ratings of Certificates (and any certificates backed by any pari passu companion loan(s) serviced under this transaction). If a Control Termination Event has occurred and is continuing but no Consultation Termination Event has occurred and is continuing, the Special Servicer will be required to consult with the directing certificateholder (other than with respect to Excluded Loans) in connection with asset status reports and material special servicing actions. If a Consultation Termination Event has occurred and is continuing, no directing certificateholder will be recognized or have any right to terminate the Special Servicer or approve, direct or consult with respect to servicing matters. With respect to each serviced whole loan, the rights of the directing certificateholder described above will be subject to the consultation rights of the holders of the related pari passu companion loans. Those consultation rights will generally extend to asset status reports and material special servicing actions involving the related whole loan, will be as set forth in the related intercreditor agreement, and will be in addition to the rights of the directing certificateholder in this transaction described above. With respect to each non-serviced whole loan, the applicable servicing agreement for the related controlling pari passu companion loan(s) generally grants (or will grant) the directing |
| THE INFORMATION IN THIS STRUCTURAL AND COLLATERAL TERM SHEET IS NOT COMPLETE AND MAY BE AMENDED PRIOR TO THE TIME OF SALE. THIS TERM SHEET IS NOT AN OFFER TO SELL THESE SECURITIES AND IT IS NOT A SOLICITATION OF AN OFFER TO BUY THESE SECURITIES IN ANY JURISDICTION WHERE THE OFFER OR SALE IS NOT PERMITTED. | ||
| 21 | ||
| Wells Fargo Commercial Mortgage Trust 2024-5C1 | Certain Terms and Conditions |
certificateholder under the related securitization control rights that may include the right to approve or disapprove various material servicing actions involving the related whole loan. The directing certificateholder for this securitization (so long as no Consultation Termination Event has occurred and is occurring) generally will nonetheless have the right to be consulted on a non-binding basis with respect to such actions. For purposes of the servicing of any such whole loan contemplated by this paragraph, the occurrence and continuance of a Control Termination Event or Consultation Termination Event under this securitization will not limit the control or other rights of the directing certificateholder (or equivalent) under the securitization of the related controlling pari passu companion loan(s). The control rights and consent and consultation rights described in the preceding paragraphs are subject to various limitations, conditions and exceptions as described in the Preliminary Prospectus. Notwithstanding any contrary description set forth above, in the event that, with respect to any mortgage loan, the majority controlling class certificateholder or the directing certificateholder is a Borrower Party, the majority controlling class certificateholder and the directing certificateholder will have no right to receive asset status reports or such other information as may be specified in the WFCM 2024-5C1 pooling and servicing agreement, to grant or withhold approval of, or consult with respect to, asset status reports prepared, and material servicing actions proposed, by the Special Servicer, with respect to such mortgage loan, and such mortgage loan will be referred to as an “Excluded Loan” as to such party. In addition, notwithstanding any contrary description set forth above, in the event that, with respect to any mortgage loan, a controlling class certificateholder is a Borrower Party, such controlling class certificateholder will have no right to receive asset status reports or such other information as may be specified in the WFCM 2024-5C1 pooling and servicing agreement with respect to such mortgage loan. “Borrower Party” means a borrower, a mortgagor or a manager of a mortgaged property, an Accelerated Mezzanine Loan Lender, or any Borrower Party Affiliate. “Accelerated Mezzanine Loan Lender” means a mezzanine lender under a mezzanine loan that has been accelerated or as to which foreclosure or enforcement proceedings have been commenced against the equity collateral pledged to secure such mezzanine loan. “Borrower Party Affiliate” means, with respect to a borrower, a mortgagor, a manager of a mortgaged property or an Accelerated Mezzanine Loan Lender, (x) any other person controlling or controlled by or under common control with such borrower, mortgagor, manager or Accelerated Mezzanine Loan Lender, as applicable, or (y) any other person owning, directly or indirectly, 25% or more of the beneficial interests in such borrower, mortgagor, manager or Accelerated Mezzanine Loan Lender. | |
| Risk Retention Consultation Party: | A risk retention consultation party may be appointed by the holder or holders of more than 50% of the VRR Interest, by Certificate Balance. The holder of the majority of the VRR Interest will have a continuing right to appoint, remove or replace the risk retention consultation party in its sole discretion. This right may be exercised at any time and from time to time. There is expected to be no initial risk retention consultation party as of the closing date. Notwithstanding any contrary description set forth above, in the event that, with respect to any mortgage loan, the holder of the majority of the VRR Interest or the risk retention consultation party is a Borrower Party, such mortgage loan will be referred to as an “Excluded Loan” as to such party. Except with respect to an Excluded Loan as to such party, the risk retention consultation party will be entitled to consult with the Special Servicer, upon request of the risk retention consultation party, with respect to certain material servicing actions proposed by the Special Servicer. |
| Replacement of Special Servicer: | If a Control Termination Event has occurred and is continuing, the Special Servicer may be removed and replaced without cause upon the affirmative direction of certificate owners holding not less than 66-2/3% of a certificateholder quorum, following a proposal from certificate owners holding not less than 25% of the appraisal-reduced voting rights of all Principal Balance Certificates. The certificateholders who initiate a vote on a termination and replacement of the Special Servicer without cause must cause Fitch, KBRA and Moody’s to confirm the then-current ratings of the Certificates (or decline to review the matter) and cause the payment of the fees and expenses incurred in the replacement. If no Control Termination Event has occurred and is continuing, the Special Servicer may be replaced by the directing certificateholder, subject to Fitch, KBRA and Moody’s (and any Rating Agency rating any securities backed by any pari passu companion loan(s) serviced under this transaction) confirming the then-current ratings of the Certificates (and any certificates backed by any pari passu companion loans serviced under this transaction) or declining to review the matter. In addition, if at any time the Operating Advisor determines, in its sole discretion exercised in good faith, that (i) the Special Servicer is not performing its duties as required under the pooling |
| THE INFORMATION IN THIS STRUCTURAL AND COLLATERAL TERM SHEET IS NOT COMPLETE AND MAY BE AMENDED PRIOR TO THE TIME OF SALE. THIS TERM SHEET IS NOT AN OFFER TO SELL THESE SECURITIES AND IT IS NOT A SOLICITATION OF AN OFFER TO BUY THESE SECURITIES IN ANY JURISDICTION WHERE THE OFFER OR SALE IS NOT PERMITTED. | ||
| 22 | ||
| Wells Fargo Commercial Mortgage Trust 2024-5C1 | Certain Terms and Conditions |
and servicing agreement in accordance with the Servicing Standard and (ii) the replacement of the Special Servicer would be in the best interest of the certificateholders as a collective whole, then the Operating Advisor will have the right to recommend the replacement of the Special Servicer and will submit its formal recommendation to the Trustee and the Certificate Administrator (along with its rationale, its proposed replacement special servicer and other relevant information justifying its recommendation). The Operating Advisor’s recommendation to replace the Special Servicer must be confirmed by an affirmative vote of holders of Certificates representing a majority of the aggregate outstanding Certificate Balance of all Principal Balance Certificates whose holders voted on the matter, provided that the holders of Principal Balance Certificates that so voted on the matter (i) hold Principal Balance Certificates representing at least 20% of the outstanding Certificate Balance of all Principal Balance Certificates on an aggregate basis and (ii) consist of at least three certificateholders or certificate owners that are not “risk retention affiliated” with each other. In the event the holders of Principal Balance Certificates evidencing at least a majority of a quorum of certificateholders elect to remove and replace the Special Servicer (which requisite affirmative votes must be received within 180 days of the posting of the notice of the Operating Advisor’s recommendation to replace the Special Servicer to the Certificate Administrator’s website), the Certificate Administrator will be required to receive a Rating Agency Confirmation from each of the Rating Agencies at that time. | |
| Excluded Special Servicer: | In the event that, with respect to any mortgage loan, the Special Servicer is a Borrower Party, the Special Servicer will be required to resign as special servicer of such mortgage loan (referred to as an “excluded special servicer loan”). If no Control Termination Event has occurred and is continuing, the directing certificateholder will be entitled to appoint (and may replace with or without cause) a separate special servicer that is not a Borrower Party (referred to as an “excluded special servicer”) with respect to such excluded special servicer loan unless such excluded special servicer loan is also an excluded loan. Otherwise, upon resignation of the Special Servicer with respect to an excluded special servicer loan, the resigning Special Servicer will be required to use commercially reasonable efforts to appoint the excluded special servicer. |
| Appraisal Remedy: | If the Class of Certificates comprising the Controlling Class loses its status as Controlling Class because of the application of an Appraisal Reduction Amount or Collateral Deficiency Amount, the holders of a majority of the voting rights of such Class may require the Special Servicer to order a second appraisal for any mortgage loan in respect of which an Appraisal Reduction Amount or Collateral Deficiency Amount has been applied. The Special Servicer must thereafter determine whether, based on its assessment of such second appraisal, any recalculation of the Appraisal Reduction Amount or Collateral Deficiency Amount is warranted and, if so warranted, will recalculate such Appraisal Reduction Amount or Collateral Deficiency Amount. Such Class will not be able to exercise any direction, control, consent and/or similar rights of the Controlling Class unless and until reinstated as the Controlling Class through such determination; and pending such determination, the rights of the Controlling Class will be exercised by the Control Eligible Certificates, if any, that would be the Controlling Class taking into account the subject appraisal reduction amount. |
| Sale of Defaulted Assets: | There will be no “fair value” purchase option. Instead, the WFCM 2024-5C1 pooling and servicing agreement will authorize the Special Servicer to sell defaulted mortgage loans serviced by such Special Servicer to the highest bidder in a manner generally similar to sales of REO properties. The sale of a defaulted loan (other than a non-serviced whole loan) for less than par plus accrued interest and certain other fees and expenses owed on the loan will be subject to consent or consultation rights of the directing certificateholder, Operating Advisor and/or Risk Retention Consultation Party, as described in the Preliminary Prospectus. Generally speaking, the holder of a pari passu companion loan will have consent and/or consultation rights, as described in the Preliminary Prospectus. With respect to any serviced whole loan, if such whole loan becomes a defaulted loan under the WFCM 2024-5C1 pooling and servicing agreement, the Special Servicer will generally be required to sell both the mortgage loan and the related pari passu companion loan(s) as a single whole loan. With respect to each non-serviced whole loan, the applicable servicing agreement governing the servicing of such whole loan generally provides (or is expected to provide) that, if the related pari passu companion loan(s) serviced under such agreement become a defaulted loan under such servicing agreement, then the related special servicer may offer to sell to any person (or may offer to purchase) for cash such whole loan during such time as such applicable pari passu companion loan(s) constitutes a defaulted loan under such servicing agreement. Generally speaking, in connection with any such sale, the related special servicer is required to sell both the mortgage loan and the related pari passu companion loan(s) (and, in some cases, any related subordinate companion loan) as a whole loan. The directing certificateholder for this securitization |
| THE INFORMATION IN THIS STRUCTURAL AND COLLATERAL TERM SHEET IS NOT COMPLETE AND MAY BE AMENDED PRIOR TO THE TIME OF SALE. THIS TERM SHEET IS NOT AN OFFER TO SELL THESE SECURITIES AND IT IS NOT A SOLICITATION OF AN OFFER TO BUY THESE SECURITIES IN ANY JURISDICTION WHERE THE OFFER OR SALE IS NOT PERMITTED. | ||
| 23 | ||
| Wells Fargo Commercial Mortgage Trust 2024-5C1 | Certain Terms and Conditions |
generally will have consultation rights as the holder of an interest in the related mortgage loan, as described in the Preliminary Prospectus. The procedures for the sale of any whole loan that becomes a defaulted whole loan, and any associated consultation rights, are subject to various limitations, conditions and exceptions as described in the Preliminary Prospectus. | |
| “As-Is” Appraisals: | Appraisals must be conducted on an “as-is” basis, and must be no more than 12 months old, for purposes of determining Appraisal Reduction Amounts and market value in connection with REO sales. Required appraisals may consist of updates of prior appraisals. Internal valuations by the Special Servicer are permitted if the principal balance of a mortgage loan is less than $2,000,000. |
| Operating Advisor: | The Operating Advisor will have certain review and consultation rights relating to the performance of the Special Servicer and with respect to its actions taken in connection with the resolution and/or liquidation of Specially Serviced Loans. With respect to each mortgage loan (other than a Non-Serviced Mortgage Loan) or serviced whole loan, the Operating Advisor will be responsible for: ● reviewing the actions of the Special Servicer with respect to any Specially Serviced Loan; ● reviewing (i) all reports by the Special Servicer made available to Privileged Persons on the Certificate Administrator’s website that are relevant to the Operating Advisor’s obligations under the pooling and servicing agreement and (ii) each Asset Status Report (as defined in the Preliminary Prospectus) (after the occurrence and during the continuance of an Operating Advisor Consultation Event (as defined below)) and Final Asset Status Report (as defined in the Preliminary Prospectus); ● reviewing for accuracy and consistency with the WFCM 2024-5C1 pooling and servicing agreement the mathematical calculations by the special servicer and the corresponding application of the non-discretionary portion of the applicable formulas required to be utilized in connection with Appraisal Reduction Amounts, Collateral Deficiency Amounts and net present value calculations used in the Special Servicer’s determination of what course of action to take in connection with the workout or liquidation of a Specially Serviced Loan; and ● preparing an annual report (if any mortgage loan (other than any Non-Serviced Mortgage Loan) or serviced whole loan was a Specially Serviced Loan at any time during the prior calendar year or an Operating Advisor Consultation Event (as defined below) occurred during the prior calendar year) that sets forth whether the Operating Advisor believes, in its sole discretion exercised in good faith, that the Special Servicer is operating in compliance with the Servicing Standard with respect to its performance of its duties under the pooling and servicing agreement with respect to Specially Serviced Loans (and, after the occurrence and during the continuance of an Operating Advisor Consultation Event (as defined below), with respect to major decisions on non-Specially Serviced Loans) during the prior calendar year on an “asset-level basis”. The Operating Advisor will identify (1) which, if any, standards the Operating Advisor believes, in its sole discretion exercised in good faith, the Special Servicer has failed to comply with and (2) any material deviations from the Special Servicer’s obligations under the pooling and servicing agreement with respect to the resolution or liquidation of any Specially Serviced Loan or REO Property (other than with respect to any REO Property related to any Non-Serviced Mortgage Loan). In preparing any Operating Advisor Annual Report (as defined in the Preliminary Prospectus), the Operating Advisor will not be required to report on instances of non-compliance with, or deviations from, the Servicing Standard or the Special Servicer’s obligations under the pooling and servicing agreement that the Operating Advisor determines, in its sole discretion exercised in good faith, to be immaterial. With respect to each mortgage loan (other than any Non-Serviced Mortgage Loan) or serviced whole loan, after the Operating Advisor has received notice that an Operating Advisor Consultation Event (as defined below) has occurred and is continuing, in addition to the duties described above, the Operating Advisor will be required to perform the following additional duties: ● to consult (on a non-binding basis) with the Special Servicer in respect of asset status reports and ● to consult (on a non-binding basis) with the Special Servicer with respect to “major decisions” processed by the Special Servicer. |
| THE INFORMATION IN THIS STRUCTURAL AND COLLATERAL TERM SHEET IS NOT COMPLETE AND MAY BE AMENDED PRIOR TO THE TIME OF SALE. THIS TERM SHEET IS NOT AN OFFER TO SELL THESE SECURITIES AND IT IS NOT A SOLICITATION OF AN OFFER TO BUY THESE SECURITIES IN ANY JURISDICTION WHERE THE OFFER OR SALE IS NOT PERMITTED. | ||
| 24 | ||
| Wells Fargo Commercial Mortgage Trust 2024-5C1 | Certain Terms and Conditions |
An “Operating Advisor Consultation Event” will occur when the Certificate Balance of the Class G-RR and Class J-RR Certificates in the aggregate (taking into account the application of any Cumulative Appraisal Reduction Amounts to notionally reduce the Certificate Balances of such Classes) is 25% or less of the initial Certificate Balances of such Classes in the aggregate. | |
| Asset Representations Reviewer: | The Asset Representations Reviewer will be required to review certain delinquent mortgage loans after a specified delinquency threshold has been exceeded (an “Asset Review Trigger”) and the required percentage of certificateholders vote to direct a review of such delinquent loans. An Asset Review Trigger will occur when either (1) mortgage loans with an aggregate outstanding principal balance of 25.0% or more of the aggregate outstanding principal balance of all of the mortgage loans (including any REO loans (or a portion of any REO loan in the case of a whole loan)) held by the issuing entity as of the end of the applicable collection period are delinquent loans or (2) at least 15 mortgage loans are delinquent loans as of the end of the applicable collection period and the outstanding principal balance of such delinquent loans in the aggregate constitutes at least 20.0% of the aggregate outstanding principal balance of all of the mortgage loans (including any REO loans (or a portion of any REO loan in the case of a whole loan)) held by the issuing entity as of the end of the applicable collection period. See “Pooling and Servicing Agreement—The Asset Representations Reviewer—Asset Review” in the Preliminary Prospectus. The Asset Representations Reviewer may be terminated and replaced without cause. Upon (i) the written direction of certificateholders evidencing not less than 25% of the voting rights (without regard to the application of any Cumulative Appraisal Reduction Amounts) requesting a vote to terminate and replace the Asset Representations Reviewer with a proposed successor Asset Representations Reviewer that is an eligible asset representations reviewer, and (ii) payment by such holders to the certificate administrator of the reasonable fees and expenses to be incurred by the certificate administrator in connection with administering such vote, the certificate administrator will promptly provide notice to all certificateholders and the Asset Representations Reviewer of such request by posting such notice on its internet website, and by mailing such notice to all certificateholders and the Asset Representations Reviewer. Upon the written direction of certificateholders evidencing at least 75% of a certificateholder quorum (without regard to the application of any Cumulative Appraisal Reduction Amounts), the Trustee will terminate all of the rights and obligations of the Asset Representations Reviewer under the WFCM 2024-5C1 pooling and servicing agreement by written notice to the Asset Representations Reviewer, and the proposed successor Asset Representations Reviewer will be appointed. See “Pooling and Servicing Agreement—The Asset Representations Reviewer” in the Preliminary Prospectus. |
| Dispute Resolution Provisions: | The mortgage loan sellers will be subject to the dispute resolution provisions set forth in the WFCM 2024-5C1 pooling and servicing agreement to the extent those provisions are triggered with respect to any mortgage loan sold to the depositor by a mortgage loan seller and such mortgage loan seller will be obligated under the related mortgage loan purchase agreement to comply with all applicable provisions and to take part in any mediation or arbitration proceedings that may result. Generally, in the event that a Repurchase Request (as defined in the Preliminary Prospectus) is not “Resolved” (as defined below) within 180 days after the related mortgage loan seller receives such Repurchase Request, then the enforcing servicer will be required to send a notice to the “Initial Requesting Certificateholder” (if any) and the Certificate Administrator indicating the enforcing servicer’s intended course of action with respect to the Repurchase Request. If (a) the enforcing servicer’s intended course of action with respect to the Repurchase Request does not involve pursuing further action to exercise rights against the related mortgage loan seller with respect to the Repurchase Request and the Initial Requesting Certificateholder, if any, or any other certificateholder or certificate owner wishes to exercise its right to refer the matter to mediation (including non-binding arbitration) or arbitration, or (b) the enforcing servicer’s intended course of action is to pursue further action to exercise rights against the related mortgage loan seller with respect to the Repurchase Request but the Initial Requesting Certificateholder, if any, or any other certificateholder or certificate owner does not agree with the dispute resolution method selected by the enforcing servicer, then the Initial Requesting Certificateholder, if any, or such other certificateholder or certificate owner may deliver a written notice to the Special Servicer indicating its intent to exercise its right to refer the matter to either mediation or arbitration. “Resolved” means, with respect to a Repurchase Request, (i) that the related Material Defect has been cured, (ii) the related mortgage loan has been repurchased in accordance with the related mortgage loan purchase agreement, (iii) a mortgage loan has been substituted for the related mortgage loan in accordance with the related mortgage loan purchase agreement, (iv) the applicable mortgage loan seller has made a Loss of Value Payment (as defined in the Preliminary Prospectus), (v) a contractually binding agreement is entered into between the enforcing servicer, on behalf of the issuing entity, and the related mortgage loan seller that settles the |
| THE INFORMATION IN THIS STRUCTURAL AND COLLATERAL TERM SHEET IS NOT COMPLETE AND MAY BE AMENDED PRIOR TO THE TIME OF SALE. THIS TERM SHEET IS NOT AN OFFER TO SELL THESE SECURITIES AND IT IS NOT A SOLICITATION OF AN OFFER TO BUY THESE SECURITIES IN ANY JURISDICTION WHERE THE OFFER OR SALE IS NOT PERMITTED. | ||
| 25 | ||
| Wells Fargo Commercial Mortgage Trust 2024-5C1 | Certain Terms and Conditions |
related mortgage loan seller’s obligations under the related mortgage loan purchase agreement or (vi) the related mortgage loan is no longer property of the issuing entity as a result of a sale or other disposition in accordance with the WFCM 2024-5C1 pooling and servicing agreement. See “Pooling and Servicing Agreement—Dispute Resolution Provisions” in the Preliminary Prospectus. | |
| Investor Communications: | The certificate administrator is required to include on any Form 10–D any request received from a certificateholder to communicate with other certificateholders related to certificateholders exercising their rights under the terms of the WFCM 2024-5C1 pooling and servicing agreement. Any certificateholder wishing to communicate with other certificateholders regarding the exercise of its rights under the terms of the WFCM 2024-5C1 pooling and servicing agreement will be able to deliver a written request signed by an authorized representative of the requesting investor to the certificate administrator. |
| Certain Fee Offsets: | If a workout fee is earned by the Special Servicer following a loan default with respect to any mortgage loan that it services, then certain limitations will apply based on modification fees paid by the borrower. The modification fee generally must not exceed 1% of the principal balance of the loan as modified in any 12-month period. In addition, if the loan re-defaults, any subsequent workout fee on that loan must be reduced by a portion of the modification fees paid by the borrower in the previous 12-months. Likewise, liquidation fees collected in connection with a liquidation or partial liquidation of a mortgage loan must be reduced by a portion of the modification fees paid by the borrower in the previous 12 months. |
| Deal Website: | The Certificate Administrator will be required to maintain a deal website, which will include, among other items: (a) summaries of asset status reports prepared by the Special Servicer, (b) inspection reports, (c) appraisals, (d) various “special notices” described in the Preliminary Prospectus, (e) the “Investor Q&A Forum”, (f) a voluntary “Investor Registry” and (g) the “Risk Retention Special Notices” tab. Investors may access the deal website following execution of a certification and confidentiality agreement. |
| Initial Majority Controlling Class Certificateholder: | It is expected that Argentic Securities Holdings 2 Cayman Limited, an affiliate of Argentic Real Estate Finance 2 LLC and Argentic Services Company LP or an affiliate will be the initial majority controlling class certificateholder. |
| Whole Loans: | Each of the mortgaged properties identified above under “IV. Characteristics of the Mortgage Pool—B. Summary of the Whole Loans” secures both a mortgage loan to be included in the trust fund and one or more other mortgage loans that will not be included in the trust fund, each of which will be pari passu or subordinate in right of payment with the mortgage loan included in the trust fund. We refer to each such group of mortgage loans as a “whole loan”. Such “—Summary of the Whole Loans” section includes further information regarding the various notes in each whole loan, the holders of such notes, the lead servicing agreement for each such whole loan, and the master servicer and special servicer under such lead servicing agreement. |
| THE INFORMATION IN THIS STRUCTURAL AND COLLATERAL TERM SHEET IS NOT COMPLETE AND MAY BE AMENDED PRIOR TO THE TIME OF SALE. THIS TERM SHEET IS NOT AN OFFER TO SELL THESE SECURITIES AND IT IS NOT A SOLICITATION OF AN OFFER TO BUY THESE SECURITIES IN ANY JURISDICTION WHERE THE OFFER OR SALE IS NOT PERMITTED. | ||
| 26 | ||
| Office - Suburban | Loan #1 | Cut-off Date Balance: | $73,000,000 | |
| 9950 Woodloch Forest Drive | 9950 Woodloch | Cut-off Date LTV: | 56.2% | |
| The Woodlands, TX 77380 | U/W NCF DSCR: | 1.50x | ||
| U/W NOI Debt Yield: | 13.1% |

| THE INFORMATION IN THIS STRUCTURAL AND COLLATERAL TERM SHEET IS NOT COMPLETE AND MAY BE AMENDED PRIOR TO THE TIME OF SALE. THIS TERM SHEET IS NOT AN OFFER TO SELL THESE SECURITIES AND IT IS NOT A SOLICITATION OF AN OFFER TO BUY THESE SECURITIES IN ANY JURISDICTION WHERE THE OFFER OR SALE IS NOT PERMITTED. | ||
| 27 | ||
| Office - Suburban | Loan #1 | Cut-off Date Balance: | $73,000,000 | |
| 9950 Woodloch Forest Drive | 9950 Woodloch | Cut-off Date LTV: | 56.2% | |
| The Woodlands, TX 77380 | U/W NCF DSCR: | 1.50x | ||
| U/W NOI Debt Yield: | 13.1% |
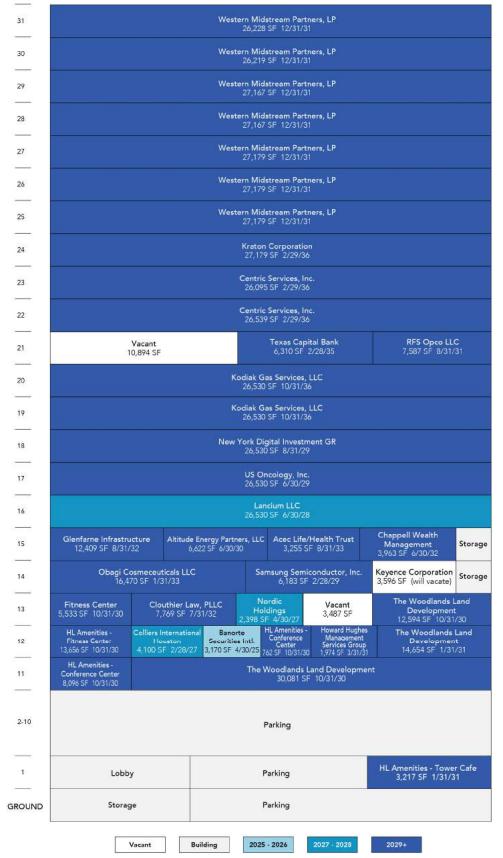
| THE INFORMATION IN THIS STRUCTURAL AND COLLATERAL TERM SHEET IS NOT COMPLETE AND MAY BE AMENDED PRIOR TO THE TIME OF SALE. THIS TERM SHEET IS NOT AN OFFER TO SELL THESE SECURITIES AND IT IS NOT A SOLICITATION OF AN OFFER TO BUY THESE SECURITIES IN ANY JURISDICTION WHERE THE OFFER OR SALE IS NOT PERMITTED. | ||
| 28 | ||
| Office - Suburban | Loan #1 | Cut-off Date Balance: | $73,000,000 | |
| 9950 Woodloch Forest Drive | 9950 Woodloch | Cut-off Date LTV: | 56.2% | |
| The Woodlands, TX 77380 | U/W NCF DSCR: | 1.50x | ||
| U/W NOI Debt Yield: | 13.1% |
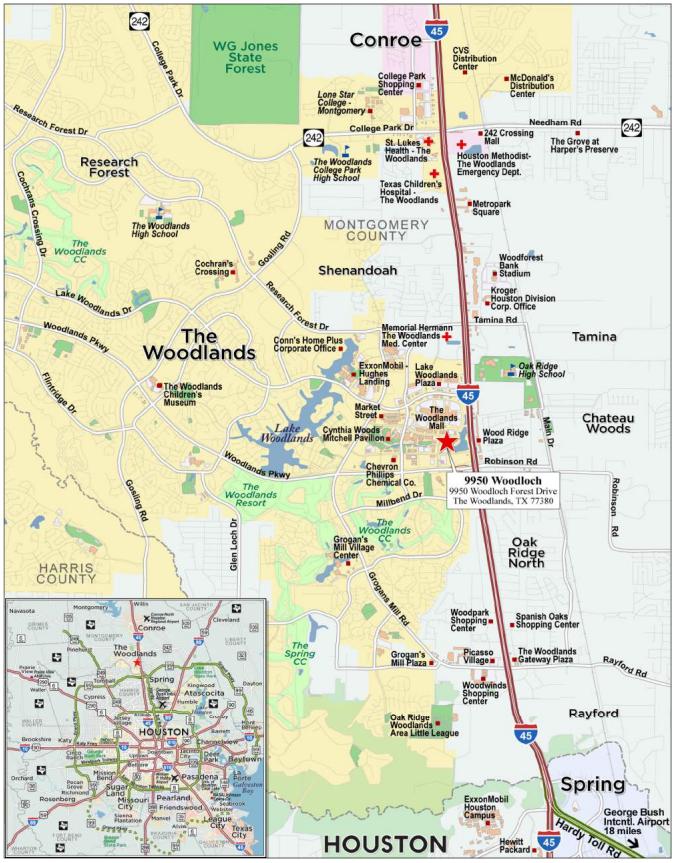
| THE INFORMATION IN THIS STRUCTURAL AND COLLATERAL TERM SHEET IS NOT COMPLETE AND MAY BE AMENDED PRIOR TO THE TIME OF SALE. THIS TERM SHEET IS NOT AN OFFER TO SELL THESE SECURITIES AND IT IS NOT A SOLICITATION OF AN OFFER TO BUY THESE SECURITIES IN ANY JURISDICTION WHERE THE OFFER OR SALE IS NOT PERMITTED. | ||
| 29 | ||
| No. 1 – 9950 Woodloch |
| Mortgage Loan Information | Mortgaged Property Information | ||||||
| Mortgage Loan Seller: | Wells Fargo Bank, National Association / Argentic Real Estate Finance 2 LLC | Single Asset/Portfolio: | Single Asset | ||||
Credit Assessment (Fitch/KBRA/S&P): | NR/NR/NR | Property Type – Subtype: | Office – Suburban | ||||
| Original Principal Balance(1): | $73,000,000 | Location: | The Woodlands, TX | ||||
| Cut-off Date Balance(1): | $73,000,000 | Size: | 601,151 SF | ||||
| % of Initial Pool Balance: | 9.97% | Cut-off Date Balance Per SF(1): | $216.25 | ||||
| Loan Purpose: | Refinance | Maturity Date Balance Per SF(1): | $205.26 | ||||
| Borrower Sponsor: | The Woodlands Land Development Company, L.P. | Year Built/Renovated: | 2014/NAP | ||||
| Guarantor: | The Woodlands Land Development Company, L.P. | Title Vesting: | Fee | ||||
| Mortgage Rate: | 7.0750% | Property Manager: | Howard Hughes Management Services Company, LLC (borrower-related) | ||||
| Note Date: | June 12, 2024 | Current Occupancy (As of): | 97.0% (6/3/2024) | ||||
| Seasoning: | 0 months | YE 2023 Occupancy: | 91.8% | ||||
| Maturity Date: | July 11, 2029 | YE 2022 Occupancy: | 57.7% | ||||
| IO Period: | NAP | YE 2021 Occupancy: | 44.0% | ||||
| Loan Term (Original): | 60 months | YE 2020 Occupancy: | 29.1% | ||||
| Amortization Term (Original): | 360 months | As-Is Appraised Value: | $231,500,000 | ||||
| Loan Amortization Type: | Amortizing Balloon | As-Is Appraised Value Per SF: | $385.09 | ||||
| Call Protection(2): | L(24),D(29),O(7) | As-Is Appraisal Valuation Date: | May 9, 2024 | ||||
| Lockbox Type(3): | Hard/Springing Cash Management | Underwriting and Financial Information | |||||
| Additional Debt(1): | Yes | TTM (3/31/2024) NOI(5): | $6,556,466 | ||||
| Additional Debt Type (Balance)(1): | Pari Passu ($57,000,000) | YE 2023 NOI(5): | $5,438,113 | ||||
| YE 2022 NOI(5): | $1,337,359 | ||||||
| YE 2021 NOI(5): | $(5,256,469) | ||||||
| Escrows and Reserves(4) | U/W Revenues: | $29,009,847 | |||||
| Initial | Monthly | Cap | U/W Expenses: | $12,018,882 | |||
| Taxes: | $1,309,164 | $218,194 | NAP | U/W NOI: | $16,990,965 | ||
| Insurance: | $0 | Springing | NAP | U/W NCF: | $15,668,433 | ||
| Replacement Reserve: | $0 | $10,019 | $360,684 | U/W DSCR based on NOI/NCF(1): | 1.62x / 1.50x | ||
| TI/LC Reserve: | $0 | $100,192 | NAP | U/W Debt Yield based on NOI/NCF(1): | 13.1% / 12.1% | ||
| Existing TI/LC Reserve: | $8,840,609 | $0 | NAP | U/W Debt Yield at Maturity based on NOI/NCF(1): | 13.8% / 12.7% | ||
| Rent Concession Reserve: | $4,020,411 | $0 | NAP | Cut-off Date LTV Ratio(1): | 56.2% | ||
| LTV Ratio at Maturity(1): | 53.3% | ||||||
| Sources and Uses | |||||||||
| Sources | Uses | ||||||||
| Original Mortgage Loan amount | $130,000,000 | 95.0 | % | Loan Payoff | $120,907,122 | 88.3% | |||
| Sponsor Equity | 6,865,528 | 5.0 | Upfront Reserves | 14,170,184 | 10.4 | ||||
| Closing Costs | 1,788,222 | 1.3 | |||||||
| Total Sources | $136,865,528 | 100.0 | % | Total Uses | $136,865,528 | 100.0% | |||
| (1) | The 9950 Woodloch Mortgage Loan (as defined below) is part of the 9950 Woodloch Whole Loan (as defined below), which is evidenced by four pari passu promissory notes with an aggregate principal balance of $130,000,000. The Cut-off Date Balance Per SF, Maturity Date Balance Per SF, U/W Debt Yield based on NOI/NCF, U/W Debt Yield at Maturity based on NOI/NCF, U/W DSCR based on NOI/NCF, Cut-off Date LTV Ratio and LTV Ratio at Maturity numbers presented above are based on the aggregate principal balance of the promissory notes comprising the 9950 Woodloch Whole Loan. |
| (2) | The lockout period will be at least 24 payment dates beginning with and including the first payment date on August 11, 2024. Defeasance of the 9950 Woodloch Whole Loan in full is permitted at any time after the earlier to occur of (i) the date that is two years from the closing date of the securitization that includes the last pari passu note of the 9950 Woodloch Whole Loan to be securitized and (ii) August 11, 2027. The assumed lockout period of 24 payment dates is based on the expected WFCM 2024-5C1 securitization closing date in July 2024. The actual lockout period may be longer. |
| (3) | Sponsor-affiliated tenants do not pay monthly into the deposit account until there is a Cash Trap Event Period (as defined below) (see “Lockbox and Cash Management” section). |
| (4) | See “Escrows” section. |
| (5) | The 9950 Woodloch Property was acquired vacant by the borrower sponsor in December 2019 after the single tenant at the time vacated. The increase in NOI from 2021 to TTM (3/31/2024) is due to the lease up of the building to 97.0% as of 6/3/2024 (see “Operating History and Underwritten Net Cash Flow”). |
| THE INFORMATION IN THIS STRUCTURAL AND COLLATERAL TERM SHEET IS NOT COMPLETE AND MAY BE AMENDED PRIOR TO THE TIME OF SALE. THIS TERM SHEET IS NOT AN OFFER TO SELL THESE SECURITIES AND IT IS NOT A SOLICITATION OF AN OFFER TO BUY THESE SECURITIES IN ANY JURISDICTION WHERE THE OFFER OR SALE IS NOT PERMITTED. | ||
| 30 | ||
| Office - Suburban | Loan #1 | Cut-off Date Balance: | $73,000,000 | |
| 9950 Woodloch Forest Drive | 9950 Woodloch | Cut-off Date LTV: | 56.2% | |
| The Woodlands, TX 77380 | U/W NCF DSCR: | 1.50x | ||
| U/W NOI Debt Yield: | 13.1% |
The Mortgage Loan. The largest mortgage loan (the “9950 Woodloch Mortgage Loan”) is part of a whole loan (the “9950 Woodloch Whole Loan”) that is evidenced by four pari passu promissory notes in the aggregate original principal amount of $130,000,000 and secured by the first priority fee interest encumbering a multi-tenant office property totaling 601,151 square feet located in The Woodlands, Texas (the “9950 Woodloch Property”). The 9950 Woodloch Whole Loan was co-originated by Wells Fargo Bank, National Association (“WFB”) and Argentic Real Estate Finance 2 LLC (“AREF2”). The 9950 Woodloch Mortgage Loan is evidenced by the controlling Note A-1 and non-controlling Note A-2, with an aggregate principal balance of $73,000,000, and will be serviced under the pooling and servicing agreement for the WFCM 2024-5C1 securitization trust. See “Description of the Mortgage Pool—The Whole Loans—The Serviced Pari Passu Whole Loans” and “Pooling and Servicing Agreement” in the Preliminary Prospectus.
| 9950 Woodloch Whole Loan Summary | ||||
| Note | Original Balance | Cut-off Date Balance | Note Holder | Controlling Note |
| A-1 | $47,450,000 | $47,450,000 | WFCM 2024-5C1 | Yes |
| A-2 | $25,550,000 | $25,550,000 | WFCM 2024-5C1 | No |
| A-3(1) | $37,050,000 | $37,050,000 | WFB | No |
| A-4(1) | $19,950,000 | $19,950,000 | AREF2 | No |
| Total | $130,000,000 | $130,000,000 | ||
| (1) | The notes held by the lenders are expected to be contributed to one or more future securitization transactions or may otherwise be transferred at any time. |
The Borrower and Borrower Sponsor. The borrower is HH Hackett Tower Holdings, LLC, a Delaware limited liability company, which is a single purpose entity with two independent directors. Legal counsel to the borrower delivered a non-consolidation opinion in connection with the origination of the 9950 Woodloch Whole Loan. The borrower sponsor and nonrecourse carveout guarantor is The Woodlands Land Development Company, L.P., an entity owned by the Howard Hughes Corporation.
Founded in 2010, the Howard Hughes Corporation owns, manages, and develops commercial, residential and mixed-use real estate throughout the United States. The company’s holdings include a portfolio of master planned communities including Seaport in New York City, Downtown Columbia, Maryland, The Woodlands and Bridgeland in greater Houston, Texas, Summerlin, Las Vegas, Ward Village, Honolulu, Hawai’i, and Douglas Ranch in Phoenix, Arizona.
The Property. The 9950 Woodloch Property consists of a 31-story, 601,151 square foot, Class A, LEED Silver, office building, located in The Woodlands, Texas. Built in 2014 and situated on a 2.25-acre site, the 9950 Woodloch Property includes a rooftop terrace, fitness center with locker rooms and an indoor basketball/pickleball court. The 9950 Woodloch Property has access to a 10-story parking garage podium via a shared garage use agreement with the adjacent office tower (same sponsorship). The 9950 Woodloch Property is allocated 1,803 spaces, resulting in a parking ratio of three spaces per 1,000 square feet. As of June 3, 2024, the 9950 Woodloch Property is 97.0% occupied by 24 tenants.
Major Tenants.
Largest Tenant by UW Base Rent: Western Midstream Partners, LP. (BBB-/Baa3/BBB-: F/M/S&P; 188,318 square feet; 31.3% of net rentable area; 33.3% of underwritten base rent; 12/31/2031 lease expiration) – Western Midstream Partners, LP. (“Western Midstream”) is in the business of gathering, compressing, treating, processing, and transporting natural gas; and gathering and disposing of produced water for its customers. Western Midstream also buys and sells natural gas, natural gas liquids, and condensate on its behalf and its customers under certain gas processing contracts. Western Midstream is publicly traded on the NYSE with a market capitalization of $14.9 billion (as of June 21, 2024). Western Midstream is headquartered at the 9950 Woodloch Property and took initial occupancy in December 2020 but subsequently expanded into an additional 81,537 square feet from 2023 to 2024. Western Midstream has one, ten-year or two, five-year renewal options. The tenant has the option to terminate its lease effective 11/30/2028 with 12 months’ notice and the payment of a termination fee.
2nd Largest Tenant by UW Base Rent: The Woodlands Land Development. (BB/NR/B: F/M/S&P; 57,329 square feet; 9.5% of net rentable area; 10.2% of underwritten base rent; 1/31/2031 and 10/31/2031 lease expirations) – The Woodlands Land Development is an affiliate of the borrower and a subsidiary of Howard Hughes Corporation. Howard Hughes Corporation is headquartered at the 9950 Woodloch Property and is a real estate development and management company formed in 2010. Howard Hughes Corporation is publicly traded on the NYSE (HHH) with a market capitalization of $3.2 billion (as of June 21, 2024). The tenant does not have any termination or extension options.
3rd Largest Tenant by UW Base Rent: Kodiak Gas Services, LLC. (BB/B2/B+: F/M/S&P; 53,060 square feet; 8.8% of net rentable area; 9.0% of underwritten base rent; 10/31/2036 lease expiration) – Kodiak Gas Services, LLC. (“Kodiak”) is a provider of natural gas contract compression services in the United States, bringing efficiency and reliability to all the major basins. As a developer of gas compression technology, Kodiak offers customers an array of turnkey and operations services. Kodiak is publicly traded on the NYSE (KGS) with a market capitalization of $2.2 billion (as of June 21, 2024). Kodiak has one, ten-year renewal option and no termination options.
| THE INFORMATION IN THIS STRUCTURAL AND COLLATERAL TERM SHEET IS NOT COMPLETE AND MAY BE AMENDED PRIOR TO THE TIME OF SALE. THIS TERM SHEET IS NOT AN OFFER TO SELL THESE SECURITIES AND IT IS NOT A SOLICITATION OF AN OFFER TO BUY THESE SECURITIES IN ANY JURISDICTION WHERE THE OFFER OR SALE IS NOT PERMITTED. | ||
| 31 | ||
| Office - Suburban | Loan #1 | Cut-off Date Balance: | $73,000,000 | |
| 9950 Woodloch Forest Drive | 9950 Woodloch | Cut-off Date LTV: | 56.2% | |
| The Woodlands, TX 77380 | U/W NCF DSCR: | 1.50x | ||
| U/W NOI Debt Yield: | 13.1% |
The following table presents certain information relating to the tenancy at the 9950 Woodloch Property:
Major Tenants
| Tenant Name | Credit Rating (Fitch/ Moody’s/ | Tenant NRSF | % of NRSF | Annual U/W Base Rent PSF(2) | Annual U/W Base Rent(2) | % of Total Annual U/W Base Rent | Lease Expiration Date | Ext. Options | Term. Option (Y/N) |
| Major Tenants | |||||||||
| Western Midstream Partners, LP | BBB-/Baa3/BBB- | 188,318 | 31.3% | $32.28 | $6,079,258 | 33.3% | 12/31/2031 | 1, 10-year(3) | Y(3) |
| The Woodlands Land Development(4) | BB/NR/B | 57,329 | 9.5% | $32.47 | $1,861,473 | 10.2% | Various(5) | N | N |
| Kodiak Gas Services, LLC | BB/B2/B+ | 53,060 | 8.8% | $31.00 | $1,644,860 | 9.0% | 10/31/2036 | 1, 10-year | N |
| Centric Services, Inc. | NR/NR/NR | 52,634 | 8.8% | $30.96 | $1,629,549 | 8.9% | 2/29/2036 | 2, 5-year | Y(6) |
| Lancium LLC | NR/NR/NR | 26,530 | 4.4% | $32.04 | $850,021 | 4.7% | 6/30/2028 | N | N |
| 377,871 | 62.9% | $31.93 | $12,065,160 | 66.0% | |||||
| Non-Major Tenants(7)(8) | 205,258 | 34.1% | $30.25 | $6,209,109 | 34.0% | ||||
| Occupied Collateral Total | 583,129 | 97.0% | $31.34 | $18,274,269 | 100.0% | ||||
| Vacant Space | 18,022 | 3.0% | |||||||
| Collateral Total | 601,151 | 100.0% | |||||||
| (1) | Ratings are those of the parent company, whether or not the parent guarantees the lease. |
| (2) | The Annual U/W Base Rent and Annual U/W Base Rent PSF shown above include straight-line rent averaging for certain investment grade tenants through lease maturity totaling $537,710 and contractual rent steps through May 2025 totaling $472,016. |
| (3) | Western Midstream has two, 5-year or one, 10-year extension option. Western Midstream has the right to terminate its lease effective 11/30/2028 with 12 months’ notice and payment of a termination fee in an amount equal to (i) three times the then-current monthly rent, plus (ii) the unamortized costs of the tenant improvement and construction allowances, all broker commissions, rental abatement, and reasonable attorneys’ fees, amortized at a discount factor of 8% per year over the initial term. |
| (4) | The Woodlands Land Development is an affiliate of the borrower. |
| (5) | The Woodlands Land Development has various lease expirations dates including 42,675 SF (7.1% of NRA) on 10/31/2030 and 14,654 SF (2.4% of NRA) on 1/31/2031. |
| (6) | Centric Services, Inc. has the right to terminate its lease effective 2/28/2033 with 12 months notice and by paying a termination fee. |
| (7) | Non-Major Tenants include 11,545 SF (1.9% of NRA) of Unleasable/Storage space with no underwritten income attributable to the space. |
| (8) | Non-Major Tenants include two borrower affiliated tenants totaling 33,238 SF (5.5% of NRA) with various lease expirations of 10/31/2030, 1/31/2031 and 3/31/2031. |
The following table presents certain information relating to the lease rollover schedule at the 9950 Woodloch Property:
Lease Expiration Schedule(1)
| Year Ending December 31, | No. of Leases Expiring | Expiring NRSF | % of Total NRSF | Cumulative Expiring NRSF | Cumulative % of Total NRSF | Annual U/W Base Rent(2) | % of Total Annual U/W Base Rent | Annual U/W Base Rent PSF(2) |
| MTM | 1 | 11,545(3) | 1.9% | 11,545 | 1.9% | $0 | 0.0% | $0.00 |
| 2024 | 0 | 0 | 0.0% | 11,545 | 1.9% | $0 | 0.0% | $0.00 |
| 2025 | 1 | 3,170 | 0.5% | 14,715 | 2.4% | $103,247 | 0.6% | $32.57 |
| 2026 | 0 | 0 | 0.0% | 14,715 | 2.4% | $0 | 0.0% | $0.00 |
| 2027 | 2 | 6,498 | 1.1% | 21,213 | 3.5% | $202,877 | 1.1% | $31.22 |
| 2028 | 1 | 26,530 | 4.4% | 47,743 | 7.9% | $850,021 | 4.7% | $32.04 |
| 2029 | 3 | 59,243 | 9.9% | 106,986 | 17.8% | $1,871,570 | 10.2% | $31.59 |
| 2030 | 4 | 77,344 | 12.9% | 184,330 | 30.7% | $2,495,599 | 13.7% | $32.27 |
| 2031 | 5 | 215,750 | 35.9% | 400,080 | 66.6% | $6,992,963 | 38.3% | $32.41 |
| 2032 | 3 | 24,141 | 4.0% | 424,221 | 70.6% | $771,499 | 4.2% | $31.96 |
| 2033 | 2 | 19,725 | 3.3% | 443,946 | 73.8% | $624,344 | 3.4% | $31.65 |
| 2034 | 0 | 0 | 0.0% | 443,946 | 73.8% | $0 | 0.0% | $0.00 |
| Thereafter | 4 | 139,183 | 23.2% | 583,129 | 97.0% | $4,362,148 | 23.9% | $31.34 |
| Vacant | 0 | 18,022 | 3.0% | 601,151 | 100.0% | $0 | 0.0% | $0.00 |
| Total/Weighted Average | 26 | 601,151 | 100.0% | $18,274,269 | 100.0% | $31.34 |
| (1) | Information obtained from the underwritten rent roll. |
| (2) | Annual U/W Base Rent and Annual U/W Base Rent PSF does not include vacant space. |
| (3) | 11,545 SF of unleasable/storage space with no underwritten income attributable to the space is classified as MTM. |
| THE INFORMATION IN THIS STRUCTURAL AND COLLATERAL TERM SHEET IS NOT COMPLETE AND MAY BE AMENDED PRIOR TO THE TIME OF SALE. THIS TERM SHEET IS NOT AN OFFER TO SELL THESE SECURITIES AND IT IS NOT A SOLICITATION OF AN OFFER TO BUY THESE SECURITIES IN ANY JURISDICTION WHERE THE OFFER OR SALE IS NOT PERMITTED. | ||
| 32 | ||
| Office - Suburban | Loan #1 | Cut-off Date Balance: | $73,000,000 | |
| 9950 Woodloch Forest Drive | 9950 Woodloch | Cut-off Date LTV: | 56.2% | |
| The Woodlands, TX 77380 | U/W NCF DSCR: | 1.50x | ||
| U/W NOI Debt Yield: | 13.1% |
The following table presents historical occupancy percentages at the 9950 Woodloch Property:
Historical Occupancy
12/31/2020(1) | 12/31/2021(1) | 12/31/2022(1) | 12/31/2023(1) | 06/03/2024(2)(3) |
| 29.1% | 44.0% | 57.7% | 91.8% | 97.0% |
| (1) | Information obtained from the borrowers. |
| (2) | Information obtained from the underwritten rent roll. |
| (3) | The 9950 Woodloch Property was acquired vacant by the borrower sponsor in December 2019 after the single tenant at the time vacated. The increase in NOI from 2021 to TTM (3/31/2024) is due to the lease up of the building to 97.0% as of 6/3/2024 (see “Operating History and Underwritten Net Cash Flow”). |
Operating History and Underwritten Net Cash Flow. The following table presents certain information relating to the historical operating performance and underwritten net cash flow at the 9950 Woodloch Property:
Cash Flow Analysis
| 2021 | 2022 | 2023 | TTM 3/31/2024 | U/W | %(1) | U/W $ per SF(2) | |
| Base Rent | $2,466,503 | $6,358,916 | $10,291,024 | $11,454,621 | $17,968,348(2) | 60.0% | $29.89 |
| Grossed Up Vacant Space | 0 | 0 | 0 | 0 | 945,703 | 3.2 | 1.57 |
| Gross Potential Rent | $2,466,503 | $6,358,916 | $10,291,024 | $11,454,621 | $18,914,050 | 63.1% | $31.46 |
| Other Income | 32,057 | 343,200 | 382,717 | 352,849 | 407,365 | 1.4 | 0.68 |
| Parking/Garage/Other | 3,390 | 105,980 | 131,170 | 141,368 | 623,760 | 2.1 | 1.04 |
| Total Recoveries | 879,158 | 3,522,474 | 5,006,809 | 5,601,766 | 10,010,374 | 33.4 | 16.65 |
| Net Rental Income | $3,381,108 | $10,330,570 | $15,811,720 | $17,550,604 | $29,955,549 | 100.0% | $49.83 |
| (Vacancy & Credit Loss) | 0 | 0 | 0 | 0 | (945,703)(3) | (5.0)(3) | (1.57) |
| Effective Gross Income | $3,381,108 | $10,330,570 | $15,811,720 | $17,550,604 | $29,009,847 | 96.8% | $48.26 |
| Real Estate Taxes | 2,223,030 | 2,015,805 | 2,493,650 | 2,666,349 | 2,493,650 | 8.6 | 4.15 |
| Insurance | 308,537 | 364,678 | 683,732 | 781,313 | 646,941 | 2.2 | 1.08 |
| Management Fee | 117,911 | 156,271 | 355,105 | 371,581 | 870,295 | 3.0 | 1.45 |
| Other Operating Expenses | 5,984,636 | 6,423,382 | 6,771,725 | 7,099,689 | 7,855,693 | 27.1 | 13.07 |
| Other Fixed Expense | 3,463 | 33,075 | 69,395 | 75,206 | 152,302 | 0.5 | 0.25 |
| Total Operating Expenses | $8,637,577 | $8,993,211 | $10,373,607 | $10,994,138 | $12,018,882 | 41.4% | $19.99 |
| Net Operating Income(4) | ($5,256,469) | $1,337,359 | $5,438,113 | $6,556,466 | $16,990,965 | 58.6% | $28.26 |
| Replacement Reserves | 0 | 0 | 0 | 0 | 120,230 | 0.4 | 0.20 |
| TI/LC | 0 | 0 | 0 | 0 | 1,202,302 | 4.1 | 2.00 |
| Net Cash Flow | ($5,256,469) | $1,337,359 | $5,438,113 | $6,556,466 | $15,668,433 | 54.0% | $26.06 |
| NOI DSCR(5) | (0.50)x | 0.13x | 0.52x | 0.63x | 1.62x | ||
| NCF DSCR(5) | (0.50)x | 0.13x | 0.52x | 0.63x | 1.50x | ||
| NOI Debt Yield(5) | (4.0)% | 1.0% | 4.2% | 5.0% | 13.1% | ||
| NCF Debt Yield(5) | (4.0)% | 1.0% | 4.2% | 5.0% | 12.1% |
| (1) | Represents (i) percent of Net Rental Income for all revenue fields, (ii) percent of Gross Potential Rent for Vacancy & Credit Loss and (iii) percent of Effective Gross Income for all other fields. |
| (2) | U/W Base Rent PSF and U/W Base Rent include straight-line rent averaging for certain investment grade tenants through lease maturity totaling $537,710 and contractual rent steps through May 2025 totaling $472,016. |
| (3) | The underwritten economic vacancy is 5.0%. The 9950 Woodloch Property was 97.0% physically occupied as of June, 3 2024. |
| (4) | The 9950 Woodloch Property was acquired was acquired vacant by the borrower sponsor in December 2019 after the single tenant at the time vacated. The increase in NOI from 2021 to TTM (3/31/2024) is due to the lease up of the building to 97.0% as of 6/3/2024. |
| (5) | Figures are based on the 9950 Woodloch Whole Loan debt service and original principal balance. |
Appraisal. The appraiser concluded to an “as-is” Appraised Value for the 9950 Woodloch Property of $231,500,000 as of May 9, 2024.
Environmental Matters. According to the Phase I environmental site assessment dated May 20, 2024, there was no evidence of any recognized environmental conditions at the 9950 Woodloch Property.
Market Overview and Competition. The 9950 Woodloch Property is located in The Woodlands, Texas, approximately 33 miles north of the Houston Central Business District and 24 miles northwest of the George Bush International Airport. The Woodlands is a master planned community with a mix of moderate- to high-end residential and commercial/office/retail uses. The 9950 Woodloch Property is located on the southeast corner of Woodloch Forest Drive and Lake Robbins Drive, the outermost loop around Houston that provides
| THE INFORMATION IN THIS STRUCTURAL AND COLLATERAL TERM SHEET IS NOT COMPLETE AND MAY BE AMENDED PRIOR TO THE TIME OF SALE. THIS TERM SHEET IS NOT AN OFFER TO SELL THESE SECURITIES AND IT IS NOT A SOLICITATION OF AN OFFER TO BUY THESE SECURITIES IN ANY JURISDICTION WHERE THE OFFER OR SALE IS NOT PERMITTED. | ||
| 33 | ||
| Office - Suburban | Loan #1 | Cut-off Date Balance: | $73,000,000 | |
| 9950 Woodloch Forest Drive | 9950 Woodloch | Cut-off Date LTV: | 56.2% | |
| The Woodlands, TX 77380 | U/W NCF DSCR: | 1.50x | ||
| U/W NOI Debt Yield: | 13.1% |
accessibility throughout the area. Additionally, the 9950 Woodloch Property is located 0.4 miles from The Woodlands Mall, a GreenStreet rated A+ mall featuring various dining and entertainment options. Major employers in The Woodlands include corporations such as Exxon Mobil Corp., Wood, Landry's Inc., Shell Oil Co., Fort Bend ISD and Schlumberger Ltd. According to the appraisal, the estimated 2024 population within a one, three and five-mile radius was approximately 7,425, 66,122 and 180,291, respectively and the estimated 2024 average household income within the same radii was approximately $147,624, $127,876, and $138,042, respectively.
According to the appraisal, the 9950 Woodloch Property is situated in The Woodlands Office submarket within the greater Houston Office market. As of the fourth quarter of 2023, the submarket reported a total inventory of approximately 24.9 million square feet with a 13.6% vacancy rate and an average asking rent of $32.63 per square foot, net. The appraiser identified five comparable buildings located within The Woodlands with rents ranging from $34.00 to $38.00 per square foot, net. The appraiser concluded a market rent for the 9950 Woodloch Property of $35.50 per square foot, net.
The following table presents certain information relating to the appraiser’s market rent conclusions for the 9950 Woodloch Property:
Market Rent Summary(1)
| Office | |
| Market Rent (PSF) | $35.50 |
| Lease Term (Years) | 7 |
| Lease Type | NNN |
| Rent Increase Projection | 3.0%/Year |
| TI (New/Renewal) | $60.00 / $30.00 |
| LC (New/Renewal) | 6.0% / 3.0% |
| (1) | Information obtained from the appraisal. |
The table below presents certain information relating to comparable sales pertaining to the 9950 Woodloch Property identified by the appraiser:
Comparable Sales(1)
| Property Name | Location | Year Built/Renovated | Rentable Area (SF) | Sale Date | Sale Price | Sale Price (PSF) |
Three Barton Skyway 1221 South MoPac Expressway | Austin, TX | 2001/NAP | 173,302 | Aug-2023 | $53,300,000 | $308 |
McKinney & Olive 2021 McKinney Avenue | Dallas, TX | 2016/2021 | 536,000 | Dec-2022 | $397,000,000 | $741 |
200 Park Place River Oaks 4200 Westheimer Road | Houston, TX | 2020/NAP | 206,943 | Jul-2022 | $145,000,000 | $701 |
Landmark One 15727 Anthem Parkway | San Antonio, TX | 2017/NAP | 167,618 | Jul-2022 | $73,800,000 | $440 |
Gateway at Legacy 6860 Dallas Parkway | Plano, TX | 2006/2020 | 208,978 | Jan-2022 | $90,500,000 | $433 |
| (1) | Information obtained from the appraisal. |
| THE INFORMATION IN THIS STRUCTURAL AND COLLATERAL TERM SHEET IS NOT COMPLETE AND MAY BE AMENDED PRIOR TO THE TIME OF SALE. THIS TERM SHEET IS NOT AN OFFER TO SELL THESE SECURITIES AND IT IS NOT A SOLICITATION OF AN OFFER TO BUY THESE SECURITIES IN ANY JURISDICTION WHERE THE OFFER OR SALE IS NOT PERMITTED. | ||
| 34 | ||
| Office - Suburban | Loan #1 | Cut-off Date Balance: | $73,000,000 | |
| 9950 Woodloch Forest Drive | 9950 Woodloch | Cut-off Date LTV: | 56.2% | |
| The Woodlands, TX 77380 | U/W NCF DSCR: | 1.50x | ||
| U/W NOI Debt Yield: | 13.1% |
The following table presents certain information relating to the appraiser’s market rent conclusions for the 9950 Woodloch Property:
Comparable Office Leases(1)
| Property Name/Location | Year Built | Total GLA (SF) | Tenant | Tenant Size (SF) | Lease Start Date | Lease Term | Annual Base Rent PSF | Lease Type |
9950 Woodloch (Subject) 9950 Woodloch Forest Drive The Woodlands, TX | 2014 | 601,151 | ||||||
460 Wildwood Forest Drive 460 Wildwood Forest Drive Spring, TX | 2014 | 64,250 | Cisco Systems | 21,574 | Jan-2024 | 1.0 Yrs. | $35.93 |
NNN
|
730 Town & Country Boulevard 730 Town and Country Boulevard Houston, TX | 2023 | 167,141 |
LTIMindTree Limited | 6,542 | Nov-2023 | 7.3 Yrs. | $35.00 | NNN |
609 Main Street 609 Main Street Houston, TX
| 2017 | 1,073,075 | White & Case | 85,908 | Aug-2023 | 5.0 Yrs. | $38.00 | NNN |
730 Town & Country Boulevard 730 Town and Country Boulevard Houston, TX
| 2023 | 167,141 | Group 1 Automotive | 45,330 | May-2023 |
10.4 Yrs.
| $34.00 | NNN |
9753 Katy Freeway 9753 Katy Freeway Houston, TX
| 2023 | 188,553 | Callon Petroleum | 107,171 | Nov-2022 | 11.3 Yrs. | $35.00 | NNN |
| (1) | Information obtained from the appraisal. |
Escrows.
Real Estate Taxes – The 9950 Woodloch Whole Loan documents require an upfront deposit of $1,309,164 and ongoing monthly real estate tax reserves in an amount equal to 1/12th of the real estate taxes that the lender estimates will be payable during the next 12 months, initially estimated at $218,194.
Insurance – The 9950 Woodloch Whole Loan documents do not require ongoing monthly insurance reserves in an amount equal to 1/12 of the insurance premiums that the lender reasonably estimates will be payable during the next ensuing 12 months; provided no event of default is continuing, the borrower maintains insurance coverage for the 9950 Woodloch Property as part of blanket or umbrella coverage reasonably approved by the lender, and provides the lender with evidence of the renewals of the insurance policies and paid receipts for the payment of the insurance premiums no later than 10 business days prior to the expiration dates of the policies.
Replacement Reserve – The 9950 Woodloch Whole Loan documents require an ongoing springing monthly replacement reserve deposit of $10,019, capped at $360,684.
Existing TI/LC – The 9950 Woodloch Whole Loan documents require an upfront deposit of $8,840,609 for existing tenant improvements and leasing commissions.
TI/LC – The 9950 Woodloch Whole Loan documents require an ongoing monthly leasing reserve deposit of $100,192 ($2 per square foot), uncapped.
Rent Concession Reserve – The 9950 Woodloch Whole Loan documents require an upfront deposit of $4,020,411 for outstanding free rent, gap rent, and future rent credits.
Western Midstream Termination Reserve Fund - Upon Western Midstream exercising its termination right, the borrower is required to deposit $3,600,000 with the lender in the form of cash or a letter of credit. The loan documents provide that, if the borrower fails to make such deposit, the borrower and guarantor will have personal liability for such amount; provided that if the outstanding amount of the 9950 Woodloch Whole Loan is equal to or less than $3,600,000, the borrower and guarantor will have personal liability in an amount equal to such outstanding amount.
Lockbox and Cash Management. The 9950 Woodloch Whole Loan is structured with a hard lockbox and springing cash management. The tenants are required to deposit all rent into an established deposit account each business day (however, sponsor-affiliated tenants are only required to deposit rent into the deposit account following a Cash Trap Event Period. Upon the occurrence of a Cash Trap
| THE INFORMATION IN THIS STRUCTURAL AND COLLATERAL TERM SHEET IS NOT COMPLETE AND MAY BE AMENDED PRIOR TO THE TIME OF SALE. THIS TERM SHEET IS NOT AN OFFER TO SELL THESE SECURITIES AND IT IS NOT A SOLICITATION OF AN OFFER TO BUY THESE SECURITIES IN ANY JURISDICTION WHERE THE OFFER OR SALE IS NOT PERMITTED. | ||
| 35 | ||
| Office - Suburban | Loan #1 | Cut-off Date Balance: | $73,000,000 | |
| 9950 Woodloch Forest Drive | 9950 Woodloch | Cut-off Date LTV: | 56.2% | |
| The Woodlands, TX 77380 | U/W NCF DSCR: | 1.50x | ||
| U/W NOI Debt Yield: | 13.1% |
Event Period, all amounts available in the deposit account will be transferred to a cash management account controlled by the lender on each business day and applied in accordance with the cash flow waterfall in the cash management agreement.
A “Cash Trap Event Period” will commence upon the earlier of the following:
| (i) | the occurrence of an event of default; |
| (ii) | the net cash flow debt service coverage ratio (“NCF DSCR”) being less than 1.15x, tested quarterly (a “Low DSCR |
Trigger Event”), unless within 10 days after the lender notifies the borrower of the occurrence of a Low DSCR Trigger
Event, the borrower delivers to the lender cash deposits and/or a letter of credit as additional collateral for the 9950
Woodloch Whole Loan (“DSCR Collateral”) in accordance with the 9950 Woodloch Whole Loan documents; or
| (iii) | the occurrence of a Major Tenant Event (as defined below); or |
| (iv) | the monthly payment occurring in January 2029. |
A Cash Trap Event Period will end upon the occurrence of the following:
| ● | with regard to clause (i), the cure of such event of default; |
| ● | with regard to clause (ii), above, upon the date that the NCF DSCR is equal to or greater than 1.15x for two consecutive calendar quarters or the borrower delivers the DSCR Collateral pursuant to the 9950 Woodloch Whole Loan documents; or |
| ● | with regard to clause (iii), a Major Tenant Event Cure (as defined below). |
A “Major Tenant” means Western Midstream, its successors and assigns, and any replacement tenant that enters into a lease for all
or any portion of the Major Tenant space in accordance with the 9950 Woodloch Whole Loan documents.
A “Major Tenant Event” means the earliest to occur of the following:
| (i) | A Major Tenant goes dark or vacates 10% or more of its space; |
| (ii) | A Major Tenant becomes a debtor in a bankruptcy or similar insolvency proceeding, or action; or |
| (iii) | A Major Tenant terminates or cancels its lease; |
A “Major Tenant Event Cure” means:
| ● | with regard to clauses (i)-(iii) above, either (a) the entire Major Tenant space has been leased to one or more reasonably satisfactory replacement tenants, or (b) the Major Tenant assigns its Lease. |
| ● | with regard to clause (i) above, the Major Tenant has re-occupied its entire Major Tenant space and is open for business; |
| ● | with regard to clause (ii) above, the bankruptcy or insolvency proceeding has terminated, the related lease has been affirmed and the terms of such lease are reasonably satisfactory to the lender; and |
| ● | with regard to clause (iii) above, Major Tenant (x) revokes the termination or cancellation and (y) delivers to the lender a tenant estoppel certificate. |
Property Management. The 9950 Woodloch Property is managed by Howard Hughes Management Services Company, LLC, an affiliate of the borrowers.
Partial Release. Not permitted.
Real Estate Substitution. Not permitted.
Subordinate and Mezzanine Indebtedness. None.
Ground Lease. None.
Terrorism Insurance. The 9950 Woodloch Whole Loan documents require that the “all risk” insurance policy required to be maintained by the borrowers provides coverage for terrorism in an amount equal to the full replacement cost of the 9950 Woodloch Property, as well as business interruption insurance covering no less than the 18-month period following the occurrence of a casualty event, together with a 6-month extended period of indemnity (provided that if TRIPRA or a similar statute is not in effect, the borrowers will not be obligated to pay terrorism insurance premiums in excess of two times the premium for the casualty and business interruption coverage on a stand-alone basis).
| THE INFORMATION IN THIS STRUCTURAL AND COLLATERAL TERM SHEET IS NOT COMPLETE AND MAY BE AMENDED PRIOR TO THE TIME OF SALE. THIS TERM SHEET IS NOT AN OFFER TO SELL THESE SECURITIES AND IT IS NOT A SOLICITATION OF AN OFFER TO BUY THESE SECURITIES IN ANY JURISDICTION WHERE THE OFFER OR SALE IS NOT PERMITTED. | ||
| 36 | ||
| Multifamily – Garden | Loan #2 | Cut-off Date Balance: | $64,500,000 | |
| Property Addresses - Various | Falls Houston Multifamily Portfolio | Cut-off Date LTV: | 62.4% | |
| Houston, TX | U/W NCF DSCR: | 1.35x | ||
| U/W NOI Debt Yield: | 9.9% |
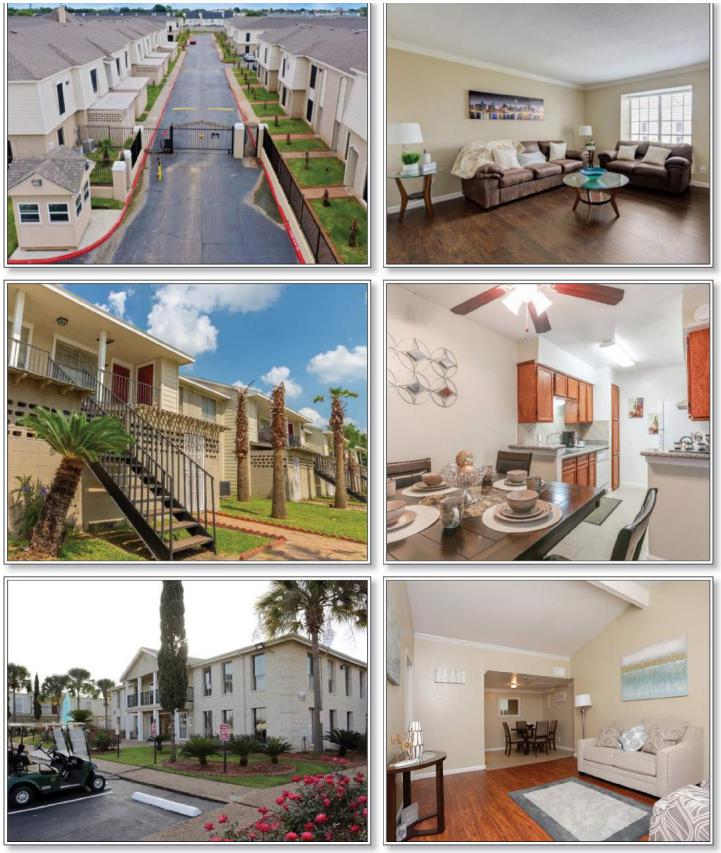
| THE INFORMATION IN THIS STRUCTURAL AND COLLATERAL TERM SHEET IS NOT COMPLETE AND MAY BE AMENDED PRIOR TO THE TIME OF SALE. THIS TERM SHEET IS NOT AN OFFER TO SELL THESE SECURITIES AND IT IS NOT A SOLICITATION OF AN OFFER TO BUY THESE SECURITIES IN ANY JURISDICTION WHERE THE OFFER OR SALE IS NOT PERMITTED. | ||
| 37 | ||
| Multifamily – Garden | Loan #2 | Cut-off Date Balance: | $64,500,000 | |
| Property Addresses - Various | Falls Houston Multifamily Portfolio | Cut-off Date LTV: | 62.4% | |
| Houston, TX | U/W NCF DSCR: | 1.35x | ||
| U/W NOI Debt Yield: | 9.9% |
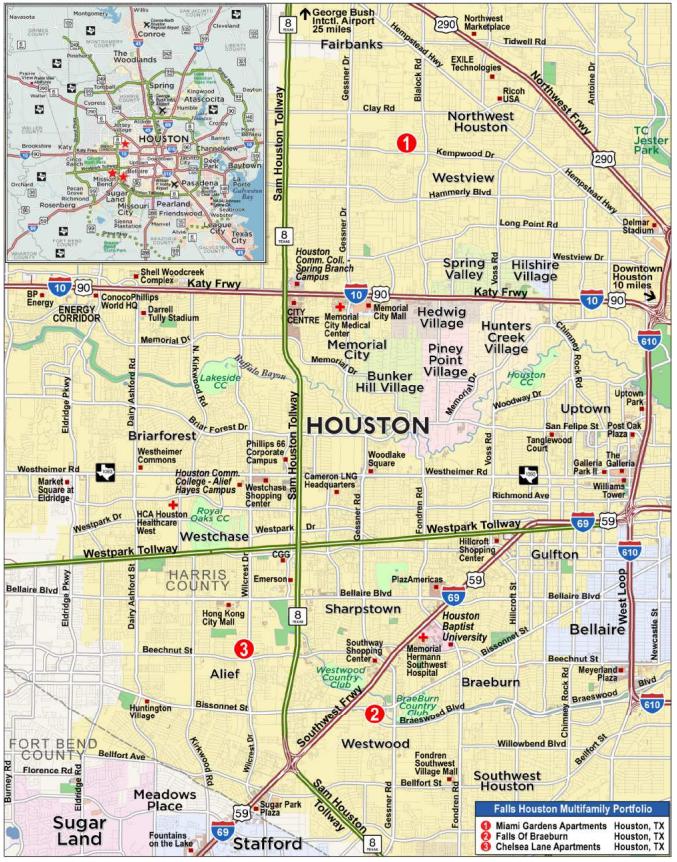
| THE INFORMATION IN THIS STRUCTURAL AND COLLATERAL TERM SHEET IS NOT COMPLETE AND MAY BE AMENDED PRIOR TO THE TIME OF SALE. THIS TERM SHEET IS NOT AN OFFER TO SELL THESE SECURITIES AND IT IS NOT A SOLICITATION OF AN OFFER TO BUY THESE SECURITIES IN ANY JURISDICTION WHERE THE OFFER OR SALE IS NOT PERMITTED. | ||
| 38 | ||
| No. 2 – Falls Houston Multifamily Portfolio |
| Mortgage Loan Information | Mortgaged Property Information | ||||||
| Mortgage Loan Seller: | Wells Fargo Bank, National Association | Single Asset/Portfolio: | Portfolio | ||||
Credit Assessment (Fitch/KBRA/S&P): | NR/NR/NR | Property Type – Subtype: | Multifamily – Garden | ||||
| Original Principal Balance: | $64,500,000 | Location: | Houston, TX | ||||
| Cut-off Date Balance: | $64,500,000 | Size: | 942 Units | ||||
| % of Initial Pool Balance: | 8.8% | Cut-off Date Balance Per Unit: | $68,471 | ||||
| Loan Purpose: | Refinance | Maturity Date Balance Per Unit: | $68,471 | ||||
| Borrower Sponsor: | Rao J. Polavarapu | Year Built/Renovated: | Various | ||||
| Guarantor: | Rao J. Polavarapu | Title Vesting: | Fee | ||||
| Mortgage Rate: | 6.9440% | Property Manager: | NMJ, Inc. | ||||
| Note Date: | June 14, 2024 | Current Occupancy (As of): | 88.7% (6/5/2024) | ||||
| Seasoning: | 0 months | YE 2023 Occupancy: | 84.6% | ||||
| Maturity Date: | July 11, 2029 | YE 2022 Occupancy: | 81.9% | ||||
| IO Period: | 60 months | YE 2021 Occupancy: | 72.5% | ||||
| Loan Term (Original): | 60 months | YE 2020 Occupancy: | NAV | ||||
| Amortization Term (Original): | NAP | As-Is Appraised Value: | $103,400,000 | ||||
| Loan Amortization Type: | Interest Only | As-Is Appraised Value Per Unit: | $109,766 | ||||
| Call Protection: | L(24),D(29),O(7) | As-Is Appraisal Valuation Date: | April 19, 2024 | ||||
| Lockbox Type: | Soft/Springing Cash Management | Underwriting and Financial Information | |||||
| Additional Debt: | NAP | TTM NOI (4/30/2024): | $6,718,657 | ||||
| Additional Debt Type (Balance): | NAP | YE 2023 NOI: | $6,337,449 | ||||
| YE 2022 NOI: | $5,290,072 | ||||||
| YE 2021 NOI: | $3,923,736 | ||||||
| U/W Revenues: | $12,312,557 | ||||||
| U/W Expenses: | $5,945,517 | ||||||
| Escrows and Reserves(1) | U/W NOI: | $6,367,040 | |||||
| Initial | Monthly | Cap | U/W NCF: | $6,131,540 | |||
| Taxes: | $896,922 | $149,487 | NAP | U/W DSCR based on NOI/NCF: | 1.40x / 1.35x | ||
| Insurance: | $0 | Springing | NAP | U/W Debt Yield based on NOI/NCF: | 9.9% / 9.5% | ||
| Replacement Reserve: | $117,616 | $19,625 | $824,116 | U/W Debt Yield at Maturity based on NOI/NCF: | 9.9% / 9.5% | ||
| Additional Capital Expenditure Reserve: | $0 | $41,667 | NAP | Cut-off Date LTV Ratio: | 62.4% | ||
| Deferred Maintenance: | $108,000 | NAP | NAP | LTV Ratio at Maturity: | 62.4% | ||
| Sources and Uses | ||||||||||
| Sources | Uses | |||||||||
| Loan Amount | $64,500,000 | 99.9 | % | Loan Payoff | $60,978,061 | 94. | 4% | |||
| Sponsor Equity | 77,934 | 0.1 | Upfront Reserves | 1,122,538 | 1.7 | |||||
| Closing Costs | 2,477,335 | 3.8 | ||||||||
| Total Sources | $64,577,934 | 100.0 | % | Total Uses | $64,577,934 | 10 | 0.0% | |||
| (1) | See “Escrows and Reserves” below for further discussion of reserve requirements. |
The Mortgage Loan. The second largest mortgage loan (the “Falls Houston Multifamily Portfolio Mortgage Loan”) is evidenced by a promissory note in the original principal amount of $64,500,000 and secured by the fee interests in three multifamily properties totaling 942 units (the “Falls Houston Multifamily Portfolio Properties”).
The Borrower and Borrower Sponsors. The borrowers are Falls Of Braeburn, LLC, a Texas limited liability company, Falls Of Chelsea Lane, LLC, a Texas limited liability company, and Northwest Miami Gardens, LP, a Texas limited partnership. The borrower are each structured to be a single purpose bankruptcy-remote entity in its organizational structure. Legal counsel to the borrower delivered a non-consolidation opinion in connection with the origination of the Falls Houston Multifamily Portfolio Mortgage Loan. The borrower sponsor and non-recourse carveout guarantor under the Falls Houston Multifamily Portfolio Mortgage Loan is Rao J. Polavarapu.
Rao J. Polavarapu founded the Falls Management Group, which is a Houston real estate development and management company specializing in operating garden-style multifamily communities. The Sponsor has over 25 years of experience operating in the multifamily market and owns 23 multifamily assets consisting of more than 8,100 units in the Houston MSA.
The Properties. The Falls Houston Multifamily Portfolio Properties consist of three garden style multifamily properties containing a total of 942 units located in the Houston MSA. The Falls Houston Multifamily Portfolio Properties were developed between 1970 and 1977 and were 88.7% occupied as of June 5, 2024.
| THE INFORMATION IN THIS STRUCTURAL AND COLLATERAL TERM SHEET IS NOT COMPLETE AND MAY BE AMENDED PRIOR TO THE TIME OF SALE. THIS TERM SHEET IS NOT AN OFFER TO SELL THESE SECURITIES AND IT IS NOT A SOLICITATION OF AN OFFER TO BUY THESE SECURITIES IN ANY JURISDICTION WHERE THE OFFER OR SALE IS NOT PERMITTED. | ||
| 39 | ||
| Multifamily – Garden | Loan #2 | Cut-off Date Balance: | $64,500,000 | |
| Property Addresses - Various | Falls Houston Multifamily Portfolio | Cut-off Date LTV: | 62.4% | |
| Houston, TX | U/W NCF DSCR: | 1.35x | ||
| U/W NOI Debt Yield: | 9.9% |
Falls Houston Multifamily Portfolio Summary
| Property Address | Year Built/ Renovated | Units | Property Sub-Type | June 2024 Occupancy | Appraised Value | % of Portfolio Appraised Value | Allocated Loan Amount | UW NOI | UW NOI Per Unit | % of Total UW NOI |
| Miami Gardens Apartments | 1970 / 2011 | 442 | Garden | 84.2% | $51,500,000 | 49.8% | $30,535,036 | $3,014,140 | $6,819 | 47.3% |
| 9540 Kempwood Drive | ||||||||||
| Houston, TX 77080 | ||||||||||
| Falls of Braeburn | 1977 / 2018 | 292 | Garden | 94.2% | $26,000,000 | 25.1% | $18,226,279 | $1,804,175 | $6,179 | 28.3% |
| 9707 Braeburn Glen Boulevard | ||||||||||
| Houston, TX 77074 | ||||||||||
| Chelsea Lane Apartments | 1974 / 2019 | 208 | Garden | 90.4% | $25,900,000 | 25.0% | $15,738,685 | $1,548,724 | $7,446 | 24.3% |
| 8039 Boone Road | ||||||||||
| Houston, TX 77072 | ||||||||||
| Total/Weighted Average: | 942 | 88.7% | $103,400,000 | 100.0% | $64,500,000 | $6,367,040 | $6,759 | 100.0% |
Miami Gardens Apartments
The Miami Gardens Apartments property is a 442-unit garden-style multifamily complex located in Houston, TX. The property consists of 28 two-story apartment buildings and a two-story clubhouse/leasing office building and a single-story clubhouse/event building. The property was constructed in 1970, renovated in 2011 and is situated on 15.73 acres of land. The 442 units average 936 SF with a unit mix as shown in the table below. Community amenities include a clubhouse/leasing office, swimming pool, fitness center, arcade room, walking trail, gated/controlled access, three laundry facilities, an event/party center and two playgrounds. The Miami Gardens Apartments property was 84.2% occupied as of June 5, 2024. Average occupancy at the Miami Gardens property for 2021, 2022, and 2023 was 65.8%, 75.7%, 81.1% respectively.
Unit Mix Summary(1)
| Unit Type | Total No. of Units | Occupied Units | % of Total Units | Occupancy | Average Unit Size (SF) | Average Underwritten Monthly Rent per Unit(2) |
| 1 Bedroom | 160 | 112 | 36.2% | 70.0% | 633 | $937 |
| 2 Bedrooms | 159 | 147 | 36.0% | 92.5% | 937 | $1,205 |
| 3 Bedrooms | 123 | 113 | 27.8% | 91.9% | 1,329 | $1,451 |
| Total/Weighted Average | 442 | 372 | 100.0% | 84.2% | 936 | $1,176 |
| (1) | Information obtained from the underwritten rent roll. |
| (2) | Excluding 5 management units |
Falls of Braeburn
The Falls of Braeburn property is a 292-unit garden-style multifamily complex located in Houston, TX. The property consists of 23 two-story apartment buildings and a single-story leasing office. The property was constructed in 1977, renovated in 2018 and is situated on 10.89 acres of land. The 292 units average 797 SF with a unit mix as shown in the table below. Community amenities include clubhouse/leasing office, swimming pool, gated/controlled access, laundry facilities and a playground. The Falls of Braeburn apartment property was 94.2% occupied as of June 5, 2024. Average occupancy at the Falls of Braeburn property for 2021, 2022, and 2023 was 77.0%, 87.9%, 88.1% respectively.
Unit Mix Summary(1)
| Unit Type | Total No. of Units | Occupied Units | % of Total Units | Occupancy | Average Unit Size (SF) | Average Underwritten Monthly Rent per Unit(2) |
| 1 Bedroom | 240 | 229 | 82.2% | 95.4% | 748 | $986 |
| 2 Bedrooms | 40 | 34 | 13.7% | 85.0% | 981 | $1,241 |
| 3 Bedrooms | 12 | 12 | 4.1% | 100.0% | 1,155 | $1,325 |
| Total/Weighted Average | 292 | 275 | 100.0% | 94.2% | 797 | $1,035 |
| (1) | Information obtained from the underwritten rent roll. |
| (2) | Excluding 3 management units |
Chelsea Lane Apartments
The Chelsea Lane Apartments property is a 208-unit garden-style multifamily complex located in Houston, TX. The property consists of 15, two-story apartment buildings and a two-story clubhouse/leasing office building. The property was constructed in 1974,
| THE INFORMATION IN THIS STRUCTURAL AND COLLATERAL TERM SHEET IS NOT COMPLETE AND MAY BE AMENDED PRIOR TO THE TIME OF SALE. THIS TERM SHEET IS NOT AN OFFER TO SELL THESE SECURITIES AND IT IS NOT A SOLICITATION OF AN OFFER TO BUY THESE SECURITIES IN ANY JURISDICTION WHERE THE OFFER OR SALE IS NOT PERMITTED. | ||
| 40 | ||
| Multifamily – Garden | Loan #2 | Cut-off Date Balance: | $64,500,000 | |
| Property Addresses - Various | Falls Houston Multifamily Portfolio | Cut-off Date LTV: | 62.4% | |
| Houston, TX | U/W NCF DSCR: | 1.35x | ||
| U/W NOI Debt Yield: | 9.9% |
renovated in 2019 and is situated on 9.53 acres of land. The 208 units average 1,041 SF with a unit mix as shown in the table below. Community amenities include clubhouse/leasing office, swimming pool, fitness center, gated/controlled access, two laundry facilities and a playground. The Chelsea Lane Apartments property was 90.4% occupied as of June 5, 2024. Average occupancy at the Chelsea Lane Apartments property for 2021, 2022, and 2023 was 80.5%, 86.5%, 87.3% respectively.
Unit Mix Summary(1)
| Unit Type | Total No. of Units | Occupied Units | % of Total Units | Occupancy | Average Unit Size (SF) | Average Underwritten Monthly Rent per Unit |
| 1 Bedroom | 32 | 29 | 15.4% | 90.6% | 685 | $992 |
| 2 Bedrooms | 131 | 114 | 63.0% | 87.0% | 1,056 | $1,298 |
| 3 Bedrooms | 45 | 45 | 21.6% | 100.0% | 1,253 | $1,563 |
| Total/Weighted Average | 208 | 188 | 100% | 90.4% | 1,041 | $1,308 |
| (1) | Information obtained from the underwritten rent roll. |
The following table presents historical occupancy percentages at the Falls Houston Multifamily Portfolio Properties:
Historical Occupancy(1)
12/31/2021(2) | 12/31/2022(2) | 12/31/2023(2) | 6/5/2024(3) |
| 72.5% | 81.9% | 84.6% | 88.7% |
| (1) | Represents the weighted average occupancy of the portfolio. |
| (2) | Information obtained from the underwritten rent roll. |
| (3) | Information obtained from the borrower. |
| THE INFORMATION IN THIS STRUCTURAL AND COLLATERAL TERM SHEET IS NOT COMPLETE AND MAY BE AMENDED PRIOR TO THE TIME OF SALE. THIS TERM SHEET IS NOT AN OFFER TO SELL THESE SECURITIES AND IT IS NOT A SOLICITATION OF AN OFFER TO BUY THESE SECURITIES IN ANY JURISDICTION WHERE THE OFFER OR SALE IS NOT PERMITTED. | ||
| 41 | ||
| Multifamily – Garden | Loan #2 | Cut-off Date Balance: | $64,500,000 | |
| Property Addresses - Various | Falls Houston Multifamily Portfolio | Cut-off Date LTV: | 62.4% | |
| Houston, TX | U/W NCF DSCR: | 1.35x | ||
| U/W NOI Debt Yield: | 9.9% |
Underwritten Net Cash Flow. The following table presents certain information relating to the underwritten net cash flow at the Falls Houston Multifamily Portfolio Properties:
Cash Flow Analysis
| 2021 | 2022 | 2023 | T-12 4/30/2024 | U/W | %(1) | U/W $ per Unit | |
| Base Rent | $7,734,617 | $9,232,191 | $10,502,146 | $10,970,930 | $11,577,710 | 83.1% | $12,291 |
| Grossed Up Vacant Space | 3,031,789 | 2,046,275 | 1,892,587 | 1,486,230 | 1,553,242 | 11.2% | $1,649 |
| Gross Potential Rent | $10,766,407 | $11,278,466 | $12,394,733 | $12,457,160 | $13,130,952 | 94.3% | $13,939 |
| Laundry | 21,424 | 18,500 | 18,455 | 18,420 | 18,420 | 0.1 | 20 |
| Storage | 440,363 | 557,558 | 626,846 | 634,031 | 634,031 | 4.6 | 673 |
| Other Income(2) | 128,821 | 188,344 | 130,443 | 141,367 | 141,367 | 1.0 | 150 |
| Net Rental Income(3) | $11,357,014 | $12,042,867 | $13,170,477 | $13,250,978 | $13,924,770 | 100.0% | $14,782 |
| (Concessions) | (131,587) | (117,871) | (73,918) | (58,971) | (58,971) | (0.4) | (63) |
| (Vacancy & Credit Loss) | (3,031,789) | (2,046,275) | (1,892,587) | (1,486,230) | (1,553,242) | (11.8) | (1,649) |
| Effective Gross Income | $8,193,638 | $9,878,721 | $11,203,972 | $11,705,777 | $12,312,557 | 88.4% | $13,071 |
| Real Estate Taxes | 1,422,366 | 1,314,078 | 1,300,021 | 1,305,429 | 1,800,452 | 14.6 | 1,911 |
| Insurance | 678,569 | 846,968 | 953,745 | 1,040,737 | 1,309,638 | 10.6 | 1,390 |
| Management Fee | 327,746 | 395,149 | 448,159 | 468,231 | 492,502 | 4.0 | 523 |
| Other Operating Expenses | 1,841,221 | 2,032,454 | 2,164,598 | 2,172,723 | 2,342,925 | 19.0 | 2,487 |
| Total Operating Expenses | $4,269,902 | $4,588,649 | $4,866,524 | $4,987,120 | $5,945,517 | 48.3% | $6,312 |
| Net Operating Income |
$3,923,736 |
$5,290,072 |
$6,337,449 |
$6,718,657 | $6,367,040 | 51.7% | $6,759 |
| Capital Expenditures | 235,500 | 1.9 | 250 | ||||
| Net Cash Flow |
$3,923,736 |
$5,290,072 |
$6,337,449 |
$6,718,657 | $6,131,540 | 49.8% | $6,509 |
| NOI DSCR | 0.86x | 1.16x | 1.40x | 1.48x | 1.40x | ||
| NCF DSCR | 0.86x | 1.16x | 1.40x | 1.48x | 1.35x | ||
| NOI Debt Yield | 6.1% | 8.2% | 9.8% | 10.4% | 9.9% | ||
| NCF Debt Yield | 6.1% | 8.2% | 9.8% | 10.4% | 9.5% |
| (1) | Represents (i) percent of Net Rental Income for all revenue fields, (ii) percent of Gross Potential Rent for Vacancy & Credit Loss and (iii) percent of Effective Gross Income for all other fields. |
| (2) | Other income includes application fees, month-to-month fees, late fees, and NSF fees. |
| (3) | The increase in NOI year over year from 2021 to the 2023 is due to a steady decrease in vacancy since the height of the COVID pandemic in 2021, as well as decreased operating expenses due to operational efficiencies that sponsorship has achieved. |
Appraisal. According to the appraisals, the Falls Houston Multifamily Portfolio Properties had an aggregate “As Is” appraised value of $103,400,000 as of April 19, 2024.
Environmental Matters. According to the Phase I environmental site assessments dated April 23, 2024, there was no evidence of any recognized environmental conditions at the Falls Houston Multifamily Portfolio Properties.
Market Overview and Competition. The Falls Houston Multifamily Portfolio Properties are located in the Houston-The Woodlands-Sugar Land, TX MSA. The Houston-The Woodlands-Sugar Land, TX MSA had a 2023 population of 7,500,883.
Miami Gardens Apartments
The Miami Gardens Apartments property is located in central Spring Branch, within the central/northwest region of the city of Houston. The property is approximately 11 miles northwest of the Houston CBD. Interstate Highway 10 extends through the city in an east/west direction and provides primary access.
The Miami Gardens Apartments property is located in the Spring Branch submarket. As of fourth quarter 2023, the submarket had an inventory of 22,246 units, a vacancy rate of 10.1%, and an average asking rental rate of $1,187.
The Falls of Braeburn
The Falls of Braeburn property is located in South Houston/Braeburn neighborhood, within the central/southwest region of the city of Houston. The property area is approximately 15 miles southwest of the Houston CBD. The property’s primary access is provided by the Westpark Tollway, Sam Houston Tollway (Beltway 8) and Interstate 69.
| THE INFORMATION IN THIS STRUCTURAL AND COLLATERAL TERM SHEET IS NOT COMPLETE AND MAY BE AMENDED PRIOR TO THE TIME OF SALE. THIS TERM SHEET IS NOT AN OFFER TO SELL THESE SECURITIES AND IT IS NOT A SOLICITATION OF AN OFFER TO BUY THESE SECURITIES IN ANY JURISDICTION WHERE THE OFFER OR SALE IS NOT PERMITTED. | ||
| 42 | ||
| Multifamily – Garden | Loan #2 | Cut-off Date Balance: | $64,500,000 | |
| Property Addresses - Various | Falls Houston Multifamily Portfolio | Cut-off Date LTV: | 62.4% | |
| Houston, TX | U/W NCF DSCR: | 1.35x | ||
| U/W NOI Debt Yield: | 9.9% |
The Falls of Braeburn property is located in the Southwest Houston submarket. As of the fourth quarter of 2023, the submarket had an inventory of 69,285 units, a vacancy rate of 8.0% and an asking average rental rate of $1,004 per unit.
Chelsea Lane Apartments
The Chelsea Lane Apartments property is located within the central/southwest region of the city of Houston. The property is approximately 16 miles northwest of the Houston CBD. The Property’s primary access is provided by US Highway 69/Southwest Freeway, Loop 610 and the Sam Houston Tollway.
The Chelsea Lane Apartments property is located in the Alief submarket. As of the fourth quarter 2023, the submarket had an inventory of 15,551 units, a vacancy rate of 10.5%, and an average asking rental rate of $1,039 per unit.
Falls Houston Multifamily Portfolio Demographic Summary(1)
| Property Name | City, State | 1-mile Population | 3-mile Population | 5-mile Population | 1-mile Average Household Income | 3-mile Average Household Income | 5-mile Average Household Income |
| Miami Gardens Apartments | Houston, TX | 21,749 | 128,881 | 295,388 | $90,748 | $90,242 | $117,965 |
| Falls of Braeburn | Houston, TX | 21,197 | 226,181 | 524,993 | $58,151 | $64,522 | $74,773 |
| Chelsea Lane Apartments | Houston, TX | 25,915 | 221,098 | 530,239 | $59,922 | $62,206 | $74,585 |
| Total / Wtd. Avg.(2) | 22,665 | $201,002 | $470,449 | $66,605 | $70,144 | $85,259 |
| (1) | Source: Appraisal. |
| (2) | The Wtd. Avg. figures are based on allocated loan amounts for the individual properties. |
Escrows.
Taxes – The Falls Houston Multifamily Portfolio Mortgage Loan documents require an upfront reserve of $896,922 for real estate taxes plus ongoing monthly reserves in an amount equal to 1/12 of the taxes that the lender estimates will be payable during the next twelve months, initially $149,487.
Insurance – The Falls Houston Multifamily Portfolio Mortgage Loan documents require ongoing monthly reserves in an amount equal to 1/12 of the insurance premiums that the lender estimates will be payable during the next twelve months. Ongoing monthly reserves for insurance are not required as long as (i) no event of default under the Falls Houston Multifamily Portfolio Mortgage Loan documents has occurred and is continuing; (ii) the Falls Houston Multifamily Portfolio Properties are part of a blanket or umbrella policy approved by the lender; (iii) the borrowers provide the lender with evidence of renewal of insurance policies; and (iv) the borrowers provide the lender with paid receipts for insurance premiums by no later than 10 business days prior to the policy expiration dates.
Replacement Reserve – The Falls Houston Multifamily Portfolio Mortgage Loan documents require an upfront deposit of $117,616 and ongoing monthly reserves in an amount equal to $19,625 for replacements, capped at $824,116.
Additional Capital Expenditure Reserve - The Falls Houston Multifamily Portfolio Mortgage Loan documents require ongoing monthly reserves through and including the monthly payment date occurring in July, 2026 of $41,667 (totaling $1,000,008 when complete) representing additional capital expenditures which are payable by the borrower related to the property.
Deferred Maintenance Reserve – The Falls Houston Multifamily Portfolio Mortgage Loan documents require an upfront reserve of $108,000 for immediate repairs.
Lockbox and Cash Management. The Falls Houston Multifamily Portfolio Mortgage Loan is structured with a soft lockbox and springing cash management. The borrowers and property manager are required to deposit all rent into an established deposit account each business day. Upon the occurrence of a Cash Trap Event Period (defined below), all amounts available in the deposit account will be transferred to a cash management account controlled by the lender on each business day and applied in accordance with the cash flow waterfall in the cash management agreement. During the continuance of a Cash Trap Event Period, all excess cash flow will be held by the lender as additional collateral.
A “Cash Trap Event Period” will commence upon the earlier of the following:
| (i) | the occurrence and continuance of an event of default under the Falls Houston Multifamily Portfolio Mortgage Loan documents; or |
| (ii) | the net cash flow debt service coverage ratio (“NCF DSCR”) falling below 1.15x on an interest only basis tested quarterly. |
| THE INFORMATION IN THIS STRUCTURAL AND COLLATERAL TERM SHEET IS NOT COMPLETE AND MAY BE AMENDED PRIOR TO THE TIME OF SALE. THIS TERM SHEET IS NOT AN OFFER TO SELL THESE SECURITIES AND IT IS NOT A SOLICITATION OF AN OFFER TO BUY THESE SECURITIES IN ANY JURISDICTION WHERE THE OFFER OR SALE IS NOT PERMITTED. | ||
| 43 | ||
| Multifamily – Garden | Loan #2 | Cut-off Date Balance: | $64,500,000 | |
| Property Addresses - Various | Falls Houston Multifamily Portfolio | Cut-off Date LTV: | 62.4% | |
| Houston, TX | U/W NCF DSCR: | 1.35x | ||
| U/W NOI Debt Yield: | 9.9% |
A Cash Trap Event Period will end upon the occurrence of the following:
| ● | with regard to clause (i) above, the cure of such event of default; or |
| ● | with regard to clause (ii) above, the NCF DSCR is equal to or greater than 1.15x on an interest only basis for 2 consecutive calendar quarters. |
Property Management. The Falls Houston Multifamily Portfolio Properties are managed by NMJ, Inc., an affiliate of the borrowers.
Partial Release. Not permitted.
Real Estate Substitution. Not permitted.
Subordinate and Mezzanine Indebtedness. None.
Future Mezzanine or Subordinate Indebtedness Permitted. Not permitted.
Ground Lease. None.
Letter of Credit. None.
Terrorism Insurance. The Falls Houston Multifamily Portfolio Mortgage Loan documents require that the “all risk” insurance policy required to be maintained by the borrower, in an amount equal to the full replacement cost of the Falls Houston Multifamily Portfolio Properties, contain no exclusion for damage or destruction caused by acts of terrorism, as well as business interruption insurance covering a period of restoration of 18 months and a 6-month extended period of indemnity.
| THE INFORMATION IN THIS STRUCTURAL AND COLLATERAL TERM SHEET IS NOT COMPLETE AND MAY BE AMENDED PRIOR TO THE TIME OF SALE. THIS TERM SHEET IS NOT AN OFFER TO SELL THESE SECURITIES AND IT IS NOT A SOLICITATION OF AN OFFER TO BUY THESE SECURITIES IN ANY JURISDICTION WHERE THE OFFER OR SALE IS NOT PERMITTED. | ||
| 44 | ||
| Mixed Use - Office/Retail | Loan #3 | Cut-off Date Balance: | $50,400,000 | |
| 640 5th Avenue | 640 5th Avenue | Cut-off Date LTV: | 41.7% | |
| New York, NY 10022 | U/W NCF DSCR: | 2.04x | ||
| U/W NOI Debt Yield: | 18.7% |

| THE INFORMATION IN THIS STRUCTURAL AND COLLATERAL TERM SHEET IS NOT COMPLETE AND MAY BE AMENDED PRIOR TO THE TIME OF SALE. THIS TERM SHEET IS NOT AN OFFER TO SELL THESE SECURITIES AND IT IS NOT A SOLICITATION OF AN OFFER TO BUY THESE SECURITIES IN ANY JURISDICTION WHERE THE OFFER OR SALE IS NOT PERMITTED. | ||
| 45 | ||
| Mixed Use - Office/Retail | Loan #3 | Cut-off Date Balance: | $50,400,000 | |
| 640 5th Avenue | 640 5th Avenue | Cut-off Date LTV: | 41.7% | |
| New York, NY 10022 | U/W NCF DSCR: | 2.04x | ||
| U/W NOI Debt Yield: | 18.7% |
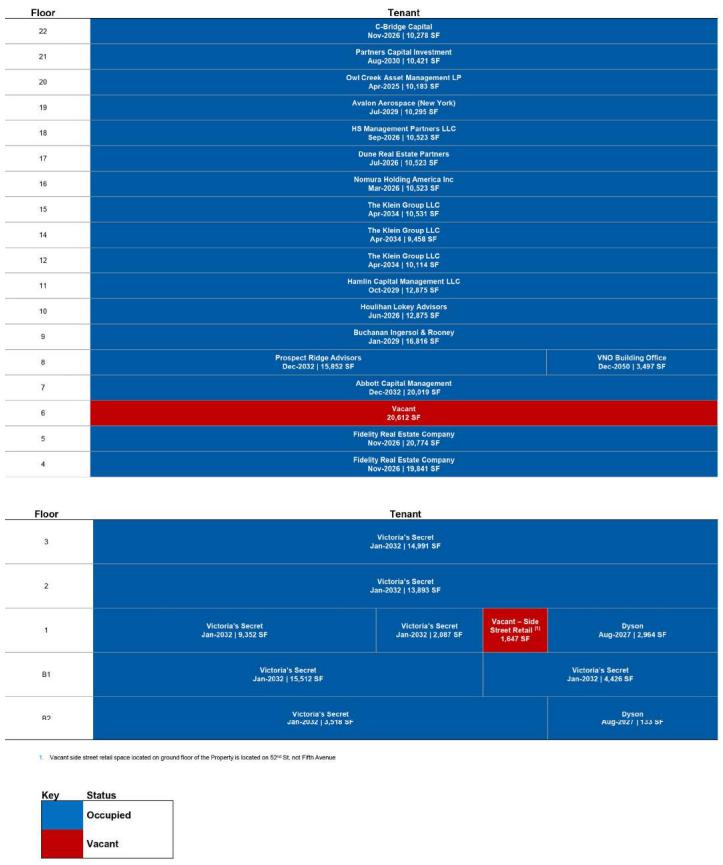
| THE INFORMATION IN THIS STRUCTURAL AND COLLATERAL TERM SHEET IS NOT COMPLETE AND MAY BE AMENDED PRIOR TO THE TIME OF SALE. THIS TERM SHEET IS NOT AN OFFER TO SELL THESE SECURITIES AND IT IS NOT A SOLICITATION OF AN OFFER TO BUY THESE SECURITIES IN ANY JURISDICTION WHERE THE OFFER OR SALE IS NOT PERMITTED. | ||
| 46 | ||
| Mixed Use - Office/Retail | Loan #3 | Cut-off Date Balance: | $50,400,000 | |
| 640 5th Avenue | 640 5th Avenue | Cut-off Date LTV: | 41.7% | |
| New York, NY 10022 | U/W NCF DSCR: | 2.04x | ||
| U/W NOI Debt Yield: | 18.7% |
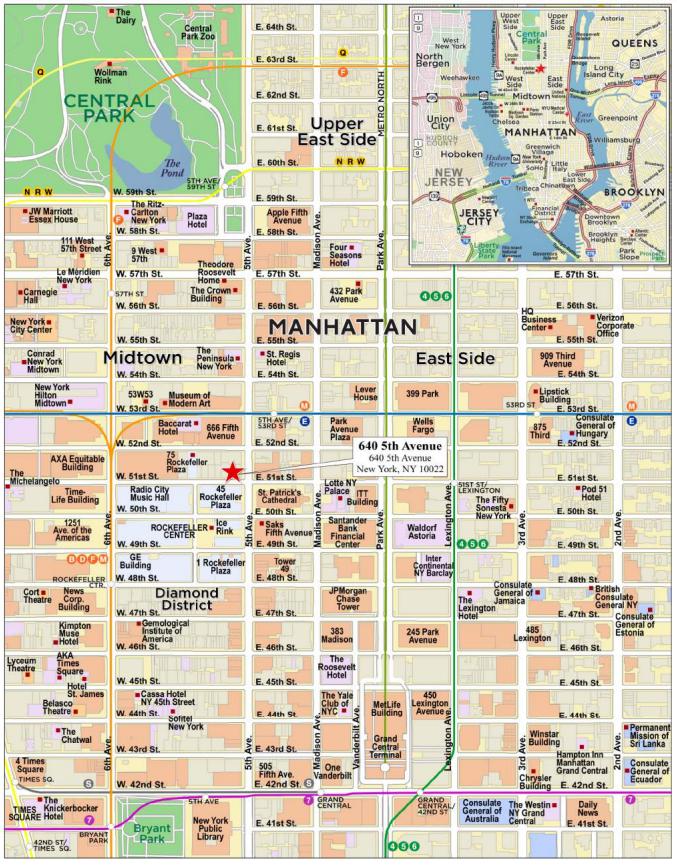
| THE INFORMATION IN THIS STRUCTURAL AND COLLATERAL TERM SHEET IS NOT COMPLETE AND MAY BE AMENDED PRIOR TO THE TIME OF SALE. THIS TERM SHEET IS NOT AN OFFER TO SELL THESE SECURITIES AND IT IS NOT A SOLICITATION OF AN OFFER TO BUY THESE SECURITIES IN ANY JURISDICTION WHERE THE OFFER OR SALE IS NOT PERMITTED. | ||
| 47 | ||
| No. 3 – 640 5th Avenue |
| Mortgage Loan Information | Mortgaged Property Information | ||||||
| Mortgage Loan Seller: | Goldman Sachs Mortgage Company | Single Asset/Portfolio: | Single Asset | ||||
| Credit Assessment (Fitch/KBRA/Moody’s): | BBB+sf/BBB(sf)/NR | Property Type – Subtype: | Mixed Use – Office/Retail | ||||
| Original Principal Balance(1): | $50,400,000 | Location: | New York, NY | ||||
| Cut-off Date Balance(1): | $50,400,000 | Size(5): | 314,533 SF | ||||
| % of Initial Pool Balance: | 6.9% | Cut-off Date Balance Per SF(1)(5): | $953.79 | ||||
| Loan Purpose: | Refinance | Maturity Date Balance Per SF(1)(5): | $871.73 | ||||
| Borrower Sponsor: | Vornado Realty Trust | Year Built/Renovated: | 1949 / 2003 | ||||
| Guarantor: | Manhattan High Street Holdings LP | Title Vesting(4): | Fee/Leasehold | ||||
| Mortgage Rate: | 6.1293333% | Property Manager: | Vornado Office Management LLC | ||||
| Note Date: | June 10, 2024 | Current Occupancy (As of): | 92.9% (1/31/2024) | ||||
| Seasoning: | 0 months | YE 2023 Occupancy: | 92.6% | ||||
| Maturity Date: | July 1, 2029 | YE 2022 Occupancy: | 93.4% | ||||
| IO Period: | NAP | YE 2021 Occupancy: | 85.8% | ||||
| Loan Term (Original): | 60 months | As-Is Appraised Value: | $720,000,000 | ||||
| Amortization Term (Original)(5): | NAP | As-Is Appraised Value Per SF: | $2,289.11 | ||||
| Loan Amortization Type: | Amortizing Balloon | As-Is Appraisal Valuation Date: | February 28, 2024 | ||||
| Call Protection(2): | L(24),D(29),O(7) | ||||||
| Lockbox Type: | Hard/In Place Cash Management | Underwriting and Financial Information(1)(5) | |||||
| Additional Debt(1): | Yes | YE 2023 NOI: | $53,799,655 | ||||
| Additional Debt Type (Balance)(1): | Pari Passu ($249,600,000) | YE 2022 NOI: | $47,771,835 | ||||
| Mezzanine ($100,000,000) | YE 2021 NOI: | $48,824,168 | |||||
| YE 2020 NOI: | $51,524,481 | ||||||
| U/W Revenues: | $77,479,026 | ||||||
| Escrows and Reserves(3) | U/W Expenses: | $21,293,412 | |||||
| Initial | Monthly | Cap | U/W NOI: | $56,185,614 | |||
| Taxes: | $0 | Springing | NAP | U/W NCF: | $48,532,770 | ||
| Insurance: | $0 | Springing | NAP | U/W DSCR based on NOI/NCF: | 2.37x / 2.04x | ||
| Replacement Reserves: | $0 | Springing | $195,217 | U/W Debt Yield based on NOI/NCF: | 18.7% / 16.2% | ||
| TI/LC Reserve: | $1,567,900 | $500,000 | $15,000,000 | U/W Debt Yield at Maturity based on NOI/NCF: | 20.5% / 17.7% | ||
| Free Rent Reserve: | $1,648,112 | $0 | NAP | Cut-off Date LTV Ratio: | 41.7% | ||
| LTV Ratio at Maturity: | 38.1% | ||||||
| Sources and Uses | ||||||||||
| Sources | Uses | |||||||||
| Whole Loan Amount | $300,000,000 | 59.3 | % | Loan Payoff | $501,608,063 | 99.1 | % | |||
| Sponsor Equity | 106,245,190 | 021.0 | Upfront Reserves | 3,216,012 | 0.6 | |||||
| Mezzanine Loan Amount | 100,000,000 | 19.8 | Closing Costs | 1,421,115 | 0.3 | |||||
| Total Sources | $506,245,190 | 100.0 | % | Total Uses | $506,245,190 | 100.0 | % | |||
| (1) | The 640 5th Avenue Mortgage Loan (as defined below) is part of a whole loan evidenced by 10 pari passu notes with an aggregate outstanding principal balance as of the Cut-off Date of $300.0 million (the “640 5th Avenue Whole Loan”). The Financial Information in the chart above reflects the Cut-off Date Balance of the 640 5th Avenue Whole Loan. |
| (2) | The lockout period for prepayment of the 640 5th Avenue Whole Loan will be at least 24 months beginning with and including the first payment date on August 1, 2024; provided that partial prepayment to resize the 640 5th Avenue Whole Loan to satisfy certain debt yield requirements is permitted during the whole loan term with the payment of the applicable yield maintenance payment. Defeasance of the 640 5th Avenue Whole Loan, in whole but not in part, is permitted after the date that is the earlier of (i) two years from the closing date of the securitization that includes the last note to be securitized and (ii) August 1, 2027. The assumed lockout period of 24 payments is based on the anticipated closing date of the WFCM 2024-5C1 securitization in July 2024. The actual lockout period may be longer. |
| (3) | See “Escrows” section below. |
| (4) | A prior owner of the 640 5th Avenue Property (as defined below) ground leased the 640 5th Avenue Property to the owner of the property located at 650 5th Avenue (the “Air Rights Tenant”), who subleased the 640 5th Avenue Property (other than development rights relating to one of the two buildings comprising the 640 5th Avenue Property, which was retained by the Air Rights Tenant) back to such prior owner of the 640 5th Avenue Property, solely for purposes of satisfying certain zoning requirements in connection with the transfer of such development rights to the Air Rights Tenant, as further described under “Description of the Mortgage Pool—Mortgage Pool Characteristics—Fee & Leasehold Estates; Ground Leases” in the Preliminary Prospectus. |
| (5) | The 640 5th Avenue Whole Loan and the 640 5th Avenue Mezzanine Loan (as defined below) have fixed amortization for their entire 60-month loan terms. With respect to the 640 5th Avenue Whole Loan, the borrower is required to make payments on each monthly payment date, as follows: (x) principal in the amount of $437,500 and (y) the monthly interest payment. With respect to the 640 5th Avenue Mezzanine Loan, the mezzanine borrower is required to make payments on each monthly payment date as follows: (x) principal in the amount of approximately $145,833 and (y) the monthly interest payment. |
| THE INFORMATION IN THIS STRUCTURAL AND COLLATERAL TERM SHEET IS NOT COMPLETE AND MAY BE AMENDED PRIOR TO THE TIME OF SALE. THIS TERM SHEET IS NOT AN OFFER TO SELL THESE SECURITIES AND IT IS NOT A SOLICITATION OF AN OFFER TO BUY THESE SECURITIES IN ANY JURISDICTION WHERE THE OFFER OR SALE IS NOT PERMITTED. | ||
| 48 | ||
| Mixed Use - Office/Retail | Loan #3 | Cut-off Date Balance: | $50,400,000 | |
| 640 5th Avenue | 640 5th Avenue | Cut-off Date LTV: | 41.7% | |
| New York, NY 10022 | U/W NCF DSCR: | 2.04x | ||
| U/W NOI Debt Yield: | 18.7% |
The Mortgage Loan. The third largest mortgage loan (the “640 5th Avenue Mortgage Loan”) is part of a the 640 5th Avenue Whole Loan secured by the borrower’s fee and leasehold interest in a 314,533 SF mixed-use property comprised of two abutting and interconnected buildings facing Fifth Avenue and West 52nd Street (other than development rights relating to the West 52nd Street building), respectively, in New York, New York (the “640 5th Avenue Property”). The 640 5th Avenue Whole Loan is comprised of 10 pari passu notes, with an aggregate outstanding principal balance as of the Cut-off Date of $300,000,000. The 640 5th Avenue Mortgage Loan, which is evidenced by the non-controlling Note A-6 and Note A-7, has an aggregate outstanding principal balance as of the Cut-off Date of $50,400,000. The 640 5th Avenue Whole Loan was originated by Goldman Sachs Bank USA (“GSBI”), Bank of Montreal (“BMO”) and Morgan Stanley Bank, N.A. (“MSBNA”) and has an aggregate outstanding principal balance as of the Cut-off Date of $300,000,000. GSMC is selling Note A-6 and Note A-7 in the outstanding aggregate principal balance of $50,400,000 as of the Cut-off Date. The 640 5th Avenue Whole Loan has fixed amortization, as described below, for the entire term and accrues interest on an Actual/360 basis. The borrower is required to make payments on each monthly payment date for the 640 5th Avenue Whole Loan as follows: (x) principal in the amount of $437,500 and (y) the monthly interest payment.
A prior owner of the 640 5th Avenue Property ground leased the 640 5th Avenue Property to the Air Rights Tenant, who subleased the 640 5th Avenue Property (other than development rights relating to the West 52nd Street building, which were retained by the Air Rights Tenant) back to such prior owner of the 640 5th Avenue Property, solely for the purpose of satisfying certain zoning requirements in connection with the transfer of such development rights to the Air Rights Tenant, as further described under “Description of the Mortgage Pool—Mortgage Pool Characteristics—Fee & Leasehold Estates; Ground Leases” in the Preliminary Prospectus.
The table below identifies the promissory notes that comprise the 640 5th Avenue Whole Loan. The relationship between the holders of the 640 5th Avenue Whole Loan is governed by a co-lender agreement as described under “Description of the Mortgage Pool—The Whole Loans—The Non-Serviced Pari Passu Whole Loans” in the Preliminary Prospectus. The 640 5th Avenue Whole Loan will be serviced pursuant to the pooling and servicing agreement for the BBCMS 2024-5C27 securitization trust until the controlling Note A-1 is securitized, whereupon the 640 5th Avenue Whole Loan will be serviced pursuant to the pooling and servicing agreement for such securitization. See “Description of the Mortgage Pool—The Whole Loans—The Non-Serviced Pari Passu Whole Loans” in the Preliminary Prospectus
Whole Loan Note Summary
| Notes | Original Balance | Cut-off Date Balance | Note Holder | Controlling Piece |
| A-1(1) | $40,000,000 | $40,000,000 | MSBNA | Yes |
| A-2(1) | 37,500,000 | 37,500,000 | MSBNA | No |
| A-3(1) | 30,000,000 | 30,000,000 | MSBNA | No |
| A-4(1) | 20,000,000 | 20,000,000 | MSBNA | No |
| A-5 | 69,600,000 | 69,600,000 | Benchmark 2024-V8 | No |
| A-6 | 40,000,000 | 40,000,000 | WFCM 2024-5C1 | No |
| A-7 | 10,400,000 | 10,400,000 | WFCM 2024-5C1 | No |
| A-8 | 25,000,000 | 25,000,000 | BBCMS 2024-5C27 | No |
| A-9 | 17,500,000 | 17,500,000 | Benchmark 2024-V8 | No |
| A-10 | 10,000,000 | 10,000,000 | Benchmark 2024-V8 | No |
| Total | $300,000,000 | $300,000,000 |
| (1) | The notes held by the lenders are expected to be contributed to one or more future securitization transactions or may otherwise be transferred at any time. |
The Borrower and the Borrower Sponsor. The borrower is 640 Fifth Avenue Owner LLC, a Delaware limited liability company structured as a single purpose, bankruptcy-remote entity, with one independent director. Legal counsel to the borrower delivered a non-consolidation opinion in connection with the origination of the 640 5th Avenue Whole Loan.
The borrower sponsor is Vornado Realty Trust (“Vornado”). Vornado is a real estate investment firm that owns and manages over 26 million SF of LEED certified buildings and received the Energy Star Partner of the Year Award, Sustained Excellence 2022. Vornado commemorated 50 years on the New York Stock Exchange in 2012 and is a member of the S&P MidCap 400. Vornado’s portfolio is concentrated on office and retail properties in New York. Vornado has 57 Manhattan operating properties consisting of approximately 18.9 million SF of office space in 30 of the properties, approximately 2.4 million SF of street retail space in 50 of the properties and 338 residential units in four Manhattan properties as of June 2024.
The non-recourse carveout guarantor is Manhattan High Street Holdings LP, a subsidiary of Vornado. The non-recourse carveout guarantor’s recourse obligations with respect to bankruptcy or insolvency related events is capped at 25% of the outstanding principal balance of the 640 5th Avenue Whole Loan, plus the lender’s enforcement costs under the guaranty, including reasonable attorneys’ fees. Additionally, recourse for losses relating to a transfer of the related mortgaged property or interests in the borrower is limited as described under “Description of the Mortgage Pool—Non-Recourse Carveout Limitations” in the Preliminary Prospectus.
The Property. The 640 5th Avenue Property consists of both (i) a 22-story, Class A office building with multi-level retail space commonly known as 640 Fifth Avenue (the “Fifth Avenue Building”), and (ii) a two-story commercial building on the south side commonly known as 6 West 52nd Street (the “6 West 52nd Street Building”). The Fifth Avenue Building and the 6 West 52nd Street Building are interconnected and share certain paths of ingress and egress. The 640 5th Avenue Property (inclusive of the 6 West 52nd
| THE INFORMATION IN THIS STRUCTURAL AND COLLATERAL TERM SHEET IS NOT COMPLETE AND MAY BE AMENDED PRIOR TO THE TIME OF SALE. THIS TERM SHEET IS NOT AN OFFER TO SELL THESE SECURITIES AND IT IS NOT A SOLICITATION OF AN OFFER TO BUY THESE SECURITIES IN ANY JURISDICTION WHERE THE OFFER OR SALE IS NOT PERMITTED. | ||
| 49 | ||
| Mixed Use - Office/Retail | Loan #3 | Cut-off Date Balance: | $50,400,000 | |
| 640 5th Avenue | 640 5th Avenue | Cut-off Date LTV: | 41.7% | |
| New York, NY 10022 | U/W NCF DSCR: | 2.04x | ||
| U/W NOI Debt Yield: | 18.7% |
Street Building) totals 314,533 SF, which consists of 245,740 SF of office space (78.1% of NRA and 30.9% of underwritten base rent), 58,359 SF of retail space (18.6% of NRA and 67.8% of underwritten base rent) and 10,434 SF of storage space (3.3% of NRA and 1.2% of underwritten base rent). As of January 31, 2024, 91.7% of the office space (“Office NRA”) is leased to 15 tenants and 97.2% of the retail space (“Retail NRA”) and 97.4% of the storage space is leased to two tenants, Victoria’s Secret and Dyson. The Fifth Avenue Building includes retail spaces located on the first three levels of the building and office spaces on the remaining 19 levels of the building.
| Property Summary(1) | ||||||
| Space Type | Total SF | % Total SF | Occupancy | U/W Base Rent(2) | % of U/W Base Rent(2) | U/W Base Rent PSF(2)(3) |
| Office | 245,740 | 78.1% | 91.7% | $20,885,412 | 30.9% | $92.66 |
| Retail | 58,359 | 18.6% | 97.2% | $45,771,452 | 67.8% | $807.09 |
| Storage | 10,434 | 3.3% | 97.4% | $831,121 | 1.2% | $81.77 |
| Total / Wtd. Avg. | 314,533 | 100.0% | 92.9% | $67,487,985 | 100.0% | $230.91 |
| (1) | Based on the underwritten rent roll dated January 31, 2024. |
| (2) | U/W Base Rent, U/W Base Rent PSF and % of U/W Base Rent are inclusive of contractual rent steps through June 2025. |
| (3) | U/W Base Rent PSF excludes vacant space. |
The 640 5th Avenue Property has been the recipient of an Industrial and Commercial Tax Abatement (the “ICAP Tax Abatement”) that commenced on July 1, 2019 and is scheduled to end on July 1, 2029, which is set to be phased out beginning in July 2024. The ICAP Tax Abatement originally provided a 100% tax abatement of the 640 5th Avenue Property’s assessment value, which abatement amount will be reduced to 80.0% of such assessment value in July 2024, 60.0% in July 2025, 40.0% in July 2026 and 20.0% in July 2027 until termination. The total benefit from the ICAP Tax Abatement is estimated in the table below.
| ICAP Tax Abatement | ||||
| Tax Year | ICAP Year | ICAP Phase-out | ICAP Benefit | Reduction in Benefit |
| 2019/20 | 1 | 100% | $3,074,549 | $588,138 |
| 2020/21 | 2 | 100% | 3,074,549 | 588,138 |
| 2021/22 | 3 | 100% | 3,074,549 | 588,138 |
| 2022/23 | 4 | 100% | 3,074,549 | 588,138 |
| 2023/24 | 5 | 100% | 3,074,549 | 588,138 |
| 2024/25 | 6 | 80% | 2,459,639 | 470,511 |
| 2025/26 | 7 | 60% | 1,844,729 | 352,883 |
| 2026/27 | 8 | 40% | 1,229,820 | 235,255 |
| 2027/28 | 9 | 20% | 614,910 | 117,628 |
| 2028/29 | 10 | 20% | 614,910 | 117,628 |
| Total / Wtd Avg. | $22,136,752 | $4,234,597 | ||
| THE INFORMATION IN THIS STRUCTURAL AND COLLATERAL TERM SHEET IS NOT COMPLETE AND MAY BE AMENDED PRIOR TO THE TIME OF SALE. THIS TERM SHEET IS NOT AN OFFER TO SELL THESE SECURITIES AND IT IS NOT A SOLICITATION OF AN OFFER TO BUY THESE SECURITIES IN ANY JURISDICTION WHERE THE OFFER OR SALE IS NOT PERMITTED. | ||
| 50 | ||
| Mixed Use - Office/Retail | Loan #3 | Cut-off Date Balance: | $50,400,000 | |
| 640 5th Avenue | 640 5th Avenue | Cut-off Date LTV: | 41.7% | |
| New York, NY 10022 | U/W NCF DSCR: | 2.04x | ||
| U/W NOI Debt Yield: | 18.7% |
Major Tenants.
Victoria’s Secret (63,779 square feet; 20.3% of Total NRA; 92.1% of Retail NRA; 54.5% of underwritten base rent; 1/31/2032 lease expiration): Victoria’s Secret (NYSE: VSCO) is a clothing retailer specializing in selling intimate garments and undergarments. The company is the largest intimates retailer in the world and produces a range of products such as bras, panties, lingerie, swimwear and sleepwear, which are sold to customers across the United States and globally. Victoria’s Secret spun off L Brands in 2021 and reported a net income of $109 million on $6.182 billion of net sales in 2023. The 640 5th Avenue Property is the flagship location for Victoria’s Secret. Victoria’s Secret’s lease at the 640 5th Avenue Property commenced in February 2016, expires on January 31, 2032 and has one, 10-year renewal option and no termination options.
Dyson (3,097 square feet; 1.0% of Total NRA; 5.1% of Retail NRA; 14.6% of underwritten base rent; 8/27/2027 lease expiration): Dyson is a multi-national Singapore based appliances company. Dyson produces a range of products such as vacuum cleaners, hair care, air purifiers, headphones and lighting. Dyson was founded in 1991 and employs approximately 14,000 people. Dyson’s lease at the 640 5th Avenue Property commenced in March 2017, expires on August 27, 2027 and has no renewal or termination options.
The Klein Group LLC (30,103 square feet; 9.6% of Total NRA; 12.2% of Office NRA; 5.1% of underwritten base rent; 4/14/2034 lease expiration): The Klein Group LLC is a provider of brokerage services. The Klein Group LLC offers investment banking, trading, private placement of securities and investment advisory services. The Klein Group LLC’s lease at the 640 5th Avenue Property commenced in June 2015 and was amended in June 2018 and August 2022 to expand its leased space at the 640 5th Avenue Property. The lease is scheduled to expire on April 14, 2034, and the tenant has no renewal option. The Klein Group LLC has a two-time right to terminate its lease, effective either (i) December 31, 2027 or (ii) December 31, 2029, subject to, among other things, providing notice to the borrower no later than a year before the effective date of each such termination right, satisfaction of certain minimum occupancy and demise requirements under the lease, no event of default having occurred and continuing under the lease and the payment of a termination fee.
| THE INFORMATION IN THIS STRUCTURAL AND COLLATERAL TERM SHEET IS NOT COMPLETE AND MAY BE AMENDED PRIOR TO THE TIME OF SALE. THIS TERM SHEET IS NOT AN OFFER TO SELL THESE SECURITIES AND IT IS NOT A SOLICITATION OF AN OFFER TO BUY THESE SECURITIES IN ANY JURISDICTION WHERE THE OFFER OR SALE IS NOT PERMITTED. | ||
| 51 | ||
| Mixed Use - Office/Retail | Loan #3 | Cut-off Date Balance: | $50,400,000 | |
| 640 5th Avenue | 640 5th Avenue | Cut-off Date LTV: | 41.7% | |
| New York, NY 10022 | U/W NCF DSCR: | 2.04x | ||
| U/W NOI Debt Yield: | 18.7% |
The following table presents certain information relating to the tenants at the 640 5th Avenue Property:
Tenant Summary(1)
| Tenant Name | Tenant Type | Credit Rating (Fitch/ Moody's/ S&P)(2) | Tenant NRSF | % of NRSF | Annual U/W Rent(3) | % of Total Annual U/W Rent(3) | Annual U/W Rent PSF(3) | Term. Option (Y/N) | Lease Expiration Date | Ext. Options |
| Victoria's Secret | Retail and Storage | NR/Ba3/BB- | 63,779 | 20.3% | $36,763,592 | 54.5% | $576.42 | N | 1/31/2032 | 1 x 10 Yr |
| Dyson | Retail and Storage | NR/NR/NR | 3,097 | 1.0% | $9,838,981 | 14.6% | $3,176.94 | N | 8/27/2027 | None |
| The Klein Group LLC(4) | Office | NR/NR/NR | 30,103 | 9.6% | $3,461,845 | 5.1% | $115.00 | Y | 4/14/2034 | None |
| Fidelity Real Estate Company(5) | Office | NR/NR/NR | 40,615 | 12.9% | $3,249,200 | 4.8% | $80.00 | N | 11/30/2026 | None |
| Houlihan Lokey Advisors(6) | Office | NR/NR/NR | 12,875 | 4.1% | $1,442,000 | 2.1% | $112.00 | N | 6/30/2026 | 1 x 5 Yr |
| Abbot Capital Management | Office | NR/NR/NR | 20,019 | 6.4% | $1,361,292 | 2.0% | $68.00 | N | 12/31/2032 | 1 x 5 Yr |
| Buchanan Ingersoll & Rooney(7) | Office | NR/NR/NR | 16,816 | 5.3% | $1,345,280 | 2.0% | $80.00 | Y | 1/31/2029 | None |
| Hamlin Capital Mgmt LLC | Office | NR/NR/NR | 12,875 | 4.1% | $1,287,500 | 1.9% | $100.00 | N | 10/31/2029 | 1 x 5 Yr |
| C-Bridge Capital | Office | NR/NR/NR | 10,278 | 3.3% | $1,233,360 | 1.8% | $120.00 | N | 11/30/2026 | 1 x 5 Yr |
| Dune Real Estate Partners LP | Office | NR/NR/NR | 10,523 | 3.3% | $1,178,576 | 1.7% | $112.00 | N | 7/31/2026 | 1 x 5 Yr |
| HS Management Partners LLC | Office | NR/NR/NR | 10,523 | 3.3% | $1,178,576 | 1.7% | $112.00 | N | 9/30/2026 | None |
| Normura Greentech Capital(8) | Office | NR/NR/NR | 10,523 | 3.3% | $1,157,530 | 1.7% | $110.00 | N | 3/31/2026 | 1 x 5 Yr |
| Prospect Ridge Advisors(9) | Office | NR/NR/NR | 15,852 | 5.0% | $1,157,196 | 1.7% | $73.00 | Y | 12/31/2032 | 1 x 5 Yr |
| Avolon Aerospace (New York)(10) | Office | NR/NR/NR | 10,295 | 3.3% | $1,039,795 | 1.5% | $101.00 | N | 7/31/2029 | 1 x 5 Yr |
| Partners Capital Investment | Office | NR/NR/NR | 10,421 | 3.3% | $937,890 | 1.4% | $90.00 | N | 8/31/2030 | 1 x 5 Yr |
| Owl Creek Asset Management LP | Office | NR/NR/NR | 10,183 | 3.2% | $855,372 | 1.3% | $84.00 | N | 4/30/2025 | None |
| VNO Building Office | Office | NR/NR/NR | 3,497 | 1.1% | $0 | 0.0% | $0.00 | N | 12/31/2050 | None |
| Total/Wtd. Avg. | 292,274 | 92.9% | $67,487,985 | 100.0% | $230.91 | |||||
| Remaining Occupied | 0 | 0.0% | $0 | 0.0% | $0.00 | |||||
| Occupied Total | 292,274 | 92.9% | $67,487,985 | 100.0% | $230.91 | |||||
| Vacant Space | 22,259 | 7.1% | ||||||||
| Total/Wtd. Avg. | 314,533 | 100.0% |
| (1) | Based on the underwritten rent roll dated January 31, 2024, with contractual rent steps through June 2025. |
| (2) | In certain instances, ratings provided are those of the parent company of the entity shown, whether or not the parent company guarantees the lease. |
| (3) | Annual U/W Base Rent, Annual U/W Base Rent PSF and % of Total Annual U/W Base Rent are inclusive of contractual rent steps underwritten through June 2025. |
| (4) | The Klein Group LLC is entitled to $1,648,112 in free rent through February 2025. At origination, the borrower deposited $1,648,112 into the free rent reserve, which will be disbursed in accordance with the schedule set forth in the related loan documents. For more details, see “Description of the Mortgage Pool” in the Preliminary Prospectus. In addition, the tenant has a two-time right to terminate its lease, effective either (i) December 31, 2027 or (ii) December 31, 2029, subject to, among other things, providing notice to the borrower no later than a year before the effective date of each such termination right, satisfaction of certain minimum occupancy and demise requirements under the lease, no event of default having occurred and continuing under the lease and the payment of a termination fee. |
| (5) | Fidelity Real Estate Company has subleased 19,841 square feet to Advisor Group in Suite 401, which commenced on October 1, 2020, is scheduled to expire on October 31, 2026 and provides for approximately $907,726 in annual rent to Fidelity Real Estate Company. |
| (6) | Houlihan Lokey Advisors has subleased all of its 12,875 square feet to Triple P Services LLC in Suite 1000, which commenced on June 7, 2023, is scheduled to expire on June 29, 2026 and provides for $965,625 in annual rent to Houlihan Lokey Advisors. |
| (7) | Buchanan Ingersoll & Rooney has a one-time right to terminate its lease, effective January 2, 2026, subject to providing notice to the borrower no later than November 8, 2024 and the payment of a termination fee. |
| (8) | Normura Greentech Capital has subleased all of its 10,523 square feet to Kershner Trading Group in Suite 1600, which commenced on December 14, 2020, is scheduled to expire on March 30, 2026 and provides for $631,380 in annual rent to Nomura Greentech Capital. |
| (9) | Prospect Ridge Advisors has a one-time right to terminate its lease effective December 31, 2029, subject to providing notice to the borrower no later than October 7, 2028 and payment of a termination fee. |
| (10) | Avolon Aerospace (New York) has subleased all of its 10,295 square feet to Trinet USA in Suite 1900, which commenced on September 7, 2022, is scheduled to expire on June 30, 2029 and provides for $844,190 in annual rent to Avolon Aerospace (New York). |
| THE INFORMATION IN THIS STRUCTURAL AND COLLATERAL TERM SHEET IS NOT COMPLETE AND MAY BE AMENDED PRIOR TO THE TIME OF SALE. THIS TERM SHEET IS NOT AN OFFER TO SELL THESE SECURITIES AND IT IS NOT A SOLICITATION OF AN OFFER TO BUY THESE SECURITIES IN ANY JURISDICTION WHERE THE OFFER OR SALE IS NOT PERMITTED. | ||
| 52 | ||
| Mixed Use - Office/Retail | Loan #3 | Cut-off Date Balance: | $50,400,000 | |
| 640 5th Avenue | 640 5th Avenue | Cut-off Date LTV: | 41.7% | |
| New York, NY 10022 | U/W NCF DSCR: | 2.04x | ||
| U/W NOI Debt Yield: | 18.7% |
The following table presents certain information relating to the lease rollover schedule at the 640 5th Avenue Property:
Lease Expiration Schedule(1)(2)(3)
| Year Ending December 31 | No. of Leases Expiring | Expiring NRSF | % of Total NRSF | Cumulative Expiring NRSF | Cumulative % of Total NRSF | Annual U/W Base Rent(4) | % of Total Annual U/W Base Rent(4) | Annual U/W Base Rent PSF(4) |
| 2024 & MTM | 4 | 0 | 0.0% | 0 | 0.0% | $0 | 0.0% | $0.00 |
| 2025 | 1 | 10,183 | 3.2% | 10,183 | 3.2% | $855,372 | 1.3% | $84.00 |
| 2026 | 8 | 95,337 | 30.3% | 105,520 | 33.5% | $9,439,242 | 14.0% | $99.01 |
| 2027 | 1 | 3,097 | 1.0% | 108,617 | 34.5% | $9,838,981 | 14.6% | $3,176.94 |
| 2028 | 1 | 0 | 0.0% | 108,617 | 34.5% | $0 | 0.0% | $0.00 |
| 2029 | 3 | 39,986 | 12.7% | 148,603 | 47.2% | $3,672,575 | 5.4% | $91.85 |
| 2030 | 1 | 10,421 | 3.3% | 159,024 | 50.6% | $937,890 | 1.4% | $90.00 |
| 2031 | 0 | 0 | 0.0% | 159,024 | 50.6% | $0 | 0.0% | $0.00 |
| 2032 | 3 | 99,650 | 31.7% | 258,674 | 82.2% | $39,282,080 | 58.2% | $394.20 |
| 2033 | 0 | 0 | 0.0% | 258,674 | 82.2% | $0 | 0.0% | $0.00 |
| 2034 | 1 | 30,103 | 9.6% | 288,777 | 91.8% | $3,461,845 | 5.1% | $115.00 |
| 2035 & Beyond | 1 | 3,497 | 1.1% | 292,274 | 92.9% | $0 | 0.0% | $0.00 |
| Vacant | 0 | 22,259 | 7.1% | 314,533 | 100.0% | $0 | 0% | $0.00 |
| Total/Wtd. Avg. | 24(5) | 314,533 | 100.0% | $67,487,985 | 100.0% | $230.91(6) |
| (1) | Based on the underwritten rent roll dated January 31, 2024. |
| (2) | Lease Expiration Schedule is based on the lease expiration dates of all direct leases in place. Certain tenants have more than one lease. |
| (3) | Certain tenants may have termination or contraction options (which may become exercisable prior to the originally stated expiration date of the tenant lease) that are not considered in the above Lease Expiration Schedule. |
| (4) | Annual U/W Base Rent, % of Total Annual U/W Base Rent and Annual U/W Base Rent PSF are inclusive of contractual rent steps underwritten through June 2025. |
| (5) | The number of expiring leases includes 15 office tenants, two retail/storage tenants and seven other tenants, and excludes the Air Rights Lease (as defined below). No net rentable area or underwritten base rent is attributable to other tenants. |
| (6) | Excludes vacant space. |
The following table presents historical occupancy percentages at the 640 5th Avenue Property:
Historical Occupancy
| Historical and Current Occupancy(1) | |||
| 2021 | 2022 | 2023 | Current(2) |
| 85.8% | 93.4% | 92.6% | 92.9% |
| (4) | Historical occupancies are as of December 31 of each respective year. |
| (5) | Current Occupancy is as of January 31, 2024. |
| THE INFORMATION IN THIS STRUCTURAL AND COLLATERAL TERM SHEET IS NOT COMPLETE AND MAY BE AMENDED PRIOR TO THE TIME OF SALE. THIS TERM SHEET IS NOT AN OFFER TO SELL THESE SECURITIES AND IT IS NOT A SOLICITATION OF AN OFFER TO BUY THESE SECURITIES IN ANY JURISDICTION WHERE THE OFFER OR SALE IS NOT PERMITTED. | ||
| 53 | ||
| Mixed Use - Office/Retail | Loan #3 | Cut-off Date Balance: | $50,400,000 | |
| 640 5th Avenue | 640 5th Avenue | Cut-off Date LTV: | 41.7% | |
| New York, NY 10022 | U/W NCF DSCR: | 2.04x | ||
| U/W NOI Debt Yield: | 18.7% |
Operating History and Underwritten Net Cash Flow. The following table presents certain information relating to the historical operating performance and underwritten net cash flow at the 640 5th Avenue Property:
Cash Flow Analysis(1)
| 2019 | 2020 | 2021 | 2022 | 2023 | U/W | %(2) | U/W $ per SF | ||
| Base Rent | $60,784,545 | $61,607,022 | $59,918,692 | $61,922,806 | $64,089,076 | $65,997,448 | 85.2 | % | $209.83 |
| Free Rent | (1,626,528) | 0 | (334,847) | (2,247,718) | (730,003) | 0 | 0.0 | $0.00 | |
| Percentage Rent | (73,405) | 0 | 0 | 0 | 0 | 0 | 0.0 | $0.00 | |
| Rent Steps | 0 | 0 | 0 | 0 | 0 | 1,490,537 | 1.9 | $4.74 | |
| Recovery Income | 4,318,055 | 5,394,737 | 5,869,822 | 6,714,695 | 7,448,692 | 8,824,722 | 11.4 | $28.06 | |
| Other Income(3) | 1,189,908 | 1,200,647 | 1,197,940 | 1,181,296 | 1,229,121 | 1,166,319 | 1.5 | $3.71 | |
| Gross Potential Rent | $64,592,575 | $68,202,405 | $66,651,606 | $67,571,078 | $72,036,886 | $77,479,026 | 100.0 | % | $246.33 |
| (Vacancy/Credit Loss/Abatements) | 0 | (1,465) | 0 | 0 | 0 | 0 | 0.0 | $0.00 | |
| Effective Gross Income | $64,592,575 | $68,200,940 | $66,651,606 | $67,571,078 | $72,036,886 | $77,479,026 | 100.0 | % | $246.33 |
| Total Expenses(4) | 16,729,042 | 16,676,459 | 17,827,438 | 19,799,244 | 18,237,231 | 21,293,412 | 27.5 | $67.70 | |
| Net Operating Income(5)(6) | $47,863,533 | $51,524,481 | $48,824,168 | $47,771,835 | $53,799,655 | $56,185,614 | 72.5 | % | $178.63 |
| Capital Expenditures | 0 | 0 | 0 | 0 | 0 | 78,633 | 0.1 | $0.25 | |
| TI/LC | 0 | 0 | 0 | 0 | 0 | 7,574,210 | 9.8 | $24.08 | |
| Net Cash Flow | $47,863,533 | $51,524,481 | $48,824,168 | $47,771,835 | $53,799,655 | $48,532,770 | 62.6 | % | $154.30 |
| (1) | Based on the underwritten rent roll dated January 31, 2024, with contractual rent steps through June 2025. |
| (2) | % column represents percent of Gross Potential Rent for revenue lines and percent of Effective Gross Income for all remaining fields. |
| (3) | Other Income is based on the borrower’s 2024 budget and is largely comprised of the Air Rights Lease income paid in the form of a fixed annual lease payment to the borrower from the adjacent building. Income from the Air Rights Lease as of the end of 2023 was approximately $1.2 million. |
| (4) | Tax benefits from the ICAP Tax Abatement were underwritten based on the borrower-provided ICAP tax abatement schedule. |
| (5) | The 640 5th Avenue Property receives an annual fixed rent payment from the Air Rights Tenant (the fee owner of the real property known as 650 Fifth Avenue), pursuant to the related ground leases (collectively, the “Air Rights Lease”) that expire on July 30, 2070. The annual rent from the Air Rights Lease as of July 1, 2024 is $1,166,319 per annum, payable monthly in instalments of $97,193.25. Annual rent must reset as of August 1, 2024 and must be in an amount equal to the greater of the rental rate for the prior period (i.e., $1,166,319 per annum) or an amount equal to 1.6065% of the fair value of the combined land under the 650 Fifth Avenue building and the 6 West 52nd Street Building as determined by a qualified, third-party appraisal (the “Appraised Rental”) which valuation is required to be as of February 1, 2024. As of the date of the loan agreement, the borrower and the Air Rights Tenant are in continuing negotiations regarding the amount of the Appraised Rental, provided, however, that such amount may not be no lower than the rental rate for the prior period (i.e., $1,166,319 per annum). If the Appraised Rental is not finalized by August 1, 2024, the Air Rights Tenant will be required to continue to pay rent at the prior rental rate (i.e., $1,166,319 per annum), and upon determination of the Appraised Rental (assuming such rate is higher than the rental rate for the prior period), the Air Rights Tenant will pay the difference between the Appraised Rental and the rent paid on account for all months elapsed theretofore on the first day of the month following such determination. Upon resolution of the final rental rate, such rental rate will remain in effect through July 31, 2047, after which time the rental rate will again be the greater of the rental for the prior period or 1.6065% of the fair value of the combined land under the 650 Fifth Avenue building and the 6 West 52nd Street Building. |
| (6) | Base rent for two of the retail suites is above market. Based on the appraiser’s market rents for these two suites, the Underwritten Net Operating Income would be approximately $46,959,997. The 640 5th Avenue Whole Loan underwritten NOI Debt Yield would decrease from 18.7% to 15.7% and the underwritten NOI Debt Service Coverage Ratio would decrease from 2.37x to 1.98x. |
Appraisal. According to the appraisal dated May 7, 2024, the 640 5th Avenue Property had an “As-Is” appraised value of $720,000,000 as of February 28, 2024.
Environmental. According to the Phase I environmental assessment dated April 17, 2024, there was no evidence of any recognized environmental conditions at the 640 5th Avenue Property.
Market Overview and Competition. The 640 5th Avenue Property is located in New York, New York, more specifically in the Manhattan retail market. The Manhattan retail market has regressed since the pandemic, but not as strongly as the office market. The retail market is driven by Manhattan’s pedestrians and tourists. According to the appraisal, New York City expects to welcome 63.2 million visitors in 2023, and total city visitors will surpass 2019 levels by 2024. The 640 5th Avenue Property is situated on upper Fifth Avenue, one of the most well-known retail areas in the United States. Notable features in the proximate area of the 640 5th Avenue Property include Rockefeller Center, 4.7 million square feet of Class A office space, the New York Public Library, a Ritz-Carlton hotel and conference center, Central Park and luxury residential buildings. As of the fourth quarter of 2023, total leasing velocity in the market increased 6.6% year-over-year with an average annual leasing velocity of 2.9 million square feet. The 640 5th Avenue Property is also located in the Manhattan office market, which has been practically brought to a halt since March 2020. According to the appraisal, as of the fourth quarter of 2023, the Manhattan office vacancy rate reached 12.8% with an availability rate of 18.5%. According to the appraisal, the 2023 total population within a 0.25-, 0.5- and one-mile radii of the 640 5th Avenue Property was 1,772, 25,066 and 200,745, respectively, and the 2023 median household income within the same radii was $129,959, $135,306 and $124,189, respectively.
| THE INFORMATION IN THIS STRUCTURAL AND COLLATERAL TERM SHEET IS NOT COMPLETE AND MAY BE AMENDED PRIOR TO THE TIME OF SALE. THIS TERM SHEET IS NOT AN OFFER TO SELL THESE SECURITIES AND IT IS NOT A SOLICITATION OF AN OFFER TO BUY THESE SECURITIES IN ANY JURISDICTION WHERE THE OFFER OR SALE IS NOT PERMITTED. | ||
| 54 | ||
| Mixed Use - Office/Retail | Loan #3 | Cut-off Date Balance: | $50,400,000 | |
| 640 5th Avenue | 640 5th Avenue | Cut-off Date LTV: | 41.7% | |
| New York, NY 10022 | U/W NCF DSCR: | 2.04x | ||
| U/W NOI Debt Yield: | 18.7% |
According to a third-party report, the 640 5th Avenue Property is located in the Fifth Avenue retail submarket, ranging from Saks Fifth Avenue (East 50th Street) to the GM Building (East 60th Street). According to the appraisal, this area is identified as one of the top five most expensive retail corridors in the world. As of the fourth quarter of 2023, the Fifth Avenue retail submarket had an availability rate of 17.1%, which is consistent with the previous quarter. The average asking rent was $1,201 per square foot, a decrease over the asking rent of $1,345 per square foot from the previous quarter.
According to a third-party report, the 640 5th Avenue Property is located in the Plaza District office submarket. As of the fourth quarter of 2023, the Plaza District office submarket had an inventory of 26.2 million square feet with a 13.6% vacancy rate. The average asking rent was $111.15 per square foot, an increase over the asking rent of $95.83 per square foot from the previous year.
The following table presents certain information relating to comparable retail leases for the 640 5th Avenue Property:
Comparable Retail Rental Summary(1)
| Property Address/Location | Year Built / Renovated | Gross Building Area (SF) | Tenant Size (SF) | Tenant Name | Annual Base Rent PSF | Commencement | Lease Term (Months) |
| 640 5th Avenue | 1949 / 2003 | 314,533(2) | 63,779(2) | Victoria’s Secret | $576.42(2) | Feb-16(2) | 192.0(2) |
| New York, NY | |||||||
| 691 Madison Avenue | NAV | NAV | 23,339 | Dolce & Gabanna | $514.16 | Q4-23 | 180.0 |
| New York, NY | |||||||
| 693 Fifth Avenue | NAV | NAV | 14,761 | Burberry | $372.60 | Q1-23 | 20.0 |
| New York, NY | |||||||
| 690 Madison Avenue | NAV | NAV | 7,848 | Van Cleef and Arpels | $573.39 | Q1-23 | 120.0 |
| New York, NY | |||||||
| 140 West 57th Street | NAV | NAV | 15,482 | Morton Williams | $108.15 | Q3-22 | 180.0 |
| New York, NY | |||||||
| 645 Fifth Avenue | NAV | NAV | 2,320 | Tag Heuer | $1,185.34 | Q3-22 | 132.0 |
| New York, NY | |||||||
| 680 Fifth Avenue | NAV | NAV | 14,000 | Swarovski | $500.00 | Q1-22 | 132.0 |
| New York, NY | |||||||
| 144 West 46th Street | NAV | NAV | 4,500 | Gossip Bar | $93.33 | Q3-21 | 144.0 |
| New York, NY | |||||||
| 660 Fifth Avenue | NAV | NAV | 8,071 | Citibank (Side Street) | $164.75 | Q1-21 | 123.0 |
| New York, NY | |||||||
| 721-725 Fifth Avenue | NAV | NAV | 48,167 | Gucci | $519.03 | Q1-21 | 84.0 |
| New York, NY | |||||||
| 730 Fifth Avenue | NAV | NAV | 2,808 4,505 | Chopard Mikimoto | $1,673.79 $958.94 | Q3-20 Q2-19 | 120.0 120.0 |
| New York, NY | |||||||
| 685 Fifth Avenue | NAV | NAV | 896 | Tag Heuer | $3,000.00 | Q1-20 | 36.0 |
| New York, NY |
| (1) | Information obtained from the appraisal unless otherwise indicated. |
| (2) | Based on the underwritten rent roll dated January 31, 2024. Annual Base Rent PSF includes contractual rent steps through June 2025. |
| THE INFORMATION IN THIS STRUCTURAL AND COLLATERAL TERM SHEET IS NOT COMPLETE AND MAY BE AMENDED PRIOR TO THE TIME OF SALE. THIS TERM SHEET IS NOT AN OFFER TO SELL THESE SECURITIES AND IT IS NOT A SOLICITATION OF AN OFFER TO BUY THESE SECURITIES IN ANY JURISDICTION WHERE THE OFFER OR SALE IS NOT PERMITTED. | ||
| 55 | ||
| Mixed Use - Office/Retail | Loan #3 | Cut-off Date Balance: | $50,400,000 | |
| 640 5th Avenue | 640 5th Avenue | Cut-off Date LTV: | 41.7% | |
| New York, NY 10022 | U/W NCF DSCR: | 2.04x | ||
| U/W NOI Debt Yield: | 18.7% |
The following table presents certain information relating to comparable office leases for the 640 5th Avenue Property:
Comparable Office Rental Summary(1)
| Property Address/Location | Year Built / Renovated | Gross Building Area (SF) | Tenant Size (SF) | Tenant Name | Annual Base Rent PSF | Commencement | Lease Term (Months) |
| 640 5th Avenue New York, NY | 1949 / 2003 | 314,533(2) | 40,615(2) | Fidelity Real Estate Company | $80.00(2) | Dec-16(2) | 120.0(2) |
745 Fifth Avenue New York, NY | 1930 / 1989 | 535,451 | 11,227 12,400 12,307 | Fundamental Advisors Hakluyt and Company Hildred Capital | $105.45 $95.91 $69.31 | Feb-24 Dec-23 Jul-23 | 130.0 135.0 132.0 |
| 360 Madison Avenue New York, NY | 1981 / 2002 | 373,000 | 14,883 | Vestwell | $64.38 | Nov-23 | 135.0 |
| 40 West 57th Street New York, NY | 1972 / NAP | 712,000 | 25,000 | Access Industries | $88.31 | Nov-23 | 134.0 |
| 1 Rockefeller Plaza New York, NY | 1936 / NAP | 655,350 | 19,468 | Ingalls & Snyder | $66.36 | Oct-23 | 132.0 |
| 767 Fifth Avenue New York, NY | 1968 / 2019 | 1,965,003 | 15,445 48,000 38,100 | Balyasny Asset Management L.P. CVC Capital Partners Grosvenor Capital | $101.82 $87.84 $94.67 | Sep-23 Sep-23 Jun-23 | 130.0 200.0 180.0 |
510 Madison Avenue New York, NY | 2009 / 2012 | 355,089 | 5,891 | Granger Management Holdings LLC | $100.29 | Sep-23 | 82.0 |
545 Madison Avenue New York, NY | 1955 / 2021 | 153,583 | 7,000 | Helix Partners Management | $79.20 | May-23 | 60.0 |
595 Madison Avenue New York, NY | 1929 / 2011 | 331,000 | 13,227 | Matouk | $55.48 | Apr-23 | 120.0 |
590 Madison Avenue New York, NY | 1982 / 2006 | 1,049,759 | 25,030 | Schonfeld Securities, LLC | $79.52 | Mar-23 | 96.0 |
535 Madison Avenue | 1982 / NAP | 548,530 | 14,875 | The Lanier Law Firm | $69.39 | Jan-23 | 130.0 |
| (1) | Information obtained from the appraisal unless otherwise indicated. |
| (2) | Based on the underwritten rent roll dated January 31, 2024. Annual Base Rent PSF includes contractual rent steps through June 2025. |
Escrows. At origination of the 640 5th Avenue Whole Loan, the borrower deposited $1,567,900 for tenant improvements and leasing commissions and approximately $1,648,112 for free rent reserves.
Tax Escrows – On a monthly basis during a Trigger Period (as defined below), the borrower is required to escrow 1/12th of the estimated annual real estate tax payments.
Insurance Escrows – On a monthly basis during a Trigger Period, the borrower is required to escrow 1/12th of the annual estimated insurance payments. Such reserve has been conditionally waived so long as the borrower maintains a blanket policy meeting the requirements of the 640 5th Avenue Whole Loan documents and the borrower provides evidence of the renewal of any insurance policy prior to the expiration thereof and receipts for the payment of the applicable premiums.
Replacement Reserve – On a monthly basis during a Trigger Period, the borrower is required to escrow approximately $8,134 for the payment or reimbursement of approved capital expenses. Such monthly deposits will not be required during such time that the balance of the capital expense reserve exceeds approximately $195,217.
Rollover Reserve – On a monthly basis, the borrower is required to escrow $500,000 for approved leasing expenses. Such monthly deposits will not be required during such time that the balance of the capital expense reserve exceeds approximately $15,000,000.
Free Rent Reserve – Provided that no event of default exists, on each monthly payment date, the free rent funds deposited for each applicable lease will be disbursed in the amounts equal to the applicable monthly rent credits or free rent amounts set forth in the 640 5th Avenue Whole Loan documents.
| THE INFORMATION IN THIS STRUCTURAL AND COLLATERAL TERM SHEET IS NOT COMPLETE AND MAY BE AMENDED PRIOR TO THE TIME OF SALE. THIS TERM SHEET IS NOT AN OFFER TO SELL THESE SECURITIES AND IT IS NOT A SOLICITATION OF AN OFFER TO BUY THESE SECURITIES IN ANY JURISDICTION WHERE THE OFFER OR SALE IS NOT PERMITTED. | ||
| 56 | ||
| Mixed Use - Office/Retail | Loan #3 | Cut-off Date Balance: | $50,400,000 | |
| 640 5th Avenue | 640 5th Avenue | Cut-off Date LTV: | 41.7% | |
| New York, NY 10022 | U/W NCF DSCR: | 2.04x | ||
| U/W NOI Debt Yield: | 18.7% |
Lockbox / Cash Management. The 640 5th Avenue Whole Loan is structured with a hard lockbox and in-place cash management. The borrower was required to deliver tenant direction letters to the existing tenants at the 640 5th Avenue Property, directing them to remit their rent directly to the lender-controlled lockbox. The borrower is required to cause revenue received by the borrower or the property manager, as applicable, from the 640 5th Avenue Property to be deposited into such lockbox within 10 business days. All funds in the lockbox account are required to be swept each business day into the lender-controlled cash management account and applied and disbursed in accordance with the 640 5th Avenue Whole Loan documents. All excess cash flow will be deposited, (A) provided no Trigger Period is continuing (i) for so long as the 640 5th Avenue Mezzanine Loan remains outstanding, into the 640 5th Avenue Mezzanine Loan subaccount, or (ii) following the repayment in full of the 640 5th Avenue Mezzanine Loan, into the borrower’s account, or (B) during the continuance of a Trigger Period, into the excess cash trap subaccount held by the lender.
A “Trigger Period” means a period commencing upon the earliest to occur of (i) an event of default under the 640 5th Avenue Whole Loan or the 640 5th Avenue Mezzanine Loan, (ii) a Low Debt Yield Trigger Period (as defined below) or (iii) a Victoria’s Secret Event Period (as defined below), and ending if, with respect to a Trigger Period continuing pursuant to (A) clause (i), the event of default commencing the Trigger Period has been cured or waived and such cure has been accepted by the applicable lender or the applicable lender has waived such event of default in writing, and no other event of default is then continuing, (B) clause (ii), the Low Debt Yield Trigger Period has ended and (C) clause (iii), such Victoria’s Secret Event Period has ended.
A “Low Debt Yield Trigger Period” means a period commencing if, as of the last day of any calendar quarter, the NOI Debt Yield (as defined below) is less than 10.0%, and ending if the NOI Debt Yield is equal to or in excess of 10.0% on any subsequent calculation date; provided, however, that a Low Debt Yield Trigger Period will be deemed not to exist as of such related calculation date if, not later than 15 business days after the borrower’s receipt of notice from the lender that a Low Debt Yield Trigger Period has commenced, the borrower (a) prepays a portion of the 640 5th Avenue Whole Loan, along with any yield maintenance premium, and the 640 5th Avenue Mezzanine Loan in accordance with the terms of the 640 5th Avenue Mezzanine Loan documents, which amount will be applied, in each case, on a pro rata basis to the 640 5th Avenue Whole Loan and the 640 5th Avenue Mezzanine Loan, or (b) delivers to the lender as additional collateral for the 640 5th Avenue Whole Loan, either (i) cash, which must be deposited into, or retained in, the cash collateral account, or (ii) a letter of credit in lieu of cash, in each case, in an amount equal to the Low Debt Yield Avoidance Amount (as defined below). If the borrower delivers to the lender such Low Debt Yield Avoidance Collateral (as defined below), then for so long as the lender holds such Low Debt Yield Avoidance Collateral, the NOI Debt Yield will be calculated based on the assumption that the outstanding principal balance of the 640 5th Avenue Whole Loan has been reduced by the value of the Low Debt Yield Avoidance Collateral, such value being the amount of cash or notional amount of any letter of credit.
The “NOI Debt Yield” means, as of any date of determination, a fraction, expressed as a percentage, of which (a) the numerator is the underwritten net operating income as of such date; and (b) the denominator is the sum of the outstanding principal balances, as of such date, of (A) the 640 5th Avenue Whole Loan and (B) the 640 5th Avenue Mezzanine Loan.
A “Low Debt Yield Avoidance Amount” means, at any point in time, the amount that when applied on a pro rata basis to the reduction of the then-current outstanding principal balance of the 640 5th Avenue Whole Loan and the then-current outstanding principal balance of the 640 5th Avenue Mezzanine Loan would cause the NOI Debt Yield to equal at least 10.0%, taking into account the aggregate amount of Low Debt Yield Avoidance Collateral previously provided by the borrower and then held by the lender.
“Low Debt Yield Avoidance Collateral” means (i) cash or (ii) a letter of credit in lieu of cash, in each case, in an amount equal to the Low Debt Yield Avoidance Amount.
A ”Victoria’s Secret Event Period” will (i) commence upon the occurrence, as applicable, of (x) a bankruptcy or other insolvency proceeding, whether voluntary or involuntary, with respect to the Victoria’s Secret tenant or any guarantor of the Victoria’s Secret lease, or (y) the Victoria’s Secret tenant discontinues normal business operations at the Victoria’s Secret leased space, other than a temporary cessation of business operations for permitted alterations, renovations, necessary repairs or restoration following casualty, provided that in any such case the Victoria’s Secret tenant continues to pay all contractual rent, and (ii) will end upon the first to occur of (a) in the event the Victoria’s Secret Event Period commenced due to a bankruptcy or other insolvency proceeding, the affirmation of the Victoria’s Secret lease in such applicable proceeding, provided that the Victoria’s Secret tenant is actually paying all rents and other amounts due under the Victoria’s Secret lease, (b) in the event the Victoria’s Secret Event Period commenced due to a vacancy at the Victoria’s Secret leased space, the Victoria’s Secret tenant re-commences normal business operations at the Victoria’s Secret leased space in accordance with the terms and conditions of the Victoria’s Secret lease and (c) the date on which the entirety of the Victoria’s Secret space is leased to one or more replacement tenants that are acceptable to the lender.
Real Estate Substitution. Not permitted.
Partial Release. Not permitted.
Current Mezzanine or Secured Subordinate Indebtedness. Concurrently with the origination of the 640 5th Avenue Whole Loan, a $100,000,000 mezzanine loan (the “640 5th Avenue Mezzanine Loan” and together with the 640 5th Avenue Whole Loan, the “640 5th Avenue Total Debt”) was funded by MSBNA and GSBI, which is secured by the mezzanine borrower’s direct equity interests in the borrower. The mezzanine borrower is required under the 640 5th Avenue Mezzanine Loan to make monthly payments to the Mezzanine Lenders equal to (x) principal in the amount of approximately $145,833 and (y) the monthly interest payment. The 640 5th Avenue Mezzanine Loan accrues interest at a rate of 11.50000% per annum and is coterminous with the 640 5th Avenue Whole Loan.
Permitted Future Mezzanine or Secured Subordinate Indebtedness. Not permitted.
| THE INFORMATION IN THIS STRUCTURAL AND COLLATERAL TERM SHEET IS NOT COMPLETE AND MAY BE AMENDED PRIOR TO THE TIME OF SALE. THIS TERM SHEET IS NOT AN OFFER TO SELL THESE SECURITIES AND IT IS NOT A SOLICITATION OF AN OFFER TO BUY THESE SECURITIES IN ANY JURISDICTION WHERE THE OFFER OR SALE IS NOT PERMITTED. | ||
| 57 | ||
| Mixed Use - Office/Retail | Loan #3 | Cut-off Date Balance: | $50,400,000 | |
| 640 5th Avenue | 640 5th Avenue | Cut-off Date LTV: | 41.7% | |
| New York, NY 10022 | U/W NCF DSCR: | 2.04x | ||
| U/W NOI Debt Yield: | 18.7% |
Property Management. The 640 5th Avenue Property is managed by Vornado Office Management LLC, a borrower sponsor affiliate.
Ground Lease. A prior owner of the 640 5th Avenue Property ground leased the 640 5th Avenue Property to the Air Rights Tenant, and the Air Rights Tenant who subleased the 640 5th Avenue Property (other than development rights relating to one of the two buildings comprising the 640 5th Avenue Property, which were retained by the Air Rights Tenant) back to such prior owner of the 640 5th Avenue Property, solely for purposes of satisfying certain zoning requirements in connection with the transfer of such development rights to the Air Rights Tenant. The borrower receives an annual fixed rent payment from the Air Rights Tenant pursuant to the Air Rights Lease that expires on July 30, 2070. The annual rent from the Air Rights Lease is calculated as described in “Operating History and Underwritten Net Cash Flow” above. See “Description of the Mortgage Pool—Mortgage Pool Characteristics—Fee & Leasehold Estates; Ground Leases” in the Preliminary Prospectus.
Terrorism Insurance. The 640 5th Avenue Whole Loan documents require that the “all risk” insurance policy required to be maintained by the borrower provides coverage for terrorism in an amount equal to the full replacement cost of the 640 5th Avenue Property, as well as business interruption insurance covering no less than the 24-month period following the occurrence of a casualty event, together with a 12-month extended period of indemnity (provided that if TRIPRA or a similar statute is not in effect, the borrower will not be obligated to pay terrorism insurance premiums in excess of the greater of (i) the product of the rate of $0.10 per $100 times the lesser of (a) the outstanding principal balance and (b) sum of 100% of the full replacement cost and the amount of rental loss and/or business income interruption insurance required pursuant to the 640 5th Avenue Whole Loan documents and (ii) two times the annual premium for the casualty and business interruption coverage (without giving effect to the cost of terrorism, flood and earthquake and business interruption components of such coverage)).
| THE INFORMATION IN THIS STRUCTURAL AND COLLATERAL TERM SHEET IS NOT COMPLETE AND MAY BE AMENDED PRIOR TO THE TIME OF SALE. THIS TERM SHEET IS NOT AN OFFER TO SELL THESE SECURITIES AND IT IS NOT A SOLICITATION OF AN OFFER TO BUY THESE SECURITIES IN ANY JURISDICTION WHERE THE OFFER OR SALE IS NOT PERMITTED. | ||
| 58 | ||
| Multifamily – Various | Loan #4 | Cut-off Date Balance: | $50,000,000 | |
| Property Addresses - Various | Lotus 315 & Essence 144 | Cut-off Date LTV: | 69.6% | |
| East Orange, NJ 07018 | U/W NCF DSCR: | 1.23x | ||
| U/W NOI Debt Yield: | 8.1% |
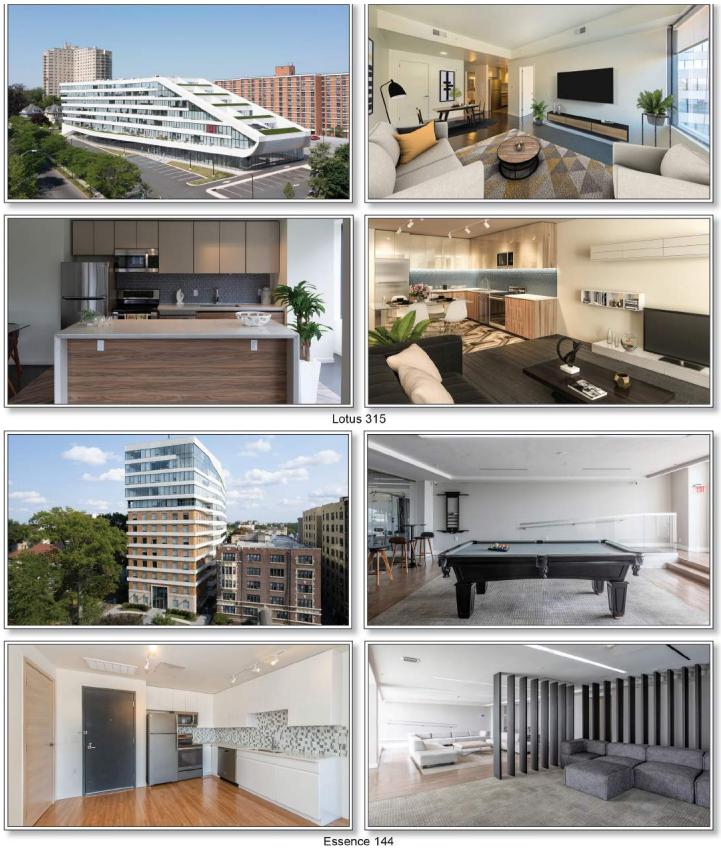
| THE INFORMATION IN THIS STRUCTURAL AND COLLATERAL TERM SHEET IS NOT COMPLETE AND MAY BE AMENDED PRIOR TO THE TIME OF SALE. THIS TERM SHEET IS NOT AN OFFER TO SELL THESE SECURITIES AND IT IS NOT A SOLICITATION OF AN OFFER TO BUY THESE SECURITIES IN ANY JURISDICTION WHERE THE OFFER OR SALE IS NOT PERMITTED. | ||
| 59 | ||
| Multifamily – Various | Loan #4 | Cut-off Date Balance: | $50,000,000 | |
| Property Addresses - Various | Lotus 315 & Essence 144 | Cut-off Date LTV: | 69.6% | |
| East Orange, NJ 07018 | U/W NCF DSCR: | 1.23x | ||
| U/W NOI Debt Yield: | 8.1% |
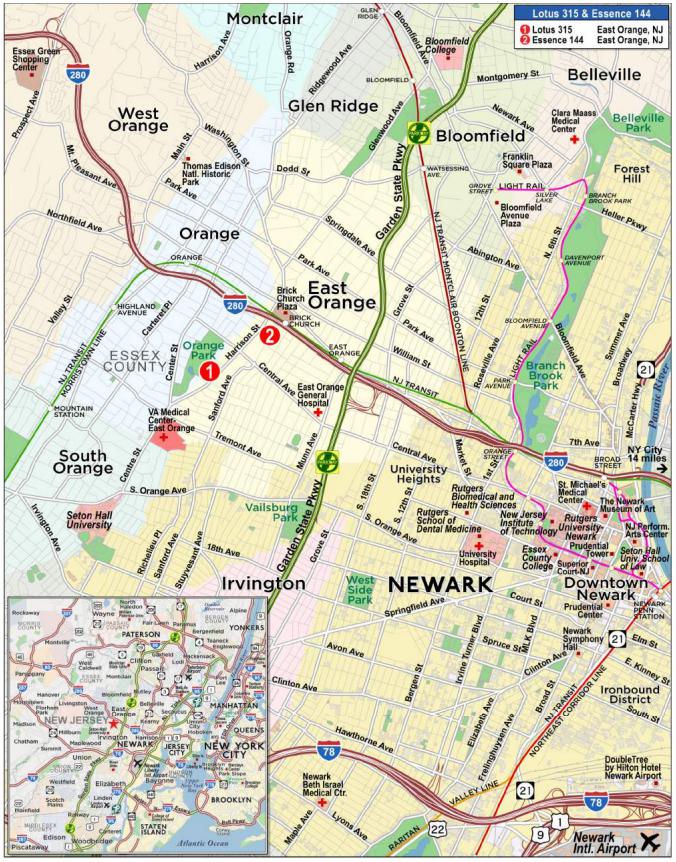
| THE INFORMATION IN THIS STRUCTURAL AND COLLATERAL TERM SHEET IS NOT COMPLETE AND MAY BE AMENDED PRIOR TO THE TIME OF SALE. THIS TERM SHEET IS NOT AN OFFER TO SELL THESE SECURITIES AND IT IS NOT A SOLICITATION OF AN OFFER TO BUY THESE SECURITIES IN ANY JURISDICTION WHERE THE OFFER OR SALE IS NOT PERMITTED. | ||
| 60 | ||
| No. 4 – Lotus 315 & Essence 144 |
| Mortgage Loan Information | Mortgaged Property Information | ||||||
| Mortgage Loan Seller: | Citi Real Estate Funding Inc. | Single Asset/Portfolio: | Portfolio | ||||
| Credit Assessment (Fitch/KBRA/Moody’s): | NR/NR/NR | Property Type – Subtype(4): | Multifamily – Various | ||||
| Original Principal Balance(1): | $50,000,000 | Location: | East Orange, NJ | ||||
| Cut-off Date Balance(1): | $50,000,000 | Size: | 336 Units | ||||
| % of Initial Pool Balance: | 6.8% | Cut-off Date Balance Per Unit(1): | $256,250 | ||||
| Loan Purpose: | Refinance | Maturity Date Balance Per Unit(1): | $256,250 | ||||
| Borrower Sponsors: | Syed A. Hasan and Ayesha Wahidy | Year Built/Renovated(5): | Various/NAP | ||||
| Guarantors: | Syed A. Hasan and Ayesha Wahidy | Title Vesting: | Fee | ||||
| Mortgage Rate: | 6.4200% | Property Manager: | Blackstone Realty Management LLC | ||||
| Note Date: | June 3, 2024 | Current Occupancy (As of)(6): | 96.4% (6/1/2024) | ||||
| Seasoning: | 1 month | YE 2023 Occupancy: | 91.6% | ||||
| Maturity Date: | June 6, 2029 | YE 2022 Occupancy: | 92.7% | ||||
| IO Period: | 60 months | YE 2021 Occupancy: | NAV | ||||
| Loan Term (Original): | 60 months | YE 2020 Occupancy: | NAV | ||||
| Amortization Term (Original): | NAP | As-Is Appraised Value(7): | $123,700,000 | ||||
| Loan Amortization Type: | Interest Only | As-Is Appraised Value Per Unit(7): | $368,155 | ||||
| Call Protection: | L(25),D(28),O(7) | As-Is Appraisal Valuation Date(7): | Various | ||||
| Lockbox Type: | Springing/Springing Cash Management | ||||||
| Additional Debt(1): | Yes | Underwriting and Financial Information | |||||
| Additional Debt Type (Balance)(1): | Pari Passu ($36,100,000) | TTM 4/30/2024 NOI(8): | $5,870,649 | ||||
| YE 2023 NOI: | $5,659,568 | ||||||
| YE 2022 NOI: | $5,603,876 | ||||||
| YE 2021 NOI: | NAV | ||||||
| U/W Revenues: | $9,423,831 | ||||||
| U/W Expenses: | $2,452,429 | ||||||
| U/W NOI(8): | $6,971,402 | ||||||
| Escrows and Reserves(2) | U/W NCF: | $6,867,456 | |||||
| Initial | Monthly | Cap | U/W DSCR based on NOI/NCF(1): | 1.24x/ 1.23x | |||
| Taxes: | $116,278 | $58,139 | NAP | U/W Debt Yield based on NOI/NCF(1): | 8.1%/ 8.0% | ||
| Insurance: | $38,489 | $6,415 | NAP | Cut-off Date LTV Ratio(1): | 69.6% | ||
| TI / LC: | $0 | $1,350 | NAP | LTV Ratio at Maturity(1): | 69.6% | ||
| Replacement Reserve: | $0 | $8,537 | NAP | ||||
| Other(3): | $1,225,000 | $0 | NAP | ||||
| Sources and Uses | |||||||||
| Sources | Proceeds | % of Total | Uses | Proceeds | % of Total | ||||
| Whole Loan Amount | $86,100,000 | 100.0% | Loan Payoff | $78,827,137 | 91.6 | % | |||
| Closing Costs | 4,010,102 | 4.7 | |||||||
| Return of Equity | 1,882,994 | 2.2 | |||||||
| Upfront Reserves | 1,379,767 | 1.6 | |||||||
| Total Sources | $86,100,000 | 100.0% | Total Uses: | $86,100,000 | 100.0 | % | |||
| (1) | The Lotus 315 & Essence 144 Mortgage Loan (as defined below) is part of the Lotus 315 & Essence 144 Whole Loan (as defined below), which is comprised of two pari passu promissory notes with an aggregate original principal balance of $86,100,000. The Cut-off Date Balance Per Unit, Maturity Date Balance Per Unit, U/W DSCR based on NOI/NCF, U/W Debt Yield based on NOI/NCF, Cut-off Date LTV Ratio and LTV Ratio at Maturity presented above are based on the aggregate Cut-off Date principal balance of the Lotus 315 & Essence 144 Whole Loan. |
| (2) | See “Escrows” below. |
| (3) | Other Reserves include an initial (i) upfront holdback reserve of $1,000,000, (ii) upfront free rent reserve of $141,750 and (iii) upfront gap rent reserve of $83,250. See “Escrows” below. |
| (4) | The Lotus 315 Property (as defined below) is a seven-story mid-rise multifamily property. The Essence 144 Property (as defined below) is a 12-story high-rise multifamily property. |
| (5) | See “Lotus 315 & Essence 144 Properties Summary” below. |
| (6) | Current Occupancy represents the residential occupancy at the Lotus 315 and Essence 144 Properties (as defined below) as of June 1, 2024. The Lotus 315 Property also contains 16,200 square feet of retail space that is 100.0% leased and 10,907 square feet of self-storage space that is in lease-up and 37.5% occupied by units. |
| (7) | Appraised Value represents the aggregate appraised value of the Lotus 315 Property and the Essence 144 Property. The Appraised Value for the Lotus 315 Property represents the “prospective market value upon stabilization” of $73,200,000 as of October 1, 2024, which includes value attributable to the renovated commercial units at the Lotus 315 Property. The Appraised Value for the Essence 144 Property represents the “as is” value of $50,500,000 as of April 23, 2024. The aggregate “as is” value for the Lotus 315 & Essence 144 Properties is $122,200,000, which results in a Cut-off Date LTV and Maturity Date LTV of 70.5%. |
| (8) | The increase from TTM 4/30/2024 NOI to U/W NOI is primarily attributable to commercial rental income of $602,244 at the Lotus 315 Property. The borrower sponsor recently executed leases with two retail tenants for $427,500 and converted another retail unit into 160 self-storage units which were |
| THE INFORMATION IN THIS STRUCTURAL AND COLLATERAL TERM SHEET IS NOT COMPLETE AND MAY BE AMENDED PRIOR TO THE TIME OF SALE. THIS TERM SHEET IS NOT AN OFFER TO SELL THESE SECURITIES AND IT IS NOT A SOLICITATION OF AN OFFER TO BUY THESE SECURITIES IN ANY JURISDICTION WHERE THE OFFER OR SALE IS NOT PERMITTED. | ||
| 61 | ||
| Multifamily – Various | Loan #4 | Cut-off Date Balance: | $50,000,000 | |
| Property Addresses - Various | Lotus 315 & Essence 144 | Cut-off Date LTV: | 69.6% | |
| East Orange, NJ 07018 | U/W NCF DSCR: | 1.23x | ||
| U/W NOI Debt Yield: | 8.1% |
37.5% occupied by units as of June 13, 2024. The tenant Sihana LLC, which accounts for 64.8% of the retail net rentable area at the Lotus 315 Property, was in a 100% rent abatement period through June 30, 2024, and is in a 50% rent abatement period beginning on July 1, 2024 and ending on September 30, 2024, and a 25% rent abatement period beginning on October 1, 2024 and ending on March 31, 2025. The tenant Bernard Jackson Art Gallery, which accounts for 35.2% of the retail net rentable area at the Lotus 315 Property, is in a gap rent period through September 6, 2024.
The Mortgage Loan. The fourth largest mortgage loan (the “Lotus 315 & Essence 144 Mortgage Loan”) is part of a whole loan (the “Lotus 315 & Essence 144 Whole Loan”) evidenced by two pari passu promissory notes in the aggregate original principal amount of $86,100,000. The Lotus 315 & Essence 144 Mortgage Loan is evidenced by the controlling Note A-1, which has an outstanding principal balance as of the Cut-off Date of $50,000,000. The Lotus 315 & Essence 144 Mortgage Loan will be included in the WFCM 2024-5C1 securitization trust and represents approximately 6.8% of the initial pool balance. The Lotus 315 & Essence 144 Whole Loan was originated on June 3, 2024, by Citi Real Estate Funding Inc. (“CREFI”). The Lotus 315 & Essence 144 Whole Loan is secured by the borrowers’ fee interest in two multifamily properties totaling 336 units located in East Orange, New Jersey (the "Lotus 315 & Essence 144 Properties"). The Lotus 315 & Essence 144 Whole Loan has a 5-year term, is interest-only for the full term and accrues interest at a rate of 6.4200% per annum on an Actual/360 basis.
The table below identifies the promissory notes that comprise the Lotus 315 & Essence 144 Whole Loan. The Lotus 315 & Essence 144 Whole Loan will be serviced pursuant to the pooling and servicing agreement for the WFCM 2024-5C1 securitization trust. The relationship between the holders of the Lotus 315 & Essence 144 Whole Loan is governed by a co-lender agreement as described under “Description of the Mortgage Pool—The Whole Loans—The Serviced Pari Passu Whole Loans” and “The Pooling and Servicing Agreement” in the Preliminary Prospectus.
Whole Loan Summary
| Note | Original Balance | Cut-off Date Balance | Note Holder | Controlling Piece |
| A-1 | $50,000,000 | $50,000,000 | WFCM 2024-5C1 | Yes |
| A-2 | 36,100,000 | 36,100,000 | Benchmark 2024-V8 | No |
| Whole Loan | $86,100,000 | $86,100,000 |
The Borrowers and the Borrower Sponsors. The borrowers are 315 Urban Renewal Limited Liability Company and Essence 144 Urban Renewal LLC, each a New Jersey limited liability company and single purpose entity with one independent director. The borrower sponsors and non-recourse carveout guarantors are Syed A. Hasan and Ayesha Wahidy. Syed A. Hasan is the founder and CEO of Blackstone 360 (“B360”). B360 is a vertically integrated real estate investment firm based in Newark, New Jersey, that specializes in the development of urban, multifamily and mixed-use assets in the markets surrounding New York City.
The Properties. The Lotus 315 & Essence 144 Properties are comprised of two multifamily properties totaling 336 units located in East Orange, New Jersey. The Lotus 315 & Essence 144 Properties were recently constructed between 2017 and 2019 and are situated approximately 0.5 miles from each other on South Harrison Street, approximately 15 miles from New York City. The Lotus 315 & Essence 144 Properties are located within walking distance of Brick Church, New Jersey Transit Station, which provides access to Newark, Hoboken, and New York Penn Station. As of June 1, 2024, the multifamily units at the Lotus 315 & Essence 144 Properties were 96.4% occupied. The Lotus 315 & Essence 144 Properties are comprised of 38 studio units (11.3% of unit count), 237 one-bedroom units (70.5% of unit count), and 61 two-bedroom units (18.2% of unit count).
The following table presents detailed information with respect to the Lotus 315 & Essence 144 Properties:
Lotus 315 & Essence 144 Properties Summary
| Property Name | Address | Year Built/Year Renovated | Units(1) | Occ.%(1)(2) | Allocated Whole Loan Amounts | Appraised Value(3) | UW NOI(1) | % of UW NOI(1) | |
| Lotus 315 | 315 South Harrison Street, East Orange, NJ | 2019/NAP | 180 | 95.6% | $50,850,000 | $73,200,000(4) | $4,102,999 | 58.9% | |
| Essence 144 | 144 South Harrison Street, East Orange, NJ | 2017/NAP | 156 | 97.4% | $35,250,000 | $50,500,000 | $2,868,403 | 41.1% | |
| Total/Wtd. Avg. | 336 | 96.4% | $86,100,000 | $123,700,000 | $6,971,402 | 100.0% |
| (1) | Based on the underwritten rent rolls dated June 1, 2024. |
| (2) | Occ. % represents the residential occupancy at the Lotus 315 and Essence 144 Properties as of June 1, 2024. The Lotus 315 Property also contains 16,200 square feet of retail space that is 100.0% leased and 10,907 square feet of self-storage space that is in lease-up and 37.5% occupied by units. |
| (3) | Source: Appraisals. |
| (4) | The Appraised Value for the Lotus 315 Property represents the “prospective market value upon stabilization” as of October 1, 2024. The “as is” value is $71,700,000 as of April 23, 2024. |
| THE INFORMATION IN THIS STRUCTURAL AND COLLATERAL TERM SHEET IS NOT COMPLETE AND MAY BE AMENDED PRIOR TO THE TIME OF SALE. THIS TERM SHEET IS NOT AN OFFER TO SELL THESE SECURITIES AND IT IS NOT A SOLICITATION OF AN OFFER TO BUY THESE SECURITIES IN ANY JURISDICTION WHERE THE OFFER OR SALE IS NOT PERMITTED. | ||
| 62 | ||
| Multifamily – Various | Loan #4 | Cut-off Date Balance: | $50,000,000 | |
| Property Addresses - Various | Lotus 315 & Essence 144 | Cut-off Date LTV: | 69.6% | |
| East Orange, NJ 07018 | U/W NCF DSCR: | 1.23x | ||
| U/W NOI Debt Yield: | 8.1% |
Lotus 315
The Lotus 315 property is a newly constructed, Class A, seven-story, 180-unit mid-rise multifamily property located at 315 South Harrison Street in East Orange, New Jersey (the “Lotus 315 Property”). The Lotus 315 Property is comprised of 180 residential units, 16,200 square feet of ground floor retail space, and 10,907 square feet of self-storage space across 160 units. The Lotus 315 property is situated on a 3.68-acre site and features 316 garage and surface parking spaces resulting in a parking ratio of approximately 1.76 spaces per unit. The unit mix at the Lotus 315 Property consists of 12 studio units, 129 one-bedroom units and 39 two-bedroom units. As of June 1, 2024, the multifamily units at the Lotus 315 Property were 95.6% occupied. Amenities at the Lotus 315 Property include resident lounges, a fitness center, on-site management, and a free shuttle to both Newark Penn and Brick Church train stations. Unit amenities include stainless steel appliances, in-unit washer/dryers, individual unit balcony/patios and granite countertops.
The retail space at the Lotus 315 Property is comprised of two units. The first retail unit is a 10,500 square foot unit that is leased by Sihana LLC, a restaurant and market with a lease through March 31, 2034. The second retail unit is a 5,700 square foot unit that is leased by Bernard Jackson Art Gallery, an art studio and gallery with a lease through April 30, 2029. Sihana, LLC and Bernard Jackson Art Gallery have not yet taken possession of their respective premises. Sihana LLC, which accounts for 64.8% of the retail net rentable area at the Lotus 315 Property, was in a 100% rent abatement period through June 30, 2024, and is in a 50% rent abatement period beginning on July 1, 2024 and ending on September 30, 2024, and a 25% rent abatement period beginning on October 1, 2024 and ending on March 31, 2025. Bernard Jackson Art Gallery, which accounts for 35.2% of the retail net rentable area at the Lotus 315 Property, is in a gap rent period through September 6, 2024. All gap and free rent for these spaces were reserved at origination of the Lotus 315 and Essence 144 Whole Loan.
The self-storage space at the Lotus 315 Property was recently completed and consists of 10,907 square feet across 160 units. The self storage unit mix is comprised of 5x5, 5x10 and 10x10 climate-controlled units. The self-storage units are currently in lease-up and as of June 13, 2024 were 37.5% occupied. Commercial income accounts for approximately 7.0% of underwritten base rent at the Lotus 315 & Essence 144 Properties.
Essence 144
The Essence 144 property is a recently redeveloped, Class A, 12-story, 156-unit high-rise multifamily property located at 144 South Harrison Street in East Orange, New Jersey (the “Essence 144 Property”). The Essence 144 Property was originally constructed as an office building in 1931 and subsequently gutted and converted into the Essence 144 Property in 2017. The Essence 144 Property is situated on a 1.22-acre site and features 80 surface parking spaces, resulting in a parking ratio of approximately 0.51 spaces per unit. The unit mix at the Essence 144 Property consists of 26 studio units, 108 one-bedroom units, and 22 two-bedroom units. As of June 1, 2024, the Essence 144 Property was 97.4% occupied. Amenities at the Essence 144 Property include a rooftop terrace with New York City skyline views, a fitness center, resident lounge, library, package system, and on-site parking. Unit amenities include stainless steel appliances, in-unit washer/dryers, and individual unit balcony/patios.
The following table presents certain information relating to the unit mix at the Lotus 315 Property:
Lotus 315 Unit Mix (1)
| Unit Type | # of Units | % of Total Units |
Occupancy |
Average Unit Size (Sq. Ft.) |
Average Monthly Rent Per Unit |
Average Monthly Market Rent Per Unit(2) |
| Studio | 12 | 6.7% | 91.7% | 560 | $1,604 | $1,700 |
| 1BR/1BA | 129 | 71.7 | 95.3 | 821 | $2,038 | $2,069 |
| 2BR/2BA | 39 | 21.7 | 97.4 | 1,122 | $2,534 | $2,690 |
| Total/Wtd. Avg. | 180 | 100% | 95.6% | 869 | $2,120 | $2,179 |
| (1) | Based on the underwritten rent roll dated June 1, 2024. Average Monthly Rent Per Unit is based on occupied units. |
| (2) | Source: Appraisal. |
| THE INFORMATION IN THIS STRUCTURAL AND COLLATERAL TERM SHEET IS NOT COMPLETE AND MAY BE AMENDED PRIOR TO THE TIME OF SALE. THIS TERM SHEET IS NOT AN OFFER TO SELL THESE SECURITIES AND IT IS NOT A SOLICITATION OF AN OFFER TO BUY THESE SECURITIES IN ANY JURISDICTION WHERE THE OFFER OR SALE IS NOT PERMITTED. | ||
| 63 | ||
| Multifamily – Various | Loan #4 | Cut-off Date Balance: | $50,000,000 | |
| Property Addresses - Various | Lotus 315 & Essence 144 | Cut-off Date LTV: | 69.6% | |
| East Orange, NJ 07018 | U/W NCF DSCR: | 1.23x | ||
| U/W NOI Debt Yield: | 8.1% |
The following table presents certain information relating to the unit mix at the Essence 144 Property:
Essence 144 Unit Mix (1)
| Unit Type | # of Units | % of Total Units |
Occupancy |
Average Unit Size (Sq. Ft.) |
Average Monthly Rent Per Unit |
Average Monthly Market Rent Per Unit(2) |
| Studio | 26 | 16.7% | 100.0% | 589 | $1,700 | $1,654 |
| 1BR/1BA | 108 | 69.2 | 98.1 | 818 | $1,950 | $1,971 |
| 2BR/2BA | 22 | 14.1 | 90.9 | 1,101 | $2,469 | $2,709 |
| Total/Wtd. Avg. | 156 | 100% | 97.4% | 820 | $1,976 | $2,022 |
| (1) | Based on the underwritten rent roll dated June 1, 2024. Average Monthly Rent Per Unit is based on occupied units. |
| (2) | Source: Appraisal. |
The following table presents historical occupancy percentages at the Lotus 315 & Essence 144 Properties:
Historical Occupancy
12/31/2022(1) | 12/31/2023(1) | 6/1/2024(2) |
| 92.7% | 91.6% | 96.4% |
| (1) | Information obtained from the borrowers. |
| (2) | Information obtained from the underwritten rent roll. |
| THE INFORMATION IN THIS STRUCTURAL AND COLLATERAL TERM SHEET IS NOT COMPLETE AND MAY BE AMENDED PRIOR TO THE TIME OF SALE. THIS TERM SHEET IS NOT AN OFFER TO SELL THESE SECURITIES AND IT IS NOT A SOLICITATION OF AN OFFER TO BUY THESE SECURITIES IN ANY JURISDICTION WHERE THE OFFER OR SALE IS NOT PERMITTED. | ||
| 64 | ||
| Multifamily – Various | Loan #4 | Cut-off Date Balance: | $50,000,000 | |
| Property Addresses - Various | Lotus 315 & Essence 144 | Cut-off Date LTV: | 69.6% | |
| East Orange, NJ 07018 | U/W NCF DSCR: | 1.23x | ||
| U/W NOI Debt Yield: | 8.1% |
Operating History and Underwritten Net Cash Flow. The following table presents certain information relating to the operating history and underwritten net cash flow at the Lotus 315 & Essence 144 Properties:
Cash Flow Analysis(1)
| 2022 | 2023 | TTM 4/30/2024(2) | U/W(2) | %(3) | U/W $ per Unit | |
| Base Rent | $7,436,978 | $7,432,770 | $7,585,109 | $7,979,066 | 79.6% | $23,747 |
| Potential Income from Vacant Units | 0 | 0 | 0 | 313,968 | 3.1 | $934 |
| Commercial Rental Income | 0 | 0 | 0 | 602,244 | 6.0 | $1,792 |
| Potential Income from Vacant Commercial Space | 0 | 0 | 0 | 157,019 | 1.6 | $467 |
| Gross Potential Rent | $7,436,978 | $7,432,770 | $7,585,109 | $9,052,296 | 90.3% | $26,941 |
| Other Income(4) | 610,121 | 715,447 | 762,211 | 967,730 | 9.7 | $2,880 |
| Net Rental Income | $8,047,099 | $8,148,217 | $8,347,320 | $10,020,027 | 100.0% | $29,822 |
| (Vacancy) | (93,825) | (98,312) | (97,925) | (596,196) | (6.0) | ($1,774) |
| Effective Gross Income | $7,953,274 | $8,049,905 | $8,249,395 | $9,423,831 | 94.0% | $28,047 |
| Real Estate Taxes(5) | 683,502 | 751,025 | 817,119 | 1,006,409 | 10.7 | $2,995 |
| Insurance | 142,598 | 155,255 | 154,109 | 148,465 | 1.6 | $442 |
| Management Fee | 318,475 | 322,717 | 331,644 | 282,715 | 3.0 | $841 |
| Other Expenses(6) | 1,204,824 | 1,161,341 | 1,075,875 | 1,014,841 | 10.8 | $3,020 |
| Total Expenses | $2,349,398 | $2,390,337 | $2,378,747 | $2,452,429 | 26.0% | $7,299 |
| Net Operating Income | $5,603,876 | $5,659,568 | $5,870,649 | $6,971,402 | 74.0% | $20,748 |
| Replacement Reserves | $0 | $0 | $0 | $87,746 | 0.9 | $261 |
| TI/LC | 0 | 0 | 0 | 16,200 | 0.2 | $48 |
| Net Cash Flow | $5,603,876 | $5,659,568 | $5,870,649 | $6,867,456 | 72.9% | $20,439 |
| NOI DSCR(7) | 1.00x | 1.01x | 1.05x | 1.24x | ||
| NCF DSCR(7) | 1.00x | 1.01x | 1.05x | 1.23x | ||
| NOI Debt Yield(7) | 6.5% | 6.6% | 6.8% | 8.1% | ||
| NCF Debt Yield(7) | 6.5% | 6.6% | 6.8% | 8.0% |
| (1) | Based on the underwritten rent roll as of June 1, 2024. |
| (2) | The increase from TTM 4/30/2024 NOI to U/W NOI is primarily attributable to commercial rental income of $602,244 at the Lotus 315 Property. The borrower sponsor recently executed leases with two retail tenants for $427,500 and converted another retail unit into 160 self-storage units which were 37.5% occupied (41.6% economically occupied) as of June 13, 2024. The tenant Sihana, LLC, which accounts for 64.8% of the retail net rentable area at the Lotus 315 Property, was in a 100% rent abatement period through June 30, 2024, and is in a 50% rent abatement period beginning on July 1, 2024 and ending on September 30, 2024, and a 25% rent abatement period beginning on October 1, 2024 and ending on March 31, 2025. The tenant Bernard Jackson Art Gallery, which accounts for 35.2% of the retail net rentable area at the Lotus 315 Property, is in a gap rent period through September 6, 2024. |
| (3) | Represents (i) percent of Net Rental Income for all revenue fields and Vacancy & Credit Loss and (ii) percent of Effective Gross Income for all other fields. |
| (4) | Other Income includes parking income, fee/miscellaneous income and amenity fees. |
| (5) | The Lotus 315 & Essence 144 Properties are both subject to a 30-year PILOT program. Real Estate Taxes are underwritten based on estimated current abated taxes. See “Description of the Mortgage Pool—Real Estate and Other Tax Considerations” in the Preliminary Prospectus. |
| (6) | Other Expenses include payroll and benefits, repairs and maintenance, utilities, advertising and marketing, and general and administrative expenses. |
| (7) | Based on the Lotus 315 & Essence 144 Whole Loan. |
Appraisal. According to the appraisals dated from May 16, 2024 to May 21, 2024, the Lotus 315 & Essence 144 Properties had an aggregate appraised value of $123,700,000. The Appraised Value for the Lotus 315 Property represents the “prospective market value upon stabilization” of $73,200,000 as of October 1, 2024, which includes value attributable to the renovated commercial units at the Lotus 315 Property. The Appraised Value for the Essence 144 Property represents the “as is” value of $50,500,000 as of April 23, 2024. The aggregate “as is” value for the Lotus 315 & Essence 144 Properties is $122,200,000 which results in a Cut-off Date LTV and Maturity Date LTV of 70.5%.
Environmental Matters. According to the Phase I environmental reports dated May 2, 2024, there was no evidence of any recognized environmental conditions at the Lotus 315 & Essence 144 Properties.
| THE INFORMATION IN THIS STRUCTURAL AND COLLATERAL TERM SHEET IS NOT COMPLETE AND MAY BE AMENDED PRIOR TO THE TIME OF SALE. THIS TERM SHEET IS NOT AN OFFER TO SELL THESE SECURITIES AND IT IS NOT A SOLICITATION OF AN OFFER TO BUY THESE SECURITIES IN ANY JURISDICTION WHERE THE OFFER OR SALE IS NOT PERMITTED. | ||
| 65 | ||
| Multifamily – Various | Loan #4 | Cut-off Date Balance: | $50,000,000 | |
| Property Addresses - Various | Lotus 315 & Essence 144 | Cut-off Date LTV: | 69.6% | |
| East Orange, NJ 07018 | U/W NCF DSCR: | 1.23x | ||
| U/W NOI Debt Yield: | 8.1% |
Market Overview and Competition. The Lotus 315 & Essence 144 Properties are located along South Harrison Street in East Orange, New Jersey within the New York-Newark-Jersey City metropolitan statistical area. East Orange is located at the intersection of the Garden State Parkway and Interstate 280 in New Jersey, both of which provide access to the Lotus 315 & Essence 144 Properties. East Orange also benefits from its proximity to Newark Liberty Internal Airport and access to three train lines, three trolley lines and six train stations within the 3.9 square miles of the city.
The Lotus 315 & Essence 144 Properties are located in the Northern New Jersey multifamily market of the New York-Newark-Jersey City metropolitan statistical area. As of December 31, 2024, the Northern New Jersey multifamily submarket had an inventory of 164,003 units, a vacancy rate of 5.15%, and an average rent per unit of $2,070. Furthermore, the Lotus 315 & Essence 144 Properties are located within the Lower Essex County multifamily submarket of the Northern New Jersey multifamily market. As of December 31, 2024, the Lower Essex County multifamily submarket had an inventory of 24,885 units, a vacancy rate of 5.75%, and an average rent per unit of $1,892.
According to the appraisal, the estimated 2023 population and average household income within a one-, three-, and five-mile radius of the Lotus 315 Property is 58,165, 400,283, and 832,786 and $73,586, $91,234, and $105,177, respectively. According to the appraisal, the estimated 2023 population and average household income within a one-, three-, and five-mile radius of the Essence 144 Property is 62,086, 411,371, and 842,828 and $70,082, $88,183, and $104,950, respectively.
The following table presents certain information relating to comparable multifamily properties to the Lotus 315 & Essence 144 Properties:
| Multifamily Rent Comparables(1) | |||||||
| Property Name / Address | Distance from Subject(2) | Year Built / Renovated | Occupancy | Number of Units | Unit Type | Average Unit Size | Average Rent Per Unit |
Lotus 315 315 South Harrison Street, East Orange, NJ | – | 2019 / NAP | 95.6%(3) | 180 | Studio | 560 SF(3) | $1,604(3) |
| 1BR / 1BA | 821 SF(3) | $2,038(3) | |||||
| 2BR / 2BA | 1,122 SF(3) | $2,534(3) | |||||
Essence 144 144 South Harrison Street, East Orange, NJ | 0.5 miles | 2017 / NAP | 97.4%(3) | 156 | Studio | 589 SF(3) | $1,700(3) |
| 1BR / 1BA | 818 SF(3) | $1,950(3) | |||||
| 2BR / 2BA | 1,101 SF(3) | $2,469(3) | |||||
Essex and Crane 377 Crane Street, East Orange, NJ | 0.9 miles | 2023 / NAP | 99.5% | 209 | Studio | 491 SF | $1,900 |
| 1BR / 1BA | 792 SF | $2,300 | |||||
| 2BR / 2BA | 1,339 SF | $3,500 | |||||
Indigo 141 141 South Harrison Street, East Orange, NJ | 0.5 miles | 2009 / NAP | 100.0% | 175 | 1BR / 1BA | 450 SF | $1,700 |
| 2BR / 2BA | 850 SF | $1,950 | |||||
The Highland 416 Highland Avenue, East Orange, NJ | 0.7 miles | 2024 / NAP | 93.5% | 138 | Studio | 594 SF | $1,800 |
| 1BR / 1BA | 736 SF | $2,200 | |||||
| 2BR / 2BA | 1,067 SF | $2,600 | |||||
Aura 240 240 South Harrison Street, East Orange, NJ | 0.2 miles | 2013 / NAP | 100.0% | 97 | 1BR / 1BA | 1,070 SF | $2,400 |
| 2BR / 2BA | 1,235 SF | $2,695 | |||||
The Harvard 129 Halsted Street, East Orange, NJ | 0.6 miles | 2021 / NAP | 95.0% | 60 | 1BR / 1BA | 725 SF | $1,950 |
| 2BR / 2BA | 1,190 SF | $2,550 | |||||
Allure 258 258 South Harrison Street, East Orange, NJ | 0.2 miles | 2022 / NAP | 97.2% | 213 | Studio | 455 SF | $1,600 |
| 1BR / 1BA | 850 SF | $2,300 | |||||
| 2BR / 2BA | 1,200 SF | $3,300 | |||||
| (1) | Source: Appraisal. |
| (2) | Distance from Subject represents the distance from the Lotus 315 Property. The Essence 144 Property is located 0.5 miles away from the Lotus 315 Property. |
| (3) | Based on the underwritten rent roll dated June 1, 2024. Average Unit Size and Average Rent Per Unit reflects the average fair market value for occupied units. |
| THE INFORMATION IN THIS STRUCTURAL AND COLLATERAL TERM SHEET IS NOT COMPLETE AND MAY BE AMENDED PRIOR TO THE TIME OF SALE. THIS TERM SHEET IS NOT AN OFFER TO SELL THESE SECURITIES AND IT IS NOT A SOLICITATION OF AN OFFER TO BUY THESE SECURITIES IN ANY JURISDICTION WHERE THE OFFER OR SALE IS NOT PERMITTED. | ||
| 66 | ||
| Multifamily – Various | Loan #4 | Cut-off Date Balance: | $50,000,000 | |
| Property Addresses - Various | Lotus 315 & Essence 144 | Cut-off Date LTV: | 69.6% | |
| East Orange, NJ 07018 | U/W NCF DSCR: | 1.23x | ||
| U/W NOI Debt Yield: | 8.1% |
Escrows. At origination of the Lotus 315 & Essence 144 Whole Loan, the borrowers deposited approximately (i) $116,278 into a real estate tax reserve account, (ii) $38,489 into an insurance reserve; (iii) $141,750 into a free rent reserve; (iv) $83,250 into a gap rent reserve; and (v) $1,000,000 into an economic holdback reserve.
Real Estate Taxes – On each monthly payment date, the borrowers are required to deposit an amount equal to 1/12 of the real estate taxes that the lender estimates will be payable during the next 12 months into a real estate tax reserve account (initially estimated to be approximately $58,139).
Insurance – On each monthly payment date, the borrowers are required to deposit into the insurance reserve, 1/12th of the amount which will be sufficient to pay the insurance premiums due for the renewal of coverage afforded by such policies (initially estimated to be approximately $6,415).
Replacement Reserve – On each monthly payment date, the borrowers are required to deposit approximately $8,537 into a replacement reserve account.
Leasing Reserve – On each monthly payment date, the borrowers are required to deposit approximately $1,350 into a leasing reserve.
Holdback Reserve Funds – At origination of the Lotus 315 & Essence 144 Whole Loan, the borrowers were required to deposit $1,000,000 into a holdback reserve account (the “Holdback Reserve Funds”) to be held as additional cash collateral for the Lotus 315 & Essence 144 Whole Loan. The lender is required to disburse to the borrowers the Holdback Reserve Funds, in up to four increments, upon satisfaction by the borrowers of, among other conditions set forth in the Lotus 315 & Essence 144 Whole Loan documents, the following conditions: (i) on the date the lender calculates the debt yield, no event of default has occurred and is continuing; and (ii) the lender has received evidence, in form and substance reasonably satisfactory to the lender, that the debt yield (calculated as set forth in the Lotus 315 & Essence 144 Whole Loan documents and after giving effect to the release) equals or exceeds 8.15%. In the event the borrowers have not satisfied the conditions to the disbursement of all Holdback Reserve Funds on or prior to June 3, 2027, then the lender will have the right to, in the lender’s sole discretion, hold the Holdback Reserve Funds as additional collateral for the Lotus 315 & Essence 144 Whole Loan and as additional security for all of the borrower’s obligations under the Lotus 315 & Essence 144 Whole Loan documents.
Lockbox and Cash Management. The Lotus 315 & Essence 144 Whole Loan is structured with a springing lockbox and springing cash management. Upon the first occurrence of a Trigger Period (as defined below), the borrowers are required to establish a lender-controlled lockbox account, and are thereafter required to deposit, or cause the property manager to deposit, immediately upon receipt, all revenue received by the borrowers or the property manager into such lockbox. Within five days after the first occurrence of a Trigger Period, the borrowers are required to deliver a notice to all commercial tenants directing them to remit all payments into the lender-controlled lockbox account. All funds deposited into the lockbox are required to be transferred on each business day to or at the direction of the borrower unless a Trigger Period exists and the lender elects (in its sole and absolute discretion) to deliver a restricted account notice, in which case all funds in the lockbox account are required to be swept on each business day to a lender-controlled cash management account to be applied and disbursed in accordance with the Lotus 315 & Essence 144 Whole Loan documents, and all excess cash flow funds remaining in the cash management account after the application of such funds in accordance with the Lotus 315 & Essence 144 Whole Loan documents are required to be held by the lender in an excess cash flow reserve account as additional collateral for the Lotus 315 & Essence 144 Whole Loan. Upon the cure of the applicable Trigger Period, so long as no other Trigger Period exists, the lender is required to return any amounts remaining on deposit in the excess cash flow reserve account to the borrowers. Upon an event of default under the Lotus 315 & Essence 144 Whole Loan documents, the lender may apply funds to the debt in such priority as it may determine.
A “Trigger Period” means a period (A) commencing upon the earliest of (i) the occurrence and continuance of an event of default under the Lotus 315 & Essence 144 Whole Loan documents, and (ii) the debt service coverage ratio being less than 1.10x (unless the Collateral Cure Conditions (as defined below) are satisfied); and (B) expiring upon (x) with regard to clause (i) above, the cure (if applicable) of such event of default under the Lotus 315 & Essence 144 Whole Loan documents, and (y) with regard to clause (ii) above, the date that the debt service coverage ratio is equal to or greater than 1.10x for two consecutive calendar quarters.
“Collateral Cure Conditions” exist if and for so long as the borrowers deposit cash into an account with the lender to serve as additional collateral for the Lotus 315 & Essence 144 Whole Loan in an amount equal to the Collateral Deposit Amount (as defined below) and, thereafter, on each date occurring three months after the date that the borrowers made the most recent such deposit, the borrowers deposit any additional cash collateral required to cause the total amount deposited to equal the Collateral Deposit Amount. Such amounts will be returned to the borrowers, provided that no event of default is ongoing, at such time as the Trigger Period that the Collateral Cure Conditions relate to would have been cured had the borrowers not satisfied the Collateral Cure Conditions.
A “Collateral Deposit Amount” means an amount equal to the difference between (i) the outstanding principal balance of the Lotus 315 & Essence 144 Whole Loan at the time of an applicable deposit of funds and (ii) an assumed balance of the Lotus 315 & Essence 144 Whole Loan that would cause the debt service coverage ratio to equal 1.10x.
| THE INFORMATION IN THIS STRUCTURAL AND COLLATERAL TERM SHEET IS NOT COMPLETE AND MAY BE AMENDED PRIOR TO THE TIME OF SALE. THIS TERM SHEET IS NOT AN OFFER TO SELL THESE SECURITIES AND IT IS NOT A SOLICITATION OF AN OFFER TO BUY THESE SECURITIES IN ANY JURISDICTION WHERE THE OFFER OR SALE IS NOT PERMITTED. | ||
| 67 | ||
| Multifamily – Various | Loan #4 | Cut-off Date Balance: | $50,000,000 | |
| Property Addresses - Various | Lotus 315 & Essence 144 | Cut-off Date LTV: | 69.6% | |
| East Orange, NJ 07018 | U/W NCF DSCR: | 1.23x | ||
| U/W NOI Debt Yield: | 8.1% |
Additional Secured Indebtedness (not including trade debts). The Lotus 315 & Essence 144 Properties also secure the Lotus 315 & Essence 144 Note A-2 which has a Cut-off Date principal balance of $36,100,000 (the “Lotus 315 & Essence 144 Serviced Pari Passu Companion Loan”). The Lotus 315 & Essence 144 Serviced Pari Passu Companion Loan accrues interest at the same rate as the Lotus 315 & Essence 144 Mortgage Loan. The Lotus 315 & Essence 144 Mortgage Loan is entitled to payments of principal and interest on a pro rata and pari passu basis with the Lotus 315 & Essence 144 Serviced Pari Passu Companion Loan. The holders of the Lotus 315 & Essence 144 Mortgage Loan and the Lotus 315 & Essence 144 Serviced Pari Passu Companion Loan have entered into a co-lender agreement which sets forth the allocation of collections on the Lotus 315 & Essence 144 Whole Loan. See “Description of the Mortgage Pool—The Whole Loans—The Serviced Pari Passu Whole Loans” in the Preliminary Prospectus.
Mezzanine Loan and Preferred Equity. None.
Release of Property. Provided that no event of default is continuing under the Lotus 315 & Essence 144 Whole Loan documents, at any time after the date that is two years after the closing date of this securitization, the borrowers may either deliver defeasance collateral or partially prepay the Lotus 315 & Essence 144 Whole Loan and obtain release of either of the individual Lotus 315 & Essence 144 Properties, in each case, provided that, among other conditions, (i) the defeasance collateral or partial prepayment, as applicable, is of an amount equal to the greater of (a) 120% of the allocated loan amount for such individual Lotus 315 & Essence 144 Property, and (b) 100% of the net sales proceeds applicable to such individual Lotus 315 & Essence 144 Property, (ii) the borrowers deliver a REMIC opinion, (iii) the borrowers deliver (if requested by the lender) a rating agency confirmation, (iv) as of the date of notice of the partial release and the consummation of the partial release (whether by partial prepayment or partial defeasance), after giving effect to the release, the debt service coverage ratio with respect to the remaining individual Lotus 315 & Essence 144 Property is equal to or greater than the greater of (a) 1.25x, and (b) the debt service coverage ratio of both of the Lotus 315 & Essence 144 Properties immediately prior to the date of notice of the partial release or the consummation of the partial release, as applicable, and (v) as of the date of notice of the partial release and the consummation of the partial release (whether by partial prepayment or partial defeasance), after giving effect to the release, the loan-to-value ratio with respect to the remaining individual Lotus 315 & Essence 144 Property is no greater than the lesser of (a) 70.0% and (b) the loan-to-value ratio for both of the Lotus 315 & Essence 144 Properties immediately prior to the date of notice of the partial release or the consummation of the partial release, as applicable.
Letter of Credit. None.
Right of First Offer/Right of First Refusal. None.
Ground Lease. None.
Terrorism Insurance. The borrowers are required to maintain or cause to be maintained an “all-risk” insurance policy that provides coverage for terrorism in an amount equal to the full replacement cost of the Lotus 315 & Essence 144 Properties. The “all-risk” policy containing terrorism insurance is required to contain a deductible no greater than $50,000 except with respect to windstorm/named storms and earthquake. See “Risk Factors—Risks Relating to the Mortgage Loans—Terrorism Insurance May Not Be Available for All Mortgaged Properties” in the Preliminary Prospectus.
| THE INFORMATION IN THIS STRUCTURAL AND COLLATERAL TERM SHEET IS NOT COMPLETE AND MAY BE AMENDED PRIOR TO THE TIME OF SALE. THIS TERM SHEET IS NOT AN OFFER TO SELL THESE SECURITIES AND IT IS NOT A SOLICITATION OF AN OFFER TO BUY THESE SECURITIES IN ANY JURISDICTION WHERE THE OFFER OR SALE IS NOT PERMITTED. | ||
| 68 | ||
| Multifamily – Mid Rise | Loan #5 | Cut-off Date Balance: | $47,850,000 | |
| 110 North 1st Street | The Archive Apartments | Cut-off Date LTV: | 67.4% | |
| Minneapolis, MN 55401 | U/W NCF DSCR: | 1.23x | ||
| U/W NOI Debt Yield: | 8.8% |

| THE INFORMATION IN THIS STRUCTURAL AND COLLATERAL TERM SHEET IS NOT COMPLETE AND MAY BE AMENDED PRIOR TO THE TIME OF SALE. THIS TERM SHEET IS NOT AN OFFER TO SELL THESE SECURITIES AND IT IS NOT A SOLICITATION OF AN OFFER TO BUY THESE SECURITIES IN ANY JURISDICTION WHERE THE OFFER OR SALE IS NOT PERMITTED. | ||
| 69 | ||
| Multifamily – Mid Rise | Loan #5 | Cut-off Date Balance: | $47,850,000 | |
| 110 North 1st Street | The Archive Apartments | Cut-off Date LTV: | 67.4% | |
| Minneapolis, MN 55401 | U/W NCF DSCR: | 1.23x | ||
| U/W NOI Debt Yield: | 8.8% |
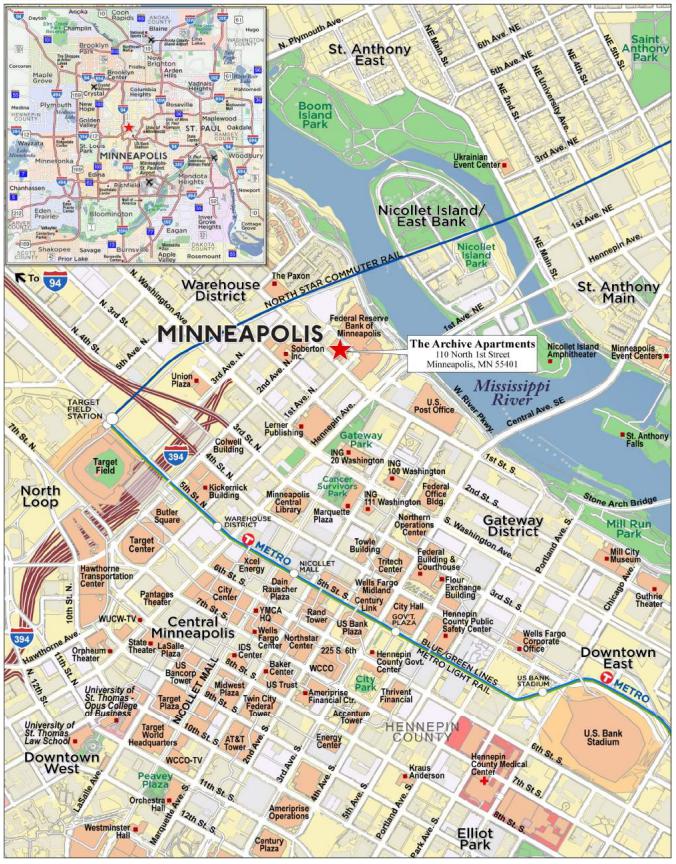
| THE INFORMATION IN THIS STRUCTURAL AND COLLATERAL TERM SHEET IS NOT COMPLETE AND MAY BE AMENDED PRIOR TO THE TIME OF SALE. THIS TERM SHEET IS NOT AN OFFER TO SELL THESE SECURITIES AND IT IS NOT A SOLICITATION OF AN OFFER TO BUY THESE SECURITIES IN ANY JURISDICTION WHERE THE OFFER OR SALE IS NOT PERMITTED. | ||
| 70 | ||
| No. 5 – The Archive Apartments | |||||||
| Mortgage Loan Information | Mortgaged Property Information | ||||||
| Mortgage Loan Seller: | Argentic Real Estate Finance 2 LLC | Single Asset/Portfolio: | Single Asset | ||||
| Credit Assessment (Fitch/KBRA/Moody’s): | NR/NR/NR | Property Type – Subtype: | Multifamily – Mid Rise | ||||
| Original Principal Balance: | $47,850,000 | Location: | Minneapolis, MN | ||||
| Cut-off Date Balance: | $47,850,000 | Size: | 200 Units | ||||
| % of Initial Pool Balance: | 6.5% | Cut-off Date Balance Per Unit: | $239,250 | ||||
| Loan Purpose: | Refinance | Maturity Date Balance Per Unit: | $239,250 | ||||
| Borrower Sponsors: | Robert T. Miller, Curt L. Gunsbury and Robert T. Miller Revocable Trust | Year Built/Renovated: | 2021/NAP | ||||
| Guarantors: | Robert T. Miller, Curt L. Gunsbury and Robert T. Miller Revocable Trust | Title Vesting: | Fee | ||||
| Mortgage Rate: | 6.9200% | Property Manager: | Solhem LLC (borrower-related) | ||||
| Note Date: | 5/17/2024 | Current Occupancy (As of): | 96.5% (5/7/2024) | ||||
| Seasoning: | 1 month | YE 2023 Occupancy: | 98.0% | ||||
| Maturity Date: | June 6, 2029 | YE 2022 Occupancy: | 96.0% | ||||
| IO Period: | 60 months | YE 2021 Occupancy: | 94.5% | ||||
| Loan Term (Original): | 60 months | YE 2020 Occupancy(2): | NAP | ||||
| Amortization Term (Original): | NAP | As-Is Appraised Value: | $71,000,000 | ||||
| Loan Amortization Type: | Interest Only | As-Is Appraised Value Per Unit: | $355,000 | ||||
| Call Protection: | L(25),D(32),O(3) | As-Is Appraisal Valuation Date: | March 12, 2024 | ||||
| Lockbox Type: | Soft/Springing Cash Management | Underwriting and Financial Information | |||||
| Additional Debt: | None | TTM NOI (5/31/2024): | $3,959,496 | ||||
| Additional Debt Type (Balance): | NAP | YE 2023 NOI: | $3,622,453 | ||||
| YE 2022 NOI: | $3,601,095 | ||||||
| YE 2021 NOI(2): | NAP | ||||||
| YE 2020 NOI(2): | NAP | ||||||
| U/W Revenues: | $6,565,948 | ||||||
| U/W Expenses: | $2,375,509 | ||||||
| Escrows and Reserves(1) | U/W NOI: | $4,190,439 | |||||
| Initial | Monthly | Cap | U/W NCF: | $4,140,439 | |||
| Taxes: | $302,763 | $75,691 | NAP | U/W DSCR based on NOI/NCF: | 1.25x / 1.23x | ||
| Insurance: | $48,259 | $16,086 | NAP | U/W Debt Yield based on NOI/NCF: | 8.8% / 8.7% | ||
| Replacement Reserve: | $0 | $4,167 | NAP | U/W Debt Yield at Maturity based on NOI/NCF: | 8.8% / 8.7% | ||
| Cut-off Date LTV Ratio: | 67.4% | ||||||
| LTV Ratio at Maturity: | 67.4% | ||||||
| Sources and Uses | |||||||||
| Sources | Uses | ||||||||
| Mortgage Loan Amount | $47,850,000 | 100.0% | Loan Payoff | $45,147,348 | 94.4 | % | |||
| Closing Costs(3) | 1,774,935 | 3.7 | |||||||
| Return of Equity | 576,695 | 1.2 | |||||||
| Upfront Reserves | 351,022 | 0.7 | |||||||
| Total Sources | $47,850,000 | 100.0% | Total Uses | $47,850,000 | 100.0 | % | |||
| (1) | See Escrows below for further discussion of reserve requirements. |
| (2) | YE 2020 Occupancy, YE 2021 NOI, and YE 2020 NOI are not available as The Archive Apartments Property (as defined below) was constructed in 2021. |
| (3) | Closing Costs include an origination fee of $957,000. |
The Mortgage Loan. The fifth largest mortgage loan (“The Archive Apartments Mortgage Loan”) is evidenced by a promissory note in the original principal amount of $47,850,000 and secured by a first priority fee mortgage encumbering a 200-unit mid-rise multifamily property in Minneapolis, Minnesota (“The Archive Apartments Property”).
The Borrower and the Borrower Sponsor. The borrower for The Archive Apartments Mortgage Loan is The Archive Apartments LLC, a single-purpose, Delaware limited liability company, with one independent director in its organizational structure. The borrower sponsors and non-recourse carve-out guarantors for The Archive Apartments Mortgage Loan are Robert T. Miller, Curt L. Gunsbury and Robert T. Miller Revocable Trust. Robert T. Miller is a vice president at TE Miller Development, a real estate company that owns, manages, and develops multifamily housing. Curt L. Gunsbury is the owner of Solhem Companies, an owner, manager, and developer of multifamily housing. Robert T. Miller and Curt L. Gunsbury have successfully collaborated on five previous projects totaling 637 units.
| THE INFORMATION IN THIS STRUCTURAL AND COLLATERAL TERM SHEET IS NOT COMPLETE AND MAY BE AMENDED PRIOR TO THE TIME OF SALE. THIS TERM SHEET IS NOT AN OFFER TO SELL THESE SECURITIES AND IT IS NOT A SOLICITATION OF AN OFFER TO BUY THESE SECURITIES IN ANY JURISDICTION WHERE THE OFFER OR SALE IS NOT PERMITTED. | ||
| 71 | ||
| Multifamily – Mid Rise | Loan #5 | Cut-off Date Balance: | $47,850,000 | |
| 110 North 1st Street | The Archive Apartments | Cut-off Date LTV: | 67.4% | |
| Minneapolis, MN 55401 | U/W NCF DSCR: | 1.23x | ||
| U/W NOI Debt Yield: | 8.8% |
The Property. The Archive Apartments Property is a 200-unit mid-rise multifamily complex located in the eastern area of The North Loop in downtown Minneapolis, Minnesota. Situated on a 0.82-acre site, the improvements consist of a single eight-story building constructed in 2021. The unit mix is comprised of 10 studios, 102 one-bedroom units and 88 two-bedroom units. The Archive Apartments Property features amenities such as a fitness center, roof deck, virtual sports room, dog park, co-working space, and package lockers. Unit amenities include patios, central air conditioning, dishwashers, stainless steel appliances, granite/quartz counters, and in-unit washer/dryer. The Archive Apartments Property features 316 underground garage parking spaces, resulting in a parking ratio of 1.6 spaces per unit.
As of May 7, 2024, The Archive Apartments Property was 96.5% occupied. The Archive Apartments Property began initial lease-up in April 2021 and was 94.5% occupied by December 2021. Between January 2022 and March 2024, occupancy at The Archive Apartments Property averaged 92.4%. The Archive Apartments Property also features 3,170 square feet of ground floor retail space that was 50.0% occupied by one tenant (an advertising and design firm) as of March 2024 and accounted for 0.9% of underwritten revenues.
The table below shows the unit mix at The Archive Apartments Property:
Unit Mix(1)
| Unit Mix / Type | Total Units | Leased Units | Average Square Feet per Unit | % Leased |
| Studio | 10 | 9 | 509 | 90.0% |
| One Bedroom | 102 | 101 | 497 | 99.0% |
| Two Bedroom | 88 | 83 | 847 | 94.3% |
| Total/Wtd. Avg. | 200 | 193 | 652 | 96.5% |
| (1) | Information based on the underwritten rent roll dated May 7, 2024. |
The following table presents historical occupancy percentages at The Archive Apartments Property:
Historical Occupancy
12/31/2021(1) | 12/31/2022(1) | 12/31/2023(1) | 5/7/2024(2) |
| 94.5% | 96.0% | 98.0% | 96.5% |
| (1) | Information obtained from the borrower sponsors. |
| (2) | Information based on the underwritten rent roll dated May 7, 2024. |
| THE INFORMATION IN THIS STRUCTURAL AND COLLATERAL TERM SHEET IS NOT COMPLETE AND MAY BE AMENDED PRIOR TO THE TIME OF SALE. THIS TERM SHEET IS NOT AN OFFER TO SELL THESE SECURITIES AND IT IS NOT A SOLICITATION OF AN OFFER TO BUY THESE SECURITIES IN ANY JURISDICTION WHERE THE OFFER OR SALE IS NOT PERMITTED. | ||
| 72 | ||
| Multifamily – Mid Rise | Loan #5 | Cut-off Date Balance: | $47,850,000 | |
| 110 North 1st Street | The Archive Apartments | Cut-off Date LTV: | 67.4% | |
| Minneapolis, MN 55401 | U/W NCF DSCR: | 1.23x | ||
| U/W NOI Debt Yield: | 8.8% |
Operating History and Underwritten Net Cash Flow. The following table presents certain information relating to the historical operating performance and underwritten net cash flow at The Archive Apartments Property:
Cash Flow Analysis
| 2022 | 2023 | 5/31/2024 TTM | U/W | %(1) | U/W $ per unit | |
| Gross Potential Rent | $4,914,664 | $5,143,101 | $5,233,924 | $5,283,480 | 76.7% | $26,417 |
| Retail Income | 53,498 | 54,567 | 55,385 | 57,171 | 0.8 | 286 |
| Parking Income | 757,927 | 787,686 | 828,430 | 879,567 | 12.8 | 4,398 |
| Other Income(2) | 519,436 | 640,718 | 666,163 | 666,163 | 9.7 | 3,331 |
| Net Rental Income | $6,245,525 | $6,626,073 | $6,783,902 | $6,886,382 | 100.0% | $34,432 |
| Less Vacancy, Concessions & Credit Loss | (454,542) | (641,239) | (468,273) | (320,434) | (6.1) | (1,602) |
| Effective Gross Income | $5,790,983 | $5,984,834 | $6,315,629 | $6,565,948 | 95.3% | $32,830 |
| Real Estate Taxes | 732,176 | 892,678 | 901,709 | 908,290 | 13.8 | 4,541 |
| Insurance | 44,097 | 61,238 | 136,147 | 193,034 | 2.9 | 965 |
| Management Fee | 303,304 | 295,030 | 241,070 | 196,978 | 3.0 | 985 |
| Other Expenses | 1,110,311 | 1,113,435 | 1,077,207 | 1,077,207 | 16.4 | 5,386 |
| Total Operating Expenses | $2,189,888 | $2,362,380 | $2,356,133 | $2,375,509 | 36.2% | $11,878 |
| Net Operating Income | $3,601,095 | $3,622,453 | $3,959,496 | $4,190,439 | 63.8% | $20,952 |
| Capital Expenditures | 0 | 0 | 0 | 50,000 | 0.8 | 250 |
| Net Cash Flow | $3,601,095 | $3,622,453 | $3,959,496 | $4,140,439 | 63.1% | $20,702 |
| NOI DSCR | 1.07x | 1.08x | 1.18x | 1.25x | ||
| NCF DSCR | 1.07x | 1.08x | 1.18x | 1.23x | ||
| NOI Debt Yield | 7.5% | 7.6% | 8.3% | 8.8% | ||
| NCF Debt Yield | 7.5% | 7.6% | 8.3% | 8.7% |
| (1) | Represents (i) percent of Net Rental Income for all revenue fields, (ii) percent of Gross Potential Rent for Vacancy & Credit Loss and (iii) percent of Effective Gross Income for all other fields. |
| (2) | Other Income is comprised of utility reimbursement and other miscellaneous fees. |
Appraisal. The appraisal concluded to an “as-is” appraised value as of March 12, 2024 of $71,000,000.
Environmental Matters. According to the Phase I environmental report dated May 6, 2024, there was no evidence of any recognized environmental conditions at The Archive Apartments Property.
Market Overview and Competition. The Archive Apartments Property is located in Minneapolis, Minnesota in Hennepin County. Primary access is provided by Interstate 394. The Archive Apartments Property is located in the eastern area of the North Loop in downtown Minneapolis, with the surrounding neighborhood consisting of low- to mid-rise residential and retail including dining, breweries, and theaters, and a riverside walking trail and park. Additionally, the neighborhood is located approximately half a mile from Target Field and one mile from US Bank Stadium. Public transportation is provided by Metro Transit and provides access to the greater Twin Cities Metropolitan area.
According to the appraisal, the 2024 estimated population within a one-, three-, and five-mile radius of The Archive Apartments Property is 31,581, 247,341 and 479,722, respectively. The 2024 estimated median household income within the same radii was $98,021, $60,328 and $71,805, respectively.
According to the appraisal, The Archive Apartments Property is considered Class A and is situated in the Minneapolis metropolitan area which has an inventory of 121,144 units as of 2023. The 2023 vacancy rate for Class A properties in the Minneapolis metropolitan area is 9.8% with an average asking rent of $1,743 per unit. According to a third-party report, based on 2,879 multifamily units in the North Loop, the vacancy rate is 5.9%. Comparable rental properties for The Archive Apartments Property have vacancy rates ranging from 0.0% to 4.0%.
| THE INFORMATION IN THIS STRUCTURAL AND COLLATERAL TERM SHEET IS NOT COMPLETE AND MAY BE AMENDED PRIOR TO THE TIME OF SALE. THIS TERM SHEET IS NOT AN OFFER TO SELL THESE SECURITIES AND IT IS NOT A SOLICITATION OF AN OFFER TO BUY THESE SECURITIES IN ANY JURISDICTION WHERE THE OFFER OR SALE IS NOT PERMITTED. | ||
| 73 | ||
| Multifamily – Mid Rise | Loan #5 | Cut-off Date Balance: | $47,850,000 | |
| 110 North 1st Street | The Archive Apartments | Cut-off Date LTV: | 67.4% | |
| Minneapolis, MN 55401 | U/W NCF DSCR: | 1.23x | ||
| U/W NOI Debt Yield: | 8.8% |
The following table presents certain information relating to the appraisal’s market rent conclusion for The Archive Apartments Property:
Market Rent Summary
| Unit Type | Units(1) | Avg. Monthly Actual Rent per Unit(1)(2) | Avg. Monthly Market Rent per Unit(3) |
| Studio | 10 | $1,628 | $1,660 |
| One Bedroom | 102 | $1,790 | $1,802 |
| Two Bedroom | 88 | $2,715 | $2,731 |
| Total / Wtd. Average | 200 | $2,180 | $2,204 |
| (1) | Based on the underwritten rent roll dated May 7, 2024. |
| (2) | Represents the average rent for occupied units only. |
| (3) | Based on the appraisal. |
The following table presents certain information relating to multifamily rental properties comparable to The Archive Apartments Property:
Comparable Rental Properties(1)
| Property | Year Built | # Units | Occupancy | Unit Mix | In-Place Monthly Rent per Unit |
The Archive Apartments(2) Minneapolis, MN | 2021 | 200 | 96.5% | Studio 1BR 2BR | $1,628 $1,790 $2,715 |
The Duffey Minneapolis, MN | 1910, 1916 | 188 | 96.0% | Studio 1BR 2BR | $1,455 - $1,555 $1,619 - $2,111 $2,495 - $3,075 |
Viridium Apartments Minneapolis, MN | 2021 | 139 | 99.0% | Studio 1BR 2BR | $1,315 - $1,460 $1,640 - $1,900 $2,660 - $3,650 |
724 Lofts Minneapolis, MN
| 1886 | 49 | 100.0% | Studio 1BR 2BR | NAP NAP $1,950 - $2,375 |
| 270 Hennepin Minneapolis, MN | 2021 | 346 | 97.0% | Studio 1BR 2BR | $1,420 - $1,700 $1,940 - $2,4251 $2,790 - $4,300 |
| North Loop Green 360 Minneapolis, MN | 2024 | 450 | NAV | Studio 1BR 2BR | $1,572 - $1,761 $1,849 - $3,708 $3,650 - $8,450 |
| (1) | Source: Appraisal, unless otherwise noted. |
| (2) | Other than Year Built, information is based on the underwritten rent roll dated May 7, 2024. |
The following table presents recent comparable multifamily sales data with respect to The Archive Apartments Property:
Comparable Sales(1)
| Property | Year Built | # Units | Occupancy | Date of Sale | Sale Price | Sale Price per Unit | Capitalization Rate |
The Archive Apartments Minneapolis, MN | 2021 | 200 | 96.5%(2) | ||||
Arlo West End St. Louis Park, MN | 2020 | 164 | NAV | Jan. 2024 | $53,437,500 | $325,838 | 5.00% |
Expo Apartments Minneapolis, MN | 2020 | 369 | NAV | Dec. 2023 | $120,000,000 | $325,203 | 5.75% |
Nic on Fifth Apts. Minneapolis, MN | 2014 | 250 | NAV | Sep. 2023 | $70,000,000 | $280,000 | 5.75% |
Millennium Edina Edina, MN | 2021 | 227 | 96.0% | Aug. 2023 | $74,700,000 | $329,075 | 5.18% |
Millennium West End St. Louis Park, MN | 2015 | 158 | 94.0% | Aug. 2022 | $50,700,000 | $320,886 | 4.05% |
| (1) | Source: Appraisal |
| (2) | Based on the underwritten rent roll dated May 7, 2024. |
| THE INFORMATION IN THIS STRUCTURAL AND COLLATERAL TERM SHEET IS NOT COMPLETE AND MAY BE AMENDED PRIOR TO THE TIME OF SALE. THIS TERM SHEET IS NOT AN OFFER TO SELL THESE SECURITIES AND IT IS NOT A SOLICITATION OF AN OFFER TO BUY THESE SECURITIES IN ANY JURISDICTION WHERE THE OFFER OR SALE IS NOT PERMITTED. | ||
| 74 | ||
| Multifamily – Mid Rise | Loan #5 | Cut-off Date Balance: | $47,850,000 | |
| 110 North 1st Street | The Archive Apartments | Cut-off Date LTV: | 67.4% | |
| Minneapolis, MN 55401 | U/W NCF DSCR: | 1.23x | ||
| U/W NOI Debt Yield: | 8.8% |
Escrows.
Real Estate Taxes – The Archive Apartments Mortgage Loan documents require an upfront deposit of $302,763 for real estate taxes and ongoing monthly deposits equal to 1/12 of the taxes that the lender estimates will be payable during the next 12 months (initially $75,691).
Insurance – The Archive Apartments Mortgage Loan documents require an upfront deposit of $48,259 for insurance premiums and ongoing monthly deposits equal to 1/12 of the insurance premiums that the lender estimates will be payable during the next 12 months (initially $16,086).
Replacement Reserve – The Archive Apartments Mortgage Loan documents require ongoing monthly replacement reserve deposits of $4,167 ($250 per unit per year).
Lockbox and Cash Management. The Archive Apartments Mortgage Loan is structured with a soft lockbox and springing cash management. The Archive Apartments Mortgage Loan documents require the borrower to deposit, or cause the manager to deposit, all rents into the lockbox within one business day of receipt. If a Cash Management Period (as defined below) is not in effect, all funds in the lockbox will be swept daily into the borrower’s operating account. During a Cash Management Period, all funds in the lockbox will be swept daily into a cash management account controlled by the lender and applied in accordance with The Archive Apartments Mortgage Loan documents.
A “Cash Management Period” will commence upon the earliest of the following:
| (i) | the occurrence of a default or an event of default; or |
| (ii) | if as of the last day of any calendar quarter, the net cash flow debt service coverage ratio (based on the trailing 12-month period as calculated by the lender) is less than 1.10x. |
A Cash Management Period will end upon the occurrence of the following:
| ● | with regard to clause (i), the cure of such default or event of default and no other default or event of default has occurred and is continuing; or |
| ● | with regard to clause (ii), the net cash flow debt service coverage ratio (based on the trailing 12-month period as calculated by the lender) is at least 1.15x for two consecutive calendar quarters. |
Property Management. The Archive Apartments Property is managed by Solhem LLC, an affiliate of the borrower.
Partial Release. Not permitted.
Real Estate Substitution. Not permitted.
Subordinate and Mezzanine Indebtedness. None.
Right of First Offer / Right of First Refusal. None.
Ground Lease. None.
Terrorism Insurance. The Archive Apartments Mortgage Loan documents require that the “all risk” insurance policy required to be maintained by the borrower provides coverage for terrorism in an amount equal to the full replacement cost of The Archive Apartments Property, as well as business interruption insurance covering no less than the 18-month period following the occurrence of a casualty event, together with a 12-month extended period of indemnity.
| THE INFORMATION IN THIS STRUCTURAL AND COLLATERAL TERM SHEET IS NOT COMPLETE AND MAY BE AMENDED PRIOR TO THE TIME OF SALE. THIS TERM SHEET IS NOT AN OFFER TO SELL THESE SECURITIES AND IT IS NOT A SOLICITATION OF AN OFFER TO BUY THESE SECURITIES IN ANY JURISDICTION WHERE THE OFFER OR SALE IS NOT PERMITTED. | ||
| 75 | ||
| Multifamily – Mid Rise | Loan #6 | Cut-off Date Balance: | $45,500,000 | |
| 3060 West Olympic Boulevard | 3060 Olympic | Cut-off Date LTV: | 62.1% | |
| Los Angeles, CA 90006 | U/W NCF DSCR: | 1.26x | ||
| U/W NOI Debt Yield: | 8.4% |
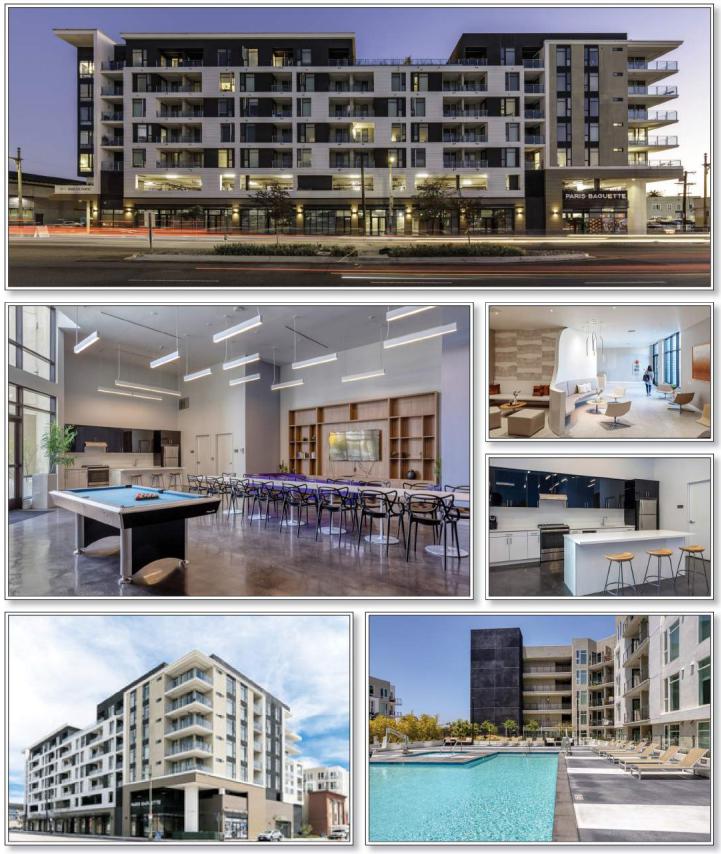
| THE INFORMATION IN THIS STRUCTURAL AND COLLATERAL TERM SHEET IS NOT COMPLETE AND MAY BE AMENDED PRIOR TO THE TIME OF SALE. THIS TERM SHEET IS NOT AN OFFER TO SELL THESE SECURITIES AND IT IS NOT A SOLICITATION OF AN OFFER TO BUY THESE SECURITIES IN ANY JURISDICTION WHERE THE OFFER OR SALE IS NOT PERMITTED. | ||
| 76 | ||
| Multifamily – Mid Rise | Loan #6 | Cut-off Date Balance: | $45,500,000 | |
| 3060 West Olympic Boulevard | 3060 Olympic | Cut-off Date LTV: | 62.1% | |
| Los Angeles, CA 90006 | U/W NCF DSCR: | 1.26x | ||
| U/W NOI Debt Yield: | 8.4% |
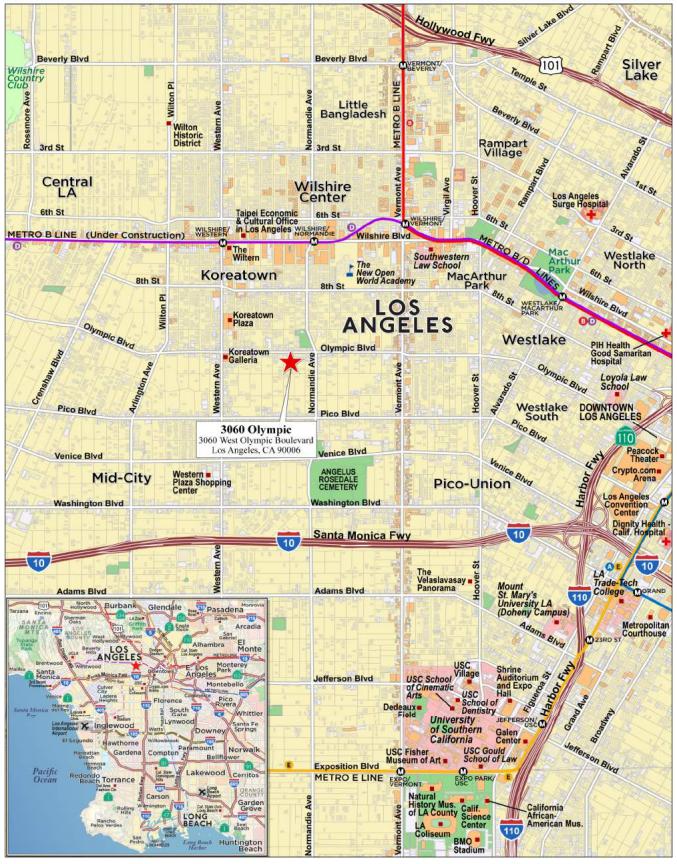
| THE INFORMATION IN THIS STRUCTURAL AND COLLATERAL TERM SHEET IS NOT COMPLETE AND MAY BE AMENDED PRIOR TO THE TIME OF SALE. THIS TERM SHEET IS NOT AN OFFER TO SELL THESE SECURITIES AND IT IS NOT A SOLICITATION OF AN OFFER TO BUY THESE SECURITIES IN ANY JURISDICTION WHERE THE OFFER OR SALE IS NOT PERMITTED. | ||
| 77 | ||
| No. 6 – 3060 Olympic | |||||||
| Mortgage Loan Information | Mortgaged Property Information | ||||||
| Mortgage Loan Seller: | Argentic Real Estate Finance 2 LLC | Single Asset/Portfolio: | Single Asset | ||||
| Credit Assessment (Fitch/KBRA/Moody’s): | NR/NR/NR | Property Type – Subtype: | Multifamily – Mid Rise | ||||
| Original Principal Balance: | $45,500,000 | Location: | Los Angeles, CA | ||||
| Cut-off Date Balance: | $45,500,000 | Size: | 226 Units | ||||
| % of Initial Pool Balance: | 6.2% | Cut-off Date Balance Per Unit: | $201,327 | ||||
| Loan Purpose: | Refinance | Maturity Date Balance Per Unit: | $201,327 | ||||
| Borrower Sponsor: | David Y. Lee | Year Built/Renovated: | 2018/NAP | ||||
| Guarantor: | David Y. Lee | Title Vesting: | Leasehold | ||||
| Mortgage Rate: | 6.4900% | Property Manager: | Carter Residential, LLC (borrower-related) | ||||
| Note Date: | 6/18/2024 | Current Occupancy (As of): | 94.2% (6/10/2024) | ||||
| Seasoning: | 0 months | YE 2023 Occupancy: | 85.4% | ||||
| Maturity Date: | July 6, 2029 | YE 2022 Occupancy: | 96.9% | ||||
| IO Period: | 60 months | YE 2021 Occupancy: | 98.2% | ||||
| Loan Term (Original): | 60 months | YE 2020 Occupancy: | 79.2% | ||||
| Amortization Term (Original): | NAP | As-Is Appraised Value: | $73,300,000 | ||||
| Loan Amortization Type: | Interest Only | As-Is Appraised Value Per Unit: | $324,336 | ||||
| Call Protection: | L(24),D(31),O(5) | As-Is Appraisal Valuation Date: | April 17, 2024 | ||||
| Lockbox Type: | Soft/Springing Cash Management | Underwriting and Financial Information | |||||
| Additional Debt: | None | TTM NOI (4/30/2024)(2): | $3,282,794 | ||||
| Additional Debt Type (Balance): | NAP | YE 2023 NOI: | $3,568,040 | ||||
| YE 2022 NOI: | $3,409,153 | ||||||
| YE 2021 NOI: | $2,963,531 | ||||||
| YE 2020 NOI: | NAV | ||||||
| U/W Revenues: | $7,272,118 | ||||||
| U/W Expenses: | $3,452,177 | ||||||
| Escrows and Reserves(1) | U/W NOI(2): | $3,819,941 | |||||
| Initial | Monthly | Cap | U/W NCF: | $3,763,441 | |||
| Taxes: | $392,431 | $87,207 | NAP | U/W DSCR based on NOI/NCF: | 1.28x / 1.26x | ||
| Insurance: | $0 | Springing | NAP | U/W Debt Yield based on NOI/NCF: | 8.4% / 8.3% | ||
| Replacement Reserve: | $0 | $4,708 | NAP | U/W Debt Yield at Maturity based on NOI/NCF: | 8.4% / 8.3% | ||
| Ground Lease Reserve: | $0 | $66,000 | $132,000 | Cut-off Date LTV Ratio: | 62.1% | ||
| LTV Ratio at Maturity: | 62.1% | ||||||
| Sources and Uses | ||||||||||
| Sources | Uses | |||||||||
| Mortgage Loan Amount | $45,500,000 | 99.8 | % | Loan Payoff | $43,302,508 | 95.0 | % | |||
| Borrower Sponsor Equity | 88,191 | 0.2 | Closing Costs(3) | 1,893,251 | 4.2 | |||||
| Upfront Reserves | 392,431 | 0.9 | ||||||||
| Total Sources | $45,588,191 | 100.0 | % | Total Uses | $45,588,191 | 100.0 | % | |||
| (1) | See Escrows below for further discussion of reserve requirements. |
| (2) | The increase in U/W NOI from TTM NOI is primarily due to an increase in occupancy after the borrower sponsor evicted delinquent tenants in 2023. Furthermore, approximately $77,662 of master lease income was included. |
| (3) | Closing Costs include an origination fee of $1,365,000. |
The Mortgage Loan. The sixth largest mortgage loan (the “3060 Olympic Mortgage Loan”) is evidenced by a promissory note in the original principal amount of $45,500,000 and secured by a first priority leasehold mortgage encumbering a 226-unit mid-rise multifamily property in Los Angeles, California (the “3060 Olympic Property”).
The Borrower and the Borrower Sponsor. The borrower for the 3060 Olympic Mortgage Loan is Jeco Residential, LP, a single-purpose, California limited partnership, with one independent director in its organizational structure. The borrower sponsor and non-recourse carve-out guarantor for the 3060 Olympic Mortgage Loan is David Y. Lee. David Y. Lee is the president of Jamison Services Inc., one of the largest private commercial property owners in Los Angeles County. Jamison Services Inc. specializes in the acquisition, operation, construction, leasing and ownership of office, medical, and retail properties. The company currently operates over 100 commercial buildings comprising approximately 20 million square feet.
The Property. The 3060 Olympic Property is a 226-unit, mid-rise apartment complex situated east of Western Avenue within the Wilshire Center – Koreatown neighborhood council of the city of Los Angeles, Los Angeles County, California. Built in 2018, the 3060 Olympic Property is comprised of one, seven-story mid-rise apartment building situated on a 1.66-acre site. The residential unit mix consists of studio, one-bedroom, and two-bedroom units with an average unit size of 634 square feet. Of the 226 total units, 19 units are set aside as rent restricted units for a period of 55 years (2073 expiration). These units are required to be leased to individuals or families whose income does not exceed 50% of the area median income. In addition, the 3060 Olympic Property is subject to rent
| THE INFORMATION IN THIS STRUCTURAL AND COLLATERAL TERM SHEET IS NOT COMPLETE AND MAY BE AMENDED PRIOR TO THE TIME OF SALE. THIS TERM SHEET IS NOT AN OFFER TO SELL THESE SECURITIES AND IT IS NOT A SOLICITATION OF AN OFFER TO BUY THESE SECURITIES IN ANY JURISDICTION WHERE THE OFFER OR SALE IS NOT PERMITTED. | ||
| 78 | ||
| Multifamily – Mid Rise | Loan #6 | Cut-off Date Balance: | $45,500,000 | |
| 3060 West Olympic Boulevard | 3060 Olympic | Cut-off Date LTV: | 62.1% | |
| Los Angeles, CA 90006 | U/W NCF DSCR: | 1.26x | ||
| U/W NOI Debt Yield: | 8.4% |
control under the City of Los Angeles Rent Stabilization Ordinance. Project amenities include a fitness center, open courtyard with pool and spa with lounge seating, club room with demonstration kitchen, rooftop lounge with barbeque and fire pits, EV charging stations, bike storage area, on-site management, security surveillance cameras, 24-hour concierge/courtesy patrol, and leasing office. Unit amenities include vinyl plank flooring in living and bedroom areas, stainless steel appliances (refrigerator, electric range/oven, dishwasher, microwave), quartz countertops, in-unit washer/dryer, and private balcony/patio. The 3060 Olympic Property maintains 305 parking spaces, or 1.35 spaces per unit, and is equipped with three elevators.
The 3060 Olympic Property also contains a commercial/retail component which consists of 17,923 square feet located on the ground floor and comprised of three retail spaces ranging from 2,500 to 8,000 square feet per space that are fully leased to a restaurant, a bakery, and an adult day care. As of June 10, 2024, the 3060 Olympic Property was 94.2% leased. At closing, the guarantor executed a master lease for all vacant and delinquent units (13 units). The master lease may be terminated at the earlier to occur of (A) the repayment in full of the 3060 Olympic Mortgage Loan or (B) each of the following conditions are satisfied (i) no Trigger Period (as defined below) is then continuing, (ii) the 3060 Olympic Property has an occupancy rate of 95%, and (iii) debt yield is equal to or greater than 8% for one calendar quarter. Net of a 5% vacancy factor, approximately $77,662 of master lease income was included in the underwritten effective gross income.
The table below shows the unit mix at the 3060 Olympic Property:
Unit Mix(1)
| Unit Mix / Type | Total Units | Leased Units | Average Square Feet per Unit | % Leased |
| Studio | 3 | 3 | 619 | 100.0% |
| Studio – Affordable | 1 | 1 | 619 | 100.0% |
| One Bedroom | 177 | 165 | 586 | 93.2% |
| One Bedroom - Affordable | 15 | 15 | 628 | 100.0% |
| Two Bedroom | 27 | 26 | 927 | 96.3% |
| Two Bedroom - Affordable | 3 | 3 | 903 | 100.0% |
| Total / Wtd. Avg. | 226 | 213 | 634 | 94.2% |
| (1) | Information based on the underwritten rent roll dated June 10, 2024. |
The following table presents historical occupancy percentages at the 3060 Olympic Property:
Historical Occupancy
12/31/2021(1) | 12/31/2022(1) | 12/31/2023(1)(2) | 6/10/2024(3) |
| 98.2% | 96.9% | 85.4% | 94.2% |
| (1) | Information obtained from the borrower sponsor. |
| (2) | Occupancy decreased in 2023 as the borrower sponsor began evicting delinquent tenants after the eviction moratorium was lifted in California in March 2023. |
| (3) | Information based on the underwritten rent roll dated June 10, 2024. |
| THE INFORMATION IN THIS STRUCTURAL AND COLLATERAL TERM SHEET IS NOT COMPLETE AND MAY BE AMENDED PRIOR TO THE TIME OF SALE. THIS TERM SHEET IS NOT AN OFFER TO SELL THESE SECURITIES AND IT IS NOT A SOLICITATION OF AN OFFER TO BUY THESE SECURITIES IN ANY JURISDICTION WHERE THE OFFER OR SALE IS NOT PERMITTED. | ||
| 79 | ||
| Multifamily – Mid Rise | Loan #6 | Cut-off Date Balance: | $45,500,000 | |
| 3060 West Olympic Boulevard | 3060 Olympic | Cut-off Date LTV: | 62.1% | |
| Los Angeles, CA 90006 | U/W NCF DSCR: | 1.26x | ||
| U/W NOI Debt Yield: | 8.4% |
Operating History and Underwritten Net Cash Flow. The following table presents certain information relating to the historical operating performance and underwritten net cash flow at the 3060 Olympic Property:
Cash Flow Analysis
| 2021 | 2022 | 2023 | 4/30/2024 TTM | U/W | %(1) | U/W $ per unit | |
| Gross Potential Rent | $5,015,259 | $5,550,297 | $5,465,728 | $5,208,276 | $6,042,766 | 79.8% | $26,738 |
| Commercial Income | 853,446 | 869,458 | 869,486 | 855,722 | 917,681 | 12.1 | 4,061 |
| Parking Income | 170,293 | 215,215 | 234,362 | 224,437 | 224,437 | 3.0 | 993 |
| Other Income(2) | 245,301 | 338,039 | 390,668 | 389,372 | 389,372 | 5.1 | 1,723 |
| Net Rental Income | $6,284,299 | $6,973,009 | $6,960,244 | $6,677,807 | $7,574,256 | 100.0% | $33,514 |
| Less Vacancy, Concessions & Credit Loss | (331,578) | (206,752) | (11,182) | (36,816) | (302,138) | (5.0) | (1,337) |
| Effective Gross Income | $5,952,721 | $6,766,257 | $6,949,062 | $6,640,991 | $7,272,118 | 96.0% | $32,178 |
| Real Estate Taxes | 972,345 | 1,291,970 | 1,059,534 | 1,046,345 | 1,005,811 | 13.8 | 4,450 |
| Insurance | 93,145 | 70,128 | 71,436 | 80,068 | 99,336 | 1.4 | 440 |
| Management Fee | 217,756 | 187,395 | 190,542 | 150,438 | 218,164 | 3.0 | 965 |
| Ground Rent | 685,742 | 792,000 | 792,000 | 792,000 | 839,520 | 11.5 | 3,715 |
| Other Expenses | 1,020,202 | 1,015,611 | 1,267,510 | 1,289,346 | 1,289,346 | 17.7 | 5,705 |
| Total Operating Expenses | $2,989,190 | $3,357,104 | $3,381,022 | $3,358,197 | $3,452,177 | 47.5% | $15,275 |
| Net Operating Income(3) | $2,963,531 | $3,409,153 | $3,568,040 | $3,282,794 | $3,819,941 | 52.5% | $16,902 |
| Capital Expenditures | 0 | 0 | 0 | 0 | 56,500 | 0.8 | 250 |
| Net Cash Flow | $2,963,531 | $3,409,153 | $3,568,040 | $3,282,794 | $3,763,441 | 51.8% | $16,652 |
| NOI DSCR | 0.99x | 1.14x | 1.19x | 1.10x | 1.28x | ||
| NCF DSCR | 0.99x | 1.14x | 1.19x | 1.10x | 1.26x | ||
| NOI Debt Yield | 6.5% | 7.5% | 7.8% | 7.2% | 8.4% | ||
| NCF Debt Yield | 6.5% | 7.5% | 7.8% | 7.2% | 8.3% |
| (1) | Represents (i) percent of Net Rental Income for all revenue fields, (ii) percent of Gross Potential Rent for Vacancy & Credit Loss and (iii) percent of Effective Gross Income for all other fields. |
| (2) | Other Income is comprised of utility reimbursement and other miscellaneous fees. |
| (3) | The increase in U/W Net Operating Income from TTM Net Operating Income is primarily due to an increase in occupancy after the borrower sponsor evicted delinquent tenants in 2023. Furthermore, approximately $77,662 of master lease income was included. |
Appraisal. The appraisal concluded to an “as-is” appraised value as of April 17, 2024 of $73,300,000.
Environmental Matters. According to the Phase I environmental report dated May 23, 2024, there was no evidence of any recognized environmental conditions at the 3060 Olympic Property.
Market Overview and Competition. The 3060 Olympic Property is located in the Koreatown neighborhood of Los Angeles, California, approximately three miles west of downtown Los Angeles. The 3060 Olympic Property is situated on Olympic Boulevard, which is one of the main east/west thoroughfares running through Los Angeles and is lined with retail and commercial facilities, office buildings, and other multifamily projects. Koreatown is centrally located within Los Angeles and is known for its restaurants and nightlife. The major industries within Los Angeles County are healthcare / social assistance, retail trade, and professional / scientific / technology services. The largest employers in the county include Los Angeles International Airport, UCLA Health System, UCLA Community Based Learning, and University of California Los Angeles.
According to the appraisal, the 2023 estimated population within a one-, three-, and five-mile radius of the 3060 Olympic Property is 99,762, 624,364 and 1,268,049, respectively. The 2023 estimated median household income within the same radii was $45,916, $54,074 and $60,845, respectively.
According to the appraisal, the 3060 Olympic Property is situated in the Mid-Wilshire apartment submarket, which contained approximately 123,214 units as of the first quarter of 2024. The Mid-Wilshire apartment submarket reported a vacancy rate of 4.9% with an average effective rent of $2,805 per unit.
| THE INFORMATION IN THIS STRUCTURAL AND COLLATERAL TERM SHEET IS NOT COMPLETE AND MAY BE AMENDED PRIOR TO THE TIME OF SALE. THIS TERM SHEET IS NOT AN OFFER TO SELL THESE SECURITIES AND IT IS NOT A SOLICITATION OF AN OFFER TO BUY THESE SECURITIES IN ANY JURISDICTION WHERE THE OFFER OR SALE IS NOT PERMITTED. | ||
| 80 | ||
| Multifamily – Mid Rise | Loan #6 | Cut-off Date Balance: | $45,500,000 | |
| 3060 West Olympic Boulevard | 3060 Olympic | Cut-off Date LTV: | 62.1% | |
| Los Angeles, CA 90006 | U/W NCF DSCR: | 1.26x | ||
| U/W NOI Debt Yield: | 8.4% |
The following table presents certain information relating to the appraisal’s market rent conclusion for the 3060 Olympic Property:
Market Rent Summary
| Unit Type | Units(1) | Avg. Monthly Actual Rent per Unit(1)(2) | Avg. Monthly Market Rent per Unit(3) |
| Studio | 3 | $2,097 | $2,200 |
| Studio Affordable | 1 | $695 | $809 |
| One Bedroom | 177 | $2,224 | $2,350 |
| One Bedroom Affordable | 15 | $745 | $925 |
| Two Bedroom | 27 | $3,250 | $3,450 |
| Two Bedroom Affordable | 3 | $782 | $1,041 |
| Total/Wtd. Average | 226 | $2,216 | $2,361 |
| (1) | Based on the underwritten rent roll dated June 10, 2024. |
| (2) | Represents the average rent for occupied units only. |
| (3) | Based on the appraisal. |
The following table presents certain information relating to multifamily rental properties comparable to the 3060 Olympic Property:
Comparable Rental Properties(1)
| Property | Year Built | # Units | Occupancy | Unit Mix | In-Place Monthly Rent per Unit |
3060 Olympic(2) Los Angeles, CA | 2018 | 226 | 94.2% | Studio 1BR 2BR | $2,097 $2,224 $3,250 |
W Marino Los Angeles, CA | 2018 | 78 | 100.0% | Studio 1BR 2BR | NAP NAP $3,050 |
Sienna Apartments Los Angeles, CA | 2019 | 104 | 95.0% | Studio 1BR 2BR | NAP $2,123 - $2,399 $2,947 |
1120 S Serrano Ave Los Angeles, CA | 2024 | 52 | 46.0% | Studio 1BR 2BR | $1,850 $2,375 - $2,400 $2,900 - $3,350 |
The Bora 3170 Los Angeles, CA | 2023 | 252 | 58.0% | Studio 1BR 2BR | $2,454 - $2,643 $2,799 - $3,661 $3,525 - $3,907 |
Audrey Apartments Los Angeles, CA | 2020 | 160 | 98.0% | Studio 1BR 2BR | NAP $2,377 - $2,506 $2,885 - $3,738 |
Gemma Ktown Los Angeles, CA | 2022 | 329 | 95.0% | Studio 1BR 2BR | $2,250 - $3,120 $2,300 - $2,450 $3,250 - $3,300 |
Luna on Wilshire Los Angeles, CA | 2018 | 209 | 95.0% | Studio 1BR 2BR | $1,975 - $2,100 $2,150 - $2,250 $3,400 - $3,450 |
| (1) | Source: Appraisal, unless otherwise noted. |
| (2) | Other than Year Built, information is based on the underwritten rent roll dated June 10, 2024. In-Place Monthly Rent per Unit represents market rate units only. |
| THE INFORMATION IN THIS STRUCTURAL AND COLLATERAL TERM SHEET IS NOT COMPLETE AND MAY BE AMENDED PRIOR TO THE TIME OF SALE. THIS TERM SHEET IS NOT AN OFFER TO SELL THESE SECURITIES AND IT IS NOT A SOLICITATION OF AN OFFER TO BUY THESE SECURITIES IN ANY JURISDICTION WHERE THE OFFER OR SALE IS NOT PERMITTED. | ||
| 81 | ||
| Multifamily – Mid Rise | Loan #6 | Cut-off Date Balance: | $45,500,000 | |
| 3060 West Olympic Boulevard | 3060 Olympic | Cut-off Date LTV: | 62.1% | |
| Los Angeles, CA 90006 | U/W NCF DSCR: | 1.26x | ||
| U/W NOI Debt Yield: | 8.4% |
The following table presents recent comparable multifamily sales data with respect to the 3060 Olympic Property:
Comparable Sales(1)
| Property | Year Built | # Units | Occupancy | Date of Sale | Sale Price | Sale Price per Unit | Capitalization Rate |
3060 Olympic Los Angeles, CA | 2018 | 226(2) | 94.2%(2) | ||||
Maya Apartments Los Angeles, CA | 2018 | 72 | 83.0% | Apr-24 | $31,450,000 | $436,806 | 4.83% |
Cobalt Los Angeles, CA | 2019 | 135 | 95.0% | Feb-24 | $67,700,000 | $501,481 | 5.65% |
MetWest on Sunset Los Angeles, CA | 2016 | 79 | 97.0% | Sep-23 | $27,300,000 | $345,570 | 5.53% |
Angelene Los Angeles, CA | 2016 | 179 | 95.0% | Mar-23 | $112,500,000 | $628,492 | 4.75% |
nVe North Hollywood, CA | 2017 | 82 | 96.0% | Feb-23 | $32,000,000 | $390,244 | 5.24% |
The LC by CLG Los Angeles, CA | 2015 | 84 | 98.0% | Jan-23 | $46,500,000 | $553,571 | 5.00% |
| (1) | Source: Appraisal |
| (2) | Based on the underwritten rent roll dated June 10, 2024. |
Escrows.
Real Estate Taxes – The 3060 Olympic Mortgage Loan documents require an upfront deposit of $392,431 for real estate taxes and ongoing monthly deposits equal to 1/12 of the taxes that the lender estimates will be payable during the next 12 months (initially $87,207).
Insurance – The 3060 Olympic Mortgage Loan documents require ongoing monthly deposits equal to 1/12 of the insurance premiums that the lender estimates will be payable during the next 12 months, provided, however the borrower is not required to make monthly deposits into the insurance escrow as long as a blanket policy acceptable to the lender remains in place.
Replacement Reserve – The 3060 Olympic Mortgage Loan documents require ongoing monthly replacement reserve deposits of $4,708 ($250 per unit per year).
Ground Lease Reserve – The 3060 Olympic Mortgage Loan documents require ongoing monthly ground lease reserve deposits equal to the lesser of $66,000 and the positive difference between the amount then deposited in the ground lease reserve and $132,000. The ground lease reserve is subject to a cap of $132,000.
Lockbox and Cash Management. The 3060 Olympic Mortgage Loan is structured with a soft lockbox and springing cash management. The 3060 Olympic Mortgage Loan documents require the borrower to deposit, or cause the manager to deposit, all rents into the lockbox within one business day of receipt. If a Trigger Period is not in effect, all funds in the lockbox will be swept daily into the borrower’s operating account. During a Trigger Period, all funds in the lockbox will be swept daily into a cash management account controlled by the lender and applied in accordance with the 3060 Olympic Mortgage Loan documents.
A “Trigger Period” will commence upon the earliest of the following:
| (i) | the occurrence of an event of default; or |
| (ii) | if as of the last day of any calendar quarter, the net cash flow debt service coverage ratio (based on the trailing 12-month period as calculated by the lender) is less than 1.05x (which will occur if the underwritten net cash flow is below $3,143,661). |
A Trigger Period will end upon the occurrence of the following:
| ● | with regard to clause (i), the cure of such event of default, the lender has accepted such cure and no other event of default is continuing; or |
| ● | with regard to clause (ii), as of the last day of any calendar quarter, the net cash flow debt service coverage ratio (based on the trailing 12-month period as calculated by the lender) is at least 1.05x (which will occur if the underwritten net cash flow is $3,143,661 or higher). |
Property Management. The 3060 Olympic Property is managed by Carter Residential, LLC, an affiliate of the borrower.
Partial Release. Not permitted.
Real Estate Substitution. Not permitted.
Subordinate and Mezzanine Indebtedness. None.
Right of First Offer / Right of First Refusal. None.
| THE INFORMATION IN THIS STRUCTURAL AND COLLATERAL TERM SHEET IS NOT COMPLETE AND MAY BE AMENDED PRIOR TO THE TIME OF SALE. THIS TERM SHEET IS NOT AN OFFER TO SELL THESE SECURITIES AND IT IS NOT A SOLICITATION OF AN OFFER TO BUY THESE SECURITIES IN ANY JURISDICTION WHERE THE OFFER OR SALE IS NOT PERMITTED. | ||
| 82 | ||
| Multifamily – Mid Rise | Loan #6 | Cut-off Date Balance: | $45,500,000 | |
| 3060 West Olympic Boulevard | 3060 Olympic | Cut-off Date LTV: | 62.1% | |
| Los Angeles, CA 90006 | U/W NCF DSCR: | 1.26x | ||
| U/W NOI Debt Yield: | 8.4% |
Ground Lease. The 3060 Olympic Property is subject to a ground lease between the borrower as ground lessee and Jong Whan Cha and Soon Ai Cha, Trustees of the Cha Revocable Family Trust Dated October 31, 2000 and JSR Development Group, LLC as ground lessor. The ground lease has an initial term of 33 years that commenced in August 2016 and expires in August 2049, with two, 33-year renewal options remaining that are as of right provided no event of default under the ground lease exists. The initial ground rent was set at $60,000 per month with an increase of 10% every five years. The current ground rent payment is $66,000 per month and is set to increase to $72,600 per month in August 2026.
Terrorism Insurance. The 3060 Olympic Mortgage Loan documents require that the “all risk” insurance policy required to be maintained by the borrower provides coverage for terrorism in an amount equal to the full replacement cost of the 3060 Olympic Property, as well as business interruption insurance covering no less than the 18-month period following the occurrence of a casualty event, together with a 12-month extended period of indemnity.
| THE INFORMATION IN THIS STRUCTURAL AND COLLATERAL TERM SHEET IS NOT COMPLETE AND MAY BE AMENDED PRIOR TO THE TIME OF SALE. THIS TERM SHEET IS NOT AN OFFER TO SELL THESE SECURITIES AND IT IS NOT A SOLICITATION OF AN OFFER TO BUY THESE SECURITIES IN ANY JURISDICTION WHERE THE OFFER OR SALE IS NOT PERMITTED. | ||
| 83 | ||
| Property Types – Various | Loan #7 | Cut-off Date Balance: | $33,522,953 | |
| Property Addresses – Various | ExchangeRight 67 | Cut-off Date LTV: | 46.8% | |
| U/W NCF DSCR: | 1.90x | |||
| U/W NOI Debt Yield: | 12.9% |
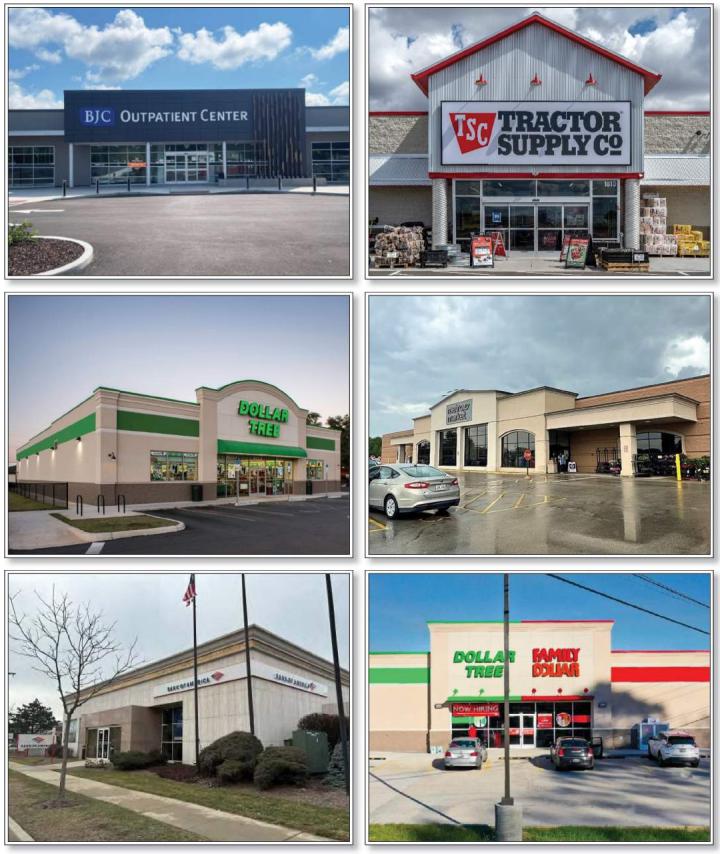
| THE INFORMATION IN THIS STRUCTURAL AND COLLATERAL TERM SHEET IS NOT COMPLETE AND MAY BE AMENDED PRIOR TO THE TIME OF SALE. THIS TERM SHEET IS NOT AN OFFER TO SELL THESE SECURITIES AND IT IS NOT A SOLICITATION OF AN OFFER TO BUY THESE SECURITIES IN ANY JURISDICTION WHERE THE OFFER OR SALE IS NOT PERMITTED. | ||
| 84 | ||
| Property Types – Various | Loan #7 | Cut-off Date Balance: | $33,522,953 | |
| Property Addresses – Various | ExchangeRight 67 | Cut-off Date LTV: | 46.8% | |
| U/W NCF DSCR: | 1.90x | |||
| U/W NOI Debt Yield: | 12.9% |
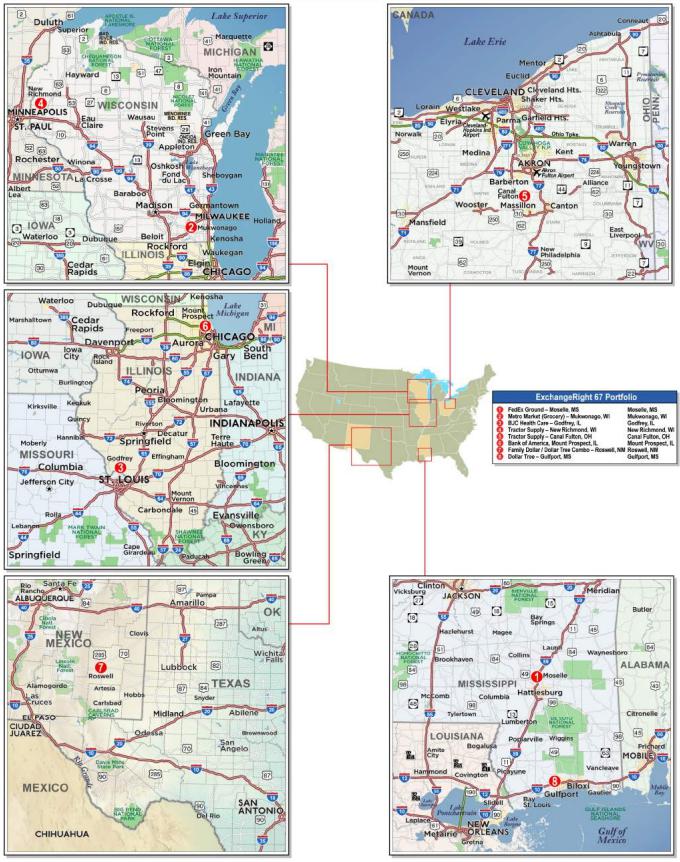
| THE INFORMATION IN THIS STRUCTURAL AND COLLATERAL TERM SHEET IS NOT COMPLETE AND MAY BE AMENDED PRIOR TO THE TIME OF SALE. THIS TERM SHEET IS NOT AN OFFER TO SELL THESE SECURITIES AND IT IS NOT A SOLICITATION OF AN OFFER TO BUY THESE SECURITIES IN ANY JURISDICTION WHERE THE OFFER OR SALE IS NOT PERMITTED. | ||
| 85 | ||
| No. 7 – ExchangeRight 67 | |||||||
| Mortgage Loan Information | Mortgaged Property Information | ||||||
| Mortgage Loan Seller: | Wells Fargo Bank, National Association | Single Asset/Portfolio: | Portfolio | ||||
| Credit Assessment (Fitch/KBRA/Moody’s): | NR/NR/NR | Property Type – Subtype: | Various – Various | ||||
| Original Principal Balance: | $33,522,953 | Location: | Various | ||||
| Cut-off Date Balance: | $33,522,953 | Size: | 369,844 SF | ||||
| % of Initial Pool Balance: | 4.6% |
Cut-off Date Balance Per SF: | $90.64 | ||||
| Loan Purpose: | Acquisition | Maturity Date Balance Per SF: | $90.64 | ||||
| Borrower Sponsors: | David Fisher, Joshua Ungerecht and Warren Thomas | Year Built/Renovated: | Various/Various | ||||
| Guarantors: | David Fisher, Joshua Ungerecht and Warren Thomas | Title Vesting: | Fee | ||||
| Mortgage Rate: | 6.4500% | Property Manager: | Self-managed | ||||
| Note Date: | June 11, 2024 | Current Occupancy (As of): | 100.0% (7/1/2024) | ||||
| Seasoning: | 1 month | YE 2023 Occupancy(3): | NAV | ||||
| Maturity Date: | June 11, 2029 | YE 2022 Occupancy(3): | NAV | ||||
| IO Period: | 60 months | YE 2021 Occupancy(3): | NAV | ||||
| Loan Term (Original): | 60 months | YE 2020 Occupancy(3): | NAV | ||||
| Amortization Term (Original): | NAP | As-Is Appraised Value: | $71,675,000 | ||||
| Loan Amortization Type: | Interest Only | As-Is Appraisal Value Per SF: | $193.80 | ||||
| Call Protection: | L(25),D(28),O(7) | As-Is Appraisal Valuation Date(3): | Various | ||||
| Lockbox Type: | Hard/Springing Cash Management | Underwriting and Financial Information | |||||
| Additional Debt: | No | YE 2023 NOI(3): | NAV | ||||
| Additional Debt Type (Balance): | NAP | YE 2022 NOI(3): | NAV | ||||
| YE 2021 NOI(3): | NAV | ||||||
| YE 2020 NOI(3): | NAV | ||||||
| Escrows and Reserves(1) | U/W Revenues: | $5,032,508 | |||||
| Initial | Monthly | Cap | U/W Expenses: | $716,364 | |||
| Real Estate Taxes | $165,998 | $51,171 | NAP | U/W NOI: | $4,316,143 | ||
| Insurance | $0 | Springing | NAP | U/W NCF: | $4,169,910 | ||
| Replacement Reserves | $53,005 | Springing | $166,032 | U/W DSCR based on NOI/NCF: | 1.97x / 1.90x | ||
| TI/LC Reserve | $500,000 | Springing | NAP | U/W Debt Yield based on NOI/NCF: | 12.9% / 12.4% | ||
| Immediate Repairs | $39,705 | $0 | NAP | U/W Debt Yield at Maturity based on NOI/NCF: | 12.9% / 12.4% | ||
| Cut-off Date LTV Ratio: | 46.8% | ||||||
| LTV Ratio at Maturity: | 46.8% | ||||||
| Sources and Uses | ||||||||||
| Sources | Uses | |||||||||
| Original loan amount | $33,522,953 | 45.7 | % | Purchase Price | $71,227,329 | 97.2 | % | |||
| Cash equity contribution | $39,755,909 | 54.3 | Reserves | 758,708 | 1.0 | |||||
| Closing Costs | 1,292,826 | 1.8 | ||||||||
| Total Sources | $73,278,862 | 100.0 | % | Total Uses | $73,278,862 | 100.0 | % | |||
| (1) | See “Escrows” section below. |
| (2) | Historical occupancy and NOI are unavailable, as the ExchangeRight 67 Properties (as defined below) were acquired by the ExchangeRight 67 Borrower between February 2024 and June 2024, and such information was not provided by the seller. |
| (3) | The individual appraisal valuation dates range from February 2, 2024 and May 11, 2024. |
The Mortgage Loan. The seventh largest mortgage loan (the “ExchangeRight 67 Mortgage Loan”) is evidenced by a promissory note in the original principal amount of $33,522,953 and secured by the fee interests in six single-tenant retail properties, one single-tenant medical office property and one single-tenant industrial property totaling 369,844 square feet (the “ExchangeRight 67 Properties”) located across 5 states.
The Borrower and Borrower Sponsors. The borrower is ExchangeRight Net-Leased Portfolio 67 DST (the “ExchangeRight 67 Borrower”), a Delaware statutory trust with at least one independent trustee. Legal counsel to the ExchangeRight 67 Borrower delivered a non-consolidation opinion in connection with the origination of the ExchangeRight 67 Mortgage Loan. The borrower sponsors and non-recourse carveout guarantors are David Fisher, Joshua Ungerecht, and Warren Thomas, all of whom serve as managing partners of ExchangeRight Real Estate, LLC. ExchangeRight Real Estate, LLC has more than 24 million square feet under management across over 1,200 properties across 47 states with a focus on investment grade, necessity-based retail and healthcare.
The ExchangeRight 67 Borrower has master leased the ExchangeRight 67 Properties to a master tenant (the “ExchangeRight Master Tenant”) owned by ExchangeRight Real Estate, LLC, which is in turn owned by the guarantors. The ExchangeRight Master Tenant is a
| THE INFORMATION IN THIS STRUCTURAL AND COLLATERAL TERM SHEET IS NOT COMPLETE AND MAY BE AMENDED PRIOR TO THE TIME OF SALE. THIS TERM SHEET IS NOT AN OFFER TO SELL THESE SECURITIES AND IT IS NOT A SOLICITATION OF AN OFFER TO BUY THESE SECURITIES IN ANY JURISDICTION WHERE THE OFFER OR SALE IS NOT PERMITTED. | ||
| 86 | ||
| Property Types – Various | Loan #7 | Cut-off Date Balance: | $33,522,953 | |
| Property Addresses – Various | ExchangeRight 67 | Cut-off Date LTV: | 46.8% | |
| U/W NCF DSCR: | 1.90x | |||
| U/W NOI Debt Yield: | 12.9% |
Delaware limited liability company structured to be bankruptcy-remote, with one independent director. The master lease generally imposes responsibility on the ExchangeRight Master Tenant for the operation, maintenance and management of the ExchangeRight 67 Properties and payment of all expenses incurred in the maintenance and repair of the ExchangeRight 67 Properties, other than capital expenses. The ExchangeRight Master Tenant’s interest in all tenant rents was assigned to the ExchangeRight 67 Borrower, which in turn collaterally assigned its interest to the lender. The master lease is subordinate to the ExchangeRight 67 Mortgage Loan and, upon an event of default under the ExchangeRight 67 Mortgage Loan, the lender has the right to cause the ExchangeRight 67 Borrower to terminate the master lease. A default under the master lease is an event of default under the ExchangeRight 67 Mortgage Loan and gives rise to recourse liability to the guarantors for losses, unless such default arises solely in connection with the failure of the ExchangeRight Master Tenant to pay rent as a result of the ExchangeRight 67 Properties not generating sufficient cash flow for the payment of such rent.
The lender has the right to require the ExchangeRight 67 Borrower to convert from a Delaware statutory trust to a limited liability company (a conversion) upon certain events, including (i) an event of default or the lender’s good faith determination of imminent default under the ExchangeRight 67 Mortgage Loan, (ii) the lender’s good faith determination that the ExchangeRight 67 Borrower will be unable to make a material decision or take a material action required in connection with the operation and maintenance of any of the ExchangeRight 67 Properties, and (iii) 90 days prior to the maturity date of the ExchangeRight 67 Mortgage Loan, if an executed commitment from an institutional lender to refinance the ExchangeRight 67 Mortgage Loan in full is not delivered to the lender.
The Properties. The ExchangeRight 67 Properties comprise eight properties including six single-tenant retail properties, one single-tenant medical office property and one single-tenant industrial property totaling 369,844 square feet and located across 5 states. The ExchangeRight 67 Properties are located in Mississippi (two properties, 61.4% of net rentable area), Wisconsin (two properties, 24.3% of net rentable area), Ohio (one property, 5.9% of net rentable area), Illinois (two properties, 5.4% of net rentable area), and New Mexico (one property, 2.8% of net rentable area). Built between 1987 and 2024 with, the ExchangeRight 67 Properties range in size from 5,717 square feet to 217,237 square feet.
The ExchangeRight 67 Properties are net leased to six nationally recognized tenants, all of which are investment grade-rated entities or subsidiaries of investment grade-rated entities. All of the ExchangeRight 67 Properties, have leases expiring after the stated maturity date of the ExchangeRight 67 Mortgage Loan, and no tenants have termination options.
The following table presents certain information relating to the ExchangeRight 67 Properties. As of July 1, 2024, the ExchangeRight 67 Properties are 100.0% occupied.
Properties Summary(1)
Tenant Name City, State | Year Built/ Renovated | Tenant NRSF | % of Portfolio NRSF | Appraised Value | % of Portfolio Appraised Value | Allocated Loan Amount | Annual U/W Base Rent PSF | % of Annual U/W Base Rent | Lease Expiration Date |
Renewal Options | Term. Option |
FedEx Ground – Moeselle, MS Moselle, MS | 2022/NAP | 217,237 | 58.7% | $33,400,000 | 46.6% | $15,621,439 | $9.90 | 45.9% | 9/30/2032 | 2 x 5 yrs. | N |
Metro Market (Grocery) Mukwonago, WI | 1990/2018 | 63,303 | 17.1% | $12,100,000 | 16.9% | $5,659,264 | $12.95 | 17.5% | 12/31/2034 | 8 x 5 yrs. | N |
BJC Health Care – Godfrey, IL Godfrey, IL | 2023/NAP | 14,419 | 3.9% | $7,400,000 | 10.3% | $3,461,037 | $33.99 | 10.5% | 9/30/2033 | 3 x 5 yrs. | N |
Tractor Supply – New New Richmond, WI | 2023/NAP | 26,738 | 7.2% | $6,100,000 | 8.5% | $2,853,017 | $14.36 | 8.2% | 12/31/2038 | 4 x 5 yrs. | N |
Tractor Supply – Canal Canal Fulton, OH | 2022/NAP | 21,930 | 5.9% | $5,200,000 | 7.3% | $2,432,080 | $15.35 | 7.2% | 2/28/2039 | 4 x 5 yrs. | N |
Bank of America – Mount Mount Prospect, IL | 1987/NAP | 5,717 | 1.5% | $3,800,000 | 5.3% | $1,777,290 | $43.73 | 5.3% | 12/31/2032 | 4 x 5 yrs. | N |
Dollar Tree / Family Dollar Roswell, NM | 2024/NAP | 10,500 | 2.8% | $1,850,000 | 2.6% | $865,259 | $12.76 | 2.9% | 1/31/2034 | 6 x 5 yrs. | N |
Dollar Tree – Gulfport, MS Gulfport, MS | 2024/NAP | 10,000 | 2.7% | $1,825,000 | 2.5% | $853,567 | $12.36 | 2.6% | 2/28/2034 | 6 x 5 yrs. | N |
| Total/Weighted Average | 369,844 | 100.0% | $71,675,000 | 100.0% | $33,522,953 | $12.68 | 100.0% |
| 1) | Information obtained from the appraisals and the underwritten rent roll. |
| THE INFORMATION IN THIS STRUCTURAL AND COLLATERAL TERM SHEET IS NOT COMPLETE AND MAY BE AMENDED PRIOR TO THE TIME OF SALE. THIS TERM SHEET IS NOT AN OFFER TO SELL THESE SECURITIES AND IT IS NOT A SOLICITATION OF AN OFFER TO BUY THESE SECURITIES IN ANY JURISDICTION WHERE THE OFFER OR SALE IS NOT PERMITTED. | ||
| 87 | ||
| Property Types – Various | Loan #7 | Cut-off Date Balance: | $33,522,953 | |
| Property Addresses – Various | ExchangeRight 67 | Cut-off Date LTV: | 46.8% | |
| U/W NCF DSCR: | 1.90x | |||
| U/W NOI Debt Yield: | 12.9% |
The following table presents certain information relating to the major tenants at the ExchangeRight 67 Properties:
Major Tenants(1)
| Tenant Name | Credit Rating (Moody’s/Fitch/S&P)(2) | No of Prop. | Tenant NRSF | % of NRSF | Annual U/W Base Rent(3)(4) | Annual U/W Base Rent PSF(3)(4) | % of Total Annual U/W Base Rent |
| Major Tenants | |||||||
| FedEx Ground | Baa2 / NR / BBB | 1 | 217,237 | 58.7% | $2,150,725 | $9.90 | 45.9% |
| Metro Market | Baa1 / NR / BBB | 1 | 63,303 | 17.1% | $819,998 | $12.95 | 17.5% |
| Tractor Supply | Baa1 / NR / BBB | 2 | 48,668 | 13.2% | $720,631 | $14.81 | 15.4% |
| BJC Health Care | NR / NR / AA | 1 | 14,419 | 3.9% | $490,081 | $33.99 | 10.5% |
| Family Dollar / Dollar Tree | Baa2 / NR / BBB | 2 | 20,500 | 5.5% | $257,580 | $12.56 | 5.5% |
| Bank of America | A1 / NR / A- | 1 | 5,717 | 1.5% | $250,000 | $43.73 | 5.3% |
| Total Major Tenants | 8 | 369,844 | 100.0% | $4,689,014 | $12.68 | 100.0% | |
| Vacant Space | 0 | 0.0% | |||||
| Collateral Total | 369,844 | 100.0% | |||||
| (1) | Information is based on the underwritten rent roll. |
| (2) | Certain ratings are those of the parent company whether or not the parent company guarantees the lease. |
| (3) | Annual U/W Base Rent and Annual U/W Base Rent PSF includes rent averaging for investment grade tenants totaling $13,584. |
| (4) | The UW Base Rent and UW Base Rent PSF shown above include contractual rent steps through January, 2025 totaling $39,048. |
The following table presents certain information relating to the lease expiration schedule at the ExchangeRight 67 Properties:
Lease Expiration Schedule(1)
| Year Ending December 31, | No. of Leases Expiring | Expiring NRSF | % of Total NRSF | Cumulative Expiring NRSF | Cumulative % of Total NRSF | Annual U/W Base Rent(2)(3) | % of Total Annual U/W Base Rent(2)(3) | Annual U/W Base Rent PSF |
| MTM | 0 | 0 | 0.0% | 0 | 0.0% | $0 | 0.0% | $0.00 |
| 2024 | 0 | 0 | 0.0% | 0 | 0.0% | $0 | 0.0% | $0.00 |
| 2025 | 0 | 0 | 0.0% | 0 | 0.0% | $0 | 0.0% | $0.00 |
| 2026 | 0 | 0 | 0.0% | 0 | 0.0% | $0 | 0.0% | $0.00 |
| 2027 | 0 | 0 | 0.0% | 0 | 0.0% | $0 | 0.0% | $0.00 |
| 2028 | 0 | 0 | 0.0% | 0 | 0.0% | $0 | 0.0% | $0.00 |
| 2029 | 0 | 0 | 0.0% | 0 | 0.0% | $0 | 0.0% | $0.00 |
| 2030 | 0 | 0 | 0.0% | 0 | 0.0% | $0 | 0.0% | $0.00 |
| 2031 | 0 | 0 | 0.0% | 0 | 0.0% | $0 | 0.0% | $0.00 |
| 2032 | 2 | 222,954 | 60.3% | 222,954 | 60.3% | $2,400,725 | 51.2% | $10.77 |
| 2033 | 1 | 14,419 | 3.9% | 237,373 | 64.2% | $490,081 | 10.5% | $33.99 |
| 2034 | 3 | 83,803 | 22.7% | 321,176 | 86.8% | $1,077,578 | 23.0% | $12.86 |
| Thereafter | 2 | 48,668 | 13.2% | 369,844 | 100.0% | $720,631 | 15.4% | $14.81 |
| Vacant | 0 | 0 | 0.0% | 369,844 | 100.0% | $0 | 0.0% | $0.00 |
| Total/Weighted Average | 8 | 369,844 | 100.0% | $4,689,014 | 100.0% | $12.68 |
| (1) | Information obtained from the underwritten rent roll. |
| (2) | Annual U/W Base Rent and Annual U/W Base Rent PSF includes rent averaging for investment grade tenants totaling $13,584. |
| (3) | The UW Base Rent and UW Base Rent PSF shown above include contractual rent steps through January, 2025 totaling $39,048. |
The following table presents historical occupancy percentages at the ExchangeRight 67 Properties:
Historical Occupancy
12/31/2020(1) | 12/31/2021(1) | 12/31/2022(1) | 12/31/2023(1) | 7/1/2024(2) |
| NAV | NAV | NAV | NAV | 100.0% |
| (1) | Historical occupancy information is not available, as the ExchangeRight 67 Properties were acquired by the ExchangeRight 67 Borrower between February 2024 and June 2024, and such information was not provided by the seller. |
| (2) | Information obtained from the underwritten rent roll. |
| THE INFORMATION IN THIS STRUCTURAL AND COLLATERAL TERM SHEET IS NOT COMPLETE AND MAY BE AMENDED PRIOR TO THE TIME OF SALE. THIS TERM SHEET IS NOT AN OFFER TO SELL THESE SECURITIES AND IT IS NOT A SOLICITATION OF AN OFFER TO BUY THESE SECURITIES IN ANY JURISDICTION WHERE THE OFFER OR SALE IS NOT PERMITTED. | ||
| 88 | ||
| Property Types – Various | Loan #7 | Cut-off Date Balance: | $33,522,953 | |
| Property Addresses – Various | ExchangeRight 67 | Cut-off Date LTV: | 46.8% | |
| U/W NCF DSCR: | 1.90x | |||
| U/W NOI Debt Yield: | 12.9% |
Underwritten Net Cash Flow. The following table presents certain information relating to the underwritten net cash flow at the ExchangeRight 67 Properties:
Cash Flow Analysis(1)
| U/W | %(2) | U/W $ per SF | |
| Base Rent | $4,505,178 | 86.4% | $12.18 |
| Grossed up Vacant Space | 183,837 | 3.5 | 0.50 |
| Gross Potential Rent | $4,689,014 | 89.9% | $12.68 |
| Total Recoveries | 527,330 | 10.1 | 1.43 |
| Net Rental Income | $5,216,344 | 100.0% | $14.10 |
| (Vacancy & Credit Loss) | (183,837) | (3.9) | (0.50) |
| Effective Gross Income | $5,032,508 | 96.5% | $13.61 |
| Real Estate Taxes | $520,146 | 10.3% | $1.41 |
| Insurance | 45,243 | 0.9 | 0.12 |
| Management Fee | 150,975 | 3.0 | 0.41 |
| Other Operating Expenses | 0 | 0.0 | 0.00 |
| Total Operating Expenses | $716,364 | 14.2% | $1.94 |
| Net Operating Income | $4,316,143 | 85.8% | $11.67 |
| Replacement Reserves | 55,340 | 1.1 | 0.15 |
| TI/LC | 90,893 | 1.8 | 0.25 |
| Net Cash Flow | $4,169,910 | 82.9% | $11.27 |
| NOI DSCR | 1.97x | ||
| NCF DSCR | 1.90x | ||
| NOI Debt Yield | 12.9% | ||
| NCF Debt Yield | 12.4% |
| (1) | Historical operating statements are not available, as the ExchangeRight 67 Borrower acquired the ExchangeRight 67 Properties between February 2024 and June 2024, and such information was not provided by the sellers. |
| (2) | Represents (i) percent of Net Rental Income for all revenue fields, (ii) percent of Gross Potential Rent for Vacancy & Credit Loss and (iii) percent of Effective Gross Income for all other fields. |
Appraisal. According to the appraisals dated between February 2, 2024 and May 11, 2024, the ExchangeRight 67 Properties had an aggregate “As-is” value of $71,675,000.
Environmental Matters. The Phase I environmental site assessments for the ExchangeRight 67 Properties dated from September 28, 2023 to March 22, 2024 identified a recognized environmental condition at the Family Dollar / Dollar Tree Combo – Rosewell, NM property. No recognized environmental conditions were identified at the remaining seven ExchangeRight 67 Properties.
The Family Dollar / Dollar Tree Combo – Rosewell, NM property has had two generations of fueling operations occur at the property, from 1954 to 1975 and from 1980 to 2013. The second generation of USTs were removed in 2013 and subsurface soil testing did not identify any impacts. A phase II subsurface investigation was performed in January 2024 and in summary, no fuel constituents or solvents were detected in the soil sample. No further investigation was recommended. See “Description of the Mortgage Pool – Environmental Considerations” in the Preliminary Prospectus.
Escrows.
Taxes – Subject to certain waiver conditions (described below) the ExchangeRight 67 Mortgage Loan documents require an upfront reserve of $165,998 for real estate taxes plus ongoing monthly reserves in an amount equal to 1/12 of the real estate taxes that the lender estimates will be payable during the next twelve months, initially $51,171.
Ongoing monthly reserves for real estate taxes related to any tenant that is required to pay taxes directly pursuant to its leases (“Tax Paying Tenants”) are not required as long as (i) no event of default has occurred and is continuing; (ii) the borrower provides proof of payment directly to the taxing authority by 15 days prior to the delinquency date; (iii) the lease with the applicable Tax Paying Tenant is in full force and effect and not subject to any default beyond any applicable grace or notice and cure period; and (iv) no material change has occurred with respect to the applicable Tax Paying Tenant that would, in the lender’s reasonable determination, jeopardize such tenant’s ability to timely pay the taxes. Tax Paying Tenants currently include the Bank of America – Mount Prospect, IL, BJC Healthcare - Godfrey, IL, Tractor Supply – Canal Fulton, OH and Tractor Supply – New Richmond, WI properties.
| THE INFORMATION IN THIS STRUCTURAL AND COLLATERAL TERM SHEET IS NOT COMPLETE AND MAY BE AMENDED PRIOR TO THE TIME OF SALE. THIS TERM SHEET IS NOT AN OFFER TO SELL THESE SECURITIES AND IT IS NOT A SOLICITATION OF AN OFFER TO BUY THESE SECURITIES IN ANY JURISDICTION WHERE THE OFFER OR SALE IS NOT PERMITTED. | ||
| 89 | ||
| Property Types – Various | Loan #7 | Cut-off Date Balance: | $33,522,953 | |
| Property Addresses – Various | ExchangeRight 67 | Cut-off Date LTV: | 46.8% | |
| U/W NCF DSCR: | 1.90x | |||
| U/W NOI Debt Yield: | 12.9% |
Insurance – Ongoing monthly reserves for insurance are not required as long as (i) no event of default has occurred and is continuing; (ii) the ExchangeRight 67 Properties are part of a blanked or umbrella policy approved by the lender; (iii) the borrower provides the lender with evidence of renewal of insurance policies; and (iv) the borrower provides the lender with paid receipts for insurance premiums by no later than 10 business days prior to the policy expiration dates.
In addition, the borrower is not required to deposit ongoing monthly insurance reserves related to any tenant who pays all insurance premiums directly to the applicable insurance company pursuant to such tenant’s lease (“Insurance Paying Tenants”) as long as (i) no event of default has occurred and is continuing; (ii) the borrower provides proof of payment by the applicable Insurance Paying Tenant (or borrower) directly to the insurance company by no later than 15 days prior to the due date for such premiums; (iii) the lease with the applicable Insurance Paying Tenant is in full force and effect and not subject to any default beyond any applicable grace or notice and cure period; and (iv) no material change has occurred with respect to the applicable Insurance Paying Tenant that would, in the lender’s reasonable determination, jeopardize such tenant’s ability to timely pay the insurance premiums. Insurance Paying Tenants currently include the Bank of America – Mount Prospect, IL, BJC Healthcare - Godfrey, IL, Metro Market, Mukwonago, WI, Tractor Supply – Canal Fulton, OH and Tractor Supply – New Richmond, WI properties.
Replacement Reserve – Subject to certain waiver conditions for ongoing reserves (described below), The ExchangeRight 67 Mortgage Loan documents require an upfront reserve of $53,005 for replacements plus ongoing monthly reserves in an amount equal to $4,612, capped at $166,032.
The borrower is not required to deposit ongoing monthly replacement reserves related to any tenant that is obligated under its lease to pay replacements and/or alterations for its premises (“Replacement Reserve Paying Tenants”) as long as (a) no event of default has occurred and is continuing; (b) the borrower provides proof of payment of replacements by all Replacement Reserve Paying Tenants; (c) the lease with the applicable Replacement Reserve Paying Tenant is in full force and effect and not subject to any default beyond any applicable grace or notice and cure period; and (d) no material change has occurred with respect to the applicable Replacement Reserve Paying Tenant that would, in the lender’s reasonable determination, jeopardize such tenant’s ability to timely pay the replacements for its premises. Replacement Reserve Paying Tenants currently include the Bank of America – Mount Prospect, IL, Metro Market (Grocery), Mukwonago, WI and Family Dollar / Dollar Tree Combo, Rosewell, NM properties.
TI/LC Reserve – The ExchangeRight 67 Mortgage Loan documents require an upfront reserve of $500,000 for general tenant improvements and leasing commissions (“TI/LC”). The ExchangeRight 67 Mortgage Loan documents also require ongoing monthly general TI/LC reserves in an amount equal to $15,411; upon the occurrence and continuance of an event of default.
Deferred Maintenance Reserve – The ExchangeRight 67 Mortgage Loan documents require an upfront reserve of $39,705 for immediate repairs.
Lockbox and Cash Management. The ExchangeRight 67 Mortgage Loan is structured with a hard lockbox and springing cash management, into which the borrower is required to deposit, or cause all rents to be deposited directly. Prior to a Cash Trap Event Period (as defined below), all funds in the lockbox account are required to be distributed to the borrower’s operating account. During a Cash Trap Event Period, all excess funds are required to be swept to an excess cash flow subaccount controlled by the lender.
A Cash Trap Event Period will commence upon the earlier of the following:
| (i) | the occurrence of an event of default; |
| (ii) | the net cash flow debt service coverage ratio (NCF DSCR) being less than 1.35x (tested quarterly); and |
| (iii) | the monthly payment date occurring in March 2029 (unless a Permitted Transfer has occurred prior to such date; see “Permitted Transfer” section below). |
A Cash Trap Event Period will end upon the occurrence of the following:
| ● | with regard to clause (i), the cure of such event of default; |
| ● | with regard to clause (ii), the NCF DSCR being equal to or greater than 1.40x for two consecutive calendar quarters; or |
| ● | with regard to clause (iii), the date a Permitted Transfer occurs. |
Permitted Transfer. A “Permitted Transfer” means either (i) a Qualified Transfer (as defined below), (ii) a Qualified REIT Transfer (as defined below), (iii) a Conversion (defined above), (iv) the transfer of up to 99.5% of beneficial ownership interests in the ExchangeRight 67 Borrower to up to 400 accredited investors pursuant to Regulation D offering, or (v) an Operating Partnership Acquisition (as defined below).
A Cash Trap Event Period (see definition above) will be triggered unless a Permitted Transfer occurs prior to March 11, 2029 (3 months prior to maturity). Each such Permitted Transfer has the effect of transferring beneficial ownership interests in the ExchangeRight 67 Borrower out of a Delaware Statutory Trust form.
A “Qualified Transfer” means the borrower sponsors’ transfer on or after June 11, 2025 of the entirety of their ownership interest in the ExchangeRight 67 Borrower to an Approved Transferee (as defined below) and the replacement of the non-recourse carve-out guarantors with the Approved Transferee or other lender-approved replacement guarantor, subject to certain conditions, including (i) no loan default has occurred and is continuing, (ii) the properties’ being managed by the current or other sponsor-affiliated manager, (iii) immediately following a Qualified Transfer, the Approved Transferee’s being in control of the ExchangeRight 67 Borrower and owning (directly or indirectly) 100% of the legal and beneficial ownership interests in the ExchangeRight 67 Borrower, and (iv) if required by lender, a rating agency confirmation.
| THE INFORMATION IN THIS STRUCTURAL AND COLLATERAL TERM SHEET IS NOT COMPLETE AND MAY BE AMENDED PRIOR TO THE TIME OF SALE. THIS TERM SHEET IS NOT AN OFFER TO SELL THESE SECURITIES AND IT IS NOT A SOLICITATION OF AN OFFER TO BUY THESE SECURITIES IN ANY JURISDICTION WHERE THE OFFER OR SALE IS NOT PERMITTED. | ||
| 90 | ||
| Property Types – Various | Loan #7 | Cut-off Date Balance: | $33,522,953 | |
| Property Addresses – Various | ExchangeRight 67 | Cut-off Date LTV: | 46.8% | |
| U/W NCF DSCR: | 1.90x | |||
| U/W NOI Debt Yield: | 12.9% |
An "Approved Transferee" means either an (i) eligible financial institution (broadly, an FDIC-insured depository institution having S&P “A-1”/Moody’s “P-1”/ Fitch “F-1+”-rated short-term unsecured debt obligations or S&P “AA”/ Moody’s “Aa2”/ Fitch “AA” and/or “F1+” and/or “AAAmmf”-rated long-term, unsecured debt or (ii) a person satisfying Qualified Transferee criteria (broadly, persons that are not on governmental watchlists and have no felony convictions, prior bankruptcies or material litigation threatened or pending, or are crowd-funded entities), that is (1) regularly engaged in the business of owning or operating commercial properties, or interests therein, which are similar to the ExchangeRight 67 Properties, (2) owns interests in, or operates, at least five retail properties with a minimum of 750,000 square feet in the aggregate, (3) maintains either (A) a net worth of at least $200,000,000 and total assets of at least $400,000,000, or (B) an investment grade rating by S&P and Moody’s, (4) at all times owns no less than 100% of the legal and beneficial ownership of the borrower, and (5) is not a Delaware statutory trust.
A “Qualified REIT Transfer” means the borrower sponsors’ transfer on or after June 11, 2025 of the entirety of their ownership interest in the ExchangeRight 67 Borrower to an Approved REIT (as defined below) and the replacement of the non-recourse carve-out guarantors with the Approved REIT or other lender-approved replacement guarantor, subject to certain conditions, including (i) no loan default has occurred and is continuing, (ii) immediately following a Qualified REIT Transfer, the existing borrower sponsors’ (a) owning at least a 0.5% direct or indirect equity ownership interest in each of the ExchangeRight 67 Borrower and any SPE component entity, (b) controlling the ExchangeRight 67 Borrower and SPE component entity, and (c) controlling the day-to-day operation of the ExchangeRight 67 Properties; (iii) immediately following a Qualified REIT Transfer, the Approved REIT’s owning, directly or indirectly, no less than 51% of the legal and beneficial ownership interests in the ExchangeRight 67 Borrower and SPE component entity, and (iv) if required by lender, a rating agency confirmation.
An “Approved REIT” means a real estate investment trust that (i) meets the requirements of a Qualified Transferee and for whom the lender receives a reasonably acceptable credit check; (ii) is at all times (a) owned, directly or indirectly, by the borrower sponsor in an amount that is not less than 0.5% of all equity interests, and (b) under the control of one or more persons that (1) meet the requirements of a Qualified Transferee and for whom the lender receives a reasonably acceptable credit check, and (2) is at all times controlled by the borrower sponsor; and (iii) is otherwise reasonably acceptable to the lender in all respects; provided certain sponsor controlled entities are deemed to be acceptable to lender, so long as they meet the requirements in (i) and (ii) above.
An “Operating Partnership Acquisition” means the borrower sponsors’ transfer of any or all of its membership interests to ExchangeRight Operating Partnership and the immediate subsequent transfer of such membership interests to a wholly-owned subsidiary that satisfies Qualified Transferee criteria, subject to certain conditions, including (i) no loan default has occurred and is continuing, (ii) the properties are managed by the current or other sponsor-affiliated manager, and (iii) immediately following the Operating partnership Acquisition, there shall be no change to the direct ownership of the ExchangeRight 67 Borrower, master lessee and any SPE component entity unless such change is expressly permitted pursuant to the terms of the loan agreement (including, without limitation, a Qualified REIT Transfer).
Property Management. The ExchangeRight 67 Properties are managed by NLP Management, LLC, an affiliate of the borrower.
Partial Release. On or after the Defeasance Lockout Release Date, the lender shall release an individual property, in connection with a sale or transfer of any property to an unaffiliated third party, subject to certain conditions, including: (i) defeasance of the mortgage loan in an amount equal to the greatest of (a) 90% of the net proceeds of the sale of such released property, (b) an amount equal to the Allocated Loan Amount for such released property multiplied by 115%, and (c) if the ExchangeRight 67 Mortgage Loan is included in a REMIC Trust, the ratio of the unpaid principal balance of the ExchangeRight 67 Mortgage Loan to the value of the remaining property would be greater than 125% or (ii) after giving effect to such individual property release and Partial Defeasance Event, the debt service cover ratio is greater than or equal to 1.60x and the debt yield is greater than or equal to 12.25% (iii) a rating agency confirmation.
Real Estate Substitution. Not permitted.
Subordinate and Mezzanine Indebtedness. Not permitted.
Ground Lease. None.
Rights of First Refusal. The single-tenant at each of the following two properties has a right of first refusal (“ROFR”) to purchase the related property: Tractor Supply – Canal Fulton, OH and Tractor Supply – New Richmond, WI. Each ROFR is not extinguished by a foreclosure of the related property; however, each ROFR does not apply to foreclosure or deed-in-lieu thereof. See “Description of the Mortgage Pool—Tenant Leases—Purchase Options and Rights of First Refusal” in the Preliminary Prospectus.
Terrorism Insurance. The ExchangeRight 67 Mortgage Loan documents require that the property insurance policy required to be maintained by the borrower provide coverage for perils and acts of terrorism in an amount equal to 100% of the full replacement cost of the ExchangeRight 67 Properties, as well as business interruption insurance covering no less than the 18-month period following the occurrence of a casualty event, together with a 12-month extended period of indemnity. See “Risk Factors—Risks Relating to the Mortgage Loans—Terrorism Insurance May Not Be Available for All Mortgaged Properties” in the Preliminary Prospectus.
| THE INFORMATION IN THIS STRUCTURAL AND COLLATERAL TERM SHEET IS NOT COMPLETE AND MAY BE AMENDED PRIOR TO THE TIME OF SALE. THIS TERM SHEET IS NOT AN OFFER TO SELL THESE SECURITIES AND IT IS NOT A SOLICITATION OF AN OFFER TO BUY THESE SECURITIES IN ANY JURISDICTION WHERE THE OFFER OR SALE IS NOT PERMITTED. | ||
| 91 | ||
| Office – CBD | Loan #8 | Cut-off Date Balance: | $32,250,000 | |
| 132 West 36th Street | 132 West 36th Street | Cut-off Date LTV: | 53.8% | |
| New York, NY 10018 | U/W NCF DSCR: | 1.26x | ||
| U/W NOI Debt Yield: | 11.6% |
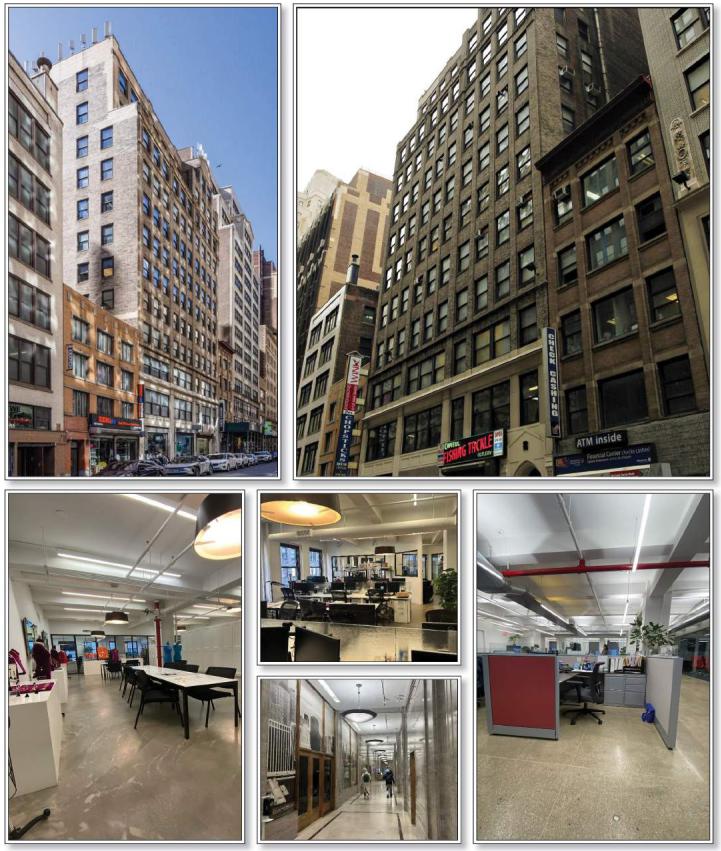
| THE INFORMATION IN THIS STRUCTURAL AND COLLATERAL TERM SHEET IS NOT COMPLETE AND MAY BE AMENDED PRIOR TO THE TIME OF SALE. THIS TERM SHEET IS NOT AN OFFER TO SELL THESE SECURITIES AND IT IS NOT A SOLICITATION OF AN OFFER TO BUY THESE SECURITIES IN ANY JURISDICTION WHERE THE OFFER OR SALE IS NOT PERMITTED. | ||
| 92 | ||
| Office – CBD | Loan #8 | Cut-off Date Balance: | $32,250,000 | |
| 132 West 36th Street | 132 West 36th Street | Cut-off Date LTV: | 53.8% | |
| New York, NY 10018 | U/W NCF DSCR: | 1.26x | ||
| U/W NOI Debt Yield: | 11.6% |
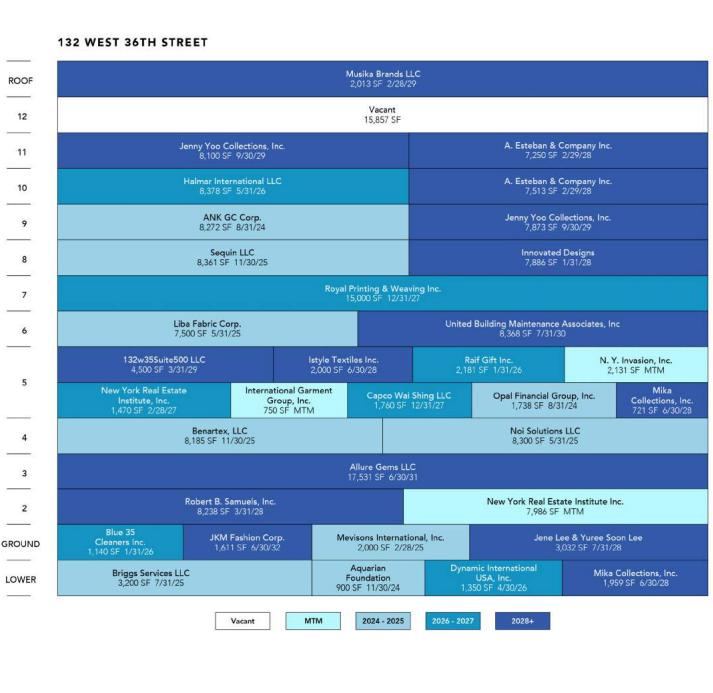
| THE INFORMATION IN THIS STRUCTURAL AND COLLATERAL TERM SHEET IS NOT COMPLETE AND MAY BE AMENDED PRIOR TO THE TIME OF SALE. THIS TERM SHEET IS NOT AN OFFER TO SELL THESE SECURITIES AND IT IS NOT A SOLICITATION OF AN OFFER TO BUY THESE SECURITIES IN ANY JURISDICTION WHERE THE OFFER OR SALE IS NOT PERMITTED. | ||
| 93 | ||
| Office – CBD | Loan #8 | Cut-off Date Balance: | $32,250,000 | |
| 132 West 36th Street | 132 West 36th Street | Cut-off Date LTV: | 53.8% | |
| New York, NY 10018 | U/W NCF DSCR: | 1.26x | ||
| U/W NOI Debt Yield: | 11.6% |
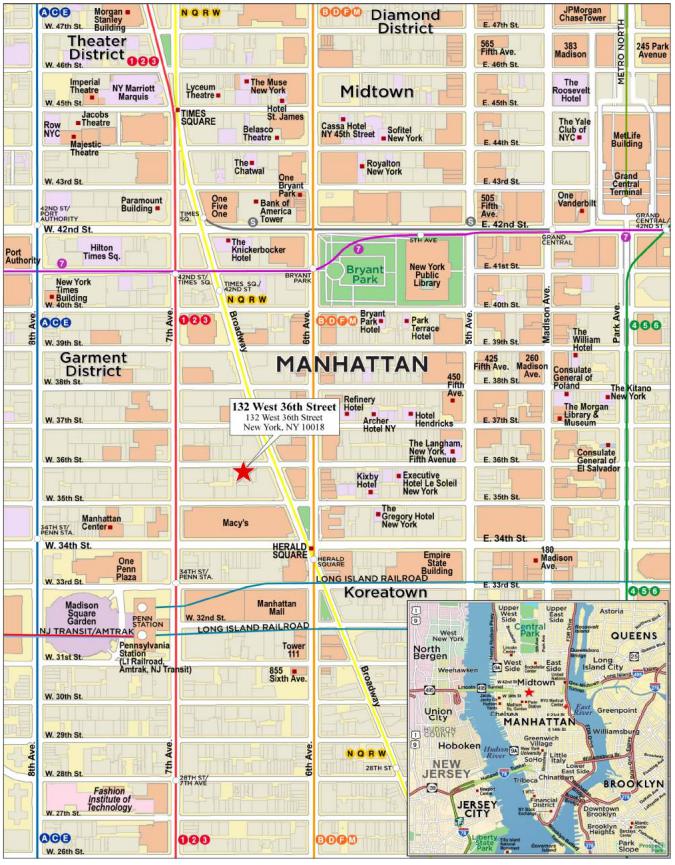
| THE INFORMATION IN THIS STRUCTURAL AND COLLATERAL TERM SHEET IS NOT COMPLETE AND MAY BE AMENDED PRIOR TO THE TIME OF SALE. THIS TERM SHEET IS NOT AN OFFER TO SELL THESE SECURITIES AND IT IS NOT A SOLICITATION OF AN OFFER TO BUY THESE SECURITIES IN ANY JURISDICTION WHERE THE OFFER OR SALE IS NOT PERMITTED. | ||
| 94 | ||
| No. 8 – 132 West 36th Street | |||||||
| Mortgage Loan Information | Mortgaged Property Information | ||||||
| Mortgage Loan Sellers: | Citi Real Estate Funding Inc., Argentic Real Estate Finance 2 LLC | Single Asset/Portfolio: | Single Asset | ||||
| Credit Assessment (Fitch/KBRA/Moody’s): | NR/NR/NR | Property Type – Subtype: | Office – CBD | ||||
| Original Principal Balance: | $32,250,000 | Location: | New York, NY | ||||
| Cut-off Date Balance: | $32,250,000 | Size: | 195,054 SF | ||||
| % of Initial Pool Balance: | 4.4% | Cut-off Date Balance Per SF: | $165.34 | ||||
| Loan Purpose: | Refinance | Maturity Date Balance Per SF: | $161.15 | ||||
| Borrower Sponsor: | Steven Kaufman | Year Built/Renovated: | 1922/2015 | ||||
| Guarantor: | Steven Kaufman | Title Vesting: | Fee | ||||
| Mortgage Rate: | 7.4800% | Property Manager: | Kaufman Management Company, L.L.C. (borrower-related) | ||||
| Note Date: | June 11, 2024 | Current Occupancy (As of): | 91.9% (6/3/2024) | ||||
| Seasoning: | 0 months | YE 2023 Occupancy: | 92.0% | ||||
| Maturity Date: | July 6, 2029 | YE 2022 Occupancy: | 83.6% | ||||
| IO Period: | 24 months | YE 2021 Occupancy: | 88.0% | ||||
| Loan Term (Original): | 60 months | YE 2020 Occupancy: | 96.4% | ||||
| Amortization Term (Original): | 360 months | As-Is Appraised Value: | $60,000,000 | ||||
| Loan Amortization Type: | Interest Only, Amortizing Balloon | As-Is Appraised Value Per SF: | $307.61 | ||||
| Call Protection: | L(24),D(33),O(3) | As-Is Appraisal Valuation Date: | 1/17/2024 | ||||
| Lockbox Type: | Hard/Springing Cash Management | ||||||
| Additional Debt: | No | Underwriting and Financial Information | |||||
| Additional Debt Type (Balance): | NAP | TTM 4/30/2024 NOI: | $3,639,224 | ||||
| YE 2023 NOI: | $3,416,460 | ||||||
| YE 2022 NOI: | $3,090,434 | ||||||
| YE 2021 NOI: | $3,143,606 | ||||||
| U/W Revenues: | $6,610,141 | ||||||
| U/W Expenses: | $2,856,136 | ||||||
| U/W NOI: | $3,754,005 | ||||||
| Escrows and Reserves(1) | U/W NCF: | $3,402,559 | |||||
| Initial | Monthly | Cap | U/W DSCR based on NOI/NCF: | 1.39x/1.26x | |||
| Taxes: | $283,596 | $141,798 | NAP | U/W Debt Yield based on NOI/NCF: | 11.6%/10.6% | ||
| Insurance: | $0 | Springing | NAP | Cut-off Date LTV Ratio: | 53.8% | ||
| Replacement Reserve: | $0 | $3,251 | NAP | LTV Ratio at Maturity: | 52.4% | ||
| TI / LC: | $1,000,000 | $24,382 | $1,500,000 | ||||
| Other(2): | $135,000 | $0 | NAP | ||||
| Sources and Uses | ||||||||||
| Sources | Uses | |||||||||
| Original Loan Amount | $32,250,000 | 92.2 | % | Loan Payoff | $31,506,855 | 90.0 | % | |||
| Borrower Equity Contribution | 2,740,046 | 7.8 | Closing Costs | 2,064,594 | 5.9 | |||||
| Upfront Reserves | 1,418,596 | 4.1 | ||||||||
| Total Sources | $34,990,046 | 100.0 | % | Total Uses: | $34,990,046 | 100.0 | % | |||
| (1) | See “Escrows” below. |
| (2) | Other Reserves include initial upfront deposits of: (i) $27,000 into an unfunded obligations reserve for outstanding tenant improvements under the Benartex, Inc. lease, and (ii) $108,000 into a NY REI reserve fund representing the aggregate amount of 18 months of base rent for the New York Real Estate Institute, Inc. tenant, which leases a 7,986 square foot space on a month-to-month basis. |
The Mortgage Loan. The eighth largest mortgage loan (the “132 West 36th Street Mortgage Loan”) is evidenced by two pari passu promissory notes in the aggregate original principal amount of $32,250,000. The 132 West 36th Street Mortgage Loan was co-originated on June 11, 2024 by Citi Real Estate Funding Inc. (“CREFI”) and Argentic Real Estate Finance 2 LLC (“AREF2”). CREFI is contributing the controlling Note A-1, which has an outstanding principal balance as of the Cut-off Date of $17,250,000. AREF2 is contributing the non-controlling Note A-2, which has an outstanding principal balance as of the Cut-off Date of $15,000,000. The 132 West 36th Street Mortgage Loan is secured by the borrower’s fee interest in a 12-story office property totaling 195,054 SF located in New York, New York (the "132 West 36th Street Property"). The 132 West 36th Street Mortgage Loan has a 5-year term, has an initial interest-only period of 24 months followed by amortization on a 30-year basis and accrues interest at a rate of 7.4800% per annum on an Actual/360 basis.
The Borrower and the Borrower Sponsor. The borrower is Kaufman Arcade Owner LLC, a Delaware limited liability company and single purpose entity with one independent director. The borrower sponsor and non-recourse carveout guarantor is Steven Kaufman. Steven Kaufman is the president of the Kaufman Organization, a three-generation, family-owned and operated New York-based real
| THE INFORMATION IN THIS STRUCTURAL AND COLLATERAL TERM SHEET IS NOT COMPLETE AND MAY BE AMENDED PRIOR TO THE TIME OF SALE. THIS TERM SHEET IS NOT AN OFFER TO SELL THESE SECURITIES AND IT IS NOT A SOLICITATION OF AN OFFER TO BUY THESE SECURITIES IN ANY JURISDICTION WHERE THE OFFER OR SALE IS NOT PERMITTED. | ||
| 95 | ||
| Office – CBD | Loan #8 | Cut-off Date Balance: | $32,250,000 | |
| 132 West 36th Street | 132 West 36th Street | Cut-off Date LTV: | 53.8% | |
| New York, NY 10018 | U/W NCF DSCR: | 1.26x | ||
| U/W NOI Debt Yield: | 11.6% |
estate company active in ownership of commercial and residential property, office leasing, management and acquisitions, with a portfolio of approximately 6 million square feet.
The Property. The 132 West 36th Street Property is a 12-story, office property totaling 195,054 SF located in the Garment District neighborhood of New York, New York. The 132 West 36th Street Property was originally constructed in 1922 and most recently renovated in 2015 and is situated on the south side of West 36th Street between Sixth and Seventh Avenues. The 132 West 36th Street Property is comprised of 180,491 SF of office space, 10,642 SF of retail space and 3,921 SF of storage space. As of June 3, 2024, the 132 West 36th Street Property was 91.9% leased to 32 unique tenants with no tenant accounting for more than 9.0% of net rentable area or 11.0% of underwritten base rent. The 132 West 36th Street Property benefits from long term tenancy with 32.5% of net rentable area and 33.7% of underwritten base rent having been at the 132 West 36th Street Property for 15 years or more. The 132 West 36th Street Property has experienced strong leasing since the onset of the COVID-19 pandemic with 13 leases for 74,998 square feet (38.4% of net rentable area) and $2,635,746 of underwritten base rent (40.5% of underwritten base rent) leased since June 2020.
Major Tenants.
Allure Gems LLC (“Allure Gems”) (17,531 square feet; 9.0% of net rentable area; 8.7% of underwritten base rent). Founded in 2007, Allure Gems is a producer, developer, and marketer of jewelry, including bridal, diamond classics, and diamond fashion, managing direct partnerships with jewelry retailers, headquartered in New York City. Allure Gems has been a tenant at the 132 West 36th Street Property since October 2020 and has a lease term through June 2031 with no termination or renewal options.
Jenny Yoo Collections, Inc. (“Jenny Yoo Collections”) (15,973 square feet; 8.2% of net rentable area; 11.0% of underwritten base rent). Jenny Yoo Collections is a bridal dress and gown boutique collection. Dress designer Jenny Yoo has been an innovator in the wedding and bridesmaid industry for two decades, launching her first collection in November 2002. The Jenny Yoo bridal gowns can be found in over 200 select bridal salons in the United States, as well as other online retailers. Jenny Yoo uses the space at the 132 West 36th Street Property as a showroom and office space. Jenny Yoo Collections has been a tenant at the 132 West 36th Street Property since November 2005 and originally occupied 7,873 square feet of space, but expanded to an additional 8,100 square feet in 2018. Jenny Yoo Collections has a lease term through September 2029 with no termination options and one, three-year renewal option.
Royal Printing & Weaving Inc. (15,000 square feet; 7.7% of net rentable area; 8.3% of underwritten base rent). Founded in 1991, Royal Printing & Weaving Inc. is a New York City based newspaper printing and fabric weaving company. Royal Printing & Weaving Inc. has been a tenant at the 132 West 36th Street Property since April 1998 and has a lease term through December 2027 with no termination or renewal options.
| THE INFORMATION IN THIS STRUCTURAL AND COLLATERAL TERM SHEET IS NOT COMPLETE AND MAY BE AMENDED PRIOR TO THE TIME OF SALE. THIS TERM SHEET IS NOT AN OFFER TO SELL THESE SECURITIES AND IT IS NOT A SOLICITATION OF AN OFFER TO BUY THESE SECURITIES IN ANY JURISDICTION WHERE THE OFFER OR SALE IS NOT PERMITTED. | ||
| 96 | ||
| Office – CBD | Loan #8 | Cut-off Date Balance: | $32,250,000 | |
| 132 West 36th Street | 132 West 36th Street | Cut-off Date LTV: | 53.8% | |
| New York, NY 10018 | U/W NCF DSCR: | 1.26x | ||
| U/W NOI Debt Yield: | 11.6% |
The following table presents certain information relating to the tenancy at the 132 West 36th Street Property:
Tenant Summary(1)
| Tenant Name | Credit Rating (Fitch/ Moody’s/ S&P)(2) | Tenant NRSF | % of NRSF | Annual U/W Base Rent PSF(3) | Annual U/W Base Rent(3) | % of Total Annual U/W Base Rent | Lease Expiration Date | Ext. Options | Term. Option (Y/N) |
| Major Tenants | |||||||||
| Allure Gems | NR/NR/NR | 17,531 | 9.0% | $32.47 | $569,284 | 8.7% | 6/30/2031 | N | N |
| Jenny Yoo Collections, Inc. | NR/NR/NR | 15,973 | 8.2% | $44.81 | $715,782 | 11.0% | 9/30/2029 | 1, 3-year | N |
| Royal Printing & Weaving Inc. | NR/NR/NR | 15,000 | 7.7% | $36.02 | $540,345 | 8.3% | 12/31/2027 | N | N |
| A. Esteban & Company, Inc. | NR/NR/NR | 14,763 | 7.6% | $38.95 | $575,026 | 8.8% | 2/29/2028 | N | N |
| New York Real Estate Institute, Inc. | NR/NR/NR | 9,456 | 4.8% | $12.64 | $119,491 | 1.8% | Various(4) | N | N |
| Halmar International LLC | NR/NR/NR | 8,378 | 4.3% | $33.62 | $281,668 | 4.3% | 5/31/2026 | 3, 4-month | N |
| United Building Maintenance Associates, Inc | NR/NR/NR | 8,368 | 4.3% | $39.92 | $334,082 | 5.1% | 7/31/2030 | 1, 5-year | N |
| Sequin LLC | NR/NR/NR | 8,361 | 4.3% | $35.32 | $295,327 | 4.5% | 11/30/2025 | N | Y(5) |
| Noi Solutions LLC | NR/NR/NR | 8,300 | 4.3% | $46.08 | $382,430 | 5.9% | 5/31/2025 | N | N |
| Total Major Tenants | 106,130 | 54.4% | $35.93 | $3,813,435 | 58.6% | ||||
| Non-Major Tenants | 73,067 | 37.5% | $36.91 | $2,697,239 | 41.4% | ||||
| Occupied Collateral Total | 179,197 | 91.9% | $36.33 | $6,510,674 | 100.0% | ||||
| Vacant Space | 15,857 | 8.1% | |||||||
| Collateral Total | 195,054 | 100.0% | |||||||
| (1) | Based on the underwritten rent roll dated June 3, 2024, with contractual rent steps through June 1, 2025 |
| (2) | Certain ratings are those of the parent company whether or not the parent company guarantees the lease. |
| (3) | The Annual U/W Base Rent and Annual U/W Base Rent PSF does not include vacant space and represents rent steps through June 1, 2025. |
| (4) | Tenant has two suites, a 7,986 square foot space on a month-to-month term and a 1,470 square foot space with a lease expiration of February 28, 2027. |
| (5) | Tenant has the right to terminate its lease at any time upon six months prior written notice. |
| THE INFORMATION IN THIS STRUCTURAL AND COLLATERAL TERM SHEET IS NOT COMPLETE AND MAY BE AMENDED PRIOR TO THE TIME OF SALE. THIS TERM SHEET IS NOT AN OFFER TO SELL THESE SECURITIES AND IT IS NOT A SOLICITATION OF AN OFFER TO BUY THESE SECURITIES IN ANY JURISDICTION WHERE THE OFFER OR SALE IS NOT PERMITTED. | ||
| 97 | ||
| Office – CBD | Loan #8 | Cut-off Date Balance: | $32,250,000 | |
| 132 West 36th Street | 132 West 36th Street | Cut-off Date LTV: | 53.8% | |
| New York, NY 10018 | U/W NCF DSCR: | 1.26x | ||
| U/W NOI Debt Yield: | 11.6% |
The following table presents certain information relating to the lease rollover schedule at the 132 West 36th Street Property:
Lease Expiration Schedule(1)
| Year Ending December 31, | No. of Leases Expiring | Expiring NRSF | % of Total NRSF | Cumulative Expiring NRSF | Cumulative % of Total NRSF | Annual U/W Base Rent(2) | % of Total Annual U/W Base Rent | Annual U/W Base Rent PSF(2) |
| 2024 & MTM | 6 | 21,777 | 11.2% | 21,777 | 11.2% | $452,873 | 7.0% | $20.80 |
| 2025 | 6 | 37,546 | 19.2% | 59,323 | 30.4% | $1,423,025 | 21.9% | $37.90 |
| 2026 | 4 | 13,049 | 6.7% | 72,372 | 37.1% | $494,916 | 7.6% | $37.93 |
| 2027(3) | 5 | 18,230 | 9.3% | 90,602 | 46.4% | $739,885 | 11.4% | $40.59 |
| 2028 | 6 | 38,599 | 19.8% | 129,201 | 66.2% | $1,484,884 | 22.8% | $38.47 |
| 2029 | 3 | 22,486 | 11.5% | 151,687 | 77.8% | $939,725 | 14.4% | $41.79 |
| 2030 | 1 | 8,368 | 4.3% | 160,055 | 82.1% | $334,082 | 5.1% | $39.92 |
| 2031 | 1 | 17,531 | 9.0% | 177,586 | 91.0% | $569,284 | 8.7% | $32.47 |
| 2032 | 1 | 1,611 | 0.8% | 179,197 | 91.9% | $72,000 | 1.1% | $44.69 |
| 2033 | 0 | 0 | 0.0% | 179,197 | 91.9% | $0 | 0.0% | $0.00 |
| 2034 | 0 | 0 | 0.0% | 179,197 | 91.9% | $0 | 0.0% | $0.00 |
| 2035 & Beyond | 0 | 0 | 0.0% | 179,197 | 91.9% | $0 | 0.0% | $0.00 |
| Vacant | 0 | 15,857 | 8.1% | 195,054 | 100.0% | $0 | 0.0% | $0.00 |
| Total/Weighted Average | 33 | 195,054 | 100.0% | $6,510,674 | 100.0% | $36.33 |
| (1) | Information obtained from the underwritten rent roll as of June 3, 2024. Certain tenants may have termination or contraction options (which may become exercisable prior to the originally stated expiration date of the tenant lease) that are not considered in the above Lease Expiration Schedule. |
| (2) | Annual U/W Base Rent and Annual U/W Base Rent PSF do not include vacant space and include rent steps through June 1, 2025. |
| (3) | Includes two antenna leases to which 0 square feet are attributed. |
The following table presents historical occupancy percentages at the 132 West 36th Street Property:
Historical Occupancy(1)
12/31/2020 | 12/31/2021 | 12/31/2022 | 12/31/2023 | 6/3/2024(2) |
| 96.4% | 88.0% | 83.6% | 92.0% | 91.9% |
| (1) | Information obtained from the 132 West 36th Street borrower and represents the average annual occupancy as of December 31 of each respective year unless otherwise indicated. |
| (2) | Information obtained from the underwritten rent roll as of June 3, 2024. |
| THE INFORMATION IN THIS STRUCTURAL AND COLLATERAL TERM SHEET IS NOT COMPLETE AND MAY BE AMENDED PRIOR TO THE TIME OF SALE. THIS TERM SHEET IS NOT AN OFFER TO SELL THESE SECURITIES AND IT IS NOT A SOLICITATION OF AN OFFER TO BUY THESE SECURITIES IN ANY JURISDICTION WHERE THE OFFER OR SALE IS NOT PERMITTED. | ||
| 98 | ||
| Office – CBD | Loan #8 | Cut-off Date Balance: | $32,250,000 | |
| 132 West 36th Street | 132 West 36th Street | Cut-off Date LTV: | 53.8% | |
| New York, NY 10018 | U/W NCF DSCR: | 1.26x | ||
| U/W NOI Debt Yield: | 11.6% |
Operating History and Underwritten Net Cash Flow. The following table presents certain information relating to the operating history and underwritten net cash flow at the 132 West 36th Street Property:
Cash Flow Analysis(1)
| 2020 | 2021 | 2022 | 2023 | TTM 4/30/2024 | U/W | %(2) | U/W $ per SF | |
| Base Rent | $5,237,851 | $5,572,081 | $5,488,882 | $5,835,705 | $6,064,006 | $6,335,545 | 86.3% | $32.48 |
| Grossed Up Vacant Space | 0 | 0 | 0 | 0 | 0 | 554,995 | 7.6 | 2.85 |
| Commercial Rent Steps | 0 | 0 | 0 | 0 | 0 | 175,128 | 2.4 | 0.90 |
| Gross Potential Rent | $5,237,851 | $5,572,081 | $5,488,882 | $5,835,705 | $6,064,006 | $7,065,669 | 96.3% | $36.22 |
| Reimbursements | 332,213 | 107,028 | 219,344 | 290,189 | 288,375 | 240,873 | 3.3 | 1.23 |
| Other Income(3) | 29042 | 38,943 | 33,927 | 29,574 | 34,254 | 34,254 | 0.5 | 0.18 |
| Net Rental Income | $5,599,106 | $5,718,052 | $5,742,154 | $6,155,468 | $6,386,634 | $7,340,795 | 100.0% | $37.63 |
| (Vacancy & Credit Loss) | 0 | 0 | 0 | 0 | 0 | (730,654) | (10.0) | (3.75) |
| Effective Gross Income | $5,599,106 | $5,718,052 | $5,742,154 | $6,155,468 | $6,386,634 | $6,610,141 | 90.0% | $33.89 |
| Real Estate Taxes | $1,545,031 | $1,455,485 | $1,450,580 | $1,589,234 | $1,602,454 | $1,602,454 | 24.2 | $8.22 |
| Insurance | 130,931 | 147,045 | 158,332 | 147,540 | 152,638 | 173,445 | 2.6 | 0.89 |
| Management Fee | 148,655 | 154,178 | 148,628 | 177,250 | 149,993 | 198,304 | 3.0 | 1.02 |
| Other Operating Expenses(4) | 1,220,205 | 817,737 | 894,180 | 824,985 | 842,325 | 881,932 | 13.3 | 4.52 |
| Total Operating Expenses | $3,044,822 | $2,574,445 | $2,651,719 | $2,739,008 | $2,747,410 | $2,856,136 | 43.2% | $14.64 |
| Net Operating Income | $2,554,284 | $3,143,606 | $3,090,434 | $3,416,460 | $3,639,224 | $3,754,005 | 56.8% | $19.25 |
| Replacement Reserves | 0 | 0 | 0 | 0 | 0 | 39,011 | 0.6 | 0.20 |
| TI/LC | 0 | 0 | 0 | 0 | 0 | 312,435 | 4.7 | 1.60 |
| Net Cash Flow | $2,554,284 | $3,143,606 | $3,090,434 | $3,416,460 | $3,639,224 | $3,402,559 | 51.5% | $17.44 |
| NOI DSCR | 0.95x | 1.16x | 1.14x | 1.27x | 1.35x | 1.39x | ||
| NCF DSCR | 0.95x | 1.16x | 1.14x | 1.27x | 1.35x | 1.26x | ||
| NOI Debt Yield | 7.9% | 9.7% | 9.6% | 10.6% | 11.3% | 11.6% | ||
| NCF Debt Yield | 7.9% | 9.7% | 9.6% | 10.6% | 11.3% | 10.6% |
| (1) | Based on the underwritten rent roll as of June 3, 2024. |
| (2) | Represents (i) percent of Net Rental Income for all revenue fields and Vacancy & Credit Loss and (ii) percent of Effective Gross Income for all other fields. |
| (3) | Other Income includes utility income and miscellaneous income. |
| (4) | Other Operating Expenses include payroll and benefits, repairs and maintenance, utilities, general and administrative expenses and legal and professional expenses. |
| THE INFORMATION IN THIS STRUCTURAL AND COLLATERAL TERM SHEET IS NOT COMPLETE AND MAY BE AMENDED PRIOR TO THE TIME OF SALE. THIS TERM SHEET IS NOT AN OFFER TO SELL THESE SECURITIES AND IT IS NOT A SOLICITATION OF AN OFFER TO BUY THESE SECURITIES IN ANY JURISDICTION WHERE THE OFFER OR SALE IS NOT PERMITTED. | ||
| 99 | ||
| Office – CBD | Loan #8 | Cut-off Date Balance: | $32,250,000 | |
| 132 West 36th Street | 132 West 36th Street | Cut-off Date LTV: | 53.8% | |
| New York, NY 10018 | U/W NCF DSCR: | 1.26x | ||
| U/W NOI Debt Yield: | 11.6% |
Appraisal. According to the appraisal, the 132 West 36th Street Property had an “as-is” appraised value of $60,000,000 as of January 17, 2024.
Environmental Matters. According to the Phase I environmental report dated January 22, 2024, there was no evidence of any recognized environmental conditions at the 132 West 36th Street Property.
Market Overview and Competition. The 132 West 36th Street Property is located on the south side of West 36th Street between Sixth and Seventh Avenues in Midtown Manhattan. Midtown Manhattan is the largest office market in Manhattan and New York City, with a total of 772 buildings containing nearly 263.1 million square feet with nine different submarkets.
According to the appraisal, the 132 West 36th Street Property is located in the Times Square South office submarket of the Midtown Manhattan office market. The Times Square South office submarket is delineated by West 35th Street to the south, West 42nd Street to the north, Fifth Avenue to the east, and the Hudson River to the west. As of December 31, 2023, the Times Square South office submarket had inventory of 31,122,506 square feet, a vacancy rate of 21.2%, and average asking rent of $56.61 per square foot.
The following table presents certain information relating to comparable office leases to the 132 West 36th Street Property:
Market Analysis(1)
| Property Name | Tenant | Suite Size (SF) | Lease Commencement | Lease Term (Yrs) | Rent (PSF) |
| 132 West 36th Street | Various | Various | Various | Various | $35.36(2) |
| 29 West 38th Street | Anat Gerstein | 7,150 | Oct-2023 | 10.75 | $30.00 |
| 321 West 44th Street | Rose Hill Psychiatric | 4,749 | Sept-2023 | 10.83 | $41.00 |
| 212 West 35th Street | Zeng Law Group | 3,303 | July-2023 | 5.75 | $24.70 |
| 320 West 37th Street | ASL Productions | 7,456 | July-2023 | 10.50 | $37.00 |
| 15 West 39th Street | Guy Conti Art | 5,528 | Jan-2023 | 10.00 | $34.21 |
| 1333 Broadway | Rising Ground | 29,566 | Apr-2023 | 11.00 | $56.00 |
| 321 West 44th Street | Great Neck Productions | 5,892 | Feb-2023 | 10.83 | $40.00 |
| (1) | Information obtained from the appraisal unless otherwise indicated. |
| (2) | Rent (PSF) reflects base rent as of the underwritten rent roll dated June 3, 2024 and is not inclusive of rent steps. |
| THE INFORMATION IN THIS STRUCTURAL AND COLLATERAL TERM SHEET IS NOT COMPLETE AND MAY BE AMENDED PRIOR TO THE TIME OF SALE. THIS TERM SHEET IS NOT AN OFFER TO SELL THESE SECURITIES AND IT IS NOT A SOLICITATION OF AN OFFER TO BUY THESE SECURITIES IN ANY JURISDICTION WHERE THE OFFER OR SALE IS NOT PERMITTED. | ||
| 100 | ||
| Office – CBD | Loan #8 | Cut-off Date Balance: | $32,250,000 | |
| 132 West 36th Street | 132 West 36th Street | Cut-off Date LTV: | 53.8% | |
| New York, NY 10018 | U/W NCF DSCR: | 1.26x | ||
| U/W NOI Debt Yield: | 11.6% |
Escrows. At origination of the 132 West 36th Street Mortgage Loan, the borrower deposited (i) approximately $283,596 into a real estate tax reserve account, (ii) $1,000,000 into a leasing reserve, (iii) $27,000 into an unfunded obligations reserve for outstanding tenant improvements under the Benartex, Inc. lease, and (iv) $108,000 into a NY REI reserve fund representing the aggregate amount of 18 months of base rent under the New York Real Estate Institute, Inc. space which is leased on a month-to-month term.
Real Estate Taxes – On each monthly payment date, the borrower is required to deposit an amount equal to 1/12 of the real estate taxes that the lender estimates will be payable during the next 12 months into a real estate tax reserve account (initially estimated to be approximately $141,798).
Insurance – If the liability or casualty policy maintained by the borrower is not an approved blanket or umbrella policy, on each monthly payment date, the borrower is required to deposit into an insurance reserve an amount equal to 1/12 of the insurance premiums that the lender estimates will be payable for the renewal of coverage. At origination of the 132 West 36th Street Mortgage Loan, the borrower maintained a blanket policy and was not obligated to deposit into the insurance reserve.
Replacement Reserve – On each monthly payment date, the borrower is required to deposit approximately $3,251 into a replacement reserve account.
TI/LC Reserve – On each monthly payment date, the borrower is required to deposit approximately $24,382 into a tenant improvements and leasing commissions reserve; provided, however, the borrower will not be obligated to make such deposits if the funds on deposit in such TI/LC reserve account would equal or exceed $1,500,000.
Lockbox and Cash Management. The 132 West 36th Street Mortgage Loan is structured with a hard lockbox and springing cash management. At origination of the 132 West 36th Street Mortgage Loan, the borrower delivered a notice to each tenant directing them to remit all payments under the applicable lease directly to the lender-controlled lockbox account. The borrower and property manager are required to cause all revenue derived from the 132 West 36th Street Property to be deposited directly into a lender-approved lockbox account immediately following receipt. All funds deposited into the lockbox are required to be released to the borrower on each business day unless a Trigger Period (as defined below) exists. Upon the occurrence and during the continuance of a Trigger Period, all funds in the lockbox account are required to be swept each business day to a lender-controlled cash management account, to be applied and disbursed in accordance with the 132 West 36th Street Mortgage Loan documents, and all excess cash flow funds remaining in the cash management account after the application of such funds in accordance with the 132 West 36th Street Mortgage Loan documents are required to be held by the lender in an excess cash flow reserve account as additional collateral for the 132 West 36th Street Mortgage Loan. Upon the cure of the applicable Trigger Period, so long as no other Trigger Period exists, the lender is required to return any amounts remaining on deposit in the excess cash flow reserve account to the borrower. Upon an event of default under the 132 West 36th Street Mortgage Loan documents, the lender may apply funds to the debt in such priority as it may determine.
A “Trigger Period” means a period (A) commencing upon the earliest of (i) the occurrence and continuance of an event of default, (ii) the debt service coverage ratio being less than 1.15x and (iii) the occurrence of a Specified Tenant Trigger Period (as defined below), and (B) expiring upon (x) with regard to any Trigger Period commenced in connection with the foregoing clause (i), the cure (if applicable) of such event of default, (y) with regard to any Trigger Period commenced in connection with the foregoing clause (ii), the date the debt service coverage ratio is equal to or greater than 1.15x for two consecutive calendar quarters and (z) with regard to any Trigger Period commenced in connection with the foregoing clause (iii), a Specified Tenant Trigger Period ceasing to exist.
A “Specified Tenant Trigger Period” means a period (A) commencing upon the first to occur of (i) Specified Tenant (as defined below) being in monetary or material non-material default under the applicable Specified Tenant lease beyond applicable notice and cure periods, (ii) Specified Tenant failing to be in actual, physical possession of the Specified Tenant space (or applicable portion thereof), (iii) Specified Tenant failing to be open for business during customary hours and/or “going dark” in the Specified Tenant space (or applicable portion thereof), (iv) Specified Tenant giving notice that it is terminating its lease for all or any portion of the Specified Tenant space (or applicable portion thereof), (v) any termination or cancellation of any Specified Tenant lease (including, without limitation, rejection in any bankruptcy or similar insolvency proceeding) and/or any Specified Tenant lease failing to otherwise be in full force and effect, (vi) any bankruptcy or similar insolvency of Specified Tenant, and (vii) Specified Tenant failing to extend or renew the applicable Specified Tenant lease as required under the terms of the 132 West 36th Street Mortgage Loan documents and (B) expiring upon the first to occur of the lender’s receipt of evidence reasonably acceptable to the lender of (1) the satisfaction of the applicable Specified Tenant Cure Conditions (as defined below) or (2) the borrower leasing the entire Specified Tenant space (or applicable portion thereof) pursuant to one or more leases in accordance with the applicable terms and conditions of the 132 West 36th Street Mortgage Loan documents, the applicable tenant(s) under such lease(s) being in actual, physical occupancy of the space demised (provided, however, that the applicable tenant being in actual, physical occupancy will not apply with respect to a Specified Tenant Trigger Period due to the occurrence of the event described in clause (A)(vii) of this definition), all contingencies to effectiveness of each such lease have expired or been satisfied, each such lease has commenced and a rent commencement date has been established (without possibility of delay) and, in the lender’s reasonable judgment, the applicable Specified Tenant Excess Cash Flow Condition (as defined below) is satisfied in connection therewith.
A “Specified Tenant” means any tenant whose lease, individually or when aggregated with all other leases at the 132 West 36th Street Property with the same tenant or its affiliate, either (i) accounts for 10% or more of the total rental income for the 132 West 36th Street Property or (ii) 10% of the total square footage of the 132 West 36th Street Property, and in each case, together with any parent of affiliate of the tenant providing credit support or a guaranty under such lease.
| THE INFORMATION IN THIS STRUCTURAL AND COLLATERAL TERM SHEET IS NOT COMPLETE AND MAY BE AMENDED PRIOR TO THE TIME OF SALE. THIS TERM SHEET IS NOT AN OFFER TO SELL THESE SECURITIES AND IT IS NOT A SOLICITATION OF AN OFFER TO BUY THESE SECURITIES IN ANY JURISDICTION WHERE THE OFFER OR SALE IS NOT PERMITTED. | ||
| 101 | ||
| Office – CBD | Loan #8 | Cut-off Date Balance: | $32,250,000 | |
| 132 West 36th Street | 132 West 36th Street | Cut-off Date LTV: | 53.8% | |
| New York, NY 10018 | U/W NCF DSCR: | 1.26x | ||
| U/W NOI Debt Yield: | 11.6% |
“Specified Tenant Cure Conditions” means each of the following, as applicable, (i) the Specified Tenant has cured all events of default under the applicable Specified Tenant lease and no other events of default by the applicable Specified Tenant under such Specified Tenant lease occurs during the remainder of the then-current calendar quarter following such cure, (ii) (1) if the applicable Specified Tenant occupies office space at the 132 West 36th Street Property, then such Specified Tenant is in actual, physical possession of the Specified Tenant space (or applicable portion thereof) and open for business during customary hours and not “dark” in substantially all of the Specified Tenant space (or applicable portion thereof) and (2) if the applicable Specified Tenant occupies retail space at the 132 West 36th Street Property, then such Specified Tenant is in actual, physical possession of the Specified Tenant Space (or applicable portion thereof), (iii) the applicable Specified Tenant has revoked or rescinded all termination or cancellation notices with respect to the applicable Specified Tenant lease and has re-affirmed the applicable Specified Tenant lease as being in full force and effect, (iv) in the event the Specified Tenant Trigger Period is due to the applicable Specified Tenant’s failure to extend or renew the applicable Specified Tenant lease in accordance with clause (vii) of the definition of “Specified Tenant Trigger Period”, the applicable Specified Tenant has renewed or extended the applicable Specified Tenant lease in accordance with the terms of the 132 West 36th Street Mortgage Loan documents and the lease for a term of at least five years and, in the lender’s reasonable judgment, the applicable Specified Tenant Excess Cash Flow Condition is satisfied in connection therewith, (v) the Specified Tenant is no longer insolvent or subject to any bankruptcy or insolvency proceedings and has assumed the applicable Specified Tenant lease pursuant to a final, non-appealable order of a court of competent jurisdiction, and (vi) the applicable Specified Tenant is paying full, unabated rent under the applicable Specified Tenant lease (other than any market free rent period that is discernible in length and for which borrower has deposited into a reserve with the lender (to be disbursed by the lender on the monthly payment dates that correspond to the applicable free rent period) an amount equal to the unabated rent that would otherwise be due and payable with respect to such Specified Tenant lease during each unexpired free rent period if no rent concession were in place).
“Specified Tenant Excess Cash Flow Condition” means, (i) with respect to curing any Specified Tenant Trigger Period by re-tenanting the applicable Specified Tenant space (as contemplated by clause (B)(2) of the definition of “Specified Tenant Trigger Period” above), sufficient funds have been accumulated in the excess cash flow account to cover all anticipated leasing commissions, tenant improvement costs, tenant allowances, free rent periods, and/or rent abatement periods to be incurred in connection with any such re-tenanting and (ii) with respect to curing any Specified Tenant Trigger Period by renewal/extension of any Specified Tenant lease (as contemplated by clause (iv) of the definition of “Specified Tenant Cure Conditions” above), sufficient funds have been accumulated in the excess cash flow account (during the continuance of the subject Specified Tenant Trigger Period) to cover all of the Specified Tenant’s anticipated leasing commissions, tenant improvement costs, tenant allowances, free rent periods, and/or rent abatement periods to be incurred in connection with any such renewal/extension.
Additional Secured Indebtedness (not including trade debts). None.
Mezzanine Loan and Preferred Equity. None.
Release of Property. Not permitted.
Letter of Credit. None.
Right of First Offer/Right of First Refusal. None.
Ground Lease. None.
Terrorism Insurance. The borrower is required to maintain or cause to be maintained an “all-risk” insurance policy that provides coverage for terrorism in an amount equal to the full replacement cost of the 132 West 36th Street Property. The “all-risk” policy containing terrorism insurance is required to contain a deductible no greater than $25,000 except with respect to windstorm/named storms and earthquake. See “Risk Factors—Risks Relating to the Mortgage Loans—Terrorism Insurance May Not Be Available for All Mortgaged Properties” in the Preliminary Prospectus.
| THE INFORMATION IN THIS STRUCTURAL AND COLLATERAL TERM SHEET IS NOT COMPLETE AND MAY BE AMENDED PRIOR TO THE TIME OF SALE. THIS TERM SHEET IS NOT AN OFFER TO SELL THESE SECURITIES AND IT IS NOT A SOLICITATION OF AN OFFER TO BUY THESE SECURITIES IN ANY JURISDICTION WHERE THE OFFER OR SALE IS NOT PERMITTED. | ||
| 102 | ||
| Multifamily – Garden | Loan #9 | Cut-off Date Balance: | $28,000,000 | |
| 34600 Park East Drive | Solon Park Apartments | Cut-off Date LTV: | 74.9% | |
| Solon, OH 44139 | U/W NCF DSCR: | 1.31x | ||
| U/W NOI Debt Yield: | 9.1% |
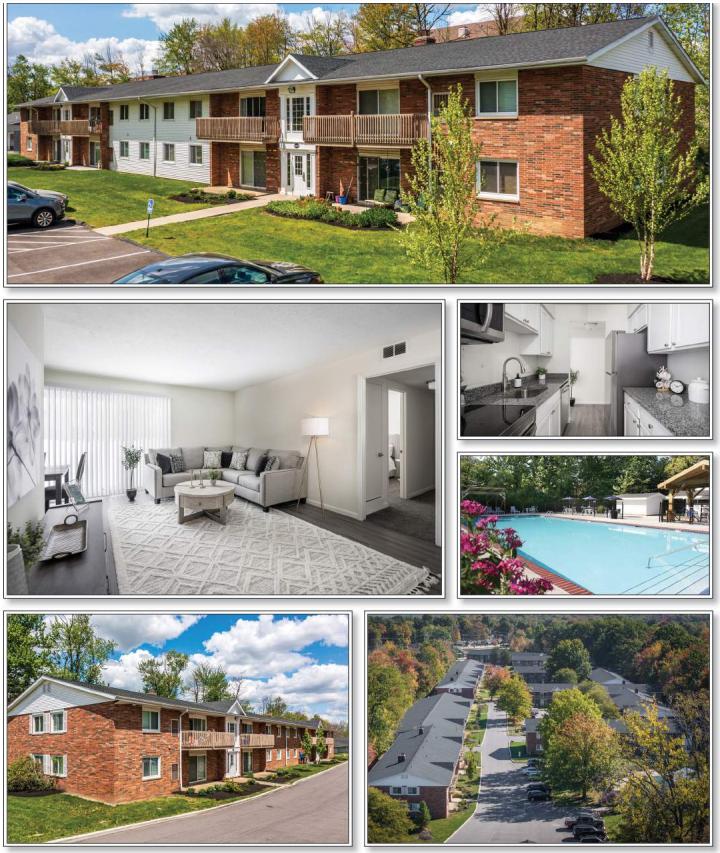
| THE INFORMATION IN THIS STRUCTURAL AND COLLATERAL TERM SHEET IS NOT COMPLETE AND MAY BE AMENDED PRIOR TO THE TIME OF SALE. THIS TERM SHEET IS NOT AN OFFER TO SELL THESE SECURITIES AND IT IS NOT A SOLICITATION OF AN OFFER TO BUY THESE SECURITIES IN ANY JURISDICTION WHERE THE OFFER OR SALE IS NOT PERMITTED. | ||
| 103 | ||
| Multifamily – Garden | Loan #9 | Cut-off Date Balance: | $28,000,000 | |
| 34600 Park East Drive | Solon Park Apartments | Cut-off Date LTV: | 74.9% | |
| Solon, OH 44139 | U/W NCF DSCR: | 1.31x | ||
| U/W NOI Debt Yield: | 9.1% |
| THE INFORMATION IN THIS STRUCTURAL AND COLLATERAL TERM SHEET IS NOT COMPLETE AND MAY BE AMENDED PRIOR TO THE TIME OF SALE. THIS TERM SHEET IS NOT AN OFFER TO SELL THESE SECURITIES AND IT IS NOT A SOLICITATION OF AN OFFER TO BUY THESE SECURITIES IN ANY JURISDICTION WHERE THE OFFER OR SALE IS NOT PERMITTED. | ||
| 104 | ||
| No. 9 – Solon Park Apartments | |||||||
| Mortgage Loan Information | Mortgaged Property Information | ||||||
| Mortgage Loan Seller: | Argentic Real Estate Finance 2 LLC | Single Asset/Portfolio: | Single Asset | ||||
| Credit Assessment (Fitch/KBRA/Moody’s): | NR/NR/NR | Property Type – Subtype: | Multifamily – Garden | ||||
| Original Principal Balance: | $28,000,000 | Location: | Solon, OH | ||||
| Cut-off Date Balance: | $28,000,000 | Size: | 240 Units | ||||
| % of Initial Pool Balance: | 3.8% | Cut-off Date Balance Per Unit: | $116,667 | ||||
| Loan Purpose: | Refinance | Maturity Date Balance Per Unit: | $116,667 | ||||
| Borrower Sponsor: | Lance F. Osborne | Year Built/Renovated: | 1964, 1967, 1972/2023 | ||||
| Guarantor: | Lance F. Osborne | Title Vesting: | Fee | ||||
| Mortgage Rate: | 6.6700% | Property Manager: | Insignia Residential Management, LLC | ||||
| Note Date: | 6/7/2024 | Current Occupancy (As of): | 93.8% (5/31/2024) | ||||
| Seasoning: | 0 month | YE 2023 Occupancy(2): | 93.8% | ||||
| Maturity Date: | July 6, 2029 | YE 2022 Occupancy(2): | 88.3% | ||||
| IO Period: | 60 months | YE 2021 Occupancy: | 95.0% | ||||
| Loan Term (Original): | 60 months | YE 2020 Occupancy(3): | NAV | ||||
| Amortization Term (Original): | NAP | As-Is Appraised Value: | $37,400,000 | ||||
| Loan Amortization Type: | Interest Only | As-Is Appraised Value Per Unit: | $155,833 | ||||
| Call Protection: | L(24),D(32),O(4) | As-Is Appraisal Valuation Date: | May 20, 2024 | ||||
| Lockbox Type: | Springing/Springing Cash Management | Underwriting and Financial Information | |||||
| Additional Debt: | None | TTM NOI (5/31/2024): | $2,402,139 | ||||
| Additional Debt Type (Balance): | NAP | YE 2023 NOI(2): | $2,185,092 | ||||
| YE 2022 NOI(2): | $1,515,666 | ||||||
| YE 2021 NOI(3): | NAV | ||||||
| YE 2020 NOI(3): | NAV | ||||||
| U/W Revenues: | $4,166,728 | ||||||
| U/W Expenses: | $1,632,034 | ||||||
| Escrows and Reserves(1) | U/W NOI: | $2,534,694 | |||||
| Initial | Monthly | Cap | U/W NCF: | $2,474,694 | |||
| Taxes: | $99,530 | $49,765 | NAP | U/W DSCR based on NOI/NCF: | 1.34x / 1.31x | ||
| Insurance: | $96,250 | $8,750 | NAP | U/W Debt Yield based on NOI/NCF: | 9.1% / 8.8% | ||
| Replacement Reserve: | $0 | $5,000 | NAP | U/W Debt Yield at Maturity based on NOI/NCF: | 9.1% / 8.8% | ||
| Cut-off Date LTV Ratio: | 74.9% | ||||||
| LTV Ratio at Maturity: | 74.9% | ||||||
| Sources and Uses | |||||||||
| Sources | Uses | ||||||||
| Mortgage Loan Amount | $28,000,000 | 100.0% | Loan Payoff | $25,150,402 | 89.8 | % | |||
| Closing Costs(4) | 1,549,481 | 5.5 | |||||||
| Return of Equity | 1,104,337 | 3.9 | |||||||
| Upfront Reserves | 195,780 | 0.7 | |||||||
| Total Sources | $28,000,000 | 100.0% | Total Uses | $28,000,000 | 100.0 | % | |||
| (1) | See Escrows below for further discussion of reserve requirements. |
| (2) | The increase in occupancy and NOI from 2022 to 2023 is due to lease up after the Solon Park Apartments Property (as defined below) went through renovations in 2022. |
| (3) | YE 2020 Occupancy, YE 2021 NOI and YE 2020 NOI are not available as the Solon Park Apartments Property was acquired in 2021. |
| (4) | Closing Costs include an origination fee of $750,000. |
The Mortgage Loan. The ninth largest mortgage loan (the “Solon Park Apartments Mortgage Loan”) is evidenced by a promissory note in the original principal amount of $28,000,000 and secured by a first priority fee mortgage encumbering a 240-unit garden style multifamily property in Solon, Ohio (the “Solon Park Apartments Property”).
The Borrower and the Borrower Sponsor. The borrower for the Solon Park Apartments Mortgage Loan is Solon Park Associates LLC, a single-purpose, Ohio limited liability company, with one independent director in its organizational structure. The borrower sponsor and non-recourse carve-out guarantor for the Solon Park Apartments Mortgage Loan is Lance F. Osborne. Lance F. Osborne is the chief executive officer of Osborne Capital Group, a real estate investment firm. Since inception in 2003, Osborne Capital Group has acquired and developed over 850,000 square feet of retail, self-storage, multifamily, and office properties. The borrower sponsor is subject to a pending lawsuit in connection with a partnership dispute related to a property other than the Solon Park Apartments Property. See “Description of the Mortgage Pool—Litigation and Other Considerations” in the Preliminary Prospectus.
| THE INFORMATION IN THIS STRUCTURAL AND COLLATERAL TERM SHEET IS NOT COMPLETE AND MAY BE AMENDED PRIOR TO THE TIME OF SALE. THIS TERM SHEET IS NOT AN OFFER TO SELL THESE SECURITIES AND IT IS NOT A SOLICITATION OF AN OFFER TO BUY THESE SECURITIES IN ANY JURISDICTION WHERE THE OFFER OR SALE IS NOT PERMITTED. | ||
| 105 | ||
| Multifamily – Garden | Loan #9 | Cut-off Date Balance: | $28,000,000 | |
| 34600 Park East Drive | Solon Park Apartments | Cut-off Date LTV: | 74.9% | |
| Solon, OH 44139 | U/W NCF DSCR: | 1.31x | ||
| U/W NOI Debt Yield: | 9.1% |
The Property. The Solon Park Apartments Property is a 240-unit garden-style multifamily complex located in Solon, Ohio, approximately 18 miles southwest of Cleveland. Situated on a 13.87-acre site, the improvements consist of 14 two-story residential buildings and three single-story detached garages constructed in 1964, 1967, and 1972. Previous ownership completed extensive interior renovations to 93 units from 2018 to 2021. The renovated units include new stainless-steel appliances, dishwasher, microwave, vinyl wood plank flooring, toilets, cabinets, and granite countertops. Trim, lighting, hardware, and window covering improvements have also been completed. In addition, other improvements include new doors and hardware, new lighting, new window coverings, HVAC replacements, and utility meters. The borrower sponsor acquired the Solon Park Apartments Property in 2021 and renovated the remaining 147 units. Capital improvements have totaled approximately $4.0 million since acquisition, primarily consisting of interior renovations such as flooring, cabinets, appliances, countertops, and paint. Against in-place rents, the rents of the renovated 147 units have increased by approximately 37% and 45% for one-bedroom and two-bedroom units, respectively, since acquisition.
As of May 31, 2024, the Solon Park Apartments Property was 93.8% occupied. Between October 2021 and April 2024, occupancy at the Solon Park Apartments Property averaged 91.2%. The unit mix at the Solon Park Apartments Property is comprised of 48 one-bedroom units and 192 two-bedroom units. The Solon Park Apartments Property features amenities such as a swimming pool, laundry facilities, garage parking, and storage units. Unit amenities include granite countertops, stainless steel appliances, ceiling fans, patio/balcony, dishwasher, and walk-in closets. The Solon Park Apartments Property features 189 surface parking spaces and 197 garage parking spaces, resulting in a parking ratio of 1.6 spaces per unit.
The Solon Park Apartments Property is located in Solon City School District, which ranks in the top 10 school districts in the state of Ohio. Solon High School, Middle School, and Elementary School are all located within 0.5 miles of the Solon Park Apartments Property.
The table below shows the unit mix at the Solon Park Apartments Property:
Unit Mix(1)
| Unit Mix / Type | Total Units | Leased Units | Average Square Feet per Unit | % Leased |
| One Bedroom | 48 | 48 | 637 | 100.0% |
| Two Bedroom | 192 | 177 | 792 | 92.2% |
| Total/Wtd. Avg. | 240 | 225 | 761 | 93.8% |
| (1) | Information based on the underwritten rent roll dated May 31, 2024. |
The following table presents historical occupancy percentages at the Solon Park Apartments Property:
Historical Occupancy
12/31/2021(1) | 12/31/2022(1)(2) | 12/31/2023(1) | 5/31/2024(3) |
| 95.0% | 88.3% | 93.8% | 93.8% |
| (1) | Information obtained from the borrower sponsor. |
| (2) | Occupancy decreased in 2022 as the Solon Park Apartments Property was undergoing renovations. |
| (3) | Information based on the underwritten rent roll dated May 31, 2024. |
| THE INFORMATION IN THIS STRUCTURAL AND COLLATERAL TERM SHEET IS NOT COMPLETE AND MAY BE AMENDED PRIOR TO THE TIME OF SALE. THIS TERM SHEET IS NOT AN OFFER TO SELL THESE SECURITIES AND IT IS NOT A SOLICITATION OF AN OFFER TO BUY THESE SECURITIES IN ANY JURISDICTION WHERE THE OFFER OR SALE IS NOT PERMITTED. | ||
| 106 | ||
| Multifamily – Garden | Loan #9 | Cut-off Date Balance: | $28,000,000 | |
| 34600 Park East Drive | Solon Park Apartments | Cut-off Date LTV: | 74.9% | |
| Solon, OH 44139 | U/W NCF DSCR: | 1.31x | ||
| U/W NOI Debt Yield: | 9.1% |
Operating History and Underwritten Net Cash Flow. The following table presents certain information relating to the historical operating performance and underwritten net cash flow at the Solon Park Apartments Property:
Cash Flow Analysis
| 2022 | 2023 | 5/31/2024 TTM | U/W | %(1) | U/W $ per unit | |
| Gross Potential Rent | $3,473,119 | $3,923,189 | $4,027,360 | $4,035,017 | 90.8% | $16,813 |
| Other Income(2) | 276,527 | 378,251 | 408,753 | 408,753 | 9.2 | 1,703 |
| Net Rental Income | $3,749,646 | $4,301,440 | $4,436,113 | $4,443,770 | 100.0% | $18,516 |
| Less Vacancy, Concessions & Credit Loss | (517,665) | (498,724) | (444,049) | (277,042) | (6.9) | (1,154) |
| Effective Gross Income | $3,231,980 | $3,802,716 | $3,992,064 | $4,166,728 | 93.8% | $17,361 |
| Real Estate Taxes | 676,735 | 542,614 | 513,583 | 533,509 | 12.8 | 2,223 |
| Insurance | 88,592 | 79,538 | 61,275 | 105,000 | 2.5 | 438 |
| Management Fee | 109,630 | 138,584 | 146,544 | 125,002 | 3.0 | 521 |
| Other Expenses | 841,358 | 856,888 | 868,523 | 868,523 | 20.8 | 3,619 |
| Total Operating Expenses | $1,716,315 | $1,617,624 | $1,589,925 | $1,632,034 | 39.2% | $6,800 |
| Net Operating Income | $1,515,666 | $2,185,092 | $2,402,139 | $2,534,694 | 60.8% | $10,561 |
| Capital Expenditures | 0 | 0 | 0 | 60,000 | 1.4 | 250 |
| Net Cash Flow | $1,515,666 | $2,185,092 | $2,402,139 | $2,474,694 | 59.4% | $10,311 |
| NOI DSCR | 0.80x | 1.15x | 1.27x | 1.34x | ||
| NCF DSCR | 0.80x | 1.15x | 1.27x | 1.31x | ||
| NOI Debt Yield | 5.4% | 7.8% | 8.6% | 9.1% | ||
| NCF Debt Yield | 5.4% | 7.8% | 8.6% | 8.8% |
| (1) | Represents (i) percent of Net Rental Income for all revenue fields, (ii) percent of Gross Potential Rent for Vacancy & Credit Loss and (iii) percent of Effective Gross Income for all other fields. |
| (2) | Other Income is comprised of parking income, utility reimbursement and other miscellaneous fees. |
Appraisal. The appraisal concluded to an “as-is” appraised value as of May 20, 2024 of $37,400,000.
Environmental Matters. According to the Phase I environmental report dated May 28, 2024, there was no evidence of any recognized environmental conditions at the Solon Park Apartments Property.
Market Overview and Competition. The Solon Park Apartments Property is located in Solon, Ohio in Cuyahoga County, approximately 18 miles southwest of Cleveland. Primary access is provided by Highway 422, Interstate 480 and Interstate 271. The Solon Park Apartments Property is located within the Cleveland-Elyria metropolitan statistical area (“MSA”). The major industries within the Cleveland-Elyria MSA include education and health services, professional/business services, government services, and manufacturing. The top employers in the Cleveland-Elyria MSA are Cleveland Clinic Foundation, University Hospitals, US Office of Personnel Management, and Minute Men Co. Retail and other forms of commercial development are generally located to the north of the Solon Park Apartments Property. Downtown Solon contains most of the retail development in the immediate market area. The closest major retail corridor in the vicinity is located just north of the Solon Park Apartments Property along Aurora Road (SR-43) and SOM Center Road (SR 91).
According to the appraisal, the 2024 estimated population within a one-, three-, and five-mile radius of the Solon Park Apartments Property is 6,004, 31,712 and 91,842, respectively. The 2024 estimated median household income within the same radii was $87,255, $116,759 and $94,240, respectively.
According to the appraisal, the Solon Park Apartments Property is situated in the Southeast Cleveland multifamily submarket, which contained approximately 987 units as of the first quarter of 2024. The Southeast Cleveland multifamily submarket reported a vacancy rate of 5.4% with an average effective rent of $1,327 per unit.
| THE INFORMATION IN THIS STRUCTURAL AND COLLATERAL TERM SHEET IS NOT COMPLETE AND MAY BE AMENDED PRIOR TO THE TIME OF SALE. THIS TERM SHEET IS NOT AN OFFER TO SELL THESE SECURITIES AND IT IS NOT A SOLICITATION OF AN OFFER TO BUY THESE SECURITIES IN ANY JURISDICTION WHERE THE OFFER OR SALE IS NOT PERMITTED. | ||
| 107 | ||
| Multifamily – Garden | Loan #9 | Cut-off Date Balance: | $28,000,000 | |
| 34600 Park East Drive | Solon Park Apartments | Cut-off Date LTV: | 74.9% | |
| Solon, OH 44139 | U/W NCF DSCR: | 1.31x | ||
| U/W NOI Debt Yield: | 9.1% |
The following table presents certain information relating to the appraisal’s market rent conclusion for the Solon Park Apartments Property:
Market Rent Summary
| Unit Type | Units(1) | Avg. Monthly Actual Rent per Unit(1)(2) | Avg. Monthly Market Rent per Unit(3) |
| One Bedroom | 48 | $1,260 | $1,310 |
| Two Bedroom | 192 | $1,433 | $1,477 |
| Total / Wtd. Average | 240 | $1,396 | $1,443 |
| (1) | Based on the underwritten rent roll dated May 31, 2024. |
| (2) | Represents the average rent for occupied units only. |
| (3) | Based on the appraisal. |
The following table presents certain information relating to multifamily rental properties comparable to the Solon Park Apartments Property:
Comparable Rental Properties(1)
| Property | Year Built | # Units | Occupancy | Unit Mix | In-Place Monthly Rent per Unit |
Solon Park Apartments(2) Solon, OH | 1964, 1967, 1972 | 240 | 93.8% | 1BR 2BR | $1,260 $1,433 |
The Residence at Barrington Aurora, OH | 1998 | 288 | 99.0% | 1BR 2BR | $1,557 $1,916 - $2,147 |
Solon Club Apartments Bedford, OH | 1967 | 195 | 99.0% | 1BR 2BR | $1,060 - $1,155 $1,335 - $1,380 |
Ravenna Woods Apartments Twinsburg, OH | 1987 | 128 | 98.0% | 1BR 2BR | $1,045 $1,200 |
Pebble Creek Apartments Twinsburg, OH | 1994 | 148 | 99.0% | 1BR 2BR | $1,245 $1,285 - $1,300 |
Liberty Hill Apartments Solon, OH | 1979 | 396 | 97.0% | 1BR 2BR | $1,295 $1,450 |
| Glenwood Pointe Twinsburg, OH | 1997 | 128 | 99.0% | 1BR 2BR | $1,300 $1,345 |
| Deer Run Twinsburg, OH | 1987 | 562 | 99.0% | 1BR 2BR | $1,150 $1,350 - $1,365 |
| (1) | Source: Appraisal, unless otherwise noted. |
| (2) | Other than Year Built, information is based on the underwritten rent roll dated May 31, 2024. |
The following table presents recent comparable multifamily sales data with respect to the Solon Park Apartments Property:
Comparable Sales(1)
| Property | Year Built | # Units | Occupancy | Date of Sale | Sale Price | Sale Price per Unit | Capitalization Rate |
Solon Park Apartments Solon, OH | 1964, 1967,1972 | 240 | 93.8%(2) | ||||
Stratford Crossing Wadsworth, OH | 2007 | 348 | 98.0% | NAV | $46,600,000 | $133,908 | 7.20% |
Troy Farms Delaware, OH | 2005 | 304 | 91.0% | Apr-24 | $44,250,000 | $145,559 | 7.00% |
Easthaven at the Village Beachwood, OH | 1994 | 360 | 94.0% | Apr-24 | $72,000,000 | $200,000 | 6.75% |
The Standard Cleveland, OH | 1924 | 277 | 93.0% | Nov-23 | $42,000,000 | $151,625 | 7.46% |
Village at Mayfield Mayfield, OH | 1966 | 252 | 96.0% | NAV | $37,550,000 | $149,008 | 7.05% |
Britton Woods Dublin, OH | 1992 | 352 | 100.0% | Jun-23 | $53,000,000 | $150,568 | 6.07% |
Lakes of Aurora Apartments Aurora, OH | 1989 | 242 | 94.0% | Jan-24 | $44,500,000 | $183,884 | 7.25% |
| (1) | Source: Appraisal |
| (2) | Based on the underwritten rent roll dated May 31, 2024. |
| THE INFORMATION IN THIS STRUCTURAL AND COLLATERAL TERM SHEET IS NOT COMPLETE AND MAY BE AMENDED PRIOR TO THE TIME OF SALE. THIS TERM SHEET IS NOT AN OFFER TO SELL THESE SECURITIES AND IT IS NOT A SOLICITATION OF AN OFFER TO BUY THESE SECURITIES IN ANY JURISDICTION WHERE THE OFFER OR SALE IS NOT PERMITTED. | ||
| 108 | ||
| Multifamily – Garden | Loan #9 | Cut-off Date Balance: | $28,000,000 | |
| 34600 Park East Drive | Solon Park Apartments | Cut-off Date LTV: | 74.9% | |
| Solon, OH 44139 | U/W NCF DSCR: | 1.31x | ||
| U/W NOI Debt Yield: | 9.1% |
Escrows.
Real Estate Taxes – The Solon Park Apartments Mortgage Loan documents require an upfront deposit of $99,530 for real estate taxes and ongoing monthly deposits equal to 1/12 of the taxes that the lender estimates will be payable during the next 12 months (initially $49,765).
Insurance – The Solon Park Apartments Mortgage Loan documents require an upfront deposit of $96,250 for insurance premiums and ongoing monthly deposits equal to 1/12 of the insurance premiums that the lender estimates will be payable during the next 12 months (initially $8,750).
Replacement Reserve – The Solon Park Apartments Mortgage Loan documents require ongoing monthly replacement reserve deposits of $5,000 ($250 per unit per year).
Lockbox and Cash Management. The Solon Park Apartments Mortgage Loan is structured with a springing lockbox and springing cash management. Upon the commencement of a Cash Management Period (as defined below), the Solon Park Apartments Mortgage Loan documents require the borrower to deposit, or cause the manager to deposit, all rents into a lockbox account within two business days of receipt. During a Cash Management Period, all funds in the lockbox will be swept daily into a cash management account controlled by the lender and applied in accordance with the Solon Park Apartments Mortgage Loan documents.
A “Cash Management Period” will commence upon the earliest of the following:
| (i) | the occurrence of an event of default; or |
| (ii) | if as of the last day of any calendar quarter, the net cash flow debt service coverage ratio (based on the trailing 12-month period as calculated by the lender) is less than 1.10x. |
A Cash Management Period will end upon the occurrence of the following:
| ● | with regard to clause (i), the cure of such event of default and no other event of default has occurred and is continuing; or |
| ● | with regard to clause (ii), the net cash flow debt service coverage ratio (based on the trailing 12-month period as calculated by the lender) is at least 1.15x for two consecutive calendar quarters. |
Property Management. The Solon Park Apartments Property is managed by Insignia Residential Management, LLC, a third-party property manager.
Partial Release. Not permitted.
Real Estate Substitution. Not permitted.
Subordinate and Mezzanine Indebtedness. None.
Right of First Offer / Right of First Refusal. None.
Ground Lease. None.
Terrorism Insurance. The Solon Park Apartments Mortgage Loan documents require that the “all risk” insurance policy required to be maintained by the borrower provides coverage for terrorism in an amount equal to the full replacement cost of the Solon Park Apartments Property, as well as business interruption insurance covering no less than the 18-month period following the occurrence of a casualty event, together with a six-month extended period of indemnity.
| THE INFORMATION IN THIS STRUCTURAL AND COLLATERAL TERM SHEET IS NOT COMPLETE AND MAY BE AMENDED PRIOR TO THE TIME OF SALE. THIS TERM SHEET IS NOT AN OFFER TO SELL THESE SECURITIES AND IT IS NOT A SOLICITATION OF AN OFFER TO BUY THESE SECURITIES IN ANY JURISDICTION WHERE THE OFFER OR SALE IS NOT PERMITTED. | ||
| 109 | ||
| Hospitality – Full Service | Loan #10 | Cut-off Date Balance: | $27,000,000 | |
28 Day Hill Road Windsor, CT 06095
| Marriott Hartford Windsor Airport | Cut-off Date LTV: U/W NCF DSCR: U/W NOI Debt Yield: | 48.8% 2.03x 17.2% |

| THE INFORMATION IN THIS STRUCTURAL AND COLLATERAL TERM SHEET IS NOT COMPLETE AND MAY BE AMENDED PRIOR TO THE TIME OF SALE. THIS TERM SHEET IS NOT AN OFFER TO SELL THESE SECURITIES AND IT IS NOT A SOLICITATION OF AN OFFER TO BUY THESE SECURITIES IN ANY JURISDICTION WHERE THE OFFER OR SALE IS NOT PERMITTED. | ||
| 110 | ||
| Hospitality – Full Service | Loan #10 | Cut-off Date Balance: | $27,000,000 | |
28 Day Hill Road Windsor, CT 06095
| Marriott Hartford Windsor Airport | Cut-off Date LTV: U/W NCF DSCR: U/W NOI Debt Yield: | 48.8% 2.03x 17.2% |
| THE INFORMATION IN THIS STRUCTURAL AND COLLATERAL TERM SHEET IS NOT COMPLETE AND MAY BE AMENDED PRIOR TO THE TIME OF SALE. THIS TERM SHEET IS NOT AN OFFER TO SELL THESE SECURITIES AND IT IS NOT A SOLICITATION OF AN OFFER TO BUY THESE SECURITIES IN ANY JURISDICTION WHERE THE OFFER OR SALE IS NOT PERMITTED. | ||
| 111 | ||
| No. 10 – Marriott Hartford Windsor Airport | |||||||
| Mortgage Loan Information | Mortgaged Property Information | ||||||
| Mortgage Loan Seller: | LMF Commercial, LLC | Single Asset/Portfolio: | Single Asset | ||||
Credit Assessment (Fitch/KBRA/S&P): | NR/NR/NR | Property Type – Subtype: | Hospitality – Full Service | ||||
| Original Principal Balance: | $27,000,000 | Location: | Windsor, CT | ||||
| Cut-off Date Balance: | $27,000,000 | Size: | 302 Rooms | ||||
| % of Initial Pool Balance: | 3.7% | Cut-off Date Balance Per Room: | $89,404 | ||||
| Loan Purpose: | Refinance | Maturity Date Balance Per Room: | $89,404 | ||||
| Borrower Sponsor: | CSC Holdings, LLC | Year Built/Renovated: | 2002/2018, 2020 | ||||
| Guarantor: | CSC Holdings, LLC | Title Vesting: | Fee | ||||
| Mortgage Rate: | 7.2600% | Property Manager: | Crestview Management, LLC (borrower-related) | ||||
| Note Date: | June 21, 2024 | Current Occupancy (As of): | 56.3% (3/31/2024) | ||||
| Seasoning: | 0 months | YE 2023 Occupancy: | 55.5% | ||||
| Maturity Date: | July 6, 2029 | YE 2022 Occupancy(2): | 48.3% | ||||
| IO Period: | 60 months | YE 2021 Occupancy(2) : | 36.4% | ||||
| Loan Term (Original): | 60 months | YE 2020 Occupancy(2): | 22.3% | ||||
| Amortization Term (Original): | NAP | As-Is Appraised Value: | $55,300,000 | ||||
| Loan Amortization Type: | Interest Only | As-Is Appraised Value Per Room: | $183,113 | ||||
| Call Protection: | L(24),D(29),O(7) | As-Is Appraisal Valuation Date: | April 4, 2024 | ||||
| Lockbox Type: | Hard/Springing Cash Management | Underwriting and Financial Information | |||||
| Additional Debt: | None | TTM NOI (3/31/2024): | $4,755,994 | ||||
| Additional Debt Type (Balance): | NAP | YE 2023 NOI: | $4,688,544 | ||||
| YE 2022 NOI(2): | $3,012,308 | ||||||
| YE 2021 NOI(2): | $938,133 | ||||||
| U/W Revenues: | $14,808,227 | ||||||
| U/W Expenses: | $10,173,768 | ||||||
| U/W NOI: | $4,634,459 | ||||||
| Escrows and Reserves(1) | U/W NCF: | $4,042,130 | |||||
| Initial | Monthly | Cap | U/W DSCR based on NOI/NCF: | 2.33x / 2.03x | |||
| Taxes: | $787,500 | $62,500 | NAP | U/W Debt Yield based on NOI/NCF: | 17.2% / 15.0% | ||
| Insurance: | $108,629 | $18,105 | NAP | U/W Debt Yield at Maturity based on NOI/NCF | 17.2% / 15.0% | ||
| FF&E Reserve: | $0 | $49,361 | NAP | Cut-off Date LTV Ratio: | 48.8% | ||
| PIP Reserve: | $0 | Springing | NAP | LTV Ratio at Maturity: | 48.8% | ||
| Sources and Uses | |||||||
| Sources | Uses | ||||||
| Mortgage Amount | $27,000,000 | 100.0% | Loan Payoff | $23,008,034 | 85.2% | ||
| Closing Costs | 271,721 | 1.0 | |||||
| Upfront Reserves | 896,129 | 3.3 | |||||
| Return of Equity | 2,824,116 | 10.5 | |||||
| Total Sources | $27,000,000 | 100.0% | Total Uses | $27,000,000 | 100.0% | ||
| (1) | See “Escrows” section. |
| (2) | The increase in occupancy and NOI from 2020 to 2021 and 2021 to 2022 was primarily due to the effect of the novel coronavirus on the hospitality industry in 2020, and the recovery in 2021. |
The Mortgage Loan. The tenth largest mortgage loan (the “Marriott Hartford Windsor Airport Mortgage Loan”) is evidenced by a single promissory note in the original principal amount of $27,000,000 and secured by the fee interest in a 302-room full-service hotel located in Windsor, Connecticut (the “Marriott Hartford Windsor Airport Property”).
The Borrower and Borrower Sponsor. The borrower is CP Windsor, LLC, a single-purpose, Delaware limited liability company with at least two independent directors. Legal counsel to the borrower delivered a non-consolidation opinion in connection with the origination of the Marriott Hartford Windsor Airport Mortgage Loan. The borrower sponsor and non-recourse carveout guarantor is CSC Holdings, LLC, a subsidiary of Columbia Sussex Corporation.
Columbia Sussex Corporation is an experienced hotel management firm that was founded in 1972. The Columbia Sussex Corporation owns and manages more than 40 hospitality assets under the JW Marriott, Marriott, Courtyard by Marriott, Hilton, DoubleTree by Hilton, Renaissance, and Westin flags.
| THE INFORMATION IN THIS STRUCTURAL AND COLLATERAL TERM SHEET IS NOT COMPLETE AND MAY BE AMENDED PRIOR TO THE TIME OF SALE. THIS TERM SHEET IS NOT AN OFFER TO SELL THESE SECURITIES AND IT IS NOT A SOLICITATION OF AN OFFER TO BUY THESE SECURITIES IN ANY JURISDICTION WHERE THE OFFER OR SALE IS NOT PERMITTED. | ||
| 112 | ||
| Hospitality – Full Service | Loan #10 | Cut-off Date Balance: | $27,000,000 | |
28 Day Hill Road Windsor, CT 06095
| Marriott Hartford Windsor Airport | Cut-off Date LTV: U/W NCF DSCR: U/W NOI Debt Yield: | 48.8% 2.03x 17.2% |
Columbia Sussex Corporation has had a number of loan defaults and related actions over the past fifteen years. For additional information please see “Description of the Mortgage Pool - Loan Purpose; Default History, Bankruptcy Issues and Other Proceedings” in the Preliminary Prospectus.
Upon execution of the franchise agreement, the borrower assumed the obligation to repay the unamortized portion of key money to the franchisor in the amount of $194,897.94. For additional information, see “Description of the Mortgage Pool—Additional Indebtedness—Other Unsecured Indebtedness in the Preliminary Prospectus.
The Property. The Marriott Hartford Windsor Airport Property is a 302-room, full-service hotel located in Windsor, Connecticut. Built in 2002, property amenities include an indoor swimming pool, fitness room, airport/local shuttle, market pantry, lobby workstation, room service, vending areas and 12,905 square feet of meeting space. The Marriott Hartford Windsor Airport Property operates under a license agreement with Marriott International, Inc., which expires in July 2039.
The Marriott Hartford Windsor Airport Property guestroom configuration consists of 134 king rooms, 89 double/double rooms, 71 sofa king rooms, 4 one-bedroom suites and 4 studio suites. The guestrooms feature flat-panel television, desk with chair, coffee/tea maker, in-room safe, room service and refrigerator.
The Marriott Hartford Windsor Airport Property underwent approximately $9,200,000 ($30,464/room) of guestroom and public space renovations between 2015 and 2018. The ballroom and meeting spaces were renovated in 2020.
The following table presents historical occupancy, ADR, and RevPAR penetration rates of the Marriott Hartford Windsor Airport Property:
| Historical Occupancy, ADR, RevPAR(1)(2) | ||||||||||||
| Competitive Set | Marriott Hartford Windsor Airport Property | Penetration Factor | ||||||||||
| Year | Occupancy | ADR | RevPAR | Occupancy | ADR | RevPAR | Occupancy | ADR | RevPAR | |||
| 3/31/2022 TTM | 58.9% | $125.11 | $73.65 | 42.5% | $136.67 | $58.04 | 72.1% | 109.2% | 78.8% | |||
| 3/31/2023 TTM | 69.0% | $146.01 | $100.69 | 50.7% | $157.99 | $80.12 | 73.5% | 108.2% | 79.6% | |||
| 3/31/2024 TTM | 71.3% | $148.56 | $105.89 | 56.2% | $170.77 | $95.93 | 78.8% | 115.0% | 90.6% | |||
| (1) | Information obtained from a third-party research report. |
| (2) | According to a third-party research report, the competitive set includes DoubleTree by Hilton Hotel Hartford-Bradley Airport, Hilton Garden Inn Hartford North Bradley International Airport, Residence Inn Hartford Windsor, Hyatt House Hartford North/Windsor, Sheraton Hartford Hotel at Bradley Airport and Holiday Inn Express Bradley Airport. |
The following table presents historical occupancy percentages at the Marriott Hartford Windsor Airport Property:
Historical Occupancy(1)
12/31/2020(2) | 12/31/2021(2) | 12/31/2022(2) | 12/31/2023 | TTM 3/31/2024 |
| 22.3% | 36.4% | 48.3% | 55.5% | 56.3% |
| (1) | Information obtained from the borrower. |
| (2) | The increase from 2020 to 2021 and 2021 to 2022 was primarily due to the effect of the novel coronavirus on the hospitality industry in 2020, and the recovery in 2021. |
| THE INFORMATION IN THIS STRUCTURAL AND COLLATERAL TERM SHEET IS NOT COMPLETE AND MAY BE AMENDED PRIOR TO THE TIME OF SALE. THIS TERM SHEET IS NOT AN OFFER TO SELL THESE SECURITIES AND IT IS NOT A SOLICITATION OF AN OFFER TO BUY THESE SECURITIES IN ANY JURISDICTION WHERE THE OFFER OR SALE IS NOT PERMITTED. | ||
| 113 | ||
| Hospitality – Full Service | Loan #10 | Cut-off Date Balance: | $27,000,000 | |
28 Day Hill Road Windsor, CT 06095
| Marriott Hartford Windsor Airport | Cut-off Date LTV: U/W NCF DSCR: U/W NOI Debt Yield: | 48.8% 2.03x 17.2% |
Operating History and Underwritten Net Cash Flow. The following table presents certain information relating to the historical operating performance and underwritten net cash flow at the Marriott Hartford Windsor Airport Property:
Cash Flow Analysis
| 2021 | 2022 | 2023 | TTM 3/31/2024 | U/W | % of U/W Total Revenue(1) | U/W $ per Room | |
| Occupancy | 36.4% | 48.3% | 55.5% | 56.3% | 56.3% | ||
| ADR | $133.22 | $154.63 | $169.81 | $170.57 | $170.57 | ||
| RevPAR | $48.45 | $74.63 | $94.22 | $96.00 | $96.00 | ||
| Room Revenue | $5,340,205 | $8,226,728 | $10,385,420 | $10,611,314 | $10,582,321 | 71.5% | $35,041 |
Food & Beverag Revenue Other Revenue(2) | 1,420,123 86,432 | 3,383,274 115,966 | 3,997,994 150,601 | 4,050,000 152,530 | 4,073,793 152,113 | 27.5 1.0 | 13,489 504 |
| Total Revenue | $6,846,760 | $11,725,968 | $14,534,015 | $14,813,844 | $14,808,227 | 100.0% | $49,034 |
| Room Expense | 1,777,524 | 2,506,170 | 2,685,745 | 2,700,735 | 2,693,356 | 25.5 | 8,918 |
| Food & Beverage Expense | 840,324 | 1,771,588 | 2,045,887 | 2,092,798 | 2,105,093 | 51.7 | 6,971 |
| Other Expenses | 28,194 | 29,160 | 45,608 | 47,899 | 46,066 | 30.3 | 153 |
| Total Department Expenses | $2,646,042 | $4,306,917 | $4,777,241 | $4,841,432 | $4,844,515 | 32.7% | $16,041 |
| Gross Operating Income | $4,200,717 | $7,419,051 | $9,756,774 | $9,972,412 | $9,963,712 | 67.3% | $32,992 |
| Total Undistributed Expenses | 2,447,757 | 3,591,833 | 4,213,705 | 4,316,427 | 4,334,965 | 29.3 | 14,354 |
| Gross Operating Profit | $1,752,960 | $3,827,217 | $5,543,069 | $5,655,985 | $5,628,747 | 38.0% | $18,638 |
| Property Taxes | 687,315 | 674,993 | 669,556 | 668,956 | 750,000 | 5.1 | 2,483 |
| Lease Expense | 0 | 0 | 2,154 | 2,154 | 2,154 | 0.0 | 7 |
| Insurance | 127,512 | 139,917 | 182,815 | 228,882 | 242,134 | 1.6 | 802 |
| Total Operating Expenses | $5,908,627 | $8,713,661 | $9,845,471 | $10,057,850 | $10,173,768 | 68.7% | $33,688 |
| Net Operating Income | $938,133(3) | $3,012,308(3) | $4,688,544 | $4,755,994 | $4,634,459 | 31.3% | $15,346 |
| FF&E | 273,871 | 469,039 | 581,361 | 592,554 | 592,329 | 4.0 | 1,961 |
| Net Cash Flow | $664,263 | $2,543,269 | $4,107,183 | $4,163,440 | $4,042,130 | 27.3% | $13,385 |
| NOI DSCR | 0.47x | 1.52x | 2.36x | 2.39x | 2.33x | ||
| NCF DSCR | 0.33x | 1.28x | 2.07x | 2.09x | 2.03x | ||
| NOI DY | 3.5% | 11.2% | 17.4% | 17.6% | 17.2% | ||
| NCF DY | 2.5% | 9.4% | 15.2% | 15.4% | 15.0% |
| (1) | % of U/W Total Revenue for Room Expense, Food & Beverage Expense and Other Expenses are based on their corresponding revenue line items. All other line items represent percent of Total Revenue. |
| (2) | Other Revenue includes gift shop sales revenue, room service fees, internet access fees and other miscellaneous revenues. |
| (3) | The increase in Net Operating Income from 2021 to 2022 was primarily due to the effect of the novel coronavirus on the hospitality industry in 2020, and the recovery in 2021. Additionally, the Marriott Hartford Windsor Airport Property underwent an approximately $9.2 million renovation ($30,464/room) between 2015 and 2018. The ballroom and meeting spaces were renovated in 2020. |
Appraisal. The appraised value of $55,300,000 is as of April 4, 2024 and represents the as-is value of the Marriott Hartford Windsor Airport Property.
Environmental Matters. According to the Phase I environmental site assessment dated April 9, 2024, there was no evidence of any recognized environmental conditions at the Marriott Hartford Windsor Airport Property.
Market Overview and Competition. The Marriott Hartford Windsor Airport Property is located in Windsor, Connecticut, approximately 1.0 mile west of Interstate 91, approximately 1.7 miles east State Highway 305 and 6 miles south of Bradley International Airport, which serviced 6,248,165 passengers in 2023, an increase of 7.8% over 2022. The Marriott Hartford Windsor Airport Property is within 10 miles of numerous tourist attractions including New England Air Museum (8.4 miles north), Connecticut’s Old State House (9.4 miles south), Bushnell Park Carousel (10.3 miles south), Wadsworth Atheneum Museum of Art (9.4 miles south) and Mark Twain House & Museum (11.1 miles south).
According to the appraisal, the 2024 estimated population within a one-, three- and five-mile radius of the Marriott Hartford Windsor Airport Property was 3,304, 23,760 and 68,010, respectively. The 2024 estimated average household income within the same one-, three- and five-mile radii was $127,486, $121,850 and $112,371, respectively.
The appraisal did not identify any directly competitive properties either proposed or under construction.
| THE INFORMATION IN THIS STRUCTURAL AND COLLATERAL TERM SHEET IS NOT COMPLETE AND MAY BE AMENDED PRIOR TO THE TIME OF SALE. THIS TERM SHEET IS NOT AN OFFER TO SELL THESE SECURITIES AND IT IS NOT A SOLICITATION OF AN OFFER TO BUY THESE SECURITIES IN ANY JURISDICTION WHERE THE OFFER OR SALE IS NOT PERMITTED. | ||
| 114 | ||
| Hospitality – Full Service | Loan #10 | Cut-off Date Balance: | $27,000,000 | |
28 Day Hill Road Windsor, CT 06095
| Marriott Hartford Windsor Airport | Cut-off Date LTV: U/W NCF DSCR: U/W NOI Debt Yield: | 48.8% 2.03x 17.2% |
The table below presents certain information relating to comparable sales pertaining to the Marriott Hartford Windsor Airport Property identified by the appraisal:
| Comparable Sales Summary | |||||
Property Name | Location | Year Built/Renovated | Rooms | Sale Date | Sale Price / Room |
| Courtyard by Marriott Providence Downtown | 32 Exchange Terrace At, Memorial Boulevard Providence, RI | 2000/NAP | 216 | 3/2024 | $174,769 |
| Sheraton Ann Arbor | 3200 Boardwalk Drive Ann Arbor, MI | 1981/NAV | 197 | 9/2022 | $181,218 |
| AC Hotel Worcester | 125 Front Street Worcester, MA | 2018/NAP | 170 | 9/2022 | $235,294 |
| Boston Marriott Quincy | 1000 Marriott Drive Quincy, MA | 2001/NAV | 464 | 3/2022 | $189,655 |
Escrows.
Real Estate Taxes – The Marriott Hartford Windsor Airport Mortgage Loan documents require an upfront deposit of $787,500 and ongoing monthly deposits of 1/12 of the tax deposit reasonably estimated by the lender for real estate taxes, initially $62,500.
Insurance – The Marriott Hartford Windsor Airport Mortgage Loan documents require an upfront deposit of $108,629 and an ongoing monthly insurance reserve in an amount equal to 1/12 of the insurance premiums that the lender reasonably estimates, initially $18,105. Notwithstanding the above, the borrower’s obligation to make insurance reserve payments will be waived so long as (i) the insurance policies maintained by the borrower are part of a blanket or umbrella policy approved by the lender in its reasonable discretion, and (ii) the lender is provided with paid receipts for the payment of the insurance premiums no later than 15 days prior to the expiration dates of said policies.
FF&E Reserve - The Marriott Hartford Windsor Airport Mortgage Loan documents require ongoing monthly deposits in an amount equal to the greater of (i) 1/12 of 4% of gross income from operations during the calendar year immediately preceding the calendar year in which such monthly payment date occurs, or (ii) the aggregate amount, if any, required to be reserved under the management agreement and the franchise agreement. The monthly reserve amount is initially estimated to be $49,361.
PIP Reserve - The Marriott Hartford Windsor Airport Mortgage Loan documents require that on each monthly payment date during the continuance of a franchise trigger event period, the borrower is required to deposit with lender all excess cash flow to pay or reimburse the borrower for the costs and expenses of any PIP Work; provided that the borrower may post cash or an acceptable letter of credit in such amount (less any amounts then on deposit in the FF&E Reserve) to avoid a cash sweep that may be triggered by the PIP work requirement.
Lockbox and Cash Management. The Marriott Hartford Windsor Airport Mortgage Loan is structured with a hard lockbox and springing cash management. The borrower and property manager are required to direct all credit card companies to deposit all amounts due directly into the lockbox account, which will be transferred to the borrower’s operating account on a daily basis when there is no Cash Management Trigger Event (as defined below) or Cash Sweep Event (as defined below) in place. During a Cash Management Trigger Event or Cash Sweep Event, any excess cash flow remaining after satisfaction of the payment priorities outlined in the Marriott Hartford Windsor Airport Mortgage Loan documents is required to be swept to an excess cash flow subaccount to be held as additional collateral for the Marriott Hartford Windsor Airport Mortgage Loan.
A “Cash Management Trigger Event” will commence upon the earlier of the following:
| (i) | an event of default; |
| (ii) | the occurrence of bankruptcy or insolvency of the borrower, guarantor or the property manager; |
| (iii) | the debt service coverage ratio (“DSCR”) falls below 1.20x; or |
| (iv) | a Franchise Trigger Event (as defined below). |
A Cash Management Trigger Event will end upon the occurrence of the following:
| ● | with regard to clause (i), the cure of such event of default; |
| ● | with regard to clause (ii), upon the same being discharged, stayed or dismissed within 30 days of such filing for the borrower or the guarantor, or upon replacing the property manager with a qualified property manager within 120 days of such filing; |
| ● | with regard to clause (iii), upon the DSCR being greater than 1.25x for two consecutive quarters; or |
| ● | with regard to clause (iv), the date upon which the Franchise Trigger Event has been cured. |
A “Cash Sweep Event” will commence upon any of the following:
| (i) | an event of default; |
| (ii) | the occurrence of bankruptcy or insolvency of the borrower, guarantor or the property manager; |
| (iii) | the DSCR falls below 1.20x; or |
| (iv) | the occurrence of a Franchise Trigger Event. |
| THE INFORMATION IN THIS STRUCTURAL AND COLLATERAL TERM SHEET IS NOT COMPLETE AND MAY BE AMENDED PRIOR TO THE TIME OF SALE. THIS TERM SHEET IS NOT AN OFFER TO SELL THESE SECURITIES AND IT IS NOT A SOLICITATION OF AN OFFER TO BUY THESE SECURITIES IN ANY JURISDICTION WHERE THE OFFER OR SALE IS NOT PERMITTED. | ||
| 115 | ||
| Hospitality – Full Service | Loan #10 | Cut-off Date Balance: | $27,000,000 | |
28 Day Hill Road Windsor, CT 06095
| Marriott Hartford Windsor Airport | Cut-off Date LTV: U/W NCF DSCR: U/W NOI Debt Yield: | 48.8% 2.03x 17.2% |
A Cash Sweep Event will end upon the occurrence of the following:
| ● | with regard to clause (i), the cure of such event of default; |
| ● | with regard to clause (ii), upon the same being discharged, stayed or dismissed within 30 days of such filing for the borrower or the guarantor, or upon replacing the property manager with a qualified property manager within 120 days of such filing; |
| ● | with regard to clause (iii), upon the DSCR being greater than 1.25x for two consecutive quarters; and |
| ● | with regard to clause (iv), the date upon which the Franchise Trigger Event has been cured. |
A “Franchise Trigger Event” will commence upon any of the following:
| (i) | the expiration or termination of the franchise agreement for any reason; |
| (ii) | the date that is 12 months prior to the then current expiration of the franchise agreement; |
| (iii) | the occurrence of a material default under the franchise agreement beyond the applicable cure period; or |
| (iv) | the date that the borrower enters into any PIP or is required to perform a PIP pursuant to the franchise agreement. |
A Franchise Trigger Event will end upon the occurrence of the following:
| ● | with regard to clauses (i) and (ii), a replacement franchise agreement is entered into by the borrower with a qualified franchisor, all related property improvement requirements have been completed and paid for in full and lender has received an acceptable comfort letter from such qualified franchisor; |
| ● | with regard to clause (iii), all such defaults have been cured and such cures accepted by the franchisor, as demonstrated by delivery to lender of a “good standing” letter (or equivalent) in form and substance reasonably acceptable to lender; and |
| ● | with regard to clause (iv), the earlier of the date that the related PIP has been completed and paid for in full and lender has received an acceptable comfort letter, estoppel or other documentation from the franchisor evidencing such completion, or the borrower deposits with the lender, cash or a letter of credit in an amount equal to (A) 110% of the estimated cost to complete the PIP work less (B) the amount of funds that remain in the FF&E reserve that are not then allocated for the completion of capital expenditures or capital expenditure work. |
Property Management. The Marriot Hartford Windsor Airport Property is managed by Crestview Management, LLC, an affiliate of the borrower.
Partial Release. Not permitted.
Real Estate Substitution. Not permitted.
Subordinate and Mezzanine Indebtedness. Not permitted.
Ground Lease. None.
Terrorism Insurance. The Marriott Hartford Windsor Airport Mortgage Loan documents require that the “all risk” insurance policy required to be maintained by the borrower provides coverage for terrorism in an amount equal to the full replacement cost of the Marriott Hartford Windsor Airport Property, as well as business interruption insurance covering no less than the 12-month period following the occurrence of a casualty event, together with a 12-month extended period of indemnity.
| THE INFORMATION IN THIS STRUCTURAL AND COLLATERAL TERM SHEET IS NOT COMPLETE AND MAY BE AMENDED PRIOR TO THE TIME OF SALE. THIS TERM SHEET IS NOT AN OFFER TO SELL THESE SECURITIES AND IT IS NOT A SOLICITATION OF AN OFFER TO BUY THESE SECURITIES IN ANY JURISDICTION WHERE THE OFFER OR SALE IS NOT PERMITTED. | ||
| 116 | ||
| No. 11 – Cummins Station | |||||||
| Mortgage Loan Information | Mortgaged Property Information | ||||||
| Mortgage Loan Seller: | Wells Fargo Bank, National Association | Single Asset/Portfolio: | Single Asset | ||||
Credit Assessment (Fitch/KBRA/Moody’s): | NR/NR/NR | Property Type – Subtype: | Office – CBD | ||||
| Original Principal Balance(1): | $25,000,000 | Location: | Nashville, TN | ||||
| Cut-off Date Balance(1): | $25,000,000 | Size: | 410,740 SF | ||||
| % of Initial Pool Balance: | 3.4% | Cut-off Date Balance Per SF(1): | $328.68 | ||||
| Loan Purpose: | Refinance | Maturity Date Balance Per SF(1): | $328.68 | ||||
| Borrower Sponsor: | Zachary P. Liff | Year Built/Renovated: | 1910/2017 | ||||
| Guarantor: | Zachary P. Liff | Title Vesting: | Fee | ||||
| Mortgage Rate: | 7.1550% | Property Manager: | DZL Management Company, LLC | ||||
| Note Date: | June 6, 2024 | Current Occupancy (As of)(5): | 71.1% (5/15/2024) | ||||
| Seasoning: | 1 month | YE 2023 Occupancy(5): | 80.1% | ||||
| Maturity Date: | June 11, 2029 | YE 2022 Occupancy: | 82.4% | ||||
| IO Period: | 60 months | YE 2021 Occupancy: | 86.2% | ||||
| Loan Term (Original): | 60 months | YE 2020 Occupancy: | 91.3% | ||||
| Amortization Term (Original): | NAP | As-Is Appraised Value: | $229,700,000 | ||||
| Loan Amortization Type: | Interest Only | As-Is Appraised Value Per SF: | $559.23 | ||||
| Call Protection(2): | L(25),D(28),O(7) | As-Is Appraisal Valuation Date: | April 16, 2024 | ||||
| Lockbox Type: | Hard/In Place Cash Management | Underwriting and Financial Information | |||||
| Additional Debt(1): | Yes | TTM 3/31/2024 NOI: | $12,694,127 | ||||
| Additional Debt Type (Balance) (1): | Pari Passu ($110,000,000) | YE 2023 NOI: | $12,292,464 | ||||
| YE 2022 NOI: | $12,001,080 | ||||||
| YE 2021 NOI: | $12,328,036 | ||||||
| U/W Revenues: | $18,454,322 | ||||||
| Escrows and Reserves | U/W Expenses: | $4,621,356 | |||||
| Initial | Monthly | Cap | U/W NOI: | $13,832,966 | |||
| Taxes: | $355,264 | $88,816 | NAP | U/W NCF: | $13,730,281 | ||
| Insurance: | $0 | Springing(3) | NAP | U/W DSCR based on NOI/NCF(1): | 1.41x / 1.40x | ||
| Replacement Reserves: | $0 | $8,557 | $205,370 | U/W Debt Yield based on NOI/NCF(1): | 10.2% / 10.2% | ||
| Deferred Maintenance: | $160,050 | $0 | NAP | U/W Debt Yield at Maturity based on NOI/NCF(1): | 10.2% / 10.2% | ||
| TI/LC Reserves: | $10,000,000(4) | $83,333 | NAP | Cut-off Date LTV Ratio(1): | 58.8% | ||
| Existing TI/LCs: | $2,115,256 | $0 | NAP | LTV Ratio at Maturity(1): | 58.8% | ||
| Rent Concession Reserve: | $1,023,389 | $0 | NAP | ||||
| Sources and Uses | |||||||
| Sources | Uses | ||||||
| Whole loan amount | $135,000,000 | 99.5% | Loan Payoff | $117,462,455 | 86.6% | ||
| Sponsor equity | 649,890 | 0.5 | Upfront Reserves | 13,653,959 | 10.1 | ||
| Closing costs | 4,533,475 | 3.3 | |||||
| Total Sources | $135,649,890 | 100.0% | Total Uses | $135,649,890 | 100.0% | ||
| (1) | The Cummins Station Mortgage Loan (as defined below) is part of the Cummins Station Whole Loan (as defined below) with an original aggregate principal balance of $135,000,000. The Cut-off Date Balance per SF, Maturity Date Balance per SF, UW Debt Yield based on NOI/NCF, UW Debt Yield at Maturity based on NOI/NCF, UW DSCR based on NOI/NCF, Cut-off Date LTV Ratio and Maturity Date LTV Ratio numbers presented above are based on the Cummins Station Whole Loan. |
| (2) | At any time after the earlier of (i) July 11, 2027 and (ii) two years from the closing date of the securitization that includes the last pari passu note of the Cummins Station Whole Loan to be securitized, the borrower has the right to defease the Cummins Station Whole Loan in whole, but not in part. Additionally, the borrower may prepay the Cummins Station Whole Loan with 30 days’ notice on or after December 11, 2028. |
| (3) | The loan documents require ongoing monthly insurance reserves in an amount equal to 1/12th of the insurance premiums that the lender estimates will be payable for the renewal of the coverage afforded by the policies upon the expiration thereof. Notwithstanding the above, the borrower’s obligation to make insurance reserve payments will be waived so long as (i) no event of default is continuing, (ii) the insurance policies maintained by borrower are part of a blanket or umbrella policy approved by the lender in its reasonable discretion, and (iii) borrower provides lender evidence of renewal of policies and paid receipts no later than 10 business days prior to policy expiration. |
| (4) | TI/LC reserves may be used for general TI/LCs and existing TI/LCs totalling $2,115,000 with respect to the Vidorra Restaurant space (9,400 square feet of net rentable area). |
| THE INFORMATION IN THIS STRUCTURAL AND COLLATERAL TERM SHEET IS NOT COMPLETE AND MAY BE AMENDED PRIOR TO THE TIME OF SALE. THIS TERM SHEET IS NOT AN OFFER TO SELL THESE SECURITIES AND IT IS NOT A SOLICITATION OF AN OFFER TO BUY THESE SECURITIES IN ANY JURISDICTION WHERE THE OFFER OR SALE IS NOT PERMITTED. | ||
| 117 | ||
| Office – CBD | Loan #11 | Cut-off Date Balance: | $25,000,000 | |
209 10th Avenue South Nashville, TN 37203 | Cummins Station | Cut-off Date LTV: U/W NCF DSCR: U/W NOI Debt Yield: | 58.8% 1.40x 10.2% |
| (5) | The decrease in occupancy between YE 2023 and Current Occupancy (as of 5/15/2024) is due to one tenant (8.8% of net rentable area) that is dark and current on rent being underwritten as vacant. |
The Mortgage Loan. The eleventh largest mortgage loan (the “Cummins Station Mortgage Loan”) is part of a whole loan (the “Cummins Station Whole Loan”) evidenced by three pari passu promissory notes in the aggregate original principal amount of $135,000,000 and secured by a first priority fee mortgage encumbering an office property located in Nashville, Tennessee (the “Cummins Station Property”). The non-controlling Note A-3, in the original principal amount of $25,000,000, represents the Cummins Station Mortgage Loan and will be contributed to the WFCM 2024-5C1 securitization trust. The controlling Note A-1, in the original principal amount of $60,000,000, is expected to be contributed to a future securitizations. The Cummins Station Whole Loan will be serviced pursuant to the pooling and servicing agreement for the WFCM 2024-5C1 securitization trust until the securitization of the controlling Note A-1, whereupon the Cummins Station Whole Loan will be serviced pursuant to the pooling and servicing agreement for such future securitization. See “Description of the Mortgage Pool—The Whole Loans—The Serviced Pari Passu Whole Loans” and “Pooling and Servicing Agreement—Servicing of the Serviced Mortgage Loans” in the prospectus.
Whole Loan Note Summary
| Notes | Original Balance | Cut-off Date Balance | Note Holder | Controlling Piece |
| A-1 | $60,000,000 | $60,000,000 | WFB | Yes |
| A-2 | $50,000,000 | $50,000,000 | WFB | No |
| A-3 | $25,000,000 | $25,000,000 | WFCM 2024-5C1 | No |
| Total (Whole Loan) | $135,000,000 | $135,000,000 |
The Borrower and Borrower Sponsor. The borrower is Cummins Station, LLC, a Delaware limited liability company and single purpose entity with one independent director. Legal counsel to the borrower delivered a non-consolidation opinion in connection with the origination of the Cummins Station Mortgage Loan.
The borrower sponsor is Zachary P. Liff. Zachary Liff is the owner of DZL, a real estate investment, management and development company, headquartered in Nashville, TN. DZL is a market leader in real estate development and property management, featuring a high-profile mixed-use portfolio of office, retail, hospitality and co-working properties.
The Property. The Cummins Station Property comprises a 5-story Class A, creative office building totaling 410,740 SF of net rentable area, inclusive of 48,523 SF of ground floor retail, located in Nashville, Tennessee. Situated on a 2.4 acre site, the Cummins Station Property was constructed in 1910. Since 2017, the sponsor has invested approximately $43 million in capital improvements, equipment, and TI/LCs. Amenities at the property include a private outdoor courtyard, conference room, onsite management, and a fitness center. The Cummins Station Property has 750 parking spaces on site, resulting in a parking ratio of approximately 1.8 spaces per 1,000 SF. As of May 15, 2024, the property was 71.1% leased to 26 tenants. Eventbrite (36,241 SF; 8.8% of net rentable area) is currently dark and was underwritten as vacant but is current on rent payments as of June 2024. Occupancy including the dark Eventbrite space is 80.0% as of May 15, 2024.
Major Tenants.
Gibson Brands, Inc. (57,357 square feet, 14.0% of net rentable area; 20.8% of underwritten base rent). Founded in 1894 and headquartered in Nashville, TN, Gibson Brands, Inc. (“Gibson”) is a manufacturer of musical instruments with a primary focus on guitars. The Gibson portfolio includes Gibson, the company’s guitar brand, as well as music brands, including Epiphone, Kramer, Steinberger, MESA/Boogie, and the Gibson Pro Audio division, KRK Systems. Gibson has been at the property, which serves as its headquarters, since 2019 and the current lease expires on December 31, 2032 with no renewal options.
Axial Healthcare, Inc. (45,911 SF, 11.2% of NRA; 17.4% of underwritten base rent). Axial Healthcare, Inc. (“Axial Healthcare”) is a risk management solution that identifies and addresses opoid-related risk in patient populations. Axial Healthcare is the risk mitigation solution of Wayspring, a company that provides end-to-end support for members with substance abuse. Axial Healthcare‘s lease expires on June 30, 2028 with no renewal or termination options.
Serendipity Labs (32,124 square feet, 7.8% of net rentable area; 8.2% of underwritten base rent). Founded in 2011, and headquartered in Rye, New York, Serendipity Labs is a designer of flexible workplaces that combine high-quality design, technology infrastructure and security. Since its founding, Serendipity Labs has grown to operate in over 29 locations across urban and suburban areas in the United States, as well as some international locations. The tenant is on a lease expiring July 28, 2033, with no renewal or termination options.
| THE INFORMATION IN THIS STRUCTURAL AND COLLATERAL TERM SHEET IS NOT COMPLETE AND MAY BE AMENDED PRIOR TO THE TIME OF SALE. THIS TERM SHEET IS NOT AN OFFER TO SELL THESE SECURITIES AND IT IS NOT A SOLICITATION OF AN OFFER TO BUY THESE SECURITIES IN ANY JURISDICTION WHERE THE OFFER OR SALE IS NOT PERMITTED. | ||
| 118 | ||
| Office – CBD | Loan #11 | Cut-off Date Balance: | $25,000,000 | |
209 10th Avenue South Nashville, TN 37203 | Cummins Station | Cut-off Date LTV: U/W NCF DSCR: U/W NOI Debt Yield: | 58.8% 1.40x 10.2% |
The following table presents certain information relating to the tenancy at the Cummins Station Property:
Major Tenants
| Tenant Name | Credit Rating (Fitch/ Moody’s/ | Tenant NRSF | % of NRSF | Annual U/W Base Rent PSF(2) | Annual U/W Base Rent(2) | % of Total Annual U/W Base Rent | Lease Expiration Date | Ext. Options | Term. Option (Y/N) |
| Major Tenants | |||||||||
| Gibson | NR/B3/B | 57,357 | 14.0% | $44.33 | $2,542,621 | 20.8% | 12/31/2032 | None | Y(3) |
| Axial Healthcare(4) | NR/NR/NR | 45,911 | 11.2% | $46.25 | $2,123,553 | 17.4% | 6/30/2028 | None | N |
| Serendipity Labs | NR/NR/NR | 32,124 | 7.8% | $31.00 | $995,844 | 8.2% | 7/28/2033 | None | N |
| Gish, Sherwood & Friends, Inc. | NR/NR/NR | 28,363 | 6.9% | $28.05 | $795,537 | 6.5% | 5/31/2026 | 2, 5-year | N |
| The Interpublic Group of Companies, Inc. | BBB+/Baa2/BBB | 17,074 | 4.2% | $41.37 | $706,436 | 5.8% | 10/31/2028 | None | N |
| Smart USA Co | NR/NR/NR | 13,203 | 3.2% | $39.61 | $522,989 | 4.3% | 8/31/2027 | 1, 5-year | N |
| 194,032 | 47.2% | $39.62 | $7,686,980 | 63.0% | |||||
| Other Tenants(5)(6) | 98,123 | 23.9% | $46.01 | $4,514,220 | 37.0% | ||||
| Occupied Collateral Total | 292,155 | 71.1% | $41.76 | $12,201,200 | 100.0% | ||||
| Vacant Space | 118,585 | 28.9% | |||||||
| Collateral Total | 410,740 | 100.0% | |||||||
| (1) | Certain ratings are those of the parent company whether or not the parent guarantees the lease. |
| (2) | The Annual U/W Base Rent and Annual U/W Base Rent PSF shown above include contractual rent steps through June 2025 totalling $346,699. |
| (3) | Gibson has the one-time right to terminate 1,965 square feet of its space effective 12/31/2030, by giving notice no earlier than 4/01/2030, and no later than 7/31/2030 and by paying a termination fee equal to the sum of (i) the unamortized leasing commission based on 2.0% of the applicable base rent and (ii) the unamortized allowance, calculated on an 8.0% per annum interest rate from the date of first full payment of base rent through the termination date. |
| (4) | Axial Healthcare is currently subleasing 21,697 square feet of space to three subtenants on subleases that expire between November 2024 and June 2028. |
| (5) | Other Tenants include three borrower affiliated tenants totalling 14,181 square feet (3.5% of net rentable area; 5.5% of underwritten base rent). |
| (6) | Other Tenants include three tenants (5.4% of net rentable area; 10.4% of underwritten base rent) with lease commencement dates between October 2024 and July 2025. Gap rent and outstanding free rent was reserved at loan origination. |
| THE INFORMATION IN THIS STRUCTURAL AND COLLATERAL TERM SHEET IS NOT COMPLETE AND MAY BE AMENDED PRIOR TO THE TIME OF SALE. THIS TERM SHEET IS NOT AN OFFER TO SELL THESE SECURITIES AND IT IS NOT A SOLICITATION OF AN OFFER TO BUY THESE SECURITIES IN ANY JURISDICTION WHERE THE OFFER OR SALE IS NOT PERMITTED. | ||
| 119 | ||
| Office – CBD | Loan #11 | Cut-off Date Balance: | $25,000,000 | |
209 10th Avenue South Nashville, TN 37203 | Cummins Station | Cut-off Date LTV: U/W NCF DSCR: U/W NOI Debt Yield: | 58.8% 1.40x 10.2% |
The following table presents certain information relating to the lease rollover schedule at the Cummins Station Property:
Lease Expiration Schedule(1)(2)
| Year Ending December 31, | No. of Leases Expiring | Expiring NRSF | % of Total NRSF | Cumulative Expiring NRSF | Cumulative % of Total NRSF | Annual U/W Base Rent(3) | % of Total Annual U/W Base Rent | Annual U/W Base Rent PSF(3) |
| MTM | 3 | 2,606 | 0.6% | 2,606 | 0.6% | $0 | 0.0% | $0.00 |
| 2024 | 0 | 0 | 0.0% | 2,606 | 0.6% | $0 | 0.0% | $0.00 |
| 2025 | 2 | 11,969 | 2.9% | 14,575 | 3.5% | $554,544 | 4.5% | $46.33 |
| 2026 | 4 | 34,163 | 8.3% | 48,738 | 11.9% | $1,031,529 | 8.5% | $30.19 |
| 2027 | 2 | 22,843 | 5.6% | 71,581 | 17.4% | $956,693 | 7.8% | $41.88 |
| 2028 | 4 | 74,035 | 18.0% | 145,616 | 35.5% | $3,285,860 | 26.9% | $44.38 |
| 2029 | 3 | 19,600 | 4.8% | 165,216 | 40.2% | $779,855 | 6.4% | $39.79 |
| 2030 | 0 | 0 | 0.0% | 165,216 | 40.2% | $0 | 0.0% | $0.00 |
| 2031 | 1 | 6,857 | 1.7% | 172,073 | 41.9% | $304,018 | 2.5% | $44.34 |
| 2032 | 1 | 57,357 | 14.0% | 229,430 | 55.9% | $2,542,621 | 20.8% | $44.33 |
| 2033 | 2 | 35,699 | 8.7% | 265,129 | 64.5% | $1,185,480 | 9.7% | $33.21 |
| 2034 | 2 | 4,225 | 1.0% | 269,354 | 65.6% | $269,745 | 2.2% | $63.84 |
| Thereafter | 3 | 22,801 | 5.6% | 292,155 | 71.1% | $1,290,855 | 10.6% | $56.61 |
| Vacant | 0 | 118,585 | 28.9% | 410,740 | 100.0% | $0 | 0.0% | $0.00 |
| Total/Weighted Average | 27 | 410,740 | 100.0% | $12,201,200 | 100.0% | $41.76 |
| (1) | Information obtained from the underwritten rent roll. |
| (2) | Certain tenants may have termination options that are not accounted for in the lease rollover schedule. |
| (3) | Annual U/W Base Rent and Annual U/W Base Rent PSF does not include vacant space. |
The following table presents historical occupancy percentages at the Cummins Station Property:
Historical Occupancy
12/31/2021(1) | 12/31/2022(1) | 12/31/2023(1) | 5/15/2024(2) |
| 86.2% | 82.4% | 80.1% | 71.1% |
| (1) | Information obtained from the borrower. |
| (2) | Information obtained from the underwritten rent roll. |
Market Overview and Competition. The Cummins Station Property is located in downtown Nashville, Tennessee. The property is located within a quarter mile of major thoroughfares including U.S. Route 41, U.S. Route 31, and U.S. Route 70, and within one mile of Interstate 40. Additionally, the property is within a half mile of Music City Center, Nashville’s new $600 million convention center, and Bridgestone Arena. Nashville is known for being a music recording and production hub with notable record labels, including Universal Music Group, Sony Music Entertainment, and Warner Music Group. Healthcare is also a primary industries with approximately 300 companies in the city, including the Hospital Corporation of America, the world’s largest private operator of hospitals. Additionally, Nashville is home to a number of Fortune 500 companies, including Bridgestone, Dell, Dollar General, Tractor Supply Company, and Nissan North America. Finally, Amazon and Oracle recently announced plans to invest in office space in Nashville and will be bringing approximately 5,000 and 8,500 jobs to the city, respectively.
● According to the appraisal, the 2023 population and average household income within a one-, three- and five-mile radius of the Cummins Station Property was 17,500, 123,212, 240,140 and $108,972, $104,783, and $108,554, respectively. Between 2010 and 2020, the population within a one-, three-, and five-mile radius increased by 82.2%, 23.4%, and 15.4%, respectively.
According to a third party market research report, the property is located in the Downtown submarket of the Nashville office market. As of May 2024, the submarket reported a total inventory of approximately 20.2 million SF with a 14.3% vacancy rate and average asking rent of $36.75 PSF.
| THE INFORMATION IN THIS STRUCTURAL AND COLLATERAL TERM SHEET IS NOT COMPLETE AND MAY BE AMENDED PRIOR TO THE TIME OF SALE. THIS TERM SHEET IS NOT AN OFFER TO SELL THESE SECURITIES AND IT IS NOT A SOLICITATION OF AN OFFER TO BUY THESE SECURITIES IN ANY JURISDICTION WHERE THE OFFER OR SALE IS NOT PERMITTED. | ||
| 120 | ||
| Office – CBD | Loan #11 | Cut-off Date Balance: | $25,000,000 | |
209 10th Avenue South Nashville, TN 37203 | Cummins Station | Cut-off Date LTV: U/W NCF DSCR: U/W NOI Debt Yield: | 58.8% 1.40x 10.2% |
The following table presents certain information relating to the appraiser’s market rent conclusions for the Cummins Station Property:
Market Rent Summary(1)
Office | No Windows | Retail | End Cap | Building Amenity or Support | |
| Market Rent (PSF) | $40.00 | $24.00 | $60.00 | $65.00 | $0.00 |
| Lease Term (Years) | 7 | 5 | 10 | 10 | 5 |
| Lease Type | NNN | NNN | NNN | NNN | None |
| Rent Increase Projection | 3%/annually | 3%/annually | 3%/annually | 3%/annually | None |
| (1) | Information obtained from the appraisal. |
The table below presents certain information relating to comparable sales pertaining to the Cummins Station Property identified by the appraiser:
Comparable Sales(1)
| Property Name | Location | Year Built | Rentable Area (SF) | Occupancy | Sale Date | Sale Price | Sale Price (PSF) |
| Cummins Station | Nashville, TN | 1910 | 410,740(2) | 71.1%(2) | |||
| Sylvan Supply | Nashville, TN | 1923 | 193,650 | 53.6% | Jan-2022 | $87,500,000 | $452 |
| 1 Music Circle South | Nashville, TN | 2019 | 107,880 | 95.0% | Oct-2022 | $55,200,000 | $512 |
| Stocking 51 Complex | Nashville, TN | 1920 | 124,315 | 100.0% | Apr-2022 | $58,000,000 | $467 |
| The Sheds on Charlotte | Nashville, TN | 1950 | 85,032 | 100.0% | Feb-2022 | $47,500,000 | $559 |
| Interlock | Atlanta, GA | 2021 | 336,463 | 89.0% | May-2023 | $215,000,000 | $639 |
| Hartland Plaza | Austin, TX | 1987 | 171,785 | 90.0% | Feb-2023 | $83,000,000 | $483 |
| (1) | Information obtained from the appraisal. |
| (2) | Information obtained from the underwritten rent roll. |
● The following table presents certain information relating to the appraiser’s market rent conclusions for the Cummins Station Property:
Comparable Office Properties(1)
| Property Name/Location | Total NRA (SF) | Year Built | Stories | % Occupied |
Cummins Station Nashville, TN | 410,740(2) | 1910 | 5 | 71.1%(2) |
The Roundabout Nashville, TN | 218,319 | 2004 | 9 | 58.9% |
L&C Tower Annex Nashville, TN | 264,046 | 1957 | 9 | 87.5% |
Truist Plaza Nashville, TN | 340,000 | 2007 | 13 | 80.8% |
Gulch Crossing Nashville, TN | 205,000 | 2015 | 8 | 100.0% |
CMT Building Nashville, TN | 175,440 | 1986 | 13 | 100.0% |
1801 West End Avenue Nashville, TN | 243,000 | 1986 | 18 | 79.2% |
| (1) | Information obtained from the appraisal. |
| (2) | Information obtained from the underwritten rent roll. |
| THE INFORMATION IN THIS STRUCTURAL AND COLLATERAL TERM SHEET IS NOT COMPLETE AND MAY BE AMENDED PRIOR TO THE TIME OF SALE. THIS TERM SHEET IS NOT AN OFFER TO SELL THESE SECURITIES AND IT IS NOT A SOLICITATION OF AN OFFER TO BUY THESE SECURITIES IN ANY JURISDICTION WHERE THE OFFER OR SALE IS NOT PERMITTED. | ||
| 121 | ||
| Office – CBD | Loan #11 | Cut-off Date Balance: | $25,000,000 | |
209 10th Avenue South Nashville, TN 37203 | Cummins Station | Cut-off Date LTV: U/W NCF DSCR: U/W NOI Debt Yield: | 58.8% 1.40x 10.2% |
Operating History and Underwritten Net Cash Flow. The following table presents certain information relating to the historical operating performance and underwritten net cash flow at the Cummins Station Property:
Cash Flow Analysis
| 2021 | 2022 | 2023 | TTM 03/31/2024 | U/W | %(1) | U/W $ per SF | |
| Base Rent | $11,529,469 | $10,218,153 | $10,475,526 | $10,706,829 | $12,201,200(2) | 53.4% | $29.71 |
| Grossed Up Vacant Space | 0 | 0 | 0 | 0 | 4,409,752 | 19.3 | 10.74 |
| Gross Potential Rent | $11,529,469 | $10,218,153 | $10,475,526 | $10,706,829 | $16,610,952 | 72.7% | $40.44 |
| Other Income | 260,183 | 29,722 | 99,027 | 137,142 | 137,142 | 0.6 | 0.33 |
| Parking/Garage/Other | 2,695,799 | 3,243,410 | 3,233,962 | 3,246,160 | 3,246,160 | 14.2 | 7.90 |
| Total Recoveries | 2,603,762 | 3,207,429 | 2,795,193 | 2,789,675 | 2,869,821 | 12.6 | 6.99 |
| Net Rental Income | $17,089,214 | $16,698,714 | $16,603,708 | $16,879,806 | $22,864,074 | 100% | $55.67 |
| (Vacancy & Credit Loss) | 0 | 0 | 0 | 0 | (4,409,752) | (26.5)(3) | (10.74) |
| Effective Gross Income | $17,089,214 | $16,698,714 | $16,603,708 | $16,879,806 | $18,454,322 | 80.7% | $44.93 |
| Real Estate Taxes | 1,567,731 | 1,307,943 | 1,015,040 | 1,015,040 | 1,015,040 | 5.5% | 2.47 |
| Insurance | 62,462 | 78,716 | 94,001 | 129,885 | 212,630 | 1.2 | 0.52 |
| Management Fee | 300,889 | 417,587 | 415,281 | 200,698 | 553,630 | 3.0 | 1.35 |
| Other Operating Expenses | 1,705,562 | 1,909,364 | 1,799,105 | 1,852,115 | 1,852,115 | 10.0 | 4.51 |
| Other Fixed Expense | 1,124,533 | 984,024 | 987,817 | 987,941 | 987,941 | 5.4 | 2.41 |
| Total Operating Expenses | $4,761,178 | $4,697,634 | $4,311,244 | $4,185,679 | $4,621,356 | 25.0% | $11.25 |
| Net Operating Income(4) | $12,328,036 | $12,001,080 | $12,292,464 | $12,694,127 | $13,832,966 | 75.0% | $33.68 |
| Replacement Reserves | 0 | 0 | 0 | 0 | 102,685 | 0.6 | 0.25 |
| TI/LC | 0 | 0 | 0 | 0 | 1,000,000 | 5.4 | 2.43 |
| Non-Recurring Items | 0 | 0 | 0 | 0 | (1,000,000)(4) | (5.4) | (2.43) |
| Net Cash Flow | $12,328,036 | $12,001,080 | $12,292,464 | $12,694,127 | $13,730,281 | 74.4% | $33.43 |
| NOI DSCR(5) | 1.26x | 1.23x | 1.26x | 1.30x | 1.41x | ||
| NCF DSCR(5) | 1.26x | 1.23x | 1.26x | 1.30x | 1.40x | ||
| NOI Debt Yield(5) | 9.1% | 8.9% | 9.1% | 9.4% | 10.2% | ||
| NCF Debt Yield(5) | 9.1% | 8.9% | 9.1% | 9.4% | 10.2% |
| (1) | Represents (i) percent of Net Rental Income for all revenue fields, (ii) percent of Gross Potential Rent for Vacancy & Credit Loss and (iii) percent of Effective Gross Income for all other fields. |
| (2) | U/W Base Rent shown above includes contractual rent steps through June 2025 totalling $346,699. |
| (3) | The underwritten economic vacancy is 26.5%. The Cummins Station Property was 71.1% leased as of May 15, 2024. |
| (4) | Represents a 10% credit for the upfront TI/LC reserve funds. |
| (5) | The NOI and NCF DSCR and NOI and NCF Debt Yields are based on the Cummins Station Whole Loan. |
| THE INFORMATION IN THIS STRUCTURAL AND COLLATERAL TERM SHEET IS NOT COMPLETE AND MAY BE AMENDED PRIOR TO THE TIME OF SALE. THIS TERM SHEET IS NOT AN OFFER TO SELL THESE SECURITIES AND IT IS NOT A SOLICITATION OF AN OFFER TO BUY THESE SECURITIES IN ANY JURISDICTION WHERE THE OFFER OR SALE IS NOT PERMITTED. | ||
| 122 | ||
| No. 12 – Hyatt Place Pittsburgh North Shore | |||||||
| Mortgage Loan Information | Mortgaged Property Information | ||||||
| Mortgage Loan Seller: | Wells Fargo Bank, National Association | Single Asset/Portfolio: | Single Asset | ||||
Credit Assessment (Fitch/KBRA/S&P): | NR/NR/NR | Property Type – Subtype: | Hospitality - Select Service | ||||
| Original Principal Balance: | $23,300,000 | Location: | Pittsburgh, PA | ||||
| Cut-off Date Balance: | $23,300,000 | Size: | 178 Rooms | ||||
| % of Initial Pool Balance: | 3.2% | Cut-off Date Balance Per Room: | $130,899 | ||||
| Loan Purpose: | Recapitalization | Maturity Date Balance Per Room: | $130,899 | ||||
| Borrower Sponsor: | Chatham Lodging, L.P. | Year Built/Renovated: | 2010/2018 | ||||
| Guarantor: | Chatham Lodging, L.P. | Title Vesting: | Fee | ||||
| Mortgage Rate: | 7.2890% | Property Manager: | Island Hospitality Management III, Inc. | ||||
| Note Date: | May 31, 2024 | Current Occupancy (As of): | 64.8% (4/30/2024) | ||||
| Seasoning: | 1 month | YE 2023 Occupancy: | 62.8% | ||||
| Maturity Date: | June 11, 2029 | YE 2022 Occupancy: | 63.8% | ||||
| IO Period: | 60 months | YE 2021 Occupancy: | 47.4% | ||||
| Loan Term (Original): | 60 months | YE 2020 Occupancy: | 35.5% | ||||
| Amortization Term (Original): | NAP | As-Is Appraised Value: | $40,700,000 | ||||
| Loan Amortization Type: | Interest Only | As-Is Appraised Value Per Room: | $228,652 | ||||
| Call Protection: | L(24),YM1(29),O(7) | As-Is Appraisal Valuation Date: | May 1, 2024 | ||||
| Lockbox Type: | Springing | Underwriting and Financial Information | |||||
| Additional Debt: | No | TTM NOI (4/30/2024): | $3,660,711 | ||||
| Additional Debt Type (Balance): | NAP | YE 2023 NOI: | $3,638,104 | ||||
| YE 2022 NOI: | $3,542,560 | ||||||
| YE 2021 NOI: | $1,776,098 | ||||||
| U/W Revenues: | $8,797,090 | ||||||
| U/W Expenses: | $5,158,015 | ||||||
| U/W NOI: | $3,639,075 | ||||||
| Escrows and Reserves | U/W NCF: | $3,287,191 | |||||
| Initial | Monthly | Cap | U/W DSCR based on NOI/NCF: | 2.11x / 1.91x | |||
| Taxes: | $67,830 | $33,915 | NAP | U/W Debt Yield based on NOI/NCF: | 15.6% / 14.1% | ||
| Insurance(1): | $0 | Springing | NAP | U/W Debt Yield at Maturity based on NOI/NCF: | 15.6% / 14.1% | ||
| FF&E Reserve(2): | $0 | $29,324 | NAP | Cut-off Date LTV Ratio: | 57.2% | ||
| Replacement Comfort Letter Reserve: | $7,500 | $0 | NAP | LTV Ratio at Maturity: | 57.2% | ||
| Low DSCR Reserve(3) | $0 | Springing | NAP | ||||
| Sources and Uses | |||||||
| Sources | Uses | ||||||
| Mortgage Loan Amount | $23,300,000 | 100.0% | Return of Equity | $22,800,130 | 97.9% | ||
| Closing Costs | 424,540 | 1.8 | |||||
| Upfront Escrows | 75,330 | 0.3 | |||||
| Total Sources | $23,300,000 | 100.0% | Total Uses | $23,300,000 | 100.0% | ||
| (1) | The Hyatt Place Pittsburgh North Shore Mortgage Loan (as defined below) documents do not require ongoing monthly insurance reserves; provided (i) no event of default is continuing, (ii) the borrower maintains insurance coverage for the Hyatt Place Pittsburgh North Shore Property (as defined below) as part of blanket or umbrella coverage reasonably approved by the lender, and (iii) the borrower provides the lender with evidence of the renewals of the insurance policies and paid receipts for the payment of the insurance premiums no later than 10 business days prior to the expiration dates of the policies. If such conditions are not satisfied, the Hyatt Place Pittsburgh North Shore Mortgage Loan documents require ongoing monthly deposits in an amount equal to 1/12th of the insurance premiums that the lender reasonably estimates will be payable during the next ensuing 12 months. |
| (2) | The Hyatt Place Pittsburgh North Shore Mortgage Loan documents require ongoing monthly deposits in an amount equal to 1/12 of 4% of the trailing 12-month underwritten revenue for the prior fiscal quarter, initially $29,324. |
| (3) | Borrower may elect to avoid the commencement of a Cash Trap Event Period caused solely as a result of a low DSCR event for a period of six months by depositing cash or a letter of credit in an amount equal to $478,692.00, as additional collateral for the payment and performance of borrower’s obligations under the Hyatt Place Pittsburgh North Shore Mortgage Loan (as defined below) documents. |
| THE INFORMATION IN THIS STRUCTURAL AND COLLATERAL TERM SHEET IS NOT COMPLETE AND MAY BE AMENDED PRIOR TO THE TIME OF SALE. THIS TERM SHEET IS NOT AN OFFER TO SELL THESE SECURITIES AND IT IS NOT A SOLICITATION OF AN OFFER TO BUY THESE SECURITIES IN ANY JURISDICTION WHERE THE OFFER OR SALE IS NOT PERMITTED. | ||
| 123 | ||
| Hospitality – Select Service | Loan #12 | Cut-off Date Balance: | $23,300,000 | |
| 260 North Shore Drive | Hyatt Place Pittsburgh North Shore | Cut-off Date LTV: | 57.2% | |
| Pittsburgh, PA 15212 | U/W NCF DSCR: | 1.91x | ||
| U/W NOI Debt Yield: | 15.6% |
The Mortgage Loan. The twelfth mortgage loan (the “Hyatt Place Pittsburgh North Shore Mortgage Loan”) is evidenced by a promissory note in the original principal amount of $23,300,000 secured by the borrower’s fee simple interest in the Hyatt Place Pittsburgh North Shore, a 178-room select service hotel located in Pittsburgh, Pennsylvania (the “Hyatt Place Pittsburgh North Shore Property”).
The Borrowers and Borrower Sponsors. The borrower is Chatham Pittsburgh HP LLC, a single-purpose, Delaware limited liability company with one independent director. Legal counsel to the borrower delivered a non-consolidation opinion in connection with the origination of the Hyatt Place Pittsburgh North Shore Mortgage Loan.
The borrower sponsor and non-recourse carveout guarantor is Chatham Lodging, L.P. Chatham Lodging, L.P. is a subsidiary of Chatham Lodging Trust, which is headquartered in West Palm Beach, Florida. Chatham Lodging Trust is a publicly traded real estate investment trust, focused primarily on investing in upscale, extended-stay hotels and premium branded, select-service hotels. As of 2024, the company owns 38 hotels totaling 5,735 rooms in 16 states and the District of Columbia.
The Property. The Hyatt Place Pittsburgh North Shore is a 7-story, 178-room, select-service hotel in Pittsburgh, Pennsylvania, operating under a franchise agreement with Hyatt Place Franchising, L.L.C. expiring on July 17, 2033. The Hyatt Place Pittsburgh North Shore Property offers amenities including a restaurant, lounge, fitness room, business center, indoor swimming pool and approximately 2,600 square feet of meeting space. The guestroom configuration consists of 106 king rooms, 54 queen/queen rooms, six ADA queen/queen rooms and 12 ADA king rooms. Each of the guestrooms features flat-screen television, telephone, desk with chair, dresser, nightstand(s) and a lounge chair. There is a small restaurant and lounge on the ground level as well as a 24/7 grab and go market.
Since 2013, the Sponsors have invested approximately $3.25 million ($18,258 per key) in capital improvements. The Hyatt Place Pittsburgh North Shore Property completed $1.56 million ($8,764 per key) renovation in 2018 which included updates of the public areas, carpet, wallpapers, painting and new mattresses. According to the appraisal, the sponsor plans to invest an additional $4.5 million ($25,281 per key) in 2026.
Market Overview and Competition. The Hyatt Place Pittsburgh North Shore Property is located in downtown Pittsburgh, just north of Allegheny River and in between Acrisure Stadium (home of the Pittsburgh Steelers) approximately 0.3 miles west and PNC Park (home of the Pittsburgh Pirates) approximately 0.2 miles east. Intestate 279 is located to the north.
According to the appraisal, the 2022 population within a one-, three- and five-mile radius of the Hyatt Place Pittsburgh North Shore Property was 14,485, 147,752 and 385,972, respectively. The average household income for the same one-, three- and five-mile radius was $98,841, $71,446 and $81,815, respectively.
According to a third-party research report, the property is located in the Pittsburgh CBD submarket. The research report did not identify any new hotels under construction. According to the appraisal, the demand segmentation in 2023 for the Hyatt Place Pittsburgh North Shore Property was 90% Transient and 10.0% meeting and group.
The table below presents certain information relating to comparable sales pertaining to the Hyatt Place Pittsburgh North Shore Property identified by the appraisal:
| Comparable Sales Summary(1) | |||||
Property Name | Location | Year Built | Rooms | Sale Date | Sale Price / Room |
| Springhill Suites Pittsburgh Bakery Square | 120 Bakery Square Boulevard Pittsburgh, PA | 2010 | 110 | 7/2022 | $225,909 |
| AC by Marriott | 1126 Smallman St Pittsburgh, PA | 2018 | 134 | 10/2022 | $253,731 |
| Homewood Suites – Strip District | 1410 Smallman St Pittsburgh, PA | 2015 | 150 | 5/2022 | $288,000 |
| Hyatt House Pittsburgh Southside | 2795 South Water Street Pittsburgh, PA | 2012 | 136 | 11/2022 | $161,765 |
| Residence Inn Pittsburgh University/Medical Center | 3896 Bigelow Boulevard Pittsburgh, PA | 2000 | 171 | 5/2022 | $186,257 |
| Courtyard Pittsburgh Shadyside | 5308 Liberty Ave Pittsburgh, PA | 2003 | 132 | 6/2021 | $155,303 |
| Residence Inn Philadelphia Langhorne | 15 Cabot Blvd E Langhorne, PA | 2007 | 100 | 1/2024 | $220,500 |
| (1) | Information obtained from the appraisal. |
| THE INFORMATION IN THIS STRUCTURAL AND COLLATERAL TERM SHEET IS NOT COMPLETE AND MAY BE AMENDED PRIOR TO THE TIME OF SALE. THIS TERM SHEET IS NOT AN OFFER TO SELL THESE SECURITIES AND IT IS NOT A SOLICITATION OF AN OFFER TO BUY THESE SECURITIES IN ANY JURISDICTION WHERE THE OFFER OR SALE IS NOT PERMITTED. | ||
| 124 | ||
| Hospitality – Select Service | Loan #12 | Cut-off Date Balance: | $23,300,000 | |
| 260 North Shore Drive | Hyatt Place Pittsburgh North Shore | Cut-off Date LTV: | 57.2% | |
| Pittsburgh, PA 15212 | U/W NCF DSCR: | 1.91x | ||
| U/W NOI Debt Yield: | 15.6% |
The following table presents certain information relating to the performance of the Hyatt Place Pittsburgh North Shore Property:
| Historical Occupancy, ADR, RevPAR(1)(2) | ||||||||||||
| Competitive Set(3) | Hyatt Place Pittsburgh North Shore Property | Penetration Factor | ||||||||||
| Year | Occupancy | ADR | RevPAR | Occupancy | ADR | RevPAR | Occupancy | ADR | RevPAR | |||
| 2021 | 49.2% | $138.98 | $68.44 | 47.4% | $165.08 | $78.28 | 96.3% | 118.8% | 114.4% | |||
| 2022 | 56.9% | $164.28 | $93.53 | 63.8% | $183.38 | $116.91 | 112.0% | 111.6% | 125.0% | |||
| 2023 | 57.3% | $164.49 | $94.29 | 62.6% | $191.12 | $119.62 | 109.2% | 116.2% | 126.9% | |||
| 4/30/2024 TTM(4) | 59.2% | $161.42 | $95.52 | 64.7% | $187.54 | $121.25 | 109.3% | 116.2% | 126.9% | |||
| (1) | The variances between the underwriting, the appraisal and industry report data with respect to occupancy, ADR and RevPAR at the Hyatt Place Pittsburgh North Shore Property are attributable to variances in reporting methodology and/or timing differences. |
| (2) | Data obtained from third-party hospitality research reports. |
| (3) | The competitive set consists of the following hotels: SpringHill Suites Pittsburgh North Shore, Hampton Inn & Suites Pittsburgh-Downtown, Fairfield Inn & Suites Pittsburgh Neville Island, Residence Inn Pittsburgh North Shore, Holiday Inn Express & Suites Pittsburgh North Shore and Red Roof Inn Pittsburgh. |
| (4) | TTM represents the trailing 12-month period ending April 30, 2024. |
The following table presents historical occupancy percentages at the Hyatt Place Pittsburgh North Shore Property:
Historical Occupancy(1)(2)
12/31/2020(3) | 12/31/2021(3) | 12/31/2022(3) | 12/31/2023 | 4/30/2024 |
| 35.5% | 47.4% | 63.8% | 62.8% | 64.8% |
| (1) | Information obtained from the borrowers. |
| (2) | The variances between the underwriting, the appraisal and industry report data with respect to occupancy at the Hyatt Place Pittsburgh North Shore Property are attributable to variances in reporting methodology and/or timing differences. |
| (3) | The increase in occupancy from 2020 to 2021 and 2021 to 2022 was primarily due to the effect of the novel coronavirus on the hospitality industry in 2020, and the recovery in 2021. |
| THE INFORMATION IN THIS STRUCTURAL AND COLLATERAL TERM SHEET IS NOT COMPLETE AND MAY BE AMENDED PRIOR TO THE TIME OF SALE. THIS TERM SHEET IS NOT AN OFFER TO SELL THESE SECURITIES AND IT IS NOT A SOLICITATION OF AN OFFER TO BUY THESE SECURITIES IN ANY JURISDICTION WHERE THE OFFER OR SALE IS NOT PERMITTED. | ||
| 125 | ||
| Hospitality – Select Service | Loan #12 | Cut-off Date Balance: | $23,300,000 | |
| 260 North Shore Drive | Hyatt Place Pittsburgh North Shore | Cut-off Date LTV: | 57.2% | |
| Pittsburgh, PA 15212 | U/W NCF DSCR: | 1.91x | ||
| U/W NOI Debt Yield: | 15.6% |
Operating History and Underwritten Net Cash Flow. The following table presents certain information relating to the historical operating performance and underwritten net cash flow at the Hyatt Place Pittsburgh North Shore Property:
Cash Flow Analysis(1)
| 2020(2) | 2021(2) | 2022(2) | 2023 | TTM 4/30/2024 | U/W | % of U/W Total Revenue(1) | U/W $ per Room | |
| Occupancy | 35.5% | 47.4% | 63.8% | 62.8% | 64.8% | 64.8% | ||
| ADR | $101.26 | $165.08 | $183.38 | $192.57 | $188.97 | $188.97 | ||
| RevPAR | $35.92 | $78.28 | $116.91 | $120.90 | $122.52 | $122.52 | ||
| Room Revenue | $2,340,153 | $5,085,761 | $7,595,475 | $7,854,929 | $7,981,979 | $7,960,170 | 90.5% | $44,720 |
| Food & Beverage Revenue | 130,058 | 185,689 | 297,578 | 311,140 | 327,618 | 327,618 | 3.7% | 1,841 |
| Miscellaneous Income | 218,947 | 325,242 | 449,014 | 495,271 | 509,302 | 509,302 | 5.8% | 2,861 |
| Total Revenue | $2,689,158 | $5,596,692 | $8,342,067 | $8,661,340 | $8,818,899 | $8,797,090 | 100.0% | $49,422 |
| Room Expense | 923,447 | 1,170,765 | 1,730,149 | 1,729,443 | 1,833,308 | 1,828,299 | 23.0% | 10,271 |
| Food & Beverage Expense | 70,475 | 122,206 | 145,975 | 158,409 | 140,797 | 140,797 | 43.0% | 791 |
| Other Department Expense | 7,639 | 7,709 | 7,088 | 6,017 | 8,194 | 8,194 | 1.6% | 46 |
| Total Department Expenses | $1,001,561 | $1,300,680 | $1,883,212 | $1,893,869 | $1,982,299 | $1,977,290 | 22.5% | $11,108 |
| Departmental Profit | $1,687,597 | $4,296,012 | $6,458,855 | $6,767,471 | $6,836,600 | $6,819,800 | 77.5% | $38,313 |
| Total Undistributed Expenses | $1,321,282 | $1,794,358 | $2,421,926 | $2,533,556 | $2,600,623 | $2,600,779 | 29.6% | $14,611 |
| Gross Operating Profit | $366,315 | $2,501,654 | $4,036,929 | $4,233,915 | $4,235,977 | $4,219,021 | 48.0% | $23,702 |
| Real Estate Taxes | 518,195 | 558,833 | 336,637 | 416,406 | 391,565 | 393,936 | 4.5% | 2,213 |
| Property Insurance | 113,222 | 166,724 | 157,732 | 179,405 | 183,701 | 186,010 | 2.1% | 1,045 |
| Total Operating Expenses | $631,417 | $725,557 | $494,369 | $595,811 | $575,266 | $579,946 | 6.6% | $3,258 |
| Net Operating Income | ($265,102) | $1,776,098 | $3,542,560 | $3,638,104 | $3,660,711 | $3,639,075 | 41.4% | $20,444 |
| FF&E | 0 | 0 | 0 | 0 | 0 | 351,884 | 4.0% | 1,977 |
| Net Cash Flow | ($265,102) | $1,776,098 | $3,542,560 | $3,638,104 | $3,660,711 | $3,287,191 | 37.4% | $18,467 |
| NOI DSCR | (0.15)x | 1.03x | 2.06x | 2.11x | 2.13x | 2.11x | ||
| NCF DSCR | (0.15)x | 1.03x | 2.06x | 2.11x | 2.13x | 1.91x | ||
| NOI DY | -1.1% | 7.6% | 15.2% | 15.6% | 15.7% | 15.6% | ||
| NCF DY | -1.1% | 7.6% | 15.2% | 15.6% | 15.7% | 14.1% |
| (1) | % of U/W Total Revenue for Room Expense, Food & Beverage Expense, and Other Department Expense are based on their corresponding revenue line items. All other line items represent percent of Total Revenue. |
| (2) | The increases in Occupancy and Net Operating Income year-over-year from 2020 to 2022 were due to the effects of the novel coronavirus on the hospitality industry in 2020 and the subsequent recovery in 2021 and 2022. |
| THE INFORMATION IN THIS STRUCTURAL AND COLLATERAL TERM SHEET IS NOT COMPLETE AND MAY BE AMENDED PRIOR TO THE TIME OF SALE. THIS TERM SHEET IS NOT AN OFFER TO SELL THESE SECURITIES AND IT IS NOT A SOLICITATION OF AN OFFER TO BUY THESE SECURITIES IN ANY JURISDICTION WHERE THE OFFER OR SALE IS NOT PERMITTED. | ||
| 126 | ||
| No. 13 – 324 West 125th Street | |||||||
| Mortgage Loan Information | Mortgaged Property Information | ||||||
| Mortgage Loan Seller: | Wells Fargo Bank, National Association | Single Asset/Portfolio: | Single Asset | ||||
Credit Assessment (Fitch/KBRA/Moody’s): | NR/NR/NR | Property Type – Subtype: | Mixed Use – Medical Office/Retail | ||||
| Original Principal Balance: | $23,000,000 | Location: | New York, NY | ||||
| Cut-off Date Balance: | $23,000,000 | Size: | 17,384 SF | ||||
| % of Initial Pool Balance: | 3.1% | Cut-off Date Balance Per SF: | $1,323.06 | ||||
| Loan Purpose: | Refinance | Maturity Date Balance Per SF: | $1,323.06 | ||||
| Borrower Sponsors: | Jeff Sutton, Riki Roth, Pauline Harari and Nissim Kafif | Year Built/Renovated: | 2016/NAP | ||||
| Guarantors: | Jeff Sutton, Riki Roth, Pauline Harari and Nissim Kafif | Title Vesting: | Fee | ||||
| Mortgage Rate: | 6.7050% | Property Manager: | Self-managed | ||||
| Note Date: | May 21, 2024 | Current Occupancy (As of): | 100.0% (4/1/2024) | ||||
| Seasoning: | 1 month | YE 2023 Occupancy: | 100.0% | ||||
| Maturity Date: | June 11, 2029 | YE 2022 Occupancy: | 100.0% | ||||
| IO Period: | 60 months | YE 2021 Occupancy: | 100.0% | ||||
| Loan Term (Original): | 60 months | As-Is Appraised Value: | $32,900,000 | ||||
| Amortization Term (Original): | NAP | As-Is Appraised Value Per SF: | $1,892.54 | ||||
| Loan Amortization Type: | Interest Only | As-Is Appraisal Valuation Date: | November 28, 2023 | ||||
| Call Protection: | L(25),D(26),O(9) | ||||||
| Lockbox Type: | Soft/Springing Cash Management | Underwriting and Financial Information | |||||
| Additional Debt: | None | TTM NOI (3/30/2024): | $1,995,112 | ||||
| Additional Debt Type (Balance): | NAP | YE 2023 NOI: | $1,948,711 | ||||
| YE 2022 NOI: | $2,017,613 | ||||||
| YE 2021 NOI: | $1,915,814 | ||||||
| U/W Revenues: | $2,247,278 | ||||||
| U/W Expenses: | $321,730 | ||||||
| U/W NOI: | $1,925,548 | ||||||
| U/W NCF: | $1,889,309 | ||||||
| Escrows and Reserves | U/W DSCR based on NOI/NCF: | 1.23x / 1.21x | |||||
| Initial | Monthly | Cap | U/W Debt Yield based on NOI/NCF: | 8.4% / 8.2% | |||
| Taxes: | $90,385 | $18,507 | NAP | U/W Debt Yield at Maturity based on NOI/NCF: | 8.4% / 8.2% | ||
| Insurance(1): | $0 | Springing | NAP | Cut-off Date LTV Ratio: | 69.9% | ||
| Replacement Reserve: | $0 | $217 | NAP | LTV Ratio at Maturity: | 69.9% | ||
| Sources and Uses | |||||||
| Sources | Uses | ||||||
| Loan amount | $23,000,000 | 93.7% | Loan Payoff | $22,979,935 | 93.6% | ||
| Borrower Equity | $1,555,966 | 6.3% | Closing Costs | $1,485,646 | 6.1% | ||
| Upfront Reserves | $90,385 | 0.4% | |||||
| Total Sources | $24,555,966 | 100.0% | Total Uses | $24,555,966 | 100.0% | ||
| (1) | Ongoing monthly reserves for insurance are not required as long as no event of default is continuing, the policies maintained by the borrower are part of a blanket or umbrella policy approved by the lender, and the borrower provides the lender with evidence of renewal of policies and paid receipts for the insurance premiums no later than 10 business days prior to the expiration dates of the policies. |
The Mortgage Loan. The mortgage loan (the “324 West 125th Street Mortgage Loan”) is evidenced by a promissory note in the original principal amount of $23,000,000 and secured by a first priority fee interest in a 17,384 square foot mixed-use – medical office/retail property located in New York, New York (the “324 West 125th Street Property”).
The Borrower and Borrower Sponsor. The borrower is 324 West 125th Street Owner, LLC, a Delaware limited liability company with one independent director. Legal counsel to the borrower delivered a non-consolidation opinion in connection with the origination of the 324 West 125th Street Mortgage Loan.
The non-recourse carveout guarantors and borrower sponsors are Jeff Sutton, Riki Roth, Pauline Harari & Nissim Kafif. Jeff Sutton is the founder of Wharton Properties, and has over 25 years of experience in real estate.
The Property. The 324 West 125th Street Property is a mixed-use medical office and retail property located in New York, NY totaling 17,384 SF. Built in 2016, the property is 2-stories, situated on a 0.21-acre site. As of April 1st, 2024, the 324 West 125th Street Property was 100.0% leased to 2 tenants: CVS Pharmacy occupies the entirety of the retail component totaling 7,637 of NRA (43.9%
| THE INFORMATION IN THIS STRUCTURAL AND COLLATERAL TERM SHEET IS NOT COMPLETE AND MAY BE AMENDED PRIOR TO THE TIME OF SALE. THIS TERM SHEET IS NOT AN OFFER TO SELL THESE SECURITIES AND IT IS NOT A SOLICITATION OF AN OFFER TO BUY THESE SECURITIES IN ANY JURISDICTION WHERE THE OFFER OR SALE IS NOT PERMITTED. | ||
| 127 | ||
| Mixed Use – Medical Office/Retail | Loan #13 | Cut-off Date Balance: | $23,000,000 | |
| 324 West 125th Street | 324 West 125th Street | Cut-off Date LTV: | 69.9% | |
| New York, NY 10027 | U/W NCF DSCR: | 1.21x | ||
| U/W NOI Debt Yield: | 8.4% |
of NRA) on the ground floor and cellar and ZP Radiology (“Zwanger-Pesiri Radiology”) occupies the entirety of the office component totaling 9,747 of NRA (56.1%) on 2nd Floor.
Major Tenants.
CVS Pharmacy (NA/Baa2/BBB by F/M/S&P; 7,637 SF; 43.9% of NRA; 54.9% of underwritten base rent). CVS Health Corporation provides health services in the United States. It operates through Health Care Benefits, Pharmacy Services, and Retail/LTC segments. The tenant has been at the property since May 15, 2018, on a 20-year term that expires May 31, 2038, with one 5-year renewal option remaining and no termination options. There are 10% escalations every 5 years.
Zwanger-Pesiri Radiology (9,747 SF; 56.1% of NRA; 45.1% of underwritten base rent). Zwanger-Pesiri Radiology specializes in imaging tests including X-rays, magnetic resonance imaging (MRI), and computed tomography (CT) scans. Founded in 1953, it is a privately held company with 22 locations in
New York. Zwanger-Pesiri Radiology has been a tenant since March 1, 2018, on a 20 year term that expires on February 28, 2038, and has one, 10-year renewal option remaining and no termination option. There is a 10% escalation every five years until the 11th year. Thereafter rent increased by 2.0% annually.
The following table presents certain information relating to the tenancy at the 324 West 125th Street Property:
Major Tenants(1)
| Tenant Name | Credit Rating (Fitch/ Moody’s/ | Tenant NRSF | % of NRSF | Annual U/W Base Rent PSF | Annual U/W Base Rent(3) | % of Total Annual U/W Base Rent(3) | Lease Expiration Date | Ext. Options | Term. Option (Y/N) |
| Major Tenants | |||||||||
| CVS Pharmacy | NR/Baa2/BBB | 7,637 | 43.9% | $164.24 | $1,254,300 | 54.9% | 5/31/2038 | 1, 5-year | N |
| ZP Radiology | NR/NR/NR | 9,747 | 56.1% | $105.63 | $1,029,600 | 45.1% | 2/28/2038 | 1, 10-year | N |
| 17,384 | 100.0% | $131.38 | $2,283,900 | 100.0% | |||||
| Occupied Collateral Total | 17,384 | 100.0% | $131.38 | $2,283,900 | 100.0% | ||||
| Vacant Space | 0 | 0.0% | |||||||
| Collateral Total | 17,384 | 100.0% | |||||||
| (1) | Information obtained from the underwritten rent roll dated April 1, 2024. |
| (2) | Certain ratings are those of the parent company, whether or not the parent company guarantees the lease. |
| (3) | Annual U/W Rent and Annual U/W Rent PSF include a straight-line average over the loan term totalling $25,300 for CVS Pharmacy through March of 2029 due to the investment grade nature of the tenant. |
| THE INFORMATION IN THIS STRUCTURAL AND COLLATERAL TERM SHEET IS NOT COMPLETE AND MAY BE AMENDED PRIOR TO THE TIME OF SALE. THIS TERM SHEET IS NOT AN OFFER TO SELL THESE SECURITIES AND IT IS NOT A SOLICITATION OF AN OFFER TO BUY THESE SECURITIES IN ANY JURISDICTION WHERE THE OFFER OR SALE IS NOT PERMITTED. | ||
| 128 | ||
| Mixed Use – Medical Office/Retail | Loan #13 | Cut-off Date Balance: | $23,000,000 | |
| 324 West 125th Street | 324 West 125th Street | Cut-off Date LTV: | 69.9% | |
| New York, NY 10027 | U/W NCF DSCR: | 1.21x | ||
| U/W NOI Debt Yield: | 8.4% |
The following table presents certain information relating to the lease rollover schedule at the 324 West 125th Street Property:
Lease Expiration Schedule(1)(2)
| Year Ending December 31, | No. of Leases Expiring | Expiring NRSF | % of Total NRSF | Cumulative Expiring NRSF | Cumulative % of Total NRSF | Annual U/W Base Rent | % of Total Annual U/W Base Rent | Annual U/W Base Rent PSF |
| MTM | 0 | 0 | 0.0% | 0 | 0.0% | $0 | 0.0% | $0.00 |
| 2024 | 0 | 0 | 0.0% | 0 | 0.0% | $0 | 0.0% | $0.00 |
| 2025 | 0 | 0 | 0.0% | 0 | 0.0% | $0 | 0.0% | $0.00 |
| 2026 | 0 | 0 | 0.0% | 0 | 0.0% | $0 | 0.0% | $0.00 |
| 2027 | 0 | 0 | 0.0% | 0 | 0.0% | $0 | 0.0% | $0.00 |
| 2028 | 0 | 0 | 0.0% | 0 | 0.0% | $0 | 0.0% | $0.00 |
| 2029 | 0 | 0 | 0.0% | 0 | 0.0% | $0 | 0.0% | $0.00 |
| 2030 | 0 | 0 | 0.0% | 0 | 0.0% | $0 | 0.0% | $0.00 |
| 2031 | 0 | 0 | 0.0% | 0 | 0.0% | $0 | 0.0% | $0.00 |
| 2032 | 0 | 0 | 0.0% | 0 | 0.0% | $0 | 0.0% | $0.00 |
| 2033 | 0 | 0 | 0.0% | 0 | 0.0% | $0 | 0.0% | $0.00 |
| 2034 | 0 | 0 | 0.0% | 0 | 0.0% | $0 | 0.0% | $0.00 |
| Thereafter | 2 | 17,384 | 100.0% | 17,384 | 100.0% | $2,283,900 | 100.0% | $131.38 |
| Vacant | 0 | 0 | 0.0% | 0 | 0.0% | $0 | 0.0% | $0.00 |
| Total/Weighted Average | 2 | 17,384 | 100.0% | $2,283,900 | 100.0% | $131.38 |
| (1) | Information obtained from the underwritten rent roll dated April 1, 2024. |
| (2) | Certain tenants may have lease termination options that are exercisable prior to the originally stated expiration date of the related lease and are not considered in the rollover schedule. |
The following table presents historical occupancy percentages at the 324 West 125th Street Property:
Historical Occupancy
12/31/2021(1) | 12/31/2022(1) | 12/31/2023(1) | 4/1/2024 (2) |
| 100.0% | 100.0% | 100.0% | 100.0% |
| (1) | Information obtained from the borrower. |
| (2) | Information obtained from the underwritten rent roll dated April 1, 2024. |
Market Overview and Competition. The 324 West 125th Street Property is located in Manhattan, New York within the Harlem neighborhood. Major employers in the area include JP Morgan Chase Co, Citi, ABM Industries, Pfizer, Carl Icahn, Philip Morris International, Omnicom Group, PwC, Alcoa and Marsh & McLennan.
According to the appraisal, the 324 West 125th Street Property is located within the Harlem/North Manhattan submarket of the Manhattan, NY retail market. As of the third quarter of 2023, the submarket reported total inventory of approximately 10.42 million SF with a 5.6% vacancy rate and average asking rent of $74.94 PSF. The appraiser concluded to market rents for the 324 West 125th Street Property ranging from $105.00 PSF for Upper Level to $180.00 PSF for Ground Floor Retail (see table below).
● The following table presents certain information relating to the appraiser’s market rent conclusions for the 324 West 125th Street Property:
Market Rent Summary(1)
| Ground Floor Retail | Upper Level | |
| Market Rent (PSF) | $180.00 | $105.00 |
| Lease Term (Years) | 10 | 10 |
Lease Type (Reimbursements) | Modified Gross | Modified Gross |
| Tenant Improvements (New / Renewal) | $100 / $50 | $25 / $10 |
| Leasing Commissions (New / Renewal) | 6% / 3% | 6% / 3% |
| (1) | Information obtained from the appraisal. |
| THE INFORMATION IN THIS STRUCTURAL AND COLLATERAL TERM SHEET IS NOT COMPLETE AND MAY BE AMENDED PRIOR TO THE TIME OF SALE. THIS TERM SHEET IS NOT AN OFFER TO SELL THESE SECURITIES AND IT IS NOT A SOLICITATION OF AN OFFER TO BUY THESE SECURITIES IN ANY JURISDICTION WHERE THE OFFER OR SALE IS NOT PERMITTED. | ||
| 129 | ||
| Mixed Use – Medical Office/Retail | Loan #13 | Cut-off Date Balance: | $23,000,000 | |
| 324 West 125th Street | 324 West 125th Street | Cut-off Date LTV: | 69.9% | |
| New York, NY 10027 | U/W NCF DSCR: | 1.21x | ||
| U/W NOI Debt Yield: | 8.4% |
The table below presents certain information relating to comparable sales pertaining to the 324 West 125th Street Property, as identified by the appraiser:
Comparable Sales(1)
Property Name | Location | Year Built/Renovated | Rentable Area (SF) | Occupancy(2) | Sale Date | Sale Price | Sale Price (PSF) |
| Retail Condominium | 300 West 122nd Street New York, NY 10027 | 2019/NAP | 17,553 | N/A | 7/2023 | $18,000,000 | $1,025 |
| 1905 Third Avenue | 1905 Third Avenue New York, NY 10029 | 1920/2020 | 10,113 | 100.0% | 2/2023 | $8,400,000 | $831 |
| 121 Greene Street | 121 Greene Street New York, NY 10012 | 1883/NAP | 7,131 | 100.0% | 12/2022 | $14,000,000 | $1,963 |
| 102 Greene Street | 102 Greene Street New York, NY 10012 | 1910/NAP | 9,336 | 100.0% | 10/2022 | $31,500,000 | $3,374 |
| 223-225 East 86th Street | 223-225 East 86th Street New York, NY 10028 | 1981/NAP | 5,542 | 0.0% | 8/2022 | $8,700,000 | $1,570 |
| 991 Third Avenue | 991 Third Avenue New York, NY 10022 | 2006/NAP | 4,960 | 100.0% | 6/2021 | $19,750,000 | $3,982 |
| (1) | Information obtained from the appraisal. |
| (2) | Occupancy at sale |
Operating History and Underwritten Net Cash Flow. The following table presents certain information relating to the historical operating performance and underwritten net cash flow at the 324 West 125th Street Property:
Cash Flow Analysis
| 2021 | 2022 | 2023 | TTM 3/30/2024 | U/W | %(1) | U/W $ per SF | |
| Base Rent | $2,050,000 | $2,050,000 | $2,195,083 | $2,246,869 | $2,169,705(2) | 91.9% | $124.81 |
| Grossed Up Vacant Space | 0 | 0 | 0 | 0 | 114,195 | 4.8 | 6.57 |
| Gross Potential Rent | $2,050,000 | $2,050,000 | $2,195,083 | $2,246,869 | $2,283,900 | 96.7% | $131.38 |
| Total Recoveries | 171,124 | 68,983 | 72,742 | 72,124 | 77,572 | 3.3 | 4.46 |
| Net Rental Income | $2,221,124 | $2,118,983 | $2,267,825 | $2,318,993 | $2,361,473 | 100.0% | $135.84 |
| (Vacancy & Credit Loss) | 0 | 0 | 0 | 0 | (114,195)(3) | (5.0) | (6.57) |
| Effective Gross Income | $2,221,124 | $2,118,983 | $2,267,826 | $2,318,993 | $2,247,278 | 95.2% | $129.27 |
| Real Estate Taxes(4) | 207,267 | 7,947 | 217,176 | 215,983 | 215,983 | 9.6 | 12.42 |
| Insurance | 22,873 | 25,466 | 32,463 | 32,463 | 32,463 | 1.4 | 1.87 |
| Management Fee | 66,634 | 63,569 | 68,035 | 69,570 | 67,418 | 3.0 | 3.88 |
| Other Operating Expenses | 8,536 | 4,387 | 1,441 | 5,865 | 5,865 | 0.3 | 0.34 |
| Total Operating Expenses | $305,310 | $101,370 | $319,115 | $323,881 | $321,729 | 14.3% | $18.51 |
| Net Operating Income | $1,915,814 | $2,017,613 | $1,948,711 | $1,995,112 | $1,925,548 | 85.7% | $110.77 |
| Replacement Reserves | 0 | 0 | 0 | 0 | 3,477 | 0.2 | 0.20 |
| TI/LC | 0 | 0 | 0 | 0 | 32,762 | 1.5 | 1.88 |
| Net Cash Flow | $1,915,814 | $2,017,613 | $1,948,711 | $1,995,112 | $1,889,309 | 84.1% | $108.68 |
| NOI DSCR | 1.23x | 1.29x | 1.25x | 1.28x | 1.23x | ||
| NCF DSCR | 1.23x | 1.29x | 1.25x | 1.28x | 1.21x | ||
| NOI Debt Yield | 8.3% | 8.8% | 8.5% | 8.7% | 8.4% | ||
| NCF Debt Yield | 8.3% | 8.8% | 8.5% | 8.7% | 8.2% |
| (1) | Represents (i) percent of Net Rental Income for all revenue fields, (ii) percent of Gross Potential Rent for Vacancy & Credit Loss and (iii) percent of Effective Gross Income for all other fields. |
| (2) | U/W Rent includes straight-line rent averaging credit over the remaining lease term for CVS due to the investment grade nature of the tenant. |
| (3) | The underwritten economic vacancy is 5.0%. The 324 West 125th Street Property was 100% occupied as of April 1, 2024. |
| (4) | The property entered into New York City’s Industrial and Commercial Abatement Program (ICAP) in tax year 2019/ 2020. For the first 15 years of the program, the property is entitled to 100% of the ICAP abatement (approximately $197,000) through tax year 2035/2036 (the loan matures 06.11.2029). The loan underwriting was based on actual 2023/2024 real estate taxes. |
| THE INFORMATION IN THIS STRUCTURAL AND COLLATERAL TERM SHEET IS NOT COMPLETE AND MAY BE AMENDED PRIOR TO THE TIME OF SALE. THIS TERM SHEET IS NOT AN OFFER TO SELL THESE SECURITIES AND IT IS NOT A SOLICITATION OF AN OFFER TO BUY THESE SECURITIES IN ANY JURISDICTION WHERE THE OFFER OR SALE IS NOT PERMITTED. | ||
| 130 | ||
| No. 14 – Park Parthenia | |||||||
| Mortgage Loan Information | Mortgaged Property Information | ||||||
| Mortgage Loan Seller: | BSPRT CMBS Finance, LLC | Single Asset/Portfolio: | Single Asset | ||||
| Credit Assessment (Fitch/KBRA/Moody’s): | Asf/AA+(sf)/Aaa(sf) | Property Type – Subtype: | Multifamily – Garden | ||||
| Original Principal Balance(1): | $22,500,000 | Location: | Northridge, CA | ||||
| Cut-off Date Balance(1): | $22,500,000 | Size: | 447 Units | ||||
| % of Initial Pool Balance: | 3.1% | Cut-off Date Balance Per Unit(1): | $72,707 | ||||
| Loan Purpose: | Refinance | Maturity Date Balance Per Unit(1): | $72,707 | ||||
| Borrower Sponsors: | Laisin Leung and David Leung | Year Built/Renovated: | 1962-1970 / NAP | ||||
| Guarantors: | Laisin Leung and David Leung | Title Vesting: | Fee | ||||
| Mortgage Rate: | 7.3900% | Property Manager: | Self-Managed | ||||
| Note Date: | May 29, 2024 | Current Occupancy (As of): | 99.8% (5/1/2024) | ||||
| Seasoning: | 1 month | YE 2023 Occupancy: | 98.1% | ||||
| Maturity Date: | June 6, 2029 | YE 2022 Occupancy: | 98.8% | ||||
| IO Period: | 60 months | YE 2021 Occupancy: | 98.1% | ||||
| Loan Term (Original): | 60 months | As-Is Appraised Value: | $98,000,000 | ||||
| Amortization Term (Original): | NAP | As-Is Appraised Value Per Unit: | $219,239 | ||||
| Loan Amortization Type: | Interest Only | As-Is Appraisal Valuation Date: | 4/19/2024 | ||||
| Call Protection(2): | L(25),D(31),O(4) | ||||||
| Lockbox Type: | Springing | ||||||
| Additional Debt: | Pari Passu | Underwriting and Financial Information | |||||
| Additional Debt Type (Balance): | $10,000,000 | TTM 3/31/2024 NOI: | $5,736,590 | ||||
| YE 2023 NOI: | $5,598,822 | ||||||
| YE 2022 NOI: | $5,739,062 | ||||||
| YE 2021 NOI: | $5,154,799 | ||||||
| U/W Revenues: | $8,409,067 | ||||||
| U/W Expenses: | $3,080,433 | ||||||
| U/W NOI: | $5,328,634 | ||||||
| Escrows and Reserves | U/W NCF: | $5,216,884 | |||||
| Initial | Monthly | Cap | U/W DSCR based on NOI/NCF(1): | 2.19x / 2.14x | |||
| Taxes: | $238,610 | $39,768 | NAP | U/W Debt Yield based on NOI/NCF(1): | 16.4% / 16.1% | ||
| Insurance: | $127,710 | $63,855 | NAP | U/W Debt Yield at Maturity based on NOI/NCF(1): | 16.4% / 16.1% | ||
| Replacement Reserve: | $0 | $9,313 | NAP | Cut-off Date LTV Ratio(1): | 33.2% | ||
| LTV Ratio at Maturity(1): | 33.2% | ||||||
| Sources and Uses | |||||||
| Sources | Uses | ||||||
| Whole Loan Amount(1) | $32,500,000 | 100.0% | Loan Payoff | $23,205,503 | 71.4% | ||
| Borrower Sponsors’ Equity | 8,491,604 | 26.1 | |||||
| Closing Costs | 436,572 | 1.3 | |||||
| Upfront Reserves | 366,320 | 1.1 | |||||
| Total Sources | $32,500,000 | 100.0% | Total Uses: | $32,500,000 | 100.0% | ||
| (1) | The Park Parthenia Mortgage Loan (as defined below) is part of the Park Parthenia Whole Loan (as defined below), which is comprised of two pari passu promissory notes with an aggregate original balance of $32,500,000. All statistical information related to the Cut-off Date Balance per Unit, Maturity Date Balance per Unit, U/W Debt Yield based on NOI/NCF, U/W Debt Yield at Maturity based on NOI/NCF, U/W DSCR based on NOI/NCF, Cut-off Date LTV Ratio and LTV Ratio at Maturity are based on the Park Parthenia Whole Loan. |
| (2) | Defeasance of the Park Parthenia Whole Loan is permitted at any time after two years after the closing date that includes the last note to be securitized. The assumed defeasance lockout period of 25 payments is based on the WFCM 2024-5C1 securitization trust closing in July 2024. |
The Mortgage Loan. The fourteenth largest mortgage loan (the “Park Parthenia Mortgage Loan”) is part of a whole loan (the “Park Parthenia Whole Loan”) evidenced by two pari passu promissory notes with an aggregate original principal balance of $32,500,000 secured by a first mortgage encumbering the borrower’s fee interest in a garden multifamily property in Northridge, California (the “Park Parthenia Property”). The Park Parthenia Mortgage Loan consists of the controlling Note A-1, which has an original principal balance of $22,500,000, has a Cut-off Date Balance of $22,500,000 and is being contributed to the WFCM 2024-5C1 trust. The non-controlling Note A-2 has an original principal balance of $10,000,000, has a Cut-off Date Balance of $10,000,000, and is expected to be contributed to a future transaction.
| THE INFORMATION IN THIS STRUCTURAL AND COLLATERAL TERM SHEET IS NOT COMPLETE AND MAY BE AMENDED PRIOR TO THE TIME OF SALE. THIS TERM SHEET IS NOT AN OFFER TO SELL THESE SECURITIES AND IT IS NOT A SOLICITATION OF AN OFFER TO BUY THESE SECURITIES IN ANY JURISDICTION WHERE THE OFFER OR SALE IS NOT PERMITTED. | ||
| 131 | ||
| Multifamily – Garden | Loan #14 | Cut-off Date Balance: | $22,500,000 | |
| 19100 Parthenia Street | Park Parthenia | Cut-off Date LTV: | 33.2% | |
| Northridge, CA 91324 | U/W NCF DSCR: | 2.14x | ||
| U/W NOI Debt Yield: | 16.4% |
Note Summary
| Notes | Original Balance | Cut-off Date Balance | Note Holder | Controlling Piece |
| A-1 | $22,500,000 | $22,500,000 | WFCM 2024-5C1 | Yes |
| A-2(1) | $10,000,000 | $10,000,000 | BSPRT CMBS Finance, LLC | No |
| Total | $32,500,000 | $32,500,000 |
| (1) | Expected to be contributed to one or more future securitization transactions or may otherwise be transferred at any time. |
The Property. The Park Parthenia Property is a 447-unit garden multifamily property located in Northridge, California, and constructed between 1962 and 1970. The completely gated community is comprised of 64 buildings, with 48 owned by the borrower sponsor, 5 owned by an affiliate of the borrower sponsor, and 11 owned by third-parties. Unit amenities include a balcony / patio, white appliances, carpet and vinyl flooring, mini blinds, and a wall AC unit. Community amenities include gated entry, a laundry room, pool, computer center, counseling center with resident services, and 601 parking spaces. The borrower sponsor has also invested approximately $3.9 million in various upgrades throughout the Park Parthenia Property between 2019 and 2023. The Park Parthenia Property comprises 85 one-bedroom units (19.0% of unit count), 271 two-bedroom units (60.6% of unit count), 67 three-bedroom units (15.0% of unit count), and 24 four-bedroom units (5.4% of unit count).
The following table presents certain information relating to the tenancy at the Park Parthenia Property:
Unit Mix Summary(1)
| Unit Type | Total No. of Units | Occupied Units | % of Total Units | Occupancy | Average Unit Size (SF) | Average Underwritten Monthly Rent per Unit(2) |
| 1 Bedroom | 85 | 84 | 19.0% | 98.8% | 656 | $1,421 |
| 2 Bedroom | 271(3) | 271(3) | 60.6% | 100.0% | 920 | $1,581 |
| 3 Bedroom | 67 | 67 | 15.0% | 100.0% | 1,143 | $1,868 |
| 4 Bedroom | 24 | 24 | 5.4% | 100.0% | 1,300 | $2,019 |
| Total/Wtd. Avg. | 447 | 446 | 100.0% | 99.8% | 924 | $1,617 |
| (1) | Based on the underwritten rent roll dated May 1, 2024. |
| (2) | Represents in-place rent for all occupied units, with the exception of the family center, management office, and model units. |
| (3) | Includes three units designated as family center, one unit designated as the management office, and one unit designated as the model unit, which do not pay any in-place rent. |
The following table presents historical occupancy percentages at the Park Parthenia Property:
Historical Occupancy
12/31/2021(1) | 12/31/2022(1) | 12/31/2023(1) | 5/1/2024(2) |
| 98.1% | 98.8% | 98.1% | 99.8% |
| (1) | Information obtained from the borrower sponsor. |
| (2) | Information obtained from the underwritten rent roll. |
Market Overview and Competition. The Park Parthenia Property is located in Northridge, California, within the Los Angeles County. Los Angeles County is ranked among the largest economies in the world and is home to the largest population by county in the United States with nearly 10.1 million residents, according to a third-party source. The city of Northridge is located in the San Fernando Valley district in the northern region of Los Angeles County, approximately 25.3 miles northwest of downtown Los Angeles. Several freeways cross over San Fernando Valley, most notably Interstate 405, U.S. Route 101, State Route 118, and Interstate 5. The Park Parthenia Property is located 0.9 miles from the Northridge Fashion Center and 1.4 miles southwest from the California State University Northridge campus.
According to a third-party market report, the 2023 population within a one-, three-, and five-mile radius of the Park Parthenia Property was 23,089, 230,051, and 560,264, respectively. Additionally, for the same period, the average household income within the same radii was $98,603, $101,085, and $103,973, respectively.
Submarket Information – According to a third-party market report, the Park Parthenia Property is located in the Granada Hills/ Northridge/ Reseda submarket within the Los Angeles apartment market. As of year-end 2023, the Granada Hills/ Northridge/ Reseda submarket reported a total inventory of approximately 17,621 units, with a 3.1% vacancy rate and average asking rental rate of $1,964 per month.
| THE INFORMATION IN THIS STRUCTURAL AND COLLATERAL TERM SHEET IS NOT COMPLETE AND MAY BE AMENDED PRIOR TO THE TIME OF SALE. THIS TERM SHEET IS NOT AN OFFER TO SELL THESE SECURITIES AND IT IS NOT A SOLICITATION OF AN OFFER TO BUY THESE SECURITIES IN ANY JURISDICTION WHERE THE OFFER OR SALE IS NOT PERMITTED. | ||
| 132 | ||
| Multifamily – Garden | Loan #14 | Cut-off Date Balance: | $22,500,000 | |
| 19100 Parthenia Street | Park Parthenia | Cut-off Date LTV: | 33.2% | |
| Northridge, CA 91324 | U/W NCF DSCR: | 2.14x | ||
| U/W NOI Debt Yield: | 16.4% |
Operating History and Underwritten Net Cash Flow. The following table presents certain information relating to the operating history and underwritten net cash flow at the Park Parthenia Property:
Cash Flow Analysis
| 2021 | 2022 | 2023 | TTM 3/31/2024 | U/W | %(1) | U/W $ per Unit | |
| Base Rent(2) | $7,672,052 | $8,305,751 | $8,359,355 | $8,438,994 | $8,675,548 | 98.1% | $19,408 |
| Bad Debt | 0 | 0 | 0 | 0 | 0 | 0.0 | 0 |
| Gross Potential Rent | $7,672,052 | $8,305,751 | $8,359,355 | $8,438,994 | $8,675,548 | 98.1% | $19,408 |
| Other Income | 125,083 | 141,842 | 157,935 | 167,297 | 167,297 | 1.9 | 374 |
| Net Rental Income | $7,797,135 | $8,447,593 | $8,517,290 | $8,606,291 | $8,842,845 | 100.0% | $19,783 |
| (Vacancy & Credit Loss) | (152,152) | (100,680) | (149,475) | (127,025) | (433,777)(3) | (5.0) | (970) |
| Effective Gross Income | $7,644,983 | $8,346,913 | $8,367,815 | $8,479,266 | $8,409,067 | 95.1% | $18,812 |
| Real Estate Taxes | 430,778 | 401,871 | 435,420 | 435,420 | 435,420 | 5.2 | 974 |
| Insurance | 350,499 | 411,763 | 426,396 | 426,396 | 766,259 | 9.1 | 1,714 |
| Management Fee | 229,349 | 250,407 | 251,034 | 254,378 | 252,272 | 3.0 | 564 |
| Other Operating Expenses | 1,479,558 | 1,543,810 | 1,656,143 | 1,626,482 | 1,626,482 | 19.3 | 3,639 |
| Total Operating Expenses | $2,490,184 | $2,607,851 | $2,768,993 | $2,742,676 | $3,080,433 | 36.6% | $6,891 |
| Net Operating Income | $5,154,799 | $5,739,062 | $5,598,822 | $5,736,590 | $5,328,634 | 63.4% | $11,921 |
| Capital Expenditures | 0 | 0 | 0 | 0 | 111,750 | 1.3 | 250 |
| Net Cash Flow | $5,154,799 | $5,739,062 | $5,598,822 | $5,736,590 | $5,216,884 | 62.0% | $11,671 |
| NOI DSCR(4) | 2.12x | 2.36x | 2.30x | 2.36x | 2.19x | ||
| NCF DSCR(4) | 2.12x | 2.36x | 2.30x | 2.36x | 2.14x | ||
| NOI Debt Yield(4) | 15.9% | 17.7% | 17.2% | 17.7% | 16.4% | ||
| NCF Debt Yield(4) | 15.9% | 17.7% | 17.2% | 17.7% | 16.1% | ||
| (1) | Represents (i) percent of Net Rental Income for all revenue fields, (ii) percent of Gross Potential Rent for Vacancy & Credit Loss and (iii) percent of Effective Gross Income for all other fields. |
| (2) | This takes into account 91 of the 447 total units which are rented by tenants holding Housing Authority of the City of Los Angeles Section 8 Voucher Program documentations and 418 of the 447 total units which are leased on a month-to-month basis. |
| (3) | The underwritten economic vacancy is 5.0%. The Park Parthenia Property was 99.8% physically occupied as of May 1, 2024. |
| (4) | All statistical information related to the NOI DSCR, NCF DSCR, NOI Debt Yield and NCF Debt Yield is based on the Park Parthenia Whole Loan. |
| THE INFORMATION IN THIS STRUCTURAL AND COLLATERAL TERM SHEET IS NOT COMPLETE AND MAY BE AMENDED PRIOR TO THE TIME OF SALE. THIS TERM SHEET IS NOT AN OFFER TO SELL THESE SECURITIES AND IT IS NOT A SOLICITATION OF AN OFFER TO BUY THESE SECURITIES IN ANY JURISDICTION WHERE THE OFFER OR SALE IS NOT PERMITTED. | ||
| 133 | ||
| No. 15 – 57-63 Orchard Street | |||||||
| Mortgage Loan Information | Mortgaged Property Information | ||||||
| Mortgage Loan Seller: | LMF Commercial, LLC | Single Asset/Portfolio: | Single Asset | ||||
Credit Assessment (Fitch/KBRA/S&P): | NR/NR/NR | Property Type – Subtype: | Mixed Use – Office/Retail/Multifamily | ||||
| Original Principal Balance: | $22,000,000 | Location: | New York, NY | ||||
| Cut-off Date Balance: | $22,000,000 | Size: | 55,200 SF | ||||
| % of Initial Pool Balance: | 3.0% | Cut-off Date Balance PSF: | $398.55 | ||||
| Loan Purpose: | Refinance | Maturity Date Balance PSF: | $398.55 | ||||
| Borrower Sponsors: | Joyce Jangana Reiss, Jenny Haim and Jack Jangana | Year Built/Renovated: | 1900, 1910, 1915/2023 | ||||
| Guarantors: | Joyce Jangana Reiss, Jenny Haim and Jack Jangana | Title Vesting: | Fee | ||||
| Mortgage Rate: | 7.2700% | Property Manager: | Self-Managed | ||||
| Note Date: | June 21, 2024 | Current Occupancy (As of)(4): | 100.0% (6/1/2024) | ||||
| Seasoning: | 0 months | YE 2023 Occupancy: | 95.0% | ||||
| Maturity Date: | July 6, 2029 | YE 2022 Occupancy: | 100.0% | ||||
| IO Period: | 60 months | YE 2021 Occupancy: | 95.0% | ||||
| Loan Term (Original): | 60 months | YE 2020 Occupancy: | NAP | ||||
| Amortization Term (Original): | NAP | As-Is Appraised Value: | $35,000,000 | ||||
| Loan Amortization Type: | Interest Only | As-Is Appraised Value PSF: | $634.06 | ||||
| Call Protection(1): | L(24),D(29),O(7) | As-Is Appraisal Valuation Date: | April 24, 2024 | ||||
| Lockbox Type: | Springing/Springing Cash Management | Underwriting and Financial Information | |||||
| Additional Debt: | No | TTM NOI (4/30/2024): | $1,911,195 | ||||
| Additional Debt Type (Balance): | NAP | YE 2023 NOI: | $1,720,443 | ||||
| YE 2022 NOI: | $1,396,162 | ||||||
| YE 2021 NOI: | $1,190,573 | ||||||
| U/W Revenues: | $2,847,638 | ||||||
| U/W Expenses: | $704,792 | ||||||
| U/W NOI: | $2,142,846 | ||||||
| Escrows and Reserves | U/W NCF: | $2,085,589 | |||||
| Initial | Monthly | Cap | U/W DSCR based on NOI/NCF: | 1.32x / 1.29x | |||
| Taxes | $73,393 | $35,092 | NAP | U/W Debt Yield based on NOI/NCF: | 9.7% / 9.5% | ||
| Insurance | $21,875 | $6,944 | NAP | Cut-off Date LTV Ratio: | 62.9% | ||
| TI/LC Reserve | $400,000 | Springing | $400,000(2) | LTV Ratio at Maturity: | 62.9% | ||
| Immediate Repairs | $58,795 | $0 | NAP | ||||
| Replacement Reserve | $0 | $880(3) | $31,671 | ||||
| Sources and Uses | |||||||
| Sources | Uses | ||||||
| Whole Loan Amount | $22,000,000 | 97.8% | Loan Payoff | $20,847,309 | 92.7% | ||
| Borrower Equity | 487,774 | 2.2 | Closing Costs | 1,086,103 | 4.8 | ||
| Upfront Reserves | 554,362 | 2.5 | |||||
| Total Sources | $22,487,774 | 100.0% | Total Uses | $22,487,774 | 100.0% | ||
| (1) | The borrower will have the right at any time on and after August 6, 2026 and prior to January 6, 2029 to obtain the release of a portion of the 57-63 Orchard Street Property (as defined below) located at 57 Orchard Street, as long as, among other conditions, (i) the borrower partially defeases the 57-63 Orchard Street Mortgage Loan (as defined below) in an amount equal to the release price of 110% of $3,500,000; (ii) no event of default has occurred and is continuing; (iii) the DSCR after the release is not less than the greater of (1) 1.29x and (2) the DSCR immediately preceding such release; (iv) the LTV ratio after the release is not greater than the lesser of (1) 63.6%, and (2) the LTV ratio immediately preceding such release. |
| (2) | The 57-63 Orchard Street Property Mortgage Loan (as defined below) is structured with an upfront TI/LC reserve of $400,000, as well as an ongoing TI/LC collection of $3,891.67 per month or $1.00 per square foot per year, subject to a cap of $400,000. Commencing two years after the loan origination date, the TI/LC reserve cap will be reduced to $300,000, subject to, among other conditions, that the borrower has re-leased at least 70% of the commercial leases that expire before the loan term, for a minimum of 3 years. |
| (3) | The borrower is not required to make monthly deposits into the monthly replacement reserve account during such times that the balance in the replacement reserve account exceeds $31,671. |
| (4) | Occupancy is based on the total NRSF of 55,200 comprising both the commercial component and the multifamily component of the 57-63 Orchard Street Property (as defined below). |
The Mortgage Loan. The mortgage loan (the “57-63 Orchard Street Mortgage Loan”) is evidenced by a single promissory note in the original principal amount of $22,000,000 and secured by a first priority fee mortgage encumbering a mixed-use office, retail and multifamily building located in New York, New York (the “57-63 Orchard Street Property”).
| THE INFORMATION IN THIS STRUCTURAL AND COLLATERAL TERM SHEET IS NOT COMPLETE AND MAY BE AMENDED PRIOR TO THE TIME OF SALE. THIS TERM SHEET IS NOT AN OFFER TO SELL THESE SECURITIES AND IT IS NOT A SOLICITATION OF AN OFFER TO BUY THESE SECURITIES IN ANY JURISDICTION WHERE THE OFFER OR SALE IS NOT PERMITTED. | ||
| 134 | ||
| Mixed Use – Office/Retail/Multifamily | Loan #15 | Cut-off Date Balance: | $22,000,000 | |
57 – 63 Orchard Street New York, NY 10002
| 57 – 63 Orchard Street | Cut-off Date LTV: U/W NCF DSCR: U/W NOI Debt Yield: | 62.9% 1.29x 9.7% |
The Borrowers and Borrower Sponsors. The borrower is Orchard Street Equities LLC, a single-purpose, New York limited liability company with one independent director. The borrower sponsors and non-recourse carveout guarantors are Jack Jangana, Jenny Haim and Joyce Jangana Reiss.
Jack Jangana, Jenny Haim and Joyce Jangana Reiss are owners of Continental Equities Group, a privately held real estate developer and operator of both residential and commercial properties located in lower Manhattan. From adaptive reuse and existing asset repositions to ground-up development, Continental Equities Group utilizes a diverse set of capabilities, and a regimented and planned approach to maximize value.
The borrower sponsors disclosed a default on two loans made in 2016 and 2019. For additional information please see “Description of the Mortgage Pool - Loan Purpose; Default History, Bankruptcy Issues and Other Proceedings” in the Preliminary Prospectus.
The Property. The 57-63 Orchard Street Property is comprised of three, two- and five- story buildings located in New York, New York at the intersection of Orchard Street and Grand Street in the Lower East Side are in Manhattan. Built in stages in 1900, 1910 and 1915 and situated on a 0.28-acre site, the 57-63 Orchard Street Property features 46,700 square feet of commercial space (32,946 square feet of office, and 13,754 square feet of retail) and 3 multifamily units (8,500 square feet). As of June 1, 2024, the 57-63 Orchard Street Property was 100.0% leased.
Office
The 57-63 Orchard Street Property includes 32,946 square feet of office space (the “Office Component”) comprising 59.7% of net rentable area and 45.3% of underwritten base rent. Tenant suites range in size from 1,168 square feet to 5,141 square feet. As of June 1, 2024, the Office Component is 100.0% leased to 11 tenants.
Retail
The 57-63 Orchard Street Property includes 13,754 square feet of retail space (the “Retail Component” and, together with the Office Component, the “Commercial Component”) comprising 84.6% of net rentable area and 94.9% of underwritten base rent. The largest tenants include Artists & Fleas, Alpha Industries, Tilit NYC, Lynch Eisinger Design and Juan Miguel Carrion Cententero. As of June 1, 2024, the Retail Component is 100.0% leased to 10 tenants, with Goldstar Printing Corporation occupying 2 spaces. At origination, the lender reserved $400,000 for non-tenant specific TI/LCs.
Multifamily
The 57-63 Orchard Street Property includes 3 multifamily units totaling 8,500 square feet (the “Multifamily Component”) comprising 15.4% of net rentable area and 5.1% of underwritten base rent. Units feature wood flooring, open floorplans, two kitchens and vaulted ceilings. In total, there are 3 loft units with unit size averaging 2,833 square feet. As of June 1, 2024, the Multifamily Component was 100.0% leased.
Major Tenants.
Artists & Fleas (5,141 square feet, 11.0% of commercial NRA, 5.6% underwritten commercial base rent). Artists & Fleas pays a current base rent of $30.34 per square foot, on a modified gross basis. Artists & Fleas has been a tenant at the 57-63 Orchard Street property since 2022 and has a lease expiration of May 31, 2025, with no renewal options remaining. Founded in 2003, Artists & Fleas is a marketplace of creators, designers, collectors, and curators. Shop Extraordinary Enterprises, the parent company of Artists & Fleas, was founded with a mission to cultivate retail environments that empower entrepreneurs, celebrate creativity, and foster meaningful human connections.
Alpha Industries (5,084 square feet, 10.9% of commercial NRA; 6.4% of underwritten commercial base rent). Alpha Industries pays a current base rent of $33.81 per square foot, on a modified gross basis, with annual rent escalations of 3.0%, commencing November 1, 2021, with a lease expiration date of October 31, 2025, and two, one-year renewal options remaining. Alpha Industries, established in 1959 in Knoxville, Tennessee, is an American clothing manufacturer. Originally serving as a contractor for the United States military, the company expanded its operations to become a global vendor of American military-style and fashion apparel. Alpha Industries has the right to terminate the lease if governmental authorities, including the New York City Department of Buildings, prohibit the operation of the property as an office. The current zoning permits office use.
Tilit NYC (5,047 square feet;10.8% of commercial NRA; 6.9% of underwritten commercial base rent). Tilit NYC pays a current base rent of $35.02 per square foot, on a modified gross basis. Tilit NYC has been a tenant at the 57-63 Orchard property since 2017 and has a lease expiration date of December 31, 2026, with one, one-year renewal option remaining. Tilit NYC is a renowned workwear brand focusing on the hospitality sector that services chefs, cooks, servers, bartenders, baristas, home cooks, and others. Tilit NYC offers a range of functional and durable garments including stylish work shirts, chef coats, jumpsuits, tees, pants, overalls, aprons, and various accessories tailored to meet the needs of professionals in the industry.
| THE INFORMATION IN THIS STRUCTURAL AND COLLATERAL TERM SHEET IS NOT COMPLETE AND MAY BE AMENDED PRIOR TO THE TIME OF SALE. THIS TERM SHEET IS NOT AN OFFER TO SELL THESE SECURITIES AND IT IS NOT A SOLICITATION OF AN OFFER TO BUY THESE SECURITIES IN ANY JURISDICTION WHERE THE OFFER OR SALE IS NOT PERMITTED. | ||
| 135 | ||
| Mixed Use – Office/Retail/Multifamily | Loan #15 | Cut-off Date Balance: | $22,000,000 | |
57 – 63 Orchard Street New York, NY 10002
| 57 – 63 Orchard Street | Cut-off Date LTV: U/W NCF DSCR: U/W NOI Debt Yield: | 62.9% 1.29x 9.7% |
The following table presents certain information relating to the tenancy at the 57-63 Orchard Street Property:
Commercial Major Tenants
| Tenant Name (Property) | Credit Rating (Fitch/ Moody’s/ | Tenant NRSF | % of SF(1) | Annual U/W Base Rent PSF(2) | Annual U/W Base Rent(2) | % of Total Annual U/W Base Rent(1) | Lease Expiration Date | Extension Options | Termination Option (Y/N) |
| Major Tenants | |||||||||
| Artists & Fleas | NR/NR/NR | 5,141 | 11.0% | $30.34 | $156,000 | 5.6% | 5/31/2025 | NAP | N |
| Alpha Industries | NR/NR/NR | 5,084 | 10.9% | $34.82 | $177,024 | 6.4% | 10/31/2025 | 2, 1 year | Y(3) |
| Tilit NYC | NR/NR/NR | 5,047 | 10.8% | $37.61 | $189,816 | 6.9% | 12/31/2026 | 1, 1 year | N |
| Lynch Eisinger Design | NR/NR/NR | 2,836 | 6.1% | $42.31 | $120,000 | 4.3% | 2/28/2026 | NAP | N |
| Juan Miguel Carrion Cententero | NR/NR/NR | 2,819 | 6.0% | $48.10 | $135,600 | 4.9% | 12/31/2024 | NAP | Y(4) |
| Total Major Tenants | 20,927 | 44.8% | $37.20 | $778,440 | 28.2% | ||||
| Non-Major Tenant(4) | 25,773 | 55.2% | $77.03 | $1,985,278 | 71.8% | ||||
| Occupied Collateral Total | 46,700 | 100.0% | $59.18 | $2,763,718 | 100.0% | ||||
| Vacant Space | 0 | 0.0% | |||||||
| Collateral Total | 46,700 | 100.0% | |||||||
| (1) | Represents the % of NRSF based on the total net rental area for the Commercial Component and the % of Total Annual U/W Base Rent for the Commercial Component. |
| (2) | Annual U/W Base Rent PSF and Annual U/W Base Rent include contractual rent steps through June 2025 totalling $74,528. |
| (3) | Alpha Industries has the right to terminate the lease if governmental authorities, including the New York City Department of Buildings, prohibit the operation of the 57-63 Orchard Street Property as an office. The current zoning permits office use. |
| (4) | Juan Miguel Carrion Cententero has the right to terminate its lease at any time by giving 60 days prior written notice. |
The following table presents certain information relating to the Commercial Component lease rollover schedule at the 57-63 Orchard Street Property:
Lease Expiration Schedule(1)(2)(3)
| Year | No. of Leases Expiring | Expiring NRSF | % of Total NRSF | Cumulative Expiring NRSF | Cumulative % of Total NRSF | Annual U/W Base Rent | % of Total Annual U/W Base Rent | Annual U/W Base Rent PSF |
| MTM | 0 | 0 | 0.0% | 0 | 0.0% | $0 | 0.0% | $0.00 |
| 2024 | 4 | 6,484 | 13.9% | 6,484 | 13.9% | $525,000 | 19.0% | $80.97 |
| 2025 | 9 | 23,417 | 50.1% | 29,901 | 64.0% | $1,180,392 | 42.7% | $50.41 |
| 2026 | 2 | 7,883 | 16.9% | 37,784 | 80.9% | $309,816 | 11.2% | $39.30 |
| 2027 | 2 | 3,280 | 7.0% | 41,064 | 87.9% | $235,800 | 8.5% | $71.89 |
| 2028 | 3 | 4,410 | 9.4% | 45,474 | 97.4% | $446,710 | 16.2% | $101.29 |
| 2029 | 1 | 1,226 | 2.6% | 46,700 | 100.0% | $66,000 | 2.4% | $53.83 |
| 2030 | 0 | 0 | 0.0% | 46,700 | 100.0% | $0 | 0.0% | $0.00 |
| 2031 | 0 | 0 | 0.0% | 46,700 | 100.0% | $0 | 0.0% | $0.00 |
| 2032 | 0 | 0 | 0.0% | 46,700 | 100.0% | $0 | 0.0% | $0.00 |
| 2033 | 0 | 0 | 0.0% | 46,700 | 100.0% | $0 | 0.0% | $0.00 |
| 2034 | 0 | 0 | 0.0% | 46,700 | 100.0% | $0 | 0.0% | $0.00 |
| Thereafter | 0 | 0 | 0.0% | 46,700 | 100.0% | $0 | 0.0% | $0.00 |
| Vacant | 0 | 0 | 0.0% | 46,700 | 100.0% | $0 | 0.0% | $0.00 |
| Total/Weighted Average | 21 | 46,700 | 100.0% | $2,763,718 | 100.0% | $59.18 |
| (1) | Information obtained from the underwritten rent roll. |
| (2) | Certain tenants may have lease termination options that are exercisable prior to the originally stated expiration date of the subject lease and that are not considered in the Lease Expiration Schedule. |
| (3) | Represents lease expiration information related to the Commercial Component at the 57-63 Orchard Street Property and excludes the Multifamily Component, which comprises 8,500 square feet of the net rentable area and $148,500 of Annual U/W Base Rent |
| THE INFORMATION IN THIS STRUCTURAL AND COLLATERAL TERM SHEET IS NOT COMPLETE AND MAY BE AMENDED PRIOR TO THE TIME OF SALE. THIS TERM SHEET IS NOT AN OFFER TO SELL THESE SECURITIES AND IT IS NOT A SOLICITATION OF AN OFFER TO BUY THESE SECURITIES IN ANY JURISDICTION WHERE THE OFFER OR SALE IS NOT PERMITTED. | ||
| 136 | ||
| Mixed Use – Office/Retail/Multifamily | Loan #15 | Cut-off Date Balance: | $22,000,000 | |
57 – 63 Orchard Street New York, NY 10002
| 57 – 63 Orchard Street | Cut-off Date LTV: U/W NCF DSCR: U/W NOI Debt Yield: | 62.9% 1.29x 9.7% |
The following table presents historical occupancy percentages at the 57-63 Orchard Street Property:
Combined Historical Occupancy
12/31/2021(1) | 12/31/2022(1) | 12/31/2023(1) | 6/1/2024(2) |
| 95.0% | 100.0% | 95.0% | 100.0% |
| (1) | Information obtained from the borrower. |
| (2) | Information obtained from the underwritten rent roll. |
Operating History and Underwritten Net Cash Flow. The following table presents certain information relating to the operating history and underwritten net cash flow at the 57-63 Orchard Street Property:
Cash Flow Analysis
| 2021 | 2022 | 2023 | TTM 4/30/2024 | U/W | %(1) | U/W $ per SF(2) | |
| Commercial Base Rent | $1,584,875 | $1,827,729 | $2,181,886 | $2,372,520 | $2,689,190 | 89.7% | $48.72 |
| Multifamily Base Rent | 148,500 | 148,500 | 148,500 | 148,500 | 148,500 | 5.0 | 2.69 |
| Commercial Rent Steps | 0 | 0 | 0 | 0 | 74,528 | 2.5 | 1.35 |
| Gross Potential Rent | $1,733,375 | $1,976,229 | $2,330,386 | $2,521,020 | $2,912,218(3) | 97.2% | $52.76 |
| Tax/Utility Reimbursement | 0 | 0 | 0 | 0 | 85,296 | 2.8 | 1.55 |
| Other Income | 0 | 0 | 0 | 0 | 0 | 0.0 | 0.0 |
| Net Rental Income | $1,733,375 | $1,976,229 | $2,330,386 | $2,521,020 | $2,997,514 | 100.0% | $54.30 |
| (Vacancy & Credit Loss) | 0 | 0 | 0 | 0 | (149,876) | (5.0)(4) | (2.72) |
| Effective Gross Income | $1,733,375 | $1,976,229 | $2,330,386 | $2,521,020 | $2,847,638 | 95.0% | $51.59 |
| Real Estate Taxes | 355,639 | 414,737 | 427,389 | 427,389 | 421,100 | 14.8 | 7.63 |
| Insurance | 83,444 | 64,275 | 74,238 | 80,653 | 83,312 | 2.9 | 1.51 |
| Repairs & Maintenance | 25,906 | 24,340 | 26,578 | 26,659 | 26,659 | 0.9 | 0.48 |
| Management Fee | 0 | 0 | 0 | 0 | 71,191 | 2.5 | 1.29 |
| Utilities | 71,118 | 67,947 | 73,406 | 68,209 | 68,209 | 2.4 | 1.24 |
| General & Administrative | 6,695 | 8,768 | 8,332 | 6,915 | 6,915 | 0.2 | 0.13 |
| Payroll | 0 | 0 | 0 | 0 | 27,406 | 1.0 | 0.50 |
| Total Operating Expenses | $542,802 | $580,067 | $609,943 | $609,825 | $704,792 | 24.8% | $12.77 |
| Net Operating Income | $1,190,573 | $1,396,162 | $1,720,443 | $1,911,195 | $2,142,846 | 75.2% | $38.82 |
| Tenant Improvements | 0 | 0 | 0 | 0 | 23,350 | 0.8 | 0.50 |
| Leasing Commissions | 0 | 0 | 0 | 0 | 23,350 | 0.8 | 0.50 |
| Replacement Reserves (Multifamily) | 0 | 0 | 0 | 0 | 750 | 0.0 | 250 |
| Replacement Reserves (Commercial) | 0 | 0 | 0 | 0 | 9,807 | 0.3 | 0.21 |
| Net Cash Flow | $1,190,573 | $1,396,162 | $1,720,443 | $1,911,195 | $2,085,589 | 73.2% | $37.78 |
| NOI DSCR | 0.73x | 0.86x | 1.06x | 1.18x | 1.32x | ||
| NCF DSCR | 0.73x | 0.86x | 1.06x | 1.18x | 1.29x | ||
| NOI Debt Yield | 5.4% | 6.3% | 7.8% | 8.7% | 9.7% | ||
| NCF Debt Yield | 5.4% | 6.3% | 7.8% | 8.7% | 9.5% |
| (1) | Represents (i) percent of Net Rental Income for all revenue fields and (ii) percent of Effective Gross Income for all other fields. |
| (2) | Represents (i) U/W $ per PSF based on the combined commercial and multifamily net rentable square feet, except for Tenant Improvements, Leasing Commissions and Replacement Reserves (Commercial), which are calculated based on the total commercial square feet of 46,700, and, Replacement Reserves (Multifamily), which is calculated on a per unit basis. |
| (3) | Includes contractual rent steps through June 2025 totalling $74,528. |
| (4) | The underwritten economic vacancy is 5.0%. The Commercial Component of the 57-63 Orchard Street Property was 100.0% leased as of June 1, 2024, and the Multifamily Component of the 57-63 Orchard Street Property was 100.0% leased as of June 1, 2024. |
| THE INFORMATION IN THIS STRUCTURAL AND COLLATERAL TERM SHEET IS NOT COMPLETE AND MAY BE AMENDED PRIOR TO THE TIME OF SALE. THIS TERM SHEET IS NOT AN OFFER TO SELL THESE SECURITIES AND IT IS NOT A SOLICITATION OF AN OFFER TO BUY THESE SECURITIES IN ANY JURISDICTION WHERE THE OFFER OR SALE IS NOT PERMITTED. | ||
| 137 | ||
| Mixed Use – Office/Retail/Multifamily | Loan #15 | Cut-off Date Balance: | $22,000,000 | |
57 – 63 Orchard Street New York, NY 10002
| 57 – 63 Orchard Street | Cut-off Date LTV: U/W NCF DSCR: U/W NOI Debt Yield: | 62.9% 1.29x 9.7% |
Appraisal. The appraisal concluded to an “as is” appraised value for the 57-63 Orchard Street Property of $33,000,000 as of April 24, 2024.
Environmental Matters. According to the Phase I environmental site assessment dated April 25, 2024, there was no evidence of any recognized environmental conditions at the 57-63 Orchard Street Property.
Market Overview and Competition. The 57-63 Orchard Street Property is located in New York City, New York, in the Lower East Side neighborhood of Manhattan. The Lower East Side of New York City encompasses much of lower Manhattan and its east side neighborhoods below 14th Street. Orchard Street provides access to the Manhattan Bridge, located less than 0.5 miles south of the 57-63 Orchard Street Property, via Canal Street. Additionally, the Brooklyn Bridge is located approximately 1.5 miles southeast of the 57-63 Orchard Street Property. There are numerous MTA bus stops located within half a mile of the 57-63 Orchard Street Property, including one immediately adjacent to the 57-63 Orchard Street Property at the corner of Allen Street and Grand Street. The nearest subway stations include Grand Street (197 feet away) and East Broadway (0.3 miles southeast). Additionally, the area is served by LaGuardia International Airport, Newark Liberty International Airport, and John F. Kennedy International Airport, located 8.3 miles northeast, 12.5 miles southwest and 15.8 miles southeast of the 57-63 Orchard Street Property, respectively. Attractions and landmarks on the Lower East Side include The Tenement Museum, The Essex Market, Pier 35, The Museum at Eldridge Street and The Museum of Street Art.
According to a third-party market research report, the Office Component is situated within the NoHo/SoHo submarket of the Midtown South Manhattan office market. As of the fourth quarter of 2023, the NoHo/SoHo office submarket reported inventory of approximately 8.7 million SF with a 15.4% vacancy rate and average asking rents of $93.71 per square foot. The appraisal concluded to market rent of $47.00 per square foot, modified gross, for office space at the 57-63 Orchard Street Property (see table below).
According to a third-party market research report, the Retail Component is located within the SoHo submarket of the Manhattan retail market. As of the fourth quarter of 2023, the SoHo retail submarket reported total inventory of approximately 5.6 million square feet with a 3.8% vacancy rate and average asking rent of $107.04 per square foot. The appraisal concluded to market rents ranging from $75.00 to $150.00 per square foot, modified gross, for the retail spaces at the 57-63 Orchard Street Property (see table below).
According to a third-party market research report, the Multifamily Component is located within the Lower East Side submarket of the New York Metro multifamily market. As of the fourth quarter of 2023, the Lower East Side multifamily submarket reported total inventory of 79,747 units with a 0.7% vacancy rate and average asking rents of $4,854 per unit (per month). The appraisal concluded to market rent of $7,259 per unit (per month) at the 57-63 Orchard Street Property (see table below).
The following table presents certain information relating to the appraisal’s market rent conclusion for the Retail and Office Components at the 57-63 Orchard Street Property:
Retail & Office Component Market Rent Summary(1)
| Inline Retail | Corner Retail | Two Story Retail (57 Orchard) |
Office | |
| Market Rent (PSF) | $110.00 | $150.00 | $75.00 | $47.00 |
| Lease Term (Years) | 5 | 5 | 5 | 5 |
| Lease Type (Reimbursements) | Mod Gross | Mod Gross | Mod Gross | Mod Gross |
| Rent Increase Projection | 3.0% annually | 3.0% annually | 3.0% annually | 3.0% annually |
| (1) | Information obtained from the appraisal. |
The following table presents certain information relating to the appraisal’s market rent conclusion for the Multifamily Component at the 57-63 Orchard Street Property:
Multifamily Component Market Rent Summary
| Market Rent Summary | ||||
| Unit Mix / Type | Units(1) | Average Unit Size (square feet)(1) | Avg. Monthly Rent per Unit(1) | Avg. Monthly Market Rent per Unit(2) |
| Loft | 3 | 2,833 | $4,125 | $7,259 |
| (1) | Based on the borrower rent roll dated June 1, 2024. |
| (2) | Based on the appraisal. |
| THE INFORMATION IN THIS STRUCTURAL AND COLLATERAL TERM SHEET IS NOT COMPLETE AND MAY BE AMENDED PRIOR TO THE TIME OF SALE. THIS TERM SHEET IS NOT AN OFFER TO SELL THESE SECURITIES AND IT IS NOT A SOLICITATION OF AN OFFER TO BUY THESE SECURITIES IN ANY JURISDICTION WHERE THE OFFER OR SALE IS NOT PERMITTED. | ||
| 138 | ||
| Mixed Use – Office/Retail/Multifamily | Loan #15 | Cut-off Date Balance: | $22,000,000 | |
57 – 63 Orchard Street New York, NY 10002
| 57 – 63 Orchard Street | Cut-off Date LTV: U/W NCF DSCR: U/W NOI Debt Yield: | 62.9% 1.29x 9.7% |
The table below presents certain information relating to comparable sales pertaining to the 57-63 Orchard Street Property identified by the appraiser:
Comparable Mixed-Use Sales(1)
| Property Name | Location | Year Built/Renovated | Rentable Area (SF) | Occupancy | Sale Date | Sale Price | Sale Price (PSF) |
| Subject Property | New York, NY | 1900, 1910, 1915/2023 | 55,200(2) | 100.0%(2) | NAP | NAP | NAP |
| 225 West 39th Street | New York, NY | 1910/NAP | 103,500 | NAP | Mar-2024 | $22,200,000 | $214.49 |
| 22 West 23rd Street | New York, NY | 1900/NAP | 16,431 | 100.0% | Jun-2023 | $9,710,000 | $590.96 |
| 381-383 Broadway | New York, NY | 1915/2018 | 26,850 | 66.0% | Mar-2023 | $16,750,000 | $623.84 |
| 206 Spring Street | New York, NY | 1915/NAP | 15,540 | 66.0% | Mar-2022 | $10,500,000 | $675.68 |
| 62 West 45th Street | New York, NY | 1911/NAP | 55,150 | 92.0% | Mar-2022 | $36,000,000 | $652.77 |
| (1) | Information obtained from the appraisal. |
| (2) | Information obtained from the underwritten rent roll. |
| THE INFORMATION IN THIS STRUCTURAL AND COLLATERAL TERM SHEET IS NOT COMPLETE AND MAY BE AMENDED PRIOR TO THE TIME OF SALE. THIS TERM SHEET IS NOT AN OFFER TO SELL THESE SECURITIES AND IT IS NOT A SOLICITATION OF AN OFFER TO BUY THESE SECURITIES IN ANY JURISDICTION WHERE THE OFFER OR SALE IS NOT PERMITTED. | ||
| 139 | ||
| Wells Fargo Commercial Mortgage Trust 2024-5C1 | Transaction Contact Information |
| VI. | Transaction Contact Information |
Questions regarding this Structural and Collateral Term Sheet may be directed to any of the following individuals:
| Wells Fargo Securities, LLC | |
| Brigid Mattingly | Tel. (312) 269-3062 |
| A.J. Sfarra | Tel. (212) 214-5613 |
| Sean Duffy | Tel. (312) 827-1518 |
| Citigroup Global Markets Inc. | |
| Raul Orozco | Tel. (212) 723-1295 |
| Rick Simpson | Tel. (212) 816-5343 |
| Jay Mercandetti | Tel. (212) 816-6384 |
| Goldman Sachs & Co. LLC | |
| Scott Epperson | Tel. (212) 934-2882 |
| Justin Peterson | Tel. (212) 902-4283
|
| UBS Securities LLC | |
| Nicholas Galeone | Tel. (212) 713-8832 |
| Siho Ham | Tel. (212) 713-1278 |
| Michael Barbieri | Tel. (212) 713-1181 |
| THE INFORMATION IN THIS STRUCTURAL AND COLLATERAL TERM SHEET IS NOT COMPLETE AND MAY BE AMENDED PRIOR TO THE TIME OF SALE. THIS TERM SHEET IS NOT AN OFFER TO SELL THESE SECURITIES AND IT IS NOT A SOLICITATION OF AN OFFER TO BUY THESE SECURITIES IN ANY JURISDICTION WHERE THE OFFER OR SALE IS NOT PERMITTED. | ||
| 140 | ||