<
Item 1: Report to Shareholders| Tax-Free Income Fund | February 28, 2005 |
The views and opinions in this report were current as of February 28, 2005. They are not guarantees of performance or investment results and should not be taken as investment advice. Investment decisions reflect a variety of factors, and the managers reserve the right to change their views about individual stocks, sectors, and the markets at any time. As a result, the views expressed should not be relied upon as a forecast of the fund’s future investment intent. The report is certified under the Sarbanes-Oxley Act of 2002, which requires mutual funds and other public companies to affirm that, to the best of their knowledge, the information in their financial reports is fairly and accurately stated in all material respects.
REPORTS ON THE WEB
Sign up for our E-mail Program, and you can begin to receive updated fund reports and prospectuses online rather than through the mail. Log in to your account at troweprice.com for more information.
Fellow ShareholdersTax-free bonds generally produced positive returns and outperformed their taxable bond counterparts in the one-year period ended February 28, 2005. Most of the municipal market’s gains occurred in the last six months, which were characterized by rising short-term interest rates, steady economic growth, elevated oil prices, and an unexpected decline in long-term interest rates. In both the 6- and 12-month periods, long-term and high-yield municipals fared better than short-term and investment-grade securities, respectively.
MARKET ENVIRONMENT
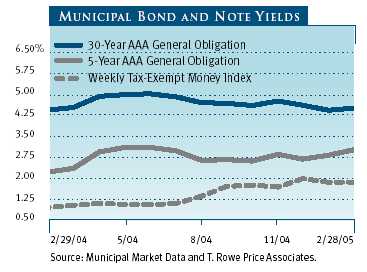
Twelve months ago, at the beginning of our fiscal year, the economy was growing vigorously, and the Federal Reserve prepared to unwind at a “measured” pace the accommodative monetary policy that had prevailed for almost three years. From June 30, 2004, through the end of February 2005—and despite a brief period of uncertainty about the economic outlook related to geopolitical concerns, rising oil prices, and a tight presidential race—the central bank gradually lifted the federal funds target rate from 1.00% to 2.50%, a three-year high.
As shown in the graph, municipal money market yields rose steadily for most of the last year. Long-term rates, on the other hand, declined after peaking in the spring of 2004. The result was that longer-term municipal securities outperformed short- and intermediate-term bonds in the last six months and for our entire fiscal year.
MUNICIPAL MARKET NEWS
New municipal supply in 2004 totaled $360 billion, approximately 6.3% below the previous year’s record $384 billion (according to The Bond Buyer). While still high from a historical perspective, the increased participation of property and casualty insurance companies and other nontraditional buyers of municipal securities easily absorbed supply, which reduced downward pressure on municipal bond prices. Many states have recovered nicely from the 2001 recession as higher-than-anticipated revenues, spending cuts, and fee increases have improved many states’ finances and reduced the need to borrow.
Local governments and school districts are participating in the states’ recovery in that they are receiving more in assistance and transfers. The rise in housing prices over the last three years also benefited local governments since it resulted in increased property tax receipts, which are localities’ primary revenue source. Broadly speaking, the outlook for public finance is brighter, though escalating pension and benefit costs may hinder further improvement.
PORTFOLIO STRATEGY
Tax-Exempt Money Fund
Your fund outperformed its peers during the 6- and 12-month periods ended February 28, 2005, with returns of 0.57% and 0.86%, respectively, versus the Lipper peer group average of 0.48% and 0.69%.
| PERFORMANCE COMPARISON | |
| Periods Ended 2/28/05 | 6 Months | 12 Months |
| Tax-Exempt Money Fund | 0.57% | 0.86% |
| Lipper Tax-Exempt Money | | |
| Market Funds Average | 0.48 | 0.69 |
The tightening of monetary conditions by the Federal Reserve has been good news for money fund investors. The string of successive rate increases pushed money fund yields substantially higher. The fund’s seven-day simple dividend yield nearly doubled in the past six months, rising from 0.76% on August 31, 2004, to 1.39% at the end of February. If the Fed continues to raise short-term rates, as is widely expected, money fund yields should continue to improve.
Since our August report, the money markets have absorbed four rate increases by the Fed, and forward markets continue to price in expectations of further hikes in short-term rates. One-year Libor—a taxable benchmark rate—rose 131 basis points since August, from 2.26% to 3.57%. Municipal rates, which price relative to taxable rates, rose in similar fashion. Variable-rate debt with maturities out to seven days increased an average of 60 basis points (0.60%) in yield since August and now offer yields between 1.60% and 1.70%. Yields on longer-dated maturities moved even higher, pricing in the risk of further Fed moves. Six-month municipal notes have yields 80 basis points higher than in August, 2.15%, while one-year notes have yields 78 basis points higher at 2.35%.
| PORTFOLIO DIVERSIFICATION | |
| Percent of | Percent of |
| Net Assets | Net Assets |
| Periods Ended | 8/31/04 | 2/28/05 |
| Hospital Revenue | 22.6% | 22.3% |
| Educational Revenue | 11.1 | 14.6 |
| General Obligation – Local | 14.9 | 13.3 |
| General Obligation – State | 9.9 | 8.1 |
| Housing Finance Revenue | 9.0 | 7.1 |
| Water and Sewer Revenue | 5.3 | 6.4 |
| Life Care/Nursing Home Revenue | 5.1 | 5.9 |
| Electric Revenue | 9.6 | 5.7 |
| Industrial and Pollution | | |
| Control Revenue | 2.1 | 4.2 |
| Ground Transportation Revenue | 1.1 | 3.9 |
| All Other Sectors | 10.5 | 10.1 |
| Other Assets Less Liabilities | -1.2 | -1.6 |
| Total | 100.0% | 100.0% |
| Historical weightings reflect current industry/sector classifications. |
With rates increasing, we have substantially shortened the fund’s weighted average maturity (WAM). In August, the fund’s WAM stood at 46 days, and as of February 28, 2005, it was 19 days shorter at 27 days. Our investment focus has been on very short positions with an emphasis on variable rate debt and commercial paper; we have extended our maturities on a limited basis when we feel a temporary yield advantage exists. A shorter WAM not only benefits shareholders through quicker reinvestment at successively higher rates but also protects fund shareholders against unwanted price movement.
With economic recovery appearing firmly entrenched and fears of deflation long since forgotten, the market expects the Fed to continue raising rates through the balance of the year. With this in mind, we plan to continue our current strategy, managing the fund with a short weighted average maturity, and concentrating on exploiting temporary yield advantages in the short end of our market. Following this strategy, the fund’s yield can be expected to rise gradually for the remainder of this current cycle of Fed tightening.
Tax-Free Short-Intermediate Fund
The fund returned 0.22% over the past six months, behind the 0.39% return for the Lipper benchmark. For the 12 months ended February 28, 2005, the fund’s 0.09% performance also lagged the Lipper average for similar funds. Dividends per share remained stable at $0.07 during the six-month period, and the fund’s NAV declined from $5.46 to $5.40 per share.
| PERFORMANCE COMPARISON | |
| Periods Ended 2/28/05 | 6 Months | 12 Months |
| Tax-Free Short-Intermediate Fund | 0.22% | 0.09% |
| Lipper Short-Intermediate | | |
| Municipal Debt Funds Average | 0.39 | 0.17 |
Short-intermediate bonds were the worst-performing sector of the municipal market, since they were most affected by the rise in short-term rates and by expectations for further increases this year. To give you an idea of how yields affected our area of the market, two-year Treasury yields climbed 1.18% versus 0.25% for 10-year Treasuries. Municipal yields followed suit, with two-year yields rising more sharply than longer tax-exempt yields as a result of the Federal Reserve lifting short-term rates over the past eight months.
While your fund’s return was below that of the average fund in its peer group, it ranked considerably higher than the median return.
| PORTFOLIO DIVERSIFICATION | |
| | Percent of | Percent of |
| | Net Assets | Net Assets |
| Periods Ended | 8/31/04 | 2/28/05 |
| General Obligation – State | 16.1% | 16.2% |
| Dedicated Tax Revenue | 12.2 | 13.4 |
| Electric Revenue | 13.7 | 12.6 |
| General Obligation – Local | 13.4 | 12.3 |
| Air and Sea | | |
| Transportation Revenue | 7.7 | 8.6 |
| Lease Revenue | 5.9 | 7.7 |
| Hospital Revenue | 5.7 | 5.8 |
| Ground Transportation Revenue | 4.7 | 5.3 |
| Prerefunded Bonds | 5.1 | 4.6 |
| Industrial and Pollution | | |
| Control Revenue | 2.3 | 3.2 |
| All Other Sectors | 11.8 | 10.5 |
| Other Assets Less Liabilities | 1.4 | -0.2 |
| Total | 100.0% | 100.0% |
| Historical weightings reflect current industry/sector classifications. |
Our strategy on interest rates focused on maintaining a short- to neutral- maturity posture, shortening maturities as we approached the end of the reporting period. We implemented a so-called barbell structure, holding bonds with longer and shorter maturities within the 1- to 10-year yield curve. Among various sectors, we favored bonds offering higher-than-usual yields relative to other sectors, as we felt they would benefit from an improving economy. When the economy strengthens, the yield spread between different quality bonds often tightens. We have been adding to the bonds of lower-rated states like California, Massachusetts, and New York, and also to airport and hospital revenue bonds.
In the near term, we anticipate maintaining our defensive posture. However, rates have moved up, and more tightening is already built in to the market. Signs of slower growth or lower inflation may prompt us to adjust our strategy and extend duration.
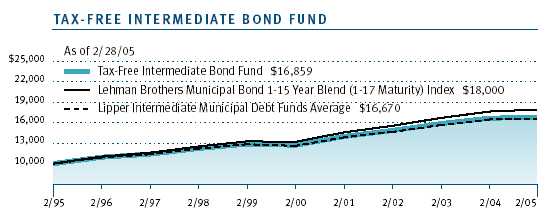
Tax-Free Intermediate Bond FundThe fund outpaced its peer group average during the 6- and 12-month periods ended February 28, 2005, with returns of 1.03% and 0.87% versus 0.87% and 0.72%, respectively. The fund’s dividend remained stable at $0.20 per share during the past six months, and the NAV declined from $11.34 to $11.26 per share.
| PERFORMANCE COMPARISON | |
| Periods Ended 2/28/05 | 6 Months | 12 Months |
| Tax-Free Intermediate Bond Fund | 1.03% | 0.87% |
| Lipper Intermediate Municipal | | |
| Debt Funds Average | 0.87 | 0.72 |
Shorter-term bonds were adversely affected by the Federal Reserve’s tightening policy, which raised short-term rates by 150 basis points since last June. As a result, shorter bonds declined in value while longer-term bonds posted good returns as their yields have been falling since spring 2004.
We were underweighted in the three-year maturity area, which benefited results relative to our peer group. We also bought longer-term bonds in the fall, boosting relative results. Through the period, we maintained a shorter duration than the average for competitive funds (duration is a measure of bond sensitivity to changes in interest rates; see the glossary following this letter for a more detailed explanation).
The past six months marked the first time that we were able to buy below-investment-grade bonds, which aided performance as these securities outperformed. In addition, we purchased some nonrated bonds, which also benefited fund results. We expect to add to these segments as the opportunities present themselves.
Our credit strategy focused on increasing the holdings of bonds we believe will benefit from a stronger economy; as the economy gathers strength, the yields on lower-quality bonds often narrow versus the yields on high-quality securities. Accordingly, we increased exposure to bonds issued in California, New York, and other areas that had reflected higher-than-usual yields because of earlier credit concerns.| | | |
| PORTFOLIO DIVERSIFICATION | |
| | Percent of | Percent of |
| | Net Assets | Net Assets |
| Periods Ended | 8/31/04 | 2/28/05 |
| General Obligation – Local | 15.6% | 13.3% |
| Electric Revenue | 14.2 | 12.5 |
| Prerefunded Bonds | 8.0 | 11.5 |
| Lease Revenue | 10.7 | 10.5 |
| Dedicated Tax Revenue | 9.4 | 9.7 |
| Hospital Revenue | 9.9 | 9.3 |
| General Obligation – State | 5.9 | 7.4 |
| Air and Sea | | |
| Transportation Revenue | 4.9 | 5.9 |
| Educational Revenue | 5.2 | 5.3 |
| Ground Transportation Revenue | 2.4 | 4.0 |
| All Other Sectors | 14.6 | 11.1 |
| Other Assets Less Liabilities | -0.8 | -0.5 |
| Total | 100.0% | 100.0% |
| Historical weightings reflect current industry/sector classifications. |
Tax-Free Income Fund
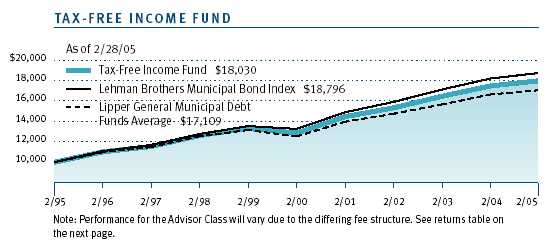
In a year of modest bond market returns, the Tax-Free Income Fund and Advisor Class shares provided returns well above those of the Lipper peer group average for both the 6- and 12-month periods. During the past six months, the fund’s dividend remained stable at $0.22 per share, and the NAV rose three cents to $10.06. Our results versus the benchmark reflect our decisions on maturity structure and credit exposure and are supported by our relatively low expenses.
| PERFORMANCE COMPARISON | |
| Periods Ended 2/28/05 | 6 Months | 12 Months |
| Tax-Free Income Fund | 2.47% | 2.87% |
| Tax-Free Income Fund– | | |
| Advisor Class | 2.41 | 2.65 |
| Lipper General Municipal | | |
| Debt Funds Average | 2.14 | 2.18 |
The past year was unusual for interest rates. While short- and intermediate-term rates rose steadily, long-term rates fluctuated and ended the year only slightly higher than a year ago. In prior periods of Federal Reserve tightening, we saw much bigger adjustments in long-term rates and commensurately weaker performance from long-term bonds.
A couple of factors made this period different. First, with interest rates close to four-decade lows, market yields were lower than the coupons of most outstanding bonds. In the case of long-term bonds with call provisions, which allow these bonds to be called back by the issuer before maturity, the effective maturity becomes the call date. This meant that a bond with a stated maturity of 30 years and a 10-year call date reacted to interest rate changes with the volatility of a 10-year bond. With nearly unchanged long-term rates, these bonds behaved better than noncallable shorter bonds in a part of the yield curve where rates rose. Second, demand for 15- to 20-year securities created an unusually wide spread between 20- and 30-year rates. Historically, a five to 10 basis point difference in yield had prevailed between these maturities. Over the past year, however, the differential expanded to 25 to 30 basis points, making the longest-term bonds more attractive.
Our strategy focused on maintaining a barbell maturity structure, which meant owning more bonds in the one- to two-year range than we usually do and overweighting 30-year maturities for the reasons described above. Avoiding the middle of the yield curve helped us outperform as the yield curve flattened.
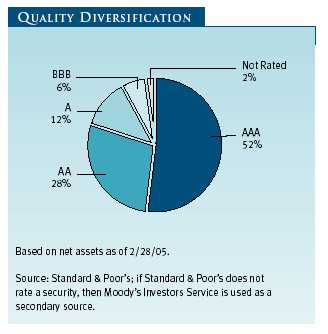
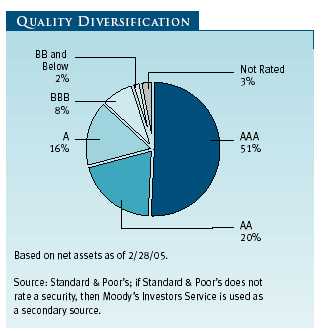
From a credit perspective, we favored A and BBB rated bonds, relying on our credit research to identify opportunities. At year-end, approximately 25% of the portfolio was in bonds rated A or lower, a posture that helped as lower-rated bonds outperformed. The credit cycle is still positive, with a strong economy feeding tax coffers and helping weaker credits improve. Some of the ideas we put to work over a year ago also benefited the portfolio, such as taking our exposure to BBB California general obligation debt from zero to 4% and thereby providing a significant yield pickup over high-quality bonds. Last fall the state was upgraded to single A status, and the bonds outperformed. Such opportunities are less obvious today as yield spreads for lower-rated bonds have generally narrowed. While it is too soon to upgrade our overall credit exposure, we don’t expect to buy more lower-rated bonds and will watch carefully for any signs of weakness.
| PORTFOLIO DIVERSIFICATION | |
| | Percent of | Percent of |
| | Net Assets | Net Assets |
| Periods Ended | 8/31/04 | 2/28/05 |
| Hospital Revenue | 13.6% | 15.2% |
| Prerefunded Bonds | 9.9 | 9.7 |
| Dedicated Tax Revenue | 9.4 | 9.6 |
| Electric Revenue | 11.1 | 9.4 |
| General Obligation – Local | 7.8 | 8.9 |
| Lease Revenue | 8.9 | 7.5 |
| Escrowed to Maturity | 5.9 | 6.5 |
| General Obligation – State | 5.6 | 6.4 |
| Educational Revenue | 4.8 | 5.4 |
| Water and Sewer Revenue | 6.5 | 4.6 |
| All Other Sectors | 15.9 | 16.7 |
| Other Assets Less Liabilities | 0.6 | 0.1 |
| Total | 100.0 | 100.0 |
| Historical weightings reflect current industry/sector classifications. |
One missed opportunity involved bonds secured by legal settlement payments from tobacco companies to state and local governments (“tobacco bonds”). In our view, the declining fundamentals of the industry and the litigation risk posed by repeated challenges to these companies were more than we could justify. Despite our concerns, tobacco bonds provided outsized returns this year when several court cases were resolved favorably for the industry.
Looking ahead, there are several reasons to be cautious. At year-end, rates were rising again as the market braced for more Fed tightening due to continued strength in the economy and higher inflation. Accordingly, the protective steps we have taken include lowering the portfolio’s duration or interest rate exposure (see glossary) close to the low end of the fund’s 29-year history. We are carrying cash reserves of 5%, which is above our usual 1% to 3%, to give us the ability to buy bonds at higher interest rates later. We put a modest hedge in place (Treasury bond options), reflecting our view that greater interest rate risk now resides in the Treasury market. Finally, our lower-quality, higher-yielding bonds should prove defensive if rates rise.
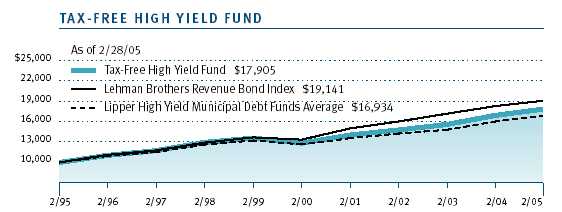
Tax-Free High Yield FundThe Tax-Free High Yield Fund outpaced the Lipper average for the 12-month period but slightly trailed over the past six months. The fund’s dividends per share slipped a penny to $0.29 since the end of August, while the NAV rose from $11.67 to $11.86, resulting in a strong total return.
| PERFORMANCE COMPARISON | |
| Periods Ended 2/28/05 | 6 Months | 12 Months |
| Tax-Free High Yield Fund | 4.19% | 5.49% |
| Lipper High Yield Municipal | | |
| Debt Funds Average | 4.36 | 5.12 |
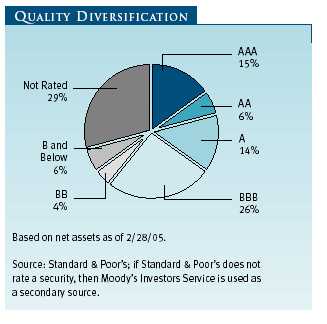
During the past 12 months, demand for medium- and lower-quality municipals remained firm. Solid economic fundamentals and persistently low interest rates drove investors toward higher-yielding securities in an effort to enhance portfolio returns. The pursuit of higher yields contracted the risk premiums on lower-quality bonds to levels not seen since the late 1990s. Near the end of the reporting period, formerly downtrodden sectors of the municipal market, especially tobacco securitization bonds and airline-backed debt, led the rally toward tighter quality spreads. Returns for other sectors such as hospitals and utilities, while positive, failed to keep pace in this “bottom up” rally.
Our conservative posture vis-à-vis tobacco securitization bonds and airline-backed debt tempered relative performance toward the end of the period. In February, a federal appeals court ruled that the Department of Justice could not seek disgorgement of past profits amounting to $280 billion as a remedy for its civil racketeering case against several large tobacco companies. Tobacco securitization bonds rallied as much as 15% on this news. Our 1% exposure to the sector was considerably lower than that of most competing funds, curtailing results. Airline bonds did well in the fourth quarter of 2004, as oil prices eased and Delta Air Lines averted bankruptcy.
Holdings in two toll road projects in the Southeast were strong contributors to the fund’s performance. Continued traffic growth in the Richmond (VA) area and a significant toll increase enhanced revenues for Pocahontas Parkway bonds. County approval of a large residential real estate project adjacent to the road fueled increased demand for the project’s revenue bonds as well. We also witnessed improving traffic trends and a toll increase for our Connector 2000 (SC) bonds. Both projects benefited from improved macroeconomic conditions.
| PORTFOLIO DIVERSIFICATION | |
| Percent of | Percent of |
| Net Assets | Net Assets |
| Periods Ended | 8/31/04 | 2/28/05 |
| Life Care/Nursing Home Revenue | 15.9% | 16.0% |
| Hospital Revenue | 14.4 | 14.3 |
| Industrial and Pollution | | |
| Control Revenue | 11.6 | 13.0 |
| Electric Revenue | 11.2 | 9.0 |
| Lease Revenue | 7.5 | 7.4 |
| Dedicated Tax Revenue | 6.4 | 6.8 |
| Prerefunded Bonds | 5.4 | 5.1 |
| Solid Waste Revenue | 4.7 | 4.4 |
| General Obligation - State | 3.1 | 3.4 |
| General Obligation - Local | 2.7 | 3.2 |
| All Other Sectors | 15.9 | 16.9 |
| Other Assets Less Liabilities | 1.2 | 0.5 |
| Total | 100.0% | 100.0% |
| Historical weightings reflect current industry/sector classifications. |
Hospitals and life care-related debt posted solid returns for the 6- and 12-month periods. Hospital revenue bonds continued to benefit from a favorable reimbursement climate. Improved fiscal conditions at the state level diminished the likelihood of sharp Medicaid cuts, while stronger financial markets alleviated concerns about significant pension costs for hospital staff. Solid demographics, a strong real estate market, and better financial management helped drive returns in our retirement home positions.
Yield premiums for higher-risk municipal bonds are now at historically low levels. While the economic backdrop appears positive for credit-sensitive securities, we believe valuations fully reflect these conditions. In addition, the potential for higher yields on AAA municipals as the Federal Reserve continues to raise rates might reduce demand for medium- and lower-quality bonds in the months ahead. We will continue to rely on our disciplined, research-driven process to uncover value opportunities in this environment.
OUTLOOKWhile heightened energy prices may dampen consumer spending, strong fundamentals support our outlook for sustained economic expansion. Because the Fed remains committed to removing monetary policy accommodation, interest rates along the yield curve are more likely to rise than fall, suggesting a more challenging bond market environment in the period ahead.
Although it may be time for renewed caution regarding fixed-income investments, we believe several factors are likely to temper a broad increase in interest rates. First, the current cyclical increase in inflation may be modest compared with previous inflationary periods. Forces that encourage price increases, such as dollar weakness and a tighter labor market, may be offset to some degree by forces that restrain inflation, including productivity gains and intense global competition. Second, reduced supply in a higher-rate environment should lead to less refinanc-ing issuance, less borrowing, and generally better fiscal conditions. Third, the greater transparency of the Federal Open Market Committee process, as evidenced by the earlier publication of Fed meeting minutes, could lessen the impact of a surprise rate hike by the central bank. Finally, given that the municipal yield curve remains somewhat steep, we believe that bonds with longer maturities still offer value to investors.
We thank you for your continued support.
Respectfully submitted,

Joseph K. Lynagh
Chairman of the Investment Advisory Committee
Tax-Exempt Money Fund

Charles B. Hill
Chairman of the Investment Advisory Committees
Tax-Free Short Intermediate and Tax-Free Intermediate Bond Funds

Mary J. Miller
Chairman of the Investment Advisory Committee
Tax-Free Income Fund

James M. Murphy
Chairman of the Investment Advisory Committee
Tax-Free High Yield Fund
March 18, 2005
The committee chairman has day-to-day responsibility for managing the portfolio and works with committee members in developing and executing the fund’s investment program.
RISKS OF FIXED-INCOME INVESTINGSince money market funds are managed to maintain a constant $1.00 share price, there should be little risk of principal loss. However, there is no assurance the fund will avoid principal losses if fund holdings default or are downgraded, or if interest rates rise sharply in an unusually short period. In addition, the fund’s yield will vary; it is not fixed for a specific period like the yield on a bank certificate of deposit. An investment in the fund is not insured or guaranteed by the Federal Deposit Insurance Corporation (FDIC) or any other government agency. Although a money market fund seeks to preserve the value of your investment at $1.00 per share, it is possible to lose money by investing in it.
Bonds are subject to interest rate risk (the decline in bond prices that usually accompanies a rise in interest rates) and credit risk (the chance that any fund holding could have its credit rating downgraded, or that a bond issuer will default by failing to make timely payments of interest or principal), potentially reducing the fund’s income level and share price. High-yield bonds could have greater price declines than funds that invest primarily in high-quality bonds. Municipalities issuing high-yield bonds are not as strong financially as those with higher credit ratings, so the bonds are usually considered speculative investments.
GLOSSARY
Lipper averages: The averages of available mutual fund performance returns for specified time periods in defined categories as tracked by Lipper Inc.
Libor rate: The rate that contributor banks in London offer one another for interbank deposits. In effect, the Libor rate is a rate at which a fellow London bank can borrow money from other banks.
Basis points: One hundred basis points equal one percentage point.
Duration: A measure of a bond fund’s sensitivity to changes in interest rates. For example, a fund with a duration of 6.0 years would fall about 6% in price in response to a one-percentage-point rise in interest rates, and vice versa.
Fed funds target rate: An overnight lending rate set by the Federal Reserve and used by banks to meet reserve requirements. Banks also use the fed funds rate as a benchmark for their prime lending rates.
Average maturity: For a bond fund, the average of the stated maturity dates of the portfolio’s securities. In general, the longer the average maturity, the greater the fund’s sensitivity to interest rate changes, which means greater price fluctuation. A shorter average maturity usually means a less sensitive, and consequently, less volatile portfolio.
| PORTFOLIO CHARACTERISTICS | | | | |
| |
| | | | | | Tax-Free | |
| | Tax- | Tax-Free | Tax-Free | | Income | Tax-Free |
| | Exempt | Short- | Intermediate | Tax-Free | Fund– | High |
| Periods Ended | Money | Intermediate | Bond | Income | Advisor | Yield |
| 2/28/05 | Fund | Fund | Fund | Fund | Class | Fund |
| Price Per Share | $ 1.00 | $ 5.40 | $11.26 | $10.06 | $10.07 | $11.86 |
| |
| Dividends Per Share | | | | | | |
| For 6 months | 0.006 | 0.07 | 0.20 | 0.22 | 0.20 | 0.29 |
| For 12 months | 0.009 | 0.14 | 0.39 | 0.43 | 0.40 | 0.60 |
| |
| Dividend Yield | | | | | | |
| (7-Day Simple) * | 1.39% | – | – | – | – | – |
| |
| 30-Day | | | | | | |
| Dividend Yield * | – | 2.63% | 3.46% | 4.27% | 3.92% | 4.91% |
| |
| 30-Day Standardized | | | | | | |
| Yield to Maturity | – | 2.32 | 2.65 | 3.27 | 2.93 | 4.15 |
| |
| Weighted Average | | | | | | |
| Maturity (years) ** | 27 | 3.6 | 7.5 | 14.5 | 14.5 | 17.4 |
| |
| Weighted Average | | | | | | |
| Effective Duration | | | | | | |
| (years) | – | 2.8 | 4.4 | 5.3 | 5.3 | 5.2 |
| * | Dividends earned for the last 30 days (7 days for the money fund) are annualized and divided by |
| | the fund’s net asset value at the end of the period. |
| ** | Weighted average maturity for the money fund is in days. |
| Note: Yields will vary and are not guaranteed. A money fund’s yield more closely reflects its current |
| earnings than the total return. |
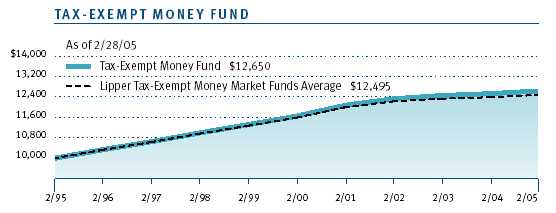
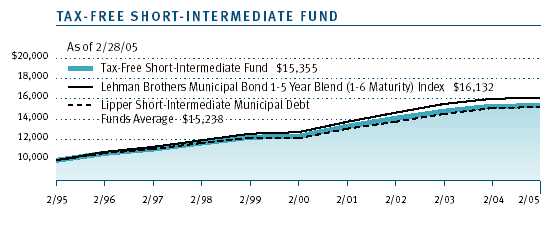
These charts show the value of a hypothetical $10,000 investment in each fund over the past 10 fiscal year periods or since inception (for funds lacking 10-year records). The result is compared with benchmarks, which may include a broad-based market index and a peer group average or index. Market indexes do not include expenses, which are deducted from fund returns as well as mutual fund averages and indexes.
| AVERAGE ANNUAL COMPOUND TOTAL RETURN |
This table shows how the fund and its benchmarks would have performed each year if their actual (or cumulative) returns for the periods shown had been earned at a constant rate.
| | | | | Since | Inception |
| Periods Ended 2/28/05 | 1 Year | 5 Years | 10 Years | Inception | Date |
| Tax-Exempt Money Fund | 0.86% | 1.65% | 2.38% | | |
| Tax-Free Short-Intermediate Fund | 0.09 | 4.44 | 4.38 | | |
| Tax-Free Intermediate Fund | 0.87 | 5.78 | 5.36 | | |
| Tax-Free Income Fund | 2.87 | 6.96 | 6.07 | | |
| Tax-Free Income Fund– | | | | | |
| Advisor Class | 2.65 | — | — | 3.92% | 9/30/02 |
| Tax-Free High Yield Fund | 5.49 | 6.84 | 6.00 | | |
| Returns do not reflect taxes that the shareholder may pay on fund distributions or the redemption of fund |
| shares. Past performance cannot guarantee future results. | | | |
As a mutual fund shareholder, you may incur two types of costs: (1) transaction costs such as redemption fees or sales loads and (2) ongoing costs, including management fees, distribution and service (12b-1) fees, and other fund expenses. The following example is intended to help you understand your ongoing costs (in dollars) of investing in the fund and to compare these costs with the ongoing costs of investing in other mutual funds. The example is based on an investment of $1,000 invested at the beginning of the most recent six-month period and held for the entire period.
Actual Expenses
The first line of the following table (“Actual”) provides information about actual account values and actual expenses. You may use the information in this line, together with your account balance, to estimate the expenses that you paid over the period. Simply divide your account value by $1,000 (for example, an $8,600 account value divided by $1,000 = 8.6), then multiply the result by the number in the first line under the heading “Expenses Paid During Period” to estimate the expenses you paid on your account during this period.
Please note that a fund may have two share classes: The original share class (“investor class”) charges no distribution and service (12b-1) fee. Advisor Class shares are offered only through unaffiliated brokers and other financial intermediaries and charge a 0.25% 12b-1 fee. Each share class is presented separately in the table.
Hypothetical Example for Comparison Purposes
The information on the second line of the table (“Hypothetical”) is based on hypothetical account values and expenses derived from the fund’s actual expense ratio and an assumed 5% per year rate of return before expenses (not the fund’s actual return). You may compare the ongoing costs of investing in the fund with other funds by contrasting this 5% hypothetical example and the 5% hypothetical examples that appear in the shareholder reports of the other funds. The hypothetical account values and expenses may not be used to estimate the actual ending account balance or expenses you paid for the period.
Note: T. Rowe Price charges an annual small-account maintenance fee of $10, generally for accounts with less than $2,000 ($500 for UGMA/UTMA). The fee is waived for any investor whose T. Rowe Price mutual fund accounts total $25,000 or more, accounts employing automatic investing, and IRAs and other retirement plan accounts that utilize a prototype plan sponsored by T. Rowe Price (although a separate custodial or administrative fee may apply to such accounts). This fee is not included in the accompanying table. If you are subject to the fee, keep it in mind when you are estimating the ongoing expenses of investing in the fund and when comparing the expenses of this fund with other funds.
You should also be aware that the expenses shown in the table highlight only your ongoing costs and do not reflect any transaction costs, such as redemption fees or sales loads. Therefore, the second line of the table is useful in comparing ongoing costs only and will not help you determine the relative total costs of owning different funds. To the extent a fund charges transaction costs, however, the total cost of owning that fund is higher.
| T. ROWE PRICE TAX-EXEMPT MONEY FUND | |
| |
| | Beginning | Ending | Expenses Paid |
| | Account Value | Account Value | During Period* |
| | 9/1/04 | 2/28/05 | 9/1/04 to 2/28/05 |
| Actual | $1,000.00 | $1,005.70 | $2.54 |
| Hypothetical (assumes 5% | | | |
| return before expenses) | $1,000.00 | $1,022.27 | $2.56 |
| * Expenses are equal to the fund’s annualized expense ratio for the six-month period (0.51%), multiplied |
| * by the average account value over the period, multiplied by the number of days in the most recent fiscal |
| * half year (181) divided by the days in the year (365) to reflect the half-year period. |
| T. ROWE PRICE TAX-FREE SHORT-INTERMEDIATE FUND | |
| |
| | Beginning | Ending | Expenses Paid |
| | Account Value | Account Value | During Period* |
| | 9/1/04 | 2/28/05 | 9/1/04 to 2/28/05 |
| Actual | $1,000.00 | $1,002.20 | $2.53 |
| Hypothetical (assumes 5% | | | |
| return before expenses) | $1,000.00 | $1,022.27 | $2.56 |
| * Expenses are equal to the fund’s annualized expense ratio for the six-month period (0.51%), multiplied |
| * by the average account value over the period, multiplied by the number of days in the most recent fiscal |
| * half year (181) divided by the days in the year (365) to reflect the half-year period. |
| T. ROWE PRICE TAX-FREE INTERMEDIATE BOND FUND | |
| |
| | Beginning | Ending | Expenses Paid |
| | Account Value | Account Value | During Period* |
| | 9/1/04 | 2/28/05 | 9/1/04 to 2/28/05 |
| |
| Actual | $1,000.00 | $1,010.30 | $2.84 |
| Hypothetical (assumes 5% | | | |
| return before expenses) | $1,000.00 | $1,021.97 | $2.86 |
| * Expenses are equal to the fund’s annualized expense ratio for the six-month period (0.57%), multiplied |
| * by the average account value over the period, multiplied by the number of days in the most recent fiscal |
| * half year (181) divided by the days in the year (365) to reflect the half-year period. |
| T. ROWE PRICE TAX-FREE INCOME FUND | |
| |
| | Beginning | Ending | Expenses Paid |
| | Account Value | Account Value | During Period* |
| | 9/1/04 | 2/28/05 | 9/1/04 to 2/28/05 |
| Investor Class | | | |
| Actual | $1,000.00 | $1,024.70 | $2.71 |
| Hypothetical (assumes 5% | | | |
| return before expenses) | $1,000.00 | $1,022.12 | $2.71 |
| Advisor Class | | | |
| Actual | $1,000.00 | $1,024.10 | $4.32 |
| Hypothetical (assumes 5% | | | |
| return before expenses) | $1,000.00 | $1,020.53 | $4.31 |
| * Expenses are equal to the fund’s annualized expense ratio for the six-month period, multiplied by the |
| * average account value over the period, multiplied by the number of days in the most recent fiscal half |
| * year (181) divided by the days in the year (365) to reflect the half-year period. The annualized expense |
| * ratio of the Investor Class was 0.54%, the Advisor Class was 0.86%. | |
| T. ROWE PRICE TAX-FREE HIGH YIELD FUND | |
| |
| | Beginning | Ending | Expenses Paid |
| | Account Value | Account Value | During Period* |
| | 9/1/04 | 2/28/05 | 9/1/04 to 2/28/05 |
| Actual | $1,000.00 | $1,041.90 | $3.54 |
| Hypothetical (assumes 5% | | | |
| return before expenses) | $1,000.00 | $1,021.32 | $3.51 |
| * Expenses are equal to the fund’s annualized expense ratio for the six-month period (0.70%), multiplied |
| * by the average account value over the period, multiplied by the number of days in the most recent fiscal |
| * half year (181) divided by the days in the year (365) to reflect the half-year period. |
| QUARTER-END RETURNS | | | | |
| | 7-Day | | | |
| | Simple | | | |
| Periods Ended 12/31/04 | Yield | 1 Year | 5 Years | 10 Years |
| Tax-Exempt Money Fund | 1.38% | 0.73% | 1.70% | 2.41% |
| Lipper Tax-Exempt Money | | | | |
| Market Funds Average | — | 0.56 | 1.52 | 2.30 |
| Tax-Free Short-Intermediate Fund | — | 1.60 | 4.60 | 4.63 |
| Lehman Brothers Municipal Bond | | | | |
| 1-5 Year Blend (1-6 Maturity) Index | — | 2.05 | 4.96 | 5.19 |
| Lipper Short-Intermediate | | | | |
| Municipal Debt Funds Average | — | 1.63 | 4.62 | 4.61 |
| Tax-Free Intermediate Bond Fund | — | 2.67 | 5.85 | 5.76 |
| Lehman Brothers Municipal Bond | | | | |
| 1-15 Year Blend (1-17 Maturity) Index | — | 3.56 | 6.45 | 6.53 |
| Lipper Intermediate | | | | |
| Municipal Debt Funds Average | — | 2.59 | 5.75 | 5.68 |
| Tax-Free Income Fund | — | 4.31 | 7.02 | 6.63 |
| Tax-Free Income Fund–Advisor Class | — | 4.08 | 6.88 | 6.56 |
| Lehman Brothers Municipal Bond Index | — | 4.48 | 7.20 | 7.06 |
| Lipper General Municipal | | | | |
| Debt Funds Average | — | 3.70 | 6.27 | 6.06 |
| Tax-Free High Yield Fund | — | 6.64 | 6.58 | 6.39 |
| Lehman Brothers Revenue Bond Index | — | 5.32 | 7.30 | 7.27 |
| Lipper High Yield Municipal | | | | |
| Debt Funds Average | — | 6.10 | 5.87 | 5.78 |
| Current performance may be higher or lower than quoted past performance, which cannot |
| guarantee future results. Share price, principal value, and return will vary, and you may have a |
| gain or loss when you sell your shares. For the most recent month-end performance informa- |
| tion, please visit our Web site (troweprice.com) or contact a T. Rowe Price representative at |
| 1-800-225-5132. |
| |
| This table provides returns net of all expenses through the most recent calendar quarter-end rather than |
| through the end of the funds’ fiscal period. The T. Rowe Price Tax-Free Income Fund—Advisor Class began |
| operations on September 30, 2002, and shares the portfolio of the existing retail fund. The average annual |
| total return figures for the Advisor Class have been calculated using the performance data of the retail fund |
| up to the inception date of the class and the actual performance results of the class since that date. The per- |
| formance results of the retail fund have not been adjusted to reflect the 12b-1 fee associated with Advisor |
| Class (0.25%). Had the fee been included, the performance of the Advisor Class would have been lower. |
| |
| Average annual total returns include changes in principal value, reinvested dividends, and capital gain dis- |
| tributions. Returns do not reflect taxes that the shareholder may pay on fund distributions or the redemption |
| of fund shares. A money fund’s yield more closely represents its current earnings than the total return. |
| FINANCIAL HIGHLIGHTS | | | | For a share outstanding throughout each period |
| |
| Investor Class | | | | | | | | | | |
| | | Year | | | | | | | | |
| | | Ended | | | | | | | | |
| | | 2/28/05** | | 2/29/04 | | 2/28/03 | | 2/28/02 | | 2/28/01 |
| NET ASSET VALUE | | | | | | | | | | |
| Beginning of period | $ | 10.21 | $ | 10.05 | $ | 9.81 | $ | 9.72 | $ | 9.10 |
| |
| Investment activities | | | | | | | | | | |
| Net investment income (loss) | | 0.43 | | 0.44 | | 0.47 | | 0.48 | | 0.49 |
| Net realized and | | | | | | | | | | |
| unrealized gain (loss) | | (0.15) | | 0.16 | | 0.24 | | 0.09 | | 0.62 |
| Total from | | | | | | | | | | |
| investment activities | | 0.28 | | 0.60 | | 0.71 | | 0.57 | | 1.11 |
| |
| Distributions | | | | | | | | | | |
| Net investment income | | (0.43) | | (0.44) | | (0.47) | | (0.48) | | (0.49) |
| |
| NET ASSET VALUE | | | | | | | | | | |
| End of period | $ | 10.06 | $ | 10.21 | $ | 10.05 | $ | 9.81 | $ | 9.72 |
| |
| |
| Ratios/Supplemental Data | | | | | | | | | | |
| Total return^ | | 2.87% | | 6.17% | | 7.42% | | 5.99% | | 12.55% |
| Ratio of total expenses to | | | | | | | | | | |
| average net assets | | 0.54% | | 0.54% | | 0.55% | | 0.54% | | 0.54% |
| Ratio of net investment | | | | | | | | | | |
| income (loss) to average | | | | | | | | | | |
| net assets | | 4.33% | | 4.47% | | 4.78% | | 4.95% | | 5.25% |
| Portfolio turnover rate | | 29.8% | | 26.9% | | 24.4% | | 28.2% | | 28.6% |
| Net assets, end of period | | | | | | | | | | |
| (in millions) | $ | 1,459 | $ | 1,509 | $ | 1,501 | $ | 1,442 | $ | 1,403 |
| ^ | Total return reflects the rate that an investor would have earned on an investment in the fund during each period, |
| | assuming reinvestment of all distributions |
| ** | Per share amounts calculated using average shares outstanding method. |
| |
| |
| The accompanying notes are an integral part of these financial statements. |
| FINANCIAL HIGHLIGHTS | | For a share outstanding throughout each period |
| |
| Advisor Class | | | | | | |
| | | Year | | | | 9/30/02 |
| | | Ended | | | | Through |
| | | 2/28/05** | | 2/29/04 | | 2/28/03 |
| NET ASSET VALUE | | | | | | |
| Beginning of period | $ | 10.21 | $ | 10.05 | $ | 10.13 |
| |
| Investment activities | | | | | | |
| Net investment income | | 0.40 | | 0.41 | | 0.18* |
| Net realized and | | | | | | |
| unrealized gain (loss) | | (0.14) | | 0.16 | | (0.08) + |
| Total from investment activities | | 0.26 | | 0.57 | | 0.10 |
| |
| Distributions | | | | | | |
| Net investment income | | (0.40) | | (0.41) | | (0.18) |
| |
| NET ASSET VALUE | | | | | | |
| End of period | $ | 10.07 | $ | 10.21 | $ | 10.05 |
| |
| |
| Ratios/Supplemental Data | | | | | | |
| Total return^ | | 2.65% | | 5.82% | | 1.02%* |
| Ratio of total expenses to | | | | | | |
| average net assets | | 0.85% | | 0.86% | | 0.90%*† |
| Ratio of net investment | | | | | | |
| income (loss) to average | | | | | | |
| net assets | | 4.00% | | 4.10% | | 4.48%*† |
| Portfolio turnover rate | | 29.8% | | 26.9% | | 24.4% |
| Net assets, end of period | | | | | | |
| (in thousands) | $ 283,538 | $ | 165 | $ | 147 |
| ^ | Total return reflects the rate that an investor would have earned on an investment in the fund during each period, |
| | assuming reinvestment of all distributions. |
| * | Excludes expenses in excess of a 0.90% contractual expense limitation in effect through 6/30/06. |
| † | Annualized |
| ** | Per share amounts calculated using average shares outstanding method. |
| + | The amount presented is calculated pursuant to a methodology prescribed by the Securities and Exchange Commission |
| | for a share outstanding throughout the period. This amount is inconsistent with the fund’s aggregate gains and |
| | losses because of the timing of sales and redemptions of fund shares in relation to fluctuating market values for |
| | the investment portfolio. |
| |
| |
| The accompanying notes are an integral part of these financial statements. |
| PORTFOLIO OF INVESTMENTS (1) | | |
| (Amounts in 000s) | $ Par | Value |
| | |
| ALABAMA 1.0% | | |
| Alabama Water Pollution Control Auth. | | |
| 6.75%, 8/15/17 (Prerefunded 8/15/05†) (AMBAC Insured) | 2,685 | 2,741 |
| Baldwin County Eastern Shore Hosp. Auth. | | |
| Thomas Hosp. | | |
| 5.75%, 4/1/27 | 880 | 874 |
| 6.75%, 4/1/21 | 1,450 | 1,495 |
| Camden Ind. Dev. Board, IDRB, Weyerhaeuser | | |
| 6.125%, 12/1/24 | 2,500 | 2,707 |
| Phoenix, IDRB, PCR, MeadWestvaco, 6.10%, 5/15/30 | 3,750 | 3,981 |
| Tuscaloosa County Board of Ed., VRDN (Currently 1.87%) | 5,010 | 5,010 |
| Total Alabama (Cost $16,249) | | 16,808 |
| |
| ALASKA 0.7% | | |
| Alaska HFC | | |
| Single Family | | |
| 5.30%, 12/1/17 | 2,650 | 2,703 |
| 5.85%, 12/1/14 (MBIA Insured) | 1,705 | 1,755 |
| 5.875%, 12/1/24 (MBIA Insured) | 5,510 | 5,693 |
| Valdez Marine, PCR, BP Pipelines, VRDN (Currently 1.81%) | 2,200 | 2,200 |
| Total Alaska (Cost $11,784) | | 12,351 |
| |
| ARIZONA 0.8% | | |
| Arizona School Fac. Board, 5.50%, 7/1/18 | 5,000 | 5,573 |
| Maricopa County, PCR, Arizona Public Service | | |
| 1.875%, 5/1/29 (Tender 3/1/05) | 3,000 | 3,000 |
| Salt River Agricultural Improvement & Power, 5.00%, 1/1/08 | 2,250 | 2,387 |
| Scottsdale IDA, Healthcare, 5.80%, 12/1/31 | 2,000 | 2,145 |
| Total Arizona (Cost $12,462) | | 13,105 |
| |
| ARKANSAS 0.4% | | |
| Little Rock Health Fac. Board, Baptist Health, 6.85%, 11/1/08 | 2,495 | 2,780 |
| North Little Rock, 6.50%, 7/1/15 (MBIA Insured) | 4,000 | 4,795 |
| Total Arkansas (Cost $6,479) | | 7,575 |
| | | |
| CALIFORNIA 12.7% | | |
| Anaheim PFA, California Electric, 5.00%, 10/1/34 (MBIA Insured) | 3,380 | 3,505 |
| California, Economic Recovery, 5.00%, 7/1/16 | 20,000 | 21,539 |
| California, GO | | |
| 5.00%, 2/1/10 | 5,520 | 5,964 |
| 5.00%, 3/1/24 | 7,500 | 7,843 |
| 5.00%, 2/1/33 | 3,750 | 3,856 |
| 5.125%, 6/1/31 | 10,540 | 10,860 |
| 5.25%, 4/1/29 | 5,000 | 5,319 |
| 5.25%, 4/1/34 | 5,500 | 5,825 |
| 5.50%, 11/1/33 | 8,000 | 8,689 |
| 5.65%, 6/1/30 | 2,500 | 2,744 |
| California Dept. of Water Resources | | |
| Central Valley Project, 5.00%, 12/1/13 (FGIC Insured) | 8,000 | 8,759 |
| Power Supply | | |
| VRDN (Currently 1.76%) | 400 | 400 |
| 5.375%, 5/1/21 | 2,000 | 2,170 |
| 5.75%, 5/1/17 | 3,000 | 3,367 |
| California Public Works Board | | |
| Dept. of Corrections, 5.25%, 6/1/28 | 14,810 | 15,672 |
| Mental Health, 5.50%, 6/1/23 | 3,000 | 3,294 |
| California Statewide CDA | | |
| Community Hosp. of Monterey Peninsula | | |
| 5.25%, 6/1/23 (FSA Insured) | 2,000 | 2,140 |
| Sutter Health, 5.625%, 8/15/42 | 3,850 | 4,083 |
| Capistrano Unified School Dist. No. 90-2, 5.875%, 9/1/23 | 1,415 | 1,502 |
| Folsom, Community Fac. Dist. No. 10, 5.875%, 9/1/28 | 3,000 | 3,041 |
| Foothill / Eastern Transportation Corridor Agency | | |
| Zero Coupon, 1/1/15 (Escrowed to Maturity) | 5,000 | 3,357 |
| Zero Coupon, 1/1/17 (Escrowed to Maturity) | 18,000 | 10,889 |
| Golden State Tobacco Securitization Corp. | | |
| Tobacco Settlement | | |
| 5.50%, 6/1/33 | 7,500 | 8,076 |
| 5.625%, 6/1/38 | 8,500 | 9,226 |
| Los Angeles County, Marina Del Rey, COP, 6.50%, 7/1/08 | 2,680 | 2,710 |
| | | |
| Los Angeles Dept. of Water & Power, 5.00%, 7/1/23 | | |
| (MBIA Insured) | 5,000 | 5,284 |
| Los Angeles Harbor, 7.60%, 10/1/18 (Escrowed to Maturity) | 3,305 | 4,165 |
| Orange County, COP, 5.875%, 7/1/19 (MBIA Insured) | 6,000 | 6,364 |
| Palm Springs Fin. Auth., Convention Center | | |
| 5.50%, 11/1/29 (MBIA Insured) | 3,100 | 3,445 |
| San Diego Unified School Dist., 5.50%, 7/1/25 | | |
| (MBIA Insured) | 4,745 | 5,533 |
| San Francisco Public Utility Commission | | |
| 5.00%, 11/1/27 (FSA Insured) | 8,000 | 8,289 |
| San Jose Airport, 5.00%, 3/1/28 (MBIA Insured) | 3,500 | 3,639 |
| Southern California Public Power Auth., 6.75%, 7/1/11 | 4,050 | 4,757 |
| Union Elementary School Dist., GO | | |
| Zero Coupon, 9/1/12 (FGIC Insured) | 2,945 | 2,205 |
| Zero Coupon, 9/1/13 (FGIC Insured) | 3,520 | 2,503 |
| Univ. of California Regents | | |
| 5.125%, 5/15/15 (AMBAC Insured) | 6,900 | 7,575 |
| 5.125%, 5/15/17 (AMBAC Insured) | 10,000 | 10,896 |
| West Hollywood CDA, East Side Redev. Project | | |
| 5.625%, 9/1/28 | 2,015 | 2,086 |
| Total California (Cost $206,463) | | 221,571 |
| |
| COLORADO 0.3% | | |
| Arapahoe County, Highway | | |
| Zero Coupon, 8/31/26 (Prerefunded 8/31/05†) | 5,500 | 1,134 |
| Colorado HFA | | |
| Adventist Health / Sunbelt, 6.50%, 11/15/31 | 2,500 | 2,762 |
| Covenant Retirement Communities, 6.125%, 12/1/33 | 2,000 | 2,145 |
| Total Colorado (Cost $5,540) | | 6,041 |
| |
| CONNECTICUT 0.9% | | |
| Connecticut, 7.125%, 6/1/10 | 7,350 | 8,593 |
| Mohegan Tribe Indians | | |
| 6.00%, 1/1/16 | 2,250 | 2,413 |
| 6.25%, 1/1/31 | 4,750 | 5,023 |
| Total Connecticut (Cost $14,588) | | 16,029 |
| | | |
| DISTRICT OF COLUMBIA 2.5% | | |
| District of Columbia | | |
| 5.25%, 6/1/27 (Prerefunded 6/1/08†) (MBIA Insured) | 1,330 | 1,445 |
| 6.00%, 6/1/14 (Escrowed to Maturity) (MBIA Insured) | 2,305 | 2,729 |
| District of Columbia, GO | | |
| 5.125%, 6/1/17 (AMBAC Insured) | 12,720 | 13,773 |
| 5.25%, 6/1/27 (MBIA Insured) | 8,645 | 9,181 |
| 6.00%, 6/1/14 (MBIA Insured) | 4,400 | 5,154 |
| 6.00%, 6/1/15 (MBIA Insured) | 1,550 | 1,828 |
| 6.00%, 6/1/17 (MBIA Insured) | 4,250 | 5,049 |
| Tobacco Settlement, 5.25%, 5/15/09 | 5,000 | 5,196 |
| Total District of Columbia (Cost $40,390) | | 44,355 |
| |
| FLORIDA 2.3% | | |
| Coral Gables HFA, Baptist Health | | |
| 5.25%, 8/15/24 (FSA Insured) | 5,000 | 5,407 |
| Dade County, Zero Coupon, 2/1/09 (MBIA Insured) | 12,185 | 10,378 |
| Florida, Ed. Lottery, 5.50%, 7/1/14 (AMBAC Insured) | 5,470 | 6,175 |
| Florida Board of Ed., GO, Public Ed., 5.00%, 6/1/05 | 1,425 | 1,435 |
| Highlands County HFA | | |
| Adventist Health System / Sunbelt | | |
| 5.875%, 11/15/29 | 7,000 | 7,593 |
| 6.00%, 11/15/31 | 2,750 | 2,975 |
| Orange County HFA, Westminster Community Care | | |
| 6.75%, 4/1/34 | 2,500 | 2,172 |
| Port St. Lucie Utility | | |
| Zero Coupon, 9/1/16 (Prerefunded 9/1/06†) | | |
| (FGIC Insured) | 5,000 | 2,702 |
| Zero Coupon, 9/1/26 (Prerefunded 9/1/06†) | | |
| (FGIC Insured) | 5,000 | 1,419 |
| Total Florida (Cost $38,292) | | 40,256 |
| |
| GEORGIA 4.9% | | |
| Athens - Clarke County Unified Gov't. Dev. Auth., Univ. of Georgia | | |
| Athletic Assoc., VRDN (Currently 1.80%) | 2,000 | 2,000 |
| Atlanta Airport, 5.25%, 1/1/33 (FSA Insured) | 5,000 | 5,330 |
| Chatham County Hosp. Auth. | | |
| Memorial Univ. Medical Center | | |
| 5.75%, 1/1/29 | 3,500 | 3,755 |
| 6.125%, 1/1/24 | 4,000 | 4,362 |
| Coweta County Residential Care Fac. for the Elderly | | |
| Wesley Woods of Newnan-Peachtree City | | |
| 8.20%, 10/1/16 | 1,350 | 1,400 |
| 8.25%, 10/1/26 | 1,800 | 1,867 |
| Forsyth County School Dist. | | |
| 5.75%, 2/1/18 (Prerefunded 2/1/10†) | 2,800 | 3,191 |
| Fulton-DeKalb Hosp. Auth. | | |
| Grady Memorial Hosp. | | |
| 6.80%, 1/1/07 (Escrowed to Maturity) | | |
| (AMBAC Insured) | 5,530 | 5,947 |
| 6.80%, 1/1/08 (Escrowed to Maturity) | | |
| (AMBAC Insured) | 5,905 | 6,559 |
| 6.85%, 1/1/09 (Escrowed to Maturity) | | |
| (AMBAC Insured) | 6,310 | 7,215 |
| 6.85%, 1/1/10 (Escrowed to Maturity) | | |
| (AMBAC Insured) | 6,745 | 7,890 |
| Georgia Private Colleges & Univ. Auth., Emory Univ. | | |
| 5.50%, 11/1/24 | 6,225 | 6,895 |
| Gwinnett County School Dist., GO, 6.40%, 2/1/11 | 1,905 | 2,231 |
| Municipal Electric Auth. of Georgia | | |
| 5.50%, 1/1/20 | 3,000 | 3,344 |
| 5.70%, 1/1/19 (FGIC Insured) | 5,100 | 5,900 |
| 6.40%, 1/1/07 (AMBAC Insured) | 6,655 | 7,090 |
| 6.40%, 1/1/07 (Escrowed to Maturity) | | |
| (AMBAC Insured) | 845 | 903 |
| 7.25%, 1/1/24 (AMBAC Insured) | 6,500 | 8,917 |
| Total Georgia (Cost $75,438) | | 84,796 |
| |
| HAWAII 0.5% | | |
| Hawaii Airport, 5.75%, 7/1/21 (FGIC Insured) | 4,000 | 4,457 |
| Hawaii Dept. of Budget & Fin., Hawaii Pacific Health | | |
| B&F Kapiolani, 6.25%, 7/1/21 | 4,000 | 4,159 |
| Total Hawaii (Cost $7,823) | | 8,616 |
| | | |
| IDAHO 0.2% | | |
| Nez Perce County, IDRB, PCR, Potlatch, 7.00%, 12/1/14 | 2,600 | 2,948 |
| Total Idaho (Cost $2,600) | | 2,948 |
| |
| ILLINOIS 4.9% | | |
| Chicago, 6.75%, 1/1/35 (Prerefunded 7/1/10†) (FGIC Insured) | 5,000 | 5,926 |
| Chicago, GO | | |
| 5.50%, 1/1/14 (FSA Insured) | 5,000 | 5,649 |
| 5.50%, 1/1/18 (AMBAC Insured) | 3,880 | 4,435 |
| Chicago Board of Ed., GO, VRDN (Currently 1.81%) | | |
| (FSA Insured) | 3,400 | 3,400 |
| Chicago O'Hare Int'l. Airport, United Airlines | | |
| 6.30%, 5/1/16 ++ | 3,555 | 533 |
| Chicago Wastewater, VRDN (Currently 1.88%) | | |
| (MBIA Insured) | 5,225 | 5,225 |
| Illinois | | |
| Sales Tax | | |
| 5.50%, 6/15/16 | 2,000 | 2,228 |
| 6.125%, 6/15/16 | 2,000 | 2,274 |
| Illinois, GO, 5.25%, 4/1/06 | 7,000 | 7,204 |
| Illinois EFA, Northwestern Univ. | | |
| 5.25%, 11/1/32 (Tender 11/1/14) | 4,000 | 4,398 |
| Illinois Fin. Auth., Northwestern Memorial Hosp. | | |
| 5.50%, 8/15/43 | 8,000 | 8,520 |
| Illinois HFA | | |
| Glen Oaks Medical Center | | |
| 7.00%, 11/15/19 (Escrowed to Maturity) | 3,300 | 3,564 |
| Northwest Community Healthcare | | |
| VRDN (Currently 1.83%) | 800 | 800 |
| Illinois Unemployment Insurance Fund | | |
| 5.00%, 12/15/06 (FSA Insured) | 10,000 | 10,414 |
| Metropolitan Pier & Expo Auth., McCormick | | |
| Zero Coupon, 6/15/18 (FGIC Insured) | 14,160 | 7,724 |
| Regional Transportation Auth. | | |
| 6.70%, 11/1/21 (FGIC Insured) | 5,000 | 6,318 |
| 7.75%, 6/1/19 (FGIC Insured) | 5,350 | 7,185 |
| Total Illinois (Cost $81,597) | | 85,797 |
| | | |
| INDIANA 1.1% | | |
| Goshen, Greencroft Obligated Group, 5.75%, 8/15/19 | 3,000 | 2,980 |
| Indiana HFFA, Clarian Health Partners, 5.50%, 2/15/16 | 6,705 | 6,992 |
| Indiana Office Building Commission | | |
| 5.50%, 7/1/20 (Prerefunded 7/1/05†) (AMBAC Insured) | 4,500 | 4,640 |
| Indiana Transportation Fin. Auth., Highway | | |
| 5.375%, 12/1/25 | 3,360 | 3,628 |
| Indiana Transportation Fin. Auth., Highway | | |
| 5.375%, 12/1/25 (Prerefunded 12/1/10†) | 640 | 714 |
| Total Indiana (Cost $17,593) | | 18,954 |
| |
| IOWA 0.5% | | |
| Iowa Fin. Auth. | | |
| Single Family Mortgage, 5.70%, 1/1/27 | 2,640 | 2,659 |
| Wesley Retirement, 6.25%, 2/1/12 (Prerefunded 8/1/05†) | 2,400 | 2,461 |
| Scott County, Ridgecrest Village, 7.25%, 11/15/26 | 4,000 | 4,213 |
| Total Iowa (Cost $8,819) | | 9,333 |
| |
| KANSAS 1.2% | | |
| Burlington PCR, Kansas Gas & Electric | | |
| 5.30%, 6/1/31 (MBIA Insured) | 20,050 | 21,586 |
| Total Kansas (Cost $20,420) | | 21,586 |
| |
| LOUISIANA 0.5% | | |
| Calcasieu Parish, IDRB, PCR, Entergy, 5.45%, 7/1/10 | 1,750 | 1,771 |
| Louisiana Public Fac. Auth., Baton Rouge General Medical Center | | |
| 5.25%, 7/1/33 (MBIA Insured) | 4,000 | 4,236 |
| Sabine River Auth., PCR, Intl. Paper, 6.20%, 2/1/25 | 2,500 | 2,661 |
| Total Louisiana (Cost $8,360) | | 8,668 |
| |
| MARYLAND 3.4% | | |
| Baltimore City, GO | | |
| Consolidated Public Improvement | | |
| Muni Auction Rate (Currently 1.95%) 10/15/22 | | |
| (FSA Insured) | 2,000 | 2,000 |
| Muni Auction Rate (Currently 1.98%) 10/15/20 | | |
| (FSA Insured) | 5,000 | 5,000 |
| Baltimore County, Quail Ridge Apartments, Multi-Family | | |
| VRDN (Currently 1.86%) | 1,300 | 1,300 |
| Maryland CDA, Single Family, 5.95%, 4/1/16 | 4,720 | 4,900 |
| Maryland HHEFA | | |
| Adventist Healthcare, VRDN (Currently 1.89%) | 4,350 | 4,350 |
| Beth Tfiloh Dahan Community School | | |
| VRDN (Currently 1.87%) | 3,300 | 3,300 |
| Johns Hopkins Hosp., Zero Coupon, 7/1/19 | 7,675 | 3,847 |
| Mercy Ridge Retirement Community, 6.00%, 4/1/35 | 2,535 | 2,622 |
| Sheppard & Enoch Pratt Foundation | | |
| Muni Auction Rate (Currently 2.05%) 7/1/28 | | |
| (RAA Insured) | 6,700 | 6,700 |
| Univ. of Maryland Medical | | |
| VRDN (Currently 1.86%) (AMBAC Insured) | 1,970 | 1,970 |
| 7.00%, 7/1/22 (FGIC Insured) | 1,500 | 1,974 |
| Maryland Ind. Dev. Fin. Auth., Trinity Health | | |
| Muni Auction Rate (Currently 2.00%) 12/1/15 | 10,000 | 10,000 |
| Prince George's County Hosp., Dimensions Health | | |
| 5.30%, 7/1/24 | 5,685 | 4,684 |
| Univ. of Maryland, Auxiliary Fac. & Tuition | | |
| 5.75%, 4/1/17 (Prerefunded 4/1/06†) | 5,000 | 5,227 |
| Westminster, Carroll Lutheran Village | | |
| VRDN (Currently 1.85%) | 700 | 700 |
| Total Maryland (Cost $56,776) | | 58,574 |
| |
| MASSACHUSETTS 4.3% | | |
| Massachusetts | | |
| 5.25%, 8/1/16 (Prerefunded 8/1/13†) | 10,000 | 11,130 |
| 5.75%, 1/1/32 (FGIC Insured) | 6,000 | 6,747 |
| Massachusetts Bay Transportation Auth., 5.25%, 7/1/30 | 8,150 | 9,195 |
| Massachusetts Bay Transportation Auth., GO | | |
| 7.00%, 3/1/14 | 3,150 | 3,856 |
| 7.00%, 3/1/21 | 6,200 | 7,860 |
| Massachusetts HEFA | | |
| Harvard Univ. | | |
| 6.00%, 7/1/35 (Prerefunded 7/1/10†) | 3,500 | 4,026 |
| 6.25%, 4/1/20 | 5,000 | 6,265 |
| Partners Healthcare, 5.75%, 7/1/32 | 4,400 | 4,816 |
| Massachusetts Port Auth., 5.75%, 7/1/29 | 5,000 | 5,509 |
| Massachusetts Water Pollution Abatement Trust | | |
| 5.25%, 8/1/20 | 55 | 60 |
| 5.25%, 8/1/20 (Prerefunded 8/1/10†) | 3,695 | 4,118 |
| 5.75%, 8/1/29 (Prerefunded 8/1/09†) | 990 | 1,113 |
| Water Resources Auth. | | |
| 5.75%, 8/1/29 | 4,010 | 4,439 |
| 6.00%, 8/1/19 | 5,000 | 6,076 |
| Total Massachusetts (Cost $65,813) | | 75,210 |
| |
| MICHIGAN 1.1% | | |
| Cornell Township Economic Dev., PCR, MeadWestvaco | | |
| 5.875%, 5/1/18 | 2,000 | 2,203 |
| Michigan Building Auth., 5.50%, 10/15/19 | 5,000 | 5,571 |
| Michigan Hosp. Fin. Auth. | | |
| Ascension Health, 5.25%, 11/15/26 | 3,570 | 3,748 |
| Trinity Health, 6.00%, 12/1/20 | 1,500 | 1,661 |
| Michigan Strategic Fund, Ford Motor, 7.10%, 2/1/06 | 1,180 | 1,223 |
| Michigan Strategic Fund, IDRB, PCR, Detroit Edison | | |
| 5.45%, 9/1/29 | 5,000 | 5,238 |
| Total Michigan (Cost $18,334) | | 19,644 |
| |
| MINNESOTA 0.6% | | |
| Minneapolis & St. Paul Metropolitan Airport Commission | | |
| 5.25%, 1/1/32 (FGIC Insured) | 10,000 | 10,534 |
| Total Minnesota (Cost $9,747) | | 10,534 |
| |
| MISSISSIPPI 0.6% | | |
| Jackson County Port Fac., Chevron, VRDN (Currently 1.81%) | 3,200 | 3,200 |
| Mississippi Business Fin. PCR, Entergy Corp., 5.90%, 5/1/22 | 7,000 | 7,083 |
| Total Mississippi (Cost $10,135) | | 10,283 |
| |
| MISSOURI 0.4% | | |
| Good Shepherd Nursing Home Dist., 5.90%, 8/15/23 | 2,000 | 1,795 |
| Missouri HEFA, Washington Univ. / Dexia Credit | | |
| VRDN (Currently 1.81%) | 5,900 | 5,900 |
| Total Missouri (Cost $7,900) | | 7,695 |
| | | |
| NEBRASKA 0.2% | | |
| Omaha Public Power Dist., 6.20%, 2/1/17 | | |
| (Escrowed to Maturity) | 3,000 | 3,589 |
| Total Nebraska (Cost $2,991) | | 3,589 |
| |
| NEVADA 2.2% | | |
| Clark County, Fuel Tax, 5.125%, 7/1/16 (AMBAC Insured) | 10,870 | 11,866 |
| Clark County Airport, McCarran Int'l. Airport | | |
| 4.75%, 7/1/22 (MBIA Insured) | 2,970 | 3,036 |
| Clark County IDRB, PCR | | |
| Nevada Power, 5.30%, 10/1/11 | 2,000 | 1,987 |
| Southwest Gas, 5.45%, 3/1/38 (Tender 3/1/13) | 5,000 | 5,310 |
| Clark County School Dist., GO, 7.00%, 6/1/11 (MBIA Insured) | 3,500 | 4,198 |
| Nevada, 7.25%, 11/1/10 (Escrowed to Maturity) | 3,050 | 3,064 |
| Nevada Dept. of Business & Industry | | |
| Las Ventanas | | |
| 6.00%, 11/15/14 | 2,655 | 2,636 |
| 7.00%, 11/15/34 | 2,500 | 2,574 |
| Truckee Meadows Water Auth., 5.50%, 7/1/19 (FSA Insured) | 2,500 | 2,778 |
| Total Nevada (Cost $35,086) | | 37,449 |
| |
| NEW HAMPSHIRE 2.0% | | |
| New Hampshire Business Fin. Auth., PCR, Public Service | | |
| 5.45%, 5/1/21 (MBIA Insured) | 14,500 | 15,964 |
| New Hampshire HEFA | | |
| Covenant Health, 6.00%, 7/1/22 | 3,400 | 3,643 |
| Dartmouth-Hitchcock Obligation Group | | |
| 5.50%, 8/1/27 (FSA Insured) | 7,930 | 8,745 |
| Elliot Hosp., 5.60%, 10/1/22 | 1,000 | 1,043 |
| Wentworth-Douglas Hosp., 5.375%, 1/1/15 | | |
| (MBIA Insured) | 5,600 | 6,176 |
| Total New Hampshire (Cost $32,875) | | 35,571 |
| | | |
| NEW JERSEY 1.6% | | |
| Middlesex County Improvement Auth. | | |
| Student Housing Urban Renewal, 5.00%, 8/15/18 | 1,000 | 1,038 |
| Middlesex County, PCR, Amerada Hess, 6.05%, 9/15/34 | 2,000 | 2,124 |
| New Jersey Economic Dev. Auth. | | |
| Cigarette Tax, 5.625%, 6/15/19 | 2,500 | 2,659 |
| Harrogate, 5.875%, 12/1/26 | 3,500 | 3,557 |
| Motor Vehicle Surcharge | | |
| Zero Coupon, 7/1/20 (MBIA Insured) | 2,500 | 1,278 |
| 5.25%, 7/1/31 (MBIA Insured) | 5,000 | 5,378 |
| New Jersey HFFA | | |
| Pascack Valley Hosp. Assoc. | | |
| 6.50%, 7/1/23 | 3,000 | 2,968 |
| 6.625%, 7/1/36 | 3,000 | 2,961 |
| New Jersey Transportation Trust Fund | | |
| 5.75%, 6/15/25 (FGIC Insured) | 5,000 | 5,915 |
| Total New Jersey (Cost $26,775) | | 27,878 |
| |
| NEW MEXICO 0.9% | | |
| Farmington, PCR, El Paso Electric | | |
| 6.375%, 6/1/32 (Tender 8/1/05) | 2,500 | 2,533 |
| Jicarilla Apache Nation, 5.50%, 9/1/23 | 3,890 | 4,157 |
| Univ. of New Mexico Regents, Univ. of New Mexico Hosp. | | |
| 5.00%, 7/1/32 (FSA Insured) | 7,840 | 8,067 |
| Total New Mexico (Cost $14,418) | | 14,757 |
| |
| NEW YORK 16.7% | | |
| Dormitory Auth. of the State of New York | | |
| 5.25%, 5/15/19 | 3,325 | 3,689 |
| City Univ. | | |
| 5.75%, 7/1/13 | 10,000 | 11,256 |
| 5.75%, 7/1/18 (AMBAC Insured) | 5,000 | 5,880 |
| 6.00%, 7/1/14 | 10,000 | 11,407 |
| State Univ. Ed. Fac., 5.75%, 5/15/19 | | |
| (Prerefunded 5/15/10†) (FGIC Insured) | 4,945 | 5,624 |
| State Univ. of New York, 5.25%, 5/15/15 | | |
| (AMBAC Insured) | 3,600 | 4,009 |
| Metropolitan Transportation Auth. | | |
| 5.00%, 4/1/29 (Prerefunded 10/1/14†) (FSA Insured) | 7,290 | 8,099 |
| 5.00%, 11/15/33 (AMBAC Insured) | 7,500 | 7,822 |
| 5.125%, 11/15/31 | 5,000 | 5,166 |
| 5.25%, 11/15/31 | 2,945 | 3,099 |
| 5.25%, 11/15/32 | 10,000 | 10,572 |
| Commuter Fac., 5.75%, 7/1/21 | | |
| (Prerefunded 1/1/08†) (MBIA Insured) | 12,750 | 13,991 |
| New York City, GO | | |
| 5.00%, 8/1/06 | 3,000 | 3,101 |
| 5.00%, 8/1/07 | 5,000 | 5,257 |
| 5.00%, 8/1/16 | 3,000 | 3,202 |
| 5.00%, 3/1/30 | 7,000 | 7,240 |
| 5.25%, 8/1/13 | 5,000 | 5,505 |
| 5.25%, 8/1/15 | 9,500 | 10,332 |
| 5.25%, 5/15/22 | 10,000 | 10,692 |
| 5.25%, 8/15/26 | 5,000 | 5,370 |
| 5.50%, 6/1/21 | 7,500 | 8,158 |
| 6.00%, 12/1/18 (Escrowed to Maturity) (FSA Insured) | 5,000 | 5,049 |
| 6.00%, 10/15/26 (Prerefunded 10/15/07†) | 1,950 | 2,137 |
| 6.00%, 5/15/30 | 520 | 581 |
| 6.00%, 5/15/30 (Prerefunded 5/15/10†) | 2,360 | 2,712 |
| 6.25%, 8/1/09 | 4,850 | 5,151 |
| 6.25%, 8/1/09 (Prerefunded 8/1/06†) | 200 | 213 |
| New York City Municipal Water Fin. Auth. | | |
| VRDN (Currently 1.88%) (MBIA Insured) | 1,500 | 1,500 |
| 5.00%, 6/15/32 | 10,000 | 10,249 |
| Water & Sewer | | |
| 5.50%, 6/15/33 | 9,000 | 9,734 |
| 6.00%, 6/15/33 (Prerefunded 6/15/10†) | 2,220 | 2,554 |
| New York City Transitional Fin. Auth. | | |
| 5.75%, 11/15/20 | 4,990 | 5,570 |
| 5.75%, 11/15/20 (Prerefunded 5/15/10†) | 510 | 580 |
| 6.00%, 8/15/17 (Prerefunded 8/15/09†) | 4,000 | 4,546 |
| STEP, 5.25%, 2/1/29 | 16,640 | 18,065 |
| New York State Environmental Fac. Corp., PCR | | |
| EFC Pooled Loan, 6.90%, 11/15/15 | 215 | 220 |
| New York State Housing Fin. Agency, 5.00%, 9/15/34 | 3,000 | 3,110 |
| New York State Mortgage Agency, Single Family | | |
| 5.70%, 4/1/16 | 4,090 | 4,322 |
| New York State Thruway Auth., 5.50%, 3/15/20 | 3,000 | 3,330 |
| New York State Urban Dev. Corp., 5.50%, 7/1/26 | 10,000 | 10,525 |
| Tobacco Settlement Fin. Corp. | | |
| 5.00%, 6/1/06 | 3,715 | 3,821 |
| 5.00%, 6/1/08 | 5,720 | 6,071 |
| 5.25%, 6/1/20 (AMBAC Insured) | 5,000 | 5,413 |
| 5.25%, 6/1/21 (AMBAC Insured) | 2,500 | 2,696 |
| Triborough Bridge & Tunnel Auth. | | |
| General Purpose | | |
| 5.25%, 1/1/28 (Prerefunded 1/1/22†) | 10,000 | 11,389 |
| 5.50%, 1/1/17 (Escrowed to Maturity) | 18,275 | 21,101 |
| Total New York (Cost $266,994) | | 290,110 |
| |
| NORTH CAROLINA 1.5% | | |
| North Carolina, GO, VRDN (Currently 1.90%) | 960 | 960 |
| North Carolina Eastern Municipal Power Agency | | |
| 5.30%, 1/1/15 | 1,000 | 1,065 |
| 5.375%, 1/1/16 | 2,000 | 2,132 |
| 6.70%, 1/1/19 | 3,965 | 4,443 |
| 7.50%, 1/1/10 | 4,330 | 5,005 |
| 7.50%, 1/1/10 (Escrowed to Maturity) | 4,650 | 5,565 |
| North Carolina Municipal Power Agency | | |
| Catawba Electric | | |
| 5.50%, 1/1/13 | 2,250 | 2,493 |
| 6.50%, 1/1/20 | 4,500 | 5,055 |
| Total North Carolina (Cost $24,330) | | 26,718 |
| | | |
| OHIO 1.4% | | |
| Cuyahoga County Hosp., Cleveland Clinic Obligation Group | | |
| 6.00%, 1/1/32 | 5,000 | 5,502 |
| Franklin County Hosp., Holy Cross Trinity Health Corp. | | |
| VRDN (Currently 1.88%) | 1,400 | 1,400 |
| Montgomery County Hosp., Catholic Health Initiatives | | |
| 6.00%, 12/1/19 | 3,190 | 3,572 |
| Montgomery County Hosp., Catholic Health Initiatives | | |
| 6.00%, 12/1/19 (Escrowed to Maturity) | 3,310 | 3,774 |
| Ohio State Univ., 5.25%, 6/1/17 (Tender 12/1/16) | 5,000 | 5,498 |
| Ohio Water Dev. Auth., PCR, FirstEnergy, 7.70%, 8/1/25 | 3,950 | 4,118 |
| Total Ohio (Cost $22,196) | | 23,864 |
| |
| OKLAHOMA 0.5% | | |
| Jackson County Memorial Hosp. Auth., 7.30%, 8/1/15 | 2,000 | 2,053 |
| Oklahoma Dev. Fin. Auth., Inverness Village, 8.00%, 2/1/32 | 1,500 | 1,201 |
| Tulsa County Home Fin. Auth., Single Family | | |
| 6.90%, 8/1/10 (Escrowed to Maturity) (FGIC Insured) | 4,250 | 5,011 |
| Total Oklahoma (Cost $7,265) | | 8,265 |
| |
| OREGON 0.3% | | |
| Oregon Housing & Community Services Dept., Single Family | | |
| 6.00%, 7/1/20 | 2,425 | 2,471 |
| Umatilla County Hosp. Fac. Auth., Catholic Health Initiatives | | |
| 5.50%, 3/1/22 | 955 | 1,032 |
| Umatilla County Hosp. Fac. Auth., Catholic Health Initiatives | | |
| 5.50%, 3/1/22 (Escrowed to Maturity) | 1,255 | 1,403 |
| Total Oregon (Cost $4,617) | | 4,906 |
| |
| PENNSYLVANIA 2.4% | | |
| Allegheny County Hosp. Dev. Auth., West Penn Allegheny Health, | | |
| 9.25%, 11/15/22 | 3,000 | 3,470 |
| Beaver County IDA, PCR, FirstEnergy, 7.75%, 7/15/25 | 3,900 | 4,057 |
| Chester County HEFA, Jefferson Health, 5.375%, 5/15/27 | 6,500 | 6,674 |
| Cumberland County Municipal Auth., Wesley Affiliated Services, | | |
| 7.125%, 1/1/25 | 3,000 | 3,130 |
| Pennsylvania Intergov't. Cooperative Auth. | | |
| 6.75%, 6/15/21 (Prerefunded 6/15/05†) (FGIC Insured) | 4,750 | 4,815 |
| Pennsylvania State Univ., 5.00%, 9/1/35 | 2,000 | 2,085 |
| Pennsylvania Turnpike Commission | | |
| 5.25%, 12/1/32 (AMBAC Insured) | 7,500 | 8,081 |
| 5.50%, 7/15/33 (AMBAC Insured) | 3,500 | 3,820 |
| St. Mary Hosp. Auth., Catholic Health East, 5.375%, 11/15/34 | 1,350 | 1,407 |
| West Shore Area Auth., Holy Spirit Hosp., 6.20%, 1/1/26 | 3,250 | 3,482 |
| Total Pennsylvania (Cost $37,954) | | 41,021 |
| |
| PUERTO RICO 1.1% | | |
| Puerto Rico Housing Fin. Auth. | | |
| 5.00%, 12/1/20 (MBIA Insured) | 7,475 | 7,904 |
| Puerto Rico Public Buildings Auth., GO | | |
| 4.00%, 7/1/26 (Tender 7/1/07) | 2,750 | 2,840 |
| Puerto Rico Public Fin. Corp. | | |
| 5.25%, 8/1/29 (Tender 2/1/12) (MBIA Insured) | 7,000 | 7,729 |
| Total Puerto Rico (Cost $18,142) | | 18,473 |
| |
| SOUTH CAROLINA 3.3% | | |
| Connector 2000 Assoc. | | |
| Zero Coupon, 1/1/09 | 2,700 | 1,441 |
| Zero Coupon, 1/1/10 | 3,400 | 2,041 |
| Zero Coupon, 1/1/11 | 2,200 | 607 |
| Zero Coupon, 1/1/29 | 20,500 | 2,722 |
| Georgetown County PCR, Int'l. Paper, 5.70%, 4/1/14 | 4,000 | 4,435 |
| Medical Univ. Hosp. Auth., 5.00%, 8/15/31 (MBIA Insured) | 10,550 | 10,879 |
| Piedmont Municipal Power Agency | | |
| 6.50%, 1/1/14 (FGIC Insured) | 3,000 | 3,593 |
| Piedmont Municipal Power Agency | | |
| 6.50%, 1/1/14 (Escrowed to Maturity) (FGIC Insured) | 500 | 606 |
| South Carolina Jobs Economic Dev. Auth., Bon Secours Health | | |
| 5.625%, 11/15/30 | 4,000 | 4,140 |
| South Carolina Public Service Auth. | | |
| 5.875%, 1/1/23 (Prerefunded 1/1/06†) (FGIC Insured) | 8,030 | 8,396 |
| 6.25%, 1/1/22 (Prerefunded 1/1/06†) | | |
| (AMBAC Insured) | 17,750 | 18,661 |
| Total South Carolina (Cost $58,140) | | 57,521 |
| | | |
| SOUTH DAKOTA 0.6% | | |
| South Dakota HEFA | | |
| Sioux Valley Hosp. | | |
| VRDN (Currently 4.85%) (Tender 5/1/06) | 5,000 | 5,117 |
| 5.25%, 11/1/27 | 2,000 | 2,064 |
| 5.50%, 11/1/31 | 3,000 | 3,180 |
| Total South Dakota (Cost $10,228) | | 10,361 |
| |
| TENNESSEE 1.9% | | |
| Chattanooga Health Ed. & Housing Fac. Board | | |
| Chattanooga Memorial Hosp. | | |
| 6.625%, 9/1/07 (Escrowed to Maturity) | | |
| (MBIA Insured) | 2,950 | 3,234 |
| 6.625%, 9/1/08 (Escrowed to Maturity) | | |
| (MBIA Insured) | 3,150 | 3,552 |
| Clarksville Public Building Auth., GO | | |
| VRDN (Currently 1.80%) | 6,200 | 6,200 |
| Metropolitan Nashville & Davidson Counties, Water & Sewer | | |
| STEP, 7.70%, 1/1/12 (FGIC Insured) | 6,250 | 7,568 |
| Montgomery County Public Building Auth., GO | | |
| VRDN (Currently 1.80%) | 8,430 | 8,430 |
| Shelby County Health Ed. & Housing Board, Bonheur | | |
| 5.50%, 8/15/12 (Escrowed to Maturity) (MBIA Insured) | 4,000 | 4,400 |
| Total Tennessee (Cost $31,501) | | 33,384 |
| |
| TEXAS 6.6% | | |
| Abilene Health Fac. Dev. Corp., Sears Methodist Retirement | | |
| 7.00%, 11/15/33 | 3,500 | 3,683 |
| Amarillo Health Fac. Dev. Corp., Sears Panhandle Retirement | | |
| 7.75%, 8/15/26 (Prerefunded 8/15/06†) | 5,000 | 5,470 |
| Austin, Water & Wastewater, 5.125%, 5/15/27 (FSA Insured) | 10,955 | 11,373 |
| Brazos River Auth. PCR, Reliant / Centerpoint Energy | | |
| 7.75%, 12/1/18 | 4,000 | 4,427 |
| Cass County PCR, IDC, Int'l. Paper, 4.80%, 3/1/25 | 1,780 | 1,760 |
| Dallas Independent School Dist., 5.00%, 8/15/29 | 5,000 | 5,206 |
| Denison Hosp. Auth., Texoma Medical Center | | |
| 7.00%, 8/15/14 | 4,245 | 4,335 |
| Harris County Health Fac. Dev. Corp. | | |
| Memorial Hermann Healthcare, 6.375%, 6/1/29 | 4,000 | 4,378 |
| Methodist Hosp., VRDN (Currently 1.80%) | 2,700 | 2,700 |
| St. Luke's Episcopal, 5.375%, 2/15/26 | 5,500 | 5,748 |
| Texas Childrens Hosp., 5.25%, 10/1/19 | 5,000 | 5,235 |
| Harris County Hosp. Dist., 7.40%, 2/15/10 | | |
| (Escrowed to Maturity) (AMBAC Insured) | 350 | 383 |
| Houston, 6.40%, 6/1/27 | 4,250 | 4,607 |
| Houston, GO, 5.50%, 3/1/18 (FSA Insured) | 2,750 | 3,033 |
| Houston Airport, 5.50%, 7/1/19 (FSA Insured) | 2,000 | 2,223 |
| Houston Higher Ed. Fin. Corp., Rice Univ., 5.375%, 11/15/29 | 11,450 | 12,206 |
| Houston Independent School Dist., GO | | |
| 5.00%, 7/15/20 (FSA Insured) | 3,000 | 3,176 |
| Houston Water & Sewer, 5.75%, 12/1/18 | | |
| (Prerefunded 12/1/12†) (AMBAC Insured) | 3,000 | 3,461 |
| Lower Colorado River Auth., 6.00%, 5/15/12 (FSA Insured) | 6,095 | 6,829 |
| Sabine River Auth., PCR | | |
| TXU Energy | | |
| 5.50%, 5/1/22 (Tender 11/1/11) | 4,580 | 4,951 |
| 5.80%, 7/1/22 | 1,500 | 1,607 |
| 6.15%, 8/1/22 | 2,850 | 3,161 |
| Texas A&M Univ. | | |
| 5.375%, 5/15/16 | 4,750 | 5,235 |
| 5.375%, 5/15/18 | 2,570 | 2,825 |
| Texas Dept. of Housing & Community Affairs, Asmara | | |
| 6.40%, 1/1/27 (Prerefunded 1/1/07†) | 5,820 | 6,325 |
| Total Texas (Cost $105,882) | | 114,337 |
| |
| VIRGINIA 3.3% | | |
| Chesapeake IDA, PCR, Virginia Electric & Power | | |
| 5.25%, 2/1/08 | 3,000 | 3,073 |
| Fairfax County, COP, 6.10%, 4/15/32 | 5,000 | 5,754 |
| Fairfax County IDA, Inova Health System | | |
| VRDN (Currently 1.81%) | 3,490 | 3,490 |
| Fairfax County Water Auth., 6.00%, 4/1/22 | 3,835 | 4,150 |
| Fairfax County Water Auth. | | |
| 6.00%, 4/1/22 (Prerefunded 4/1/07†) | 3,815 | 4,151 |
| Fredericksburg IDA, Medicorp Health, 5.25%, 6/15/27 | 2,750 | 2,847 |
| Greater Richmond Convention Center, 6.125%, 6/15/29 | 8,550 | 9,627 |
| James City & County IDA, Williamsburg Landing | | |
| 6.125%, 3/1/32 | 2,000 | 2,090 |
| Loudoun County IDA, Falcons Landing, 6.00%, 8/1/24 | 2,500 | 2,585 |
| Roanoke IDA, Carilion Health System | | |
| VRDN (Currently 1.80%) | 8,700 | 8,700 |
| Virginia College Building Auth., Washington & Lee Univ. | | |
| 5.25%, 1/1/31 (MBIA Insured) | 5,000 | 5,660 |
| Virginia Transportation Board | | |
| 5.25%, 5/15/20 (Prerefunded 5/15/11†) | 4,620 | 5,129 |
| Total Virginia (Cost $53,940) | | 57,256 |
| |
| WASHINGTON 4.8% | | |
| Chelan County Public Utility Dist. #1, Rock Island Hydro | | |
| Zero Coupon, 6/1/18 (MBIA Insured) | 10,100 | 5,446 |
| Energy Northwest, Public Power Supply | | |
| 5.25%, 7/1/16 (FSA Insured) | 3,000 | 3,203 |
| King County Public Hosp. Dist. #1, Valley Medical Center | | |
| 5.75%, 9/1/20 (AMBAC Insured) | 10,950 | 12,815 |
| Port of Seattle, 5.50%, 2/1/26 (MBIA Insured) | 6,000 | 6,499 |
| Snohomish County Housing Auth., Millwood Estates | | |
| 5.50%, 6/1/29 | 3,750 | 3,799 |
| Tacoma Solid Waste Utility | | |
| 5.50%, 12/1/17 (AMBAC Insured) | 12,080 | 12,959 |
| Tacoma Solid Waste Utility, 5.50%, 12/1/17 | | |
| (Prerefunded 12/1/07†) (AMBAC Insured) | 2,420 | 2,624 |
| Washington, GO | | |
| VRDN (Currently 1.90%) (MBIA Insured) | 8,895 | 8,895 |
| 5.00%, 1/1/28 (AMBAC Insured) | 5,000 | 5,203 |
| 5.70%, 10/1/15 | 14,000 | 15,948 |
| Motor Vehicle Fuel Tax, 6.625%, 1/1/25 | 6,100 | 6,959 |
| Total Washington (Cost $76,894) | | 84,350 |
| |
| WEST VIRGINIA 1.2% | | |
| Mason County, PCR, Appalachian Power, 5.50%, 10/1/22 | 8,000 | 8,150 |
| West Virginia Building Commission, GO, Regional Jail Court Fees | | |
| 5.375%, 7/1/18 (AMBAC Insured) | 2,915 | 3,287 |
| West Virginia Hosp. Fin. Auth. | | |
| Charleston Medical Center, 5.75%, 9/1/13 (MBIA Insured) | 4,200 | 4,352 |
| Oak Hill Hosp., 6.75%, 9/1/22 (Prerefunded 9/1/10†) | 5,000 | 5,932 |
| Total West Virginia (Cost $20,090) | | 21,721 |
| |
| WISCONSIN 1.3% | | |
| Manitowoc, Electric Power, 5.25%, 10/1/34 (FGIC Insured) | 9,250 | 9,738 |
| Wisconsin HEFA | | |
| Froedert & Community Health | | |
| 5.625%, 10/1/14 | 1,000 | 1,080 |
| 5.625%, 10/1/15 | 1,100 | 1,183 |
| 5.625%, 10/1/17 | 3,725 | 3,992 |
| United Health Group / Thedacare | | |
| 5.50%, 12/15/16 (MBIA Insured) | 6,540 | 7,062 |
| Total Wisconsin (Cost $21,840) | | 23,055 |
| |
| WYOMING 0.3% | | |
| Wyoming CDA, 5.30%, 6/1/17 | 4,600 | 4,889 |
| Total Wyoming (Cost $4,600) | | 4,889 |
| |
| OPTIONS PURCHASED 0% | | |
| U.S. Treasury Notes, Put, 4/22/05 @ $109.00 * | 500 | 297 |
| Total Options Purchased (Cost $168) | | 297 |
| | | |
| Total Investments in Securities | | |
| 99.9% of Net Assets (Cost $1,620,528) | $ | 1,740,501 |
| (1) | Denominated in U.S. dollars unless other- |
| | wise noted |
| * | Non-income producing |
| † | Used in determining portfolio maturity |
| ++ | In default with respect to payment |
| | of interest. |
| AMBAC | AMBAC Assurance Corp. |
| CDA | Community Development Administration |
| COP | Certificates of Participation |
| EFA | Educational Facility Authority |
| FGIC | Financial Guaranty Insurance Company |
| FSA | Financial Security Assurance Inc. |
| GO | General Obligation |
| HEFA | Health & Educational Facility Authority |
| HFA | Health Facility Authority |
| HFC | Housing Finance Corp. |
| HFFA | Health Facility Financing Authority |
| HHEFA | Health & Higher Educational Facility |
| | Authority |
| IDA | Industrial Development Authority/Agency |
| IDC | Industrial Development Corp. |
| IDRB | Industrial Development Revenue Bond |
| MBIA | MBIA Insurance Corp. |
| PCR | Pollution Control Revenue |
| PFA | Public Finance Authority |
| RAA | Radian Asset Assurance Inc. |
| STEP | Stepped coupon bond for which the coupon |
| | rate of interest will adjust on specified future |
| | date(s) |
| VRDN | Variable-Rate Demand Note; rate shown is |
| | effective rate at period-end |
| |
| |
| The accompanying notes are an integral part of these financial statements. |
| STATEMENT OF ASSETS AND LIABILITIES | | | |
| (In thousands except shares and per share amounts) | | | |
| Assets | | | |
| Investments in securities, at value (cost $1,620,528) | | $ | 1,740,501 |
| Cash | | | 88 |
| Interest receivable | | | 19,249 |
| Receivable for investment securities sold | | | 4,975 |
| Receivable for shares sold | | | 1,129 |
| Other assets | | | 799 |
| Total assets | | | 1,766,741 |
| |
| Liabilities | | | |
| Investment management fees payable | | | 621 |
| Payable for investment securities purchased | | | 20,213 |
| Payable for shares redeemed | | | 1,462 |
| Due to affiliates | | | 45 |
| Other liabilities | | | 1,808 |
| Total liabilities | | | 24,149 |
| |
| NET ASSETS | | $ | 1,742,592 |
| Net Assets Consist of: | | | |
| Undistributed net investment income (loss) | | $ | 2,509 |
| Undistributed net realized gain (loss) | | | (1,651) |
| Net unrealized gain (loss) | | | 119,973 |
| Paid-in-capital applicable to 173,207,636 shares of | | | |
| $1.00 par value capital stock outstanding; | | | |
| 500,000,000 shares authorized | | | 1,621,761 |
| |
| NET ASSETS | | $ | 1,742,592 |
| |
| NET ASSET VALUE PER SHARE | | | |
| Investor Class | | | |
| ($1,459,054,192/145,039,142 shares outstanding) | | $ | 10.06 |
| Advisor Class | | | |
| ($283,538,033/28,168,494 shares outstanding) | | $ | 10.07 |
The accompanying notes are an integral part of these financial statements.
| STATEMENT OF OPERATIONS | | |
| ($ 000s) | | |
| | | Year |
| | | Ended |
| | | 2/28/05 |
| Investment Income (Loss) | | |
| Interest income | $ | 83,096 |
| Expenses | | |
| Investment management | | 7,926 |
| Shareholder servicing | | |
| Investor Class | | 641 |
| Advisor Class | | 266 |
| Rule 12b-1 fees | | 649 |
| Custody and accounting | | 239 |
| Prospectus and shareholder reports | | |
| Investor Class | | 97 |
| Advisor Class | | 31 |
| Registration | | 66 |
| Legal and audit | | 22 |
| Directors | | 7 |
| Proxy and annual meeting | | 1 |
| Miscellaneous | | 13 |
| Total expenses | | 9,958 |
| Expenses paid indirectly | | (6) |
| Net expenses | | 9,952 |
| Net investment income (loss) | | 73,144 |
| |
| Realized and Unrealized Gain (Loss) | | |
| Net realized gain (loss) | | |
| Securities | | 2,249 |
| Futures | | (99) |
| Written options | | 51 |
| Net realized gain (loss) | | 2,201 |
| Change in net unrealized gain (loss) | | |
| Securities | | (24,792) |
| Futures | | 161 |
| Change in net unrealized gain (loss) | | (24,631) |
| Net realized and unrealized gain (loss) | | (22,430) |
| |
| INCREASE (DECREASE) IN NET | | |
| ASSETS FROM OPERATIONS | $ | 50,714 |
The accompanying notes are an integral part of these financial statements.
| STATEMENT OF CHANGES IN NET ASSETS | | | | |
| ($ 000s) | | | | | | |
| | | | | Year | | |
| | | | | Ended | | |
| | | | | 2/28/05 | | 2/29/04 |
| |
| Increase (Decrease) in Net Assets | | | | | |
| Operations | | | | | | |
| Net investment income (loss) | | | $ | 73,144 | $ | 69,544 |
| Net realized gain (loss) | | | | 2,201 | | 6,795 |
| Change in net unrealized gain (loss) | | | (24,631) | | 18,853 |
| Increase (decrease) in net assets from operations | | 50,714 | | 95,192 |
| |
| Distributions to shareholders | | | | | | |
| Net investment income | | | | | | |
| Investor Class | | | | (62,470) | | (66,063) |
| Advisor Class | | | | (10,349) | | (2,986) |
| Decrease in net assets from distributions | | | (72,819) | | (69,049) |
| |
| Capital share transactions * | | | | | | |
| Shares sold | | | | | | |
| Investor Class | | | | 110,529 | | 181,840 |
| Advisor Class | | | | 199,746 | | 170,913 |
| Distributions reinvested | | | | | | |
| Investor Class | | | | 42,818 | | 44,495 |
| Advisor Class | | | | 10,340 | | 2,986 |
| Shares redeemed | | | | | | |
| Investor Class | | | | (180,331) | | (241,651) |
| Advisor Class | | | | (91,986) | | (11,868) |
| Increase (decrease) in net assets from | | | | | |
| capital share transactions | | | | 91,116 | | 146,715 |
| |
| Net Assets | | | | | | |
| Increase (decrease) during period | | | 69,011 | | 172,858 |
| Beginning of period | | | | 1,673,581 | | 1,500,723 |
| |
| End of period | | | $ | 1,742,592 | $ | 1,673,581 |
| (Including undistributed net investment income of | | | | |
| $2,509 at 2/28/05 and $2,437 at 2/29/04) | | | | | |
| | | |
| *Share information | | |
| Shares sold | | |
| Investor Class | 11,038 | 18,141 |
| Advisor Class | 20,228 | 17,004 |
| Distributions reinvested | | |
| Investor Class | 4,288 | 4,437 |
| Advisor Class | 1,034 | 298 |
| Shares redeemed | | |
| Investor Class | (18,086) | (24,132) |
| Advisor Class | (9,220) | (1,190) |
| Increase (decrease) in shares outstanding | 9,282 | 14,558 |
The accompanying notes are an integral part of these financial statements.
| NOTES TO FINANCIAL STATEMENTS |
NOTE 1 - SIGNIFICANT ACCOUNTING POLICIES
T. Rowe Price Tax-Free Income Fund, Inc. (the fund) is registered under the Investment Company Act of 1940 (the 1940 Act) as a diversified, open-end management investment company. The fund seeks to provide a high level of income exempt from federal income taxes by investing primarily in long-term investment-grade municipal securities. The fund has two classes of shares: the Tax-Free Income Fund original share class, referred to in this report as the Investor Class, offered since October 26, 1976, and Tax-Free Income Fund—Advisor Class (Advisor Class), offered since September 30, 2002. Advisor Class shares are sold only through unaffiliated brokers and other unaffiliated financial intermediaries that are compensated by the class for distribution, shareholder servicing, and/or certain administrative services under a Board-approved Rule 12b-1 plan. Each class has exclusive voting rights on matters related solely to that class, separate voting rights on matters that relate to both classes, and, in all other respects, the same rights and obligations as the other class.
The accompanying financial statements were prepared in accordance with accounting principles generally accepted in the United States of America, which require the use of estimates made by fund management.
Valuation The fund values its investments and computes its net asset value per share at the close of the New York Stock Exchange (NYSE), normally 4 p.m. ET, each day that the NYSE is open for business. Debt securities are generally traded in the over-the-counter market. Securities are valued at prices furnished by dealers who make markets in such securities or by an independent pricing service, which considers yield or price of bonds of comparable quality, coupon, maturity, and type, as well as prices quoted by dealers who make markets in such securities.
Options on futures contracts are valued at the last sale price. Financial futures contracts are valued at closing settlement prices.
Other investments, including restricted securities, and those for which the above valuation procedures are inappropriate or are deemed not to reflect fair value are stated at fair value as determined in good faith by the T. Rowe Price Valuation Committee, established by the fund’s Board of Directors.
Class Accounting The Advisor Class pays distribution, shareholder servicing, and/or certain administrative expenses in the form of Rule 12b-1 fees, in an amount not exceeding 0.25% of the class’s average daily net assets. Shareholder servicing, prospectus, and shareholder report expenses incurred by each class are charged directly to the class to which they relate. Expenses common to both classes and investment income are allocated to the classes based upon the relative daily net assets of each class’s settled shares; realized and unrealized gains and losses are allocated based upon the relative daily net assets of each class’s outstanding shares.
Credits The fund earns credits on temporarily uninvested cash balances at the custodian that reduce the fund’s custody charges. Custody expense in the accompanying financial statements is presented before reduction for credits, which are reflected as expenses paid indirectly.
Investment Transactions, Investment Income, and Distributions Income and expenses are recorded on the accrual basis. Premiums and discounts on debt securities are amortized for financial reporting purposes. Investment transactions are accounted for on the trade date. Realized gains and losses are reported on the identified cost basis. Payments (“variation margin”) made or received to settle the daily fluctuations in the value of futures contracts are recorded as unrealized gains or losses until the contracts are closed. Distributions to shareholders are recorded on the ex-dividend date. Income distributions are declared by each class on a daily basis and paid monthly. Capital gain distributions, if any, are declared and paid by the fund, typically on an annual basis.
Other In the normal course of business, the fund enters into contracts that provide general indemnifications. The fund’s maximum exposure under these arrangements is dependent on claims that may be made against the fund in the future and, therefore, cannot be estimated; however, based on experience, the risk of material loss from such claims is considered remote.
NOTE 2 - INVESTMENT TRANSACTIONS
Consistent with its investment objective, the fund engages in the following practices to manage exposure to certain risks or enhance performance. The investment objective, policies, program, and risk factors of the fund are described more fully in the fund’s prospectus and Statement of Additional Information.
Futures Contracts During the year ended February 28, 2005, the fund was a party to futures contracts, which provide for the future sale by one party and purchase by another of a specified amount of a specific financial instrument at an agreedupon price, date, time, and place. Risks arise from possible illiquidity of the futures market and from movements in security values and/or interest rates.
Options Call and put options on futures contracts give the holder the right to purchase or sell, respectively, a particular futures contract at a specified price on a certain date. Risks arise from possible illiquidity of the options market and from movements in underlying futures prices. Options are reflected in the accompanying Portfolio of Investments at market value. Transactions in options written and related premiums received during the year ended February 28, 2005, were as follows:
| | Number of | | |
| | Contracts | | Premiums |
| Outstanding at beginning of period | – | $ | – |
| Written | 75 | | 56,000 |
| Closed | (75) | | (56,000) |
| |
| Outstanding at end of period | – | $ | – |
Other Purchases and sales of portfolio securities, other than short-term securities, aggregated $554,261,000 and $479,524,000, respectively, for the year ended February 28, 2005.
NOTE 3 - FEDERAL INCOME TAXES
No provision for federal income taxes is required since the fund intends to continue to qualify as a regulated investment company under Subchapter M of the Internal Revenue Code and distribute to shareholders all of its income and gains. Federal income tax regulations differ from generally accepted accounting principles; therefore, distributions determined in accordance with tax regulations may differ significantly in amount or character from net investment income and realized gains for financial reporting purposes. Financial reporting records are adjusted for permanent book/tax differences to reflect tax character. Financial records are not adjusted for temporary differences.
Distributions during the year ended February 28, 2005 totaled $72,819,000 and were characterized as tax-exempt income. At February 28, 2005, the tax-basis components of net assets were as follows:
| Unrealized appreciation | $ 128,658,000 |
| Unrealized depreciation | (8,644,000) |
| Net unrealized appreciation (depreciation) | 120,014,000 |
| Undistributed tax-exempt income | 817,000 |
| Paid-in capital | 1,621,761,000 |
| |
| Net assets | $1,742,592,000 |
For federal income tax purposes, market discount is recognized as income at the time of sale in the amount of the lesser of gain or scheduled amortization. Accordingly, at February 28, 2005, amortization of $1,693,000 that has been recognized as income for financial reporting purposes is treated as unrealized appreciation for tax purposes.
For the year ended February 28, 2005, the fund recorded the following permanent reclassifications to reflect tax character. Reclassifications to paid-in capital relate primarily to a tax practice that treats a portion of the proceeds from each redemption of capital shares as a distribution of taxable net investment income and/or realized capital gain. Results of operations and net assets were not affected by these reclassifications.
| Undistributed net investment income | $ (253,000) |
| Undistributed net realized gain | (2,674,000) |
| Paid-in capital | 2,927,000 |
| |
| At February 28, 2005, the cost of investments for federal income tax purposes was $1,620,487,000. |
NOTE 4 - RELATED PARTY TRANSACTIONS
The fund is managed by T. Rowe Price Associates, Inc. (the manager or Price Associates), a wholly owned subsidiary of T. Rowe Price Group, Inc. The investment management agreement between the fund and the manager provides for an annual investment management fee, which is computed daily and paid monthly. The fee consists of an individual fund fee, equal to 0.15% of the fund’s averagedaily net assets, and the fund’s pro-rata share of a group fee. The group fee is calculated based on the combined net assets of certain mutual funds sponsored by Price Associates (the group) applied to a graduated fee schedule, with rates ranging from 0.48% for the first $1 billion of assets to 0.295% for assets in excess of $120 billion. The fund’s portion of the group fee is determined by the ratio of its average daily net assets to those of the group. At February 28, 2005, the effective annual group fee rate was 0.31% .
The Advisor Class is also subject to a contractual expense limitation through June 30, 2006. During the limitation period, the manager is required to waive its management fee and reimburse the class for any expenses, excluding interest, taxes, brokerage commissions, and extraordinary expenses, that would otherwise cause the class’s ratio of total expenses to average net assets (expense ratio) to exceed its expense limitation of 0.90% . Through June 30, 2008, the class is required to repay the manager for expenses previously reimbursed and management fees waived to the extent its net assets have grown or expenses have declined sufficiently to allow repayment without causing the class’s expense ratio to exceed its expense limitation. Pursuant to this agreement, at February 28, 2005, there were no amounts subject to repayment. For the year ended February 28, 2005, the Advisor Class operated below its expense limitation.
In addition, the fund has entered into service agreements with Price Associates and a wholly owned subsidiary of Price Associates (collectively, Price). Price Associates computes the daily share prices and maintains the financial records of the fund. T. Rowe Price Services, Inc., provides shareholder and administrative services in its capacity as the fund’s transfer and dividend disbursing agent. For the year ended February 28, 2005, expenses incurred pursuant to these service agreements were $113,000 for Price Associates and $436,000 for T. Rowe Price Services. The total amount payable at period end pursuant to these service agreements is reflected as due to affiliates in the accompanying financial statements.
| REPORT OF INDEPENDENT REGISTERED PUBLIC ACCOUNTING FIRM |
To the Board of Directors and Shareholders of T. Rowe Price Tax-Free Income Fund, Inc.
In our opinion, the accompanying statement of assets and liabilities, including the portfolio of investments, and the related statements of operations and of changes in net assets and the financial highlights present fairly, in all material respects, the financial position of T. Rowe Price Tax-Free Income Fund, Inc. (the “Fund”) at February 28, 2005, the results of its operations for the year then ended, the changes in its net assets for each of the two years in the period then ended and the financial highlights for each of the periods presented in the period then ended, in conformity with accounting principles generally accepted in the United States of America. These financial statements and financial highlights (hereafter referred to as “financial statements”) are the responsibility of the Fund’s management; our responsibility is to express an opinion on these financial statements based on our audits. We conducted our audits of these financial statements in accordance with the auditing standards of the Public Company Accounting Oversight Board (United States). Those standards require that we plan and perform the audit to obtain reasonable assurance about whether the financial statements are free of material misstatement. An audit includes examining, on a test basis, evidence supporting the amounts and disclosures in the financial statements, assessing the accounting principles used and significant estimates made by management, and evaluating the overall financial statement presentation. We believe that our audits, which included confirmation of securities at February 28, 2005 by correspondence with the custodian and brokers, provide a reasonable basis for our opinion.
PricewaterhouseCoopers
LLP Baltimore, Maryland
April 11, 2005
| TAX INFORMATION (UNAUDITED) FOR THE TAX YEAR ENDED 2/28/05 |
We are providing this information as required by the Internal Revenue Code. The amounts shown may differ from those elsewhere in this report because of differences between tax and financial reporting requirements.
The fund’s distributions to shareholders included:
$1,266,000 from short-term capital gains
$1,439,000 from long-term capital gains, subject to the 15% rate gains category.
$72,312,000 which qualified as exempt-interest dividends.
| INFORMATION ON PROXY VOTING POLICIES, PROCEDURES, AND RECORDS |
A description of the policies and procedures used by T. Rowe Price funds and portfolios to determine how to vote proxies relating to portfolio securities is available in each fund’s Statement of Additional Information, which you may request by calling 1-800-225-5132 or by accessing the SEC’s Web site, www.sec.gov. The description of our proxy voting policies and procedures is also available on our Web site, www.troweprice.com. To access it, click on the words “Company Info” at the top of our homepage for individual investors. Then, in the window that appears, click on the “Proxy Voting Policy” navigation button in the top left corner.
Each fund’s most recent annual proxy voting record is available on our Web site and through the SEC’s Web site. To access it through our Web site, follow the directions above, then click on the words “Proxy Voting Record” at the bottom of the Proxy Voting Policy page.
| HOW TO OBTAIN QUARTERLY PORTFOLIO HOLDINGS |
The fund files a complete schedule of portfolio holdings with the Securities and Exchange Commission for the first and third quarters of each fiscal year on Form N-Q. The fund’s Form N-Q is available electronically on the SEC’s Web site (www.sec.gov); hard copies may be reviewed and copied at the SEC’s Public Reference Room, 450 Fifth St. N.W., Washington, DC 20549. For more information on the Public Reference Room, call 1-800-SEC-0330.
| ABOUT THE FUND’S DIRECTORS AND OFFICERS |
Your fund is governed by a Board of Directors that meets regularly to review investments, performance, expenses, and other business matters, and is responsible for protecting the interests of shareholders. The majority of the fund’s directors are independent of T. Rowe Price Associates, Inc. (T. Rowe Price); “inside” directors are officers of T. Rowe Price. The Board of Directors elects the fund’s officers, who are listed in the final table. The business address of each director and officer is 100 East Pratt Street, Baltimore, MD 21202. The Statement of Additional Information includes additional information about the fund directors and is available without charge by calling a T. Rowe Price representative at 1-800-225-5132.
| Independent Directors | |
| |
| Name | |
| (Year of Birth) | Principal Occupation(s) During Past 5 Years and |
| Year Elected * | Directorships of Other Public Companies |
| |
| Anthony W. Deering | Chairman, Exeter Capital, LLC, private investment firm (2004 to present); |
| (1945) | Director, Chairman of the Board, and Chief Executive Officer, The Rouse |
| 1983 (Tax-Exempt Money, | Company, real estate developers (1997 to 2004); Director, Mercantile |
| Tax-Free Short- | Bank (4/03 to present) |
| Intermediate, Tax-Free | |
| Income) | |
| 1984 (Tax-Free High Yield) | |
| 1992 (Tax-Free | |
| Intermediate Bond) | |
| |
| Donald W. Dick, Jr. | Principal, EuroCapital Advisors, LLC, an acquisition and management |
| (1943) | advisory firm; Chairman, President, and CEO, The Haven Group, a cus- |
| 2001 (all tax-free funds) | tom manufacturer of modular homes (1/04 to present) |
| |
| David K. Fagin | Chairman and President, Nye Corporation (6/88 to present); Director, |
| (1938) | Canyon Resources Corporation, Golden Star Resources Ltd. (5/00 to |
| 2001 (all tax-free funds) | present), and Pacific Rim Mining Corporation (2/02 to present) |
| |
| Karen N. Horn | Managing Director and President, Global Private Client Services, Marsh |
| (1943) | Inc. (1999 to 2003); Managing Director and Head of International Private |
| 2003 (all tax-free funds) | Banking, Bankers Trust (1996 to 1999); Director, Eli Lilly and Company |
| | and Georgia Pacific (5/04 to present) |
| |
| F. Pierce Linaweaver | President, F. Pierce Linaweaver & Associates, Inc., consulting envi- |
| (1934) | ronmental and civil engineers |
| 1979 (Tax-Free Income) | |
| 1983 (Tax-Exempt Money, | |
| Tax-Free Short- | |
| Intermediate) | |
| 1984 (Tax-Free High Yield) | |
| 1992 (Tax-Free | |
| Intermediate Bond) | |
| |
| John G. Schreiber | Owner/President, Centaur Capital Partners, Inc., a real estate investment |
| (1946) | company; Partner, Blackstone Real Estate Advisors, L.P.; Director, AMLI |
| 1992 (all tax-free funds) | Residential Properties Trust and The Rouse Company, real estate |
| | developers |
| |
| * Each independent director oversees 112 T. Rowe Price portfolios and serves until retirement, resignation, or |
| election of a successor. | |
| |
| |
| Inside Directors | |
| |
| Name | |
| (Year of Birth) | |
| Year Elected * | |
| [Number of T. Rowe Price | Principal Occupation(s) During Past 5 Years and |
| Portfolios Overseen] | Directorships of Other Public Companies |
| |
| Mary J. Miller, CFA | Director and Vice President, T. Rowe Price; Vice President, T. Rowe |
| (1955) | Price Group, Inc.; President, Tax-Free Income Fund; Vice President, |
| 2004 (all tax-free funds) | Tax-Exempt Money, Tax-Free Short-Intermediate, and Tax-Free High |
| [38] | Yield Funds |
| |
| James S. Riepe | Director and Vice President, T. Rowe Price; Vice Chairman of the |
| (1943) | Board, Director, and Vice President, T. Rowe Price Group, Inc.; |
| 1983 (Tax-Exempt Money, | Chairman of the Board and Director, T. Rowe Price Global Asset |
| Tax-Free Income, Tax-Free | Management Limited, T. Rowe Price Global Investment Services |
| Short-Intermediate) | Limited, T. Rowe Price Investment Services, Inc., T. Rowe Price |
| 1984 (Tax-Free High Yield) | Retirement Plan Services, Inc., and T. Rowe Price Services, Inc.; |
| 1992 (Tax-Free | Chairman of the Board, Director, President, and Trust Officer, |
| Intermediate Bond) | T. Rowe Price Trust Company; Director, T. Rowe Price |
| [112] | International, Inc.; Chairman of the Board (all tax-free funds) |
| |
| * Each inside director serves until retirement, resignation, or election of a successor. |
| Officers | |
| |
| Name (Year of Birth) | |
| Title and Fund(s) Served | Principal Occupation(s) |
| |
| Stephen V. Booth, CPA (1961) | Vice President, T. Rowe Price, T. Rowe Price |
| Vice President, all tax-free funds | Group, Inc., and T. Rowe Price Trust Company |
| |
| Steven G. Brooks, CFA (1954) | Vice President, T. Rowe Price and T. Rowe Price |
| Vice President, Tax-Exempt Money Fund | Group, Inc. |
| |
| Joseph A. Carrier, CPA (1960) | Vice President, T. Rowe Price, T. Rowe Price |
| Treasurer, all tax-free funds | Group, Inc., T. Rowe Price Investment Services, |
| | Inc., and T. Rowe Price Trust Company |
| |
| Jonathan M. Chirunga (1966) | Vice President, T. Rowe Price; formerly Municipal |
| Vice President, Tax-Free Income Fund | Credit Analyst/Associate Director, Standard & |
| | Poor’s Rating Services (to 2001) |
| |
| Maria H. Condez (1962) | Assistant Vice President, T. Rowe Price |
| Assistant Vice President, Tax-Exempt | |
| Money Fund | |
| |
| G. Richard Dent (1960) | Vice President, T. Rowe Price and T. Rowe Price |
| Vice President, Tax-Exempt Money, Tax-Free | Group, Inc.; formerly Deputy General Counsel, |
| High Yield, and Tax-Free Income Funds | ACA Financial Guaranty Corporation (to 2001) |
| |
| Roger L. Fiery III, CPA (1959) | Vice President, T. Rowe Price, T. Rowe Price |
| Vice President, all tax-free funds | Group, Inc., T. Rowe Price International, Inc., |
| | and T. Rowe Price Trust Company |
| |
| John R. Gilner (1961) | Chief Compliance Officer and Vice President, |
| Chief Compliance Officer, all tax-free funds | T. Rowe Price; Vice President, T. Rowe Price |
| | Group, Inc., and T. Rowe Price Investment |
| | Services, Inc. |
| |
| Gregory S. Golczewski (1966) | Vice President, T. Rowe Price and T. Rowe Price |
| Vice President, all tax-free funds | Trust Company |
| |
| Charles B. Hill, CFA (1961) | Vice President, T. Rowe Price and T. Rowe Price |
| President, Tax-Free Intermediate Bond and Tax- | Group, Inc. |
| Free Short-Intermediate Funds; Vice President, | |
| Tax-Free High Yield and Tax-Free Income Funds | |
| |
| Henry H. Hopkins (1942) | Director and Vice President, T. Rowe Price |
| Vice President, all tax-free funds | Investment Services, Inc., T. Rowe Price Services, |
| | Inc., and T. Rowe Price Trust Company; Vice |
| | President, T. Rowe Price, T. Rowe Price Group, |
| | Inc., T. Rowe Price International, Inc., and T. Rowe |
| | Price Retirement Plan Services, Inc. |
| | |
| T. Dylan Jones (1971) | Assistant Vice President, T. Rowe Price |
| Assistant Vice President, Tax-Exempt | |
| Money Fund | |
| |
| Philip J. Kligman, CFA (1974) | Assistant Vice President, T. Rowe Price |
| Assistant Vice President, Tax-Free Intermediate | |
| Bond and Tax-Free Short-Intermediate Funds | |
| |
| Marcy M. Lash (1963) | Vice President, T. Rowe Price and T. Rowe Price |
| Vice President, Tax-Exempt Money, Tax-Free | Group, Inc. |
| High Yield, Tax-Free Income, and Tax-Free | |
| Short-Intermediate Funds | |
| |
| Alan D. Levenson, Ph.D. (1958) | Vice President, T. Rowe Price and T. Rowe Price |
| Vice President, Tax-Exempt Money Fund | Group, Inc. |
| |
| Patricia B. Lippert (1953) | Assistant Vice President, T. Rowe Price and |
| Secretary, all tax-free funds | T. Rowe Price Investment Services, Inc. |
| |
| Joseph K. Lynagh, CFA (1958) | Vice President, T. Rowe Price and T. Rowe Price |
| President, Tax-Exempt Money Fund | Group, Inc. |
| |
| Konstantine B. Mallas (1963) | Vice President, T. Rowe Price and T. Rowe Price |
| Vice President, Tax-Free High Yield, Tax-Free | Group, Inc. |
| Income, Tax-Free Intermediate Bond, and | |
| Tax-Free Short-Intermediate Funds | |
| |
| James M. McDonald (1949) | Vice President, T. Rowe Price, T. Rowe Price |
| Vice President, Tax-Exempt Money Fund | Group, Inc., and T. Rowe Price Trust Company |
| |
| Hugh D. McGuirk, CFA (1960) | Vice President, T. Rowe Price and T. Rowe Price |
| Vice President, Tax-Free High Yield, Tax-Free | Group, Inc. |
| Income, Tax-Free Intermediate Bond, and | |
| Tax-Free Short-Intermediate Funds | |
| |
| James M. Murphy, CFA (1967) | Vice President, T. Rowe Price and T. Rowe Price |
| President, Tax-Free High Yield Fund; Vice | Group, Inc.; formerly Portfolio Manager, |
| President, Tax-Free Income Fund | Prudential Investments (to 2000) |
| |
| Stephen P. Richter, CFA (1969) | Vice President, T. Rowe Price; formerly Vice |
| Vice President, Tax-Free High Yield, Tax-Free | President, Euler ACI (to 2000) |
| Income, and Tax-Free Intermediate Bond Funds | |
| | |
| Timothy G. Taylor, CFA (1975) | Assistant Vice President, T. Rowe Price |
| Assistant Vice President, Tax-Free Intermediate | |
| Bond and Tax-Free Short-Intermediate Funds | |
| |
| Julie L. Waples (1970) | Vice President, T. Rowe Price |
| Vice President, all tax-free funds | |
| |
| Edward A. Wiese, CFA (1959) | Vice President, T. Rowe Price, T. Rowe Price |
| Vice President, Tax-Exempt Money, | Group, Inc., and T. Rowe Price Trust Company; |
| Tax-Free Intermediate Bond, and Tax-Free | Chief Investment Officer, Director, and Vice |
| Short-Intermediate Funds | President, T. Rowe Price Savings Bank |
| |
| Unless otherwise noted, officers have been employees of T. Rowe Price or T. Rowe Price International for at |
| least five years. | |
Item 2. Code of Ethics.
The registrant has adopted a code of ethics, as defined in Item 2 of Form N-CSR, applicable to its principal executive officer, principal financial officer, principal accounting officer or controller, or persons performing similar functions. A copy of this code of ethics is filed as an exhibit to this Form N-CSR. No substantive amendments were approved or waivers were granted to this code of ethics during the period covered by this report.
Item 3. Audit Committee Financial Expert.
The registrant’s Board of Directors/Trustees has determined that Mr. David K. Fagin qualifies as an audit committee financial expert, as defined in Item 3 of Form N-CSR. Mr. Fagin is considered independent for purposes of Item 3 of Form N-CSR.
Item 4. Principal Accountant Fees and Services.
(a) – (d) Aggregate fees billed to the registrant for the last two fiscal years for professional services rendered by the registrant’s principal accountant were as follows:
| | 2005 | 2004 |
| Audit Fees | $12,155 | $13,110 |
| Audit-Related Fees | 1,386 | 1,174 |
| Tax Fees | 3,539 | 3,655 |
| All Other Fees | - | 124 |
Audit fees include amounts related to the audit of the registrant’s annual financial statements and services normally provided by the accountant in connection with statutory and regulatory filings. Audit-related fees include amounts reasonably related to the performance of the audit of the registrant’s financial statements, specifically the issuance of a report on internal controls. Tax fees include amounts related to tax compliance, tax planning, and tax advice. Other fees include the registrant’s pro-rata share of amounts for agreed-upon procedures in conjunction with service contract approvals by the registrant’s Board of Directors/Trustees.
(e)(1) The registrant’s audit committee has adopted a policy whereby audit and non-audit services performed by the registrant’s principal accountant for the registrant, its investment adviser, and any entity controlling, controlled by, or under common control with the investment adviser that provides ongoing services to the registrant require pre-approval in advance at regularly scheduled audit committee meetings. If such a service is required between regularly scheduled audit committee meetings, pre-approval may be authorized by one audit committee member with ratification at the next scheduled audit committee meeting. Waiver of pre-approval for audit or non-audit services requiring fees of a de minimis amount is not permitted.
(2) No services included in (b) – (d) above were approved pursuant to paragraph (c)(7)(i)(C) of Rule 2-01 of Regulation S-X.
(f) Less than 50 percent of the hours expended on the principal accountant’s engagement to audit the registrant’s financial statements for the most recent fiscal year were attributed to work performed by persons other than the principal accountant’s full-time, permanent employees.
(g) The aggregate fees billed for the most recent fiscal year and the preceding fiscal year by the registrant’s principal accountant for non-audit services rendered to the registrant, its investment adviser, and any entity controlling, controlled by, or under common control with the investment adviser that provides ongoing services to the registrant were $903,000 and $821,000, respectively, and were less than the aggregate fees billed for those same periods by the registrant’s principal accountant for audit services rendered to the T. Rowe Price Funds.
(h) All non-audit services rendered in (g) above were pre-approved by the registrant’s audit committee. Accordingly, these services were considered by the registrant’s audit committee in maintaining the principal accountant’s independence.Item 5. Audit Committee of Listed Registrants.
Not applicable.
Item 6. Schedule of Investments.
Not applicable. The complete schedule of investments is included in Item 1 of this Form N-CSR.
Item 7. Disclosure of Proxy Voting Policies and Procedures for Closed-End Management Investment Companies.
Not applicable.
Item 8. Portfolio Managers of Closed-End Management Investment Companies.
Not applicable.
Item 9. Purchases of Equity Securities by Closed-End Management Investment Company and Affiliated Purchasers.
Not applicable.
Item 10. Submission of Matters to a Vote of Security Holders.
Not applicable.
Item 11. Controls and Procedures.
(a) The registrant’s principal executive officer and principal financial officer have evaluated the registrant’s disclosure controls and procedures within 90 days of this filing and have concluded that the registrant’s disclosure controls and procedures were effective, as of that date, in ensuring that information required to be disclosed by the registrant in this Form N-CSR was recorded, processed, summarized, and reported timely.
(b) The registrant’s principal executive officer and principal financial officer are aware of no change in the registrant’s internal control over financial reporting that occurred during the registrant’s second fiscal quarter covered by this report that has materially affected, or is reasonably likely to materially affect, the registrant’s internal control over financial reporting.
Item 12. Exhibits.
(a)(1) The registrant’s code of ethics pursuant to Item 2 of Form N-CSR is attached.
(2) Separate certifications by the registrant's principal executive officer and principal financial officer, pursuant to Section 302 of the Sarbanes-Oxley Act of 2002 and required by Rule 30a-2(a) under the Investment Company Act of 1940, are attached.
(3) Written solicitation to repurchase securities issued by closed-end companies: not applicable.
(b) A certification by the registrant's principal executive officer and principal financial officer, pursuant to Section 906 of the Sarbanes-Oxley Act of 2002 and required by Rule 30a-2(b) under the Investment Company Act of 1940, is attached.SIGNATURES
Pursuant to the requirements of the Securities Exchange Act of 1934 and the Investment Company Act of 1940, the registrant has duly caused this report to be signed on its behalf by the undersigned, thereunto duly authorized.
T. Rowe Price Tax-Free Income Fund, Inc.
| By | /s/ James S. Riepe |
| | James S. Riepe |
| | Principal Executive Officer |
| |
| Date | April 15, 2005 |
Pursuant to the requirements of the Securities Exchange Act of 1934 and the Investment Company Act of 1940, this report has been signed below by the following persons on behalf of the registrant and in the capacities and on the dates indicated.
| By | /s/ James S. Riepe |
| | James S. Riepe |
| | Principal Executive Officer |
| |
| Date | April 15, 2005 |
| |
| |
| |
| By | /s/ Joseph A. Carrier |
| | Joseph A. Carrier |
| | Principal Financial Officer |
| |
| Date | April 15, 2005 |