UNITED STATES
SECURITIES AND EXCHANGE COMMISSION
Washington, DC 20549
SCHEDULE 14A
Proxy Statement Pursuant to Section 14(a) of the Securities
Exchange Act of 1934 (Amendment No. )
Filed by the Registrant x
Filed by a Party other than the Registrant o
Check the appropriate box:
| x | Preliminary Proxy Statement |
| o | Confidential, for Use of the Commission Only (as permitted by Rule 14a-6(e)(2)) |
| o | Definitive Proxy Statement |
| o | Definitive Additional Materials |
| o | Soliciting Material Pursuant to § 240.14a-12 |
St. Jude Medical, Inc.
(Name of Registrant as Specified In Its Charter)
(Name of Person(s) Filing Proxy Statement, if other than the Registrant)
Payment of Filing Fee (Check the appropriate box):
| x | No fee required |
| o | Fee computed on table below per Exchange Act Rules 14a-6(i)(1) and 0-11. |
| 1) | Title of each class of securities to which transaction applies: |
| 2) | Aggregate number of securities to which transaction applies: |
| 3) | Per unit price or other underlying value of transaction computed pursuant to Exchange Act Rule 0-11 (set forth the amount on which the filing fee is calculated and state how it was determined): |
| 4) | Proposed maximum aggregate value of transaction: |
| 5) | Total fee paid: |
| o | Fee paid previously with preliminary materials. |
| o | Check box if any part of the fee is offset as provided by Exchange Act Rule 0-11(a)(2) and identify the filing for which the offsetting fee was paid previously. Identify the previous filing by registration statement number, or the Form or Schedule and the date of its filing. |
| 1) | Amount Previously Paid: |
| 2) | Form, Schedule or Registration Statement No.: |
| 3) | Filing Party: |
| 4) | Date Filed: |
Notice of 2013 Annual Meeting and
Proxy Statement

|
ST. JUDE MEDICAL, INC. |
|
One St. Jude Medical Drive
St. Paul, Minnesota 55117
|
NOTICE OF ANNUAL MEETING OF SHAREHOLDERS |
|
|
|
TIME | 8:30 a.m. central time | |
| Thursday, May 2, 2013 | |
|
|
|
PLACE | Minnesota History Center | |
| 345 Kellogg Boulevard West | |
| St. Paul, Minnesota 55102 | |
|
|
|
ITEMS OF BUSINESS | (1) | To elect three members to our Board of Directors, for terms ending in 2016. |
|
|
|
| (2) | To approve an amendment to our Articles of Incorporation and Bylaws to declassify our Board of Directors. |
|
|
|
| (3) | To approve the compensation of our named executive officers. |
|
|
|
| (4) | To ratify the appointment of Ernst & Young LLP as our independent registered public accounting firm for 2013. |
|
|
|
| (5) | To transact such other business as may properly come before the meeting. |
|
|
|
RECORD DATE | Holders of St. Jude Medical, Inc. common stock of record at the close of business on March 5, 2013 are entitled to notice of and to vote at the meeting. | |
|
|
|
PROXY VOTING | It is important that your shares be represented at the meeting, regardless of the number of shares you hold. PLEASE VOTE AS SOON AS POSSIBLE BY MAIL, PHONE OR INTERNET. Instructions on voting your shares are on the Notice of Internet Availability of Proxy Materials you received for the annual meeting. If you received paper copies of our proxy materials, instructions on the different ways to vote your shares are found on the enclosed proxy form. You should vote by proxy even if you plan to attend the meeting. You can revoke a proxy at any time prior to its exercise at the meeting by following the instructions in the accompanying proxy statement. | |
|
|
|
|
| Jason Zellers |
| Vice President, General Counsel & Corporate Secretary |

March 22, 2013
i
|
|
|
|
|
|
| Page |
| 1 | ||
|
|
| |
|
| 1 | |
|
|
| |
|
| 2 | |
|
|
| |
|
| 2 | |
|
|
| |
|
| 3 | |
|
|
| |
| 4 | ||
|
|
| |
|
| 4 | |
|
|
| |
|
| 5 | |
|
|
| |
|
| 6 | |
|
|
| |
|
| 6 | |
|
|
| |
|
| 6 | |
|
|
| |
|
| 6 | |
|
|
| |
|
| 6 | |
|
|
| |
|
| 7 | |
|
|
| |
| Director Independence and Audit Committee Financial Literacy and Expertise |
| 7 |
|
|
| |
|
| 8 | |
|
|
| |
|
| 10 | |
|
|
| |
|
| 11 | |
|
|
| |
|
| 12 | |
|
|
| |
|
| 14 | |
|
|
| |
|
| 14 | |
|
|
| |
|
| 14 | |
|
|
| |
|
| 16 | |
|
|
| |
| 17 | ||
|
|
| |
|
| 17 | |
|
|
| |
|
| 18 | |
|
|
| |
|
| 19 | |
|
|
| |
SHARE OWNERSHIP OF MANAGEMENT AND DIRECTORS AND CERTAIN BENEFICIAL OWNERS |
| 20 | |
|
|
| |
| 22 | ||
|
|
| |
|
| 22 | |
ii
iii

St. Jude Medical, Inc.
One St. Jude Medical Drive
St. Paul, MN 55117
|
Proxy Statement for Annual Meeting of Shareholders |
|
We are providing these proxy materials in connection with the solicitation by the Board of Directors of St. Jude Medical, Inc. (“St. Jude Medical,” the “Company,” “we” or “us”) of proxies to be voted at our 2013 Annual Meeting of Shareholders and at any meeting following adjournment thereof.
You are cordially invited to attend the annual meeting on May 2, 2013, beginning at 8:30 a.m. central time. The meeting will be held at the Minnesota History Center, 345 Kellogg Boulevard West, St. Paul, Minnesota. The location is accessible to handicapped persons.
Pursuant to rules adopted by the Securities and Exchange Commission (the “SEC”), we have elected to provide access to our proxy materials over the internet. Accordingly, we have sent to our shareholders a Notice of Internet Availability of Proxy Materials (the “Notice”) containing instructions on how to access this proxy statement and our 2012 Annual Report on-line. Shareholders who have received the Notice will not be sent a printed copy of our proxy materials in the mail unless they request to receive one.
Important Notice Regarding the Availability of Proxy Materials for the Shareholder Meeting to be Held on May 2, 2013: This Proxy Statement and Our 2012 Annual Report are Available atwww.proxyvote.com.
We are first making available this proxy statement and the forms of proxy and voting instructions on or about March 22, 2013 to holders of our common stock on March 5, 2013, the record date for the meeting.
Your vote is important.Because many shareholders cannot attend the annual meeting in person, it is necessary that a large number be represented by proxy. If you are a shareholder of record as of the record date, you can give a proxy to be voted at the meeting in any of the following ways:
|
|
|
| • | Over the telephone by calling a toll-free number (if you received paper copies of our proxy materials) |
|
|
|
| • | Electronically, using the internet |
|
|
|
| • | By completing, signing and mailing the proxy card (if you received paper copies of our proxy materials) |
1
The telephone and internet voting procedures have been set up for your convenience. We encourage you to save corporate expense by submitting your vote by telephone or internet. The procedures have been designed to authenticate your identity, to allow you to give voting instructions and to confirm that those instructions have been recorded properly. If you are a shareholder of record and would like to submit your proxy by telephone or internet, please refer to the specific instructions provided on the Notice or on the enclosed proxy card. If you received paper copies of our proxy materials and wish to submit your proxy by mail, please return your signed proxy card to us before the meeting.
If your shares are held in the name of a broker, bank or other nominee, then the broker, bank or other nominee is considered to be the shareholder of record with respect to those shares and you must vote your shares in the manner prescribed by the broker, bank or other nominee. Your broker, bank or other nominee has provided a voting instruction card for you to use in directing the broker, bank or other nominee how to vote your shares. If your shares are held in the name of a broker, bank or other nominee, you must obtain a proxy, executed in your favor, from the broker, bank or other nominee to be able to vote at the meeting.
You may revoke your proxy and change your vote at any time before your proxy is voted at the meeting. If you are a shareholder of record, you may revoke your proxy and change your vote by submitting a later-dated proxy by telephone, internet or mail, or by voting in person at the meeting. If your shares are held in the name of a broker, bank or other nominee, contact your broker, bank or other nominee regarding how to revoke your proxy and change your vote.
All shares entitled to vote at the meeting and represented by properly completed proxies received prior to the meeting and not revoked will be voted at the meeting in accordance with your instructions. If you sign and return your proxy card or submit your proxy by telephone or internet and do not indicate how your shares should be voted on any particular matter, the shares represented by your proxy will be voted in accordance with the recommendation of the Board of Directors on that matter, as set forth in this proxy statement.
If any other matters are properly presented at the annual meeting for consideration, including, among other things, consideration of a motion to adjourn the meeting to another time or place, the persons named as proxies will have discretion to vote on those matters according to their best judgment to the same extent as the person delivering the proxy would be entitled to vote. At the date this proxy statement was printed, the Company did not anticipate that any matters other than those set forth in the Notice of Annual Meeting of Shareholders would be raised at the meeting.
Shareholders at the close of business on the record date are entitled to notice of and to vote at the annual meeting. Each share is entitled to one vote on each matter properly brought before the meeting, and there is no cumulative voting.
On the record date, March 5, 2013, there were [____________] shares of common stock outstanding and, therefore, entitled to vote at the annual meeting.
The presence, in person or by proxy, of a majority of the shares entitled to vote at the meeting is necessary to constitute a quorum at the meeting for the transaction of business.
Abstentions and broker “non-votes” are counted as present and entitled to vote for purposes of determining a quorum. A broker “non-vote” occurs when a broker, bank or other nominee holding shares for a beneficial owner does not vote on a particular proposal because the nominee does not have discretionary voting power with respect to that item and has not received voting instructions from
2
the beneficial owner. Under the rules of the New York Stock Exchange (the “NYSE”), brokers, banks and other nominees do not have discretionary authority to vote with respect to (i) the election of the Company’s Directors, (ii) the amendments to our Articles of Incorporation and Bylaws to declassify our Board of Directors (the “Declassification Proposal”) and (iii) the advisory vote to approve the compensation of our named executive officers (the “Say on Pay Proposal”).
In an uncontested election (where, as at the annual meeting, the number of Director nominees does not exceed the number of Directors to be elected), our Articles of Incorporation provide that a Director is elected if the number of votes cast “for” a Director exceeds the number of votes cast “against” the election of that Director. To address a holdover provision in Minnesota law that allows a Director who has not been re-elected to remain in office until a successor is identified, our Principles of Corporate Governance require that any Director nominee who receives a greater number of votes “against” his or her election than votes “for” such election must promptly offer to tender his or her resignation following certification of the shareholder vote. The Governance and Nominating Committee will consider the resignation offer and recommend to the Board whether to accept it. The Board will act on the Governance and Nominating Committee’s recommendation within 90 days following certification of the shareholder vote. The Board will promptly disclose its decision whether to accept the Director’s resignation offer (and the reasons for rejecting the resignation offer, if applicable) in a press release. Any Director who offers to tender his or her resignation as described above will not participate in the Governance and Nominating Committee’s recommendation or Board action regarding whether to accept the resignation offer.
At any meeting for which the number of Director nominees exceeds the number of Directors to be elected, our Articles of Incorporation provide that Directors are elected by a plurality of the votes present and entitled to vote on the election of Directors. This means that if shareholders are electing two Directors, the two Director nominees receiving the highest number of votes will be elected.
The affirmative vote of a majority of the shares of our common stock present in person or by proxy and entitled to vote at the annual meeting is required to approve the Say on Pay Proposal and to ratify the appointment of Ernst & Young LLP as our independent registered public accounting firm for 2013, provided that the total number of shares that voted in favor of each proposal constitutes more than 25% of our outstanding shares. The affirmative vote of at least 80% of the votes entitled to be cast by holders of all outstanding shares at the 2013 Annual Meeting of Shareholders is required to approve the Declassification Proposal.
Abstentions on any matter will be counted as shares that are present and entitled to vote for purposes of determining the approval of such matter. Abstentions have no effect on the election of Directors and have the same effect as a vote “against” the other proposals. Broker “non-votes” on any matter will not be considered as present and entitled to vote for purposes of determining the approval of such matter.
St. Jude Medical will pay the cost of soliciting proxies. We are soliciting proxies primarily by mail. Proxies may be solicited on behalf of the Company by Directors, officers or employees of the Company in person or by telephone, facsimile or other electronic means. These persons will not receive any additional compensation for providing this service.
In accordance with the regulations of the SEC and the NYSE, we will reimburse brokerage firms and other custodians, nominees and fiduciaries for their reasonable expenses incurred in sending proxies and proxy materials to beneficial owners of our common stock.
3
|
The Board of Directors of St. Jude Medical is responsible for overseeing the business, property and affairs of the Company. Members of the Board are kept informed of the Company’s business through discussions with the Chief Executive Officer and other officers, by reviewing materials provided to them and by participating in meetings of the Board and its Committees.
The Board is currently comprised of Mr. Daniel J. Starks, who has served as Chairman of the Board, President and Chief Executive Officer since 2004, and six independent Directors. Mr. John W. Brown has served as Presiding Director since 2006. The Presiding Director plays an important role in the Board’s governance structure. The Presiding Director works closely with the Chairman and the other Directors, as appropriate, to set and approve the agenda for Board and Governance and Nominating Committee meetings, to ensure that there is an appropriate flow of information to the Board and to make sure that management properly and adequately addresses matters of interest to the Board. The Chairman conducts the actual Board meetings, and the Presiding Director organizes and presides over all executive sessions of the non-management, independent Directors. The other principal responsibilities of the Presiding Director include:
|
|
|
| • | Counseling the Chairman on issues of interest or concern to the independent Directors; |
|
|
|
| • | Evaluating, along with the members of the Board, the Chairman’s performance and meeting with the Chairman to discuss the Board’s evaluation; |
|
|
|
| • | Advising the Chairman concerning the independent Directors’ views as to the quantity, quality and timeliness of the flow of information from management that is necessary for the independent Directors to effectively and responsibly perform their duties; and |
|
|
|
| • | Conducting an annual self-assessment to evaluate the effectiveness of the Board and individual Board members. |
The Presiding Director also serves as Chairman of the Governance and Nominating Committee, the principal Board committee charged with responsibility for the Board’s governance structure. In this dual role, the Presiding Director facilitates the ability of non-management Directors to fulfill their responsibilities and provides a structure for communicating any concerns the non-management Directors may have directly to the Company’s executive management.
The Board is comprised of qualified and experienced leaders with the ability to act independently in providing oversight to the Company. Of the six independent Directors serving on the Board, three are currently serving or have served as chief executive officers of other companies. Of the three independent Directors who have not served as a chief executive officer of a company, one Director served as chief financial officer of a multi-billion dollar manufacturer of specialty medical technology products, one served as chief marketing officer for one of the largest pharmaceutical companies in the world and one has held a number of leadership positions in two of the largest information technology companies in the world. Accordingly, we believe that all of our Directors have demonstrated seasoned leadership in large enterprises and are familiar with board processes. For additional information about the backgrounds and qualifications of the Directors, see “Director Qualifications” on page 8 of this proxy statement.
4
The Board believes that there is no single best organizational model that is the most effective in all circumstances and that the shareholders’ interests are best served by allowing the Board to retain the flexibility to determine the optimal organizational structure for the Company at a given time, including whether the Chairman role should be held by an independent Director or a senior executive who serves on the Board. The members of the Board possess considerable experience and unique knowledge of the challenges and opportunities the Company faces and are in the best position to evaluate the needs of the Company and how best to maximize the capabilities of the Directors and management to meet those needs.
We believe that the Company, like many U.S. companies, is best served by having one person serve as both Chief Executive Officer and Chairman of the Board. The Board believes that through this leadership structure, Mr. Starks is able to draw on his intimate knowledge of the daily operations of the Company and its relationships with customers and employees to provide the Board with leadership in setting its agenda and properly focusing its discussions. As the individual with primary responsibility for managing our day to day operations, Mr. Starks is also best-positioned to chair regular Board meetings and ensure that key business issues are brought to the Board’s attention. The combined role as Chairman and Chief Executive Officer also ensures that the Company presents its message and strategy to shareholders, employees, customers and other stakeholders with a unified, single voice. The appointment by the Board of an experienced independent Presiding Director with substantial responsibilities provides additional strength and balance to our Board leadership structure.
Board’s Role in Risk Oversight
The Board takes an active role in risk oversight of the Company both as a full Board and through its Committees. Through detailed reviews, discussions and presentations by the heads of the Company’s various businesses, the Board reviews and advises with respect to the Company’s business strategies and financial plans, with attention and focus on the risks to achievement of these strategies and plans. Such risks include those inherent in the Company’s businesses as well as the risks from external sources such as competitors, the economy and credit markets, and regulatory and legislative developments. In addition, the heads of certain of the Company’s key functional areas (e.g., IT, Legal and Regulatory) regularly update the Board on risks in their areas.
At least annually, management provides a report to the Board identifying the principal risks facing the Company and its subsidiaries. This report is intended to assist the Board in its evaluation of the Company’s risk management practices and to promote a culture that actively identifies and manages risk. More in-depth information and discussion of particular risk areas may be provided upon request of the Board.
Each year management also conducts an assessment of financial risks to the Company and reports its findings to the Audit Committee, which in turn provides a summary to the full Board. The financial risk assessment process is facilitated by St. Jude Medical’s internal audit team. Members of the internal audit team interview key department and functional leaders from a global cross-section of the Company to identify and evaluate financial risks and the steps being taken to mitigate the risks. Identified risks are prioritized based on the potential exposure to the business, measured as a function of the severity and likelihood of occurrence. At least annually, there is also an evaluation of management’s preparedness to respond to the most significant risks, if realized. The risk profiles and current and future mitigating actions are discussed and refined during subsequent discussions with senior management. A summary of the results of the financial risk assessment process and risk mitigation activities is presented to the Audit Committee, provided to the full Board and discussed by the Board.
The Audit Committee meets regularly with Company management with regard to the Company’s financial risk management processes, controls and capabilities and with the Company’s Chief Internal Auditor with regard to significant control matters. The Audit Committee also oversees and reviews with management the liquidity of the Company and its subsidiaries, the Company’s funding needs and other
5
finance matters. In addition, the Audit Committee reviews the Company’s procedures regarding the receipt, retention and treatment of complaints regarding internal accounting, accounting controls or audit matters.
The Compensation Committee oversees the Company’s executive compensation arrangements, including the identification and management of risks that may arise from the Company’s executive compensation policies and practices. For a discussion of the Compensation Committee’s assessment of the risks arising from the Company’s executive compensation practices and policies, see “Compensation Risk Analysis” on page 42.
The Governance and Nominating Committee has oversight of corporate governance, including establishing practices and procedures that promote good governance and thus mitigate governance risk, and is also responsible for reviewing the performance of the Board, its Committees and their members.
Meeting Attendance and Executive Sessions
During 2012, the Board held seven (7) meetings. With the exception of Mr. Thomas Garrett III, who passed away on August 19, 2012 after over three decades of service on the Board of Directors, each Director attended at least 75% of all meetings of the Board and of the Committees on which the Director served.
The independent members of the Board also meet at scheduled executive sessions at least twice each year. These sessions are chaired by the Presiding Director, who is the Chairman of the Governance and Nominating Committee.
Principles of Corporate Governance
The Company’s Principles of Corporate Governance are available on the Company’s website atwww.sjm.com.
The Company has adopted a Code of Business Conduct for its Board, principal executive officer, principal financial officer, principal accounting officer, corporate controller and all other employees. The Code of Business Conduct is available on the Company’s website atwww.sjm.com.
Any interested party wishing to communicate with one or more Directors may do so by sending a letter addressed to the Director or Directors at:
|
|
| c/o Corporate Secretary |
| St. Jude Medical, Inc. |
| One St. Jude Medical Drive |
| St. Paul, MN 55117 |
All such correspondence will be forwarded to the Director or Directors.
The Governance and Nominating Committee identifies and nominates appropriate candidates for the Board of Directors. The Governance and Nominating Committee works closely with the Board to develop selection criteria and identify candidates. The Committee considers suggestions from many sources, including other Directors, search firms and shareholders, for possible candidates for Directors.
6
The Governance and Nominating Committee considers all candidates in the same manner, regardless of the source that proposed them.
Any shareholder wishing to recommend that a person be appointed to the Board of Directors or that management nominate a person for election to the Board of Directors may submit such a recommendation to:
|
|
| Governance and Nominating Committee |
| c/o Corporate Secretary |
| St. Jude Medical, Inc. |
| One St. Jude Medical Drive |
| St. Paul, MN 55117 |
The Governance and Nominating Committee will review all nominees to the Board of Directors, which includes an assessment of a nominee’s judgment, experience, independence and such other factors as the Governance and Nominating Committee concludes are pertinent in light of the Board’s needs.
Once candidates are identified, they are evaluated through a series of interviews with members of the Governance and Nominating Committee, several other Directors and members of management, including the Company’s General Counsel. Candidates are also asked to complete a Director questionnaire used by the Company.
The Governance and Nominating Committee has worked in the past with independent search firms that assist in identifying Director candidates.
Director Attendance at Annual Shareholder Meeting
All of the Company’s Directors attended the 2012 Annual Meeting of Shareholders. The Company reimburses a Director’s travel expenses for attending the annual shareholder meeting, but attendance by non-management Directors is not required. A meeting of the Board of Directors will be held in conjunction with the 2013 Annual Meeting of Shareholders in order to facilitate attendance by Directors at the meeting.
Director Independence and Audit Committee Financial Literacy and Expertise
The Board undertakes an annual review of Director independence. As part of that process, in February of each year, the Board reviews all transactions and relationships between each Director (or any member of his or her immediate family) and the Company, including transactions and relationships described in the responses of the Directors to questions regarding employment, business, familial and other relationships with the Company and its management. At the conclusion of each of the 2012 and 2013 Director independence reviews, the Board affirmatively determined that each of the Directors, except Mr. Starks, are independent under the Company’s Principles of Corporate Governance and Bylaws and the NYSE listing standards and have no material relationships with the Company other than their positions on the Board of Directors.
In February 2012 and 2013, the Board specifically considered Richard R. Devenuti’s relationship with EMC Corporation and the Company’s purchase of hardware and software from EMC Corporation during the immediately preceding fiscal years, as well as potential purchases for the upcoming fiscal years. In fiscal years 2011 and 2012, the Company purchased approximately $1.3 million and $2 million, respectively, of hardware and software from EMC Corporation related to the storage and protection of Company data, of which approximately $300,000 and $133,000, respectively, were purchased from EMC’s International Intelligence Group (the “IIG Division”), the division for which Mr. Devenuti serves as President. EMC Corporation is a multinational, global company with over $20 billion and $21.7 billion in annual sales in 2011 and 2012, respectively, of which the IIG Division
7
contributed $661 million and $640 million of revenue in 2011 and 2012, respectively. In both fiscal years 2011 and 2012, St. Jude Medical’s aggregate purchases of all products and services from EMC Corporation comprised less than .01% of EMC Corporation’s annual revenue and its purchases from the IIG Division comprised less than .05% of the IIG Division’s annual revenue. The Board also considered potential purchases by the Company from EMC Corporation in 2013, which it did not expect to be materially different from the amount and nature of purchases by the Company in 2011 and 2012 (approximately $1.5 million in potential aggregate purchases from EMC Corporation, of which approximately $150,000 will be from the IIG Division). Mr. Devenuti’s compensation arrangement with EMC, among other components, provides him an annual bonus that is based (i) 22% on EMC Corporation revenue and profit, (ii) 45% on IIG Division revenue and profit and (iii) 33% on quarterly management by objectives criteria not related to revenue or profit.
Given that these transactions (i) are ordinary course purchases of hardware and software from EMC in which Mr. Devenuti was and is not personally involved, (ii) represent a small percentage of IIG Division revenue and even smaller percent of EMC Corporation revenue and (iii) have an immaterial impact on Mr. Devenuti’s potential annual bonus payments, the Board concluded that Mr. Devenuti is independent under both our Bylaws and the NYSE rules and that none of these transactions constituted “Related Party Transactions” under the Company’s Policy and Procedures for Related Person Transactions.
The Board also determined that all members of the Audit Committee are financially literate under the NYSE listing standards and that Mr. Devenuti and Mr. Rocca each qualifies as an “audit committee financial expert” within the meaning of the rules of the SEC.
The Board of Directors believes that its membership should reflect the diversity of experience, skills, geography, gender and ethnicity required to meet its corporate governance, oversight and advisory functions in a way that is in the best interest of its shareholders. This includes ensuring that the Board has the expertise required to fulfill all of its legal, regulatory and NYSE requirements, including the requirements for each of its Committees.
In identifying appropriate candidates to serve as a Director, the Board gives particular weight to individuals with experience as a chief executive officer. The Board believes that individuals with chief executive officer experience are best able to mentor, advise, evaluate, direct and decide when it is appropriate to replace the Company’s Chief Executive Officer, all of which are critical Board responsibilities. The Board also places great weight on large-company experience when evaluating Director candidates. Such experience enables a Director to offer insights to help the Company navigate the many issues that arise as it continues its rapid growth. The Board has not aimed to be comprised of individuals with niche expertise, such that other members of the Board would defer to that member when issues arise within their expertise. Rather, the Board believes that the overall business acumen and experience of each Director, working together with the rest of the Board, better serves the Company and its shareholders.
Each of our Directors possess the necessary business acumen and experience, but also has particular attributes and areas of expertise that are of value to the Company and that, taken together, provide the strength of a well-rounded Board. The following describes the particular experience, qualifications, attributes or skills that led the Board to conclude that each of our Directors should serve as a Director of the Company.
Mr. Brown has a unique background and skills that qualify him not only to serve on the Board, but also to act as Presiding Director. Mr. Brown served as the Chief Executive Officer of Stryker Corporation from 1977 to 2004 and as Chairman from 1980 until his retirement in 2009. During his tenure as head of Stryker, Mr. Brown turned a small medical instruments company with annual sales of $17 million and 400 employees into a global orthopedics medical device manufacturer that at the time
8
of his retirement had annual sales of approximately $6.7 billion and over 18,000 employees. Between 1979 and 2007, Stryker increased annual per share earnings by at least 20 percent every year but two. From these experiences, Mr. Brown brings a particularly strong understanding of the challenges and opportunities for building and managing a global medical device company. He brings a visionary yet disciplined approach to the Company and provides invaluable leadership to the Board.
Mr. Devenuti is currently the President of EMC Corporation’s Information Intelligence Group (“IIG Division”), where he oversees all aspects of the IIG Division’s operations, including worldwide sales and services, channel strategy, product development, marketing, strategic business and financial initiatives, technical support and the Total Customer Experience program. Prior to this role, Mr. Devenuti served as Senior Vice President and Chief Operating Officer of the CMA Division of EMC Corporation. Prior to joining EMC, Mr. Devenuti held a variety of senior positions at Microsoft Corporation. As a result of his leadership roles with Microsoft and EMC, Mr. Devenuti has extensive general business experience and, in particular, experience with high growth companies in a high growth industry. In addition, Mr. Devenuti possesses a deep expertise in information technologies and in creating and managing organizations to achieve operational excellence. This expertise has been particularly useful to the Company as it has grown and needed to expand its systems and infrastructure and build a more scalable business. Mr. Devenuti also qualifies as an audit committee financial expert under applicable rules of the SEC, providing the Board with a financially seasoned member of the Audit Committee.
Mr. Essig is currently the Chairman of the Board of Directors of Integra LifeSciences Holdings Corporation, a manufacturer of medical devices and implants, a position he has held since January 2012. Prior to such role, Mr. Essig served as Integra’s Chief Executive Officer from December 1997 until January 2012 and its President from December 1997 until November 2010. In addition, he has served as a director since he joined Integra in December 1997. Prior to joining Integra, Mr. Essig supervised the medical technology practice at Goldman, Sachs & Co. as a managing director. Mr. Essig has also served on the Board of Directors of the Advanced Medical Technology Association, a trade association that represents the medical device industry. In addition to his demonstrated seasoned leadership and experience as a chief executive officer, Mr. Essig brings a broad strategic perspective in the medical device industry that is valued by the Board and the Company.
Ms. Hill has an accomplished record with extensive experience in the managed healthcare industry. Ms. Hill is currently an Operating Partner of Moelis Capital Partners, a private equity firm, where she focuses on healthcare-related investments and providing strategic and operating support for Moelis’ healthcare portfolio companies. She previously served as Chief Executive Officer and a member of the Board of Directors of ValueOptions, Inc., a managed behavioral health company from March 2006 to September 2010. Previously, Ms. Hill served as Chairman and Chief Executive Officer of Woodhaven Health Services, an institutional pharmacy company, and President and a member of the Board of Directors of Express Scripts, a Fortune 100 pharmacy benefits management company. From these experiences, Ms. Hill brings deep management experience and insight both generally and specific to the healthcare industry. In addition, Ms. Hill’s expertise in understanding and evaluating benefits and compensation issues has proven to be of great value to the Board.
Mr. Rocca was selected to serve on the Board because of the global financial expertise he attained through various senior financial and leadership positions at large multinational public companies. He served as Chief Financial Officer at Mallinckrodt, Inc., a $2.7 billion manufacturer of specialty medical technology products, from 1994 until his retirement in 2000. Prior to joining Mallinckrodt, from 1966 to 1994, Mr. Rocca worked at Honeywell, Inc., where he served in a variety of finance roles, including Vice President of Finance for Honeywell Europe in Brussels, Belgium and Vice President and Corporate Treasurer. Given Mr. Rocca’s extensive management and financial experience, including serving as the current Chairman of the Audit Committee of Hyatt Hotels Corporation and having served as the Chairman of the Audit Committee of Lawson Software, Inc., he is uniquely qualified to serve as Chairman of the Company’s Audit Committee. Mr. Rocca’s considerable management and financial knowledge and experience make him a highly valued member of the Board.
9
Mr. Starks, our Chairman, President and Chief Executive Officer since 2004, has over 27 years of medical device industry experience. Prior to joining the Company, Mr. Starks was President and Chief Executive Officer of Daig Corporation, a manufacturer of specialty cardiovascular devices that was acquired by St. Jude Medical in 1996. In 1998, Mr. Starks was named Chief Executive Officer and President of the Company’s Cardiac Rhythm Management business and in 2001 was named President and Chief Operating Officer of the Company. Mr. Starks has been a member of the St. Jude Medical Board of Directors since the Company acquired Daig Corporation in 1996. Under Mr. Starks’ leadership, the Company has grown from $2.3 billion in revenue in 2004 to $5.5 billion in 2012 and experienced its most profitable (on an adjusted net earnings per share basis) fiscal year on record in 2012, with an adjusted earnings per share of $3.48 (refer to page 39 of this proxy statement for a reconciliation of non-GAAP adjusted diluted net earnings per share).
Ms. Yarno has a 27 year history of demonstrated leadership in global operations, marketing and human resources in the pharmaceutical industry. She is currently an independent consultant in the life sciences industry. From September 2010 through February 2012, Ms. Yarno was the Chief Marketing Officer of HemoShear LLC, a biotechnology research company and leading developer of human cell-based surrogate systems for discovery and assessment of new drug compounds. Prior to this role, she served as Chief Marketing Officer of Merck & Co., Inc., a pharmaceutical company. She also has held a series of other executive positions at Merck, including General Manager of U.S. Human Health, Executive Vice President of Worldwide Human Health Marketing and Senior Vice President of Human Resources. Additionally, Ms. Yarno served as the vice president of the Women’s Health Care Franchise at Johnson & Johnson, the world’s largest healthcare company. Ms. Yarno was selected by the Board because of her management and business acumen and experience with a large enterprise in the healthcare industry.
Committees of the Board of Directors
The Board of Directors has three standing Committees: the Audit Committee, the Compensation Committee and the Governance and Nominating Committee. During 2012, the Audit Committee met nine (9) times, the Compensation Committee met five (5) times and the Governance and Nominating Committee met six (6) times. Membership on each committee as of March 5, 2013 is set forth in the following table:
|
|
|
|
Director | Audit Committee | Compensation | Governance and |
John W. Brown |
|
| Chair |
Richard R. Devenuti | ● |
|
|
Stuart M. Essig |
| Chair | ● |
Barbara B. Hill | ● | ● |
|
Michael A. Rocca | Chair |
|
|
Wendy L. Yarno |
| ● | ● |
Each Committee of the Board has a separate written charter which is available on the Company’s website atwww.sjm.com.
Each member of the Audit Committee, the Compensation Committee and the Governance and Nominating Committee is independent under the Company’s Principles of Corporate Governance and Bylaws and the NYSE listing standards. Each member of the Audit Committee is also independent under the rules of the SEC.
The duties of the Audit Committee are described in its report below.
10
The Compensation Committee is responsible for establishing and administering compensation programs for the Company’s executive officers and considering matters relating to employee benefits provided by the Company. The Compensation Committee is also responsible for making recommendations to the Board regarding Director compensation.
The Governance and Nominating Committee is responsible for recommending good governance practices. The Governance and Nominating Committee evaluates the qualifications of and nominates candidates for positions on the Board. The procedures for shareholders to recommend Directors can be found on page 6. In addition, the Governance and Nominating Committee facilitates an annual evaluation by Board members of Board and individual Director performance and provides feedback to the entire Board.
The Audit Committee reviews the Company’s consolidated financial statements, financial reporting process and internal control over financial reporting on behalf of the Board of Directors. The Directors who serve on the Audit Committee are all independent under the Company’s Principles of Corporate Governance and Bylaws, the NYSE listing standards and the rules of the SEC.
The Board has adopted a written charter which describes the functions the Audit Committee is to perform. Each year, we review the actions required to be taken by the Audit Committee under the charter, confirm that they have been taken, and report the same to the Board. The current Audit Committee charter is available on the Company’s website at www.sjm.com.
Management has the primary responsibility for the Company’s consolidated financial statements and the overall reporting process, including the Company’s system of internal controls.
The Audit Committee meets with management periodically to consider, among other things, the adequacy of the Company’s financial disclosures and internal control over financial reporting. We discuss these matters with the Company’s independent registered public accounting firm, Ernst & Young LLP, and with appropriate Company financial personnel, including the Company’s internal auditor. We also conduct an annual assessment of financial risks to the Company, as more specifically described on page 5.
We also appoint the independent registered public accounting firm, approve the performance of, and fees associated with, both its audit and non-audit services and review periodically its performance and independence from management. We regularly meet privately with the independent registered public accounting firm, which has unrestricted access to the Audit Committee.
We have received the written disclosures and the letter from Ernst & Young LLP required by applicable requirements of the Public Company Accounting Oversight Board (“PCAOB”) regarding the independent registered public accounting firm’s communications with the Audit Committee concerning independence, and have discussed with Ernst & Young LLP its independence. We have also considered the compatibility of non-audit services with the independence of Ernst & Young LLP. In addition, we discussed with Ernst & Young LLP any matters required under PCAOB Auditing Standard No. 16, Communications with Audit Committees, and SEC Rule 2-07, Communications with Audit Committees.
The independent registered public accounting firm audits the annual consolidated financial statements prepared by management, expresses an opinion as to whether those consolidated financial statements fairly present the consolidated financial position, results of operations and cash flows of the Company in conformity with generally accepted accounting principles and discusses with us any issues they believe should be raised with us. The independent registered public accounting firm also audits the Company’s internal control over financial reporting and expresses an opinion as to whether the Company maintained effective internal control over financial reporting.
11
This year, we reviewed the Company’s audited consolidated financial statements and met with both management and Ernst & Young LLP to discuss these financial statements. Management has represented to us that these financial statements were prepared in accordance with United States generally accepted accounting principles. We also considered the report of the independent registered public accounting firm relating to the Company’s consolidated financial statements.
We also reviewed management’s assessment of the effectiveness of the Company’s internal control over financial reporting. Management has represented to us that the Company’s internal control over financial reporting was effective as of December 29, 2012. We also considered the report of the independent registered public accounting firm relating to the Company’s internal control over financial reporting.
Based on our review and discussions described above, we recommended to the Board that the Company’s audited consolidated financial statements be included in the Company’s Annual Report on Form 10-K for the fiscal year ended December 29, 2012, filed with the SEC.
|
|
| Michael A. Rocca, Chairman |
| Barbara B. Hill |
| Richard R. Devenuti |
The Company targets compensation for service on the Board of Directors and its committees at the 60th percentile of the market as defined by an analysis of the primary peer companies identified on page 32. The Compensation Committee engages outside consultants for assistance in determining the levels and components of compensation that are consistent with this objective. See discussion beginning on page 26. The Chairman of the Board reviews the data and analyses provided by the Company’s outside consultants and then makes recommendations to the Compensation Committee regarding Director compensation. The Compensation Committee, in turn, reviews the data and analyses provided by the Company’s outside consultants and the Chairman’s recommendations and makes its own recommendations to the Board regarding Director compensation. The Board of Directors then approves Board and Committee compensation based on the recommendations of the Compensation Committee. Each year, the compensation levels approved by the Board become effective at the Company’s annual meeting of shareholders and remain in effect until the annual meeting of shareholders held in the following year.
For the period commencing on May 3, 2012, the date of the 2012 Annual Meeting of Shareholders, and ending on May 2, 2013, the date of the 2013 Annual Meeting of Shareholders, each non-employee Director received compensation as set forth in the table below:
|
|
Annual Retainer | $60,000 |
Per Diem for Each Board Meeting Attended | $2,000 |
Committee Chairmen (except for Audit Committee) | $9,000 |
Audit Committee Chairman | $14,200 |
Committee Members | $4,000 |
Presiding Director | $5,000 |
The Company believes this compensation paid to our non-employee Directors is aligned with the 60th percentile of the Company’s primary peer group and reflects the responsibilities and potential liabilities
12
for audit committee chairmen and directors generally. Directors who are Company employees are not compensated for their services as Directors.
In May of each year, non-employee Directors who are serving at that time may elect to receive the annual retainer fee payable over the following 12 months either as 100% cash, 50% cash plus 50% restricted stock, or 100% restricted stock. Restricted stock is valued at the closing market price of our common stock on the date of grant, which is the first business day in June after a Director’s election to receive restricted stock in lieu of half or all of the Director’s retainer. The restriction on the stock lapses on the six-month anniversary of the grant date. In 2012, all of our non-employee Directors elected to receive their entire annual retainer in the form of restricted stock, except for Ms. Yarno, who elected to receive 50% of her annual retainer in cash and 50% in stock, and Mr. Garrett, who elected to receive all of his annual retainer in cash.
Directors are reimbursed for expenses incurred in connection with travel and lodging when attending meetings of the Board or otherwise engaged in Company business and for such expenses for the Director’s partner when attending the annual strategic planning meeting.
The Company’s 2006 Stock Plan provides that each non-employee Director who is elected, re-elected or serving an unexpired term as a Director at any annual meeting of shareholders will receive, as of the date of such meeting, an option to purchase 5,600 shares of our common stock at an exercise price per share equal to the closing market price of our common stock on such date. The number of options awarded can be adjusted upward if approved by the Board of Directors, and each year the Compensation Committee reviews external market data and makes a recommendation to the Board of Directors regarding the annual grant. All such options are designated as non-qualified stock options with eight-year terms and fully vest on the six-month anniversary of the grant date. Non-employee Directors appointed between annual shareholder meetings are granted a stock option to purchase a pro-rata portion of shares on the same terms and conditions as the stock options described above, except the exercise price is equal to the closing market price of our common stock on the date of appointment. At the 2012 Annual Meeting of Shareholders, each non-employee Director received a grant of an option to purchase 15,400 shares at $38.51 per share, the closing market price of our common stock on the date of grant. No additional options were granted to non-employee Directors in 2012.
Each Director may receive reimbursement for one physical examination every 12 months up to a maximum of $1,600 per exam. Board members may also participate in our charitable contribution matching program under which eligible charitable contributions are matched by the Company up to a maximum of $1,000 each year.
Under a retirement plan for non-employee Directors that was terminated April 1, 1996, each non-employee Director serving on the Board at that time who serves five years or more will receive payment of an annual benefit equal to the average of the annual retainers paid to the Director during his or her service as a Director, with a minimum annual benefit of $24,000. Mr. Garrett was the only Director eligible for benefits under the discontinued retirement plan for non-employee Directors. Following Mr. Garrett’s death in August 2012, the Company was obligated to pay all amounts due under the plan to Mr. Garrett’s named beneficiary, which it paid in one lump sum payment of $302,000 in December 2012.
Under the process described above, the Board will approve compensation for its Directors for the twelve month period commencing on May 2, 2013 at its next regularly-scheduled meeting (to be held immediately prior to the 2013 Annual Meeting of Shareholders).
13
The following table shows the cash and non-cash compensation for the last fiscal year awarded to or earned by our non-employee Directors.
|
|
|
|
|
|
|
|
|
Name |
| Fees Earned or |
| Option Awards |
| All Other |
| Total |
|
|
|
|
|
|
|
|
|
John W. Brown |
| 90,000 |
| 134,864 |
| -0- |
| 224,864 |
Richard R. Devenuti |
| 80,000 |
| 134,864 |
| -0- |
| 214,864 |
Stuart M. Essig |
| 89,000 |
| 134,864 |
| 1,000 |
| 224,864 |
Thomas H. Garrett III(5) |
| 53,000 |
| 134,864 |
| 303,000 |
| 490,864 |
Barbara B. Hill |
| 80,000 |
| 134,864 |
| -0- |
| 214,864 |
Michael A. Rocca |
| 90,200 |
| 134,864 |
| 1,000 |
| 226,064 |
Wendy L. Yarno |
| 84,000 |
| 134,864 |
| -0- |
| 218,864 |
|
|
|
|
|
|
Footnotes |
| |
|
|
|
(1) | All of the non-employee Directors elected to receive their entire $60,000 annual retainer fee for the May 2012 to May 2013 term in the form of shares of restricted stock, except for Ms. Yarno, who elected to receive 50% of her annual retainer in cash and 50% in stock, and Mr. Garrett, who elected to receive all of his annual retainer in cash. | |
|
| |
(2) | On May 3, 2012, each non-employee Director was awarded options to purchase 15,400 shares of our common stock with a grant date fair value of $134,864. The amounts in this column are computed in accordance with Financial Accounting Standards Board Accounting Standards Codification Topic 718 (“FASB ASC Topic 718”) and are based on the fair value of the stock option awards as estimated using the Black-Scholes option pricing model. The assumptions used to estimate fair value are discussed in Note 7 to our consolidated financial statements included in our Annual Report on Form 10-K for the year ended December 29, 2012. | |
|
| |
(3) | As of December 31, 2012, the Directors held options to purchase the following numbers of shares of our common stock: Mr. Brown, 74,300; Mr. Devenuti, 75,700; Mr. Essig, 75,700; Ms. Hill, 59,979; Mr. Rocca, 70,100; and Ms. Yarno, 75,700. As of December 31, 2012, no Directors held any restricted stock awards. | |
|
| |
(4) | Amounts reflected in this column for each of Mr. Essig, Mr. Garrett and Mr. Rocca include a $1,000 company match for a charitable contribution by the Director. Also includes for Mr. Garrett an additional payment of $302,000 to his estate under the Company’s Retirement Plan for Non-Employee Directors (see “Compensation of Directors” above for additional detail). | |
|
| |
(5) | Mr. Garrett passed away on August 19, 2012. | |
Compensation Committee Interlocks and Insider Participation
During 2012, Stuart M. Essig (chair), Barbara B. Hill and Wendy L. Yarno served as members of the Compensation Committee. None of these individuals has ever served as an officer or employee of St. Jude Medical or any of our subsidiaries or has any relationships with St. Jude Medical or any of our subsidiaries requiring disclosure under “Related Person Transactions” below. The members of the Compensation Committee have no interlocking relationships requiring disclosure under the rules of the SEC.
Our Board of Directors has adopted a written policy and procedures for related person transactions (collectively referred to as the “Policy”). Under the Policy, all related person transactions must be approved or ratified by the Company’s Governance and Nominating Committee. For purposes of the Policy, related person transactions generally include any transaction:
|
|
|
| • | to which the Company is a participant; |
|
|
|
| • | for which the amount involved in any calendar year is expected to exceed $120,000; and |
|
|
|
| • | in which a related person is expected to have a direct or indirect material interest. |
14
Despite otherwise falling within this definition, the following transactions have been determined by the Board not to be related person transactions subject to the Policy:
|
|
|
| • | employment arrangements with management that are otherwise approved by the Board; |
|
|
|
| • | transactions for which the related person’s interest is solely due to their status as a shareholder; and |
|
|
|
| • | transactions with third parties in which the amounts involved are not material to the third parties. |
A related person under the Policy is:
|
|
|
| • | someone who is or was an executive officer, Director or nominee for election as a Director of the Company since the beginning of the last fiscal year; |
|
|
|
| • | a person or group who is a beneficial owner of more than 5% of the Company’s voting securities; or |
|
|
|
| • | an immediate family member of any of the foregoing. |
Each officer and Director has an affirmative obligation to inform the Company of any transactions in which he or she or a member of his or her immediate family may have a material interest and which may reasonably be expected to be a related person transaction. Management of the Company is also required to inform the Company of any potential related person transactions of which management becomes aware in the course of business development activities.
Our General Counsel is responsible for determining whether a particular transaction is a related person transaction. If so, the Governance and Nominating Committee reviews the transaction to determine whether to approve or ratify the transaction and whether to impose any conditions on the approval or ratification.
In determining whether to approve or ratify a particular transaction, the Governance and Nominating Committee will take into account any factors that it deems relevant, which may include, among other things:
|
|
|
| • | the material terms of the transaction; |
|
|
|
| • | the expected and potential impact of the transaction on the Company’s results of operations, financial position and cash flows; |
|
|
|
| • | whether the terms of the transaction are no less favorable to the Company than if the other party did not have an affiliation with a related person; |
|
|
|
| • | the availability of, and terms to obtain, other sources of comparable products or services, where applicable; and |
|
|
|
| • | the identity of the related person and the impact of the transaction on the related person’s independence due to the expected and potential financial interest of the related person in the transaction. |
Under the Policy, related persons are required to refrain from directly or indirectly participating in the negotiation of any transactions that may reasonably be expected to be related person transactions, or managing any existing related person transactions. In addition, no Director of the Company may engage in the approval under the Policy of a related person transaction in which he or she, or a member of his or her immediate family, has a material interest, except to the extent of providing to the
15
Governance and Nominating Committee all material information requested concerning the related person transaction.
Jason Zellers, the Company’s Vice President and General Counsel, is married to Amy Zellers, who has been an employee of the Company since 2008 and currently holds the position of Senior Marketing Manager with the Company’s International Division. Ms. Zellers total compensation in fiscal year 2012 was approximately $200,000, consisting of salary, bonus, equity grants and retirement benefits. Her total compensation is commensurate with her peers and consistent with the Company’s overall compensation principles based on her years of experience, performance and position within the Company. As required, the Company’s Governance and Nominating Committee reviewed and ratified Ms. Zellers’ compensation.
Section 16(a) Beneficial Ownership Reporting Compliance
Section 16(a) of the Securities Exchange Act of 1934, as amended (the “Exchange Act”), requires our Directors and executive officers to file initial reports of ownership and reports of changes in ownership of our securities with the SEC. Based on a review of the Section 16(a) reports filed by our Directors and executive officers in 2012 and on written representations by the Directors and executive officers, we believe that all Section 16(a) filing requirements applicable to our Directors and executive officers during 2012 were satisfied.
16
|
Our Articles of Incorporation and Bylaws provide that the Board of Directors be divided into three classes of Directors as nearly equal in number as possible. The members of each class are elected to serve three-year terms with the terms of office for each class expiring at successive annual meetings.
At this year’s annual meeting, the three-year terms of Stuart M. Essig, Barbara B. Hill and Michael A. Rocca will expire. Mr. Essig, Ms. Hill and Mr. Rocca have been nominated for re-election to the Board for a three-year term ending in 2016. If elected, Mr. Essig, Ms. Hill and Mr. Rocca will continue in office until their successors have been duly elected and qualified, or until the earlier of their death, resignation or retirement. We expect each of the nominees to be able to serve if elected.
The principal occupation and other information about each of the Director nominees and each Director whose term of office will continue after the annual meeting are provided below.
The Board of Directors recommends a voteFOR the election Stuart M. Essig, Barbara B. Hill and Michael A. Rocca as Directors. Proxies will be votedFOR the election of the nominees unless otherwise specified.
|
|
|
|
| |
| Stuart M. Essig,Director of St. Jude Medical since 1999. Chairman of the Board of Directors of Integra LifeSciences Holdings Corporation, a manufacturer of medical devices and implants, since January 2012. A director on the Integra Board of Directors since December 1997. From December 1997 to January 2012, Chief Executive Officer of Integra. Director of Zimmer Holdings from March 2005 to August 2008. Age: 51 | |
|
| |
| Barbara B. Hill, Director of St. Jude Medical since December 2007. Operating Partner of Moelis Capital Partners, a private equity firm, since March 2011. President, Chief Executive Officer and Director of ValueOptions, Inc., a managed behavioral health company, and FHC Health Systems, Inc., its parent company, from March 2006 to September 2010. Chairman and Chief Executive Officer of Woodhaven Health Services, an institutional pharmacy company, from August 2004 to March 2006. President and Director of Express Scripts, Inc., a pharmacy benefits management company, from April 2002 to October 2003. Age: 60 | |
|
| |
| Michael A. Rocca,Director of St. Jude Medical since March 2004. Retired in 2000 from Mallinckrodt, Inc., a pharmaceutical and medical device manufacturer, where he was Senior Vice President and Chief Financial Officer from 1994 to 2000. Director of Hyatt Hotels Corporation. Director of Lawson Software, Inc. from February 2003 to July 2011. Age: 68 | |


17
|
|
|
|
| |
| Richard R. Devenuti, Director of St. Jude Medical since 2001. President, Information Intelligence Group, a Division of EMC Corporation, a developer and provider of information infrastructure technology and solutions, since October 2010. Senior Vice President and Chief Operating Officer of the Information Intelligence Group from July 2008 to October 2010. Senior Vice President of Worldwide Services and IT of Microsoft Corporation, a software company, from December 2003 until January 2007. From March 1999 to December 2003, Vice President and Chief Information Officer of Microsoft Corporation. Director of Convergys Corporation and Director of XETA Technologies Inc. from May 2008 to November 2009. Age: 55 | |
|
| |
| Wendy L. Yarno, Director of St. Jude Medical since 2002. Independent consultant in the life sciences industry. Chief Marketing Officer of HemoShear LLC, a biotechnology research company, from September 2010 through February 2012. From 2006 to 2008, Chief Marketing Officer for Merck & Co., Inc., a pharmaceutical company. From 2005 to 2006, General Manager, Business Unit, Merck & Co., Inc. From 2002 to 2005, Executive VP, Worldwide Human Health, Merck & Co., Inc. Age: 58 | |


18
|
|
|
|
| |
| John W. Brown,Director of St. Jude Medical since August 2005. Chairman of the Board of Stryker Corporation, an orthopedic device company, from 1997 through December 2009. Chief Executive Officer of Stryker Corporation from 1977 through 2004. Chairman Emeritus of Stryker Corporation. Age: 78 | |
|
| |
| Daniel J. Starks, Director of St. Jude Medical since 1996. Chairman, President and Chief Executive Officer of St. Jude Medical since May 2004. President and Chief Operating Officer of St. Jude Medical from January 2001 to May 2004. From April 1998 to February 2001, President and Chief Executive Officer of the Cardiac Rhythm Management Division of St. Jude Medical. Previously, Chief Executive Officer and President, Daig Corporation. Director of Urologix, Inc. from October 2002 to November 2009. Age: 58 | |


19
|
CERTAIN BENEFICIAL OWNERS |
The following table presents information regarding the beneficial ownership of our common stock as of March 5, 2013 by (a) each of our Directors, Director nominees and executive officers appearing in the Summary Compensation Table on page 43, (b) all of our Directors and executive officers as a group and (c) each person known to the Company to be the beneficial owner of more than 5% of our common stock. Unless otherwise noted, these persons have sole voting and dispositive power with respect to the shares owned by them, and none of the shares beneficially owned by our Directors, Director nominees and executive officers are subject to a pledge.
|
|
|
|
|
|
|
|
|
|
|
|
|
|
|
| Amount and Nature of |
|
|
|
|
|
| |||||
Name of Beneficial Owner |
| Number of |
| RSUs that vest and |
| Total Beneficial |
|
| Percent of |
| |||
| |||||||||||||
John W. Brown |
| 114,709 |
|
| 74,300 |
|
| 189,009 |
|
|
| * |
|
Richard R. Devenuti |
| 12,636 |
|
| 75,700 |
|
| 88,336 |
|
|
| * |
|
Stuart M. Essig |
| 27,887 |
|
| 75,700 |
|
| 103,587 |
|
|
| * |
|
Barbara B. Hill |
| 9,667 |
|
| 59,979 |
|
| 69,646 |
|
|
| * |
|
Michael A. Rocca |
| 12,797 |
|
| 70,100 |
|
| 82,897 |
|
|
| * |
|
Daniel J. Starks |
| 6,186,116 |
|
| 1,833,500 |
|
| 8,019,616 | (6) |
|
| 2.56% |
|
Wendy L. Yarno |
| 18,150 |
|
| 75,700 |
|
| 93,850 |
|
|
| * |
|
John C. Heinmiller |
| 235,689 |
|
| 1,015,000 |
|
| 1,250,689 |
|
|
| * |
|
Michael T. Rousseau |
| 19,717 |
|
| 806,500 |
|
| 826,217 |
|
|
| * |
|
Denis M. Gestin |
| 5,592 |
|
| 307,500 |
|
| 313,092 |
|
|
| * |
|
Donald J. Zurbay |
| 9,162 |
|
| 156,166 |
|
| 165,328 |
|
|
| * |
|
Directors and Executive Officers as a Group |
| 6,748,325 |
|
| 5,869,526 |
|
| 12,613,966 |
|
|
| 4.02% |
|
Massachusetts Financial Services Company |
| 32,728,256 | (2) |
| -0- |
|
| 32,728,256 |
|
|
| 10.60% |
|
Capital Research Global Investors |
| 33,147,044 | (3) |
| -0- |
|
| 33,147,044 |
|
|
| 10.80% |
|
BlackRock, Inc. |
| 19,620,668 | (4) |
| -0- |
|
| 19,620,668 |
|
|
| 6.37% |
|
Wellington Management Company, LLP |
| 15,948,077 | (5) |
| -0- |
|
| 15,948,077 |
|
|
| 5.17% |
|
|
|
|
|
| |
|
|
|
Footnotes |
| |
|
|
|
* | Less than 1.0% | |
|
| |
(1) | Includes 1,071 shares of common stock, 180 restricted stock units and 2,192 stock options held by an executive officer’s spouse, for which the executive officer disclaims beneficial ownership. | |
|
| |
(2) | This information is derived from a Schedule 13G/A filed on February 13, 2013 by Massachusetts Financial Services Company (“MFS”), an investment adviser, which is deemed to be the beneficial owner of 32,728,256 shares of our common stock owned by MFS and/or certain other non-reporting entities. MFS has sole voting power over 27,634,509 shares and sole dispositive power over 32,728,256 shares. | |
|
| |
(3) | This information is derived from a Schedule 13G/A filed on February 13, 2013 by Capital Research Global Investors (“CRGI”), which is deemed to be the beneficial owner of 33,147,044 shares of our common stock as a result of acting as an investment adviser to various investment companies registered under the Investment Company Act of 1940. CRGI, a division of Capital Research and Management Company, disclaims beneficial ownership pursuant to Rule 13d-4 under the Exchange Act. | |
|
| |
(4) | This information is derived from a Schedule 13G filed on January 30, 2013 by BlackRock, Inc., which is deemed to be the beneficial owner of 19,620,668 shares of our common stock. | |
20
|
|
|
(5) | This information is derived from a Schedule 13G filed on February 14, 2013 by Wellington Management Company, LLP (“WMC”), an investment adviser, which may be deemed to be the beneficial owner of 15,948,077 shares of our common stock which are held of record by clients of WMC. WMC has shared voting power over 3,445,251 shares and shared dispositive power over 15,948,077 shares. | |
|
| |
(6) | Includes 2,000,000 shares that are subject to a pledge in support of a line of credit. | |
21
|
We have reviewed and discussed with management the Compensation Discussion and Analysis. Based on this review and discussion, we have recommended to the Board of Directors that the Compensation Discussion and Analysis be included in this proxy statement and the Company’s Annual Report on Form 10-K for the fiscal year ended December 29, 2012.
|
|
| Stuart M. Essig, Chairman |
| Barbara B. Hill |
| Wendy L. Yarno |
Compensation Discussion and Analysis
Executive Summary
This Compensation Discussion and Analysis describes the material elements of compensation awarded to each of the following executive officers (the “Named Executive Officers”) for fiscal 2012:
|
|
|
|
| • | Daniel J. Starks | Chairman, President and Chief Executive Officer |
|
|
|
|
| • | John C. Heinmiller | Executive Vice President |
|
|
|
|
| • | Michael T. Rousseau | Group President |
|
|
|
|
| • | Denis M. Gestin | President, International Division |
|
|
|
|
| • | Donald J. Zurbay | Vice President, Finance and Chief Financial Officer |
Compensation Philosophy and Principles
The Compensation Committee of the Company’s Board of Directors (the “Committee”) is responsible for establishing and administering compensation programs for the Company’s executive officers. To achieve our business objectives, the Committee seeks to ensure that our executive compensation programs reinforce our business strategy and are appropriately aligned with the interests of our shareholders. The goals of our compensation programs are to attract, retain and motivate talented executives to enable the Company to be successful in a highly competitive industry and to enhance shareholder value. The following principles were used in the design of the programs:
|
|
|
| • | A substantial part of an executive officer’s compensation should be incentive-based, tied to Company performance; |
|
|
|
| • | Compensation should reflect individual job responsibilities, qualifications and performance; and |
|
|
|
| • | Executive officers and employees should be encouraged to own St. Jude Medical stock. |
In line with our pay for performance philosophy, the total compensation received by the Named Executive Officers will vary based on division and corporate level performance measured over the short and long term. As an executive’s level of responsibility within our organization increases, so does the percentage of total compensation that we link to performance. Our Named Executive Officers’ total compensation is comprised of a mix of base salary, annual incentive compensation and equity awards consisting of stock options and restricted stock units. Our Named Executive Officer compensation
22
program is weighted toward equity awards, and such officers are required to accumulate and hold Company stock. Changes in Company stock price have a direct effect on the amount of compensation they realize, in addition to the value of the Company stock they own. If shareholder value declines, so does the compensation we deliver to our executives.
We seek to ensure the long-term growth of the Company while at the same time delivering short-term results. Our executive compensation program for the Named Executive Officers supports these initiatives by way of an annual cash incentive plan based solely on Company-wide and divisional financial objectives; stock options, which have value only through future appreciation in stock price; and restricted stock units, which foster retention and provide an alignment with shareholder value creation.
The Committee and the Board believe that the skill and motivation of our employees, and especially our executive leaders, are essential to the Company’s performance and creation of shareholder value. St. Jude Medical operates in a fast-paced, ever-evolving industry in which there is a high level of competition for market share and talent. In order to attract and retain the necessary talent, we set each component of compensation – base salary, annual cash incentive target and long-term incentive awards – using the 60th percentile of the external market (as determined through the process described beginning on page 30) as a reference point. We believe our compensation program motivates performance that differentiates us from our competitors and does not encourage excessive risk-taking, as discussed further under “Compensation Risk Analysis” below. We will continue to provide a compensation program that we believe is effective, serves shareholder interests and is worthy of shareholder support.
2012 Say on Pay Results
At the Company’s 2012 Annual Meeting, the Company’s shareholders had the opportunity to cast a non-binding advisory vote on the compensation of the Named Executive Officers. Approximately 82%of the shares voted at the meeting approved the Named Executive Officers’ compensation. The Committee welcomed this feedback and, while the results were taken into account, as evidenced by the compensation-related changes adopted by the Company in 2012 in the paragraph below, they were not the sole factor considered in making executive pay decisions. The Company intends to continue its practice of linking Company performance with executive compensation decisions.
Continuous Improvement
The Company continues to assess its executive compensation programs and practices and periodically makes changes based on competitive market and governance considerations. Recent changes include:
|
|
|
| • | The Company has eliminated the provision for the payment of excise tax and associated gross-up from its change in control severance agreements for any such agreements entered into after December 2012. |
|
|
|
| • | Beginning in December 2012, the Company modified its equity award agreements so that they now contain (i) a “double trigger” change in control provision such that vesting is accelerated only if the executive officer is involuntarily terminated, other than for cause, or leaves for good reason following a change in control and (ii) a provision that requires the executive officer to return or repay certain amounts under the equity award agreement if they breach the non-competition or non-solicitation provisions of the agreement. |
|
|
|
| • | Effective beginning in 2012, the Company implemented a compensation recoupment or “clawback” policy that requires the repayment of annual incentive awards in certain circumstances. |
23
|
|
|
| • | In December 2011, the Committee adopted an anti-hedging policy prohibiting all Directors and executive officers from engaging in the purchase or sale of financial instruments based on the Company’s securities that are designed to hedge or offset any decrease in the market value of the Company’s securities. |
|
|
|
| • | Beginning in August 2012, the Committee hired Pay Governance as its external advisor related to executive and Board of Directors compensation matters. Pay Governance does not provide any services to the Company other than those provided to the Committee. |
|
|
|
| • | In order to balance the executive compensation mix and reduce the amount of compensation which may be perceived as encouraging risk-taking behavior, a portion of the Named Executive Officer’s 2012 long-term incentive award was provided in the form of restricted stock units. Prior to 2012, long-term incentives awards to Named Executive Officers were provided entirely in the form of stock options. |
Fiscal 2012 Performance
Our executive team has successfully managed the Company through the recent macroeconomic downturn and the challenging cardiac rhythm management market and taken the appropriate steps to position the Company for future growth and success. Despite a number of headwinds, we delivered improved financial results for fiscal year 2012 as seen in the year-over-year comparison set forth below. For the fiscal year ended December 29, 2012, while there was only modest constant-currency revenue growth, the Company implemented a series of organizational and structural changes that provided significant cost savings, contributing to the 6% increase to our adjusted diluted net earnings per share (“EPS”) and the most profitable year in Company history (on an adjusted net earnings basis). These organizational and structural changes were part of a comprehensive plan to accelerate the Company’s growth and, in addition to reducing costs, were focused on the Company being able to leverage economies of scale, maintain the highest level of quality and fund our portfolio of growth drivers. Please see “Management’s Discussion and Analysis of Financial Conditions and Results of Operations” in our Annual Report on Form 10-K for a more detailed description of our fiscal year 2012 financial results.
|
|
|
|
|
|
|
|
| Fiscal Year |
| Fiscal Year |
| Change % |
Constant-Currency Net Sales (millions)(1) |
| $5,640 |
| $5,612 |
| 1% |
| ||||||
Adjusted Net Earnings (millions) (1) |
| $1,095 |
| $1,074 |
| 2% |
| ||||||
Adjusted Diluted Net Earnings per Share(1) |
| $3.48 |
| $3.28 |
| 6% |
|
|
|
| (1) | The year-over-year change in net sales is represented on a constant-currency basis. The Company’s reported net sales for 2011 and 2012 were $5.612 billion and $5.503 billion, respectively. A reconciliation of non-GAAP constant-currency net sales, non-GAAP adjusted net earnings and non-GAAP adjusted diluted net earnings per share is included in “Adjustments for Non-GAAP Financial Measures” on page 39 of this proxy statement. |
24
Fiscal 2012 Pay Implications
Our fiscal year 2012 corporate performance was a key factor in the compensation decisions and outcomes for the fiscal year. In December 2011, the Board of Directors approved an operating plan that reflected our expectations for Company performance and included goals for Company-wide sales, adjusted EPS and division sales and adjusted operating earnings achievement. These goals served as targets for our Management Incentive Compensation Plan (“MICP”). The Committee determined that these goals provided appropriate incentive for continued execution of our growth and performance strategy. In 2012, overall Company sales fell below targeted levels identified in the operating plan as the Company was able to only modestly grow revenue (on a constant-currency basis). However, primarily driven by the organizational and structural changes described above, adjusted EPS exceeded targeted levels identified in the operating plan, despite significant macroeconomic and industry challenges.
2012 adjusted EPS performance equaled 102% of the MICP target and 2012 sales performance was achieved at 94% of target. For 2012, division sales performance ranged from 92% to 96% of the MICP target and adjusted division operating profit performance ranged from 91% to 99% of the MICP target. The payouts associated with these levels of performance are determined by a scale on which 100% achievement of a performance target results in a payment at 100% of target level bonus. To increase the incentive to achieve or over-achieve target, performance below target results in a payout that declines steeply from 100% payout at target to no payout for performance below 90% of target, while performance above target results in a steeply inclined scale that pays up to 200% of the individual’s target-level bonus for performance at 120% of target. Fiscal 2012 performance resulted in MICP awards for our Named Executive Officers that ranged from 85% to 103.75% of target-level bonuses. The range of MICP awards reflects the Committee’s philosophy to align such awards most closely with the performance of the business unit for which the executives have direct accountability. It is also important to note that MICP awards are based solely on financial performance measures and do not allow for a financial performance shortfall to be offset by the overachievement of qualitative measures. Please see “Fiscal 2012 Annual Incentive Awards” on page 35 for more detailed annual incentive award information for our Named Executive Officers.
Long-term incentive awards make up a significant portion of each of the Named Executive Officer’s compensation. In 2012, the Named Executive Officers received a combination of stock options and restricted stock units. Both award vehicles result in long-term incentive compensation being highly correlated to the Company’s stock price performance. Stock options only have value if the stock price appreciates and the value of restricted stock units will rise and fall in direct correlation to the Company’s stock price. As set forth in the table below, the current value of the 2012 equity awards as of the end of the fiscal year based on the Company’s year-end stock price was significantly below the value reported in the Summary Compensation Table.
Our executives’ base salaries were reviewed prior to the start of fiscal 2012. Based on the financial performance of the Company in 2011 and benchmark data available at the time, we granted average salary increases of 5.1% to our Named Executive Officers, excluding Mr. Zurbay who received a salary increase when he was promoted to Vice President, Finance and CFO in August 2012. Please see “Fiscal 2012 Base Salaries” on page 35 for more detailed base salary information for our Named Executive Officers.
Since the Company provides a significant portion of its compensation to the Named Executive Officers in the form of equity awards, it is important to note that the equity values reported in the Summary Compensation Table on page 43 are not necessarily the values that the Named Executive Officers will realize. The table below illustrates the value as of the Company’s fiscal year-end of equity awards made to each of the Named Executive Officers over the past five years, using the Company’s year-end closing stock price of $35.47, compared to the fair value reported in the Summary Compensation Table in each of those years. In aggregate, the total equity value for each of the Named Executive Officers, based on the Company’s year-end stock price, was less than 20% of the values
25
reported in the Summary Compensation Table for those years, illustrating the high degree of alignment between stock price performance and executive compensation.
|
|
|
|
|
|
|
|
|
|
|
|
|
|
|
|
|
|
|
|
|
|
|
|
| 2008 |
| 2009 |
| 2010 |
| 2011 |
| 2012 |
|
| ||||||||||
|
|
|
|
|
|
|
|
|
|
|
|
|
|
|
|
|
|
|
|
|
| |
|
| $6,424,380 |
| $2,934,000 |
| $5,865,795 |
| $0 |
| $6,997,200 |
| $0 |
| $4,481,808 |
| $244,800 |
| $4,338,166 |
| $1,507,590 |
| 17% |
|
| $2,676,825 |
| $1,222,500 |
| $2,789,511 |
| $0 |
| $3,250,783 |
| $0 |
| $2,801,130 |
| $153,000 |
| $3,070,020 |
| $1,184,040 |
| 18% |
|
| $2,141,460 |
| $978,000 |
| $2,372,388 |
| $0 |
| $2,973,810 |
| $0 |
| $2,801,130 |
| $153,000 |
| $3,070,020 |
| $1,184,040 |
| 17% |
|
| $963,657 |
| $440,100 |
| $1,173,159 |
| $0 |
| $1,545,215 |
| $0 |
| $1,867,420 |
| $102,000 |
| $1,775,916 |
| $667,260 |
| 17% |
|
| n/a |
| n/a |
| n/a |
| n/a |
| n/a |
| n/a |
| n/a |
| n/a |
| $1,053,077 |
| $470,084 |
| n/a |
|
|
|
1 | Information is only provided for Mr. Zurbay for 2012 because he was not a Named Executive Officer prior to such time. | |
Use of Consultants and Other Advisors
Until August 2012, the Committee retained Mercer (US) Inc. (“Mercer”), a wholly owned subsidiary of Marsh & McLennan Companies, Inc. (“MMC”), to assist the Committee with its responsibilities related to the Company’s executive and Board of Director compensation programs. Mercer’s fees for executive and Director compensation consulting to the Committee in fiscal year 2012 were $93,880.
Mercer’s responsibilities to the Committee included providing:
|
|
|
| • | Competitive market data and advice related to the Chief Executive Officer’s compensation level and incentive program; |
|
|
|
| • | A review of Company compensation levels, performance and incentive program design (including performance objectives); |
|
|
|
| • | Information on executive compensation trends and implications for the Company; and |
|
|
|
| • | Competitive market data and advice on outside Director compensation. |
During the fiscal year, management decided to retain Mercer and its MMC affiliates to provide other services unrelated to executive and Director compensation. These other services provided by Mercer were not approved by the Board of Directors or the Committee. The aggregate fees paid for these other services were $326,459.
Although the Company retained Mercer for other services, the Committee is confident that the advice it received from the executive compensation consultant was objective and not influenced by Mercer’s or its affiliates’ relationships with the Company because of the procedures Mercer and the Committee have in place. These include:
|
|
|
| • | The consultant receives no incentive or other compensation based on the fees charged to the Company for other services provided by Mercer or any of its affiliates; |
|
|
|
| • | The consultant is not responsible for selling other Mercer or affiliate services to the Company; |
26
|
|
|
| • | Mercer’s professional standards prohibit the individual consultant from considering any other relationships Mercer or any of its affiliates may have with the Company in rendering his or her advice and recommendations; |
|
|
|
| • | The Committee has the sole authority to retain and terminate the executive compensation consultant; |
|
|
|
| • | The consultant has direct access to the Committee without management intervention; and |
|
|
|
| • | The Committee evaluates the quality and objectivity of the services provided by the consultant each year and determines whether to continue to retain the consultant. |
This approach protects the Committee’s ability to receive objective advice from the consultant so that the Committee may make independent decisions about executive pay.
In August 2012, the Committee selected Pay Governance as its advisor regarding executive and Board of Director compensation programs, with Pay Governance providing substantially similar services to those provided by and described above for Mercer. Pay Governance’s fees for executive and Director compensation consulting to the Committee in fiscal year 2012 were $191,425. Pay Governance was not retained to provide any other services to the Company in 2012. As part of the Company’s evaluation of Pay Governance, the Committee considered the following independence factors and associated responses from Pay Governance:
|
|
|
Independence Criteria |
| Pay Governance Response |
Provision of non-Committee-directed, nonexecutive compensation services |
| None |
|
|
|
Amount of fees paid to Pay Governance as a percentage of Pay Governance revenue |
| Both 2012 actual and 2013 projected fees for St. Jude Medical are less than 1% of Pay Governance’s annual revenue |
|
|
|
Pay Governance conflict of interest policy |
| Pay Governance maintains a detailed conflict of interest and independence policy, which was provided to the Committee, in order to ensure that the Committee can be confident that it receives conflict-free advice |
|
|
|
Business or personal relationship of Pay Governance’s advisor for St. Jude Medical with a member of St. Jude Medical’s Compensation Committee |
| None |
|
|
|
Business or personal relationship of Pay Governance or its advisor for St. Jude Medical with a St. Jude Medical executive |
| None |
|
|
|
St. Jude Medical stock owned by advisor |
| None |
27
Overview of Components of Named Executive Officer Compensation Program
The tabular and narrative disclosures below describe the objectives of each of the four major components of our Named Executive Officer compensation program and explain how the amount of each component is determined by the Committee. For a discussion of the specific actions and awards for fiscal 2012 for each component, see “Overview of Fiscal 2012 Compensation,” “Fiscal 2012 Base Salaries,” “Fiscal 2012 Annual Incentive Awards,” “Fiscal 2012 Long-Term Incentive Awards” and “Fiscal 2012 Other Benefits and Perquisites” below.
|
|
|
|
|
Component |
| Objective |
| How Determined |
Base Salary |
| Competitive base salaries are necessary to attract and retain high caliber candidates and serve as the fixed component of our compensation. |
| • Consideration of the market 60th percentile data along with the factors listed under “Determination of Targeted Compensation Levels” below. |
|
|
|
|
|
Annual Incentive Awards |
| Serves to focus executives on the delivery of annual performance results related to sales and profitability. The incentives are weighted so that awards are based most heavily on those items for which the executive is most directly accountable while at the same time providing consideration to overall corporate performance. |
| • For target bonus award opportunity percentages: consideration of the market 60th percentile data along with the factors listed under “Determination of Targeted Compensation Levels” below as well as trends and internal equity among positions within the Company with similar responsibilities. |
|
|
|
|
|
Long-Term Incentive Awards (Equity Awards) |
| Link executive compensation to long-term shareholder return and provide a retention feature as a result of awards vesting over time. |
| • Consideration of the market 60th percentile data along with the factors listed under “Determination of Targeted Compensation Levels” below. |
|
|
|
|
|
Other Benefits and Perquisites |
| Ensure a competitive total compensation package by providing a cash allowance to offset the aggregate value of perquisites provided at peer companies. |
| • For the cash perquisite allowance, consideration is given to the 50th percentile data for primary and expanded peer companies. |
Additional information regarding annual and long-term incentive awards follows.
Annual Incentive Awards. All annual incentive awards paid to the Named Executive Officers are awarded and paid under the MICP and are based on the achievement of predetermined, objective performance goals as established under the Company’s annual operating plan. Each objective is assigned a relative weighting for each Named Executive Officer. The weightings result in each executive’s incentives being tied most heavily to those factors over which the executive has the greatest influence.
Under the MICP, target award opportunities, weightings and associated performance objectives must be determined and approved by the Committee or Board of Directors no later than 90 days after the beginning of the fiscal year. Typically, target award opportunities, weightings and associated performance objectives for a particular fiscal year are approved in the December preceding the start of that fiscal year. At that time, the Committee may identify items that will be excluded from the calculation of incentive payments, such as the impact of foreign exchange rates, transaction costs and accretive or dilutive effect of merger and acquisition activity and other specified items.
28
Upon completion of each fiscal year, the Committee determines and certifies in writing the payout levels associated with Company-wide and division performance results, and incentive awards are typically paid in February. The Committee has no discretion under the MICP to increase any executive’s incentive target or payout that would be due upon the attainment of performance objectives, or otherwise modify performance objectives associated with the performance period. However, the Committee may, in its discretion, reduce or eliminate individual incentive targets or payouts for a performance period. The Committee did not exercise this discretion related to MICP awards for 2012.
In December 2011, the Committee adopted a policy regarding the recovery of performance-based compensation payable under our MICP from executive officers under certain circumstances. The “claw-back” policy provides that executive officers will be required to reimburse the Company for any annual MICP payment subject to the policy received in the three-year period preceding the date on which the Company is required to prepare an accounting restatement that was due to material noncompliance under any financial reporting requirements. The amount of reimbursement will be the excess, if any, of the amount actually paid to an executive officer over the amount which should have been paid based upon the restated results.
Long-Term Incentive Awards. For 2012, long-term incentive compensation was provided to the Named Executive Officers through awards granted under the Company’s shareholder-approved 2007 stock plan. The Committee annually reviews the potential dilutive effect of equity award programs from both a share and economic basis as compared to the primary peer group companies.
Prior to 2012, the Company granted primarily stock options to our Named Executive Officers. Beginning in December 2012, however, the Named Executive Officers began to receive a portion of their annual equity awards in the form of restricted stock units. The Company believes this mix of stock options and restricted stock units is appropriate and consistent with its objective of directly aligning management compensation with the delivery of shareholder value, while at the same time providing a strong retention component that is not perceived as encouraging risk-taking behavior. Stock options have value only to the extent that the price of the Company’s stock on the date of exercise exceeds the exercise price, which is equal to the closing market price of our common stock on the date of grant, and the value of restricted stock units is directly correlated to the price of our common stock. To encourage a longer-term perspective and retain our employees, restricted stock units do no vest immediately, but rather generally vest 25% per year over a four-year period and any unvested awards are forfeited at the time of termination. Similarly, stock options cannot be exercised immediately, and generally become exercisable over a four-year period. Equity awards are generally made in December of each year on a date coinciding with a regularly scheduled Board of Directors meeting. This date falls after the release of the Company’s third quarter earnings and prior to the end of the Company’s fourth quarter.
In certain cases, equity awards may be granted to new hires upon commencement of employment with the Company or to existing employees upon promotion to a higher level position. In those cases the grant date is determined to be the fifth day of the month following the later of the month of commencement of employment or written approval of the grant. If the fifth day of the month is within seven days before an earnings release, the grant date is the third business day following the earnings release. In August 2012, the Company awarded 3,500 restricted stock units to Donald J. Zurbay in connection with his promotion to Vice President, Finance and Chief Financial Officer.
Beginning in December 2012, the Company modified its equity award agreements so that they now contain (i) a “double trigger” change in control provision such that vesting is accelerated only if the executive officer is involuntarily terminated, other than for cause, or leaves for good reason following a change in control and (ii) a provision that requires the executive officer to return or repay certain amounts under the equity award agreement if they breach the non-competition or non-solicitation provisions of the agreement.
29
Determination of Targeted Compensation Levels
In December of each year, the Committee establishes base salaries, annual incentive targets, long-term incentive awards and cash perquisite allowances. The annual incentive targets are effective for the next year and the long-term incentive awards are effective the day they are approved but are intended to be compensation for the next year and beyond.
In establishing target levels of pay for base salaries, annual incentive targets and long-term incentive awards, the Company considers the market 60th percentile data along with additional factors such as:
|
|
|
| • | Actual executive role as compared to the most similar external comparator description; |
|
|
|
| • | Individual executive’s experience and past performance; |
|
|
|
| • | Ability of the position to impact key business initiatives; |
|
|
|
| • | Our assessment of the risk of losing the executive to competitors; |
|
|
|
| • | Advancement potential; and |
|
|
|
| • | Succession planning considerations. |
No pre-assigned weighting is given to these factors. In establishing cash perquisite allowances for the Named Executive Officers, consideration is given to the 50th percentile data for primary and expanded peer companies.
The Company considers “standard performers” to be those executives whose areas of responsibility consistently meet or exceed annual performance targets and who provide leadership that is consistent with the Company’s core values and is aligned with the Company’s overall long-term growth strategy. Executives who are considered to be standard performers and for whom there is substantially similar external market comparator data typically have their base salaries, annual incentive targets and long-term incentive awards targeted to the 60th percentile of the external market. We believe that targeting the 60th percentile for standard performers is appropriate given our practice of recruiting the highest caliber executives and our historically aggressive performance goals. Moreover, the cost of turnover at the executive level can be high given the growth initiatives of the Company and the potential delay to those initiatives that could result from the loss of key executives. In general, the Company considers compensation levels within 15% of the value associated with the 60th percentile reference point to be within a reasonable range of the 60th percentile in light of differences in external market data that can be explained by performance, time in position or year-over-year anomalies in market data.
In the event that an executive’s position has greater responsibility than the external market comparator, the executive’s performance consistently exceeds objectives, the executive possesses a skill set that is critical to a key business objective or the executive is in line for a key leadership position, the executive’s base salary, annual incentive target and/or long-term incentive award may be targeted above the 60th percentile of the external market. In the event that an executive has not fully met performance objectives, has duties and responsibilities which are less than those of the closest external comparator, or is new to his or her position and has not had the opportunity to demonstrate a consistent level of performance, the executive’s base salary, annual incentive target and/or long-term incentive award may be targeted below the 60th percentile.
The Committee makes recommendations to the Board of Directors regarding the compensation to be paid to the Chief Executive Officer of the Company. When making such recommendations, the Committee considers the results of the review by the Board of the Chief Executive Officer’s performance against specific objectives established at the beginning of each year, the 60th percentile of
30
the primary peer group for base salaries, annual incentive targets and long-term incentive awards and the Company’s overall financial performance as compared to the performance of companies in the primary peer group. The Chief Executive Officer attends Committee meetings but is not present for the discussions when his own compensation is determined.
The Committee determines, and reports to the Board of Directors, the compensation to be paid to Named Executive Officers other than the Chief Executive Officer. When evaluating the compensation levels of the other Named Executive Officers, the Committee considers recommendations of our Chief Executive Officer. These recommendations are presented to the Committee each year along with a written assessment for each executive officer addressing performance against the past year’s financial objectives, overall leadership effectiveness and individual breadth and effectiveness.
In determining compensation levels for the Named Executive Officers, the Committee also reviews current and historical compensation levels (targeted and actually paid) for each executive, including the current value of any outstanding equity awards. While historical compensation levels are considered when establishing future compensation targets, the primary objective is to establish market-competitive programs that are highly aligned with future Company performance goals and shareholder value creation. This results in executive compensation being highly correlated to annual financial performance and long-term stock price performance. On average, 82% of targeted total compensation (base salary, annual incentive, long-term incentive and cash perquisite allowance) for the Named Executive Officers in fiscal 2012 was tied to Company-wide and/or division performance and at-risk insofar as annual incentive awards and the value of stock awards may be reduced or eliminated depending on Company-wide and division performance.
Fiscal 2012 Market Data
We evaluate the compensation paid to the Named Executive Officers in relation to the programs offered by a primary peer group of other medical product companies. In the event the data sample is not large enough, data from an expanded peer group and/or other data sources may be used. Companies are selected based on similarities of business characteristics and overall company size. Organizational size is measured using revenue, and the primary peer group is developed so that the median annual sales revenue of the companies within the primary peer group approximates the annual revenue for the Company. The primary and expanded peer groups are reviewed by the Committee in May of each year. If necessary, changes may be made to the peer groups in order to achieve the objectives stated above or as the result of merger and acquisition activity that may have impacted peer companies. As reflected in the table below, the Company made changes to the peer group in May 2012.
31
The following table represents the primary peer and expanded group used for making decisions related to (i) 2012 base salaries and annual incentive targets and (ii) December 2012 long term incentive awards. The changes to the primary and expanded peer group companies identified in column A to those identified in column B were made in May 2012.
|
|
|
|
|
Company |
| Column A |
| Column B |
|
|
|
|
|
Medtronic, Inc. |
| Primary |
| Primary |
Baxter International, Inc. |
| Primary |
| Primary |
Thermo-Fisher Scientific, Inc. |
| Primary |
| Primary |
Stryker Corporation |
| Primary |
| Primary |
Boston Scientific Corporation |
| Primary |
| Primary |
Becton Dickenson and Company |
| Primary |
| Primary |
Alcon, Inc. |
| Primary |
| n/a |
Zimmer Holdings, Inc. |
| Primary |
| Primary |
Hospira, Inc. |
| Primary |
| Primary |
Covidien, plc. |
| Primary |
| Primary |
Varian Medical Systems, Inc. |
| Primary |
| Primary |
CR Bard, Inc. |
| Primary |
| Primary |
Kinetic Concepts, Inc. |
| Primary |
| n/a |
Edwards, Life Sciences Corporation |
| Primary |
| Primary |
Hill-Rom Holdings, Inc. |
| Primary |
| n/a |
Steris Corporation |
| Primary |
| n/a |
Gilead Sciences, Inc. |
| Expanded |
| Expanded |
Agilent Technologies, Inc. |
| Expanded |
| Primary |
Allegran, Inc. |
| Expanded |
| Primary |
Biogen Idec, Inc. |
| Expanded |
| Expanded |
Forest Laboratories, Inc. |
| Expanded |
| Expanded |
Life Technologies Corporation |
| Expanded |
| Expanded |
Cephalon, Inc. |
| Expanded |
| n/a |
Waters Corp. |
| Expanded |
| n/a |
Bio-Rad Laboratories, Inc. |
| Expanded |
| Expanded |
Perkin-Elmer, Inc. |
| Expanded |
| Expanded |
Invacare Corporation |
| Expanded |
| Expanded |
Carefusion Corporation |
| n/a |
| Primary |
DENTSPLY International, Inc. |
| n/a |
| Expanded |
Teleflex, Inc. |
| n/a |
| Expanded |
32
The table below provides information regarding the market data used for each Named Executive Officer for each component of our compensation program. When a relevant data sample is available from the primary peer group it is used to determine market compensation levels for the Named Executive Officers. If a relevant sample is not available from the primary peer group, the data is supplemented with data from an expanded peer group or salary survey data.
|
|
|
|
|
|
|
|
|
|
|
|
| Market Match |
| Base Salary |
| Annual Incentive(1) |
| Long-Term Incentive |
| Perquisite Allowance |
|
|
|
|
|
|
|
|
|
|
|
Daniel J. Starks |
| Chief Executive Officer |
| Primary peer group identified in Column A of the peer group table on page 32 |
| Primary peer group identified in Column A of the peer group table on page 32 |
| Primary peer group identified in Column B of the peer group table on page 32 |
| Primary and expanded peer group identified in Column A of the peer group table on page 32 |
|
|
|
|
|
|
|
|
|
|
|
John C. Heinmiller |
| Chief Financial Officer is the primary point of reference with consideration given to additional responsibility for legal, HR and IT |
| Primary peer group identified in Column A of the peer group table on page 32 |
| A large sample of data from medical device and similar companies |
| Primary peer group identified in Column B of the peer group table on page 32 |
| Primary and expanded peer group identified in Column A of the peer group table on page 32 |
|
|
|
|
|
|
|
|
|
|
|
Michael T. Rousseau |
| Chief Operating Officer |
| Primary and expanded peer group identified in Column A of the peer group table on page 32 |
| A large sample of data from medical device and similar companies |
| Primary and expanded peer group identified in Column B of the peer group table on page 32 |
| Primary and expanded peer group identified in Column A of the peer group table on page 32 |
|
|
|
|
|
|
|
|
|
|
|
Denis M. |
| Top International and division level executive |
| Blend of primary and expanded peer groups and general industry data |
| A large sample of data from medical device and similar companies |
| Primary and expanded peer group identified in Column B of the peer group table on page 32 |
| Primary and expanded peer group identified in Column A of the peer group table on page 32 |
|
|
|
|
|
|
|
|
|
|
|
Donald J. Zurbay |
| Chief Financial Officer (discounted for reporting relationship) |
| Primary peer group identified in Column B of the peer group table on page 32 |
| Primary peer group identified in Column B of the peer group table on page 32 |
| Primary peer group identified in Column B of the peer group table on page 32 |
| Primary and expanded peer group identified in Column A of the peer group table on page 32 |
|
|
|
|
| |
(1) | A large sample of data from medical device and similar companies was used in determining 2012 annual incentive targets for Messrs. Heinmiller, Rousseau and Gestin. The use of this data allowed us to capture the unique characteristics of incentive levels in the industry. This sample data included data from the primary and expanded peer group identified in Column A of the peer group table on page 32 as well as the companies detailed in the table titled “Additional Sources of Supplemental Incentive Market Data” below. The supplemental market data chosen was a large enough sample to gather incentive data for all executive levels. The data was obtained from the ORC Worldwide SIRS Benchmark Survey, Mercer’s United States Benchmark Database and published compensation proxy data. | |
Additional Sources of Supplemental Incentive Market Data
|
|
|
|
|
Abbott Laboratories |
| Fenwall, Inc. |
| Philips NA – Healthcare |
ACIST Medical Systems, Inc. |
| Fresenius Medical Care AG & Co. |
| Roche Diagnostic Operations, Inc. |
Arthrex, Inc. |
| Hu-Friedy Mfg. Co., Inc. |
| Siemens AG US |
Beckman Coulter, Inc. |
| Marteck Biosciences Corporation |
| Smiths Medical ASD, Inc. |
Cardinal Health, Inc. |
| Novartis US |
| Straumann USA, LLC |
Covance Inc. |
| Novo Nordisk Inc. |
| Sunrise Medical (US) LLC |
Daiichi Sankyo Company, Ltd. |
| Owens & Minor, Inc. |
| Teleflex Incorporated |
Dentsply International, Inc. |
| Patterson Companies, Inc. |
|
|
33
|
|
|
(2) | In order to ensure a relevant sample size and reasonable position matches and capture any unique compensation characteristics of jobs based outside of the United States, data from the following companies was considered in addition to the data from the primary and expanded peer groups when determining Mr. Gestin’s 2012 base salary: Wolseley PLC; Koninklijke KPN NV; Thomas Cook Group PLC; Transocean LTD; Baloise Holding AG; Beierdorf AG; Vf Corp; AGCO Corporation; Sims Metal Management Ltd.; Coca- Cola Enterprises, Inc.; Commercial Metals Company; General Cable Corporation; and Boskalis Westminster NV. | |
Overview of Fiscal 2012 Compensation
Pay Mix. The chart below illustrates the mix of base salaries, target annual incentive awards, long-term incentive awards and cash perquisites for our Named Executive Officers as a group for fiscal 2012.
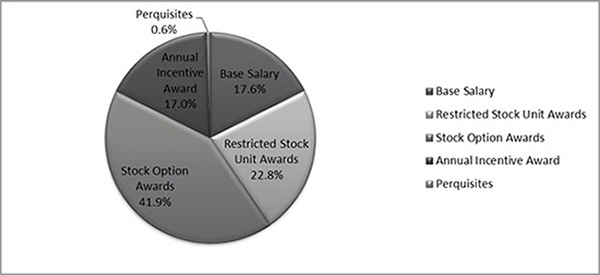
As reflected in the above chart, for fiscal 2012, on average approximately 82% of the total compensation awarded to the Named Executive Officers was in the form of annual incentive or equity compensation and therefore linked to Company performance.
Market Positioning. The following table describes how the 2012 base salaries, target annual incentive awards and long-term incentive awards for our Named Executive Officers compared against the market data described above.
|
|
|
Element of Compensation |
| Average Variance to the 60th percentile |
Base Salary |
| +2% |
|
|
|
Target Annual Incentive |
| +5% |
|
|
|
Long-term Incentive Awards |
| -2% |
The Company believes that these variances are within an acceptable range of the 60th percentile reference point. In addition to the factors listed on page 30, for Mr. Gestin, the variances to the 60th percentile reference point can be attributed to fluctuations in the Euro to U.S. Dollar exchange rate in recent years.
34
Fiscal 2012 Base Salaries
The amount of annualized base salary and year-over-year increase for each of our Named Executive Officers for fiscal year 2012 is set forth in the following table.
|
|
|
|
|
|
|
|
| Base Salary | ||||
Name |
| Fiscal Year 2011 |
| Fiscal Year 2012 |
| Percent Increase in |
Daniel J. Starks |
| 1,025,000 |
| 1,045,500 |
| 2 |
John C. Heinmiller |
| 700,000 |
| 714,000 |
| 2 |
Michael T. Rousseau |
| 650,000 |
| 700,000 |
| 7.7 |
Denis M. Gestin |
| 625,498 |
| 694,260 |
| 8.8(2) |
Donald J. Zurbay(1) |
| n/a |
| 430,000 |
| n/a |
Footnotes
|
|
(1) | Mr. Zurbay was promoted to Vice President, Finance and Chief Financial Officer in August 2012 and the base salary set forth above represents his base salary effective upon such promotion. |
| |
(2) | The percentage increase in fiscal year 2012 base salary for Mr. Gestin has been calculated using his base salary as expressed in Euros (not U.S. Dollars). Mr. Gestin’s base salary for 2012 and 2011 was Euro 525,000 and Euro 482,600, respectively, representing an increase of 8.8%. |
In determining 2012 base salary rates, consideration was given to each of the factors listed on pages 30-31 under“Determination of Targeted Compensation Levels” and the market data described on page 33.
Fiscal 2012 Annual Incentive Awards
For 2012, targeted annual incentive opportunities for our Named Executive Officers under the MICP ranged from 65% to 120% of base salary. The actual incentive payout for each performance objective could range from 0% to 200% of target depending upon the extent to which the performance objective was achieved. Incentive payments are not made if actual performance is less than 90% of targeted levels.
For fiscal 2012, annual incentive payments made to the Named Executive Officers under the MICP were based on the Company’s level of achievement of Company-wide annual sales revenue and earnings per share objectives, as well as divisional profitability and sales objectives, all as established under the Company’s annual operating plan. When calculating fiscal year 2012 earnings per share for determining achievement of performance measures under the MICP, we included the accretive impact of the Company’s repurchase of approximately 28 million shares during such year.
Historically, Company-wide performance objectives for the MICP have been set so they require meaningful growth over the previous year’s revenue and profitability results. For example, in December 2011, the Board approved our 2012 operating plan and the Company-wide revenue and earnings per share targets of $5.909 billion and $3.47 (excluding the impact of certain charges, acquisitions and foreign currency translation), respectively, that were included within the operating plan. When the Board approved the operating plan, the 2012 revenue and earnings per share targets reflected increases of approximately 7% (on a constant-currency basis) and 6%, respectively, over the revenue and adjusted earnings per share that we expected, at that time, to achieve for the full year 2011.
Division goals related to sales and operating profit are established in support of Company-wide revenue and earnings per share targets with additional consideration given to division-specific market conditions and each division’s stage in its growth cycle. For example, although division-specific targets in the aggregate are intended to be consistent with Company-wide objectives, growth rates implicit in targets for any one division may be above or below the growth rates targeted for the entire Company, due to faster or slower growth in relevant product markets or smaller or larger market shares.
These considerations result in Company-wide and division goals that are consistent in their difficulty to achieve and probability for success. Performance objectives are set at a level that we believe is
35
aggressive enough to inspire top performance but reasonable enough to be realistically achievable. Goals are established to challenge executives to maximize year-over-year growth in sales and profitability but are at the same time intended to be reasonable in that they can be achieved by the efficient execution of operating plans.
Information regarding the weightings of the performance measures and the potential and actual payouts of the fiscal 2012 annual incentive awards pursuant to the MICP is set forth below.
Fiscal 2012 Annual Incentive Award Payouts
|
|
|
|
|
|
|
|
|
|
|
|
|
|
|
|
|
|
|
|
|
|
|
|
|
|
|
| Performance Measures |
| Potential Payout |
|
| Actual Payout |
| |||||||||||||||||
| |||||||||||||||||||||||||
Name |
| Measure |
| Weighting |
| Target |
| Target Payout |
| % of |
| Payout |
| % of Salary | |||||||||||
Daniel J. Starks |
| EPS |
| 75 | % |
| 90.00 | % |
|
| $ | 940,950 |
|
| 110.00 | % |
|
| $ | 1,035,045 |
|
| 99.00 | % |
|
|
| Company Sales |
| 25 | % |
| 30.00 | % |
|
| $ | 313,650 |
|
| 85.00 | % |
|
| $ | 266,603 |
|
| 25.50 | % |
|
|
|
|
| 100 | % |
| 120.00 | % |
|
| $ | 1,254,600 |
|
| 103.75 | % |
|
| $ | 1,301,648 |
|
| 124.50 | % |
|
John C. Heinmiller |
| EPS |
| 75 | % |
| 75.00 | % |
|
| $ | 535,500 |
|
| 110.00 | % |
|
| $ | 589,050 |
|
| 82.50 | % |
|
|
| Company Sales |
| 25 | % |
| 25.00 | % |
|
| $ | 178,500 |
|
| 85.00 | % |
|
| $ | 151,725 |
|
| 21.25 | % |
|
|
|
|
| 100 | % |
| 100.00 | % |
|
| $ | 714,000 |
|
| 103.75 | % |
|
| $ | 740,775 |
|
| 103.75 | % |
|
Michael T. Rousseau |
| EPS |
| 75 | % |
| 75.00 | % |
|
| $ | 525,000 |
|
| 110.00 | % |
|
| $ | 577,500 |
|
| 82.50 | % |
|
|
| Company Sales |
| 25 | % |
| 25.00 | % |
|
| $ | 175,000 |
|
| 85.00 | % |
|
| $ | 148,750 |
|
| 21.25 | % |
|
|
|
|
| 100 | % |
| 100.00 | % |
|
| $ | 700,000 |
|
| 103.75 | % |
|
| $ | 726,250 |
|
| 103.75 | % |
|
Denis M. Gestin(1) |
| EPS |
| 25 | % |
| 18.75 | % |
|
| $ | 130,174 |
|
| 110.00 | % |
|
| $ | 143,191 |
|
| 20.63 | % |
|
|
| Division Sales |
| 50 | % |
| 37.50 | % |
|
| $ | 260,348 |
|
| 75.00 | % |
|
| $ | 195,261 |
|
| 28.13 | % |
|
|
| Division Operating Profit |
| 25 | % |
| 18.75 | % |
|
| $ | 130,174 |
|
| 80.00 | % |
|
| $ | 104,139 |
|
| 15.00 | % |
|
|
|
|
| 100 | % |
| 75.00 | % |
|
| $ | 520,696 |
|
| 85.00 | % |
|
| $ | 442,591 |
|
| 63.75 | % |
|
Donald J. Zurbay(2) |
| EPS |
| 75 | % |
| 44.18 | % |
|
| $ | 165,762 |
|
| 110.00 | % |
|
| $ | 182,338 |
|
| 48.59 | % |
|
|
| Company Sales |
| 25 | % |
| 14.73 | % |
|
| $ | 55,254 |
|
| 85.00 | % |
|
| $ | 46,966 |
|
| 12.52 | % |
|
|
|
|
| 100 | % |
| 58.90 | % |
|
| $ | 221,015 |
|
| 103.75 | % |
|
| $ | 229,303 |
|
| 61.11 | % |
|
|
|
|
| Footnotes | |
|
| |
| (1) | Mr. Gestin is paid in Euros, but for the purposes of this proxy statement, all amounts have been converted to U.S. Dollars using the exchange rate of 1 Euro to $1.3224, the exchange rate in effect on the last business day of fiscal year 2012. |
|
|
|
| (2) | In connection with Mr. Zurbay’s promotion to Vice President, Finance and Chief Financial Officer in August 2012, his MICP award target was increased from 55% to 65% and the amounts above reflect the combined, “blended” target rate and payout during 2012. |
Fiscal 2012 Long-Term Incentive Awards
The equity awards granted to the Named Executive Officers during fiscal 2012 were determined as described under “Determination of Targeted Compensation Levels” above. Grant recommendations are made to the Committee in advance of the date they are actually approved. In making these recommendations, the fair value of the awards was determined using the average closing price of the Company’s stock for the 25 days following the third-quarter earnings release. This mitigates the impact of market anomalies on the value used to determine award levels. The number of shares subject to each option award granted to the Named Executive Officers during fiscal year 2012, as well as the grant date fair values of these awards, is shown in the Grants of Plan-Based Awards for Fiscal 2012 table on page 44. In addition to the customary equity awards granted to Named Executive Officers in December 2012, Mr. Zurbay also received a grant of 3,500 restricted stock units in connection with his promotion to Vice President, Finance and Chief Financial Officer in August 2012.
Fiscal 2012 Other Benefits and Perquisites
The table below provides information regarding the other benefits and perquisites provided to the Named Executive Officers other than Mr. Gestin. A discussion of the other benefits and perquisites provided to Mr. Gestin follows the table.
36
|
|
|
Other Benefits and Perquisites |
| Description |
Health and Welfare Benefits |
|
|
|
| •Health Benefits: Health care, dental, vision and disability benefits that are available to all exempt employees. |
|
|
|
|
| •Life Insurance: Life insurance with a death benefit equal to twice the employee’s annual salary, commission and bonus, up to a maximum death benefit of $1,250,000, which is available to each salaried employee with a salary, commission and bonus exceeding $150,000. As of December 31, 2006, Mr. Starks declined coverage under this program and therefore no longer receives a life insurance benefit from the Company. |
|
|
|
|
| •Supplemental Disability Insurance. Payment of supplemental disability insurance premiums for Mr. Heinmiller. |
|
|
|
Retirement Benefits |
| •401(k) Plan: Company matches 100% of the first 3% of compensation contributed by employees. |
|
|
|
|
| •Management Savings Plan: Plan provides matching payments for each employee whose annual salary, commission and bonus exceeds the IRS qualified plan limit. |
|
|
|
|
| •Employee Stock Purchase Plan: Allows employees to purchase stock at a discount to the market price. |
|
|
|
Perquisites |
| •Cash Perquisite Allowance: Cash provided in lieu of car allowances, financial planning and other perquisites provided by similarly-sized companies. The Company uses a cash allowance approach because it is easily administered and can be easily adjusted on an annual basis in response to shifts in market practices. For 2012, cash perquisite allowances ranged from $17,250 to $26,000. |
|
|
|
|
| •Physical Examination: Reimbursement for one physical examination every 12 months up to a maximum of $1,600 per exam. |
|
|
|
|
| •Charitable Matching Program: Eligible charitable contributions are matched by the Company up to a maximum of $1,000 each year. |
|
|
|
The other benefits and perquisites described above, including the 401(k) plan, the Management Savings Plan and Employee Stock Purchase Plan, do not factor into decisions related to other elements of compensation for the Named Executive Officers other than to support the Company’s overall strategy to attract and retain executive talent. Unlike base salaries, cash perquisites are excluded from the determination of benefits under other Company programs such as the MICP.
Because Mr. Gestin is not based in the United States, in 2012 he did not participate in the benefit programs discussed above, but rather participated in health, welfare and retirement programs provided to all employees at the Company’s Brussels location. These benefits include disability insurance, hospitalization insurance and life insurance equal to two times the employee’s annual base salary plus an additional 50% of such employee’s annual base salary per each dependent child. Additionally, Belgian employees participate in a retirement plan that for 2012 provided a contribution equal to 3% of the social security ceiling plus 11% of the difference between the social security ceiling and the employee’s base salary. The Company believes these programs are necessary in order to compete for talent and that it is appropriate to provide Mr. Gestin benefits consistent with normal practice in his country of residence. Consistent with European practice, Mr. Gestin did not receive a cash perquisite allowance in 2012 but rather was provided an automobile by the Company. The cost to the Company for this perquisite in 2012 was $34,110.
Change in Control Severance Agreements
The Company has entered into change in control severance agreements (the “Severance Agreements”) with each of the Named Executive Officers. Each Severance Agreement provides a benefit to the Named Executive Officer in the event that he is involuntarily terminated, other than for cause, following a change in control. A benefit is also provided if the Named Executive Officer terminates his employment for good reason in the three years following a change in control. The Company has selected this “double trigger” approach because it protects the Named Executive Officer from the possibility of a termination of his employment following a change in control while at the same time providing for payment only if such a termination of employment actually occurs. The Severance
37
Agreements apply solely to change in control related terminations. The Named Executive Officers are not provided any guaranteed benefit, under the Severance Agreements or otherwise, in the event of termination not related to a change in control.
In the event of a qualifying termination, each Named Executive Officer is provided with a lump sum payment equal to 2.9 times his annual base salary, target annual incentive and annual perquisite allowance. In addition, for a period of three years, the Named Executive Officer is entitled to receive, at the Company’s expense, health, accident, disability and life insurance benefits substantially similar to those provided immediately prior to termination. In the event that any payments associated with a change in control, whether covered by the Severance Agreement or any other plan, would be subject to excise tax under Section 280G of the Internal Revenue Code, the Company will provide the Named Executive Officer with a payment to cover the excise tax plus a gross-up payment to cover any taxes applied to the excise tax payment. The Company will also reimburse the Named Executive Officer for any legal fees and expenses incurred by the Named Executive Officer as a result of the termination of his employment, including costs incurred in contesting or disputing the termination or seeking to obtain or enforce any right under the Severance Agreement.
The Committee reviewed the Severance Agreements in December 2012 and determined to reduce the benefits for any executive hired after December 2012 by eliminating (i) consideration of the annual perquisite allowance when computing the amount of the severance payment and (ii) the provision of the cash gross-up payment to cover any excise tax. The reduced severance benefit does not affect any of our current executive officers (including the Named Executive Officers). The Committee determined it was not appropriate to adjust the existing Severance Agreements as their terms may have been material to executives in their decision to take a position with the Company.
The Company believes that providing change in control benefits should eliminate or reduce the reluctance of executive management to pursue potential change in control transactions that may be in the best interests of shareholders. The Company also believes these arrangements are necessary in order to retain key executives during the transition period following a change in control and allow them to focus on Company-related matters rather than seeking new employment opportunities. The Severance Agreements are discussed in greater detail on page 47. The Severance Agreements do not factor into decisions related to other elements of compensation other than to support the overall strategy of attracting and retaining executive talent.
Stock Ownership Guidelines and Anti-Hedging Policy
The Company maintains stock ownership guidelines which set stock ownership targets that all executive officers and Directors are expected to achieve, with the intent of aligning the interests of management and shareholders. Targeted stock ownership levels range from three times base salary for the Chief Executive Officer to two times base salary for each of the other Named Executive Officers. Stock ownership guidelines for Directors are set at five times the annual retainer for Directors, or $300,000. Ownership levels are expected to be reached within five years after the date of first promotion to the applicable management level or to the Board, as applicable.
Ownership levels are determined by including stock acquired through open market, option plan or Employee Stock Purchase Plan purchases, shares obtained in lieu of earned compensation, shares earned under restricted stock grants and the “in the money” value of vested stock options. Other than Mr. Gestin, who would be in compliance with these guidelines if the Company’s stock price was at least $43, each Director and those Named Executive Officers that have been executive officers of the Company for at least five years are in compliance with the Company’s stock ownership guidelines.
The Committee also maintains an anti-hedging policy prohibiting all Directors and executive officers from engaging in the purchase or sale of financial instruments (including puts, calls, prepaid variable forward contracts, equity swaps, collars, exchange funds or other derivative securities) based on the Company’s securities that are designed to hedge or offset any decrease in the market value of
38
the Company’s securities. The policy is premised on the belief that even in those circumstances where the proposed transaction may not constitute a violation of law or applicable regulations, it is nonetheless considered inappropriate for any Director or executive officer to engage in short-term or speculative transactions in our securities which may be viewed as reducing their incentive to improve our performance or inconsistent with the objectives of our shareholders in general.
Tax Implications of Executive Compensation
Section 162(m) of the Internal Revenue Code places a limit of $1,000,000 on the amount of compensation that the Company may deduct in any one year with respect to certain of its executive officers. There is an exception to the $1,000,000 limitation for performance-based compensation, provided it is paid pursuant to a plan that has been approved by shareholders, the performance goals are objective and determined by a committee of the board of directors which is comprised solely of two or more outside directors and the compensation is paid only after the committee certifies that the performance goals and any other material terms were in fact satisfied.
Other than restricted stock units, all awards to the Named Executive Officers made for fiscal 2012 under the Company’s annual and long-term incentive plans are intended to qualify as performance-based compensation under Section 162(m) and, therefore, are excluded from the $1,000,000 cap on compensation for deductibility purposes.
It is the Committee’s intention to use incentive compensation as a substantial component of the Company’s executive compensation program and to attempt to structure incentive compensation so that the Company will not lose deductions under Section 162(m). While the Committee intends to continue to provide compensation opportunities to its executives in as tax-efficient a manner as possible, it recognizes that from time to time it may be in the best interests of shareholders to provide non-deductible compensation.
Adjustments for Non-GAAP Financial Measures
The Company provides adjusted net earnings and adjusted net earnings per share because St. Jude Medical management believes that in order to properly understand the Company’s short-term and long-term financial trends, investors may wish to consider the impact of certain adjustments (such as in-process research and development charges, acquisition-related charges, impairment charges, restructuring charges, litigation charges or litigation reserve adjustments and income tax adjustments). These adjustments result from facts and circumstances (such as business development activities, acquisitions, restructuring activities, asset impairment events or developments, settlements and other developments relating to income taxes and litigation) that vary in frequency and impact on the Company’s results of operations. St. Jude Medical management uses adjusted net earnings and adjusted net earnings per share to forecast and evaluate the operational performance of the Company as well as to compare results of current periods to prior periods on a consolidated basis.
Non-GAAP financial measures used by the Company may be calculated differently from, and therefore may not be comparable to, similarly titled measures used by other companies. Investors should consider non-GAAP measures in addition to, and not as a substitute for, or superior to, financial performance measures prepared in accordance with GAAP.
The following table provides a reconciliation of the Company’s reported net earnings and reported diluted net earnings per share to the Company’s adjusted net earnings and adjusted diluted net earnings per share for fiscal years 2012 and 2011:
39
|
|
|
|
|
Fiscal Year 2012 |
| (in millions) |
| Description of Adjustments |
Net Earnings, as reported |
| $752 |
|
|
|
|
|
|
|
2012 business realignment plan restructuring charges |
| 123 |
| After-tax charges primarily related to ongoing restructuring actions originally announced in August 2012 to realign our product divisions and to centralize certain support functions. |
|
|
|
|
|
2011 restructuring plan charges |
| 75 |
| After-tax charges primarily related to ongoing restructuring actions that began in 2011 to realign certain activities in our legacy CRM business as well as costs primarily associated with continuing efforts to improve our sales and sales support organizations. |
|
|
|
|
|
Discontinued product line charges |
| 11 |
| After-tax charges related to intangible asset impairment charges and inventory write-offs for discontinued CATD product lines. |
|
|
|
|
|
Field action charges |
| 27 |
| After-tax charges related to litigation and other costs associated with field actions in our IESD business. |
|
|
|
|
|
Intangible asset impairment charges |
| 14 |
| After-tax charges related to the write-down of neuromodulation intangible assets to fair value. |
|
|
|
|
|
License dispute settlement charge |
| 25 |
| After-tax charges related to a license dispute settlement. |
|
|
|
|
|
Income tax settlement charge |
| 46 |
| Income tax expense related to a settlement reserve for certain prior year tax positions. |
|
|
|
|
|
Research and development tax credit |
| 22 |
| 2012 benefit relating to the federal research and development tax credit that was extended in 2013 retroactive to the beginning of the 2012 fiscal year. |
|
|
|
|
|
Adjusted Net Earnings (Non-GAAP) |
| $1,095 |
|
|
|
|
|
|
|
Fiscal Year 2012 |
|
|
| Description of Adjustments |
Diluted EPS, as reported |
| $2.39 |
|
|
|
|
|
|
|
2012 business realignment plan restructuring charges |
| 0.39 |
| After-tax charges primarily related to ongoing restructuring actions originally announced in August 2012 to realign our product divisions and to centralize certain support functions. |
|
|
|
|
|
2011 restructuring plan charges |
| 0.24 |
| After-tax charges primarily related to ongoing restructuring actions that began in 2011 to realign certain activities in our legacy CRM business as well as costs primarily associated with continuing efforts to improve our sales and sales support organizations. |
|
|
|
|
|
Discontinued product line charges |
| 0.03 |
| After-tax charges related to intangible asset impairment charges and inventory write-offs for discontinued CATD product lines. |
|
|
|
|
|
Field action charges |
| 0.09 |
| After-tax charges related to litigation and other costs associated with field actions in our IESD business. |
|
|
|
|
|
Intangible asset impairment charges |
| 0.04 |
| After-tax charges related to the write-down of neuromodulation intangible assets to fair value. |
|
|
|
|
|
License dispute settlement charge |
| 0.08 |
| After-tax charges related to a license dispute settlement. |
|
|
|
|
|
Income tax settlement charge |
| 0.15 |
| Income tax expense related to a settlement reserve for certain prior year tax positions. |
|
|
|
|
|
Research and development tax credit |
| 0.07 |
| 2012 benefit relating to the federal research and development tax credit that was extended in 2013 retroactive to the beginning of the 2012 fiscal year. |
|
|
|
|
|
Adjusted Diluted EPS (Non-GAAP) |
| $3.48 |
|
|
40
|
|
|
|
|
Fiscal Year 2011 |
| (in millions) |
| Description of Adjustments |
Net Earnings, as reported |
| $826 |
|
|
|
|
|
|
|
Acquired inventory step-up amortization charges |
| 19 |
| After-tax charges for AGA Medical Holdings, Inc. acquired inventory step-up amortization. |
|
|
|
|
|
Restructuring charges |
| 121 |
| After-tax charges related to ongoing restructuring actions to realign certain activities in our legacy CRM business as well as employee termination and other costs primarily associated with continuing efforts to improve sales & sales support organization. |
|
|
|
|
|
Intangible asset impairment charges |
| 30 |
| After-tax charges related to the write-down of certain intangible assets which were determined to be impaired. |
|
|
|
|
|
Post-acquisition related charges |
| 19 |
| Net after-tax charges primarily related to post-acquisition expenses for AGA Medical Holdings, Inc. which principally include contract termination costs and other integration costs in international locations. |
|
|
|
|
|
Foundation contribution |
| 9 |
| After-tax charges related to contributions to the St. Jude Medical Foundation. |
|
|
|
|
|
Accounts receivable charges |
| 47 |
| After-tax charges related to increased collection risk for accounts receivable related to customers in Europe. |
|
|
|
|
|
In-process research and development charges |
| 3 |
| After-tax charges for the acquisition of pre-development technology assets. |
|
|
|
|
|
Adjusted Net Earnings (Non-GAAP) |
| $1,074 |
|
|
|
|
|
|
|
Fiscal Year 2011 |
|
|
| Description of Adjustments |
Diluted EPS, as reported |
| $2.52 |
|
|
|
|
|
|
|
Acquired inventory step-up amortization charges |
| 0.06 |
| After-tax charges for AGA Medical Holdings, Inc. acquired inventory step-up amortization. |
|
|
|
|
|
Restructuring charges |
| 0.37 |
| After-tax charges related to ongoing restructuring actions to realign certain activities in our legacy CRM business as well as employee termination and other costs primarily associated with continuing efforts to improve sales & sales support organization. |
|
|
|
|
|
Intangible asset impairment charges |
| 0.09 |
| After-tax charges related to the write-down of certain intangible assets which were determined to be impaired. |
|
|
|
|
|
Post-acquisition related charges |
| 0.06 |
| Net after-tax charges primarily related to post-acquisition expenses for AGA Medical Holdings, Inc. which principally include contract termination costs and other integration costs in international locations. |
|
|
|
|
|
Foundation contribution |
| 0.03 |
| After-tax charges related to contributions to the St. Jude Medical Foundation. |
|
|
|
|
|
Accounts receivable charges |
| 0.14 |
| After-tax charges related to increased collection risk for accounts receivable related to customers in Europe. |
|
|
|
|
|
In-process research and development charges |
| 0.01 |
| After-tax charges for the acquisition of pre-development technology assets. |
|
|
|
|
|
Adjusted Diluted EPS (Non-GAAP) |
| $3.28 |
|
|
41
The Company also provides constant currency sales growth because management believes that in order to properly understand the Company’s short-term and long-term financial trends, investors may wish to consider the impact of foreign currency translation on net sales. The Company’s management uses constant currency sales growth to forecast and evaluate the operational performance of the Company as well as to compare sales of current periods to prior periods.
The following table provides a reconciliation of the Company’s reported net sales to the Company’s net sales on a constant-currency basis for fiscal year 2012:
|
|
|
|
|
|
|
2011 – 2012 Constant-Currency Net Sales Reconciliation |
|
|
|
| ||
|
| |||||
2011 Net Sales (as reported) |
| $5,612 million |
| Estimated Foreign Exchange Impact |
| ($137 million) |
| ||||||
2012 Net Sales Constant-Currency |
| $5,640 million |
| 2012 Net Sales (as reported) |
| $5,503 million |
In October 2012, the Company’s compensation consultant, Pay Governance, analyzed, reviewed and discussed with the Company’s Compensation Committee whether the Company’s executive compensation practices and policies encourage excessive risk-taking. The Compensation Committee and Pay Governance concluded that such practices and policies, taking into account any risk-mitigating provisions and controls (e.g., stock ownership guidelines, the elements of long-term incentive compensation, lack of formal non-change-in-control severance plans and funding of the annual bonus pool based on Company performance), do not encourage excessive risk-taking that is reasonably likely to have a material adverse effect on the Company. For 2012, a portion of the Named Executive Officer’s equity award was made in the form of restricted stock units in order to balance the risk profile of the executive compensation portfolio. Effective beginning in 2012, the Company also implemented a compensation recoupment or “clawback” policy that requires the repayment of MICP awards in certain circumstances. Management applied similar criteria in assessing whether other compensation practices and policies encourage excessive risk-taking and concluded that they do not. Based on the foregoing, the Company determined that the risks arising from the Company’s compensation practices and policies are not reasonably likely to have a material adverse effect on the Company.
42
The following table shows the cash and non-cash compensation for the last three fiscal years awarded to or earned by the individuals who served as our chief executive officer, chief financial officer and each of our three other most highly compensated executive officers during fiscal year 2012. These five individuals are collectively referred to as the “Named Executive Officers”.
|
|
|
|
|
|
|
|
|
|
|
|
|
|
|
|
Name and Principal Position |
| Year |
| Salary |
| Stock |
| Option |
| Non-Equity |
| All Other |
| Total |
|
Daniel J. Starks |
| 2012 |
| 1,045,500 |
| 1,426,001 |
| 2,912,165 |
| 1,301,648 |
| 36,500(5) | 6,721,814 |
| |
Chairman, President and |
| 2011 |
| 1,025,000 |
|
| 4,481,808 |
| 1,030,125 |
| 36,350 |
| 6,573,283 |
| |
Chief Executive Officer |
| 2010 |
| 995,000 |
|
| 6,997,200 |
| 1,408,920 |
| 36,350 |
| 9,437,470 |
| |
|
|
|
|
|
|
|
|
|
|
|
|
|
|
|
|
John C. Heinmiller |
| 2012 |
| 714,000 |
| 1,128,640 |
| 1,941,380 |
| 740,775 |
| 39,967(6) | 4,564,762 |
| |
Executive Vice President |
| 2011 |
| 700,000 |
|
| 2,801,130 |
| 586,250 |
| 39,764 |
| 4,127,144 |
| |
|
| 2010 |
| 678,300 |
|
| 3,250,783 |
| 800,394 |
| 40,915 |
| 4,770,392 |
| |
|
|
|
|
|
|
|
|
|
|
|
|
|
|
|
|
Michael T. Rousseau |
| 2012 |
| 700,000 |
| 1,128,640 |
| 1,941,380 |
| 726,250 |
| 35,775(7) | 4,532,045 |
| |
Group President |
| 2011 |
| 650,000 |
|
| 2,801,130 |
| 544,375 |
| 35,565 |
| 4,031,070 |
| |
|
| 2010 |
| 612,000 |
|
| 2,973,810 |
| 722,160 |
| 35,160 |
| 4,343,130 |
| |
|
|
|
|
|
|
|
|
|
|
|
|
|
|
|
|
Denis M. Gestin(8) |
| 2012 |
| 694,261 |
| 634,860 |
| 1,141,056 |
| 442,591 |
| 149,829(9) | 3,062,597 |
| |
President, International Division |
| 2011 |
| 625,498 |
|
| 1,867,420 |
| 279,128 |
| 160,541 |
| 2,932,588 |
| |
|
| 2010 |
| 626,007 |
|
| 1,545,215 |
| 414,025 |
| 159,274 |
| 2,744,521 |
| |
|
|
|
|
|
|
|
|
|
|
|
|
|
|
|
|
Donald J. Zurbay |
| 2012 |
| 375,231 |
| 461,440 |
| 591,638 |
| 229,303 |
| 29,227(11) | 1,686,839 |
| |
Vice President, Finance and Chief Executive Officer(10) |
|
|
|
|
|
|
|
|
|
|
|
|
|
|
|
|
|
Footnotes
|
|
(1) | Includes amounts deferred at the discretion of the executive officer pursuant to our 401(k) plan and our Management Savings Plan. |
|
|
(2) | The amounts in this column are computed in accordance with FASB ASC Topic 718 and are based on the fair value of the restricted stock unit awards as recognized in our consolidated statement of earnings for each fiscal year. The compensation cost is based on the fair value of the restricted stock unit grant (the Company’s closing stock price on the date of grant multiplied by the number of shares subject to the award). |
|
|
(3) | The amounts in this column are computed in accordance with FASB ASC Topic 718 and are based on the fair value of the stock option awards as estimated using the Black-Scholes option pricing model. The assumptions used to estimate fair value are discussed in Note 7 to our consolidated financial statements included in our Annual Report on Form 10-K for the year ended December 29, 2012. |
|
|
(4) | We award bonuses to the Named Executive Officers solely based on our achievement of certain performance targets. Accordingly, bonus amounts are reported in the Non-Equity Incentive Plan Compensation column. The amounts in this column relate to awards under the MICP and are described under the heading “Compensation Discussion and Analysis” above. |
|
|
(5) | Consists of a perquisite allowance of $26,000 and retirement plan contributions of $10,500. The Company purchases life insurance for salaried employees generally providing a death benefit equal to the lesser of $500,000 or twice the annual salary, commission and bonus of such salaried employees. For employees whose annual salary, commission and bonus exceeds $150,000 and who participate in the Management Savings Plan, the Company purchases supplemental life insurance providing a death benefit equal to the lesser of $1,250,000 or twice the annual salary, commission and supplemental bonus of such salaried employees. As of December 31, 2006, Mr. Starks declined coverage under this program and therefore no longer receives a life insurance benefit from the Company. |
43
|
|
(6) | Consists of a perquisite allowance of $24,000, retirement plan contributions of $10,500, the cost of supplemental disability insurance premiums paid by the Company and the incremental cost of life insurance premiums paid by the Company for coverage in excess of that purchased by the Company for salaried employees generally. |
|
|
(7) | Consists of a perquisite allowance of $24,000, retirement plan contributions of $10,500 and the incremental cost of life insurance premiums paid by the Company for coverage in excess of that purchased by the Company for salaried employees generally. |
|
|
(8) | 2012 amounts paid to Mr. Gestin in Euros were converted to U.S. dollars using the exchange rate of 1 Euro to $1.3224 in effect on the last business day of fiscal year 2012. 2011 amounts paid to Mr. Gestin in Euros were converted to U.S. dollars using the exchange rate of 1 Euro to $1.2961 in effect on the last business day of fiscal year 2011. 2010 amounts paid to Mr. Gestin in Euros were converted to U.S. dollars using the exchange rate of 1 Euro to $1.3342 in effect on the last business day of fiscal year 2010. |
|
|
(9) | Consists of statutory vacation pay of $44,617 required to be paid annually pursuant to Belgium law, retirement plan contributions of $71,103 and the cost of a company automobile of $34,110. |
|
|
(10) | Compensation information is only provided for Mr. Zurbay for 2012 because he was not a Named Executive Officer in 2010 or 2011. |
|
|
(11) | Consists of a perquisite allowance of $17,250, retirement plan contributions of $10,500 and the incremental cost of life insurance premiums paid by the Company for coverage in excess of that purchased by the Company for salaried employees generally. |
Grants of Plan-Based Awards for Fiscal 2012
The following table summarizes the 2012 grants of equity and non-equity incentive plan-based awards to the Named Executive Officers.
|
|
|
|
|
|
|
|
|
|
|
|
|
|
|
|
|
|
|
| Estimated Possible Payouts Under |
|
|
|
|
|
|
|
|
| ||||||
|
|
|
|
|
|
|
|
| |||||||||
Name |
| Grant |
| Threshold |
| Target |
| Maximum |
| All Other Stock |
| All Other |
| Exercise or |
| Grant Date Fair |
|
Daniel J. Starks |
|
|
| 752,760 |
| 1,254,600 |
| 2,509,200 |
|
|
|
|
|
|
|
|
|
|
| 12/10/12 |
|
|
|
|
|
|
| 40,431 |
| 367,512 |
| 35.27 |
| 4,338,166 |
|
|
|
|
|
|
|
|
|
|
|
|
|
|
|
|
|
|
|
John C. Heinmiller |
|
|
| 428,400 |
| 714,000 |
| 1,428,000 |
|
|
|
|
|
|
|
|
|
|
| 12/10/12 |
|
|
|
|
|
|
| 32,000 |
| 245,000 |
| 35.27 |
| 3,070,020 |
|
|
|
|
|
|
|
|
|
|
|
|
|
|
|
|
|
|
|
Michael T. Rousseau |
|
|
| 420,000 |
| 700,000 |
| 1,400,000 |
|
|
|
|
|
|
|
|
|
|
| 12/10/12 |
|
|
|
|
|
|
| 32,000 |
| 245,000 |
| 35.27 |
| 3,070,020 |
|
|
|
|
|
|
|
|
|
|
|
|
|
|
|
|
|
|
|
Denis M. Gestin(6) |
|
|
| 312,418 |
| 520,696 |
| 1,041,392 |
|
|
|
|
|
|
|
|
|
|
| 12/10/12 |
|
|
|
|
|
|
| 18,000 |
| 144,000 |
| 35.27 |
| 1,775,916 |
|
|
|
|
|
|
|
|
|
|
|
|
|
|
|
|
|
|
|
Donald J. Zurbay(7) |
|
|
| 132,609 |
| 221,015 |
| 442,030 |
|
|
|
|
|
|
|
|
|
|
| 12/10/12 |
|
|
|
|
|
|
| 9,332 |
| 74,664 |
| 35.27 |
| 920,777 |
|
|
| 08/30/12 |
|
|
|
|
|
|
| 3,500 |
|
|
|
|
| 132,300 |
|
|
|
Footnotes
|
|
(1) | Actual amounts paid under the MICP based on our 2012 performance are reported in the “Non-Equity Incentive Plan Compensation” column of the Summary Compensation Table. The performance objectives and target opportunities for awards under the MICP for each year are typically set at the Board of Directors and Compensation Committee meetings held in the December preceding the year for which performance is to be measured. For example, in December 2011, the Board of Directors and Compensation Committee set the performance targets for fiscal year 2012. The performance targets are described in “Compensation Discussion and Analysis” above. |
|
|
(2) | All grants made to the Named Executive Officers were made under the St. Jude Medical, Inc. 2007 Stock Incentive Plan. |
|
|
(3) | Other than the 3,500 restricted stock units awarded to Mr. Zurbay on August 30, 2012, which vest 25% on each of the first four anniversary dates of the date of grant, subject to acceleration of vesting upon a change of control, these restricted stock units vest 25% on each December 17 in 2013, 2014, 2015 and 2016, subject to acceleration of vesting if the executive is involuntarily terminated, other than for cause, or leaves for good reason following a change in control. |
|
|
(4) | These options vest 25% on each December 17 in 2013, 2014, 2015 and 2016, subject to acceleration of vesting if the executive is involuntarily terminated, other than for cause, or leaves for good reason following a change in control. |
|
|
(5) | The grant date fair value of restricted stock units is based on the Company’s closing stock price on the date of grant multiplied by the number of shares subject to the award. The assumptions used to estimate the grant date fair value of stock options are discussed in Note 7 to our consolidated financial statements included in our Annual Report on Form 10-K for the year ended December 29, 2012. |
44
|
|
(6) | Estimated possible payouts under non-equity incentive plan awards for Mr. Gestin have been converted from Euros to U.S. dollars using the exchange rate of 1 Euro to $1.3224, the exchange rate in effect on the last business day of fiscal year 2012. |
|
|
(7) | In connection with Mr. Zurbay’s promotion to Vice President, Finance and Chief Financial Officer in August 2012, his MICP award target was increased from 55% to 65% and the amounts above reflect the combined, “blended” target rate during 2012. |
Outstanding Equity Awards at 2012 Fiscal Year-End
The following table sets forth the outstanding equity awards held by the Named Executive Officers at the end of fiscal year 2012.
|
|
|
|
|
|
|
|
|
|
|
|
|
|
|
|
| Option Awards |
| Stock | ||||||||||
Name |
| Number of |
| Number of |
| Option |
| Option Grant |
| Option |
| Number of |
| Market Value |
|
|
|
|
|
|
|
|
|
|
|
|
|
|
|
Daniel J. Starks |
| 216,000 |
| -0- |
| 51.91 |
| 12/13/2005 |
| 12/13/2013 |
|
|
|
|
|
| 320,000 |
| -0- |
| 40.55 |
| 12/10/2007 |
| 12/10/2015 |
|
|
|
|
|
| 600,000 |
| -0- |
| 30.58 |
| 12/15/2008 |
| 12/15/2016 |
|
|
|
|
|
| 337,500 |
| 112,500 |
| 38.59 |
| 12/14/2009 |
| 12/14/2017 |
|
|
|
|
|
| 240,000 |
| 240,000 |
| 41.65 |
| 12/14/2010 |
| 12/14/2018 |
|
|
|
|
|
| 120,000 |
| 360,000 |
| 34.96 |
| 12/12/2011 |
| 12/12/2019 |
|
|
|
|
|
| -0- |
| 367,512 |
| 35.27 |
| 12/10/2012 |
| 12/10/2020 |
|
|
|
|
|
|
|
|
|
|
|
|
|
|
|
| 40,431 |
| 1,434,088 |
|
|
|
|
|
|
|
|
|
|
|
|
|
|
|
John C. Heinmiller |
| 108,000 |
| -0- |
| 51.91 |
| 12/13/2005 |
| 12/13/2013 |
|
|
|
|
|
| 150,000 |
| -0- |
| 38.00 |
| 12/12/2006 |
| 12/12/2014 |
|
|
|
|
|
| 160,000 |
| -0- |
| 40.55 |
| 12/10/2007 |
| 12/10/2015 |
|
|
|
|
|
| 250,000 |
| -0- |
| 30.58 |
| 12/15/2008 |
| 12/15/2016 |
|
|
|
|
|
| 160,500 |
| 53,500 |
| 38.59 |
| 12/14/2009 |
| 12/14/2017 |
|
|
|
|
|
| 111,500 |
| 111,500 |
| 41.65 |
| 12/14/2010 |
| 12/14/2018 |
|
|
|
|
|
| 75,000 |
| 225,000 |
| 34.96 |
| 12/12/2011 |
| 12/12/201 |
|
|
|
|
|
| -0- |
| 245,000 |
| 35.27 |
| 12/10/2012 |
| 12/10/2020 |
|
|
|
|
|
|
|
|
|
|
|
|
|
|
|
| 32,000 |
| 1,135,040 |
|
|
|
|
|
|
|
|
|
|
|
|
|
|
|
Michael T. Rousseau |
| 106,000 |
| -0- |
| 51.91 |
| 12/13/2005 |
| 12/13/2013 |
|
|
|
|
|
| 130,000 |
| -0- |
| 38.00 |
| 12/12/2006 |
| 12/12/2014 |
|
|
|
|
|
| 122,000 |
| -0- |
| 40.55 |
| 12/10/2007 |
| 12/10/2015 |
|
|
|
|
|
| 200,000 |
| -0- |
| 30.58 |
| 12/15/2008 |
| 12/15/2016 |
|
|
|
|
|
| 136,500 |
| 45,500 |
| 38.59 |
| 12/14/2009 |
| 12/14/2017 |
|
|
|
|
|
| 102,000 |
| 102,000 |
| 41.65 |
| 12/14/2010 |
| 12/14/2018 |
|
|
|
|
|
| 75,000 |
| 225,000 |
| 34.96 |
| 12/12/2011 |
| 12/12/2019 |
|
|
|
|
|
| -0- |
| 245,000 |
| 35.27 |
| 12/10/2012 |
| 12/10/2020 |
|
|
|
|
|
|
|
|
|
|
|
|
|
|
|
| 32,000 |
| 1,135,040 |
|
|
|
|
|
|
|
|
|
|
|
|
|
|
|
Denis M. Gestin |
| 34,500 |
| -0- |
| 51.91 |
| 12/13/2005 |
| 12/13/2013 |
|
|
|
|
|
| 34,500 |
| -0- |
| 38.00 |
| 12/12/2006 |
| 12/12/2014 |
|
|
|
|
|
| 68,000 |
| -0- |
| 40.55 |
| 12/10/2007 |
| 12/10/2015 |
|
|
|
|
|
| 90,000 |
| -0- |
| 30.58 |
| 12/15/2008 |
| 12/15/2016 |
|
|
|
|
|
| 67,500 |
| 22,500 |
| 38.59 |
| 12/14/2009 |
| 12/14/2017 |
|
|
|
|
|
| 53,000 |
| 53,000 |
| 41.65 |
| 12/14/2010 |
| 12/14/2018 |
|
|
|
|
|
| 50,000 |
| 150,000 |
| 34.96 |
| 12/12/2011 |
| 12/12/2019 |
|
|
|
|
|
| -0- |
| 144,000 |
| 35.27 |
| 12/10/2012 |
| 12/10/2020 |
|
|
|
|
|
|
|
|
|
|
|
|
|
|
|
| 18,000 |
| 638,460 |
|
|
|
|
|
|
|
|
|
|
|
|
|
|
|
Donald J. Zurbay |
| 12,000 |
| -0- |
| 51.91 |
| 12/13/2005 |
| 12/13/2013 |
|
|
|
|
|
| 20,000 |
| -0- |
| 38.00 |
| 12/12/2006 |
| 12/12/2014 |
|
|
|
|
|
| 30,000 |
| -0- |
| 40.55 |
| 12/10/2007 |
| 12/10/2015 |
|
|
|
|
|
| 40,000 |
| -0- |
| 30.58 |
| 12/15/2008 |
| 12/15/2016 |
|
|
|
|
|
| 28,500 |
| 9,500 |
| 38.59 |
| 12/14/2009 |
| 12/14/2017 |
|
|
|
|
|
| 15,000 |
| 15,000 |
| 41.65 |
| 12/14/2010 |
| 12/14/2018 |
|
|
|
|
|
| 10,666 |
| 31,998 |
| 34.96 |
| 12/12/2011 |
| 12/12/2019 |
|
|
|
|
|
| -0- |
| 74,664 |
| 35.27 |
| 12/10/2012 |
| 12/10/2020 |
|
|
|
|
|
|
|
|
|
|
|
|
|
|
|
| 19,487 |
| 691,204 |
|
|
|
|
| |||
Footnotes | |||
| |||
| (1) | Except for the options granted on December 12, 2011 and December 10, 2012, which will vest 25% per year on each December 17 following the one-year anniversary of the date of grant, these options vest 25% on each of the first four anniversary dates of the date of grant, subject to acceleration of vesting upon a change in control under certain circumstances. | |
|
|
| |
| (2) | These restricted stock units will vest 25% per year on December 17 of 2013, 2014, 2015 and 2016, except for, as it relates specifically to restricted stock units awarded to Mr. Zurbay (i) 1,250 restricted stock units that will vest on December 14, 2013, (ii) 1,250 restricted stock units that will vest on December 14, 2014, (iii) 1,385 restricted stock units that will vest on December 17, 2013, (iv) 1,385 restricted stock units that will vest on December 17, 2014, (v) 1,385 restricted stock units that will vest on December 17, 2015, and (vi) 3,500 restricted stock units granted on August 30, 2012 which will vest 25% per year on each of the first four anniversary dates of the date of grant. All these restricted stock units are subject to acceleration of vesting upon a change in control under certain circumstances. | |
45
|
|
(3) | Determined by multiplying the Company’s closing stock price ($35.47) on the last business day of fiscal year 2012 by the number of shares subject to the award. |
Option Exercises and Stock Vested During Fiscal 2012
The following table summarizes information with respect to stock option awards exercised and restricted stock vested during fiscal year 2012 for each of the Named Executive Officers.
|
|
|
|
|
|
|
|
|
|
|
|
|
|
|
| Option Awards |
| Stock Awards |
| ||||||||
Name |
| Number of Shares Acquired on |
| Value Realized on Exercise ($)(1) |
| Number of Shares Acquired on |
| Value Realized on Vesting ($)(2) |
| ||||
|
|
|
|
|
|
|
|
|
|
|
|
|
|
Daniel J. Starks |
|
| 210,000 |
|
| 550,647 |
|
| -0- |
|
| -0- |
|
John C. Heinmiller |
|
| -0- |
|
| -0- |
|
| -0- |
|
| -0- |
|
Michael T. Rousseau |
|
| 120,000 |
|
| 161,076 |
|
| -0- |
|
| -0- |
|
Denis M. Gestin |
|
| -0- |
|
| -0- |
|
| -0- |
|
| -0- |
|
Donald J. Zurbay |
|
| -0- |
|
| -0- |
|
| 2,635 |
|
| 93,659 |
|
|
|
|
|
|
|
| |
Footnotes | |||
|
|
| |
| (1) | Calculated by multiplying the number of shares acquired on exercise by the difference between the closing market price per share of our common stock on the day of exercise and the exercise price per share. | |
|
|
| |
| (2) | Calculated by multiplying the number of shares acquired on vesting by the closing market price on the date of vesting. | |
Nonqualified Deferred Compensation
The following table shows the executive contributions and Company contributions in fiscal year 2012 and earnings and account balances for the Named Executive Officers in the St. Jude Medical Management Savings Plan (the “MSP”), an unfunded, unsecured non-qualified deferred compensation plan. The MSP allows participants to defer up to 100% of their base pay, MICP bonus and other bonus and commission compensation. The Company makes matching contributions of 100% of deferrals up to 3% of the first $100,000 of compensation above the Internal Revenue Code limit ($250,000 in 2012). Deferred amounts and Company contributions are held in an irrevocable trust which remains subject to the claims of the Company’s creditors. Company contributions vest 20% for each calendar year of a participant’s service. Deferred amounts and Company contributions in each participant’s account are credited with the net returns of the investment funds in which such contributions are deemed to be invested. Participants may select among several deemed investment options made available by the Company, and participants may change their deemed investment elections at any time. The following investment funds were available under the MSP in fiscal 2012: Janus Balanced-I, Loomis Sayles Value-Y, Fidelity Spartan Extended Market Index-Inv, Fidelity Spartan International Index-Inv, JPMorgan Prime Money Market, PIMCO Total Return, Vanguard Target Retirement Income Fund, Vanguard Institutional Index, Vanguard Target Retirement 2010, Vanguard Target Retirement 2015, Vanguard Target Retirement 2020, Vanguard Target Retirement 2025, Vanguard Target Retirement 2030, Vanguard Target Retirement 2035, Vanguard Target Retirement 2040, Vanguard Target Retirement 2045, Vanguard Target Retirement 2050, Vanguard Total Bond Market Index-Inst, JPMorgan Large Cap Growth, JPMorgan Mid Cap Value, Morgan Stanley Inst Mid Cap Growth, ACI Short Duration, American Century Small Cap Value, Columbia Acorn Fund Z and Harbor International. The returns on these investment funds for the calendar year ended December 29, 2012 ranged from .14% to 20.87%, with a median return of 14.24%.
46
Participants may elect, prior to the beginning of each year, to have all amounts deferred and Company contributions for that year distributed on a date during employment, provided that the selected distribution date occurs at least two years after the end of the year in which the withdrawn amounts were initially deferred into the MSP. Participants may also elect at that time to receive the amount in installments over a period of up to 15 years upon separation from service, provided their account balance and length of service exceed certain minimums; otherwise payment is made in a single lump sum. If no early distribution election is made, participants will receive a distribution of their account in the MSP upon separation from service with the Company. To the extent necessary to comply with Section 409A of the Internal Revenue Code, payments made to Named Executive Officers on account of their separation from service may be delayed six months following their separation from service.
|
|
|
|
|
|
|
|
|
|
|
|
|
|
|
|
|
Name |
| Executive Contributions in Last FY |
| Registrant Contributions in Last FY |
| Aggregate Earnings (Loss) |
| Aggregate Withdrawals/ Distributions |
| Aggregate Balance at Last |
| |||||
|
|
|
|
|
|
|
|
|
|
|
|
|
|
|
|
|
Daniel J. Starks |
|
| 52,275 |
|
| 3,000 |
|
| 106,516 |
| -0- |
|
| 967,984 |
| |
|
|
|
|
|
|
|
|
|
|
|
|
|
|
|
|
|
John C. Heinmiller |
|
| 35,700 |
|
| 3,000 |
|
| 130,149 |
| -0- |
|
| 1,060,606 |
| |
|
|
|
|
|
|
|
|
|
|
|
|
|
|
|
|
|
Michael T. Rousseau |
|
| 1,080,999 |
|
| 3,000 |
|
| 1,168,437 |
| -0- |
|
| 10,635,084 |
| |
|
|
|
|
|
|
|
|
|
|
|
|
|
|
|
|
|
Denis M. Gestin(5) |
|
| -0- |
|
| -0- |
|
| -0- |
| -0- |
|
| -0- |
| |
|
|
|
|
|
|
|
|
|
|
|
|
|
|
|
|
|
Donald J. Zurbay |
|
| 3,752 |
|
| 3,000 |
|
| 5,331 |
| -0- |
|
| 294,017 |
| |
|
|
|
|
| |||
Footnotes | |||
| |||
| (1) | All of these amounts are included in the amounts reported under the “Salary” and “Non-Equity Incentive Plan Compensation” columns of the Summary Compensation Table on page 43. | |
|
|
| |
|
|
| |
| (2) | All of these amounts are included in the amounts reported under the “All Other Compensation” column of the Summary Compensation Table on page 43. | |
|
|
| |
| (3) | The amounts reported in this column represent the change during the last fiscal year in the value of the underlying mutual funds in which the Named Executive Officers’ deferred amounts were deemed to be invested. None of these amounts are reflected in the Summary Compensation Table for the last completed fiscal year. | |
|
|
| |
| (4) | Includes the following amounts that were previously reported as compensation to the Named Executive Officers in the Summary Compensation Table for previous years: Mr. Starks, 676,662; Mr. Heinmiller, 752,022; Mr. Rousseau, 7,013,165; and Mr. Zurbay 248,340. | |
|
|
| |
| (5) | As a Belgium resident, Mr. Gestin is not eligible to participate in the MSP. | |
The Company has no written employment agreements with the Named Executive Officers. The compensation arrangement for each of the Named Executive Officers is described under “Compensation Discussion and Analysis” above.
The Company has entered into change in control severance agreements (the “Severance Agreements”) with each of the Named Executive Officers. The Severance Agreements provide for certain payments and other benefits if, following a Change in Control, the Company terminates the Named Executive Officer’s employment without Cause or the Named Executive Officer terminates his employment for Good Reason. Such payments and benefits include: (1) severance pay equal to 2.9 times the sum of the Named Executive Officer’s annual salary, target bonus and certain other compensation paid to the Named Executive Officer during the 12 months prior to the termination; (2) three years of health, life, accident and disability insurance substantially similar to that in effect at the time of termination; (3) the payment of legal fees and expenses relating to the termination; and (4) a gross-up payment for certain excise taxes, if they are imposed on such payments or benefits and for any tax imposed on such gross-up payment. Under the Severance Agreements, “Cause” is defined as a conviction for felony criminal conduct; “Good Reason” is defined to include a change in the Named
47
Executive Officer’s responsibility or status, a reduction in salary or benefits or a mandatory relocation; and “Change in Control” is defined to include a change in control of the type required to be disclosed under SEC proxy rules, acquisition by a person or group of 35% or more of the outstanding voting stock of the Company, a proxy fight or contested election which results in Continuing Directors (as defined) not constituting a majority of the Company’s Board of Directors or another event the majority of the Continuing Directors determines to be a change in control.
The Compensation Committee reviewed the Severance Agreements in December 2012 and determined to reduce the benefits by eliminating (i) consideration of the annual perquisite allowance when computing the amount of the severance payment and (ii) the provision of the cash gross-up payment to cover any excise tax for any executive hired after December 2012. The reduced severance benefit does not affect any of our current executive officers (including the Named Executive Officers). The Compensation Committee determined it was not appropriate to adjust the existing Severance Agreements as their terms may have been material to executives in their decision to take a position with the Company.
Potential Payments Upon Termination or Change in Control
As described above, the Named Executive Officers do not have employment agreements with the Company but do have Severance Agreements with the Company. The information below describes and quantifies certain compensation that would become payable under existing plans and arrangements if a Named Executive Officer’s employment had terminated on December 29, 2012, given the Named Executive Officer’s compensation and service levels as of such date and, if applicable, based on the Company’s closing stock price on that date. These benefits are in addition to benefits available generally to salaried employees, such as distributions under our 401(k) plan, disability benefits and accrued vacation pay. Because it is unlikely that any of the Named Executive Officers would be affected by a layoff, the information below does not reflect benefits that may be available in such situations under Company plans and arrangements.
Due to the number of factors that affect the nature and amount of any benefits provided upon the events discussed below, any actual amounts paid or distributed may be different. Factors that could affect these amounts include the timing during the year of any such event, the Company’s stock price and the executive’s age.
Equity Awards
If one of the Named Executive Officers were to die or become disabled, any exercisable stock options would remain exercisable for one year following the date of death or disability, except to the extent of the earlier expiration of the option term. All unexercisable stock options would immediately be cancelled and all unvested shares of restricted stock would immediately be forfeited.
Deferred Compensation
Other than Mr. Gestin, who is a Belgium resident and is not eligible to participate, each of the Named Executive Officers participates in our MSP, which permits the deferral of base salary and incentive compensation. The last column of the Nonqualified Deferred Compensation Table on page 47 reports each Named Executive Officer’s aggregate balance at December 29, 2012, under the MSP. The Named Executive Officers are entitled to receive the amount in their deferred compensation account in the event of termination of employment, death or at a date during employment elected by the Named Executive Officer, subject to any claims of creditors in the event of a Company insolvency. Until distribution, the account balances continue to be credited with increases or decreases reflecting changes in the value of the deemed investment funds in which each Named Executive Officer has elected the deferred compensation to be allocated.
48
Life Insurance Benefits
The Company purchases life insurance for salaried employees generally providing a death benefit equal to the lesser of $500,000 or twice the annual salary, commission and bonus of such salaried employees. For employees whose annual salary, commission and bonus exceeds $150,000 and who participate in the MSP, the Company purchases supplemental life insurance providing a death benefit equal to the lesser of $1,250,000 or twice the annual salary, commission and supplemental bonus of such salaried employees. If a Named Executive Officer had died on December 29, 2012, their survivors would have received $1,250,000 under this arrangement, except for Mr. Starks, who declined this benefit, and Mr. Gestin, who would have been entitled to receive $2,429,910 pursuant to the life insurance plan offered to our employees in Belgium.
Severance Payments
In the event that a Change in Control of the Company (as defined under the Severance Agreements) had occurred on December 29, 2012, no severance payments would have been due to the Named Executive Officers unless they were also terminated without Cause or they terminated their employment for Good Reason (as those terms are defined under the Severance Agreements). The table below sets forth the severance payments to each of the Named Executive Officers in the event a Change in Control had occurred on December 29, 2012 and there had been such a termination. The table also sets forth the “in the money” value of options and the value of any restricted stock units for which vesting would have accelerated on that date, assuming, as it pertains to a certain number of such equity awards, that a Change in Control of the Company (as defined under the applicable agreements governing such option and restricted stock unit awards, the “Equity Award Agreements”) had occurred on such date and the Named Executive Officers had been terminated without Cause or they terminated their employment for Good Reason (as those terms are defined under the Equity Award Agreements).
|
|
|
|
|
|
|
|
|
|
|
|
|
|
|
Change in Control Payments and Acceleration of Options | ||||||||||||||
|
| Cash Payments(1) |
|
| Equity Awards for |
|
|
| ||||||
|
|
|
|
|
|
| ||||||||
Named Executive Officer |
| Salary, Bonus and |
|
| Healthcare |
|
| “In the |
|
| Value of |
|
| Total |
Daniel J. Starks |
| 6,745,690 |
|
| 51,729 |
|
| 257,102 |
|
| 1,434,088 |
|
| 8,488,609 |
John C. Heinmiller |
| 4,303,600 |
|
| 70,298 |
|
| 163,750 |
|
| 1,135,040 |
|
| 5,672,688 |
Michael T. Rousseau |
| 4,303,600 |
|
| 56,545 |
|
| 163,750 |
|
| 1,135,040 |
|
| 5,658,935 |
Denis M. Gestin(4) |
| 3,787,431 |
|
| 25,427 |
|
| 105,300 |
|
| 638,460 |
|
| 4,556,618 |
Donald J. Zurbay |
| 3,308,833 |
|
| 50,862 |
|
| 31,252 |
|
| 691,204 |
|
| 4,082,151 |
|
|
|
|
|
|
|
|
Footnotes |
| ||
|
|
|
|
| (1) | The salary, bonus and perk-related payments would have been made in lump sums, and the health care benefits would have been provided over three years following termination. | |
|
|
| |
| (2) | Calculated using the closing price of our common stock on December 29, 2012, the last business day of fiscal year 2012. | |
|
|
| |
| (3) | Other than for Mr. Zurbay, no gross-up payments would have been due for any of the Named Executive Officers in connection with a Change in Control. | |
|
|
| |
| (4) | Mr. Gestin is not a United States taxpayer and is not subject to the United States tax law. | |
49
|
ADVISORY VOTE TO APPROVE THE COMPENSATION |
Pursuant to Section 14A of the Exchange Act, the Company is providing shareholders with an advisory (non-binding) vote to approve the compensation of our Named Executive Officers, as described in the Compensation Discussion and Analysis section, the tabular disclosure regarding such compensation and the accompanying narrative disclosure set forth in this proxy statement. The Company asks that you support the compensation of our Named Executive Officers as disclosed in this proxy statement. Because your vote is advisory, it will not be binding on the Board of Directors or the Company. However, the Board of Directors will review the voting results and take them into consideration when making future decisions regarding executive compensation. The Company currently conducts annual advisory votes on executive compensation, and the Company expects to conduct the next advisory vote at our 2014 annual meeting of shareholders.
The Company has in the past obtained approval from shareholders for the most significant incentive plans that we use to motivate, retain, and reward our executives. Those incentive plans include our MICP and our stock incentive plans and make up a majority of the pay that the Company provides to our Named Executive Officers. Thus, shareholders have already had a voice in the largest part of our executive compensation program.
Our executive compensation program must be viewed in light of our performance. St. Jude Medical has had a long-standing tradition of delivering results for our shareholders, customers, and the communities in which we operate. We are one of the largest 500 companies in the United States (based on revenue) with facilities in more than 40 countries throughout the world, and we generate nearly 53% of our net sales outside of the United States. We believe our executive compensation program has played a material role in attracting and retaining a highly experienced, successful team to drive strong financial results and manage the Company through the recent economic downturn, challenging cardiac rhythm management market and cost-reduction measures being implemented in many major healthcare markets around the world. In 2012:
|
|
|
| • | The Company’s revenue was $5.5 billion, representing, on a constant-currency basis, an increase of 1% over the prior year1; |
|
|
|
| • | Adjusted net earnings (non-GAAP) grew to $1.095 billion in 20121, resulting in, on an adjusted net earnings basis, the most profitable year in the history of the Company; |
|
|
|
| • | Adjusted diluted net earnings per share (non-GAAP) grew to $3.48 in 2012, an increase of $0.20 or 6% over the prior year1; and |
|
|
|
| • | The Company increased its annual dividend to $.92, representing an increase of $0.08 or nearly 10% over the prior year. |
In addition, we are well-positioned coming out of 2012 to accelerate our sales growth. Over the past three years, St. Jude Medical has spent more than $2 billion investing in internal development of new technologies that are designed to both help patients as well as improve healthcare on a cost-effective basis, and we continue to make above industry-average investments in research and development, as a percentage of sales, to support our future growth. At the start of 2011, we laid out 18 growth drivers that would help the Company continue to deliver sustainable growth in the years to come, and we have made significant strides toward the development and commercialization of these
|
|
|
|
|
|
|
1 | A reconciliation of non-GAAP revenue on a constant-currency basis, non-GAAP adjusted net earnings and non-GAAP adjusted diluted net earnings per share is included in the Adjustments for Non-GAAP Financial Measures section on page 39 of this proxy statement. |
50
growth drivers in 2011 and 2012. We also have remained disciplined in our efforts to streamline our manufacturing processes, leverage our sales organizations and otherwise manage expenses in challenging industry and economic environments. In August 2012, the Company announced the realignment of its product divisions into two new operating units: the Implantable Electronic Systems Division and the Cardiovascular and Ablation Technologies Division and centralized several support functions, including information technology, human resources, legal, business development and many marketing functions. This reorganization was undertaken as part of a comprehensive plan to accelerate the Company’s growth by focusing on reducing costs, leveraging economies of scale, maintaining the highest level of quality and funding our portfolio of growth drivers.
We believe that our executive compensation program is structured in the best manner possible to support the Company and its business objectives. It has been designed to implement certain core compensation principles, which include:
|
|
|
| • | alignment of management’s interests with our shareholders’ interests to support long-term value creation, including, by way of example, through equity compensation programs and share ownership guidelines; |
|
|
|
| • | pay for performance, demonstrated by linking bonuses paid under our MICP to key financial deliverables; and |
|
|
|
| • | linking compensation to market levels of compensation adopted by our competitors. |
Mr. Starks, our Chairman, President and Chief Executive Officer, who has been with the Company for 17 years, owns approximately 6,186,116 shares of the Company’s common stock, making him the Company’s largest individual shareholder. This assures that his interests are aligned with the shareholders’ interests.
In the course of establishing the compensation programs and awarding compensation for fiscal 2012, our Compensation Committee reviewed the Company’s business expectations, and ultimately, performance, for fiscal 2012, and data and analyses regarding median market compensation. In addition, the Compensation Committee received advice and counsel on the program from its compensation consultant. The Committee determined that performance-based incentives were best able to motivate our Named Executive Officers to achieve short-term and long-term business goals.
The Company believes that our executive compensation program is worthy of your support for the following reasons:
|
|
|
| • | Our compensation programs are substantially tied to achievement of our key business objectives, which are designed to further the success of the Company and our shareholders. For example, while revenue was relatively flat in 2012 versus 2011 due to significant macroeconomic and industry challenges, resulting in us falling short of our revenue targets for 2012, the Company was able to grow adjusted EPS in fiscal year 2012 by 6%, exceeding our 2012 EPS objectives. Accordingly, executive compensation was directly impacted by the Company’s financial performance during 2012. |
|
|
|
| • | Our compensation program for executive officers delivers a large part of potential total compensation in equity. If the value we deliver to our shareholders declines, so does the compensation we deliver to our executives. This is evidenced by the actual year-end value of our Named Executive Officer’s equity awards measured against the value of such awards previously reported in the Summary Compensation Table for prior years, as reflected in the table on page 26. |
|
|
|
| • | We maintain a high-quality corporate governance framework. |
|
|
|
| • | We closely monitor the compensation programs and pay levels of executives at companies of similar size and complexity so that we can ensure that our compensation programs are within the range of market practices. |
51
|
|
|
| • | Our compensation programs include many “best practices”, including by way of example, “clawback” and anti-hedging policies and, beginning in 2012, the elimination of tax gross-up payments in future executive severance agreements (see “Change in Control Agreements”) and the inclusion in our equity award agreements of a “double trigger” change in control provision so that vesting of our equity awards is accelerated only if the executive officer is involuntarily terminated, other than for cause, or leaves for good reason following a change in control (see“Equity Awards”). |
|
|
|
| • | Each of the Named Executive Officers is employed at-will and is expected to demonstrate exceptional personal performance in order to continue serving as a member of the executive team. |
We believe that the information we have provided above and within the “Executive Compensation” section of this proxy statement demonstrates that our executive compensation program was designed appropriately and is working to ensure management’s interests are aligned with our shareholders’ interests to support long-term value creation. Accordingly, we are asking our shareholders to voteFOR the following resolution at the annual meeting:
|
|
|
| “RESOLVED, that the shareholders approve, on an advisory basis, the compensation of the Company’s Named Executive Officers, as described in the Compensation Discussion and Analysis section, the tabular disclosure regarding such compensation and the accompanying narrative disclosure set forth in this proxy statement for the 2013 Annual Meeting of Shareholders.” |
|
|
The Board of Directors recommends a voteFOR adoption of the resolution approving |
|
52
|
AMENDMENT TO OUR ARTICLES OF INCORPORATION AND BYLAWS TO |
Our Board of Directors is currently divided into three classes, and members of each class are elected to serve for staggered three-year terms. Included in the proxy statement for our 2011 Annual Meeting of Shareholders was a shareholder proposal requesting that our Board of Directors declassify our Board and establish annual elections of our Directors. Our Board of Directors did not oppose the proposal and made no voting recommendation to shareholders regarding the proposal. The Board stated that if shareholders approved the shareholder proposal, the Board would present for a vote of shareholders at the 2012 Annual Meeting of Shareholders an amendment to our Articles of Incorporation to declassify the Board. The shareholder proposal to declassify the Board was approved by shareholders, receiving approximately 94% of the votes cast on the proposal. Accordingly, the Company presented a proposal at our 2012 Annual Meeting of Shareholders to amend our Articles of Incorporation to declassify the Board. This proposal failed to meet the requisite shareholder vote required to pass and the Company is now resubmitting the same proposal for shareholder consideration at the 2013 Annual Meeting of Shareholders.
Our Articles of Incorporation (Article IX, Sections 2 and 8) and Bylaws (Article II, Section 2(b)) contain provisions regarding the classification of the Board of Directors and the filling of Director vacancies. In light of the shareholder approval at our 2011 Annual Meeting of Shareholders to declassify the Board, the Board of Directors has approved amendments to these provisions in the Articles of Incorporation and Bylaws to declassify the board, subject to shareholder approval at the 2013 Annual Meeting of Shareholders, and is recommending such amendments to our shareholders.
If adopted, the amendments would become effective immediately following the 2013 Annual Meeting of Shareholders. Therefore, Directors elected at the 2014 annual meeting and thereafter would be elected to one-year terms. In accordance with the shareholder proposal that was approved by the shareholders in 2011, the declassification of the Board would be phased in so that it does not affect the unexpired term of any Director elected prior to the 2014 annual meeting. Therefore, the Directors elected at the 2013 annual meeting will be elected to three-year terms, expiring at the 2016 annual meeting. The terms of the Directors elected at the 2012 annual meeting will expire at the 2015 annual meeting, and the terms of the Directors elected at the 2011 annual meeting will expire at the 2014 annual meeting. From and after the 2016 annual meeting, all Directors would stand for election annually. Any Director chosen as a result of a newly created directorship or to fill a vacancy on the Board of Directors would hold office until the next annual meeting of shareholders. The amendments would also eliminate the supermajority vote required to alter, amend or repeal these provisions in the future.
Under the terms of the Articles of Incorporation and Bylaws, the proposed amendments must be adopted by the affirmative vote of at least 80% of the votes entitled to be cast by holders of all outstanding shares of common stock at the 2013 Annual Meeting of Shareholders. If the amendments are not adopted by shareholders, the Board of Directors will remain classified.
The proposed amendments to our Articles of Incorporation and Bylaws are set forth in Appendix A to this proxy statement.
|
The Board of Directors recommends a voteFOR the proposal to amend our Articles of |
|
53
|
PROPOSAL TO RATIFY THE APPOINTMENT OF INDEPENDENT |
The Audit Committee of the Board of Directors has appointed Ernst & Young LLP as the Company’s independent registered public accounting firm for 2013. Ernst & Young LLP will audit our consolidated financial statements for 2013 and perform other services approved by the Audit Committee.
The following table presents Ernst & Young LLP fees for professional services by type and amount charged to the Company during fiscal years 2012 and 2011 (in thousands):
|
|
|
|
|
|
|
|
|
| 2012 |
| 2011 |
| ||
Audit Fees(1) |
| $6,518 |
| $6,249 |
| ||
Audit-Related Fees(2) |
| $ 73 |
|
| $ 72 |
| |
Tax Fees(3) |
| $3,442 |
| $4,744 |
| ||
All Other Fees |
|
| — |
|
| — |
|
|
|
Footnotes
|
|
(1) | Audit fees represent fees billed for professional services rendered for: the audit of the registrant’s annual financial statements; the review of quarterly financial statements; services that are normally provided by the accountant in connection with statutory and regulatory filings or engagements; and services that generally only the auditor reasonably can provide. This category includes: fees for statutory audits required domestically and internationally; comfort letters; consents; assistance with and review of documents filed with the SEC; Section 404 attestation services; other attest services that generally only the auditor can provide; work done by tax professionals in connection with the audit or quarterly review; and accounting consultations billed as audit services, as well as other accounting and financial reporting consultation and research work necessary to comply with the standards of the Public Company Accounting Oversight Board (United States). |
|
|
(2) | Audit-related fees represent amounts for employee benefit plan audits and other attestation services. |
|
|
(3) | Tax fees represent amounts for preparation or review of the Company’s income and related tax returns, tax planning and tax advice. Tax fees for preparation or review of the Company’s income and related tax returns totaled $874 (thousand) and $904 (thousand) in fiscal years 2012 and 2011, respectively. |
Pre-Approval Policy for Audit and Permissible Non-Audit Services
In 2003, the Audit Committee adopted the “Pre-Approval of Independent Auditor Services and Fees” policy. The policy requires that all services by the Company’s independent registered public accounting firm be approved in advance by the Audit Committee and expresses a preference that non-audit services be performed by persons other than the Company’s independent registered public accounting firm. Each year, the Audit Committee approves the performance of, and fees for, the annual audit. Once a year, the Audit Committee reviews general requests to approve non-audit matters, including fees, performed by the Company’s independent registered public accounting firm. In addition, specific requests for non-audit services by the independent registered public accounting firm may be brought to the Audit Committee from time to time. The policy also prohibits engaging the independent registered public accounting firm to perform services prohibited by law.
In 2011 and 2012, there were no fees paid to Ernst & Young LLP that were not approved in advance by the Audit Committee.
A proposal will be presented at the annual meeting to ratify the appointment of Ernst & Young LLP as our independent registered public accounting firm for 2013 in order to ascertain the views of our shareholders on this appointment. If the shareholders do not ratify the appointment of Ernst & Young LLP, the Audit Committee will reconsider its selection of the Company’s independent registered public accounting firm for 2013. Even if the appointment is ratified, the Audit Committee, which is solely responsible for appointing and terminating the Company’s independent registered public
54
accounting firm, may, in its discretion, direct the appointment of a different independent registered public accounting firm at any time during the year if it determines that such a change would be in the best interests of the Company and its shareholders. A representative of Ernst & Young LLP will be present at the annual meeting and will have an opportunity to make a statement and to answer your questions.
The Board of Directors recommends a voteFOR ratification of the appointment of
Ernst & Young LLP. Proxies will be votedFOR ratification of this appointment
unless otherwise specified.
|
|
55
|
Under SEC rules, shareholders who wish to present a proposal at the 2014 Annual Meeting of Shareholders and have it included in our proxy statement for that meeting must submit the proposal in writing to Jason Zellers, Corporate Secretary, St. Jude Medical, Inc., One St. Jude Medical Drive, St. Paul, Minnesota 55117. We must receive your written proposal no later than November 22, 2013.
Shareholders who intend to present a proposal at the 2013 Annual Meeting of Shareholders, but not to include the proposal in our proxy statement, must comply with the requirements established in the Company’s Bylaws. Our Bylaws require, among other things, that a shareholder submit a written notice to the Corporate Secretary of the Company of the intention to bring a proposal before the meeting not less than 50 days nor more than 75 days prior to the meeting (or if less than 60 days’ notice or prior public disclosure of the date of the annual meeting is given to shareholders, not later than the tenth day following the day on which the notice of the date of the annual meeting was mailed or such public disclosure was made).
|
We have sent to our shareholders the Notice containing instructions on how to access this proxy statement and our 2012 Annual Report to Shareholders on-line. Shareholders who received a paper copy of this proxy statement were also sent a copy of our 2012 Annual Report. Both our 2012 Annual Report to Shareholders and our Annual Report on Form 10-K for the year ended December 29, 2012 are available on our website at www.sjm.com, by clicking on Investor Relations and Annual Reports and SEC Filings, respectively. Copies of the Form 10-K are available to any shareholder who submits a request in writing to St. Jude Medical, Inc., One St. Jude Medical Drive, St. Paul, MN 55117, Attention: Corporate Secretary. Copies of any exhibits to the Form 10-K are also available upon written request and payment of a fee covering our reasonable expenses in furnishing the exhibits.
|
The SEC rules allow a single copy of the Notice or proxy statement and annual report to be delivered to multiple shareholders sharing the same address and last name, or who we reasonably believe are members of the same family, and who consent to receive a single copy of these materials in a manner provided by these rules. This practice is referred to as “householding” and can result in significant savings of paper and mailing costs. Although we do not household for our registered shareholders, some brokers household St. Jude Medical Notices or proxy statements and annual reports, delivering a single copy of these documents to multiple shareholders sharing an address unless contrary instructions have been received from the affected shareholders. Once you have received notice from your broker that they will be householding materials to your address, householding will continue until you are notified otherwise or until you revoke your consent. If, at any time, you no longer wish to participate in householding and would prefer to receive a separate copy of our Notice or proxy statement and annual report, or if you are receiving multiple copies of these documents and wish to receive only one, please notify your broker. We will deliver promptly upon written or oral request a separate copy of our Notice or proxy statement and annual report to a shareholder at a shared address to which single copies of these documents were delivered. For copies of these documents, shareholders should write to St. Jude Medical, Inc., One St. Jude Medical Drive, St. Paul, MN 55117, Attention: Corporate Secretary, or call (800) 328-9634.
56
|
We do not know of any other matters that may be presented for consideration at the annual meeting. If any other business properly comes before the annual meeting, the holders of the proxies will have discretionary voting authority to vote your shares as they deem in the best interest of the Company.
|
|
|
|
| Daniel J. Starks |
| Chairman of the Board of Directors, |
| President and Chief Executive Officer |

March 22, 2013
57
APPENDIX A
PROPOSED AMENDMENTS TO THE
ARTICLES OF INCORPORATION AND BYLAWS OF ST. JUDE MEDICAL, INC.
TO DECLASSIFY THE BOARD OF DIRECTORS
Articles of Incorporation
Article IX, Section 2 of St. Jude Medical, Inc.’s Articles of Incorporation, as amended, is hereby amended and restated to read in its entirety as follows:
|
|
| “Section 2. Commencing with the 2014 Annual Meeting of Shareholders, directors shall be elected annually for terms expiring at the next annual meeting of shareholders, except that any director at the 2014 Annual Meeting of Shareholders whose term expires at the 2015 Annual Meeting of Shareholders or the 2016 Annual Meeting of Shareholders shall continue to hold office until the end of the term for which such director was elected. From and after the 2016 Annual Meeting of Shareholders, all directors will stand for election annually. In the case of any vacancy on the Board of Directors, including a vacancy created by an increase in the number of directors, the vacancy shall be filled by election of the Board of Directors with the director so elected to serve until the next annual meeting of shareholders. All directors shall continue in office until the election and qualification of their respective successors in office. No decrease in the number of directors shall have the effect of shortening the term of any incumbent director.” |
Article IX, Section 8 of St. Jude Medical, Inc.’s Articles of Incorporation, as amended, is hereby amended and restated to read in its entirety as follows:
|
|
| “Section 8. Notwithstanding any other provision of these Articles of Incorporation or of law which might otherwise permit a lesser vote or no vote, but in addition to any affirmative vote of the holders of any particular class of Voting Stock required by law or these Articles of Incorporation, the affirmative vote of at least 80% of the votes entitled to be cast by holders of all the outstanding shares of Voting Stock (as defined in Article XIII hereof), voting together as a single class, shall be required to alter, amend or repeal Section 3 of this Article IX. |
1
Bylaws
Section 2(b) of Article II of St. Jude Medical, Inc.’s Bylaws, as amended, is hereby amended and restated to read in its entirety as follows:
|
|
| “(b) Commencing with the 2014 Annual Meeting of Shareholders, directors shall be elected annually for terms expiring at the next annual meeting of shareholders, except that any director at the 2014 Annual Meeting of Shareholders whose term expires at the 2015 Annual Meeting of Shareholders or the 2016 Annual Meeting of Shareholders shall continue to hold office until the end of the term for which such director was elected. From and after the 2016 Annual Meeting of Shareholders, all directors will stand for election annually. In the case of any vacancy on the Board of Directors, including a vacancy created by an increase in the number of directors, the vacancy shall be filled by election of the Board of Directors with the director so elected to serve until the next annual meeting of shareholders. All directors shall continue in office until the election and qualification of their respective successors in office. No decrease in the number of directors shall have the effect of shortening the term of any incumbent director.” |
2

|
|
|
|
|
|
|
|
| |
|
|
|
|
|
|
|
|
|
|
|
| Investor Address Line 1 |
| |
|
| Investor Address Line 2 |
| |
|
| Investor Address Line 3 |
| |
|
| Investor Address Line 4 |
| |
|
| Investor Address Line 5 |
| |
|
| John Sample |
| |
|
| 1234 ANYWHERE STREET | ||
|
| ANY CITY, ON A1A 1A1 | ||
|
|
| ||
|
|
|
| |
|
| |||


|
|
|
|
|
|
|
| |
|
| |
VOTE BY INTERNET - www.proxyvote.com |
| |
Use the Internet to transmit your voting instructions and for electronic delivery of information up until 11:59 P.M. Eastern Time the day before the meeting date. Have your proxy card in hand when you access the web site and follow the instructions to obtain your records and to create an electronic voting instruction form. |
| |
|
| |
ELECTRONIC DELIVERY OF FUTURE PROXY MATERIALS |
| |
If you would like to reduce the costs incurred by our company in mailing proxy materials, you can consent to receiving all future proxy statements, proxy cards and annual reports electronically via e-mail or the Internet. To sign up for electronic delivery, please follow the instructions above to vote using the Internet and, when prompted, indicate that you agree to receive or access proxy materials electronically in future years. |
| |
|
| |
VOTE BY PHONE - 1-800-690-6903 |
| |
Use any touch-tone telephone to transmit your voting instructions up until 11:59 P.M. Eastern Time the day before the meeting date. Have your proxy card in hand when you call and then follow the instructions. |
| |
|
| |
VOTE BY MAIL |
| |
Mark, sign and date your proxy card and return it in the postage-paid envelope we have provided or return it to Vote Processing, c/o Broadridge, 51 Mercedes Way, Edgewood, NY 11717. |
| |
|
|


|
|
|
|
|
|
|
|
|
|
|
|
|
|
| CONTROL # |
| 000000000000 |
| |
|
|
|
|
|
|
|
|
|
|
|
| NAME |
|
|
|
|
|
|
|
|
|
|
|
|
|
|
|
|
|
|
| THE COMPANY NAME INC. - COMMON |
| SHARES |
|
| 123,456,789,012.12345 | ||
|
| THE COMPANY NAME INC. - CLASS A |
|
|
|
| 123,456,789,012.12345 | ||
|
| THE COMPANY NAME INC. - CLASS B |
|
|
|
| 123,456,789,012.12345 | ||
|
| THE COMPANY NAME INC. - CLASS C |
|
|
|
| 123,456,789,012.12345 | ||
|
| THE COMPANY NAME INC. - CLASS D |
|
|
|
| 123,456,789,012.12345 | ||
|
| THE COMPANY NAME INC. - CLASS E |
|
|
|
| 123,456,789,012.12345 | ||
|
| THE COMPANY NAME INC. - CLASS F |
|
|
|
| 123,456,789,012.12345 | ||
|
| THE COMPANY NAME INC. - 401 K |
|
|
|
| 123,456,789,012.12345 | ||
|
|
|
|
|
|
|
|
|
|
|
|
| x |
| PAGE 1 OF 2 | ||||
TO VOTE, MARK BLOCKS BELOW IN BLUE OR BLACK INK AS FOLLOWS: |
|
|
|
|
|
| |||

|
|
|
| KEEP THIS PORTION FOR YOUR RECORDS | |
| DETACH AND RETURN THIS PORTION ONLY | |
THIS PROXY CARD IS VALID ONLY WHEN SIGNED AND DATED. | ||
|
|
|
|
|
|
|
|
|
|
|
|
|
| ||||||||||||
|
|
|
|
|
|
|
| |||||
|
|
|
|
|
|
|
| |||||
| 1. | Election of Directors |
| For | Against | Abstain |
| |||||
|
|
|
|
|
|
|
| |||||
| 1a. | Stuart M. Essig |
| o | o | o |
| |||||
|
|
|
|
|
|
|
|
| ||||
| 1b. | Barbara B. Hill |
| o | o | o |
|
| ||||
|
|
|
|
|
|
|
|
| ||||
| 1c. | Michael A. Rocca |
| o | o | o |
|
| ||||
|
|
|
|
|
|
|
|
| ||||
| The Board of Directors recommends you vote FOR proposals 2, 3 and 4. |
| For | Against | Abstain |
| NOTE: In their discretion, the proxies are | |||||
|
|
|
|
|
|
|
| |||||
| 2. | To approve amendments to our Articles of Incorporation and Bylaws to declassify our Board of Directors. |
| o | o | o |
|
| ||||
|
|
|
|
|
|
|
|
| ||||
| 3. | Advisory vote to approve the compensation of our named executive officers. |
| o | o | o |
|
| ||||
|
|
|
|
|
|
|
|
| ||||
| 4. | To ratify the appointment of Ernst & Young LLP as our independent registered public accounting firm for 2013. |
| o | o | o |
|
| ||||
|
|
|
|
|
|
|
|
| ||||
| For address change/comments, mark here. |
|
|
| o |
|
| |||||
| (see reverse for instructions) |
| Yes | No |
|
|
| |||||
|
|
|
|
|
|
|
|
| ||||
| Please indicate if you plan to attend this meeting |
| o | o |
|
|
| |||||
|
|
|
|
|
|
|
|
| ||||
| Please sign exactly as your name(s) appear(s) hereon. When signing as attorney, executor, administrator, or other fiduciary, | |||||||||||
|
|
|
|
|
|
|
| |||||
|
|
|
|
|
|
|
|
|
|
| SHARES | |
|
|
|
|
| JOB # |
|
|
| ||||
| Signature [PLEASE SIGN WITHIN BOX] | Date |
|
|
|
|
|
| Signature (Joint Owners) | Date | ||

|
|
0000160209_1 R1.0.0.51160 |
|
|
|
|
|
| |
|
| |
|
| |
| ||
| ||
|
| |
|
| |
| ||
| ||
|
| |
|
| |
|
| |
|
| |
|
| |
|
| |
|
| |
|
| |
|
| |
|
| |
|
| |
|
| |
|
| |
|
|
|
Important Notice Regarding the Availability of Proxy Materials for the Annual Meeting: The Annual Report, Notice & Proxy Statement is/are available atwww.proxyvote.com. |
|
|
|
|
|
|
|
|
|
|
|
|
|
| ST. JUDE MEDICAL, INC. |
| |||
|
| ||||
Annual Meeting of Shareholders |
| ||||
|
| ||||
May 2, 2013 8:30 AM |
| ||||
|
| ||||
This proxy is solicited by the Board of Directors |
| ||||
|
|
| |||
| The undersigned hereby appoints Daniel J. Starks, John C. Heinmiller, Donald J. Zurbay and Jason A. Zellers or any one of them, as proxies, with full power of substitution to vote all the shares of common stock which the undersigned would be entitled to vote if personally present at the Annual Meeting of Shareholders of St. Jude Medical, Inc., to be held May 2, 2013 at 8:30 a.m. central time, at the Minnesota History Center, 345 Kellogg Boulevard West, St. Paul, Minnesota, 55102 or at any adjournment thereof, upon any and all matters which may properly be brought before the meeting or adjournments thereof, hereby revoking all former proxies. |
| |||
| The shares represented by this proxy will be voted as specified, but if no specification is made, the shares will be voted “FOR” each of the Director nominees, “FOR” Proposal 2, “FOR” Proposal 3, “FOR” Proposal 4, and in the discretion of the named proxies on all other matters. |
| |||
|
|
| |||
|
| Address change/comments: |
| ||
|
|
|
|
|
|
|
|
|
|
|
|
|
|
|
|
|
|
|
|
|
|
|
|
|
|
|
|
|
|
| (If you noted any Address Changes and/or Comments above, please mark corresponding box on the reverse side.) |
| |||
|
|
|
|
|
|
Continued and to be signed on reverse side | |||||
|
|
|
|
|
|
0000160209_2 R1.0.0.51160
|
|
|
|
|
|
|
|
|
|
|
|
|
|
|
| *** Exercise YourRight to Vote *** |
|
|
|
|
| ||||||||
| Important Notice Regarding the Availability of Proxy Materials for the |
|
|
| B |
| ||||||||
| Shareholder Meeting to Be Held on May 02, 2013 |
|
|
|
| |||||||||
|
|
|
|
|
| |||||||||
|
|
|
|
|
|
|
|
|
|
|
|
|
| |
|
|
|
|
|
|
| Meeting Information |
|
|
|
| |||
|
|
|
|
|
|
|
|
|
|
|
|
| ||
| ST. JUDE MEDICAL, INC. |
|
|
| Meeting Type: Annual Meeting |
|
|
|
|
| ||||
|
|
|
|
|
|
| For holders as of: March 05, 2013 |
|
|
|
|
| ||
|
|
|
|
|
|
| Date: May 02, 2013 Time: 8:30 AM CDT |
|
|
|
| |||
|
|
|
|
|
|
| Location: | Minnesota History Center |
|
|
|
|
| |
|
|
|
|
|
|
|
| 345 Kellogg Boulevard West |
|
|
|
|
| |
|
|
|
|
|
|
|
| St. Paul, Minnesota 55102 |
|
|
|
|
| |
|
|
|
|
|
|
|
|
|
|
|
| |||
|
|
|
|
|
|
|
|
|
|
|
|
| ||
|
|
|
|
|
|
|
|
|
|
|
|
|
| |
|
|
|
|
|
| You are receiving this communication because you hold shares in the above named company. |
|
|
|
| ||||
| ST. JUDE MEDICAL, INC. |
|
|
|
|
|
|
|
| |||||
| ATTN: INVESTOR RELATIONS |
|
|
|
|
|
|
|
|
| ||||
| ONE ST. JUDE MEDICAL DRIVE |
|
|
|
| This is not a ballot. You cannot use this notice to vote these shares. This communication presents only an overview of the more complete proxy materials that are available to you on the Internet. You may view the proxy materials online atwww.proxyvote.com or easily request a paper copy (see reverse side). |
|
|
|
| ||||
| ST. PAUL, MN 55117 |
|
|
|
|
|
|
|
| |||||
|
|
|
|
|
|
|
|
|
| |||||
|
|
|
|
|
|
|
|
|
| |||||
| Investor Address Line 1 |
|
|
|
|
|
|
|
| |||||
| Investor Address Line 2 |
|
|
|
|
|
|
|
| |||||
| Investor Address Line 3 |
|
|
|
|
|
|
|
|
|
|
| ||
| Investor Address Line 4 |
|
|
| We encourage you to access and review all of the important information contained in the proxy materials before voting. |
|
|
|
|
| ||||
| Investor Address Line 5 |
|
|
|
|
|
|
|
| |||||
| John Sample |
|
|
| See the reverse side of this notice to obtain proxy materials and voting instructions. |
|
| |||||||
| 1234 ANYWHERE STREET |
|
|
|
|
|
|
|
| |||||
| ANY CITY, ON A1A 1A1 |
|
|
|
|
|
|
|
| |||||
|
|
|
|
|
|
|
|
|
|
|
|
|
|
|
|
|
|
|
|
|
|
| Broadridge Internal Use Only |
| |||||
|
|
|
|
|
|
|
|
| ||||||


0000160208_1 R1.0.0.51160
|
|
|
|
| Before You Vote | ||
|
|
| |
How to Access the Proxy Materials | |||
|
|
|
|
|
| Proxy Materials Available to VIEW or RECEIVE: |
| ||
| 1. Annual Report 2. Notice & Proxy Statement |
| ||
|
|
|
|
|
| How to View Online: |
| ||
| Have the information that is printed in the box marked by the arrowè XXXX XXXX XXXX (located on the following page) and visit:www.proxyvote.com. |
| ||
|
|
|
|
|
| How to Request and Receive a PAPER or E-MAIL Copy: |
| ||
| If you want to receive a paper or e-mail copy of these documents, you must request one. There is NO charge for requesting a copy. Please choose one of the following methods to make your request: |
| ||
|
|
|
|
|
|
| 1)BY INTERNET: | www.proxyvote.com |
|
|
| 2)BY TELEPHONE: | 1-800-579-1639 |
|
|
| 3)BY E-MAIL*: | sendmaterial@proxyvote.com |
|
|
|
|
|
|
| * If requesting materials by e-mail, please send a blank e-mail with the information that is printed in the box marked by the arrowè XXXX XXXX XXXX (located on the following page) in the subject line. |
| ||
|
|
|
|
|
| Requests, instructions and other inquiries sent to this e-mail address will NOT be forwarded to your investment advisor. Please make the request as instructed above on or before April 18, 2013 to facilitate timely delivery. |
| ||
|
|
| ||
|
|
| ||
|
|
|
|
| How To Vote | ||
|
|
| |
Please Choose One of the Following Voting Methods | |||
|
|
|
|
|
|
|
|
| Vote In Person: Many shareholder meetings have attendance requirements including, but not limited to, the possession of an attendance ticket issued by the entity holding the meeting. Please check the meeting materials for any special requirements for meeting attendance. At the meeting, you will need to request a ballot to vote these shares. |
|
|
|
|
|
|
| Vote By Internet: To vote now by Internet, go towww.proxyvote.com. Have the information that is printed in the box marked by the arrowè XXXX XXXX XXXX available and follow the instructions. |
| Internal Use |
|
|
| |
| Vote By Mail: You can vote by mail by requesting a paper copy of the materials, which will include a proxy card. |
| |
|
|
| |
|
|
|
|
0000160208_2 R1.0.0.51160
|
Voting items |
The Board of Directors recommends you vote FOR the following:
|
|
1. | Election of Directors |
|
|
| Nominees |
|
|
1a. | Stuart M. Essig |
|
|
1b. | Barbara B. Hill |
|
|
1c. | Michael A. Rocca |
The Board of Directors recommends you vote FOR proposals 2, 3 and 4.
|
|
2. | To approve amendments to our Articles of Incorporation and Bylaws to declassify our Board of Directors. |
|
|
3. | Advisory vote to approve compensation of our named executive officers. |
|
|
4. | To ratify the appointment of Ernst & Young LLP as our independent registered public accounting firm for 2013. |
|
NOTE: In their discretion, the proxies are authorized to vote upon such other business as may properly come before the meeting. |

|
|
|
|
|
|
|
|
|
|
|
|
| à | 0000 0000 0000 |
|
|
|
|
|
|
|
|
|
|
|
|
|
|
|
|
|
|
|
| Broadridge Internal Use Only |
|
|
|
|
| xxxxxxxxxx |
|
|
|
|
| xxxxxxxxxx |
|
|
|
|
| Cusip |
|
|
|
|
| Job # |
|
|
|
|
| Envelope # |
|
|
|
|
| Sequence # |
|
|
|
|
| # of # Sequence # |
0000160208_3 R1.0.0.51160
|
|
|
|
|
|
|
| ||||
| Reserved for Broadridge Internal Control Information |
|
| ||
|
|
|
|
| |
|
|
|
|
|
|
|
|
|
|
|
|
|
|
|
|
| NAME |
|
|
|
|
|
|
| THE COMPANY NAME INC. - COMMON | 123,456,789,012.12345 |
|
| THE COMPANY NAME INC. - CLASS A | 123,456,789,012.12345 |
|
| THE COMPANY NAME INC. - CLASS B | 123,456,789,012.12345 |
|
| THE COMPANY NAME INC. - CLASS C | 123,456,789,012.12345 |
|
| THE COMPANY NAME INC. - CLASS D | 123,456,789,012.12345 |
|
| THE COMPANY NAME INC. - CLASS E | 123,456,789,012.12345 |
|
| THE COMPANY NAME INC. - CLASS F | 123,456,789,012.12345 |
|
| THE COMPANY NAME INC. - 401 K | 123,456,789,012.12345 |
|
| |||
|
|
|
|
| |||
|
|
| |
|
|
|
|
Job | # |
| |
THIS SPACE RESERVED FOR SIGNATURES IF APPLICABLE | Envelope | # |
|
Sequence | # |
| |
# of # Sequence | # |
| |
0000160208_4 R1.0.0.51160