| | The Honourable Rod Gantefoer Minister of Finance | |
| |  | |
| | SASKATCHEWAN PROVINCIAL BUDGET | |
| | 10-11 | |
| | BALANCED. FORWARD-LOOKING. RESPONSIBLE. | |
| |
| | BUDGET SUMMARY | |
Minister’s Message
It is with great pleasure that I table the 2010-11 Budget and supporting documents for public review and discussion.
Today, Saskatchewan faces both significant challenges and great opportunities. We all know the story of the past year in which we were faced with an unprecedented collapse in global potash markets.
While serious, it’s a circumstance that has given us the opportunity to rethink our approach to governing. This Budget is not about potash. It is about making the right decisions – balanced, forward-looking, responsible decisions – to keep our province on the path of steady, long-term growth.
Like other jurisdictions across the country, our spending has increased in recent years, and for good reasons. We have made record investments in infrastructure and tax cuts to maintain economic growth. And we have been fulfilling the commitments made in the 2007 election campaign.
But that trajectory of spending growth is unsustainable. We must now think about spending smarter, not just bigger.
We’re not alone in this. Governments across the country and around the globe are engaged in a similar process. While their particular challenges might differ, governments everywhere are looking for ways to reduce spending and to shrink the footprint of government.
Overall, this Budget will actually see Saskatchewan reduce its spending in 2010-11, something no other province has so far managed to do in this budget season.
In the coming year, we will also reduce the size of government through a process of attrition. This will mean adjustments to what we do and how we do it but we believe we can achieve an orderly reduction in the size of the government workforce and improve our efficiency at the same time.
This is just part of finding a different way to conduct government business. We have achieved real spending reductions in most government ministries this year, while maintaining the core services that people expect their government to provide. This balanced approach preserves our social programs, our health care priorities and the post-secondary programs that are key to our province’s economic prosperity.
At the same time, we have increased spending in the key areas where it’s needed. For example, we are spending $10.5 million on the first year of a four-year effort to reduce health care wait lists to three months even while we have found savings throughout the system.
At the same time, we have not forgotten our government’s commitment to a growth agenda that promotes innovation and diversification. That’s why we are supporting projects like the Canadian Light Source, Canada’s only synchrotron.
Nor are we forgetting the fact that Saskatchewan remains an outward-looking, export-driven province. In order to capitalize on the huge successes of our farmers and manufacturers, we are investing an additional 11 per cent in the Saskatchewan Trade and Export Partnership, so that it can do even more to promote our trading interests abroad.
In the past two years, we have made huge investments in our infrastructure in order to foster the economic growth we see all around us. But more needs to be done. This year, we will make $632 million in capital expenditures, to continue making investments in highways, health care and education facilities.
We think this is a budget to be proud of, a balanced budget. While other provinces continue to increase spending, we’re reducing our expenditures. Where some governments are laying off hundreds of government workers, we are reducing government primarily through attrition.
There’s no doubt that in facing contemporary challenges, Saskatchewan is taking a different path. We think it’s the right one.
/s/ Rod Gantefoer
Honourable Rod Gantefoer
Minister of Finance
Table of Contents
MINISTER’S MESSAGE | |
| GOVERNMENT DIRECTION FOR 2010-11 | 6 |
| TECHNICAL PAPERS | |
| | Saskatchewan’s Economic Outlook | 28 |
| | General Revenue Fund Financial Outlook | 37 |
| | General Revenue Fund 2009-10 Financial Update | 50 |
| | Saskatchewan’s Tax Expenditures | 51 |
| | 2010 Intercity Comparison of Taxes, Utilities and Housing | 55 |
| | 2010-11 Borrowing and Debt | 61 |
| | Growth and Financial Security Fund | 66 |
| | Debt Retirement Fund | 67 |
| | Saskatchewan’s Tobacco Control Strategy | 68 |
| | Canada’s Retirement Income System | 70 |
GENERAL REVENUE FUND (GRF) FINANCIAL TABLES | |
| | GRF – Statement of Operations and Accumulated Deficit | 74 |
| | GRF – Statement of Change in Net Debt | 74 |
| | GRF – Statement of Cash Flow | 75 |
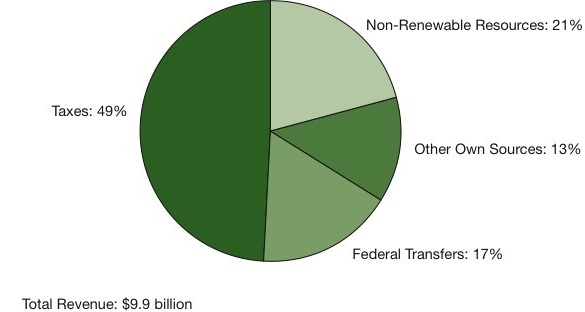
| | GRF – Schedule of Revenue | 76 |
| | GRF – Schedule of Expense | 77 |
| | GRF – Schedule of Debt | 78 |
| | GRF – Schedule of Borrowing Requirements | 79 |
| | GRF – Schedule of Guaranteed Debt | 80 |
SUMMARY FINANCIAL STATEMENT (SFS) FINANCIAL TABLES | |
| | Summary Statement of Surplus | 82 |
| | Summary Statement of Accumulated Surplus | 83 |
| | Summary Statement of Change in Net Debt | 84 |
| | Summary Schedule of Pension Liabilities | 84 |
| | Summary Schedule of Tangible Capital Assets | 85 |
| | Summary Schedule of Debt | 86 |
| | Notes to the Summary Financial Budget | 87 |
| | | |
| | | |
| | SASKATCHEWAN PROVINCIAL BUDGET | |
| | 10-11 | |
| | GOVERNMENT DIRECTION FOR 2010-11 | |
| |
Government Direction for 2010-11:
BALANCED. FORWARD-LOOKING. RESPONSIBLE.
The 2010-11 Budget sets a course for the Saskatchewan government that is balanced, forward-looking and responsible. This Budget ensures future prosperity, making important investments where necessary to position the province for future growth and opportunity.
In order to achieve a balanced budget and ensure that Saskatchewan keeps moving forward, this Budget reduces government spending while focusing on key priorities and reducing direct government involvement.
To achieve this, some difficult decisions had to be made. This was not the easy path. The easy path is to keep spending more, keep government growing, and put the burden of these choices on future governments and future generations.
A responsible government does not do that. This government will take a different path – smaller government, less spending, and a balanced budget.
Government’s plan presents a path to a more efficient government that operates with fiscal prudence, innovation and integrity; all the while remaining true to the Government’s vision for:
A secure and prosperous Saskatchewan, leading the country in economic and population growth, while providing opportunity for a high quality of life for all.
Government’s vision is supported by three goals:
Sustain economic growth for the benefit of Saskatchewan people, ensuring the economy is ready for growth and positioning Saskatchewan to meet the challenges of economic and population growth and development;
Secure Saskatchewan as a safe place to live and raise a family where people are confident in their future, ensuring the people of Saskatchewan benefit from the growing economy; and,
Keep Government’s promises and fulfill the commitments of the election, operating with integrity and transparency, accountable to the people of Saskatchewan.
A STRONG AND GROWING ECONOMY
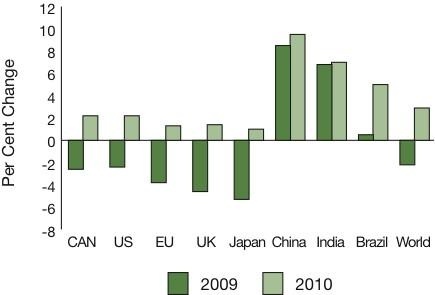
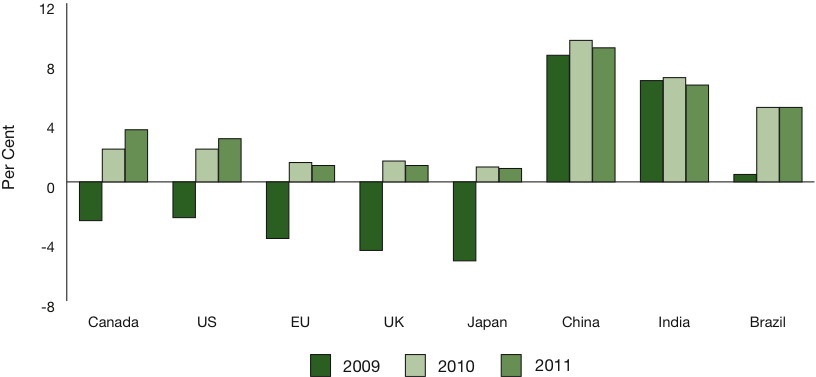
After record breaking growth rates in 2008, 2009 was a difficult year across most of the globe. While China, India and Brazil recorded positive growth in real Gross Domestic Product (GDP), Canada, the United States, the United Kingdom, the European Union and Japan all suffered decreases in real GDP. Overall, world GDP contracted by 2.2 per cent.
6 Budget 2010-11 | Budget Summary
INTERNATIONAL GDP GROWTH RATES
Source: For world data – Conference Board of Canada, Consensus
Economics; other countries – Saskatchewan Ministry of
Finance, various sources
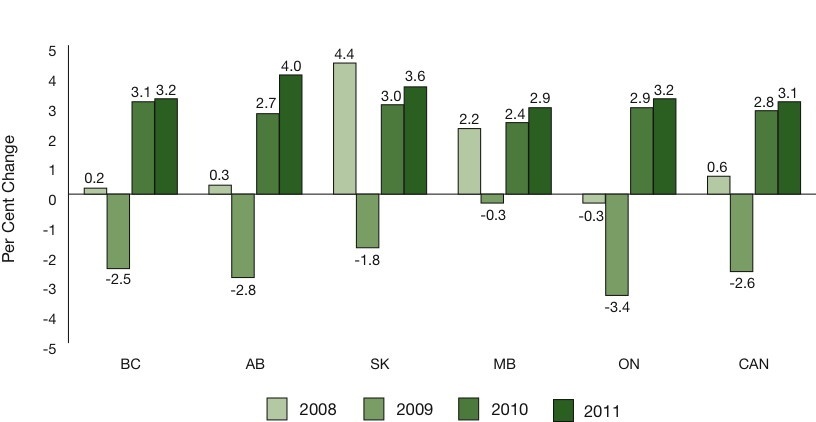
Saskatchewan was not immune and while the severity of the impact on the potash sector was unexpected, Saskatchewan fared much better than most other provinces.
REAL GDP 2008-2011
WESTERN PROVINCES, ONTARIO & CANADA
Source: For 2008 – Statistics Canada; for 2009-11 – Saskatchewan Ministry of Finance, average of private sector forecasters
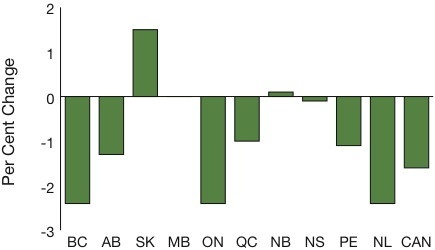
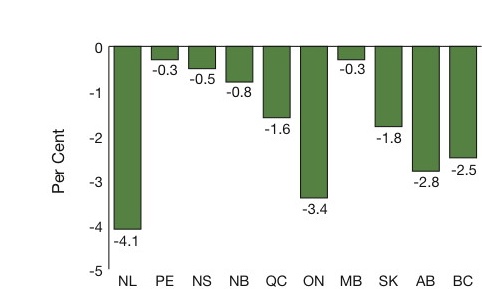
There were many positive indicators of relative economic strength. Saskatchewan was the only province to experience significant growth in employment in 2009.
CHANGE IN EMPLOYMENT
ACROSS CANADA – 2009
| | Source: Statistics Canada |
� 60; Budget Summary | Budget 2010-11 7
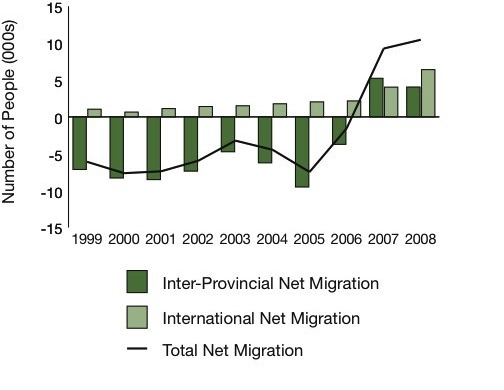
The province continues to attract people from other jurisdictions seeking opportunities. At October 2009, Saskatchewan’s population hit an all-time high of 1,034,974, breaking the record set in 1987.
NET MIGRATION
| | Source: Statistics Canada |
Independent forecasters say Saskatchewan is poised for a strong recovery, with improved conditions and growth expected in 2010 and 2011.
BALANCED
The job of our Government is to ensure this momentum continues and that Saskatchewan and its economy keeps growing and moving forward. The foundation of a growing economy is a strong fiscal framework.
Our Government made a commitment to balanced budgets and this promise is being kept. The General Revenue Fund (GRF) is budgeting a $20 million surplus and debt is to remain flat. Government spending will decrease by 1.2 per cent in 2010-11.
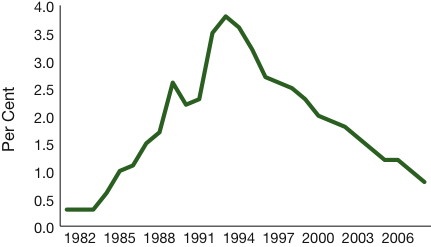
Debt reduction in this Government’s first two years in office has improved the Province’s fiscal flexibility, as demonstrated in the graph below:
INTEREST COSTS AS A % OF GDP
1981-82 TO 2008-09
| | Source: Ministry of Finance |
Developing a balanced budget with such uncertain economic conditions across the globe required some tough choices. Decisions needed to be made between funding worthwhile and growing program needs across all ministries, controlling government spending, and maintaining a competitive tax structure within the existing tax base.
This Government has committed to sharing the benefits of a growing economy with all of Saskatchewan’s citizens. The expenditure highlights presented in this document represent the programs and services that meet the Government’s priorities and its goal:
Secure Saskatchewan as a safe place to live and raise a family where people are confident in their future, ensuring the people of Saskatchewan benefit from the growing economy.
8 Budget 2010-11 | Budget Summary
Health Care – A Priority
Health care funding continues to be one of the highest priority expenditures of this Government. While most ministries were expected to stay at or below zero growth, the government set boundaries for health funding to grow – but only modestly. This ensures that priority programs are funded while asking the health sector to find innovative ways to alter the historical increase in health care spending.
Health ministries represent the largest component of most public sector budgets (over 40 per cent of the total expense budget in Saskatchewan) and these budgets are expected to continue growing. If meaningful spending restraint is to occur, then health care costs must be controlled; programs and services must be made more efficient.
The Regional Health Authorities (RHAs) have been asked to find ways to reduce costs and improve efficiencies and to implement “LEAN” innovations wherever possible.
LEAN is a quality improvement philosophy used to examine a system or a process, with the intention of improving customer experience, outcomes and efficiency.
A customer focused approach is taken in evaluating an entire system or process, from its beginning to its end. The goal may be to make the process more effective (thereby improving services) and/or make it more efficient (eliminating waste).
The primary focus is to create value from the customer’s perspective. In the health care system, this equates to the patient and their family, therefore these efforts co-ordinate very well with a “Patient First” approach – a cultural shift that is taking place across the health sector, including the Ministry of Health, and which is beginning to show tangible results.
RHAs and the Saskatchewan Cancer Agency are being asked to reduce their operating costs, through such things as reduced employee sick time, overtime management, less time lost due to injuries, and through increased use of shared administrative services and bulk purchasing.
RHA operating funding will increase by $123 million, for a total of $2.56 billion, a 5 per cent increase over last year, providing necessary funding for drugs and medical supplies, operating costs and health care worker salaries.
RHAs will receive funding from the Ministry in 2010-11 for the ongoing salary costs of increased nursing staff. RHAs are employing 600 more nursing full time equivalents (FTEs) than in 2007-08, well ahead of the schedule to meet the election and throne speech commitments to hire 800 nurses over four years.
The Saskatchewan Cancer Agency will receive $10 million in new funding to accommodate increases in chemotherapy, radiation and other treatments for new and existing cancer patients. This funding will also allow the Agency to continue to provide screening services for early detection of breast and cervical cancers, as well as continue implementation of the colorectal cancer screening program.
Additional funding will address utilization and cost increases for Canadian Blood Services, Fee-for-Service, and Out-of-Province payments.
The Fall 2009 Throne Speech
… Government has set a bold, new goal. Over the next four years, we will reduce surgical wait times in Saskatchewan to no longer than three months. The plan to achieve this goal will be outlined during this session.
� 60; Budget Summary | Budget 2010-11 9
The 2010-11 Budget moves forward on this commitment and provides $10.5 million to begin planning and implementing the necessary surgical capacity improvements within the system.
Patient First Review
Recommendation #1: that the health system make patient- and family-centred care the foundation and principal aim of the Saskatchewan health system…
To support the health system in adopting a patient- and family-centred care approach, the 2010-11 Budget provides $7 million for a Patient First Initiatives Fund.
Total funding of $382.7 million, an increase of $6.8 million will support the continuation of prescription drugs and extended benefit programs including the Seniors’ and Children’s Drug plans, Family Health and Supplementary Health benefits and Saskatchewan Aids to Independent Living.
Investments have also been made to ensure people in Saskatchewan get the care they need:
| · | $2.5 million in new funding to enhance Autism services; |
| · | $10.6 million to continue Early Childhood Development programming, supporting mental health and addictions services for 670 new pre- and post-natal families in targeted communities and initiatives to reduce infant mortality and Fetal Alcohol Spectrum Disorder; |
| · | $2.6 million in new funding to address increased cardiac care volumes including expansion of electrophysiology services in the province; |
| · | $3.8 million operating funding increase for the Irene and Leslie Dubé Centre for Mental Health; |
| · | $3.6 million in new funding for kidney disease and hemodialysis volume increases; and, |
| · | $2.4 million in new funding to continue infant, and pre-school vaccinations, and seasonal influenza immunization. |
Funding these priority programs meant making some difficult choices and balancing priorities. Funding for some of our partner agencies, the Health Quality Council, the Health Research Foundation and the Saskatchewan Association of Health Organizations (SAHO) will decrease.
Capital funding provided in previous years will allow progress to continue for the Children’s Hospital, the Surgical Care Centre and long-term care facilities.
The difficult choice of de-insuring universal chiropractic services was made in this Budget, saving the Province $10.4 million annually. Low income people will continue to receive full coverage for up to 12 treatments per year, under Family and Supplementary Health benefit programs. This policy change is consistent with most other provinces which do not pay for chiropractic services and/or which limit these treatments.
The effects of tobacco use and second-hand smoke have serious health consequences, yet these are entirely preventable.
The Fall 2009 Throne Speech placed emphasis on the need to reduce tobacco use, particularly use amongst our Province’s young people. The Province committed to the implementation of a tobacco control strategy and legislation to strengthen these efforts.
10 Budget 2010-11 | Budget Summary
The Ministry of Health will continue the Government’s Tobacco Control Strategy in 2010-11 through a combination of legislation and investment in prevention and cessation programming.
The Saskatchewan Coalition for Tobacco Reduction has recommended that an increase in the real price of tobacco products is one of the surest and most cost-effective ways to enhance the Government’s plan to reduce tobacco use.
Effective midnight March 24th, the Tobacco Tax will increase by 2.7 cents per cigarette to $5.25 per package of 25 cigarettes, with a comparable increase for other tobacco products.
First Nations persons continue to smoke at a rate that is significantly higher than the rest of the population. The Coalition for Tobacco Reduction has indicated that the public health impact of Saskatchewan’s high tobacco taxation policy has been limited by the lack of taxation on tobacco products sold to First Nations.
The Government will address this important health concern, while continuing to respect First Nations rights, by limiting the purchase of tax-free cigarettes by First Nations individuals from three cartons per week to one carton per week.
This change to the allowance for tax-free tobacco for First Nations individuals will take effect once enacting legislation is proclaimed.
For more information on this change to the Tobacco Control Strategy, see the Budget Summary Book, page 68.
Protecting Saskatchewan People
Safety in our Communities
The Government continues to move forward on its commitment to increase the number of police officers by 120 new officers over four years. Funding provided in 2010-11 will allow for an additional 30 police officers to be hired across the province.
This Budget increases funding commitments to the Royal Canadian Mounted Police to $138.4 million and continues programming and operations in community programs, correctional centres and young offender facilities.
In addition, there is a $700,000 increase in the municipal policing grants for continued support of our specialized officers, such as those that deal with the suppression of gang-related activity and exploitation of children through the Internet.
The Provincial Public Safety Telecommunications Network-Subscriber Radio Purchase Program receives funding of $4.3 million, which will be augmented by $2.6 million from the Sask911 Fund. Capital funding of $13.8 million is provided to complete construction of the network and an additional $2.3 million in funding will allow the program to begin operating.
The 2010-11 Budget contains $4.5 million in capital funding, which includes $2.5 million to complete construction of the Meadow Lake Court House and $1.5 million to continue replacement of the Maintenance Enforcement computer system which will improve the collection of family support payments ordered by the court.
� 60; Budget Summary | Budget 2010-11 11
Social Assistance, Housing and Child Protection
This Budget invests $345 million for income assistance programs – an increase of approximately $35 million.
The Fall 2009 Throne Speech
“...Government has made significant investments towards protecting vulnerable children, foster families and supporting extended family caregivers
...will continue this work with a thorough review
of the Child and Family Services Act and the Adoption Act
...will also begin implementing a new electronic case management system, to provide better monitoring and protection of children and youth in its care”
In November of 2009, the Minister of Social Services announced a comprehensive child welfare review to be undertaken that would go beyond the examination of legislation. The review will examine all aspects of child welfare: foster care, adoption, prevention of abuse and neglect, and child protection.
Consultations are set to begin in the spring of 2010. New funding of $831,000 is provided in 2010-11 to support the child welfare review.
Child and Family Services will receive a funding increase for caseload pressures and to support a comprehensive multi-year strategy, announced last year, that will continue to improve the lives of children in care.
Highlights of these investments include:
| · | providing $8.2 million to fully fund the operating costs associated with residential spaces developed in 2009-10; |
| · | investing $4.5 million in capital and operating funding to develop additional out-of-home residential spaces in 2010-11; |
| · | providing a 1.5 per cent cost-of-living increase to foster parents and other caregivers; |
| · | providing $1.6 million to increase respite funding for foster parents; |
| · | investing an additional $1.1 million to enhance intensive family support services; and, |
| · | providing annualized funding of $1.3 million to support Family Finders, a program initiated in 2009-10 and operated in partnership with our First Nations Agencies to enhance the Ministry’s efforts to place children with extended family; and, |
| · | providing $9 million to address pressures in family-based care. |
Significant investments in Child and Family Services over the past two years have helped support the province’s child welfare system, as demonstrated through the development of 144 new residential spaces across Saskatchewan in 2009-10, as well as by a 36 per cent decrease in 2009 in the number of children living in foster homes with more than four children.
The Ministry is moving forward on the commitment to better track and monitor children in the province’s care. Funding of $9 million is provided for a new automated case management system.
A commitment was made in the 2008 Throne Speech to address the 440-person waitlist for individuals with intellectual disabilities. Following through on this commitment, people with intellectual disabilities will get support from this Budget. By the start of the 2010-11 fiscal year, projects will be underway to serve 264 Saskatchewan people with intellectual disabilities – 60 per cent of the waitlist. In 2010-11 work will continue on the four-year plan with $1.5 million of additional funding.
12 Budget 2010-11 | Budget Summary
A commitment was also made in the 2009 Throne Speech to address the shortage of low income housing.
In this Budget, the Province continues to invest in rejuvenation of the housing portfolio, including new housing for families, seniors and single persons. The province will leverage its $77.2 million in investments between 2009 and 2011 to generate a total provincial/federal investment of $161.2 million for housing across Saskatchewan.
The Budget provides $1.5 million to continue to index shelter rates semi-annually for benefits provided to low-income families and individuals to offset the inflationary pressure of the cost of rental housing.
The Ministry of Social Services is receiving a 13 per cent ($30.2 million) increase to offset caseload and cost increases in the Saskatchewan Assistance Program, the Saskatchewan Assured Income for Disability Program, and the Transitional Employment Allowance, as part of government’s resolve to maintain core services while ensuring fiscal responsibility.
Funding is being provided to support our Community Based Organizations (CBOs) that help deliver some of the province’s most needed supports. New funding of $3.2 million across all ministries with CBO partners will provide a one per cent operating increase to these agencies, bringing the total operating increase to 13.3 per cent since 2007.
Including program enhancements as well as operating increases, funding provided to the province’s CBOs to deliver public services has increased by 39.9 per cent since 2007.
Environmental Sustainability
The government committed to spend $70 million over four years on green initiatives as part of the “Go Green” program. The $40 million ($10 million per year) incremental commitment by the government in the 2008-09 Budget was in addition to the funding already committed to green projects.
Go Green funding of over $2.5 million in 2010-11 will establish the foundational elements of the provincial climate change plan, including the Office of Climate Change, the Climate Change Foundation, and the Technology Fund.
The 2010-11 Budget provides a total of $16.7 million:
| · | $15.3 million in Environment; and, |
| · | $1.4 million in Energy and Resources, a reduction of $800,000 from the 2009-10 Budget levels, as a number of projects have been completed. |
More than $15 million in grants will be provided through programs and measures aimed at mitigating or avoiding the negative impacts of some of Saskatchewan’s most important environmental challenges.
Government’s long standing partnership with SARCAN continues to ensure environmental benefits to our province while providing important employment opportunities. A $21.7 million grant is being provided to SARCAN in 2010-11 to support their operations in the Beverage Container Collection and Recycling Program. A portion of this funding, $4 million, is provided through the “Go Green” program.
The Crown Investments Corporation (CIC) and its subsidiary Crowns continue to demonstrate environmental leadership through a variety of initiatives and programs as part of the Government’s commitment to help Saskatchewan people “Go Green.”
Budget Summary | Budget 2010-11 13
Programs are designed to enhance environmental sustainability in the sector and the province in general. All Crowns, even those that do not produce significant greenhouse gas emissions, are required to identify performance measures, which are monitored and reported on annually, as part of the Crown
Sector Performance Management System.
The Fall 2009 Throne Speech
Over the course of next year, SaskPower will develop an electrical power generation strategy to meet our province’s future needs. This strategy will include a significant commitment to increased wind power.
SaskPower plans to add 200 megawatts of wind power to its generation profile as early as 2013. Wind power will help to satisfy a portion of the province’s future power generation needs as well as provide a source of renewable, clean power.
Consistent with the Government’s direction to facilitate private sector involvement in the economy, all of this generation will be procured from the private sector. SaskPower’s Green Options Partners Program will purchase up to 25 megawatts of wind power from small, renewable power producers. The balance, up to 175 megawatts, will be procured through SaskPower’s large-scale generation procurement process.
200 megawatts will supply power for approximately 200,000 homes for a year. Currently wind power constitutes just under 5 per cent of SaskPower’s generating capacity. This additional capacity will move the wind power component to 8.5 per cent making Saskatchewan second in Canada in percentage of wind power to total generating capacity.
SaskEnergy will continue to provide incentive programs such as the Programmable Thermostat Rebate Program and the ENERGY STAR® Prime Rate Loan Program, which could impact up to 7,500 customers in 2010. It is anticipated that approximately 15,500 customers will also participate in programs indirectly administered by SaskEnergy such as the EnerGuide for Houses grant and the Energy Efficient Rebate for New Homes.
Saskatchewan Government Insurance (SGI) is meeting an election commitment by continuing to provide a 20 per cent rebate on insurance premiums and registration fees for hybrid and other fuel efficient vehicles, providing incentives for the purchase and use of more environmentally-friendly vehicles on our roads.
The SGI Auto Fund will begin paying for the full costs of delivering the Driver Licence and Registration Administration Program, including $1.3 million which had been previously funded through the Ministry of Finance.
Quality of Life
The Community Vitality Program is a new program designed to enhance the culture and quality, accessibility and use of facilities in communities across the province. The Program also encourages volunteerism and community involvement; engages Aboriginal and young people as leaders in community activities; and improves access and inclusion for those who experience barriers to community involvement.
This Program will run over the next three years, funded through the Community Initiatives Fund. More details on this new program will be available over the coming weeks.
The recently announced Cultural Policy will serve as a foundation for planning and enhancement of our cultural programs. As a first step, the new Saskatchewan Capital Commission has been established with a mandate to promote the culture and heritage of the Province’s capital.
14 Budget 2010-11 | Budget Summary
The Building Communities Program will continue with a total budget of $13.7 million, to reflect the estimated cost of projects in 2010-11. This Program advances grants to communities for construction of recreational facilities, adding to the quality of life of people in communities around the province.
Saskatchewan families can now take advantage of the Active Families Benefit, an election commitment that was announced last year. This Benefit provides a tax credit of up to $150/child for cultural, recreational and sport activities. This program serves as an incentive to keep our young people active and supports families with the associated costs of these programs.
Families can now submit receipts to the program with their 2009 tax forms. The tax credit is estimated to cost $11 million in 2010-11, reflecting revised estimates of up-take in the program.
The 2010-11 Budget maintains stable funding to most of our major third parties.
Capital funding for provincial parks will be reduced in this year’s budget by $4.4 million. However, sufficient funding in the budget will allow for 240 new camping sites to be upgraded to electrified sites in the upcoming year, keeping the Government on track to meet its commitment of 1,000 new electrified sites over four years. $515,000 is also being provided to regional parks.
While steps will be taken to maintain distance education and satellite services, the Saskatchewan Communications Network will cease operation before the end of the 2010-11 fiscal year, for savings of $2.4 million.
FORWARD-LOOKING
The Fall 2009 Throne Speech
[quoting Albert Einstein] … “Life is like riding a bicycle. To keep your balance, you must keep moving.”
In 2009, our province faced the challenge of a global economic recession. Saskatchewan has met this challenge and kept its balance because we kept moving – moving forward.
As choices were being made in this Budget about government spending, specific attention was placed on making investments in Saskatchewan’s future and ensuring economic stimulus funding was maintained.
This Budget encourages innovation, and focuses on preparing our youth with a solid education, which increases their career opportunities within the province. Initiatives in this section relate closely to Government’s goal to:
Sustain economic growth for the benefit of Saskatchewan people, ensuring the economy is ready for growth and positioning Saskatchewan to meet the challenges of economic and population growth and development
Innovation – Key to a Growth Agenda
Saskatchewan holds some of the country’s most important research and development institutions on our university campuses. This Government recognizes the importance of providing funding to these organizations so that they can continue to find innovative and leading edge scientific solutions to some of our greatest challenges.
� 60; Budget Summary | Budget 2010-11 15
In the past, the Province has provided capital funding support to the Canada Light Source Synchrotron. This Budget commits new operating funding of $1 million to the Synchrotron on the University of Saskatchewan (U of S) campus to support the facilities’ 13 beam lines in the operational and commissioning stage and nine beam lines in development.
The InterVac facility in Saskatoon provides capacity for animal and human disease research on current and emerging infectious diseases. Funding is being provided to InterVac through the Innovation and Science Fund. The Province’s total multi-year commitment is $57.1 million, which is approximately 40 per cent of the total cost. The remainder of the cost is funded by the federal government and other partners.
The Petroleum Technology Research Centre (PTRC) located on the University of Regina campus receives $2.5 million in continued funding for its petroleum-related research projects, including CO2 storage and enhanced oil recovery.
In addition, $1.6 million in “Go Green” funding is also being provided to the PTRC for its important contributions to carbon capture research and finding solutions to reduce to greenhouse gas emissions.
This Budget establishes Innovation Saskatchewan with a base budget of $1.3 million. A significant portion of this funding ($480,000) will go to TRLabs in Saskatoon to support the work they do in telecommunications research.
Government continues its support for the Saskatchewan Research Council (SRC) to further its research and development projects in most of the province’s key economic sectors including agriculture; biotechnology and food; energy; environment and forestry; alternative energy and manufacturing; and mining and minerals.
SRC’s budget increases year over year by $1.6 million, to accommodate new forestry responsibilities, bio-energy and other related research.
Other research funding contained in this Budget includes:
| · | $16 million for grants to support agricultural research and development; and, |
| · | $11.5 million for the Innovation and Science Fund. This Fund provides matching funding for post-secondary institution projects that have received approval for federal funding from the Canada Foundation for Innovation, the Canada Research Chairs Foundation, or the Canadian Institute for Health Research. |
The Saskatchewan Trade and Export Partnership (STEP) works hard to expand trade and develop new markets for Saskatchewan products throughout the world. To continue and improve upon this success, STEP will receive increased funding of $325,000 or 11 per cent more in 2010-11 to increase markets for our province’s exporters.
Carbon Capture and Storage
SaskPower is leading the development of one of the world’s first and largest integrated Carbon Capture and Storage (CCS) commercial projects at Boundary Dam Power Station in Estevan.
16 Budget 2010-11 | Budget Summary
This innovative $1.4 billion partnership between the Governments of Canada and Saskatchewan, SaskPower and private industry will transform Unit 3 at Boundary Dam Power Station into a reliable, long-term producer of 115 to 120 megawatts of clean base-load electricity, while enhancing provincial oil production and reducing greenhouse gas emissions by capturing one million tonnes of CO2 per year.
This leading-edge project will determine the technical, economic and environmental performance of clean coal/carbon capture and storage technology.
Infrastructure – Investments in our Future
The Government has made an unprecedented commitment to infrastructure funding over the past two years – investing $2.3 billion in hospitals, schools, highways, municipal projects and other much-needed initiatives.
This funding was directed to provincial projects which addressed needed capital improvements and generated employment opportunities across the province.
These decisions served the province well as the momentum of projects underway throughout last year allowed Saskatchewan to realize continued growth in employment in 2009.
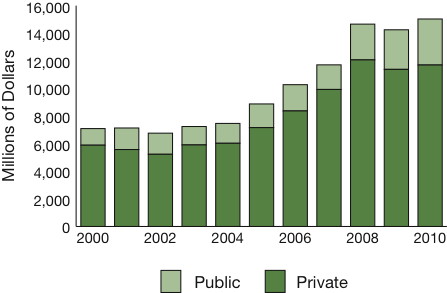
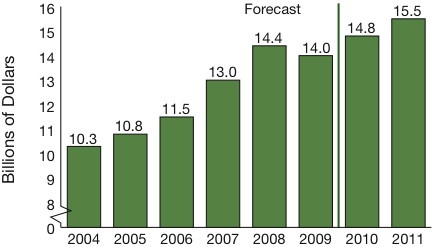
Statistics Canada released its Private and Public Investment Intentions Survey in February of 2010. Saskatchewan’s total capital investment from both the private sector and the public sector is growing significantly.
While investment in 2009 was lower than 2008, investment is expected to grow by 5.5 per cent in 2010 reaching a record high level of $15 billion next year.
PRIVATE AND PUBLIC CAPITAL
INVESTMENT INTENTIONS
The federal government has made a commitment to maintain the economic stimulus programs introduced under Canada’s Action Plan. Saskatchewan is following suit – continuing to fund stimulus projects as a priority and phasing out of projects as appropriate and in accordance with the design of the projects.
The Government will make a significant capital investment of $632 million in 2010-11, bringing the total infrastructure investment to nearly $3 billion over three years.
The majority of this funding is dedicated to Highways and Infrastructure projects ($302 million) and another large portion goes to Municipal Affairs ($177 million).
The Conference Board of Canada
Winter 2010 – Provincial Outlook
“Saskatchewan – Geared Up for a Recovery
... commodity markets are rebounding and are expected to serve as the engine for growth in 2010
... potash sales are expected to climb
... housing starts will jump by 15.4 per cent
... several private construction projects – including Loblaw’s $200-million Regina warehouse and distribution facility – are also entering their peak development period.”
� 60; Budget Summary | Budget 2010-11 17
Highways and Infrastructure
The Budget provides the Ministry of Highways and Infrastructure government-owned capital funding of $250.3 million, which optimizes all potentially available Infrastructure Stimulus Fund (ISF) revenues. Total revenue from ISF and the Building Canada Plan related to highways is estimated at $112.5 million for 2010-11.
This funding will:
| · | continue twinning of Highway 11; |
| · | continue work on the Lewvan Drive interchange in Regina; |
| · | construct the Yorkton Truck Bypass; |
| · | proceed with contracts under the Rural Highway Strategy, resulting in approximately 470 kilometres of highway construction on the market; |
| · | commence or complete resurfacing on approximately 600 kilometres of highway; and, |
| · | undertake construction to replace 36 bridges. |
At this level of funding the Province is on track to complete its commitment to dedicate funding equivalent to fuel taxes as well as meet the commitment to $1.8 billion in highway funding over four years.
The Highways and Infrastructure operations budget includes:
| · | a $2.8 million enhancement to the Urban Connectors Program (total program budgeted at $17.5 million in 2010-11); and, |
| · | $600,000 to purchase radios to access the new Provincial Public Safety Telecommunications Network. |
This level of funding maintains:
| · | the Winter Maintenance Program at $25.4 million; |
| · | the Municipal Roads for the Economy Program with $20.5 million in the base budget, plus a $3 million enhancement to the Program; |
| · | ferry services – $3.5 million; |
| · | airports – $2.5 million; and, |
| · | the Shortline Railway Sustainability Program at $500,000. |
The Global Transportation Hub Authority begins its first full year of operations in 2010-11. The Ministry of Highways and Infrastructure will be investing $26 million this year on the Regina West By-Pass in support of the Hub and growth in Regina.
The Western Canadian Distribution Centre to serve Loblaw’s will start operations in late 2010, creating up to 750 jobs. The Canadian Pacific Intermodal facility will complete its pre-construction work and obtain regulatory approvals in 2010 and begin construction in early 2011. This facility allows for the efficient transfer of containers between rail, truck and ship for both import and export purposes.
Vision for the Global Transportation Hub Authority
A major transportation and logistics hub that is private-sector driven and will effectively and efficiently distribute goods regionally, nationally and internationally, providing economic benefits to Saskatchewan people and business.
The Hub will provide the public infrastructure required to offer efficient distribution solutions and create business opportunities, optimizing returns to the Province.
18 Budget 2010-11 | Budget Summary
In order to fund priority infrastructure programs, some highways programs needed to be delayed or reduced:
| · | A $16.9 million decrease in the Surface Preservation Program will be achieved by reducing the amount of maintenance done to the provincial highway system; |
| · | The $20 million in one-time funding provided for the Municipal Roads for the Economy Program has been removed; |
| · | The Ministry will defer the purchase of new machinery, reduce sign rehabilitation and pavement marking and provide a smaller summer mowing program; |
| · | The First Nations Pilot Projects budgeted at $5 million will be delayed; and, |
| · | No funding is provided for new loans under the Railway Line Loan Program. |
Municipal Partners
In recent years, as provincial revenues were increasing, the Government provided significant new funding to its municipal partners. Municipal leaders are aware of the fiscal challenges facing the Province and have been consulted on the impact of budget decisions on the municipal sector.
As communicated to municipal leaders, $167.4 million is provided in the 2010-11 Budget to maintain funding for revenue sharing at the record-setting level provided in 2009-10.
Total funding for federal-provincial-municipal infrastructure programs increases by $48.3 million to $115.8 million, a 71.7 per cent increase from 2009-10. This includes:
| · | $60.6 million for stimulus programs that need to be completed before March of 2011; and, |
| · | $51.9 million for longer-term programs that expire in 2014 or later. |
In 2010-11, $58.3 million in federal flow-through funding for the Gas Tax Program will allow more municipal infrastructure projects to proceed.
Funding of $2.3 million is provided to maintain commitments under the Saskatchewan Infrastructure Growth Initiative, providing assistance to growing communities that are facing increasing costs for infrastructure development.
Crown Capital Investments
In 2010 the Crown sector is forecast to reinvest $1.3 billion in capital infrastructure, led by requirements in SaskPower, SaskTel, and SaskEnergy.
SaskPower is faced with the challenge of replacing aging infrastructure with more expensive, cleaner technologies during a period where Saskatchewan is expected to experience economic growth and require more electricity.
The challenge will require a major re-investment in the Province’s electrical infrastructure and SaskPower intends to partner with the private sector to ensure the reliability and long-term security of the system.
SaskTel will focus on capital investments to enhance infrastructure, providing leading edge products and services to the people of Saskatchewan.
SaskTel will also continue to implement the Rural Infrastructure Program to deliver 100 per cent high speed internet and improved wireless coverage across the province, advancing the Government’s commitment to expand these services.
SaskTel will also construct a new wireless network based on the Global System for Mobile Communications technology, and plans to expand Max Entertainment Services to 14 more Saskatchewan communities over the next two years.
� 60; Budget Summary | Budget 2010-11 19
SaskEnergy will continue to expand the utility infrastructure required to service the growing Saskatchewan population by upgrading technology, increasing storage capacity, and putting new pipelines in the ground, while also supporting various growth initiatives. Growth initiatives such as waste heat recovery and the transportation of CO2 will continue to be the focus in 2010.
Investments in Education and Training
Prekindergarten to Grade 12 Education
Over the last two years, significant investments were made in school capital.
In 2008-09, $117.6 million was provided for school capital under the Ready for Growth Initiative and $142.4 million as part of the “economic booster shot” in February of 2009.
In 2009-10, $31 million was provided for K-12 major and block capital projects and $5.4 million for early learning and child care space development capital funding. In addition, capital funding of $22 million was provided in the fourth quarter of 2009-10 to proceed with projects nearing completion, to address immediate capital needs, and to provide additional school maintenance and planning.
In 2010-11, capital funding for the K-12 sector is $17.2 million, bringing total new school capital
funding to more than $328 million over three years.
The overall funding for school divisions will increase by $33 million or 2.1 per cent in 2010-11. Education Property Tax rates will remain at the 2009-10 level: 7.08 mills for agriculture, 10.08 mills for residences, and an average of 15.42 mills for commercial property.
A commitment was made in the 2009 Throne Speech to increase the number of licensed child care spaces funded by the Province. In response to this commitment, this budget provides $2 million for 235 additional child care spaces and 18 Prekindergarten programs. This brings the total number of licensed child care spaces, that are operational or in development at the end of the 2010-11 fiscal year to approximately 11,650, and the number of Prekindergarten programs to 230.
The Ministry of Education will continue its implementation of the Career Development Action Plan, helping students become self-reliant, self-motivated career managers as they transition between learning and work. In 2010-11 the Ministry will continue to work with local school boards, the business community, and CBOs to enhance business literacy, entrepreneurship, and career education for students.
The Ministry’s new video streaming service – Recommended Online Video Education Resources – will continue to be implemented in all provincially funded schools. This resource benefits educators by delivering high-quality services and greater access to curriculum-based video, streaming directly into the classroom.
Post-Secondary Education
Additional funding of $16.3 million will be provided to universities, federated and affiliated colleges to support the core base of programming and enable institutions to limit potential increases to tuition.
In addition, $7.9 million will be provided to post-secondary institutions for the continuation of health care provider training seat expansion.
Capital funding of $6.2 million will be provided through the Knowledge Infrastructure Program to fund the nursing expansion at Saskatchewan Institute of Applied Science and Technology’s (SIAST) Kelsey Campus and the electrical shop expansion at Woodland Campus.
20 Budget 2010-11 | Budget Summary
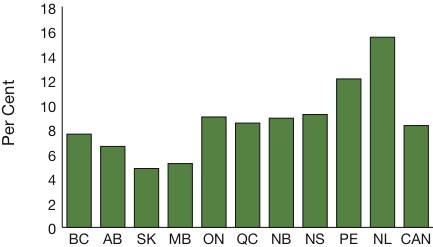
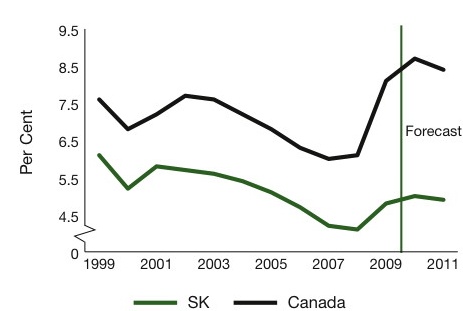
Saskatchewan’s unemployment rate was the lowest across Canada in 2009.
UNEMPLOYMENT RATE ACROSS CANADA –
2009
| | Source: Statistics Canada |
Job opportunities are available in the province, however, a challenge for post-secondary sectors is to stay ahead of the changing needs in the market place.
Post-secondary institutions are being asked to examine program priorities and find efficiencies in their operations, as is being done across government, in the health sector, and in the Crown sector.
Institutions will receive $16.9 million to fund sustaining capital and maintenance projects, which is a $12.4 million or 42 per cent decrease from last year.
The Ministry of Advanced Education, Employment and Labour continues to examine the effectiveness of its current array of training and employment programs and evaluate if they are achieving desired outcomes. Some funding will be discontinued or reduced while other funding will be repositioned to be more responsive to the training and retraining needs of the labour market.
Although there are training and employment program reductions, federal stimulus initiatives will ensure a comparable level of training and employment opportunities.
This Budget provides needed support to students and responds to the 2008 Throne Speech commitment to enhance student loans. New funding of $1.8 million will provide for enhancements to student support programs, including lower interest rates for student loans in repayment. Enhancements also include consistent levels of assistance for students through the student loan program and the elimination of vehicle value and in-study income in the assessment of eligibility for the student loan program and the Provincial Training Allowance.
A $4.6 million increase is being provided for the third year of the Graduate Retention Program, for total program funding of $23.1 million, helping to keep our students in the province and to attract graduates from other provinces.
The Gradworks program through the Crown Investment Corporation (CIC) provides 12-month internships in the Crowns for recent post-secondary graduates who have little or no work experience.
Since the program was implemented, there have been 340 internships provided within the Crown sector. In 2009, 72 people obtained new internships through this program. Nearly 84 per cent of those who have completed their internships have stayed in Saskatchewan, with 54 per cent employed in the Crowns and 30 per cent employed in other companies.
The CIC Aboriginal Bursary Program provides financial assistance for qualifying students at the University of Regina and affiliated colleges.
Beginning in the fall of 2009 the bursary program was expanded to include the University of Saskatchewan, the Saskatchewan Institute of Indian Technologies and SIAST. Under the program, students can receive $2,500 per semester or $5,000 per full academic year.
� 60; Budget Summary | Budget 2010-11 21
In 2009, there were 67 bursaries awarded for the winter semester and 50 for the fall semester. From the program’s inception in 2004 to the end of 2009, 531 bursaries had been awarded, with some students receiving multiple bursaries.
Health Care Providers –
Recruitment and Retention
The Province continues to place priority on increasing the number of seats provided in health related training. This Budget provides $6.6 million to continue medical education enhancements including the physician training seat expansion, with 12 new post-graduate seats. This fulfills government’s commitment to fund 60 additional residency seats (120 in total).
To complement these training seats, efforts are also being made to retain Saskatchewan-trained physicians once their residencies are complete. Funding of $3.5 million will continue for implementation of the physician recruitment strategy and agency, another 2009 Throne Speech commitment that is being funded in this Budget.
Given the province’s strong economy, competitive wages and success in meeting and exceeding recruitment and retention targets, non-physician recruitment and retention activities will be scaled back.
The 10-Year Health Human Resource Plan, upon its completion later this year, will provide insights into what the Province may need to do to ensure the required number of health professionals are available over the next decade.
Investments in Agriculture
The 2010-11 Budget provides $283.4 million to fulfill the commitment to deliver and fully fund the Province’s 40 per cent share of farm income stabilization programs. This includes $234.1 million for the Province’s share of program payments to AgriStability, AgriInvest, and Crop Insurance premiums, based on current forecasts.
As committed, a review was undertaken on the Crop Insurance Program that has led to enhancements that improve upon the program, such as improvements made to the Wildlife Damage Compensation Program.
Crop insurance coverage has been broadened for 2010 to include camelina, soybeans, navy beans and honey, supporting more diversified crops across the province.
Yield cushioning is also being made a permanent feature of the program, after being studied under a pilot program in 2009. This feature limits the impact of consecutive poor growing seasons, such as a prolonged drought, on the level of coverage available to a producer.
The transfer of AgriStability administration to the Crop Insurance Corporation in Melville will be completed this year, leading to improved services to farmers.
This Budget also includes $6 million to continue the second year of the Crown Land Sale Program and $2.6 million for the Comprehensive Pest Control Program.
22 Budget 2010-11 | Budget Summary
Further Engagement with First Nations and Métis People
The Ministry of First Nations and Métis Relations (FNMR) manages the Government’s approach to First Nations and Métis issues by building and maintaining partnerships and relationships, and providing leadership within government.
The Ministry also manages the $3 million First Nation and Métis Consultation Participation Fund to ensure that the Province’s duty to consult obligations are met and relationships are strengthened.
Government will meet its financial obligations pursuant to Treaty Land Entitlement (TLE) Agreements with $4.9 million in funding in 2010-11.
In addition, $68.1 million will meet obligations under gaming agreements. The funding includes an increase of $1.4 million for the Clarence Campeau Development Fund which supports improving the economic circumstances of Saskatchewan’s Métis people.
New funding of $3 million is set aside for a program through the Crown Investments Corporation, to be available to support economic development for First Nations people.
In 2010-11, First Nations and Métis Relations will develop a new Northern Social Policy Unit that will work with other ministries to improve the lives of northern Saskatchewan people through the development of a Northern Action Plan.
Funding of $1.4 million is provided for the first full year of funding for three Northern Enterprise Regions. This new structure will assist stakeholders in key sectors of the north, increasing business and industry competitiveness and supporting the north to reach its full economic potential.
The Ministry reconfigured a number of its programs and reviewed their effectiveness in delivering results. As a result, a decision was made to discontinue the Aboriginal Employment Development Program, achieving savings of $786,000, allowing funding to be directed to other program areas, such as the Northern Enterprise regions.
FNMR will support northern Saskatchewan’s (estimated 600+) commercial fishers’ efforts to transition from a monopoly marketing agreement with Canada to an open, competitive market. FNMR will support the exploration and implementation of alternative models that will broaden processing and marketing options for their catch.
The Ministry will also work to ensure that all First Nations children with intensive medical needs get care similar to that of other children through the development of a joint plan with Canada and the Federation of Saskatchewan Indian Nations to implement Jordan’s Principle.
RESPONSIBLE
Keep Government’s promises and fulfill the commitments of the election, operating with integrity and transparency, accountable to the people of Saskatchewan
In order to reduce spending and achieve a balanced budget, the Government is outlining its plan to make government more efficient.
Efforts taken by ministries and agencies in the latter half of 2009 and through the 2010-11 Budget process resulted in a 1.2 per cent reduction in the expense budget over the previous year. This is significant in that Saskatchewan may be the only province in Canada to reduce government spending this year.
� 60; Budget Summary | Budget 2010-11 23
Ministries have achieved this through:
| · | vacancy management, either by eliminating vacant positions and/or not filling positions; |
| · | eliminating travel and unnecessary operational costs; |
| · | reducing the scope of programs that are under-utilized or not achieving results; |
| · | scaling back on program expansions, refining program eligibility, or deferring projects and program investments where possible; and, |
| · | eliminating programs which have the least direct impact on the public. |
Improving Service Delivery
Government is already taking steps to work more effectively, engaging in joint service delivery with key partners to improve services delivered to the public.
Improving service to industry and increasing ministry efficiency is the goal behind the Process Renewal and Infrastructure Management Enhancements (PRIME) Project, in the Ministry of Energy and Resources.
This Budget provides $10.5 million in capital and $1.9 million in expense funding to continue the second year of the PRIME project.
The Information Services Corporation (ISC), in collaboration with the Ministry of Energy and Resources, is implementing the Mineral Administration Registry of Saskatchewan (MARS) in 2010 which will assist in the improved management of land dispositions. The MARS project will assist in handling greater volumes, reduce processing time and provide better information for the management of Crown mineral lands.
Effective October 2010, the Corporations Branch will transfer from the Ministry of Justice to ISC. This move will leverage ISC’s registry expertise, core competencies and infrastructure to enhance and further evolve service delivery to the business community in the future. This move will mark the start of a one-stop business registry for Saskatchewan, thereby increasing the efficiency of the process and making it easier for new businesses to get started in the province.
The Ministry of Environment is provided with $6.7 million in operating and capital funding to continue implementation of the Results-Based Regulatory framework. This new approach is intended to streamline and improve the efficiency of the provincial environmental management system and reduce response times to better serve industry and the public.
Effective July 1, 2010, boiler and pressure vessel, elevator, and amusement ride licensing and inspection services will move from the Ministry of Corrections, Public Safety and Policing (CPSP) to a delegated administrative agency.
This move will allow these services to be provided in a more flexible manner, adapting to industry demand for licensing and inspection services. Costs will be recovered on a fee-for-service basis. Legislative and regulatory authority will remain with CPSP.
The Ethanol Grant Program is being restructured, reflecting a reduced need to support the maturing provincial ethanol industry. The revised program will provide an annual subsidy for the first 25 million litres of production. Small, local ethanol producers with production of 25 million litres or less will receive nine cents per litre produced, while larger producers will receive six cents per litre.
Government is decreasing its fire management budget by $30.8 million, including both operating and government-owned capital, to reflect more refined forecasts. Core funding of $71 million continues to be provided to ensure protection of people, communities, and the commercial forest and to renew the province’s aerial fire fighting fleet.
24 Budget 2010-11 | Budget Summary
There has been a change in how the Province funds capital acquisition by Treasury Board Crown organizations. Rather than provide the TB Crown an upfront capital grant, the Province will fund (and expense) the capital as it is amortized by the TB Crown. This change effectively amortizes and expenses TB Crown capital acquisitions in the same manner that it amortizes its own capital assets.
A Reduced Government Footprint
Over the past decade, the size of the public service has grown at a faster pace than the growth in Saskatchewan’s population.
Government has signalled its interest in attaining a smaller footprint, focusing on core government programs, and improving the administration of programs and services within government and across the public sector including regional health authorities, school divisions and post-secondary institutions.
Saskatchewan began this process early last fiscal year with the first signals that revenue sources may not hold. The government implemented a process to find efficiencies throughout its operations, including delays in hiring staff and holding positions vacant.
The examination of government programs and services, ensuring their efficient delivery, continued during the development of this budget.
Government is moving in the right direction but real efficiencies take more time than is allowed in one budget process. We need to do more.
All agencies that receive taxpayer funding are being asked to consider how programs and services can be made more efficient and effective and how we might get by with less. Executive government is taking the lead, but it cannot make significant gains without the support of the health and education sectors participating in this effort.
Over the next four years, ministries and agencies are being asked to find ways to reduce the size of the public service. The goal is to reduce the size of the service by 15 per cent at the end of four years. This will be achieved primarily through attrition and vacancy management.
The Growth and Financial Security Act, 2008 requires Treasury Board to monitor the size of the public service. The Ministry of Finance has developed a performance measure in its Ministry Plan in response to the requirements of the Act. The Ministry of Finance and the Public Service Commission will be monitoring the workforce adjustment strategy and the corresponding reduction in the size of the public service.
The Crown sector will also be participating in finding efficiencies in their operations. In 2010 the Crown sector will build on the productivity reviews currently underway at SaskTel and SaskPower.
As new efficiency measures are introduced, the Crown sector will reduce staff levels through attrition. The Crown sector’s ability to efficiently deliver high quality service at the lowest possible cost will drive staffing decisions.
Consistent with the SaskFirst Policy, SaskTel, SaskEnergy and SaskPower will sell non-core out-of-province assets to support required capital investment in Saskatchewan.
These efforts, in addition to the interest in pursuing LEAN practices, will help to encourage greater fiscal responsibility, improved governance and a more sustainable and accountable government.
� 60; Budget Summary | Budget 2010-11 25
Revenue Initiatives
In working to achieve a balanced budget, the Government made every effort to avoid tax increases. The Tobacco Tax is being increased as outlined earlier.
In addition, this Budget increases the Saskatchewan Liquor and Gaming Authority’s mark-ups on various alcohol products. These changes will increase provincial revenues by approximately $18 million. As an example, the mark-up on a case of 12 bottles of beer increases by 75 cents.
A small number of fee increases were announced on March 4, 2010 which are intended to recover the costs of services provided. Anticipated revenue from these fee increases is estimated at about $1 million.
Keeping Government’s Promises
The Government remains committed to the promises it made to the people of Saskatchewan. Sometimes difficult choices need to be made. However, commitments made in the election platform, through the last three Speeches from the Throne and through the Ministers’ mandate letters remained front and centre during the budget deliberations.
A fundamental promise made to the people of Saskatchewan was to maintain balanced budgets. Despite some challenges with volatile revenue sources and an unpredictable international economy, Government has delivered a balanced budget.
This Government is on track to continue delivering the promises made to the people of this province. While not all commitments will be delivered as quickly as initially hoped, this Government places high value on being held accountable for delivering on its commitments.
Balanced. Forward-Looking. Responsible.
The 2010-11 Budget sets Saskatchewan firmly on the path of fiscal responsibility and continued economic growth. Our Government has chosen to make key investments in health, education, innovation and other priority areas that meet the needs of Saskatchewan people.
The Government has also made some difficult but necessary choices to meet the challenges of today because we know what it means for our children tomorrow.
This Budget makes the right choices for the new Saskatchewan – where our best days lie ahead.
This document provides highlights of government activity for the upcoming year. For more detailed information, see the Ministry Plans for 2010-11 accessible through each of the ministries’ websites or at www.finance.gov.sk.ca/PlanningAndReporting. Crown sector plans are available through www.cic.gov.sk.ca.
For more information on changes made within the 2010-11 Budget, see the technical and background papers provided through the Ministry of Finance website.
26 Budget 2010-11 | Budget Summary
| | | |
| | | |
| | SASKATCHEWAN PROVINCIAL BUDGET | |
| | 10-11 | |
| | | |
| | TECHNICAL PAPERS | |
Saskatchewan’s Economic Outlook
2009 PERFORMANCE
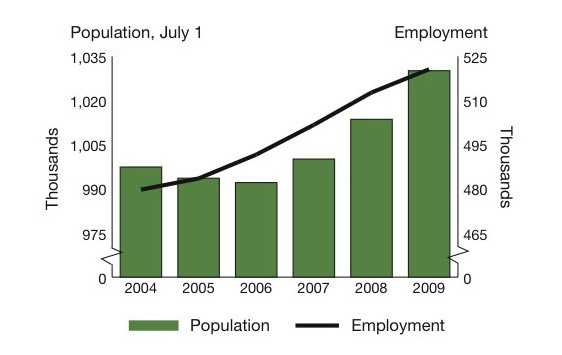
Last year was a good year for the province in terms of both population and employment gains.
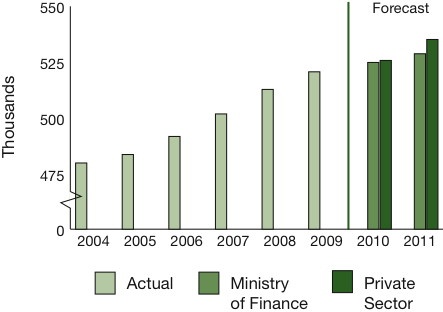
POPULATION AND EMPLOYMENT
IN SASKATCHEWAN
| | Source: Statistics Canada |
Whereas most provinces lost jobs, Saskatchewan created (on average) 7,817. Further, Saskatchewan’s population continued to grow. As of October 1, 2009, there were 1,034,974 people living in Saskatchewan, more than ever before.
2009 EMPLOYMENT GROWTH
BY PROVINCE
Source: Statistics Canada
Yet Saskatchewan’s economy was affected by the global economic slowdown, as evident in most other indicators for 2009.
SASKATCHEWAN ECONOMIC INDICATORS
(Per Cent Change Unless Otherwise Noted)
| | | | 2007 | | | | 2008 | | | | 2009 | |
| Employment Growth (000s) | | | 10.2 | | | | 11.0 | | | | 7.8 | |
| Unemployment Rate (%) | | | 4.2 | | | | 4.1 | | | | 4.8 | |
| Consumer Price Index | | | 2.9 | | | | 3.2 | | | | 1.1 | |
| Average Weekly Earnings | | | 5.4 | | | | 4.8 | | | | 2.5 | |
| International Exports | | | 19.4 | | | | 55.2 | | | | (26.4 | ) |
| Wholesale Trade | | | 17.3 | | | | 41.0 | | | | (21.0 | ) |
| Retail Sales | | | 13.0 | | | | 10.6 | | | | (2.3 | ) |
| New Vehicle Sales | | | 14.1 | | | | 8.6 | | | | (9.1 | ) |
| Manufacturing Sales | | | 4.5 | | | | 18.9 | | | | (10.7 | ) |
| Building Permits | | | 44.6 | | | | 32.8 | | | | (13.5 | ) |
| Housing Starts | | | 61.7 | | | | 13.7 | | | | (43.4 | ) |
Private/Public Investment1 | | | 14.0 | | | | 25.2 | | | | (2.8 | ) |
| | 1 | Private and Public Investment Intentions Survey, February 26, 2010 |
| | Source: Statistics Canada |
28 Budget 2010-11 | Budget Summary
Overall, Saskatchewan’s economy, like all other provincial economies, contracted last year. For Saskatchewan, weak potash sales were a major contributor.
PRIVATE SECTOR FORECASTS
OF 2009 REAL GDP GROWTH 1
| 1 | Percentages are the average of private sector forecasts. Private sector here includes major Canadian banks, Global Insight, Conference Board of Canada and the Centre for Spatial Economics. |
INTERNATIONAL ECONOMIC CONDITIONS AND OUTLOOK
Saskatchewan exports roughly 70 per cent of what it produces. Therefore, what happens in the rest of the world is an important factor in the province’s economic performance.
The global economy is gradually recovering from what turned out to be one of the worst recessions in years.
The U.S. economy in particular is expected to grow by 2.2 per cent this year, much improved from the 2.4 per cent contraction in 2009.
Countries that were least affected by the financial crisis are expected to post the strongest growth in 2010. The economies of China, India and Brazil, for example, are anticipated to grow by 9.5 per cent, 7.0 per cent and 5.0 per cent, respectively.
OUTLOOK FOR GLOBAL ECONOMIC GROWTH
Source: Ministry of Finance
� 0; Budget Summary | Budget 2010-11 29
CANADIAN ECONOMIC CONDITIONS AND OUTLOOK
Canada’s growth tracks U.S. developments quite closely due to the large bilateral trade relationship and closely aligned monetary policies between the two countries.
Just like in the U.S., economic recovery in Canada appears to be taking hold. Growth in the final quarter of 2009 was 5.0 per cent on an annualized basis, much higher than forecasters had expected. For 2010, the Canadian economy is expected to grow by 2.2 per cent.
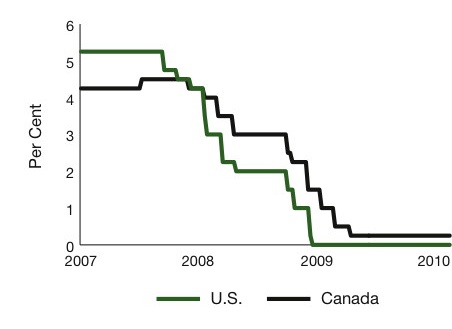
Few central banks around the world appear ready to raise interest rates just yet. In part, this reflects the view that the global economic recovery will be slow. In the near term, the U.S. Federal Reserve and the Bank of Canada are likely to keep interest rates at a relatively low level, conditional on the outlook for inflation.
CANADA AND U.S. KEY POLICY RATES
WEEKLY
Source: Bank of Canada, U.S. Federal Reserve
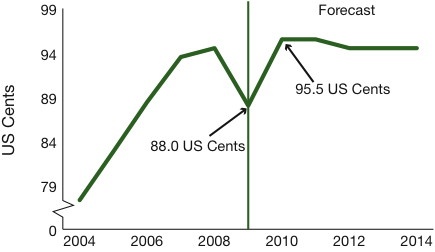
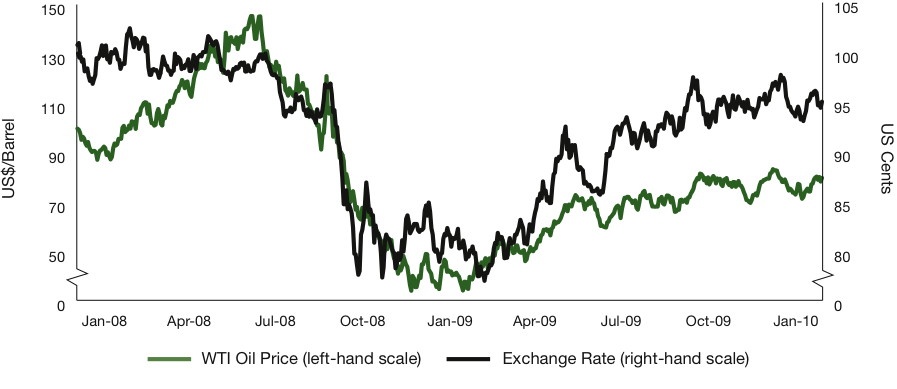
The value of the Canadian dollar tumbled alongside commodity prices early last year, but rebounded quickly in the second half of 2009 as commodity prices began to improve. The value of the Canadian dollar rose from an average of 79.4 US cents in March 2009 to 94.9 US cents in December 2009. For the year, it averaged 88.0 US cents.
CANADIAN ECONOMIC ASSUMPTIONS
| | 2009 Actual | | | 2010 | | | | 2011 | | | | 2012 | | | | 2013 | | | | 2014 | |
| Real GDP Growth (%) | (2.6 | ) | | 2.2 | | | | 3.5 | | | | 3.6 | | | | 3.2 | | | | 2.9 | |
| CPI Growth (%) | 0.3 | | | 1.6 | | | | 2.0 | | | | 2.0 | | | | 2.0 | | | | 2.0 | |
| Interest Rates (%) | | | | | | | | | | | | | | | | | | | | | |
Short-term1 | 0.33 | | | 0.27 | | | | 1.59 | | | | 3.08 | | | | 4.13 | | | | 4.69 | |
Long-term2 | 3.23 | | | 3.65 | | | | 4.07 | | | | 4.64 | | | | 4.93 | | | | 5.64 | |
| Canadian Dollar (US cents) | 88.0 | | | 95.5 | | | | 95.5 | | | | 94.5 | | | | 94.5 | | | | 94.5 | |
| | 2 | 10-year Government of Canada Bond |
30 Budget 2010-11 | Budget Summary
CANADIAN DOLLAR
Source: Bank of Canada, Ministry of Finance
Private sector forecasters disagree on how quickly and how high the value of the Canadian dollar will rise. For 2010, for example, Canadian dollar forecasts range from 94.3 US cents (IHS Global Insight) to 100.8 US cents (Scotiabank).
The Canadian dollar is assumed to average 95.5 US cents in 2010.
Alberta’s 2010 budget assumed 95.0 US cents for 2010 while the 2010 federal budget included 95.5 US cents as a private sector average.
PRIVATE SECTOR FORECASTS OF THE CANADIAN DOLLAR
(Expressed in US Cents)
| | | | 2010 | | | | | |
| IHS Global Insight | | | 94.3 | | | 93.3 | | | Mar./10 | |
| Conference Board of Canada (CBOC) | | | 95.5 | | | 96.4 | | Jan./10 | |
Centre for Spatial Economics (C4SE) | | | 94.8 | | | 93.1 | | Jan./10 | |
| TD Bank | | | 95.5 | | | 94.8 | | | Feb./10 | |
| Royal Bank of Canada | | | 99.1 | | | 97.6 | | | Mar./10 | |
| Bank of Montreal | | | 98.2 | | | 101.4 | | | Mar./10 | |
| CIBC | | | 100.7 | | | 100.8 | | | Mar./10 | |
| Scotiabank | | | 100.8 | | | 104.4 | | | Mar./10 | |
| High | | | 100.8 | | | 104.4 | | | | |
| Low | | | 94.3 | | | 93.1 | | | | |
| Private Sector Average | | | 97.3 | | | 97.7 | | | | |
| Ministry of Finance | | | 95.5 | | | 95.5 | | | | |
COMMODITY PRICES
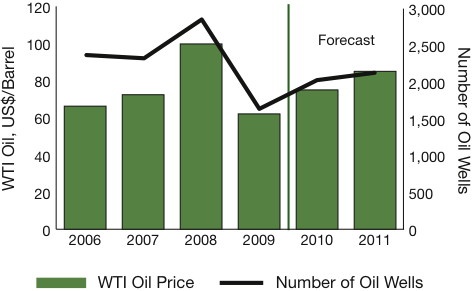
The price of West Texas Intermediate (WTI) oil is expected to average US$75.00 per barrel in 2010 and US$85.00 per barrel in 2011.
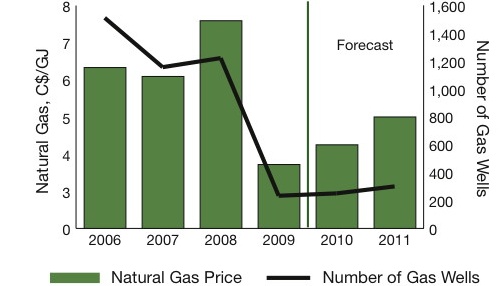
The price of natural gas is expected to average C$4.25 per gigajoule (GJ) in 2010 and C$5.00 per GJ in 2011.
NON-RENEWABLE RESOURCE PRICE ASSUMPTIONS
| | | | 2009 Actual | | | 2010 | | | 2011 | | | 2012 | | | 2013 | | | 2014 | |
| WTI Oil (US$/barrel) | | | 62.09 | | | 75.00 | | | 85.00 | | | 87.00 | | | 90.00 | | | 92.00 | |
| Natural Gas (C$/GJ) | | | 3.72 | | | 4.25 | | | 5.00 | | | 5.50 | | | 5.75 | | | 6.00 | |
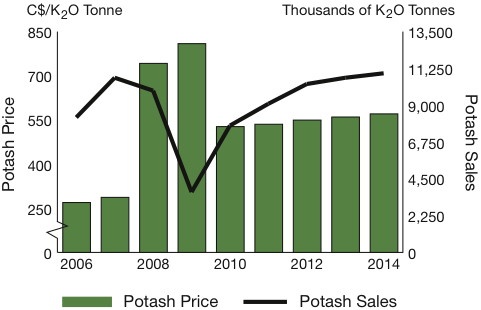
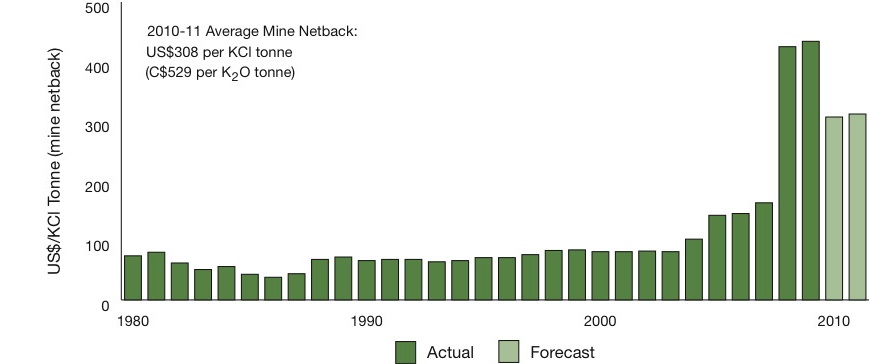
Potash1 (C$/K2O tonne) | | | 809.03 | | | 527.29 | | | 535.26 | | | 549.38 | | | 559.86 | | | 570.47 | |
Potash1 (US$/KCl tonne) | | | 434.19 | | | 307.17 | | | 311.82 | | | 316.69 | | | 322.73 | | | 328.85 | |
| 1 | The potash industry quotes prices in US dollars per KCl tonne. Provincial royalty calculations, however, are based on the Canadian dollar price per K2O tonne. |
| | Source: Ministry of Energy and Resources |
� 0; Budget Summary | Budget 2010-11 31
Oil and gas well drilling levels are expected to improve slightly this year and next due to higher prices.
OIL PRICES AND THE NUMBER OF
WELLS DRILLED IN SASKATCHEWAN
| | Source: Ministry of Energy and Resources |
NATURAL GAS PRICES AND THE NUMBER
OF WELLS DRILLED IN SASKATCHEWAN
| | Source: Ministry of Energy and Resources |
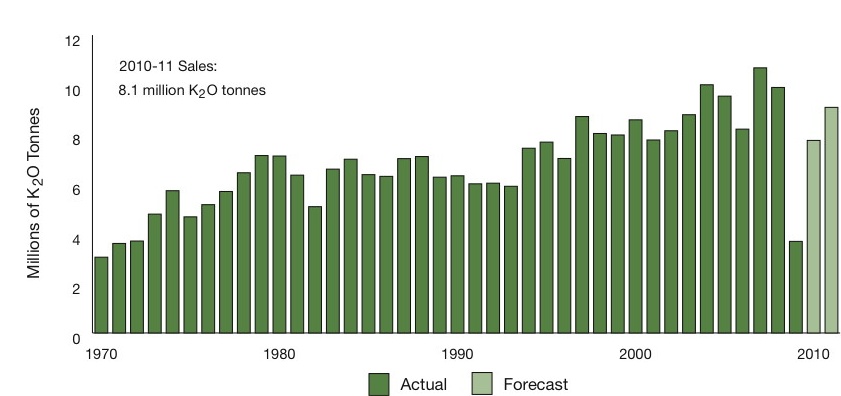
Saskatchewan potash sales fell by 63 per cent last year to roughly 3.7 million K2O tonnes, a level not seen since 1971.
POTASH PRICES AND SALES
| | Source: Ministry of Energy and Resources |
Despite this drop in demand, potash prices averaged C$809 per K2O tonne last year, roughly 10 per cent higher than in 2008.
For 2010, both domestic and offshore sales are expected to improve yet still remain well below 2008 levels.
Prices, on the other hand, are expected to ease. Recent contracts with both China and India were concluded at a price of about US$350 per KCl tonne, delivered. The current potash price assumption for 2010 is consistent with these developments.
For the most part, no significant change in major crop and livestock prices is expected for 2010.
MAJOR CROP AND LIVESTOCK PRICE ASSUMPTIONS
| | | | 2009 | | | 2010 | | | 2011 | | | 2012 | | | 2013 | | | 2014 | |
Wheat1 (C$/tonne) | | | 162.05 | | | 163.67 | | | 174.57 | | | 186.04 | | | 191.11 | | | 180.93 | |
Canola1 (C$/tonne) | | | 403.03 | | | 412.02 | | | 417.47 | | | 418.79 | | | 415.35 | | | 396.52 | |
Barley1 (C$/tonne) | | | 157.04 | | | 151.35 | | | 154.46 | | | 163.57 | | | 162.85 | | | 155.56 | |
| Cattle (C$/cwt) | | | 82.40 | | | 83.74 | | | 84.08 | | | 85.74 | | | 85.80 | | | 85.80 | |
| Hogs (C$/ckg) | | | 125.21 | | | 134.95 | | | 131.88 | | | 132.57 | | | 133.39 | | | 131.14 | |
| | 1 | Crop price assumptions are on a crop year basis. |
| | Source: Ministry of Agriculture |
32 Budget 2010-11 | Budget Summary
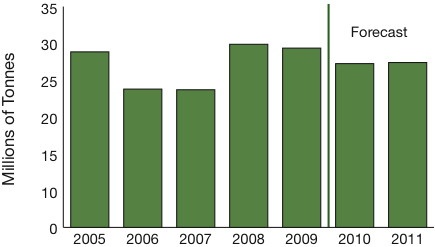
Saskatchewan farmers harvested 29.3 million tonnes in 2009, 20.9 per cent more than the 10-year average. The current forecast assumes roughly 27.0 million tonnes in 2010.
SASKATCHEWAN CROP PRODUCTION
Source: Ministry of Agriculture
SASKATCHEWAN’S ECONOMIC OUTLOOK
Saskatchewan real GDP is forecast to grow by 2.6 per cent this year and 3.3 per cent in 2011.
SASKATCHEWAN FORECAST SUMMARY
| | | | 2009 | | | 2010 | | | 2011 | | | 2012 | | | 2013 | | | 2014 | |
| Real GDP Growth (%) | | | (1.6 | ) | | 2.6 | | | 3.3 | | | 2.0 | | | 1.9 | | | 1.5 | |
| Nominal GDP Growth (%) | | | (12.5 | ) | | 3.8 | | | 10.0 | | | 6.2 | | | 5.4 | | | 4.5 | |
| CPI Growth (%) | | | 1.1 | 1 | | 2.1 | | | 2.8 | | | 3.1 | | | 3.2 | | | 3.4 | |
| Employment Growth (000s) | | | 7.8 | 1 | | 4.1 | | | 3.9 | | | 4.6 | | | 4.7 | | | 5.6 | |
| Unemployment Rate (%) | | | 4.8 | 1 | | 5.0 | | | 4.9 | | | 4.6 | | | 4.3 | | | 3.7 | |
| Personal Income Growth (%) | | | 1.1 | | | 1.2 | | | 5.1 | | | 4.7 | | | 5.0 | | | 5.0 | |
| Retail Sales Growth (%) | | | (2.3 | )1 | | 5.7 | | | 4.3 | | | 5.1 | | | 5.0 | | | 5.2 | |
| | Source: Statistics Canada, Ministry of Finance |
SASKATCHEWAN GDP GROWTH
| | Source: Ministry of Finance |
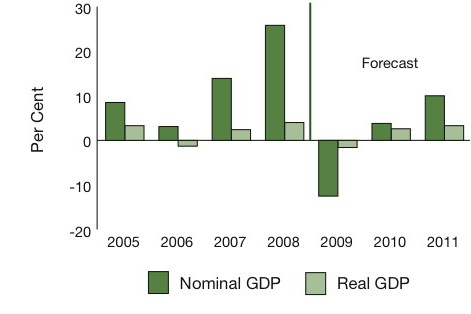
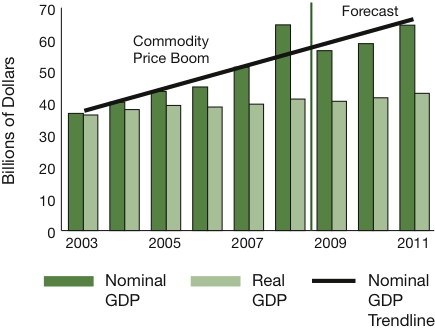
Nominal GDP is forecast to grow by 3.8 per cent this year and 10.0 per cent in 2011. The 10.0 per cent growth rate forecast for 2011 is driven by both increases in real economic activity as well as higher commodity prices.
� 0; Budget Summary | Budget 2010-11 33
SASKATCHEWAN GDP
| | Source: Ministry of Finance |
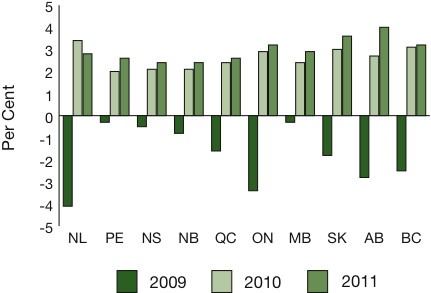
The private sector is similarly optimistic concerning Saskatchewan’s economy this year and next.
Private sector forecasts of Saskatchewan real GDP growth in 2010 range from a high of 3.6 per cent to a low of 2.3 per cent.
PRIVATE SECTOR REAL GDP GROWTH FORECASTS FOR SASKATCHEWAN
(Per Cent Change)
| | | | 2009 | | | 2010 | | | 2011 | | | Release Date | |
| IHS Global Insight | | | | (1.4 | ) | | 3.1 | | | 3.8 | | | Jan./10 | |
| CBOC | | | | (4.2 | ) | | 2.5 | | | 2.9 | | | Feb./10 | |
C4SE | | | | (0.7 | ) | | 2.4 | | | 3.2 | | | Jan./10 | |
| TD Bank | | | | (1.1 | ) | | 2.3 | | | 3.1 | | | Nov./09 | |
| Royal Bank of Canada | | | | (3.0 | ) | | 3.6 | | | 4.6 | | | Mar./10 | |
| Bank of Montreal | | | | (2.0 | ) | | 3.5 | | | 3.8 | | | Mar./10 | |
| CIBC | | | | (2.1 | ) | | 3.5 | | | 4.0 | | | Mar./10 | |
| Scotiabank | | | | (1.8 | ) | | 3.4 | | | 3.3 | | | Mar./10 | |
| Laurentian | | | | (0.3 | ) | | 3.0 | | | 3.5 | | | Feb./10 | |
| High | | | | (0.3 | ) | | 3.6 | | | 4.6 | | | | |
| Low | | | | (4.2 | ) | | 2.3 | | | 2.9 | | | | |
| Private Sector Average | | | | (1.8 | ) | | 3.0 | | | 3.6 | | | | |
| Ministry of Finance | | | | (1.6 | ) | | 2.6 | | | 3.3 | | | | |
Job growth is expected to continue over the forecast period. The Ministry of Finance is forecasting total employment to rise by 4,100 this year. In comparison, the private sector (on average) is forecasting total employment to rise by 5,100.
SASKATCHEWAN EMPLOYMENT
Source: Private Sector Forecasters, Ministry of Finance, Statistics Canada
34 Budget 2010-11 | Budget Summary
Saskatchewan’s unemployment rate is expected to remain well below the national average over the forecast period.
SASKATCHEWAN AND CANADA
UNEMPLOYMENT RATE
| | Source: Statistics Canada, Ministry of Finance |
Continued gains in employment, particularly those in the province’s goods producing sectors, and a continuation of low interest rates and improved consumer confidence are expected to help lift consumer spending this year, providing an added boost to the Saskatchewan economy.
SASKATCHEWAN RETAIL SALES
| | Source: Statistics Canada, Ministry of Finance |
Growth of the provincial economy is also anticipated to come from higher potash sales and production as well as business investment.
Respecting the latter, 2010 is expected to see increased oil and gas well drilling (due to higher prices and a generally improving investment climate since the financial crisis of 2008 and 2009) and increased investment related to existing potash mine expansions.
The fact that all of the potash mine expansions are proceeding on schedule in light of the global economic slowdown and fall-off in sales last year is indicative of the confidence that remains among producers in the future of potash markets worldwide.
While all provincial economies are anticipated to post positive growth this year, the private sector expects Saskatchewan’s economy to post the third-highest growth in 2010.
PRIVATE SECTOR FORECASTS OF
REAL GDP GROWTH BY PROVINCE
Source: Major Canadian banks, Global Insight, CBOC, C4SE
� 60; Budget Summary | Budget 2010-11 35
PRIVATE SECTOR FORECASTS OF REAL GDP GROWTH BY PROVINCE 1
(Per Cent Change)
| | | 2009 | | | 2010 | | | 2011 | |
| NL | | | (4.1 | ) | | | 3.4 | | | | 2.8 | |
| PE | | | (0.3 | ) | | | 2.0 | | | | 2.6 | |
| NS | | | (0.5 | ) | | | 2.1 | | | | 2.4 | |
| NB | | | (0.8 | ) | | | 2.1 | | | | 2.4 | |
| QC | | | (1.6 | ) | | | 2.4 | | | | 2.6 | |
| ON | | | (3.4 | ) | | | 2.9 | | | | 3.2 | |
| MB | | | (0.3 | ) | | | 2.4 | | | | 2.9 | |
| SK | | | (1.8 | ) | | | 3.0 | | | | 3.6 | |
| AB | | | (2.8 | ) | | | 2.7 | | | | 4.0 | |
| BC | | | (2.5 | ) | | | 3.1 | | | | 3.2 | |
| Canada | | | (2.6 | ) | | | 2.8 | | | | 3.1 | |
| 1 | The percentages shown in the table are the average of private sector forecasts as of March 15, 2010. Private sector includes major |
| | Canadian banks, Global Insight, CBOC and C4SE. |
CONCLUSION
The Saskatchewan economy is forecast to grow by 2.6 per cent this year and 3.3 per cent in 2011.
As with all forecasts, this one is based on a set of assumptions, including those concerning commodity production and prices, Canadian and U.S. economic growth and the value of the Canadian dollar.
Stimulus measures have been a major contributor to the global economic recovery. The speed and timing of stimulus withdrawal as well as interest rate hikes, therefore, pose a risk to the recovery. In turn, this poses a risk for the Saskatchewan economic forecast.
The Saskatchewan harvest is either an opportunity or a risk. The current forecast assumes a return to more normal crop levels.
36 Budget 2010-11 | Budget Summary
General Revenue Fund
Financial Outlook
INTRODUCTION
The 2010-11 Budget represents the third year under The Growth and Financial Security Act. The Act requires a four-year financial plan in which total General Revenue Fund (GRF) expense must balance with or be less than total GRF revenue each year.
GRF REVENUE OVERVIEW
In recent years, revenue growth has been stronger than long-run trends.
Between 2003-04 and 2008-09, GRF revenue growth averaged 13.4 per cent compared to 4.4 per cent over the 1980-81 to 2003-04 period. Annual non-renewable resource revenue growth averaged 28.1 per cent between 2003-04 and 2008-09 compared to 2.3 per cent prior to 2003-04.
AVERAGE ANNUAL GRF REVENUE GROWTH
Strong revenue growth in recent years has been accompanied by increased volatility, reflecting underlying volatility in external factors, particularly resource prices.
Between 2003-04 and 2008-09, annual changes in non-renewable resource revenue ranged from a low of -7.5 per cent to a high of 74.7 per cent, while total GRF revenue growth rates ranged from a low of 1.6 per cent to 25.2 per cent.
Soaring resource prices reversed in late 2008 and into 2009 as the global economy entered recession. In 2009-10, non-renewable resource revenue declined 61.8 per cent, or $2.8 billion, from 2008-09. Total GRF revenue declined $2.3 billion, or 18.6 per cent, as the drop in non-renewable resource revenue was partially offset by higher tax revenue, particularly income taxes, and a higher dividend from the Crown Investments Corporation of Saskatchewan (CIC).
� 60; Budget Summary | Budget 2010-11 37
ANNUAL GRF REVENUE GROWTH
2003-04 to 2009-10
2010-11 GRF REVENUE
In 2010-11, GRF revenue is forecast to decrease $76.8 million (0.8 per cent) from the 2009-10 forecast. The decline in 2010-11 is the result of:
| · | a $477.9 million decrease in transfers from Crown Entities, primarily due to a $479.0 million reduction in total CIC dividends; |
| · | a $115.1 million decrease in other own-source revenue; |
| · | a $344.2 million increase in non-renewable resource revenue; |
| · | a $93.3 million increase in transfers from the Government of Canada; and, |
| · | a $78.7 million increase in tax revenue. |
COMPOSITION OF 2010-11 GRF REVENUE
38 Budget 2010-11 | Budget Summary
2010-11 GRF REVENUE RECONCILIATION
By Major Revenue Source
| (Millions of Dollars) | | | |
| 2009-10 GRF Revenue Forecast | | | 10,026.7 | |
| CIC Dividends | | | (479.0 | ) |
| Interest Earnings | | | (91.0 | ) |
| Oil Royalties | | | (90.0 | ) |
| Resource Surcharge | | | (42.1 | ) |
| Potash Royalties | | | 424.9 | |
| Federal Transfers | | | 93.3 | |
| Tax Revenue | | | 78.7 | |
| Crown Land Sales | | | 51.4 | |
| Other Changes | | | (23.0 | ) |
| | | | | |
| Revenue Changes | | | (76.8 | ) |
| | | | | |
| 2010-11 GRF Revenue Estimate | | | 9,949.9 | |
Tax Revenue
Tax revenue is forecast to be $4.9 billion in 2010-11, an increase of $78.7 million (1.6 per cent) from the 2009-10 forecast.
| · | Provincial Sales Tax (PST) revenue is forecast to increase $55.7 million in 2010-11 as the result of continued growth in personal and business spending. |
| · | Individual Income Tax is forecast to increase $75.0 million in 2010-11 as the result of growth in taxable income, partially offset by a decline in expected prior-year reconciliation payments compared to the previous year. |
| · | Tobacco Tax revenue is forecast to increase $35.7 million as a result of new initiatives in 2010-11. Increases in tobacco tax rates are |
2010-11 GRF REVENUE RECONCILIATION
By Major Factor
| (Millions of Dollars) | | | |
2009-10 GRF Revenue Forecast | | | 10,026.7 | |
| Change in total CIC dividends | | | (479.0 | ) |
| Improvement in Saskatchewan economy in 2010-11 | | | 255.1 | |
| Increase in Federal Transfers | | | 93.3 | |
| Tobacco Tax initiatives and SLGA price increases | | | 53.8 | |
| | | | | |
| Revenue Changes | | | (76.8 | ) |
| | | | | |
| 2010-11 GRF Revenue Estimate | | | 9,949.9 | |
� 0; Budget Summary | Budget 2010-11 39
estimated to result in an additional $23.8 million in revenue. The introduction of a one carton per week quota for the purpose of rebates paid to First Nations retailers is expected to result in an additional $11.9 million in 2010-11.
| · | Other Taxes are forecast to increase $20.3 million in 2010-11. Corporation Capital Tax (CCT) revenue will increase $12.4 million, largely due to refunds issued in 2009-10 related to prior-year overpayments. Liquor Consumption Tax revenue is forecast to increase $5.9 million due to anticipated growth in population and incomes as well as increases in SLGA liquor mark-ups. |
| · | Fuel Tax revenue is forecast to increase $9.7 million from 2009-10 on the basis of continued growth in the Saskatchewan economy. |
| · | Corporation Income Tax (CIT) is forecast to decrease $117.7 million from 2009-10. The decrease is primarily due to the receipt in 2009-10 of a large prior-year adjustment payment and one-time revenue related to accelerated federal payments. |
Non-Renewable Resource Revenue
Non-renewable resource revenue is forecast to increase $344.2 million (19.5 per cent) in 2010-11 to $2.1 billion. The increase is due to growth in potash, Crown land sales and natural gas, partially offset by lower revenue from oil, the Resource Surcharge and other non-renewable resources.
FISCAL-YEAR NON-RENEWABLE RESOURCE FORECAST ASSUMPTIONS
| | | 2009-10 Budget | | | 2009-10 Forecast | | | 2010-11 Budget | |
| Natural Gas Price (fieldgate, C$/GJ) | | | 6.63 | | | | 3.55 | | | | 4.40 | |
| Natural Gas Production (billion cubic feet) | | | 231.1 | | | | 214.2 | | | | 188.7 | |
| WTI Oil Price (US$/barrel) | | | 48.75 | | | | 69.78 | | | | 77.50 | |
| Oil Production (million barrels) | | | 157.0 | | | | 148.7 | | | | 148.6 | |
Potash Price (mine netback, C$/K2O tonne) | | | 1,071 | | | | 739 | | | | 529 | |
| Potash Price (mine netback, US$/KCl tonne) | | | 556 | | | | 413 | | | | 308 | |
Potash Sales (million K2O tonnes) | | | 10.3 | | | | 4.7 | | | | 8.1 | |
| Canadian Dollar (US cents) | | | 85.13 | | | | 91.65 | | | | 95.50 | |
| · | Crown land sales are forecast to increase $51.4 million in 2010-11 as the result of increasing interest in land related to higher forecasts for oil and gas prices. The final sale of 2009-10 in February generated $39.5 million, the second highest total for a sale in February. This upward trend is expected to continue in 2010-11. |
| · | Natural gas revenue is forecast to be relatively flat in 2010-11. Fieldgate prices are forecast to average $4.40 per gigajoule (GJ), up from $3.55 per GJ in 2009-10. However, production is forecast to decline by 12 per cent in 2010-11, largely as the result of lower drilling activity. The result is a $3.2 million increase in natural gas revenue in 2010-11. |
| · | Oil revenue is forecast to decrease $90.0 million in 2010-11. While West Texas Intermediate (WTI) oil prices are forecast to rise in 2010-11, increases in the exchange rate, the light-heavy differential and the percentage of oil receiving lower royalty rates result in a lower royalty forecast. Oil royalties are forecast at $1,098.3 million in 2010-11. |
40 Budget 2010-11 | Budget Summary
NON-RENEWABLE RESOURCE REVENUE AS A SHARE OF GRF REVENUE
WTI oil prices are forecast to average US$77.50 per barrel in 2010-11, up from US$69.78 per barrel in 2009-10. Production is forecast to remain flat at 148.6 million barrels in 2010-11 but the average royalty rate is forecast to fall from 12.5 per cent in 2009-10 to 11.4 per cent. This decrease is due to declining well productivities and an increase in the percentage of oil production receiving lower Fourth Tier royalty/tax rates.
| · | The value of the Canadian dollar is anticipated to increase to an average of 95.5 US cents in 2010-11, 3.9 US cents higher than 2009-10. The higher exchange rate reduces Canadian dollar prices for resources sold in US dollars, including oil, potash and uranium. |
WTI OIL PRICES AND EXCHANGE RATE
| · | The outlook for the potash sector improved over the final quarter of 2009-10 and this upward trend is forecast to lead to a recovery in royalties in 2010-11. Potash royalties are forecast at $221.0 million in 2010-11, an increase of $424.9 million from 2009-10. The increase is primarily due to a higher sales volumes forecast, partially offset by lower prices. |
Sales in 2009 are currently estimated at 3.7 million K2O tonnes, the lowest level since 1971. Recent sales by the Saskatchewan industry to major markets such as India and China, as well as reported growth in North American demand, are signs that the sector is recovering from the impact of the global recession.
� 0; Budget Summary | Budget 2010-11 41
SASKATCHEWAN POTASH SALES
On a fiscal-year basis, potash sales are forecast at 8.1 million K2O tonnes in 2010-11. This outlook is consistent with the general consensus in the private sector that price certainty has returned to the market and 2010 will see a recovery in global demand. However, the forecast assumes that sales will not reach pre-recession peaks in the short term.
Average prices were the highest on record in 2009 despite the global recession and unprecedented decline in sales volumes, but prices at the end of the year were much lower than prices at the beginning of the year.
The revenue forecast assumes that average prices in 2010 will be lower than in 2009 as recent contract prices become entrenched for the medium term. As a result, the average Saskatchewan mine netback in 2010-11 is forecast at C$529 per K2O tonne (US$308 per KCl tonne). This price assumption is consistent with external analysis and recent contract prices after accounting for transportation and delivery costs.
SASKATCHEWAN POTASH PRICES
| · | Resource Surcharge revenue is forecast to decrease by $42.1 million in 2010-11. Revenue in 2009-10 remained strong due to catch-up payments related to 2008. These reconciliation payments are not expected to repeat in 2010-11. |
| · | Other non-renewable resource revenue, including coal, uranium and other minerals, is forecast to decrease by $3.2 million in 2010-11. |
42 Budget 2010-11 | Budget Summary
Transfers from Crown Entities
Transfers from Crown Entities are forecast to decline by $477.9 million (38.3 per cent) in 2010-11.
The majority of the decrease is related to lower CIC dividends. Special dividends are forecast to decrease by $560.0 million. The regular dividend has been targeted at $266.0 million, an increase of $81.0 million over 2009-10.
Net income at SLGA is forecast to increase $18.3 million in 2010-11, largely as the result of increased mark-ups on alcoholic beverages.
Transfers from other enterprises and funds are forecast to fall $17.2 million, primarily due to the receipt of a one-time payment in 2009-10 from the Saskatchewan Housing Corporation for the Rental Housing Supplements program.
Other Own-Source Revenue
Other own-source revenue is forecast to be $514.5 million in 2010-11, a decrease of $115.1 million (18.3 per cent) from 2009-10. Interest earnings are forecast to decrease by $91.0 million, largely as the result of a smaller Growth and Financial Security Fund (GFSF) balance in 2010-11. Sales, Services and Service Fees revenue is forecast to decline by $11.1 million, primarily due to lower Crown agricultural land sales.
Federal Transfers
Total transfers from the Government of Canada are anticipated to increase by $93.3 million (5.8 per cent) in 2010-11.
Total transfers under the Canada Social Transfer (CST) and Canada Health Transfer (CHT) are down by a combined $0.1 million from 2009-10. CST funding will increase $7.4 million but CHT funding will decline $7.5 million as the result of increases in the value of Saskatchewan tax points associated with a strong economy in recent years.
Federal funding under existing and anticipated cost-sharing arrangements is expected to increase $93.4 million in 2010-11.
RISKS TO THE 2010-11 FORECAST
Economic Activity
There is a strong correlation between economic activity in Saskatchewan and GRF own-source revenue.
The provincial economic forecast relies on a set of assumptions regarding the performance of the Canadian, U.S. and global economies, including non-renewable resource prices. A slower-than-expected global recovery would negatively impact provincial revenue, particularly tax and non-renewable resource revenue.
Nominal GDP is forecast to grow by 3.8 per cent in 2010. A one percentage point change in this growth rate, all else equal, is estimated to change GRF own-source revenue by $90 million. However, the impact may not be fully realized in 2010-11 due to several factors, including lags in the receipt of revenue in certain revenue bases (for example, Corporation Income Tax and the Resource Surcharge).
Non-Renewable Resource Prices
Prices for Saskatchewan’s non-renewable resources, including oil, natural gas, potash, and uranium, are volatile and beyond the control of government. For example:
� 0; Budget Summary | Budget 2010-11 43
| · | WTI oil prices fell from US$134 (per barrel) in June 2008 to US$39 in February 2009 before doubling to US$78 by November 2009; and, |
| · | potash prices increased from less than US$200 (per KCl tonne, delivered) prior to 2007 to as high as US$1,000 in 2008 before falling to the US$350 range in recent months. |
As a result, forecasting non-renewable resource revenue is difficult. To minimize risk, revenue estimates are derived by incorporating current market information and private sector outlooks, including the use of private sector averages where possible.
The use of private sector forecasts is best practice. However, it does not guarantee that these forecasts will be correct. For example, WTI oil prices averaged US$62.09 per barrel in 2009, more than 30 per cent higher than the private sector average at the time of the 2009-10 Budget (US$48.00 per barrel).
For the current fiscal year, it is estimated that:
| · | a US$1 per barrel change in the annual WTI oil price results in an estimated $18.4 million change in oil royalties; |
| · | a $1 per gigajoule change in the annual fieldgate price results in an estimated $13.0 million change in natural gas royalties; and, |
| · | a US$10 per KCl tonne (C$17 per K2O tonne) change in the average 2010 potash mine netback results in an approximate $15.0 million change in potash royalties. |
Exchange Rate
Movements in the exchange rate impact the provincial economy and government revenue in several ways.
With respect to non-renewable resource revenue, a higher value of the Canadian dollar, vis-à-vis the US dollar, reduces the Canadian dollar price of commodities sold in US dollars and provincial royalties.
The 2010-11 exchange rate assumption is 95.5 US cents. A one US cent increase/decrease in the value of the Canadian dollar results in an estimated $21.0 million decrease/increase in non-renewable resource revenue, all else equal.
GRF REVENUE
1990-91 to 2013-14
44 Budget 2010-11 | Budget Summary
MEDIUM-TERM GRF
REVENUE OUTLOOK
GRF revenue is forecast to increase by an average of 3.4 per cent per year over the forecast period, lower than both long-run trends and anticipated nominal GDP growth over the medium term.
For comparison, GRF revenue increased by 4.5 per cent annually over the 2000-01 to 2009-10 period and 4.1 per cent annually over the 1990-91 to 2009-10 period.
The current outlook results in a GRF revenue forecast of $11.0 billion in 2013-14.
Tax revenue is forecast to increase at an annual rate of 4.1 per cent and to account for roughly 49 per cent of total revenue over the medium term. By 2013-14, tax revenue is projected to account for 7.6 per cent of the provincial economy, down from 8.6 per cent in 2007-08.
Over the next four years, increasing resource prices and sales volumes are forecast to result in 9.1 per cent annual growth in non-renewable resource revenue. This is 40 per cent lower than the 15.3 per cent annual growth rate experienced over the ten-year period prior to 2008-09.
By 2013-14, non-renewable resource revenue is forecast to account for 24.7 per cent of total GRF revenue, approximately the same share as the 2005-06 to 2006-07 period, but well below the high of 37.4 per cent in 2008-09.
NON-RENEWABLE RESOURCE REVENUE AS A SHARE OF GRF REVENUE
MEDIUM-TERM NON-RENEWABLE RESOURCE FORECAST ASSUMPTIONS
| | | | 2009-10 | | | | 2010-11 | | | | 2011-12 | | | | 1012-13 | | | | 2013-14 | |
| Natural Gas Price (fieldgate, C$/GJ) | | | 3.55 | | | | 4.40 | | | | 5.21 | | | | 5.56 | | | | 5.82 | |
| Natural Gas Production (billion cubic feet) | | | 214.2 | | | | 188.7 | | | | 173.6 | | | | 163.8 | | | | 157.2 | |
| WTI Oil Price (US$/barrel) | | | 69.78 | | | | 77.50 | | | | 85.50 | | | | 87.75 | | | | 90.50 | |
| Oil Production (million barrels) | | | 148.7 | | | | 148.6 | | | | 151.1 | | | | 151.5 | | | | 150.0 | |
Potash Price (mine netback, C$/K2O tonne) | | | 739 | | | | 529 | | | | 539 | | | | 552 | | | | 563 | |
| Potash Price (mine netback, US$/KCl tonne) | | | 413 | | | | 308 | | | | 313 | | | | 318 | | | | 324 | |
Potash Sales (million K2O tonnes) | | | 4.7 | | | | 8.1 | | | | 9.4 | | | | 10.4 | | | | 10.7 | |
| Canadian Dollar (US cents) | | | 91.65 | | | | 95.50 | | | | 95.25 | | | | 94.50 | | | | 94.50 | |
� 60; Budget Summary | Budget 2010-11 45
Transfers from Crown Entities are expected to remain relatively flat over the medium term and average 7.1 per cent of total revenue. For comparison, transfers from the Crown sector averaged 7.8 per cent over the five-year period 2003-04 to 2007-08.
Other own-source revenue is forecast to decline by approximately two per cent per year over the medium term. The current outlook incorporates a gradual reduction in the unexpected miscellaneous and casual revenue amounts that have been realized in recent years.
With respect to federal transfers, the current outlook assumes increases in CHT and CST funding over the medium term. However, these increases are more than offset by reductions in other federal cost-sharing transfers primarily due to the winding down of federal stimulus programs. The medium-term forecast includes all existing federal-provincial agreements that are reasonably expected to continue. The timing of these funding streams is subject to some degree of uncertainty, particularly with respect to infrastructure projects.
GRF EXPENSE OVERVIEW
Government has signaled its interest in attaining a smaller footprint, re-focusing on core government programs, and improving the administration of programs and services within government and across the public sector, including regional health authorities, school divisions and post-secondary institutions.
All jurisdictions across the country are facing fiscal challenges. Alberta plans to eliminate about 250 civil service positions while British Columbia is projecting a reduction in the civil service of 11 per cent over three years. The federal government is also freezing departmental spending which will have an impact on the size of the civil service.
Saskatchewan began this process early last fiscal year with the first signs that revenue forecasts may not hold. The government implemented a process to find efficiencies throughout its operations, including delays in hiring staff and holding positions vacant.
The examination of government programs and services, ensuring their efficient delivery, continued during the development of this Budget. Budget decisions resulted in a reduction in the size of the public service through budget cuts of 198 full-time equivalents* (FTEs) and transfers of 45 FTEs to organizations not covered by The Public Service Act, offset by adding 24 new FTEs. The majority of employees impacted by cuts will be accommodated throughout the public service and will result in minimal job loss.
The government has established a four-year plan with a goal of reaching a 15 per cent reduction in the size of the public service through attrition. The budget reductions combined with this year’s attrition target of just over 2.5 per cent will lead to an overall 4 per cent (528.5 FTEs) shrinkage in 2010 -11. Many employees who retire or leave for other opportunities will not be replaced. Government is establishing a centralized review process to ensure that only critical positions will be staffed.
Government plans to improve its administrative and service delivery processes into the future, leading to a smaller, more effective and more efficient public service with its efforts focused on core government priorities. This will require careful consideration of the workforce to ensure services remain relevant, responsive and affordable while at the same time honouring the terms of public service collective agreements.
The government has created a $2.5 million Productivity Fund which is intended to provide support to initiatives
* A full-time equivalent is a measurement of paid hours of work divided by a standard number of hours a full-time
employee would be paid in a year (see 2010-11 Estimates Glossary of Terms for a more complete definition).
46 Budget 2010-11 | Budget Summary
that will allow the public service to realize further efficiencies. For example, investments in staff training and technology aids may allow for programs to operate with less staff. Investment in process improvement can make programs more effective.
2010-11 GRF EXPENSE
GRF expense is estimated to be $10.1 billion in 2010-11, reflecting achievement of an overall reduction of $121.3 million, or 1.2 per cent, compared to the 2009-10 Budget expense estimate, while providing for increases in areas such as Health, Municipal Affairs and Social Services.
2010-11 GRF Expense Allocation
GRF expense in 2010-11 will be allocated as follows:
| · | Health, $4.20 billion, or 41.5 per cent; |
| · | Education, $1.31 billion, or 13.0 per cent; |
| · | Advanced Education, Employment and Labour, $846.1 million, or 8.3 per cent; |
| · | Social Services, $753.7 million, or 7.4 per cent; |
| · | Debt Servicing, $435.0 million, or 4.3 per cent; |
| · | Highways and Infrastructure, $402.9 million, or 4.0 per cent; |
| · | Agriculture, $385.8 million, or 3.8 per cent; and, |
| · | remaining ministries and agencies, $1.79 billion, or about 17.7 per cent. |
This allocation represents a shifting of the shares, relative to the 2009-10 Budget, from Agriculture (down 0.9 percentage points), debt servicing (down 0.6 percentage points), Education (down 0.3 percentage points) and Highways and Infrastructure (down 0.3 percentage points) to Health (up 1.7 percentage points) and Social Services (up 0.4 percentage points).
2010-11 GRF EXPENSE RECONCILIATION
| (Millions of Dollars) | | | |
| | | | |
| 2009-10 Budget GRF Expense Estimate | | | 10,245.4 | |
| Agriculture | | | (97.2 | ) |
| Finance Debt Servicing | | | (67.5 | ) |
Education1 | | | (61.2 | ) |
| Highways and Infrastructure | | | (33.7 | ) |
| Environment | | | (25.7 | ) |
| Tourism, Parks, Culture and Sport | | | (20.5 | ) |
| Health | | | 126.9 | |
| Municipal Affairs | | | 38.3 | |
| Social Services | | | 34.4 | |
| Corrections, Public Safety and Policing | | | 12.7 | |
| Other Net Changes | | | (27.8 | ) |
| Expense Changes | | | (121.3 | ) |
| 2010-11 Budget GRF Expense Estimate | | | 10,124.1 | |
| | 1 | Includes Teachers’ Pensions and Benefits |
� 60; Budget Summary | Budget 2010-11 47
COMPOSITION OF 2010-11 GRF EXPENSE
| | Education portion includes Ministries of Education and Advanced Education, Employment and Labour |
MEDIUM-TERM GRF EXPENSE OUTLOOK
Over the medium term, expense growth will be moderated by reducing the footprint of government, shrinking the size of the public service, modest compensation increases, and a continued focus on efficient and effective service delivery across the public sector.
Expense growth is targeted at 1.0 per cent in 2011-12 and 2.0 per cent in 2012-13 and 2013-14. By the end of the four-year period, GRF expense is forecast at $10.6 billion, cumulatively, expenses are forecast to be $5.3 billion less than forecast in the 2009-10 Budget.
COMPARISON OF GRF EXPENSE FORECASTS
2010-11 to 2013-14
48 Budget 2010-11 | Budget Summary
FOUR-YEAR FINANCIAL PLAN
The Growth and Financial Security Act requires a four-year financial plan that sets out the Government’s plan for expense, revenue and debt. Government general public debt is presented in this section.
The GRF is estimated to have a surplus of $20.0 million in 2010-11 after a transfer of $194.2 million from the GFSF to fund government-owned capital.
Over the medium term, revenue growth of 1.5 per cent in 2011-12, 4.2 per cent in 2012-13 and 4.4 per cent in 2013-14 will accommodate expense growth of 1.0 per cent in 2011-12 followed by 2.0 per cent growth over the remainder of the forecast period.
Pre-transfer surpluses and net transfers to the GFSF are forecast for 2012-13 and 2013-14. By 2013-14, the GFSF is forecast to have a balance of $546.5 million.
Government general public debt will remain at $4.1 billion over the forecast period, unchanged from March 31, 2009.
GRF FOUR-YEAR FINANCIAL PLAN
| (Millions of Dollars) | | | 2010-11 | | | | 2011-12 | | | | 2012-13 | | | | 2013-14 | |
| Revenue | | $ | 9,949.9 | | | $ | 10,104.0 | | | $ | 10,531.8 | | | $ | 10,998.4 | |
| Expense | | | 10,124.1 | | | | 10,225.3 | | | | 10,429.8 | | | | 10,638.4 | |
| Pre-transfer Surplus (Deficit) | | | (174.2 | ) | | | (121.3 | ) | | | 102.0 | | | | 360.0 | |
| Transfer to GFSF | | | – | | | | – | | | | (51.0 | ) | | | (180.0 | ) |
| Transfer from GFSF | | | 194.2 | | | | 171.3 | | | | 24.0 | | | | – | |
Net Transfer from (to) GFSF | | | 194.2 | | | | 171.3 | | | | (27.0 | ) | | | (180.0 | ) |
GRF Surplus | | $ | 20.0 | | | $ | 50.0 | | | $ | 75.0 | | | $ | 180.0 | |
GFSF Balance | | $ | 510.8 | | | $ | 339.5 | | | $ | 366.5 | | | $ | 546.5 | |
Government General Public | | | | | | | | | | | | | | | | |
| Debt (Billions of Dollars) | | $ | 4.1 | | | $ | 4.1 | | | $ | 4.1 | | | $ | 4.1 | |
� 60; Budget Summary | Budget 2010-11 49
General Revenue Fund
2009-10 Financial Update
The General Revenue Fund (GRF) fiscal situation in 2009-10 is unchanged from the forecast presented in the 2009-10 Third Quarter Financial Report. While additional expense has been allocated for school capital at the Ministry of Education since the third quarter forecast, this increase has been fully offset by savings in Teachers’ Pensions and Benefits such that total expense is unchanged.
Specifically, the current forecast includes:
| · | a $634.1 million decline in revenue from budget, primarily due to lower-than-budgeted potash royalties, partially offset by higher-than-budgeted oil revenue, income tax revenue and Crown transfers; |
| · | a $133.1 million reduction in expense from budget, primarily due to lower-than-budgeted expense in Health, Agriculture, Teachers’ Pensions and Benefits, and debt-servicing costs, partially offset by higher-than-budgeted expense in Municipal Affairs, Social Services and Advanced Education, Employment and Labour; |
| · | a pre-transfer deficit of $85.6 million; |
| · | a net transfer of $510.1 million from the Growth and Financial Security Fund (GFSF), an increase of $501.0 million from budget; and, |
| · | no change in the budgeted $424.5 million GRF surplus. |
The GFSF balance at the end of 2009-10 is forecast to be $705.0 million.
GRF 2009-10 FINANCIAL FORECASTS
| (Millions of Dollars) | | | Budget Estimate | | | | 1st Quarter Forecast | | | | Mid-Year Projection | | | | 3rd Quarter Forecast | | | | Change from Budget | |
| Revenue | | $ | 10,660.8 | | | $ | 10,102.4 | | | $ | 9,872.9 | | | $ | 10,026.7 | | | $ | (634.1 | ) |
| Expense | | | 10,245.4 | | | | 10,052.4 | | | | 10,012.7 | | | | 10,112.3 | | | | (133.1 | ) |
Pre-transfer Surplus (Deficit) | | | 415.4 | | | | 50.0 | | | | (139.8 | ) | | | (85.6 | ) | | | (501.0 | ) |
| Transfer to GFSF | | | (207.7 | ) | | | (25.0 | ) | | | – | | | | – | | | | 207.7 | |
| Transfer from GFSF | | | 216.8 | | | | 399.5 | | | | 564.3 | | | | 510.1 | | | | 293.3 | |
| Net Transfer from | | | | | | | | | | | | | | | | | | | | |
| (to) GFSF | | | 9.1 | | | | 374.5 | | | | 564.3 | | | | 510.1 | | | | 501.0 | |
| GRF Surplus | | | 424.5 | | | | 424.5 | | | | 424.5 | | | | 424.5 | | | | – | |
| GFSF Balance* | | $ | 1,215.1 | | | $ | 840.6 | | | $ | 650.8 | | | $ | 705.0 | | | $ | (510.1 | ) |
* Budget Estimate reflects 2008-09 year-end balance.
50 Budget 2010-11 | Budget Summary
Saskatchewan’s Tax Expenditures
INTRODUCTION
Although the primary purpose of taxation is to raise revenue, governments also attain some of their social and economic goals by reducing the taxes paid by certain taxpayers. These reductions are commonly called “tax expenditures” and include such measures as exemptions, deductions, tax credits, preferential tax rates or deferrals. Each provides special or preferential treatment to certain taxpayers or to certain types of activity. Taken together, they provide assistance to a variety of individuals and businesses, including families, farmers, senior citizens and small businesses.
While tax expenditures are usually absorbed in the overall revenue estimates and are not presented in the same way as direct spending programs, they reduce the amount of revenue generated by a government and they affect a government’s fiscal position in the same way as direct expenditures.
THE RATIONALE FOR TAX EXPENDITURES
Tax expenditures can achieve a number of objectives, such as enhancing the fairness of the tax system or promoting certain types of economic activity. In pursuing these objectives, some tax expenditures have become fundamental elements of the tax system.
Saskatchewan’s sales tax does not apply to certain basic items such as food, residential natural gas, residential electricity, children’s clothing and reading materials, thereby reducing the taxes paid by families consuming these basic items. This treatment is in contrast to the federal Goods and Services Tax (GST) and the sales taxes of provinces that have harmonized their sales taxes with the GST, since those taxes apply to a much broader range of goods and services purchased by families.
In recognition of the importance of agriculture to Saskatchewan, the Province’s Fuel Tax exemption provides tax-free treatment to farm-use diesel fuel, through a fuel-colouring program, and a partial exemption of farm-use gasoline when purchased in bulk.
Saskatchewan’s personal income tax system applies provincial marginal tax rates directly to taxable income as defined for federal income tax purposes. As a result, deductions that contribute to the federal determination of taxable income, such as the deduction for Registered Retirement Savings Plan contributions, also affect Saskatchewan income tax revenue. The impacts of several of these deductions are estimated in this paper.
In addition, Saskatchewan’s personal income tax system has distinct provincial non-refundable income tax credits that recognize the personal circumstances of the taxpayer, including family-based credits, disability credits and educational credits. This paper also provides estimates of the revenue impacts of several of these provincial non-refundable tax credits.
To improve the distribution of corporate taxes, Saskatchewan levies a lower income tax rate on small businesses and a special income tax rate on manufacturing and processing (M&P) profits. Saskatchewan also provides a refundable Investment Tax Credit (ITC) to assist M&P companies that invest in qualifying new or used M&P assets for use in Saskatchewan, and a refundable Research and Development (R&D) Tax Credit to encourage innovation.
� 60; Budget Summary | Budget 2010-11 51
ASSOCIATED COSTS
While tax expenditures serve important social and economic objectives, the introduction of any tax expenditure results in associated costs. These costs take several forms.
| · | First, there is the cost of forgone revenue. Tax expenditures result in the reduction of revenue collected and have a significant impact on a government’s financial position. |
| · | Second, tax expenditures may add to the complexity of the tax system, leading to increased administrative effort by both taxpayers and governments. |
| · | Third, tax expenditures may create distortions in consumer and other economic behaviour. For example, the exemption for restaurant meals and snack foods provides preferential treatment for this category of consumer expenditure. |
| · | Finally, tax expenditures may create increased compliance costs for both businesses and consumers. |
GOVERNMENT OF CANADA TAX EXPENDITURES
The federal government produces a detailed presentation on tax expenditures that are part of the federal tax system.
Since Saskatchewan’s personal and corporate income taxes are based upon the federal definition of taxable income, many of the federal tax expenditures have an impact on Saskatchewan’s revenue. Readers interested in examining the federal government’s presentation of tax expenditures are invited to contact the Finance Canada Distribution Centre in Ottawa or visit the website www.fin.gc.ca (and click on “Publications”).
2010 SASKATCHEWAN TAX EXPENDITURES
The following tables provide estimates of the major tax expenditures of the Government of Saskatchewan in 2010, calculated using tax collection data and Statistics Canada data.
52 Budget 2010-11 | Budget Summary
2010 Government of Saskatchewan
Tax Expenditure Accounts
(Value of Tax Expenditures in Millions of Dollars)
| Exemptions | | | | |
| | | 1. | | Children’s clothing and footwear | | $ | 7.1 | |
| | | 2. | | Prescription drugs | | | 33.2 | |
| | | 3. | | Electricity | | | 32.2 | |
| | | 4. | | Farm machinery and repair parts | | | 44.7 | |
| | | 5. | | Fertilizer, pesticide and seed | | | 115.4 | |
| | | 6. | | Food | | | | |
| | | | | – Restaurant meals and snack foods | | | 57.0 | |
| | | | | – Basic groceries | | | 114.2 | |
| | | 7. | | Natural gas | | | 25.2 | |
| | | 8. | | Reading materials | | | 9.1 | |
| | | 9. | | Services | | | | |
| | | | | – Construction | | | 320.2 | |
| | | | | – Other | | | 28.7 | |
| | | 10. | | Used goods – exemption amounts | | | 0.9 | |
| | | 11. | | Light used vehicles | | | 54.9 | |
| | | 12. | | Direct agents | | | 19.1 | |
| | | 13. | | Eligible energy efficient appliances, furnaces and boilers | | | 2.8 | |
| | | 14. | | Toll-free telephone services | | | 0.3 | |
| | | 15. | | Municipal fire trucks | | | 0.1 | |
| | | 16. | | Mineral exploration equipment | | | 0.1 | |
| Fuel Tax | | | | |
| | 1. | | Exemption for farm activity | | $ | 100.9 | |
| | | 2. | | Exemption for heating fuels | | | 23.1 | |
| | | 3. | | Exemption for primary producers | | | 1.2 | |
| Personal Income Tax | | | | |
Deductions from Income | | | | |
| | | 1. | | Registered Pension Plan contributions | | $ | 75.8 | |
| | | 2. | | Registered Retirement Savings Plan contributions | | | 159.8 | |
| | | 3. | | Annual union, professional or like dues | | | 16.4 | |
| | | 4. | | Child care expenses | | | 7.9 | |
| | | 5. | | Moving expenses | | | 3.2 | |
| | | 6. | | Carrying charges | | | 14.3 | |
| | | 7. | | Allowable employment expenses | | | 15.7 | |
| | | 8. | | $750,000 capital gains deduction | | | 58.7 | |
Budget Summary | Budget 2010-11 53
| Saskatchewan Non-Refundable Tax Credits | | | |
| | | 1. | | Basic personal tax credit | | $ | 846.3 | |
| | | 2. | | Spousal tax credit | | | 41.8 | |
| | | 3. | | Equivalent-to-spouse tax credit | | | 19.7 | |
| | | 4. | | Age tax credit | | | 32.1 | |
| | | 5. | | Supplement to the age tax credit | | | 10.8 | |
| | | 6. | | Dependent child tax credit | | | 58.0 | |
| | | 7. | | Canada Pension Plan contributions tax credit | | | 66.4 | |
| | | 8. | | Employment Insurance premiums tax credit | | | 21.6 | |
| | | 9. | | Pension income tax credit | | | 11.7 | |
| | | 10. | | Tuition and education tax credit | | | 32.0 | |
| | | 11. | | Student loan interest tax credit | | | 1.8 | |
| | | 12. | | Disability tax credit | | | 10.7 | |
| | | 13. | | Caregiver tax credit | | | 2.0 | |
| | | 14. | | Medical expenses tax credit | | | 23.7 | |
| | | 15. | | Charitable contributions tax credit | | | 44.8 | |
Other Saskatchewan Tax Measures | | | | |
| | | 1. | | Saskatchewan Low-Income Tax Credit | | $ | 80.0 | |
| | | 2. | | Labour-sponsored Venture Capital Tax Credit | | | 11.1 | |
| | | 3. | | Mineral Exploration Tax Credit | | | 2.0 | |
| | | 4. | | Employees’ Tool Tax Credit | | | 1.5 | |
| | | 5. | | Political Contributions Tax Credit | | | 0.7 | |
| Corporation Income Tax | | | | |
| | | 1. | | Lower tax rate for small business | | $ | 138.9 | |
| | | 2. | | Royalty Tax Rebate | | | 3.0 | |
| | | 3. | | Manufacturing and Processing Profits Tax Reduction | | | 6.0 | |
| | | 4. | | Investment Tax Credit for Manufacturing and Processing | | | 20.0 | |
54 Budget 2010-11 | Budget Summary
2010 Intercity Comparison of Taxes,
Utilities and Housing
A number of factors contribute to the quality of life enjoyed by individuals and families in Saskatchewan and across Canada. For example, access to excellent health care, education and social services is a key part of the overall quality of life.
Other important factors that affect quality of life are:
| · | cost of utilities and auto insurance; and, |
| · | household costs for rent and mortgages. |
Calculating the combined cost of provincial taxes, utilities and housing is a reliable way to compare the attractiveness of living in different parts of Canada.
For the purposes of such a comparison, the total cost of such taxes, utilities and housing for representative families living in Saskatoon, Saskatchewan’s largest city, has been compared with the costs those families would face in other major cities across the country.
The provincial taxes, utilities and housing costs associated with the following family characteristics and income levels have been calculated to provide a representative comparison:
| · | a single person, living in rental accommodation, with an annual income of $25,000; |
| · | a family of two adults and two dependent children, owning its own home, with an annual family income of $50,000; and, |
| · | a family of two adults and two dependent children, owning its own home, with an annual family income of $75,000. |
The income of the two families is assumed to be earned by both spouses, with one earning 60 per cent and the other earning 40 per cent of total family income.
In October 2008, the Provincial Government introduced an increase of $4,000 to the basic and spousal personal income tax exemptions, together with a $2,000 per child increase in the dependent child exemption. When combined with a significant enhancement to Saskatchewan’s refundable low-income tax credit and the indexation of the personal income tax system to the national rate of inflation, Saskatchewan lowered personal income taxes by about $320 million for 2010.
As a result, Saskatchewan individuals and families pay total provincial taxes that are very competitive with those paid in other Canadian cities. For 2010 these representative profiles will pay the following total provincial taxes in Saskatoon:
| · | A single person earning $25,000 will pay $1,262 in total provincial taxes, the third lowest tax level in Canada; |
| · | A two-income family earning $50,000 will pay $1,270 in total provincial taxes, the lowest tax level in Canada; and, |
| · | A two-income family earning $75,000 will pay $4,571 in total provincial taxes, the second lowest tax level in Canada. |
Saskatoon ranks favourably with other cities in Canada when comparing taxes and household utility costs. For all three representative family situations, Saskatoon ranks as either the lowest or second-lowest level in Canada.
When the combined taxes, utilities and housing costs of the representative families are considered, Saskatoon compares very favourably with other Canadian cities.
� 60; Budget Summary | Budget 2010-11 55
2010 Intercity Comparison of Taxes, Utilities and Housing
Single Person at $25,000 Total Income
| | | Vancouver | | | Calgary | | | Saskatoon | | | Winnipeg | | | Toronto | | | Montréal | | | Saint John | | | Halifax | | | Charlotte- town | | | St. John’s | |
| Provincial Taxes and Health Premiums | | | | | | | | | | | | | | | | | | | | | | | | | | | | |
| Provincial | | | | | | | | | | | | | | | | | | | | | | | | | | | | | | |
| Income Tax | | $ | 521 | | | $ | 668 | | | $ | 1,117 | | | $ | 1,660 | | | $ | 735 | | | $ | 1,598 | | | $ | 1,097 | | | $ | 1,342 | | | $ | 1,548 | | | $ | 1,207 | |
| Tax Credits and | | | | | | | | | | | | | | | | | | | | | | | | | | | | | | | | | | | | | | | | |
| Rebates | | | (120 | ) | | | 0 | | | | (222 | ) | | | (650 | ) | | | (632 | ) | | | (597 | ) | | | 0 | | | | 0 | | | | 0 | | | | 0 | |
| Health Premiums | | | 274 | | | | 0 | | | | 0 | | | | 0 | | | | 300 | | | | 0 | | | | 0 | | | | 0 | | | | 0 | | | | 0 | |
| Retail Sales Tax | | | 437 | | | | 0 | | | | 217 | | | | 382 | | | | 536 | | | | 590 | | | | 652 | | | | 652 | | | | 547 | | | | 690 | |
| Gasoline Tax | | | 274 | | | | 90 | | | | 150 | | | | 115 | | | | 147 | | | | 167 | | | | 107 | | | | 155 | | | | 158 | | | | 165 | |
| Total Provincial | | | | | | | | | | | | | | | | | | | | | | | | | | | | | | | | | | | | | | | | |
| Taxes and Health | | | | | | | | | | | | | | | | | | | | | | | | | | | | | | | | | | | | | | | | |
| Premiums | | $ | 1,386 | | | $ | 758 | | | $ | 1,262 | | | $ | 1,507 | | | $ | 1,086 | | | $ | 1,758 | | | $ | 1,856 | | | $ | 2,149 | | | $ | 2,253 | | | $ | 2,062 | |
| Household Utility Costs | | | | | | | | | | | | | | | | | | | | | | | | | | | | | | | | | | | | | | | | |
| Electricity | | $ | 322 | | | $ | 690 | | | $ | 650 | | | $ | 366 | | | $ | 642 | | | $ | 398 | | | $ | 593 | | | $ | 671 | | | $ | 975 | | | $ | 612 | |
| Telephone | | | 303 | | | | 281 | | | | 258 | | | | 289 | | | | 268 | | | | 268 | | | | 266 | | | | 303 | | | | 296 | | | | 266 | |
| Auto Insurance | | | 1,451 | | | | 2,025 | | | | 914 | | | | 1,006 | | | | 3,945 | | | | 1,436 | | | | 1,466 | | | | 1,880 | | | | 1,500 | | | | 2,488 | |
| Total Household | | | | | | | | | | | | | | | | | | | | | | | | | | | | | | | | | | | | | | | | |
| Utility Costs | | $ | 2,076 | | | $ | 2,996 | | | $ | 1,822 | | | $ | 1,661 | | | $ | 4,855 | | | $ | 2,102 | | | $ | 2,325 | | | $ | 2,854 | | | $ | 2,771 | | | $ | 3,366 | |
| Total Taxes | | | | | | | | | | | | | | | | | | | | | | | | | | | | | | | | | | | | | | | | |
| and Utilities | | $ | 3,462 | | | $ | 3,754 | | | $ | 3,084 | | | $ | 3,168 | | | $ | 5,941 | | | $ | 3,860 | | | $ | 4,181 | | | $ | 5,003 | | | $ | 5,024 | | | $ | 5,428 | |
| Housing Costs | | | | | | | | | | | | | | | | | | | | | | | | | | | | | | | | | | | | | | | | |
| Rent | | $ | 11,028 | | | $ | 10,956 | | | $ | 8,868 | | | $ | 7,380 | | | $ | 11,112 | | | $ | 7,248 | | | $ | 6,492 | | | $ | 8,520 | | | $ | 6,720 | | | $ | 7,104 | |
| Total of Taxes, | | | | | | | | | | | | | | | | | | | | | | | | | | | | | | | | | | | | | | | | |
| Utilities and | | | | | | | | | | | | | | | | | | | | | | | | | | | | | | | | | | | | | | | | |
| Housing | | $ | 14,490 | | | $ | 14,710 | | | $ | 11,952 | | | $ | 10,548 | | | $ | 17,053 | | | $ | 11,108 | | | $ | 10,673 | | | $ | 13,523 | | | $ | 11,744 | | | $ | 12,532 | |
56 Budget 2010-11 | Budget Summary
2010 Intercity Comparison of Taxes, Utilities and Housing
Family at $50,000 Total Income
| | | Vancouver | | | Calgary | | | Saskatoon | | | Winnipeg | | | Toronto | | | Montréal | | | | | | Halifax | | | | | | St. John’s | |
| Provincial Taxes and Health Premiums | | | | | | | | | | | | | | | | | | | | | | | | | |
| Provincial | | | | | | | | | | | | | | | | | | | | | | | | | | | | | | |
| Income Tax | | $ | 869 | | | $ | 1,134 | | | $ | 816 | | | $ | 2,416 | | | $ | 302 | | | $ | 2,276 | | | $ | 2,265 | | | $ | 2,446 | | | $ | 2,802 | | | $ | 2,182 | |
| Tax Credits and | | | | | | | | | | | | | | | | | | | | | | | | | | | | | | | | | | | | | | | | |
| Rebates | | | (57 | ) | | | 0 | | | | (260 | ) | | | (650 | ) | | | (825 | ) | | | 0 | | | | 0 | | | | 0 | | | | 0 | | | | 0 | |
| Active Families | | | | | | | | | | | | | | | | | | | | | | | | | | | | | | | | | | | | | | | | |
| Benefit | | | 0 | | | | 0 | | | | (300 | ) | | | (109 | ) | | | 0 | | | | 0 | | | | 0 | | | | (88 | ) | | | 0 | | | | 0 | |
| Health Premiums | | | 1,368 | | | | 0 | | | | 0 | | | | 0 | | | | 300 | | | | 0 | | | | 0 | | | | 0 | | | | 0 | | | | 0 | |
| Retail Sales Tax | | | 1,389 | | | | 0 | | | | 714 | | | | 1,254 | | | | 1,699 | | | | 1,918 | | | | 2,019 | | | | 2,019 | | | | 1,799 | | | | 2,150 | |
| Gasoline Tax | | | 548 | | | | 180 | | | | 300 | | | | 230 | | | | 294 | | | | 334 | | | | 214 | | | | 310 | | | | 316 | | | | 330 | |
| Total Provincial | | | | | | | | | | | | | | | | | | | | | | | | | | | | | | | | | | | | | | | | |
| Taxes and Health | | | | | | | | | | | | | | | | | | | | | | | | | | | | | | | | | | | | | | | | |
| Premiums | | $ | 4,117 | | | $ | 1,314 | | | $ | 1,270 | | | $ | 3,141 | | | $ | 1,770 | | | $ | 4,528 | | | $ | 4,498 | | | $ | 4,687 | | | $ | 4,917 | | | $ | 4,662 | |
| Household Utility Costs | | | | | | | | | | | | | | | | | | | | | | | | | | | | | | | | | | | | | | | | |
| Home Heating | | $ | 1,361 | | | $ | 917 | | | $ | 1,233 | | | $ | 1,396 | | | $ | 1,322 | | | $ | 1,830 | | | $ | 2,084 | | | $ | 1,695 | | | $ | 2,183 | | | $ | 2,108 | |
| Electricity | | | 533 | | | | 1,113 | | | | 997 | | | | 584 | | | | 1,004 | | | | 589 | | | | 909 | | | | 1,085 | | | | 1,502 | | | | 938 | |
| Telephone | | | 303 | | | | 281 | | | | 258 | | | | 289 | | | | 268 | | | | 268 | | | | 266 | | | | 303 | | | | 296 | | | | 266 | |
| Auto Insurance | | | 1,451 | | | | 2,025 | | | | 914 | | | | 1,006 | | | | 3,945 | | | | 1,436 | | | | 1,466 | | | | 1,880 | | | | 1,500 | | | | 2,488 | |
| Total Household | | | | | | | | | | | | | | | | | | | | | | | | | | | | | | | | | | | | | | | | |
| Utility Costs | | $ | 3,648 | | | $ | 4,336 | | | $ | 3,402 | | | $ | 3,275 | | | $ | 6,539 | | | $ | 4,123 | | | $ | 4,725 | | | $ | 4,963 | | | $ | 5,481 | | | $ | 5,800 | |
| Total Taxes | | | | | | | | | | | | | | | | | | | | | | | | | | | | | | | | | | | | | | | | |
| and Utilities | | $ | 7,765 | | | $ | 5,650 | | | $ | 4,672 | | | $ | 6,416 | | | $ | 8,309 | | | $ | 8,651 | | | $ | 9,223 | | | $ | 9,650 | | | $ | 10,398 | | | $ | 10,462 | |
| Housing Costs | | | | | | | | | | | | | | | | | | | | | | | | | | | | | | | | | | | | | | | | |
| Mortgage Costs | | $ | 9,116 | | | $ | 12,041 | | | $ | 9,331 | | | $ | 7,346 | | | $ | 13,857 | | | $ | 7,372 | | | $ | 5,332 | | | $ | 7,219 | | | $ | 4,793 | | | $ | 6,441 | |
| Property Taxes | | | 3,309 | | | | 1,873 | | | | 2,868 | | | | 2,558 | | | | 2,950 | | | | 2,938 | | | | 2,462 | | | | 2,272 | | | | 2,600 | | | | 2,640 | |
| Property Tax Credit | | | (570 | ) | | | 0 | | | | 0 | | | | 0 | | | | (460 | ) | | | 0 | | | | 0 | | | | 0 | | | | 0 | | | | 0 | |
| Total Housing | | | | | | | | | | | | | | | | | | | | | | | | | | | | | | | | | | | | | | | | |
| Costs | | $ | 21,855 | | | $ | 13,914 | | | $ | 12,199 | | | $ | 9,904 | | | $ | 16,347 | | | $ | 10,310 | | | $ | 7,794 | | | $ | 9,491 | | | $ | 7,393 | | | $ | 9,081 | |
| Total of Taxes, | | | | | | | | | | | | | | | | | | | | | | | | | | | | | | | | | | | | | | | | |
| Utilities and | | | | | | | | | | | | | | | | | | | | | | | | | | | | | | | | | | | | | | | | |
| Housing | | $ | 29,620 | | | $ | 19,564 | | | $ | 16,871 | | | $ | 16,320 | | | $ | 24,656 | | | $ | 18,961 | | | $ | 17,017 | | | $ | 19,141 | | | $ | 17,791 | | | $ | 19,543 | |
� 60; Budget Summary | Budget 2010-11 57
2010 Intercity Comparison of Taxes, Utilities and Housing
Family at $75,000 Total Income
| | | Vancouver | | | Calgary | | | Saskatoon | | | Winnipeg | | | Toronto | | | Montréal | | | | | | Halifax | | | | | | St. John’s | |
| Provincial Taxes and Health Premiums | | | | | | | | | | | | | | | | | | | | | | | | | |
| Provincial | | | | | | | | | | | | | | | | | | | | | | | | | | | | | | |
| Income Tax | | $ | 2,498 | | | $ | 3,372 | | | $ | 3,479 | | | $ | 5,417 | | | $ | 2,822 | | | $ | 6,618 | | | $ | 4,907 | | | $ | 5,424 | | | $ | 5,612 | | | $ | 4,681 | |
| Tax Credits and | | | | | | | | | | | | | | | | | | | | | | | | | | | | | | | | | | | | | | | | |
| Rebates | | | 0 | | | | 0 | | | | 0 | | | | (650 | ) | | | (665 | ) | | | 0 | | | | 0 | | | | 0 | | | | 0 | | | | 0 | |
| Active Families | | | | | | | | | | | | | | | | | | | | | | | | | | | | | | | | | | | | | | | | |
| Benefit | | | 0 | | | | 0 | | | | (300 | ) | | | (109 | ) | | | 0 | | | | 0 | | | | 0 | | | | (88 | ) | | | 0 | | | | 0 | |
| Health Premiums | | | 1,368 | | | | 0 | | | | 0 | | | | 0 | | | | 750 | | | | 0 | | | | 0 | | | | 0 | | | | 0 | | | | 0 | |
| Retail Sales Tax | | | 2,099 | | | | 0 | | | | 1,092 | | | | 1,898 | | | | 2,568 | | | | 2,905 | | | | 3,042 | | | | 3,042 | | | | 2,719 | | | | 3,238 | |
| Gasoline Tax | | | 548 | | | | 180 | | | | 300 | | | | 230 | | | | 294 | | | | 334 | | | | 214 | | | | 310 | | | | 316 | | | | 330 | |
| Total Provincial | | | | | | | | | | | | | | | | | | | | | | | | | | | | | | | | | | | | | | | | |
| Taxes and Health | | | | | | | | | | | | | | | | | | | | | | | | | | | | | | | | | | | | | | | | |
| Premiums | | $ | 6,513 | | | $ | 3,552 | | | $ | 4,571 | | | $ | 6,786 | | | $ | 5,769 | | | $ | 9,857 | | | $ | 8,163 | | | $ | 8,688 | | | $ | 8,647 | | | $ | 8,249 | |
| Household Utility Costs | | | | | | | | | | | | | | | | | | | | | | | | | | | | | | | | | | | | | | | | |
| Home Heating | | $ | 1,361 | | | $ | 917 | | | $ | 1,233 | | | $ | 1,396 | | | $ | 1,322 | | | $ | 1,830 | | | $ | 2,084 | | | $ | 1,695 | | | $ | 2,183 | | | $ | 2,108 | |
| Electricity | | | 533 | | | | 1,113 | | | | 997 | | | | 584 | | | | 1,004 | | | | 589 | | | | 909 | | | | 1,085 | | | | 1,502 | | | | 938 | |
| Telephone | | | 303 | | | | 281 | | | | 258 | | | | 289 | | | | 268 | | | | 268 | | | | 266 | | | | 303 | | | | 296 | | | | 266 | |
| Auto Insurance | | | 1,451 | | | | 2,025 | | | | 914 | | | | 1,006 | | | | 3,945 | | | | 1,436 | | | | 1,466 | | | | 1,880 | | | | 1,500 | | | | 2,488 | |
| Total Household | | | | | | | | | | | | | | | | | | | | | | | | | | | | | | | | | | | | | | | | |
| Utility Costs | | $ | 3,648 | | | $ | 4,336 | | | $ | 3,402 | | | $ | 3,275 | | | $ | 6,539 | | | $ | 4,123 | | | $ | 4,725 | | | $ | 4,963 | | | $ | 5,481 | | | $ | 5,800 | |
| Total Taxes | | | | | | | | | | | | | | | | | | | | | | | | | | | | | | | | | | | | | | | | |
| and Utilities | | $ | 10,161 | | | $ | 7,888 | | | $ | 7,973 | | | $ | 10,061 | | | $ | 12,308 | | | $ | 13,980 | | | $ | 12,888 | | | $ | 13,651 | | | $ | 14,128 | | | $ | 14,049 | |
| Housing Costs | | | | | | | | | | | | | | | | | | | | | | | | | | | | | | | | | | | | | | | | |
| Mortgage Costs | | $ | 19,116 | | | $ | 12,041 | | | $ | 9,331 | | | $ | 7,346 | | | $ | 13,857 | | | $ | 7,372 | | | $ | 5,332 | | | $ | 7,219 | | | $ | 4,793 | | | $ | 6,441 | |
| Property Taxes | | | 3,309 | | | | 1,873 | | | | 2,868 | | | | 2,558 | | | | 2,950 | | | | 2,938 | | | | 2,462 | | | | 2,272 | | | | 2,600 | | | | 2,640 | |
| Property Tax Credit | | | (570 | ) | | | 0 | | | | 0 | | | | 0 | | | | 0 | | | | 0 | | | | 0 | | | | 0 | | | | 0 | | | | 0 | |
| Total Housing | | | | | | | | | | | | | | | | | | | | | | | | | | | | | | | | | | | | | | | | |
| Costs | | $ | 21,855 | | | $ | 13,914 | | | $ | 12,199 | | | $ | 9,904 | | | $ | 16,807 | | | $ | 10,310 | | | $ | 7,794 | | | $ | 9,491 | | | $ | 7,393 | | | $ | 9,081 | |
| Total of Taxes, | | | | | | | | | | | | | | | | | | | | | | | | | | | | | | | | | | | | | | | | |
| Utilities and | | | | | | | | | | | | | | | | | | | | | | | | | | | | | | | | | | | | | | | | |
| Housing | | $ | 32,016 | | | $ | 21,802 | | | $ | 20,172 | | | $ | 19,965 | | | $ | 29,115 | | | $ | 24,290 | | | $ | 20,682 | | | $ | 23,142 | | | $ | 21,521 | | | $ | 23,130 | |
58 Budget 2010-11 | Budget Summary
TAXES, UTILITIES AND HOUSING – NOTES
Tax estimates are calculated for the 2010 calendar year using known changes as of March 5, 2010. Household charges for the bundle of basic utility services (electricity, home heating, telephone and auto insurance) represents a cost comparison of the actual ‘known’ utility rates for the 2009 calendar year. This methodology has been chosen due to the uncertainty of attempting to forecast utility rates for the coming year. The utility figures exclude federal GST, provincial sales tax and municipal taxes and surcharges.
Provincial Income Tax is calculated for an individual with $25,000 and two families with $50,000 and $75,000 income respectively. It is assumed that family income is earned by both spouses at a 60 per cent to 40 per cent ratio and that the families each claim $3,000 in child care expenses for two dependent children (ages 6 and 12). Personal non-refundable credits used include the CPP/QPP and EI contribution credits. Gross Québec Personal Income Tax has been reduced by the Québec Child Care Expense Tax Credit and by the 16.5 per cent abatement from federal income tax.
Tax Credits and Rebates refer to refundable provincial income tax credits and rebates designed to reduce the impact of retail sales tax, rental payments and property taxes (those property tax rebate plans administered through provincial income tax systems).
Active Families Benefit refers to the Saskatchewan refundable income tax credit that rebates up to $150 per child annually for cultural, recreational and sports activities fees for children aged 6 to 14. This initiative took effect January 1, 2009. Manitoba and Nova Scotia provide non-refundable children’s fitness tax credits which mirror the federal credit.
Health Premiums are annual premiums for hospital insurance and medical services.
Retail Sales Tax is based upon average family expenditure baskets at the total income levels from the Survey of Family Expenditures in 2007 (Statistics Canada). The sales tax base in each province was identified from the enacting legislation, with total expenditures adjusted to reflect Saskatchewan consumption patterns. Provincial retail sales taxes were then estimated based on taxable expenditures in each province. The Harmonized Sales Tax replaces the provincial sales tax in British Columbia and Ontario effective July 1, 2010; these estimates are pro-rated to reflect this effective date.
Gasoline Tax is based on annual consumption of 1,000 litres by a single person, and 2,000 litres for each of the families. Vancouver gasoline tax figures also include the British Columbia Carbon Tax.
Home Heating charges are based on an annual consumption level of 3,200 m3 of natural gas. For Charlottetown and St. John’s, the figures represent the BTU equivalent consumption of fuel oil.
Electricity charges are based on an annual consumption level of 4,584 kWh for the renter and 8,100 kWh for the homeowners.
Telephone charges are the basic service rates for individual residences.
Auto Insurance is based on a composite index developed by SGI modelled after the index developed by the Consumers’ Association of Canada. The index is based on the actual insurance rates quoted for what the driver would pay in each jurisdiction if they had the same car, same coverage, same claims history and driving record at a consistent point in time. The Consumers’ Association of Canada developed 34 profiles to create this index. The impact of “Good Driver” discounts/rebates have been factored in for all applicable jurisdictions.
� 60; Budget Summary | Budget 2010-11 59
Rent is based on average one-bedroom apartment rents for each metropolitan area, from the Canada Mortgage and Housing Corporation’s Rental Market Report, October 2009.
Mortgage Costs are based on average home prices for a detached bungalow, from the Royal LePage Third Quarter 2009 Survey of Canadian House Prices, with one-half of the home price being financed over 25 years at a one-year closed mortgage rate of 3.5 per cent.
Property Taxes for all cities are based on the estimated taxes for a sample detached bungalow from the City of Edmonton 2009 Residential Property Taxes and Utility Charges Survey, with the exception of Charlottetown whose property tax estimate is based on the average of detached bungalows in that city as determined from the Royal LePage Third Quarter 2009 Survey of Canadian House Prices. All provincial, municipal, education and library property taxes are included in the property tax figures. The property tax credit line refers to property tax credit programs administered by municipalities on property tax notices.
A review of the Edmonton survey for 2008 and 2009 illustrates a reduction of $142 in Education Property Tax for the representative home in Saskatoon.
SASKATOON SURVEY RESULTS
| | | 2008 | | | 2009 | |
| Education Property Tax | | $ | 1,714 | | | $ | 1,366 | |
| Previous Education Property Tax Credit | | | (206 | ) | | | – | |
| Net Education Property Tax | | $ | 1,508 | | | $ | 1,366 | |
60 Budget 2010-11 | Budget Summary
2010-11 Borrowing and Debt
The General Revenue Fund (GRF) borrows for government and Crown corporations.
Public Debt as reported in the Province’s financial statements is comprised of:
| · | Gross Debt – the amount of money owed to lenders; less |
| · | Sinking Funds – the amount of money which has been set aside for the repayment of debt. |
Public debt is discussed in this budget paper.
Crown corporations are responsible for the principal and interest payments on their debt. Crown corporation debt is incurred in the normal course of business, primarily for investment in infrastructure and business development initiatives which provide revenue streams to service the debt.
Crown corporation debt is divided into two components: Crown corporation general debt and Government business enterprise specific debt. This has been done to provide consistency with the way these amounts are segregated in the Public Accounts.
Government business enterprises are self-sufficient government organizations that have the financial and operating authority to sell goods and services to individuals and organizations outside government as their principal activity. Amounts borrowed specifically for these enterprises are disclosed separately from other government debt, because they are expected to be repaid from cash flows generated by these business enterprises.
All other Crown corporation debt is classified as Crown corporation general debt. This debt includes amounts that can be repaid from business activities of the Crown sector and amounts that can only be repaid with assistance from Government.
Public debt is forecast to increase by $395.9 million during 2009-10 and increase by $695.1 million in 2010-11.
Government general public debt is forecast to remain level during 2009-10 and 2010-11.
Crown corporation general public debt is forecast to grow by $399.4 million during 2009-10 and $55.5 million during 2010-11. The increases in both years are primarily due to increases in debt for the utility Crown corporations.
Government business enterprise specific public debt is forecast to decline by $3.5 million during 2009-10 and increase by $639.6 million during 2010-11. The increase in 2010-11 is almost entirely attributable to higher long-term debt for the utility Crown corporations.
� 60; Budget Summary | Budget 2010-11 61
DEBT OF THE GENERAL REVENUE FUND
As at March 31
| (Millions of Dollars) | | | | | | | | Actual 2009 | |
| Government General | | | | | | | | | |
| Gross Debt | | $ | 6,093.1 | | | $ | 6,440.0 | | | $ | 7,109.2 | |
| Sinking Funds | | | 1,947.8 | | | | 2,294.7 | | | | 2,963.9 | |
Government General Public Debt | | $ | 4,145.3 | | | $ | 4,145.3 | | | $ | 4,145.3 | |
| Crown Corporation General | | | | | | | | | | | | |
| Gross Debt | | $ | 1,007.0 | | | $ | 946.6 | | | $ | 589.2 | |
| Sinking Funds | | | 31.8 | | | | 26.9 | | | | 68.9 | |
Crown Corporation General Public Debt | | $ | 975.2 | | | $ | 919.7 | | | $ | 520.3 | |
Government Business Enterprise Specific | | | | | | | | | | | | |
| Gross Debt | | $ | 4,082.9 | | | $ | 3,416.0 | | | $ | 3,367.4 | |
| Sinking Funds | | | 410.8 | | | | 383.5 | | | | 331.4 | |
Government Business Enterprise | | | | | | | | | | | | |
| Specific Public Debt | | $ | 3,672.1 | | | $ | 3,032.5 | | | $ | 3,036.0 | |
| Public Debt | | $ | 8,792.6 | | | $ | 8,097.5 | | | $ | 7,701.6 | |
| Guaranteed Debt | | $ | 81.7 | | | $ | 27.0 | | | $ | 20.3 | |
PUBLIC DEBT OF THE GENERAL REVENUE FUND
As at March 31
62 Budget 2010-11 | Budget Summary
GRF PUBLIC DEBT AS A % OF GDP
As at March 31
GENERAL REVENUE FUND
BORROWING
The Province’s 2010-11 borrowing requirements are estimated to be $1,067.7 million, compared to forecast requirements of $715.9 million in 2009-10.
Borrowing requirements for government in 2010-11, estimated to be $132.2 million (2009-10 forecast: $196.8 million), are primarily to assist with financing capital expenditures.
Borrowing requirements for Crown corporations in 2010-11 are estimated to be $935.5 million (2009-10 forecast: $519.1 million).
Budget Summary | Budget 2010-11 63
Reconciliation of Surplus and Change
in Government General Public Debt
The amount by which government general public debt will change may be higher or lower than the surplus reported under the accrual basis of accounting.
The difference between the surplus and the amount by which government general public debt will change is reconciled by:
| 1. | Adjusting the surplus to a cash basis to recognize the amount and timing of non-cash revenues and expenditures to determine the cash provided from operations; |
| 2. | Adjusting for cash required for capital acquisitions; |
| 3. | Adding other cash sources or subtracting other cash requirements to recognize the amount of cash inflows and outflows from loan, investment and other activities to determine the cash available to reduce debt; and, |
| 4. | Adding changes in sinking funds which will be used to repay government general public debt. |
| | | | | | | | Forecast 2009-10 |
| | | | | | ($ Millions) | | |
Surplus (on Accrual Accounting Basis) | | | | | $ | 20.0 | | | | | $ | 424.5 | |
1. Adjustment to Cash Basis | | | | | | (85.5 | ) | | | | | 308.9 | |
Cash Provided by Operations | | | | | | (65.5 | ) | | | | | 733.4 | |
2. Capital Acquisitions | | | | | | (300.0 | ) | | | | | (380.6 | ) |
3. Other Cash Sources | | | | | | | | | | | | | |
• Sinking Fund Proceeds | | | 483.6 | | | | | | | | 843.6 | | | | |
• CIC Equity Repayment | | | 120.0 | | | | | | | | 0.0 | | | | |
• Change in Cash Balance | | | 156.6 | | | | | | | | (534.9 | ) | | | |
• Other | | | (47.8 | ) | | | 712.4 | | | | 7.7 | | | 316.4 | |
| | | | | | | | | | | | | | | | |
| Cash Available to Reduce Debt | | | | | | $ | 346.9 | | | | | | $ | 669.2 | |
4. Change in Sinking Funds | | | | | | | (346.9 | ) | | | | | | (669.2 | ) |
Change in Government General Public Debt | | | | | | $ | 0.0 | | | | | | $ | 0.0 | |
64 Budget 2010-11 | Budget Summary
COST OF SERVICING DEBT
In addition to interest payments, debt servicing costs include all charges related to the gross debt, such as: the amortization of premiums, discounts, and commissions; and, gains or losses on foreign currency debt that result from a change in the value of the Canadian dollar.
The 2010-11 debt servicing cost estimates are based on 2.0 per cent short-term and 5.0 per cent long-term interest rates. A one percentage point increase in interest rates for a full year from levels assumed in the Budget would increase the estimated cost of servicing government debt in 2010-11 by approximately $8.7 million.
COST OF SERVICING DEBT
| (Millions of Dollars) | | Estimated 2010-11 | | | Forecast 2009-10 | |
| Government General Debt | | $ | 413.0 | | | $ | 463.3 | |
| Crown Corporation General Debt | | | 22.0 | | | | 19.2 | |
| Government Business Enterprise Specific Debt | | | 247.0 | | | | 223.1 | |
| Total Cost of Servicing Gross Debt | | $ | 682.0 | | | $ | 705.6 | |
SUMMARY STATEMENT OF DEBT
GRF debt includes all debt borrowed by the GRF for either government purposes or the purposes of certain Crown corporations. Some Crown corporations and other organizations have additional obligations to other entities. The GRF is not responsible for this other debt.
The Summary Schedule of Debt on page 119 calculates the combined public debt of government entities by listing both the GRF debt and the debt to other entities.
SUMMARY STATEMENT OF DEBT
As at March 31
| (Millions of Dollars) | | | Estimated 2011 | | | | Forecast 2010 | | | | Actual 2009 | |
| GRF Public Debt for Crown Corporations | | $ | 4,647.3 | | | $ | 3,952.2 | | | $ | 3,556.3 | |
| GRF Public Debt for Government | | | 4,145.3 | | | | 4,145.3 | | | | 4,145.3 | |
| GRF Public Debt | | $ | 8,792.6 | | | $ | 8,097.5 | | | $ | 7,701.6 | |
| Other Debt | | | 318.6 | | | | 314.8 | | | | 244.7 | |
| Summary Statement of Debt | | $ | 9,111.2 | | | $ | 8,412.3 | | | $ | 7,946.3 | |
Budget Summary | Budget 2010-11 65
Growth and Financial Security Fund
The Growth and Financial Security Fund (GFSF) was established with the assent of The Growth and Financial Security Act.
The purpose of the GFSF is twofold:
| · | to assist in the achievement of the Government of Saskatchewan’s long-term objectives by providing for financial security of the Government of Saskatchewan from year to year; and, |
| · | to provide a source of funds that are to be available for appropriation to be used for programs of the Government of Saskatchewan identified as promoting or enhancing the economic development of Saskatchewan. |
The opening balance of the GFSF in 2009-10 was $1,215.1 million.
Subsequently, transfers to the GFSF represent either:
| · | 50 per cent of any pre-transfer surplus for any fiscal year (required); or, |
| · | subject to the approval of Treasury Board, the amount of significant, unexpected revenues received for the fiscal year, as determined by the minister (special transfer). |
Transfers out of the GFSF may be made by the minister, subject to the approval of Treasury Board, with the objective of achieving the aforementioned twofold purpose.
GROWTH AND FINANCIAL SECURITY FUND TRANSACTIONS
| | | | | | | | | | | | | Forecast | | | | | | | |
| (Millions of Dollars) | | 2008-09 Actual | | | | 2009-10 | | | | 2010-11 | | | | 2011-12 | | | | 2012-13 | | | | 2013-14 | |
Opening Balance | | $ | 1,634.0 | | | $ | 1,215.1 | | | $ | 705.0 | | | $ | 510.8 | | | $ | 339.5 | | | $ | 366.5 | |
| Plus Transfers to the | | | | | | | | | | | | | | | | | | | | | | | | |
| GFSF from the GRF | | | | | | | | | | | | | | | | | | | | | | | | |
| (50% of Pre-transfer | | | | | | | | | | | | | | | | | | | | | | | | |
| Surplus) | | | 985.0 | | | | – | | | | – | | | | – | | | | 51.0 | | | | 180.0 | |
| Minus Transfers from | | | | | | | | | | | | | | | | | | | | | | | | |
| the GFSF to the GRF | | | | | | | | | | | | | | | | | | | | | | | | |
| (to provide financial | | | | | | | | | | | | | | | | | | | | | | | | |
| security) | | | (1,403.9 | ) | | | (510.1 | ) | | | (194.2 | ) | | | (171.3 | ) | | | (24.0 | ) | | | – | |
| Net Transfers to (from) | | | | | | | | | | | | | | | | | | | | | | | | |
| the GFSF from the GRF | | | (418.9 | ) | | | (510.1 | ) | | | (194.2 | ) | | | (171.3 | ) | | | 27.0 | | | | 180.0 | |
Closing Balance | | $ | 1,215.1 | | | $ | 705.0 | | | $ | 510.8 | | | $ | 339.5 | | | $ | 366.5 | | | $ | 546.5 | |
66 Budget 2010-11 | Budget Summary
Debt Retirement Fund
The Debt Retirement Fund (DRF) was established with the assent of The Growth and Financial Security Act.
The DRF is an accounting of the surpluses of the GRF that are allocated to the fund on or after April 1, 2008.
The purpose of the DRF is to assist in achieving the long-term objective of the Government of Saskatchewan in eliminating the debt.
Allocations to the DRF represent either:
| · | 50 per cent of any pre-transfer surplus for any fiscal year (required); or, |
| · | a transfer made out of the Growth and Financial Security Fund (GFSF) by the minister, subject to the approval of Treasury Board, for the purpose of assisting in the long-term objective of eliminating the debt. |
DEBT RETIREMENT FUND FORECAST
| | | | | | | | | | | | | | | Forecast | | | | | | | | | |
| (Millions of Dollars) | | 2008-09 Actual | | | | 2009-10 | | | | 2010-11 | | | | 2011-12 | | | | 2012-13 | | | | 2013-14 | |
2008-09 Surplus | | $ | 2,388.9 | | | $ | – | | | $ | – | | | $ | – | | | $ | – | | | $ | – | |
| 2009-10 Surplus Forecast | | | – | | | | 424.5 | | | | – | | | | – | | | | – | | | | – | |
| 2010-11 Surplus Forecast | | | – | | | | – | | | | 20.0 | | | | – | | | | – | | | | – | |
| 2011-12 Surplus Forecast | | | – | | | | – | | | | – | | | | 50.0 | | | | – | | | | – | |
| 2012-13 Surplus Forecast | | | – | | | | – | | | | – | | | | – | | | | 75.0 | | | | – | |
| 2013-14 Surplus Forecast | | | – | | | | – | | | | – | | | | – | | | | – | | | | 180.0 | |
Cumulative Total | | $ | 2,388.9 | | | $ | 2,813.4 | | | $ | 2,833.4 | | | $ | 2,883.4 | | | $ | 2,958.4 | | | $ | 3,138.4 | |
� 60; Budget Summary | Budget 2010-11 67
Saskatchewan’s Tobacco
Control Strategy
INTRODUCTION
The 2010-11 Budget will enhance Saskatchewan’s tobacco control strategy by introducing changes to Saskatchewan’s Tobacco Taxes. These measures will help reduce the negative impacts of tobacco use on the health of Saskatchewan residents. For more detailed information, please contact the Ministry of Finance (at 1-800-667-6102) or consult the amending legislation.
GENERAL
Smoking and second hand smoke are major contributing factors to a number of chronic diseases and deaths. Tobacco use is the leading cause of preventable illness, disability and premature death in Canada. The Saskatchewan Coalition for Tobacco Reduction, the Saskatchewan Division of the Canadian Cancer Society, the Canadian Lung Association, the Canadian Heart and Stroke Foundation, the Canadian Diabetes Association, Saskatchewan’s Health Regions and others working to reduce tobacco usage in Saskatchewan, agree that smoking and exposure to environmental tobacco smoke results in over 1,000 deaths per year in Saskatchewan, or approximately three deaths per day.
The Government of Saskatchewan has long recognized that wide-spread tobacco usage has significant detrimental effects on society as a whole. According to an October 2009 study prepared for the Saskatchewan Division of the Canadian Cancer Society, tobacco use cost Saskatchewan’s economy an estimated $1.1 billion in 2008. This includes both direct health care costs and indirect costs such as the productivity losses for employers arising from the higher absenteeism and reduced productivity of employees who smoke.
To address these issues, Saskatchewan introduced a tobacco control strategy in 2002 and is now updating this strategy including new legislative measures. This strategy is intended to protect the public from the health risks associated with direct tobacco usage and with indirect exposure to environmental tobacco smoke. Of particular concern are the effects of tobacco smoking on children and youth. One of the key objectives of the tobacco control strategy is to de-normalize tobacco use within society in general.
Significant measures that have been implemented under Saskatchewan’s tobacco control strategy include:
| · | prohibiting smoking in enclosed public spaces such as offices, stores, restaurants, bars, private clubs, billiard and bingo halls, casinos, theatres; |
| · | prohibiting the sale of tobacco to anyone under the age of 18; |
| · | prohibiting the sale of tobacco products through vending machines; |
| · | banning the display and promotion of tobacco products in retail stores; |
| · | levying severe penalties for violations of tobacco control measures; and, |
| · | implementing public education programs and measures to prevent youth from smoking and to help smokers quit. |
68 Budget 2010-11 | Budget Summary
Despite these measures, Health Canada statistics on tobacco usage indicate that smoking rates for Saskatchewan residents have been the highest in Canada and that Saskatchewan has had the lowest rate of decline in tobacco usage in the country over the 1999 to 2007 period. The statistics for 2008 indicate that 20 per cent of Saskatchewan residents were smokers (compared to the national average of 18 per cent) and that the smoking rate among young adults (aged 20 to 24) was considerably higher at 27 per cent.
The Government must therefore do more to protect public health. The Saskatchewan Coalition for Tobacco Reduction notes that “an increase in the real price of tobacco is one of the surest and most cost effective ways to reduce tobacco use.” The Coalition also notes that the availability of tax-free tobacco products for First Nations individuals undermines the tobacco control strategy’s efforts to reduce tobacco usage in Saskatchewan.
TOBACCO TAX RATE
In response to these issues and to help further reduce tobacco-related diseases and deaths in Saskatchewan, the Government is enhancing its tobacco control strategy by increasing the Tobacco Tax rate on cigarettes and tobacco sticks by 2.7 cents to 21 cents each. Similarly, the tax rate on cut/loose tobacco will increase to 21 cents per gram. In addition, the tax rate on cigars will increase to 100 per cent of the retail price, subject to the existing minimum and maximum tax amounts per cigar ($0.35 and $5.00, respectively). These changes take effect midnight Budget night.
Tobacco Sales to First Nations Consumers
The Government of Saskatchewan has entered into agreements with First Nations whereby First Nations individuals can purchase up to three cartons of cigarettes tax-free per week for their own consumption. This system was put in place to recognize that, in accordance with the federal Indian Act, First Nations individuals are exempt from federal and provincial taxation for their personal purchases that occur on reserve.
The current three-carton allowance equates to 600 cigarettes per week or 85 cigarettes per day, which impairs the effectiveness of Saskatchewan’s tobacco control strategy. The current allowance makes available an estimated 300 million tax-free cigarettes per year for consumption in Saskatchewan.
To strengthen the Province’s tobacco control strategy, the Government is reducing the tax-free allowance for a First Nations individual to one carton per week, with provision for over-limit tobacco requests for ceremonial and cultural use. In keeping with other provinces, the new allowance will be set out in legislation. To ensure that the new allowance can be effectively applied and monitored, the legislation will also provide authority to introduce a marking regime for tobacco products that are sold under the tax-free allowance. In addition, the Government will also be improving the tobacco sales reporting system to assist on-reserve retailers with their refund claims.
� 60; Budget Summary | Budget 2010-11 69
Canada’s Retirement Income System
INTRODUCTION
Canada’s current retirement income system is comprised of three elements. The federal government has described these elements or “pillars” as follows:
| · | The first pillar is the publicly-funded Old Age Security and Guaranteed Income Supplement programs. These programs are intended to provide a minimum level of financial support to seniors. |
| · | The second pillar is the Canada Pension Plan (CPP). The CPP is funded through earnings-based contributions from employees and employers. Participation is mandatory for all employed and self-employed Canadians. |
| · | The third pillar is voluntary retirement savings. These include occupational pension plans and registered retirement savings plans (RRSPs). |
RECENT PUBLIC INTEREST
Although Canada’s retirement income system is often praised internationally, there have recently been concerns raised by Canadians over whether the incomes of future retirees will be sufficient for them to maintain their pre-retirement standard of living. These concerns have arisen in part due to demographic trends and in part due to the declining coverage of occupational pension plans (only one-quarter of private sector workers in Canada belong to an occupational pension plan). This issue has also gained prominence with the recent turmoil in global financial markets and the impact that it has had on pension plans and retirement savings.
Canadian governments have noted these concerns and have been examining various related issues. Several provincial governments have commissioned independent reviews of the rules governing occupational pension plans. The federal government commissioned a series of research papers to study issues such as the level and adequacy of current retirement savings. Ontario commissioned a study on retirement income adequacy for future retirees. The western provinces have worked together to prepare a paper (coordinated by British Columbia) examining options for expanding pension coverage to a broader range of working Canadians.
Governments are working collaboratively to assess these various research studies and are conducting further analysis on a number of proposals for reforms to the retirement income system that have been suggested by key stakeholders. These proposals have included changes in the balance of retirement income reliance between the three pillars, an expansion of the CPP, enhancing incentives for voluntary retirement savings and the creation of a supplemental national pension plan as a new vehicle for encouraging voluntary retirement savings.
The Government of Saskatchewan recognizes that retirement income adequacy issues are complex and that the consideration of alternatives and potential reforms must involve broad-based consultations with stakeholders and the general public. The federal government’s recent budget includes a commitment to undertake public consultations on the retirement income system, beginning in March 2010. Federal, provincial and territorial Finance Ministers will discuss the implications of various reform proposals at their May 2010 meeting. In addition, Premiers, through the Council of the Federation, have called on the federal government to arrange a national pension summit to bring together governments and stakeholders to discuss potential improvements to Canada’s retirement income system.
70 Budget 2010-11 | Budget Summary
SASKATCHEWAN PENSION PLAN
Saskatchewan is already a leader in pension innovation in Canada.
| · | The rules governing pension plans in Saskatchewan are among the most flexible in the country with regard to pension payouts and the unlocking of pension funds. |
| · | Saskatchewan has the highest rate of coverage of occupational pension plans in the country. |
| · | Saskatchewan is home to the largest defined contribution pension plans in the country and these plans account for about half of the total membership in Saskatchewan’s occupational pension plans (nationally, only 16 per cent of pension plan members participate in defined contribution plans). |
| · | Saskatchewan created the Saskatchewan Pension Plan (SPP) in 1986 to provide a unique retirement income savings vehicle for individuals with little or no access to employer-sponsored pension plans or other retirement savings arrangements. |
The SPP is the only plan of its kind in Canada – employer contributions are not required and member contributions are voluntary. In addition, the contribution limit is not tied to the contributor’s employment income. Membership is open to any resident between the ages of 18 and 71.
The SPP is a fully-funded capital accumulation plan and is currently the 26th largest defined contribution plan in Canada. Contributions are tax deductible within RRSP limits and earnings are tax sheltered until received as retirement income (as early as age 55). The SPP’s investment activities operate at arms length from the Government. The SPP offers plan members professional investment management at institutional costs, where private sector investment managers actively invest member funds in accordance with the investment policies established by the SPP Board of Trustees. The five-person Board of Trustees is appointed by the Government by Order in Council and the Board reports to the Legislature through the Minister of Finance.
The SPP provides an individual pension plan that does not depend on employer involvement. In the past, this provision has allowed the SPP to market itself as a retirement savings vehicle for “homemakers” and others who do not earn employment income. However, this feature of the SPP is no longer required as a result of the introduction of Tax-Free Savings Accounts by the federal government in 2009, which allow individuals to contribute up to $5,000 in annual tax-sheltered savings.
Saskatchewan residents believe that access to a pension plan is very important. Because the SPP specializes in handling a large number of small accounts in an efficient manner, it can be an attractive pension alternative for small businesses and their employees. However, contributions to the SPP are limited to $600 per year. This limit is set out in the federal Income Tax Act and has not been changed in 24 years. As a result, SPP’s ability to serve as an effective pension alternative is hindered by an annual contribution limit that is now too low to create an adequate level of savings.
To address these issues and improve the SPP’s attractiveness to small businesses and the self-employed, Saskatchewan will propose amendments to the federal Act that would increase the annual SPP contribution limit to $2,500 while requiring contributions to be fully dependent upon the contributor’s earned income. This initiative will also create a “working model” of a fully voluntary, multi-employer, supplemental pension plan for Canadians to evaluate as part of the national retirement income system deliberations.
� 60; Budget Summary | Budget 2010-11 71
These adjustments to the SPP would allow the plan to better illustrate the feasibility and the advantages of a broad-based supplemental pension plan, and will:
| · | offer a pension plan alternative for small businesses that do not offer their own pension plans; |
| · | provide cost-effective professional investment management of retirement savings; |
| · | allow employees full portability of pension savings between employers; and, |
| · | establish a contribution limit designed to target the self-employed, employees of small businesses and others who do not have access to an occupational pension plan, and that avoids direct competition with the retail investment industry. |
For further information on the SPP, please contact:
Saskatchewan Pension Plan
Box 5555
Kindersley SK S0L 1S0
1-800-667-7153
info@saskpension.com
To provide your perspectives on Canada’s retirement income system, please write to:
Saskatchewan Ministry of Finance
9th Floor, 2350 Albert Street
Regina SK S4P 4A6
FCommuni@gov.sk.ca
72 Budget 2010-11 | Budget Summary
| | | |
| | | |
| | SASKATCHEWAN PROVINCIAL BUDGET | |
| | 10-11 | |
| | | |
| | GENERAL REVENUE FUND (GRF) BUDGET DETAILS | |
General Revenue Fund
Statement of Operations and Accumulated Deficit
| | | (thousands of dollars) | |
| | | | | | | | | | |
| | | | Estimated 2010-11 | | | | Forecast 2009-10 | | | | Estimated 2009-10 | |
| | | | | | | | | | | | | |
| Revenue | | $ | 9,949,900 | | | $ | 10,026,700 | | | $ | 10,660,800 | |
| Expense | | | 10,124,086 | | | | 10,112,285 | | | | 10,245,386 | |
Pre-Transfer Surplus (Deficit) | | $ | (174,186 | ) | | $ | (85,585 | ) | | $ | 415,414 | |
| Transfer (to) Growth and Financial Security Fund | | | – | | | | – | | | | (207,707 | ) |
| Transfer from Growth and Financial Security Fund | | | 194,186 | | | | 510,085 | | | | 216,793 | |
Surplus | | $ | 20,000 | | | $ | 424,500 | | | $ | 424,500 | |
| Accumulated Deficit, Beginning of Year | | | (546,428 | ) | | | (970,928 | ) | | | (970,928 | ) |
Accumulated Deficit, End of Year | | $ | (526,428 | ) | | $ | (546,428 | ) | | $ | (546,428 | ) |
General Revenue Fund
Statement of Change in Net Debt
| | | (thousands of dollars) | |
| | | | | | | | | | |
| | | | Estimated 2010-11 | | | | Forecast 2009-10 | | | | Estimated 2009-10 | |
| | | | | | | | | | | | | |
| Annual Surplus | | $ | 20,000 | | | $ | 424,500 | | | $ | 424,500 | |
| Acquisition of Capital Assets | | | (347,983 | ) | | | (420,630 | ) | | | (473,563 | ) |
| Amortization of Capital Assets (Gross) | | | 165,903 | | | | 153,599 | | | | 159,618 | |
| Disposal of Agricultural Land (Net) | | | 18,000 | | | | 14,000 | | | | 8,000 | |
(Increase) Decrease in Net Debt from Operations | | $ | (144,080 | ) | | $ | 171,469 | | | $ | 118,555 | |
| Net Debt, Beginning of Year | | | (3,676,583 | ) | | | (3,848,052 | ) | | | (3,848,052 | ) |
Net Debt, End of Year | | $ | (3,820,663 | ) | | $ | (3,676,583 | ) | | $ | (3,729,497 | ) |
74 Budget 2010-11 | Budget Summary
General Revenue Fund
Statement of Cash Flow
| | | | | | | | | | |
| | | (thousands of dollars) | |
| | | | | | | | | | |
| | | | Estimated 2010-11 | | | | Forecast 2009-10 | | | | Estimated 2009-10 | |
Operating Activities | | | | | | | | | | | | |
Surplus for the Year | | $ | 20,000 | | | $ | 424,500 | | | $ | 424,500 | |
| Add Non-cash Items: | | | | | | | | | | | | |
| Amortization of Foreign Exchange (Gain) Loss | | | 1,510 | | | | 877 | | | | 2,829 | |
| Amortization of Capital Assets | | | 165,903 | | | | 153,599 | | | | 159,618 | |
| (Gain) Loss on Loans, Investments and Capital Assets | | | (26,640 | ) | | | (22,700 | ) | | | (233 | ) |
| Net Change in Non-cash Operating Activities | | | (144,129 | ) | | | 333,150 | | | | (215,839 | ) |
| Earnings Retained in Sinking Funds | | | (82,128 | ) | | | (155,985 | ) | | | (99,172 | ) |
Cash Provided by (used for) Operating Activities | | $ | (65,484 | ) | | $ | 733,441 | | | $ | 271,703 | |
Ministry Capital Activities | | | | | | | | | | | | |
Acquisition of Capital Assets | | $ | (347,983 | ) | | $ | (420,630 | ) | | $ | (473,563 | ) |
| Proceeds on Disposal of Agricultural Land | | | 48,000 | | | | 40,000 | | | | 8,000 | |
Cash Provided by (used for) Ministry Capital Activities | | $ | (299,983 | ) | | $ | (380,630 | ) | | $ | (465,563 | ) |
Lending and Investing Activities | | | | | | | | | | | | |
Receipts | | $ | 902,018 | | | $ | 1,052,628 | | | $ | 1,141,259 | |
| Disbursements | | | (1,072,017 | ) | | | (661,030 | ) | | | (1,194,407 | ) |
Cash Provided by (used for) Lending and Investing Activities | | $ | (169,999 | ) | | $ | 391,598 | | | $ | (53,148 | ) |
Financing Activities | | | | | | | | | | | | |
Borrowing | | $ | 1,067,722 | | | $ | 715,858 | | | $ | 1,189,570 | |
| Debt Repayment | | | (687,320 | ) | | | (925,335 | ) | | | (959,863 | ) |
Cash Provided by (used for) Financing Activities | | $ | 380,402 | | | $ | (209,477 | ) | | $ | 229,707 | |
(Decrease) Increase in Cash 1 | | $ | (155,064 | ) | | $ | 534,932 | | | $ | (17,301 | ) |
| 1 | Cash also includes temporary, short-term (less than 30 days) investments. |
& #160; Budget Summary | Budget 2010-11 75
General Revenue Fund
Schedule of Revenue
| | | (thousands of dollars) | |
| | | | | | | | | | |
| | | | Estimated 2010-11 | | | | Forecast 2009-10 | | | | Estimated 2009-10 | |
Taxes | | | | | | | | | | | | |
| Corporation Income | | $ | 762,500 | | | $ | 880,200 | | | $ | 624,900 | |
| Fuel | | | 452,700 | | | | 443,000 | | | | 438,000 | |
| Individual Income | | | 1,964,700 | | | | 1,889,700 | | | | 1,802,600 | |
| Provincial Sales | | | 1,186,300 | | | | 1,130,600 | | | | 1,155,600 | |
| Tobacco | | | 235,100 | | | | 199,400 | | | | 190,500 | |
| Other | | | 257,900 | | | | 237,600 | | | | 247,300 | |
| Taxes | | $ | 4,859,200 | | | $ | 4,780,500 | | | $ | 4,458,900 | |
Non-Renewable Resources | | | | | | | | | | | | |
| Crown Land Sales | | $ | 202,800 | | | $ | 151,400 | | | $ | 127,800 | |
| Natural Gas | | | 42,200 | | | | 39,000 | | | | 102,200 | |
| Oil | | | 1,098,300 | | | | 1,188,300 | | | | 573,100 | |
| Potash | | | 221,000 | | | | (203,900 | ) | | | 1,926,800 | |
| Resource Surcharge | | | 398,700 | | | | 440,800 | | | | 461,800 | |
| Other | | | 145,000 | | | | 148,200 | | | | 177,200 | |
| Non-Renewable Resources | | $ | 2,108,000 | | | $ | 1,763,800 | | | $ | 3,368,900 | |
Transfers from Crown Entities | | | | | | | | | | | | |
| Crown Investments Corporation of Saskatchewan | | $ | 266,000 | | | $ | 185,000 | | | $ | 185,000 | |
| – Special Dividend | | | 10,000 | | | | 570,000 | | | | 110,000 | |
| Saskatchewan Liquor and Gaming Authority | | | 445,600 | | | | 427,300 | | | | 440,700 | |
| Other Enterprises and Funds | | | 46,900 | | | | 64,100 | | | | 41,200 | |
| Transfers from Crown Entities | | $ | 768,500 | | | $ | 1,246,400 | | | $ | 776,900 | |
Other Revenue | | | | | | | | | | | | |
| Fines, Forfeits and Penalties | | $ | 11,800 | | | $ | 12,800 | | | $ | 10,500 | |
| Interest, Premium, Discount and Exchange | | | 134,300 | | | | 225,300 | | | | 176,700 | |
| Motor Vehicle Fees | | | 152,400 | | | | 149,400 | | | | 149,400 | |
| Other Licences and Permits | | | 27,100 | | | | 33,300 | | | | 32,800 | |
| Sales, Services and Service Fees | | | 108,300 | | | | 119,400 | | | | 173,100 | |
| Transfers from Other Governments | | | 15,600 | | | | 18,500 | | | | 15,900 | |
| Other | | | 65,000 | | | | 70,900 | | | | 40,000 | |
| Other Revenue | | $ | 514,500 | | | $ | 629,600 | | | $ | 598,400 | |
| Own-Source Revenue | | $ | 8,250,200 | | | $ | 8,420,300 | | | $ | 9,203,100 | |
Transfers from the Government of Canada | | | | | | | | | | | | |
| Canada Health Transfer | | $ | 811,800 | | | $ | 819,300 | | | $ | 843,500 | |
| Canada Social Transfer | | | 342,400 | | | | 335,000 | | | | 335,000 | |
| Other | | | 545,500 | | | | 452,100 | | | | 279,200 | |
| Transfers from the Government of Canada | | $ | 1,699,700 | | | $ | 1,606,400 | | | $ | 1,457,700 | |
Revenue | | $ | 9,949,900 | | | $ | 10,026,700 | | | $ | 10,660,800 | |
76 Budget 2010-11 | Budget Summary
General Revenue Fund
Schedule of Expense
| | | (thousands of dollars) | |
| | | | | | | | | | |
| | | | | | | | | | |
Ministries and Agencies | | | | | | | | | |
Advanced Education, Employment and Labour | | $ | 846,131 | | | $ | 866,740 | | | $ | 838,425 | |
| Agriculture | | | 385,776 | | | | 398,329 | | | | 482,950 | |
| Corrections, Public Safety and Policing | | | 336,205 | | | | 336,897 | | | | 323,550 | |
| Education | | | 1,135,599 | | | | 1,193,244 | | | | 1,200,476 | |
| – Teachers’ Pensions and Benefits | | | 176,815 | | | | 149,169 | | | | 173,169 | |
| Energy and Resources | | | 37,720 | | | | 40,393 | | | | 42,542 | |
| Enterprise and Innovation Programs | | | 9,547 | | | | 23,233 | | | | 22,133 | |
| Enterprise Saskatchewan | | | 37,036 | | | | 45,406 | | | | 47,305 | |
| Environment | | | 174,299 | | | | 190,401 | | | | 200,001 | |
| Executive Council | | | 12,177 | | | | 12,259 | | | | 12,559 | |
| Finance | | | 60,353 | | | | 61,861 | | | | 64,406 | |
| – Public Service Pensions and Benefits | | | 264,474 | | | | 267,457 | | | | 264,411 | |
| Finance Debt Servicing | | | 435,000 | | | | 482,500 | | | | 502,500 | |
| First Nations and Métis Relations | | | 85,740 | | | | 90,549 | | | | 87,559 | |
| Government Services | | | 12,472 | | | | 11,684 | | | | 14,234 | |
| Health | | | 4,202,106 | | | | 3,950,773 | | | | 4,075,223 | |
| Highways and Infrastructure | | | 402,939 | | | | 428,706 | | | | 436,624 | |
| Information Technology Office | | | 16,472 | | | | 15,219 | | | | 15,828 | |
| Innovation Saskatchewan | | | 1,318 | | | | – | | | | – | |
| Justice and Attorney General | | | 140,350 | | | | 146,959 | | | | 144,034 | |
| Municipal Affairs | | | 382,207 | | | | 421,677 | | | | 343,946 | |
| Office of the Provincial Capital Commission | | | 10,082 | | | | 9,559 | | | | 9,595 | |
| Office of the Provincial Secretary | | | 3,417 | | | | 3,783 | | | | 3,959 | |
| Public Service Commission | | | 36,873 | | | | 49,945 | | | | 37,945 | |
| Saskatchewan Research Council | | | 16,633 | | | | 15,016 | | | | 15,016 | |
| Social Services | | | 753,703 | | | | 740,007 | | | | 719,272 | |
| Tourism, Parks, Culture and Sport | | | 110,071 | | | | 122,764 | | | | 130,530 | |
Legislative Assembly and its Officers | | | | | | | | | | | | |
Chief Electoral Officer | | | 1,679 | | | | 1,675 | | | | 1,179 | |
| Children’s Advocate | | | 1,621 | | | | 1,621 | | | | 1,621 | |
| Conflict of Interest Commissioner | | | 156 | | | | 151 | | | | 151 | |
| Information and Privacy Commissioner | | | 927 | | | | 927 | | | | 927 | |
| Legislative Assembly | | | 23,950 | | | | 23,727 | | | | 23,662 | |
| Ombudsman | | | 2,221 | | | | 2,195 | | | | 2,195 | |
| Provincial Auditor | | | 8,017 | | | | 7,459 | | | | 7,459 | |
Expense | | $ | 10,124,086 | | | $ | 10,112,285 | | | $ | 10,245,386 | |
; Budget Summary | Budget 2010-11 77
General Revenue Fund
Schedule of Debt
As at March 31
| | | (thousands of dollars) | |
| | | | | | | | | | | | | | | | |
| | | | | | | | | | | | | | | | |
Government General Debt | | $ | 6,093,112 | | | $ | (1,947,826 | ) | | $ | 4,145,286 | | | $ | 4,145,286 | | | $ | 4,138,050 | |
Crown Corporation General Debt | | | | | | | | | | | | | | | | | | | | |
| Information Services Corporation | | | | | | | | | | | | | | | | | | | | |
| of Saskatchewan | | | 13,547 | | | $ | – | | | $ | 13,547 | | | $ | 13,547 | | | $ | 13,547 | |
| Municipal Financing | | | | | | | | | | | | | | | | | | | | |
| Corporation of Saskatchewan | | | 15,000 | | | | – | | | | 15,000 | | | | 10,000 | | | | 1,062 | |
| Saskatchewan Crop | | | | | | | | | | | | | | | | | | | | |
| Insurance Corporation | | | – | | | | – | | | | – | | | | – | | | | 701 | |
| Saskatchewan Housing Corporation | | | 52,004 | | | | (21,679 | ) | | | 30,325 | | | | 31,669 | | | | 31,929 | |
| Saskatchewan Opportunities | | | | | | | | | | | | | | | | | | | | |
| Corporation | | | 39,943 | | | | (498 | ) | | | 39,445 | | | | 37,096 | | | | 48,501 | |
| Saskatchewan Power Corporation | | | 554,200 | | | | (2,107 | ) | | | 552,093 | | | | 508,855 | | | | 138,980 | |
| Saskatchewan Telecommunications | | | | | | | | | | | | | | | | | | | | |
| Holding Corporation | | | 30,200 | | | | – | | | | 30,200 | | | | 12,900 | | | | 8,900 | |
| Saskatchewan Water Corporation | | | 55,883 | | | | (3,902 | ) | | | 51,981 | | | | 46,584 | | | | 69,974 | |
| SaskEnergy Incorporated | | | 246,200 | | | | (3,555 | ) | | | 242,64 | | | | 259,039 | | | | 314,566 | |
| Crown Corporation | | | | | | | | | | | | | | | | | | | | |
| General Debt | | $ | 1,006,977 | | | $ | (31,741 | ) | | $ | 975,236 | | | $ | 919,690 | | | $ | 628,160 | |
Government Business Enterprise Specific Debt | | | | | | | | | | | | | | | | | | | | |
| Municipal Financing | | | | | | | | | | | | | | | | | | | | |
| Corporation of Saskatchewan | | $ | 105,000 | | | $ | (1,534 | ) | | $ | 103,466 | | | $ | 88,851 | | | $ | 66,897 | |
| Saskatchewan Gaming Corporation | | | 13,000 | | | | – | | | | 13,000 | | | | 6,000 | | | | – | |
| Saskatchewan Power Corporation | | | 2,782,065 | | | | (288,934 | ) | | | 2,493,131 | | | | 2,117,710 | | | | 2,719,792 | |
| Saskatchewan Telecommunications | | | | | | | | | | | | | | | | | | | | |
| Holding Corporation | | | 536,700 | | | | (65,304 | ) | | | 471,396 | | | | 255,686 | | | | 406,579 | |
| SaskEnergy Incorporated | | | 646,183 | | | | (55,051 | ) | | | 591,132 | | | | 564,266 | | | | 657,043 | |
| Government Business | | | | | | | | | | | | | | | | | | | | |
| Enterprise Specific Debt | | $ | 4,082,948 | | | $ | (410,823 | ) | | $ | 3,672,125 | | | $ | 3,032,513 | | | $ | 3,850,311 | |
Public Debt | | $ | 11,183,037 | | | $ | (2,390,390 | ) | | $ | 8,792,647 | | | $ | 8,097,489 | | | $ | 8,616,521 | |
Guaranteed Debt | | $ | 81,735 | | | $ | – | | | $ | 81,735 | | | $ | 27,045 | | | $ | 27,431 | |
78 Budget 2010-11 | Budget Summary
General Revenue Fund
Schedule of Borrowing Requirements
| | | (thousands of dollars) | |
| | | | | | | | | | |
| | | | | | | | | | |
Borrowing for Crown Corporations | | | | | | | | | |
Municipal Financing Corporation of Saskatchewan | | $ | 20,000 | | | $ | 60,908 | | | $ | 30,000 | |
| Saskatchewan Gaming Corporation | | | 7,000 | | | | 6,000 | | | | – | |
| Saskatchewan Opportunities Corporation | | | 15,000 | | | | – | | | | 18,300 | |
| Saskatchewan Power Corporation | | | 454,100 | | | | 369,900 | | | | 598,700 | |
| Saskatchewan Telecommunications Holding Corporation | | | 317,400 | | | | – | | | | 150,000 | |
| Saskatchewan Water Corporation | | | 17,000 | | | | 11,000 | | | | 33,300 | |
| SaskEnergy Incorporated | | | 105,000 | | | | 71,300 | | | | 218,800 | |
Borrowing for Crown Corporations | | $ | 935,500 | | | $ | 519,108 | | | $ | 1,049,100 | |
Borrowing for Government | | | 132,222 | | | | 196,750 | | | | 140,470 | |
Borrowing Requirements | | $ | 1,067,722 | | | $ | 715,858 | | | $ | 1,189,570 | |
; Budget Summary | Budget 2010-11 79
General Revenue Fund
Schedule of Guaranteed Debt
As at March 31
| | | | | | | | | | |
| | | | | | | | | | |
| | | (thousands of dollars) | |
| | | | | | | | | | |
| | | | | | | | | | |
Guaranteed Debt for Crown Corporations | | | | | | | | | |
The Power Corporation Act | | | | | | | | | |
| Saskatchewan Power Savings Bonds | | | | | | | | | |
| Series I to Series VII (matured) | | $ | – | | | $ | – | | | $ | 21 | |
| The Saskatchewan Development Fund Act | | | | | | | | | | | | |
| Guaranteed Investments | | | – | | | | – | | | | 639 | |
| The Saskatchewan Telecommunications Act | | | | | | | | | | | | |
| TeleBonds (matured) | | | – | | | | – | | | | 123 | |
Guaranteed Debt for Crown Corporations | | $ | – | | | $ | – | | | $ | 783 | |
Other Guaranteed Debt | | | | | | | | | | | | |
The Farm Financial Stability Act | | | | | | | | | | | | |
| Breeder Associations Loan Guarantees | | $ | 15,000 | | | $ | 14,000 | | | $ | 14,545 | |
| Feeder Associations Loan Guarantees | | | 16,000 | | | | 10,000 | | | | 8,101 | |
| Feedlot Construction Loan Guarantees | | | 4,000 | | | | 2,000 | | | | 2,453 | |
| Individual Feedlot Loan Guarantees | | | 1,000 | | | | 1,000 | | | | 500 | |
| Enhanced Feeder Loan Guarantees | | | – | | | | – | | | | 1,037 | |
| The Saskatchewan Housing Corporation Act | | | | | | | | | | | | |
| Headstart on a Home Loan Guarantees | | | 45,700 | 1 | | | – | | | | – | |
| The Student Assistance and Student Aid Fund Act | | | 35 | | | | 45 | | | | 12 | |
Other Guaranteed Debt | | $ | 81,735 | | | $ | 27,045 | | | $ | 26,648 | |
Guaranteed Debt | | $ | 81,735 | | | $ | 27,045 | | | $ | 27,431 | |
| 1 | The Government anticipates entering into an agreement with the federal government during 2010-11 to participate in the federal Immigrant Investor Program. It is expected that the terms of the agreement will require the General Revenue Fund to guarantee repayment to the federal government of all loan obligations incurred under the Program. |
80 Budget 2010-11 | Budget Summary
| | | |
| | | |
| | SASKATCHEWAN PROVINCIAL BUDGET | |
| | 10-11 | |
| | | |
| | SUMMARY FINANCIAL BUDGET DETAILS | |
Government of Saskatchewan
Summary Statement of Surplus
| | | (millions of dollars) | |
| | | | | | | | | | |
| | | | Estimated 2010-11 | | | | Forecast 2009-10 | | | | Estimated 2009-10 | |
| | | | | | | | | | | | | |
Treasury Board Organizations 1 | | | | | | | | | | | | |
| General Revenue Fund (GRF) | | $ | 20.0 | | | $ | 424.5 | | | $ | 424.5 | |
| Growth and Financial Security Fund | | | (194.2 | ) | | | (510.1 | ) | | | (9.1 | ) |
| Agricultural Credit Corporation of Saskatchewan | | | 1.5 | | | | 1.7 | | | | 2.2 | |
| Boards of Education | | | 31.9 | | | | 107.8 | | | | – | |
| Community Initiatives Fund | | | (1.5 | ) | | | (0.1 | ) | | | 0.7 | |
| Enterprise Saskatchewan | | | (7.9 | ) | | | 5.1 | | | | (7.9 | ) |
| Global Transportation Hub Authority | | | 2.2 | | | | 5.5 | | | | – | |
| Liquor and Gaming Authority | | | 445.6 | | | | 430.4 | | | | 440.7 | |
| Regional Colleges | | | 6.3 | | | | (0.3 | ) | | | (3.2 | ) |
| Regional Health Authorities | | | (76.0 | ) | | | (136.9 | ) | | | 11.7 | |
| Saskatchewan Agricultural Stabilization Fund | | | (8.4 | ) | | | (7.5 | ) | | | (7.7 | ) |
| Saskatchewan Cancer Agency | | | (10.2 | ) | | | (5.3 | ) | | | (6.8 | ) |
| Saskatchewan Financial Services Commission Fund | | | 7.9 | | | | 6.2 | | | | – | |
| Saskatchewan Health Information Network | | | 18.1 | | | | 21.9 | | | | (4.3 | ) |
| Saskatchewan Housing Corporation | | | (5.9 | ) | | | – | | | | – | |
| Saskatchewan Institute of Applied Science and Technology | | | (1.3 | ) | | | 1.2 | | | | (1.8 | ) |
| Saskatchewan Research Council | | | 0.3 | | | | 0.9 | | | | – | |
| Saskatchewan Student Aid Fund | | | (7.7 | ) | | | (14.4 | ) | | | (8.0 | ) |
| Saskatchewan Watershed Authority | | | (2.0 | ) | | | (6.3 | ) | | | (7.4 | ) |
| Other Organizations | | | (8.7 | ) | | | 20.9 | | | | 5.0 | |
Interagency Accounting Adjustments 2 | | | (145.7 | ) | | | 17.1 | | | | (21.1 | ) |
| Adjustment to account for pension costs on an accrual basis | | | (289.2 | ) | | | (425.7 | ) | | | (389.0 | ) |
| | | $ | (224.9 | ) | | $ | (63.4 | ) | | $ | 418.5 | |
| Dividends included in GRF surplus | | | (452.6 | ) | | | (432.3 | ) | | | (440.7 | ) |
| Surplus (Deficit) of Treasury Board Organizations | | $ | (677.5 | ) | | $ | (495.7 | ) | | $ | (22.2 | ) |
CIC Board Organizations 3 | | | | | | | | | | | | |
Crown Investments Corporation (non-consolidated) 4 | | $ | (70.3 | ) | | $ | (81.4 | ) | | $ | (87.6 | ) |
| CIC Asset Management Inc. | | | 5.2 | | | | (35.0 | ) | | | 18.7 | |
| Information Services Corporation | | | 10.9 | | | | 15.1 | | | | 17.0 | |
| SaskEnergy Incorporated | | | 58.1 | | | | 93.3 | | | | 71.8 | |
| Saskatchewan Gaming Corporation | | | 25.2 | | | | 25.4 | | | | 25.4 | |
| Saskatchewan Government Insurance | | | 42.7 | | | | 52.4 | | | | 40.6 | |
| Saskatchewan Opportunities Corporation | | | 2.8 | | | | 4.1 | | | | 5.0 | |
| Saskatchewan Power Corporation | | | 134.2 | | | | 102.8 | | | | 137.5 | |
| Saskatchewan Telecommunications Holding Corporation | | | 115.2 | | | | 129.0 | | | | 116.0 | |
| Saskatchewan Transportation Company | | | (0.7 | ) | | | (0.8 | ) | | | (1.1 | ) |
| Saskatchewan Water Corporation | | | 0.2 | | | | 0.5 | | | | (0.1 | ) |
Interagency Accounting Adjustments 2 | | | (73.6 | ) | | | 14.4 | | | | (99.9 | ) |
| | | $ | 249.9 | | | $ | 319.8 | | | $ | 243.3 | |
Dividends included in GRF surplus | | | (276.0 | ) | | | (755.0 | ) | | | (295.0 | ) |
| Retained Surplus of CIC Board Organizations | | $ | (26.1 | ) | | $ | (435.2 | ) | | $ | (51.7 | ) |
82 Budget 2010-11 | Budget Summary
Government of Saskatchewan
Summary Statement of Surplus
| | | (millions of dollars) | |
| | | | | | | | | | |
| | | | Estimated 2010-11 | | | | Forecast 2009-10 | | | | Estimated 2009-10 | |
Surplus (Deficit) Prior to | | | | | | | | | | | | |
| Not-for-Profit Insurance Organizations | | $ | (703.6 | ) | | $ | (930.9 | ) | | $ | (73.9 | ) |
Not-for-Profit Insurance Organizations 5 | | | | | | | | | | | | |
Saskatchewan Auto Fund | | $ | 0.3 | | | $ | (40.8 | ) | | $ | (25.4 | ) |
| Saskatchewan Crop Insurance Corporation | | | 51.3 | | | | 256.2 | | | | 21.6 | |
| Crop Reinsurance Fund of Saskatchewan | | | 20.7 | | | | 42.3 | | | | 47.8 | |
| Workers’ Compensation Board (Saskatchewan) | | | 8.6 | | | | 3.6 | | | | 5.1 | |
Surplus of Not-for-Profit Insurance Organizations | | $ | 80.9 | | | $ | 261.3 | | | $ | 49.1 | |
Surplus (Deficit) | | $ | (622.7 | ) | | $ | (669.6 | ) | | $ | (24.8 | ) |
| 1 | Budgets of these organizations are subject to Treasury Board review and include any transfers from the GRF. |
| 2 | Interagency Accounting Adjustments are to ensure financial transactions between agencies are effectively eliminated. |
| 3 | Budgets of these organizations are subject to CIC Board review and include grants from CIC. |
| 4 | CIC’s budgets and forecast excludes the dividend revenue it receives from its subsidiaries ($261.1M for 2010-11, $258.1M for 2009-10 Forecast and $307.8M for 2009-10 Budget). |
| 5 | These insurance organizations establish rates and fees that will allow them to be actuarily sound over the long term. |
| | Year ends of organizations may be different from the Government’s March 31 fiscal year end. |
Government of Saskatchewan
Summary Statement of Accumulated Surplus
| | | (millions of dollars) | |
| | | | | | | | | | |
| | | | | | | | | | |
Accumulated Surplus – Beginning of Year | | $ | 2,494.8 | | | $ | 1,396.9 | 1 | | $ | 1,396.9 | 1 |
| Adjustment – Boards of Education | | | – | | | | 1,527.4 | 2 | | | – | |
| Surplus (Deficit) | | | (622.7 | ) | | | (669.6 | ) | | | (24.8 | ) |
| Other Comprehensive Income | | | – | | | | 240.1 | 3 | | | – | |
Accumulated Surplus – End of Year | | $ | 1,872.1 | | | $ | 2,494.8 | | | $ | 1,372.1 | |
| 1 | Accumulated Surplus as at March 31, 2009 per 2008-09 Public Accounts. |
| 2 | The passage of The Education Amendment Act, 2009 (No.3) in the 2009 Spring Legislative session has resulted in Boards of Education becoming part of the Government’s Financial Reporting Entity. |
| 3 | This is primarily unrealized market gains (losses) on investments of the Workers’ Compensation Board and the Saskatchewan Auto Fund. |
& #160; Budget Summary | Budget 2010-11 83
Government of Saskatchewan
Summary Statement of Change in Net Debt
| | | (millions of dollars) | |
| | | | | | | | | | |
| | | | | | | | | | |
Surplus (Deficit) | | $ | (622.7 | ) | | $ | (669.6 | ) | | $ | (24.8 | ) |
Acquisition of GSO Capital Assets 1 | | | (668.7 | ) | | | (753.8 | ) | | | (729.2 | ) |
| Amortization Expense | | | 434.9 | | | | 428.6 | | | | 324.5 | |
| Proceeds from Disposal of Agricultural Land (Net) | | | 18.0 | | | | 14.0 | | | | 8.0 | |
Decrease (Increase) in Net Debt | | $ | (838.5 | ) | | $ | (980.8 | ) | | $ | (421.5 | ) |
| Net Debt, Beginning of Year | | | (3,861.8 | ) | | | (3,523.9 | )2 | | | (3,523.9 | )2 |
| Other Comprehensive Income | | | – | | | | 240.2 | 3 | | | – | |
| Adjustment – Boards of Education | | | – | | | | 402.7 | 4 | | | – | |
Net Debt, End of Year | | $ | (4,700.3 | ) | | $ | (3,861.8 | ) | | $ | (3,945.4 | ) |
| 1 | These amounts reflect capital acquisitions by government service organizations (GSOs) such as the GRF and regional health authorities. The amounts do not include capital assets acquired by government business enterprises (GBEs) such as SaskPower and SaskTel. |
| 2 | Net Debt as at March 31, 2009 per 2008-09 Public Accounts. |
| 3 | This is primarily unrealized market gains (losses) on investments of the Workers’ Compensation Board and the Saskatchewan Auto Fund. |
| 4 | To account for the Net Assets of Boards of Education as at April 1, 2009 on their inclusion in Government’s financial reporting entity. |
Government of Saskatchewan
Summary Schedule of Pension Liabilities
| | | (millions of dollars) | |
| | | | | | | | | | |
| | | | | | | | | | |
Pension Liabilities – Beginning of the Year | | $ | 5,900.7 | | | $ | 5,475.0 | 1 | | $ | 5,475.0 | 1 |
| Adjustment to account for pension costs on an accrual basis | | | 289.2 | | | | 425.7 | | | | 389.0 | |
Pension Liabilities – End of the Year | | $ | 6,189.9 | | | $ | 5,900.7 | | | $ | 5,864.0 | |
| 1 | Pension Liability as at March 31, 2009 as reported in the 2008-09 Public Accounts. |
84 Budget 2010-11 | Budget Summary
Government of Saskatchewan
Summary Schedule of Tangible Capital Assets
| | | (millions of dollars) | |
| | | | | | | | | | | | | | | | | | | | | | |
| | | Actual Net Book Value | | | – 2009-10 Forecast – | | | Forecasted Net Book Value | | | – 2010-11 Estimated – | | | Estimated Net Book Value | |
| | | March 31/09 | | | Additions | | | Amortization | | | March 31/10 | | | Additions | | | Amortization | | | March 31/11 | |
General Revenue Fund | | $ | 2,772.9 | | | $ | 420.6 | | | $ | (153.6 | ) | | $ | 3,039.9 | | | $ | 348.0 | | | $ | (165.9 | ) | | $ | 3,222.0 | |
| Treasury Board | | | | | | | | | | | | | | | | | | | | | | | | | | | | |
| Organizations | | | 2,916.4 | 1 | | | 325.1 | | | | (264.3 | ) | | | 2,977.2 | | | | 287.7 | | | | (262.8 | ) | | | 3,002.1 | |
| CIC Board Organizations | | | 6,169.2 | | | | 1,000.4 | | | | (467.6 | ) | | | 6,702.0 | | | | 1,333.7 | | | | (511.4 | ) | | | 7,524.3 | |
| Not-for-Profit | | | | | | | | | | | | | | | | | | | | | | | | | | | | |
| Insurance Organizations | | | 72.7 | | | | 11.3 | | | | (8.3 | ) | | | 75.7 | | | | 23.9 | | | | (14.5 | ) | | | 85.1 | |
Total Government | | $ | 11,931.2 | | | $ | 1,757.4 | | | $ | (893.8 | ) | | $ | 12,794.8 | | | $ | 1,993.3 | | | $ | (954.6 | ) | | $ | 13,833.5 | |
Government Service | | | | | | | | | | | | | | | | | | | | | | | | | | | | |
| Organizations (GSOs) | | $ | 5,893.2 | 1 | | $ | 753.8 | | | $ | (428.6 | ) | | $ | 6,218.4 | | | $ | 668.7 | | | $ | (434.9 | ) | | $ | 6,452.2 | |
| Government Business | | | | | | | | | | | | | | | | | | | | | | | | | | | | |
| Enterprises (GBEs) | | | 6,038.0 | | | | 1,003.6 | | | | (465.2 | ) | | | 6,576.4 | | | | 1,324.6 | | | | (519.7 | ) | | | 7,381.3 | |
Total Government | | $ | 11,931.2 | | | $ | 1,757.4 | | | $ | (893.8 | ) | | $ | 12,794.8 | | | $ | 1,993.3 | | | $ | (954.6 | ) | | $ | 13,833.5 | |
| 1 | Net book value of tangible capital assets has been increased by $1,112.7 to account for the inclusion of Boards of Education in the Financial Reporting Entity. |
| GBEs sell goods and services outside of government and are self sustaining such as SaskPower and the Liquor and Gaming Authority. |
| GSOs are all other government organizations that are not GBEs. |
The Province’s Summary Financial Statements account for GBEs on an equity basis. Therefore tangible capital assets of GBEs such as SaskPower are netted against its other assets and liabilities and the resultant equity is shown as an investment in GBEs.
The above amounts reflect capital asset acquisitions of Government organizations and do not include government transfers to acquire capital assets by non-government organizations such as universities and municipalities.
� 60; Budget Summary | Budget 2010-11 85
Government of Saskatchewan
Summary Schedule of Debt
As at March 31
| | | (millions of dollars) | |
| | | | | | | | | | | | | | | | |
| | | | | | | | | | | | | | | | |
| | | | | | | | | | | | | | | | |
| Treasury Board Organizations | | | | | | | | | | | | | | | |
GRF – Government Public Debt | | $ | 4,145.3 | | | $ | – | | | $ | 4,145.3 | | | $ | 4,145.3 | | | $ | 4,138.0 | |
| Boards of Education | | | – | | | | 80.6 | | | | 80.6 | | | | 112.3 | | | | – | |
| Municipal Financing Corporation | | | | | | | | | | | | | | | | | | | | |
| of Saskatchewan | | | 118.5 | | | | – | | | | 118.5 | | | | 98.9 | | | | 68.0 | |
| Regional Health Authorities | | | – | | | | 89.0 | | | | 89.0 | | | | 85.0 | | | | 80.8 | |
| Saskatchewan Housing Corporation | | | 30.3 | | | | 8.9 | | | | 39.2 | | | | 41.7 | | | | 41.9 | |
| Other | | | – | | | | 2.2 | | | | 2.2 | | | | 2.1 | | | | 1.8 | |
Public Debt of | | | | | | | | | | | | | | | | | | | | |
| Other Treasury Board Organizations | | $ | 148.8 | | | $ | 180.7 | | | $ | 329.5 | | | $ | 340.0 | | | $ | 192.5 | |
Public Debt of | | | | | | | | | | | | | | | | | | | | |
| Treasury Board Organizations | | $ | 4,294.1 | | | $ | 180.7 | | | $ | 4,474.8 | | | $ | 4,485.3 | | | $ | 4,330.5 | |
CIC Board Organizations | | | | | | | | | | | | | | | | | | | | |
| CIC Asset Management Inc. | | $ | – | | | $ | – | | | $ | – | | | $ | – | | | $ | 32.4 | |
| Information Services Corporation | | | | | | | | | | | | | | | | | | | | |
| of Saskatchewan | | | 13.5 | | | | – | | | | 13.5 | | | | 13.5 | | | | 13.5 | |
| Saskatchewan Gaming Corporation | | | 13.0 | | | | 8.6 | | | | 21.6 | | | | 20.2 | | | | 14.2 | |
| Saskatchewan Opportunities Corporation | | | 39.4 | | | | – | | | | 39.4 | | | | 37.1 | | | | 48.5 | |
| Saskatchewan Power Corporation | | | 3,045.2 | | | | 75.7 | | | | 3,120.9 | | | | 2,706.3 | | | | 2,937.7 | |
| Saskatchewan Telecommunications | | | 501.6 | | | | 6.3 | | | | 507.9 | | | | 275.2 | | | | 422.0 | |
| Saskatchewan Water Corporation | | | 52.0 | | | | – | | | | 52.0 | | | | 46.6 | | | | 70.0 | |
| SaskEnergy Incorporated | | | 833.8 | | | | 4.8 | | | | 838.6 | | | | 828.1 | | | | 977.5 | |
| Other CIC Board Organizations | | | – | | | | 42.5 | | | | 42.5 | | | | – | | | | – | |
Public Debt of CIC Board Organizations | | $ | 4,498.5 | | | $ | 137.9 | | | $ | 4,636.4 | | | $ | 3,927.0 | | | $ | 4,515.8 | |
| Not-for-Profit Insurance Organizations | | | | | | | | | | | | | | | | | | | | |
| Saskatchewan Crop Insurance Corporation | | $ | – | | | $ | – | | $ | | – | | | $ | – | | | $ | 0.7 | |
Public Debt of Not-for-Profit | | | | | | | | | | | | | | | | | | | | |
| Insurance Organizations | | $ | – | | | $ | – | | | $ | – | | | $ | – | | | $ | 0.7 | |
Public Debt 2 | | $ | 8,792.6 | | | $ | 318.6 | | | $ | 9,111.2 | | | $ | 8,412.3 | | | $ | 8,847.0 | |
Guaranteed Debt | | $ | 36.1 | | | $ | 5.4 | | | $ | 41.5 | | | $ | 32.5 | | | $ | 33.0 | |
| 1 | Debt obtained by the General Revenue Fund for its own use or on behalf of Crown corporations. The amount is net of sinking funds. Debt repayable in foreign currency is restated in Canadian dollars equivalents. |
| 2 | The Province’s Summary Financial Statements account for Government Business Enterprises such as SaskPower on an equity basis. Therefore debt of GBEs (except general lending by the GRF to GBEs) is netted against other liabilities and assets and the resultant equity is shown as Investment in GBEs. |
86 Budget 2010-11 | Budget Summary
Government of Saskatchewan
Notes to the Summary Financial Budget
REPORTING ENTITY
The Summary Financial Budget reports the planned financial activities of the General Revenue Fund and organizations controlled by Government. This reporting entity is the same as used in the Government’s Summary Financial Statements in the Public Accounts. Significant changes for 2009-10 are the establishment of the Global Transportation Hub Authority and the inclusion of Boards of Education.
Passage of The Education Amendment Act, 2009 (No. 3) Act requires inclusion of the Boards of Education in the Government’s financial reporting entity. Inclusion of Boards of Education meant that their financial reporting had to be compliant with the standards set by The Public Sector Accounting Board of the Canadian Institute of Chartered Accountants. These standards require that capital assets be amortized over their useful life rather than expensed upon acquisition as was the practice with the Boards of Education. The Boards of Education have been included in the Summary Budget in a PSAB compliant manner.
METHOD OF CONSOLIDATION
There are two basic methods of combining the activities of organizations in the reporting entity. One is to combine each organization on a line-by-line basis where all assets, liabilities, revenue, and expenses are added together and significant inter-organization balances and transactions are eliminated. The other approach is referred to as the modified equity method where the equity and net income of each organization is combined with the central organization, the General Revenue Fund. Both methods arrive at the same bottom-line financial results and position.
The Public Accounts uses both methods. A line-by-line consolidation is used for government service organizations like regional health authorities and the modified equity method is used for government business enterprises, like SaskPower. The Summary Financial Budget combines all organizations on a modified equity basis for the purposes of calculating the Government’s surplus.
GOVERNMENT BUSINESS ENTERPRISES (GBE)
These are self-sufficient government organizations that have the financial and operating authority to sell goods and services to individuals and organizations outside the government as their principal activity. These organizations comprise: Liquor and Gaming Authority, Municipal Financing Corporation, the Auto Fund, Saskatchewan Gaming Corporation, SGI, SaskPower, SaskTel, SaskEnergy and the Workers’ Compensation Board.
GOVERNMENT SERVICE ORGANIZATIONS (GSO)
All government organizations including the General Revenue Fund that are not government business enterprises are considered government service organizations. Typically government service organizations provide public services and require government grants to sustain their operations such as regional health authorities. Other government service organizations like Saskatchewan Transportation Company sell services but are not self sufficient, while other government service organizations like Information Services Corporation are self sufficient but their revenues are considered more akin to a levy or tax.
& #160; Budget Summary | Budget 2010-11 87
INTERAGENCY ACCOUNTING ADJUSTMENTS
The Summary Financial Budget – Statement of Surplus reflects the forecasted surplus of the various government organizations based on their specific fiscal year. Adjustments are made to ensure transfer payments from the GRF or CIC are reflected as grant revenue by the recipient organization in the same fiscal year.
GOVERNMENT OF SASKATCHEWAN
Description of Government Organizations
Categorization of Government Organizations
The summary financial budget categorizes organizations by which Cabinet Committee, Treasury Board and Crown Investment Corporation (CIC) Board, would examine the organization’s budget and plans. The other categorization is the Not-for-Profit Insurance organizations. These organizations are intended to be actuarially sound over the long term. They will typically adjust their rates to break even over the longer term. The General Revenue Fund does not take a dividend from these organizations
TREASURY BOARD ORGANIZATIONS
Agricultural Credit Corporation of Saskatchewan (ACS)
ACS was established pursuant to the provisions of The Agricultural Credit Corporation Act which came into force on January 1, 1984. ACS manages a food industry development division and manages the wind down of the corporation’s agricultural loan portfolio, agri-food investment portfolio, and loan guarantee program.
Boards of Education
Twenty-nine Boards of Education and the Conseils d’écoles fransaskois operate under the authority of The Education Act. The Boards work with the Ministry of Education to strengthen the performance and accountability of the school system under their Continuous Improvement Framework. Boards are responsible for delivering the educational program including curriculum and instruction, and programs for children and youth. Boards are required to comply with provincial statutes, regulations and policies and, as elected bodies, are accountable to their local electors. Boards receive operating and capital funding from the provincial government as well as local property taxes in their jurisdiction.
Community Initiatives Fund
The Community Initiatives Fund has operated since 1996 according to the provisions of The Saskatchewan Gaming Corporation Act 1994. It is managed by a Board of Trustees consisting of eight people appointed by the Lieutenant Governor in Council. The Fund receives 25 per cent of the net profits of the Saskatchewan Gaming Corporation minus $2 million for the Métis Development Fund. The Community Initiatives Fund provides grants for activities that strengthen human development and community vitality.
Enterprise Saskatchewan (ES)
Enterprise Saskatchewan (ES) was established in 2008 as the central economic development agency of Government, pursuant to The Enterprise Saskatchewan Act. ES brings together representation from all sectors of the economy to formulate strategy and recommend action to move the province forward on a sustainable growth agenda in accordance with the principles set out in the Act. ES provides the Government advice to remove barriers to growth;
88 Budget 2010-11 | Budget Summary
implements activities and programs that would promote and develop the Saskatchewan economy; and establishes and reports on clear and measurable targets for performance of the Saskatchewan economy.
Global Transportation Hub Authority (GTHA)
GTHA was established in 2009 by Order in Council pursuant to the provisions of The Crown Corporations Act, 1993. The GTHA is responsible for the planning management and promotion of the Global Transportation Hub in a manner that creates an investment and operating environment for business that is secure, efficient, coordinated and orderly; and is consistent with the social and economic development of the Province.
Regional Colleges
Seven regional colleges, operating under the authority of The Regional Colleges Act, provide educational services and programs in over 40 locations throughout the Province. Through partnerships with universities and technical institutes such as SIAST, regional colleges deliver credit programs in response to the needs of rural and northern Saskatchewan. Regional colleges also offer literacy and basic education, industry credit and non-credit programs based on local needs and provide a broad array of counselling and assessment services geared to assisting individuals with career planning.
Regional Health Authorities (RHAs)
The Regional Health Services Act was proclaimed on August 1, 2002. Health services in Saskatchewan are delivered by 12 regional health authorities. Major services of responsibility include:
| · | Health centres, wellness centres, and social centres; |
| · | Emergency response services, including first responders, ambulance; |
| · | Supportive Care, such as long-term care, day programs, respite, palliative care and programs for patients with multiple disabilities; |
| · | Community health services, such as public health nursing, public health inspection, dental health, vaccinations, and speech pathology; |
| · | Mental health services; and, |
| · | Rehabilitation services. |
Saskatchewan Agricultural Stabilization Fund
The Fund was established under The Farm Financial Stability Act. The following programs exist within the Fund: New Crops Insurance Program, Wildlife Damage Compensation Program,, Canadian Farm Income Program, Farm and Ranch Water Infrastructure Program and Specified Risk Material Management Program.
Saskatchewan Cancer Agency (SCA)
SCA was established pursuant to The Cancer Foundation Act which was superseded by The Cancer Agency Act on January 2, 2007. SCA is responsible for the planning, organization, and delivery and evaluation of cancer care services throughout Saskatchewan in collaboration with regional health
& #160; Budget Summary | Budget 2010-11 89
authorities and health care organizations. SCA provides for the detection, diagnosis, testing, treatment and monitoring of individuals; treatment or rehabilitation services; education of health care providers and Saskatchewan residents respecting cancer and the prevention of cancer; prevention and screening; and cancer research and studies.
Saskatchewan Health Information Network (SHIN)
SHIN was established by Order-in-Council pursuant to the provisions of The Crown Corporations Act, 1993. SHIN’s mandate is to implement, own, operate and manage the provincial health information network and deliver information technology solutions in a timely, effective manner reflecting the priorities of the health system. The information network is connecting front-line care providers and delivery organizations across the province, providing them with timely and secure access to information they need in continuing to improve health care services for the people of the province.
Saskatchewan Housing Corporation (SHC)
SHC operates under the authority of The Saskatchewan Housing Corporation Act. The Corporation provides suitable and affordable housing for moderate to low-income seniors, and for families and individuals with an identified need. SHC also improves access to other housing programs and services that enable its clients to achieve or maintain independence. SHC funds and administers nearly 31,000 housing units for about 67,000 people in over 300 communities through local housing authorities and non-profit organizations. SHC receives funding from the GRF, Canada Mortgage and Housing Corporation and municipalities.
Saskatchewan Institute of Applied Science and Technology (SIAST)
SIAST operates under the authority of The Saskatchewan Institute of Applied Science and Technology Act. SIAST provides post-secondary technical education and skills training through its four urban campuses in Regina, Saskatoon, Moose Jaw and Prince Albert and a Virtual Campus to help meet the needs of students and employers. SIAST’s enrollment is almost 15,000 full load equivalent students.
SIAST’s offers 190 certificate, diploma and apprenticeship programs through six divisions: Business and Entrepreneurial Studies; Community Services; Industrial Training; Nursing; Science and Health; and Technology. In addition, SIAST offers basic skill development programs in Adult Basic Education; Basic Literacy; English as a Second Language; General Educational Development (GED) Testing and Preparation; High School Completion; and Life Skills.
Saskatchewan Liquor and Gaming Authority (SLGA)
SLGA is governed by The Alcohol and Gaming Regulation Act, 1997. SLGA is responsible for the distribution, regulation, management and operation of liquor and gaming across the province. SLGA warehouses and distributes wine, spirits and domestic and imported beer to SLGA stores and franchises for sale to the public and permittees. Most mainstream beer is distributed by Brewer’s Distribution Ltd. to retail liquor stores, some franchises and commercial permittees. SLGA owns and operates all video lottery terminals and owns and manages the slot machines at all Saskatchewan Indian Gaming Authority casinos. SLGA also licenses and regulates most forms of gaming including bingo, raffles, casinos, breakopen tickets, and horse racing.
90 Budget 2010-11 | Budget Summary
Saskatchewan Research Council (SRC)
SRC was established in 1947 at a time when people were very aware of the role that science and technology played in winning the Second World War. The concept was that science and technology could be an instrument to build a better life for Saskatchewan people. The Council undertakes matters pertaining to research, development, design, consultation, innovation, and commercialization of science for the improvement of the Province. SRC creates wealth through the responsible application of science and technology to assist Saskatchewan industry to be globally competitive.
Saskatchewan Student Aid Fund
The Saskatchewan Student Aid Fund operates under the authority of The Student Assistance and Student Aid Fund Act, 1985. The primary purpose of the Fund is to support the Saskatchewan Student Assistance Program.
Saskatchewan Watershed Authority
The Saskatchewan Watershed Authority is the province’s lead water management agency with a mandate to:
| · | Manage the water supply for social, economic and environmental needs; |
| · | Protect the quality of surface and ground water; |
| · | Reduce damage from flooding; |
| · | Develop, own and manage the province’s water management infrastructure; and, |
| · | Collect and analyze data and provide information to support water management and use. |
CIC BOARD ORGANIZATIONS
Crown Investments Corporation of Saskatchewan (CIC)
CIC is the financially self-sufficient holding company for 11 subsidiary commercial Crown corporations. The Government Finance Office (GFO) was established in 1947 to act as a holding company for many of Saskatchewan’s Crown corporations and to be a mechanism for developing broad policy control, directing investment, and routing dividends into the government’s consolidated fund. In 1978, the GFO was renamed Crown Investments Corporation of Saskatchewan, with a focus on the delivery of strategic shareholder direction and contributing to the province’s economic success. The Crown Corporations Act, 1993, is the current governing legislation.
CIC Asset Management Inc. (formerly Investment Saskatchewan Inc.)
Effective September 10, 2009, Investment Saskatchewan was de-designated as a Crown corporation and continues to operate as CIC Asset Management Inc with CIC as sole shareholder. The corporation’s mandate is to prudently manage and divest the portfolio of investments, previously managed by Investment Saskatchewan, on behalf of the Province.
Information Services Corporation of Saskatchewan (ISC)
ISC is responsible for the administration of land titles, geographic information systems, vital statistics, surveys, mapping and interests in personal property. Effective October 2010, the management and administration of the Corporations Branch will be transferred from the Ministry of Justice to ISC. ISC was established on January 1, 2000 as a wholly-
& #160; Budget Summary | Budget 2010-11 91
owned subsidiary of CIC and provides customer-focused services such as the Land Registry, the Saskatchewan Personal Property Registry, the Survey Plan Registry, Vital Statistics Registry and Geomatics services.
SaskEnergy Incorporated (SaskEnergy)
Saskatchewan’s provincially owned natural gas system began operations in 1952 as part of SaskPower. SaskEnergy, which is a wholly-owned subsidiary of CIC, was formed in 1988 as a separate corporation to continue providing natural gas transmission and distribution services across the province. The system has grown substantially over the years, with service now extended to more than 90 per cent of Saskatchewan communities. Today SaskEnergy provides safe, reliable and economical natural gas service to more than 347,000 residential, farm, commercial and industrial customers in the province.
Saskatchewan Gaming Corporation (SaskGaming)
SGC was established under The Saskatchewan Gaming Corporation Act, 1994 to operate Casino Regina and Casino Moose Jaw under a framework agreement that provides for sharing of net profits between the government, First Nations Trust and the Community Initiatives Fund. Casino Regina opened to the public January 26, 1996 and Casino Moose Jaw opened on September 6, 2002. The corporation’s Act was amended in 2007 to effectively place the corporation under the management of the CIC Board as a wholly-owned subsidiary of CIC.
Saskatchewan Government Insurance (SGI)
SGI was established in 1945 to provide affordable, good quality insurance to Saskatchewan people. Under the trade name SGI CANADA, which is a wholly-owned subsidiary of CIC, it conducts a competitive property and casualty insurance business in seven Canadian provinces. It offers a comprehensive line of home, tenant, farm, automobile extension and commercial coverage.
Saskatchewan Opportunities Corporation (SOCO)
SOCO is a wholly-owned subsidiary of CIC which was established in 1994. SOCO supports the growth and success of Saskatchewan’s technology sector through the development and operation of research parks at the province’s two universities in Saskatoon and Regina, and a forest sector building in downtown Prince Albert. SOCO operates under the brand name of Innovation Place.
Saskatchewan Power Corporation (SaskPower)
SaskPower is a wholly-owned subsidiary of CIC that was established as the Saskatchewan Power Commission in 1929. Its purpose was to provide safe, reliable, cost-effective power to Saskatchewan people. Today, SaskPower maintains this purpose and is the principal supplier of electricity in Saskatchewan to more than 460,000 residential, farm, commercial, oilfield, power and reseller customers.
Saskatchewan Telecommunications (SaskTel)
SaskTel is a wholly-owned subsidiary of CIC which was established as the Department of Railway, Telephones and Telegraphs in 1908. The corporation is the leading full service provider in Saskatchewan of voice, data, dial up and high speed internet, entertainment and multimedia services, security, web hosting, text and messaging services, and cellular and wireless data services over its digital networks.
92 Budget 2010-11 | Budget Summary
Saskatchewan Transportation Company (STC)
STC is a wholly-owned subsidiary of CIC that has been providing passenger transportation, parcel express and freight services throughout the province since 1946. The bus company was established to ensure that as many communities as possible have access to reasonably priced transportation. Today STC and its network of 198 agencies operate 29 bus routes serving 290 communities in the province. STC’s connections with partner carriers extend service to nearly 400 communities.
Saskatchewan Water Corporation (SaskWater)
SaskWater is a wholly-owned subsidiary of CIC which was established in 1984. Headquartered in Moose Jaw, SaskWater designs, builds, owns and operates water supply and wastewater systems providing quality water to Saskatchewan industries, municipalities, First Nations and rural water user groups.
NOT-FOR-PROFIT INSURANCE ORGANIZATIONS
Saskatchewan Auto Fund
The Fund is the Province’s compulsory auto insurance program and the provider of its driver’s licensing and vehicle registration system.. The Fund does not receive or provide money to the Province. The Fund is administered by SGI.
Saskatchewan Crop Insurance Corporation (SCIC)
SCIC operates under the authority of The Crop Insurance Act and The Farm Financial Stability Act. The Corporation administers insurance programs which protect crop and livestock producers from production failures due to natural hazards. The Corporation also delivers the Waterfowl Damage Compensation Program and the Big Game Damage Compensation Program.
Crop Reinsurance Fund of Saskatchewan
The Fund provides reinsurance coverage for the Saskatchewan Crop Insurance Corporation against losses in excess of the net premiums, indemnities and accumulated reserves. Reinsurance for the Saskatchewan crop insurance program is provided by the federal and provincial governments under the terms of the Canada-Saskatchewan Production Insurance Agreement. Payments are made from each government’s reinsurance fund based on a formula set out in the agreement and each is responsible for the accumulated deficits of their fund.
Workers’ Compensation Board (WCB)
The WCB was established in 1930. It is a no fault insurance program that protects workers and employers from the results of work injuries. The WCB collects annual premiums from employers and uses those funds to compensate injured workers for lost income and expenses with the objective of returning them to safe, productive work as soon as medically possible. Further, the WCB seeks to develop and deliver injury prevention programs and services with the goal of eliminating workplace injuries.
& #160; Budget Summary | Budget 2010-11 93