| | The Honourable Ken Krawetz Deputy Premier Minister of Finance | |
| | | |
| SASKATCHEWAN PROVINCIAL BUDGET |
| 12-13 |
| | | |
| KEEPING THE SASKATCHEWAN ADVANTAGE |
| | BUDGET SUMMARY | |
MINISTER’S MESSAGE
I’m pleased to table the 2012-13 Budget and supporting documents for public discussion and review.
Over the past few years, Saskatchewan people have helped to create the “Saskatchewan Advantage,” a combination of balanced budgets, reduced debt and lower taxes, a strong and growing economy and the tremendous quality of life we all enjoy.
Our province is now the best place in Canada to live, work, start a business, receive an education, raise a family and build a life.
Saskatchewan has become a magnet for people across the country and around the world, recording the largest population growth in any census period since Statistics Canada started doing the census every five years in 1956.
People are coming here because they recognize that Saskatchewan is now a place of opportunity.
KEEPING THE SASKATCHEWAN ADVANTAGE
The 2012-13 Budget is all about “Keeping the Saskatchewan Advantage.”
While other jurisdictions post deficits, Saskatchewan will once again balance its budget.
While other provinces struggle with sluggish growth, Saskatchewan is projected to lead the nation in economic growth.
Even in a time of global uncertainty, our government’s focus will remain squarely on enhancing and preserving Saskatchewan’s quality of life through prudent fiscal management.
This year’s budget also strives to make life more affordable and provide better access to health care.
This budget provides for enhancements to the Active Families Benefit, as well as for the introduction of a Saskatchewan Advantage scholarship and a Saskatchewan Advantage grant for education savings.
In health care, we’re investing $50 million in the Saskatchewan Surgical Initiative and providing a 3.5 per cent funding increase for Regional Health Authorities. We’re also improving primary health care and establishing a new rural doctor locum pool. And we’re committing $4 million to expand the colorectal screening program province-wide, providing a valuable early detection tool to Saskatchewan people.
Our province’s enhanced population growth has created challenges in some communities for people who require housing.
Last year, we introduced a five-point plan to increase the supply of affordable housing, which helped a great deal.
We’re building on that success in this budget with several new initiatives.
The First-Time Homebuyers Tax Credit will provide eligible Saskatchewan residents with a non-refundable credit of up to $1,100 on their income tax.
We’re also creating an innovative tax incentive for the private sector to invest in new multi-unit residential rental projects in our province.
KEEPING OUR PROMISES
This budget is also about keeping promises. In last fall’s provincial election campaign, we made a commitment to continue balancing the budget and sustaining programs while remaining fiscally responsible. We also promised to improve the quality of life for people across Saskatchewan.
With this budget, we’re introducing the Seniors Personal Care Home Benefit. We’re increasing benefits in both the Seniors Income Plan and Saskatchewan Assured Income for Disability programs.
We’re increasing funding for the treatment of autism. We’re creating 500 new child care spaces. And we’re providing for an array of other initiatives aimed at enhancing the quality of life of seniors, families, children, and every other citizen of our province.
Saskatchewan people have worked hard over the past few years to establish the Saskatchewan Advantage.
Our government intends to do everything we can in the years ahead to keep it.
/s/ Ken Krawetz
Honourable Ken Krawetz
Minister of Finance
TABLE OF CONTENTS
MINISTER’S MESSAGE
| GOVERNMENT DIRECTION FOR 2012-13 | | | 6 | |
TECHNICAL PAPERS | | | | |
The Saskatchewan Economy | | | 25 | |
General Revenue Fund Financial Outlook | | | 35 | |
General Revenue Fund 2011-12 Financial Update | | | 48 | |
Saskatchewan’s Tax Expenditures | | | 49 | |
2012 Intercity Comparison of Taxes, Utilities and Housing | | | 53 | |
2012-13 Borrowing and Debt | | | 59 | |
Growth and Financial Security Fund | | | 64 | |
Debt Retirement Fund | | | 65 | |
2012-13 Housing Initiatives | | | 66 | |
2012-13 Revenue Initiatives | | | 70 | |
GENERAL REVENUE FUND (GRF) FINANCIAL TABLES | | | | |
GRF – Statement of Operations and Accumulated Deficit | | | 74 | |
GRF – Statement of Change in Net Debt | | | 74 | |
GRF – Statement of Cash Flow | | | 75 | |
GRF – Schedule of Revenue | | | 76 | |
GRF – Schedule of Expense | | | 77 | |
GRF – Schedule of Borrowing Requirements | | | 78 | |
GRF – Schedule of Debt | | | 79 | |
GRF – Schedule of Guaranteed Debt | | | 80 | |
SUMMARY FINANCIAL STATEMENT (SFS) FINANCIAL TABLES | | | | |
Summary Statement of Surplus | | | 82 | |
Summary Statement of Accumulated Surplus | | | 83 | |
Summary Statement of Change in Net Debt | | | 84 | |
Summary Schedule of Pension Liabilities | | | 84 | |
Summary Schedule of Tangible Capital Assets | | | 85 | |
Summary Schedule of Debt | | | 86 | |
Notes to the Summary Financial Budget | | | 87 | |
| | | |
| | | |
| | SASKATCHEWAN PROVINCIAL BUDGET | |
| | | |
| | | |
| GOVERNMENT DIRECTION FOR 2012-13 |
Government Direction for 2012-13:
KEEPING THE SASKATCHEWAN ADVANTAGE
In the fall of 2011, the government was given a renewed mandate to continue making this province the best place in the country to live, work and raise a family.
That means balanced budgets, strong economic growth and an unparalleled quality of life. Those are the hallmarks of the Saskatchewan Advantage.
At a time when other jurisdictions struggle with slow economic growth, growing debt and deficits, Saskatchewan is leading the way with sound provincial finances and a growing economy.
We are a “have” province with record population growth and opportunities unprecedented in our history.
This provides us with the opportunity to make improvements to key programs in health, education and social services, while ensuring all programs and services remain sustainable through disciplined fiscal management.
This budget is about building on our strengths in education and innovation. It is about further improving the infrastructure that promotes economic growth. It is about caring for the vulnerable.
This budget is about keeping the Saskatchewan Advantage.
VISION – Saskatchewan will be the best place in Canada – to live, to work, to start a business, to get an education, to raise a family and to build a life. The Government has identified four new goals to set direction for the province: |
• • | Sustaining growth and opportunities for Saskatchewan people Improving our quality of life Making life more affordable Delivering responsive and responsible government |
GROWTH AND OPPORTUNITY
Saskatchewan is blessed with many natural resources, abundant energy supplies, diverse mineral deposits and a large, rich land base that continues to grow high quality grains and oilseeds.
Unpredictable weather patterns and international economic conditions have an influence on the supply and demand for these products and prices can be extremely volatile. But year after year, Saskatchewan continues to produce a large surplus of food and energy, helping to supply a hungry world with what it needs.
6 Budget 2012-13 | Budget Summary
Substantial Growth
A variety of economic indicators demonstrate the significant growth that is occurring in Saskatchewan. More people are coming here to seek better opportunities, to find work and to become part of our community.
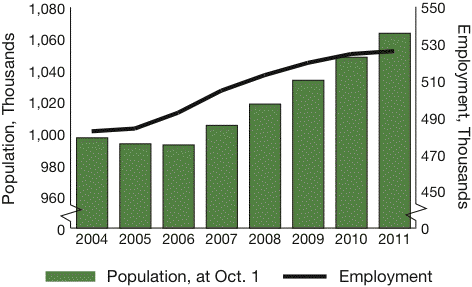
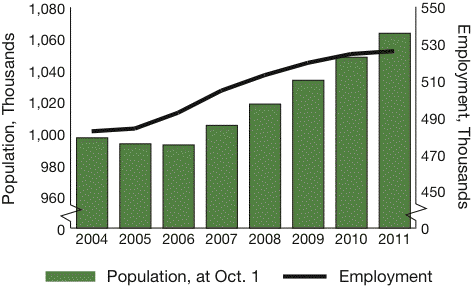
Saskatchewan’s population reached a record high of 1,063,535 people in October of 2011.
SASKATCHEWAN POPULATION AND EMPLOYMENT
Source: Statistics Canada
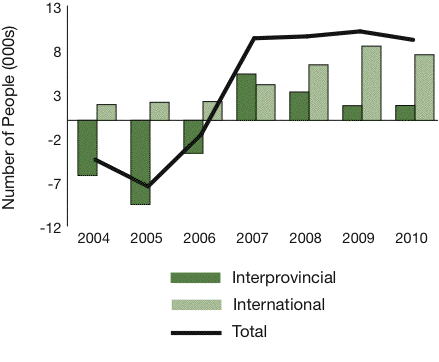
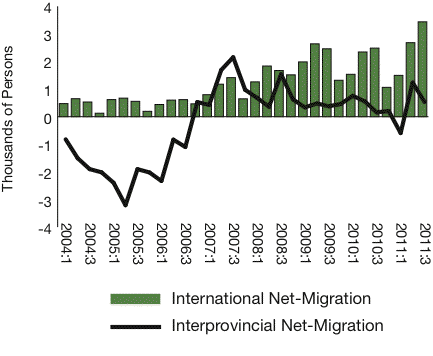
Immigration to our province has been strong of late and will continue to grow as trade missions and job fairs seek out new employees for our growing industries.
NET MIGRATION
Source: Statistics Canada
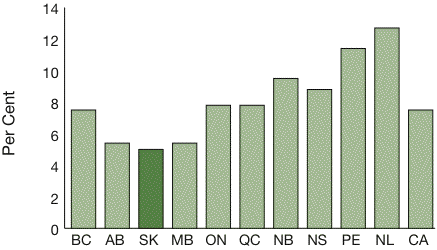
Saskatchewan is seeing high employment levels and has had the lowest unemployment rate across Canada for the past three years. More people are needed in our province to meet the increasing demands of the tight labour market.
UNEMPLOYMENT RATE COMPARED
ACROSS PROVINCES (2011)
Source: Statistics Canada
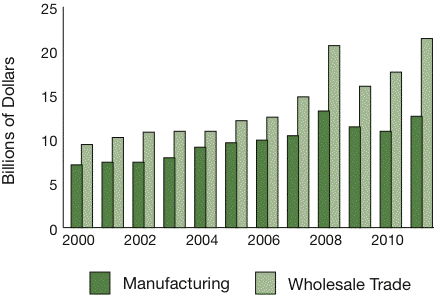
Saskatchewan set new records for manufacturing shipments in 2008 and wholesale trade set a new record in 2011.
Budget Summary | Budget 2012-13 7
MANUFACTURING AND WHOLESALE
TRADE – SASKATCHEWAN 2000 TO 2011
Source: Statistics Canada
This is a strong indicator of the health of our economy, particularly when compared to other provinces in Canada. Every year more of our products are being shipped to countries around the world.
MANUFACTURING AND WHOLESALE
TRADE – % CHANGE FROM 2010 TO 2011,
ACROSS CANADA
Source: Statistics Canada
In 2011, Saskatchewan recorded the highest growth rate across Canada in retail sales and building permits and the second highest growth in new vehicle sales and new housing starts.
According to the Canadian Federation of Independent Business (CFIB), Business Barometer from March 7, 2012, small business owners in Saskatchewan are feeling optimistic about the year ahead; many have plans to increase their full-time employment over the next three to four months. The mood across industries is positive as well with the agriculture sector joining the most “up-beat” sectors in their optimism about the economy.
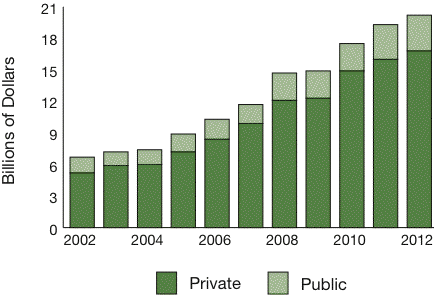
The business climate is clearly improving, evidenced by the plans for growing investments by the public and private sector in Saskatchewan.
PRIVATE/PUBLIC CAPITAL INVESTMENT
INTENTIONS
Source: Statistics Canada
8 Budget 2012-13 | Budget Summary
So what are private sector forecasters saying about Saskatchewan’s growth?
Economic Slowdown Barely Noticeable Out West – Conference Board of Canada, Provincial Outlook Executive Summary – Winter 2012 “The economic outlook for Western Canada remains very positive ... real GDP growth is forecast to be a full percentage point stronger than the rest of the country this year and next. Commodity prices remain at profitable levels and continue to encourage the development of the mining sector and to attract thousands of out-of-province workers and their families. Saskatchewan’s sources of growth are widespread ... the mineral fuels sector will expand 7.9 per cent in 2012; manufacturing is set for a 3.8 per cent gain ... non-residential business investment which is coming off a very strong year, looks to continue this trend.” |
The Fraser Institute – Canadian Investment Climate: 2010 Report – Saskatchewan ranked second in the nation, up substantially from its sixth place ranking in 2005. The Institute notes that ... “attracting and sustaining high levels of investment requires an ongoing commitment to policies that contribute to a positive investment climate: productive economic activities, competitive tax rates, effective transportation infrastructure, and prudent fiscal policies ...” Saskatchewan received high marks in the areas of fiscal management and improving the regulatory impact. |
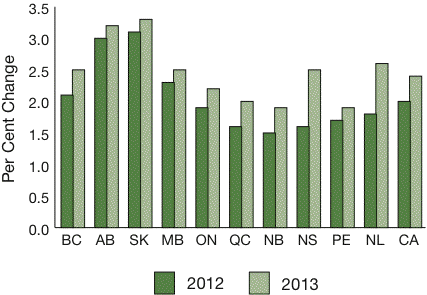
Private sector forecasters are optimistic about Saskatchewan’s growth this year and next, with the province again holding a strong place across Canada.
PRIVATE SECTOR FORECASTS OF
GDP GROWTH, 2012 AND 2013
Source: Average of private sector forecasts, as of March 6, 2012
Fiscal Discipline
Economies around the globe are being tested and those economic realities can have an impact here at home. While Saskatchewan has been blessed with strong economic conditions, we need to be careful fiscal managers and ensure investments are sustainable.
The Saskatchewan Government has been rewarded for its careful fiscal management, receiving its first ever “AAA” credit rating from Standard and Poor’s, their highest rating, in 2011.
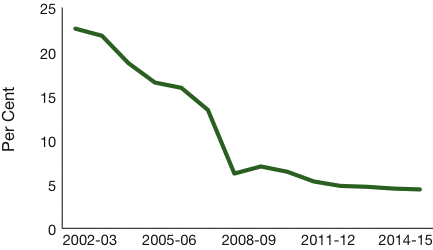
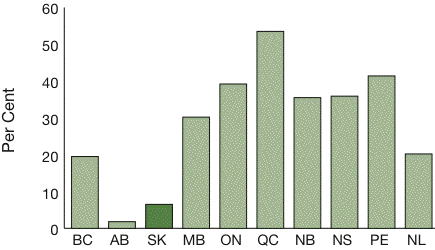
The province’s debt to GDP ratio is steadily improving while other governments are either struggling to get out from under a mountain of debt or are returning to deficit positions to fund their government programs.
Budget Summary | Budget 2012-13 9
SASKATCHEWAN GOVERNMENT DEBT AS A
PERCENTAGE OF GDP (DEBT TO GDP RATIO)
Source: Saskatchewan Public Accounts and Saskatchewan Provincial Economic Accounts
DEBT TO GDP RATIO, ACROSS CANADA
Source: DBRS (as at March 31, 2012); Statistics Canada; Conference Board of Canada
The Saskatchewan Government has outlined a four-year fiscal plan, which is consistent with the plan identified in the 2011-12 Budget and the 2011 election platform.
EXPENSE GROWTH, YEAR OVER YEAR
| 2012-13 | 2013-14 | 2014-15 | 2015-16 |
| 4.7% | 4.0% | 4.0% | 4.0% |
Being able to afford a 4.7 per cent increase in expense is an uncommon privilege. It means that key government programs and services can continue while balancing government’s interests for tax competitiveness and debt management. We also need to ensure that levels of program funding are sustainable into the future and match our growth in the economy. This avoids broad swings in program resources available to serve the public.
Steps are being taken to find efficiencies across government, by examining programs services delivered by government ministries and by asking our third party partners to be vigilant in finding efficiencies in their operations.
For 2012-13, the Government has a balanced budget; it is also balanced on a summary basis. Not only is the budget balanced, but it maintains some funds in reserve to help pay for unexpected emergencies: $756.4 million in the Growth and Financial Security Fund.
Financial decisions were scrutinized to ensure they did not increase Government debt. Debt will remain flat for this year.
Strategic Investments in Transportation and Trade
The Saskatchewan Government established a solid foundation for growth in its first term, investing heavily in necessary infrastructure across the province for roads, bridges, schools, health care facilities and to help communities with the increased cost of a growing population.
The 2012-13 Highways and Infrastructure budget of $581.5 million is a 4.5 percent increase over 2011-12 and is the first year’s investment towards the election platform commitment of $2.2 billion in Highways and Infrastructure over the next four years.
10 Budget 2012-13 | Budget Summary
Highlights of the 2012-13 transportation investments include:
| • | $207.8 million for repair and replacement of highway surfaces – including 320 kms of repaving; |
| • | $18.0 million for repair and replacement of highways, bridges and culverts related to the 2011 flooding; |
| • | $63.0 million for Gateway Corridors, including the completion of Highway 11 twinning, the start of twinning and passing lane strategy, continued work on the West Regina Bypass, and commencement of the Estevan Bypass; |
| • | $70.5 million for upgrades under the Rural Highway Strategy – including primary weight upgrades on 150 km to be completed and $10.3 million to upgrade community and tourism access roads; |
| • | $59.2 million, an increase of $13.8 million for the Bridge and Culvert Strategy – including 29 bridges to be replaced, 4 bridges to be rehabilitated, numerous culverts replaced and continued work to replace the St. Louis bridge; |
| • | $23.5 million for the Municipal Roads for the Economy Program which assists rural municipalities to strategically improve the road systems supporting economic growth; and, |
| • | $7.9 million to continue road maintenance and rehabilitation projects for municipalities that have signed agreements under the Urban Connectors Program. |
Investments are also being made to support our industries in gaining access to international markets. Funding for the Saskatchewan Trade Export Partnership (STEP) is increasing by $500,000, total funding of $3.4 million, to ensure long-term economic strength through export growth.
The Ministry of Agriculture will also provide an additional $1.0 million for international market development and trade advocacy. This funding will provide industry support to maintain existing markets, develop new markets and attract new buyers to the province.
Support for our Growing Economy
Maintaining a strong and vibrant workforce is a key component of our economy. One of Saskatchewan’s key advantages is the next generation of young people who will receive the right education and training to meet the demands of our labour market.
Efforts to increase the number of First Nations and Métis people in the workforce is showing progress:
| • | There are 5,900 more First Nations and Métis people employed to the end of February this year over last year; |
| • | Over the past four years, the number of First Nations and Métis apprentices has increased by 24 per cent; and, |
| • | The number of First Nations and Métis Journeyperson Certifications has doubled from 61 in 2006-07 to 123 in 2010-11. |
Another $450,000 will be spent on the First Nations Apprenticeship Program to help promote new careers.
Programs for First Nations and Métis people that are funded through the provincial gaming agreements will increase by 3.8 per cent to $67.6 million this year.
In addition, year two funding will be provided to meet the commitment of $1.5 million over three years through the Northern Action Plan to work with northern leaders to improve the well-being of at-risk individuals in northern Saskatchewan.
Budget Summary | Budget 2012-13 11
Education Infrastructure
Our growing population and expanding communities are contributing to an increased cost of education. School operating funding will increase by almost $82 million in 2012-13.
This budget provides support for the new funding distribution model by providing $10 million in transition funding in 2012-13. The new model will be phased in over a three-year period.
To support the need for new schools and upgrades to existing schools, the following investments are being made:
| • | $38.6 million is provided for the construction of six new school projects in a new provincial government co-ownership model; |
| • | $50.1 million will provide for 15 major school capital projects, which are already under construction or renovation; |
| • | $4.0 million will assist with planning for three new school capital approvals; and, |
| • | $15.9 million for block sustaining capital, an increase of $10.9 million over last year, supporting smaller maintenance projects. |
Support is also being provided for improving the infrastructure at our post-secondary institutions:
| • | $7.0 million for universities and the Saskatchewan Institute of Applied Science and Technology to finance sustaining capital; |
| • | continued support for the Academic Health Sciences Centre project at the University of Saskatchewan (U of S), total funding to date will be $215.6 million; |
| • | $1.0 million to support planning for a student residence, child care facilities and a parkade at the University of Regina (U of R); |
| • | $1.0 million for the continued construction of the new Southeast Regional College; and, |
| • | $879,000 capital grant for sustaining capital at regional colleges and federated colleges. |
IMPROVING OUR QUALITY OF LIFE
A major factor contributing to a person’s quality of life is their physical health and well-being. This Budget makes a significant investment in our health care system, an increase of $217.6 million for a total budget of $4.68 billion.
Improving Access to Health Care
The Ministry of Health is working closely with the Regional Health Authorities (RHAs) to improve the quality and standard of care, to put the patient first, and to do so in the most efficient manner. The total budget for the RHAs will increase by $98.2 million, a 3.5 per cent increase over last year.
Access to surgeries will improve with a total investment of $60.5 million for the Saskatchewan Surgical Initiative.
At December 31, 2011, Saskatchewan has completed more than 62,400 surgeries since the start of this fiscal year, seven per cent more (approximately 4,100 cases) than during the same period last year.
SASKATCHEWAN SURGICAL INITIATIVE
WAIT TIME GOAL – SURGERIES COMPLETED
(AT DECEMBER 31, 2011)
| | | |
| | Within 18 months | 99 per cent |
| | Within 12 months | 96 per cent |
| | Within 6 months | 87 per cent |
| | Within 3 months | 76 per cent |
12 Budget 2012-13 | Budget Summary
In addition, $5.5 million will be invested to introduce innovative approaches to improve access to primary health care that will improve the patient experience, ensure services are stable and sustainable into the future, keeping Saskatchewan people healthier.
As well, $1.5 million will be invested to implement a rural physician locum pool to improve access to physician care, as promised in the election platform. This initiative will encourage a dedicated resource of physicians providing services in rural Saskatchewan in addition to the existing short-term locum pool.
To help those living with diabetes, the budget provides a $2.5 million increase to add two forms of long-acting insulin to the Drug Plan and to expand the Children’s Insulin Pump Program to cover those up to 25 years of age.
The Saskatchewan Cancer Agency will receive an increase of $16.9 million ($138.8 million total) to support access to cancer services and for increased drug, operating and medical costs.
An increase of $5.5 million is provided for the Shock Trauma Air Rescue Society (STARS) Helicopter Ambulance service for start-up and initial operating costs. This service will focus on care and transport of critically ill or injured patients in rural and remote areas of the province.
A total increase of $4.0 million will be provided to expand colorectal screening province-wide, providing early detection tools and thereby supporting early treatment and improved patient outcomes.
Health Care Facilities
Investments are also being made to support health care facilities across the province:
| • | $42.7 million in funding to begin construction of seven previously announced long-term care (LTC) facilities under a new co-ownership model between the province and the Regional Health Authorities, and additional grant funding to continue progress on the other six LTC facilities currently underway; |
| • | $5.0 million to continue planning and redesign to replace the Saskatchewan Hospital North Battleford; |
| • | $16.4 million for equipment and capital maintenance of facilities; and, |
| • | Planning and design will continue to replace the Moose Jaw Union Hospital. |
Improving Circumstances for People with Disabilities
The 2011 election platform identified that a Government priority is to ensure that the quality of life for people with disabilities improves in this province.
Clearly, this is a priority for Saskatchewan people as well, evidenced by the overwhelming support and generosity extended every year to the Kinsmen Telemiracle. The 36th anniversary of the telethon, recently held in Regina, raised a record-breaking amount of over $5.9 million. This is a testament to the Saskatchewan spirit of giving back to others in our communities that need some extra support.
The 2012-13 Budget makes an investment of $26.4 million for new or enhanced programming and increased program utilization. Since taking office in 2007, Government funding for disabilities programming has increased by $308.8 million.
Budget Summary | Budget 2012-13 13
An increase of $17.8 million is provided to expand the Saskatchewan Assured Income for Disability (SAID) program. The total program will cost $113.0 million in 2012-13 and will expand the number of clients from 3,000 to up to 10,000 adults.
| • | People in residential care settings will receive an additional $40 in June, increasing to $100 per month over four years; |
| • | Single individuals living independently will receive an increase of $200 per month in June, expanding to an average of $350 per month over four years; and, |
| • | Couples living independently will receive a $230 per month increase in June, expanding to an average of $400 per month over four years. |
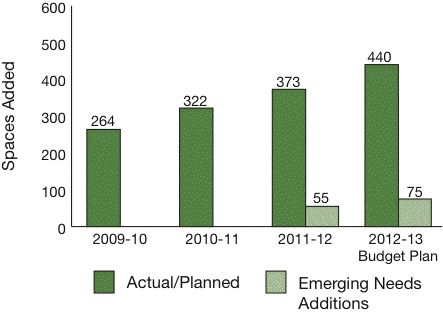
Increases will also be provided to the community-based organizations (CBOs) that support people with disabilities and $2.4 million in capital funding will provide spaces by March, 2013, for 67 clients, completing the Government’s 440 Waitlist commitment from 2009-10.
In addition, $600,000 in capital funding is being provided in 2012-13 to meet increased demand for residential and day program services for 20 additional people with intellectual disabilities.
PROGRESS ON ELIMINATING THE 440
WAITLIST FOR GROUP HOME SPACES
Source: Ministry of Social Services
Saskatchewan Aids to Independent Living (SAIL) will receive an increase of $1.5 million, $39.4 million total, to maintain benefits for people with long-term disabilities or illnesses. This program provides supports such as orthotics, prosthetics, rehabilitation/mobility equipment, oxygen and insulin pumps for children.
Better Outcomes for Children
One of the best things we can do to improve our quality of life is to invest in our children and youth. If they can individually achieve better outcomes throughout their lives, then collectively, we all benefit.
The Children and Youth Agenda was launched in the 2011-12 Budget and brought together a number of programs from across government under one “umbrella.” The intention is to find new and innovative ways to approach the key social determinants of health and well-being at a very early age.
The initial investment of $34.0 million in 2011-12 is being enhanced by $6.0 million in this budget. Government-wide funding for children, youth and their families includes:
| • | $1.0 million enhancement for Autism Spectrum Disorder therapies, total funding of $7.6 million in 2012-13; |
| • | $600,000 increase for Fetal Alcohol Spectrum Disorder prevention services in Saskatoon, Regina, and Prince Albert, total funding of $3.6 million across several ministries; |
| • | $500,000 to continue 20 literacy camps for underprivileged youth; and, |
| • | $3.0 million in capital funding for a new risk assessment tool for child protection workers. |
14 Budget 2012-13 | Budget Summary
The 2012-13 Budget in the Ministry of Education also provides:
| • | $1.0 million in increased operating funding ($15.8 million total) and $1.0 million in capital funding to create 15 new pre-kindergarten programs next year; and, |
| • | $600,000 in new funding ($2.6 million total) to support immigrant children in schools who have English as an Additional Language (EAL). |
Supporting Those in Need
Changes are underway with respect to children in need and the results are proving to be favourable. The introduction of the Children and Youth Agenda has greatly improved relationships with First Nations agencies and has built new partnerships to improve services to families and children. First Nations agencies are provided $3.9 million annually to support case management and service delivery for First Nations child welfare authorities.
Efforts are being taken to find placements for children with extended family and with First Nations agencies on reserve so that the children can remain in their community. This approach has contributed to an increase in the number of children placed with extended family both on and off reserve. The result is a steady decline in the number of children that are coming into the care of the Ministry.
Other enhancements for Child and Family Services include:
| • | $1.15 million for 20 Out-of-Home Residential Care spaces and an infant care centre; |
| • | $1.0 million increase for Intensive Family Supports; |
| • | $750,000 increase for Home Assessments and Treatment Foster Care by CBOs; and, |
| • | $500,000 increase for Visitation and Supervision for Children by CBOs. |
This budget also provides $180.8 million for Saskatchewan Assistance Program (SAP) and Transitional Employment Allowance (TEA) caseloads, a decrease of $5.7 million due to a strengthening economy and more opportunities for employment.
Research and Innovation
Investing in research and innovation occurring at our post-secondary institutions can lead to an improved quality of life here in Saskatchewan and have a positive impact around the world.
The Canadian Light Source (CLS, or Synchrotron), one of the most advanced synchrotron facilities in the world, is attracting researchers from across Canada and internationally to perform research that will help identify new ways to tackle diseases, make plants more productive, and make metals more resilient. CLS will receive an increase of $1.5 million, for a total operating budget of $4.1 million.
InterVac, which opens in the spring of 2012 will receive $2.1 million to support its operations and will develop vaccines to protect people and animals from the threat of emerging or persistent diseases such as avian influenza or tuberculosis. This new facility will be the first Containment Level 3 facility in Western Canada dealing with both human and large animal diseases.
The provincial investment in Saskatchewan Research Council is increasing by $850,000 to $19.0 million. This increase supports an organization that has a proven track record of success in helping industry partners in our province innovate and improve their competitiveness.
Budget Summary | Budget 2012-13 15
Other investments include:
| • | $20.4 million for agricultural research and development, including $2.0 million for research to accelerate the development of wheat varieties and improve yield, quality and tolerance to disease and weather conditions, and $250,000 to establish the Global Institute for Food Security; |
| • | The Canada Excellence Research Chair in Water Security at the U of S will receive $500,000 in new funding ($1.0 million total in 2012-13); |
| • | The Academic Renal Transplant Program will receive $376,000 in new funding ($678,000 total in 2012-13); and, |
| • | The Innovation and Science Fund will receive $6.4 million to promote excellence in, and lever federal funding for, research at Saskatchewan post-secondary institutions and associated non-profit institutes. |
Research and Development (R&D) Tax Credits will continue to encourage private sector R&D investment by providing a tax credit of 15 per cent for qualifying expenditures incurred by corporations in Saskatchewan.
Innovation Saskatchewan will invest an additional $3.3 million to support the nuclear R&D strategy. Total funding of $4.8 million in 2012-13 will support a Cyclotron, the Canadian Centre for Nuclear Innovation at the U of S, and operate the Positron Emission Tomography and Computerized Tomography (PET-CT) at the Royal University Hospital in Saskatoon.
Sports, Culture and Recreation
2013 promises to be an entertaining year in Saskatchewan with the 2013 Grey Cup, the JUNO awards in Regina, and the 2013 Memorial Cup in Saskatoon. Government support includes a $6.2 million loan for additional temporary seats in preparation for the Grey Cup and $1.5 million for hosting the JUNOs. In addition, funding of $1.0 million is being provided for preparations to host the North American Indigenous Games in 2014.
As promised in the election platform, a new community rink affordability grant of $2,500 is being provided for approximately 750 community rinks across the province, at a cost of $1.9 million.
Saskatchewan parks will receive some upgrades with an increase of $3.0 million for service centres and electrical upgrades, improvements to ensure public safety, and for the full implementation of the new Campground Management System which will accommodate on-line reservations being launched for the 2012-13 camping season.
INCREASING AFFORDABILITY
Students
A number of initiatives are being offered to encourage students to further their education in Saskatchewan, making this choice an increasingly affordable option.
The 2012-13 Budget provides $12 million, a two per cent increase to support operating costs at our post-secondary institutions.
The 2011 election platform announced a key initiative to encourage Saskatchewan students to continue to study in the province. This budget invests $4.6 million in the new Saskatchewan Advantage Scholarship Program that will provide every high school graduate from 2012 on, with up to $500 per year to a maximum of $2,000 per individual, to be applied toward tuition fees at any post-secondary institution or recognized training course in the province.
16 Budget 2012-13 | Budget Summary
The Graduate Retention Program is designed to encourage our students to stay and work in the province after graduation. It will continue to offer graduates who reside in Saskatchewan up to $20,000 in tuition rebates over seven years, now through a combination of non-refundable and refundable tax credits.
The Saskatchewan Student Loan program offers an affordable way to finance post-secondary education. This budget provides an increase of $6.7 million for increased access to the Student Aid Fund, total program funding of $36.5 million.
As announced in the election platform, steps are being taken to encourage our medical professionals to remain in Saskatchewan. A portion of the Saskatchewan student loans for new doctors, nurses and nurse practitioners will be forgiven (up to $120,000 for doctors and up to $20,000 for nurses and nurse practitioners) that practice in under-served rural and remote communities for five years.
This Budget also includes funding to implement the recent and previous commitments for medical training seats:
| • | Five new Nurse Practitioner training seats will be introduced as part of the new commitment for 20 new training seats; |
| • | $10.3 million to expand Registered Nurse training seats by 170 seats – 85 seats will be added in 2012-13; and, |
| • | In 2012-13, the government will have fulfilled its commitments to both the medical training seat expansion to 100 and the physician residency seat expansion to 120. |
Seniors
To help seniors keep pace with the cost of living, this budget provides $3.3 million, $24.2 million total, to increase the Seniors Income Plan (SIP) benefit for singles and couples.
This initiative provides a monthly supplement to seniors who have little or no income other than the Old Age Security and Guaranteed Income Supplement paid by the federal government.
In our government’s first term, the number of seniors who qualify for this benefit was doubled and the amount of the benefit was doubled after it had not been increased in the previous sixteen years.
This year, starting on July 1, the government will fulfill its election commitment to increase the benefit by a further $50 per month, followed by increases of $10 per month in each of the next three years.
In addition, a new Seniors Personal Care Home Benefit will be provided, at a cost of $3.5 million in 2012-13. This investment will provide seniors with the financial assistance required to help them with the cost of living in a licensed personal care home. This monthly supplement is the difference between the senior’s income and $1,800. The benefit of approximately $278 per month will rise to $369 per month by the fourth year.
Families
Government continually examines its tax structure to ensure that Saskatchewan remains competitive and keeps taxes as affordable as possible. For example, the sales tax exemption on children’s clothing was recently expanded to all children up to age 18, as promised in the 2011 election platform. This enhancement was introduced in November 2011, bringing immediate savings to families, and costs $3.0 million annually.
Budget Summary | Budget 2012-13 17
Support is also being provided for child care: $46.0 million in operating funding is provided in 2012-13, an increase of $2.0 million to create 500 new child care spaces and $4.0 million for the capital costs related to those new spaces. The majority of these spaces will be placed in schools or post-secondary institutions to facilitate continuing education and improved outcomes for young people.
In addition, $675,000 in new funding is being provided for Child Care Parent Subsidies (total program funding of $18.2 million) to support 135 additional cases.
The Active Family Benefit program will be expanded to include activities for all children and youth under 18 years of age, fulfilling government’s commitment to expand the program. The tax benefit program continues to offset costs for children and youth to participate in sport, culture and recreation programs with the expansion estimated to cost an additional $3.0 million annually.
Housing
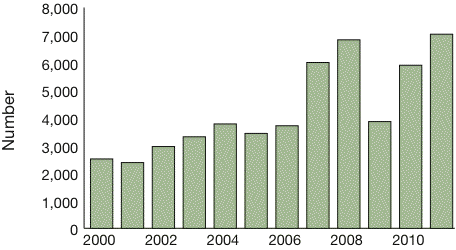
Since Saskatchewan’s population started growing in 2006, the demand for housing has steadily increased. The number of housing starts in Saskatchewan has drastically increased in the past four years to an average of 5,908 per year, more than double the average of 2,932 in the previous sixteen years.
SASKATCHEWAN HOUSING STARTS
Source: Canada Mortgage and Housing Corporation
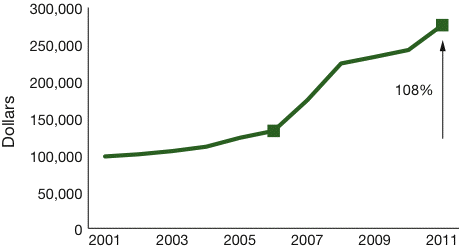
However, demand for housing continues to rise more quickly than supply. Consequently, the average resale price of a home has more than doubled since 2006.
SASKATCHEWAN AVERAGE HOUSE PRICE
Source: Canada Mortgage and Housing Corporation
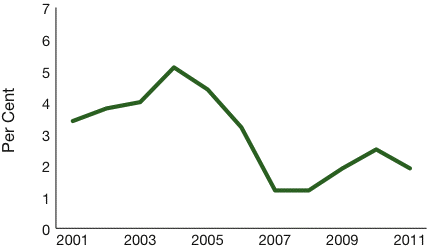
In the rental housing market, vacancy rates have dropped significantly and remained relatively low since 2006, creating a demand that has driven up the average rental cost across Saskatchewan. As shown in the chart below, vacancy rates in Saskatchewan hit a low of 1.2 per cent in 2007 and have remained low.
SASKATCHEWAN AVERAGE
RENTAL VACANCY RATE
Source: Canada Mortgage and Housing Corporation
18 Budget 2012-13 | Budget Summary
In response, the Government launched the long-term Housing Strategy for Saskatchewan. The intention is to help improve the affordability of housing and to increase the housing supply in the province, including providing direct investment in affordable housing projects.
In 2011-12, the government introduced the Saskatchewan Advantage Housing Plan which included the Rental Construction Incentive (RCI) and Affordable Home Ownership Program (AHOP). These programs have been very successful with applications far exceeding initial expectations.
The 2012-13 Budget provides $3.7 million to continue to support these programs. With these programs and the other initiatives identified below, the province could add up to 10,000 rentals to the market, 2,200 new entry-level homes and 650 student residences.
A new income tax credit is being introduced in 2012 to help people with the cost of their first home. The First-Time Homebuyers’ Tax Credit will provide eligible Saskatchewan residents with a non-refundable credit of up to $1,100.
To encourage construction of new multi-unit rental housing projects, Government is introducing an incentive to encourage private sector investment. The incentive is a corporate income tax rebate equal to 10 per cent of the rental income generated from newly constructed multi-unit rental projects, for a period of up to ten years. This rebate, when combined with other housing initiatives, is expected to encourage the construction of an additional 10,000 new rental units in the province over the life of the program.
In addition, the Saskatchewan Housing Corporation will provide $1.0 million to Habitat for Humanity to help an additional 20 low-income families achieve home ownership.
RESPONSIVE AND RESPONSIBLE GOVERNMENT
Delivering on Commitments
The Government made a firm commitment to share the economic prosperity with municipalities. This budget includes:
| • | $237.4 million in Revenue Sharing equal to one full point of Provincial Sales Tax (PST) based on the 2010-11 Public Accounts, an increase of $20.6 million or 9.5 per cent from the previous year and up 87 per cent from 2007-08; |
| • | $56.1 million in flow-through municipal infrastructure funding provided by the Gas Tax Program; |
| • | $48.4 million to meet project commitments under the various federal-provincial infrastructure programs. This funding level accounts for a reduction of $21.9 million due to the completion of the federal stimulus programs in 2011-12; |
| • | $6.1 million, an increase of $500,000 to meet program commitments under the Saskatchewan Infrastructure Growth Initiative; and, |
| • | $12.3 million, an increase of $500,000 for Grants-in-Lieu of Property Tax. |
Overall funding to municipalities in 2012-13 will be $348.9 million, up 14.8 per cent from last year and up 60.9 per cent from 2007-08.
Commitments were also made to support our agriculture industry, by funding AgriStability and AgriInvest, and Crop Insurance, budgeted at $321.4 million in 2012-13, an increase of $600,000.
Crop insurance coverage levels are rising to a record high of $174 per acre on average, nearly double what they were in 2007. In response to the unprecedented flooding in 2010 and 2011, producers now have the option to supplement the Unseeded Acreage Benefit of $70 per eligible acre by purchasing either $15 or $30 per acre in additional coverage.
Budget Summary | Budget 2012-13 19
In addition, the federal-provincial Growing Forward programs will get a boost of $11.8 million in new funding.
Work is well underway to further the commitment to rehabilitate provincial irrigation assets. This budget includes $5.0 million, an increase of $1.9 million, to accelerate rehabilitation of the M1 Canal over 10 years.
This budget is also investing in environmental programming and in strengthening water management and flood protection.
| • | $5.0 million to extend the 2011 Emergency Flood Damage Reduction Program to 2012; |
| • | $2.1 million in one-time funding for the Provincial Disaster Assistance Program to address the backlog in claims from 2011; |
| • | $1.7 million to support the implementation of the 10-year Water Management Infrastructure Program (WMIP) for major water infrastructure redevelopment and reinvestment; |
| • | $2.1 million, an increase of $1.4 million to enhance the Dam Safety Program and to ensure that the highest priority projects are addressed through WMIP; |
| • | $2.2 million to maintain funding for insect and disease control, including the prevention of mountain pine beetle and spruce budworm forest infestation; |
| • | $3.8 million, an increase of $800,000 to support reforestation; |
| • | $6.2 million in total funding for Green Initiatives, a decrease of $10.8 million from last year primarily because a previous commitment to provide enhanced funding has been fulfilled; and, |
| • | $21.8 million in total operating funding for SARCAN, which links the grant to the actual revenue collected from the Environmental Handling Charge in 2010-11, providing a stable level of funding to this important partner. |
Safer Communities
The following investments are being made through the Ministries of Corrections, Public Safety and Policing (CPSP) and Justice and Attorney General (JAG) to help to support the Government’s commitment to safer communities:
| • | $1.1 million to complete the commitment to hire 120 police officers over four years (total funding of $14.0 million over the four years); |
| • | $11.8 million for the implementation of the Provincial Policing Services Agreement with the Royal Canadian Mounted Police ($161.5 million total); |
| • | $1.2 million increase (CPSP) and $700,000 (JAG), for $1.9 million total and 13 additional FTEs, for the phased implementation of the High-Risk Violent Offender Crime Reduction commitment. This initiative will get tough on violent crime and make communities safer by adding more police officers and prosecutors; |
| • | In addition to the $700,000 above, an increase of $4.4 million ($52.4 million total) for increasing costs in Court Services and Prosecutions related to a nearly 50 per cent increase in court appearances since 2000 and other funding primarily related to salary adjustments; |
| • | $2.0 million for caseload increases in adult corrections; and, |
| • | $450,000 for the 2011 election platform commitment to expand the successful Community Mobilization Partnership, a multi-agency initiative located in Prince Albert that brings together community agencies, schools, health care and social service agencies, First Nations workers and police to provide immediate and long-term interventions in the lives of at-risk individuals in order to prevent crime. |
20 Budget 2012-13 | Budget Summary
Making Responsible Fiscal Decisions
Balanced budgets are a key part of the Saskatchewan Advantage but balancing a budget in these uncertain economic times can be a significant challenge. Maintaining a balanced budget over a sustained period of time takes some tough decisions.
It means ensuring that government spending is affordable and sustainable over the long term. Sometimes it means saying no to new spending, keeping spending flat or undertaking a thorough review of existing programs and services.
Executive government has been reviewing its programs, services and organizations to find more efficient ways of doing business. Government ministries and agencies are also examining how best to prioritize and finance their capital infrastructure projects to achieve better results.
We need to do more of this in order to keep spending under control and to ensure programs and services are sustainable over the longer term.
Some programs are being revised to help meet Government’s four-year spending targets and to ensure spending remains sustainable and provincial budgets remain balanced, now and in the future:
| • | Raising the cap on prescription drug fees from $15 to $20, while maintaining one of the most affordable drug plans for seniors across Canada. This cap was introduced in 2007, was expanded to include children’s prescriptions in 2008, and has not increased since; |
| • | Winding down the Film Employment Tax Credit, saving $3 million this year and $8 million annually when the program has ended; |
| • | Research and Development (R&D) Tax Credits will continue to be refundable for qualifying R&D expenditures by Canadian-controlled private corporations up to an annual limit of $3.0 million, with all other qualifying expenditures eligible for a non-refundable tax credit; |
| • | Provincial funding for Enterprise Regions will be discontinued, saving $4.0 million, allowing economic development decisions to be made locally. Additionally, regional offices will be closed, saving $1.0 million this year and $2.0 million annually thereafter; |
| • | The Student Aid fund will eliminate non-repayable bursaries for above middle-income students, targeting benefits to those most in need, saving about $3.1 million per year; and, |
| • | Discounts for early payment of education property tax will be discontinued beginning in 2013, which is expected to save $16.0 million that year. |
For more information on savings identified in this budget, see the Backgrounder on Key Facts and Figures at www.finance.gov.sk.ca
Efficient and Effective Government
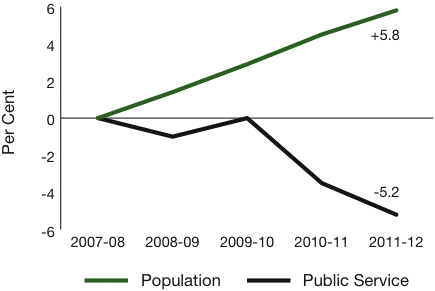
In 2008, the Government introduced The Growth and Financial Security Act, requiring Treasury Board to monitor and report on the size of the public service, and ensuring that it did not grow faster than the population. This target is on track, the size of the public service is diminishing while the population grows.
CUMULATIVE CHANGE SINCE BASE YEAR,
2007-08 (PUBLIC SERVICE AND
SASKATCHEWAN POPULATION)
Source: Saskatchewan Ministry of Finance Plan for 2012-13
Budget Summary | Budget 2012-13 21
Three years ago, government started a process for public service renewal, asking ministries to find ways to increase the efficiency of their operations and pursuing smarter delivery of programs. Various methodologies have been used, ranging from Lean process improvements to program evaluations. The intention is to improve the experience of the customer, client or patient, and to do so within a smaller footprint.
Government is continuing with its commitment to reduce the size of the public service and is well on its way to meeting the goal of reducing the size of government by 15 per cent over four years. We are demonstrating it is possible to have a smaller, more efficient and effective government. The 2012-13 Budget brings the total FTE reduction to 1,302 in the first three years, a 10.3 per cent reduction.
Government is now asking all of its third parties to join in this effort and to find innovative ways to achieve efficiencies in the delivery of important services to the public. This may mean bulk purchasing of supplies, sharing services across organizations, and finding new ways of doing things.
| • | The Regional Health Authorities (RHAs) have been given expenditure targets to meet over the next year, without impacting patient care. This will be the third consecutive year that RHAs have been given targets like this. |
| • | The education system is also being asked to help reduce costs while still delivering high quality education to our children throughout the province. |
| • | Post-secondary institutions are being asked to consider the opportunities available to enhance the effectiveness and efficiency of their organizations, with specific attention to administrative operations. |
Many governments are being forced to slash programs and funding to deal with huge deficits and debt. Saskatchewan’s strong fiscal position enables us to find efficiencies as part of a framework for continuous improvement.
Saskatchewan is blessed with many natural advantages. Our strong and diverse resource base coupled with innovation, dedication and the Saskatchewan spirit of hard work is helping to keep our economy growing.
As our population grows and businesses keep expanding, our province will continue to flourish. Government’s intention is to keep our economy moving forward and to support those that need our help along the way. Fiscal discipline is a key component in keeping the Saskatchewan advantage and ensuring that we maintain efficient and effective programs and services for years to come.
22 Budget 2012-13 | Budget Summary
| | | |
| | | |
| | SASKATCHEWAN PROVINCIAL BUDGET | |
| | 12-13 | |
| | | |
| | TECHNICAL PAPERS | |
THE SASKATCHEWAN ECONOMY
INTRODUCTION
Last year was another strong year for Saskatchewan’s economy. Most economic indicators were positive. Saskatchewan ranked number one among provinces in growth in the value of retail and wholesale trade and in building permits. Overall, Saskatchewan’s real GDP is estimated to have grown by 3.6 per cent in 2011.
While the agriculture sector faced flooding issues once again, the problem was not as widespread as in 2010. Much of the province experienced near ideal growing and harvesting conditions, producing very good quality crops.
Despite uncertainties surrounding the global outlook, Saskatchewan is well positioned to experience strong growth again in 2012. Oil and potash investment in particular, supported by strong prices, is expected to lead the way in terms of resource sector investment this year. Labour markets remain tight, while demand for workers is fueling continued population growth.
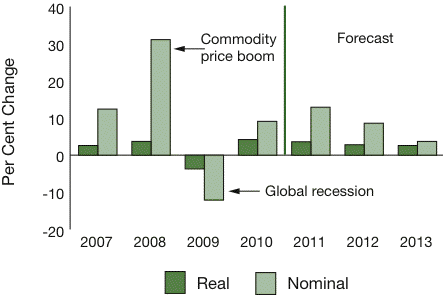
The current forecast sees real GDP growth of 2.8 per cent in 2012. Nominal GDP is projected to improve by 8.6 per cent.
SASKATCHEWAN ECONOMIC INDICATORS
(Per Cent Change)
| | | 2011 | | | Rank | | | | Saskatchewan 2006-11 | | | Rank | | | | Canada 2006-11 | |
| Employment | | | 0.3 | | | | 8 | | | | 7.0 | | | | 2 | | | | 5.0 | |
| Retail Trade | | | 8.5 | | | | 1 | | | | 41.3 | | | | 1 | | | | 16.6 | |
| Wholesale Trade | | | 21.8 | | | | 1 | | | | 71.8 | | | | 1 | | | | 17.2 | |
| Building Permits | | | 25.3 | | | | 1 | | | | 128.5 | | | | 1 | | | | 11.1 | |
| Number of New Vehicle Sales | | | 7.3 | | | | 2 | | | | 28.0 | | | | 1 | | | | (2.7 | ) |
| Manufacturing Sales | | | 15.0 | | | | 2 | | | | 27.2 | | | | 2 | | | | (5.7 | ) |
| International Goods Exports | | | 24.6 | | | | 2 | | | | 82.8 | | | | 1 | | | | 1.8 | |
| Number of Housing Starts | | | 19.0 | | | | 2 | | | | 89.3 | | | | 1 | | | | (14.7 | ) |
| Private and Public | | | | | | | | | | | | | | | | | | | | |
| Investment Intentions | | | 10.3 | | | | 3 | | | | 88.2 | | | | 1 | | | | 21.5 | |
| Average Weekly Earnings | | | 3.8 | | | | 3 | | | | 23.7 | | | | 3 | | | | 15.9 | |
Source: Statistics Canada
EXTERNAL ENVIRONMENT
Global Growth Prospects
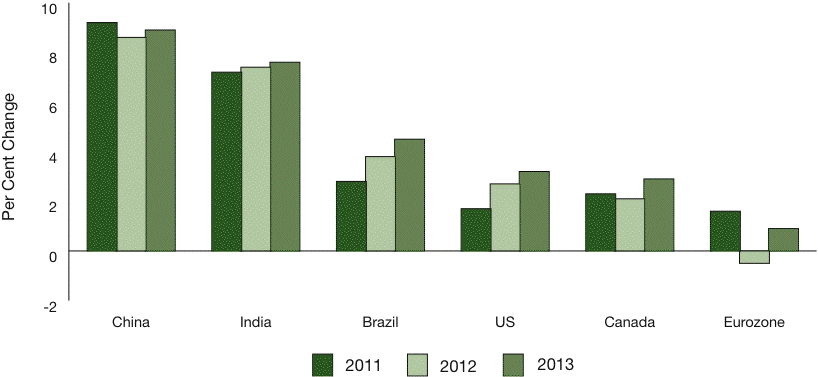
Globally, every region will feel the effect of the ongoing debt and financial crises in the Eurozone. Even so, many of the emerging market nations and the United States will remain on a positive growth trajectory. Real GDP in the Eurozone as a whole is projected to contract by 0.5 per cent in 2012, followed by an expansion of only 0.9 per cent in 2013.
Budget Summary | Budget 2012-13 25
China’s real GDP is forecast to grow by 8.6 per cent in 2012, a less vigorous expansion compared to the more than 9.0 per cent annual growth that nation posted in each of the past few years. However, China remains on fundamentally solid economic footing, with growth forecast to improve to 8.9 per cent in 2013. Other emerging market stalwarts such as India and Brazil are also set to expand by 7.4 per cent and 3.8 per cent respectively in 2012, and by 7.6 per cent and 4.5 per cent in 2013.
Boosted by inventory rebuilding and stronger consumer spending, U.S. real GDP advanced at an annual rate of 3.0 per cent in the fourth quarter of 2011, up from 1.8 per cent in the third quarter and more than double the 1.3 per cent growth rate registered in the second quarter. U.S. real GDP advanced at an annual rate of 1.7 per cent in all of 2011 and is projected to increase by 2.7 per cent in 2012 and by 3.2 per cent in 2013.
Canadian real GDP increased by 2.5 per cent in 2011. Growth is expected to ease somewhat this year, due in part to fiscal restraint. Canadian real GDP is currently projected to increase by 2.1 per cent in 2012 and by 2.9 per cent in 2013.
GLOBAL GROWTH ASSUMPTIONS
Source: Ministry of Finance
CANADIAN AND U.S. GROWTH ASSUMPTIONS
| | | 2011 Actual | | | 2012 | | | 2013 | | | 2014 | | | 2015 | | | 2016 | |
| Canadian Real GDP Growth (%) | | | 2.5 | | | | 2.1 | | | | 2.9 | | | | 2.7 | | | | 2.5 | | | | 2.2 | |
| U.S. Real GDP Growth (%) | | | 1.7 | | | | 2,7 | | | | 3.2 | | | | 3.3 | | | | 3.1 | | | | 3.0 | |
Source: Ministry of Finance
26 Budget 2012-13 | Budget Summary
Interest Rates
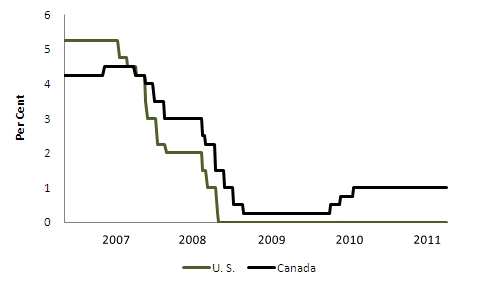
There has been a pronounced shift to more, not less, monetary accommodation by central banks around the world. In Europe, Asia and Latin America, central banks have cut interest rates. Others have resorted to quantitative easing and other non-traditional measures to keep longer-term interest rates at low levels. Canada and the United States have kept their benchmark interest rates on hold for longer.
| • | The U.S. Federal Reserve is expected to hold the federal funds rate between 0-0.25 per cent through at least 2014. |
| • | The Bank of Canada is likewise expected to keep its benchmark lending rate at 1.0 per cent through at least 2013. |
By promoting ultra-low borrowing costs, by either cutting or anchoring short-term interest rates and trimming long-term interest rates, central banks and governments are reinforcing financial conditions conducive to economic growth.
CANADA AND U.S. KEY POLICY RATES,
WEEKLY
Source: Bank of Canada, U.S. Federal Reserve
Canadian Dollar
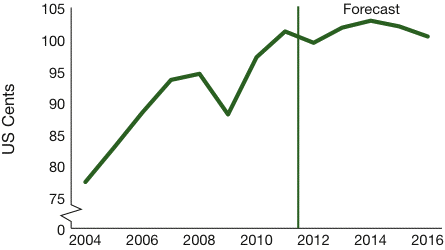
Parity with the U.S. dollar appears to be a reasonable level for the Canadian dollar. On a fundamental basis, Canada-U.S. interest rate spreads, the country’s stronger fiscal and debt metrics and commodity prices should keep the Canadian dollar at or near parity. However, any spike in risk aversion stemming from the Eurozone is likely to temporarily weaken the Canadian dollar.
CANADIAN DOLLAR
Source: Bank of Canada, Ministry of Finance
CANADIAN INTEREST RATE AND CANADIAN DOLLAR ASSUMPTIONS
| | | 2011 Actual | | | 2012 | | | 2013 | | | 2014 | | | 2015 | | | 2016 | |
| Short-term Interest Rate (%) | | | 0.91 | | | | 1.00 | | | | 1.80 | | | | 3.10 | | | | 3.80 | | | | 3.80 | |
| Long-term Interest Rate (%)* | | | 2.79 | | | | 2.00 | | | | 2.40 | | | | 3.20 | | | | 3.90 | | | | 4.20 | |
| Canadian Dollar (US Cents) | | | 101.20 | | | | 99.40 | | | | 101.80 | | | | 102.90 | | | | 102.00 | | | | 100.40 | |
| * | 10-year Government of Canada Bond |
Source: Ministry of Finance
Budget Summary | Budget 2012-13 27
RECENT PERFORMANCE
Business investment continues to be a key driver of economic growth in Saskatchewan.
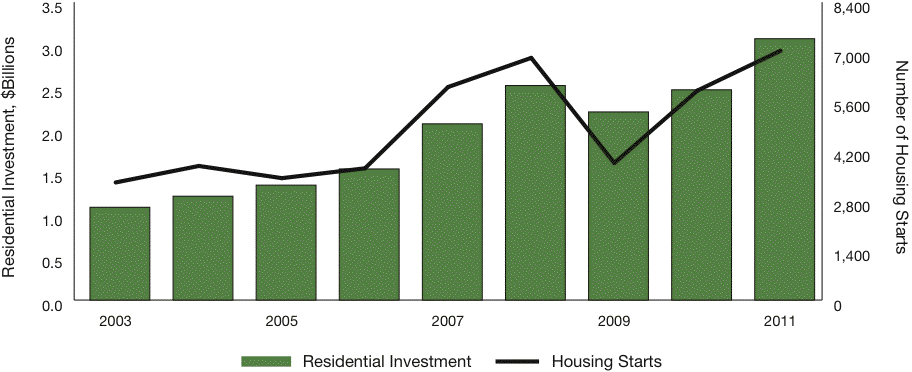
Residential investment overall, including investment in new dwellings as well as renovations, totaled roughly $3.1 billion in 2011, up 24.4 per cent from the previous year. Housing starts in particular rose 19.0 per cent to 7,031 units.
In terms of non-residential investment, oil producers drilled 3,528 new oil wells last year, 29.2 per cent more than in 2010, in response to rising prices. In addition, work continued on projects geared toward increasing production capacity of the province’s potash industry.
RESIDENTIAL INVESTMENT IN SASKATCHEWAN
Source: Statistics Canada
Excess moisture was an issue for farmers again in 2011. As a result, many acres went unseeded. However, as noted in the 2011-12 Mid-Year Report, the problem last year was not as widespread as in 2010. Wet conditions were confined to a few specific areas of the province. The majority of the province experienced good growing and harvesting conditions and produced very good quality crops.
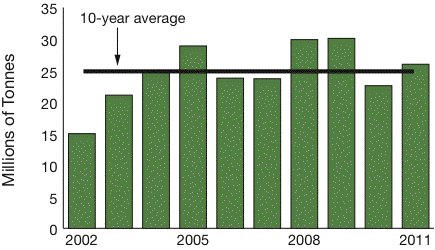
In terms of crop quantity, 26.0 million tonnes were produced last year – 14.8 per cent more than in 2010 and 5.7 per cent more than the 10-year average.
SASKATCHEWAN CROP PRODUCTION
Source: Statistics Canada
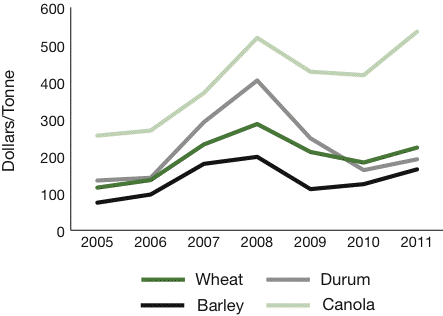
Though crop prices eased in the second half of last year, crop prices throughout all of last year were generally higher, on average, than in 2010.
28 Budget 2012-13 | Budget Summary
SASKATCHEWAN CROP PRICES
Note: Crop prices are on a calendar year basis. Wheat, durum and barley prices are Canadian Wheat Board (CWB) prices and include initial, adjusted initial, interim and final payments made by the CWB on a retroactive basis.
Source: Statistics Canada
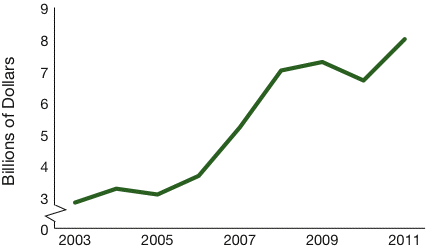
Increased production and prices led to higher cash receipts for Saskatchewan farmers. Crop receipts alone went up 19.6 per cent to roughly $8.0 billion.
SASKATCHEWAN FARM CROP RECEIPTS
Source: Statistics Canada
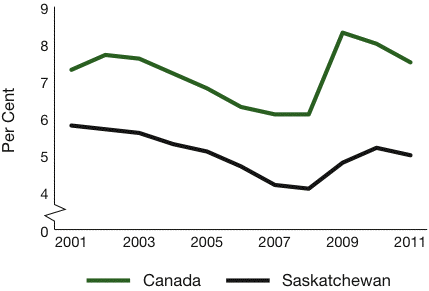
Saskatchewan employment grew again in 2011, though not to the extent it did the previous year. Flooding had an impact on both agriculture and oil sector employment. Still, labour markets remain tight. For the third year in a row, Saskatchewan had the lowest unemployment rate in Canada. Saskatchewan’s unemployment rate has consistently been well below the national average.
SASKATCHEWAN AND CANADA
UNEMPLOYMENT RATE
Source: Statistics Canada
Increased demand for workers has helped attract people to the province from other jurisdictions. International net-migration in the third quarter of last year was the highest ever recorded. Between October 1, 2010 and October 1, 2011, Saskatchewan’s population increased by 15,241 persons.
POPULATION AND EMPLOYMENT
IN SASKATCHEWAN
Source: Statistics Canada
Budget Summary | Budget 2012-13 29
SASKATCHEWAN INTERNATIONAL AND
INTERPROVINCIAL NET-MIGRATION
Source: Statistics Canada
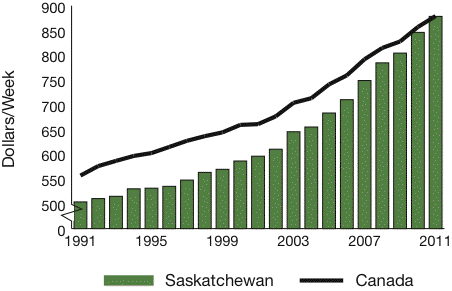
Average weekly earnings in Saskatchewan grew by 3.8 per cent in 2011 to $878.38. This percentage increase ranked third among provinces, behind only Newfoundland and Labrador and Alberta. As well, average weekly earnings in Saskatchewan last year exceeded the national average for the first time.
SASKATCHEWAN AND CANADA
AVERAGE WEEKLY EARNINGS
Source: Statistics Canada
Retail sales growth last year in Saskatchewan was stronger than expected. The 2011-12 mid-year forecast projected growth of 6.4 per cent; however, recent figures released by Statistics Canada show growth of 8.5 per cent in 2011 – the highest rate of growth in Canada.
RETAIL SALES GROWTH IN 2011
Source: Statistics Canada
OUTLOOK
Overall, the Ministry of Finance is forecasting 3.6 per cent real GDP growth and 12.9 per cent nominal GDP growth for 2011. These growth forecasts represent a slight improvement from the 2011-12 mid-year real and nominal GDP growth forecasts of 3.1 per cent and 11.2 per cent, respectively. A better-than-expected crop (in terms of quantity) and slightly stronger consumer spending and business investment are the primary reasons.
For 2012, Saskatchewan real GDP is forecast to grow by 2.8 per cent, while nominal GDP is forecast to grow by 8.6 per cent.
30 Budget 2012-13 | Budget Summary
SASKATCHEWAN FORECAST SUMMARY
| | | 2011 | | | 2012 | | | 2013 | | | 2014 | | | 2015 | | | 2016 | |
| Real GDP Growth (%) | | | 3.6 | | | | 2.8 | | | | 2.6 | | | | 2.4 | | | | 2.4 | | | | 2.3 | |
| Nominal GDP Growth (%) | | | 12.9 | | | | 8.6 | | | | 3.7 | | | | 3.2 | | | | 3.6 | | | | 3.4 | |
| CPI Growth (%) | | | 2.8 | * | | | 2.1 | | | | 2.0 | | | | 2.2 | | | | 2.1 | | | | 2.3 | |
| Employment Growth (000s) | | | 1.6 | * | | | 5.5 | | | | 4.2 | | | | 3.3 | | | | 3.6 | | | | 3.5 | |
| Unemployment Rate (%) | | | 5.0 | * | | | 5.1 | | | | 5.3 | | | | 5.1 | | | | 5.2 | | | | 5.0 | |
| Retail Sales Growth (%) | | | 8.5 | * | | | 5.5 | | | | 4.3 | | | | 5.6 | | | | 4.0 | | | | 4.0 | |
Source: Ministry of Finance, Statistics Canada
SASKATCHEWAN GDP GROWTH
Source: Ministry of Finance
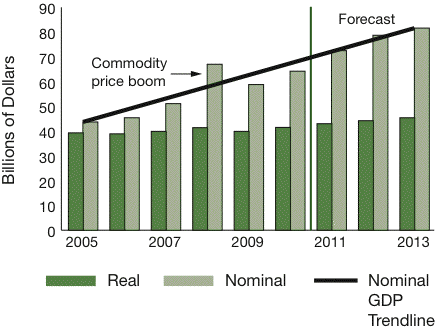
SASKATCHEWAN GDP
Source: Ministry of Finance
Part of overall growth in 2011 was due to the 14.8 per cent increase in crop production. This increase was possible, in part, because the flooding of 2010 had such a large negative impact on the 2010 crop (crop production fell 24.9 per cent). The current 2012 forecast assumes a similar-size crop to 2011.
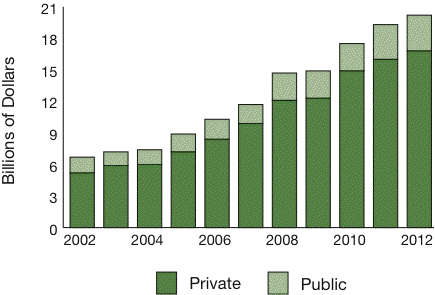
Private investment will help drive growth this year. Private investment has been on a remarkable trend in recent years and is expected to grow another 4.9 per cent in 2012, according to Statistics Canada’s most recent private and public investment intentions survey.
PRIVATE AND PUBLIC INVESTMENT
IN SASKATCHEWAN
Source: Statistics Canada
Budget Summary | Budget 2012-13 31
PRIVATE AND PUBLIC INVESTMENT
INTENTIONS AS A SHARE OF NOMINAL GDP
Source: Statistics Canada, Conference Board of Canada
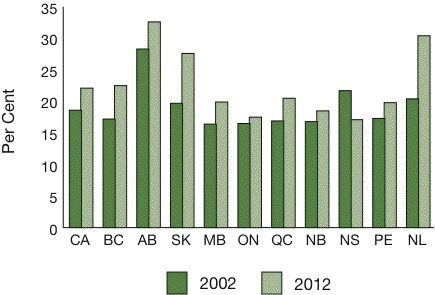
In 2002 in Saskatchewan, private and public investment as a share of provincial nominal GDP totaled 19.7 per cent. In 2012, this figure is expected to be 27.6 per cent, behind only Alberta and Newfoundland and Labrador.
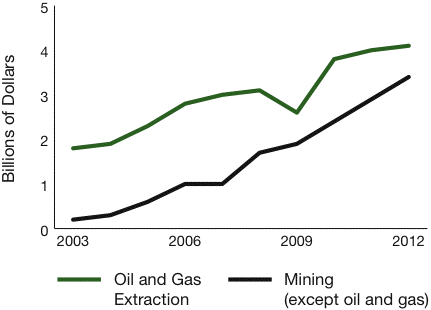
Oil and gas investment and other mining investment, including investment related to expansion of the province’s potash industry, are expected to remain strong.
MINING INVESTMENT IN SASKATCHEWAN
Source: Statistics Canada
Investment in the oil patch is being supported by strong oil prices which are expected to rise again this year. The current forecast assumes the price of West Texas Intermediate (WTI) oil will average US$100.00 per barrel in 2012.
COMMODITY PRICE ASSUMPTIONS – CALENDAR YEAR
| | | 2011 Actual | | | 2012 | | | 2013 | | | 2014 | | | 2015 | | | 2016 | |
| WTI Oil (US$/barrel) | | | 95.11 | | | | 100.00 | | | | 102.00 | | | | 102.00 | | | | 100.00 | | | | 100.00 | |
| Natural Gas (C$/GJ) | | | 3.43 | | | | 3.00 | | | | 3.50 | | | | 4.00 | | | | 4.40 | | | | 4.80 | |
Potash (C$/K2O tonne)1 | | | 666.95 | | | | 758.93 | | | | 768.31 | | | | 772.85 | | | | 792.78 | | | | 819.21 | |
Potash (US$/KCl tonne)1 | | | 411.48 | | | | 460.17 | | | | 477.11 | | | | 485.11 | | | | 493.27 | | | | 501.72 | |
Wheat (C$/tonne)2 | | | 269.76 | | | | 272.28 | | | | 264.96 | | | | 277.31 | | | | 290.22 | | | | 286.17 | |
Canola (C$/tonne)2 | | | 540.00 | | | | 525.00 | | | | 517.49 | | | | 488.24 | | | | 489.42 | | | | 494.03 | |
| | 1 | The potash industry quotes prices in US dollars per KCl tonne. Provincial royalty calculations, however, are based on the Canadian dollar price per K2O tonne. |
| | 2 | Crop prices are on a crop year basis and represent the price at the farmgate. |
| | Source: Ministry of Energy and Resources, Ministry of Agriculture |
32 Budget 2012-13 | Budget Summary
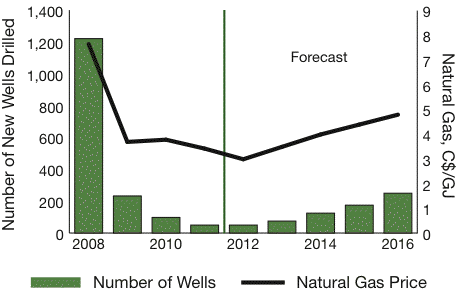
Oil production last year was impacted somewhat by flooding, but is expected to remain strong over the forecast period. The number of gas wells drilled in Saskatchewan has fallen in recent years, but is expected to begin to rise gradually as prices improve.
NATURAL GAS PRICES AND THE NUMBER
OF GAS WELLS DRILLED IN SASKATCHEWAN
Source: Ministry of Energy and Resources
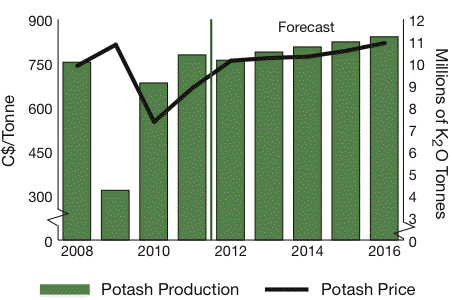
The Saskatchewan potash industry produced a record 10.4 million K2O tonnes of potash in 2011 as potash prices increased to $666.95 per K2O tonne. World demand has eased in recent months due in part to uncertainties surrounding the global growth outlook. This is expected to have some impact on production in 2012. Prices, however, are expected to remain strong.
SASKATCHEWAN POTASH PRODUCTION
AND AVERAGE POTASH PRICES
Source: Ministry of Energy and Resources
Agricultural prices are also expected to remain strong this year. Wheat and canola in particular are expected to average $272.28 per tonne and $525.00 per tonne, respectively.
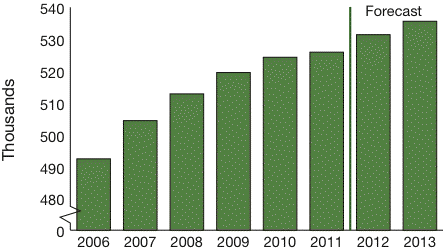
Employment in Saskatchewan is expected to continue to rise. Total employment is forecast to increase by 5,500 this year and by 4,200 in 2013.
SASKATCHEWAN EMPLOYMENT
Source: Statistics Canada, Ministry of Finance
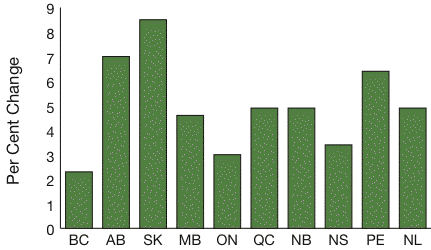
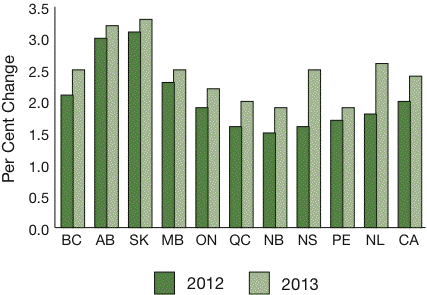
According to private sector forecasters, Saskatchewan’s economy is expected to outperform all other provincial economies in each of the next two years. Private sector forecasts of Saskatchewan real GDP growth in 2012 range from a high of 4.2 per cent to a low of 2.4 per cent.
PRIVATE SECTOR FORECASTS OF
REAL GDP GROWTH BY PROVINCE*
| * | The percentages are the average of private sector forecasts as of March 6, 2012. |
Budget Summary | Budget 2012-13 33
PRIVATE SECTOR FORECASTS OF REAL GDP GROWTH BY PROVINCE
(Per Cent Change*)
| | | 2011 | | | Rank | | | 2012 | | | Rank | | | 2013 | | | Rank | |
| British Columbia | | | 2.3 | | | | 4 | | | | 2.1 | | | | 4 | | | | 2.5 | | | | 4 | |
| Alberta | | | 3.6 | | | | 3 | | | | 3.0 | | | | 2 | | | | 3.2 | | | | 2 | |
| Saskatchewan | | | 3.8 | | | | 2 | | | | 3.1 | | | | 1 | | | | 3.3 | | | | 1 | |
| Manitoba | | | 2.1 | | | | 5 | | | | 2.3 | | | | 3 | | | | 2.5 | | | | 4 | |
| Ontario | | | 2.1 | | | | 5 | | | | 1.9 | | | | 5 | | | | 2.2 | | | | 5 | |
| Québec | | | 1.8 | | | | 7 | | | | 1.6 | | | | 8 | | | | 2.0 | | | | 6 | |
| New Brunswick | | | 1.2 | | | | 9 | | | | 1.5 | | | | 9 | | | | 1.9 | | | | 7 | |
| Nova Scotia | | | 1.6 | | | | 8 | | | | 1.6 | | | | 8 | | | | 2.5 | | | | 4 | |
| Prince Edward Island | | | 1.9 | | | | 6 | | | | 1.7 | | | | 7 | | | | 1.9 | | | | 7 | |
| Newfoundland and Labrador | | | 3.9 | | | | 1 | | | | 1.8 | | | | 6 | | | | 2.6 | | | | 3 | |
| Canada | | | 2.4 | | | | | | | | 2.0 | | | | | | | | 2.4 | | | | | |
| | * | The percentages shown in the table are the average of private sector forecasts as of March 6, 2012. Private sector here includes all of the major Canadian banks, Global Insight, Conference Board of Canada and The Centre for Spatial Economics. |
PRIVATE SECTOR REAL GDP GROWTH FORECASTS FOR SASKATCHEWAN
(Per Cent Change*)
| | | | | | | | | | | | Release | |
| | | 2011 | | | 2012 | | | 2013 | | | Date | |
| IHS Global Insight | | | 3.1 | | | | 2.9 | | | | 3.4 | | | Jan./12 | |
| Conference Board of Canada | | | 5.2 | | | | 2.6 | | | | 3.5 | | | Feb./12 | |
| Centre for Spatial Economics | | | 3.6 | | | | 4.2 | | | | 3.4 | | | Jan./12 | |
| TD Bank | | | 3.0 | | | | 2.4 | | | | 2.7 | | | Jan./12 | |
| RBC | | | 4.5 | | | | 4.2 | | | | 4.7 | | | Dec./11 | |
| Bank of Montreal | | | 3.1 | | | | 2.9 | | | | 3.0 | | | Feb./12 | |
| CIBC | | | 4.0 | | | | 3.1 | | | | 3.0 | | | Mar./12 | |
| Scotiabank | | | 4.0 | | | | 2.8 | | | | 3.0 | | | Mar./12 | |
| Laurentian Bank | | | 3.5 | | | | 2.4 | | | | 2.6 | | | Dec./11 | |
| Private Sector Average | | | 3.8 | | | | 3.1 | | | | 3.3 | | | | |
| 2012-13 Budget Forecast | | | 3.6 | | | | 2.8 | | | | 2.6 | | | | |
CONCLUSION
Saskatchewan’s economy performed well in 2011, and is forecast to perform well again this year. Real GDP growth of 2.8 per cent is projected, and job growth is expected to continue.
Uncertainties surrounding the European sovereign debt crisis remain a concern. Though some Eurozone countries are already in recession, continued economic growth in emerging markets and the United States is anticipated to keep the world economy afloat.
34 Budget 2012-13 | Budget Summary
GENERAL REVENUE FUND
FINANCIAL OUTLOOK
INTRODUCTION
The 2012-13 Budget represents the fifth year under The Growth and Financial Security Act. The Act requires a four-year financial plan in which total General Revenue Fund (GRF) expense must balance with or be less than total GRF revenue each year.
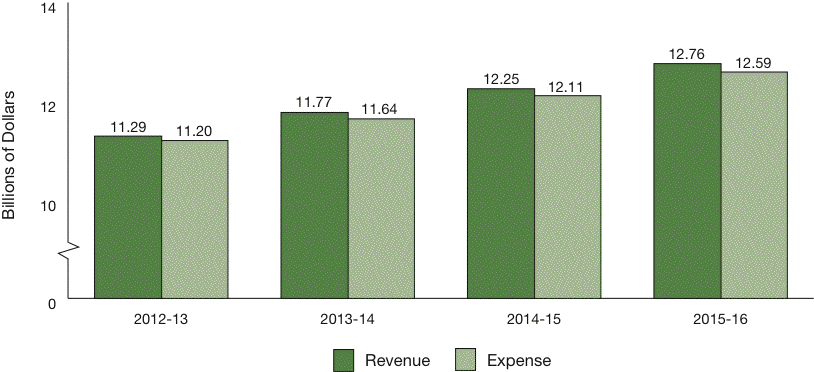
The 2012-13 Budget estimates a GRF surplus of $47.5 million. GRF surpluses are also forecast for the subsequent three years.
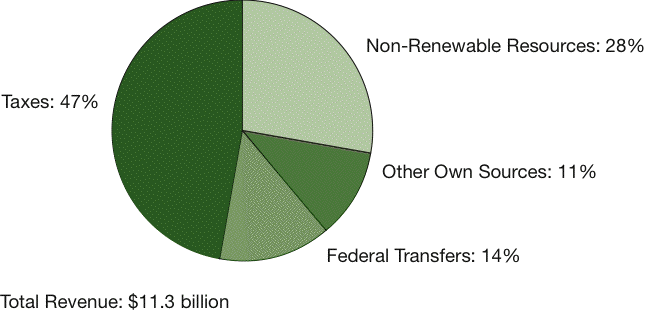
2012-13 GRF REVENUE
GRF revenue is forecast to be $11.3 billion in 2012-13, an increase of $215.7 million, or 1.9 per cent, from 2011-12. The increase is due to higher non-renewable resource and taxation revenue, partially offset by lower revenue from Crown entities, other own-sources and federal transfers.
Revenue in 2011-12 was boosted by several non-recurring items. These include unbudgeted federal disaster assistance revenue, federal funding via stimulus and infrastructure programs that are expiring, a $120.0 million Crown Investments Corporation of Saskatchewan (CIC) dividend to help fund flood relief, and other miscellaneous own-source gains.
Excluding these non-recurring items, GRF revenue is estimated to grow 5.4 per cent in 2012-13.
Tax Revenue
The tax revenue forecast incorporates all revenue initiatives introduced with the 2012-13 Budget.
In addition, the following new accounting standards have been incorporated into the forecast.
| • | Beginning in 2012-13, commissions paid to Provincial Sales Tax (PST), Liquor Consumption Tax (LCT) and Tobacco Tax vendors are recorded as GRF expense instead of deducted from tax revenue. The total cost of these commissions is budgeted at $9.0 million. Revenue and expense forecasts for 2011-12 have been restated to reflect this new accounting standard. |
COMPOSITION OF 2012-13 GRF REVENUE
Budget Summary | Budget 2012-13 35
2012-13 GRF REVENUE RECONCILIATION
By Revenue Source
| (Millions of Dollars) | | | |
| | | | |
2011-12 GRF Revenue Forecast1 | | | 11,075.2 | |
| Potash | | | 254.1 | |
| Taxes | | | 198.1 | |
| Oil | | | 129.0 | |
| CIC Regular Dividend | | | 40.0 | |
| Resource Surcharge | | | 30.5 | |
| Federal Transfers | | | (167.9 | ) |
| CIC Special Dividend | | | (127.0 | ) |
| Interest Earnings | | | (92.4 | ) |
| Other Changes | | | (48.7 | ) |
| Total Revenue Changes | | | 215.7 | |
| 2012-13 GRF Revenue Estimate | | | 11,290.9 | |
| | 1 | Beginning in 2012-13, commissions paid to tax vendors are recorded as GRF expense instead of deducted from tax revenue. The 2011-12 forecast has been restated to be consistent. |
2012-13 GRF REVENUE RECONCILIATION
By Major Factor
| (Millions of Dollars) | | | |
| | | | |
2011-12 GRF Revenue Forecast1 | | | 11,075.2 | |
| Growth in Own-Source Revenue Base | | | 597.1 | |
| Change in Federal Transfers | | | (167.9 | ) |
Change in Other Own-Source Revenue2 | | | (117.4 | ) |
| Change in CIC Dividends | | | (87.0 | ) |
| 2012-13 Tax and Revenue Measures | | | (9.1 | ) |
| Total Revenue Changes | | | 215.7 | |
| 2012-13 GRF Revenue Estimate | | | 11,290.9 | |
| | 1 | Beginning in 2012-13, commissions paid to tax vendors are recorded as GRF expense instead of deducted from tax revenue. The 2011-12 forecast has been restated to be consistent. |
| | 2 | Includes non-recurring interest earnings and dividends from other government organizations. |
36 Budget 2012-13 | Budget Summary
| • | Interest charges and penalties levied under the tax system are now included in Other Own-Source revenue. This new policy moves $7.4 million of revenue that was previously reported as tax revenue to Interest, Premium, Discount and Exchange ($4.4 million) and Fines, Forfeits and Penalties ($3.0 million). Revenue forecasts for 2011-12 have not been restated to reflect this change. |
| • | The cost of the Saskatchewan Low-Income Tax Credit (SLITC) is now deducted from PST revenue instead of Individual Income Tax. The cost of this credit is budgeted at $80.0 million per year. Revenue forecasts for 2011-12 have not been restated to reflect this new accounting standard. |
Tax revenue is forecast at $5.3 billion in 2012-13 and accounts for 47 per cent of GRF revenue. This is an increase of $198.1 million, or 3.9 per cent, from 2011-12.
| • | Corporation Income Tax (CIT) in 2011-12 was negatively affected by lower-than-expected assessments and higher-than-expected tax credit claims for the 2010 tax year. CIT revenue in 2011-12 was $288.3 million lower than budgeted, largely as a result of a negative prior-year adjustment for the 2010 tax year. The weaker 2010 assessments also negatively affect 2012-13 revenue, as federal instalment payments to Saskatchewan for the 2012 tax year are based on the province’s share of national corporate taxable income in 2010. This feature of the tax-collection agreement restrains CIT payments to the province in 2012-13. As a result, CIT revenue is forecast at $817.2 million, an increase of $24.8 million from 2011-12. |
| • | Individual Income Tax is forecast to grow by $169.1 million (8.8 per cent) in 2012-13, of which $80.0 million is related to the SLITC no longer being deducted against Individual Income Tax revenue. The remainder of the increase is due mainly to anticipated growth in Saskatchewan employment and wages. |
| • | PST revenue is forecast at $1.3 billion in 2012-13, a decrease of $24.5 million from 2011-12. Prior to adjustments for new accounting standards, PST revenue is forecast to grow $60.4 million (4.4 per cent). This increase, however, is more than offset by the new accounting policy that deducts the $80.0 million SLITC from PST revenue, as well as the reclassification of $4.9 million in interest and penalty revenue collected with the PST to Other Own-Source revenue. |
| • | Tobacco Tax revenue is forecast at $247.1 million, the same as last year. In 2011-12, anticipated growth in tobacco consumption did not materialize. As a result, revenue this year is budgeted to remain unchanged. |
| • | Growth in Saskatchewan’s economy and population is expected to result in a $17.0 million increase in Fuel Tax revenue and an $11.7 million increase in Other taxes in 2012-13. |
Non-Renewable Resource Revenue
Non-renewable resource revenue, which accounts for 28 per cent of GRF revenue, is forecast at $3.1 billion in 2012-13, an increase of $387.2 million, or 14.0 per cent, from last year. The increase is due to increases in potash, oil and the Resource Surcharge, partially offset by declines in Crown land sales, natural gas and other non-renewable resources.
Budget Summary | Budget 2012-13 37
FISCAL-YEAR NON-RENEWABLE RESOURCE FORECAST ASSUMPTIONS
| | | 2011-12 Budget | | | 2011-12 Forecast | | | 2012-13 Budget | |
| Natural Gas Price (fieldgate, C$/GJ) | | | 3.65 | | | | 3.29 | | | | 2.98 | |
| Natural Gas Production (billion cubic feet) | | | 160.2 | | | | 153.6 | | | | 135.6 | |
| WTI Oil Price (US$/barrel) | | | 93.75 | | | | 96.60 | | | | 100.50 | |
| Well-head Oil Price (C$/barrel) | | | 77.38 | | | | 80.79 | | | | 82.45 | |
| Oil Production (million barrels) | | | 159.4 | | | | 156.2 | | | | 176.9 | |
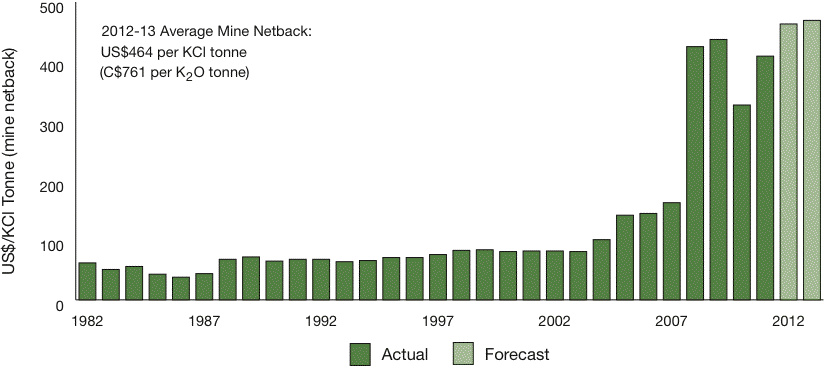
| Potash Price (mine netback, US$/KCl tonne) | | | 393 | | | | 423 | | | | 464 | |
Potash Price (mine netback, C$/K2O tonne) | | | 646 | | | | 689 | | | | 761 | |
Potash Sales (million K2O tonnes) | | | 10.4 | | | | 10.2 | | | | 10.2 | |
| Canadian Dollar (US cents) | | | 99.82 | | | | 100.64 | | | | 100.00 | |
| • | Potash revenue is forecast at $705.2 million in 2012-13, an increase of $254.1 million from last year. |
The outlook for potash sales and prices remains positive as high crop prices and a growing world population provide farmers with the incentives needed to maintain fertilizer applications. Sales are forecast to be 10.2 million K2O tonnes in 2012-13, the same as last year.
Average realized prices are forecast at US$464 per KCl tonne (C$761 per K2O tonne) in the 2012-13 fiscal year, an increase of US$41 per KCl tonne from last year.
In addition, the winding down of industry capital expenditures related to mine expansions will begin to boost potash royalties in 2012-13. While current mine expansions are not expected to be complete until 2020, capital expenditures are expected to peak in 2012 and then decline in 2013. Nonetheless, investments by the Saskatchewan potash industry are forecast to remain well above pre-expansion levels in 2013 and beyond.
SASKATCHEWAN POTASH PRICES
38 Budget 2012-13 | Budget Summary
SASKATCHEWAN POTASH INDUSTRY CAPITAL EXPENDITURES*
| • | Oil revenue is forecast at $1.6 billion, an increase of $129.0 million. The increase is a result of higher price and production forecasts. |
West Texas Intermediate (WTI) oil prices continue to be volatile. For example, in 2011, daily prices ranged between US$75.67 and US$113.93 per barrel and averaged US$95.11 over the entire calendar year.
For 2012-13, Saskatchewan well-head prices are forecast to average C$82.45 per barrel, up C$1.66 from last year. The increase is due largely to a higher forecast for WTI oil prices.
WTI oil is expected to average US$100.50 per barrel, up from US$96.60 in 2011-12. The value of the Canadian dollar is projected at parity in 2012-13, a small decrease from last year’s average exchange rate.
Oil production is expected to rebound from last year’s lower-than-expected output that resulted from wet spring and summer conditions. Production is forecast to increase more than 13 per cent and reach 176.9 million barrels.
WTI OIL PRICES
Budget Summary | Budget 2012-13 39
| • | Resource Surcharge revenue is forecast at $485.9 million in 2012-13. The $30.5 million increase from last year is a result of continued growth in the value of non-renewable resource sales, primarily oil and potash. |
| • | Crown land sales are forecast to generate $220.0 million in revenue, a decline of $14.1 million from last year as the industry continues to focus on drilling and exploring land purchased in recent years. |
| • | Natural gas royalties are forecast at $12.5 million, a decrease of $5.5 million. The outlook for natural gas continues to be weak against a backdrop of high inventories and a warm North American winter. Natural gas prices are forecast at $2.98 per gigajoule, down from $3.29 in 2011-12. Production is expected to fall nearly 12 per cent to 135.6 billion cubic feet. |
| • | Other non-renewable resources, including uranium, coal and other minerals, are forecast at $123.8 million, a decrease of $6.8 million from 2011-12. |
Transfers from Crown Entities
Transfers from Crown entities are forecast at $639.4 million in 2012-13, a $112.0 million decrease from last year.
The regular CIC dividend is targeted at $150.0 million in 2012-13, an increase of $40.0 million.
This increase is more than offset by a $127.0 million decrease in special dividends from CIC. In 2011-12, CIC provided dividends of $120.0 million to help fund provincial flood-relief programs and $10.0 million for Saskatchewan’s nuclear research and development strategy. The 2012-13 Special Dividend is set at $3.0 million.
The Saskatchewan Liquor and Gaming Authority (SLGA) dividend is forecast to be $439.9 million in 2012-13, an increase of $3.0 million from last year. Transfers from all other government entities are forecast at $46.5 million. This is $28.0 million lower than last year, primarily due to a $25.0 million return of surplus funds from the Agricultural Credit Corporation of Saskatchewan in 2011-12.
Other Own-Source Revenue
Other own-source revenue is forecast at $601.3 million, a decrease of $89.7 million. The decline is due primarily to lower interest earnings in 2012-13. Interest, premium, discount and exchange revenue is forecast to drop $92.4 million from last year as a result of gains on the sale of financial assets in 2011-12 that are not budgeted to repeat.
Federal Transfers
Transfers and contributions from the Government of Canada will total $1.6 billion in 2012-13, a decrease of $167.9 million from last year.
Canada Health Transfer revenue is estimated at $902.9 million, an increase of $55.8 million, and Canada Social Transfer revenue is estimated at $363.7 million, up $11.0 million. The increases are due mainly to legislated increases in the federal funding envelope.
Other revenue received from federal-provincial cost-sharing arrangements is forecast at $320.3 million in 2012-13, a decline of $234.7 million from last year. The decrease is primarily a result of the winding down and expiration of a number of federal infrastructure and stimulus programs, as well as a significant amount of federal disaster assistance funding recorded in 2011-12.
40 Budget 2012-13 | Budget Summary
RISKS TO THE 2012-13 REVENUE FORECAST
The revenue forecast in the 2012-13 Budget incorporates a series of assumptions that impact Saskatchewan’s fiscal performance, including assumptions on Canadian, U.S. and global economic growth, non-renewable resource prices and the value of the Canadian dollar. These factors are beyond the Province’s control, yet they heavily influence Saskatchewan’s largest revenue sources, particularly non-renewable resource revenue and Corporation Income Tax.
Actual economic performance and non-renewable resource prices will undoubtedly vary from budget assumptions. As a result, revenue linked to these factors will vary from budget estimates. In recent years, this volatility has become more pronounced.
Recognizing that Saskatchewan is reliant on non-renewable resources and external events, the underlying assumptions upon which revenue estimates are derived incorporate a number of private sector forecasts in an attempt to minimize risk. As the budget is developed, the degree of risk present in the revenue forecast is assessed and quantified, and this risk analysis continues throughout the fiscal year.
In 2012-13, it is estimated that:
| • | a 1 per cent change in the level of 2012 nominal Gross Domestic Product (GDP) results in an estimated $97 million change in own-source revenue (the impact of such a change may not be fully realized in 2012-13 due to lags in the receipt of some revenue, such as income taxes and the Resource Surcharge); |
| • | a US$1 per barrel change in the average WTI oil price results in an estimated $19 million change in oil royalties; |
| • | a US$50 per KCl tonne (C$82 per K2O tonne) change in the average realized 2012 potash price results in an estimated $142 million change in potash royalties; and, |
| • | a 1 U.S. cent change in the average value of the Canadian dollar results in an estimated $34 million change in non-renewable resource revenue. |
MEDIUM-TERM GRF REVENUE OUTLOOK
The revenue outlook for the medium term is positive. After 1.9 per cent growth in 2012-13, GRF revenue is forecast to grow an average of 4.2 per cent over the subsequent three years. The current medium-term outlook results in a GRF revenue forecast of $12.8 billion in 2015-16. The growth is due largely to strong growth in taxation and non-renewable resource revenue, with modest growth in other own-sources of revenue and federal transfers.
Tax revenue is forecast to increase an average of 5.2 per cent over the forecast period. All tax sources are forecast to grow over the timeframe due to continued growth in the economy.
Non-renewable resource revenue is forecast to increase an average of 4.8 per cent over the medium term. The growth is largely the result of anticipated increases in the value of oil and potash sales. Potash royalties will also benefit from lower levels of capital expenditures over the medium term as mine expansions are completed. Natural gas revenue, however, is expected to remain depressed over the forecast period.
Budget Summary | Budget 2012-13 41
GRF REVENUE
MEDIUM-TERM NON-RENEWABLE RESOURCE FORECAST ASSUMPTIONS
| | | | 2011-12 | | | | 2012-13 | | | | 2013-14 | | | | 2014-15 | | | | 2015-16 | |
| Natural Gas Price (fieldgate, C$/GJ) | | | 3.29 | | | | 2.98 | | | | 3.97 | | | | 4.10 | | | | 4.51 | |
| Natural Gas Production (billion cubic feet) | | | 153.6 | | | | 135.6 | | | | 124.2 | | | | 116.0 | | | | 110.3 | |
| WTI Oil Price (US$/barrel) | | | 96.60 | | | | 100.50 | | | | 102.00 | | | | 101.50 | | | | 100.00 | |
| Well-head Oil Price (C$/barrel) | | | 80.79 | | | | 82.45 | | | | 81.83 | | | | 80.62 | | | | 79.62 | |
| Oil Production (million barrels) | | | 156.2 | | | | 176.9 | | | | 186.6 | | | | 190.1 | | | | 188.9 | |
| Potash Price (mine netback, US$/KCl tonne) | | | 423 | | | | 464 | | | | 479 | | | | 487 | | | | 495 | |
Potash Price (mine netback, C$/K2O tonne) | | | 689 | | | | 761 | | | | 769 | | | | 778 | | | | 799 | |
Potash Sales (million K2O tonnes) | | | 10.2 | | | | 10.2 | | | | 10.6 | | | | 10.8 | | | | 11.0 | |
| Canadian Dollar (US cents) | | | 100.64 | | | | 100.00 | | | | 102.08 | | | | 102.68 | | | | 101.60 | |
As a share of total revenue, non-renewable resources are projected to average 28 per cent over the medium term.
Transfers from Crown entities and other own-source revenue are expected to remain relatively flat over the medium term and increase at an average of 1.5 per cent and 1.4 per cent, respectively. These two categories, however, are subject to volatility over the medium term as the result of several factors, including Government decisions with respect to Crown dividends, realized gains on the sale of financial assets and unexpected miscellaneous and casual revenue.
Federal transfers are forecast to increase an average of 1.5 per cent over the forecast period. The increase is due mainly to increases in Canada Health Transfer and Canada Social Transfer revenue, as per existing legislation. Revenue from federal-provincial cost-sharing agreements is projected to decrease over the forecast period as existing major infrastructure agreements expire.
42 Budget 2012-13 | Budget Summary
NON-RENEWABLE RESOURCE REVENUE AS A SHARE OF GRF REVENUE
2012-13 GRF EXPENSE
GRF expense is estimated to be $11.2 billion in 2012-13. This is an increase of $507.6 million, or 4.7 per cent, from the restated 2011-12 Budget Estimate.
Operating expense (excluding capital transfers) is budgeted at $10.9 billion in 2012-13. This is a $421.5 million increase from the 2011-12 Budget and accounts for 3.9 percentage points of GRF expense growth in 2012-13.
Third-party capital transfers total $265.3 million in 2012-13, an $86.1 million increase from the 2011-12 Budget. This increase accounts for 0.8 percentage points of GRF expense growth.
Total GRF expense in 2012-13 is allocated by ministry as follows:
| • | Health, $4.7 billion, or 41.8 per cent; |
| • | Education (including Teachers’ Pensions and Benefits), $1.6 billion, or 14.3 per cent; |
COMPOSITION OF 2012-13 GRF EXPENSE
By Ministry
Budget Summary | Budget 2012-13 43
| • | Advanced Education, Employment and Immigration, $890.6 million, or 8.0 per cent; |
| • | Social Services, $852.7 million, or 7.6 per cent; |
| • | Agriculture, $430.8 million, or 3.8 per cent; |
| • | Highways and Infrastructure, $425.9 million, or 3.8 per cent; |
| • | Debt Servicing, $400.0 million, or 3.6 per cent; and, |
| • | remaining ministries and agencies, $1.9 billion, or 17.1 per cent. |
By classification, 2012-13 expense is allocated as follows:
| • | Third-party operating transfers, $7.4 billion, or 66.4 per cent; |
| • | Government-delivered programs, $1.8 billion, or 16.1 per cent; |
| • | Transfers to individuals, $1.3 billion, or 11.5 per cent; |
| • | Debt servicing, $400.0 million, or 3.6 per cent; and, |
| • | Third-party capital transfers, $265.3 million, or 2.4 per cent. |
Compared to the 2011-12 Budget, this allocation represents a shifting of the shares, primarily from government-delivered programs (down 0.5 percentage points) and debt servicing (down 0.3 percentage points) to third-party capital transfers (up 0.7 percentage points).
2012-13 GRF EXPENSE RECONCILIATION
By Ministry
| (Millions of Dollars) | | | |
| | | | |
2011-12 Budget GRF Expense Estimate1 | | | 10,688.3 | |
| Change in Operating Expense | | | | |
| Health | | | 194.1 | |
Education2 | | | 106.0 | |
| Social Services | | | 34.5 | |
| Advanced Education, Employment and Immigration | | | 28.1 | |
| Highways and Infrastructure | | | 25.2 | |
| Municipal Affairs | | | 21.3 | |
| Agriculture | | | 13.0 | |
| Debt Servicing | | | (20.0 | ) |
| Chief Electoral Officer | | | (11.8 | ) |
| Other Net Changes | | | 31.1 | |
| Total Change in Operating Expense | | | 421.5 | |
| Total Change in Third-Party Capital Transfers | | | 86.1 | |
| Total Expense Change | | | 507.6 | |
| 2012-13 Budget GRF Expense Estimate | | | 11,195.9 | |
| | 1 | Beginning in 2012-13, commissions paid to tax vendors are recorded as GRF expense instead of deducted from tax revenue. The 2011-12 Estimate has been restated to be consistent. |
| | | Includes Teachers' Pensions and Benefits |
44 Budget 2012-13 | Budget Summary
COMPOSITION OF 2012-13 GRF EXPENSE
By Classification
2012-13 GRF CAPITAL INVESTMENTS
Total capital investments in 2012-13 are budgeted at $787.7 million, an increase of $192.8 million from the 2011-12 Budget.
This year’s capital investments include:
| • | $265.3 million in capital grants to third parties (included in GRF expense); and, |
| • | $522.4 million allocated for investments in government-owned infrastructure. |
Since 2008-09, nearly $4.9 billion has been invested in the provincial infrastructure. This includes $2.8 billion in transfers to third parties for capital requirements and $2.1 billion in investments in government-owned infrastructure.
2012-13 CAPITAL INVESTMENTS
By Ministry
Budget Summary | Budget 2012-13 45
| | | Excludes $154 million that was subsequently used by recipients for operation in 2009-10. |
MEDIUM-TERM GRF EXPENSE OUTLOOK
Against a backdrop of a growing population and economy, expense growth in 2012-13 has been held to the level committed to in last year’s budget, 4.7 per cent.
Over the medium term, funding priorities will be addressed within the context of prudent fiscal planning. Expense growth is targeted at an average of 4.0 per cent over the next three years, below projected revenue growth of 4.2 per cent over the same time period.
GRF MEDIUM-TERM FINANCIAL FORECAST
46 Budget 2012-13 | Budget Summary
The Growth and Financial Security Act requires a four-year financial plan that sets out the Government’s plan for expense, revenue and debt.
In 2012-13, the GRF is estimated to have a surplus of $47.5 million after a $47.5 million transfer to the Growth and Financial Security Fund (GFSF).
The projected year-end balance in the GFSF is $756.4 million
Government general debt is estimated to be $3.8 billion on March 31, 2013, unchanged from the previous year.
Over the remainder of the forecast period, revenue growth is forecast to average 4.2 per cent annually. Expense growth is targeted at 4.0 per cent per year. The GRF will post pre-transfer surpluses each year, resulting in transfers to the GFSF over the medium term.
The GFSF is projected to have a balance of $978.9 million at the end of 2015-16.
Government general public debt is projected to remain unchanged over the four-year plan.
GRF FOUR-YEAR FINANCIAL PLAN
| (Millions of Dollars) | | | 2012-13 | | | | 2013-14 | | | | 2014-15 | | | | 2015-16 | |
| Revenue | | | 11,290.9 | | | | 11,771.3 | | | | 12,251.5 | | | | 12,757.8 | |
| Expense | | | 11,195.9 | | | | 11,640.1 | | | | 12,105.7 | | | | 12,589.8 | |
Pre-Transfer Surplus (Deficit) | | | 95.0 | | | | 131.2 | | | | 145.8 | | | | 168.0 | |
| Transfer (to) GFSF | | | (47.5 | ) | | | (65.6 | ) | | | (72.9 | ) | | | (84.0 | ) |
| Transfer from GFSF | | | – | | | | – | | | | – | | | | – | |
| Net Transfer from (to) GFSF | | | (47.5 | ) | | | (65.6 | ) | | | (72.9 | ) | | | (84.0 | ) |
| GRF Surplus | | | 47.5 | | | | 65.6 | | | | 72.9 | | | | 84.0 | |
| GFSF Balance | | | 756.4 | | | | 822.0 | | | | 894.9 | | | | 978.9 | |
| Government Debt | | | 3,810.2 | | | | 3,810.2 | | | | 3,810.2 | | | | 3,810.2 | |
Budget Summary | Budget 2012-13 47
GENERAL REVENUE FUND
2011-12 FINANCIAL UPDATE
The current 2011-12 General Revenue Fund (GRF) forecast shows that the GRF is on track to record a pre-transfer surplus of $55.8 million. This is $59.2 million less than budgeted and is the result of:
| • | a $331.1 million increase in expense, largely as a result of costs incurred with flood relief and the teachers’ settlement; partially offset by, |
| • | a $271.9 million increase in revenue, due primarily to an unbudgeted dividend from the Crown Investments Corporation of Saskatchewan (CIC) to assist in funding flood relief, federal disaster assistance funding and higher-than-expected oil prices. |
Half of the pre-transfer surplus, or $27.9 million, will be transferred to the Growth and Financial Security Fund (GFSF). The budgeted $325.0 million withdrawal from the GFSF for debt reduction will proceed.
The resulting GRF surplus in 2011-12 is forecast at $352.9 million and the GFSF is projected to have a year-end balance of $708.9 million.
Government general public debt is forecast to be $3.8 billion on March 31, 2012, a decrease of $325.0 million from the previous year.
The following table summarizes the 2011-12 GRF fiscal forecasts as published over the course of the fiscal year. The forecasts in the table below have not been restated to reflect new accounting standards that will be in place in 2012-13.
GRF 2011-12 FINANCIAL FORECASTS
| | | | | | 1st | | | | | | 3rd | | | Change | |
| | | Budget | | | Quarter | | | Mid-Year | | | Quarter | | | from | |
| (Millions of Dollars) | | Estimate | | | Forecast | | | Projection | | | Forecast | | | Budget | |
| Revenue | | | 10,794.3 | | | | 10,858.4 | | | | 10,951.1 | | | | 11,066.2 | | | | 271.9 | |
| Expense | | | 10,679.3 | | | | 10,786.7 | | | | 10,926.1 | | | | 11,010.4 | | | | 331.1 | |
Pre-Transfer Surplus (Deficit) | | | 115.0 | | | | 71.7 | | | | 25.0 | | | | 55.8 | | | | (59.2 | ) |
| Transfer (to) GFSF | | | (57.5 | ) | | | (35.9 | ) | | | (12.5 | ) | | | (27.9 | ) | | | 29.6 | |
| Transfer from GFSF | | | 325.0 | | | | 325.0 | | | | 325.0 | | | | 325.0 | | | | 0.0 | |
Net Transfer from (to) GFSF | | | 267.5 | | | | 289.1 | | | | 312.5 | | | | 297.1 | | | | 29.6 | |
| GRF Surplus | | | 382.5 | | | | 360.8 | | | | 337.5 | | | | 352.9 | | | | (29.6 | ) |
GFSF Balance1 | | | 710.8 | | | | 716.9 | | | | 693.5 | | | | 708.9 | | | | (1.9 | ) |
Government Debt2 | | | 3,815.5 | | | | 3,810.2 | | | | 3,810.2 | | | | 3,810.2 | | | | (5.3 | ) |
1 | The 1st Quarter forecast and all subsequent forecasts reflect the actual 2011-12 opening balance of $1,006.0 million. |
2 | The 1st Quarter forecast and all subsequent forecasts reflect the actual March 31, 2011 level of $4,135.2 million. |
48 Budget 2012-13 | Budget Summary
SASKATCHEWAN’S TAX EXPENDITURES
INTRODUCTION
Although the primary purpose of taxation is to raise revenue, governments also attain some of their social and economic goals by reducing the taxes paid by certain taxpayers. These reductions are commonly called “tax expenditures” and include such measures as exemptions, deductions, tax credits, preferential tax rates and deferrals. Each provides special or preferential treatment to certain taxpayers or to certain types of activity. Taken together, they provide assistance to a variety of individuals, families and businesses, including farmers, senior citizens and small businesses.
While tax expenditures are usually absorbed in the overall revenue estimates and are not presented in the same way as direct spending programs, they reduce the amount of revenue generated by a government and they affect a government’s fiscal position in the same way as direct expenditures.
THE RATIONALE FOR TAX EXPENDITURES
Tax expenditures can achieve a number of objectives, such as enhancing the fairness of the tax system or promoting certain types of economic activity. In pursuing these objectives, some tax expenditures have become fundamental elements of the tax system.
Saskatchewan’s sales tax does not apply to certain basic items such as food, residential natural gas, residential electricity, children’s clothing and reading materials, thereby reducing the taxes paid by families consuming these basic items. This treatment is in contrast to the federal Goods and Services Tax (GST) and the sales taxes of provinces that have harmonized their sales taxes with the GST, since those taxes apply to a much broader range of goods and services purchased by families.
In recognition of the importance of agriculture to Saskatchewan, the Province’s fuel tax exemption provides tax-free treatment to farm-use diesel fuel, through a fuel-colouring program, and a partial tax exemption for farm-use gasoline when purchased in bulk.
Saskatchewan’s personal income tax system applies provincial marginal tax rates directly to taxable income as defined for federal income tax purposes. As a result, deductions that contribute to the federal determination of taxable income, such as the deduction for Registered Retirement Savings Plan contributions, also affect Saskatchewan income tax revenue. The impacts of several of these deductions are estimated in this paper.
In addition, Saskatchewan’s personal income tax system has distinct provincial non-refundable income tax credits that recognize the personal circumstances of the taxpayer, including family-based credits, disability-related credits and educational credits. This paper also provides estimates of the revenue impacts of several of these provincial non-refundable tax credits.
To improve the distribution of corporate taxes, Saskatchewan levies a lower income tax rate on small businesses and a special income tax rate on manufacturing and processing (M&P) profits. Saskatchewan also provides a refundable Investment Tax Credit (ITC) to assist M&P companies that invest in qualifying new or used M&P assets for use in Saskatchewan.
Budget Summary | Budget 2012-13 49
ASSOCIATED COSTS
While tax expenditures serve important social and economic objectives, the introduction of any tax expenditure results in associated costs. These costs take several forms.
| • | First, there is the cost of forgone revenue. Tax expenditures result in the reduction of revenue collected and have a significant impact on a government’s financial position. |
| • | Second, tax expenditures may add to the complexity of the tax system, leading to increased administrative effort by both taxpayers and governments. |
| • | Third, tax expenditures may create distortions in consumer and other economic behaviour. For example, the exemption for restaurant meals and snack foods provides preferential treatment for this category of consumer expenditure. |
| • | Finally, tax expenditures may create increased compliance costs for both businesses and consumers. |
GOVERNMENT OF CANADA TAX EXPENDITURES
The federal government produces a detailed presentation on tax expenditures that are part of the federal tax system. Since Saskatchewan’s personal and corporate income taxes are based upon the federal definition of taxable income, many of the federal tax expenditures have an impact on Saskatchewan’s revenue. Readers interested in examining the federal government’s presentation of tax expenditures are invited to contact the Finance Canada Distribution Centre in Ottawa or visit the website www.fin.gc.ca (click on “Publications & Reports”).
2012 SASKATCHEWAN TAX EXPENDITURES
The 2012 Saskatchewan tax expenditures include a number of new initiatives introduced since November 2011, which are described in greater detail in separate papers in the Budget Summary document. The tax expenditures report for 2012 incorporates:
| • | the extension of the Provincial Sales Tax exemption for children’s clothing and footwear to include purchases for all children aged 17 and under; |
| • | new non-refundable tax credits for the Research and Development Tax Credit and the Graduate Retention Program Tax Credit (the associated refundable tax credits will continue to be reflected as program expenditures in the Estimates); |
| • | a new personal income tax credit for first-time homebuyers; and, |
| • | indexation of Saskatchewan’s personal income tax system for 2012, to reflect inflation, at a rate of 2.8 per cent. |
The following tables provide estimates of the major tax expenditures of the Government of Saskatchewan in 2012, calculated using tax collection and Statistics Canada data.
50 Budget 2012-13 | Budget Summary
2012 Government of Saskatchewan
Tax Expenditure Accounts
(Value of Tax Expenditures in Millions of Dollars)
| Exemptions | |
| 1. | | Children’s clothing and footwear | | | 10.3 | |
| 2. | | Prescription drugs | | | 33.2 | |
| 3. | | Electricity | | | 41.0 | |
| 4. | | Farm machinery and repair parts | | | 80.3 | |
| 5. | | Fertilizer, pesticide and seed | | | 122.7 | |
| 6. | | Food | | | | |
| | | – Restaurant meals and snack foods | | | 60.4 | |
| | | – Basic groceries | | | 116.0 | |
| 7. | | Natural gas | | | 24.0 | |
| 8. | | Reading materials | | | 9.4 | |
| 9. | | Services | | | | |
| | | – Construction | | | 415.6 | |
| | | – Other | | | 32.0 | |
| 10. | | Used goods – exemption amounts | | | 1.2 | |
| 11. | | Light used vehicles | | | 48.9 | |
| 12. | | Direct agents | | | 18.6 | |
| 13. | | Eligible energy efficient appliances, furnaces and boilers | | | 2.9 | |
| 14. | | Toll-free telephone services | | | 0.3 | |
| 15. | | Municipal fire trucks | | | 0.1 | |
| 16. | | Mineral exploration equipment | | | 0.1 | |
| | | | | | | |
| Fuel Tax | |
1. | | Exemption for farm activity | | | 121.6 | |
| 2. | | Exemption for heating fuels | | | 25.3 | |
| 3. | | Exemption for primary producers | | | 1.4 | |
| | | | | | | |
| Personal Income Tax | |
Deductions from Income | |
| 1. | | Registered Pension Plan contributions | | | 81.6 | |
| 2. | | Registered Retirement Savings Plan contributions | | | 154.0 | |
| 3. | | Annual union, professional or like dues | | | 15.9 | |
| 4. | | Child care expenses | | | 9.6 | |
| 5. | | Moving expenses | | | 2.3 | |
| 6. | | Carrying charges | | | 14.0 | |
| 7. | | Allowable employment expenses | | | 15.1 | |
| 8. | | $750,000 capital gains deduction | | | 49.0 | |
Budget Summary | Budget 2012-13 51
| Saskatchewan Non-Refundable Tax Credits | |
| 1. | | Basic personal tax credit | | | 904.4 | |
| 2. | | Spousal tax credit | | | 40.1 | |
| 3. | | Equivalent-to-spouse tax credit | | | 18.1 | |
| 4. | | Age tax credit | | | 32.6 | |
| 5. | | Supplement to the age tax credit | | | 12.0 | |
| 6. | | Dependent child tax credit | | | 71.7 | |
| 7. | | Canada Pension Plan contributions tax credit | | | 70.5 | |
| 8. | | Employment Insurance premiums tax credit | | | 22.6 | |
| 9. | | Pension income tax credit | | | 10.1 | |
| 10. | | Tuition and education tax credit | | | 26.9 | |
| 11. | | Student loan interest tax credit | | | 1.1 | |
| 12. | | Disability tax credit | | | 12.1 | |
| 13. | | Caregiver tax credit | | | 2.1 | |
| 14. | | Medical expenses tax credit | | | 23.3 | |
| 15. | | Charitable contributions tax credit | | | 40.7 | |
| 16. | | First-time homebuyers’ tax credit | | | 6.6 | |
| | | | | | | |
| Other Saskatchewan Tax Measures | |
| 1. | | Saskatchewan Low-Income Tax Credit | | | 80.0 | |
| 2. | | Labour-sponsored Venture Capital Tax Credit | | | 17.0 | |
| 3. | | Mineral Exploration Tax Credit | | | 0.5 | |
| 4. | | Employees’ Tool Tax Credit | | | 1.0 | |
| 5. | | Political Contributions Tax Credit | | | 0.7 | |
| 6. | | Graduate Retention Program Tax Credit | | | 34.7 | |
| | | | | | | |
| Corporation Income Tax | |
1. | | Lower tax rate for small business | | | 351.2 | |
| 2. | | Royalty Tax Rebate | | | 1.0 | |
| 3. | | Manufacturing and Processing Profits Tax Reduction | | | 10.0 | |
| 4. | | Investment Tax Credit for Manufacturing and Processing | | | 60.0 | |
| 5. | | Research and Development Tax Credit | | | 5.0 | |
52 Budget 2012-13 | Budget Summary
2012 INTERCITY COMPARISON OF TAXES,
UTILITIES AND HOUSING
A number of factors contribute to the quality of life enjoyed by individuals and families in Saskatchewan and across Canada. For example, access to excellent health care, education and social services is a key part of the overall quality of life.
Other important factors that affect quality of life are:
| • | cost of utilities and auto insurance; and, |
| • | household costs for rent and mortgages. |
Calculating the combined cost of provincial taxes, utilities and housing is a reliable way to compare the attractiveness of living in different parts of Canada.
For the purposes of such a comparison, the total cost of such taxes, utilities and housing for representative families living in Saskatoon, Saskatchewan’s largest city, has been compared with the costs those families would face in other major cities across the country.
The provincial taxes, utilities and housing costs associated with the following family characteristics and income levels have been calculated to provide a representative comparison:
| • | a single person, living in rental accommodation, with an annual income of $25,000; |
| • | a family of two adults and two dependent children, owning its own home, with an annual family income of $50,000; and, |
| • | a family of two adults and two dependent children, owning its own home, with an annual family income of $75,000. |
The income of the two families is assumed to be earned by both spouses, with one earning 60 per cent and the other earning 40 per cent of total family income.
The 2011-12 Budget announced, for the 2011 taxation year, a $1,000 increase to the basic and spousal exemption amounts and a $500 per child increase to the exemption for dependent children. This personal income tax reduction supplemented the Government’s 2008 income tax reduction, which increased the basic and spousal exemption amounts by $4,000 each and increased the dependent child amount by $2,000 per child, and the indexation of the personal income tax system to the national rate of inflation from 2007 to 2012.
As a result, in 2012, Saskatchewan individuals and families pay total provincial taxes that are very competitive with those paid in other Canadian cities.
| • | A single person earning $25,000 will pay $1,103 in total provincial taxes, the second-lowest tax level; |
| • | A two-income family earning $50,000 will pay $744 in total provincial taxes, the second-lowest tax level; and, |
| • | A two-income family earning $75,000 will pay $3,965 in total provincial taxes, the second-lowest tax level. |
Saskatoon also ranks favourably with other cities in Canada when comparing provincial taxes and utilities. For all three representative family situations, Saskatoon ranks as having the lowest overall combined taxes and utilities of the 10 cities surveyed.
When the combined taxes, utilities and housing costs of the representative families are considered, Saskatoon compares very favourably with other Canadian cities.
Budget Summary | Budget 2012-13 53
2012 Intercity Comparison of Taxes, Utilities and Housing
Single Person at $25,000 Total Income
| | | Vancouver | | | Calgary | | | Saskatoon | | | Winnipeg | | | Toronto | | | Montréal | | | Saint John | | | Halifax | | | Charlotte- town | | | St. John’s | |
| Provincial Taxes and Health Premiums | |
| Provincial | | | | | | | | | | | | | | | | | | | | | | | | | | | | | | |
| Income Tax | | | 437 | | | | 620 | | | | 939 | | | | 1,603 | | | | 711 | | | | 1,583 | | | | 1,018 | | | | 1,318 | | | | 1,545 | | | | 1,174 | |
| Tax Credits and | | | | | | | | | | | | | | | | | | | | | | | | | | | | | | | | | | | | | | | | |
| Rebates | | | (145 | ) | | | 0 | | | | (229 | ) | | | (700 | ) | | | (476 | ) | | | (597 | ) | | | 0 | | | | (245 | ) | | | 0 | | | | 0 | |
| Health Premiums | | | 307 | | | | 0 | | | | 0 | | | | 0 | | | | 300 | | | | 0 | | | | 0 | | | | 0 | | | | 0 | | | | 0 | |
| Retail Sales Tax | | | 623 | | | | 0 | | | | 243 | | | | 426 | | | | 740 | | | | 878 | | | | 740 | | | | 925 | | | | 598 | | | | 783 | |
| Gasoline Tax | | | 311 | | | | 90 | | | | 150 | | | | 115 | | | | 147 | | | | 167 | | | | 107 | | | | 155 | | | | 158 | | | | 165 | |
| Total Provincial | | | | | | | | | | | | | | | | | | | | | | | | | | | | | | | | | | | | | | | | |
| Taxes and Health | |
| Premiums | | | 1,533 | | | | 710 | | | | 1,103 | | | | 1,444 | | | | 1,422 | | | | 2,031 | | | | 1,865 | | | | 2,153 | | | | 2,301 | | | | 2,122 | |
| Household Utility Costs | |
| Electricity | | | 344 | | | | 755 | | | | 718 | | | | 383 | | | | 742 | | | | 396 | | | | 597 | | | | 705 | | | | 865 | | | | 647 | |
| Telephone | | | 312 | | | | 291 | | | | 258 | | | | 295 | | | | 271 | | | | 271 | | | | 268 | | | | 304 | | | | 298 | | | | 266 | |
| Auto Insurance | | | 1,439 | | | | 1,957 | | | | 991 | | | | 985 | | | | 4,787 | | | | 1,514 | | | | 1,579 | | | | 1,911 | | | | 1,589 | | | | 2,491 | |
| Total Household | | | | | | | | | | | | | | | | | | | | | | | | | | | | | | | | | | | | | | | | |
| Utility Costs | | | 2,095 | | | | 3,003 | | | | 1,967 | | | | 1,663 | | | | 5,800 | | | | 2,181 | | | | 2,444 | | | | 2,920 | | | | 2,752 | | | | 3,404 | |
| Total Taxes | | | | | | | | | | | | | | | | | | | | | | | | | | | | | | | | | | | | | | | | |
| and Utilities | | | 3,628 | | | | 3,713 | | | | 3,070 | | | | 3,107 | | | | 7,222 | | | | 4,212 | | | | 4,309 | | | | 5,073 | | | | 5,053 | | | | 5,526 | |
| Housing Costs | | | | | | | | | | | | | | | | | | | | | | | | | | | | | | | | | | | | | | | | |
| Rent | | | 11,568 | | | | 10,788 | | | | 9,444 | | | | 8,136 | | | | 11,724 | | | | 7,692 | | | | 6,864 | | | | 9,036 | | | | 7,224 | | | | 7,992 | |
| Total of Taxes, | | | | | | | | | | | | | | | | | | | | | | | | | | | | | | | | | | | | | | | | |
| Utilities and | | | | | | | | | | | | | | | | | | | | | | | | | | | | | | | | | | | | | | | | |
| Housing | | | 15,196 | | | | 14,501 | | | | 12,514 | | | | 11,243 | | | | 18,946 | | | | 11,904 | | | | 11,173 | | | | 14,109 | | | | 12,277 | | | | 13,518 | |
54 Budget 2012-13 | Budget Summary
2012 Intercity Comparison of Taxes, Utilities and Housing
Family at $50,000 Total Income
| | | Vancouver | | | Calgary | | | Saskatoon | | | Winnipeg | | | Toronto | | | Montréal | | | Saint John | | | Halifax | | | Charlotte- town | | | St. John’s | |
| Provincial Taxes and Health Premiums | |
| Provincial | | | | | | | | | | | | | | | | | | | | | | | | | | | | | | |
| Income Tax | | | 833 | | | | 1,058 | | | | 301 | | | | 2,302 | | | | 214 | | | | 2,251 | | | | 2,121 | | | | 2,398 | | | | 2,797 | | | | 2,116 | |
| Tax Credits and | | | | | | | | | | | | | | | | | | | | | | | | | | | | | | | | | | | | | | | | |
| Rebates | | | (123 | ) | | | (832 | ) | | | (308 | ) | | | (700 | ) | | | (362 | ) | | | 0 | | | | 0 | | | | 0 | | | | 0 | | | | 0 | |
| Active Families | | | | | | | | | | | | | | | | | | | | | | | | | | | | | | | | | | | | | | | | |
| Benefit | | | 0 | | | | 0 | | | | (300 | ) | | | (109 | ) | | | (102 | ) | | | 0 | | | | 0 | | | | (88 | ) | | | 0 | | | | 0 | |
| Health Premiums | | | 1,536 | | | | 0 | | | | 0 | | | | 0 | | | | 300 | | | | 0 | | | | 0 | | | | 0 | | | | 0 | | | | 0 | |
| Retail Sales Tax | | | 1,828 | | | | 0 | | | | 751 | | | | 1,318 | | | | 2,179 | | | | 2,624 | | | | 2,179 | | | | 2,724 | | | | 1,853 | | | | 2,322 | |
| Gasoline Tax | | | 622 | | | | 180 | | | | 300 | | | | 230 | | | | 294 | | | | 334 | | | | 214 | | | | 310 | | | | 316 | | | | 330 | |
| Total Provincial | | | | | | | | | | | | | | | | | | | | | | | | | | | | | | | | | | | | | | | | |
| Taxes and Health | | | | | | | | | | | | | | | | | | | | | | | | | | | | | | | | | | | | | | | | |
| Premiums | | | 4,696 | | | | 406 | | | | 744 | | | | 3,041 | | | | 2,523 | | | | 5,209 | | | | 4,514 | | | | 5,344 | | | | 4,966 | | | | 4,768 | |
| Household Utility Costs | | | | | | | | | | | | | | | | | | | | | | | | | | | | | | | | | | | | | | | | |
| Home Heating | | | 1,092 | | | | 851 | | | | 881 | | | | 985 | | | | 933 | | | | 1,563 | | | | 1,964 | | | | 1,650 | | | | 2,672 | | | | 2,643 | |
| Electricity | | | 569 | | | | 1,173 | | | | 1,091 | | | | 614 | | | | 1,132 | | | | 586 | | | | 915 | | | | 1,146 | | | | 1,302 | | | | 998 | |
| Telephone | | | 312 | | | | 291 | | | | 258 | | | | 295 | | | | 271 | | | | 271 | | | | 268 | | | | 304 | | | | 298 | | | | 266 | |
| Auto Insurance | | | 1,439 | | | | 1,957 | | | | 991 | | | | 985 | | | | 4,787 | | | | 1,514 | | | | 1,579 | | | | 1,911 | | | | 1,589 | | | | 2,491 | |
| Total Household | | | | | | | | | | | | | | | | | | | | | | | | | | | | | | | | | | | | | | | | |
| Utility Costs | | | 3,412 | | | | 4,272 | | | | 3,221 | | | | 2,879 | | | | 7,123 | | | | 3,934 | | | | 4,726 | | | | 5,011 | | | | 5,861 | | | | 6,398 | |
| Total Taxes | | | | | | | | | | | | | | | | | | | | | | | | | | | | | | | | | | | | | | | | |
| and Utilities | | | 8,108 | | | | 4,678 | | | | 3,965 | | | | 5,920 | | | | 9,646 | | | | 9,143 | | | | 9,240 | | | | 10,355 | | | | 10,827 | | | | 11,166 | |
| Housing Costs | | | | | | | | | | | | | | | | | | | | | | | | | | | | | | | | | | | | | | | | |
| Mortgage Costs | | | 25,131 | | | | 12,238 | | | | 10,035 | | | | 8,283 | | | | 15,536 | | | | 8,238 | | | | 5,550 | | | | 8,058 | | | | 4,973 | | | | 7,202 | |
| Net Property Taxes | | | 2,721 | | | | 2,114 | | | | 2,614 | | | | 2,728 | | | | 2,999 | | | | 3,083 | | | | 2,701 | | | | 2,332 | | | | 2,600 | | | | 1,422 | |
| Total Housing | | | | | | | | | | | | | | | | | | | | | | | | | | | | | | | | | | | | | | | | |
| Costs | | | 27,852 | | | | 14,352 | | | | 12,649 | | | | 11,011 | | | | 18,535 | | | | 11,321 | | | | 8,251 | | | | 10,390 | | | | 7,573 | | | | 8,624 | |
| Total of Taxes, | | | | | | | | | | | | | | | | | | | | | | | | | | | | | | | | | | | | | | | | |
| Utilities and | | | | | | | | | | | | | | | | | | | | | | | | | | | | | | | | | | | | | | | | |
| Housing | | | 35,960 | | | | 19,030 | | | | 16,614 | | | | 16,931 | | | | 28,181 | | | | 20,464 | | | | 17,491 | | | | 20,745 | | | | 18,400 | | | | 19,790 | |
Budget Summary | Budget 2012-13 55
2012 Intercity Comparison of Taxes, Utilities and Housing
Family at $75,000 Total Income
| | | Vancouver | | | Calgary | | | Saskatoon | | | Winnipeg | | | Toronto | | | Montréal | | | Saint John | | | Halifax | | | Charlotte- town | | | St. John’s | |
| Provincial Taxes and Health Premiums | |
| Provincial | | | | | | | | | | | | | | | | | | | | | | | | | | | | | | |
| Income Tax | | | 2,353 | | | | 3,270 | | | | 2,923 | | | | 5,297 | | | | 2,551 | | | | 6,596 | | | | 4,650 | | | | 5,371 | | | | 5,601 | | | | 4,492 | |
| Tax Credits and | | | | | | | | | | | | | | | | | | | | | | | | | | | | | | | | | | | | | | | | |
| Rebates | | | 0 | | | | 0 | | | | 0 | | | | (700 | ) | | | 0 | | | | 0 | | | | 0 | | | | 0 | | | | 0 | | | | 0 | |
| Active Families | | | | | | | | | | | | | | | | | | | | | | | | | | | | | | | | | | | | | | | | |
| Benefit | | | 0 | | | | 0 | | | | (300 | ) | | | (109 | ) | | | (102 | ) | | | 0 | | | | 0 | | | | (88 | ) | | | 0 | | | | 0 | |
| Health Premiums | | | 1,536 | | | | 0 | | | | 0 | | | | 0 | | | | 750 | | | | 0 | | | | 0 | | | | 0 | | | | 0 | | | | 0 | |
| Retail Sales Tax | | | 2,479 | | | | 0 | | | | 1,042 | | | | 1,802 | | | | 2,955 | | | | 3,526 | | | | 2,955 | | | | 3,693 | | | | 2,528 | | | | 3,135 | |
| Gasoline Tax | | | 622 | | | | 180 | | | | 300 | | | | 230 | | | | 294 | | | | 334 | | | | 214 | | | | 310 | | | | 316 | | | | 330 | |
| Total Provincial | | | | | | | | | | | | | | | | | | | | | | | | | | | | | | | | | | | | | | | | |
| Taxes and Health | |
| Premiums | | | 6,990 | | | | 3,450 | | | | 3,965 | | | | 6,520 | | | | 6,448 | | | | 10,456 | | | | 7,819 | | | | 9,286 | | | | 8,445 | | | | 7,957 | |
| Household Utility Costs | |
| Home Heating | | | 1,092 | | | | 851 | | | | 881 | | | | 985 | | | | 933 | | | | 1,563 | | | | 1,964 | | | | 1,650 | | | | 2,672 | | | | 2,643 | |
| Electricity | | | 569 | | | | 1,173 | | | | 1,091 | | | | 614 | | | | 1,132 | | | | 586 | | | | 915 | | | | 1,146 | | | | 1,302 | | | | 998 | |
| Telephone | | | 312 | | | | 291 | | | | 258 | | | | 295 | | | | 271 | | | | 271 | | | | 268 | | | | 304 | | | | 298 | | | | 266 | |
| Auto Insurance | | | 1,439 | | | | 1,957 | | | | 991 | | | | 985 | | | | 4,787 | | | | 1,514 | | | | 1,579 | | | | 1,911 | | | | 1,589 | | | | 2,491 | |
| Total Household | | | | | | | | | | | | | | | | | | | | | | | | | | | | | | | | | | | | | | | | |
| Utility Costs | | | 3,412 | | | | 4,272 | | | | 3,221 | | | | 2,879 | | | | 7,123 | | | | 3,934 | | | | 4,726 | | | | 5,011 | | | | 5,861 | | | | 6,398 | |
| Total Taxes | | | | | | | | | | | | | | | | | | | | | | | | | | | | | | | | | | | | | | | | |
| and Utilities | | | 10,402 | | | | 7,722 | | | | 7,186 | | | | 9,399 | | | | 13,571 | | | | 14,390 | | | | 12,545 | | | | 14,297 | | | | 14,306 | | | | 14,355 | |
| Housing Costs | | | | | | | | | | | | | | | | | | | | | | | | | | | | | | | | | | | | | | | | |
| Mortgage Costs | | | 25,131 | | | | 12,238 | | | | 10,035 | | | | 8,283 | | | | 15,536 | | | | 8,238 | | | | 5,550 | | | | 8,058 | | | | 4,973 | | | | 7,202 | |
| Net Property Taxes | | | 2,721 | | | | 2,114 | | | | 2,614 | | | | 2,728 | | | | 2,999 | | | | 3,083 | | | | 2,701 | | | | 2,332 | | | | 2,600 | | | | 1,422 | |
| Total Housing | | | | | | | | | | | | | | | | | | | | | | | | | | | | | | | | | | | | | | | | |
| Costs | | | 27,852 | | | | 14,352 | | | | 12,649 | | | | 11,011 | | | | 18,535 | | | | 11,321 | | | | 8,251 | | | | 10,390 | | | | 7,573 | | | | 8,624 | |
| Total of Taxes, | | | | | | | | | | | | | | | | | | | | | | | | | | | | | | | | | | | | | | | | |
| Utilities and | | | | | | | | | | | | | | | | | | | | | | | | | | | | | | | | | | | | | | | | |
| Housing | | | 38,254 | | | | 22,074 | | | | 19,835 | | | | 20,410 | | | | 32,106 | | | | 25,711 | | | | 20,796 | | | | 24,687 | | | | 21,879 | | | | 22,979 | |
56 Budget 2012-13 | Budget Summary
TAXES, UTILITIES AND HOUSING – NOTES
Tax estimates are calculated for the 2012 calendar year using known changes as of March 5, 2012. Household charges for the basic utility services (home heating, electricity, telephone and auto insurance) represent a cost comparison of the actual ‘known’ utility rates for the 2011 calendar year. This methodology has been chosen due to the uncertainty of attempting to forecast utility rates for the coming year. The utility figures exclude federal GST, provincial sales tax and municipal taxes and surcharges.
Provincial Income Tax is calculated for an individual with $25,000 income and two families with $50,000 and $75,000 income respectively. It is assumed that family income is earned by both spouses at a 60 per cent to 40 per cent ratio and that the families each claim $3,000 in child care expenses for two dependent children (ages 6 and 12). Personal non-refundable credits used include the CPP/QPP and EI contribution credits. Gross Québec Personal Income Tax has been reduced by the Québec Child Care Expense Tax Credit and by the 16.5 per cent abatement from federal income tax.
Tax Credits and Rebates refer to refundable provincial income tax credits and rebates designed to reduce the impact of retail sales tax, rental payments and property taxes (those property tax rebate plans administered through provincial income tax systems).
Active Families Benefit refers to the Saskatchewan refundable income tax credit that rebates up to $150 per child annually for cultural, recreational and sports activities fees for children under age 18. Ontario also has a refundable income tax credit that rebates up to $51 per child annually for cultural, recreational and sports activities fees for children less than 16 years of age. Manitoba and Nova Scotia provide non-refundable children’s fitness tax credits.
Health Premiums are annual premiums for hospital insurance and medical services. British Columbia increased health premiums effective January 1, 2012.
Retail Sales Tax is based upon average family expenditure baskets at the total income levels from the Survey of Family Expenditures in 2009 (Statistics Canada). The sales tax base in each province was identified from the enacting legislation, with total expenditures adjusted to reflect Saskatchewan consumption patterns. Provincial retail sales taxes were then estimated based on taxable expenditures in each province. The sales tax rate in Québec was increased from 8.5 to 9.5 per cent effective January 1, 2012.
Gasoline Tax is based on annual consumption of 1,000 litres by a single person, and 2,000 litres for each of the families. Figures include charges levied by transit commissions as well as carbon taxes applied to the purchase of gasoline.
Home Heating charges are based on an annual consumption level of 2,800 m3 of natural gas. For Charlottetown and St. John’s, the figures represent the BTU equivalent consumption of fuel oil.
Electricity charges are based on an annual consumption level of 4,584 kWh for the renter and 8,100 kWh for the homeowners.
Telephone charges are the basic service rates for individual residences.
Auto Insurance is based on a composite index developed by SGI modelled after the index developed by the Consumers’ Association of Canada. The index is based on the actual insurance rates quoted for what the driver would pay in each jurisdiction if they had the same car, same coverage, same claims history and driving record at a consistent point in time. The Consumers’ Association of Canada developed 34 profiles to create this index. The impact of “Good Driver” discounts/rebates has been factored in for all applicable jurisdictions.
Budget Summary | Budget 2012-13 57
Rent is based on average one-bedroom apartment rents for each metropolitan area, from the Canada Mortgage and Housing Corporation’s Rental Market Report, October 2011.
Mortgage Costs are based on average home prices for a detached bungalow, from the Royal LePage Third Quarter 2011 Survey of Canadian House Prices, with one-half of the home price being financed over 25 years at a one-year closed mortgage rate of 3.5 per cent.
Net Property Taxes for all cities are based on the estimated taxes for a sample detached bungalow from the City of Edmonton 2010 Residential Property Taxes and Utility Charges Survey, with the exception of Charlottetown whose property tax estimate is based on the average of detached bungalows in that city as determined from the Royal LePage Third Quarter 2011 Survey of Canadian House Prices. All provincial, municipal, education and library property taxes are included in the property tax figures. Property tax credit programs administered by municipalities on property tax notices have been deducted from the property tax figures to arrive at the net property tax amounts.
58 Budget 2012-13 | Budget Summary
2012-13 BORROWING AND DEBT
The General Revenue Fund (GRF) borrows for government and Crown corporations.
Public debt as reported in the Province’s financial statements is comprised of:
| • | Gross debt – the amount of money owed to lenders; less |
| • | Sinking funds – the amount of money which has been set aside for the repayment of debt. |
Public debt is discussed in this budget paper.
Crown corporations are responsible for the principal and interest payments on their debt. Crown corporation debt is incurred in the normal course of business, primarily for investment in infrastructure and business development initiatives which provide revenue streams to service the debt.
Crown corporation debt is divided into two components: Crown corporation general debt and government business enterprise specific debt. This has been done to provide consistency with the way these amounts are segregated in the Public Accounts.
Government business enterprises are self-sufficient government organizations that have the financial and operating authority to sell goods and services to individuals and organizations outside government as their principal activity. Amounts borrowed specifically for these enterprises are disclosed separately from other government debt because they are expected to be repaid from cash flows generated by these business enterprises.
All other Crown corporation debt is classified as Crown corporation general debt. This debt includes amounts that can be repaid from business activities of the Crown sector and amounts that can only be repaid with assistance from government.
Public debt is forecast to increase by $119.7 million during 2011-12 and increase by an additional $1,019.2 million in 2012-13.
Government general public debt is forecast to decline by $325.0 million in 2011-12 and remain unchanged in 2012-13.
Crown corporation general public debt is forecast to decline by $39.7 million during 2011-12 and increase by $154.6 million during 2012-13. The changes in both years are primarily due to fluctuations in short-term debt for the utility Crown corporations.
Government business enterprise specific public debt is forecast to increase by $484.4 million during 2011-12 and increase by an additional $864.6 million during 2012-13. The increases in both years are largely attributable to higher long-term debt for the utility Crown corporations.
Budget Summary | Budget 2012-13 59
DEBT OF THE GENERAL REVENUE FUND
As at March 31
| | | Estimated | | | Forecast | | | Actual | |
| (Millions of Dollars) | | 2013 | | | 2012 | | | 2011 | |
| Government General | | | | | | | | | |
| Gross Debt | | | 5,007.7 | | | | 5,910.9 | | | | 6,111.7 | |
| Sinking Funds | | | 1,197.5 | | | | 2,100.7 | | | | 1,976.5 | |
| Government General Public Debt | | | 3,810.2 | | | | 3,810.2 | | | | 4,135.2 | |
| Crown Corporation General | | | | | | | | | | | | |
| Gross Debt | | | 772.1 | | | | 612.1 | | | | 643.4 | |
| Sinking Funds | | | 48.1 | | | | 42.7 | | | | 34.3 | |
Crown Corporation General Public Debt | | | 724.0 | | | | 569.4 | | | | 609.1 | |
Government Business Enterprise Specific | | | | | | | | | | | | |
| Gross Debt | | | 5,269.7 | | | | 4,355.3 | | | | 3,794.8 | |
| Sinking Funds | | | 546.9 | | | | 497.1 | | | | 421.0 | |
| Government Business Enterprise Specific | | | | | | | | | | | | |
| Public Debt | | | 4,722.8 | | | | 3,858.2 | | | | 3,373.8 | |
| Public Debt | | | 9,257.0 | | | | 8,237.8 | | | | 8,118.1 | |
| Guaranteed Debt | | | 152.1 | | | | 92.6 | | | | 35.4 | |
PUBLIC DEBT OF THE GENERAL REVENUE FUND
As at March 31
60 Budget 2012-13 | Budget Summary
GRF PUBLIC DEBT AS A % OF GDP
As at March 31
GENERAL REVENUE FUND BORROWING
The Province’s 2012-13 borrowing requirements are estimated to be $1,328.4 million, compared to forecast requirements of $661.0 million in 2011-12.
Borrowing requirements for government in 2012-13, estimated to be $204.0 million (2011-12 forecast: $76.3 million), are for the purpose of refinancing maturing debt.
Borrowing requirements for Crown corporations in 2012-13, estimated to be $1,124.4 million (2011-12 forecast: $584.7 million), are primarily to assist with financing capital expenditures.
Budget Summary | Budget 2012-13 61
Reconciliation of Surplus and Change in Government General Public Debt The amount by which government general public debt will change may be higher or lower than the surplus reported under the accrual basis of accounting. The difference between the surplus and the amount by which government general public debt will change is reconciled by: |
| 1. | Adjusting the surplus to a cash basis to recognize the amount and timing of non-cash revenues and expenditures to determine the cash provided from operations; |
| 2. | Adjusting for cash required for capital acquisitions; |
| 3. | Adding other cash sources or subtracting other cash requirements to recognize the amount of cash inflows and outflows from loan, investment and other activities to determine the cash available to reduce debt; and, |
| 4. | Adding changes in sinking funds which will be used to repay government general public debt. |
| | | | | | Estimated 2012-13 | | | | | | | Forecast 2011-12 | |
| | | | | ($ Millions) | |
| Surplus (on Accrual Accounting Basis) | | | | 47.5 | | | | | | | 352.9 | |
| | | 1. | | Adjustment to Cash Basis | | | | 263.1 | | | | | | | (246.2 | ) |
| Cash Provided by Operations | | | | | | 310.6 | | | | | | | 106.7 | |
| | | 2. | | Capital Acquisitions | | | | (522.4 | ) | | | | | | (426.0 | ) |
| | | 3. | | Other Cash Sources | | | | | | | | | | | | | | |
| | | | | • Sinking Fund Proceeds | | | 1,045.8 | | | | | | | | 97.0 | | | | | |
| | | | | • CIC Equity Repayment | | | 150.0 | | | | | | | | 0.0 | | | | | |
| | | | | • Change in Cash Balance | | | (44.6 | ) | | | | | | | 451.2 | | | | | |
| | | | | • Other | | | (36.2 | ) | | | 1,115.0 | | | | (28.2 | ) | | | 520.0 | |
| Cash Available to Reduce Debt | | | | | | | 903.2 | | | | | | | | 200.7 | |
| | | 4. | | Change in Sinking Funds | | | | | | | (903.2 | ) | | | | | | | 124.3 | |
| Decrease in Government General Public Debt | | | | 0.0 | | | | | | | | 325.0 | |
| | | | | | | | | | | | | | |
62 Budget 2012-13 | Budget Summary
COST OF SERVICING DEBT
In addition to interest payments, debt servicing costs include all charges related to the gross debt, such as the amortization of premiums, discounts, and commissions, and gains or losses on foreign currency debt that result from a change in the value of the Canadian dollar.
The 2012-13 debt servicing cost estimates are based on 1.5 per cent short-term and 4.5 per cent long-term interest rates. A one percentage point increase in interest rates for a full year from levels assumed in the budget would increase the estimated cost of servicing government debt in 2012-13 by approximately $8.8 million.
COST OF SERVICING DEBT
| | | Estimated | | | Forecast | |
| (Millions of Dollars) | | | 2012-13 | | | | 2011-12 | |
| Government General Debt | | | 375.5 | | | | 387.3 | |
| Crown Corporation General Debt | | | 24.5 | | | | 22.7 | |
| Government Business Enterprise Specific Debt | | | 259.1 | | | | 233.8 | |
| Total Cost of Servicing Gross Debt | | | 659.1 | | | | 643.8 | |
SUMMARY STATEMENT OF DEBT
GRF debt includes all debt borrowed by the GRF for either government purposes or the purposes of certain Crown corporations. Some Crown corporations and other organizations have additional obligations to other entities. The GRF is not responsible for this other debt.
The Summary Schedule of Debt on page 86 calculates the combined public debt of government entities by listing both the GRF debt and the debt to other entities.
SUMMARY STATEMENT OF DEBT
As at March 31
| | | Estimated | | | Forecast | | | Actual | |
| (Millions of Dollars) | | 2013 | | | 2012 | | | 2011 | |
| GRF Public Debt for Government | | | 3,810.2 | | | | 3,810.2 | | | | 4,135.2 | |
| GRF Public Debt for Crown Corporations | | | 5,446.8 | | | | 4,427.6 | | | | 3,982.9 | |
| GRF Public Debt | | | 9,257.0 | | | | 8,237.8 | | | | 8,118.1 | |
| Other Debt | | | 389.1 | | | | 246.8 | | | | 229.5 | |
| Summary Statement of Debt | | | 9,646.1 | | | | 8,484.6 | | | | 8,347.6 | |
| Summary Statement of Guaranteed Debt | | | 41.2 | | | | 29.7 | | | | 29.1 | |
Budget Summary | Budget 2012-13 63
GROWTH AND FINANCIAL SECURITY FUND
The Growth and Financial Security Fund (GFSF) was established with the assent of The Growth and Financial Security Act. The purpose of the GFSF is twofold:
| • | to assist in the achievement of the Government of Saskatchewan’s long-term objectives by providing for the financial security of the Government of Saskatchewan from year to year; and, |
| • | to provide a source of funds that are to be available for appropriation to be used for programs of the Government of Saskatchewan identified as promoting or enhancing the economic development of Saskatchewan. |
Subsequently, transfers to the GFSF represent either:
| • | 50 per cent of any pre-transfer surplus for any fiscal year (required); or, |
| • | subject to the approval of Treasury Board, the amount of significant, unexpected revenues received for the fiscal year, as determined by the minister (special transfer). |
Transfers out of the GFSF may be made by the minister, subject to the approval of Treasury Board, with the objective of achieving the aforementioned twofold purpose.
The GFSF balance at the end of 2012-13 is forecast to be $756.4 million.
GROWTH AND FINANCIAL SECURITY FUND FORECAST
| (Millions of Dollars) | | | 2011-12 | | | | 2012-13 | | | | 2013-14 | | | | 2014-15 | | | | 2015-16 | |
| Opening Balance* | | | 1,006.0 | | | | 708.9 | | | | 756.4 | | | | 822.0 | | | | 894.9 | |
| Plus: Transfers from the GRF | | | | | | | | | | | | | | | | | | | | |
(50% of GRF pre-transfer surplus) | | | 27.9 | | | | 47.5 | | | | 65.6 | | | | 72.9 | | | | 84.0 | |
| Less: Transfers to the GRF | | | | | | | | | | | | | | | | | | | | |
| (financial security/debt reduction) | | | (325.0 | ) | | | – | | | | – | | | | – | | | | – | |
Net Transfers (to) from the GRF | | | (297.1 | ) | | | 47.5 | | | | 65.6 | | | | 72.9 | | | | 84.0 | |
| Closing Balance | | | 708.9 | | | | 756.4 | | | | 822.0 | | | | 894.9 | | | | 978.9 | |
| * | 2011-12 opening balance reflects actual 2010-11 closing balance. |
64 Budget 2012-13 | Budget Summary
DEBT RETIREMENT FUND
The Debt Retirement Fund (DRF) was established with the assent of The Growth and Financial Security Act. The DRF is an accounting of the surpluses of the General Revenue Fund (GRF) that are allocated to the fund on or after April 1, 2008. The purpose of the DRF is to assist in achieving the long-term objective of the Government of Saskatchewan in eliminating the debt.
Allocations to the DRF represent either:
| • | 50 per cent of any pre-transfer surplus for any fiscal year (required); or, |
| • | a transfer made out of the Growth and Financial Security Fund (GFSF) by the minister, subject to the approval of Treasury Board, for the purpose of assisting in the long-term objective of eliminating the debt. |
The DRF balance at the end of 2012-13 is forecast to be $3.3 billion.
DEBT RETIREMENT FUND FORECAST
| (Millions of Dollars) | | | 2011-12 | | | | 2012-13 | | | | 2013-14 | | | | 2014-15 | | | | 2015-16 | |
| Opening Balance* | | | 2,861.0 | | | | 3,213.9 | | | | 3,261.4 | | | | 3,327.0 | | | | 3,399.9 | |
| Plus: GRF Surplus | | | 352.9 | | | | 47.5 | | | | 65.6 | | | | 72.9 | | | | 84.0 | |
| Closing Balance | | | 3,213.9 | | | | 3,261.4 | | | | 3,327.0 | | | | 3,399.9 | | | | 3,483.9 | |
| * | 2011-12 opening balance reflects cumulative GRF surpluses over the 2008-09 to 2010-11 period. |
Budget Summary | Budget 2012-13 65
2012-13 HOUSING INITIATIVES
This paper describes new measures the Government is introducing in the 2012-13 Budget to improve access and affordability for housing in Saskatchewan. While this paper provides a detailed summary of the Budget initiatives, the reader is advised to consult with enacting legislation to confirm specific details.
BACKGROUND
Saskatchewan has undertaken an aggressive strategy to increase the housing supply in the province. Actions taken to date have included direct investment in affordable housing projects in partnership with the federal government, supporting long-term community planning and improving utility servicing processes.
As well, as part of the 2011-12 Budget, the Government introduced the Rental Construction Incentive to provide developers a provincial grant of up to $5,000 per new rental unit that is matched by a similar incentive from participating municipalities. This incentive has been very successful, with applications for new rental unit construction exceeding 6,200 units.
This uptake will significantly improve the availability of rental housing in the province. However, the impact of Saskatchewan’s increasing population, combined with the expected loss of rental units due to age and conversion to condominiums, will continue to put pressure on Saskatchewan’s vacancy rates into the future.
CORPORATION INCOME TAX REBATE ON NEW RENTAL HOUSING
The 2012-13 Budget continues with the Government’s response to the need for additional housing by announcing the introduction of a ten percentage point reduction in the general Corporation Income Tax rate levied on income earned from the rental of newly constructed qualifying multi-unit residential projects. This new incentive will be provided as a tax rebate that will significantly reduce the effective tax rate for corporations that invest in eligible rental projects. The tax rebate will be earned for a period of up to ten consecutive years once eligible projects become available for rent.
Eligible Corporations
All private and public corporations that have a permanent establishment in Saskatchewan and are solely engaged in the construction and rental of eligible new rental housing in Saskatchewan can qualify.
An eligible corporation will be permitted to contract with another party for the construction of the eligible new rental housing and/or the business of renting the eligible new rental housing. However, it must retain ownership of the eligible new rental housing and must be able to clearly identify income earned from the owning and renting of that housing in order to access the tax rebate.
66 Budget 2012-13 | Budget Summary
Eligible Rental Housing
Eligible rental housing will include newly constructed multi-unit rental housing projects, including:
| • | new construction, including modular construction; and, |
| conversion of non-residential space to residential space (e.g. warehouse space conversion). |
Eligible multi-unit rental housing projects must consist of at least eight fully self-contained rental units (meaning bathroom and kitchen facilities are available in each suite).
Multi-unit assisted living projects for seniors are also eligible provided that they meet the general conditions listed above and are not included in the list of housing that is specifically excluded. These units do not have to be fully self-contained due to the nature of the housing project.
Multi-unit rental housing projects can be located in either urban or rural communities across the province. Eligible rental projects can include a wide range of new multi-unit residential rental accommodations, including low rise apartments, high rise apartments, town/row house dwellings and other similar construction, as long as other prescribed conditions are met.
Newly constructed multi-unit residential rental projects that don’t specifically meet eligibility conditions will be considered on a case-by-case basis by the Saskatchewan Housing Corporation (SHC).
Eligible rental housing for the purposes of the tax rebate may also be eligible for the Rental Construction Incentive.
Specific Exclusions from Eligible Rental Housing
Residential construction that is specifically excluded from eligibility includes living accommodation:
| in a hotel, motel, motor hotel, resort, lodge or tourist camp, cottage, cabin, trailer, tourist home, bed and breakfast establishment or a farm vacation home, if a person resides there for less than six consecutive months; |
| provided for crisis or emergency shelters; |
| in a hospital, health centre, addiction treatment centre, special-care home, residential treatment centre or other facility that is designated pursuant to The Regional Health Services Act; |
| in a personal care home that is licensed pursuant to The Personal Care Homes Act; |
| in a facility or an approved home as defined in The Mental Health Services Act; or, |
| located on property that is being farmed if the living accommodation is being rented by the person engaged in farming that property. |
Projects/units eligible to receive direct funding under the SHC’s Rental Development Program are specifically excluded from being eligible rental housing.
Eligible Rental Income
Eligible rental income for the purposes of determining the tax rebate for each year of eligibility will pertain specifically to the rental of eligible rental housing and will be based on terms and conditions outlined under the Income Tax Act (Canada).
Budget Summary | Budget 2012-13 67
Income resulting from the disposition of eligible new rental housing, including recapture of depreciation and capital gains, is specifically excluded from being considered eligible rental income, as the intent of the tax rebate is to encourage construction and rental of multi-unit residential rental projects and not to provide a tax reduction where a benefit is derived from appreciating asset values.
Small business corporations will be permitted to apply for the tax rebate on eligible income which does not benefit from the lower small business income tax rate of two per cent applicable to the first $500,000 of active business income of Canadian-controlled private corporations.
Rebate Eligibility Period
The tax rebate is available for a ten consecutive year period based on the eligible corporation’s fiscal year-end, although the corporation may defer eligibility for the tax rebate until the initial year the new housing project is complete and ready for occupancy.
Property owners will be permitted to register titles during the development phase or at any time during the rebate period, enabling them to convert to condominium units at a later date. Conversion will result in the housing unit no longer being considered eligible rental housing for the purposes of the tax rebate.
Restrictions on Eligible Corporations
An eligible corporation can be either a private or public corporation resident in Canada. Investors must be resident in Canada and can be individuals, partnerships or corporations. An eligible corporation can be related to another entity; however, there must be clear separation of functions and the eligible corporation must be the sole owner of the eligible new rental housing in order to qualify.
While related entities can be involved either directly or indirectly with an eligible corporation, the Government will undertake necessary scrutiny to ensure that non-arm’s length transactions that might artificially benefit the eligible corporation or its owners are not permitted in determining the tax rebate.
Eligibility for the tax rebate depends on full ownership of eligible new rental housing by an eligible corporation. Disposition of part or all ownership in the eligible corporation by the originating shareholders will not specifically disqualify eligible new rental housing from rebate eligibility. However, where the eligible corporation disposes of the eligible new rental housing, rebate eligibility for that housing will not pass forward to the purchaser.
Initial Application/Qualification Process
Rental housing, registered under a building permit dated on or after March 21, 2012 and before January 1, 2014, can be eligible for the tax rebate, assuming all other terms and conditions are met. A maximum of 10,000 rental units will qualify for the tax rebate. Eligible units must be constructed and available for rent before the end of 2016.
Applications for registering eligible new rental housing projects are available by contacting SHC. Completed applications for registering new units should be submitted to SHC for consideration.
68 Budget 2012-13 | Budget Summary
Rebate Administration
An eligible corporation will file its income tax return with the Canada Revenue Agency and receive an assessment for a taxation year in the normal manner. The eligible corporation will then file a copy of the assessment, together with its application for the tax rebate, with the Saskatchewan Ministry of Finance. This process will be required for each of the ten years in the rebate period.
Further Information:
For further information on this new initiative, please contact SHC at 1-800-667-7567.
SASKATCHEWAN FIRST-TIME HOMEBUYERS’ TAX CREDIT
The 2012-13 Budget announces the introduction of the Saskatchewan First-Time Homebuyers’ Tax Credit, effective January 1, 2012. It is based on the first $10,000 of a qualifying home purchase and results in a Saskatchewan income tax credit of up to $1,100.
In order to be eligible for the tax credit, the first-time homebuyer must have a “closing date” for the qualifying home of January 1, 2012 or later, defined as the date of sale identified on the purchase agreement.
The credit will be non-refundable and can be used to reduce Saskatchewan Personal Income Tax otherwise payable. There will be no carry-forward provision for unused amounts, but any unused portion may be claimed by the individual’s spouse or common-law partner. This tax credit will be administered by the Canada Revenue Agency on behalf of the Province.
Eligibility for the tax credit will be extended to an individual eligible for the Disability Tax Credit (DTC), or for the benefit of a DTC-eligible person who is related to the individual purchasing the home, to assist in finding a more accessible or functional home. Saskatchewan will adopt similar rules to the disability provisions of the federal First-Time Home Buyers’ Tax Credit program.
In order to simplify administration, other features of the tax credit will mirror the federal tax credit program.
| An individual will be considered a first-time homebuyer if neither the individual nor the individual’s spouse or common-law partner owned and lived in another home, anywhere in Canada, in the calendar year of the home purchase or in any of the four preceding calendar years. |
| A qualifying home is one that is currently eligible for the federal Home Buyers’ Plan (which allows eligible individuals to withdraw from their Registered Retirement Savings Plan to purchase or build a qualifying home). The individual or individual’s spouse or common-law partner must also intend to occupy the home as the principal place of residence not later than one year after its acquisition. The home may be an existing home or a new construction. |
| The credit may be claimed by the individual who acquires the home or by that individual’s spouse or common-law partner. For the purpose of this credit, a home is considered to be acquired by an individual only if the individual’s interest in the home is registered in accordance with the applicable land registration system. |
Further Information:
For further information on this new income tax initiative, please contact the Ministry of Finance at 1-800-667-6102.
Budget Summary | Budget 2012-13 69
2012-13 REVENUE INITIATIVES
As part of the 2012-13 budget development process, the Government undertook a review of several existing tax credit programs. This review examined whether these programs continue to be effective, efficient and sustainable, with the result that some tax credit programs are being amended. The reader is advised to contact the responsible ministries and consult the enacting legislation for specific details.
ACTIVE FAMILIES BENEFIT
The Active Families Benefit (AFB) provides a refundable Personal Income Tax credit to assist families with the cost of registering children in cultural, recreational and sports activities. The tax credit rebates up to $150 per child per year in eligible registration fees for children aged 6 to 14. The AFB makes cultural, recreational and sports activities more accessible and improves the quality of life for Saskatchewan families.
Eligible programs are those that are suitable for children and require children to actively participate; are offered by a service provider located in Saskatchewan; involve instruction and supervision by the service provider; and require registration with and payment of a fee to the service provider.
The Government is expanding eligibility for the AFB to all children under the age of 18 in order to increase access and ensure that all children benefit from sport, culture and recreation opportunities. All other program criteria will remain the same.
For further information on the AFB, please contact the Ministry of Tourism, Parks, Culture and Sport at 1-866-951-8828.
GRADUATE RETENTION PROGRAM
The Graduate Retention Program (GRP) provides a refundable Personal Income Tax credit to rebate up to $20,000 in tuition fees to post-secondary graduates. The tuition rebate is based on actual tuition fees paid, subject to a maximum for each type of program of study ($3,000 for certificates, $6,400 for diplomas, $15,000 for three-year degrees and $20,000 for four-year degrees). The tuition rebate is paid out over a seven-year instalment period, with 10 per cent paid in each of the first four instalment years and 20 per cent paid in each of the remaining three instalment years.
Through the 2008, 2009 and 2010 taxation years, over 30,000 post-secondary graduates have taken advantage of this program, receiving almost $46.4 million in tuition rebates by filing a Saskatchewan income tax return along with a tuition rebate eligibility certificate issued by the Ministry of Advanced Education, Employment and Immigration.
To date, the GRP has been administered as a refundable income tax credit. This means that graduates receive the tuition rebate as a reduction in their income taxes otherwise payable. Where the rebate amount is greater than the amount of income taxes payable, the excess is paid to the graduate as an income tax refund.
In order to more accurately reflect the manner in which the GRP benefit is paid out, the Government is converting the GRP into a non-refundable income tax credit. Graduates with sufficient income and provincial tax payable will continue to receive their tuition rebate as a reduction in provincial income tax.
70 Budget 2012-13 | Budget Summary
However, the Government recognizes that some graduates, particularly those who are just beginning their post-graduation careers and who are therefore not earning sufficient income or are claiming other deductions and tax credits, may not be able to apply the full amount of the non-refundable GRP tax credit against taxes payable. To protect these individuals, the Government will provide a new refundable tax credit equal to the unused portion of the non-refundable GRP tax credit.
For further information on the GRP, please contact the Ministry of Advanced Education, Employment and Immigration at 1-800-597-8278.
RESEARCH AND DEVELOPMENT TAX CREDIT
Saskatchewan currently offers a refundable Corporation Income Tax credit equal to 15 per cent of qualifying research and development (R&D) expenditures incurred in Saskatchewan. This tax credit is available to all corporations having a permanent establishment in Saskatchewan and investing in qualifying R&D activities in Saskatchewan. Qualifying R&D expenditures are determined by reference to the federal Income Tax Act and include activities such as operations research, engineering or design and computer programming.
The Government is making changes to the R&D Tax Credit effective for qualifying R&D expenditures incurred on or after April 1, 2012. The 15 per cent R&D Tax Credit will continue to be refundable for Canadian-controlled private corporations, subject to a maximum annual limit of $3 million in qualifying expenditures. Qualifying expenditures in excess of this annual limit, as well as all qualifying expenditures by other corporations, will now be eligible for a 15 per cent non-refundable R&D Tax Credit. Non-refundable tax credits earned in a year can be applied against Saskatchewan Corporation Income Tax otherwise payable for that year or in any of the subsequent 10 taxation years (or the previous three taxation years).
The changes to the R&D Tax Credit are being undertaken to ensure the sustainability of the program into the future. These amendments will have the effect of focusing the refundable portion of the tax credit on smaller companies that need more timely access to the benefit, while maintaining the 15 per cent tax credit as an incentive for all R&D in the province.
For further information on Saskatchewan’s R&D Tax Credit, please contact the Ministry of Finance at 1-800-667-6102.
FILM EMPLOYMENT TAX CREDIT
The Film Employment Tax Credit (FETC) was introduced in 1998 to encourage the development of Saskatchewan’s film industry. The FETC is a refundable Corporation Income Tax credit equal to 45 per cent of eligible labour costs. Eligible labour costs are limited to a maximum of 50 per cent of a film production’s total eligible budget. There are additional bonuses available for rural productions and for using Saskatchewan labour in key positions.
While the Saskatchewan film industry has created some high quality film and television productions, it has required a public investment of over $100 million since the program’s inception. Industry representatives have indicated that an even greater level of subsidization is required to remain competitive. Given the current level of public investment, an overall decline in industry activity and the need for additional public support to remain competitive, the Government has decided to wind down the tax credit.
Budget Summary | Budget 2012-13 71
The FETC is therefore being eliminated for any new productions. However, film productions that have already been registered by SaskFilm prior to April 1, 2012 will continue to be eligible for the tax credit.
For further information on the FETC, please contact the Ministry of Tourism, Parks, Culture and Sport at 1-306-787-0730.
INVEST IN SASKATCHEWAN PROGRAM
The Invest in Saskatchewan Program encourages Saskatchewan residents to invest in Labour-sponsored Venture Capital Corporations (LSVCCs) designed to raise pools of capital that can be reinvested into small and medium-sized businesses. To encourage investors to support these funds, federal and provincial governments provide significant tax incentives.
Saskatchewan currently provides a non-refundable Personal Income Tax credit equal to 20 per cent of investments in eligible LSVCCs. The tax credit is available for individual investments up to a maximum of $5,000 per year – the maximum annual provincial tax credit is therefore $1,000. The Saskatchewan tax credit is supplemented by a federal tax credit equal to 15 per cent of up to $5,000 invested in eligible LSVCCs. When combined with an individual’s ability to make LSVCC investments within his or her Registered Retirement Savings Plan, the federal and provincial tax savings can be as high as 79 per cent of the initial investment.
The Invest in Saskatchewan Program has been very successful in raising capital for reinvestment in the province. However, the program will also generate an estimated $17 million in provincial tax expenditures for the 2012 taxation year. The significance of this incentive warrants closer scrutiny to ensure that it is effectively meeting the original program intent.
The Government will therefore conduct an examination of the Invest in Saskatchewan Program over the next year.
For further information on the Invest in Saskatchewan Program and on the LSVCC Tax Credit, please contact Enterprise Saskatchewan at 1-306-798-1277.
72 Budget 2012-13 | Budget Summary
| | | |
| | | |
| | SASKATCHEWAN PROVINCIAL BUDGET | |
| | 12-13 | |
| | | |
GENERAL REVENUE FUND (GRF) BUDGET DETAILS |
Statement of Operations and Accumulated Deficit
| | | | (thousands of dollars) | |
| | | | Estimated | | | | Forecast | | | | Estimated | |
| | | | 2012-13 | | | | 2011-12 | | | | 2011-12 | |
Revenue 1 | | | 11,290,900 | | | | 11,075,200 | | | | 10,803,300 | |
| Expense | | | | | | | | | | | | |
Operating Expense 2 | | | 10,930,627 | | | | 10,817,679 | | | | 10,509,062 | |
| Capital Transfers | | | 265,286 | | | | 201,719 | | | | 179,204 | |
Expense 1 | | | 11,195,913 | | | | 11,019,398 | | | | 10,688,266 | |
| Pre-Transfer Surplus | | | 94,987 | | | | 55,802 | | | | 115,034 | |
| Transfer (to) Growth and Financial Security Fund | | | (47,494 | ) | | | (27,901 | ) | | | (57,517 | ) |
| Transfer from Growth and Financial Security Fund | | | – | | | | 325,000 | | | | 325,000 | |
| Surplus | | | 47,493 | | | | 352,901 | | | | 382,517 | |
| Accumulated Deficit, Beginning of Year | | | (145,858 | ) | | | (498,759 | ) | | | (498,759 | ) |
| Accumulated Deficit, End of Year | | | (98,365 | ) | | | (145,858 | ) | | | (116,242 | ) |
| 1 | Beginning in 2012-13, commissions paid to tax vendors are recorded as GRF expense instead of deducted from tax revenue. |
| | The 2011-12 Estimate and Forecast have been restated to be consistent with this change. |
| 2 | Includes salaries and benefits, goods and services, transfers for public services and to individuals, amortization, and debt servicing. |
GENERAL REVENUE FUND
Statement of Change in Net Debt
| | | (thousands of dollars) | |
| | | | | | | | | | |
| | | Estimated | | | Forecast | | | Estimated | |
| | | | 2012-13 | | | | 2011-12 | | | | 2011-12 | |
Annual Surplus | | | 47,493 | | | | 352,901 | | | | 382,517 | |
| Acquisition of Capital Assets | | | (522,447 | ) | | | (425,999 | ) | | | (415,655 | ) |
| Amortization of Capital Assets (Gross) | | | 191,505 | | | | 172,874 | | | | 174,434 | |
| Disposal of Agricultural Land (Book Value) | | | 1,600 | | | | 2,000 | | | | 8,000 | |
| (Increase) Decrease in Net Debt from Operations | | | (281,849 | ) | | | 101,776 | | | | 149,296 | |
| Net Debt, Beginning of Year | | | (3,574,217 | ) | | | (3,675,993 | )1 | | | (3,675,993 | )1 |
| Net Debt, End of Year | | | (3,856,066 | ) | | | (3,574,217 | ) | | | (3,526,697 | ) |
| | | | | | | | | | | | | |
| Net debt at March 31, 2011, as reported in the 2010-11 Public Accounts. |
74 Budget 2012-13 | Budget Summary
GENERAL REVENUE FUND
Statement of Cash Flow
| | | (thousands of dollars) | |
| | | | | | | | | | |
| | | Estimated | | | Forecast | | | Estimated | |
| | | 2012-13 | | | 2011-12 | | | 2011-12 | |
Operating Activities | | | | | | | | | |
| | | | | | | | | | |
| Surplus for the Year | | | 47,493 | | | | 352,901 | | | | 382,517 | |
| Add Non-cash Items: | | | | | | | | | | | | |
| Amortization of Foreign Exchange (Gain) Loss | | | (1,081 | ) | | | 2,181 | | | | 1,528 | |
| Amortization of Capital Assets | | | 191,505 | | | | 172,874 | | | | 174,434 | |
| (Gain) Loss on Loans, Investments and Capital Assets | | | (14,320 | ) | | | (25,775 | ) | | | (15,920 | ) |
| Net Change in Non-cash Operating Activities | | | 182,144 | | | | (225,468 | ) | | | (39,839 | ) |
| Earnings Retained in Sinking Funds | | | (95,127 | ) | | | (170,000 | ) | | | (81,000 | ) |
| Cash Provided by (used for) Operating Activities | | | 310,614 | | | | 106,713 | | | | 421,720 | |
| | | | | | | | | | | | | |
| Ministry Capital Activities | | | | | | | | | | | | |
| | | | | | | | | | | | | |
| Acquisition of Capital Assets | | | (522,447 | ) | | | (425,999 | ) | | | (415,655 | ) |
| Proceeds on Disposal of Agricultural Land | | | 18,000 | | | | 29,600 | | | | 26,000 | |
| Cash Provided by (used for) Ministry Capital Activities | | | (504,447 | ) | | | (396,399 | ) | | | (389,655 | ) |
| | | | | | | | | | | | | |
| Lending and Investing Activities | | | | | | | | | | | | |
| | | | | | | | | | | | | |
| Receipts | | | 1,356,373 | | | | 252,179 | | | | 278,418 | |
| Disbursements | | | (1,289,186 | ) | | | (732,933 | ) | | | (1,029,195 | ) |
| Cash Provided by (used for) Lending and Investing Activities | | | 67,187 | | | | (480,754 | ) | | | (750,777 | ) |
| | | | | | | | | | | | | |
| Financing Activities | | | | | | | | | | | | |
| | | | | | | | | | | | | |
| Borrowing | | | 1,328,380 | | | | 660,991 | | | | 886,800 | |
| Debt Repayment | | | (1,157,141 | ) | | | (341,744 | ) | | | (378,988 | ) |
| Cash Provided by (used for) Financing Activities | | | 171,239 | | | | 319,247 | | | | 507,812 | |
Increase (Decrease) in Cash 1 | | | 44,593 | | | | (451,193 | ) | | | (210,900 | ) |
| 1 | Cash also includes temporary, short-term (less than 30 days) investments. |
Budget Summary | Budget 2012-13 75
GENERAL REVENUE FUND
Schedule of Revenue
| | | (thousands of dollars) | |
| | | | | | | | | | |
| | | Estimated | | | Forecast | | | Estimated | |
| | | 2012-13 1 | | | 2011-12 | | | 2011-12 | |
Taxes | | | | | | | | | |
| Corporation Income | | | 817,200 | | | | 792,400 | | | | 1,080,700 | |
| Fuel | | | 508,300 | | | | 491,300 | | | | 461,300 | |
| Individual Income | | | 2,084,300 | | | | 1,915,200 | | | | 1,915,200 | |
| Provincial Sales | | | 1,348,700 | | | | 1,373,200 | | | | 1,278,900 | |
| Tobacco | | | 247,100 | | | | 247,100 | | | | 253,300 | |
| Other | | | 309,400 | | | | 297,700 | | | | 287,400 | |
| Taxes | | | 5,315,000 | | | | 5,116,900 | | | | 5,276,800 | |
| Non-Renewable Resources | | | | | | | | | | | | |
| Crown Land Sales | | | 220,000 | | | | 234,100 | | | | 436,400 | |
| Natural Gas | | | 12,500 | | | | 18,000 | | | | 22,500 | |
| Oil | | | 1,600,900 | | | | 1,471,900 | | | | 1,410,100 | |
| Potash | | | 705,200 | | | | 451,100 | | | | 381,300 | |
| Resource Surcharge | | | 485,900 | | | | 455,400 | | | | 438,300 | |
| Other | | | 123,800 | | | | 130,600 | | | | 140,300 | |
| Non-Renewable Resources | | | 3,148,300 | | | | 2,761,100 | | | | 2,828,900 | |
| Transfers from Crown Entities | | | | | | | | | | | | |
| Crown Investments Corporation of Saskatchewan | | | 150,000 | | | | 110,000 | | | | 110,000 | |
| – Special Dividend | | | 3,000 | | | | 130,000 | | | | 10,000 | |
| Saskatchewan Liquor and Gaming Authority | | | 439,900 | | | | 436,900 | | | | 422,000 | |
| Other Enterprises and Funds | | | 46,500 | | | | 74,500 | | | | 45,800 | |
| Transfers from Crown Entities | | | 639,400 | | | | 751,400 | | | | 587,800 | |
| Other Revenue | | | | | | | | | | | | |
| Fines, Forfeits and Penalties | | | 16,200 | | | | 13,900 | | | | 13,200 | |
| Interest, Premium, Discount and Exchange | | | 145,400 | | | | 237,800 | | | | 136,500 | |
| Motor Vehicle Fees | | | 172,800 | | | | 167,000 | | | | 162,000 | |
| Other Licences and Permits | | | 25,400 | | | | 24,900 | | | | 24,600 | |
| Sales, Services and Service Fees | | | 124,600 | | | | 130,500 | | | | 124,100 | |
| Transfers from Other Governments | | | 16,900 | | | | 16,900 | | | | 15,600 | |
| Other | | | 100,000 | | | | 100,000 | | | | 65,000 | |
| Other Revenue | | | 601,300 | | | | 691,000 | | | | 541,000 | |
| Own-Source Revenue | | | 9,704,000 | | | | 9,320,400 | | | | 9,234,500 | |
| Transfers from the Government of Canada | | | | | | | | | | | | |
| Canada Health Transfer | | | 902,900 | | | | 847,100 | | | | 847,100 | |
| Canada Social Transfer | | | 363,700 | | | | 352,700 | | | | 352,700 | |
| Other | | | 320,300 | | | | 555,000 | | | | 369,000 | |
| Transfers from the Government of Canada | | | 1,586,900 | | | | 1,754,800 | | | | 1,568,800 | |
| Revenue | | | 11,290,900 | | | | 11,075,200 | | | | 10,803,300 | |
| Beginning in 2012-13, commissions paid to tax vendors are recorded as GRF expense instead of deducted from tax revenue. The 2011-12 Estimate and Forecast for Provincial Sales Tax, Tobacco Tax and Other Taxes have been restated to be consistent with this change. |
76 Budget 2012-13 | Budget Summary
GENERAL REVENUE FUND
Schedule of Expense
| | | (thousands of dollars) | |
| | | | | | | | | | | | | | | | |
| | | Estimated Operating Expense 2012-13 | | | Estimated Capital Transfers 2012-13 | | | Estimated 2012-13 | | | Forecast 2011-12 | | | Estimated 2011-12 | |
| | | | | | | | | | | | | | | | |
| Ministries and Agencies | | | | | | | | | | | | | | | |
| Advanced Education, Employment | | | | | | | | | | | | | | | |
| and Immigration | | | 878,358 | | | | 12,240 | | | | 890,598 | | | | 861,231 | | | | 855,800 | |
| Agriculture | | | 430,777 | | | | – | | | | 430,777 | | | | 448,181 | | | | 417,816 | |
| Corrections, Public Safety and Policing | | | 373,983 | | | | 748 | | | | 374,731 | | | | 521,669 | | | | 367,377 | |
| Education | | | 1,273,376 | | | | 77,799 | | | | 1,351,175 | | | | 1,314,282 | | | | 1,233,715 | |
| – Teachers’ Pensions and Benefits | | | 244,892 | | | | – | | | | 244,892 | | | | 236,471 | | | | 198,507 | |
| Energy and Resources | | | 43,037 | | | | – | | | | 43,037 | | | | 36,720 | | | | 37,059 | |
| Enterprise and Innovation Programs | | | 27,347 | | | | – | | | | 27,347 | | | | 25,237 | | | | 27,347 | |
| Enterprise Saskatchewan | | | 33,063 | | | | – | | | | 33,063 | | | | 41,303 | | | | 41,803 | |
| Environment | | | 178,462 | | | | – | | | | 178,462 | | | | 207,218 | | | | 180,358 | |
| Executive Council | | | 16,472 | | | | 100 | | | | 16,572 | | | | 15,897 | | | | 15,993 | |
Finance 1 | | | 68,419 | | | | – | | | | 68,419 | | | | 86,964 | | | | 69,043 | |
| – Public Service Pensions and Benefits | | | 283,517 | | | | – | | | | 283,517 | | | | 276,670 | | | | 280,860 | |
| Finance Debt Servicing | | | 400,000 | | | | – | | | | 400,000 | | | | 410,000 | | | | 420,000 | |
| First Nations and Métis Relations | | | 81,943 | | | | – | | | | 81,943 | | | | 80,495 | | | | 82,230 | |
| Government Services | | | 14,542 | | | | – | | | | 14,542 | | | | 10,647 | | | | 12,647 | |
| Health | | | 4,656,623 | | | | 23,545 | | | | 4,680,168 | | | | 4,423,529 | | | | 4,462,529 | |
| Highways and Infrastructure | | | 393,624 | | | | 32,286 | | | | 425,910 | | | | 442,305 | | | | 380,260 | |
| Information Technology Office | | | 16,681 | | | | – | | | | 16,681 | | | | 21,414 | | | | 16,349 | |
| Innovation Saskatchewan | | | 6,769 | | | | – | | | | 6,769 | | | | 3,467 | | | | 3,467 | |
| Justice and Attorney General | | | 152,558 | | | | – | | | | 152,558 | | | | 150,407 | | | | 145,367 | |
| Labour Relations and Workplace Safety | | | 17,489 | | | | – | | | | 17,489 | | | | 17,205 | | | | 16,960 | |
| Municipal Affairs | | | 275,806 | | | | 110,977 | | | | 386,783 | | | | 379,484 | | | | 388,583 | |
| Office of the Provincial Capital Commission | | | 14,099 | | | | 616 | | | | 14,715 | | | | 10,966 | | | | 10,595 | |
| Public Service Commission | | | 38,541 | | | | – | | | | 38,541 | | | | 37,777 | | | | 37,967 | |
| Saskatchewan Research Council | | | 18,983 | | | | – | | | | 18,983 | | | | 18,133 | | | | 18,133 | |
| Social Services | | | 848,575 | | | | 4,150 | | | | 852,725 | | | | 791,337 | | | | 814,081 | |
| Tourism, Parks, Culture and Sport | | | 99,592 | | | | 2,825 | | | | 102,417 | | | | 94,981 | | | | 100,703 | |
| Legislative Assembly and its Officers | | | | | | | | | | | | | | | | | | | | |
| Chief Electoral Officer | | | 2,471 | | | | – | | | | 2,471 | | | | 15,784 | | | | 14,284 | |
| Children’s Advocate | | | 1,944 | | | | – | | | | 1,944 | | | | 1,993 | | | | 1,833 | |
| Conflict of Interest Commissioner | | | 145 | | | | – | | | | 145 | | | | 131 | | | | 145 | |
| Information and Privacy Commissioner | | | 1,065 | | | | – | | | | 1,065 | | | | 1,174 | | | | 1,114 | |
| Legislative Assembly | | | 26,067 | | | | – | | | | 26,067 | | | | 25,210 | | | | 24,225 | |
| Ombudsman | | | 3,075 | | | | – | | | | 3,075 | | | | 2,982 | | | | 2,982 | |
| Provincial Auditor | | | 8,332 | | | | – | | | | 8,332 | | | | 8,134 | | | | 8,134 | |
| Expense | | | 10,930,627 | | | | 265,286 | | | | 11,195,913 | | | | 11,019,398 | | | | 10,688,266 | |
| 1 | Beginning in 2012-13, commissions paid to tax vendors are recorded as GRF expense instead of deducted from tax revenue. The 2011-12 Estimate and Forecast have been restated to be consistent with this change. |
Budget Summary | Budget 2012-13 77
GENERAL REVENUE FUND
Schedule of Borrowing Requirements
| | | (thousands of dollars) | |
| | | | | | | | | | |
| | | Estimated | | | Forecast | | | Estimated | |
| | | | 2012-13 | | | | 2011-12 | | | | 2011-12 | |
Borrowing for Crown Corporations | | | | | | | | | | | | |
| Information Services Corporation of Saskatchewan | | | - | | | | 9,900 | | | | 9,900 | |
| Municipal Financing Corporation of Saskatchewan | | | 20,000 | | | | 32,391 | | | | 20,000 | |
| Saskatchewan Gaming Corporation | | | - | | | | - | | | | 6,800 | |
| Saskatchewan Liquor and Gaming Authority | | | 146,430 | | | | - | | | | - | |
| Saskatchewan Opportunities Corporation | | | - | | | | - | | | | 6,500 | |
| Saskatchewan Power Corporation | | | 623,000 | | | | 236,400 | | | | 733,300 | |
| Saskatchewan Telecommunications Holding Corporation | | | 183,200 | | | | 150,000 | | | | 92,900 | |
| Saskatchewan Water Corporation | | | 3,400 | | | | 6,000 | | | | 10,000 | |
| SaskEnergy Incorporated | | | 148,400 | | | | 150,000 | | | | 7,400 | |
| Borrowing for Crown Corporations | | | 1,124,430 | | | | 584,691 | | | | 886,800 | |
| Borrowing for Government | | | 203,950 | | | | 76,300 | | | | - | |
| Borrowing Requirements | | | 1,328,380 | | | | 660,991 | | | | 886,800 | |
78 Budget 2012-13 | Budget Summary
GENERAL REVENUE FUND
Schedule of Debt
As at March 31
| | | (thousands of dollars) | |
| | | | | | | | | | | | | | | | |
| | | Estimated | | | Estimated | | | Estimated | | | Forecast | | | Estimated | |
| | | Gross Debt | | | Sinking Funds | | | Debt | | | Debt | | | Debt | |
| | | 2013 | | | 2013 | | | 2013 | | | 2012 | | | 2012 | |
| | | | | | | | | | | | | | | | |
| Government General Debt | | | 5,007,739 | | | | (1,197,513 | ) | | | 3,810,226 | | | | 3,810,226 | | | | 3,810,226 | |
| Crown Corporation General Debt | | | | | | | | | | | | | | | | | | | | |
| Information Services Corporation | | | | | | | | | | | | | | | | | | | | |
| of Saskatchewan | | | 9,900 | | | | – | | | | 9,900 | | | | 9,900 | | | | 9,900 | |
| Municipal Financing | | | | | | | | | | | | | | | | | | | | |
| Corporation of Saskatchewan | | | 14,640 | | | | – | | | | 14,640 | | | | 14,640 | | | | 6,249 | |
| Saskatchewan Housing Corporation | | | 52,004 | | | | (26,008 | ) | | | 25,996 | | | | 27,291 | | | | 28,345 | |
| Saskatchewan Opportunities | | | | | | | | | | | | | | | | | | | | |
| Corporation | | | 36,684 | | | | (1,355 | ) | | | 35,329 | | | | 35,731 | | | | 42,275 | |
| Saskatchewan Power Corporation | | | 100,000 | | | | (4,567 | ) | | | 95,433 | | | | 96,555 | | | | 96,716 | |
| Saskatchewan Telecommunications | | | | | | | | | | | | | | | | | | | | |
| Holding Corporation | | | 33,200 | | | | – | | | | 33,200 | | | | – | | | | 42,900 | |
| Saskatchewan Water Corporation | | | 64,312 | | | | (8,491 | ) | | | 55,821 | | | | 53,057 | | | | 55,896 | |
| SaskEnergy Incorporated | | | 461,400 | | | | (7,683 | ) | | | 453,717 | | | | 332,222 | | | | 381,862 | |
| Crown Corporation | | | | | | | | | | | | | | | | | | | | |
| General Debt | | | 772,140 | | | | (48,104 | ) | | | 724,036 | | | | 569,396 | | | | 664,143 | |
| Government Business Enterprise Specific Debt | | | | | | | | | | | | | |
| Municipal Financing | | | | | | | | | | | | | | | | | | | | |
| Corporation of Saskatchewan | | | 142,904 | | | | (2,556 | ) | | | 140,348 | | | | 120,811 | | | | 116,898 | |
| Saskatchewan Gaming Corporation | | | 6,000 | | | | – | | | | 6,000 | | | | 6,000 | | | | 12,800 | |
| Saskatchewan Liquor and | | | | | | | | | | | | | | | | | | | | |
| Gaming Authority | | | 146,430 | | | | – | | | | 146,430 | | | | – | | | | – | |
| Saskatchewan Power Corporation | | | 3,571,558 | | | | (386,473 | ) | | | 3,185,085 | | | | 2,599,042 | | | | 3,110,842 | |
| Saskatchewan Telecommunications | | | | | | | | | | | | | | | | | | | | |
| Holding Corporation | | | 736,600 | | | | (88,516 | ) | | | 648,084 | | | | 508,001 | | | | 411,287 | |
| SaskEnergy Incorporated | | | 666,183 | | | | (69,365 | ) | | | 596,818 | | | | 624,326 | | | | 477,171 | |
| Government Business | | | | | | | | | | | | | | | | | | | | |
| Enterprise Specific Debt | | | 5,269,675 | | | | (546,910 | ) | | | 4,722,765 | | | | 3,858,180 | | | | 4,128,998 | |
| Public Debt | | | 11,049,554 | | | | (1,792,527 | ) | | | 9,257,027 | | | | 8,237,802 | | | | 8,603,367 | |
| | | | | | | | | | | | | | | | | | | | | |
| Guaranteed Debt | | | 152,115 | | | | – | | | | 152,115 | | | | 92,625 | | | | 84,015 | |
Budget Summary | Budget 2012-13 79
GENERAL REVENUE FUND
Schedule of Guaranteed Debt
As at March 31
| | | (thousands of dollars) | |
| | | | | | | | | | |
| | | Estimated | | | Forecast | | | Estimated | |
| | | 2013 | | | 2012 | | | 2012 | |
| | | | | | | | | | |
| Guaranteed Debt for Crown Corporations | | | | | | | | | |
| | | | | | | | | | |
| The Crown Corporations Act, 1993 | | | | | | | | | |
| Federal Immigrant Investor Loans | | | 125,100 | | | | 68,500 | | | | 61,129 | |
| The Power Corporation Act | | | | | | | | | | | | |
| Saskatchewan Power Savings Bonds | | | | | | | | | | | | |
| Series I to Series VII (matured) | | | – | | | | – | | | | 18 | |
| Guaranteed Debt for Crown Corporations | | | 125,100 | | | | 68,500 | | | | 61,147 | |
| | | | | | | | | | | | | |
| Other Guaranteed Debt | | | | | | | | | | | | |
| | | | | | | | | | | | | |
| The Farm Financial Stability Act | | | | | | | | | | | | |
| Breeder Associations Loan Guarantees | | | 13,000 | | | | 12,000 | | | | 10,830 | |
| Feeder Associations Loan Guarantees | | | 10,000 | | | | 9,000 | | | | 8,963 | |
| Feedlot Construction Loan Guarantees | | | 3,000 | | | | 3,000 | | | | 2,996 | |
| Individual Feedlot Loan Guarantees | | | 1,000 | | | | 100 | | | | 61 | |
| The Student Assistance and Student Aid Fund Act | | | 15 | | | | 25 | | | | 18 | |
| Other Guaranteed Debt | | | 27,015 | | | | 24,125 | | | | 22,868 | |
| Guaranteed Debt | | | 152,115 | | | | 92,625 | | | | 84,015 | |
80 Budget 2012-13 | Budget Summary
| | | |
| | | |
| | SASKATCHEWAN PROVINCIAL BUDGET | |
| | 12-13 | |
| | | |
SUMMARY FINANCIAL BUDGET DETAILS |
GOVERNMENT OF SASKATCHEWAN
Summary Statement of Surplus
| | | (millions of dollars) | |
| | | | | | | | | | |
| | | Estimated | | | Forecast | | | Estimated | |
| | | 2012-13 | | | 2011-12 | | | 2011-12 | |
Treasury Board Organizations 1 | | | | | | | | | |
| General Revenue Fund (GRF) | | | 47.5 | | | | 352.9 | | | | 382.5 | |
| Growth and Financial Security Fund | | | 47.5 | | | | (297.1 | ) | | | (267.5 | ) |
| Boards of Education | | | 69.9 | | | | 98.0 | | | | 113.8 | |
| eHealth Saskatchewan | | | 7.3 | | | | 0.8 | | | | 11.7 | |
| Enterprise Saskatchewan | | | (11.8 | ) | | | (5.8 | ) | | | (14.9 | ) |
| Legal Aid Commission | | | (0.5 | ) | | | (0.6 | ) | | | (0.3 | ) |
| Liquor and Gaming Authority | | | 439.9 | | | | 436.9 | | | | 422.0 | |
| Northern Municipal Trust Account | | | (9.3 | ) | | | (6.3 | ) | | | (8.2 | ) |
| Regional Colleges | | | (5.8 | ) | | | 4.9 | | | | 2.8 | |
| Regional Health Authorities | | | (77.0 | ) | | | (71.6 | ) | | | (94.5 | ) |
| Saskatchewan Agricultural Stabilization Fund | | | (13.5 | ) | | | – | | | | – | |
| Saskatchewan Apprenticeship & Trade Certification Commission | | | (1.1 | ) | | | 0.6 | | | | (0.5 | ) |
| Saskatchewan Cancer Agency | | | (3.4 | ) | | | (0.3 | ) | | | (3.9 | ) |
| Saskatchewan Housing Corporation | | | 1.5 | | | | 1.5 | | | | 1.5 | |
| Saskatchewan Institute of Applied Science and Technology | | | 1.8 | | | | 3.2 | | | | – | |
| Saskatchewan Research Council | | | 0.5 | | | | 1.4 | | | | 0.8 | |
| Saskatchewan Student Aid Fund | | | – | | | | – | | | | 0.7 | |
| Saskatchewan Watershed Authority | | | (6.1 | ) | | | (38.3 | ) | | | (5.4 | ) |
| Other Organizations | | | 12.8 | | | | 0.3 | | | | (2.8 | ) |
Interagency Accounting Adjustments 2 | | | (84.3 | ) | | | (170.5 | ) | | | (209.9 | ) |
| Adjustment to Account for Pension Costs on an Accrual Basis | | | (232.4 | ) | | | (175.9 | ) | | | (206.8 | ) |
| | | | 183.5 | | | | 134.1 | | | | 121.1 | |
| Dividends included in GRF Surplus | | | (449.0 | ) | | | (472.0 | ) | | | (430.0 | ) |
| Surplus (Deficit) of Treasury Board Organizations | | | (265.5 | ) | | | (337.9 | ) | | | (308.9 | ) |
CIC Board Organizations 3 | | | | | | | | | | | | |
Crown Investments Corporation (non-consolidated) 4 | | | (39.2 | ) | | | (46.9 | ) | | | (88.0 | ) |
| CIC Asset Management Inc. | | | (1.6 | ) | | | 35.3 | | | | (7.1 | ) |
| Information Services Corporation | | | 13.9 | | | | 17.2 | | | | 12.2 | |
| SaskEnergy Incorporated | | | 65.4 | | | | 25.5 | | | | 96.3 | |
| Saskatchewan Gaming Corporation | | | 26.0 | | | | 25.9 | | | | 25.5 | |
| Saskatchewan Government Insurance | | | 33.7 | | | | 0.5 | | | | 43.1 | |
| Saskatchewan Opportunities Corporation | | | 3.9 | | | | 4.6 | | | | 4.6 | |
| Saskatchewan Power Corporation | | | 156.7 | | | | 248.0 | | | | 118.6 | |
| Saskatchewan Telecommunications Holding Corporation | | | 91.1 | | | | 154.0 | | | | 161.0 | |
| Saskatchewan Transportation Company | | | (0.4 | ) | | | (0.3 | ) | | | (0.5 | ) |
| Saskatchewan Water Corporation | | | 1.6 | | | | 3.5 | | | | 0.2 | |
Interagency Accounting Adjustments 2 | | | (4.6 | ) | | | (50.5 | ) | | | (18.0 | ) |
| | | | 346.5 | | | | 416.8 | | | | 347.9 | |
| Dividends included in GRF Surplus | | | (153.0 | ) | | | (240.0 | ) | | | (120.0 | ) |
| Retained Surplus of CIC Board Organizations | | | 193.5 | | | | 176.8 | | | | 227.9 | |
82 Budget 2012-13 | Budget Summary
GOVERNMENT OF SASKATCHEWAN
Summary Statement of Surplus
Continued
| | | (millions of dollars) | |
| | | | | | | | | | |
| | | Estimated | | | Forecast | | | Estimated | |
| | | 2012-13 | | | 2011-12 | | | 2011-12 | |
| | | | | | | | | | |
| Surplus (Deficit) Prior to | | | | | | | | | |
| Not-for-Profit Insurance Organizations | | | (72.0 | ) | | | (161.1 | ) | | | (81.0 | ) |
| | | | | | | | | | | | | |
Not-for-Profit Insurance Organizations 5 | | | | | | | | | | | | |
| Saskatchewan Auto Fund | | | (8.9 | ) | | | (142.9 | ) | | | (2.2 | ) |
| Saskatchewan Crop Insurance Corporation | | | 53.3 | | | | (22.9 | ) | | | 83.3 | |
| Crop Reinsurance Fund of Saskatchewan | | | 36.6 | | | | 25.0 | | | | 26.0 | |
| Workers’ Compensation Board (Saskatchewan) | | | 5.8 | | | | (7.0 | ) | | | 28.2 | |
| Surplus of Not-for-Profit Insurance Organizations | | | 86.8 | | | | (147.8 | ) | | | 135.3 | |
| Surplus (Deficit) | | | 14.8 | | | | (308.9 | ) | | | 54.3 | |
The year-end for some organizations is not March 31. The 2012-13 Estimated amounts for those organizations are the Estimated amounts for the fiscal year ending before March 31, 2013. |
| 1 | Budgets of these organizations are subject to Treasury Board review and include transfers from the GRF. |
| 2 | Interagency Accounting Adjustments eliminate the effects of financial transactions between agencies and, for organizations whose fiscal year-ends are not March 31, adjust for significant transactions between their year-ends and March 31. |
| 3 | Budgets of these organizations are subject to Crown Investments Corporation (CIC) Board review and include grants from CIC. |
| 4 | CIC’s amounts exclude dividend revenue from its subsidiaries. |
| 5 | The insurance organizations establish rates and fees that will allow them to be actuarially sound over the long term. These organizations do not pay dividends to the GRF. |
GOVERNMENT OF SASKATCHEWAN
Summary Statement of Accumulated Surplus
| | | (millions of dollars) | |
| | | | | | | | | | |
| | | Estimated | | | Forecast | | | Estimated | |
| | | 2012-13 | | | 2011-12 | | | 2011-12 | |
| | | | | | | | | | |
| Accumulated Surplus, Beginning of Year | | | 2,518.5 | | | | 2,961.1 | 1 | | | 2,961.1 | 1 |
| Surplus (Deficit) | | | 14.8 | | | | (308.9 | ) | | | 54.3 | |
| Other Comprehensive Income | | | – | | | | (133.7 | )2 | | | – | |
| Accumulated Surplus, End of Year | | | 2,533.3 | | | | 2,518.5 | | | | 3,015.4 | |
| 1 | Accumulated Surplus as at March 31, 2011, as reported in the 2010-11 Public Accounts. |
| 2 | Primarily actuarial losses on defined benefit pension plans reported in Other Comprehensive Income under International Financial Reporting Standards (IFRS). |
Budget Summary | Budget 2012-13 83
GOVERNMENT OF SASKATCHEWAN
Summary Statement of Change in Net Debt
| | | (millions of dollars) | |
| | | | | | | | | | |
| | | Estimated | | | Forecast | | | Estimated | |
| | | 2012-13 | | | 2011-12 | | | 2011-12 | |
| | | | | | | | | | |
Surplus (Deficit) | | | 14.8 | | | | (308.9 | ) | | | 54.3 | |
Acquisition of GSO Capital Assets 1 | | | (1,184.4 | ) | | | (941.6 | ) | | | (1,041.8 | ) |
Amortization Expense 2 | | | 508.5 | | | | 475.1 | | | | 476.7 | |
| (Increase) in Net Debt | | | (661.1 | ) | | | (775.4 | ) | | | (510.8 | ) |
| Net Debt, Beginning of Year | | | (4,692.4 | ) | | | (3,783.3 | )3 | | | (3,783.3 | )3 |
| Other Comprehensive Income | | | – | | | | (133.7 | )4 | | | – | |
| Net Debt, End of Year | | | (5,353.5 | ) | | | (4,692.4 | ) | | | (4,294.1 | ) |
| 1 | These amounts reflect capital acquisitions by the GRF and government service organizations (GSOs) such as regional health authorities. The amounts exclude capital assets acquired by government business enterprises (GBEs) such as SaskPower and SaskTel. |
| 2 | Amortization expense also includes disposal of capital assets and minor adjustments. |
| 3 | Net Debt as at March 31, 2011, as reported in the 2010-11 Public Accounts. |
| 4 | Primarily actuarial losses on defined benefit pension plans reported in Other Comprehensive Income under International Financial Reporting Standards (IFRS). |
GOVERNMENT OF SASKATCHEWAN
Summary Schedule of Pension Liabilities
| | | (millions of dollars) | |
| | | | | | | | | | |
| | | Estimated | | | Forecast | | | Estimated | |
| | | 2012-13 | | | 2011-12 | | | 2011-12 | |
| | | | | | | | | | |
| Pension Liabilities, Beginning of the Year | | | 6,351.7 | | | | 6,175.8 | 1 | | | 6,175.8 | 1 |
| Adjustment to Account for Pension Costs on an Accrual Basis | | | 232.4 | | | | 175.9 | | | | 206.8 | |
| Pension Liabilities, End of the Year | | | 6,584.1 | | | | 6,351.7 | | | | 6,382.6 | |
| 1 | Pension Liability as at March 31, 2011, as reported in the 2010-11 Public Accounts. |
84 Budget 2012-13 | Budget Summary
GOVERNMENT OF SASKATCHEWAN
Summary Schedule of Tangible Capital Assets
As at March 31
| | | | (millions of dollars) | |
| | | | | | | | | | | | | | | | | | | | | | | | | | | | | | | | | |
| | | | Actual | | | | | | | | | | | | | | | | Forecasted | | | | | | | | | | | | Estimated | |
| | | | Net Book | | | | | | | | | | | | IFRS and | | | | Net Book | | | | | | | | | | | | Net Book | |
| | | | Value | | | | - 2011-12 Forecast - | | | | Other | | | | Value | | | | - 2013-13 Estimated | | | Value | |
| | | | 20111 | | | | Additions | | | | Amortization2 | | | | Adjustments4 | | | | 2012 | | | | Additions | | | | Amortization2 | | | | 2013 | |
| | | | | | | | | | | | | | | | | | | | | | | | | | | | | | | | | |
| General Revenue Fund | | | 3,045.1 | | | | 426.0 | | | | (174.9 | ) | | | – | | | | 3,296.2 | | | | 522.4 | | | | (193.1 | ) | | | 3,625.5 | |
| Treasury Board | | | | | | | | | | | | | | | | | | | | | | | | | | | | | | | | |
| Organizations | | | 3,170.4 | | | | 498.5 | | | | (295.4 | ) | | | – | | | | 3,373.5 | | | | 679.4 | | | | (302.9 | ) | | | 3,750.0 | |
| CIC Board Organizations | | | 7,087.2 | | | | 1,224.5 | | | | (539.0 | ) | | | 760.0 | | | | 8,532.7 | | | | 1,714.9 | | | | (605.7 | ) | | | 9,641.9 | |
| Not-for-Profit | | | | | | | | | | | | | | | | | | | | | | | | | | | | | | | | |
| Insurance Organizations | | | 68.2 | | | | 13.3 | | | | (9.0 | ) | | | (3.5 | ) | | | 69.0 | | | | 13.0 | | | | (14.7 | ) | | | 67.3 | |
| | | | | | | | | | | | | | | | | | | | | | | | | | | | | | | | | |
| Total Government | | | 13,370.9 | | | | 2,162.3 | | | | (1,018.3 | ) | | | 756.5 | | | | 15,271.4 | | | | 2,929.7 | | | | (1,116.4 | ) | | | 17,084.7 | |
| | | | | | | | | | | | | | | | | | | | | | | | | | | | | | | | | |
| Government Business | | | | | | | | | | | | | | | | | | | | | | | | | | | | | | | | |
Enterprises (GBEs) 3 | | | 6,825.5 | | | | 1,220.7 | | | | (543.2 | ) | | | 756.5 | | | | 8,259.5 | | | | 1,745.3 | | | | (607.9 | ) | | | 9,396.9 | |
| Government Service | | | | | | | | | | | | | | | | | | | | | | | | | | | | | | | | |
Organizations (GSOs) 3 | | | 6,545.4 | | | | 941.6 | | | | (475.1 | ) | | | – | | | | 7,011.9 | | | | 1,184.4 | | | | (508.5 | ) | | | 7,687.8 | |
| | | | | | | | | | | | | | | | | | | | | | | | | | | | | | | | | |
| Total Government | | | 13,370.9 | | | | 2,162.3 | | | | (1,018.3 | ) | | | 756.5 | | | | 15,271.4 | | | | 2,929.7 | | | | (1,116.4 | ) | | | 17,084.7 | |
This schedule includes capital asset acquisitions of government organizations only. Government transfers to non-government organizations, such as universities and municipalities, for the acquisition of capital assets are excluded. |
1 | Net Book value at March 31, 2011, as reported in the 2010-11 Public Accounts. |
2 | Amortization includes disposal of tangible capital assets and minor adjustments. |
3 | Government business enterprises (GBEs) such as SaskPower and Liquor and Gaming Authority sell goods and services outside government and are self sustaining. Government service organizations (GSOs) include any other government organization that is not a GBE. |
4 | In 2011-12, GBEs adopted International Financial Reporting Standards (IFRS). IFRS adjustments primarily relate to the immediate recognition of customer comtributions into capital, power purchase agreements that were previously considered commitments and are recognized as finance leases under IFRS, and a one-time option to fair value last and buildings. Other adjustments include a $33M reclassification, from other assets, of a specified volume of natural gas which is integral to operation of the natural gas storage facilities. |
Budget Summary | Budget 2012-13 85
GOVERNMENT OF SASKATCHEWAN
Summary Schedule of Debt
As at March 31
| | | (millions of dollars) | |
| | | | | | | | | | | | | | | | |
| | | Estimated | | | Estimated | | | Estimated | | | Forecast | | | Estimated | |
| | | GRF Debt | 1 | | Other Debt | | | Total | | | Total | | | Total | |
| | | 2013 | | | 2013 | | | 2013 | | | 2012 | | | 2012 | |
| | | | | | | | | | | | | | | | |
| Treasury Board Organizations | | | | | | | | | | | | | | | |
| GRF – Government Public Debt | | | 3,810.2 | | | | – | | | | 3,810.2 | | | | 3,810.2 | | | | 3,810.2 | |
| Boards of Education | | | – | | | | 104.3 | | | | 104.3 | | | | 85.3 | | | | 76.2 | |
| Global Transportation Hub Authority | | | – | | | | 30.0 | | | | 30.0 | | | | – | | | | – | |
| Growth and Financial Security Fund | | | – | | | | (19.3 | ) | | | (19.3 | ) | | | (18.7 | ) | | | (46.7 | ) |
| Liquor and Gaming Authority | | | 146.4 | | | | – | | | | 146.4 | | | | – | | | | – | |
| Municipal Financing Corporation of Sask. | | | 155.0 | | | | – | | | | 155.0 | | | | 135.5 | | | | 123.1 | |
| Regional Health Authorities | | | – | | | | 121.0 | | | | 121.0 | | | | 82.0 | | | | 92.0 | |
| Saskatchewan Housing Corporation | | | 26.0 | | | | 7.0 | | | | 33.0 | | | | 35.3 | | | | 36.2 | |
| Saskatchewan Watershed Authority | | | – | | | | 12.7 | | | | 12.7 | | | | 6.6 | | | | 6.3 | |
| Other | | | – | | | | 1.0 | | | | 1.0 | | | | 1.2 | | | | 2.5 | |
| Public Debt of | | | | | | | | | | | | | | | | | | | | |
| Other Treasury Board Organizations | | | 327.4 | | | | 256.7 | | | | 584.1 | | | | 327.2 | | | | 289.6 | |
| Public Debt of | | | | | | | | | | | | | | | | | | | | |
| Treasury Board Organizations | | | 4,137.6 | | | | 256.7 | | | | 4,394.3 | | | | 4,137.4 | | | | 4,099.8 | |
| CIC Board Organizations | | | | | | | | | | | | | | | | | | | | |
| Information Services Corporation of Sask. | | | 9.9 | | | | – | | | | 9.9 | | | | 9.9 | | | | 9.9 | |
| Saskatchewan Gaming Corporation | | | 6.0 | | | | 5.8 | | | | 11.8 | | | | 13.1 | | | | 19.9 | |
| Saskatchewan Immigrant Investor Fund Inc. | | | – | | | | 116.9 | | | | 116.9 | | | | 64.0 | | | | 57.1 | |
| Saskatchewan Opportunities Corporation | | | 35.3 | | | | – | | | | 35.3 | | | | 35.7 | | | | 42.3 | |
| Saskatchewan Power Corporation | | | 3,280.5 | | | | – | | | | 3,280.5 | | | | 2,695.6 | | | | 3,207.6 | |
| Saskatchewan Telecommunications | | | 681.3 | | | | – | | | | 681.3 | | | | 508.0 | | | | 454.2 | |
| Saskatchewan Water Corporation | | | 55.8 | | | | – | | | | 55.8 | | | | 53.1 | | | | 55.9 | |
| SaskEnergy Incorporated | | | 1,050.6 | | | | 4.8 | | | | 1,055.4 | | | | 961.3 | | | | 863.8 | |
| Public Debt of CIC Board Organizations | | | 5,119.4 | | | | 127.5 | | | | 5,246.9 | | | | 4,340.7 | | | | 4,710.7 | |
| Not-for-Profit Insurance Organizations | | | | | | | | | | | | | | | | | | | | |
| Saskatchewan Crop Insurance Corporation | | | – | | | | 4.9 | | | | 4.9 | | | | 6.5 | | | | 6.1 | |
| Public Debt of Not-for-Profit | | | | | | | | | | | | | | | | | | | | |
| Insurance Organizations | | | – | | | | 4.9 | | | | 4.9 | | | | 6.5 | | | | 6.1 | |
| Public Debt | | | 9,257.0 | | | | 389.1 | | | | 9,646.1 | | | | 8,484.6 | | | | 8,816.6 | |
| | | | | | | | | | | | | | | | | | | | | |
| Guaranteed Debt | | | 152.1 | | | | (110.9 | ) | | | 41.2 | | | | 29.7 | | | | 37.9 | |
| 1 | Debt obtained by the General Revenue Fund for its own use or on behalf of Crown corporations. The amount is net of sinking funds. Debt repayable in foreign currency is restated in equivalent Canadian dollars. |
| | The Province’s Summary Financial Statements account for government business enterprises (GBEs) such as SaskPower on an equity basis. |
| | Therefore debt of GBEs (except general lending by the GRF to GBEs) is netted against other liabilities and assets and the resultant equity is shown as Investment in GBEs. |
86 Budget 2012-13 | Budget Summary
GOVERNMENT OF SASKATCHEWAN
Notes to the Summary Financial Budget
REPORTING ENTITY
The Summary Financial Budget reports the planned financial activities of the General Revenue Fund (GRF), and of organizations and funds controlled by Government. The determination of control requires evaluation of various factors. While Government clearly controls Crown corporations, the determination of control is less clear for organizations such as the Workers’ Compensation Board (WCB), school boards and universities. Canadian jurisdictions differ on whether they consolidate these organizations, depending on their government’s degree of control.
The Summary Budget is not a budget in the same sense as the GRF Budget. Treasury Board and Cabinet are directly involved in GRF revenue and expenditure decisions and tradeoffs. GRF revenues (taxes) are not directly related to the programs and services they provide, so decisions on revenues can be independent from decisions on spending within any constraints imposed by the desire to achieve a given level of surplus. The budget and Estimates of the GRF are subject to detailed review, then approval by the Legislative Assembly.
CONSOLIDATION OF PLANS
The summary budget is a consolidation of the plans or budgets of individual government organizations, as approved by their Boards. Some of these plans, such as those of regional health authorities, are influenced by the extent of GRF support. The plans of other organizations, such as SaskPower and the WCB, are not. Other organizations, such as the Saskatchewan Institute of Applied Science and Technology (SIAST) and school boards, have different year-ends than the GRF and their plans are made in advance of Government’s budget process. The involvement of Treasury Board and Cabinet with the plans of these government organizations is often less direct and can vary from significant to no involvement.
Another major difference is that most government organizations do not receive taxes. Many, especially government business enterprises, tend to spend monies to provide goods and services in exchange for revenue from ratepayers, clients and customers.
METHOD OF CONSOLIDATION
The Summary Statement of Surplus (or Deficit) combines the planned surplus or deficit of all government organizations. Adjustments are then made to eliminate inter-organization transactions and to account for significant transactions in the period between the organization’s fiscal year-end and Government’s March 31 year-end. These adjustments are grouped in an “interagency accounting adjustment” amount. An adjustment is also made to ensure all pension expenses are recorded on an accrual basis of accounting, as recommended by the Public Sector Accounting Board of the Canadian Institute of Chartered Accountants.
This method of consolidating the plans of government organizations differs from the method used in the Summary Financial Statements, which combine revenues and expenses of the GRF and government service organizations on a consistent accounting basis and then eliminate interagency transactions. Each method arrives at the same bottom line.
Budget Summary | Budget 2012-13 87
GOVERNMENT BUSINESS ENTERPRISES
These are self-sufficient government organizations whose principal activity is the sale of goods and services to individuals and organizations outside government. These organizations comprise: the Municipal Financing Corporation, the Saskatchewan Gaming Corporation, the Liquor and Gaming Authority, SaskEnergy, SaskPower, SaskTel, SGI (including the Auto Fund), and the WCB.
GOVERNMENT SERVICE ORGANIZATIONS
All government organizations and funds that are not government business enterprises are considered government service organizations (GSOs). Typically GSOs, such as regional health authorities, provide public service but usually need government grants to sustain their operations. Some GSOs, such as the Saskatchewan Transportation Company, sell services but are not self-sufficient. Other GSOs, such as Information Services Corporation, are self-sufficient but have revenues more akin to fees or taxes.
DESCRIPTION OF GOVERNMENT ORGANIZATIONS
Categorization of Government Organizations
The Summary Financial Budget categorizes organizations into three groups. The first two groups are Treasury Board organizations and Crown Investment Corporation (CIC) Board organizations. For these two groups, each organization’s budget or business plan is examined by the appropriate Cabinet Committee (Treasury Board or CIC Board). The third group is not-for-profit insurance organizations which are intended to be actuarially sound and will typically adjust their rates to break even over the longer term. The GRF does not take a dividend from these organizations.
Treasury Board Organizations
Boards of Education
Twenty-eight Boards of Education, including the Conseil d’écoles fransaskois, operate under the authority of The Education Act, 1995. The boards and the Conseil work with the Ministry of Education to strengthen the performance and accountability of the school system under their Continuous Improvement Framework. The boards and the Conseil are responsible for delivering the educational program – including curriculum and instruction, and programs for children and youth. The boards and the Conseil are required to comply with provincial statutes, regulations and policies and, as elected bodies, are accountable to their local electors. The boards and the Conseil receive operating and capital grants from the Provincial Government. The boards also receive property taxes in their jurisdiction.
eHealth Saskatchewan
eHealth Saskatchewan was established by Order in Council pursuant to the provisions of The Crown Corporations Act, 1993. eHealth Saskatchewan’s mandate is to procure, implement, own, operate and manage the Saskatchewan Electronic Health Record (EHR) and, where appropriate, other health information systems – including the associated provincial components and infrastructure to facilitate improved health provider and patient access and use of electronic health information. eHealth Saskatchewan also establishes the provincial health information and technology standards necessary to access the Saskatchewan EHR and the associated provincial components and infrastructure.
Enterprise Saskatchewan
Enterprise Saskatchewan was established in 2008 as the central economic development agency of Government, pursuant to The Enterprise Saskatchewan Act. It brings together representation
88 Budget 2012-13 | Budget Summary
from all sectors of the economy to formulate strategy and recommend action to move the province forward on a sustainable growth agenda in accordance with the principles set out in the Act. Enterprise Saskatchewan provides advice to Government to remove barriers to growth; implements activities and programs that would promote and develop the Saskatchewan economy; and establishes and reports on clear and measurable targets for performance of the Saskatchewan economy.
Northern Municipal Trust Account (NMTA)
NMTA, formerly the Northern Revenue Sharing Trust Account, was established by Section 287 of The Northern Municipalities Act. NMTA administers all revenues relating to the Northern Saskatchewan Administration District (NSAD) and all monies appropriated by the legislature for the purposes of northern revenue sharing and other grant programs. The NMTA also acts as a municipal operating fund for the unincorporated area in the district, the northern settlements and recreational subdivisions. NMTA also collects taxes for northern hamlets and northern school divisions.
Regional Colleges
Seven regional colleges, operating under the authority of The Regional Colleges Act, provide educational services and programs in more than 40 locations throughout the province. Through partnerships with universities and technical institutes such as the Saskatchewan Institute of Applied Science and Technology (SIAST), regional colleges deliver credit programs in response to the needs of rural and northern Saskatchewan. Regional colleges also offer literacy and basic education, industry credit and non-credit programs based on local needs, and provide a broad array of counselling and assessment services geared to assisting individuals with career planning.
Regional Health Authorities
Pursuant to The Regional Health Services Act, proclaimed in 2002, health services in Saskatchewan are delivered by 12 regional health authorities. Major areas of responsibility include:
| hospitals, health centres, wellness centres, and social centres; |
| emergency response services, including first responders and ambulance services; |
| home care, long-term and other supportive care, respite, palliative care, day programs and programs for patients with multiple disabilities; |
| community health services such as public health nursing, public health inspection, dental health, vaccinations and speech pathology; |
| mental health services; and, |
Saskatchewan Agricultural Stabilization Fund
The Saskatchewan Agricultural Stabilization Fund was established under The Farm Financial Stability Act and delivers the Wildlife Damage Compensation Program and the Farm and Ranch Water Infrastructure Program.
Saskatchewan Apprenticeship and Trade Certification Commission (SATCC)
SATCC operates under the authority of The Apprenticeship and Trade Certification Act, 1999. SATCC is an industry-led government agency with a mandate to govern and manage the apprenticeship and trade certification system in Saskatchewan. There are more than 9,000 registered apprentices working and learning on the job in 47 trades and 23 sub-trades. In excess of 5,000 of those apprentices also attend classroom-based technical training each year.
Budget Summary | Budget 2012-13 89
Saskatchewan Cancer Agency (SCA)
SCA was established by The Cancer Foundation Act, which was superseded by The Cancer Agency Act in 2007. SCA is responsible for the planning, organization, delivery and evaluation of cancer care services throughout Saskatchewan in collaboration with regional health authorities and health care organizations. SCA provides for cancer testing, screening, detection, diagnosis and prevention; cancer treatment, rehabilitation and monitoring services; education of health care providers and Saskatchewan residents regarding cancer and cancer prevention; and cancer research.
Saskatchewan Housing Corporation (SHC)
SHC operates under the authority of The Saskatchewan Housing Corporation Act, developing, designing and implementing housing programs and services for families, seniors and others. SHC promotes access to housing for people with low incomes, and fosters independence and self-sufficiency for clients through programs and services that are delivered either directly by SHC, by local housing authorities that manage SHC-owned properties, or by third-party groups that own and manage properties and receive financial assistance from SHC.
Saskatchewan Institute of Applied Science and Technology (SIAST)
SIAST operates under the authority of The Saskatchewan Institute of Applied Science and Technology Act. SIAST provides post-secondary technical education and skills training through four urban campuses (Regina, Saskatoon, Moose Jaw and Prince Albert) and a virtual campus, helping to meet the needs of students and employers. SIAST’s enrollment is nearly 15,000 full-load equivalent students.
Saskatchewan Legal Aid Commission
The Legal Aid Act and The Legal Aid Regulations provide the legislative mandate for the Saskatchewan Legal Aid Commission. Existing since 1974, the commission provides legal services to persons and organizations for criminal and civil matters where those persons and organizations are financially unable to secure these services from their own resources.
Saskatchewan Liquor and Gaming Authority (SLGA)
SLGA is governed by The Alcohol and Gaming Regulation Act, 1997. SLGA is responsible for the distribution, regulation, management, and operation of liquor and gaming across the province. SLGA’s warehouses distribute wine, spirits and domestic and imported beer to SLGA stores and franchises for sale to the public and permittees. Most mainstream beer is distributed by Brewer’s Distribution Ltd. to retail liquor stores, some franchises, and commercial permittees. SLGA owns and operates all video lottery terminals and owns and manages the slot machines at all Saskatchewan Indian Gaming Authority casinos. SLGA also licenses and regulates most forms of gaming including bingo, raffles, casinos, breakopen tickets and horse racing.
Saskatchewan Research Council (SRC)
SRC was established in 1947. SRC undertakes matters pertaining to research, development, design, consultation, innovation and commercialization of science for the betterment of the province. SRC creates wealth through the responsible application of science and technology to assist Saskatchewan industry to be globally competitive.
90 Budget 2012-13 | Budget Summary
Saskatchewan Student Aid Fund
The Saskatchewan Student Aid Fund operates under the authority of The Student Assistance and Student Aid Fund Act, 1985. The fund’s primary purpose is to support the Saskatchewan Student Assistance Program.
Saskatchewan Watershed Authority (SWA)
SWA is the province’s lead water management agency and is mandated to manage the water supply for social, economic and environmental needs; protect the quality of surface and ground water; reduce damage from flooding; develop, own and manage the province’s water management infrastructure; collect and analyze data; and provide information to support water management and use.
Crown Investments Corporation Board Organizations
Crown Investments Corporation of Saskatchewan (CIC)
CIC is the financially self-sufficient holding company for 10 subsidiary commercial Crown corporations. The Government Finance Office (GFO) was established in 1947 to act as a holding company for many of Saskatchewan’s Crown corporations and be a mechanism for developing broad policy control – directing investment and routing dividends into the Government’s consolidated fund. In 1978, the GFO was renamed Crown Investments Corporation of Saskatchewan, with a focus on the delivery of strategic shareholder direction and contribution to the province’s economic success. The Crown Corporations Act, 1993, is the current governing legislation.
Crown Investments Corporation Asset Management Inc.
Effective September 10, 2009, Investment Saskatchewan was de-designated as a Crown corporation and continues to operate as CIC Asset Management Inc., with CIC as sole shareholder. The Corporation’s mandate is to prudently manage and divest the portfolio of investments previously managed by Investment Saskatchewan.
Information Services Corporation (ISC)
ISC is responsible for the administration of land titles, geographic information systems, vital statistics, surveys, mapping and interests in personal property, and corporate registration services. ISC was established on January 1, 2000, as a wholly-owned subsidiary of CIC and provides customer-focused services such as the Land Registry, Saskatchewan Personal Property Registry, Survey Plan Registry, Vital Statistics Registry, Corporate Registry, and Geomatics Services.
SaskEnergy Incorporated (SaskEnergy)
Saskatchewan’s provincially-owned natural gas system began operations in 1952 as part of Saskatchewan Power Corporation (SaskPower). SaskEnergy, a wholly-owned subsidiary of CIC, was formed in 1988 as a separate corporation to continue providing natural gas transmission and distribution services across the province. The system has grown substantially over the years, with service now extended to more than 90 per cent of Saskatchewan communities. Today, SaskEnergy provides safe, reliable and economical natural gas service to more than 355,000 residential, farm, commercial and industrial customers in the province.
Budget Summary | Budget 2012-13 91
Saskatchewan Gaming Corporation (SaskGaming)
SaskGaming was established by The Saskatchewan Gaming Corporation Act, 1994 to operate Casino Regina and Casino Moose Jaw under a framework agreement that provides for sharing of net profits between the Government, the First Nations Trust, and the Community Initiatives Fund. Casino Regina opened in January 1996, and Casino Moose Jaw opened in September 2002. Legislation was amended in 2007 to effectively place SaskGaming under the management of the CIC Board as a wholly-owned CIC subsidiary.
Saskatchewan Government Insurance (SGI)
SGI was established in 1945 to provide affordable, quality insurance to Saskatchewan people. Under the trade name SGI CANADA, which is a wholly-owned subsidiary of CIC, it conducts a competitive property and casualty insurance business in seven Canadian provinces. It offers a comprehensive line of home, tenant, farm, automobile extension and commercial coverage.
Saskatchewan Opportunities Corporation (SOCO)
Established in 1994, SOCO is a wholly-owned subsidiary of CIC. SOCO supports the growth and success of Saskatchewan’s technology sector through the operation of research parks at the province’s two universities in Saskatoon and Regina, and at a building in downtown Prince Albert. SOCO operates under the brand name Innovation Place.
Saskatchewan Power Corporation (SaskPower)
SaskPower, a wholly-owned subsidiary of CIC, was established as the Saskatchewan Power Commission in 1929. Its purpose was to provide safe, reliable, cost-effective power to Saskatchewan people. Today, SaskPower maintains this purpose and is the principal supplier of electricity to more than 480,000 residential, farm, commercial, oilfield, power and reseller customers in Saskatchewan.
Saskatchewan Telecommunications (SaskTel) Holding Company
SaskTel, a wholly-owned subsidiary of CIC, was established as the Department of Railway, Telephones and Telegraphs in 1908. SaskTel is the leading full-service provider in Saskatchewan of voice, cellular, data, text, messaging, dial-up and high-speed internet, web hosting, multimedia, entertainment, and security services.
Saskatchewan Transportation Company (STC)
STC is a wholly-owned subsidiary of CIC and has been providing passenger transportation, parcel express and freight services throughout Saskatchewan since 1946. The bus company was established to ensure as many communities as possible have access to reasonably priced transportation. Today, STC and its network of 197 agencies operate 27 bus routes serving 290 communities in the province. STC’s connections with partner carriers extend service to nearly 400 communities.
92 Budget 2012-13 | Budget Summary
Saskatchewan Water Corporation (SaskWater)
SaskWater, a wholly-owned subsidiary of CIC, was established in 1984. Headquartered in Moose Jaw, SaskWater designs, builds, owns and operates water supply and wastewater systems, providing quality water to Saskatchewan industries, municipalities, First Nations and rural water user groups.
Not-For-Profit Insurance Organizations
Saskatchewan Auto Fund
Administered by SGI, the Auto Fund is the province’s compulsory auto insurance program and the provider of its driver licensing and vehicle registration system. The fund does not receive money from or provide money to the Province.
Saskatchewan Crop Insurance Corporation (SCIC)
SCIC operates under the authority of The Crop Insurance Act and The Farm Financial Stability Act. SCIC administers insurance programs which protect producers from production failures due to natural hazards. SCIC also delivers wildlife damage prevention and compensation programs, as well as the AgriStability Program.
Crop Reinsurance Fund of Saskatchewan
The Crop Reinsurance Fund provides SCIC with reinsurance coverage against losses in excess of net premiums, indemnities and accumulated reserves. Reinsurance for the Saskatchewan crop insurance program is provided by the federal and provincial governments under terms of the Canada-Saskatchewan Production Insurance Agreement. Payments are made from each government’s reinsurance fund, based on a formula set out in the agreement, and each is responsible for the accumulated deficits of its fund.
Workers’ Compensation Board (WCB)
Established in 1930, the WCB is a no-fault insurance program that protects workers and employers from the results of work injuries. The WCB collects annual premiums from employers and uses those funds to compensate injured workers for lost income and expenses with the objective of returning them to safe, productive work as soon as medically possible. Further, the WCB seeks to develop and deliver injury prevention programs and services with the goal of eliminating workplace injuries.
Budget Summary | Budget 2012-13 93

