| | The Honourable Ken Krawetz Deputy Premier Minister of Finance | |
| | | |
| | SASKATCHEWAN PROVINCIAL BUDGET | |
| | 13-14 | |
| | | |
| | BALANCED GROWTH | |
| | BUDGET SUMMARY | |
I am pleased to table the 2013-14 Budget and supporting documents for public discussion and review.
As we release our government’s sixth budget, Saskatchewan’s economy is strong and more people are living here than ever before.
PLAN FOR GROWTH
Last fall, our Premier released the Saskatchewan Plan for Growth which set a bold goal – 1.2 million people living in Saskatchewan by 2020. That’s a goal that would have seemed unimaginable a decade ago. Today, we are right on track to meet that goal.
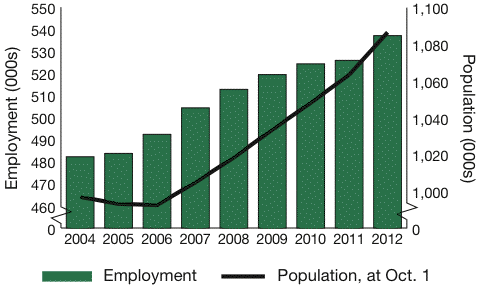
The Growth Plan also set a goal of 60,000 more people working in Saskatchewan by 2020, and we’re on track to meet that as well. Our province’s strong economy and our entrepreneurs are creating new jobs. Employment last month was up more than 24,000 from a year ago.
But the Growth Plan is not about growth for the sake of growth. It’s about improving the quality of life for all Saskatchewan people.
BALANCED GROWTH
The Growth Plan and the 2013-14 Budget are all about balanced growth. Not only balancing the books, but also balancing the priorities of Saskatchewan people. Not only continuing to grow, but also meeting the challenges of growth. Not only providing opportunity, but also ensuring we protect those in our province who need our help.
This year’s budget is balanced in the General Revenue Fund, and it is balanced in the Summary Financial Statements. And it’s balanced in other ways as well.
It is a budget that balances economic progress with social progress. It is a budget that balances the need to control spending while meeting the challenges of growth – making key investments aimed at ensuring a better quality of life for all the people of our province.
BUDGET HIGHLIGHTS
A key area of investment is helping the most vulnerable people in our province.
This budget increases support benefits for low-income seniors under the Seniors Income Plan and for people with disabilities under the Saskatchewan Assured Income for Disability program. It also doubles capital funding for paratransit buses and increases transit assistance for people with disabilities. This budget also increases funding for women’s shelters that have expanded in Regina and Prince Albert, and funds a new transition house in Melfort – the first new transition house in Saskatchewan since 1989.
Other budget highlights include a $131.8 million increase in base operating funding for Regional Health Authorities, as well as $264.4 million (a $27.0 million or 11.4 per cent increase) for municipal revenue sharing, part of $362 million in overall direct provincial support to municipalities.
This budget also provides $20.2 million to support 15 new PreK programs (for a total of 301 programs), a $17.0 million increase to support forecasted school enrolment increases, a $14.3 million increase in post-secondary base operating grants, and $117.4 million in direct student supports.
This year, we are providing $198.3 million for Crop Insurance, a record budget.
Overall, this budget provides $184.8 million ($10.8 million more) in targeted funding from government ministries for initiatives that will benefit First Nations and Métis people, including $3 million directed specifically to address future recommendations of the Joint Task Force on Improving Education and Employment Outcomes.
We are providing $119.6 million (an increase of $7.2 million or 6.4 per cent) for school capital projects, and $10.0 million through Saskatchewan Housing Corporation to begin construction of a new student residence at the University of Regina.
And this budget provides $576 million in highways and transportation funding as part of our government’s four-year, $2.2 billion commitment.
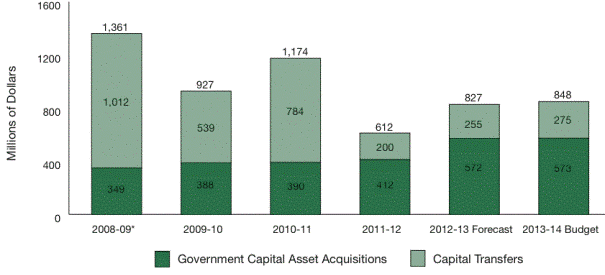
Overall, the government will invest $847.5 million in infrastructure projects this year – an increase of $59.8 million or 7.6 per cent, and the highest amount budgeted for capital since 2009-10. The capital budget includes key investments in schools, health care facilities including hospitals and long-term care facilities, post-secondary institutions, roads, highways and municipal infrastructure.
This budget not only balances the books, it balances the priorities of Saskatchewan people. It controls spending while making key investments. It promotes opportunity while protecting those in our province who need help. It ensures Saskatchewan will continue to grow while meeting the challenges of that growth. And it keeps Saskatchewan moving forward.
/s/ Ken Krawetz
Honourable Ken Krawetz
Minister of Finance
TABLE OF CONTENTS
MINISTER’S MESSAGE | | | |
GOVERNMENT DIRECTION FOR 2013-14 | | | 6 | |
| TECHNICAL PAPERS | | | | |
| The Saskatchewan Economy | | | 27 | |
| General Revenue Fund Financial Outlook | | | 37 | |
| General Revenue Fund 2012-13 Financial Update | | | 49 | |
| Growth and Financial Security Fund | | | 50 | |
| Debt Retirement Fund | | | 52 | |
| 2013-14 Borrowing and Debt | | | 53 | |
| Saskatchewan’s Tax Expenditures | | | 58 | |
| 2013 Intercity Comparison of Taxes, Utilities and Housing | | | 62 | |
| 2013-14 Revenue Initiatives | | | 69 | |
| Improving Saskatchewan’s Retirement Income System | | | 71 | |
GENERAL REVENUE FUND (GRF) FINANCIAL TABLES | | | | |
| GRF – Statement of Operations and Accumulated Deficit | | | 76 | |
| GRF – Statement of Change in Net Debt | | | 76 | |
| GRF – Statement of Cash Flow | | | 77 | |
| GRF – Schedule of Revenue | | | 78 | |
| GRF – Schedule of Expense | | | 79 | |
| GRF – Schedule of Borrowing Requirements | | | 80 | |
| GRF – Schedule of Debt | | | 81 | |
| GRF – Schedule of Guaranteed Debt | | | 82 | |
SUMMARY FINANCIAL STATEMENT (SFS) FINANCIAL TABLES | | | | |
| Summary Statement of Surplus | | | 84 | |
| Summary Statement of Accumulated Surplus | | | 85 | |
| Summary Statement of Change in Net Debt | | | 86 | |
| Summary Schedule of Pension Liabilities | | | 86 | |
| Summary Schedule of Tangible Capital Assets | | | 87 | |
| Summary Schedule of Debt | | | 88 | |
| Notes to the Summary Financial Budget | | | 89 | |
| | | |
| | | |
| | SASKATCHEWAN PROVINCIAL BUDGET | |
| | 13-14 | |
| | | |
| GOVERNMENT DIRECTION FOR 2013-14 |
Government Direction for 2013-14:
BALANCED GROWTH
| | VISION – Saskatchewan will be the best place in Canada – to live, to work, to start a business, to get an education, to raise a family and to build a life. The Government has identified four goals to set direction for the province: | |
| | ● | Sustaining growth and opportunities for Saskatchewan people | |
| | ● | Improving our quality of life | |
| | ● | Making life more affordable | |
| | ● | Delivering responsive and responsible government | |
In the fall of 2012, the Government released its Plan for Growth, Vision 2020 and Beyond. This plan set forth a long-term and strategic vision that will secure the ongoing prosperity for Saskatchewan residents. It builds on our economic strengths, with the goal of becoming a province of 1.2 million people by 2020.
The 2013-14 Budget moves forward on that Plan for Growth, taking the first steps to foster economic growth and address the associated challenges of growth. It commits to a plan of balanced growth, taking a long-term and careful approach that invests in developing a skilled labour force and necessary infrastructure, ensuring Saskatchewan can compete for investment and trade while maintaining a balanced budget and fiscal sustainability.
This plan translates into tangible benefits for the people of the province, through innovation, increasing job opportunities, better education and health care and enhancing our quality of life.
A STRONG AND GROWING ECONOMY
SASKATCHEWAN EMPLOYMENT
AND POPULATION
| | Source: Statistics Canada |
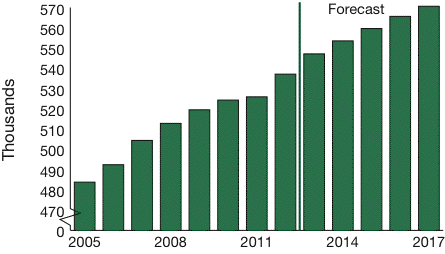
| | Saskatchewan – Lowest Unemployment Rate in Canada Government of Saskatchewan News Release – March 8, 2013 Saskatchewan had the lowest unemployment rate in Canada in February 2013, at 3.8 per cent (seasonally adjusted), the lowest since November 2008 when it was 3.7 per cent and well below the national rate of 7.0 per cent. Job numbers continued to climb in February, up 24,400 to 546,200 jobs, the most ever for the month of February (seasonally unadjusted). Jobs were up by 4.7 per cent in February 2013 over last February, the second-highest among Canadian provinces. | |
6 Budget 2013/14 | Budget Summary
| | “… 2013 is looking like another outstanding year for the Saskatchewan economy with job increases leading the way,” Economy Minister Bill Boyd said. “… we will continue with initiatives that will make sure people of our province are able to fill those opportunities.” Full-time employment was up by 21,400 and part-time jobs increased by 3,000 on a year-over-year basis. Regina had the lowest unemployment rate among major Canadian cities; Saskatoon had the fourth lowest. The youth unemployment rate was 9.2 per cent, the lowest among the provinces and below the national rate of 13.6 per cent. Off-reserve Aboriginal employment was up by 800 from February last year. | |
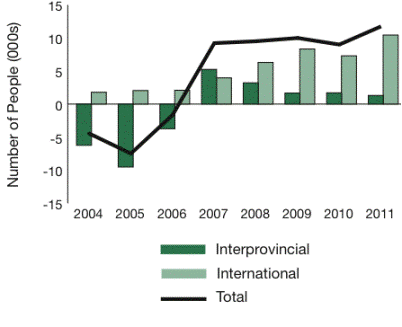
Saskatchewan’s economic indicators are showing positive results. Immigration to the province is on the rise.
NET MIGRATION
| | Source: Statistics Canada |
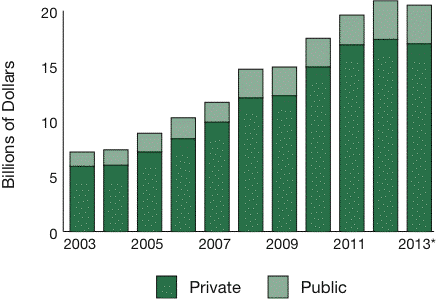
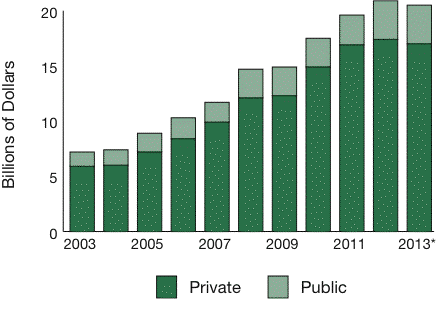
Private capital investment still remains the largest component of investment in Saskatchewan. Intentions forecasted for 2013 are down slightly from the record level set in 2012.
PRIVATE/PUBLIC CAPITAL INVESTMENT
| | Source: Statistics Canada |
FISCAL RESPONSIBILITY
The cornerstone of the Plan for Growth is fiscal responsibility. A secure and stable economic base and sound decision-making is paramount to further growth and shared prosperity.
Having a balanced budget is a priority. This is not the case in many jurisdictions. Other governments are choosing a different course of action: running deficits and increasing debt levels, which places increased risk on their future and on future generations.
Saskatchewan’s 2013-14 Budget is balanced. It has a General Revenue Fund pre-transfer surplus of $64.8 million, a Summary Financial Statements surplus of $149.8 million, and the Growth and Financial Security Fund is forecast to have a balance of $695.1 million.
Budget Summary | Budget 2013/14 7
It is balanced in many ways – our revenue sources are varied and diverse. Spending is focused on priority investments and debt reduction will continue over the longer term. Tax reductions to further improve Saskatchewan’s competitiveness for investment and workers will be introduced as it is sustainable to do so.
In order to achieve balanced budgets now and in the future, the Government has committed to modest expenditure growth – holding the line on expenses and finding further opportunities for efficiencies and savings.
Last year’s budget published a four-year plan with forecasted growth in expenses at 4.0 per cent in 2013-14. Spending will be lower than 4.0 per cent as the Government chooses a more fiscally prudent path. The long-term expenditure plan has been revised downward to 3.0 per cent in each of the next three years.
FOUR-YEAR FISCAL PLAN
| | 2013-14 | | | | 2014-15 | | | | 2015-16 | | | | 2016-17 | |
| | 3.1% | | | | 3.0% | | | | 3.0% | | | | 3.0% | |
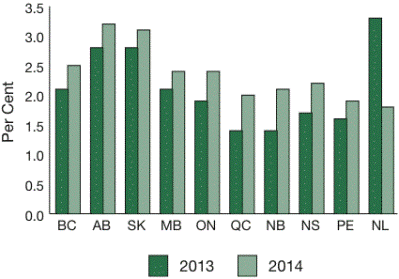
Real Gross Domestic Product (GDP) is forecast to grow at 2.6 per cent in 2013 and 3.1 per cent in 2014.
PRIVATE SECTOR FORECASTS OF REAL GDP GROWTH, 2013 AND 2014
| | Source: Private sector forecasts of growth in Real Gross Domestic Product (GDP), as of March 8, 2013 |
Keeping spending in line requires innovation to find better ways of delivering necessary services and fiscal discipline to ensure program costs are contained.
Saskatchewan’s record of holding the line on its expenditures and fostering economic growth is recognized by credit rating agencies as a symbol of fiscal strength and sustainability. Saskatchewan has earned one of the highest credit ratings in Canada and therefore in North America.
GOVERNMENT CREDIT RATINGS
| Jurisdiction | Moody’s | | Standard & Poor’s | | | DBRS | |
| BC | Aaa* | | AAA | | | AA(high) | |
| AB | Aaa | | AAA | | | AAA | |
| SK | Aa1** | | AAA | | | AA | |
| MB | Aa1 | | AA | | | A(high) | |
| ON | Aa2 | | AA-* | | | AA(low) | |
| QC | Aa2 | | A+ | | | A(high) | |
| NB | Aa2 | | A+ | | | A(high) | |
| NS | Aa2 | | A+ | | | A** | |
| PE | Aa2 | | A | | | A(low) | |
| NL | Aa2 | | A+ | | | A | |
| CA | Aaa | | AAA | | | AAA | |
| | Credit ratings as of December 12, 2012 |
Balanced growth necessitates a series of choices on spending, revenue and debt to ensure Saskatchewan captures future economic opportunities that contribute to a better quality of life for all Saskatchewan people.
Maintaining a balanced budget while addressing the pressures that come from growth can be challenging. Government is committed to keeping taxes as low as possible and is not imposing an increase on the Education Property Tax. In order
8 Budget 2013/14 | Budget Summary
to offset the 67 per cent increase in overall property values as a result of the growing economy and reassessment, the Government will lower education property tax mill rates significantly for all classes of property so that education property tax mill rates are revenue neutral with respect to the 2013 reassessment.
While revenue from education property taxes may increase, this is due to growth in the base of properties, not increases in the tax rate. Individual taxpayers will see increases and decreases in property tax levied as a result of reassessment, but these changes will not be due to education property tax changes by the provincial government.
Education property tax mill rates will be lowered to 2.67 mills for agricultural land and 5.03 mills for residential properties. Commercial properties will now have a single mill rate, instead of three tiers. The rates will be lowered to 8.28 mills for commercial/industrial businesses and to 11.04 mills for a new resources class.
EDUCATION PROPERTY TAX MILL RATES
| | 2012* | | 2013 | |
| Agriculture | 3.91 | | 2.67 | |
| Residential | 9.51 | | 5.03 | |
| Commercial/Industrial | 12.25 14.75 18.55 | | 8.28 | |
| Resources | 12.25 14.75 18.55 | | 11.04 | |
| | * | In 2012, the commercial class was composed of three tiers – 12.25 mills for taxable assessment under $500,000, 14.75 mills between $500,000 |
| | to $6.0 million and 18.55 mills over $6.0 million. |
As part of a balanced approach, the Government has determined that the increasing profits from some Crown corporations should be shared with Saskatchewan people and will take a CIC dividend, excluding SaskPower, of $180.0 million.
Government has committed in the Plan for Growth to reduce the general Corporate Income Tax rate from its current rate of 12 per cent to 10 per cent by 2015. While the commitment to reducing this rate is assured, the start of this reduction is deferred until it is deemed sustainable to do so.
Steady debt reduction over the long term is a priority of the Saskatchewan Government, a responsible thing to do and an effective way to manage government resources. Reduced debt means savings in the interest paid to service that debt and leaves more funds available to provide programs and services.
Since 2008, the Saskatchewan Government has paid off $3 billion of debt, resulting in cumulative savings of $600 million in interest payments.
The debt reduction plan will continue as outlined in the Plan for Growth, cutting the provincial debt in half from its level in 2007 by the year 2017.
The debt to Gross Domestic Product (GDP) ratio is declining steadily and ranks among the best in Canada.
SASKATCHEWAN GOVERNMENT DEBT TO GDP RATIO
Source: | Saskatchewan Public Accounts and Saskatchewan Provincial Economic Accounts |
Budget Summary | Budget 2013/14 9
GOVERNMENT DEBT TO GDP RATIO – ACROSS CANADA, 2013
| Source: | DBRS; Statistics Canada; Conference Board of Canada as of March 31, 2013 |
The budget introduces an increase in tobacco taxes and adjusts liquor mark-ups to contribute to a balanced budget. Adjustments to certain tax expenditures are also being introduced to better align with provincial priorities, including a reduction in the Saskatchewan Resource Credit by a quarter point.
An Efficient Public Service – Leading By Example
In the 2010-11 Budget, the Government announced a plan “to reduce the size of the public service by 15 per cent at the end of four years … achieved primarily through attrition and vacancy management.”
The Government also committed to monitor the size of the public service in relation to the population and to report on progress every year.
This budget announces that the Government is on track to meet these commitments.
| ● | The 2013-14 Budget includes 10,945.6 full-time equivalents (FTEs), a reduction of 472.1 FTEs (4.1 per cent) from 2012-13; and, |
| ● | The net reduction is comprised of a gross 600.0 FTE reduction, offset by 127.9 new FTEs. |
The 600.0 FTE reduction satisfies the fourth and final year of the Workforce Adjustment Strategy (WAS), bringing the total four-year savings to 1,909.0 FTEs, 15 per cent of the 2009-10 FTE base. These changes are expected to result in annualized savings of more than $16 million. Combined with prior years’ savings, this brings annualized cumulative savings to $198 million.
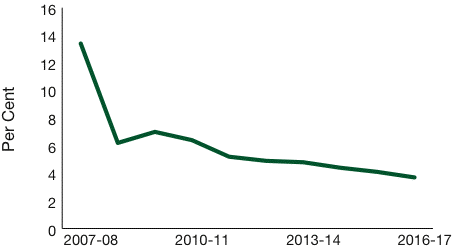
When compared to the 2007-08 baseline year, the public service has diminished as a percentage of the population each consecutive year.
PUBLIC SERVICE AS A PERCENTAGE OF POPULATION
| Source: | Saskatchewan Ministry of Finance Plan for 2013-14 |
A lot of hard work has been done through workforce adjustment strategies, through LEAN process improvements and through innovation.
The Government will continue to lead by example, by making program review a standard businesspractice to enhance the decision-making process and to achieve better outcomes. Government is encouraging ministries to continually examine programs and services to determine if they are making the best use of taxpayers’ money. All government delivery agents will be looking for innovative ways to maximize valuable resources and to question if there are better ways to achieve the outcomes that are expected by the people of Saskatchewan.
10 Budget 2013/14 | Budget Summary
QUALITY OF LIFE
The Plan for Growth outlined that the Government does not seek growth for the sake of growth but growth to support a better quality of life for the people of Saskatchewan.
A strong quality of life means having access to good health care and support when we need it most, quality education for our children and young adults, access to safe shelter, and thriving, beautiful environments that offer opportunities to enjoy our culture, music, sports and the arts.
Health
A high quality of life includes a stable and accessible health care system. Investments continue to be made to support greater services, to find efficient ways of delivering those services, and to reduce wait times for patients.
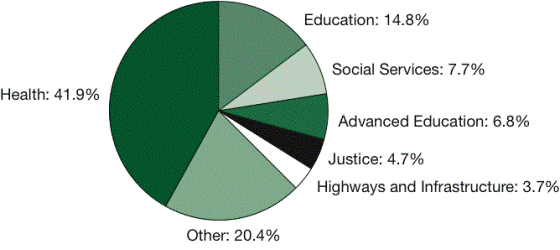
A record $4.84 billion investment in health care for 2013-14 will help improve the quality of life for Saskatchewan people.
The investment marks a $162 million or 3.5 per cent increase over last year’s health budget. In total, government’s investment in health care has increased $1.4 billion or 41 per cent over the past six years, demonstrating its commitment to improving health care for residents.
Regional Health Authorities will receive base operating funding of $3.0 billion in 2013-14, an increase of $131.8 million or 4.5 per cent over last year. This investment includes $29 million to recognize health pressures related to demographic growth, resulting from Saskatchewan’s improved economy and increased population.
The Saskatchewan Cancer Agency will receive $150.7 million to provide enhanced cancer care services, an $11.9 million or 8.6 per cent increase over last year. Total funding increased by $72 million representing a 92 per cent increase over the past six years.
The Saskatchewan Surgical Initiative will receive $70.5 million in 2013-14, an increase of $10 million or 16.5 per cent, to provide a projected 7,000 additional surgeries over last year and continue progress toward the goal of reducing wait times to no more than three months. A total of $186 million will have been provided to the initiative since it began in 2010.
Several other new investments are being made to bolster health services for Saskatchewan, including:
| ● | $9.8 million (an increase of $4.3 million) for innovative approaches to improve access to primary health care, including the introduction of Collaborative Emergency Centres (CECs), to improve health services for Saskatchewan people. CECs are designed to enhance access to high quality, comprehensive primary health care that is capable of dealing with unexpected illness or injury in a timely fashion; |
| $3.0 million (increase of $1.5 million) to support the implementation of a 20 rural physician locum pool that will enhance patient access to physician care (locum physicians temporarily fulfill the duties of physicians who are away from their practice); |
| $18.1 million (increase of $2.3 million) to support training seats as well as recruitment of physicians. This includes new funding of $250,000 for the Rural Family Physician Recruitment Incentive Program; |
| $2.0 million for a new Home First/Quick Response Home Care two-year pilot for seniors in the Regina Qu’Appelle Health Region. This program helps prevent avoidable hospital admissions, facilitates earlier hospital discharge |
Budget Summary | Budget 2013/14 11
and provides crisis intervention in the community. The program may include such things as: short-term case management, medication management, skin and wound care, mobility aids, rehabilitation, and other support; and,
| $400,000 (increase of $350,000) for expansion of the Alzheimer Society’s First Link program to four additional sites (North Battleford, Swift Current, Estevan, and Prince Albert), as well as to establish six dementia advisory networks, to improve the system of care and support for people with dementia, their families and caregivers. |
The largest portion of the Government’s investment in health – 70 per cent of the 2013-14 Health budget – goes towards paying health care workers. Further, recognizing overall that about 42 cents of every dollar spent by government goes to health care, the health system as a whole is also focussed on efficiencies and sustainability.
Regional Health Authorities and the Saskatchewan Cancer Agency have been tasked with finding $53.9 million in efficiencies in 2013-14. This will be realized through administrative savings and other efficiencies, increased use of shared services co-ordinated through 3sHealth, as well as through attendance management and efforts to reduce lost time due to injuries, premium pay and sick time.
Initiatives to lower prices on generic drugs are estimated to save over $20 million in 2013-14. This is a combination of savings from new lower prices being implemented in April 2013 for selected generic drugs, as well as savings from Saskatchewan’s generic pricing strategy which has significantly lowered generic drug prices in Saskatchewan since 2011.
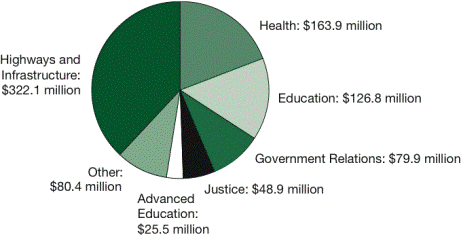
Funding is also being dedicated to support the construction and up-keep of health care facilities in the province. Capital investments total $163.9 million, of which $121.0 million is in the form of government-owned capital and $42.9 million is third party capital:
| $50.0 million for the Moose Jaw Union Hospital replacement; |
| $70.6 million for co-owned long-term care (LTC) facility funding in Biggar, Kelvington, Kerrobert, Kipling, Maple Creek and Prince Albert; |
| $15.9 million for Regional Health Authority (RHA) owned LTC facilities in Radville, Redvers, Rosetown, Shellbrook and Tisdale; |
| $14.7 million for life safety and emergency repairs; |
| $11.0 million for diagnostic, medical/surgical and other equipment; |
| $1.3 million for helipad development at the Regina General Hospital; and, |
| $0.4 million for provincial laboratory machinery and equipment. |
Increased Support for People with Disabilities
The Plan for Growth set a goal of making Saskatchewan the best place in Canada for people with disabilities.
The budget includes $330.0 million, an increase of $18.0 million for new or enhanced programming and increased program utilization for people with disabilities. Since 2007-08, government funding benefitting people with disabilities has increased by $126.8 million or 62.4 per cent.
This funding includes a $2.5 million increase for Saskatchewan Aids to Independent Living to maintain benefits for people with long-term disabilities or illnesses. This program provides supports such as prosthetics, rehabilitation/mobility equipment, oxygen, and insulin pumps for children.
12 Budget 2013/14 | Budget Summary
The budget for the Ministry of Health includes an increase of $600,000 to support the annualized cost of three storefront projects in Saskatoon, Regina, and Prince Albert to provide intensive Fetal Alcohol Spectrum Disorder (FASD) prevention programming to pregnant women at high-risk of having a child with FASD.
The Government Relations budget provides an increase of $325,000 to the Transit Assistance for Disabled program. Total funding of $3.5 million allows the program to expand to additional municipalities and doubles the capital grants available for paratransit buses.
At $112.3 million, the budget for Saskatchewan Assured Income for Disability (SAID) will allow for benefit increases committed to in 2011. In June 2012, the first installment of a four-year commitment was implemented, increasing benefits by $100 per month for people in residential care and by $350 and $400 per month for single individuals and couples, respectively, who live in independent arrangements.
This coming June, the Ministry of Social Services will implement the second installment of these planned increases. Benefit increases which began in June 2012 and end in June 2015 are as follows:
| Single Individuals: Benefits will increase by $50/month this year, $350/month over four years; |
| Couples: Benefits will increase by $60/month this year, $400/month over four years; and, |
| Persons in Residential Care: Benefits will increase by $20/month this year, $100/month over four years. |
Government is committing $12.3 million to assist CBOs to recruit and retain front-line staff and to increase level of care allowances in Approved Private Service Homes. These facilities provide care 24/7 for people with intellectual disabilities.
The goal of eliminating the 440 waitlist for individuals with intellectual disabilities waiting for group home spaces has been met. Spaces have also been found for 139 more individuals including 20 to be added this year. Capital funding of $1.0 million will place another 20 emerging needs clients in spaces and specialized programs.
Year one capital funding of $5.0 million is being provided for Valley View Centre replacement initiatives.
Supports to the Most Vulnerable
The Ministry of Social Services is receiving funding increases to help support the province’s most vulnerable people:
| a $21.9 million increase is being provided in the Saskatchewan Assistance Program (SAP), total funding of $180.8 million, as clients with significant and enduring disabilities enrolled more slowly than anticipated in SAID and to adjust shelter allowances to respond to increases in rent costs and other inflationary pressures such as utilities; and, |
| a $3.8 million increase, $34.4 million total, to the Saskatchewan Rental Housing Supplement, as more households access the program and to keep pace with increases in the cost of rent. |
The following programs will receive decreased funding due to lower utilization, perhaps an indicator of a growing economy and increased opportunity to find employment:
| a $4.2 million decrease in Transitional Employment Allowance (TEA) funding to account for lower utilization ($17.6 million total funding); and, |
| a $3.1 million utilization decrease for the Saskatchewan Employment Supplement (SES), Saskatchewan Child Benefit (SCB) and Child Care Parent Subsidies (CCPS), total funding of $36.3 million. |
Budget Summary | Budget 2013/14 13
Child and Family Services CBOs will receive $76.1 million, a $6.7 million increase, including:
| a $6.7 million annualized CBO Recruitment and Retention salary funding lift for 24/7 care homes; |
| $800,000 for intensive home supports and the “Triple P Parenting” education program; and, |
| $374,000 for a salary lift for the remaining CBOs, offset by a $1.2 million reduction for one-time capital as new spaces are not required due to declining caseload. |
The Seniors Income Plan (SIP) will see a $3.2 million increase, total funding of $27.4 million, due to a modest utilization increase and to implement year two of the increased SIP benefit. Seniors will receive a $10 per month increase in July 2013 on top of the increase provided in 2012. Clients living in special care homes will also receive a benefit increase of up to $25/month, doubling that received previously.
The Seniors Personal Care Home Benefit will receive $3.4 million, an increase of $400,000, to increase the senior’s income threshold from $1,800/month to $1,875/month.
Affordable Housing
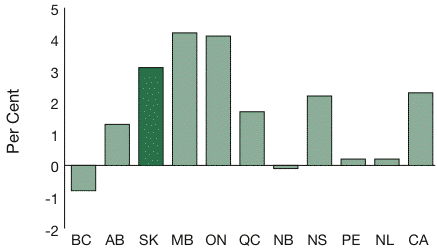
Funding is being provided to increase the supply of housing in growing communities and to make housing more affordable.
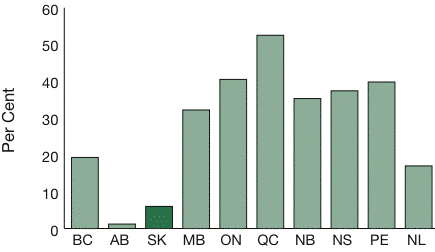
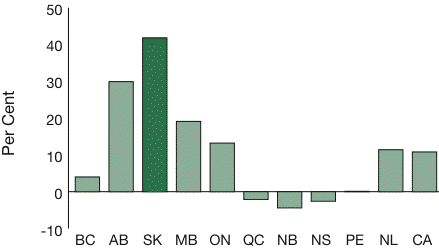
GROWTH IN HOUSING STARTS, 2012
| Source: | Statistics Canada |
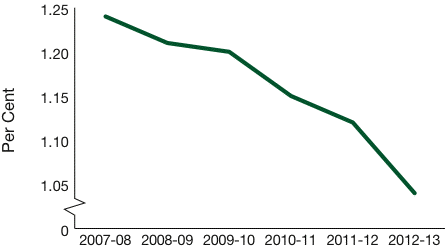
GROWTH IN HOUSING PRICE INDEX, 2012
| Source: | Statistics Canada |
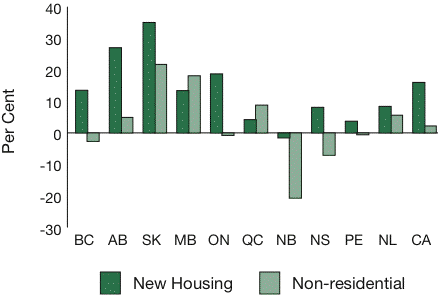
GROWTH IN INVESTMENT IN NEW HOUSING AND NON-RESIDENTIAL BUILDING CONSTRUCTION, 2012
| Source: | Statistics Canada |
The 2013-14 Budget continues the Province’s commitment to the Saskatchewan Advantage Housing Plan, which will invest $344.0 million in 12,600 new housing units around the province by 2016.
This funding also includes $9.2 million for the third year of a three-year federal/provincial Affordable Housing Agreement which is used to increase the supply of new affordable housing, home renovations, home adaptations, and to provide rent/housing supplements.
14 Budget 2013/14 | Budget Summary
To help stimulate home ownership and the development of new housing, $7.2 million, an increase of $3.5 million, is provided for the Rental Construction Incentive (RCI) for new rental housing and for the Affordable Homeownership Program (AHOP). These programs provide an incentive to property developers and municipalities to provide matching grants and provide assistance to homeowners with the purchase of a new principle residence.
The assistance provided to Habitat for Humanity will be doubled, from $1.0 million last year to $2.0 million in 2013-14. This funding will support the development of another 40 homeowner units across the province.
In addition, the Province will invest $10 million in a proposed new 605-bed student residence at the University of Regina. In conjunction with Advanced Education, this initiative will significantly increase the supply of housing in Regina while having a positive impact on the post-secondary education system in southern Saskatchewan.
Safety and Security
The Justice expense budget is $542.0 million, an increase of $27.1 million or 5.3 per cent from the restated 2012-13 Budget, which will help to fund important initiatives to increase the safety and security of people in this province.
An increase of $800,000 is being provided for women’s shelters across the province. Total funding of $7.6 million includes increased operating funding for a new transition house in Melfort and existing facilities in Regina and Prince Albert, that have already expanded. The Saskatchewan Housing Corporation will be sharing construction costs of the new shelter in Melfort, the first new shelter built in the province since 1989, with the federal government and the local community.
The budget also provides:
| $9.6 million in capital/operating funding and 92.1 FTEs to complete and open the new women’s 30-cell residential unit at Pine Grove Provincial Correctional Centre (PGPCC); |
| $1.8 million and 8.5 FTE increase ($3.9 million total) to annualize the commitments to the Serious Violent Offender Initiative ($3.3 million total) and the Money Judgement Enforcement ($0.6 million total) Programs; |
| $6.6 million increase for the RCMP grant ($168.1 million total); |
| $600,000 to increase Municipal Policing Grants; |
| $1.6 million in capital/operating funding and 2.4 FTEs to expand video court capacity across the province; and, |
| Funding to process photo radar tickets as part of the Throne Speech commitment to implement photo radar in roadway construction zones. |
The 2013-14 Budget includes an increase of $700,000 ($1.2 million total) for Building Partnerships to Reduce Crime, an interagency approach to crime prevention following the Community Mobilization – Prince Albert (CMPA) model. CMPA builds safer and healthier environments for individuals, families, neighborhoods, businesses, schools and the overall community through the prevention and suppression of crime and violence, the reduction of victimization, and the integrated treatment of the conditions that give rise to both.
The Justice budget includes $45.4 million for ongoing and new capital projects, including:
| $15.0 million to continue the Saskatoon Queen’s Bench (QB) Courthouse addition; |
| $13.0 million to continue the 72-cell addition at Prince Albert Provincial Correctional Centre; |
Budget Summary | Budget 2013/14 15
| $2.0 million in new funding for a southern Saskatchewan women’s remand centre located in the Paul Dojack Youth Centre, as a result of the relocation of the Regina RCMP F Division building to Emerald Park; |
| $1.9 million in new funding to renovate the third floor of the Saskatoon Provincial Courthouse to address crowding, security and occupational health and safety concerns; |
| $7.8 million ($9.8 million total in Justice and the Ministry of Central Services) to continue development of the Criminal Justice Information System; and, |
| $1.4 million to continue piloting of Staff Scheduling Software at the Regina Provincial Correctional Centre and to begin detailed planning of upgrades to the Public Prosecutions Case Management System. |
Parks and Culture, and the Environment
A good quality of life also includes the enjoyment of beautiful spaces, culture, heritage, the arts, sports and music. Government funding is helping to support a number of significant events taking place across Saskatchewan in 2013-14, including:
| The Junos – Canada’s music awards; |
| The Canadian Hockey League’s Memorial Cup; and, |
| The Canadian Football League’s Grey Cup game. |
For 2013-14, the Ministry of Parks, Culture and Sport will have an expense budget of $104.8 million, an increase of $8.5 million or 8.8 per cent. This includes:
| $5 million to the new Creative Saskatchewan’s Investment Fund to support growth and development in the areas of music, film and television, digital media, visual arts, crafts, publishing, theatre and dance; and, |
| $6.8 million, an increase of $322,000 or 5 per cent, to the Saskatchewan Arts Board in support of funded organizations. |
The Community Initiatives Fund (CIF) will have total funding of $9.6 million, an increase of $301,000 based on higher projected revenue from Saskatchewan Gaming Corporation gaming profits. The CIF ensures that Saskatchewan communities receive tangible benefits from casino gaming profits.
Funding is also provided to support our cultural and heritage infrastructure:
| $5 million, an increase of $2.5 million for the second year of the three-year Legislative Building Dome Repair project, which addresses water infiltration into the dome interior, stone and mortar deterioration, rainwater management, window conditions, the copper roofing and dome roof; |
| $100,000 in new funding to match the City of Regina’s commitment to support operations at the RCMP Heritage Centre; and, |
| $50,000 to support the development of a Military History Project, which will invest in an oral history project and enhance artifact protection, to help promote and safeguard Saskatchewan’s military heritage. |
Improvements to Saskatchewan Provincial Parks continue through enhanced capital funding, including an additional $10 million over four years; in 2013-14 (the second year of this additional investment), major projects include:
| planning and design for two new campground developments; |
| addition of electrical service to 194 existing campsites; |
| upgrade of electrical service to approximately 200 campsites; and, |
| replacement of three washroom/shower facilities. |
16 Budget 2013/14 | Budget Summary
The 2013-14 Budget for the Ministry of the Environment provides:
| $22.8 million an increase of $974,000 or 4.5 per cent for the SARCAN contract; |
| $500,000 funding for the Multi-Material Recycling Program (MMRP) infrastructure and research; |
| $300,000 for the South of the Divide (SOD) Multi-Species Action Plan; |
| $250,000 for the assessment of abandoned sites; and, |
| $250,000 for Boreal Caribou Research. |
INFRASTRUCTURE
Another vital element of the Plan for Growth is investment in the province’s infrastructure: schools, health care facilities, roads, bridges and highways; the infrastructure needed to support a growing population and a robust economy.
The Government has invested nearly $5.8 billion in infrastructure projects since 2008. The Plan for Growth has committed another $2.5 billion over the next three years.
The 2013-14 capital budget is $847.5 million, a $59.8 million or 7.6 per cent increase from the previous year.
SaskBuilds
Government has established a new Treasury Board Crown corporation, SaskBuilds, to drive innovation in infrastructure financing, design and delivery. The corporation will integrate, co-ordinate and develop a long-term plan for infrastructure spending. It will also provide advice and recommendations for advancing large-scale infrastructure projects in a timely manner to support rapidly growing communities in the province, through innovative approaches to infrastructure development, such as public private partnerships.
For 2013-14, SaskBuilds is provided $6.0 million to begin preparatory work on a number of P3 opportunities:
| Innovative approach to new school construction to support rapidly growing communities; |
| The Saskatchewan Hospital North Battleford; and, |
| The Regina Southeast Bypass. |
Highways
Government is ahead of schedule to meet its commitment to invest $2.2 billion in highways and transportation infrastructure over a four-year period.
The total 2013-14 Budget provides $576.0 million to meet the commitment, including:
| $269 million for activities like day-to-day operation and maintenance of the transportation system, grants to urban municipalities, engineering services, and transportation planning and winter maintenance; and, |
| $25.5 million, an increase of $2.0 million, for the Municipal Roads for the Economy Program (MREP) that provides grants to rural municipalities to improve their road systems. |
The 2013-14 highways capital budget is $280.8 million, an increase of $5.5 million or 2.0 per cent from the previous year. This amount includes:
| $86.3 million for heavy preservation which involves repaving of at least 280 km of highways; |
| $63.6 million for economic corridors such as the Regina West Bypass; the Estevan Bypass; the passing lanes on Highway 10; completion of the Highway 11 Twinning initiative; |
Budget Summary | Budget 2013/14 17
| $81.8 million for local infrastructure to upgrade a further 75 km of highways to a higher standard; and, |
| $49.1 million for bridges and culverts, including $14.4 million for the St. Louis Bridge. |
Schools
For the first time in over 40 years, our schools are seeing significant increases in enrolment as our population grows and more families are making Saskatchewan their home.
In addition to the projects being considered by SaskBuilds, funding is being provided to advance a number of school projects in 2013-14. Total funding of $119.6 million, an increase of $7.2 million, is provided as follows:
| $36.9 million to continue construction on 10 third-party grant funded projects; |
| $31.9 million to continue construction on shared-ownership projects; |
| $28.2 million, an increase of $9.5 million, for preventative and emergent maintenance, renewal, capital asset management, and 40 relocatables; |
| $18.7 million for the construction of major capital projects in Hudson Bay, Leader, and Martensville that were approved in principle in 2012-13; |
| $1.9 million to begin planning on new projects in Langenburg and Gravelbourg; |
| $1.0 million for expansion of 15 new PreK Programs; and, |
| ● | $1.0 million for automating school capital request process. |
Partnerships with Municipal Government
The 2013-14 Budget builds upon the commitment to provide steady and reliable revenue to our partners in municipal government who are experiencing first-hand the impacts of rapid economic growth.
The 2013-14 Budget provides $362.0 million of direct provincial support to municipalities, an increase of $19.6 million or 5.7 per cent from last year and $120.0 million or 49.6 per cent from 2007-08.
Municipal revenue sharing will total $264.4 million, a $27.0 million or 11.4 per cent increase, which is equal to the revenue raised from one full point of the PST, based on the 2011-12 Public Accounts.
The percentage allocation among the urban, rural and northern pools will change slightly from last year, recognizing areas of growth and the unique circumstances of northern communities. Funding will be allocated as follows:
| $170.0 million, a $18.1 million increase (11.9 per cent), to urban municipalities; |
| $74.7 million, a $5.9 million increase (8.5 per cent), to rural municipalities; and, |
| $19.7 million, a $3.1 million increase (18.6 per cent), to northern municipalities. |
In addition, $250,000 has been provided to support the creation of Regional Planning Authorities, which will encourage greater inter-municipal co-operation.
Other funding provided through Government Relations includes:
| $77.0 million for municipal infrastructure programs; |
| $12.7 million, a $355,000 increase for Grants-in-Lieu of Property Taxes; |
18 Budget 2013/14 | Budget Summary
| $15.6 million to meet project commitments under various federal/provincial infrastructure programs; |
| $56.1 million in flow through municipal infrastructure funding provided by Gas Tax Program; |
| $5.3 million to meet program commitments under the Saskatchewan Infrastructure Growth Initiative; |
| $10.1 million, a $522,000 or 5.5 per cent increase for Saskatchewan Assessment Management Agency operations; and, |
| $1.7 million, a $339,000 or 24.1 per cent increase in grant funding, for the Saskatchewan Municipal Board that will help to modernize the organization and improve service to municipal clients. |
Public Safety and Sound Stewardship
In Government Relations, Public Safety Programs, the 2013-14 Budget provides:
| $2.7 million for Provincial Disaster Assistance Program claims and operations; |
| $1.0 million in new funding to provide capacity for a Provincial Emergency Response; and, |
| $2.2 million, a $760,000 increase, for the provincial contribution to capital upgrades as a partner in the Provincial Public Safety Telecommunications Network. |
The Ministry of Agriculture will make investments in the following to support a safe and dynamic agriculture sector:
| $3.0 million in funding to be allocated towards the first year of government’s seven-year $15.0 million commitment to the Global Institute for Food Security; and, |
| $1.0 million in new third party capital for rehabilitation of irrigation bridges on municipal roads. |
GROWING AND DEVELOPING SASKATCHEWAN’S LABOUR FORCE
Saskatchewan’s economic growth and competitiveness is closely linked to its ability to attract, develop and retain a skilled labour force. When employers have access to workers with the right skills, they can plan for growth and create more opportunities for Saskatchewan people.
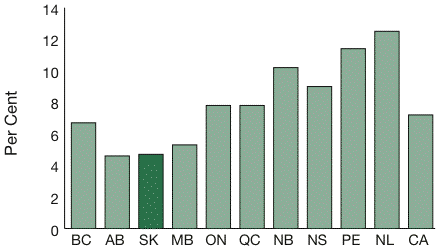
Saskatchewan has had one of the lowest unemployment rates in the country for the past five years, had the second lowest rate in 2012, and currently has the lowest rate.
UNEMPLOYMENT RATE ACROSS CANADA, 2012
Access to labour is one of the greatest constraints on our future growth. Saskatchewan is investing in developing the knowledge and skills of its people and is taking action to attract skilled workers in order to address urgent skill shortages.
To meet the current and future need for skilled workers, the Government has adopted an aggressive approach to attracting and retaining skilled workers from across Canada and around the world. The approach includes a commitment to support at least five recruitment missions each year, to help Saskatchewan address urgent skill shortages.
Budget Summary | Budget 2013/14 19
| | The population that is entering the workforce is not big enough to replace the aging population that is leaving. This situation requires our province to look outside its borders and to under-represented groups within the province for the workers it needs. In the last five years, newcomers from over 180 countries have settled in more than 325 communities in Saskatchewan. The recruitment missions to Ireland in 2012 resulted in 290 Irish workers finding permanent jobs in Saskatchewan. Not only do these newcomers help to address the critical shortages in high-skilled labour but they also contribute to the Saskatchewan economy as employers, entrepreneurs and investors. Saskatchewan’s population is at a record high, thanks primarily to immigration. In 2011, net immigration accounted for 62.5 per cent of growth. Saskatchewan has seen substantial increases in immigration over the last 10 years. Newcomers attracted through the Saskatchewan Immigrant Nominee Program accounted for 81 per cent of all new immigrants in 2012. | |
Furthermore, engaging First Nations and Métis people in the workforce is a priority. Our young Aboriginal population offers Saskatchewan businesses a competitive advantage as other regions deal with an aging labour supply. To realize this advantage, Saskatchewan needs to improve education and employment outcomes and the Joint Task Force recommendations will help identify solutions to address gaps in education and employment outcomes.
The 2013-14 Budget provides $184.8 million, an increase of $10.8 million or 6.2 per cent from the 2012-13 Budget, for targeted program funding from Executive Government ministries for programs and initiatives that benefit First Nations and Métis people.
Skills Training and Workforce Readiness
A key to success in Aboriginal employment is partnerships between industry, federal and provincial governments, training providers and provincial and Aboriginal service providers. The 2013-14 Budget supports promising programs that assist First Nations and Métis students to pursue jobs and educational opportunities.
Work Readiness Employment Development initiatives will receive a $1.5 million increase ($24.9 million total) to accelerate quick skills training and increase employment opportunities for First Nations and Métis people through projects like Northern Career Quest program, and In-Roads to Agriculture Careers. Northern Career Quest alone will provide 800 opportunities over the next two years.
Work will also begin towards eliminating the waitlist for Adult Basic Education (ABE). A $1.5 million increase ($22.9 million total) puts this commitment on a path to be completed by the end of the Government’s current term. In 2013-14, 300 additional spaces will be added, which is estimated to reduce the current waitlist from 2,175 to 1,875 spaces.
A $500,000 increase is provided to regional colleges and technical institutes for enhancing skill development, including $150,000 in new funding for the Aircraft Maintenance Engineer Training Program at the Saskatchewan Indian Institute of Technologies.
20 Budget 2013/14 | Budget Summary
The Ministry of the Economy will follow through on Plan for Growth commitments by providing a $1.5 million increase for the Saskatchewan Apprenticeship and Trade Certification Commission ($21.2 million total) to purchase an additional 300 training seats in 2013-14, as well as a $119,000 increase for the Apprenticeship Training Allowance ($2.2 million total) to meet the demand for support resulting from the increased seats.
Funding through the Ministry of Advanced Education will support training for health care workers:
| ● | $14.3 million to continue the Registered Nurse (RN) training seat expansion to 690 spaces, an increase of $2.2 million; |
| $11.8 million to continue the implementation of 100 medical undergraduate seats, an increase of $1.8 million from 2012-13; |
| $9.7 million to continue the implementation of 120 medical residency seats, an increase of $1.1 million from 2012-13; and, |
| $0.2 million in new funding to increase the number of nurse practitioner training spaces by five, which in addition to the five added in 2012-13 is half way to the government commitment of 20 new nurse practitioner training seats. |
Increasing Immigration
Part of the Government’s Plan for Growth is to support the labour market with a supply of skilled employees, attracting new immigrants to our province and encouraging ex-patriots to return home. These efforts will help to address the labour shortage and allow our businesses and industries to thrive.
The success of Saskatchewan’s immigration strategy is dependent on the province’s ability to retain our new neighbours. To help new entrants get a good start in Saskatchewan, increased funding of $1.5 million is being provided to increase immigrant settlement support programming with total funding of $9.2 million.
Saskatchewan’s settlement and integration service delivery model complements other services and programs offered, such as career and employment services, adult basic education, quick skills training, and post-secondary training.
Support for Better Education
Government is responding to increasing enrolments and growing costs for education with investments to support education in the early years to graduation. Funding for Education will reach $1.7 billion, an increase of $107.5 million.
This investment includes:
| a $17.0 million increase to support a forecasted enrolment increase of 2,654 students in 2013 and 1,930 in 2012; |
| $3.5 million, an increase of $2.4 million, for rising enrolment at independent schools; and, |
| $6.9 million for non-teacher salary increases for school divisions. |
The 2013-14 Budget meets the commitment to create 500 new child care spaces in 2013-14 by redirecting surplus child care funding.
Improving student outcomes is a priority of the Government of Saskatchewan. The Plan for Growth provides renewed focus on this and establishes targets to see improved outcomes by 2020.
Budget Summary | Budget 2013/14 21
Work is underway to build on some of the successes achieved, to learn from best practices and to increase attention on providing the best educational experience to our young people.
This budget provides $5.9 million, an increase of $3.9 million, to support the new assessment program as part of the Saskatchewan Student Achievement initiative. It also provides:
| a $272,000 increase for a one per cent increase for community-based organization (CBO) salaries; and, |
| $100,000 to provide access to online talking books for people with perceptual disabilities. |
This budget also includes increased funding to support our teachers:
| a $77.1 million increase for teachers’ pensions and benefits; and, |
| $5.2 million for teachers’ salary increases under the current collective bargaining agreement. |
Education has $3.0 million in funding dedicated to provide a response to recommendations from the Joint Task Force on Improving Education and Employment Outcomes in Saskatchewan. The Joint Task Force is expected to release its report and recommendations in April 2013.
Funding to post-secondary education increased more than 40 per cent since 2007-08.
Our post-secondary education institutions need to remain nimble to provide the right skills training to support the growing economy and to provide workers to the growing industries.
In 2013-14, the Ministry of Advanced Education will have a total expense budget of $787.7 million, an increase of $63.4 million or 8.8 per cent, from last year. This includes:
| $448.6 million to support base operating of Saskatchewan’s universities, and federated and affiliated colleges, an increase of $9.2 million or 2.1 per cent; |
| $149.6 million in operating funding for Saskatchewan’s technical institutes, an increase of $4.5 million or 3.1 per cent; and, |
| $27.6 million in operating funding for regional colleges, an increase of $0.6 million, or 2.1 per cent. |
In Advanced Education, direct student supports will increase by $19.6 million, total funding of $117.4 million, which includes:
| $63.9 million, an increase of $12.2 million for the Graduate Retention Program (GRP), which provides a tax credit equal to a student’s tuition, to a maximum of $20,000 prorated over seven years, if the student remains in Saskatchewan after graduation; |
| $7.5 million, an increase of $2.9 million, for the Saskatchewan Advantage Scholarship, which provides a $500 reduction to tuition for every year students are enrolled in an eligible post-secondary program (up to $2,000 total); |
| $6.5 million to establish the Saskatchewan Advantage Grant for Education Savings (SAGES) which will provide a contribution to individual Registered Education Savings Plans at a rate of 10 per cent of contributions, to a maximum of $250 per year; |
| $34.5 million for the Student Aid Fund; and, |
| $5.0 million for a number of other provincially funded scholarships. |
22 Budget 2013/14 | Budget Summary
Funding is also provided to support the infrastructure at our post-secondary institutions. $25.5 million in capital transfers includes:
| $16.5 million for maintenance capital; |
| $4.0 million in new capital grants for continued construction of the Health Sciences Centre; |
| $4.0 million for continued construction of the new Southeast Regional College facility, an increase of $3.0 million from 2012-13; and, |
| $1.0 million to support the feasibility, planning, and design development phases of the Trades and Technology Centre project at Parkland Regional College. |
In total, the budget includes over $16 million that will go toward the new Health Sciences Centre’s capital and operating costs.
BOOSTING EXPORTS AND BUILDING COMPETITIVENESS
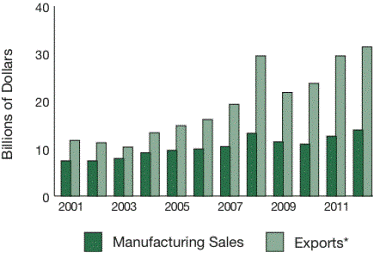
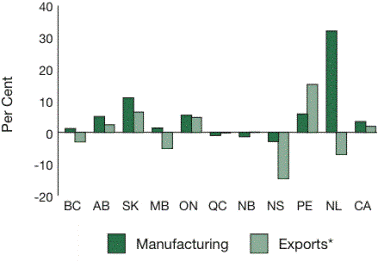
MANUFACTURING SALES AND EXPORTS, SASKATCHEWAN
| | * | Exports is total international goods exports |
| | Source: Statistics Canada |
GROWTH IN MANUFACTURING AND EXPORTS ACROSS CANADA, 2012
| | * | Exports is total international goods exports |
| | Source: Statistics Canada |
The Plan for Growth highlights the importance of being competitive for attracting and retaining investment to Saskatchewan. A significant component of this plan is maintaining competitive royalty regimes to attract investment and encourage development.
The budget introduces a modernization of the uranium royalty regime in order to encourage increased investment in northern Saskatchewan. This will create new opportunities for northern residents and add to Saskatchewan’s overall economic performance.
The 2013-14 Budget provides Innovation Saskatchewan with $28 million, an increase of $21.2 million, and includes a $19.1 million increase ($22.4 million total) for the nuclear research and development (R&D) strategy.
This includes $16.4 million in funding for a Cyclotron. It also supports the Sylvia Fedoruk Canadian Centre for Nuclear Innovation at the University of Saskatchewan ($5.0 million), and for a Memoranda of Understanding with the Hitachi Group ($1.0 million).
Budget Summary | Budget 2013/14 23
The Ministry of Agriculture will continue its commitment to fully fund its portion of Growing Forward programming to support the business interests of Saskatchewan farmers. The 2013-14 Budget includes:
| $198.3 million, an increase of $21.2 million, to fund Crop Insurance including new funding for the Province’s share of private reinsurance; |
| $28.7 million, a decrease of $52.5 million, to fund AgriStability under the new Growing Forward 2 agreement; |
| $32.4 million, a decrease of $10.2 million, to fund AgriInvest under the new Growing Forward 2 agreement; and, |
| More than $70 million in funding for non-Business Risk Management programs under the new Growing Forward 2 agreement (including $10.3 million of new provincial funding). |
This budget comes at a remarkable time in Saskatchewan’s history. Our province is growing at its fastest pace in nearly 100 years. Our economy is leading the nation and creating a record number of jobs. And more people are living here than ever before.
This year’s budget has been designed to balance the opportunities and challenges of a growing province. It controls spending while balancing the priorities of Saskatchewan people. It invests in infrastructure. It invests to shorten surgical wait times. It invests in support of students and to create an educated, well-trained work force. It invests to ensure more opportunities for First Nations and Métis people. It invests in support of people with disabilities and those who are most vulnerable.
Government’s direction and budget keep Saskatchewan moving forward.
24 Budget 2013/14 | Budget Summary
| | | |
| | | |
| | SASKATCHEWAN PROVINCIAL BUDGET | |
| | 13-14 | |
| | | |
| | TECHNICAL PAPERS | |
| | | |
THE SASKATCHEWAN ECONOMY
INTRODUCTION
Overall, 2012 was another good year for the province in terms of economic growth.
Saskatchewan was at or near the top among provinces on a number of fronts. Saskatchewan ranked number one in terms of growth in the number of housing starts, investment in new housing construction and investment in non-residential building construction. The province ranked second in terms of growth in the number of new vehicles sold, value of manufacturing sales, value of international goods exports and value of building permits.
Though the potash industry in Saskatchewan was again affected by weak global demand, demand in 2013 is expected to pick up. This, in addition to continued strong business investment and population and employment growth, will help sustain growth in the provincial economy again this year.
The current forecast sees real GDP growth of 2.6 per cent in 2013, following 2.7 per cent in 2012. Nominal GDP grew by 4.6 per cent in 2012 and is projected to rise by 3.2 per cent in 2013.
EXTERNAL ENVIRONMENT
International Economies
As in 2012, the economic outlook for the Eurozone, United States, Japan, China and other big emerging market economies will set the global economic tone in 2013 and 2014.
The economic forecasts for 2013 show negative growth in the Eurozone, minimal growth in Japan and moderate growth in the United States. China and many other emerging nations’ economies, however, are expected to post significant growth.
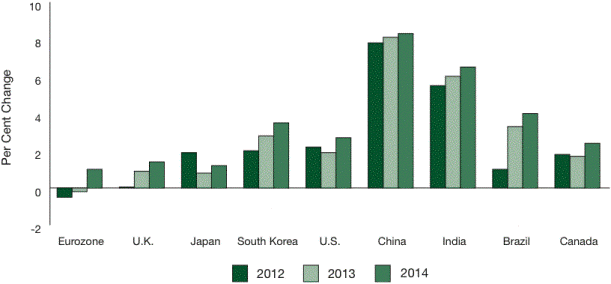
GLOBAL REAL GDP GROWTH ASSUMPTIONS
| Source: | Ministry of Finance |
Budget Summary | Budget 2013/14 27
| ● | Real GDP in the 17-nation Eurozone fell by 0.5 per cent in 2012. The Eurozone is projected to contract a further 0.2 per cent in 2013 and grow by only 1.0 per cent in 2014. |
| The United Kingdom had no growth last year and a rather tepid 0.9 per cent growth is forecast for 2013 and 1.4 per cent in 2014. |
| Following a 1.9 per cent gain in 2012, the Japanese economy is forecast to expand by a mere 0.8 per cent in 2013 and 1.2 per cent in 2014. |
| South Korea is expected to advance 2.8 per cent and 3.5 per cent in 2013 and 2014, respectively, following an increase of 2.0 per cent in 2012. |
| U.S. real GDP advanced 2.2 per cent in 2012. U.S. growth for 2013 is projected to be 1.9 per cent as a result of the expected fiscal tightening, but it improves to 2.7 per cent in 2014. |
| Growth in China is expected to accelerate to 8.1 per cent in 2013 and 8.3 per cent in 2014 compared with 7.8 per cent in 2012. |
| India’s real GDP growth is also expected to improve to 6.0 per cent this year and 6.5 per cent in 2014 from 5.5 per cent in 2012. |
| Brazil is set to expand by 3.3 per cent this year and 4.0 per cent in 2014 following 1.0 per cent growth in 2012. |
Canadian Economy
Canada’s real GDP grew by 1.8 per cent in 2012. The Canadian economy is expected to post moderate growth of 1.7 per cent in 2013, but pick up alongside the U.S. economy to 2.4 per cent in 2014.
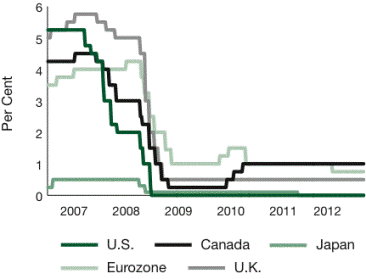
Most central banks around the world are keeping interest rates at low levels in order to support economic growth. The Bank of Canada is likewise expected to keep its overnight rate at 1.0 per cent.
CENTRAL BANK POLICY RATES
CANADIAN MACROECONOMIC ASSUMPTIONS
| | | | 2012 | | | | | | | | | | | | | | | | |
| | | | Actual | | | 2013 | | | 2014 | | | 2015 | | | 2016 | | | 2017 | |
| | Real GDP Growth (%) | | | 1.8 | | | | 1.7 | | | | 2.4 | | | | 2.4 | | | | 2.1 | | | | 1.9 | |
| | Inflation Rate (%) | | | 1.5 | | | | 2.2 | | | | 2.2 | | | | 2.1 | | | | 2.0 | | | | 2.0 | |
| | Unemployment Rate (%) | | | 7.2 | | | | 7.3 | | | | 6.8 | | | | 6.2 | | | | 5.9 | | | | 5.7 | |
| | Short-term Interest Rate (%) | | | 0.94 | | | | 1.04 | | | | 1.58 | | | | 2.44 | | | | 3.42 | | | | 3.84 | |
| | Long-term Interest Rate (%)* | | | 1.86 | | | | 1.77 | | | | 2.02 | | | | 2.54 | | | | 3.24 | | | | 3.76 | |
| | Canadian Dollar (US cents) | | | 100.04 | | | | 98.80 | | | | 99.80 | | | | 98.30 | | | | 96.70 | | | | 96.30 | |
| * | 10-year Government of Canada Bond |
| Source: | Ministry of Finance |
28 Budget 2013/14 | Budget Summary
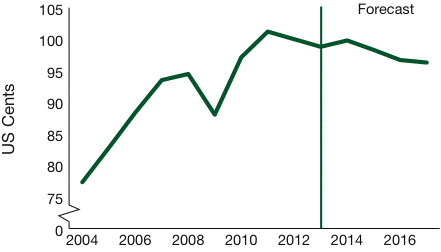
On average, the Canadian dollar was at par with the U.S. dollar in 2012. There are factors that remain supportive of a small premium in the value of the Canadian dollar, such as the Canada-U.S. interest rate spread and Canada’s Triple-A credit rating, but evidence of a widening economic growth differential between Canada and the U.S. could cause the Canadian dollar to ease.
CANADIAN DOLLAR
Source: | Bank of Canada, Ministry of Finance |
Taking these into consideration, the Canadian dollar is expected to trade slightly below parity with the U.S. dollar in 2013 and 2014, on average.
RECENT PERFORMANCE
Overall, 2012 was a good year for the Saskatchewan economy.
Despite weaker sales of potash and slightly lower oil investment, most other economic indicators for 2012 were positive.
Job growth was stronger than anticipated. Total employment rose by over 11,000 last year. As well, Saskatchewan had the second-lowest unemployment rate in all of Canada.
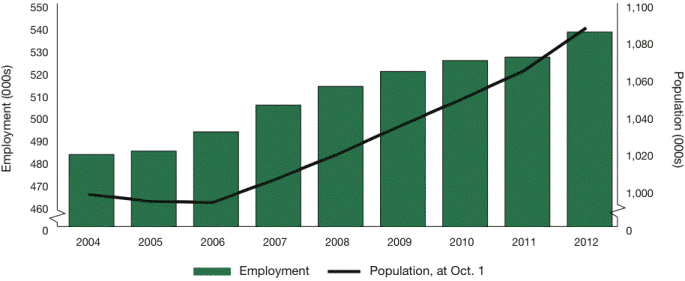
Employment growth is helping grow the province’s population. Between October 1, 2011 and October 1, 2012, Saskatchewan’s population increased by 23,024 persons, the most growth in a single year since 1921.
SASKATCHEWAN ECONOMIC INDICATORS
(Per Cent Change)
| | | | | | | | | | | | | | Saskatchewan | | | | | | | | Canada | | |
| | | | | | 2012 | | | | Rank | | | | 2007-12 | | | | Rank | | | | 2007-12 | | |
| | | Employment | | | 2.1 | | | | 3 | | | | 6.5 | | | | 2 | | | | 3.8 | | |
| | | Average Weekly Earnings | | | 4.8 | | | | 2 | | | | 22.8 | | | | 3 | | | | 13.8 | | |
| | | Retail Sales | | | 6.7 | | | | 2 | | | | 31.9 | | | | 1 | | | | 13.3 | | |
| | | Wholesale Trade | | | 2.9 | | | | 7 | | | | 48.9 | | | | 1 | | | | 13.8 | | |
| | | Number of New Vehicles Sold | | | 10.6 | | | | 2 | | | | 24.1 | | | | 2 | | | | 1.6 | | |
| | | Manufacturing Sales | | | 10.9 | | | | 2 | | | | 33.7 | | | | 2 | | | | (1.2 | ) | |
| | | International Goods Exports | | | 6.4 | | | | 2 | | | | 62.6 | | | | 1 | | | | 1.7 | | |
| | | Value of Building Permits | | | 18.0 | | | | 2 | | | | 87.4 | | | | 1 | | | | 8.5 | | |
| | | Number of Housing Starts | | | 41.8 | | | | 1 | | | | 65.9 | | | | 1 | | | | (5.9 | ) | |
| | | Investment in New Housing | | | | | | | | | | | | | | | | | | | | | |
| | | Construction | | | 35.0 | | | | 1 | | | | 130.0 | | | | 1 | | | | 10.6 | | |
| | | Investment in Non-residential | | | | | | | | | | | | | | | | | | | | | |
| | | Building Construction | | | 21.7 | | | | 1 | | | | 91.4 | | | | 2 | | | | 27.3 | | |
| | | Private and Public Investment | | | 6.5 | | | | 6 | | | | 78.4 | | | | 2 | | | | 19.1 | | |
Budget Summary | Budget 2013/14 29
SASKATCHEWAN EMPLOYMENT AND POPULATION
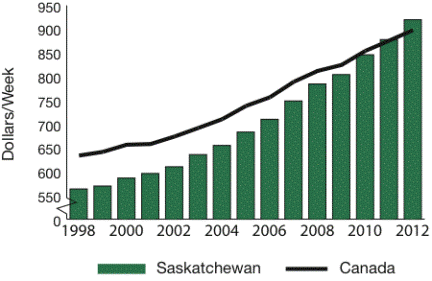
Average weekly earnings in Saskatchewan grew by 4.8 per cent in 2012 to $919.85 while retail sales went up by 6.7 per cent. Both percentage increases ranked second in the nation.
SASKATCHEWAN AND CANADA AVERAGE WEEKLY EARNINGS
Saskatchewan also ranked second in the nation in growth in:
| ● | number of new vehicles sold – up 10.6 per cent; |
| value of manufacturing sales – up 10.9 per cent; |
| value of international goods exports – up 6.4 per cent; and, |
| value of building permits – up 18.0 per cent. |
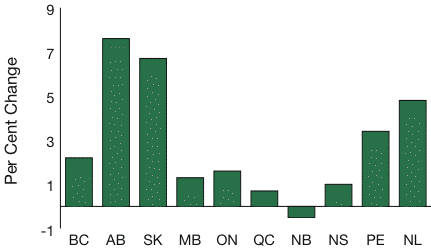
RETAIL SALES GROWTH IN 2012
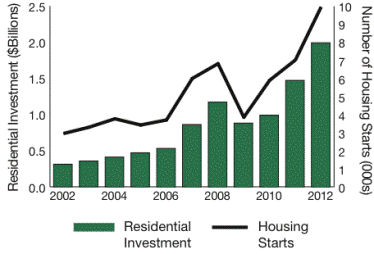
In terms of residential investment in 2012, Saskatchewan led the nation in both investment in new housing construction (up 35.0 per cent) and total number of housing starts (up 41.8 per cent).
Non-residential building construction went up 21.7 per cent to roughly $1.8 billion last year.
30 Budget 2013/14 | Budget Summary
RESIDENTIAL INVESTMENT IN SASKATCHEWAN
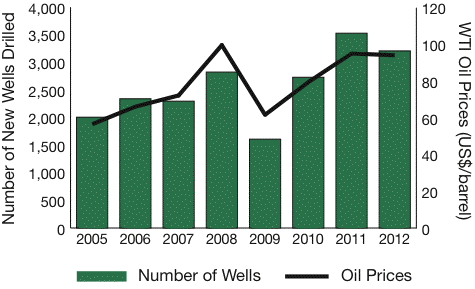
OIL PRICES AND THE NUMBER OF OIL WELLS DRILLED IN SASKATCHEWAN
| Source: | Ministry of the Economy |
Oil investment in the province last year eased somewhat alongside lower oil prices. Oil producers drilled 9.1 per cent fewer oil wells in 2012 than the record amount in 2011.
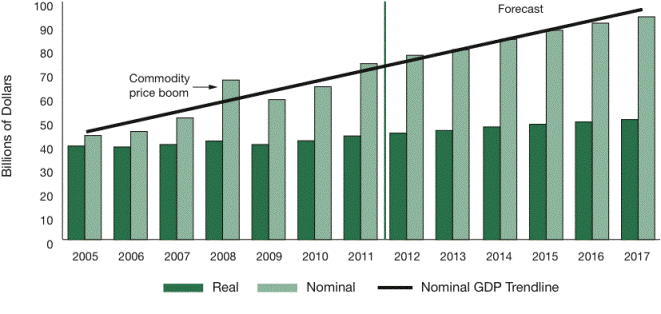
Overall, Saskatchewan real GDP is forecast to have increased by 2.7 per cent in 2012. Nominal GDP growth is forecast to have risen by 4.6 per cent.
SASKATCHEWAN ECONOMIC OUTLOOK
For 2013, real GDP is expected to rise 2.6 per cent due in part to:
| a rebound in potash production and sales; |
| continued population and job growth; and, |
| still strong business investment related to the expansion of the province’s potash industry. |
In nominal terms, Saskatchewan GDP is forecast to grow by 3.2 per cent.
FORECAST AT A GLANCE
| | | | | | 2012 | | | | 2013 | | | | 2014 | | | | 2015 | | | | 2016 | | | | 2017 | | |
| | | Real GDP Growth (%) | | | 2.7 | | | | 2.6 | | | | 3.1 | | | | 2.5 | | | | 2.1 | | | | 2.0 | | |
| | | Nominal GDP Growth (%) | | | 4.6 | | | | 3.2 | | | | 5.4 | | | | 4.5 | | | | 3.4 | | | | 2.9 | | |
| | | CPI Growth (%) | | | 1.6 | * | | | 2.3 | | | | 2.2 | | | | 2.3 | | | | 2.1 | | | | 1.7 | | |
| | | Employment Growth (000s) | | | 11.2 | * | | | 10.0 | | | | 6.4 | | | | 6.1 | | | | 6.0 | | | | 5.0 | | |
| | | Unemployment Rate (%) | | | 4.7 | * | | | 4.5 | | | | 4.7 | | | | 4.9 | | | | 5.1 | | | | 5.1 | | |
| | | Retail Sales Growth (%) | | | 6.7 | * | | | 5.7 | | | | 6.1 | | | | 4.4 | | | | 5.6 | | | | 4.8 | | |
| Source: | Ministry of Finance, Statistics Canada |
Budget Summary | Budget 2013/14 31
SASKATCHEWAN GDP
| Source: | Ministry of Finance |
COMMODITY PRICE ASSUMPTIONS – CALENDAR YEAR
| | | | | 2012 | | | | | | | | | | | | | | | | | |
| | | | | Actual | | | 2013 | | | 2014 | | | 2015 | | | 2016 | | | 2017 | | |
| | | WTI Oil (US$/barrel) | | | 94.20 | | | | 92.50 | | | | 94.50 | | | | 95.00 | | | | 95.00 | | | | 95.00 | | |
| | | Natural Gas (C$/GJ) | | | 2.18 | | | | 3.10 | | | | 3.50 | | | | 4.05 | | | | 4.50 | | | | 4.90 | | |
| | | Potash (C$/K2O tonne)1 | | | 727.53 | | | | 645.43 | | | | 679.79 | | | | 714.82 | | | | 768.29 | | | | 784.80 | | |
| | | Potash (US$/KCl tonne)1 | | | 444.15 | | | | 388.99 | | | | 413.84 | | | | 428.63 | | | | 453.19 | | | | 461.02 | | |
| | | Wheat (C$/tonne)2 | | | 263.12 | | | | 274.02 | | | | 286.86 | | | | 300.83 | | | | 297.96 | | | | 294.79 | | |
| | | Canola (C$/tonne)2 | | | 576.70 | | | | 558.84 | | | | 530.10 | | | | 542.73 | | | | 521.63 | | | | 539.72 | | |
| | 1 | The potash industry quotes prices in US dollars per KCl tonne. Provincial royalty calculations, however, are based on the Canadian dollar price per K2O tonne. |
| | 2 | Crop year basis and at farm gate prices. |
| | Source: | Ministry of the Economy, Ministry of Agriculture |
SURVEY OF WTI OIL PRICE FORECASTS – CALENDAR YEAR
As of February 4, 2013
| | | (US$/barrel) | | 2013 | | | 2014 | | |
| | | BMO Financial Group | | | 94.0 | | | | 99.0 | | |
| | | Energy Information Administration | | | 89.5 | | | | 91.0 | | |
| | | GLJ Associates Ltd. | | | 90.0 | | | | 92.5 | | |
| | | NYMEX Futures | | | 93.2 | | | | 92.2 | | |
| | | Scotiabank | | | 94.0 | | | | 96.0 | | |
| | | Sproule Associates Limited | | | 89.6 | | | | 89.9 | | |
| | | Other Confidential Forecasts* (average) | | | 93.9 | | | | 96.5 | | |
| | | Average | | | 92.3 | | | | 94.2 | | |
| | * | Ministry of the Economy receives, in confidence, other private sector forecast. |
32 Budget 2013/14 | Budget Summary
West Texas Intermediate (WTI) oil in 2013 is expected to average US$92.50 per barrel, consistent with outside forecasts.
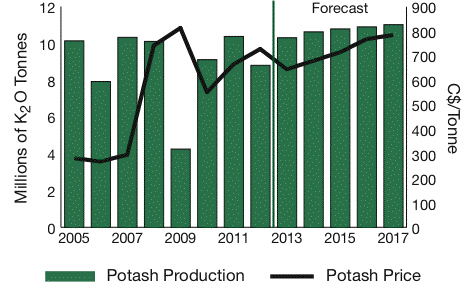
Potash production this year is expected to improve after a disappointing year in 2012 that saw production and sales impacted by weak global demand. Production of 10.3 million K2O tonnes is expected in 2013. The price of potash is currently expected to average $645.43 per K2O tonne this year.
SASKATCHEWAN POTASH PRODUCTION AND AVERAGE POTASH PRICES
Source: | Ministry of the Economy |
Agricultural prices are expected to remain strong this year. Wheat and canola in particular are expected to average $274.02 per tonne and $558.84 per tonne, respectively.
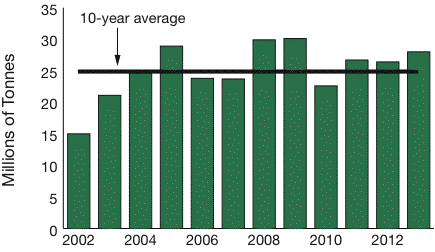
It is assumed that crop production in 2013 will not be affected by adverse weather conditions. In 2012, canola production fell 16.5 per cent as a result of adverse weather conditions such as hail.
The current forecast assumes total crop production in 2013 will be 28.0 million tonnes.
CROP PRODUCTION
Source: | Statistics Canada, Ministry of Agriculture |
According to Statistics Canada’s most recent private and public investment intentions survey, total capital investment in Saskatchewan last year was $20.9 billion, 6.5 per cent greater than in 2011.
PRIVATE AND PUBLIC INVESTMENT IN SASKATCHEWAN
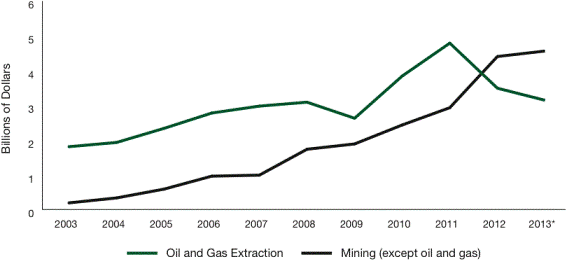
Though intentions for this year suggest some slight reduction in the level of total investment in the province from the record level seen in 2012, investment is still historically strong. Furthermore, investment in the mining sector (except oil and gas) continues to reach record highs.
Budget Summary | Budget 2013/14 33
MINING INVESTMENT IN SASKATCHEWAN
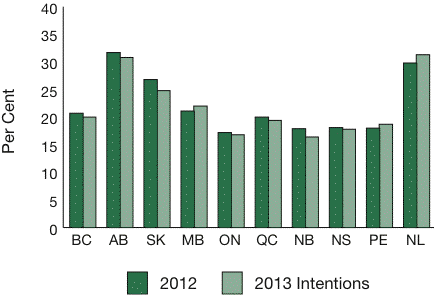
In 2013 in Saskatchewan, private and public investment as a share of provincial nominal GDP is expected to total 24.8 per cent, behind only Newfoundland and Labrador and Alberta.
PRIVATE AND PUBLIC INVESTMENT AS A SHARE OF NOMINAL GDP
Source: | Statistics Canada, Conference Board of Canada Autumn 2012 |
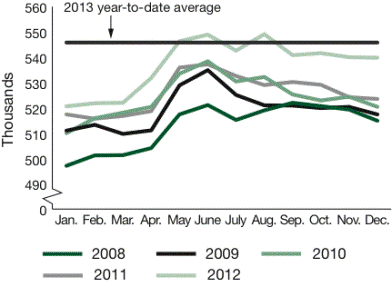
Given the strong employment numbers through the first two months of 2013, average employment this year is expected to rise by 10,000, following growth of over 11,000 in 2012. For 2014, another 6,400 new jobs are expected given current assumptions.
SASKATCHEWAN MONTHLY EMPLOYMENT
SASKATCHEWAN EMPLOYMENT
Source: | Statistics Canada, Ministry of Finance |
34 Budget 2013/14 | Budget Summary
According to private sector forecasters, Saskatchewan’s economy is expected to outperform most other provincial economies in each of the next two years.
Private sector forecasts of Saskatchewan real GDP growth for 2013 range from a high of 3.5 per cent to a low of 2.4 per cent.
PRIVATE SECTOR FORECASTS OF REAL GDP GROWTH BY PROVINCE
| | Private sector forecast average as at March 8, 2013 |
| | Source: Major Canadian banks, IHS Global Insight, CBOC, C4SE |
PRIVATE SECTOR FORECASTS OF REAL GDP GROWTH BY PROVINCE
(Per Cent Change)
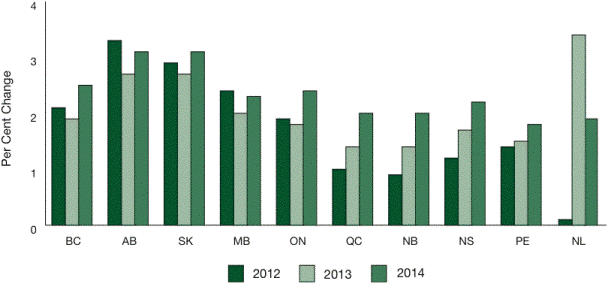
| | | | | | 2012 | | | | Rank | | | | 2013 | | | | Rank | | | | 2014 | | | | Rank | | |
| | | British Columbia | | | 2.1 | | | | 4 | | | | 1.9 | | | | 4 | | | | 2.5 | | | | 2 | | |
| | | Alberta | | | 3.3 | | | | 1 | | | | 2.7 | | | | 2 | | | | 3.1 | | | | 1 | | |
| | | Saskatchewan | | | 2.9 | | | | 2 | | | | 2.7 | | | | 2 | | | | 3.1 | | | | 1 | | |
| | | Manitoba | | | 2.4 | | | | 3 | | | | 2.0 | | | | 3 | | | | 2.3 | | | | 4 | | |
| | | Ontario | | | 1.9 | | | | 5 | | | | 1.8 | | | | 5 | | | | 2.4 | | | | 3 | | |
| | | Québec | | | 1.0 | | | | 8 | | | | 1.4 | | | | 8 | | | | 2.0 | | | | 6 | | |
| | | New Brunswick | | | 0.9 | | | | 9 | | | | 1.4 | | | | 8 | | | | 2.0 | | | | 6 | | |
| | | Nova Scotia | | | 1.2 | | | | 7 | | | | 1.7 | | | | 6 | | | | 2.2 | | | | 5 | | |
| | | Prince Edward Island | | | 1.4 | | | | 6 | | | | 1.5 | | | | 7 | | | | 1.8 | | | | 8 | | |
| | | Newfoundland and Labrador | | | 0.1 | | | | 10 | | | | 3.4 | | | | 1 | | | | 1.9 | | | | 7 | | |
| | | Canada | | | 1.9 | | | | | | | | 1.9 | | | | | | | | 2.4 | | | | | | |
Budget Summary | Budget 2013/14 35
PRIVATE SECTOR REAL GDP GROWTH FORECASTS FOR SASKATCHEWAN
(Per Cent Change)
| | | | | | 2012 | | | | 2013 | | | | 2014 | | | | Date | | |
| | | IHS Global Insight | | | 2.6 | | | | 2.4 | | | | 2.8 | | | | Feb./13 | | |
| | | Conference Board of Canada | | | 2.9 | | | | 3.0 | | | | 3.1 | | | | Mar./13 | | |
| | | The Centre for Spatial Economics | | | 2.7 | | | | 3.1 | | | | 3.4 | | | | Mar./13 | | |
| | | TD Bank | | | 3.1 | | | | 2.4 | | | | 3.1 | | | | Dec./12 | | |
| | | RBC | | | 2.8 | | | | 3.5 | | | | 3.7 | | | | Dec./12 | | |
| | | BMO | | | 3.1 | | | | 2.6 | | | | 2.9 | | | | Jan./13 | | |
| | | CIBC | | | 3.0 | | | | 2.4 | | | | 2.9 | | | | Jan./13 | | |
| | | Scotiabank | | | 3.1 | | | | 2.5 | | | | 2.9 | | | | Feb./13 | | |
| | | Laurentian Bank | | | 2.8 | | | | 2.4 | | | | 2.9 | | | | Dec./12 | | |
| | | Average of Private Sector Forecasts | | | 2.9 | | | | 2.7 | | | | 3.1 | | | | | | |
| | | 2013-14 Budget Forecast | | | 2.7 | | | | 2.6 | | | | 3.1 | | | | | | |
CONCLUSION
The Saskatchewan economy performed well in 2012 and is forecast to perform well again this year. Real GDP growth of 2.6 per cent is expected in 2013. Nominal GDP is projected to rise by 3.2 per cent.
The risks to the Saskatchewan economic outlook are largely external. U.S. growth prospects could be hurt by looming tax and spending decisions.
Weaker U.S. growth combined with prolonged recession in the Eurozone would harm emerging nations and dampen commodity prices.
While Saskatchewan is not immune to global economic conditions, prospects for provincial economic growth in the near term remain solid, reflecting strong consumer spending and business investment.
36 Budget 2013/14 | Budget Summary
General Revenue Fund
Financial Outlook
INTRODUCTION
The 2013-14 Budget represents the sixth year under The Growth and Financial Security Act. The Act requires a four-year financial plan in which total General Revenue Fund (GRF) expense must balance with or be less than total GRF revenue each year.
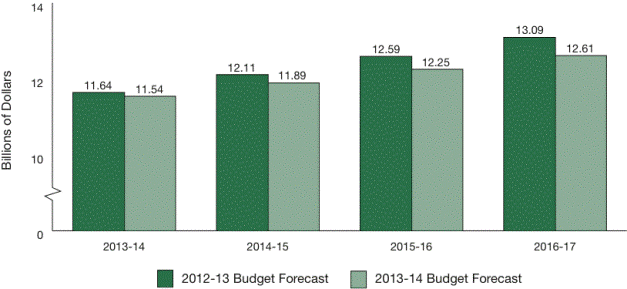
The 2013-14 Budget estimates a GRF surplus of $32.4 million. GRF surpluses are also forecast in each of the subsequent three years.
2013-14 GRF REVENUE
The 2013-14 GRF revenue forecast incorporates all revenue initiatives contained in the budget.
GRF revenue is forecast at $11.6 billion in 2013-14. This is an increase of $212.2 million, or 1.9 per cent, from the 2012-13 forecast, primarily due to higher tax and non-renewable resource revenue, partially offset by lower transfers from Crown entities, other own-sources and federal transfers.
GRF revenue in 2012-13 was supported by a number of non-recurring items. These include an unbudgeted CIC dividend at third quarter and additional federal funding, primarily for provincial flood-related costs. As well, investment income is forecast to be significantly lower in 2013-14, as a large portion of sinking fund investments were sold during 2012-13 to retire maturing debt.
Excluding one-time revenue gains in 2012-13 and the fiscal impact of revenue initiatives introduced with the 2013-14 Budget, growth in own-source GRF revenue is estimated at $364.8 million, or 3.2 per cent, consistent with the Ministry of Finance’s forecast for nominal GDP growth in 2013.
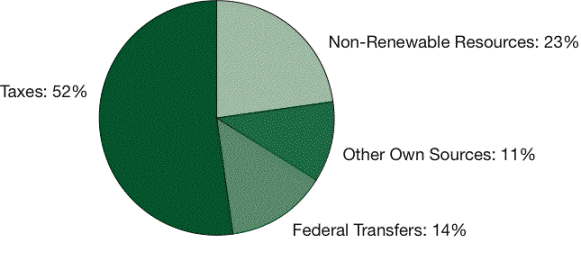
Tax revenue is budgeted to account for 52 per cent of GRF revenue, while non-renewable resource revenue is estimated at 23 per cent. Relative to the 2012-13 Budget, this allocation represents a five percentage point shift in reliance from non-renewable resources to tax revenue.
2013-14 GRF REVENUE RECONCILIATION
By Major Factor
| | | (Millions of Dollars) | | | | | |
| | | 2012-13 GRF Revenue Forecast | | | 11,395.1 | | |
| | | Growth in Own-Source Revenue Base | | | 364.8 | | |
| | | Change in CIC Dividends | | | (76.4 | ) | |
| | | Change in Investment Income | | | (74.0 | ) | |
| | | Change in Federal Transfers | | | (66.8 | ) | |
| | | 2013-14 Tax and Revenue Measures | | | 64.6 | | |
| | | Total Revenue Changes | | | 212.2 | | |
| | | 2013-14 Budget GRF Revenue Estimate | | | 11,607.3 | | |
Budget Summary | Budget 2013/14 37
COMPOSITION OF 2013-14 GRF REVENUE
Total Revenue: $11.6 billion |
Tax Revenue
Tax revenue is forecast at $6.0 billion in 2013-14 and accounts for 52 per cent of GRF revenue. This is an increase of $316.0 million, or 5.6 per cent, from 2012-13.
All tax categories are forecast to increase amidst continued economic growth in the province. Corporation Income Tax (up $141.1 million),
Provincial Sales Tax (up $52.7 million) and Individual Income Tax (up $47.2 million) will lead the growth in 2013-14. Tobacco Tax is forecast to increase $45.2 million as a result of increased tobacco tax rates, while Fuel Tax and Other Taxes are forecast to increase as the economy and population continue to expand.
FISCAL-YEAR NON-RENEWABLE RESOURCE FORECAST ASSUMPTIONS
| | | | | | 2012-13 Budget | | | | 2013-13 Forecast | | | | 2013-14 Budget | | |
| | | Natural Gas Price (fieldgate, C$/GJ) | | | 2.98 | | | | 2.45 | | | | 3.07 | | |
| | | Natural Gas Production (billion cubic feet) | | | 135.6 | | | | 140.8 | | | | 123.1 | | |
| | | WTI Oil Price (US$/barrel) | | | 100.50 | | | | 91.76 | | | | 92.84 | | |
| | | Light-Heavy Differential (% of WTI) | | | 15.0 | | | | 20.4 | | | | 17.9 | | |
| | | Well-head Oil Price (C$/barrel)1 | | | 82.45 | | | | 69.29 | | | | 75.29 | | |
| | | Oil Production (million barrels) | | | 176.9 | | | | 171.2 | | | | 171.8 | | |
| | | Potash Price (mine netback, US$/KCl tonne)2 | | | 464 | | | | 425 | | | | 395 | | |
| | | Potash Price (mine netback, C$/K2O tonne)2 | | | 761 | | | | 699 | | | | 654 | | |
| | | Potash Sales (million K2O tonnes)2 | | | 10.2 | | | | 8.8 | | | | 10.4 | | |
| | | Canadian Dollar (US cents) | | | 100.0 | | | | 99.94 | | | | 98.92 | | |
| | 1 | The average price per barrel of Saskatchewan light, medium and heavy oil |
| | 2 | Ministry of Finance calculations derived from calendar-year forecasts |
38 Budget 2013/14 | Budget Summary
SASKATCHEWAN POTASH INDUSTRY CAPITAL EXPENDITURES*
Non-Renewable Resource Revenue
Non-renewable resource revenue is forecast at $2.7 billion and accounts for 23 per cent of GRF revenue. This is an increase of $85.1 million, or 3.3 per cent, from the 2012-13 forecast. The increase is primarily due to higher potash, oil and Crown land sales, partially offset by lower revenue from the Resource Surcharge and other non-renewable resources.
Relative to the 2012-13 Budget, however, non-renewable resource revenue is lower by $477.7 million, or 15.2 per cent, due primarily to lower oil and potash prices.
Potash revenue is forecast at $519.9 million in 2013-14, an increase of $122.5 million from the 2012-13 forecast. On a fiscal-year basis, average realized potash prices are forecast at US$395 per KCl tonne (C$654 per K2O tonne) in 2013-14, down US$30 (C$45) from last year. This decrease is more than offset by an expected recovery in sales and lower capital spending as some major projects wind down, particularly in 2014.
Oil revenue is forecast at $1.4 billion in 2013-14, an increase of $118.5 million from the 2012-13 forecast. The increase is largely due to higher prices, with well-head prices forecast to average $75.29 per barrel in 2013-14, an increase of $6.00 from 2012-13. The price increase is a result of a smaller light-heavy differential forecast, a higher West Texas Intermediate (WTI) oil price forecast and a lower exchange rate.
WTI oil is a light sweet crude oil and is the benchmark for North American oil prices. However, the majority of oil produced in Saskatchewan is heavier and more sour than WTI and requires further processing to turn into refined products. As a result, Saskatchewan oil generally trades at a discount to WTI oil.
Budget Summary | Budget 2013/14 39
SASKATCHEWAN OIL PRODUCTION
In 2012-13, increasing production in Western Canada and North Dakota, coupled with pipeline capacity limits, contributed to an increase in the price discount for Saskatchewan oil. This discount is expected to ease somewhat in the coming year. The light-heavy blend differential is forecast to average 17.9 per cent in 2013-14, down from 20.4 per cent in 2012-13.
WTI oil prices continue to be volatile and this volatility is likely to continue against a backdrop of ongoing economic and financial market uncertainties. Since April 2011, daily WTI oil prices have ranged between US$75.67 and US$113.93 per barrel, averaging US$94.67 over the time period.
In 2013-14, WTI oil prices are forecast to average US$92.84 per barrel.
The Canadian dollar is forecast to average 98.92 US cents in 2013-14, down from 99.94 US cents in 2012-13. As the price of Saskatchewan oil is generally determined based on prices in the United States, the exchange rate is an important factor in determining the price of Saskatchewan oil. The lower exchange
WTI OIL PRICES
40 Budget 2013/14 | Budget Summary
rate translates to a higher well-head price for oil produced in Saskatchewan, all else being equal.
Crown land sales are forecast at $111.4 million in 2013-14, an increase of $22.5 million from 2012-13, and natural gas is forecast to grow by $1.4 million.
Resource Surcharge revenue in 2012-13 was much higher than budgeted due to the adoption of new federal income tax rules which limited the ability to defer tax to future years through the use of partnerships. This non-recurring factor accounts for the majority of the $145.1 million decline in Resource Surcharge revenue in 2013-14.
Other non-renewable resources, including uranium, coal and other minerals, are forecast at $99.7 million.
Transfers from Crown Entities
Transfers from Crown entities are forecast at $748.7 million in 2013-14, a $55.5 million decrease from 2012-13.
The regular CIC dividend is targeted at $180.0 million in 2013-14, $90.0 million less than 2012-13.
This decrease is partially offset by an increase in the special dividend from CIC. CIC will provide $16.6 million in 2013-14 to support Saskatchewan’s nuclear research and development strategy. In 2012-13, $3.0 million was provided.
The Saskatchewan Liquor and Gaming Authority (SLGA) dividend is forecast to increase $27.6 million in 2013-14, to $491.8 million, as a result of growth in the provincial economy, population growth and the impacts of increased liquor mark-ups announced in this year’s budget.
Finally, transfers from all other government entities are forecast at $60.3 million, down slightly from the $67.0 million provided by these organizations in 2012-13.
Other Own-Source Revenue
Other own-source revenue is forecast at $568.0 million in 2013-14. This is a decline of $66.6 million from the 2012-13 forecast, largely as a result of lower investment income.
A significant portion of sinking fund investments were sold during 2012-13 to retire maturing debt. As a result, GRF investment income in 2013-14 is budgeted to be $56.0 million lower than the 2012-13 Budget. This is more than offset by a $60.0 million reduction in budgeted GRF debt-servicing costs in 2013-14 due to the substantial amount of debt that matured.
Federal Transfers
Transfers and contributions from the Government of Canada are forecast at $1.6 billion, a decrease of $66.8 million from 2012-13. Revenue from cost-sharing agreements with the federal government is forecast to drop $106.8 million, primarily as a result of federal disaster assistance funding recorded in 2012-13. This decrease is partially offset by increases to the Canada Health Transfer ($25.8 million) and Canada Social Transfer ($14.2 million).
GRF INVESTMENT INCOME AND DEBT-SERVICING COSTS
| | | | | | 2012-13 | | | | 2013-14 | | | | | |
| | | (Millions of Dollars) | | Budget | | | Budget | | | Change | | |
| | | Debt-Servicing Costs | | | 400.0 | | | | 340.0 | | | | (60.0 | ) | |
| | | Investment Income | | | 145.4 | | | | 89.4 | | | | (56.0 | ) | |
| | | Budgeted Net Interest Costs | | | 254.6 | | | | 250.6 | | | | (4.0 | ) | |
Budget Summary | Budget 2013/14 41
RISKS TO THE 2013-14 REVENUE FORECAST
The revenue forecast in the 2013-14 Budget incorporates a series of assumptions that impact Saskatchewan’s fiscal performance, including assumptions on Canadian, U.S. and global economic growth, non-renewable resource prices and the value of the Canadian dollar. These factors are beyond the Government’s control, yet they heavily influence Saskatchewan’s largest revenue sources, particularly non-renewable resource revenue and Corporation Income Tax.
Actual economic performance and non-renewable resource prices will undoubtedly vary from budget assumptions. As a result, revenue linked to these factors will vary from budget estimates. In recent years, this volatility has become more pronounced.
Recognizing that Saskatchewan is reliant on non-renewable resources and external events, the underlying assumptions upon which revenue estimates are derived incorporate a number of private sector forecasts in an attempt to minimize risk. As the budget is developed, the degree of risk present in the revenue forecast is assessed and quantified, and this risk analysis continues throughout the fiscal year.
For 2013-14, it is estimated that:
| ● | a US$1 per barrel change in the average WTI oil price results in an estimated $18.9 million change in oil royalties; |
| a US$50 per KCl tonne (C$83 per K2O tonne) change in the average realized 2013 potash price results in an estimated $130.6 million change in potash royalties; and, |
| a 1 U.S. cent change in the average value of the Canadian dollar results in an estimated $28.8 million change in non-renewable resource revenue. |
MEDIUM-TERM GRF REVENUE OUTLOOK
The revenue outlook for the medium term is positive. After 1.9 per cent growth in 2013-14, GRF revenue is forecast to grow by 3.8 per cent, 4.0 per cent and 4.0 per cent over the next three years, for a total increase of $1.4 billion by 2016-17.
Over the medium term, tax revenue is expected to grow amidst solid economic growth in the province. The forecast incorporates average tax revenue growth of 2.7 per cent through 2016-17.
GRF REVENUE, 1990-91 TO 2016-17
42 Budget 2013/14 | Budget Summary
Over the same time period, non-renewable resource revenue is expected to increase by an average of 8.8 per cent annually, primarily as the result of higher values of oil and potash sales. In addition, the winding down of major capital projects in the potash sector will boost royalty revenue over the medium term.
As a share of total revenue, non-renewable resources are projected to average 25 per cent over the medium term.
Other own sources of revenue are forecast to remain relatively flat over the medium term, while federal transfers are forecast to increase an average of 3.1 per cent over the forecast period, largely as a result of legislated increases in the Canada Health Transfer and the Canada Social Transfer.
MEDIUM-TERM NON-RENEWABLE RESOURCE FORECAST ASSUMPTIONS
| | | | | | 2012-13 | | | | 2013-14 | | | | 2014-15 | | | | 2015-16 | | | | 2016-17 | | |
| | | Natural Gas Price (fieldgate, C$/GJ) | | | 2.45 | | | | 3.07 | | | | 3.89 | | | | 4.17 | | | | 4.60 | | |
| | | Natural Gas Production (billion cubic feet) | | | 140.8 | | | | 123.1 | | | | 112.0 | | | | 104.2 | | | | 98.1 | | |
| | | WTI Oil Price (US$/barrel) | | | 91.76 | | | | 92.84 | | | | 94.63 | | | | 95.00 | | | | 95.00 | | |
| | | Light-Heavy Differential (% of WTI) | | | 20.4 | | | | 17.9 | | | | 15.0 | | | | 15.0 | | | | 15.0 | | |
| | | Well-head Oil Price (C$/barrel)1 | | | 69.29 | | | | 75.29 | | | | 78.18 | | | | 79.69 | | | | 80.66 | | |
| | | Oil Production (million barrels) | | | 171.2 | | | | 171.8 | | | | 175.4 | | | | 174.0 | | | | 168.9 | | |
| | | Potash Price (mine netback, US$/KCl tonne)2 | | | 425 | | | | 395 | | | | 418 | | | | 435 | | | | 455 | | |
| | | Potash Price (mine netback, C$/K2O tonne)2 | | | 699 | | | | 654 | | | | 689 | | | | 728 | | | | 772 | | |
| | | Potash Sales (million K2O tonnes)2 | | | 8.8 | | | | 10.4 | | | | 10.7 | | | | 10.8 | | | | 10.9 | | |
| | | Canadian Dollar (US cents) | | | 99.94 | | | | 98.92 | | | | 99.43 | | | | 97.90 | | | | 96.60 | | |
| | 1 | The average price per barrel of Saskatchewan light, medium and heavy oil |
| | 2 | Ministry of Finance calculations derived from calendar-year forecasts |
NON-RENEWABLE RESOURCE REVENUE AS A SHARE OF GRF REVENUE
Budget Summary | Budget 2013/14 43
2013-14 GRF EXPENSE
GRF expense is estimated to be $11.5 billion in 2013-14, an increase of $346.6 million, or 3.1 per cent, from the 2012-13 Budget Estimate.
Operating expense (excluding capital transfers) is budgeted at $11.3 billion in 2013-14. This is a $337.3 million increase from the 2012-13 Budget.
Capital transfers to third parties total $274.6 million in 2013-14, a $9.3 million increase from the 2012-13 Budget.
Total GRF expense in 2013-14 is allocated by ministry as follows:
| ● | Health, $4.8 billion, or 41.9 per cent; |
| Education (including Teachers’ Pensions and Benefits), $1.7 billion, or 14.8 per cent; |
| Social Services, $889.6 million, or 7.7 per cent; |
| Advanced Education, $787.7 million, or 6.8 per cent; |
| Justice, $542.0 million, or 4.7 per cent; |
| Government Relations, $477.3 million, or 4.1 per cent; |
| Highways and Infrastructure, $423.3 million, or 3.7 per cent; |
| Agriculture, $406.9 million, or 3.5 per cent; |
| Debt Servicing, $340.0 million, or 2.9 per cent; |
| Economy, $275.5 million, or 2.4 per cent; and, |
| remaining ministries and agencies, $855.1 million, or 7.5 per cent. |
2013-14 GRF EXPENSE RECONCILIATION
By Ministry
| | | (Millions of Dollars) | | | | |
| | | 2012-13 Budget GRF Expense Estimate | | | 11,195.9 | | |
| | | Health | | | 161.7 | | |
| | | Education1 | | | 107.5 | | |
| | | Advanced Education | | | 63.4 | | |
| | | Social Services | | | 37.1 | | |
| | | Justice | | | 27.1 | | |
| | | Innovation Saskatchewan | | | 21.2 | | |
| | | Debt Servicing | | | (60.0 | ) | |
| | | Other Net Changes | | | (11.4 | ) | |
| | | Total Expense Change | | | 346.6 | | |
| | | 2013-14 Budget GRF Expense Estimate | | | 11,542.5 | | |
| | 1 | Includes Teachers’ Pensions and Benefits |
44 Budget 2013/14 | Budget Summary
COMPOSITION OF 2013-14 GRF EXPENSE
By Ministry
Total Expense: $11.5 billion | | Other inclues Debt-servicing costs (2.9% of total expense) |
By classification, 2013-14 expense is allocated as:
| ● | Third-party operating transfers, $7.8 billion, or 67.6 per cent; |
| Government-delivered programs, $1.9 billion, or 16.1 per cent; |
| Transfers to individuals, $1.3 billion, or 11.0 per cent; |
| Debt servicing, $340.0 million, or 2.9 per cent; and, |
| Third-party capital transfers, $274.6 million, or 2.4 per cent. |
This allocation represents a shift from debt-servicing costs (down 0.7 percentage points from the 2012-13 Budget) and transfers to individuals (down 0.5 percentage points) to third parties (up 1.2 percentage points).
COMPOSITION OF 2013-14 GRF EXPENSE
By Classification
Budget Summary | Budget 2013/14 45
2013-14 GRF CAPITAL INVESTMENTS
Total capital investments in 2013-14 are budgeted at $847.5 million, an increase of $59.8 million, or 7.6 per cent, from the 2012-13 Budget. This year’s capital investments include:
| $274.6 million in capital grants to third parties (included in GRF expense); and, |
| $572.9 million allocated for investments in government-owned infrastructure. |
Since 2008-09, nearly $5.8 billion has been invested in Saskatchewan’s infrastructure. This includes $3.1 billion in transfers to third parties for capital requirements and investments in government-owned infrastructure of $2.7 billion.
2013-14 CAPITAL INVESTMENTS
By Ministry
Total Capital Investments: $847.5 million |
GRF CAPITAL INVESTMENTS, 2008-09 TO 2013-14
| | * | Excludes $154 million that was subsequently used by recipients for operations in 2009-10. |
46 Budget 2013/14 | Budget Summary
MEDIUM-TERM GRF EXPENSE OUTLOOK
Last year’s budget set 4.0 per cent expense growth targets for the medium term.
Over the medium term, funding priorities will be addressed within a context of prudent and sustainable fiscal planning.
After growth of 3.1 per cent in 2013-14, GRF expense is now targeted at 3.0 per cent per year over the medium term.
COMPARISON OF GRF EXPENSE FORECASTS
Budget Summary | Budget 2013/14 47
FOUR-YEAR FINANCIAL PLAN
The Growth and Financial Security Act requires a four-year financial plan that sets out the Government’s plan for expense and revenue. The Act requires total expense to balance with or be less than total revenue in each year of the four-year plan.
In 2013-14, the GRF is estimated to have a $32.4 million surplus after a $32.4 million transfer to the Growth and Financial Security Fund (GFSF).
The estimated 2013-14 year-end balance in the GFSF is $695.1 million, with $512.7 million of the fund balance set aside for financial security and $182.4 million available for growth initiatives and debt reduction.
Beyond 2013-14, revenue is forecast to grow 3.8 per cent in 2014-15 and 4.0 per cent over the rest of the forecast period. This forecast incorporates the fiscal impacts of all measures announced in this year’s budget.
Over the same time period, expense growth is targeted at 3.0 per cent per year.
As a result, the GRF will post surpluses each year throughout the medium term, with a cumulative surplus of $461.3 million over the four-year planning period.
GRF FOUR-YEAR FINANCIAL PLAN
| | | (Millions of Dollars) | | | 2013-14 | | | | 2014-15 | | | | 2015-16 | | | | 2016-17 | | |
| | | Revenue | | | 11,607.3 | | | | 12,052.6 | | | | 12,528.7 | | | | 13,023.6 | | |
| | | Expense | | | 11,542.5 | | | | 11,888.8 | | | | 12,245.5 | | | | 12,612.8 | | |
| | | Pre-Transfer Surplus | | | 64.8 | | | | 163.8 | | | | 283.2 | | | | 410.8 | | |
| | | Transfer (to) GFSF – Security | | | – | | | | – | | | | – | | | | – | | |
| | | Transfer from GFSF – Security | | | – | | | | – | | | | – | | | | – | | |
| | | Transfer (to) GFSF – Growth | | | (32.4 | ) | | | (81.9 | ) | | | (141.6 | ) | | | (205.4 | ) | |
| | | Transfer from GFSF – Growth | | | – | | | | – | | | | – | | | | – | | |
| | | Net Transfer from (to) GFSF | | | (32.4 | ) | | | (81.9 | ) | | | (141.6 | ) | | | (205.4 | ) | |
| | | GRF Surplus | | | 32.4 | | | | 81.9 | | | | 141.6 | | | | 205.4 | | |
| | | GFSF Balance – Security | | | 512.7 | | | | 512.7 | | | | 512.7 | | | | 512.7 | | |
| | | GFSF Balance – Growth | | | 182.4 | | | | 264.3 | | | | 405.9 | | | | 611.3 | | |
| | | GFSF Year-end Balance | | | 695.1 | | | | 777.0 | | | | 918.6 | | | | 1,124.0 | | |
48 Budget 2013/14 | Budget Summary
GENERAL REVENUE FUND
2012-13 FINANCIAL UPDATE
The current 2012-13 General Revenue Fund (GRF) forecast shows that the GRF is on track to record a pre-transfer surplus of $8.8 million. This is $86.2 million less than budgeted as the result of:
| ● | a $190.4 million increase in expense, largely in areas driven by utilization or weather factors; partially offset by, |
| a $104.2 million increase in revenue, reflecting lower non-renewable resource revenue, higher tax revenue from a growing tax base and an additional dividend from the Crown Investments Corporation of Saskatchewan (CIC). |
Half of the pre-transfer surplus, or $4.4 million, will be transferred to the Growth and Financial Security Fund (GFSF).
After a $50.0 million transfer from the GFSF to the GRF to fund highway infrastructure, the GRF surplus is estimated to be $54.4 million in 2012-13. The year-end balance in the GFSF is forecast to be $662.7 million.
Government general public debt is forecast to be $3.8 billion on March 31, 2013, unchanged from last year.
The following table summarizes the 2012-13 GRF fiscal forecasts as published over the course of the fiscal year. Actual results for the 2012-13 fiscal year will be available with the release of the 2012-13 Public Accounts, Volume 1, expected in the summer of 2013.
GRF 2012-13 FINANCIAL FORECASTS
| | | (Millions of Dollars) | | | Budget Estimate | | | | 1st Quarter Forecast | | | | Mid-Year Projection | | | | 3rd Quarter Forecast | | | | Change from Budget | | |
| | | Revenue | | | 11,290.9 | | | | 11,177.7 | | | | 11,239.9 | | | | 11,395.1 | | | | 104.2 | | |
| | | Expense | | | 11,195.9 | | | | 11,165.9 | | | | 11,227.5 | | | | 11,386.3 | | | | 190.4 | | |
| | | Pre-Transfer Surplus | | | 95.0 | | | | 11.8 | | | | 12.4 | | | | 8.8 | | | | (86.2 | ) | |
| | | Transfer (to) GFSF | | | (47.5 | ) | | | (5.9 | ) | | | (6.2 | ) | | | (4.4 | ) | | | 43.1 | | |
| | | Transfer from GFSF | | | – | | | | – | | | | 50.0 | | | | 50.0 | | | | 50.0 | | |
| | | Net Transfer from (to) GFSF | | | (47.5 | ) | | | (5.9 | ) | | | 43.8 | | | | 45.6 | | | | 93.1 | | |
| | | GRF Surplus | | | 47.5 | | | | 5.9 | | | | 56.2 | | | | 54.4 | | | | 6.9 | | |
| | | GFSF Balance* | | | 756.4 | | | | 714.2 | | | | 664.5 | | | | 662.7 | | | | (93.7 | ) | |
| | | Government Debt** | | | 3,807.6 | | | | 3,807.6 | | | | 3,807.6 | | | | 3,807.6 | | | | – | | |
| | * | The 1st Quarter forecast and all subsequent forecasts reflect the actual 2012-13 opening balance of $708.3 million. |
| | ** | The Budget Estimate figure and all subsequent forecasts reflect the 2011-12 year-end actual level of $3,807.6 million. |
Budget Summary | Budget 2013/14 49
GROWTH AND FINANCIAL SECURITY FUND
The Growth and Financial Security Fund (GFSF) was established with the assent of The Growth and Financial Security Act.
The purpose of the GFSF is twofold:
| ● | to assist in the achievement of the Government of Saskatchewan’s long-term objectives by providing for financial security of the Government of Saskatchewan from year to year; and, |
| to provide a source of funds for programs identified as promoting or enhancing the economic development of Saskatchewan. |
Subsequently, transfers to the GFSF represent either:
| 50 per cent of any pre-transfer surplus for any fiscal year (required); or, |
| subject to the approval of Treasury Board, the amount of significant, unexpected revenues received for the fiscal year, as determined by the minister (special transfer). |
Transfers out of the GFSF may be made by the minister, subject to the approval of Treasury Board, with the objective of achieving the aforementioned two-fold purpose.
The GFSF balance at the end of 2012-13 is forecast to be $662.7 million.
Beginning in 2013-14, this amount will be segmented into two components, reflecting the fund’s dual purposes – (financial) security and growth (economic development). The growth component will be allocated an opening balance of $150 million. The security component will be allocated the remaining $512.7 million.
In the future, additional transfers from the GRF will accrue to the growth component, provided the security component has a balance of about $500 million.
50 Budget 2013/14 | Budget Summary
GROWTH AND FINANCIAL SECURITY FUND FORECAST
| | | (Millions of Dollars) | | | 2012-13 | | | | 2013-14 | | | | 2014-15 | | | | 2015-16 | | | | 2016-17 | | |
| | | Opening Balance* | | | 708.3 | | | | | | | | | | | | | | | | | | |
| | | Plus: Transfers from the GRF | | | | | | | | | | | | | | | | | | | | | |
| | | (50% of GRF pre-transfer surplus) | | | 4.4 | | | | | | | | | | | | | | | | | | |
| | | Less: Transfers (to) the GRF | | | | | | | | | | | | | | | | | | | | | |
| | | Highways Infrastructure | | | (50.0 | ) | | | | | | | | | | | | | | | | | |
| | | Net Transfers (to) from the GRF | | | (45.6 | ) | | | | | | | | | | | | | | | | | |
| | | Closing Balance | | | 662.7 | | | | | | | | | | | | | | | | | | |
| | | Opening Balance (Security)** | | | | | | | 512.7 | | | | 512.7 | | | | 512.7 | | | | 512.7 | | |
| | | Plus: Transfers from the GRF | | | | | | | – | | | | – | | | | – | | | | – | | |
| | | Less: Transfers (to) the GRF | | | | | | | – | | | | – | | | | – | | | | – | | |
| | | Net Transfers (to) from the GRF | | | | | | | – | | | | – | | | | – | | | | – | | |
| | | Closing Balance (Security) | | | | | | | 512.7 | | | | 512.7 | | | | 512.7 | | | | 512.7 | | |
| | | Opening Balance (Growth)** | | | | | | | 150.0 | | | | 182.4 | | | | 264.3 | | | | 405.9 | | |
| | | Plus: Transfers from the GRF | | | | | | | | | | | | | | | | | | | | | |
| | | (50% of GRF pre-transfer surplus) | | | | | | | 32.4 | | | | 81.9 | | | | 141.6 | | | | 205.4 | | |
| | | Less: Transfers (to) the GRF | | | | | | | – | | | | – | | | | – | | | | – | | |
| | | Net Transfers (to) from the GRF | | | | | | | 32.4 | | | | 81.9 | | | | 141.6 | | | | 205.4 | | |
| | | Closing Balance (Growth) | | | | | | | 182.4 | | | | 264.3 | | | | 405.9 | | | | 611.3 | | |
| | | Closing Balance | | | | | | | 695.1 | | | | 777.0 | | | | 918.6 | | | | 1,124.0 | | |
| | * | 2012-13 opening balance reflects actual 2011-12 closing balance. |
| | ** | Beginning in 2013-14, the GFSF is segmented into Security and Growth. |
Budget Summary | Budget 2013/14 51
DEBT RETIREMENT FUND
The Debt Retirement Fund (DRF) was established with the assent of The Growth and Financial Security Act.
The DRF is an accounting of the surpluses of the General Revenue Fund (GRF) that are allocated to the fund on or after April 1, 2008.
The purpose of the DRF is to assist in achieving the long-term objective of the Government of Saskatchewan in eliminating the debt.
Allocations to the DRF represent either:
| ● | 50 per cent of any pre-transfer surplus for any fiscal year (required); or, |
| ● | a transfer made out of the Growth and Financial Security Fund (GFSF) by the minister, subject to the approval of Treasury Board, for the purpose of assisting in the long-term objective of eliminating the debt. |
The DRF balance at the end of 2013-14 is forecast to be $3.3 billion.
DEBT RETIREMENT FUND FORECAST
| | | (Millions of Dollars) | | | 2012-13 | | | | 2013-14 | | | | 2014-15 | | | | 2015-16 | | | | 2016-17 | | |
| | | Opening Balance* | | | 3,213.4 | | | | 3,267.8 | | | | 3,300.2 | | | | 3,382.1 | | | | 3,523.7 | | |
| | | Plus: GRF Surplus | | | 54.4 | | | | 32.4 | | | | 81.9 | | | | 141.6 | | | | 205.4 | | |
| | | Closing Balance | | | 3,267.8 | | | | 3,300.2 | | | | 3,382.1 | | | | 3,523.7 | | | | 3,729.1 | | |
| | * | 2012-13 opening balance reflects cumulative GRF surpluses over the 2008-09 to 2011-12 period. |
52 Budget 2013/14 | Budget Summary
2013-14 BORROWING AND DEBT
The General Revenue Fund (GRF) borrows for government and Crown corporations.
Public Debt as reported in the Province’s financial statements is comprised of:
| ● | Gross Debt – the amount of money owed to lenders; less |
| Sinking Funds – the amount of money which has been set aside for the repayment of debt. |
Public debt is discussed in this budget paper.
Crown corporations are responsible for the principal and interest payments on their debt. Crown corporation debt is incurred in the normal course of business, primarily for investment in infrastructure and business development initiatives which provide revenue streams to service the debt.
Crown corporation debt is divided into two components: Crown corporation general debt and government business enterprise specific debt. This is consistent with the way these amounts are segregated in the Public Accounts.
Government business enterprises are self-sufficient government organizations that have the financial and operating authority to sell goods and services to individuals and organizations outside government as their principal activity. Amounts borrowed specifically for these enterprises are disclosed separately from other government debt, because they are expected to be repaid from cash flows generated by these business enterprises.
All other Crown corporation debt is classified as Crown corporation general debt. This debt includes amounts that can be repaid from business activities of the Crown sector and amounts that can only be repaid with assistance from government.
Public debt is forecast to increase by $1,033.7 million during 2012-13 and increase by an additional $768.1 million in 2013-14.
Government general public debt is forecast to remain unchanged in 2012-13 and 2013-14.
Crown corporation general public debt is forecast to rise by $337.2 million during 2012-13 and decline by $162.8 million during 2013-14. The changes are primarily due to fluctuations in short-term debt for the utility Crown corporations and the reclassification of debt of the Saskatchewan Liquor and Gaming Authority.
Government business enterprise specific public debt is forecast to increase by $696.5 million during 2012-13 and increase by an additional $930.9 million during 2013-14. The increases in both years are largely attributable to higher long-term debt for the utility Crown corporations.
Budget Summary | Budget 2013/14 53
DEBT OF THE GENERAL REVENUE FUND
As at March 31
| | | (Millions of Dollars) | | Estimated 2014 | | | Forecast 2013 | | | Actual 2012 | | |
| | | Government General | | | | | | | | | | |
| | | Gross Debt | | | 4,862.2 | | | | 5,021.4 | | | | 5,906.9 | | |
| | | Sinking Funds | | | 1,054.6 | | | | 1,213.8 | | | | 2,099.3 | | |
| | | Government General Public Debt | | | 3,807.6 | | | | 3,807.6 | | | | 3,807.6 | | |
| | | Crown Corporation General | | | | | | | | | | | | | |
| | | Gross Debt | | | 786.4 | | | | 946.2 | | | | 600.3 | | |
| | | Sinking Funds | | | 55.2 | | | | 52.2 | | | | 43.5 | | |
| | | Crown Corporation General Public Debt | | | 731.2 | | | | 894.0 | | | | 556.8 | | |
| | | Government Business Enterprise Specific | | | | | | | | | | | | | |
| | | Gross Debt | | | 6,118.6 | | | | 5,162.0 | | | | 4,403.6 | | |
| | | Sinking Funds | | | 585.9 | | | | 560.2 | | | | 498.3 | | |
| | | Government Business Enterprise Specific | | | | | | | | | | | | | |
| | | | | | 5,532.7 | | | | 4,601.8 | | | | 3,905.3 | | |
| | | Public Debt | | | 10,071.5 | | | | 9,303.4 | | | | 8,269.7 | | |
| | | Guaranteed Debt | | | 183.1 | | | | 135.2 | | | | 93.8 | | |
PUBLIC DEBT OF THE GENERAL REVENUE FUND
As at March 31
54 Budget 2013/14 | Budget Summary
GRF PUBLIC DEBT AS A % OF GDP
As at March 31
GENERAL REVENUE FUND BORROWING
The Province’s 2013-14 borrowing requirements are estimated to be $1,594.9 million, compared to forecast requirements of $1,387.7 million in 2012-13.
Borrowing requirements for government in 2013-14, estimated to be $468.4 million (2012-13 forecast: $222.1 million), are for the purpose of refinancing maturing debt.
Borrowing requirements for Crown corporations in 2013-14, estimated to be $1,126.5 million (2012-13 forecast: $1,165.6 million), are primarily to assist with financing capital expenditures.
Budget Summary | Budget 2013/14 55
| | Reconciliation of Surplus and Change in Government General Public Debt The amount by which government general public debt will change may be higher or lower than the surplus reported under the accrual basis of accounting. The difference between the surplus and the amount by which government general public debt will change is reconciled by: | |
| | 1. | Adjusting the surplus to a cash basis to recognize the amount and timing of non-cash revenues and expenditures to determine the cash provided from operations; | |
| | 2. | Adjusting for cash required for capital acquisitions; | |
| | 3. | Adding other cash sources or subtracting other cash requirements to recognize the amount of cash inflows and outflows from loan, investment and other activities to determine the cash available to reduce debt; and, | |
| | 4. | Adding changes in sinking funds which will be used to repay government general public debt. | |
| | | | | | | | | | | | | Estimated 2013-14 | | | | | | | | Forecast 2013-13 | | |
| | | | | | | | | ($ Millions) | | |
| | | | | | | | | | | | | | | | | | | | | | | |
| | Surplus (on Accrual Accounting Basis) | | | | | | | | 32.4 | | | | | | | | 54.4 | | |
| | | 1. | Adjustment to Cash Basis | | | | | | | | 213.4 | | | | | | | | (36.9 | ) | |
| | Cash Provided by Operations | | | | | | | | 245.8 | | | | | | | | 17.5 | | |
| | | 2. | Capital Acquisitions | | | | | | | | (572.9 | ) | | | | | | | (571.17 | ) | |
| | | 3. | Other Cash Sources | | | | | | | | | | | | | | | | | | |
| | | | ● | Sinking Fund Proceeds | | | | 247.2 | | | | | | | | 1,039.8 | | | | | | |
| | | | ● | CIC Equity Repayment | | | | 0.0 | | | | | | | | 150.0 | | | | | | |
| | | | ● | Change in Deposits Held | | | | 185.0 | | | | | | | | 128.1 | | | | | | |
| | | | ● | Change in Cash Balance | | | | 80.6 | | | | | | | | 154.6 | | | | | | |
| | | | ● | Other | | | | (26.5 | ) | | | 486.3 | | | | (32.8 | ) | | | 1,439.7 | | |
| | Cash Available to Reduce Debt | | | | | | | | 159.2 | | | | | | | | 885.5 | | |
| | | 4. | Change in Sinking Funds | | | | | | | | (159.2 | ) | | | | | | | (885.5 | ) | |
| | Decrease in Government General Public Debt | | | | | | | | 0.0 | | | | | | | | 0.0 | | |
| | | | | | | | | | | | | | | | | | | | | | | |
56 Budget 2013/14 | Budget Summary
COST OF SERVICING DEBT
In addition to interest payments, debt servicing costs include all charges related to the gross debt, such as: the amortization of premiums, discounts, and commissions; and, gains or losses on foreign currency debt that result from a change in the value of the Canadian dollar.
The 2013-14 debt servicing cost estimates are based on 1.5 per cent short-term and 4.5 per cent long-term interest rates. A one percentage point increase in interest rates for a full year from levels assumed in the budget would increase the estimated cost of servicing government debt in 2013-14 by approximately $14.5 million.
COST OF SERVICING DEBT
| | | | | Estimated | | | Forecast | | |
| | | (Millions of Dollars) | | | 2013-14 | | | | 2012-13 | | |
| | | Government General Debt | | | 340.0 | | | | 392.0 | | |
| | | Crown Corporation General Debt | | | 25.1 | | | | 20.8 | | |
| | | Government Business Enterprise Specific Debt | | | 245.0 | | | | 248.1 | | |
| | | Total Cost of Servicing Gross Debt | | | 610.1 | | | | 660.9 | | |
SUMMARY STATEMENT OF DEBT
GRF debt includes all debt borrowed by the GRF for either government purposes or the purposes of certain Crown corporations. Some Crown corporations and other organizations have additional obligations to other entities. The GRF is not responsible for this other debt.
The Summary Schedule of Debt on page 88 calculates the combined public debt of government entities by listing both the GRF debt and the debt to other entities.
SUMMARY STATEMENT OF DEBT
As at March 31
| | | | | | | | Forecast | | | Actual | | |
| | | (Millions of Dollars) | | 2014 | | | 2013 | | | 2012 | | |
| | | GRF Public Debt for Government | | | 3,807.6 | | | | 3,807.6 | | | | 3,807.6 | | |
| | | GRF Public Debt for Crown Corporations | | | 6,263.9 | | | | 5,495.8 | | | | 4,462.1 | | |
| | | GRF Public Debt | | | 10,071.5 | | | | 9,303.4 | | | | 8,269.7 | | |
| | | Other Debt | | | 374.3 | | | | 307.1 | | | | 232.4 | | |
| | | Summary Statement of Debt | | | 10,445.8 | | | | 9,610.5 | | | | 8,502.1 | | |
| | | Summary Statement of Guaranteed Debt | | | 37.9 | | | | 30.2 | | | | 28.4 | | |
Budget Summary | Budget 2013/14 57
SASKATCHEWAN'S TAX EXPENDITURES
INTRODUCTION
Although the primary purpose of taxation is to raise revenue, governments also attain some of their social and economic goals by reducing the taxes paid by certain taxpayers. These reductions are commonly called “tax expenditures” and include such measures as exemptions, deductions, tax credits, preferential tax rates or deferrals. Each provides special or preferential treatment to certain taxpayers or to certain types of activity. Taken together, they provide assistance to a variety of individuals and businesses, including families, farmers, senior citizens and small businesses.
While tax expenditures are usually absorbed in the overall revenue estimates and are not presented in the same way as direct spending programs, they reduce the amount of revenue generated by a government and they affect a government’s fiscal position in the same way as direct expenditures.
RATIONALE FOR TAX EXPENDITURES
Tax expenditures can achieve a number of objectives, such as enhancing the fairness of the tax system or promoting certain types of economic activity. In pursuing these objectives, some tax expenditures have become fundamental elements of the tax system.
Saskatchewan’s sales tax does not apply to certain basic items such as food, residential natural gas, residential electricity, children’s clothing and reading materials, thereby reducing the taxes paid by families consuming these basic items. This treatment is in contrast to the federal Goods and Services Tax (GST) and the sales taxes of provinces that have harmonized their sales taxes with the GST, since those taxes apply to a much broader range of goods and services purchased by families.
The Province’s Fuel Tax exemption provides tax-free treatment to farm-use diesel fuel, through a fuel-colouring program, and a partial tax exemption for farm-use gasoline when purchased in bulk.
Saskatchewan’s personal income tax system applies provincial marginal tax rates directly to taxable income as defined for federal income tax purposes. As a result, deductions that contribute to the federal determination of taxable income, such as the deduction for Registered Retirement Savings Plan contributions, also affect Saskatchewan income tax revenue. The impacts of several of these deductions are estimated in this paper.
In addition, Saskatchewan’s personal income tax system has distinct provincial non-refundable income tax credits that recognize the personal circumstances of the taxpayer, including family-based credits, disability-related credits and educational credits. This paper also provides estimates of the revenue impacts of several of these provincial non-refundable tax credits.
To improve tax competitiveness, Saskatchewan levies a lower income tax rate on small businesses and a special income tax rate on manufacturing and processing (M&P) profits. Saskatchewan also provides a refundable Investment Tax Credit (ITC) to assist M&P companies that invest in qualifying new or used M&P assets for use in Saskatchewan.
58 Budget 2013/14 | Budget Summary
ASSOCIATED COSTS
While tax expenditures serve important social and economic objectives, the introduction of any tax expenditure results in associated costs. These costs take several forms.
| ● | First, there is the cost of forgone revenue. Tax expenditures result in the reduction of revenue collected and have a significant impact on a government’s financial position. |
| ● | Second, tax expenditures may add to the complexity of the tax system, leading to increased administrative effort by both taxpayers and governments. |
| ● | Third, tax expenditures may create distortions in consumer and other economic behaviour. For example, the exemption for restaurant meals and snack foods provides preferential treatment for this category of consumer expenditure. |
| ● | Finally, tax expenditures may create increased compliance costs for both businesses and consumers. |
GOVERNMENT OF CANADA TAX EXPENDITURES
The federal government produces a detailed presentation on tax expenditures that are part of the federal tax system. Since Saskatchewan’s personal and corporate income taxes are based upon the federal definition of taxable income, many of the federal tax expenditures have an impact on Saskatchewan’s revenue. Readers interested in examining the federal government’s presentation of tax expenditures are invited to contact the Finance Canada Distribution Centre in Ottawa or visit the website www.fin.gc.ca (and click on “Publications & Reports”).
2013 SASKATCHEWAN TAX EXPENDITURES
The following tables provide estimates of the major tax expenditures of the Government of Saskatchewan in 2013, calculated using tax collection data and Statistics Canada data. Included in these estimates is the impact of indexing the personal income tax system by 2.0 per cent for 2013 and the impact on the Labour-sponsored Venture Capital Tax Credit of reducing the annual investment limit under the Invest in Saskatchewan Program.
Budget Summary | Budget 2013/14 59
| | 2013 Government of Saskatchewan Tax Expenditure Accounts (Value of Tax Expenditures in Millions of Dollars) | | | | |
| | Sales Tax | | | | |
| | Exemptions | | | | | |
| | | | 1. | | Children’s clothing and footwear | | | 10.8 | | |
| | | | 2. | | Prescription drugs | | | 32.6 | | |
| | | | 3. | | Electricity | | | 42.3 | | |
| | | | 4. | | Farm machinery and repair parts | | | 77.1 | | |
| | | | 5. | | Fertilizer, pesticide and seed | | | 137.5 | | |
| | | | 6. | | Food | | | | | |
| | | | | | – Restaurant meals and snack foods | | | 75.3 | | |
| | | | | | – Basic groceries | | | 119.7 | | |
| | | | 7. | | Natural gas | | | 22.1 | | |
| | | | 8. | | Reading materials | | | 8.6 | | |
| | | | 9. | | Services | | | | | |
| | | | | | – Construction | | | 479.8 | | |
| | | | | | – Other | | | 32.5 | | |
| | | | 10. | | Used goods – exemption amounts | | | 0.5 | | |
| | | | 11. | | Light used vehicles | | | 52.3 | | |
| | | | 12. | | Direct agents | | | 19.6 | | |
| | | | 13. | | Eligible energy efficient appliances, furnaces and boilers | | | 3.0 | | |
| | | | 14. | | Toll-free telephone services | | | 0.2 | | |
| | | | 15. | | Municipal fire trucks | | | 0.1 | | |
| | | | 16. | | Mineral exploration equipment | | | 0.1 | | |
| | | | | | | | | | | |
| | Fuel Tax | | | | | |
| | | | 1. | | Exemption for farm activity | | | 106.8 | | |
| | | | 2. | | Exemption for heating fuels | | | 26.3 | | |
| | | | 3. | | Exemption for primary producers | | | 1.2 | | |
| | | | | | | | | | | |
| | Personal Income Tax | | | | | |
| | Deductions from Income | | | | | |
| | | | 1. | | Registered Pension Plan contributions | | | 91.5 | | |
| | | | 2. | | Registered Retirement Savings Plan contributions | | | 163.9 | | |
| | | | 3. | | Annual union, professional or like dues | | | 17.8 | | |
| | | | 4. | | Child care expenses | | | 12.8 | | |
| | | | 5. | | Moving expenses | | | 2.7 | | |
| | | | 6. | | Carrying charges | | | 15.5 | | |
| | | | 7. | | Allowable employment expenses | | | 17.1 | | |
| | | | 8. | | $750,000 capital gains deduction | | | 69.2 | | |
60 Budget 2013/14 | Budget Summary
| | Saskatchewan Non-Refundable Tax Credits | | | | | |
| | | | 1. | | Basic personal tax credit | | | 960.7 | | |
| | | | 2. | | Spousal tax credit | | | 44.5 | | |
| | | | 3. | | Equivalent-to-spouse tax credit | | | 19.6 | | |
| | | | 4. | | Age tax credit | | | 39.5 | | |
| | | | 5. | | Supplement to the age tax credit | | | 12.8 | | |
| | | | 6. | | Dependent child tax credit | | | 77.6 | | |
| | | | 7. | | Canada Pension Plan contributions tax credit | | | 74.1 | | |
| | | | 8. | | Employment Insurance premiums tax credit | | | 26.6 | | |
| | | | 9. | | Pension income tax credit | | | 13.9 | | |
| | | | 10. | | Tuition and education tax credit | | | 33.7 | | |
| | | | 11. | | Student loan interest tax credit | | | 1.1 | | |
| | | | 12. | | Disability tax credit | | | 14.2 | | |
| | | | 13. | | Caregiver tax credit | | | 2.3 | | |
| | | | 14. | | Medical expenses tax credit | | | 26.7 | | |
| | | | 15. | | Charitable contributions tax credit | | | 44.6 | | |
| | | | 16. | | First-time homebuyers tax credit | | | 6.6 | | |
| | | | | | | |
| | Other Saskatchewan Tax Measures | | | | | |
| | | | 1. | | Saskatchewan Low-Income Tax Credit | | | 80.0 | | |
| | | | 2. | | Labour-sponsored Venture Capital Tax Credit | | | 16.0 | | |
| | | | 3. | | Mineral Exploration Tax Credit | | | 0.5 | | |
| | | | 4. | | Employees’ Tool Tax Credit | | | 1.0 | | |
| | | | 5. | | Political Contributions Tax Credit | | | 0.8 | | |
| | | | 6. | | Graduate Retention Program Tax Credit | | | 42.8 | | |
| | | | | | | |
| | Corporation Income Tax | | | | | |
| | | | | | | | | | | |
| | | | 1. | | Lower tax rate for small business | | | 346.1 | | |
| | | | 2. | | Royalty Tax Rebate | | | 1.0 | | |
| | | | 3. | | Manufacturing and Processing Profits Tax Reduction | | | 10.0 | | |
| | | | 4. | | Investment Tax Credit for Manufacturing and Processing | | | 45.0 | | |
| | | | 5. | | Research and Development Tax Credit | | | 5.5 | | |
Budget Summary | Budget 2013/14 61
2013 INTERCITY COMPARISON OF TAXES,
UTILITIES AND HOUSING
INTRODUCTION
A number of factors contribute to the quality of life enjoyed by individuals and families in Saskatchewan and across Canada. For example, access to excellent health care, education and social services is a key part of the overall quality of life.
Other important factors that affect quality of life are the level of taxation, the cost of utilities and auto insurance and household costs for rent and mortgages.
Calculating the combined cost of provincial taxes, utilities and housing is a reliable way to compare the attractiveness of living in different parts of Canada.
For the purposes of such a comparison, the total cost of such taxes, utilities and housing for representative families living in Regina has been compared with the costs those families would face in other major cities across the country.
The provincial taxes, utilities and housing costs associated with the following family characteristics and income levels have been calculated to provide a representative comparison:
| ● | a single person, living in rental accommodation, with an annual income of $25,000; |
| ● | a family of two adults and two dependent children, owning its own home, with an annual family income of $50,000; and, |
| ● | a family of two adults and two dependent children, owning its own home, with an annual family income of $75,000. |
PERSONAL INCOME TAX REDUCTIONS SINCE 2007
Significant personal income tax reductions have been introduced since 2007, resulting in an estimated 114,000 Saskatchewan residents no longer paying provincial income tax. In total, $473 million in tax savings are being provided to Saskatchewan residents in 2013.
VALUE OF TAX REDUCTIONS AND ENHANCED BENEFITS
2013 TAXATION YEAR
| | | | Millions of Dollars | | |
| | | 2011 Personal Income Tax Exemption Enhancements | | | 60 | | |
| | | 2008 Personal Income Tax Exemption Enhancements | | | 246 | | |
| | | Low-Income Tax Credit Enhancement | | | 46 | | |
| | | Indexation for the 2008 to 2013 Taxation Years | | | 102 | | |
| | | Other Measures* | | | 19 | | |
| | | Total Tax Reductions and Enhanced Benefits Since 2007 | | | 473 | | |
| | | * | Includes the Active Families Benefit, enhancements to the disability-related tax credit amounts and the First-Time Homebuyers Tax Credit. |
62 Budget 2013/14 | Budget Summary
SASKATCHEWAN’S RANKING FOR 2013
In 2013, Saskatchewan individuals and families pay total provincial taxes that are very competitive with those paid in other Canadian cities, with a consistent ranking of second lowest in Canada for all three representative family situations.
Regina also ranks favourably with other cities in Canada when comparing provincial taxes and utilities. For all three representative family situations, Regina ranks as having the lowest overall combined taxes and utilities of the ten cities surveyed.
When the combined taxes, utilities and housing costs of the representative families are considered, Regina also compares very favourably with other Canadian cities.
Budget Summary | Budget 2013/14 63
| | 2013 Intercity Comparison of Taxes, Utilities and Housing Single Person at $25,000 Total Income | | | | | | | |
| | | | | | | | | | | | | | | | | | | | | | | | | | | | | | | | |
| | | | Vancouver | | | Calgary | | | Regina | | | Winnipeg | | | Toronto | | | Montréal | | | | | | Halifax | | | | | St. John’s | |
| | Provincial Taxes and Health Premiums | | | | | | | | | | | | | | | | |
| | Provincial | | | | | | | | | | | | | | | | | | | | | | | | | | | | | | |
| | Income Tax | | | 477 | | | | 587 | | | | 905 | | | | 1,575 | | | | 702 | | | | 1,463 | | | | 989 | | | | 1,317 | | | | 1,544 | | | | 1,156 | |
| | Tax Credits and | | | | | | | | | | | | | | | | | | | | | | | | | | | | | | | | | | | | | | | | |
| | Rebates | | | (123 | ) | | | 0 | | | | (234 | ) | | | (700 | ) | | | (540 | ) | | | (931 | ) | | | 0 | | | | (255 | ) | | | 0 | | | | 0 | |
| | Health Premiums | | | 307 | | | | 0 | | | | 0 | | | | 0 | | | | 300 | | | | 571 | | | | 0 | | | | 0 | | | | 0 | | | | 0 | |
| | Retail Sales Tax | | | 453 | | | | 0 | | | | 267 | | | | 413 | | | | 664 | | | | 838 | | | | 675 | | | | 844 | | | | 721 | | | | 687 | |
| | Gasoline Tax | | | 322 | | | | 90 | | | | 150 | | | | 140 | | | | 147 | | | | 167 | | | | 107 | | | | 155 | | | | 158 | | | | 165 | |
| | Total Provincial | | | | | | | | | | | | | | | | | | | | | | | | | | | | | | | | | | | | | | | | |
| | Taxes and Health | | | | | | | | | | | | | | | | | | | | | | | | | | | | | | | | | | | | | | | | |
| | Premiums | | | 1,436 | | | | 677 | | | | 1,088 | | | | 1,428 | | | | 1,273 | | | | 2,108 | | | | 1,771 | | | | 2,061 | | | | 2,423 | | | | 2,008 | |
| | Household Utility Costs | | | | | | | | | | | | | | | | | | | | | | | | | | | | | | | | | | | | | | | | |
| | Electricity | | | 365 | | | | 772 | | | | 718 | | | | 393 | | | | 640 | | | | 393 | | | | 597 | | | | 768 | | | | 847 | | | | 683 | |
| | Telephone | | | 333 | | | | 320 | | | | 258 | | | | 314 | | | | 327 | | | | 327 | | | | 329 | | | | 342 | | | | 340 | | | | 329 | |
| | Auto Insurance | | | 1,536 | | | | 2,101 | | | | 1,050 | | | | 1,012 | | | | 5,230 | | | | 1,728 | | | | 1,723 | | | | 1,922 | | | | 1,673 | | | | 2,667 | |
| | Total Household | | | | | | | | | | | | | | | | | | | | | | | | | | | | | | | | | | | | | | | | |
| | Utility Costs | | | 2,234 | | | | 3,193 | | | | 2,026 | | | | 1,719 | | | | 6,197 | | | | 2,448 | | | | 2,649 | | | | 3,032 | | | | 2,860 | | | | 3,679 | |
| | Total Taxes | | | | | | | | | | | | | | | | | | | | | | | | | | | | | | | | | | | | | | | | |
| | and Utilities | | | 3,670 | | | | 3,870 | | | | 3,114 | | | | 3,147 | | | | 7,470 | | | | 4,556 | | | | 4,420 | | | | 5,093 | | | | 5,283 | | | | 5,687 | |
| | Housing Costs | | | | | | | | | | | | | | | | | | | | | | | | | | | | | | | | | | | | | | | | |
| | Rent | | | 11,764 | | | | 11,496 | | | | 9,972 | | | | 8,448 | | | | 12,084 | | | | 7,644 | | | | 7,044 | | | | 9,276 | | | | 7,572 | | | | 8,508 | |
| | Total of Taxes, | | | | | | | | | | | | | | | | | | | | | | | | | | | | | | | | | | | | | | | | |
| | Utilities and | | | | | | | | | | | | | | | | | | | | | | | | | | | | | | | | | | | | | | | | |
| | Housing | | | 15,434 | | | | 15,366 | | | | 13,086 | | | | 11,595 | | | | 19,554 | | | | 12,200 | | | | 11,464 | | | | 14,369 | | | | 12,855 | | | | 14,195 | |
64 Budget 2013/14 | Budget Summary
| | 2013 Intercity Comparison of Taxes, Utilities and Housing Family at $50,000 Total Income | | | | | | | | | | | | | |
| | | | | | | | | | | | | | | | | | | | | | | | | | | | | | | | |
| | | | Vancouver | | | Calgary | | | Regina | | | Winnipeg | | | Toronto | | | Montréal | | | | | | Halifax | | | | | St. John’s | |
| | Provincial Taxes and Health Premiums | | | | | | | | | | | | | | | | | | | |
| | Provincial | | | | | | | | | | | | | | | | | | | | | | | | | | | | | | |
| | Income Tax | | | 872 | | | | 994 | | | | 207 | | | | 2,246 | | | | 188 | | | | 2,044 | | | | 2,085 | | | | 2,396 | | | | 2,795 | | | | 2,081 | |
| | Tax Credits and | | | | | | | | | | | | | | | | | | | | | | | | | | | | | | | | | | | | | | | | |
| | Rebates | | | (110 | ) | | | (881 | ) | | | (326 | ) | | | (700 | ) | | | (452 | ) | | | (540 | ) | | | 0 | | | | 0 | | | | 0 | | | | 0 | |
| | Active Families | | | | | | | | | | | | | | | | | | | | | | | | | | | | | | | | | | | | | | | | |
| | Benefit | | | 0 | | | | 0 | | | | (300 | ) | | | (109 | ) | | | (105 | ) | | | 0 | | | | 0 | | | | (88 | ) | | | 0 | | | | 0 | |
| | Health Premiums | | | 1,596 | | | | 0 | | | | 0 | | | | 0 | | | | 300 | | | | 1,142 | | | | 0 | | | | 0 | | | | 0 | | | | 0 | |
| | Retail Sales Tax | | | 1,323 | | | | 0 | | | | 787 | | | | 1,198 | | | | 1,922 | | | | 2,420 | | | | 1,950 | | | | 2,437 | | | | 2,107 | | | | 1,950 | |
| | Gasoline Tax | | | 644 | | | | 180 | | | | 300 | | | | 280 | | | | 294 | | | | 334 | | | | 214 | | | | 310 | | | | 316 | | | | 330 | |
| | Total Provincial | | | | | | | | | | | | | | | | | | | | | | | | | | | | | | | | | | | | | | | | |
| | Taxes and Health | | | | | | | | | | | | | | | | | | | | | | | | | | | | | | | | | | | | | | | | |
| | Premiums | | | 4,325 | | | | 293 | | | | 668 | | | | 2,915 | | | | 2,147 | | | | 5,400 | | | | 4,249 | | | | 5,055 | | | | 5,218 | | | | 4,361 | |
| | Household Utility Costs | | | | | | | | | | | | | | | | | | | | | | | | | | | | | | | | | | | | | | | | |
| | Home Heating | | | 1,023 | | | | 699 | | | | 853 | | | | 858 | | | | 832 | | | | 1,417 | | | | 1,994 | | | | 1,595 | | | | 2,893 | | | | 2,768 | |
| | Electricity | | | 603 | | | | 1,201 | | | | 1,091 | | | | 632 | | | | 1,071 | | | | 581 | | | | 915 | | | | 1,258 | | | | 1,265 | | | | 1,062 | |
| | Telephone | | | 333 | | | | 320 | | | | 258 | | | | 314 | | | | 327 | | | | 327 | | | | 329 | | | | 342 | | | | 340 | | | | 329 | |
| | Auto Insurance | | | 1,536 | | | | 2,101 | | | | 1,050 | | | | 1,012 | | | | 5,230 | | | | 1,728 | | | | 1,723 | | | | 1,922 | | | | 1,673 | | | | 2,667 | |
| | Total Household | | | | | | | | | | | | | | | | | | | | | | | | | | | | | | | | | | | | | | | | |
| | Utility Costs | | | 3,495 | | | | 4,321 | | | | 3,252 | | | | 2,816 | | | | 7,460 | | | | 4,053 | | | | 4,961 | | | | 5,117 | | | | 6,171 | | | | 6,826 | |
| | Total Taxes | | | | | | | | | | | | | | | | | | | | | | | | | | | | | | | | | | | | | | | | |
| | and Utilities | | | 7,820 | | | | 4,614 | | | | 3,920 | | | | 5,731 | | | | 9,607 | | | | 9,453 | | | | 9,210 | | | | 10,172 | | | | 11,389 | | | | 11,187 | |
| | Housing Costs | | | | | | | | | | | | | | | | | | | | | | | | | | | | | | | | | | | | | | | | |
| | Mortgage Costs | | | 24,018 | | | | 12,493 | | | | 9,772 | | | | 8,594 | | | | 16,497 | | | | 8,386 | | | | 5,427 | | | | 8,547 | | | | 5,017 | | | | 7,706 | |
| | Net Property Taxes | | | 3,469 | | | | 2,383 | | | | 2,513 | | | | 2,965 | | | | 2,993 | | | | 3,083 | | | | 2,701 | | | | 2,375 | | | | 2,600 | | | | 1,986 | |
| | Total Housing | | | | | | | | | | | | | | | | | | | | | | | | | | | | | | | | | | | | | | | | |
| | Costs | | | 27,487 | | | | 14,876 | | | | 12,285 | | | | 11,559 | | | | 19,490 | | | | 11,469 | | | | 8,128 | | | | 10,922 | | | | 7,617 | | | | 9,692 | |
| | Total of Taxes, | | | | | | | | | | | | | | | | | | | | | | | | | | | | | | | | | | | | | | | | |
| | Utilities and | | | | | | | | | | | | | | | | | | | | | | | | | | | | | | | | | | | | | | | | |
| | Housing | | | 35,307 | | | | 19,490 | | | | 16,205 | | | | 17,290 | | | | 29,097 | | | | 20,922 | | | | 17,338 | | | | 21,094 | | | | 19,006 | | | | 20,879 | |
Budget Summary | Budget 2013/14 65
| | 2013 Intercity Comparison of Taxes, Utilities and HousingFamily at $75,000 Total Income | | | | | | | | | | | | | |
| | | | | | | | | | | | | | | | | | | | | | | | | | | | | | | | |
| | | | Vancouver | | | Calgary | | | Regina | | | Winnipeg | | | Toronto | | | Montréal | | | | | | Halifax | | | | | St. John’s | |
| | Provincial Taxes and Health Premiums | | | | | | | | | | | | | | | | | | | |
| | Provincial | | | | | | | | | | | | | | | | | | | | | | | | | | | | | | |
| | Income Tax | | | 2,431 | | | | 3,204 | | | | 2,811 | | | | 5,239 | | | | 2,425 | | | | 6,317 | | | | 4,590 | | | | 5,367 | | | | 5,598 | | | | 4,415 | |
| | Tax Credits and | | | | | | | | | | | | | | | | | | | | | | | | | | | | | | | | | | | | | | | | |
| | Rebates | | | 0 | | | | 0 | | | | 0 | | | | (700 | ) | | | 0 | | | | 0 | | | | 0 | | | | 0 | | | | 0 | | | | 0 | |
| | Active Families | | | | | | | | | | | | | | | | | | | | | | | | | | | | | | | | | | | | | | | | |
| | Benefit | | | 0 | | | | 0 | | | | (300 | ) | | | (109 | ) | | | (105 | ) | | | 0 | | | | 0 | | | | (88 | ) | | | 0 | | | | 0 | |
| | Health Premiums | | | 1,596 | | | | 0 | | | | 0 | | | | 0 | | | | 750 | | | | 1,142 | | | | 0 | | | | 0 | | | | 0 | | | | 0 | |
| | Retail Sales Tax | | | 1,868 | | | | 0 | | | | 1,112 | | | | 1,678 | | | | 2,679 | | | | 3,370 | | | | 2,713 | | | | 3,392 | | | | 2,932 | | | | 2,713 | |
| | Gasoline Tax | | | 644 | | | | 180 | | | | 300 | | | | 280 | | | | 294 | | | | 334 | | | | 214 | | | | 310 | | | | 316 | | | | 330 | |
| | Total Provincial | | | | | | | | | | | | | | | | | | | | | | | | | | | | | | | | | | | | | | | | |
| | Taxes and Health | | | | | | | | | | | | | | | | | | | | | | | | | | | | | | | | | | | | | | | | |
| | Premiums | | | 6,539 | | | | 3,384 | | | | 3,923 | | | | 6,388 | | | | 6,043 | | | | 11,163 | | | | 7,517 | | | | 8,981 | | | | 8,846 | | | | 7,458 | |
| | Household Utility Costs | | | | | | | | | | | | | | | | | | | | | | | | | | | | | | | | | | | | | | | | |
| | Home Heating | | | 1,023 | | | | 699 | | | | 853 | | | | 858 | | | | 832 | | | | 1,417 | | | | 1,994 | | | | 1,595 | | | | 2,893 | | | | 2,768 | |
| | Electricity | | | 603 | | | | 1,201 | | | | 1,091 | | | | 632 | | | | 1,071 | | | | 581 | | | | 915 | | | | 1,258 | | | | 1,265 | | | | 1,062 | |
| | Telephone | | | 333 | | | | 320 | | | | 258 | | | | 314 | | | | 327 | | | | 327 | | | | 329 | | | | 342 | | | | 340 | | | | 329 | |
| | Auto Insurance | | | 1,536 | | | | 2,101 | | | | 1,050 | | | | 1,012 | | | | 5,230 | | | | 1,728 | | | | 1,723 | | | | 1,922 | | | | 1,673 | | | | 2,667 | |
| | Total Household | | | | | | | | | | | | | | | | | | | | | | | | | | | | | | | | | | | | | | | | |
| | Utility Costs | | | 3,495 | | | | 4,321 | | | | 3,252 | | | | 2,816 | | | | 7,460 | | | | 4,053 | | | | 4,961 | | | | 5,117 | | | | 6,171 | | | | 6,826 | |
| | Total Taxes | | | | | | | | | | | | | | | | | | | | | | | | | | | | | | | | | | | | | | | | |
| | and Utilities | | | 10,034 | | | | 7,705 | | | | 7,175 | | | | 9,204 | | | | 13,503 | | | | 15,216 | | | | 12,478 | | | | 14,098 | | | | 15,017 | | | | 14,284 | |
| | Housing Costs | | | | | | | | | | | | | | | | | | | | | | | | | | | | | | | | | | | | | | | | |
| | Mortgage Costs | | | 24,018 | | | | 12,493 | | | | 9,772 | | | | 8,594 | | | | 16,497 | | | | 8,386 | | | | 5,427 | | | | 8,547 | | | | 5,017 | | | | 7,706 | |
| | Net Property Taxes | | | 3,469 | | | | 2,383 | | | | 2,513 | | | | 2,965 | | | | 2,993 | | | | 3,083 | | | | 2,701 | | | | 2,375 | | | | 2,600 | | | | 1,986 | |
| | Total Housing | | | | | | | | | | | | | | | | | | | | | | | | | | | | | | | | | | | | | | | | |
| | Costs | | | 27,487 | | | | 14,876 | | | | 12,285 | | | | 11,559 | | | | 19,490 | | | | 11,469 | | | | 8,128 | | | | 10,922 | | | | 7,617 | | | | 9,692 | |
| | Total of Taxes, | | | | | | | | | | | | | | | | | | | | | | | | | | | | | | | | | | | | | | | | |
| | Utilities and | | | | | | | | | | | | | | | | | | | | | | | | | | | | | | | | | | | | | | | | |
| | Housing | | | 37,521 | | | | 22,581 | | | | 19,460 | | | | 20,763 | | | | 32,993 | | | | 26,685 | | | | 20,606 | | | | 25,020 | | | | 22,634 | | | | 23,976 | |
66 Budget 2013/14 | Budget Summary
TAXES, UTILITIES AND HOUSING – NOTES
Tax estimates are calculated for the 2013 calendar year using known changes as of March 1, 2013. Household charges for the basic utility services (electricity, home heating, telephone and auto insurance) represent a cost comparison of the actual ‘known’ utility rates for the 2012 calendar year. This methodology has been chosen due to the uncertainty of attempting to forecast utility rates for the coming year. The utility figures exclude federal Goods and Services Tax (GST), provincial sales tax and municipal taxes and surcharges.
Provincial Income Tax is calculated for an individual with $25,000 and two families with $50,000 and $75,000 income respectively. It is assumed that family income is earned by both spouses at a 60 per cent to 40 per cent ratio and that the families each claim $3,000 in child care expenses for two dependent children (ages 6 and 12). Personal non-refundable credits used include the Canada Pension Plan/Québec Pension Plan and Employment Insurance contribution credits. Gross Québec Personal Income Tax has been reduced by the Québec Child Care Expense Tax Credit and by the 16.5 per cent abatement from federal income tax.
Tax Credits and Rebates refer to refundable provincial income tax credits and rebates designed to reduce the impact of retail sales tax, rental payments and property taxes (those property tax rebate plans administered through provincial income tax systems).
Active Families Benefit refers to the Saskatchewan refundable income tax credit that rebates up to $150 per child annually for cultural, recreational and sports activities fees for children less than 18 years of age. Ontario provides a refundable income tax credit in support of cultural, recreational and sports activities fees for children less than 16 years of age. Manitoba and Nova Scotia provide non-refundable children’s fitness tax credits.
Health Premiums are annual premiums for hospital insurance and medical services.
Retail Sales Tax is based upon average family expenditure baskets at the total income levels from the Survey of Family Expenditures in 2010 (Statistics Canada). The sales tax base in each province was identified from the enacting legislation, with total expenditures adjusted to reflect Saskatchewan consumption patterns. The Provincial Sales Tax (PST) in each province was then estimated based on taxable expenditures.
The PST in British Columbia is being reinstated at 7 per cent effective April 1, 2013, replacing the Harmonized Sales Tax (HST). The 2013 Intercity Comparison paper has therefore calculated a blended 3 months of HST and 9 months of PST for British Columbia.
The Québec Sales Tax rate was increased to 9.975 per cent effective January 1, 2013.
In its 2012-13 Budget, Prince Edward Island announced its intention to harmonize its PST with the federal GST effective April 1, 2013. The provincial HST rate will be 9 per cent. The 2013 Intercity Comparison paper has therefore calculated a blended 3 months of PST and 9 months of HST for Prince Edward Island.
Gasoline Tax is based on annual consumption of 1,000 litres by a single person, and 2,000 litres for each of the families. Figures include charges levied by transit commissions as well as carbon taxes applied to the purchase of gasoline.
Home Heating charges are based on an annual consumption level of 2,800 m3 of natural gas. For Charlottetown and St. John’s, the figures represent the BTU equivalent consumption of fuel oil.
Electricity charges are based on an annual consumption level of 4,584 kWh for the renter and 8,100 kWh for the homeowners.
Budget Summary | Budget 2013/14 67
Telephone charges are the basic service rates for individual residences.
Auto Insurance is based on a composite index developed by SGI modelled after the index developed by the Consumers’ Association of Canada. The index is based on the actual insurance rates quoted for what the driver would pay in each jurisdiction if they had the same car, same coverage, same claims history and driving record at a consistent point in time. The Consumers’ Association of Canada developed 34 profiles to create this index. The impact of “Good Driver” discounts/rebates has been factored in for all applicable jurisdictions.
Rent is based on average one-bedroom apartment rents for each metropolitan area, from the Canada Mortgage and Housing Corporation’s Rental Market Report, October 2012.
Mortgage Costs are based on average home prices for a detached bungalow, from the Royal LePage Third Quarter 2012 Survey of Canadian House Prices, with one-half of the home price being financed over 25 years at a one-year closed mortgage rate of 3.25 per cent.
Net Property Taxes for most cities are based on the estimated taxes for a sample detached bungalow from the City of Calgary 2011 Residential Property Taxes and Utility Charges Survey, with the exceptions of those cities not captured by the Calgary survey:
| ● | Charlottetown’s property tax estimate is based on the average of detached bungalows in that city as determined from the Royal LePage Survey of Canadian House Prices; and, |
| ● | Property tax estimates for Montréal and Saint John are based on the City of Edmonton 2010 Residential Property Taxes and Utility Charges Survey. |
For purposes of the 2012 Intercity Comparison of Taxes, Utilities and Housing budget paper, the property taxes for the city of Saskatoon were compared to other major cities across Canada. However, the City of Calgary Survey reports property tax data for the city of Regina but not Saskatoon. As a result, the 2013 Intercity Comparison paper compares the city of Regina to other major cities across Canada.
All provincial, municipal, education and library property taxes are included in the property tax figures. Property tax credit programs administered by municipalities on property tax notices have been deducted from the property tax figures to arrive at the net property tax amounts.
68 Budget 2013/14 | Budget Summary
2013-14 Revenue Initiatives
The 2013-14 budget development process was undertaken within the context of the objectives described in the Government’s economic growth plan – Saskatchewan Plan for Growth: Vision 2020 and Beyond. Within the Growth Plan’s framework, and the Government’s overarching priority of maintaining fiscal balance, the 2013-14 Budget announces changes to the Invest in Saskatchewan Program. The 2013-14 Budget also increases the Tobacco Tax rate and liquor mark-ups and reduces the Saskatchewan Resource Credit. The reader is advised to contact the responsible ministries/agencies for specific details.
INVEST IN SASKATCHEWAN PROGRAM
The Invest in Saskatchewan Program encourages Saskatchewan residents to invest in Labour-sponsored Venture Capital Corporations (LSVCCs) designed to raise pools of capital that can be reinvested into small and medium-sized businesses. To encourage investors to support these funds, federal and provincial governments provide significant tax incentives.
Saskatchewan currently provides a non-refundable Personal Income Tax credit equal to 20 per cent of investments in eligible LSVCCs. The tax credit is available for individual investments up to a maximum of $5,000 per year – the maximum annual provincial tax credit is therefore $1,000. The Saskatchewan tax credit is supplemented by a federal tax credit equal to 15 per cent of up to $5,000 invested in eligible LSVCCs.
The Invest in Saskatchewan Program has been very successful in raising capital for reinvestment in the province, with over 40,000 Saskatchewan residents participating. Provincial tax credits issued under the program will reach an estimated $18 million for the 2012 taxation year and could rise to $22 million per year under the current program rules.
Over the course of the past year, the Government undertook an examination of this program that included extensive consultations with the LSVCCs, investee businesses, business groups and other interested stakeholders. As a result of this review, interim changes were made to the Invest in Saskatchewan Program in the fall of 2012. These changes included:
| ● | maximizing the availability of funds for small and medium-sized Saskatchewan businesses by restricting the ability of LSVCCs to make passive investments and investments in large public corporations; |
| ● | clarifying what qualifies as a Saskatchewan small or medium-sized business; |
| ● | strengthening the reporting requirements for LSVCCs; and, |
| ● | maintaining the program investment limits for the 2012 taxation year. |
As part of the 2013-14 Budget, the Invest in Saskatchewan Program was reviewed to ensure that it can effectively contribute to Saskatchewan’s plan for economic growth. As a result, further changes are being made to the program for the 2013 taxation year.
Budget Summary | Budget 2013/14 69
Focus on Innovation
The Invest in Saskatchewan Program was initially launched to address a lack of private equity capital for investment in Saskatchewan small and medium-sized businesses. The consultations have suggested that there may be an opportunity to refocus the program given the current strength in the provincial economy and the enhanced availability of private equity capital in key provincial sectors. The consultations also identified a widely-held view that Saskatchewan’s innovation sector requires greater access to early-stage private capital.
In response to these observations, LSVCCs will now be required to place a greater emphasis on innovation-related investments by targeting a minimum proportion of their aggregate net capitalization in such investments, starting at 15 per cent in 2013, 20 per cent in 2014 and 25 per cent in 2015 and thereafter.
In defining eligible innovation-related investments, the Ministry of the Economy will be guided by the Saskatchewan Plan for Growth and will consult with innovation stakeholders.
Continued Affordability
In keeping with the Government’s focus on fiscal responsibility and improving program effectiveness, the aggregate amount of capital that the LSVCCs can raise in a year through this program will be reduced from $110 million to $80 million, with no one LSVCC able to raise more than 50 per cent of that total each year. This change will apply for 2013 and will have the effect of limiting the cost of the program’s tax credit to no more than $16 million per year.
For further information on the Invest in Saskatchewan Program and the LSVCC Tax Credit, contact the Ministry of the Economy at 1-306-787-4765.
SASKATCHEWAN RESOURCE CREDIT
The Saskatchewan Resource Credit (SRC) is a credit against Crown royalties and production taxes otherwise payable on the production of oil, natural gas, potash, uranium and coal in Saskatchewan.
The current SRC rate for oil and natural gas production from wells drilled before October 2002 is either 1.0 per cent or 2.5 per cent of the value of production, depending on the type of well and when it was drilled. There is no SRC applicable to oil and natural gas production from wells drilled after September 2002. The current SRC rate for potash, uranium and coal production is 1.0 per cent of the value of sales.
As part of the Government’s ongoing approach to fiscal responsibility through balanced budgets, the SRC is being reduced by 0.25 percentage points effective April 1, 2013.
For further information on the SRC, contact the Ministry of the Economy at 1-306-787-4765.
TOBACCO TAX
Effective midnight Budget night, the tax rate on tobacco products is increased from 21 cents per cigarette or gram of cut/loose tobacco to 25 cents per cigarette or gram of cut/loose tobacco.
For further information on the Tobacco Tax rate increase, contact the Ministry of Finance at 1-800-667-6102.
LIQUOR MARK-UPS
Effective April 1, 2013, the Saskatchewan Liquor and Gaming Authority (SLGA) will adjust mark-up rates for all beverage categories by approximately three per cent. For further information on the liquor mark-up increase, contact SLGA at 1-306-787-4213.
70 Budget 2013/14 | Budget Summary
IMPROVING SASKATCHEWAN’S
RETIREMENT INCOME SYSTEM
INTRODUCTION
The retirement income system in Canada is considered to be one of the best in the world, consisting of a blend of public and private programs. Canada’s retirement income system is comprised of three elements, often referred to as “pillars” by the federal government.
| ● | The first pillar consists of publicly funded income support programs, namely Old Age Security (OAS) and the Guaranteed Income Supplement (GIS). These programs are intended to provide a minimum level of financial support to Canadian seniors. |
| The second pillar consists of the Canada Pension Plan (CPP), which is funded through earnings-based contributions from employees and employers. Participation in the CPP is mandatory for all employed and self-employed Canadians. |
| The third pillar consists of private retirement savings, including occupational pension plans and registered retirement savings plans (RRSPs). Participation in some occupational pension plans is a requirement of employment. Participation in other private savings plans is entirely voluntary. |
In addition to the three pillars, there are other savings vehicles that can provide support in retirement, including home ownership, equity in a business and other financial assets.
RETIREMENT INCOME ADEQUACY
Over the past several years, federal, provincial and territorial governments across Canada have been discussing retirement income adequacy. The work began in 2009 with the appointment by the federal Minister of Finance of the Research Working Group on Retirement Income Adequacy. The Working Group covered a range of research areas including: the role of government in the retirement income system; an assessment of how current retirees are faring and how future retirees may fare; risks to adequate retirement savings; and an assessment of Canada’s retirement income system in the international context.
The Summary Report on Retirement Income Adequacy Research, prepared by the Working Group’s Research Director Jack Mintz, concluded that the existing retirement income system enables most Canadians to maintain an adequate standard of living in retirement; however, it noted that:
“There is, however, evidence that not all working Canadians are saving enough to obtain the same level of consumption in their retirement years as in working years. These estimates suggest that one fifth of Canadians may not have sufficient registered pension plan and RRSP assets to replace at least 90 per cent of their pre-retirement consumption, with higher degrees of inadequacy especially for modest- and middle-income Canadians.” (p.26)
Based on the findings from this report, and other supplemental research, the continuing work on pension reform by Canada’s Finance Ministers has focused mainly on two areas:
| Pension Innovation – broad-based, defined contribution pension arrangements for employees and the self-employed; and, |
| Canada Pension Plan – options for a modest, phased-in, and fully funded expansion of the CPP. |
Budget Summary | Budget 2013/14 71
| | Promoting Financial Literacy Parallel to the ongoing discussions on retirement income adequacy, there has been much talk about the role of financial literacy, encouraging individuals to make responsible financial decisions. Saskatchewan supports efforts being taken across the country to promote financial literacy and to improve the ability of Canadians to make informed decisions about personal finances, including retirement savings. The Financial Consumer Agency of Canada recently announced a new web-based resource, Your Financial Toolkit, to help Canadians become more informed and capable financial consumers. Your Financial Toolkit can be found at www.fcac-acfc.gc.ca. | |
PENSION INNOVATION – THE INTRODUCTION OF POOLED
REGISTERED PENSION PLANS
In December 2010, Canada’s Finance Ministers agreed on a framework for a new pension product – Pooled Registered Pension Plans (PRPPs). PRPPs are intended to improve the range of retirement savings options available to Canadians by providing a low-cost retirement savings opportunity for employees – with or without a participating employer – and the self-employed.
Following consultations with the public, stakeholders and provincial and territorial governments, the federal government introduced PRPP legislation in Parliament in November 2011. At the federal level, the complete regulatory framework for PRPPs came into force in December 2012, comprised of the Pooled Registered Pension Plans Act and associated regulations, as well as the tax rules for PRPPs under the federal Income Tax Act.
While the federal PRPP legislation creates a framework for all provinces to follow, on its own it makes PRPPs available only to employees of federally-regulated industries (e.g., air and rail transportation, banking and telecommunications). Since pension regulation is primarily an area of provincial jurisdiction, it is necessary for provinces to implement enabling legislation in order to make PRPPs available to all workers.
Saskatchewan Introduces PRPP Legislation
Saskatchewan has been supportive of the federal government’s efforts to strengthen Canada’s retirement income system through the introduction of PRPPs. In order to make PRPPs available to all Saskatchewan employees and the self-employed, the Government will be introducing The Pooled Registered Pension Plans Act in 2013.
The design of PRPP legislation in Saskatchewan will closely mirror the federal PRPP legislation, with modifications as necessary to align with existing provincial pension rules. As with the federal legislation, PRPPs will be a voluntary option for employers, allowing them to choose whether or not to offer a PRPP to their employees.
Where an employer chooses to adopt a PRPP, employees will be automatically enrolled but given the opportunity to opt out. While automatic enrolment for employees of participating employers encourages saving for retirement, providing employees with the ability to opt out ensures they retain the freedom to set individual financial priorities. Employees of non-participating employers and self-employed individuals will also be able to join a PRPP by signing up directly with a PRPP administrator.
72 Budget 2013/14 | Budget Summary
As under federal legislation, administrators of PRPPs in Saskatchewan can be any eligible Canadian corporation that meets the licencing requirements under PRPP legislation. Financial institutions and life insurance companies are the most likely potential administrators; however other corporate entities that have the necessary expertise and experience may also qualify.
The simple design of PRPPs is intended to encourage participation by small and medium-sized businesses who may not currently offer an employer-sponsored pension plan to employees due to cost or administrative complexity. While participating employers will not be required to contribute, they will be permitted to make direct contributions to a PRPP on an employee’s behalf. Under the changes to the federal Income Tax Act, these direct contributions to a PRPP will be excluded from salaried compensation and thus will not be subject to CPP contributions and Employment Insurance premiums. This feature may make PRPPs more attractive to employers than existing group RRSPs.
Upon retirement, it is anticipated that employees will have the same options for decumulating assets from a PRPP as are currently available for decumulation from a defined contribution pension plan in Saskatchewan. In particular, the options on retirement are a registered retirement income fund, a variable pension benefit or a life annuity.
EVOLUTION OF THE SASKATCHEWAN PENSION PLAN
Saskatchewan is home to the Saskatchewan Pension Plan (SPP) which was created in 1986 to provide a unique retirement savings vehicle for individuals with little or no access to employer-sponsored pension plans or other retirement savings arrangements. In 2010, federal and provincial legislative changes were made to increase the annual contribution limit to the SPP from $600 to $2,500, subject to an individual’s available RRSP contribution room. The changes enabled SPP to better serve its clients, allowing contributors to establish a more meaningful level of retirement savings.
During the national discussion of PRPPs over the past few years, SPP has repeatedly been profiled as a working model of the simple, low-cost, voluntary defined contribution pension plan that was envisioned in the initial PRPP framework. The introduction of PRPPs provides an opportunity for the SPP to continue to evolve in serving Saskatchewan residents and businesses by becoming a PRPP provider. Along with the introduction of provincial PRPP legislation, Saskatchewan will be introducing changes to The Saskatchewan Pension Plan Act. These legislative changes will enable the SPP to take the necessary steps to meet licencing requirements in order to offer a PRPP.
| | About the SPP The SPP is the 28th largest defined contribution plan in Canada as measured by Benefits Canada in September 2012. At December 31, 2012, the SPP had more than 32,000 members and assets of $322 million under administration. The SPP targets overall administration fees of one per cent in its balanced fund. | |
Budget Summary | Budget 2013/14 73
CANADA PENSION PLAN
Since the outset of national discussions on retirement income adequacy, Canada’s Finance Ministers have examined options for modest and phased-in enhancements to the CPP and considered the impact such enhancements may have on the economy.
While Saskatchewan continues to actively participate in these discussions, the Government is not supportive of a CPP enhancement at this time. In addition to having concerns about imposing an increase to mandatory CPP contributions on employers and employees at a time of relative global economic uncertainty, Saskatchewan also recognizes that moving forward with a mandatory CPP enhancement and a voluntary PRPP program simultaneously will diminish the likelihood of success for PRPPs. Employers and employees facing mandatory increases in CPP contributions would be less likely to participate in a voluntary PRPP.
CONCLUSION
The Government encourages all Saskatchewan residents to examine their financial priorities, recognizing that individuals need to set aside sufficient amounts of savings over their working lives in order to provide an adequate level of income in retirement. The introduction of provincial PRPP legislation will provide more Saskatchewan workers with a simple, low-cost option to support their retirement savings priorities.
74 Budget 2013/14 | Budget Summary
| | | |
| | | |
| | SASKATCHEWAN PROVINCIAL BUDGET | |
| | 13-14 | |
| | | |
| | GENERAL REVENUE FUND (GRF) BUDGET DETAILS | |
| | | |
Statement of Operations and Accumulated Deficit
| | | (thousands of dollars) | |
| | | | | | | | | | | |
| | | | Estimated | | | Forecast | | | Estimated | |
| | | | | 2013-14 | 1 | | | 2012-13 | | | | 2012-13 | |
| | | | | | | | | | | | | |
| Revenue | | | 11,607,300 | | | | 11,395,100 | | | | 11,290,900 | |
| Expense | | | | | | | | | | | | |
| | Operating Expense | | | 11,267,922 | | | | 11,130,972 | | | | 10,930,627 | |
| | Capital Transfers | | | 274,606 | | | | 255,317 | | | | 265,286 | |
| Expense | | | 11,542,528 | | | | 11,386,289 | | | | 11,195,913 | |
| Pre-Transfer Surplus | | | 64,772 | | | | 8,811 | | | | 94,987 | |
| Transfer (to): | | | | | | | | | | | | |
| | Growth and Financial Security Fund | | | - | | | | (4,406 | ) | | | (47,494 | ) |
| | Growth and Financial Security Fund - Growth | | | (32,386 | ) | | | - | | | | - | |
| | Growth and Financial Security Fund - Security | | | - | | | | - | | | | - | |
| Transfer from: | | | | | | | | | | | | |
| | Growth and Financial Security Fund | | | - | | | | 50,000 | | | | - | |
| | Growth and Financial Security Fund - Growth | | | - | | | | - | | | | - | |
| | Growth and Financial Security Fund - Security | | | - | | | | - | | | | - | |
| Surplus | | | 32,386 | | | | 54,405 | | | | 47,493 | |
| Accumulated Deficit, Beginning of Year | | | (92,020 | ) | | | (146,425 | ) | | | (146,425 | ) 2 |
| Accumulated Deficit, End of Year | | | (59,634 | ) | | | (92,020 | ) | | | (98,932 | ) |
| | | | | | | | | | | | | | |
| 1 | Beginning in 2013-14, the Growth and Financial Security Fund is segmented into Growth and Security components. | |
| 2 | Accumulated deficit at March 31, 2012, as reported in the 2011-12 Public Accounts. | | | | | | | | | | | | |
| | | | | | | | | | | | | | |
Statement of Change in Net Debt
| | | (thousands of dollars) | |
| | | | | | | | | | |
| | | Estimated | | | Forecast | | | Estimated | |
| | | | 2013-14 | | | | 2012-13 | | | | 2012-13 | |
| Annual Surplus | | | 32,386 | | | | 54,405 | | | | 47,493 | |
| Acquisition of Capital Assets | | | (572,894 | ) | | | (571,703 | ) | | | (522,447 | ) |
| Amortization of Capital Assets (Gross) | | | 203,304 | | | | 188,425 | | | | 191,505 | |
| Disposal of Agricultural Land (Book Value) | | | 5,700 | | | | 4,800 | | | | 1,600 | |
| (Increase) Decrease in Net Debt from Operations | | | (331,504 | ) | | | (324,073 | ) | | | (281,849 | ) |
| Net Debt, Beginning of Year | | | (3,883,949 | ) | | | (3,559,876 | ) | | | (3,559,876 | ) 1 |
| Net Debt, End of Year | | | (4,215,453 | ) | | | (3,883,949 | ) | | | (3,841,725 | ) |
| | | | |
| 1 | Net debt at March 31, 2012, as reported in the 2011-12 Public Accounts. | | |
76 Budget 2013/14 | Budget Summary
| | | | (thousands of dollars) | |
| | | | Estimated | | | Forecast | | | Estimated | |
| | | | | 2013-14 | | | | 2012-13 | | | | 2012-13 | |
| Operating Activities | | | | | | | | | | | | |
| Surplus for the Year | | | 32,386 | | | | 54,405 | | | | 47,493 | |
| Add Non-cash Items: | | | | | | | | | | | | |
| | Amortization of Foreign Exchange (Gain) Loss | | | (400 | ) | | | (1,003 | ) | | | (1,081 | ) |
| | Amortization of Capital Assets | | | 203,304 | | | | 188,425 | | | | 191,505 | |
| | (Gain) Loss on Loans, Investments and Capital Assets | | | (17,660 | ) | | | (16,445 | ) | | | (14,320 | ) |
| Net Change in Non-cash Operating Activities | | | 68,140 | | | | (100,881 | ) | | | 182,144 | |
| Earnings Retained in Sinking Funds | | | (40,000 | ) | | | (106,974 | ) | | | (95,127 | ) |
| Cash Provided by (Used for) Operating Activities | | | 245,770 | | | | 17,527 | | | | 310,614 | |
| | | | | | | | | | | | | |
| Ministry Capital Activities | | | | | | | | | | | | |
| Acquisition of Capital Assets | | | (572,894 | ) | | | (571,703 | ) | | | (522,447 | ) |
| Proceeds on Disposal of Agricultural Land | | | 25,440 | | | | 23,200 | | | | 18,000 | |
| Cash (Used for) Provided by Ministry Capital Activities | | | (547,454 | ) | | | (548,503 | ) | | | (504,447 | ) |
| | | | | | | | | | | | | | |
| Lending and Investing Activities | | | | | | | | | | | | |
| Receipts | | | 721,658 | | | | 1,357,569 | | | | 1,356,373 | |
| Disbursements | | | (1,323,278 | ) | | | (1,328,096 | ) | | | (1,289,186 | ) |
| Cash (Used for) Provided by Lending and Investing Activities | | | (601,620 | ) | | | 29,473 | | | | 67,187 | |
| | | | | | | | | | | | | | |
| Financing Activities | | | | | | | | | | | | |
| Borrowing | | | 1,594,862 | | | | 1,387,667 | | | | 1,328,380 | |
| Debt Repayment | | | (957,216 | ) | | | (1,168,890 | ) | | | (1,157,141 | ) |
| Increase in Deposits Held | | | 185,000 | | | | 128,165 | | | | - | |
| Cash Provided by (Used for) Financing Activities | | | 822,646 | | | | 346,942 | | | | 171,239 | |
| (Decrease) Increase in Cash¹ | | | (80,658 | ) | | | (154,561 | ) | | | 44,593 | |
| | | | | |
| 1 | Cash also includes temporary, short-term (less than 30 days) investments. | | |
Budget Summary | Budget 2013/14 77
| | | (thousands of dollars) | |
| | | Estimated | | | Forecast | | | Estimated | |
| | | | 2013-14 | | | | 2012-13 | | | | 2012-13 | |
| Taxes | | | | | | | | | | | | |
| Corporation Income | | | 986,800 | | | | 845,700 | | | | 817,200 | |
| Fuel | | | 526,100 | | | | 508,300 | | | | 508,300 | |
| Individual Income | | | 2,445,500 | | | | 2,398,300 | | | | 2,084,300 | |
| Provincial Sales | | | 1,401,400 | | | | 1,348,700 | | | | 1,348,700 | |
| Tobacco | | | 295,300 | | | | 250,100 | | | | 247,100 | |
| Other | | | 336,500 | | | | 324,500 | | | | 309,400 | |
| Taxes | | | 5,991,600 | | | | 5,675,600 | | | | 5,315,000 | |
| Non-Renewable Resources | | | | | | | | | | | | |
| Crown Land Sales | | | 111,400 | | | | 88,900 | | | | 220,000 | |
| Natural Gas | | | 9,600 | | | | 8,200 | | | | 12,500 | |
| Oil | | | 1,441,200 | | | | 1,322,700 | | | | 1,600,900 | |
| Potash | | | 519,900 | | | | 397,400 | | | | 705,200 | |
| Resource Surcharge | | | 488,800 | | | | 633,900 | | | | 485,900 | |
| Other | | | 99,700 | | | | 134,400 | | | | 123,800 | |
| Non-Renewable Resources | | | 2,670,600 | | | | 2,585,500 | | | | 3,148,300 | |
| Transfers from Crown Entities | | | | | | | | | | | | |
| Crown Investments Corporation of Saskatchewan | | | 180,000 | | | | 270,000 | | | | 150,000 | |
| - Special Dividend | | | 16,600 | | | | 3,000 | | | | 3,000 | |
| Saskatchewan Liquor and Gaming Authority | | | 491,800 | | | | 464,200 | | | | 439,900 | |
| Other Enterprises and Funds | | | 60,300 | | | | 67,000 | | | | 46,500 | |
| Transfers from Crown Entities | | | 748,700 | | | | 804,200 | | | | 639,400 | |
| Other Revenue | | | | | | | | | | | | |
| Fines, Forfeits and Penalties | | | 19,400 | | | | 18,600 | | | | 16,200 | |
| Investment Income | | | 89,400 | | | | 163,400 | | | | 145,400 | |
| Motor Vehicle Fees | | | 183,300 | | | | 176,800 | | | | 172,800 | |
| Other Licences and Permits | | | 26,200 | | | | 26,100 | | | | 25,400 | |
| Sales, Services and Service Fees | | | 132,800 | | | | 127,800 | | | | 124,600 | |
| Transfers from Other Governments | | | 16,900 | | | | 21,900 | | | | 16,900 | |
| Other | | | 100,000 | | | | 100,000 | | | | 100,000 | |
| Other Revenue | | | 568,000 | | | | 634,600 | | | | 601,300 | |
| Own-Source Revenue | | | 9,978,900 | | | | 9,699,900 | | | | 9,704,000 | |
| Transfers from the Government of Canada | | | | | | | | | | | | |
| Canada Health Transfer | | | 959,200 | | | | 933,400 | | | | 902,900 | |
| Canada Social Transfer | | | 377,900 | | | | 363,700 | | | | 363,700 | |
| Other | | | 291,300 | | | | 398,100 | | | | 320,300 | |
| Transfers from the Government of Canada | | | 1,628,400 | | | | 1,695,200 | | | | 1,586,900 | |
| Revenue | | | 11,607,300 | | | | 11,395,100 | | | | 11,290,900 | |
78 Budget 2013/14 | Budget Summary
| | | (thousands of dollars) | |
| | | | | | | | | | | | | | | | |
| | | Estimated | | | Estimated | | | | | | | | | | |
| | | Operating | | | Capital | | | | | | | | | | |
| | | Expense | | | Transfers | | | Estimated | | | Forecast | | | Estimated | |
| | | | 2013-14 | | | | 2013-14 | | | | 2013-14 | | | | 2012-13 | | | | 2012-13 | |
| Ministries and Agencies | | | | | | | | | | | | | | | | | | | | |
| Advanced Education | | | 762,216 | | | | 25,500 | | | | 787,716 | | | | 728,366 | | | | 724,276 | |
| Agriculture | | | 405,860 | | | | 1,000 | | | | 406,860 | | | | 473,924 | | | | 430,638 | |
| Central Services | | | 74,045 | | | | - | | | | 74,045 | | | | 73,319 | | | | 74,060 | |
| Economy | | | 275,517 | | | | - | | | | 275,517 | | | | 282,766 | | | | 288,611 | |
| Education | | | 1,293,135 | | | | 88,405 | | | | 1,381,540 | | | | 1,347,994 | | | | 1,351,064 | |
| - Teachers' Pensions and Benefits | | | 321,944 | | | | - | | | | 321,944 | | | | 295,463 | | | | 244,892 | |
| Environment | | | 163,275 | | | | - | | | | 163,275 | | | | 162,494 | | | | 165,929 | |
| Executive Council | | | 17,718 | | | | 100 | | | | 17,818 | | | | 17,791 | | | | 17,957 | |
| Finance | | | 68,788 | | | | - | | | | 68,788 | | | | 77,689 | | | | 68,768 | |
| - Public Service Pensions and Benefits | | | 291,076 | | | | - | | | | 291,076 | | | | 284,614 | | | | 283,517 | |
| Finance Debt Servicing | | | 340,000 | | | | - | | | | 340,000 | | | | 392,000 | | | | 400,000 | |
| Government Relations | | | 399,591 | | | | 77,718 | | | | 477,309 | | | | 599,071 | | | | 478,366 | |
| Health | | | 4,798,739 | | | | 42,922 | | | | 4,841,661 | | | | 4,647,249 | | | | 4,679,924 | |
| Highways and Infrastructure | | | 392,050 | | | | 31,286 | | | | 423,336 | | | | 433,554 | | | | 425,713 | |
| Innovation Saskatchewan | | | 28,006 | | | | - | | | | 28,006 | | | | 6,769 | | | | 6,769 | |
| Justice | | | 538,466 | | | | 3,509 | | | | 541,975 | | | | 521,598 | | | | 514,865 | |
| Labour Relations and Workplace Safety | | | 18,440 | | | | - | | | | 18,440 | | | | 17,984 | | | | 17,459 | |
| Parks, Culture and Sport | | | 101,599 | | | | 3,166 | | | | 104,765 | | | | 101,258 | | | | 96,258 | |
| Saskatchewan Research Council | | | 19,743 | | | | - | | | | 19,743 | | | | 18,983 | | | | 18,983 | |
| SaskBuilds Corporation | | | 8,300 | | | | - | | | | 8,300 | | | | 2,000 | | | | - | |
| Social Services | | | 888,607 | | | | 1,000 | | | | 889,607 | | | | 846,426 | | | | 852,531 | |
| Water Security Agency | | | 15,480 | | | | - | | | | 15,480 | | | | 12,234 | | | | 12,234 | |
| Legislative Assembly and its Officers | | | | | | | | | | | | | | | | | | | | |
| Advocate for Children and Youth | | | 2,195 | | | | - | | | | 2,195 | | | | 1,966 | | | | 1,944 | |
| Chief Electoral Officer | | | 3,800 | | | | - | | | | 3,800 | | | | 2,471 | | | | 2,471 | |
| Conflict of Interest Commissioner | | | 148 | | | | - | | | | 148 | | | | 145 | | | | 145 | |
| Information and Privacy Commissioner | | | 1,116 | | | | - | | | | 1,116 | | | | 1,065 | | | | 1,065 | |
| Legislative Assembly | | | 26,257 | | | | - | | | | 26,257 | | | | 25,691 | | | | 26,067 | |
| Ombudsman | | | 3,354 | | | | - | | | | 3,354 | | | | 3,075 | | | | 3,075 | |
| Provincial Auditor | | | 8,457 | | | | - | | | | 8,457 | | | | 8,330 | | | | 8,332 | |
| Expense | | | 11,267,922 | | | | 274,606 | | | | 11,542,528 | | | | 11,386,289 | | | | 11,195,913 | |
| | | | | | | | | | | | | | | | | | | | | |
| | | | | | | | | | | | | | | | | | | | | |
Budget Summary | Budget 2013/14 79
Schedule of Borrowing Requirements
| | | (thousands of dollars) | |
| | | | | | | | | | |
| | | Estimated | | | Forecast | | | Estimated | |
| | | | 2013-14 | | | | 2012-13 | | | | 2012-13 | |
| Borrowing for Crown Corporations | | | | | | | | | | | | |
| Municipal Financing Corporation of Saskatchewan | | | 120,000 | | | | 12,096 | | | | 20,000 | |
| Saskatchewan Liquor and Gaming Authority | | | 125,000 | | | | 125,000 | | | | 146,430 | |
| Saskatchewan Power Corporation | | | 595,500 | | | | 796,300 | | | | 623,000 | |
| Saskatchewan Telecommunications Holding Corporation | | | 123,100 | | | | 131,400 | | | | 183,200 | |
| Saskatchewan Water Corporation | | | 18,785 | | | | - | | | | 3,400 | |
| SaskEnergy Incorporated | | | 144,095 | | | | 100,800 | | | | 148,400 | |
| Borrowing for Crown Corporations | | | 1,126,480 | | | | 1,165,596 | | | | 1,124,430 | |
| Borrowing for Government | | | 468,382 | | | | 222,071 | | | | 203,950 | |
| Borrowing Requirements | | | 1,594,862 | | | | 1,387,667 | | | | 1,328,380 | |
80 Budget 2013/14 | Budget Summary
Schedule of Debt
As at March 31
| | | (thousands of dollars) | |
| | | | | | | | | | | | | | | | |
| | | Estimated | | | Estimated | | | Estimated | | | Forecast | | | Estimated | |
| | | Gross Debt | | | Sinking Funds | | | Debt | | | Debt | | | Debt | |
| | | 2014 | | | 2014 | | | 2014 | | | 2013 | | | 2013 | |
| Government General Debt | | | 4,862,223 | | | | (1,054,633 | ) | | | 3,807,590 | | | | 3,807,590 | | | | 3,807,590 | |
| Crown Corporation General Debt | | | | | | | | | | | | | | | | | | | | |
Information Services Corporation of Saskatchewan | | | 9,935 | | | | - | | | | 9,935 | | | | 9,935 | | | | 9,935 | |
Municipal Financing Corporation of Saskatchewan | | | 5,300 | | | | - | | | | 5,300 | | | | 5,300 | | | | 14,842 | |
| Saskatchewan Housing Corporation | | | 52,004 | | | | (28,049 | ) | | | 23,955 | | | | 25,350 | | | | 25,943 | |
Saskatchewan Liquor and Gaming Authority | | | - | | | | - | | | | - | | | | 125,000 | | | | - | |
Saskatchewan Opportunities Corporation | | | 36,684 | | | | (1,808 | ) | | | 34,876 | | | | 35,294 | | | | 35,327 | |
| Saskatchewan Power Corporation | | | 100,000 | | | | (5,854 | ) | | | 94,146 | | | | 95,315 | | | | 95,425 | |
Saskatchewan Telecommunications Holding Corporation | | | 102,900 | | | | - | | | | 102,900 | | | | 145,600 | | | | 47,400 | |
| Saskatchewan Water Corporation | | | 74,646 | | | | (12,398 | ) | | | 62,248 | | | | 49,234 | | | | 56,831 | |
| SaskEnergy Incorporated | | | 404,895 | | | | (7,036 | ) | | | 397,859 | | | | 402,937 | | | | 425,704 | |
Crown Corporation General Debt | | | 786,364 | | | | (55,145 | ) | | | 731,219 | | | | 893,965 | | | | 711,407 | |
| | | | | | | | | | | | | | | | | | | | | |
| Government Business Enterprise Specific Debt | | | | | | | | | | | | | | | | | | | | |
Municipal Financing Corporation of Saskatchewan | | | 245,200 | | | | (2,553 | ) | | | 242,647 | | | | 132,384 | | | | 140,344 | |
| Saskatchewan Gaming Corporation | | | 6,000 | | | | - | | | | 6,000 | | | | 6,000 | | | | 6,000 | |
Saskatchewan Liquor and Gaming Authority | | | 125,000 | | | | - | | | | 125,000 | | | | - | | | | 146,430 | |
| Saskatchewan Power Corporation | | | 4,291,575 | | | | (402,642 | ) | | | 3,888,933 | | | | 3,397,165 | | | | 3,232,630 | |
Saskatchewan Telecommunications Holding Corporation | | | 709,700 | | | | (101,041 | ) | | | 608,659 | | | | 495,990 | | | | 647,910 | |
| SaskEnergy Incorporated | | | 741,183 | | | | (79,697 | ) | | | 661,486 | | | | 570,306 | | | | 596,663 | |
Government Business Enterprise Specific Debt | | | 6,118,658 | | | | (585,933 | ) | | | 5,532,725 | | | | 4,601,845 | | | | 4,769,977 | |
| Public Debt | | | 11,767,245 | | | | (1,695,711 | ) | | | 10,071,534 | | | | 9,303,400 | | | | 9,288,974 | |
| | | | | | | | | | | | | | | | | | | | | |
| Guaranteed Debt | | | 183,067 | | | | - | | | | 183,067 | | | | 135,212 | | | | 153,344 | |
Budget Summary | Budget 2013/14 81
Schedule of Guaranteed Debt
As at March 31
| | | (thousands of dollars) | |
| | | | | | | | | | |
| | | Estimated | | | Forecast | | | Estimated | |
| | | 2014 | | | 2013 | | | 2013 | |
| Guaranteed Debt for Crown Corporations | | | | | | | | | |
| | | | | | | | | | |
| The Crown Corporations Act, 1993 | | | | | | | | | |
| Federal Immigrant Investor Loans | | | 156,056 | | | | 113,296 | | | | 133,322 | |
| Guaranteed Debt for Crown Corporations | | | 156,056 | | | | 113,296 | | | | 133,322 | |
| | | | | | | | | | | | | |
| Other Guaranteed Debt | | | | | | | | | | | | |
| | | | | | | | | | | | | |
| The Farm Financial Stability Act | | | | | | | | | | | | |
| Breeder Associations Loan Guarantees | | | 14,000 | | | | 11,000 | | | | 10,481 | |
| Feeder Associations Loan Guarantees | | | 10,000 | | | | 8,000 | | | | 7,350 | |
| Feedlot Construction Loan Guarantees | | | 2,000 | | | | 2,400 | | | | 1,267 | |
| Individual Feedlot Loan Guarantees | | | 1,000 | | | | 500 | | | | 913 | |
| The Student Assistance and Student Aid Fund Act | | | 11 | | | | 16 | | | | 11 | |
| Other Guaranteed Debt | | | 27,011 | | | | 21,916 | | | | 20,022 | |
| Guaranteed Debt | | | 183,067 | | | | 135,212 | | | | 153,344 | |
82 Budget 2013/14 | Budget Summary
| | | |
| | | |
| | SASKATCHEWAN PROVINCIAL BUDGET | |
| | 13-14 | |
| | | |
| | SUMMARY FINANCIAL BUDGET DETAILS | |
| | | |
GOVERNMENT OF SASKATCHEWAN
Summary Statement of Surplus
| | | (millions of dollars) | |
| | | | | | | | | | |
| | | Estimated | | | Forecast | | | Estimated | |
| | | | 2013-14 | | | | 2012-13 | | | | 2012-13 | |
Treasury Board Organizations 1 | | | | | | | | | | | | |
| General Revenue Fund (GRF) | | | 32.4 | | | | 54.4 | | | | 47.5 | |
| Growth and Financial Security Fund | | | 32.4 | | | | (45.6 | ) | | | 47.5 | |
| Boards of Education | | | 63.0 | | | | 156.7 | | | | 69.9 | |
| eHealth Saskatchewan | | | (10.8 | ) | | | 6.2 | | | | 7.3 | |
| Financial and Consumer Affairs Authority of Saskatchewan | | | 12.5 | | | | 10.2 | | | | 9.2 | |
| Northern Municipal Trust Account | | | (8.4 | ) | | | (1.4 | ) | | | (9.3 | ) |
| Regional Colleges | | | (4.1 | ) | | | (3.0 | ) | | | (5.8 | ) |
| Regional Health Authorities | | | (58.0 | ) | | | (61.6 | ) | | | (77.0 | ) |
| Saskatchewan Agricultural Stabilization Fund | | | - | | | | (13.5 | ) | | | (13.5 | ) |
| Saskatchewan Apprenticeship and Trade Certification Commission | | | (0.9 | ) | | | (1.0 | ) | | | (1.1 | ) |
| Saskatchewan Cancer Agency | | | (3.8 | ) | | | 2.0 | | | | (3.4 | ) |
| Saskatchewan Housing Corporation | | | 6.9 | | | | 1.5 | | | | 1.5 | |
| Saskatchewan Institute of Applied Science and Technology | | | (0.4 | ) | | | 2.7 | | | | 1.8 | |
| Saskatchewan Liquor and Gaming Authority | | | 491.8 | | | | 464.2 | | | | 439.9 | |
| Saskatchewan Student Aid Fund | | | (1.5 | ) | | | 2.0 | | | | - | |
| Water Security Agency | | | (4.2 | ) | | | (4.4 | ) | | | (6.1 | ) |
| Other Agencies | | | (7.9 | ) | | | (3.3 | ) | | | (8.2 | ) |
Interagency Accounting Adjustments 2 | | | (30.9 | ) | | | (29.0 | ) | | | (84.3 | ) |
| Adjustment to Account for Pension Costs on an Accrual Basis | | | (202.1 | ) | | | (476.1 | ) | | | (232.4 | ) |
| | | | 306.0 | | | | 61.0 | | | | 183.5 | |
Dividends included in GRF surplus 3 | | | (511.1 | ) | | | (491.2 | ) | | | (449.0 | ) |
| (Deficit) of Treasury Board Organizations | | | (205.1 | ) | | | (430.2 | ) | | | (265.5 | ) |
| | | | | | | | | | |
Crown Investments Corporation Board Organizations 1 | | | | | | | | | |
| | | | | | | | | | | | | |
Crown Investments Corporation (Separate) 4 | | | 45.8 | | | | (32.0 | ) | | | (39.2 | ) |
| Saskatchewan Gaming Corporation | | | 26.4 | | | | 26.3 | | | | 26.0 | |
| Saskatchewan Government Insurance | | | 36.5 | | | | 82.1 | | | | 33.7 | |
| Saskatchewan Power Corporation | | | 126.1 | | | | 152.9 | | | | 156.7 | |
| Saskatchewan Telecommunications Holding Corporation | | | 93.8 | | | | 129.6 | | | | 91.1 | |
| SaskEnergy Incorporated | | | 72.4 | | | | 106.5 | | | | 65.4 | |
Other Agencies 5 | | | 14.2 | | | | 23.3 | | | | 17.4 | |
Interagency Accounting Adjustments 2 | | | (3.7 | ) | | | (4.7 | ) | | | (4.6 | ) |
| | | | 411.5 | | | | 484.0 | | | | 346.5 | |
Dividends included in GRF surplus 3 | | | (196.6 | ) | | | (273.0 | ) | | | (153.0 | ) |
| Retained Surplus of CIC Board Organizations | | | 214.9 | | | | 211.0 | | | | 193.5 | |
Surplus (Deficit) Prior to Not-for-Profit Insurance Organizations | | | 9.8 | | | | (219.2 | ) | | | (72.0 | ) |
84 Budget 2013/14 | Budget Summary
GOVERNMENT OF SASKATCHEWAN
Summary Statement of Surplus
Continued
| | | | (millions of dollars) | |
| | | | | | | | | | | | | |
| | | | Estimated 2013-14 | | | | Forecast 2012-13 | | | | Estimated 2012-13 | |
| | | | | | | | | | | | | |
Surplus (Deficit) Prior to Not-for-Profit Insurance Organizations | | | 9.8 | | | | (219.2 | ) | | | (72.0 | ) |
Not-for-Profit Insurance Organizations 1,3 | | | | | | | | | | | | |
| Saskatchewan Auto Fund | | | (16.8 | ) | | | (11.5 | ) | | | (8.9 | ) |
| Saskatchewan Crop Insurance Corporation | | | 90.4 | | | | 101.1 | | | | 53.3 | |
| Crop Reinsurance Fund of Saskatchewan | | | 36.9 | | | | 39.4 | | | | 36.6 | |
| Workers' Compensation Board | | | 29.5 | | | | 155.8 | | | | 5.8 | |
| Surplus of Not-for-Profit Insurance Organizations | | | 140.0 | | | | 284.8 | | | | 86.8 | |
| Surplus | | | 149.8 | | | | 65.6 | | | | 14.8 | |
| 1 | The year-end for some organizations is not March 31. The 2013-14 Estimated amounts for those organizations are the Estimated amounts for the fiscal year ending before March 31, 2014. Some items are reclassified to conform with the current year presentation. |
| 2 | Interagency Accounting Adjustments eliminate the effects of financial transactions between government organizations and adjust for certain accounting standards that differ from those used in the Summary Financial Statements. |
| 3 | Dividends paid to the General Revenue Fund (GRF) by Treasury Board organizations and Crown Investments Board Corporation organizations. The dividends are eliminated to avoid double counting income. Insurance organizations do not pay dividends to the GRF. |
| 4 | Crown Investments Corporation (Separate) is shown before dividend revenue from its subsidiaries to avoid double counting income. |
| 5 | In November 2012, the Government introduced a bill into the Legislature that will provide for the sale of shares in the provincially-owned Information Services Corporation (ISC). The Province is expected to retain an approximate 40 per cent interest in ISC. ISC's forecast results, included in CIC's Other Agencies line, reflect the proposed sale. ISC's forecast is not individually dislosed as it is not intended to be relied on by potential investors. If the legislation is passed, appropriate disclosure will be provided to potential investors in the prospectus documents. |
GOVERNMENT OF SASKATCHEWAN
Summary Statement of Accumulated Surplus
| | | (millions of dollars) | |
| | | | | | | | | | |
| | | Estimated | | | Forecast | | | Estimated | |
| | | | 2013-14 | | | | 2012-13 | | | | 2012-13 | |
| | | | | | | | | | | | | |
| Accumulated Surplus, Beginning of year | | | 2,604.8 | | | | 2,617.4 | 1 | | | 2,617.4 | 1 |
| Surplus | | | 149.8 | | | | 65.6 | | | | 14.8 | |
| Other Comprehensive Income (Loss) | | | - | | | | (78.2 | )2 | | | - | |
| Accumulated Surplus, End of Year | | | 2,754.6 | | | | 2,604.8 | | | | 2,632.2 | |
| 1 | Accumulated Surplus as at March 31, 2012, as reported in the 2011-12 Public Accounts. |
| 2 | Primarily actuarial losses on defined benefit pension plans in organizations using International Financial Reporting Standards (IFRS). |
Budget Summary | Budget 2013/14 85
GOVERNMENT OF SASKATCHEWAN
Summary Statement of Change in Net Debt
| | | (millions of dollars) | |
| | | | | | | | | | |
| | | Estimated | | | Forecast | | | Estimated | |
| | | | 2013-14 | | | | 2012-13 | | | | 2012-13 | |
| | | | | | | | | | | | | |
| Surplus | | | 149.8 | | | | 65.6 | | | | 14.8 | |
| Acquisition of Government Service Organization Capital Assets | | | (1,243.0 | ) | | | (1,174.1 | ) | | | (1,184.4 | ) |
| Amortization, Disposals and Adjustments | | | 537.4 | | | | 499.2 | | | | 508.5 | |
| (Increase) in Net Debt | | | (555.8 | ) | | | (609.3 | ) | | | (661.1 | ) |
| Net Debt, Beginning of the Year | | | (5,230.7 | ) | | | (4,543.2 | )1 | | | (4,543.2 | )1 |
| Other Comprehensive Income | | | - | | | | (78.2 | )2 | | | - | |
| Net Debt, End of Year | | | (5,786.5 | ) | | | (5,230.7 | ) | | | (5,204.3 | ) |
| 1 | Net Debt as at March 31, 2012, as reported in the 2011-12 Public Accounts. |
| 2 | Primarily actuarial losses on defined benefit pension plans in organizations using International Financial Reporting Standards (IFRS). |
GOVERNMENT OF SASKATCHEWAN
Summary Schedule of Pension Liabilities
| | | (millions of dollars) | |
| | | | | | | | | | |
| | | Estimated | | | Forecast | | | Estimated | |
| | | | 2013-14 | | | | 2012-13 | | | | 2012-13 | |
| Pension Liabilities - Beginning of Year | | | 6,793.1 | | | | 6,317.0 | 1 | | | 6,317.0 | 1 |
| Adjustment to Account for Pension Costs on an Accrual Basis | | | 202.1 | | | | 476.1 | | | | 232.4 | |
| Pension Liabilities - End of Year | | | 6,995.2 | | | | 6,793.1 | | | | 6,549.4 | |
| 1 | Pension Liability as at March 31, 2012, as reported in the 2011-12 Public Accounts | |
86 Budget 2013/14 | Budget Summary
GOVERNMENT OF SASKATCHEWAN
Summary Schedule of Tangible Capital Assets
As at March 31
| | | (millions of dollars) | |
| | | | | | | | | | | | | | | | | | | | | | |
| | | Actual Net Book Value | | | -- 2012-13 Forecast -- | | | Forecast Net Book Value | | | -- 2013-14 Estimated -- | | | Estimated Net Book Value | |
| | | 20121 | | | Additions 2 | | | Amortization 3 | | | 2013 | | | Additions 2 | | | Amortization 3 | | | 2014 | |
| General Revenue Fund | | | 3,275.6 | | | | 571.7 | | | | (193.3 | ) | | | 3,654.0 | | | | 572.9 | | | | (209.0 | ) | | | 4,017.9 | |
Treasury Board Organizations | | | 3,311.9 | | | | 680.9 | | | | (288.3 | ) | | | 3,704.5 | | | | 591.7 | | | | (320.9 | ) | | | 3,975.3 | |
| CIC Board Organizations | | | 8,510.6 | | | | 1,430.7 | | | | (560.5 | ) | | | 9,380.8 | | | | 2,470.0 | | | | (661.7 | ) | | | 11,189.1 | |
Not-for-Profit Insurance Organizations | | | 70.1 | | | | 5.2 | | | | (10.7 | ) | | | 64.6 | | | | 12.4 | | | | (11.8 | ) | | | 65.2 | |
| Total Government | | | 15,168.2 | | | | 2,688.5 | | | | (1,052.8 | ) | | | 16,803.9 | | | | 3,647.0 | | | | (1,203.4 | ) | | | 19,247.5 | |
Government Service Organizations | | | 6,951.5 | | | | 1,174.1 | | | | (499.2 | ) | | | 7,626.4 | | | | 1,243.0 | | | | (537.4 | ) | | | 8,332.0 | |
Government Business Enterprises | | | 8,216.7 | | | | 1,514.4 | | | | (553.6 | ) | | | 9,177.5 | | | | 2,404.0 | | | | (666.0 | ) | | | 10,915.5 | |
| Total Government | | | 15,168.2 | | | | 2,688.5 | | | | (1,052.8 | ) | | | 16,803.9 | | | | 3,647.0 | | | | (1,203.4 | ) | | | 19,247.5 | |
| 1 | Net book value at March 31, 2012, as reported in the 2011-12 Public Accounts. | | |
| 2 | Includes only capital asset acquisitions by government organizations. Government capital transfers are excluded. | | | |
| 3 | Amortization includes disposal of tangible capital assets and minor adjustments. | | | | |
Budget Summary | Budget 2013/14 87
GOVERNMENT OF SASKATCHEWAN
Summary Schedule of Debt
As at March 31
| | | (millions of dollars) | |
| | | | | | | | | | | | | | | | |
| | | Estimated | | | Estimated | | | Estimated | | | Forecast | | | Estimated | |
| | | GRF Debt | 1 | | Other Debt | | | Total | | | Total | | | Total | |
| | | 2014 | | | 2014 | | | 2014 | | | 2013 | | | 2013 | |
| Treasury Board Organizations | | | | | | | | | | | | | | | |
| GRF - Government Public Debt | | | 3,807.6 | | | | - | | | | 3,807.6 | | | | 3,807.6 | | | | 3,807.6 | |
| Boards of Education | | | - | | | | 92.6 | | | | 92.6 | | | | 88.8 | | | | 93.5 | |
| Global Transportation Hub Authority | | | - | | | | 30.0 | | | | 30.0 | | | | 25.0 | | | | 30.0 | |
| Growth and Financial Security Fund | | | - | | | | (41.9 | ) | | | (41.9 | ) | | | (41.8 | ) | | | (23.8 | ) |
Municipal Financing Corporation of Saskatchewan | | | 247.9 | | | | - | | | | 247.9 | | | | 137.7 | | | | 155.2 | |
| Regional Health Authorities | | | - | | | | 109.0 | | | | 109.0 | | | | 98.2 | | | | 121.0 | |
| Saskatchewan Housing Corporation | | | 24.0 | | | | 5.1 | | | | 29.1 | | | | 31.9 | | | | 32.7 | |
Saskatchewan Liquor and Gaming Authority | | | 125.0 | | | | - | | | | 125.0 | | | | 125.0 | | | | 146.4 | |
| Water Security Agency | | | - | | | | 21.9 | | | | 21.9 | | | | 12.8 | | | | 12.7 | |
| Other | | | - | | | | 2.4 | | | | 2.4 | | | | 1.0 | | | | 1.3 | |
Public Debt of Other Treasury Board Organizations | | | 396.9 | | | | 219.1 | | | | 616.0 | | | | 478.6 | | | | 569.0 | |
Public Debt of Treasury Board Organizations | | | 4,204.5 | | | | 219.1 | | | | 4,423.6 | | | | 4,286.2 | | | | 4,376.6 | |
| CIC Board Organizations | | | | | | | | | | | | | | | | | | | | |
Saskatchewan Immigrant Investor Fund Inc. | | | - | | | | 146.0 | | | | 146.0 | | | | 106.0 | | | | 124.6 | |
| Saskatchewan Opportunities Corporation | | | 34.9 | | | | - | | | | 34.9 | | | | 35.3 | | | | 35.3 | |
| Saskatchewan Power Corporation | | | 3,983.1 | | | | - | | | | 3,983.1 | | | | 3,492.5 | | | | 3,328.1 | |
Saskatchewan Telecommunications Holding Corporation | | | 711.6 | | | | - | | | | 711.6 | | | | 641.6 | | | | 695.3 | |
| Saskatchewan Water Corporation | | | 62.2 | | | | - | | | | 62.2 | | | | 49.2 | | | | 56.8 | |
| SaskEnergy Incorporated | | | 1,059.3 | | | | 4.8 | | | | 1,064.1 | | | | 978.0 | | | | 1,027.2 | |
| Other | | | 15.9 | | | | 4.4 | | | | 20.3 | | | | 21.7 | | | | 21.7 | |
| Public Debt of CIC Board Organizations | | | 5,867.0 | | | | 155.2 | | | | 6,022.2 | | | | 5,324.3 | | | | 5,289.0 | |
Public Debt2 | | | 10,071.5 | | | | 374.3 | | | | 10,445.8 | | | | 9,610.5 | | | | 9,665.6 | |
| | | | | | | | | | | | | | | | | | | | | |
| Guaranteed Debt | | | 183.1 | | | | (145.2 | ) | | | 37.9 | | | | 30.2 | | | | 35.4 | |
| 1 | Debt obtained by the General Revenue Fund (GRF) for its own use or on behalf of Crown corporations. The amount is net of sinking funds. Debt repayable in foreign currency is restated in equivalent Canadian dollars. |
| 2 | The Province's Summary Financial Statements account for government business enterprises (GBEs) such as SaskPower Corporation on an equity basis. Therefore debt of GBEs (except general lending by the GRF to GBEs) is netted against other liabilities and assets and the resultant equity is shown as Investment in GBEs. |
88 Budget 2013/14 | Budget Summary
GOVERNMENT OF SASKATCHEWAN
Notes to the Summary Financial Budget
REPORTING ENTITY
The Summary Financial Budget reports the planned financial activities of the General Revenue Fund (GRF), and of organizations and funds controlled by Government. The determination of control requires evaluation of various factors. While Government clearly controls Crown corporations, the determination of control is less clear for organizations such as the Workers’ Compensation Board (WCB), school boards and universities. Canadian jurisdictions differ on whether they consolidate these organizations, depending on their government’s degree of control.
The Summary Financial Budget is not a budget in the same sense as the GRF Budget. Treasury Board and Cabinet are directly involved in GRF revenue and expenditure decisions and tradeoffs. GRF revenues (taxes) are not directly related to the programs and services they provide, so decisions on revenues can be independent from decisions on spending within any constraints imposed by the desire to achieve a given level of surplus. The budget and Estimates of the GRF are subject to detailed review, then approval by the Legislative Assembly.
CONSOLIDATION OF PLANS
The Summary Financial Budget is a consolidation of the plans or budgets of individual government organizations, as approved by their Boards. Some of these plans, such as those of regional health authorities, are influenced by the extent of GRF support. The plans of other organizations, such as SaskPower and the WCB, are not. Other organizations, such as the Saskatchewan Institute of Applied Science and Technology (SIAST) and school boards, have different year-ends than the GRF and their plans are made in advance of Government’s budget process. The involvement of Treasury Board and Cabinet with the plans of these government organizations is often less direct.
Another major difference is that most government organizations do not receive taxes. Many, especially government business enterprises, tend to spend monies to provide goods and services in exchange for revenue from ratepayers, clients and customers.
METHOD OF CONSOLIDATION
The Summary Statement of Surplus (or Deficit) combines the planned surplus or deficit of all government organizations. Adjustments are then made to eliminate inter-organization transactions and to account for significant transactions in the period between the organization’s fiscal year-end and Government’s March 31 year-end. These adjustments are grouped in an “interagency accounting adjustment” amount. An adjustment is also made to ensure all pension expenses are recorded on an accrual basis of accounting, as recommended by the Public Sector Accounting Board of the Canadian Institute of Chartered Accountants.
This method of consolidating the plans of government organizations differs from the method used in the Summary Financial Statements, which combine revenues and expenses of the GRF and government service organizations on a consistent accounting basis and then eliminate interagency transactions. Each method arrives at the same bottom line.
Budget Summary | Budget 2013/14 89
GOVERNMENT BUSINESS ENTERPRISES
These are self-sufficient government organizations whose principal activity is the sale of goods and services to individuals and organizations outside government. These organizations comprise: the Municipal Financing Corporation of Saskatchewan, the Saskatchewan Gaming Corporation, the Saskatchewan Liquor and Gaming Authority, SaskEnergy, SaskPower, SaskTel, SGI (including the Auto Fund), and the WCB.
GOVERNMENT SERVICE ORGANIZATIONS
All government organizations and funds that are not government business enterprises are considered government service organizations (GSOs). Typically GSOs, such as regional health authorities, provide public service but usually need government grants to sustain their operations. Some GSOs, such as the Saskatchewan Transportation Company, sell services but are not self-sufficient.
DESCRIPTION OF GOVERNMENT ORGANIZATIONS
Categorization of Government Organizations
The Summary Financial Budget categorizes organizations into three groups. The first two groups are based on the Cabinet Committee, either Treasury Board or Crown Investment Corporation (CIC) Board, that examines the organization’s budget or business plan. The third group is not-for-profit insurance organizations that are intended to be actuarially sound and adjust their rates to breakeven over the long term. The General Revenue Fund does not take dividends from not-for-profit insurance organizations.
Prior year financial statements for government organizations can be found in the Compendium to the Public Accounts, available in the publications section of the Ministry of Finance website.
Treasury Board Organizations
Boards of Education
Twenty-eight Boards of Education, including the Conseil des écoles fransaskoises, operate under the authority of The Education Act, 1995. The Boards and the Conseil work with the Ministry of Education to strengthen the performance and accountability of the school system under their Continuous Improvement Framework. The Boards and the Conseil are responsible for delivering the educational program, including curriculum and instruction, and programs for children and youth. The Boards and the Conseil are required to comply with provincial statutes, regulations, and policies and, as elected bodies, are accountable to their local electors. The Boards and the Conseil receive operating and capital grants from the provincial government. The Boards also receive property taxes in their jurisdiction.
eHealth Saskatchewan
eHealth Saskatchewan was established by Order in Council pursuant to the provisions of The Crown Corporations Act, 1993. eHealth Saskatchewan’s mandate is to procure, implement, own, operate, and manage the Saskatchewan Electronic Health Record (EHR) and, where appropriate, other health information systems including the associated provincial components and infrastructure to facilitate improved health provider and patient access and use of electronic health information. eHealth Saskatchewan also establishes the provincial health information and technology standards necessary to access the Saskatchewan EHR and the associated
90 Budget 2013/14 | Budget Summary
provincial components and infrastructure. Legislation will be introduced during the 2013 spring sitting of the Legislature to transfer the Vital Statistics Registry from Information Services Corporation to eHealth Saskatchewan. The Vital Statistics Registry records all births, marriages, deaths, stillbirths and changes of name that occur in Saskatchewan. The certificates issued by the Vital Statistics Registry are legal proof of these vital events and provide statistical information to various agencies and the general public.
Financial and Consumer Affairs Authority
Effective October 1, 2012, the former Saskatchewan Financial Services Commission was continued as the Financial and Consumer Affairs Authority of Saskatchewan (FCAA), a Treasury Board Crown corporation. FCAA fosters confidence in the Saskatchewan marketplace and protects Saskatchewan consumers. FCAA regulates Saskatchewan’s financial services industry including the credit union system, insurance, pensions, securities, trust and loans, payday loans and mortgage brokers. The regulatory responsibilities of FCAA have expanded to other areas of consumer protection including matters related to personal or household goods and services. FCAA also oversees the licensing or registration provisions of a number of statutes, monitors compliance with the rules, and holds to account those who break the rules. FCAA is funded through fees charged to regulated entities.
Global Transportation Hub Authority
The Global Transportation Hub Authority (GTHA) was established as a Treasury Board Crown corporation by Order in Council 492/2009. The GTHA holds a mandate to advise on, plan, develop, construct, operate, manage and promote Saskatchewan’s Global Transportation Hub.
Municipal Financing Corporation of Saskatchewan
The Municipal Financing Corporation of Saskatchewan (MFC) was established in 1969 and continues under The Municipal Financing Corporation Act. MFC assists in making capital funds available for the financing of essential local improvements, schools, hospitals and other construction projects in cities, towns, villages and rural areas throughout the province. MFC may borrow directly from private lending institutions or through the Ministry of Finance. The borrowed funds are lent to Saskatchewan local governments to meet all or a portion of their borrowing requirements.
Northern Municipal Trust Account
The Northern Municipal Trust Account (NMTA), formerly the Northern Revenue Sharing Trust Account, was established by Section 287 of The Northern Municipalities Act, 2010. NMTA administers all revenues relating to the Northern Saskatchewan Administration District (NSAD) and all monies appropriated by the legislature for the purposes of northern revenue sharing and other grant programs. The NMTA also acts as a municipal operating fund for the unincorporated area in the district, the northern settlements and resort subdivisions. NMTA also collects taxes for northern hamlets and the three northern school divisions within the NSAD.
Regional Colleges
Seven regional colleges, operating under the authority of The Regional Colleges Act, provide educational services and programs in over 40 locations throughout the province. Through partnerships with universities and technical institutes such as Saskatchewan Institute of Applied Science and Technology (SIAST), regional colleges deliver credit
Budget Summary | Budget 2013/14 91
programs in response to the needs of rural and northern Saskatchewan. Regional colleges also offer literacy and basic education, industry credit and non-credit programs based on local needs and provide a broad array of counselling and assessment services geared to assisting individuals with career planning.
Regional Health Authorities
The Regional Health Services Act was proclaimed on August 1, 2002. Health services in Saskatchewan are delivered by 12 regional health authorities. Major services include:
| ● | hospitals, health centres, and primary care teams; |
| ● | emergency response services, including first responders and ambulance services; |
| ● | supportive care, such as long-term care, day programs, respite, palliative care, and programs for patients with multiple disabilities; |
| ● | population health services including public health nursing, public health inspections, communicable disease control, epidemiology and vaccinations; and, |
| ● | community health services such as mental health and addictions services, rehabilitation services, home care and programming for individuals with autism and cognitive disabilities. |
Saskatchewan Agricultural Stabilization Fund
The Saskatchewan Agricultural Stabilization Fund was established under The Farm Financial Stability Act and delivers the Wildlife Damage Compensation Program, and the Farm and Ranch Water Infrastructure Program.
Saskatchewan Apprenticeship and Trade Certification Commission
The Saskatchewan Apprenticeship and Trade Certification Commission (SATCC) operates under the authority of The Apprenticeship and Trade Certification Act, 1999. SATCC is an industry-led government agency with a mandate to govern and manage the apprenticeship and trade certification system in Saskatchewan.
There are over 9,000 registered apprentices working and learning on the job in 47 trades and 23 sub-trades. In excess of 5,000 of those apprentices also attend classroom-based technical training each year.
Saskatchewan Cancer Agency
The Saskatchewan Cancer Agency (SCA) was established pursuant to The Cancer Foundation Act which was superseded by The Cancer Agency Act on January 2, 2007. SCA is responsible for the planning, organization, and delivery and evaluation of cancer care services throughout Saskatchewan in collaboration with regional health authorities and health care organizations. SCA provides for detection, diagnosis, testing and monitoring of individuals, treatment, rehabilitation services, education of health care providers and Saskatchewan residents respecting cancer and the prevention of cancer, prevention and screening, and cancer research and studies.
Saskatchewan Housing Corporation
The Saskatchewan Housing Corporation (SHC) operates under the authority of The Saskatchewan Housing Corporation Act. SHC is accountable for developing, designing, and implementing housing programs and services for families, seniors and
92 Budget 2013/14 | Budget Summary
others. SHC promotes access to housing for low-income people. It creates independence and self-sufficiency for clients through programs and services that are delivered either directly through SHC, by local housing authorities who manage properties owned by SHC, or by third-party groups who own and manage properties and receive financial assistance from SHC.
Saskatchewan Institute of Applied Science and Technology
SIAST operates under the authority of The Saskatchewan Institute of Applied Science and Technology Act. SIAST provides post-secondary technical education and skills training, to help meet the needs of students and employers, through distance education and campuses in Regina, Saskatoon, Moose Jaw and Prince Albert. Through program and course registrations, SIAST serves 26,000 distinct students with programming that touches every sector of the economy.
Saskatchewan Liquor and Gaming Authority
The Saskatchewan Liquor and Gaming Authority (SLGA) is governed by The Alcohol and Gaming Regulation Act, 1997. SLGA is responsible for the distribution, regulation, management, and operation of liquor and gaming across the province. SLGA warehouses and distributes wine, spirits, and domestic and imported beer to SLGA stores and franchises for sale to commercial permittees and the public. SLGA also owns and operates all video lottery terminals and owns and manages the slot machines at all Saskatchewan Indian Gaming Authority casinos. SLGA also licenses and regulates most other forms of gaming including bingo, raffles, casinos, breakopen tickets, Texas Hold’em poker and Monte Carlo events, as well as the provincial horse racing industry.
Saskatchewan Student Aid Fund
The Saskatchewan Student Aid Fund operates under the authority of The Student Assistance and Student Aid Fund Act, 1985. The primary purpose of the Fund is to support the Saskatchewan Student Assistance Program.
Water Security Agency
Bill 47, The Saskatchewan Watershed Authority Amendment Act, 2012 continues the Watershed Authority as the Water Security Agency (WSA). WSA is mandated to integrate all aspects of provincial water management to ensure water supplies support economic growth, quality of life and environmental well being. WSA supports protection of drinking water, flood and drought response, and management of water supplies, water quality and aquatic habitat. WSA also owns and operates provincial dams and water supply channels.
Crown Investments Corporation Board Organizations
Crown Investments Corporation of Saskatchewan
CIC is the financially self-sufficient holding company for ten subsidiary commercial Crown corporations. The Government Finance Office (GFO) was established in 1947 to act as a holding company for many of Saskatchewan’s Crown corporations and to be a mechanism for developing broad policy control, directing investment, and routing dividends into the Government’s consolidated fund.
In 1978, the GFO was renamed Crown Investments Corporation of Saskatchewan, with a focus on delivering strategic shareholder direction and contributing to the province’s economic success. The Crown Corporations Act, 1993 is the current governing legislation.
Budget Summary | Budget 2013/14 93
Information Services Corporation
Information Services Corporation (ISC) is the Saskatchewan Crown corporation responsible for the management and administration of land titles, vital statistics, personal property, corporate and survey registries; geographic information; and access to government services for business. ISC was established on January 1, 2000, as a wholly-owned subsidiary of CIC. In 2012, the Government of Saskatchewan introduced legislation to enable the sale of shares of ISC. As part of a potential privatization process, certain registry functions, including the Vital Statistics line of business, will be transferred to other government entities.
Saskatchewan Gaming Corporation (SaskGaming)
The Saskatchewan Gaming Corporation was established under The Saskatchewan Gaming Corporation Act, 1994 to operate Casino Regina and Casino Moose Jaw under a framework agreement that provides for sharing of net profits between the Government of Saskatchewan, First Nations Trust, and the Community Initiatives Fund. Casino Regina opened to the public January 26, 1996, and Casino Moose Jaw opened on September 6, 2002. Legislation was amended in 2007 to effectively place the Corporation under the management of the CIC Board as a wholly-owned subsidiary of CIC.
Saskatchewan Government Insurance
Saskatchewan Government Insurance (SGI) was established in 1945 to provide affordable, good quality insurance to Saskatchewan people. Under the trade name SGI CANADA, which is a wholly-owned subsidiary of CIC, it conducts a competitive property and casualty insurance business in seven Canadian provinces. It offers a comprehensive line of home, tenant, farm, automobile extension, and commercial coverage.
Saskatchewan Immigrant Investor Fund
The Saskatchewan Immigrant Investor Fund Inc. is a wholly-owned subsidiary of CIC, established in September 2010, that borrows funds from immigrant investors chosen by the federal government for use towards financing the Headstart on a Home Program. The Headstart on a Home Program provides construction mortgages and other services to developers to build entry level homes in Saskatchewan.
Saskatchewan Opportunities Corporation
Saskatchewan Opportunities Corporation (SOCO), a wholly-owned subsidiary of CIC, was established in 1994. SOCO supports the growth and success of Saskatchewan’s technology sector through the operation of research parks at the province’s two universities in Saskatoon and Regina, and a building in downtown Prince Albert. SOCO operates under the brand name Innovation Place.
Saskatchewan Power Corporation (SaskPower)
SaskPower, a wholly-owned subsidiary of CIC, was established as the Saskatchewan Power Commission in 1929. Its purpose was to provide safe, reliable, cost-effective power to Saskatchewan people. Today, SaskPower maintains this purpose and is the principal supplier of electricity to more than 490,000 residential, farm, commercial, oilfield, power, and reseller customers in Saskatchewan.
Saskatchewan Telecommunications (SaskTel)
Saskatchewan Telecommunications Holding Company
SaskTel, a wholly-owned subsidiary of CIC, was established as the Department of Railway, Telephones and Telegraphs in 1908. The Corporation is the leading full service provider in Saskatchewan of voice, data, dial up, and high speed internet,
94 Budget 2013/14 | Budget Summary
entertainment, and multimedia services, security, web hosting, text and messaging services, and cellular and wireless data services over its digital networks.
Saskatchewan Water Corporation (SaskWater)
SaskWater, a wholly-owned subsidiary of CIC, was established in 1984. Headquartered in Moose Jaw, SaskWater designs, builds, owns, and operates water supply and wastewater systems, providing quality water to Saskatchewan industries, municipalities, First Nations, and rural water user groups.
SaskEnergy Incorporated (SaskEnergy)
Saskatchewan’s provincially-owned natural gas system began operations in 1952 as part of SaskPower. SaskEnergy, which is a wholly-owned subsidiary of CIC, was formed in 1988 as a separate corporation to continue providing natural gas transmission and distribution services across the province. The system has grown substantially over the years, with 81,000 kilometres of pipeline now serving more than 92 per cent of Saskatchewan communities. Today, SaskEnergy provides safe, reliable, and economical natural gas service to more than 365,000 residential, farm, commercial, and industrial customers in the province.
Not-for-Profit Insurance Organizations
Saskatchewan Auto Fund
The Fund is the province’s compulsory auto insurance program and the provider of the provincial driver licensing and vehicle registration system. The Fund does not receive money from or provide money to the Province of Saskatchewan. The Fund is administered by SGI.
Saskatchewan Crop Insurance Corporation
Saskatchewan Crop Insurance Corporation (SCIC) operates under the authority of The Crop Insurance Act and The Farm Financial Stability Act. SCIC administers insurance programs which protect producers from production failures due to natural hazards. SCIC also delivers wildlife damage prevention and compensation programs, as well as the AgriStability Program.
Crop Reinsurance Fund of Saskatchewan
The Fund provides SCIC with reinsurance coverage against losses in excess of net premiums, indemnities, and accumulated reserves. Reinsurance for the Saskatchewan crop insurance program is provided by the federal and provincial governments under the terms of the Canada-Saskatchewan Production Insurance Agreement. Payments are made from each government’s reinsurance fund based on a formula set out in the agreement and each is responsible for the accumulated deficits of its fund.
Workers’ Compensation Board
The Workers’ Compensation Board (WCB) was established in 1930. It is a no fault insurance program that protects workers and employers from the results of work-related injuries. The WCB collects annual premiums from employers and uses those funds to compensate injured workers for lost income and expenses with the objective of returning them to safe, productive work as soon as medically possible. Further, the WCB seeks to develop and deliver injury prevention programs and services with the goal of eliminating workplace injuries.
Budget Summary | Budget 2013/14 95

