The Honourable Ken Krawetz Deputy Premier Minister of Finance |
|
SASKATCHEWAN BUDGET UPDATE 14-15 |
| | 2014-15 Mid-Year Report Government of Saskatchewan November 27, 2014 | |
| MID-YEAR REPORT | |
| | | 1 |
| | Introduction | 3 |
| | Economic Update | 12 |
| | Budget Update | |
| | | |
| | | |
| SUPPLEMENTARY INFORMATION | |
| | | |
| | Budget by Organization | 19 |
| | Debt by Organization | 20 |
INTRODUCTION 2014-15 Mid-Year Report |
At mid-year, the budget surplus remains on track despite revenue volatility and the impact of this year’s flooding.
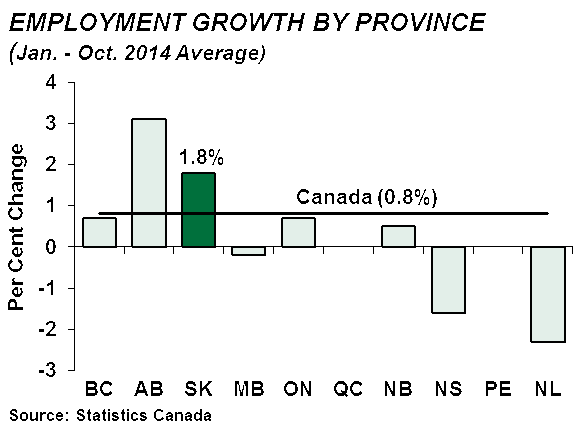
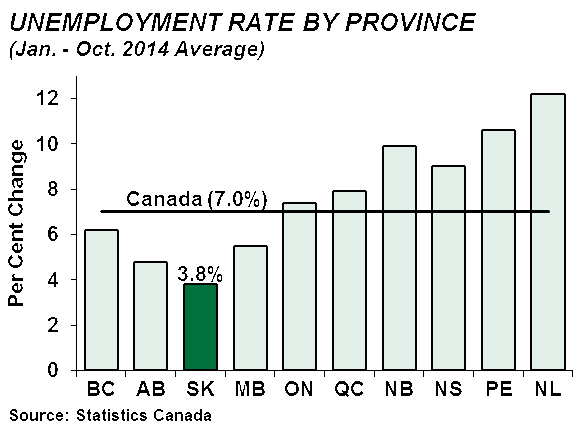
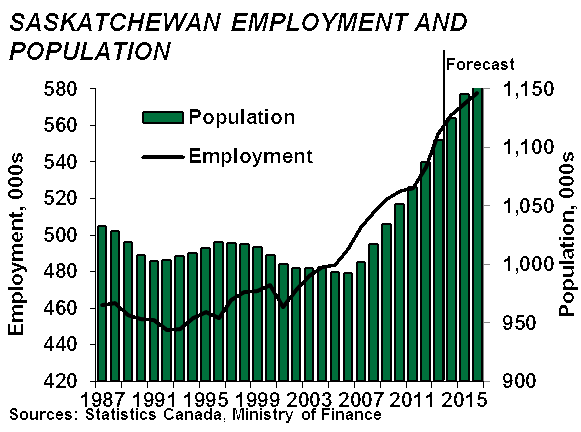
Saskatchewan’s economy continues to perform well in 2014. Employment growth year-to-date remains above the budget expectation. The unemployment rate remains the lowest in the nation. And, population has grown 19,200 between July 2013 and July 2014.
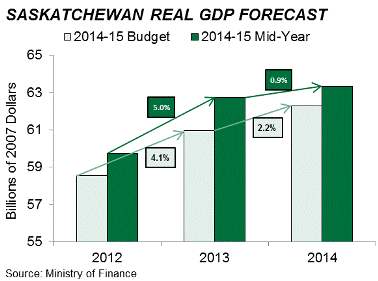
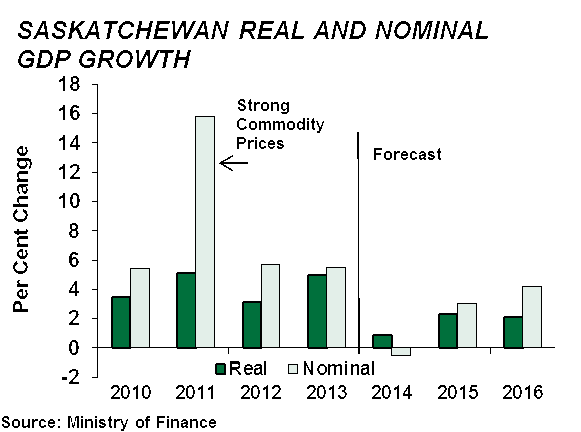
Much stronger real GDP growth in 2013 (5.0 per cent versus the budget forecast of 4.1 per cent) results in a much higher base level of economic activity than previously forecast.
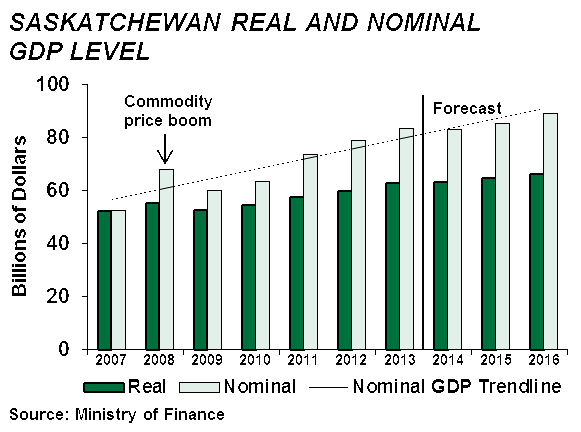
As a result, 2014 real GDP growth is now expected to be 0.9 per cent, but the level of 2014 economic activity is projected to be about $1 billion higher than previously expected.
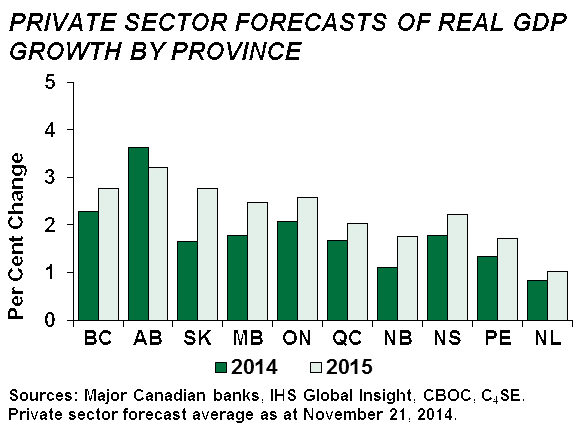
Although private sector forecasters have reduced their expectations of 2014 real GDP growth for Saskatchewan largely on the basis of much stronger-than-expected 2013 performance, they continue to see on-going strength in Saskatchewan’s economy.
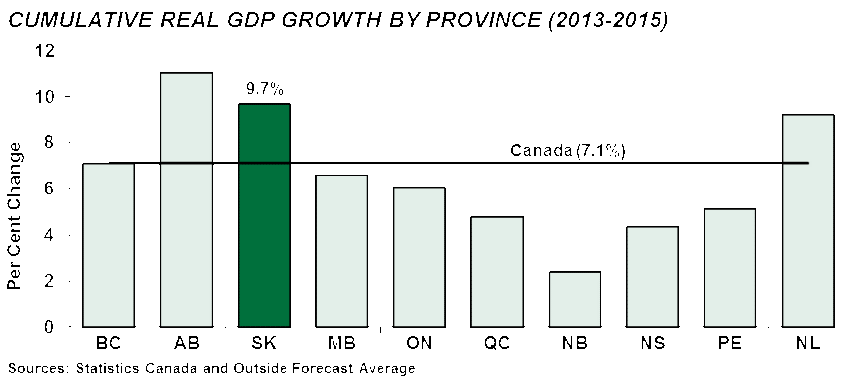
Projections for 2015 average 2.8 per cent, the second highest growth among provinces. From 2013 to 2015, Saskatchewan’s economy is expected to post cumulative growth of 9.7 per cent, the second highest growth among provinces.
Overall, revenue is up $126.4 million from budget with increased non-renewable resource revenue and net income from Government Business Enterprises offsetting a decrease in tax revenue and volatility in the oil sector.
Taxation revenue is down $145.3 million from budget, a decline of 2.1 per cent. Strong 2013 economic growth is not translating into taxation revenue growth at the expected pace. On the basis of year-to-date assessments, 2013 personal and corporate income tax revenue is higher than in 2012, but not as high as forecast in the budget.
Non-renewable resource revenue is up $59.5 million from budget, reflecting higher-than-expected Crown land sales
2014-15 Mid-Year Report | Budget Update 1
revenue, potash sales and prices and oil production, as well as higher oil prices through the first half of the fiscal year. These factors more than offset recent declines in oil prices and reductions in other resource revenue.
| | | | |
| 2014-15 WTI OIL PRICE PERFORMANCE | |
| | | | |
| (US$ per barrel) | | | |
| 2014-15 Budget | | | 94.25 | |
| Actual Averages: | | | | |
| April through September | | | 100.10 | |
| Assumption: | | | | |
| October through March | | | 82.06 | |
| 2014-15 Mid-Year Forecast | | | 91.08 | |
| | | | | |
Overall, expense is up $126.9 million from budget. The majority of the increased expense is for flooding.
Flood-related costs account for $107.0 million of the expense increase – $43.0 million less than the $150.0 million allowance set aside at first quarter.
Additional flood costs above the $107.0 million, including unseeded acreage payments and repairs to provincial roads, highways and other infrastructure, have been and will continue to be incurred as recovery from this summer’s heavy rainfalls continues. Government entities are managing these additional costs within existing budgets.
The only other significant expense increases since budget are projected to be in the Education and the Social Services and Assistance categories.
Public debt is forecast to be up $44.7 million from budget, primarily reflecting increased debt for SaskPower offset by reductions in other entities’ debt.
Government general public debt remains at $3.8 billion.
| 2014-15 DEBT UPDATE | | | | | | | |
| As at March 31 | | | | | | | | | |
| (Millions of Dollars) | | | | | | | |
| | | | | | Mid-Year | | | | |
| | | Budget | | | Projection | | | Change | |
| Government Debt | | | 3,804.8 | | | | 3,803.0 | | | | (1.8 | ) |
| Other General Debt | | | 1,054.8 | | | | 978.8 | | | | (76.0 | ) |
| General Debt | | | 4,859.6 | | | | 4,781.8 | | | | (77.8 | ) |
| GBE Specific Debt | | | 6,955.6 | | | | 7,078.1 | | | | 122.5 | |
| Public Debt | | | 11,815.2 | | | | 11,859.9 | | | | 44.7 | |
| Guaranteed Debt | | | 25.8 | | | | 21.3 | | | | (4.5 | ) |
Overall, the surplus is projected to be $70.9 million – consistent with the budget estimate of $71.4 million.
| 2014-15 BUDGET UPDATE | | | | |
| (Millions of Dollars) | | | | | | | |
| | | | | | Mid-Year | | | | |
| | | Budget | | | Projection | | | Change | |
| Total Revenue | | | 14,073.1 | | | | 14,199.5 | | | | 126.4 | |
| Total Expense | | | 14,001.7 | | | | 14,128.6 | | | | 126.9 | |
| Surplus | | | 71.4 | | | | 70.9 | | | | (0.5 | ) |
| | | | | | | | | | | | | |
2 2014-15 Mid-Year Report | Budget Update
INTRODUCTION
So far this year, Saskatchewan’s economy has performed well, ranking at or near the top among provinces in terms of several key indicators.
Saskatchewan ranks second among provinces in terms of percentage increase in employment and has the lowest unemployment rate in Canada.
In addition, manufacturing sales grew by 7.0 per cent through the first nine months of 2014 (second best percentage increase among provinces) while retail sales were up 4.9 per cent through the first eight months of 2014 (third best percentage increase among provinces).
| SASKATCHEWAN ECONOMIC INDICATORS | | | | | | | | |
| | | | | | | | | Change from |
| | 2012 | 2013 | 2014 | 2013 |
| Population at July 1 (000s) | 1,087.3 | 1,106.2 | 1,125.4 | 19.2 |
| | | | | | | | | |
| | | | | | 2014 | January |
| Per Cent Change Unless Noted Otherwise | 2007-13 | Rank | 2013 | Rank | (year-to-date) | Rank | through |
| Employment Growth | 10.1 | 2 | 3.4 | 1 | 1.8 | | 2 | Oct. |
| Unemployment Rate (average %) | 4.6 | lowest | 4.0 | lowest | 3.8 | | lowest | Oct. |
| Consumer Price Index | 12.1 | 4 | 1.5 | 4 | 2.5 | | 2 | Oct. |
| Average Weekly Earnings | 26.4 | 3 | 3.1 | 2 | 2.9 | | 5 | Aug. |
| Retail Sales | 38.1 | 1 | 5.1 | 2 | 4.9 | | 3 | Aug. |
| Wholesale Trade | 61.7 | 1 | 9.2 | 3 | 2.7 | | 9 | Sept. |
| Number of New Motor Vehicles Sales | 29.8 | 2 | 4.6 | 7 | -0.7 | | 9 | Sept. |
| Manufacturing Sales | 50.5 | 1 | 9.7 | 2 | 7.0 | | 2 | Sept. |
| International Exports | 66.8 | 1 | 2.5 | 8 | 9.7 | | 7 | Sept. |
| Building Permits | 92.8 | 1 | 1.9 | 4 | -13.5 | | 8 | Sept. |
| Number of Housing Starts | 38.0 | 1 | -16.8 | 7 | -0.3 | | 4 | Sept. |
| Investment in New Housing Construction | 133.1 | 1 | 1.4 | 3 | -6.4 | | 6 | Sept. |
| Investment in Non-residential Building Construction | 87.7 | 2 | -4.5 | 7 | 4.9 | | 5 | Sept. |
| Source: Statistics Canada | | | | | | | | |
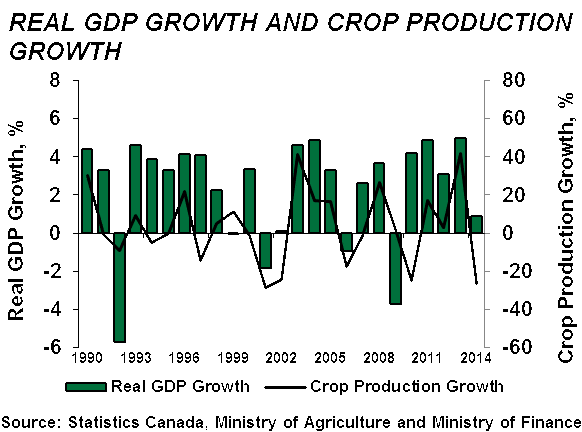
As a result of the smaller crop, 2014 real GDP growth is now expected to be 0.9 per cent, but the level of 2014 economic activity is expected to be about $1 billion higher than the budget forecast.
Real GDP growth is forecast to improve to 2.3 per cent in 2015, as crop production increases, coupled with accelerating global growth which is helping support the province’s export sector.
2014-15 Mid-Year Report | Budget Update 3
2014 PERFORMANCE
Several key indicators for 2014 remain strong, which shows that Saskatchewan’s economy remains resilient despite certain challenges.
Saskatchewan ranks second among all provinces in terms of percentage increase in employment this year. On a year-to-date basis, employment has increased 10,000 or 1.8 per cent through the first ten months of 2014.
Saskatchewan also has the lowest unemployment rate in Canada. Through the first 10 months of 2014, Saskatchewan’s unemployment rate averaged just 3.8 per cent.
As well, the province’s population continues to grow. In the second quarter of 2014 alone, Saskatchewan’s population rose by 5,281 persons, resulting in the second best percentage increase among provinces. Between July 1, 2013 and July 1, 2014, Saskatchewan’s population increased by 1.7 per cent, also the second best percentage increase among provinces.
Furthermore, manufacturing sales grew by 7.0 per cent through the first nine months of 2014 (second best percentage increase among provinces) while retail sales were up 4.9 per cent (third best percentage increase among provinces).
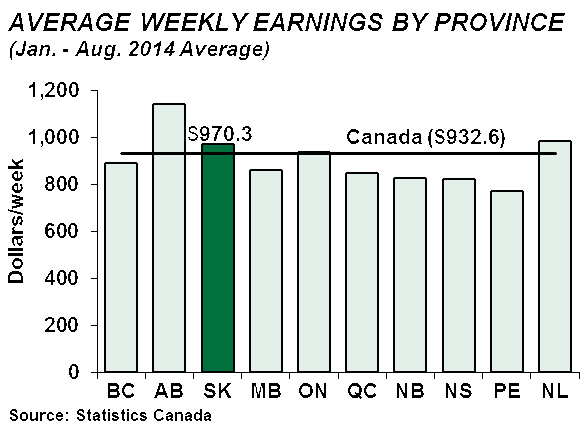
And, although growth in average weekly earnings in Saskatchewan through the first eight months of 2014 ranks fifth best among provinces, Saskatchewan still
4 2014-15 Mid-Year Report | Budget Update
ranks third best in terms of the average level of earnings.
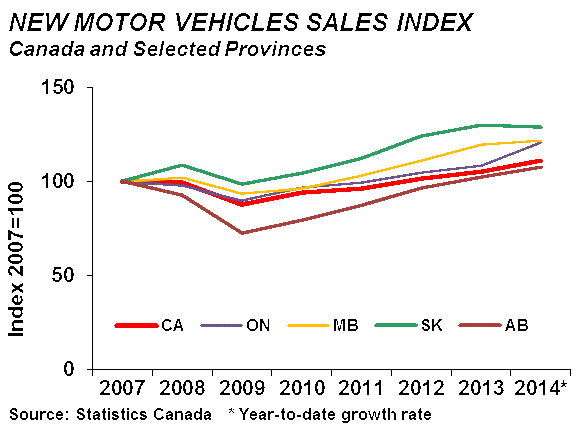
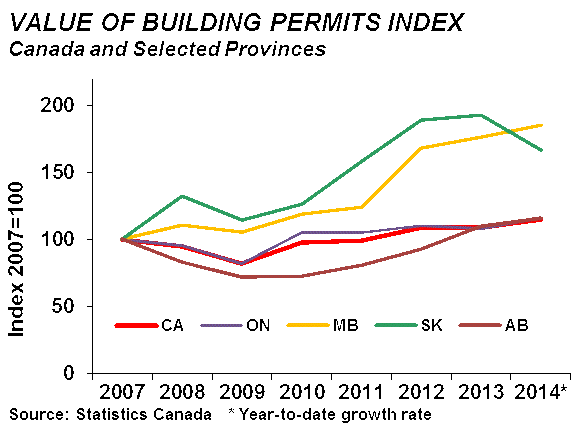
Some indicators have not performed as well in 2014, yet these indicators still remain high by historical standards due to the fact they have risen by so much over the last several years.
New motor vehicle sales and wholesale trade, for example, have grown by 29.8 per cent and 61.7 per cent, respectively, from 2007 to 2013.
Investment in new housing construction and value of building permits have gone up by even more (133.1 per cent and 92.8 per cent, respectively, from 2007 to 2013).
GLOBAL ECONOMIC OUTLOOK
The global economic recovery continues, but it remains weak and uneven with some countries rebounding and others slowing.
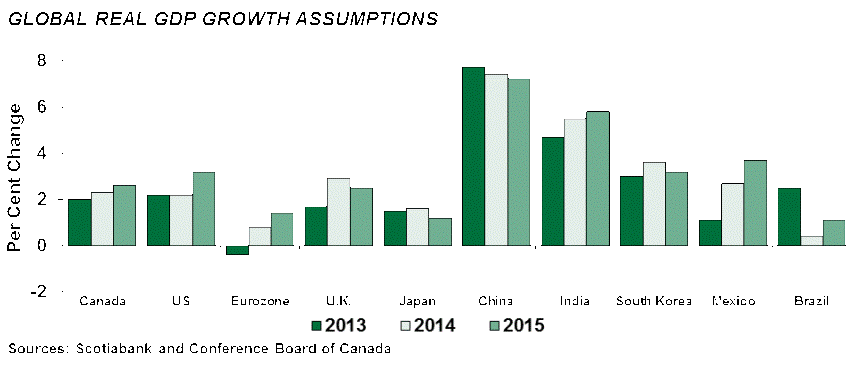
Following a decline of 2.9 per cent in the first quarter of 2014, U.S. real GDP expanded at an annual rate of 4.6 per cent in the second quarter and 3.5 per cent in the third quarter.
Weakness in the first quarter will constrain U.S. overall growth in 2014 to 2.2 per cent, the same as last year, but stronger momentum in the remainder of the year and into next year is expected to boost U.S. growth to 3.2 per cent in 2015.
Like the U.S., U.K.’s economy appears to be generating more sustainable growth momentum, posting annualized growth of 2.9 per cent in the first quarter and 3.2 per cent in the second quarter. U.K.’s real GDP is expected to increase by 2.9 per
2014-15 Mid-Year Report | Budget Update 5
cent this year and 2.5 per cent in 2015, far higher than in most Eurozone countries.
The Eurozone posted growth of 0.9 per cent in the first quarter, 0.7 per cent in the second quarter and 0.8 per cent in the third quarter. Growth forecasts for the Eurozone for all of 2014 and 2015 are positive, but low. In addition to low growth, the threat of deflation is a concern as Eurozone’s inflation is running well below 1.0 per cent.
With growth in Germany, France and Italy, Eurozone’s three largest economies, either stalling or slipping back into recession in the third quarter, there is growing concern that the Eurozone as a whole could fall back into recession.
The Japanese economy is technically in a recession, contracting at annualized rate of 7.3 per cent in the second quarter and 1.6 per cent in the third quarter.
Looking ahead, Japanese economic growth is expected to be more stable as Japan’s central bank intensifies its stimulus efforts to invigorate its chronically anemic economy. Japan’s real GDP is projected to increase by 1.6 per cent in 2014 and 1.2 per cent in 2015.
| CANADIAN AND U.S. GROWTH ASSUMPTIONS | | | | | | |
| | | | | | | | | | |
| | Actual | 2014-15 Budget | | 2014-15 Mid-Year | |
| | 2013 | 2014 | 2015 | 2016 | | 2014 | 2015 | 2016 | |
| Can. real GDP growth (%) | 2.0 | 2.4 | 2.7 | 2.7 | | 2.3 | 2.6 | 2.2 | |
| U.S. real GDP growth (%) | 2.2 | 2.5 | 3.1 | 3.3 | | 2.2 | 3.2 | 3.1 | |
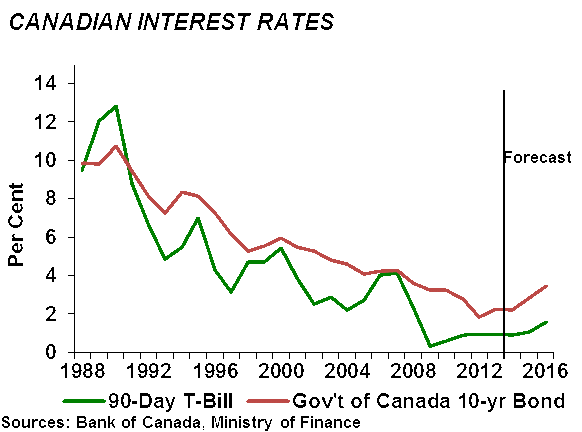
| Short-term Interest Rate (%) | 0.97 | 0.90 | 1.12 | 2.84 | | 0.92 | 1.07 | 1.56 | |
| Long-term Interest Rate (%)* | 2.26 | 2.94 | 3.27 | 3.83 | | 2.19 | 2.81 | 3.45 | |
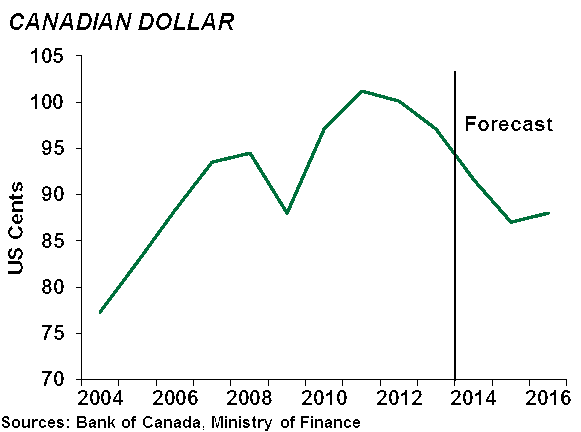
| Canadian Dollar (US cents) | 97.10 | 92.00 | 90.00 | 90.00 | | 90.60 | 87.00 | 88.00 | |
| * 10-year Government of Canada Bond | | | | | | | | |
| | | | | | | | | | |
6 2014-15 Mid-Year Report | Budget Update
China’s real GDP grew at annualized rates of 7.4 per cent and 7.5 per cent in the first and second quarter, respectively, broadly consistent with China’s projected growth of 7.4 per cent for all of 2014. China’s growth rate is anticipated to slow to 7.2 per cent in 2015.
India’s real GDP advanced at an annual rate of 4.6 per cent in the first quarter and 5.7 per cent in the second quarter. India is expected to increase its economic growth rate from 4.7 per cent in 2013 to 5.5 per cent this year and 5.8 per cent in 2015 as a result of stronger investment activity and higher public sector spending.
Real GDP growth forecasts for Brazil for 2014 and 2015 have been trimmed to 0.4 per cent and 1.1 per cent, respectively. The high interest rates required to control inflation are the main factors behind the weak outlook for Brazil.
Canadian real GDP increased at an annualized rate of 0.9 per cent in the first quarter and 3.1 per cent in the second quarter. Canada’s growth rate is projected at 2.3 per cent for all of 2014. A stronger U.S. economy and a lower Canadian dollar are expected to lift Canada’s growth rate to 2.6 per cent in 2015.
INTEREST RATES
U.S. quantitative easing operations came to end in October 2014, six years after it was launched. The end of the U.S. quantitative easing stimulus program last month did not mean the beginning of the U.S. monetary tightening cycle.
The U.S. Federal Reserve has said that it is maintaining its benchmark federal funds rate at the current 0.25 per cent level for a “considerable time” after the end of the quantitative easing program. The U.S. Federal Reserve is not expected to raise the federal funds rate before mid-2015.
The Bank of Canada has also decided to keep its overnight-rate target at 1.0 per cent, where it has been set for four years, owing to the recent plunge in oil prices, persistent excess capacity and other factors that could temper inflation and economic growth in Canada. Canadian short-term interest rates are not expected to increase until the second half of 2015.
CANADIAN DOLLAR
The U.S. dollar is strong because there is strong growth in the U.S. and weakness almost everywhere else. The steady improvement in economic conditions in the U.S. is expected to result in interest rate increases ahead of that in Canada.
2014-15 Mid-Year Report | Budget Update 7
The Canadian dollar has weakened in the midst of the broad-based U.S. dollar strength and a weaker commodity price environment.
SASKATCHEWAN ECONOMIC OUTLOOK
The growth outlook for 2014 has been revised downward primarily as a result of a smaller crop size.
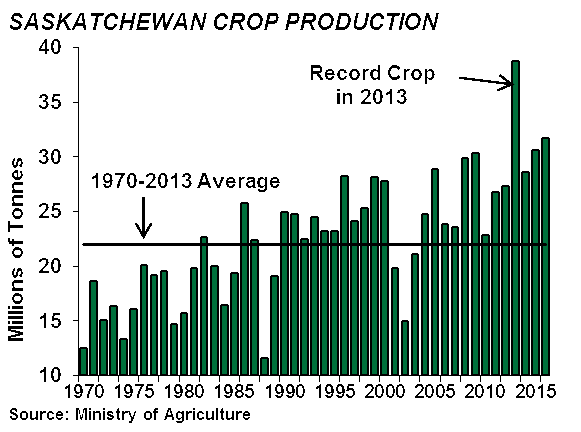
Unlike in 2013 when farmers in Saskatchewan saw near ideal growing conditions, which led to a record harvest, challenging weather conditions in parts of the province this year affected both harvested area and average yield.
Statistics Canada’s September 2014 farm survey shows that Saskatchewan farmers expect to produce just 28.8 million tonnes of crops this year. This represents a decline of roughly 25.7 per cent over the previous year.
Real GDP is now forecast to grow by 0.9 per cent in 2014.
Despite the fact the real GDP growth forecast for 2014 has been revised down, the level of real GDP in 2014 is expected to be higher than budget.
| FORECAST AT A GLANCE | | | | | | | | |
| (Per cent Change Unless Otherwise Noted) | | | | | | |
| | | | | | | | | |
| | Actual | 2014-15 Budget | 2014-15 Mid-Year | |
| | 2013 | 2014 | 2015 | 2016 | 2014 | 2015 | 2016 | |
| Real GDP | 5.0 | 2.2 | 2.3 | 2.1 | 0.9 | 2.3 | 2.1 | |
| Nominal GDP | 5.5 | 1.2 | 3.5 | 3.5 | -0.5 | 3.0 | 4.2 | |
| CPI | 1.5 | 1.9 | 2.0 | 1.7 | 2.6 | 2.1 | 2.3 | |
| Employment growth (000s) | 18.2 | 6.9 | 7.2 | 6.6 | 10.5 | 6.0 | 6.1 | |
| Unemployment rate (%) | 4.0 | 4.4 | 4.6 | 4.8 | 3.8 | 4.2 | 4.3 | |
| Retail sales | 5.1 | 3.9 | 5.1 | 4.5 | 5.0 | 4.4 | 5.0 | |
| | | | | | | | | |
8 2014-15 Mid-Year Report | Budget Update
Contributing factors to this higher level of economic activity include higher-than-anticipated growth in 2013 and upward revisions to the 2011 and 2012 figures, released by Statistics Canada earlier this month.
Saskatchewan real GDP in 2014 is now expected to reach $63.3 billion. It was previously expected to reach $62.3 billion.
Though Saskatchewan crop production is set to fall this year, global crop output overall is anticipated to rise. This has placed additional downward pressure on crop prices, which had already begun to ease late last year as a result of record crop production in Canada and many other parts of the world.
Wheat and canola prices, for example, are estimated to fall by 25.6 per cent and 28.6 per cent, respectively, in 2014.
This, in addition to the smaller-than-expected crop size in 2014, is expected to lead to a slight decline in nominal GDP in 2014.
Saskatchewan nominal GDP is now forecast to fall by 0.5 per cent in 2014.
| COMMODITY PRICE ASSUMPTIONS - CALENDAR YEAR | | | | | | | | |
| | | | | | | | | |
| | Actual | 2014-15 Budget | 2014-15 Mid-Year | |
| | 2013 | 2014 | 2015 | 2016 | 2014 | 2015 | 2016 | |
| WTI Oil (US$ per barrel) | 98.05 | 95.00 | 92.00 | 92.00 | 95.00 | 83.00 | 85.00 | |
| Natural Gas (C$ per GJ) | 2.91 | 3.50 | 3.70 | 4.00 | 4.15 | 3.95 | 4.10 | |
Potash (C$ per K2O tonne)1 | 581.94 | 488.12 | 502.21 | 509.18 | 501.39 | 545.32 | 546.29 | |
Potash (US$ per KCl tonne)1 | 344.69 | 273.93 | 275.72 | 279.54 | 277.10 | 289.40 | 293.25 | |
| Wheat (C$ per tonne) | 279.00 | 235.00 | 225.88 | 233.08 | 207.62 | 217.00 | 222.71 | |
| Canola (C$ per tonne) | 603.00 | 469.47 | 509.48 | 528.87 | 430.84 | 420.83 | 515.73 | |
1 The potash industry quotes prices in US dollars per KCl tonne. Provincial royalty calculations, however, are based on the Canadian dollar price per K2O tonne. | |
| Sources: Ministry of the Economy, Ministry of Agriculture | | | | | | | | |
2014-15 Mid-Year Report | Budget Update 9
FORECAST COMPARISON
Very strong economic performance in 2013 (and stronger-than-expected performances in 2011 and 2012 according to the provincial economic accounts released by Statistics Canada in early November) and a smaller-than-expected crop in 2014, have led forecasters to reduce Saskatchewan’s 2014 growth.
Private forecast agencies, on average, expect Saskatchewan’s real GDP to grow by 1.6 per cent in 2014, ranging from 0.8 per cent to 2.5 per cent.
Private sector forecasters continue to see strength in Saskatchewan’s economy. For 2015, they expect Saskatchewan’s real GDP to grow by 2.8 per cent, the second highest among provinces, ranging from 2.3 per cent to 3.4 per cent.
During the 2013 to 2015 period, Saskatchewan’s economy is expected to have a cumulative growth of 9.7 per cent, the second highest growth among provinces.
| PRIVATE SECTOR REAL GDP GROWTH FORECASTS FOR SASKATCHEWAN | | |
| (Per Cent Change) | | | | | | | | | |
| | | | | | | | Cumulative | | |
| | 2013* | | 2014 | | 2015 | | Growth | Release Date | |
| IHS Global Insight | 5.0 | | 1.7 | | 2.6 | | 9.6 | Nov-14 | |
| Conference Board of Canada | 5.0 | | 0.8 | | 2.3 | | 8.3 | Sep-14 | |
| The Centre for Spatial Economics | 5.0 | | 2.0 | | 3.4 | | 10.7 | Jul-14 | |
| TD Bank | 5.0 | | 1.3 | | 2.5 | | 9.0 | Oct-14 | |
| RBC | 5.0 | | 1.3 | | 3.0 | | 9.6 | Sep-14 | |
| BMO | 5.0 | | 1.0 | | 2.7 | | 8.9 | Nov-14 | |
| CIBC | 5.0 | | 2.0 | | 2.8 | | 10.1 | Sep-14 | |
| Scotiabank | 5.0 | | 2.2 | | 2.6 | | 10.1 | Oct-14 | |
| Laurentian Bank | 5.0 | | 2.5 | | 2.9 | | 10.7 | Aug-14 | |
| Average of Private Sector Forecasts | 5.0 | | 1.6 | | 2.8 | | 9.7 | | |
| 2014-15 Budget | 4.1 | | 2.2 | | 2.3 | | 8.8 | | |
| 2014-15 Mid-year | 5.0 | | 0.9 | | 2.3 | | 8.4 | | |
| * Based on Statistics Canada's Provincial Economic Accounts, November 2014 | | |
10 2014-15 Mid-Year Report | Budget Update
| PRIVATE SECTOR FORECASTS OF REAL GDP GROWTH BY PROVINCE | | | |
| (Per Cent Change) | | | | | | | | | |
| | 2013 | | | | | | Cumulative | | |
| | Actual* | Rank | 2014 | Rank | 2015 | Rank | Growth | Rank | |
| British Columbia | 1.9 | 6 | 2.3 | 2 | 2.8 | 2 | 7.1 | 4 | |
| Alberta | 3.8 | 3 | 3.6 | 1 | 3.2 | 1 | 11.0 | 1 | |
| Saskatchewan | 5.0 | 2 | 1.6 | 6 | 2.8 | 2 | 9.7 | 2 | |
| Manitoba | 2.2 | 4 | 1.8 | 4 | 2.5 | 4 | 6.6 | 5 | |
| Ontario | 1.3 | 7 | 2.1 | 3 | 2.6 | 3 | 6.1 | 6 | |
| Quebec | 1.0 | 8 | 1.7 | 5 | 2.0 | 6 | 4.8 | 8 | |
| New Brunswick | -0.5 | 10 | 1.1 | 8 | 1.8 | 7 | 2.4 | 10 | |
| Nova Scotia | 0.3 | 9 | 1.8 | 4 | 2.2 | 5 | 4.4 | 9 | |
| Prince Edward Island | 2.0 | 5 | 1.3 | 7 | 1.7 | 8 | 5.1 | 7 | |
| Newfoundland and Labrador | 7.2 | 1 | 0.8 | 9 | 1.0 | 9 | 9.2 | 3 | |
| Canada | 2.0 | | 2.3 | | 2.6 | | 7.1 | | |
| 2014-15 Mid-year | 5.0 | | 0.9 | | 2.3 | | 8.4 | | |
| * Statistics Canada's Provincial Economic Accounts, November 5, 2014 | | | | |
CONCLUSION
Saskatchewan’s economic growth is expected to ease this year following 5.0 per cent growth last year as the crop harvest declines to roughly 28.8 million tonnes from 38.8 million tonnes in 2013.
The province, however, should see its economic growth rate increase to 2.3 per cent in 2015 as crop production improves over 2014 levels.
As well, recent developments in the U.S. economy are encouraging as a stronger U.S. economy combined with a lower value of the Canadian dollar will lift the economic growth of the province.
However, the weakness in commodity prices is a concern and could persist if the Eurozone slips back into recession and Japan continues to stall.
2014-15 Mid-Year Report | Budget Update 11
2014-15 BUDGET UPDATE Mid-Year |
OVERVIEW
At mid-year, the 2014-15 surplus is expected to be $70.9 million, down $0.5 million from budget.
Revenue is projected to be up $126.4 million or 0.9 per cent from budget.
Expense is projected to be up $126.9 million or 0.9 per cent from budget.
| 2014-15 BUDGET UPDATE - MID-YEAR | | | | | | | | | | | | | |
| (Millions of Dollars) | | | | | | | | | | | | | | | |
| | | | | | First Quarter | | | Mid-Year | | | Mid-Year Change from | |
| | | Budget | | | Forecast | | | Projection | | | Budget | | | First Quarter | |
| | | | | | | | | | | | | | | | |
| Revenue | | | | | | | | | | | | | | | |
| | | | | | | | | | | | | | | | |
| Taxation | | | 6,820.3 | | | | 6,820.3 | | | | 6,675.0 | | | | (145.3 | ) | | | (145.3 | ) |
| Non-Renewable Resources | | | 2,694.4 | | | | 2,804.5 | | | | 2,753.9 | | | | 59.5 | | | | (50.6 | ) |
| Other Own-Source Revenue | | | 1,863.8 | | | | 1,841.2 | | | | 1,869.2 | | | | 5.4 | | | | 28.0 | |
| Transfers from the Federal Government | | | 2,026.4 | | | | 2,026.4 | | | | 2,049.4 | | | | 23.0 | | | | 23.0 | |
| Net Income from Government | | | | | | | | | | | | | | | | | | | | |
| Business Enterprises | | | 668.2 | | | | 749.6 | | | | 852.0 | | | | 183.8 | | | | 102.4 | |
| Total Revenue | | | 14,073.1 | | | | 14,242.0 | | | | 14,199.5 | | | | 126.4 | | | | (42.5 | ) |
| | | | | | | | | | | | | | | | | | | | | |
| Expense | | | | | | | | | | | | | | | | | | | | |
| | | | | | | | | | | | | | | | | | | | | |
| Agriculture | | | 681.2 | | | | 681.2 | | | | 680.6 | | | | (0.6 | ) | | | (0.6 | ) |
| Community Development | | | 589.0 | | | | 589.0 | | | | 589.6 | | | | 0.6 | | | | 0.6 | |
| Debt Charges | | | 546.3 | | | | 546.3 | | | | 540.2 | | | | (6.1 | ) | | | (6.1 | ) |
| Economic Development | | | 288.6 | | | | 305.9 | | | | 298.5 | | | | 9.9 | | | | (7.4 | ) |
| Education | | | 3,675.0 | | | | 3,694.5 | | | | 3,697.9 | | | | 22.9 | | | | 3.4 | |
| Environment and Natural Resources | | | 232.5 | | | | 232.5 | | | | 247.5 | | | | 15.0 | | | | 15.0 | |
| Health | | | 5,355.9 | | | | 5,355.9 | | | | 5,353.5 | | | | (2.4 | ) | | | (2.4 | ) |
| Protection of Persons and Property | | | 593.7 | | | | 593.7 | | | | 687.3 | | | | 93.6 | | | | 93.6 | |
| Social Services and Assistance | | | 1,172.4 | | | | 1,172.4 | | | | 1,190.7 | | | | 18.3 | | | | 18.3 | |
| Transportation | | | 539.3 | | | | 539.3 | | | | 539.2 | | | | (0.1 | ) | | | (0.1 | ) |
| Other | | | 327.8 | | | | 306.4 | | | | 303.6 | | | | (24.2 | ) | | | (2.8 | ) |
Total Expense (prior to flood-related costs) | | | 14,001.7 | | | | 14,017.1 | | | | 14,128.6 | | | | 126.9 | | | | 111.5 | |
| Allowance for flood-related costs | | | - | | | | 150.0 | | | | - | | | | - | | | | (150.0 | ) |
| Total Expense | | | 14,001.7 | | | | 14,167.1 | | | | 14,128.6 | | | | 126.9 | | | | (38.5 | ) |
| Surplus | | | 71.4 | | | | 74.9 | | | | 70.9 | | | | (0.5 | ) | | | (4.0 | ) |
12 2014-15 Mid-Year Report | Budget Update
REVENUE UPDATE
At mid-year, revenue is projected to be $14.2 billion, an increase of $126.4 million from budget.
| | | | |
| 2014-15 REVENUE RECONCILIATION | |
| | | | |
| (Millions of Dollars) | | | |
| 2014-15 Budget | | | 14,073.1 | |
| Forecast Changes: | | | | |
| GBE Net Income | | | 183.8 | |
| Non-Renewable Resources | | | 59.5 | |
| Federal Transfers | | | 23.0 | |
| Other Own-Source | | | 5.4 | |
| Taxation | | | (145.3 | ) |
| Total Change from Budget | | | 126.4 | |
| 2014-15 Mid-Year Forecast | | | 14,199.5 | |
Personal Income Tax (PIT) and Corporation Income Tax (CIT) revenue are projected to decrease by $101.6 million and $33.7 million, respectively. These decreases are primarily due to lower-than-expected tax assessments for the 2013 tax year, which results in negative prior-year adjustments in 2014-15 revenue. While year-to-date assessments for 2013 are lower than expected, they still reflect PIT growth of 5.9 per cent and CIT growth of 1.4 per cent relative to 2012.
Tobacco Tax revenue is projected to decrease by $10.0 million from budget, reflecting weaker-than-expected receipts through the end of September.
Non-renewable resources revenue is projected to increase by $59.5 million from budget.
Crown land sales revenue is projected to increase by $82.4 million, primarily reflecting higher-than-expected April and August land sales.
Potash revenue is projected to increase by $56.1 million from budget, primarily due to an increase in average prices and sales volumes. Average prices in 2014-15 are projected at US$280 per KCl tonne (C$512 per K2O tonne), up from the budget assumption of US$274 (C$492). Sales volumes are currently projected at 11.0 million K2O tonnes, up from the budget assumption of 10.6 million K2O tonnes.
| 2014-15 NON-RENEWABLE RESOURCES FORECAST ASSUMPTIONS | | | | | | | |
| | | | | | | | | | | | | | | | |
| | | Budget | | | First Quarter | | | Mid-Year | | | Mid-Year Change from | |
| | | Plan | | | Forecast | | | Projection | | | Budget | | | First Quarter | |
| WTI Oil Price (US$/barrel) | | | 94.25 | | | | 99.89 | | | | 91.08 | | | | (3.17 | ) | | | (8.81 | ) |
| Light-Heavy Differential (% of WTI) | | | 19.5 | | | | 16.9 | | | | 16.2 | | | | (3.3 | ) | | | (0.7 | ) |
| Oil Production (million barrels) | | | 181.8 | | | | 185.6 | | | | 183.3 | | | | 1.5 | | | | (2.3 | ) |
Potash Price (mine netback, US$/KCl tonne)1 | | | 274 | | | | 271 | | | | 280 | | | | 6 | | | | 9 | |
Potash Price (mine netback, C$/K2O tonne)1 | | | 492 | | | | 482 | | | | 512 | | | | 20 | | | | 30 | |
Potash Sales (million K2O tonnes)1 | | | 10.6 | | | | 10.6 | | | | 11.0 | | | | 0.4 | | | | 0.4 | |
| Canadian Dollar (US cents) | | | 91.5 | | | | 92.1 | | | | 89.7 | | | | (1.8 | ) | | | (2.4 | ) |
1 Ministry of Finance calculations derived from calendar-year forecasts. | | | | | | | | | | | | | |
2014-15 Mid-Year Report | Budget Update 13
Oil revenue is projected to decrease by $40.5 million from budget. The decline is primarily due to a lower average West Texas Intermediate (WTI) oil price projection, partially offset by a smaller light-heavy differential and a decrease in the average exchange rate projection.
The average 2014-15 WTI oil price is projected at US$91.08 per barrel at mid-year, down from the budget assumption of US$94.25 per barrel. The mid-year price forecast reflects an average price of US$100.10 over the first six months of the fiscal year (April to September) and an assumption of US$82.06 over the second half of the year (October to March).
A narrower differential and a lower exchange rate offset some of the decline in WTI oil prices since budget.
The light-heavy differential is now projected at 16.2 per cent, down from 19.5 per cent at budget.
The Canadian dollar is now projected to average 89.74 U.S. cents in 2014-15, down from the budget assumption of 91.50 U.S. cents. The mid-year exchange rate forecast reflects an average of 91.79 U.S. cents over the first six months of the fiscal year (April to September) and an assumption of 87.69 U.S. cents over the second half of the year (October to March).
Other non-renewable resources revenue, including uranium, coal and other minerals, is projected to decrease by $40.8 million from budget. The decrease is largely due to delays in production at Cigar Lake and lower average uranium prices.
Finally, natural gas revenue is projected to increase by $2.3 million from budget due to higher production and average fieldgate price projections.
Other own-source revenue is up a net $5.4 million from budget due mainly to higher investment revenue and Regional Health Authority revenue, offset by lower revenue from oil and gas production on federal Treaty Land Entitlement properties.
Transfers from the Federal Government are projected to increase $23.0 million from budget, largely due to federal disaster assistance funding related to prior-year weather events. While the federal government has indicated its willingness to assist Saskatchewan with this year’s flood-related costs, the mid-year projection includes no federal revenue related to the 2014 floods as financial arrangements have yet to be finalized with Canada.
Government Business Enterprise (GBE) net income is projected to increase $183.8 million from budget.
The total increase from budget is largely the result of increases in net income forecasts from SaskPower, the Auto Fund, Workers’ Compensation Board, SaskTel and SGI, with a partial offset due to a decrease in the net income forecast from SaskEnergy.
14 2014-15 Mid-Year Report | Budget Update
EXPENSE UPDATE
At mid-year, expense is projected to be $14.1 billion, an increase of $126.9 million from budget.
| | |
| 2014-15 EXPENSE RECONCILIATION | |
| | | | |
| (Millions of Dollars) | | | |
| 2014-15 Budget | | | 14,001.7 | |
| Forecast Changes: | | | | |
| Protection of Persons and Property | | | 93.6 | |
| Education | | | 22.9 | |
| Social Services and Assistance | | | 18.3 | |
| Environment and Natural Resources | | | 15.0 | |
| Other | | | (22.9 | ) |
| Total Change from Budget | | | 126.9 | |
| 2014-15 Mid-Year Forecast | | | 14,128.6 | |
| | | | | |
Flood-related costs account for $107.0 million of the increase since budget, less than the $150.0 million allowance set aside at first quarter. This funding is primarily for Provincial Disaster Assistance Program (PDAP) claims and program administration costs, as well as flood-mitigation projects delivered through the Emergency Flood Damage Reduction Program by the Water Security Agency.
However, additional costs have been and will continue to be incurred by the province as it recovers from this summer’s heavy rainfalls. Examples of these costs include crop insurance payments for unseeded acres and repairs to provincial roads, highways and other infrastructure. The full cost of this year’s flooding is expected to surpass $150.0 million, but government entities are managing some of these additional costs within existing budgets.
Significant changes have occurred in the following areas since budget.
Protection of Persons and Property is projected to increase $93.6 million, largely reflecting funding for PDAP claims and program administration costs.
Education is projected to increase $22.9 million. The increase is largely due to funding for land acquisition for the Joint Use School Project and higher enrollments, partially offset by a lower pension accrual adjustment for the Teachers’ Superannuation Plan.
Social Services and Assistance is projected to increase $18.3 million, largely reflecting increases at the Ministry of Social Services for the Saskatchewan Assistance Program, the Saskatchewan Assured Income for Disability program and Child and Family Services, partially offset by lower rental development and repair costs at the Saskatchewan Housing Corporation.
Environment and Natural Resources is up $15.0 million, primarily for the 2014 Emergency Flood Damage Reduction Program.
All other areas are projected to decline by a combined $22.9 million from budget, including small reductions in many of the Government Service Organizations.
2014-15 Mid-Year Report | Budget Update 15
DEBT UPDATE
The General Revenue Fund (GRF) borrows for government and Crown corporations. Other government entities such as Boards of Education and Regional Health Authorities borrow on their own behalf.
In total, public debt, which is composed of gross debt less sinking funds, is forecast to be $11,859.9 million at March 31, 2015, an increase of $44.7 million from the 2014-15 Budget.
Government general public debt at March 31, 2015 is forecast to be $3,803.0 million, a decrease of $1.8 million from the 2014-15 Budget.
Other general debt, principally the debt of the other government service organizations (GSOs), - some of whom borrow through the GRF and some of whom borrow on their own - is forecast to be $978.8 million at March 31, 2015, a decrease of $76.0 million from budget.
Government Business Enterprise (GBE) Specific Debt is forecast to be $7,078.1 million at March 31, 2015, an increase of $122.5 million from Budget.
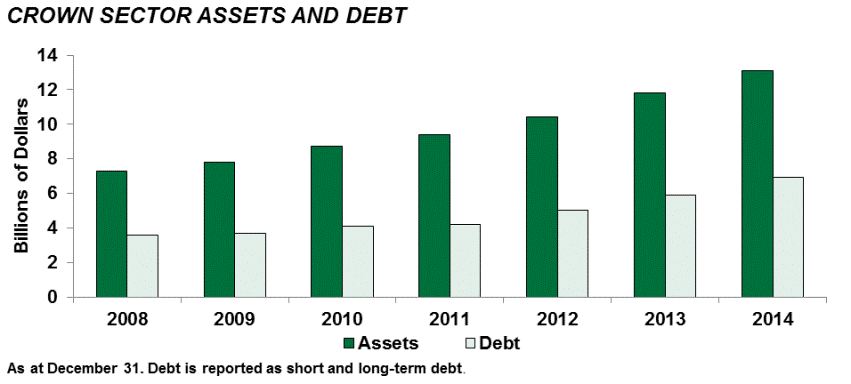
GBE debt is incurred in the normal course of business, primarily for investment in infrastructure and business development initiatives which provide revenue streams to service the debt.
For example, Crown sector debt has increased $3.3 billion between 2008 and 2014. Over that same period, the value of the Crown sector’s assets has risen by $5.8 billion.
16 2014-15 Mid-Year Report | Budget Update
| SCHEDULE OF DEBT BY CATEGORY | | | | | | | | | | | | | | | |
| As at March 31 | | | | | | | | | | | | | | | |
| (Millions of Dollars) | | | | | | | | | | | | | | | |
| | | | | | | | | | | | | | | Change | |
| | | Budget | | | Mid-Year Projection | | | from | |
| | | Total | | | GRF Debt 1 | | | Other Debt | | | Total | | | Budget | |
| | | | | | | | | | | | | | | | |
| Government Public Debt | | | 3,804.8 | | | | 3,803.0 | | | | - | | | | 3,803.0 | | | | (1.8 | ) |
| Other General Debt | | | | | | | | | | | | | | | | | | | | |
| Municipal Financing Corporation of Saskatchewan | | | 128.5 | | | | 99.0 | | | | - | | | | 99.0 | | | | (29.5 | ) |
| Saskatchewan Housing Corporation | | | 25.7 | | | | 22.0 | | | | 3.6 | | | | 25.6 | | | | (0.1 | ) |
| Saskatchewan Opportunities Corporation | | | 34.4 | | | | 34.4 | | | | - | | | | 34.4 | | | | - | |
| Saskatchewan Power Corporation | | | 92.9 | | | | 92.8 | | | | - | | | | 92.8 | | | | (0.1 | ) |
| Saskatchewan Water Corporation | | | 18.8 | | | | 25.0 | | | | - | | | | 25.0 | | | | 6.2 | |
| SaskEnergy Incorporated | | | 111.5 | | | | 111.4 | | | | - | | | | 111.4 | | | | (0.1 | ) |
| Boards of Education | | | 216.0 | | | | - | | | | 244.0 | | | | 244.0 | | | | 28.0 | |
| Saskatchewan Immigrant Investor Fund Inc. | | | 215.7 | | | | - | | | | 201.3 | | | | 201.3 | | | | (14.4 | ) |
| Global Transportation Hub Authority | | | 73.6 | | | | - | | | | 26.0 | | | | 26.0 | | | | (47.6 | ) |
| Growth and Financial Security Fund | | | (6.6 | ) | | | - | | | | (24.9 | ) | | | (24.9 | ) | | | (18.3 | ) |
| Regional Health Authorities | | | 109.6 | | | | - | | | | 108.7 | | | | 108.7 | | | | (0.9 | ) |
| Water Security Agency | | | 32.4 | | | | - | | | | 33.2 | | | | 33.2 | | | | 0.8 | |
| Other | | | 2.3 | | | | - | | | | 2.3 | | | | 2.3 | | | | - | |
| Other General Debt | | | 1,054.8 | | | | 384.6 | | | | 594.2 | | | | 978.8 | | | | (76.0 | ) |
| | | | | | | | | | | | | | | | | | | | | |
| General Debt | | | 4,859.6 | | | | 4,187.6 | | | | 594.2 | | | | 4,781.8 | | | | (77.8 | ) |
| Government Business Enterprise Specific Debt | | | | | | | | | | | | | | | | | |
| Municipal Financing Corporation of Saskatchewan | | | 131.8 | | | | 131.8 | | | | - | | | | 131.8 | | | | - | |
| Saskatchewan Gaming Corporation | | | 2.9 | | | | - | | | | 2.9 | | | | 2.9 | | | | - | |
| Saskatchewan Liquor and Gaming Authority | | | 125.0 | | | | 124.6 | | | | - | | | | 124.6 | | | | (0.4 | ) |
| Saskatchewan Power Corporation | | | 4,722.4 | | | | 4,854.7 | | | | 58.9 | | | | 4,913.6 | | | | 191.2 | |
| Saskatchewan Telecommunications | | | | | | | | | | | | | | | | | | | - | |
| Holding Corporation | | | 880.8 | | | | 857.3 | | | | - | | | | 857.3 | | | | (23.5 | ) |
| Saskatchewan Water Corporation | | | 33.0 | | | | 22.3 | | | | - | | | | 22.3 | | | | (10.7 | ) |
| SaskEnergy Incorporated | | | 1,059.7 | | | | 1,020.8 | | | | 4.8 | | | | 1,025.6 | | | | (34.1 | ) |
| Government Business Enterprise Specific Debt | | | 6,955.6 | | | | 7,011.5 | | | | 66.6 | | | | 7,078.1 | | | | 122.5 | |
| | | | | | | | | | | | | | | | | | | | | |
Public Debt 2 | | | 11,815.2 | | | | 11,199.1 | | | | 660.8 | | | | 11,859.9 | | | | 44.7 | |
| | | | | | | | | | | | | | | | | | | | | |
| Guaranteed Debt | | | 25.8 | | | | 235.0 | | | | (213.7 | ) | | | 21.3 | | | | (4.5 | ) |
1 Debt obtained by the General Revenue Fund (GRF) for its own use or on behalf of Crown corporations. The amount is net of sinking funds. Debt repayable in foreign currency is restated in equivalent Canadian dollars. |
2 The Province's Summary Financial Statements account for government business enterprises (GBEs) such as SaskPower Corporation on an equity basis. Therefore GBE specific debt is netted against other liabilities and assets and |
| the resultant equity is shown as Investment in GBEs. |
2014-15 Mid-Year Report | Budget Update 17
Supplementary
Information
Budget by Organization
Debt by Organization
18 2014-15 Mid-Year Report | Budget Update
| BUDGET BY ORGANIZATION | | | | | | | | | |
| For the Year Ended March 31 | | | | | | | | | |
| (Millions of Dollars) | | | | | | | | | |
| | | | | | Mid-Year | | | | |
| | | Budget | | | Projection | | | Change | |
| Core Government | | | 105.4 | | | | (122.2 | ) | | | (227.6 | ) |
| Boards of Education | | | 36.1 | | | | 36.1 | | | | - | |
| Regional Health Authorities | | | (50.0 | ) | | | (46.4 | ) | | | 3.6 | |
| Saskatchewan Liquor and Gaming Authority | | | 491.8 | | | | 491.8 | | | | - | |
| Other Agencies | | | (42.3 | ) | | | (42.0 | ) | | | 0.3 | |
| Adjustment to Account for Pension Costs on an Accrual Basis | | | (38.9 | ) | | | (0.6 | ) | | | 38.3 | |
| | | | 502.1 | | | | 316.7 | | | | (185.4 | ) |
Dividends included in Core Government 3 | | | (508.5 | ) | | | (508.5 | ) | | | - | |
| Surplus (Deficit) of Treasury Board Organizations | | | (6.4 | ) | | | (191.8 | ) | | | (185.4 | ) |
Crown Investments Corporation Board Organizations 1 | | | | | | | | | | | | |
Crown Investments Corporation of Saskatchewan (Separate) 4 | | | (29.4 | ) | | | (26.1 | ) | | | 3.3 | |
| Saskatchewan Gaming Corporation | | | 25.2 | | | | 24.4 | | | | (0.8 | ) |
| Saskatchewan Government Insurance | | | 29.7 | | | | 36.4 | | | | 6.7 | |
| Saskatchewan Power Corporation | | | 26.9 | | | | 108.1 | | | | 81.2 | |
| Saskatchewan Telecommunications Holding Corporation | | | 59.2 | | | | 78.0 | | | | 18.8 | |
| SaskEnergy Incorporated | | | 62.2 | | | | 49.5 | | | | (12.7 | ) |
| Other Agencies | | | 4.7 | | | | 2.5 | | | | (2.2 | ) |
Interagency Accounting Adjustments 2 | | | (16.5 | ) | | | (15.2 | ) | | | 1.3 | |
| | | | 162.0 | | | | 257.6 | | | | 95.6 | |
Dividends included in Core Government 3 | | | (206.0 | ) | | | (206.0 | ) | | | - | |
| Surplus (Deficit) Retained in CIC Board Organizations | | | (44.0 | ) | | | 51.6 | | | | 95.6 | |
| | | | | | | | | | | | | |
| Surplus (Deficit) Prior to Not-for-Profit Insurance Organizations | | | (50.4 | ) | | | (140.2 | ) | | | (89.8 | ) |
Not-for-Profit Insurance Organizations 1,3 | | | | | | | | | | | | |
| Crop Reinsurance Fund of Saskatchewan | | | - | | | | 0.1 | | | | 0.1 | |
| Saskatchewan Auto Fund | | | (12.6 | ) | | | 44.6 | | | | 57.2 | |
| Saskatchewan Crop Insurance Corporation | | | 127.9 | | | | 129.3 | | | | 1.4 | |
| Workers' Compensation Board (Saskatchewan) | | | 6.5 | | | | 37.1 | | | | 30.6 | |
| Surplus (Deficit) of Not-for-Profit Insurance Organizations | | | 121.8 | | | | 211.1 | | | | 89.3 | |
| | | | | | | | | | | | | |
| Surplus | | | 71.4 | | | | 70.9 | | | | (0.5 | ) |
| Totals may not add due to rounding. | | | | | | | | | | | | |
1 The year-end for some organizations is not March 31. The 2014-15 Budget amounts for those organizations are the Budget amounts for the fiscal year ending before March 31, 2015. |
2 Interagency Accounting Adjustments eliminate the effects of financial transactions between government organizations and adjust for certain accounting standards that differ from those used in the Summary Financial Statements. |
3 Dividends paid to the Core Government by Treasury Board organizations and Crown Investments Corporation (CIC) Board organizations. The dividends are eliminated to avoid double counting income. Insurance organizations do |
| not pay dividends to Core Government. |
4 Crown Investments Corporation of Saskatchewan (Separate) is shown before dividend revenue from its subsidiaries to avoid double counting income. |
5 At mid-year, Core operational revenue accounts for $11.8 billion of the $14.2 billion total / Core operational expense accounts for more than $11.9 billion of the $14.1 billion total. |
2014-15 Mid-Year Report | Budget Update 19
| SCHEDULE OF DEBT BY ORGANIZATION | | | | | | | | | | | | | | | |
| As at March 31 | | | | | | | | | | | | | | | |
| (Millions of Dollars) | | | | | | | | | | | | | | | |
| | | | | | | | | | | | | | | Change | |
| | | Budget | | | Mid-Year Projection | | from | |
| | | Total | | | GRF Debt 1 | | | Other Debt | | | Total | | | Budget | |
| | | | | | | | | | | | | | | | |
| Treasury Board Organizations | | | | | | | | | | | | | | | |
| | | | | | | | | | | | | | | | | | | | | |
| Government Public Debt | | | 3,804.8 | | | | 3,803.0 | | | | - | | | | 3,803.0 | | | | (1.8 | ) |
| Boards of Education | | | 216.0 | | | | - | | | | 244.0 | | | | 244.0 | | | | 28.0 | |
| Global Transportation Hub Authority | | | 73.6 | | | | - | | | | 26.0 | | | | 26.0 | | | | (47.6 | ) |
| Growth and Financial Security Fund | | | (6.6 | ) | | | - | | | | (24.9 | ) | | | (24.9 | ) | | | (18.3 | ) |
| Municipal Financing Corporation of Saskatchewan | | | 260.3 | | | | 230.8 | | | | - | | | | 230.8 | | | | (29.5 | ) |
| Regional Health Authorities | | | 109.6 | | | | - | | | | 108.7 | | | | 108.7 | | | | (0.9 | ) |
| Saskatchewan Housing Corporation | | | 25.7 | | | | 22.0 | | | | 3.6 | | | | 25.6 | | | | (0.1 | ) |
| Saskatchewan Liquor and Gaming Authority | | | 125.0 | | | | 124.6 | | | | - | | | | 124.6 | | | | (0.4 | ) |
| Water Security Agency | | | 32.4 | | | | - | | | | 33.2 | | | | 33.2 | | | | 0.8 | |
| Other | | | 2.3 | | | | - | | | | 2.3 | | | | 2.3 | | | | - | |
| Other Treasury Board Organizations | | | 838.3 | | | | 377.4 | | | | 392.9 | | | | 770.3 | | | | (68.0 | ) |
| Public Debt of Treasury Board Organizations | | | 4,643.1 | | | | 4,180.4 | | | | 392.9 | | | | 4,573.3 | | | | (69.8 | ) |
| CIC Board Organizations | | | | | | | | | | | | | | | | | | | | |
| Saskatchewan Gaming Corporation | | | 2.9 | | | | - | | | | 2.9 | | | | 2.9 | | | | - | |
| Saskatchewan Immigrant Investor Fund Inc. | | | 215.7 | | | | - | | | | 201.3 | | | | 201.3 | | | | (14.4 | ) |
| Saskatchewan Opportunities Corporation | | | 34.4 | | | | 34.4 | | | | - | | | | 34.4 | | | | - | |
| Saskatchewan Power Corporation | | | 4,815.3 | | | | 4,947.5 | | | | 58.9 | | | | 5,006.4 | | | | 191.1 | |
| Saskatchewan Telecommunications | | | | | | | | | | | | | | | | | | | - | |
| Holding Corporation | | | 880.8 | | | | 857.3 | | | | - | | | | 857.3 | | | | (23.5 | ) |
| Saskatchewan Water Corporation | | | 51.8 | | | | 47.3 | | | | - | | | | 47.3 | | | | (4.5 | ) |
| SaskEnergy Incorporated | | | 1,171.2 | | | | 1,132.2 | | | | 4.8 | | | | 1,137.0 | | | | (34.2 | ) |
| Public Debt of CIC Board Organizations | | | 7,172.1 | | | | 7,018.7 | | | | 267.9 | | | | 7,286.6 | | | | 114.5 | |
| | | | | | | | | | | | | | | | | | | | | |
Public Debt 2 | | | 11,815.2 | | | | 11,199.1 | | | | 660.8 | | | | 11,859.9 | | | | 44.7 | |
| | | | | | | | | | | | | | | | | | | | | |
| Guaranteed Debt | | | 25.8 | | | | 235.0 | | | | (213.7 | ) | | | 21.3 | | | | (4.5 | ) |
1 Debt obtained by the General Revenue Fund (GRF) for its own use or on behalf of Crown corporations. The amount is net of sinking funds. Debt repayable in foreign currency is restated in equivalent Canadian dollars. |
2 The Province's Summary Financial Statements account for government business enterprises (GBEs) such as SaskPower Corporation on an equity basis. Therefore GBE specific debt is netted against other liabilities and assets and |
| the resultant equity is shown as Investment in GBEs. |
20 2014-15 Mid-Year Report | Budget Update
The Honourable Ken Krawetz Deputy Premier Minister of Finance |
|
SASKATCHEWAN BUDGET UPDATE 14-15 |

