UNITED STATES
SECURITIES AND EXCHANGE COMMISSION
WASHINGTON, D. C. 20549
FORM N-CSR
Investment Company Act file number: 811-02671
Deutsche DWS Municipal Trust
(Exact Name of Registrant as Specified in Charter)
345 Park Avenue
New York, NY 10154-0004
(Address of Principal Executive Offices) (Zip Code)
Registrant’s Telephone Number, including Area Code:(212) 250-2500
Diane Kenneally
One International Place
Boston, MA 02110
(Name and Address of Agent for Service)
| Date of fiscal year end: | 5/31 |
| | |
| Date of reporting period: | 5/31/2019 |
| ITEM 1. | REPORT TO STOCKHOLDERS |

May 31, 2019
Annual Report
to Shareholders
DWS Managed Municipal Bond Fund
Beginning on January 1, 2021, as permitted by regulations adopted by the Securities and Exchange Commission, paper copies of the Fund’s annual and semiannual shareholder reports will no longer be sent by mail, unless you specifically request paper copies of the reports. Instead, the reports will be made available on the Fund’s Web site (dws.com), and you will be notified by mail each time a report is posted and provided with a Web site link to access the report.
If you already elected to receive shareholder reports electronically, you will not be affected by this change and you need not take any action. You may elect to receive shareholder reports and other communications from the Fund electronically anytime by contacting your financial intermediary (such as a broker-dealer or bank), or if you are a direct investor, by calling (800) 728-3337 or sending an email request to service@dws.com.
You may elect to receive all future reports in paper free of charge. If you invest through a financial intermediary, you can contact your financial intermediary to request that you continue to receive paper copies of your shareholder reports. If you invest directly with the Fund, you can call (800) 728-3337 or send an email request to service@dws.com to continue receiving paper copies of your shareholder reports. Your election to receive reports in paper will apply to all funds held in your account if you invest through your financial intermediary or all funds held with DWS if you invest directly with the Fund.

Contents
This report must be preceded or accompanied by a prospectus. To obtain a summary prospectus, if available, or prospectus for any of our funds, refer to the Account Management Resources information provided in the back of this booklet. We advise you to consider the Fund’s objectives, risks, charges and expenses carefully before investing. The summary prospectus and prospectus contain this and other important information about the Fund. Please read the prospectus carefully before you invest.
Bond investments are subject tointerest-rate, credit, liquidity and market risks to varying degrees. When interest rates rise, bond prices generally fall. Credit risk refers to the ability of an issuer to make timely payments of principal and interest. Investments inlower-quality (“junk bonds”) andnon-rated securities present greater risk of loss than investments inhigher-quality securities. The Fund invests in inverse floaters, which are derivatives that involve leverage and could magnify the Fund’s gains or losses. Although the Fund seeks income that is exempt from federal income taxes, a portion of the Fund’s distributions may be subject to federal, state and local taxes, including the alternative minimum tax. Please read the prospectus for details.
The brand DWS represents DWS Group GmbH & Co. KGaA and any of its subsidiaries such as DWS Distributors, Inc. which offers investment products or DWS Investment Management Americas, Inc. and RREEF America L.L.C. which offer advisory services.
NOT FDIC/NCUA INSURED NO BANK GUARANTEE MAY LOSE VALUE NOT A DEPOSIT NOT INSURED BY ANY FEDERAL GOVERNMENT AGENCY
| | | | | | |
| 2 | | | | | DWS Managed Municipal Bond Fund | | |
Letter to Shareholders
Dear Shareholder:
Despite shifting political sands — most notably the trade negotiations between China and the United States (the “U.S.”) — the economy continues to be resilient. A robust labor market, strong home sales, consumer confidence and other key metrics indicate that the underpinnings of the economy remain intact.
Looking ahead, while our Americas Chief Investment Officer (“CIO”) believes the U.S.-China trade conflict mayde-escalate over the coming months, he notes that it is most likely to weigh on manufacturing activity. Since certain aspects of the conflict, such as intellectual property protection and other China reforms, will not happen quickly, the conflict could prolong into the second half of the year. In any event, uncertainty may well lead to continued market volatility. Against this backdrop, we see little near-term impetus for a resurgence in growth in the emerging markets beyond the stimulus efforts that are already underway in China.
Of course, these issues and their potential implications around the world bear close watching. Our CIO Office and global network of analysts diligently monitor these matters to determine when and what, if any, strategic or tactical adjustments are warranted. We invite you to access these views often to understand the changing landscape and, most important, what it may mean for you.
While our diverse expertise in Active, Passive and Alternatives asset management — as well as our deep environmental, social and governance focus — complement each other when creating targeted investment strategies for our clients, theon-the-ground-knowledge of our economists, research analysts and investment professionals are brought together in one consistent global CIO View, which guides our strategic investment approach. We are local while being one global team with approximately 3,600 employees in offices all over the world. As always, we urge you to visit the “Insights” section of our Web site, dws.com, to review our most current market and economic perspectives.
Best regards,
| | |
 | | 
Hepsen Uzcan President, DWS Funds |
Assumptions, estimates and opinions contained in this document constitute our judgment as of the date of the document and are subject to change without notice. Any projections are based on a number of assumptions as to market conditions and there can be no guarantee that any projected results will be achieved. Past performance is not a guarantee of future results. There is no assurance provided that any investment objective will be achieved.
| | | | | | | | |
| | DWS Managed Municipal Bond Fund | | | | | | 3 | |
| | |
| Portfolio Management Review | | (Unaudited) |
Overview of Market and Fund Performance
All performance information below is historical and does not guarantee future results. Returns shown are for Class A shares, unadjusted for sales charges. Investment return and principal fluctuate, so your shares may be worth more or less when redeemed. Current performance may differ from performance data shown. Please visit dws.com for the most recent month-end performance of all share classes. Fund performance includes reinvestment of all distributions. Unadjusted returns do not reflect sales charges and would have been lower if they had. Please refer to pages 9 through 11 for more complete performance information.
Investment Strategy
The Fund invests in a wide variety of municipal bonds. These include general obligation bonds, for which payments of principal and interest are secured by the full faith and credit of the issuer and usually supported by the issuer’s taxing power. In addition, securities held may include revenue bonds, for which principal and interest are secured by revenues from tolls, rents or other fees gained from the facility that was built with the bond issue proceeds.
The Fund’s management team seeks to hold municipal bonds that appear to offer the best opportunity to meet the Fund’s objective of providing income exempt from regular federal income tax. In selecting securities, the managers typically weigh a number of factors against each other, from economic outlooks and possible interest rate movements to characteristics of specific securities, such as coupon, maturity date and call date, and changes in supply and demand within the municipal market. Although portfolio management may adjust the Fund’s duration (a measure of sensitivity to interest rates) over a wider range, they generally intend to keep it similar to that of the Bloomberg Barclays Municipal Bond Index, generally between five and nine years.
DWS Managed Municipal Bond Fund posted a return of 5.85% over the 12 months ended May 31, 2019, while the overall municipal bond market, as measured by the unmanaged Bloomberg Barclays Municipal Bond Index, delivered a total return of 6.40% for the same period. The average fund in the Morningstar Muni National Long category returned 6.16% for the 12 months.
Performance for the broader fixed income markets was supported over the period by a decline in U.S. Treasury yields which boosted bond prices. The move lower in Treasury yields was driven in large part by a flight to quality on the part of global investors at various points during the 12 months, most notably in late 2018.
| | | | | | |
| 4 | | | | | DWS Managed Municipal Bond Fund | | |
From a demand perspective, municipal bond prices came under pressure in the fourth quarter of 2018 astax-free mutual funds experienced substantial outflows from investors seeking to get ahead of anticipated interest rate increases by the U.S. Federal Reserve. Market sentiment recovered entering 2019 as the Fed pivoted to a more dovish stance, signaling that short-term rate hikes were being put on hold and announcing an early end to its balance sheet reduction program involving longer-term government-backed securities. Municipal bond performance was additionally supported by inflows into municipal bond funds. According to Lipper FMI, mutual funds have received over $37 billion in flows year to date through May, the highest level of flows for this period since the data series began in 1992.
“Market sentiment recovered entering 2019 as the Fed pivoted to a more dovish stance.”
Yields declined along the length of the municipal curve over the 12 months ended May 31, 2019. Specifically, thetwo-year bond yield fell from 1.75% to 1.39%, the five-year from 1.99% to 1.42%, the10-year from 2.41% to 1.65%, the20-year from 2.77% to 2.14%, and the30-year from 2.87% to 2.32%. (See the graph below for municipal bond yield changes from the beginning to the end of the period.) For the 12 months, municipal market credit spreads — the incremental yield offered by lower-quality issues vs.AAA-rated issues — generally tightened.
|
| Municipal Bond Yield Curve (as of 5/31/19 and 5/31/18) |
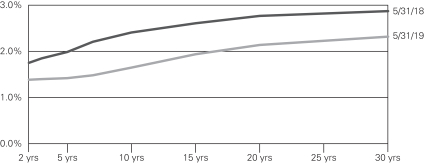
Source: Municipal Market Data, AAA-rated universe, as of 5/31/19.
Chart is for illustrative purposes only and does not represent any DWS product.
| | | | | | | | |
| | DWS Managed Municipal Bond Fund | | | | | | 5 | |
Positive and Negative Contributors to Fund Performance
The Fund’s positioning along the yield curve was a positive contributor to performance relative to the benchmark over the 12 months. Specifically, the Fund was underweight the5- to7-year segment of the yield curve and overweight issues in the10- to30-year maturity range, aiding performance as longer maturities benefited the most from falling rates.
The Fund’s overall positioning with respect to credit quality was a positive contributor to performance vs. the benchmark. During the period we were overweight issues in the single-A and BBB quality ranges, adding to performance as spreads tightened.
In terms of sectors, the Fund’s performance was aided by an overweighting of revenue bonds vs. general obligations, in particular airport and hospital bonds. Overweight exposure to State of Illinois credits added to relative performance as tax receipts surprised to the upside and a proposed graduated income tax improved the funding outlook for the state’s pension system.
Anout-of-benchmark position in issues backed by the Tobacco Master Settlement Agreement weighed on performance as sentiment with respect to the segment suffered from the prospect of tightened industry regulation.
Outlook and Positioning
At the end of the period, municipal yields were at fairly low levels by historical standards, both in absolute terms and relative to U.S. Treasury yields. As of the end of May 2019, thetwo-year municipal bond yield of 1.39% was 72.4% of thecomparable-maturity U.S. Treasury bond yield before taking into account the tax advantage of municipals. The10-year municipal bond yield of 1.65% was 77.8% of thecomparable-maturity U.S. Treasury bond yield, while the30-year municipal yield of 2.32% was 90.3% of the comparable U.S. Treasury yield.
We continue to view the municipal curve between 10 and 30 years as reasonably steep and are comfortable with maintaining our overweight compared to the benchmark to longer maturities in the 25–30 year range.
We view credit spreads as approaching full value and are being selective in adding exposure to lower quality paper in order to add income and return opportunities. We continue to perform careful analysis of each security’s risk/reward profile, while also maintaining a focus on liquidity. We continue to closely examine bond covenants on newer issues, as protections generally have become less favorable in an environment where many municipal issues have been oversubscribed.
| | | | | | |
| 6 | | | | | DWS Managed Municipal Bond Fund | | |
Portfolio Management Team
Ashton P. Goodfield, CFA, Managing Director
Portfolio Manager of the Fund. Began managing the Fund in 1998.
| – | Co-Head of Municipal Bonds. |
Matthew J. Caggiano, CFA, Managing Director
Portfolio Manager of the Fund. Began managing the Fund in 1999.
| – | BS, Pennsylvania State University; MS, Boston College. |
Chad Farrington, CFA, Managing Director
Portfolio Manager of the Fund. Began managing the Fund in 2018 (added to the team as of December 10, 2018).
| – | Joined DWS in 2018 with 20 years of industry experience; previously, worked as Portfolio Manager, Head of Municipal Research, and Senior Credit Analyst at Columbia Threadneedle. |
| – | BS, Montana State University. |
Michael J. Generazo, Director
Portfolio Manager of the Fund. Began managing the Fund in 2010.
| – | BS, Bryant College; MBA, Suffolk University. |
The views expressed reflect those of the portfolio management team only through the end of the period of the report as stated on the cover. The management team’s views are subject to change at any time based on market and other conditions and should not be construed as a recommendation. Past performance is no guarantee of future results. Current and future portfolio holdings are subject to risk.
| | | | | | | | |
| | DWS Managed Municipal Bond Fund | | | | | | 7 | |
Terms to Know
TheBloomberg Barclays Municipal Bond Indexis an unmanaged, market-value-weighted measure of municipal bonds issued across the United States. Index issues have a credit rating of at least Baa and a maturity of at least two years. Index returns do not reflect fees or expenses and it is not possible to invest directly into an index.
TheMorningstar Muni National Longcategory consists of funds that invest in municipal bonds issued by various state and local governments to fund public projects and are free from federal taxes. These funds spread their assets across many states and sectors and focus on bond durations of seven years or more.
Theyield curveis a graph with aleft-to-right line that shows how high or low yields are, from the shortest to the longest maturities. Typically (and when the yield curve is characterized as “steep,” this is especially true), the line rises from left to right as investors who are willing to tie up their money for a longer period are rewarded with higher yields.
Duration, which is expressed in years, measures the sensitivity of the price of a bond or bond fund to a change in interest rates.
Credit qualitymeasures a bond issuer’s ability to repay interest and principal in a timely manner. Rating agencies assign letter designations, such as AAA, AA and so forth. The lower the rating the higher the probability of default. Credit quality does not remove market risk and is subject to change.
Credit spreadis the additional yield provided by municipal bonds rated AA and below vs. municipals rated AAA with comparable effective maturity.
Overweightmeans the Fund holds a higher weighting in a given sector or security than the benchmark.Underweightmeans the Fund holds a lower weighting.
| | | | | | |
| 8 | | | | | DWS Managed Municipal Bond Fund | | |
| | |
| Performance Summary | | May 31, 2019 (Unaudited) |
| | | | | | | | | | | | |
| Class A | | 1-Year | | | 5-Year | | | 10-Year | |
|
| Average Annual Total Returnsas of 5/31/19 | |
| Unadjusted for Sales Charge | | | 5.85% | | | | 3.30% | | | | 4.63% | |
Adjusted for the Maximum Sales Charge
(max 2.75% load) | | | 2.94% | | | | 2.72% | | | | 4.34% | |
| Bloomberg Barclays Municipal Bond Index† | | | 6.40% | | | | 3.58% | | | | 4.58% | |
| | | |
| Class C | | 1-Year | | | 5-Year | | | 10-Year | |
|
| Average Annual Total Returnsas of 5/31/19 | |
| Unadjusted for Sales Charge | | | 5.02% | | | | 2.49% | | | | 3.82% | |
Adjusted for the Maximum Sales Charge
(max 1.00% CDSC) | | | 5.02% | | | | 2.49% | | | | 3.82% | |
| Bloomberg Barclays Municipal Bond Index† | | | 6.40% | | | | 3.58% | | | | 4.58% | |
| | | |
| Class S | | 1-Year | | | 5-Year | | | 10-Year | |
|
| Average Annual Total Returnsas of 5/31/19 | |
| No Sales Charges | | | 6.07% | | | | 3.53% | | | | 4.84% | |
| Bloomberg Barclays Municipal Bond Index† | | | 6.40% | | | | 3.58% | | | | 4.58% | |
| | | |
| Institutional Class | | 1-Year | | | 5-Year | | | 10-Year | |
|
| Average Annual Total Returnsas of 5/31/19 | |
| No Sales Charges | | | 6.09% | | | | 3.55% | | | | 4.89% | |
| Bloomberg Barclays Municipal Bond Index† | | | 6.40% | | | | 3.58% | | | | 4.58% | |
Performance in the Average Annual Total Returns table(s) above and the Growth of an Assumed $10,000 Investment line graph that follows is historical and does not guarantee future results. Investment return and principal fluctuate, so your shares may be worth more or less when redeemed. Current performance may differ from performance data shown. Please visit dws.com for the Fund’s most recentmonth-end performance. Fund performance includes reinvestment of all distributions. Unadjusted returns do not reflect sales charges and would have been lower if they had.
The gross expense ratios of the Fund, as stated in the fee table of the prospectus dated October 1, 2018 are 0.77%, 1.56%, 0.62% and 0.56% for Class A, Class C, Class S and Institutional Class shares, respectively, and may differ from the expense ratios disclosed in the Financial Highlights tables in this report.
Index returns do not reflect any fees or expenses and it is not possible to invest directly into an index.
Performance figures do not reflect the deduction of taxes that a shareholder would pay on Fund distributions or the redemption of Fund shares.
A portion of the Fund’s distributions may be subject to federal, state and local taxes and the alternative minimum tax.
| | | | | | | | |
| | DWS Managed Municipal Bond Fund | | | | | | 9 | |
Generally accepted accounting principles require adjustments to be made to the net assets of the Fund at period end for financial reporting purposes only, and as such, the total return based on the unadjusted net asset value per share may differ from the total return reported in the financial highlights.
|
Growth of an Assumed $10,000 Investment
(Adjusted for Maximum Sales Charge) |
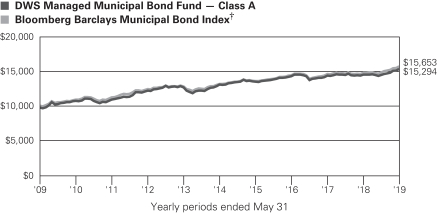
The Fund’s growth of an assumed $10,000 investment is adjusted for the maximum sales charge of 2.75%. This results in a net initial investment of $9,725.
The growth of $10,000 is cumulative.
Performance of other share classes will vary based on the sales charges and the fee structure of those classes.
| † | The Bloomberg Barclays Municipal Bond Index is an unmanaged,market-value-weighted measure of municipal bonds issued across the United States. Index issues have a credit rating of at least Baa and a maturity of at least two years. |
| | | | | | |
| 10 | | | | | DWS Managed Municipal Bond Fund | | |
| | | | | | | | | | | | | | | | |
| | | Class A | | | Class C | | | Class S | | | Institutional
Class | |
| | |
| Net Asset Value | | | | | | | | | |
| 5/31/19 | | $ | 9.21 | | | $ | 9.21 | | | $ | 9.23 | | | $ | 9.22 | |
| 5/31/18 | | $ | 8.98 | | | $ | 8.98 | | | $ | 9.00 | | | $ | 8.99 | |
| | |
| Distribution Informationas of 5/31/19 | | | | | | | | | |
| Income Dividends, Twelve Months | | $ | .28 | | | $ | .21 | | | $ | .30 | | | $ | .30 | |
| May Income Dividend | | $ | .0241 | | | $ | .0177 | | | $ | .0255 | | | $ | .0252 | |
| Capital Gain Distribution, Twelve Months | | $ | .001 | | | $ | .001 | | | $ | .001 | | | $ | .001 | |
| SEC30-day Yield‡‡ | | | 1.79% | | | | 1.04% | | | | 2.02% | | | | 1.98% | |
| Tax Equivalent Yield‡‡ | | | 3.02% | | | | 1.76% | | | | 3.41% | | | | 3.34% | |
| Current Annualized Distribution Rate‡‡ | | | 3.08% | | | | 2.26% | | | | 3.25% | | | | 3.22% | |
| ‡‡ | The SEC yield is net investment income per share earned over the month ended May 31, 2019, shown as an annualized percentage of the maximum offering price per share on the last day of the period. The SEC yield is computed in accordance with a standardized method prescribed by the Securities and Exchange Commission. Tax equivalent yield is based on the Fund’s yield and a marginal federal income tax rate of 40.8%. Current annualized distribution rate is the latest monthly dividend shown as a percentage of net asset value on May 31, 2019. Distribution rate simply measures the level of dividends and is not a complete measure of performance. |
| | | | | | | | |
| | DWS Managed Municipal Bond Fund | | | | | | 11 | |
| | | | | | | | |
| Portfolio Summary | | | (Unaudited) | |
| | |
| Asset Allocation (As a % of Investment Portfolio) | | 5/31/19 | | | 5/31/18 | |
| Revenue Bonds | | | 74% | | | | 71% | |
| General Obligation Bonds | | | 13% | | | | 17% | |
Lease Obligations | | | 8% | | | | 8% | |
Escrow to Maturity/Prerefunded Bonds | | | 5% | | | | 4% | |
| | | | 100% | | | | 100% | |
| | |
| Interest Rate Sensitivity | | 5/31/19 | | | 5/31/18 | |
| Effective Maturity | | | 6.0 years | | | | 6.1 years | |
| Modified Duration | | | 4.9 years | | | | 5.1 years | |
Effective maturity is the weighted average of the maturity date of bonds held by the Fund taking into consideration any available maturity shortening features.
Modified duration is an approximate measure of a fund’s sensitivity to movements in interest rates based on the current interest rate environment.
| | | | | | | | |
| Quality (As a % of Investment Portfolio) | | 5/31/19 | | | 5/31/18 | |
| AAA | | | 5% | | | | 11% | |
| AA | | | 39% | | | | 43% | |
| A | | | 37% | | | | 36% | |
| BBB | | | 13% | | | | 7% | |
| BB | | | 2% | | | | 1% | |
| Not Rated | | | 4% | | | | 2% | |
| | | | 100% | | | | 100% | |
The quality ratings represent the higher of Moody’s Investors Service, Inc. (“Moody’s”), Fitch Ratings, Inc. (“Fitch”) or Standard & Poor’s Corporation (“S&P”) credit ratings. The ratings of Moody’s, Fitch and S&P represent their opinions as to the quality of the securities they rate. Credit quality measures a bond issuer’s ability to repay interest and principal in a timely manner. Ratings are relative and subjective and are not absolute standards of quality. Credit quality does not remove market risk and is subject to change.
| | | | | | | | |
| Top Five State Allocations (As a % of Investment Portfolio) | | 5/31/19 | | | 5/31/18 | |
| California | | | 15% | | | | 11% | |
| Texas | | | 12% | | | | 13% | |
| New York | | | 12% | | | | 15% | |
| Illinois | | | 8% | | | | 6% | |
| Colorado | | | 7% | | | | 5% | |
Portfolio holdings and characteristics are subject to change.
For more complete details about the Fund’s investment portfolio, see page 13. A quarterly Fact Sheet is available on dws.com or upon request. Please see the Account Management Resources section on page 68 for contact information.
| | | | | | |
| 12 | | | | | DWS Managed Municipal Bond Fund | | |
| | |
| Investment Portfolio | | as of May 31, 2019 |
| | | | | | | | |
| | | Principal
Amount ($) | | | Value ($) | |
| Municipal Bonds and Notes 98.8% | | | | | | | | |
| Alaska 0.3% | | | | | | | | |
Alaska, State Industrial Development & Export Authority Revenue, Providence Health Services, Series A, 5.5%, 10/1/2041 | | | 11,000,000 | | | | 11,812,130 | |
| | |
| Arizona 0.9% | | | | | | | | |
| | |
Arizona, Salt Verde Financial Corp., Gas Revenue: | | | | | | | | |
| | |
5.0%, 12/1/2032 | | | 1,600,000 | | | | 2,020,960 | |
| | |
5.0%, 12/1/2037 | | | 8,405,000 | | | | 10,887,837 | |
| | |
Arizona, State Industrial Development Authority, 2nd Tier Great Lakes Senior Living Revenue Communities Project, Series B, 5.0%, 1/1/2049 | | | 1,400,000 | | | | 1,519,658 | |
| | |
Series B, 5.125%, 1/1/2054 | | | 1,250,000 | | | | 1,365,063 | |
| | |
Arizona, State Industrial Development Authority, Great Lakes Senior Living Revenue Communities: | | | | | | | | |
| | |
Series A, 4.5%, 1/1/2049 | | | 3,750,000 | | | | 3,954,262 | |
| | |
Series A, 5.0%, 1/1/2054 | | | 3,355,000 | | | | 3,693,654 | |
| | |
Phoenix, AZ, Civic Improvement Corp., Airport Revenue, Series A, Prerefunded, 5.0%, 7/1/2040 | | | 12,775,000 | | | | 13,259,683 | |
| | | | | | | | |
| | | | | | | 36,701,117 | |
| | |
| California 14.5% | | | | | | | | |
| | |
California, Golden State Tobacco Securitization Corp., Tobacco Settlement Revenue: | | | | | | | | |
| | |
Series A, 5.0%, 6/1/2040 | | | 11,765,000 | | | | 13,581,516 | |
| | |
SeriesA-1, 5.0%, 6/1/2047 | | | 5,900,000 | | | | 5,870,559 | |
| | |
SeriesA-2, 5.0%, 6/1/2047 | | | 18,070,000 | | | | 17,979,831 | |
| | |
SeriesA-1, 5.25%, 6/1/2047 | | | 3,700,000 | | | | 3,725,382 | |
| | |
California,M-S-R Energy Authority, Series B, 7.0%, 11/1/2034 | | | 15,315,000 | | | | 22,908,330 | |
| | |
California, Morongo Band of Mission Indians Revenue, Series B, 144A, 5.0%, 10/1/2042 | | | 2,395,000 | | | | 2,665,467 | |
| | |
California, State General Obligation: | | | | | | | | |
| | |
5.0%, 2/1/2032 | | | 35,000,000 | | | | 38,173,450 | |
| | |
5.0%, 2/1/2033 | | | 8,000,000 | | | | 8,721,040 | |
| | |
5.0%, 8/1/2035 | | | 13,210,000 | | | | 15,611,842 | |
| | |
5.0%, 2/1/2043 | | | 20,000,000 | | | | 22,219,600 | |
| | |
5.0%, 5/1/2044 | | | 11,200,000 | | | | 12,718,832 | |
| | |
5.25%, 4/1/2035 | | | 15,340,000 | | | | 16,880,750 | |
| | |
California, State General Obligation, Various Purposes: | | | | | | | | |
| | |
5.25%, 9/1/2026 | | | 18,765,000 | | | | 20,396,241 | |
| | |
5.25%, 9/1/2030 | | | 5,000,000 | | | | 5,417,250 | |
The accompanying notes are an integral part of the financial statements.
| | | | | | | | |
| | DWS Managed Municipal Bond Fund | | | | | | 13 | |
| | | | | | | | |
| | | Principal
Amount ($) | | | Value ($) | |
| | |
5.25%, 10/1/2032 | | | 25,000,000 | | | | 27,157,750 | |
| | |
California, State Health Facilities Financing Authority Revenue, Sutter Health Obligated Group, Series A, 5.0%, 8/15/2043 | | | 10,000,000 | | | | 11,443,500 | |
| | |
California, State Municipal Finance Authority Revenue, LINXS APM Project: | | | | | | | | |
| | |
Series A, AMT, 5.0%, 12/31/2043 | | | 6,000,000 | | | | 6,969,480 | |
| | |
Series A, AMT, 5.0%, 12/31/2047 | | | 3,200,000 | | | | 3,703,424 | |
| | |
Series A, AMT, 5.0%, 6/1/2048 | | | 1,200,000 | | | | 1,386,612 | |
| | |
California, State Pollution Control Financing Authority, Solid Waste Disposal Revenue, Rialto Bioenergy Facility LLC Project, Green Bonds Revenue, AMT, 144A, 7.5%, 12/1/2040 | | | 7,000,000 | | | | 7,137,690 | |
| | |
California, State Public Works Board, Lease Revenue, Series A, 5.0%, 9/1/2039 | | | 25,000,000 | | | | 28,421,250 | |
| | |
California, State University Revenue, Series A, 5.0%, 11/1/2038 | | | 7,410,000 | | | | 8,695,783 | |
| | |
California, Statewide Communities Development Authority Revenue, Kaiser Permanente, Kaiser Foundation, Series A, 5.0%, 4/1/2042 | | | 5,295,000 | | | | 5,781,187 | |
| | |
California, Statewide Communities Development Authority Revenue, Loma Linda University Medical Center: | | | | | | | | |
| | |
Series A, 144A, 5.0%, 12/1/2041 | | | 7,000,000 | | | | 7,759,500 | |
| | |
Series A, 144A, 5.0%, 12/1/2046 | | | 3,500,000 | | | | 3,862,355 | |
| | |
Series A, 144A, 5.5%, 12/1/2058 | | | 2,705,000 | | | | 3,131,822 | |
| | |
Los Angeles, CA, Department of Airports Revenue: | | | | | | | | |
| | |
Series B, AMT, 5.0%, 5/15/2029 | | | 8,625,000 | | | | 10,877,505 | |
| | |
Series C, AMT, 5.0%, 5/15/2029 | | | 7,050,000 | | | | 8,771,046 | |
| | |
Series B, AMT, 5.0%, 5/15/2030 | | | 5,715,000 | | | | 7,143,864 | |
| | |
Series C, AMT, 5.0%, 5/15/2030 | | | 3,910,000 | | | | 4,826,973 | |
| | |
Series B, AMT, 5.0%, 5/15/2031 | | | 8,350,000 | | | | 10,350,493 | |
| | |
Series C, AMT, 5.0%, 5/15/2031 | | | 3,910,000 | | | | 4,795,419 | |
| | |
Series C, AMT, 5.0%, 5/15/2044 | | | 4,000,000 | | | | 4,744,000 | |
| | |
Los Angeles, CA, Department of Airports Revenue, Los Angeles International Airport, Series D, AMT, 5.0%, 5/15/2048 | | | 15,000,000 | | | | 18,076,050 | |
| | |
Los Angeles, CA, Municipal Improvement Corp., Lease Revenue, Real Property, Series B, 5.0%, 11/1/2031 | | | 7,000,000 | | | | 8,499,330 | |
| | |
Orange County, CA, Airport Revenue: | | | | | | | | |
| | |
Series A, 5.25%, 7/1/2039 | | | 16,000,000 | | | | 16,047,680 | |
| | |
Series B, 5.25%, 7/1/2039 | | | 12,000,000 | | | | 12,035,760 | |
| | |
Sacramento County, CA, Airport Systems Revenue: | | | | | | | | |
| | |
Series C, AMT, 5.0%, 7/1/2029 | | | 9,455,000 | | | | 11,874,913 | |
| | |
Series C, AMT, 5.0%, 7/1/2030 | | | 13,690,000 | | | | 17,040,491 | |
The accompanying notes are an integral part of the financial statements.
| | | | | | |
| 14 | | | | | DWS Managed Municipal Bond Fund | | |
| | | | | | | | |
| | | Principal
Amount ($) | | | Value ($) | |
| | |
Series C, AMT, 5.0%, 7/1/2031 | | | 3,500,000 | | | | 4,317,635 | |
| | |
Series C, AMT, 5.0%, 7/1/2032 | | | 3,000,000 | | | | 3,685,110 | |
| | |
San Diego County, CA, Regional Airport Authority Revenue, Series B, AMT, 5.0%, 7/1/2043 | | | 12,500,000 | | | | 13,826,000 | |
| | |
San Francisco, CA, City & County Airports Commission, International Airport Revenue: | | | | | | | | |
| | |
Series F, 5.0%, 5/1/2035 | | | 27,500,000 | | | | 28,314,000 | |
| | |
Series A, AMT, 5.0%, 5/1/2040 | | | 14,000,000 | | | | 15,759,520 | |
| | |
Series D, AMT, 5.0%, 5/1/2043 | | | 28,800,000 | | | | 34,314,048 | |
| | |
Series D, AMT, 5.0%, 5/1/2048 | | | 8,000,000 | | | | 9,468,000 | |
| | |
University of California, State Revenues, Limited Project: | | | | | | | | |
| | |
Series O, 4.0%, 5/15/2029 | | | 4,165,000 | | | | 4,948,145 | |
| | |
Series O, 4.0%, 5/15/2030 | | | 5,000,000 | | | | 5,868,150 | |
| | |
Series O, 4.0%, 5/15/2031 | | | 3,335,000 | | | | 3,880,473 | |
| | |
Walnut, CA, Energy Center Authority Revenue, Series A, 5.0%, 1/1/2040 | | | 10,000,000 | | | | 10,189,700 | |
| | | | | | | | |
| | | | | | | 591,974,748 | |
| | |
| Colorado 6.5% | | | | | | | | |
| | |
Colorado, Certificates of Participation, Series A, 4.0%, 12/15/2035 | | | 5,000,000 | | | | 5,571,200 | |
| | |
Colorado, Public Energy Authority, Natural Gas Purchase Revenue, 6.5%, 11/15/2038 | | | 30,000,000 | | | | 45,711,900 | |
| | |
Colorado, State Health Facilities Authority Revenue, School Health Systems, Series A, 5.5%, 1/1/2035 | | | 16,250,000 | | | | 18,575,537 | |
| | |
Colorado, State Health Facilities Authority, Hospital Revenue, Covenant Retirement Communities Obligated Group: | | | | | | | | |
| | |
Series A, 5.0%, 12/1/2043 | | | 4,890,000 | | | | 5,572,057 | |
| | |
Series A, 5.0%, 12/1/2048 | | | 7,825,000 | | | | 8,879,419 | |
| | |
Colorado, Transportation/Tolls Revenue: | | | | | | | | |
| | |
Series B, Zero Coupon, 9/1/2019, INS: NATL | | | 36,500,000 | | | | 36,351,445 | |
| | |
Series B, Zero Coupon, 9/1/2020, INS: NATL | | | 7,000,000 | | | | 6,852,510 | |
| | |
Denver City & County, CO, Airport Revenue: | | | | | | | | |
| | |
Series A, AMT, 5.0%, 12/1/2029 | | | 8,950,000 | | | | 11,145,704 | |
| | |
Series A, AMT, 5.0%, 12/1/2032 | | | 24,335,000 | | | | 29,803,318 | |
| | |
Series A, AMT, 5.5%, 11/15/2028 | | | 15,000,000 | | | | 17,324,250 | |
| | |
Series A, AMT, 5.5%, 11/15/2029 | | | 14,705,000 | | | | 16,929,278 | |
| | |
Series A, AMT, 5.5%, 11/15/2030 | | | 15,080,000 | | | | 17,312,292 | |
| | |
Series A, AMT, 5.5%, 11/15/2031 | | | 5,000,000 | | | | 5,726,400 | |
| | |
Denver, CO, Convention Center Hotel Authority Revenue, 5.0%, 12/1/2040 | | | 2,770,000 | | | | 3,164,171 | |
| | |
Denver, CO, International Business Center Metropolitan District No.1, Series B, 6.0%, 12/1/2048 | | | 1,515,000 | | | | 1,530,120 | |
The accompanying notes are an integral part of the financial statements.
| | | | | | | | |
| | DWS Managed Municipal Bond Fund | | | | | | 15 | |
| | | | | | | | |
| | | Principal
Amount ($) | | | Value ($) | |
| | |
Denver, CO, Urban Renewal Authority, Tax Increment Revenue, 9th Urban Redevelopment Area, Series A, 144A, 5.25%, 12/1/2039 | | | 6,635,000 | | | | 7,017,640 | |
| | |
University of Colorado, Hospital Authority Revenue, Series A, 5.0%, 11/15/2042 | | | 26,010,000 | | | | 28,415,405 | |
| | | | | | | | |
| | | | | | | 265,882,646 | |
| | |
| Connecticut 2.1% | | | | | | | | |
| | |
Connecticut, Harbor Point Infrastructure Improvement District, Special Obligation Revenue, Harbor Point Project: | | | | | | | | |
| | |
144A, 5.0%, 4/1/2039 | | | 12,000,000 | | | | 13,367,280 | |
| | |
Series A, Prerefunded, 7.875%, 4/1/2039 | | | 6,000,000 | | | | 6,313,800 | |
| | |
Connecticut, State General Obligation: | | | | | | | | |
| | |
Series C, 5.0%, 6/15/2028 | | | 5,000,000 | | | | 6,214,700 | |
| | |
Series C, 5.0%, 6/15/2029 | | | 14,690,000 | | | | 18,136,421 | |
| | |
Connecticut, State Health & Educational Facilities Authority Revenue, Covenant Home, Inc., Series B, 5.0%, 12/1/2040 | | | 2,610,000 | | | | 2,967,022 | |
| | |
Connecticut, State Health & Educational Facilities Authority Revenue, Hartford Healthcare, Series A, 5.0%, 7/1/2041 | | | 20,000,000 | | | | 21,050,400 | |
| | |
Connecticut, State Health & Educational Facilities Authority Revenue, Stamford Hospital, Series J, 5.125%, 7/1/2035 | | | 18,000,000 | | | | 19,366,380 | |
| | | | | | | | |
| | | | | | | 87,416,003 | |
| | |
| Delaware 0.1% | | | | | | | | |
Delaware, State Health Facilities Authority Revenue, BEEBE Medical Center, Inc., 5.0%, 6/1/2050 | | | 5,250,000 | | | | 5,963,318 | |
| | |
| District of Columbia 1.6% | | | | | | | | |
| | |
District of Columbia, General Obligation: | | | | | | | | |
| | |
Series A, 5.0%, 6/1/2032 | | | 9,000,000 | | | | 10,581,030 | |
| | |
Series A, 5.0%, 6/1/2033 | | | 10,300,000 | | | | 12,208,467 | |
| | |
Metropolitan Washington, DC, Airports Authority System Revenue: | | | | | | | | |
| | |
Series A, AMT, 5.0%, 10/1/2030 | | | 7,750,000 | | | | 8,917,383 | |
| | |
Series A, AMT, 5.0%, 10/1/2031 | | | 5,355,000 | | | | 6,346,585 | |
| | |
Series A, AMT, 5.0%, 10/1/2032 | | | 5,000,000 | | | | 5,905,550 | |
| | |
Series A, AMT, 5.0%, 10/1/2044 | | | 3,890,000 | | | | 4,394,066 | |
| | |
Metropolitan Washington, DC, Airports Authority Systems Revenue, AMT, 5.0%, 10/1/2042 | | | 10,805,000 | | | | 12,641,958 | |
| | |
Washington, DC, Convention & Sports Authority, Dedicated Tax Revenue: | | | | | | | | |
| | |
Series A, 5.0%, 10/1/2029 | | | 1,455,000 | | | | 1,801,203 | |
| | |
Series A, 5.0%, 10/1/2030 | | | 1,455,000 | | | | 1,787,744 | |
| | | | | | | | |
| | | | | | | 64,583,986 | |
The accompanying notes are an integral part of the financial statements.
| | | | | | |
| 16 | | | | | DWS Managed Municipal Bond Fund | | |
| | | | | | | | |
| | | Principal
Amount ($) | | | Value ($) | |
| | |
| Florida 5.7% | | | | | | | | |
| | |
Broward County, FL, Airport Systems Revenue: | | | | | | | | |
| | |
SeriesQ-1, 5.0%, 10/1/2037 | | | 29,000,000 | | | | 31,650,600 | |
| | |
AMT, 5.0%, 10/1/2042 | | | 10,000,000 | | | | 11,740,800 | |
| | |
AMT, 5.0%, 10/1/2047 | | | 8,950,000 | | | | 10,459,865 | |
| | |
Florida, Capital Trust Agency, Senior Living Revenue, American Eagle Portfolio Project, SeriesA-1, 5.875%, 7/1/2054 | | | 15,935,000 | | | | 18,223,266 | |
| | |
Florida, Development Finance Corp., Surface Transportation Facilities Revenue, Virgin Trains USA Passenger Rail Project, Series A, 144A, AMT, 6.5%***, 1/1/2049 | | | 7,145,000 | | | | 7,191,871 | |
| | |
Florida, Halifax Hospital Medical Center, 5.0%, 6/1/2036 | | | 2,110,000 | | | | 2,373,581 | |
| | |
Florida, Jacksonville Electric Authority, Electric System Revenue: | | | | | | | | |
| | |
Series B, 4.0%, 10/1/2035 | | | 2,345,000 | | | | 2,593,359 | |
| | |
Series B, 4.0%, 10/1/2037 | | | 1,500,000 | | | | 1,648,560 | |
| | |
Florida, Jacksonville Water & Sewer System Revenue, Series A, 5.0%, 10/1/2029 | | | 5,000,000 | | | | 6,112,150 | |
| | |
Florida, Village Community Development District No. 12, Special Assessment Revenue: | | | | | | | | |
| | |
144A, 4.25%, 5/1/2043 | | | 9,095,000 | | | | 9,518,008 | |
| | |
144A, 4.375%, 5/1/2050 | | | 7,595,000 | | | | 7,969,054 | |
| | |
Hillsborough County, FL, Aviation Authority Revenue, Tampa International Airport, Series A, AMT, 5.0%, 10/1/2040 | | | 10,000,000 | | | | 11,269,100 | |
| | |
Hillsborough County, FL, Industrial Development Authority Revenue, University Community Hospital, ETM, 6.5%, 8/15/2019, INS: NATL | | | 225,000 | | | | 227,241 | |
| | |
Lee County, FL, Airport Revenue, Series A, AMT, 5.375%, 10/1/2032 | | | 1,750,000 | | | | 1,872,343 | |
| | |
Marco Island, FL, Utility Systems Revenue: | | | | | | | | |
| | |
Series A, Prerefunded, 5.0%, 10/1/2034 | | | 1,000,000 | | | | 1,047,350 | |
| | |
Series A, Prerefunded, 5.0%, 10/1/2040 | | | 1,000,000 | | | | 1,047,350 | |
| | |
Miami-Dade County, FL, Aviation Revenue: | | | | | | | | |
| | |
Series A, AMT, 5.0%, 10/1/2031 | | | 3,495,000 | | | | 3,815,596 | |
| | |
Series B, 5.0%, 10/1/2035, INS: AGMC | | | 15,000,000 | | | | 15,642,900 | |
| | |
Miami-Dade County, FL, Aviation Revenue, Miami International Airport: | | | | | | | | |
| | |
SeriesA-1, Prerefunded, 5.375%, 10/1/2035 | | | 1,000,000 | | | | 1,051,286 | |
| | |
SeriesA-1, Prerefunded, 5.375%, 10/1/2041 | | | 19,290,000 | | | | 20,284,785 | |
| | |
Miami-Dade County, FL, Expressway Authority, Toll Systems Revenue, Series A, 5.0%, 7/1/2044 | | | 7,500,000 | | | | 8,365,425 | |
| | |
Miami-Dade County, FL, Transit Sales Surtax Revenue, 5.0%, 7/1/2037 | | | 16,500,000 | | | | 18,084,660 | |
| | |
Orange County, FL, Health Facilities Authority Revenue, Orlando Regional Healthcare System, Series C, ETM, 6.25%, 10/1/2021, INS: NATL | | | 3,825,000 | | | | 4,062,188 | |
The accompanying notes are an integral part of the financial statements.
| | | | | | | | |
| | DWS Managed Municipal Bond Fund | | | | | | 17 | |
| | | | | | | | |
| | | Principal
Amount ($) | | | Value ($) | |
| | |
Orange County, FL, School Board, Certificates of Participation, Series C, 5.0%, 8/1/2033 | | | 16,610,000 | | | | 19,778,358 | |
| | |
Palm Beach County, FL, Health Facilities Authority Revenue, Lifespace Communities, Inc. Obligated Group, Series C, 5.0%, 5/15/2038 | | | 2,000,000 | | | | 2,181,420 | |
| | |
Tallahassee, FL, Health Facilities Revenue, Memorial Healthcare, Inc. Project, Series A, 5.0%, 12/1/2055 | | | 2,985,000 | | | | 3,311,649 | |
| | |
Tampa, FL, Sports Authority Revenue, SalesTax-Tampa Bay Arena Project, 5.75%, 10/1/2020, INS: NATL | | | 685,000 | | | | 708,619 | |
| | |
Tampa-Hillsborough County, FL, Expressway Authority, Series A, 5.0%, 7/1/2037 | | | 10,000,000 | | | | 10,903,900 | |
| | | | | | | | |
| | | | | | | 233,135,284 | |
| | |
| Georgia 4.0% | | | | | | | | |
| | |
Atlanta, GA, Airport Revenue, Series B, 5.0%, 1/1/2037 | | | 720,000 | | | | 773,834 | |
| | |
Atlanta, GA, Water & Wastewater Revenue: | | | | | | | | |
| | |
Series B, 5.25%, 11/1/2028 | | | 5,000,000 | | | | 5,775,250 | |
| | |
Series B, 5.375%, 11/1/2039, INS: AGMC | | | 13,915,000 | | | | 14,125,951 | |
| | |
Cobb County, GA, Kennestone Hospital Authority, Revenue Anticipation Certificates, Wellstar Health System, Series A, 5.0%, 4/1/2047 | | | 18,135,000 | | | | 20,888,981 | |
| | |
DeKalb County, GA, Water & Sewer Revenue: | | | | | | | | |
| | |
Series A, 5.25%, 10/1/2032 | | | 2,180,000 | | | | 2,353,419 | |
| | |
Series A, 5.25%, 10/1/2033 | | | 3,635,000 | | | | 3,923,292 | |
| | |
Series A, 5.25%, 10/1/2036 | | | 11,115,000 | | | | 11,980,636 | |
| | |
Series A, 5.25%, 10/1/2041 | | | 29,000,000 | | | | 31,196,750 | |
| | |
Fulton County, GA, Development Authority Hospital Revenue, Revenue Anticipation Certificates, Wellstar Health System, Series A, 5.0%, 4/1/2042 | | | 3,155,000 | | | | 3,647,054 | |
| | |
Gainesville & Hall County, GA, Hospital Authority, Northeast Georgia Healthcare: | | | | | | | | |
| | |
Series A, 5.375%, 2/15/2040 | | | 1,940,000 | | | | 1,990,809 | |
| | |
Series A, 5.5%, 2/15/2045 | | | 4,720,000 | | | | 4,838,330 | |
| | |
Georgia, Glynn-Brunswick Memorial Hospital Authority, Anticipation Certificates, Southeast Georgia Health System Project, 5.0%, 8/1/2047 | | | 2,035,000 | | | | 2,302,623 | |
| | |
Georgia, Main Street Natural Gas, Inc., Gas Project Revenue: | | | | | | | | |
| | |
Series A, 5.0%, 3/15/2020 | | | 2,700,000 | | | | 2,764,260 | |
| | |
Series B, 5.0%, 3/15/2020 | | | 5,000,000 | | | | 5,122,550 | |
| | |
Series A, 5.0%, 3/15/2022 | | | 17,340,000 | | | | 18,765,001 | |
| | |
Series A, 5.5%, 9/15/2023 | | | 5,000,000 | | | | 5,705,050 | |
| | |
Series A, 5.5%, 9/15/2024 | | | 4,635,000 | | | | 5,425,546 | |
| | |
Series A, 5.5%, 9/15/2027 | | | 5,000,000 | | | | 6,241,600 | |
| | |
Series A, 5.5%, 9/15/2028 | | | 5,000,000 | | | | 6,358,650 | |
| | |
Georgia, Municipal Electric Authority Revenue, Project One, Series A, 5.0%, 1/1/2035 | | | 2,995,000 | | | | 3,343,528 | |
The accompanying notes are an integral part of the financial statements.
| | | | | | |
| 18 | | | | | DWS Managed Municipal Bond Fund | | |
| | | | | | | | |
| | | Principal
Amount ($) | | | Value ($) | |
| | |
Georgia, State Municipal Electric Authority, Series GG, 5.0%, 1/1/2039 | | | 5,695,000 | | | | 6,181,410 | |
| | | | | | | | |
| | | | | | | 163,704,524 | |
| | |
| Hawaii 0.8% | | | | | | | | |
| | |
Hawaii, State Airports Systems Revenue: | | | | | | | | |
| | |
Series A, 5.0%, 7/1/2039 | | | 16,800,000 | | | | 17,316,600 | |
| | |
Series A, AMT, 5.0%, 7/1/2041 | | | 8,930,000 | | | | 10,130,103 | |
| | |
Hawaii, State Department of Budget & Finance, Special Purpose Revenue, Hawaiian Electric Co., Inc., 6.5%, 7/1/2039 | | | 6,000,000 | | | | 6,024,960 | |
| | | | | | | | |
| | | | | | | 33,471,663 | |
| | |
| Illinois 7.5% | | | | | | | | |
| | |
Chicago, IL, Board of Education: | | | | | | | | |
| | |
Series A, 5.0%, 12/1/2030 | | | 1,395,000 | | | | 1,579,475 | |
| | |
Series A, 5.0%, 12/1/2032 | | | 2,680,000 | | | | 3,008,461 | |
| | |
Series A, 5.0%, 12/1/2033 | | | 2,060,000 | | | | 2,303,966 | |
| | |
Series A, 5.0%, 12/1/2034 | | | 810,000 | | | | 902,737 | |
| | |
Series H, 5.0%, 12/1/2036 | | | 6,075,000 | | | | 6,690,215 | |
| | |
Series H, 5.0%, 12/1/2046 | | | 3,470,000 | | | | 3,767,726 | |
| | |
Chicago, IL, General Obligation: | | | | | | | | |
| | |
Series A, 5.0%, 1/1/2044 | | | 4,500,000 | | | | 4,914,810 | |
| | |
Series A, 5.5%, 1/1/2049 | | | 4,825,000 | | | | 5,482,213 | |
| | |
Chicago, IL, O’Hare International Airport Revenue, Series A, AMT, 5.0%, 1/1/2034 | | | 7,000,000 | | | | 7,899,080 | |
| | |
Chicago, IL, O’Hare International Airport Revenue, Senior Lien,
Series A, AMT, 5.0%, 1/1/2048 | | | 12,000,000 | | | | 14,043,600 | |
| | |
Series B, 5.0%, 1/1/2035 | | | 4,250,000 | | | | 4,945,088 | |
| | |
Chicago, IL, O’Hare International Airport, Airport Revenue, Third Lien, Series A, 5.75%, 1/1/2039 | | | 2,190,000 | | | | 2,325,276 | |
| | |
Chicago, IL, O’Hare International Airport, Special Facility Revenue, AMT, 5.0%, 7/1/2048 | | | 2,630,000 | | | | 3,017,162 | |
| | |
Chicago, IL, Waterworks Revenue, 5.0%, 11/1/2023, INS: AGMC | | | 2,990,000 | | | | 2,998,252 | |
| | |
Cook County, IL, Forest Preservation District, Series C, 5.0%, 12/15/2037 | | | 3,155,000 | | | | 3,333,415 | |
| | |
Illinois, Metropolitan Pier & Exposition Authority Revenue, McCormick Place Expansion Project: | | | | | | | | |
| | |
Series B, 5.0%, 6/15/2052 | | | 11,700,000 | | | | 12,214,566 | |
| | |
Series A, 5.0%, 6/15/2057 | | | 6,000,000 | | | | 6,524,880 | |
| | |
Illinois, Metropolitan Pier & Exposition Authority, Dedicated State Tax Revenue, Capital Appreciation-McCormick, Series A, Zero Coupon, 6/15/2038, INS: NATL | | | 17,305,000 | | | | 8,549,189 | |
The accompanying notes are an integral part of the financial statements.
| | | | | | | | |
| | DWS Managed Municipal Bond Fund | | | | | | 19 | |
| | | | | | | | |
| | | Principal
Amount ($) | | | Value ($) | |
| | |
Illinois, Railsplitter Tobacco Settlement Authority: | | | | | | | | |
| | |
5.0%, 6/1/2026 | | | 7,500,000 | | | | 8,967,075 | |
| | |
Prerefunded, 6.0%, 6/1/2028 | | | 17,315,000 | | | | 18,841,837 | |
| | |
Illinois, Regional Transportation Authority: | | | | | | | | |
| | |
Series B, 5.75%, 6/1/2033, INS: NATL | | | 7,000,000 | | | | 9,298,520 | |
| | |
Series A, 6.7%, 11/1/2021, INS: NATL | | | 9,565,000 | | | | 10,237,707 | |
| | |
Illinois, Sales & Special Tax Revenue, 6.25%, 12/15/2020, INS: AMBAC | | | 1,910,000 | | | | 1,964,702 | |
| | |
Illinois, State Development Finance Authority, Jewish Council Youth Services, 1.4%**, 6/7/2019, LOC: BMO Harris Bank NA | | | 1,220,000 | | | | 1,220,000 | |
| | |
Illinois, State Finance Authority Revenue, Ascension Health Credit Group, Series A, 5.0%, 11/15/2032 | | | 2,435,000 | | | | 2,624,711 | |
| | |
Illinois, State Finance Authority Revenue, Edward Elmhurst Obligated Group: | | | | | | | | |
| | |
Series A, 5.0%, 1/1/2036 | | | 2,970,000 | | | | 3,398,244 | |
| | |
Series A, 5.0%, 1/1/2037 | | | 3,965,000 | | | | 4,517,800 | |
| | |
Illinois, State Finance Authority Revenue, Friendship Village of Schaumburg, 5.125%, 2/15/2045 | | | 13,010,000 | | | | 11,699,243 | |
| | |
Illinois, State Finance Authority Revenue, OSF Healthcare Systems, Series A, 5.0%, 5/15/2041 | | | 13,155,000 | | | | 13,979,555 | |
| | |
Illinois, State Finance Authority Revenue, University of Chicago, Series A, 5.0%, 10/1/2038 | | | 12,000,000 | | | | 13,744,560 | |
| | |
Illinois, State General Obligation: | | | | | | | | |
| | |
Series B, 5.0%, 10/1/2030 | | | 4,230,000 | | | | 4,867,673 | |
| | |
Series B, 5.0%, 10/1/2031 | | | 6,500,000 | | | | 7,439,965 | |
| | |
Series B, 5.0%, 10/1/2032 | | | 5,000,000 | | | | 5,703,650 | |
| | |
5.0%, 2/1/2027 | | | 8,075,000 | | | | 9,254,596 | |
| | |
Series D, 5.0%, 11/1/2028 | | | 9,425,000 | | | | 10,846,479 | |
| | |
5.0%, 1/1/2035 | | | 4,200,000 | | | | 4,596,774 | |
| | |
Series A, 5.0%, 5/1/2035 | | | 11,000,000 | | | | 12,342,440 | |
| | |
Series A, 5.0%, 5/1/2036 | | | 14,355,000 | | | | 16,046,019 | |
| | |
Series A, 5.0%, 12/1/2038 | | | 4,760,000 | | | | 5,260,371 | |
| | |
Series A, 5.0%, 12/1/2039 | | | 10,240,000 | | | | 11,291,136 | |
| | |
Series A, 5.0%, 5/1/2040 | | | 3,000,000 | | | | 3,317,550 | |
| | |
Series A, 5.0%, 5/1/2043 | | | 7,000,000 | | | | 7,712,810 | |
| | |
Springfield, IL, Electric Revenue, Senior Lien, Senior Lien, 5.0%, 3/1/2040, INS: AGMC | | | 5,805,000 | | | | 6,499,104 | |
| | |
Springfield, IL, Water Revenue, 5.0%, 3/1/2037 | | | 5,000,000 | | | | 5,371,500 | |
| | | | | | | | |
| | | | | | | 305,544,132 | |
| | |
| Indiana 1.5% | | | | | | | | |
| | |
Indiana, State Finance Authority Revenue, BHI Senior Living Obligated Group: | | | | | | | | |
| | |
5.0%, 11/15/2043 | | | 1,725,000 | | | | 1,917,182 | |
| | |
5.0%, 11/15/2048 | | | 3,410,000 | | | | 3,769,891 | |
The accompanying notes are an integral part of the financial statements.
| | | | | | |
| 20 | | | | | DWS Managed Municipal Bond Fund | | |
| | | | | | | | |
| | | Principal
Amount ($) | | | Value ($) | |
| | |
5.0%, 11/15/2053 | | | 15,400,000 | | | | 16,984,198 | |
| | |
Indiana, State Finance Authority Revenue, Community Foundation of Northwest Indiana, 5.0%, 3/1/2041 | | | 17,395,000 | | | | 18,569,511 | |
| | |
Indiana, State Finance Authority Revenue, Stadium Project, Series A, 5.25%, 2/1/2031 | | | 2,595,000 | | | | 3,092,773 | |
| | |
Indiana, State Finance Authority, Exempt Facilities Revenue, Green Bond, RES Plyflow Indiana LLC, Project, 144A, AMT, 7.0%, 3/1/2039 | | | 2,665,000 | | | | 2,747,402 | |
| | |
Indiana, State Finance Authority, Health Facilities Revenue, Baptist Healthcare System, Series A, 5.0%, 8/15/2051 | | | 5,000,000 | | | | 5,624,450 | |
| | |
Indiana, State Finance Authority, Wastewater Utility Revenue, First Lien, Series A, 5.25%, 10/1/2038 | | | 8,000,000 | | | | 8,611,680 | |
| | | | | | | | |
| | | | | | | 61,317,087 | |
| | |
| Iowa 0.6% | | | | | | | | |
| | |
Iowa, State Finance Authority Revenue, Lifespace Communities, Inc. Obligated group: | | | | | | | | |
| | |
Series A, 5.0%, 5/15/2043 | | | 6,705,000 | | | | 7,382,406 | |
| | |
Series A, 5.0%, 5/15/2047 | | | 3,500,000 | | | | 3,808,910 | |
| | |
Series A, 5.0%, 5/15/2048 | | | 8,220,000 | | | | 9,019,806 | |
| | |
Iowa, State Higher Education Loan Authority, Private College Facility, Loras College, 1.93%**, 3/6/2019, LOC: Bank of America NA | | | 2,700,000 | | | | 2,700,000 | |
| | | | | | | | |
| | | | | | | 22,911,122 | |
| | |
| Kentucky 0.1% | | | | | | | | |
| | |
Kentucky, State Economic Development Finance Authority, Owensboro Health, Inc., Obligated Group: | | | | | | | | |
| | |
Series A, 5.0%, 6/1/2045 | | | 1,275,000 | | | | 1,407,460 | |
| | |
Series A, 5.25%, 6/1/2041 | | | 1,915,000 | | | | 2,166,439 | |
| | | | | | | | |
| | | | | | | 3,573,899 | |
| | |
| Louisiana 0.8% | | | | | | | | |
| | |
Louisiana, New Orleans Aviation Board, General Airport North Terminal, Series B, AMT, 5.0%, 1/1/2048 | | | 2,830,000 | | | | 3,213,890 | |
| | |
Louisiana, Public Facilities Authority, Hospital Revenue, Lafayette General Medical Center, 5.5%, 11/1/2040 | | | 5,000,000 | | | | 5,139,250 | |
| | |
Louisiana, State Local Government Environmental Facilities & Community Development Authority Revenue, Westlake Chemical Corp. Project, 3.5%, 11/1/2032 | | | 25,285,000 | | | | 26,194,754 | |
| | | | | | | | |
| | | | | | | 34,547,894 | |
| | |
| Maine 0.2% | | | | | | | | |
Maine, Health & Higher Educational Facilities Authority Revenue, Series A, 5.0%, 7/1/2040 | | | 9,650,000 | | | | 9,968,354 | |
The accompanying notes are an integral part of the financial statements.
| | | | | | | | |
| | DWS Managed Municipal Bond Fund | | | | | | 21 | |
| | | | | | | | |
| | | Principal
Amount ($) | | | Value ($) | |
| | |
| Maryland 1.0% | | | | | | | | |
| | |
Maryland, State Health & Higher Educational Facilities Authority Revenue, Adventist Healthcare, Series A, 5.5%, 1/1/2046 | | | 20,000,000 | | | | 23,180,600 | |
| | |
Maryland, State Health & Higher Educational Facilities Authority Revenue, Medstar Health Obligated Group: | | | | | | | | |
| | |
Series A, 5.0%, 5/15/2042 | | | 9,735,000 | | | | 11,318,203 | |
| | |
Series A, 5.0%, 5/15/2045 | | | 5,000,000 | | | | 5,802,700 | |
| | | | | | | | |
| | | | | | | 40,301,503 | |
| | |
| Massachusetts 0.9% | | | | | | | | |
| | |
Massachusetts, State Department of Transportation, Metropolitan Highway Systems Revenue, Series B, 5.0%, 1/1/2032 | | | 13,800,000 | | | | 14,061,648 | |
| | |
Massachusetts, State Development Finance Agency Revenue, Linden Ponds, Inc. Facility: | | | | | | | | |
| | |
Series B, 11/15/2056* | | | 314,524 | | | | 88,378 | |
| | |
144A, 5.0%, 11/15/2038 | | | 1,175,000 | | | | 1,282,583 | |
| | |
144A, 5.125%, 11/15/2046 | | | 1,175,000 | | | | 1,280,985 | |
| | |
Massachusetts, State Development Finance Agency Revenue, NewBridge Charles, Inc.: | | | | | | | | |
| | |
144A, 5.0%, 10/1/2047 | | | 700,000 | | | | 762,440 | |
| | |
144A, 5.0%, 10/1/2057 | | | 1,700,000 | | | | 1,845,962 | |
| | |
Massachusetts, State Development Finance Agency Revenue, Partners Healthcare System Issue, SeriesS-1, 5.0%, 7/1/2028 | | | 2,700,000 | | | | 3,399,813 | |
| | |
Massachusetts, State Development Finance Agency Revenue, Partners Healthcare System, Inc.: | | | | | | | | |
| | |
SeriesS-1, 5.0%, 7/1/2033 | | | 4,000,000 | | | | 4,888,400 | |
| | |
Series L, 5.0%, 7/1/2036 | | | 70,000 | | | | 74,379 | |
| | |
Massachusetts, State Development Finance Agency Revenue, South Shore Hospital, Series I, 5.0%, 7/1/2041 | | | 1,825,000 | | | | 2,069,222 | |
| | |
Massachusetts, State Development Finance Agency Revenue, Suffolk University, Series A, 5.75%, 7/1/2039 | | | 4,785,000 | | | | 4,800,264 | |
| | |
Massachusetts, State Development Finance Agency Revenue, UMass Memorial Healthcare, Series I, 5.0%, 7/1/2036 | | | 1,000,000 | | | | 1,146,540 | |
| | | | | | | | |
| | | | | | | 35,700,614 | |
| | |
| Michigan 0.6% | | | | | | | | |
| | |
Michigan, State Building Authority Revenue, Facilities Program, Series H, 5.125%, 10/15/2033 | | | 9,755,000 | | | | 9,874,011 | |
| | |
Michigan, State Strategic Fund Ltd., Obligation Revenue Improvement Project, Series I,AMT-75, 5.0%, 12/31/2043 | | | 4,800,000 | | | | 5,608,464 | |
| | |
Wayne County, MI, Airport Authority Revenue, Detroit Metropolitan Airport, Series A, 5.0%, 12/1/2037 | | | 9,255,000 | | | | 10,186,886 | |
| | | | | | | | |
| | | | | | | 25,669,361 | |
The accompanying notes are an integral part of the financial statements.
| | | | | | |
| 22 | | | | | DWS Managed Municipal Bond Fund | | |
| | | | | | | | |
| | | Principal
Amount ($) | | | Value ($) | |
| | |
| Minnesota 0.8% | | | | | | | | |
| | |
Bemidji, MN, Industrial Development Revenue, North Central Door Co., Project, AMT, 1.95%**, 6/1/2019, LOC: U.S. Bank NA | | | 1,955,000 | | | | 1,944,697 | |
| | |
Duluth, MN, Economic Development Authority, Health Care Facilities Revenue, Essentia Health Obligated Group: | | | | | | | | |
| | |
Series A, 5.0%, 2/15/2048 | | | 5,000,000 | | | | 5,781,950 | |
| | |
Series A, 5.0%, 2/15/2053 | | | 14,060,000 | | | | 16,132,444 | |
| | |
Minneapolis, MN, Health Care Systems Revenue, Fairview Health Services, Series A, 5.0%, 11/15/2049 | | | 4,075,000 | | | | 4,776,185 | |
| | |
Minnesota, State Trunk Highway, Series B, 4.0%, 8/1/2032 | | | 5,000,000 | | | | 5,786,650 | |
| | | | | | | | |
| | | | | | | 34,421,926 | |
| | |
| Mississippi 0.1% | | | | | | | | |
Mississippi, State Business Finance Corp., Solid Waste Disposal Revenue, Waste Pro U.S.A., Inc. Project, AMT, 144A, 5.0%, Mandatory Put 8/1/2022 @ 100, 2/1/2036 | | | 2,710,000 | | | | 2,874,578 | |
| | |
| Missouri 0.7% | | | | | | | | |
| | |
Missouri, State Health & Educational Facilities Authority Revenue, Lutheran Senior Services Projects, Series B, 5.0%, 2/1/2046 | | | 2,460,000 | | | | 2,682,458 | |
| | |
Missouri, State Health & Educational Facilities Authority Revenue, Medical Research, Lutheran Senior Services, Series A, 5.0%, 2/1/2046 | | | 3,285,000 | | | | 3,582,063 | |
| | |
St. Louis County, MO, Industrial Development Authority, Senior Living Facilities, Friendship Village: | | | | | | | | |
| | |
5.0%, 9/1/2048 | | | 3,255,000 | | | | 3,589,516 | |
| | |
Series A, 5.125%, 9/1/2048 | | | 7,500,000 | | | | 8,358,825 | |
| | |
Series A, 5.125%, 9/1/2049 | | | 7,975,000 | | | | 8,883,432 | |
| | | | | | | | |
| | | | | | | 27,096,294 | |
| | |
| Nebraska 0.3% | | | | | | | | |
| | |
Douglas County, NE, Hospital Authority No.2, Health Facilities, Children’s Hospital Obligated Group, 5.0%, 11/15/2047 | | | 5,205,000 | | | | 5,986,427 | |
| | |
Nebraska, Central Plains Energy Project, Gas Project Revenue, Series A, 5.0%, 9/1/2033 | | | 3,815,000 | | | | 4,785,574 | |
| | | | | | | | |
| | | | | | | 10,772,001 | |
| | |
| Nevada 0.0% | | | | | | | | |
Reno, NV, Sales Tax Revenue, Transportation Rail Access, Series C, 144A, Zero Coupon, 7/1/2058 | | | 15,500,000 | | | | 2,019,650 | |
| | |
| New Hampshire 0.3% | | | | | | | | |
New Hampshire, Health & Education Facilities Authority Revenue, Wentworth-Douglas Hospital, Series A, Prerefunded, 6.5%, 1/1/2031 | | | 10,000,000 | | | | 10,768,700 | |
The accompanying notes are an integral part of the financial statements.
| | | | | | | | |
| | DWS Managed Municipal Bond Fund | | | | | | 23 | |
| | | | | | | | |
| | | Principal
Amount ($) | | | Value ($) | |
| | |
| New Jersey 2.2% | | | | | | | | |
| | |
New Jersey, State Economic Development Authority Revenue: | | | | | | | | |
| | |
5.0%, 6/15/2028 | | | 1,050,000 | | | | 1,127,721 | |
| | |
Series DDD, 5.0%, 6/15/2042 | | | 2,775,000 | | | | 3,106,973 | |
| | |
Series BBB, 5.5%, 6/15/2030 | | | 22,440,000 | | | | 26,528,792 | |
| | |
New Jersey, State Economic Development Authority Revenue, Private Activity, The Goethals Bridge Replacement Project, AMT, 5.0%, 1/1/2031, INS: AGMC | | | 4,000,000 | | | | 4,468,240 | |
| | |
New Jersey, State Economic Development Authority, Motor Vehicle Surcharge Revenue, Series A, 5.0%, 7/1/2033 | | | 1,460,000 | | | | 1,671,408 | |
| | |
New Jersey, State Economic Development Authority, State Government Buildings Project: | | | | | | | | |
| | |
Series A, 5.0%, 6/15/2042 | | | 2,885,000 | | | | 3,248,770 | |
| | |
Series A, 5.0%, 6/15/2047 | | | 3,205,000 | | | | 3,595,529 | |
| | |
New Jersey, State Transportation Trust Fund Authority, Transportation Systems: | | | | | | | | |
| | |
Series A, 5.0%, 12/15/2033 | | | 3,570,000 | | | | 4,166,476 | |
| | |
Series A, 5.0%, 12/15/2034 | | | 5,710,000 | | | | 6,638,789 | |
| | |
Series A, 5.0%, 12/15/2036 | | | 2,385,000 | | | | 2,753,959 | |
| | |
Series A, 6.0%, 6/15/2035 | | | 6,000,000 | | | | 6,435,960 | |
| | |
New Jersey, Tobacco Settlement Financing Corp.: | | | | | | | | |
| | |
Series A, 5.0%, 6/1/2046 | | | 5,270,000 | | | | 5,901,188 | |
| | |
Series B, 5.0%, 6/1/2046 | | | 16,500,000 | | | | 17,645,760 | |
| | |
Series A, 5.25%, 6/1/2046 | | | 2,630,000 | | | | 3,004,223 | |
| | | | | | | | |
| | | | | | | 90,293,788 | |
| | |
| New Mexico 0.3% | | | | | | | | |
| | |
New Mexico, State Finance Authority Revenue, Public Project Revolving Fund: | | | | | | | | |
| | |
Series A, 4.0%, 6/1/2029 | | | 5,765,000 | | | | 6,752,718 | |
| | |
Series A, 4.0%, 6/1/2030 | | | 5,795,000 | | | | 6,720,693 | |
| | | | | | | | |
| | | | | | | 13,473,411 | |
| | |
| New York 11.8% | | | | | | | | |
| | |
New York, Metropolitan Transportation Authority, Dedicated Tax Fund, Climate Board Certified Green Bond: | | | | | | | | |
| | |
SeriesA-2, 5.0%, 11/15/2045 | | | 5,000,000 | | | | 5,965,100 | |
| | |
SeriesB-2, 5.0%, 11/15/2034 | | | 10,940,000 | | | | 13,422,833 | |
| | |
New York, Metropolitan Transportation Authority Revenue: | | | | | | | | |
| | |
Series D, 5.0%, 11/15/2027, INS: AGMC | | | 16,500,000 | | | | 18,385,455 | |
| | |
Series D, 5.0%, 11/15/2038 | | | 13,635,000 | | | | 15,162,120 | |
| | |
Series B, 5.25%, 11/15/2044 | | | 25,000,000 | | | | 28,512,750 | |
| | |
New York, Metropolitan Transportation Authority Revenue, Green Bond, Series A2, 5.0%, 11/15/2027 | | | 9,000,000 | | | | 11,068,740 | |
The accompanying notes are an integral part of the financial statements.
| | | | | | |
| 24 | | | | | DWS Managed Municipal Bond Fund | | |
| | | | | | | | |
| | | Principal
Amount ($) | | | Value ($) | |
| | |
New York, Senior Care Revenue, Dormitory Authority, City University, Series A, 5.25%, 5/15/2021 | | | 2,000,000 | | | | 2,107,380 | |
| | |
New York, State Agency General Obligation Lease, Urban Development Corp., 5.7%, 4/1/2020 | | | 800,000 | | | | 826,888 | |
| | |
New York, State Dormitory Authority Revenues,Non-State Supported Debt, Montefiore Obligated Group: | | | | | | | | |
| | |
Series A, 5.0%, 8/1/2034 | | | 545,000 | | | | 653,155 | |
| | |
Series A, 5.0%, 8/1/2035 | | | 780,000 | | | | 931,593 | |
| | |
New York, State Dormitory Authority, Personal Income Tax Revenue: | | | | | | | | |
| | |
Series A, 5.0%, 2/15/2035 | | | 9,305,000 | | | | 10,375,540 | |
| | |
Series B, 5.0%, 2/15/2035 | | | 30,000,000 | | | | 34,962,000 | |
| | |
Series A, 5.0%, 2/15/2039 | | | 3,950,000 | | | | 4,688,532 | |
| | |
Series C, 5.0%, 3/15/2041 | | | 10,000,000 | | | | 10,574,600 | |
| | |
Series C, 5.0%, 3/15/2042 | | | 14,750,000 | | | | 16,715,585 | |
| | |
New York, State Dormitory Authority, Sales Tax Revenue, Series B, 5.0%, 3/15/2036 | | | 5,000,000 | | | | 6,122,450 | |
| | |
New York, State Liberty Development Corp., Revenue, World Trade Center Port Authority Construction, 5.25%, 12/15/2043 | | | 45,000,000 | | | | 49,097,700 | |
| | |
New York, State Transportation Development Corp., Special Facilities Revenue, Delta Air Lines, Inc., Laguardia Airport C&D Redevelopment: | | | | | | | | |
| | |
AMT, 5.0%, 1/1/2033 | | | 2,045,000 | | | | 2,415,084 | |
| | |
AMT, 5.0%, 1/1/2034 | | | 2,045,000 | | | | 2,406,985 | |
| | |
AMT, 5.0%, 1/1/2036 | | | 2,045,000 | | | | 2,391,198 | |
| | |
New York, State Transportation Development Corp., Special Facilities Revenue, Laguardia Gateway Partners LLC, Redevelopment Project: | | | | | | | | |
| | |
Series A, AMT, 5.0%, 7/1/2041 | | | 6,660,000 | | | | 7,333,859 | |
| | |
Series A, AMT, 5.0%, 7/1/2046 | | | 14,190,000 | | | | 15,585,161 | |
| | |
New York, State Urban Development Corp. Revenue, State Personal Income Tax, Series A, 5.0%, 3/15/2031 | | | 4,600,000 | | | | 5,637,530 | |
| | |
New York, TSASC, Inc., Series A, 5.0%, 6/1/2041 | | | 1,195,000 | | | | 1,300,423 | |
| | |
New York, Utility Debt Securitization Authority, Restructuring Revenue: | | | | | | | | |
| | |
Series TE, 5.0%, 12/15/2034 | | | 3,200,000 | | | | 3,661,152 | |
| | |
Series TE, 5.0%, 12/15/2035 | | | 4,000,000 | | | | 4,572,000 | |
| | |
New York City, NY, Municipal Water Finance Authority, Water & Sewer Revenue, SeriesFF-2, 5.0%, 6/15/2040 | | | 2,270,000 | | | | 2,272,588 | |
| | |
New York City, NY, Municipal Water Finance Authority, Water & Sewer Systems Revenue, Series DD, 5.0%, 6/15/2036 | | | 6,000,000 | | | | 6,889,020 | |
| | |
New York City, NY, Municipal Water Finance Authority, Water & Sewer Systems Revenue, Second General Resolution, Series EE, 5.375%, 6/15/2043 | | | 11,250,000 | | | | 11,901,037 | |
The accompanying notes are an integral part of the financial statements.
| | | | | | | | |
| | DWS Managed Municipal Bond Fund | | | | | | 25 | |
| | | | | | | | |
| | | Principal
Amount ($) | | | Value ($) | |
| | |
New York City, NY, Transitional Finance Authority Revenue, Future Tax Secured: | | | | | | | | |
| | |
SeriesA-1, 4.0%, 5/1/2031 | | | 5,430,000 | | | | 6,111,899 | |
| | |
Series A, 5.0%, 2/1/2031 | | | 5,000,000 | | | | 6,139,350 | |
| | |
SeriesF-1, 5.0%, 5/1/2031 | | | 4,900,000 | | | | 6,042,190 | |
| | |
SeriesD-1, 5.0%, 2/1/2038 | | | 17,655,000 | | | | 20,018,651 | |
| | |
New York City, NY, Transitional Finance Authority, Building Aid Revenue: | | | | | | | | |
| | |
SeriesS-2A, 4.0%, 7/15/2037 | | | 5,000,000 | | | | 5,574,200 | |
| | |
SeriesS-2A, 4.0%, 7/15/2038 | | | 8,500,000 | | | | 9,443,415 | |
| | |
SeriesS-3, 5.0%, 7/15/2031 | | | 4,000,000 | | | | 5,004,960 | |
| | |
New York City, NY, Transitional Finance Authority, Building Aid Revenue, Fiscal 2018, SeriesS-1, 5.0%, 7/15/2035 | | | 2,800,000 | | | | 3,379,796 | |
| | |
New York, NY, General Obligation: | | | | | | | | |
| | |
SeriesB-1, 5.0%, 12/1/2031 | | | 2,000,000 | | | | 2,432,300 | |
| | |
SeriesD-1, 5.0%, 10/1/2033 | | | 25,000,000 | | | | 26,971,750 | |
| | |
Port Authority of New York & New Jersey: | | | | | | | | |
| | |
Series 207, AMT, 5.0%, 9/15/2031 | | | 5,000,000 | | | | 6,115,700 | |
| | |
Series 207, AMT, 5.0%, 9/15/2032 | | | 10,000,000 | | | | 12,173,300 | |
| | |
Series 193, AMT, 5.0%, 10/15/2035 | | | 2,865,000 | | | | 3,326,036 | |
| | |
Port Authority of New York & New Jersey, One Hundred Ninety-Third: | | | | | | | | |
| | |
AMT, 5.0%, 10/15/2029 | | | 10,000,000 | | | | 11,862,900 | |
| | |
AMT, 5.0%, 10/15/2034 | | | 5,775,000 | | | | 6,724,583 | |
| | |
Port Authority of New York & New Jersey, Two Hundred Second: | | | | | | | | |
| | |
AMT, 5.0%, 10/15/2033 | | | 6,560,000 | | | | 7,824,768 | |
| | |
AMT, 5.0%, 10/15/2034 | | | 5,250,000 | | | | 6,233,063 | |
| | |
Port Authority of New York & New Jersey, Two Hundred Seven: | | | | | | | | |
| | |
AMT, 5.0%, 9/15/2029 | | | 8,000,000 | | | | 9,928,960 | |
| | |
AMT, 5.0%, 9/15/2030 | | | 20,000,000 | | | | 24,628,000 | |
| | |
Syracuse, NY, Industrial Development Agency, Carousel Center Project: | | | | | | | | |
| | |
Series A, AMT, 5.0%, 1/1/2035 | | | 665,000 | | | | 703,437 | |
| | |
Series A, AMT, 5.0%, 1/1/2036 | | | 2,100,000 | | | | 2,213,904 | |
| | |
Troy, NY, Capital Resource Corp. Revenue, Rensselaer Polytechnic Institute, Series A, 5.125%, 9/1/2040 | | | 2,000,000 | | | | 2,080,040 | |
| | | | | | | | |
| | | | | | | 480,871,660 | |
| | |
| North Carolina 0.3% | | | | | | | | |
| | |
Charlotte, NC, Airport Revenue, Series A, 5.5%, 7/1/2034 | | | 1,500,000 | | | | 1,562,565 | |
| | |
Charlotte-Mecklenberg, NC, Hospital Authority, Health Care System Revenue, Series A, 5.0%, 1/15/2039 | | | 9,540,000 | | | | 10,368,549 | |
The accompanying notes are an integral part of the financial statements.
| | | | | | |
| 26 | | | | | DWS Managed Municipal Bond Fund | | |
| | | | | | | | |
| | | Principal
Amount ($) | | | Value ($) | |
| | |
North Carolina, State Municipal Power Agency No.1, Catawba Electric Revenue, Series A, 5.0%, 1/1/2030 | | | 1,560,000 | | | | 1,563,838 | |
| | | | | | | | |
| | | | | | | 13,494,952 | |
| | |
| North Dakota 0.6% | | | | | | | | |
| | |
Fargo, ND, Sanford Health Systems Revenue, 6.25%, 11/1/2031 | | | 9,260,000 | | | | 10,300,268 | |
| | |
Ward County, ND, Health Care Facilities Revenue, Trinity Obligation Group: | | | | | | | | |
| | |
Series C, 5.0%, 6/1/2043 | | | 5,215,000 | | | | 5,826,355 | |
| | |
Series C, 5.0%, 6/1/2048 | | | 5,895,000 | | | | 6,546,751 | |
| | | | | | | | |
| | | | | | | 22,673,374 | |
| | |
| Ohio 3.0% | | | | | | | | |
| | |
Chillicothe, OH, Hospital Facilities Revenue, Adena Health System Obligated Group Project, 5.0%, 12/1/2047 | | | 6,035,000 | | | | 6,888,168 | |
| | |
Cleveland, OH, Airport Systems Revenue, Series A, 5.0%, 1/1/2030 | | | 1,000,000 | | | | 1,075,550 | |
| | |
Hamilton County, OH, Health Care Revenue, Life Enriching Communities Project: | | | | | | | | |
| | |
5.0%, 1/1/2036 | | | 975,000 | | | | 1,084,405 | |
| | |
5.0%, 1/1/2046 | | | 2,790,000 | | | | 3,049,247 | |
| | |
Hancock County, OH, Hospital Revenue, Blanchard Valley Regional Health Center, Prerefunded, 6.5%, 12/1/2030 | | | 14,425,000 | | | | 15,835,044 | |
| | |
Lucas County, OH, Hospital Revenue, Promedica Healthcare, Series A, Prerefunded, 6.5%, 11/15/2037 | | | 6,000,000 | | | | 6,718,140 | |
| | |
Ohio, Akron, Bath & Copley Joint Township Hospital District Revenue, 5.25%, 11/15/2046 | | | 11,610,000 | | | | 13,327,119 | |
| | |
Ohio, Akron, Bath & Copley Joint Township Hospital District Revenue, Children’s Hospital Medical Center of Akron, 5.0%, 11/15/2038 | | | 15,645,000 | | | | 17,169,136 | |
| | |
Ohio, American Municipal Power, Inc. Revenue, Fremont Energy Center Project, Series B, 5.0%, 2/15/2037 | | | 13,090,000 | | | | 14,034,574 | |
| | |
Ohio, Higher Education Revenue, Case Western Reserve University, Series B, 6.5%, 10/1/2020 | | | 840,000 | | | | 873,163 | |
| | |
Ohio, School District General Obligation, 6.0%, 12/1/2019, INS: AMBAC | | | 80,000 | | | | 81,610 | |
| | |
Ohio, State Air Quality Development Authority, Exempt Facilities Revenue, Pratt Paper LLC Project: | | | | | | | | |
| | |
AMT, 144A, 4.25%, 1/15/2038, GTY: Pratt Industries, Inc. | | | 1,205,000 | | | | 1,268,009 | |
| | |
AMT, 144A, 4.5%, 1/15/2048, GTY: Pratt Industries, Inc. | | | 5,010,000 | | | | 5,322,173 | |
| | |
Ohio, State Higher Educational Facility Commission Revenue, Summa Health Systems Project: | | | | | | | | |
| | |
Series 2010, 5.25%, 11/15/2035, INS: AGMC | | | 7,500,000 | | | | 7,731,825 | |
| | |
Series 2010, 5.5%, 11/15/2030, INS: AGMC | | | 4,000,000 | | | | 4,139,880 | |
The accompanying notes are an integral part of the financial statements.
| | | | | | | | |
| | DWS Managed Municipal Bond Fund | | | | | | 27 | |
| | | | | | | | |
| | | Principal
Amount ($) | | | Value ($) | |
| | |
Ohio, State Turnpike Commission, Infrastructure Projects: | | | | | | | | |
| | |
SeriesA-1, 5.25%, 2/15/2030 | | | 4,620,000 | | | | 5,186,874 | |
| | |
SeriesA-1, 5.25%, 2/15/2031 | | | 9,375,000 | | | | 10,514,531 | |
| | |
SeriesA-1, 5.25%, 2/15/2032 | | | 7,500,000 | | | | 8,408,775 | |
| | | | | | | | |
| | | | | | | 122,708,223 | |
| | |
| Oklahoma 0.8% | | | | | | | | |
| | |
Oklahoma, State Development Finance Authority, Health System Revenue, OU Medicine Project: | | | | | | | | |
| | |
Series B, 5.5%, 8/15/2052 | | | 2,185,000 | | | | 2,568,948 | |
| | |
Series B, 5.5%, 8/15/2057 | | | 9,385,000 | | | | 10,969,094 | |
| | |
Oklahoma, State Turnpike Authority Revenue, Series E, 4.0%, 1/1/2031 | | | 6,375,000 | | | | 7,221,919 | |
| | |
Oklahoma, Water & Sewer Revenue, McGee Creek Authority, 6.0%, 1/1/2023, INS: NATL | | | 10,885,000 | | | | 11,769,733 | |
| | |
Tulsa County, OK, Industrial Authority, Senior Living Community Revenue, Montereau, Inc. Project, 5.25%, 11/15/2045 | | | 1,575,000 | | | | 1,773,607 | |
| | | | | | | | |
| | | | | | | 34,303,301 | |
| | |
| Pennsylvania 3.1% | | | | | | | | |
| | |
Allegheny County, PA, Hospital Development Authority Revenue, University of Pittsburgh Medical, 5.625%, 8/15/2039 | | | 11,800,000 | | | | 11,882,246 | |
| | |
Franklin County, PA, Industrial Development Authority Revenue, Menno Haven, Inc. Project: | | | | | | | | |
| | |
5.0%, 12/1/2043 | | | 665,000 | | | | 727,364 | |
| | |
5.0%, 12/1/2048 | | | 720,000 | | | | 785,333 | |
| | |
5.0%, 12/1/2053 | | | 1,055,000 | | | | 1,147,534 | |
| | |
Lancaster County, PA, Hospital Authority Revenue, University of Pennsylvania Health System Obligated Group, 5.0%, 8/15/2042 | | | 2,100,000 | | | | 2,452,212 | |
| | |
Montgomery County, PA, Industrial Development Authority, Meadowood Senior Living Project: | | | | | | | | |
| | |
Series A, 5.0%, 12/1/2038 | | | 1,665,000 | | | | 1,829,868 | |
| | |
Series A, 5.0%, 12/1/2048 | | | 4,335,000 | | | | 4,736,161 | |
| | |
Pennsylvania, Central Bradford Progress Authority Revenue, Guthrie Healthcare System, 5.375%, 12/1/2041 | | | 12,550,000 | | | | 13,436,908 | |
| | |
Pennsylvania, Certificate of Participations, Series A, 5.0%, 7/1/2043 | | | 1,115,000 | | | | 1,307,806 | |
| | |
Pennsylvania, Commonwealth Financing Authority Revenue, Series A, 5.0%, 6/1/2033 | | | 5,000,000 | | | | 5,746,950 | |
| | |
Pennsylvania, Commonwealth Financing Authority, Tobacco Master Settlement Payment Revenue Bonds: | | | | | | | | |
| | |
5.0%, 6/1/2027 | | | 1,290,000 | | | | 1,568,343 | |
| | |
5.0%, 6/1/2028 | | | 1,290,000 | | | | 1,590,634 | |
The accompanying notes are an integral part of the financial statements.
| | | | | | |
| 28 | | | | | DWS Managed Municipal Bond Fund | | |
| | | | | | | | |
| | | Principal
Amount ($) | | | Value ($) | |
| | |
5.0%, 6/1/2029 | | | 1,290,000 | | | | 1,582,443 | |
| | |
5.0%, 6/1/2030 | | | 855,000 | | | | 1,044,186 | |
| | |
5.0%, 6/1/2031 | | | 865,000 | | | | 1,050,733 | |
| | |
Pennsylvania, Geisinger Authority Health System Revenue, SeriesA-2, 5.0%, 2/15/2034 | | | 3,000,000 | | | | 3,546,810 | |
| | |
Pennsylvania, Sales & Special Tax Revenue, Convention Center Authority, Series A, ETM, 6.0%, 9/1/2019, INS: FGIC | | | 780,000 | | | | 788,502 | |
| | |
Pennsylvania, State General Obligation: | | | | | | | | |
| | |
Series 2, 4.0%, 9/15/2032 | | | 10,000,000 | | | | 11,008,500 | |
| | |
Series D, 5.0%, 8/15/2032 | | | 5,000,000 | | | | 5,837,100 | |
| | |
Pennsylvania, State Turnpike Commission Revenue: | | | | | | | | |
| | |
Series B, 5.0%, 6/1/2033 | | | 12,000,000 | | | | 13,884,000 | |
| | |
SeriesA-1, 5.0%, 12/1/2040 | | | 15,000,000 | | | | 17,108,100 | |
| | |
SeriesB-1, 5.0%, 6/1/2042 | | | 6,950,000 | | | | 8,010,083 | |
| | |
SeriesA-1, 5.0%, 12/1/2042 | | | 5,000,000 | | | | 5,914,700 | |
| | |
SeriesA-1, 5.0%, 12/1/2047 | | | 3,335,000 | | | | 3,912,489 | |
| | |
Philadelphia, PA, Airport Revenue, Series A, 5.0%, 6/15/2035 | | | 7,080,000 | | | | 7,299,905 | |
| | | | | | | | |
| | | | | | | 128,198,910 | |
| | |
| South Carolina 2.9% | | | | | | | | |
| | |
Charleston County, SC, Airport District System Revenue, Series A, AMT, 5.75%, 7/1/2030 | | | 5,880,000 | | | | 6,743,654 | |
| | |
Lexington County, SC, Health Services District, Lexington Medical Center: | | | | | | | | |
| | |
5.0%, 11/1/2041 | | | 2,500,000 | | | | 2,786,575 | |
| | |
5.0%, 11/1/2046 | | | 7,490,000 | | | | 8,345,583 | |
| | |
South Carolina, State Jobs-Economic Development Authority, Hospital Revenue, Conway Hospitals, Inc., 5.25%, 7/1/2047 | | | 4,715,000 | | | | 5,387,642 | |
| | |
South Carolina, State Jobs-Economic Development Authority, Residential Facility Revenue, Episcopal Home at Still Hopes: | | | | | | | | |
| | |
Series A, 5.0%, 4/1/2048 | | | 3,085,000 | | | | 3,264,856 | |
| | |
Series A, 5.25%, 4/1/2053 | | | 4,000,000 | | | | 4,271,920 | |
| | |
South Carolina, State Ports Authority Revenue, Prerefunded, 5.25%, 7/1/2040 | | | 10,195,000 | | | | 10,608,917 | |
| | |
South Carolina, State Public Service Authority Revenue: | | | | | | | | |
| | |
Series A, 5.0%, 12/1/2033 | | | 4,400,000 | | | | 5,150,332 | |
| | |
Series A, 5.0%, 12/1/2036 | | | 4,780,000 | | | | 5,548,959 | |
| | |
Series C, 5.0%, 12/1/2046 | | | 6,850,000 | | | | 7,664,670 | |
| | |
South Carolina, State Public Service Authority Revenue, Santee Cooper, Series A, Prerefunded, 5.75%, 12/1/2043 | | | 35,555,000 | | | | 42,162,897 | |
| | |
South Carolina, State Transportation Infrastructure Bank Revenue, 5.0%, 10/1/2038 | | | 15,130,000 | | | | 17,907,111 | |
| | | | | | | | |
| | | | | | | 119,843,116 | |
The accompanying notes are an integral part of the financial statements.
| | | | | | | | |
| | DWS Managed Municipal Bond Fund | | | | | | 29 | |
| | | | | | | | |
| | | Principal
Amount ($) | | | Value ($) | |
| | |
| South Dakota 1.1% | | | | | | | | |
| | |
South Dakota, State Health & Educational Facilities Authority Revenue, Avera Health: | | | | | | | | |
| | |
5.0%, 7/1/2044 | | | 20,475,000 | | | | 22,479,503 | |
| | |
5.0%, 7/1/2046 | | | 16,140,000 | | | | 18,586,824 | |
| | |
South Dakota, State Health & Educational Facilities Authority Revenue, Sanford Health, 5.5%, 11/1/2040 | | | 3,000,000 | | | | 3,043,410 | |
| | | | | | | | |
| | | | | | | 44,109,737 | |
| | |
| Tennessee 0.4% | | | | | | | | |
| | |
Metropolitan Government of Nashville & Davidson County, TN, General Obligation, 4.0%, 7/1/2034 | | | 6,000,000 | | | | 6,803,940 | |
| | |
Tennessee, Energy Acquisition Corp., Gas Revenue: | | | | | | | | |
| | |
Series A, 5.25%, 9/1/2019 | | | 7,000,000 | | | | 7,052,710 | |
| | |
Series A, 5.25%, 9/1/2021 | | | 2,000,000 | | | | 2,134,840 | |
| | | | | | | | |
| | | | | | | 15,991,490 | |
| | |
| Texas 11.9% | | | | | | | | |
| | |
Central Texas, Regional Mobility Authority Revenue, Senior Lien, Series A, 5.0%, 1/1/2040 | | | 4,730,000 | | | | 5,341,447 | |
| | |
Clifton, TX, Higher Education Finance Corp., Education Revenue, International Leadership, Series D, 6.125%, 8/15/2048 | | | 11,465,000 | | | | 12,490,315 | |
| | |
Harris County, TX, Port Houston Authority, SeriesD-1, 5.0%, 10/1/2035 | | | 18,290,000 | | | | 19,093,480 | |
| | |
Houston, TX, Utility Systems Revenue, First Lien, Series B, 5.0%, 11/15/2034 | | | 5,000,000 | | | | 5,987,550 | |
| | |
Mission, TX, Economic Development Corp. Revenue, Senior Lien-Natgasoline Project, AMT, 144A, 4.625%, 10/1/2031 | | | 7,500,000 | | | | 8,030,700 | |
| | |
North Texas, Tollway Authority Revenue: | | | | | | | | |
| | |
Series B, 5.0%, 1/1/2040 | | | 8,825,000 | | | | 9,714,825 | |
| | |
Series C, 5.25%, 1/1/2044 | | | 20,000,000 | | | | 20,052,600 | |
| | |
First Tier, Prerefunded, 6.0%, 1/1/2043 | | | 30,000,000 | | | | 32,103,000 | |
| | |
North Texas, Tollway Authority Revenue, Second Tier: | | | | | | | | |
| | |
Series B, 5.0%, 1/1/2043 | | | 3,075,000 | | | | 3,575,425 | |
| | |
Series B, 5.0%, 1/1/2048 | | | 8,615,000 | | | | 9,947,740 | |
| | |
San Antonio, TX, Electric & Gas Systems Revenue, 4.0%, 2/1/2032 | | | 7,000,000 | | | | 7,810,600 | |
| | |
Tarrant County, TX, Cultural Education Facilities Finance Corp. Revenue, Christus Health Obligated Group, Buckner Retirement Services Inc., Project, Series B, 5.0%, 7/1/2048 | | | 25,000,000 | | | | 29,489,250 | |
| | |
Tarrant County, TX, Cultural Education Facilities Finance Corp., Buckner Retirement Services Revenue, 5.0%, 11/15/2046 | | | 4,410,000 | | | | 4,963,014 | |
The accompanying notes are an integral part of the financial statements.
| | | | | | |
| 30 | | | | | DWS Managed Municipal Bond Fund | | |
| | | | | | | | |
| | | Principal
Amount ($) | | | Value ($) | |
| | |
Tarrant County, TX, Cultural Education Facilities Finance Corp., Hospital Revenue, Scott & White Healthcare: | | | | | | | | |
| | |
5.0%, 8/15/2036 | | | 7,000,000 | | | | 7,775,180 | |
| | |
5.0%, 8/15/2043 | | | 9,900,000 | | | | 10,912,770 | |
| | |
Prerefunded, 5.625%, 8/15/2035 | | | 740,000 | | | | 776,245 | |
| | |
Tarrant County, TX, Cultural Education Facilities Finance Corp., State Health Resources, 5.0%, 11/15/2040 | | | 19,325,000 | | | | 20,155,009 | |
| | |
Texas, Dallas/Fort Worth International Airport Revenue: | | | | | | | | |
| | |
Series D, 5.0%, 11/1/2035 | | | 24,425,000 | | | | 25,481,137 | |
| | |
Series A, 5.25%, 11/1/2038 | | | 20,000,000 | | | | 20,914,000 | |
| | |
Texas, Grand Parkway Transportation Corp., System Toll Revenue, Series B, 5.25%, 10/1/2051 | | | 20,000,000 | | | | 22,447,800 | |
| | |
Texas, Love Field Airport Modernization Corp., General Airport Revenue: | | | | | | | | |
| | |
AMT, 5.0%, 11/1/2033 | | | 1,250,000 | | | | 1,466,838 | |
| | |
AMT, 5.0%, 11/1/2034 | | | 1,000,000 | | | | 1,169,050 | |
| | |
Texas, Lower Colorado River Authority Revenue, Series A, Prerefunded, 5.0%, 5/15/2036 | | | 25,000 | | | | 27,475 | |
| | |
Texas, Lower Colorado River Authority, Transmission Contract Revenue, LCRA Transmission Services, 5.0%, 5/15/2040 | | | 20,000,000 | | | | 20,605,600 | |
| | |
Texas, Municipal Gas Acquisition & Supply Corp., I, Gas Supply Revenue, Series B, 67% of3-monthUSD-LIBOR + 0.700%, 2.449%***, 12/15/2026 | | | 18,230,000 | | | | 18,146,142 | |
| | |
Texas, New Hope Cultural Education Facilities Finance Corp., Retirement Facilities Revenue, Westminster Manor Project: | | | | | | | | |
| | |
5.0%, 11/1/2031 | | | 1,000,000 | | | | 1,114,140 | |
| | |
5.0%, 11/1/2040 | | | 1,070,000 | | | | 1,177,268 | |
| | |
Texas, New Hope Cultural Education Facilities Finance Corp., Senior Living Revenue, Bridgemoor Plano Project, Series A, 7.25%, 12/1/2053 | | | 4,000,000 | | | | 4,181,200 | |
| | |
Texas, SA Energy Acquisition Public Facility Corp., Gas Supply Revenue: | | | | | | | | |
| | |
5.5%, 8/1/2021 | | | 5,575,000 | | | | 5,966,588 | |
| | |
5.5%, 8/1/2025 | | | 2,750,000 | | | | 3,258,282 | |
| | |
Texas, State College Student Loan, AMT, 5.5%, 8/1/2028 | | | 5,620,000 | | | | 6,993,303 | |
| | |
Texas, State Municipal Gas Acquisition & Supply Corp. I, Gas Supply Revenue, Series D, 6.25%, 12/15/2026 | | | 18,590,000 | | | | 21,796,589 | |
| | |
Texas, State Municipal Gas Acquisition & Supply Corp. III Gas Supply Revenue: | | | | | | | | |
| | |
5.0%, 12/15/2030 | | | 2,250,000 | | | | 2,455,605 | |
| | |
5.0%, 12/15/2031 | | | 4,500,000 | | | | 4,901,130 | |
| | |
5.0%, 12/15/2032 | | | 21,215,000 | | | | 23,066,009 | |
The accompanying notes are an integral part of the financial statements.
| | | | | | | | |
| | DWS Managed Municipal Bond Fund | | | | | | 31 | |
| | | | | | | | |
| | | Principal
Amount ($) | | | Value ($) | |
| | |
Texas, State Transportation Commission, Turnpike Systems Revenue: | | | | | | | | |
| | |
Series C, 5.0%, 8/15/2034 | | | 14,410,000 | | | | 16,216,870 | |
| | |
Series C, 5.0%, 8/15/2042 | | | 5,085,000 | | | | 5,649,994 | |
| | |
Texas, State Water Development Board Revenue, State Water Implementation Revenue Fund: | | | | | | | | |
| | |
4.0%, 10/15/2030 | | | 8,500,000 | | | | 9,641,805 | |
| | |
Series B, 4.0%, 10/15/2033 | | | 20,000,000 | | | | 22,840,200 | |
| | |
Series A, 4.0%, 10/15/2036 | | | 5,000,000 | | | | 5,589,350 | |
| | |
Series B, 4.0%, 10/15/2036 | | | 23,580,000 | | | | 26,571,595 | |
| | |
Series B, 4.0%, 10/15/2037 | | | 7,000,000 | | | | 7,861,280 | |
| | | | | | | | |
| | | | | | | 487,758,400 | |
| | |
| Utah 0.7% | | | | | | | | |
| | |
Salt Lake City, UT, Airport Revenue: | | | | | | | | |
| | |
Series A, AMT, 5.0%, 7/1/2032 | | | 5,000,000 | | | | 6,073,050 | |
| | |
Series A, AMT, 5.0%, 7/1/2043 | | | 3,850,000 | | | | 4,547,659 | |
| | |
Series A, AMT, 5.0%, 7/1/2047 | | | 13,435,000 | | | | 15,582,047 | |
| | |
Series A, AMT, 5.0%, 7/1/2048 | | | 2,310,000 | | | | 2,715,913 | |
| | | | | | | | |
| | | | | | | 28,918,669 | |
| | |
| Virginia 1.7% | | | | | | | | |
| | |
Fairfax County, VA, Economic Development Authority, Residential Care Facility Revenue, Goodwin House, Inc., Series A, 5.0%, 10/1/2036 | | | 1,750,000 | | | | 1,947,960 | |
| | |
Virginia, Small Business Financing Authority, Private Activity Revenue, Transform 66 P3 Project: | | | | | | | | |
| | |
AMT, 5.0%, 12/31/2049 | | | 14,865,000 | | | | 16,609,110 | |
| | |
AMT, 5.0%, 12/31/2052 | | | 4,655,000 | | | | 5,190,697 | |
| | |
Virginia, State College Building Authority, Educational Facilities Revenue, 21st Century, Series A, 4.0%, 2/1/2031 | | | 15,145,000 | | | | 16,973,153 | |
| | |
Virginia, State College Building Authority, Educational Facilities Revenue, Public Higher Education: | | | | | | | | |
| | |
Series A, 4.0%, 9/1/2030 | | | 5,590,000 | | | | 6,364,103 | |
| | |
Series A, 4.0%, 9/1/2031 | | | 4,710,000 | | | | 5,281,229 | |
| | |
Virginia, State Commonwealth Transportation Board Revenue, Series A, 5.0%, 5/15/2031 | | | 5,120,000 | | | | 6,355,610 | |
| | |
Virginia, State Public Building Authority, Public Facility Revenue, Series B, AMT, 4.0%, 8/1/2039 | | | 9,700,000 | | | | 10,761,956 | |
| | | | | | | | |
| | | | | | | 69,483,818 | |
| | |
| Washington 4.1% | | | | | | | | |
| | |
King County, WA, School District No. 412 Shoreline: | | | | | | | | |
| | |
4.0%, 12/1/2035 | | | 5,505,000 | | | | 6,206,392 | |
| | |
4.0%, 12/1/2037 | | | 15,000,000 | | | | 16,661,550 | |
The accompanying notes are an integral part of the financial statements.
| | | | | | |
| 32 | | | | | DWS Managed Municipal Bond Fund | | |
| | | | | | | | |
| | | Principal
Amount ($) | | | Value ($) | |
| | |
King County, WA, School District No. 412, Shoreline, 5.0%, 12/1/2031 | | | 14,345,000 | | | | 18,003,549 | |
| | |
Port of Seattle, WA, Revenue Bonds: | | | | | | | | |
| | |
Series A, AMT, 5.0%, 5/1/2029 | | | 8,280,000 | | | | 10,021,119 | |
| | |
Series A, AMT, 5.0%, 5/1/2030 | | | 6,200,000 | | | | 7,459,344 | |
| | |
Series A, AMT, 5.0%, 5/1/2031 | | | 9,200,000 | | | | 11,007,524 | |
| | |
Seattle, WA, Municipal Light & Power Revenue, Series A, 4.0%, 1/1/2038 | | | 6,875,000 | | | | 7,569,375 | |
| | |
Spokane County, WA, School District No. 81, Series B, 4.0%, 12/1/2030 | | | 18,800,000 | | | | 21,585,032 | |
| | |
Washington, Energy Northwest Electric Revenue: | | | | | | | | |
| | |
Series C, 5.0%, 7/1/2030 | | | 14,405,000 | | | | 18,203,022 | |
| | |
Series C, 5.0%, 7/1/2031 | | | 10,675,000 | | | | 13,409,081 | |
| | |
Washington, State General Obligation, Series C, 5.0%, 2/1/2031 | | | 16,000,000 | | | | 19,926,560 | |
| | |
Washington, State Health Care Facilities Authority, Catholic Health Initiatives, Series A, 5.0%, 2/1/2041 | | | 11,260,000 | | | | 11,673,918 | |
| | |
Washington, State Health Care Facilities Authority, Virginia Mason Medical Center: | | | | | | | | |
| | |
5.0%, 8/15/2034 | | | 1,715,000 | | | | 1,968,288 | |
| | |
5.0%, 8/15/2035 | | | 1,470,000 | | | | 1,681,871 | |
| | |
5.0%, 8/15/2036 | | | 980,000 | | | | 1,117,974 | |
| | | | | | | | |
| | | | | | | 166,494,599 | |
| | |
| West Virginia 0.6% | | | | | | | | |
West Virginia, State Hospital Finance Authority, State University Health System Obligated Group, Series A, 5.0%, 6/1/2047 | | | 20,120,000 | | | | 23,121,703 | |
| | |
| Wisconsin 1.4% | | | | | | | | |
| | |
Milwaukee County, WI, Airport Revenue, Series A, 5.0%, 12/1/2034 | | | 7,000,000 | | | | 7,124,740 | |
| | |
Wisconsin, Hospital & Healthcare Revenue, Health & Education Facilities Authority: | | | | | | | | |
| | |
Series B, ETM, 6.25%, 1/1/2022, INS: AMBAC | | | 1,285,000 | | | | 1,373,267 | |
| | |
Series C, ETM, 6.25%, 1/1/2022, INS: AMBAC | | | 2,245,000 | | | | 2,398,962 | |
| | |
Wisconsin, Public Finance Authority Revenue, Denver International Airport Great Hall Project, AMT, 5.0%, 9/30/2049 | | | 3,335,000 | | | | 3,793,196 | |
| | |
Wisconsin, Public Financing Authority, Retirement Facilities Revenue, Southminster, Inc.: | | | | | | | | |
| | |
144A, 5.0%, 10/1/2043 | | | 1,560,000 | | | | 1,711,398 | |
| | |
144A, 5.0%, 10/1/2048 | | | 4,315,000 | | | | 4,720,912 | |
| | |
144A, 5.0%, 10/1/2053 | | | 8,100,000 | | | | 8,837,829 | |
| | |
Wisconsin, State Health & Educational Facilities Authority Revenue, Agnesian Healthcare, Inc., Series B, Prerefunded, 5.0%, 7/1/2036 | | | 8,500,000 | | | | 9,668,070 | |
The accompanying notes are an integral part of the financial statements.
| | | | | | | | |
| | DWS Managed Municipal Bond Fund | | | | | | 33 | |
| | | | | | | | |
| | | Principal
Amount ($) | | | Value ($) | |
| | |
Wisconsin, State Health & Educational Facilities Authority Revenue, Thedacare, Inc., Series A, 5.5%, 12/15/2038 | | | 13,235,000 | | | | 13,457,613 | |
| | |
Wisconsin, State Health & Educational Facilities Authority, St. John’s Communities, Inc. Project: | | | | | | | | |
| | |
Series A, 5.0%, 9/15/2040 | | | 335,000 | | | | 351,556 | |
| | |
Series A, 5.0%, 9/15/2045 | | | 445,000 | | | | 465,350 | |
| | |
Series A, 5.0%, 9/15/2050 | | | 1,780,000 | | | | 1,857,821 | |
| | | | | | | | |
| | | | | | | | 55,760,714 | |
| Total Municipal Bonds and Notes(Cost $3,748,099,624) | | | | 4,039,632,399 | |
|
| Underlying Municipal Bonds of Inverse Floaters (a) 0.3% | |
Texas 0.3% | | | | | | | | |
Dallas, TX, Water Works & Sewer Systems Revenue, 5.0%, 10/1/2035 (b) (Cost $10,131,304) | | | 10,000,000 | | | | 10,429,500 | |
| | |
Trust: Texas, Water Works & Sewer Systems Revenue, Series 2016-XM0288, 144A, 7.91%, 10/1/2035, Leverage Factor at purchase date: 2 to 1 | | | | | | | | |
| | |
| | | Shares | | | Value ($) | |
| Open-End Investment Companies 0.0% | | | | | | | | |
BlackRock Liquidity Funds MuniCash Portfolio, Institutional Shares, 1.341%**** (Cost $929) | | | 929 | | | | 929 | |
| | |
| | | % of Net
Assets | | | Value ($) | |
| Total Investment Portfolio(Cost $3,758,231,857) | | | 99.0 | | | | 4,050,062,828 | |
| Floating Rate Notes (a) | | | (0.1 | ) | | | (5,000,000 | ) |
| Other Assets and Liabilities, Net | | | 1.1 | | | | 43,597,848 | |
| |
| Net Assets | | | 100.0 | | | | 4,088,660,676 | |
| * | Non-income producing security. |
| ** | Variable rate demand notes are securities whose interest rates are reset periodically (usually daily mode or weekly mode) by remarketing agents based on current market levels, and are not directly set as a fixed spread to a reference rate. These securities may be redeemed at par by the holder at any time, and are shown at their current rates as of May 31, 2019. Date shown reflects the earlier of demand date or stated maturity date. |
| *** | Variable or floating rate security. These securities are shown at their current rate as of May 31, 2019. For securities based on a published reference rate and spread, the reference rate and spread are indicated within the description above. Certain variable rate securities are not based on a published reference rate and spread but adjust periodically based on current market conditions, prepayment of underlying positions and/or other variables. |
| **** | Current yield; not a coupon rate. |
The accompanying notes are an integral part of the financial statements.
| | | | | | |
| 34 | | | | | DWS Managed Municipal Bond Fund | | |
| (a) | Securities represent the underlying municipal obligations of inverse floating rate obligations held by the Fund. The Floating Rate Notes represents leverage to the Fund and is the amount owed to the floating rate note holders. |
| (b) | Security forms part of the below inverse floater. The Fund accounts for these inverse floaters as a form of secured borrowing, by reflecting the value of the underlying bond in the investments of the Fund and the amount owed to the floating rate note holder as a liability. |
144A: Security exempt from registration under Rule 144A of the Securities Act of 1933. These securities may be resold in transactions exempt from registration, normally to qualified institutional buyers.
AGMC: Assured Guaranty Municipal Corp.
AMBAC: Ambac Financial Group, Inc.
AMT: Subject to alternative minimum tax.
ETM: Bonds bearing the description ETM (escrow to maturity) are collateralized usually by U.S. Treasury securities which are held in escrow and used to pay principal and interest on bonds so designated.
FGIC: Financial Guaranty Insurance Co.
GTY: Guaranty Agreement
INS: Insured
LIBOR: London Interbank Offered Rate
LOC: Letter of Credit
NATL: National Public Finance Guarantee Corp.
Prerefunded: Bonds which are prerefunded are collateralized usually by U.S. Treasury securities which are held in escrow and used to pay principal and interest ontax-exempt issues and to retire the bonds in full at the earliest refunding date.
Fair Value Measurements
Various inputs are used in determining the value of the Fund’s investments. These inputs are summarized in three broad levels. Level 1 includes quoted prices in active markets for identical securities. Level 2 includes other significant observable inputs (including quoted prices for similar securities, interest rates, prepayment speeds and credit risk). Level 3 includes significant unobservable inputs (including the Fund’s own assumptions in determining the fair value of investments). The level assigned to the securities valuations may not be an indication of the risk or liquidity associated with investing in those securities.
The following is a summary of the inputs used as of May 31, 2019 in valuing the Fund’s investments. For information on the Fund’s policy regarding the valuation of investments, please refer to the Security Valuation section of Note A in the accompanying Notes to Financial Statements.
| | | | | | | | | | | | | | | | |
| Assets | | Level 1 | | | Level 2 | | | Level 3 | | | Total | |
| Municipal Investments (c) | | $ | — | | | $ | 4,050,061,899 | | | $ | — | | | $ | 4,050,061,899 | |
| Open-End Investment Companies | | | 929 | | | | — | | | | — | | | | 929 | |
| Total | | $ | 929 | | | $ | 4,050,061,899 | | | $ | — | | | $ | 4,050,062,828 | |
| (c) | See Investment Portfolio for additional detailed categorizations. |
The accompanying notes are an integral part of the financial statements.
| | | | | | | | |
| | DWS Managed Municipal Bond Fund | | | | | | 35 | |
Statement of Assets and Liabilities
| | | | |
| as of May 31, 2019 | | | | |
| | | | |
| | | | |
| |
| Assets | | | | |
| Investments in securities, at value (cost $3,758,231,857) | | $ | 4,050,062,828 | |
Cash | | | 9,620 | |
| Receivable for Fund shares sold | | | 4,807,024 | |
| Interest receivable | | | 51,208,399 | |
| Other assets | | | 101,460 | |
| Total assets | | | 4,106,189,331 | |
| |
| Liabilities | | | | |
| Payable for investments purchased | | | 4,655,000 | |
| Line of credit loan payable | | | 950,000 | |
| Payable for Fund shares redeemed | | | 2,038,555 | |
| Payable for floating rate notes issued | | | 5,000,000 | |
| Distributions payable | | | 1,431,219 | |
| Accrued management fee | | | 1,155,150 | |
| Accrued Trustees’ fees | | | 53,180 | |
| Other accrued expenses and payables | | | 2,245,551 | |
| Total liabilities | | | 17,528,655 | |
| Net assets, at value | | $ | 4,088,660,676 | |
| |
| Net Assets Consist of | | | | |
| Distributable earnings (loss) | | | 296,140,179 | |
| Paid-in capital | | | 3,792,520,497 | |
| Net assets, at value | | $ | 4,088,660,676 | |
The accompanying notes are an integral part of the financial statements.
| | | | | | |
| 36 | | | | | DWS Managed Municipal Bond Fund | | |
| | |
| Statement of Assets and Liabilitiesas of May 31, 2019 (continued) | | |
| | | | |
| |
| Net Asset Value | | | | |
| | | | |
Class A | | | | |
| |
Net Asset Valueand redemption price per share
($1,314,724,195 ÷ 142,711,895 outstanding shares of beneficial interest,
$.01 par value, unlimited number of shares authorized) | | $ | 9.21 | |
| |
| Maximum offering price per share (100 ÷ 97.25 of $9.21) | | $ | 9.47 | |
Class C | | | | |
| |
Net Asset Value,offering and redemption price
(subject to contingent deferred sales charge) per share
($150,743,360 ÷ 16,363,596 outstanding shares of beneficial interest,
$.01 par value, unlimited number of shares authorized) | | $ | 9.21 | |
Class S | | | | |
| |
Net Asset Value,offering and redemption price per share
($2,283,481,494 ÷ 247,528,907 outstanding shares of beneficial interest,
$.01 par value, unlimited number of shares authorized) | | $ | 9.23 | |
Institutional Class | | | | |
| |
Net Asset Value,offering and redemption price per share
($339,711,627 ÷ 36,863,148 outstanding shares of beneficial interest,
$.01 par value, unlimited number of shares authorized) | | $ | 9.22 | |
The accompanying notes are an integral part of the financial statements.
| | | | | | | | |
| | DWS Managed Municipal Bond Fund | | | | | | 37 | |
Statement of Operations
| | | | |
| for the year ended May 31, 2019 | | | | |
| | | | |
| |
| Investment Income | | | | |
| Income: | | | | |
| |
| Interest | | $ | 167,421,925 | |
| Expenses: | | | | |
| |
| Management fee | | | 13,839,309 | |
| Administration fee | | | 4,234,701 | |
| Services to shareholders | | | 5,389,488 | |
| Distribution and service fees | | | 5,012,320 | |
| Custodian fee | | | 42,017 | |
| Professional fees | | | 154,275 | |
| Reports to shareholders | | | 136,307 | |
| Registration fees | | | 138,328 | |
| Trustees’ fees and expenses | | | 192,770 | |
| Interest expense and fees on floating rate notes issued | | | 111,157 | |
| Interest expense | | | 23,612 | |
| Other | | | 293,777 | |
| Total expenses before expense reductions | | | 29,568,061 | |
| Expense reductions | | | (1,173,563 | ) |
| Total expenses after expense reductions | | | 28,394,498 | |
| Net investment income | | | 139,027,427 | |
| |
| Realized and Unrealized Gain (Loss) | | | | |
| Net realized gain (loss) from investments | | | (1,616,581 | ) |
| Change in net unrealized appreciation (depreciation) on investments | | | 95,527,018 | |
| Net gain (loss) | | | 93,910,437 | |
| Net increase (decrease) in net assets resulting from operations | | $ | 232,937,864 | |
The accompanying notes are an integral part of the financial statements.
| | | | | | |
| 38 | | | | | DWS Managed Municipal Bond Fund | | |
Statements of Changes in Net Assets
| | | | | | | | |
| | | Years Ended May 31, | |
| Increase (Decrease) in Net Assets | | 2019 | | | 2018 | |
| Operations: | | | | | | | | |
| | |
| Net investment income (loss) | | $ | 139,027,427 | | | $ | 155,182,246 | |
| Net realized gain (loss) | | | (1,616,581 | ) | | | 26,090,962 | |
| Change in net unrealized appreciation (depreciation) | | | 95,527,018 | | | | (127,314,694 | ) |
| Net increase (decrease) in net assets resulting from operations | | | 232,937,864 | | | | 53,958,514 | |
| Distributions to shareholders: | | | | | | | | |
| | |
Class A | | | (43,515,689 | ) | | | (50,101,338 | ) |
Class C | | | (4,068,918 | ) | | | (5,438,376 | ) |
Class S | | | (80,554,972 | ) | | | (93,126,519 | ) |
Institutional Class | | | (10,210,602 | ) | | | (7,247,232 | ) |
| Total distributions | | | (138,350,181 | ) | | | (155,913,465 | )* |
| Fund share transactions: | | | | | | | | |
| | |
| Proceeds from shares sold | | | 863,145,446 | | | | 749,237,383 | |
| Reinvestment of distributions | | | 121,434,618 | | | | 135,328,890 | |
| Payments for shares redeemed | | | (1,616,781,076 | ) | | | (1,202,199,186 | ) |
| Net increase (decrease) in net assets from Fund share transactions | | | (632,201,012 | ) | | | (317,632,913 | ) |
| Increase (decrease) in net assets | | | (537,613,329 | ) | | | (419,587,864 | ) |
| Net assets at beginning of year | | | 4,626,274,005 | | | | 5,045,861,869 | |
| | |
| Net assets at end of year | | $ | 4,088,660,676 | | | $ | 4,626,274,005 | ** |
| * | Includes distributions from net investment income of $49,526,791, $5,355,107, $92,134,771 and $7,161,207 for Class A, Class C, Class S and Institutional Class, respectively and distributions from net realized gains of $574,547, $83,269, $991,748 and $86,025 for Class A, Class C, Class S and Institutional Class, respectively. |
| ** | Includes undistributed net investment income of $3,246,135. |
The accompanying notes are an integral part of the financial statements.
| | | | | | | | |
| | DWS Managed Municipal Bond Fund | | | | | | 39 | |
Financial Highlights
| | | | | | | | | | | | | | | | | | | | | | | | |
| | | | Years Ended May 31, | |
| Class A | | | 2019 | | | 2018 | | | 2017 | | | 2016 | | | 2015 | |
| | | |
| Selected Per Share Data | | | | | | | | | | | | | |
| Net asset value, beginning of period | | | | $8.98 | | | | $9.17 | | | | $9.42 | | | | $9.25 | | | | $9.30 | |
| Income from investment operations: | | | | | | | | | | | | | | | | | | | | | |
| | | | | |
Net investment income | | | | .28 | | | | .28 | | | | .31 | | | | .35 | | | | .36 | |
Net realized and unrealized gain (loss) | | | | .23 | | | | (.19 | ) | | | (.25 | ) | | | .17 | | | | (.06 | ) |
Total from investment operations | | | | .51 | | | | .09 | | | | .06 | | | | .52 | | | | .30 | |
| Less distributions from: | | | | | | | | | | | | | | | | | | | | | |
| | | | | |
Net investment income | | | | (.28 | ) | | | (.28 | ) | | | (.31 | ) | | | (.35 | ) | | | (.35 | ) |
Net realized gains | | | | (.00 | )* | | | (.00 | )* | | | (.00 | )* | | | (.00 | )* | | | (.00 | )* |
Total distributions | | | | (.28 | ) | | | (.28 | ) | | | (.31 | ) | | | (.35 | ) | | | (.35 | ) |
| Net asset value, end of period | | | | $9.21 | | | | $8.98 | | | | $9.17 | | | | $9.42 | | | | $9.25 | |
| Total Return (%)a | | | | | | | 5.85 | | | | 1.00 | | | | .71 | | | | 5.70 | | | | 3.34 | |
| |
| Ratios to Average Net Assets and Supplemental Data | | | | | |
| Net assets, end of period ($ millions) | | | | 1,315 | | | | 1,507 | | | | 1,693 | | | | 2,031 | | | | 1,941 | |
| Ratio of expenses (including interest expense) (%)b | | | | .77 | | | | .77 | | | | .79 | | | | .80 | | | | .81 | |
| Ratio of expenses (excluding interest expense) (%) | | | | .77 | | | | .76 | | | | .76 | | | | .76 | | | | .76 | |
| Ratio of net investment income (%) | | | | 3.18 | | | | 3.08 | | | | 3.40 | | | | 3.73 | | | | 3.84 | |
| Portfolio turnover rate (%) | | | | 39 | | | | 42 | | | | 38 | | | | 29 | | | | 29 | |
| a | Total return does not reflect the effect of any sales charges. |
| b | Interest expense represents interest and fees onshort-term floating rate notes issued in conjunction with inverse floating rate securities. Interest income from such transactions is included in income from investment operations. |
| * | Amount is less than $.005. |
The accompanying notes are an integral part of the financial statements.
| | | | | | |
| 40 | | | | | DWS Managed Municipal Bond Fund | | |
| | | | | | | | | | | | | | | | | | | | | | |
| | | Years Ended May 31, | |
| Class C | | 2019 | | | 2018 | | | 2017 | | | 2016 | | | 2015 | |
| | | |
| Selected Per Share Data | | | | | | | | | | | | | |
| Net asset value, beginning of period | | $ | 8.98 | | | $ | 9.17 | | | $ | 9.42 | | | $ | 9.25 | | | $ | 9.30 | |
| Income from investment operations: | | | | | | | | | | | | | | | | | | | | |
| | | | | |
Net investment income | | | .21 | | | | .21 | | | | .24 | | | | .27 | | | | .29 | |
Net realized and unrealized gain (loss) | | | .23 | | | | (.19 | ) | | | (.25 | ) | | | .17 | | | | (.06 | ) |
Total from investment operations | | | .44 | | | | .02 | | | | (.01 | ) | | | .44 | | | | .23 | |
| Less distributions from: | | | | | | | | | | | | | | | | | | | | |
| | | | | |
Net investment income | | | (.21 | ) | | | (.21 | ) | | | (.24 | ) | | | (.27 | ) | | | (.28 | ) |
Net realized gains | | | (.00 | )* | | | (.00 | )* | | | (.00 | )* | | | (.00 | )* | | | (.00 | )* |
Total distributions | | | (.21 | ) | | | (.21 | ) | | | (.24 | ) | | | (.27 | ) | | | (.28 | ) |
| Net asset value, end of period | | $ | 9.21 | | | $ | 8.98 | | | $ | 9.17 | | | $ | 9.42 | | | $ | 9.25 | |
| Total Return (%)a | | | 5.02 | b | | | .21 | | | | (.08 | ) | | | 4.88 | b | | | 2.53 | b |
|
| Ratios to Average Net Assets and Supplemental Data | |
| Net assets, end of period ($ millions) | | | 151 | | | | 208 | | | | 259 | | | | 292 | | | | 256 | |
| Ratio of expenses before expense reductions (including interest expense) (%)c | | | 1.57 | | | | 1.56 | | | | 1.58 | | | | 1.59 | | | | 1.61 | |
| Ratio of expenses after expense reductions (including interest expense) (%)c | | | 1.56 | | | | 1.56 | | | | 1.58 | | | | 1.59 | | | | 1.60 | |
| Ratio of expenses after expense reductions (excluding interest expense) (%) | | | 1.56 | | | | 1.55 | | | | 1.55 | | | | 1.55 | | | | 1.55 | |
| Ratio of net investment income (%) | | | 2.39 | | | | 2.29 | | | | 2.61 | | | | 2.94 | | | | 3.05 | |
| Portfolio turnover rate (%) | | | 39 | | | | 42 | | | | 38 | | | | 29 | | | | 29 | |
| a | Total return does not reflect the effect of any sales charges. |
| b | Total return would have been lower had certain expenses not been reduced. |
| c | Interest expense represents interest and fees onshort-term floating rate notes issued in conjunction with inverse floating rate securities. Interest income from such transactions is included in income from investment operations. |
| * | Amount is less than $.005. |
The accompanying notes are an integral part of the financial statements.
| | | | | | | | |
| | DWS Managed Municipal Bond Fund | | | | | | 41 | |
| | | | | | | | | | | | | | | | | | | | | | |
| | | Years Ended May 31, | |
| Class S | | 2019 | | | 2018 | | | 2017 | | | 2016 | | | 2015 | |
| | | | |
| Selected Per Share Data | | | | | | | | | | | | | | | | | |
| Net asset value, beginning of period | | $ | 9.00 | | | | $9.18 | | | | $9.44 | | | | $9.26 | | | | $9.31 | |
| Income from investment operations: | | | | | | | | | | | | | | | | | | | | |
| | | | | |
Net investment income | | | .30 | | | | .30 | | | | .33 | | | | .37 | | | | .38 | |
Net realized and unrealized gain (loss) | | | .23 | | | | (.18 | ) | | | (.26 | ) | | | .18 | | | | (.06 | ) |
Total from investment operations | | | .53 | | | | .12 | | | | .07 | | | | .55 | | | | .32 | |
| Less distributions from: | | | | | | | | | | | | | | | | | | | | |
| | | | | |
Net investment income | | | (.30 | ) | | | (.30 | ) | | | (.33 | ) | | | (.37 | ) | | | (.37 | ) |
Net realized gains | | | (.00 | )* | | | (.00 | )* | | | (.00 | )* | | | (.00 | )* | | | (.00 | )* |
Total distributions | | | (.30 | ) | | | (.30 | ) | | | (.33 | ) | | | (.37 | ) | | | (.37 | ) |
| Net asset value, end of period | | $ | 9.23 | | | | $9.00 | | | | $9.18 | | | | $9.44 | | | | $9.26 | |
| Total Return (%)a | | | 6.07 | | | | 1.32 | | | | .81 | | | | 6.03 | | | | 3.55 | |
| |
| Ratios to Average Net Assets and Supplemental Data | | | | | |
| Net assets, end of period ($ millions) | | | 2,283 | | | | 2,670 | | | | 2,918 | | | | 2,940 | | | | 2,873 | |
| Ratio of expenses before expense reductions (including interest expense) (%)b | | | .61 | | | | .62 | | | | .63 | | | | .64 | | | | .64 | |
| Ratio of expenses after expense reductions (including interest expense) (%)b | | | .56 | | | | .58 | | | | .60 | | | | .60 | | | | .60 | |
| Ratio of expenses after expense reductions (excluding interest expense) (%) | | | .56 | | | | .56 | | | | .57 | | | | .56 | | | | .55 | |
| Ratio of net investment income (%) | | | 3.39 | | | | 3.27 | | | | 3.59 | | | | 3.93 | | | | 4.04 | |
| Portfolio turnover rate (%) | | | 39 | | | | 42 | | | | 38 | | | | 29 | | | | 29 | |
| a | Total return would have been lower had certain expenses not been reduced. |
| b | Interest expense represents interest and fees onshort-term floating rate notes issued in conjunction with inverse floating rate securities. Interest income from such transactions is included in income from investment operations. |
| * | Amount is less than $.005. |
The accompanying notes are an integral part of the financial statements.
| | | | | | |
| 42 | | | | | DWS Managed Municipal Bond Fund | | |
| | | | | | | | | | | | | | | | | | | | | | |
| | | Years Ended May 31, | |
| Institutional Class | | 2019 | | | 2018 | | | 2017 | | | 2016 | | | 2015 | |
| | |
| Selected Per Share Data | | | | | | | | | |
| Net asset value, beginning of period | | $ | 8.99 | | | $ | 9.17 | | | $ | 9.42 | | | $ | 9.25 | | | $ | 9.30 | |
| Income from investment operations: | | | | | | | | | | | | | | | | | |
| | | | | |
Net investment income | | | .30 | | | | .30 | | | | .34 | | | | .37 | | | | .38 | |
Net realized and unrealized gain (loss) | | | .23 | | | | (.18 | ) | | | (.26 | ) | | | .17 | | | | (.06 | ) |
Total from investment operations | | | .53 | | | | .12 | | | | .08 | | | | .54 | | | | .32 | |
| Less distributions from: | | | | | | | | | | | | | | | | | | | | |
| | | | | |
Net investment income | | | (.30 | ) | | | (.30 | ) | | | (.33 | ) | | | (.37 | ) | | | (.37 | ) |
Net realized gains | | | (.00 | )* | | | (.00 | )* | | | (.00 | )* | | | (.00 | )* | | | (.00 | )* |
Total distributions | | | (.30 | ) | | | (.30 | ) | | | (.33 | ) | | | (.37 | ) | | | (.37 | ) |
| Net asset value, end of period | | $ | 9.22 | | | $ | 8.99 | | | | $9.17 | | | | $9.42 | | | | $9.25 | |
| Total Return (%) | | | 6.09 | | | | 1.33 | | | | .94 | a | | | 5.96 | | | | 3.57 | |
|
| Ratios to Average Net Assets and Supplemental Data | |
| Net assets, end of period ($ millions) | | | 340 | | | | 241 | | | | 177 | | | | 311 | | | | 100 | |
| Ratio of expenses before expense reductions (including interest expense) (%)b | | | .55 | | | | .56 | | | | .59 | | | | .56 | | | | .58 | |
| Ratio of expenses after expense reductions (including interest expense) (%)b | | | .55 | | | | .56 | | | | .56 | | | | .56 | | | | .58 | |
| Ratio of expenses after expense reductions (excluding interest expense) (%) | | | .55 | | | | .55 | | | | .53 | | | | .52 | | | | .53 | |
| Ratio of net investment income (%) | | | 3.41 | | | | 3.29 | | | | 3.63 | | | | 3.93 | | | | 4.06 | |
| Portfolio turnover rate (%) | | | 39 | | | | 42 | | | | 38 | | | | 29 | | | | 29 | |
| a | Total return would have been lower had certain expenses not been reduced. |
| b | Interest expense represents interest and fees onshort-term floating rate notes issued in conjunction with inverse floating rate securities. Interest income from such transactions is included in income from investment operations. |
| * | Amount is less than $.005. |
The accompanying notes are an integral part of the financial statements.
| | | | | | | | |
| | DWS Managed Municipal Bond Fund | | | | | | 43 | |
| | |
| Notes to Financial Statements | | |
A. Organization and Significant Accounting Policies
DWS Managed Municipal Bond Fund (the “Fund”) is a diversified series of Deutsche DWS Municipal Trust (the “Trust”), which is registered under the Investment Company Act of 1940, as amended (the “1940 Act”), as anopen-end management investment company organized as a Massachusetts business trust.
The Fund offers multiple classes of shares which provide investors with different purchase options. Class A shares are subject to an initial sales charge. Class C shares are not subject to an initial sales charge but are subject to higher ongoing expenses than Class A shares and a contingent deferred sales charge payable upon certain redemptions within one year of purchase. Effective on August 10, 2018, Class C shares automatically convert to Class A shares in the same fund after 10 years, provided that the fund or the financial intermediary through which the shareholder purchased the Class C shares has records verifying that the Class C shares have been held for at least 10 years. Class S shares are not subject to initial or contingent deferred sales charges and are only available to a limited group of investors. Institutional Class shares are not subject to initial or contingent deferred sales charges and are generally available only to qualified institutions.
Investment income, realized and unrealized gains and losses and certainfund-level expenses and expense reductions, if any, are borne pro rata on the basis of relative net assets by the holders of all classes of shares, except that each class bears certain expenses unique to that class such as distribution and services fees, services to shareholders and certain otherclass-specific expenses. Differences inclass-level expenses may result in payment of different per share dividends by class. All shares of the Fund have equal rights with respect to voting subject toclass-specific arrangements.
The Fund’s financial statements are prepared in accordance with accounting principles generally accepted in the United States of America (“U.S. GAAP”) which require the use of management estimates. Actual results could differ from those estimates. The Fund qualifies as an investment company under Topic 946 of Accounting Standards Codification of U.S. GAAP. The policies described below are followed consistently by the Fund in the preparation of its financial statements.
In October 2018, the Securities and Exchange Commission adopted amendments to certain disclosure requirements in Securities Act Release No. 33-10532, Disclosure Update and Simplification, which is intended to facilitate the disclosure of information to investors and simplify compliance without significantly altering the total mix of information
| | | | | | |
| 44 | | | | | DWS Managed Municipal Bond Fund | | |
provided to investors. Effective with the current reporting period, the Fund adopted the amendments with the impacts being that the Fund is no longer required to present components of distributable earnings on the Statement of Assets and Liabilities or the sources of distributable earnings and the amount of undistributed net investment income on the Statements of Changes in Net Assets.
Security Valuation. Investments are stated at value determined as of the close of regular trading on the New York Stock Exchange on each day the exchange is open for trading.
Various inputs are used in determining the value of the Fund’s investments. These inputs are summarized in three broad levels. Level 1 includes quoted prices in active markets for identical securities. Level 2 includes other significant observable inputs (including quoted prices for similar securities, interest rates, prepayment speeds and credit risk). Level 3 includes significant unobservable inputs (including the Fund’s own assumptions in determining the fair value of investments). The level assigned to the securities valuations may not be an indication of the risk or liquidity associated with investing in those securities.
Municipal debt securities are valued at prices supplied by independent pricing services approved by the Fund’s Board whose valuations are intended to reflect the mean between the bid and asked prices. Such services may use various pricing techniques which take into account appropriate factors such as yield, quality, coupon rate, maturity, type of issue, trading characteristics and other data, as well as broker quotes. If the pricing services are unable to provide valuations, the securities are valued at the average of the most recent reliable bid and quotations or evaluated prices, as applicable, obtained frombroker-dealers. These securities are generally categorized as Level 2.
Investments in open-end investment companies are valued at their net asset value each business day and are categorized as Level 1.
Securities and other assets for which market quotations are not readily available or for which the above valuation procedures are deemed not to reflect fair value are valued in a manner that is intended to reflect their fair value as determined in accordance with procedures approved by the Board and are generally categorized as Level 3. In accordance with the Fund’s valuation procedures, factors considered in determining value may include, but are not limited to, the type of the security; the size of the holding; the initial cost of the security; the existence of any contractual restrictions on the security’s disposition; the price and extent of public trading in similar securities of the issuer or of comparable companies; quotations or evaluated prices frombroker-dealers and/or pricing services; information obtained from the issuer, analysts, and/or the appropriate stock exchange (forexchange-traded securities); an analysis of the
| | | | | | | | |
| | DWS Managed Municipal Bond Fund | | | | | | 45 | |
company’s or issuer’s financial statements; an evaluation of the forces that influence the issuer and the market(s) in which the security is purchased and sold; and with respect to debt securities, the maturity, coupon, creditworthiness, currency denomination and the movement of the market in which the security is normally traded. The value determined under these procedures may differ from published values for the same securities.
Disclosure about the classification of fair value measurements is included in a table following the Fund’s Investment Portfolio.
Inverse Floaters. The Fund invests in inverse floaters. Inverse floaters are debt instruments with a weekly floating rate of interest that bears an inverse relationship to changes in theshort-term interest rate market. Inverse floaters are created by depositing afixed-ratelong-term municipal bond into a special purpose Tender Offer Bond trust (the “TOB Trust”). In turn the TOB Trust issues ashort-term floating rate note and an inverse floater. Theshort-term floating rate note is issued in a face amount equal to some fraction of the underlying bond’s par amount and is sold to a third party, usually atax-exempt money market fund. The Fund receives the proceeds from the sale of theshort-term floating rate note and uses the cash proceeds to make additional investments. Theshort-term floating rate note represents leverage to the Fund. The Fund, as the holder of the inverse floater, has full exposure to any increase or decrease in the value of the underlying bond. The income stream from the underlying bond in the TOB Trust is divided between the floating rate note and the inverse floater. The inverse floater earns all of the interest from the underlyinglong-termfixed-rate bond less the amount of interest paid on the floating rate note and the expenses of the TOB Trust. The floating rate notes issued by the TOB Trust are valued at cost, which approximates fair value.
By holding the inverse floater, the Fund has the right to collapse the TOB Trust by causing the holders of the floating rate instrument to tender their notes at par and have the broker transfer the underlying bond to the Fund. The floating rate note holder can also elect to tender the note for redemption at par at each reset date. The Fund accounts for these transactions as a form of secured borrowing, by reflecting the value of the underlying bond in the investments of the Fund and the amount owed to the floating rate note holder as a liability under the caption “Payable for floating rate notes issued” in the Statement of Assets and Liabilities. Income earned on the underlying bond is included in interest income, and interest paid on the floaters and the expenses of the TOB Trust are included in “Interest expense and fees on floating rate notes issued” in the Statement of Operations. The weighted average outstanding daily balance of the floating rate notes issued during the year ended May 31, 2019 was approximately $5,000,000, with a weighted average interest rate of 2.22%.
| | | | | | |
| 46 | | | | | DWS Managed Municipal Bond Fund | | |
The Fund may enter into shortfall and forbearance agreements by which the Fund agrees to reimburse the TOB Trust, in certain circumstances, for the difference between the liquidation value of the underlying bond held by the TOB Trust and the liquidation value of the floating rate notes plus any shortfalls in interest cash flows. This could potentially expose the Fund to losses in excess of the value of the Fund’s inverse floater investments. In addition, the value of inverse floaters may decrease significantly when interest rates increase. The market for inverse floaters may be more volatile and less liquid than other municipal bonds of comparable maturity. The TOB Trust could be terminated outside of the Fund’s control, resulting in a reduction of leverage and disposal of portfolio investments at inopportune times and prices. Investments in inverse floaters generally involve greater risk than in an investment infixed-rate bonds.
The final rules implementing Section 619 of the Dodd-Frank Wall Street Reform and Consumer Protection Act (the “Volcker Rule”) preclude banking entities from sponsoring and/or providing services to existing TOB Trusts. In response to these rules, investment market participants have, developed TOB Trust structures that are designed to ensure that banking entities do not sponsor TOB Trusts in violation of the Volcker Rule. All Fund TOB Trusts are structured to be in compliance with the Volcker Rule. A Volcker-compliant TOB Trust structure is similar to pre-Volker TOB Trust structures. The ultimate impact of the Volker Rule on the inverse floater market and the municipal market generally is not yet certain. Such changes could make early unwinds of TOB Trusts more likely, may make the use of TOB Trusts more expensive, and may make it more difficult to use TOB Trusts in general. The new rules may also expose the Fund to additional risks, including, but not limited to, compliance, securities law and operational risks.
Federal Income Taxes. The Fund’s policy is to comply with the requirements of the Internal Revenue Code, as amended, which are applicable to regulated investment companies, and to distribute all of its taxable andtax-exempt income to its shareholders.
At May 31, 2019, the Fund had a net tax basis capital loss carryforward of approximately $6,435,000 ofshort-term losses, which may be applied against realized net taxable capital gains indefinitely.
The Fund has reviewed the tax positions for the open tax years as of May 31, 2019 and has determined that no provision for income tax and/or uncertain tax positions is required in the Fund’s financial statements. The Fund’s federal tax returns for the prior three fiscal years remain open subject to examination by the Internal Revenue Service.
| | | | | | | | |
| | DWS Managed Municipal Bond Fund | | | | | | 47 | |
Distribution of Income and Gains. Net investment income of the Fund is declared as a daily dividend and is distributed to shareholders monthly. Net realized gains from investment transactions, in excess of available capital loss carryforwards, would be taxable to the Fund if not distributed, and, therefore, will be distributed to shareholders at least annually. The Fund may also make additional distributions for tax purposes if necessary.
The timing and characterization of certain income and capital gain distributions are determined annually in accordance with federal tax regulations which may differ from accounting principles generally accepted in the United States of America. These differences primarily relate to investments in inverse floater transactions, certain securities sold at a loss and accretion of market discount on debt securities. As a result, net investment income (loss) and net realized gain (loss) on investment transactions for a reporting period may differ significantly from distributions during such period. Accordingly, the Fund may periodically make reclassifications among certain of its capital accounts without impacting the net asset value of the Fund.
At May 31, 2019, the Fund's components of distributable earnings (accumulated losses) on a tax basis were as follows:
| | | | |
| Undistributed tax-exempt income | | $ | 4,386,786 | |
| Undistributed ordinary income* | | $ | 61,805 | |
| Capital loss carryforward | | $ | (6,435,000 | ) |
| Net unrealized appreciation (depreciation) on investments | | $ | 299,558,042 | |
At May 31, 2019, the aggregate cost of investments for federal income tax purposes was $3,745,409,991. The net unrealized appreciation for all investments based on tax cost was $299,558,042. This consisted of aggregate gross unrealized appreciation for all investments in which there was an excess of value over tax cost of $309,097,334 and aggregate gross unrealized depreciation for all investments in which there was an excess of tax cost over value of $9,539,292.
In addition, the tax character of distributions paid to shareholders by the Fund is summarized as follows:
| | | | | | | | |
| | | Years Ended May 31, | |
| | | 2019 | | | 2018 | |
| Distributions from tax-exempt income | | $ | 137,978,108 | | | $ | 154,177,876 | |
| Distributions from ordinary income* | | $ | 372,073 | | | $ | 1,735,589 | |
| * | For tax purposes, short-term capital gain distributions are considered ordinary income distributions. |
Expenses. Expenses of the Trust arising in connection with a specific fund are allocated to that fund. Other Trust expenses which cannot be directly
| | | | | | |
| 48 | | | | | DWS Managed Municipal Bond Fund | | |
attributed to a fund are apportioned among the funds in the Trust based upon the relative net assets or other appropriate measures.
Contingencies. In the normal course of business, the Fund may enter into contracts with service providers that contain general indemnification clauses. The Fund’s maximum exposure under these arrangements is unknown, as this would involve future claims that may be made against the Fund that have not yet been made. However, based on experience, the Fund expects the risk of loss to be remote.
Other. Investment transactions are accounted for on a trade date plus one basis for daily net asset value calculations. However, for financial reporting purposes, investment transactions are reported on trade date. Interest income is recorded on the accrual basis. Realized gains and losses from investment transactions are recorded on an identified cost basis. All premiums and discounts are amortized/accreted for financial reporting purposes, with the exception of securities in default of principal.
B. Purchases and Sales of Securities
During the year ended May 31, 2019, purchases and sales of investment securities (excludingshort-term investments) aggregated $1,648,832,480 and $2,311,601,874, respectively.
C. Related Parties
Management Agreement. Under the Investment Management Agreement with DWS Investment Management Americas, Inc. (“DIMA” or the “Advisor”), an indirect, wholly owned subsidiary of DWS Group GmbH & Co. KGaA (“DWS Group”), the Advisor directs the investments of the Fund in accordance with its investment objectives, policies and restrictions. The Advisor determines the securities, instruments and other contracts relating to investments to be purchased, sold or entered into by the Fund.
Under the Investment Management Agreement with the Advisor, the Fund pays a monthly management fee based on the Fund’s average daily
| | | | | | | | |
| | DWS Managed Municipal Bond Fund | | | | | | 49 | |
net assets, computed and accrued daily and payable monthly, at the following annual rates:
| | | | |
| First $250 million of the Fund’s average daily net assets | | | .365% | |
| Next $750 million of such net assets | | | .345% | |
| Next $1.5 billion of such net assets | | | .325% | |
| Next $2.5 billion of such net assets | | | .315% | |
| Next $2.5 billion of such net assets | | | .295% | |
| Next $2.5 billion of such net assets | | | .275% | |
| Next $2.5 billion of such net assets | | | .255% | |
| Over $12.5 billion of such net assets | | | .235% | |
Accordingly, for year ended May 31, 2019, the fee pursuant to the Investment Management Agreement was equivalent to an annual rate (exclusive of any applicable waivers/reimbursements) of 0.33% of the Fund’s average daily net assets.
For the period from June 1, 2018 through September 30, 2019, the Advisor has contractually agreed to waive its fees and/or reimburse certain operating expenses of the Fund to the extent necessary to maintain the total annual operating expenses (excluding certain expenses such as extraordinary expenses, taxes, brokerage and interest) of certain classes as follows:
| | | | |
| Class A | | | .81% | |
| Class C | | | 1.56% | |
| Class S | | | .56% | |
| Institutional Class | | | .56% | |
For the year ended May 31, 2019, fees waived and/or expenses reimbursed for each class are as follows:
| | | | |
| Class C | | $ | 11,434 | |
| Class S | | | 1,162,129 | |
| | | $ | 1,173,563 | |
Administration Fee. Pursuant to an Administrative Services Agreement, DIMA provides most administrative services to the Fund. For all services provided under the Administrative Services Agreement, the Fund pays the Advisor an annual fee (“Administration Fee”) of 0.10% of the Fund’s average daily net assets, computed and accrued daily and payable monthly. For the year ended May 31, 2019, the Administration Fee was $4,234,701, of which $346,109 is unpaid.
Service Provider Fees. DWS Service Company (“DSC”), an affiliate of the Advisor, is the transfer agent,dividend-paying agent and shareholder
| | | | | | |
| 50 | | | | | DWS Managed Municipal Bond Fund | | |
service agent of the Fund. Pursuant to asub-transfer agency agreement between DSC and DST Systems, Inc. (“DST”), DSC has delegated certain transfer agent,dividend-paying agent and shareholder service agent functions to DST. DSC compensates DST out of the shareholder servicing fee it receives from the Fund. For the year ended May 31, 2019, the amounts charged to the Fund by DSC were as follows:
| | | | | | | | |
| Services to Shareholders | | Total
Aggregated | | | Unpaid at
May 31, 2019 | |
| Class A | | $ | 133,808 | | | $ | 21,661 | |
| Class C | | | 5,966 | | | | 908 | |
| Class S | | | 280,365 | | | | 45,343 | |
| Institutional Class | | | 7,537 | | | | 1,335 | |
| | | $ | 427,676 | | | $ | 69,247 | |
In addition, for the year ended May 31, 2019, the amounts charged to the Fund for recordkeeping and other administrative services provided by unaffiliated third parties, included in the Statement of Operations under “Services to shareholders,” were as follows:
| | | | |
| Sub-Recordkeeping | | Total
Aggregated | |
| Class A | | $ | 890,757 | |
| Class C | | | 188,283 | |
| Class S | | | 3,424,811 | |
| Institutional Class | | | 286,424 | |
| | | $ | 4,790,275 | |
Distribution and Service Fees. Under the Fund’s Class C12b-1 Plan, DWS Distributors, Inc. (“DDI”), an affiliate of the Advisor, receives a fee (“Distribution Fee”) of 0.75% of average daily net assets of Class C shares. In accordance with the Fund’s Underwriting and Distribution Services Agreement, DDI enters into related selling group agreements with various firms at various rates for sales of Class C shares. For the year ended May 31, 2019, the Distribution Fee was as follows:
| | | | | | | | |
| Distribution Fee | | Total
Aggregated | | | Unpaid at
May 31, 2019 | |
| Class C | | $ | 1,286,959 | | | $ | 96,287 | |
In addition, DDI provides information and administrative services for a fee (“Service Fee”) to Class A and C shareholders at an annual rate of up to 0.25% of average daily net assets for each such class. DDI in turn has various agreements with financial services firms that provide these services and pays these fees based upon the assets of shareholder
| | | | | | | | |
| | DWS Managed Municipal Bond Fund | | | | | | 51 | |
accounts the firms service. For the year ended May 31, 2019, the Service Fee was as follows:
| | | | | | | | | | | | |
| Service Fee | | Total
Aggregated | | | Unpaid at
May 31, 2019 | | | Annual
Rate | |
| Class A | | $ | 3,296,484 | | | $ | 543,771 | | | | .24 | % |
| Class C | | | 428,877 | | | | 64,998 | | | | .25 | % |
| | | $ | 3,725,361 | | | $ | 608,769 | | | | | |
Underwriting Agreement and Contingent Deferred Sales Charge. DDI is the principal underwriter for the Fund. Underwriting commissions paid to DDI in connection with the distribution of Class A shares for the year ended May 31, 2019 aggregated $41,081.
In addition, DDI receives any contingent deferred sales charge (“CDSC”) from Class C share redemptions occurring within one year of purchase. There is no such charge upon redemption of any share appreciation or reinvested dividends. The CDSC is 1% of the value of the shares redeemed for Class C. For the year ended May 31, 2019, the CDSC for Class C shares aggregated $8,636. A deferred sales charge of up to 0.50% is assessed on certain redemptions of Class A shares. For the year ended May 31, 2019, DDI received $41,963 for Class A shares.
Typesetting and Filing Service Fees. Under an agreement with the Fund, DIMA is compensated for providing certain pre-press and regulatory filing services to the Fund. For the year ended May 31, 2019, the amount charged to the Fund by DIMA included in the Statement of Operations under “Reports to shareholders” aggregated $23,725, of which $10,228 is unpaid.
Trustees’ Fees and Expenses. The Fund paid retainer fees to each Trustee not affiliated with the Advisor, plus specified amounts to the Board Chairperson and to each committee Chairperson.
Transactions with Affiliates. The Fund may purchase securities from, or sell securities to, an affiliated fund provided the affiliation is solely due to having a common investment adviser, common officers, or common trustees. During the year ended May 31, 2019, the Fund engaged in securities purchases of $355,615,000 and securities sales of $332,830,801 with an affiliated fund in compliance with Rule17a-7 under the 1940 Act.
D. Line of Credit
The Fund and other affiliated funds (the “Participants”) share in a $400 million revolving credit facility provided by a syndication of banks. The Fund may borrow for temporary or emergency purposes, including the meeting of redemption requests that otherwise might require the
| | | | | | |
| 52 | | | | | DWS Managed Municipal Bond Fund | | |
untimely disposition of securities. The Participants are charged an annual commitment fee which is allocated based on net assets, among each of the Participants. Interest is calculated at a rate per annum equal to the sum of the Federal Funds Rate plus 1.25 percent plus, if theone-month LIBOR exceeds the Federal Funds Rate, the amount of such excess. The Fund may borrow up to a maximum of 33 percent of its net assets under the agreement.
At May 31, 2019, the Fund had a $950,000 outstanding loan. Interest expense incurred on the borrowings was $23,612 for the year ended May 31, 2019. The average dollar amount of the borrowings was $4,795,098, the weighted average interest rate on these borrowings was 3.52%, and the Fund had a loan outstanding for fifty-one days throughout the period. The borrowings were valued at cost, which approximates fair value.
E. Fund Share Transactions
The following table summarizes share and dollar activity in the Fund:
| | | | | | | | | | | | | | | | |
| | | Year Ended May 31, 2019 | | | Year Ended May 31, 2018 | |
| | | Shares | | | Dollars | | | Shares | | | Dollars | |
| | | | |
| Shares sold | | | | | | | | | | | | | | | | |
| Class A | | | 9,406,369 | | | $ | 84,093,618 | | | | 11,581,014 | | | $ | 105,694,194 | |
| Class C | | | 1,168,613 | | | | 10,439,174 | | | | 1,891,047 | | | | 17,252,504 | |
| Class S | | | 57,523,593 | | | | 510,074,022 | | | | 51,948,467 | | | | 472,957,929 | |
| Institutional Class | | | 28,883,513 | | | | 258,538,632 | | | | 16,835,394 | | | | 153,332,756 | |
| | | | | | | $ | 863,145,446 | | | | | | | $ | 749,237,383 | |
|
| Shares issued to shareholders in reinvestment of distributions | |
| Class A | | | 4,333,283 | | | $ | 38,742,246 | | | | 4,887,379 | | | $ | 44,429,439 | |
| Class C | | | 401,147 | | | | 3,585,143 | | | | 519,082 | | | | 4,720,141 | |
| Class S | | | 7,695,155 | | | | 68,889,694 | | | | 8,679,398 | | | | 78,978,805 | |
| Institutional Class | | | 1,142,303 | | | | 10,217,535 | | | | 793,204 | | | | 7,200,505 | |
| | | | | | | $ | 121,434,618 | | | | | | | $ | 135,328,890 | |
|
| Shares redeemed | |
| Class A | | | (38,754,403 | ) | | $ | (346,140,282 | ) | | | (33,316,866 | ) | | $ | (302,622,009 | ) |
| Class C | | | (8,358,251 | ) | | | (74,554,826 | ) | | | (7,452,881 | ) | | | (67,722,302 | ) |
| Class S | | | (114,500,638 | ) | | | (1,018,422,284 | ) | | | (81,597,979 | ) | | | (740,714,830 | ) |
| Institutional Class | | | (19,985,283 | ) | | | (177,663,684 | ) | | | (10,048,963 | ) | | | (91,140,045 | ) |
| | | | | | | $ | (1,616,781,076 | ) | | | | | | $ | (1,202,199,186 | ) |
| | | | | | | | |
| | DWS Managed Municipal Bond Fund | | | | | | 53 | |
| | | | | | | | | | | | | | | | |
| | | Year Ended May 31, 2019 | | | Year Ended May 31, 2018 | |
| | | Shares | | | Dollars | | | Shares | | | Dollars | |
|
| Net increase (decrease) | |
| Class A | | | (25,014,751 | ) | | $ | (223,304,418 | ) | | | (16,848,473 | ) | | $ | (152,498,376 | ) |
| Class C | | | (6,788,491 | ) | | | (60,530,509 | ) | | | (5,042,752 | ) | | | (45,749,657 | ) |
| Class S | | | (49,281,890 | ) | | | (439,458,568 | ) | | | (20,970,114 | ) | | | (188,778,096 | ) |
| Institutional Class | | | 10,040,533 | | | | 91,092,483 | | | | 7,579,635 | | | | 69,393,216 | |
| | | | | | | $ | (632,201,012 | ) | | | | | | $ | (317,632,913 | ) |
| | | | | | |
| 54 | | | | | DWS Managed Municipal Bond Fund | | |
Report of Independent Registered
Public Accounting Firm
To the Board of Trustees of Deutsche DWS Municipal Trust and Shareholders of DWS Managed Municipal Bond Fund:
Opinion on the Financial Statements
We have audited the accompanying statement of assets and liabilities of DWS Managed Municipal Bond Fund (the “Fund”) (one of the funds constituting Deutsche DWS Municipal Trust) (the “Trust”), including the investment portfolio, as of May 31, 2019, and the related statements of operations and changes in net assets and the financial highlights for the year then ended and the related notes (collectively referred to as the “financial statements”). In our opinion, the financial statements present fairly, in all material respects, the financial position of the Fund (one of the funds constituting Deutsche DWS Municipal Trust) at May 31, 2019, the results of its operations, the changes in its net assets, and its financial highlights for the year then ended in conformity with U.S. generally accepted accounting principles.
The statement of changes in net assets for the year ended May 31, 2018, and the financial highlights for the years ended May 31, 2015, May 31, 2016, May 31, 2017 and May 31, 2018, were audited by another independent registered public accounting firm whose report, dated July 24, 2018, expressed an unqualified opinion on that statement of changes in net assets and those financial highlights.
Basis for Opinion
These financial statements are the responsibility of the Trust’s management. Our responsibility is to express an opinion on the Fund’s financial statements based on our audit. We are a public accounting firm registered with the Public Company Accounting Oversight Board (United States) (“PCAOB”) and are required to be independent with respect to the Trust in accordance with the U.S. federal securities laws and the applicable rules and regulations of the Securities and Exchange Commission and the PCAOB.
We conducted our audit in accordance with the standards of the PCAOB. Those standards require that we plan and perform the audit to obtain reasonable assurance about whether the financial statements are free of
| | | | | | | | |
| | DWS Managed Municipal Bond Fund | | | | | | 55 | |
material misstatement, whether due to error or fraud. The Trust is not required to have, nor were we engaged to perform, an audit of the Trust’s internal control over financial reporting. As part of our audit, we are required to obtain an understanding of internal control over financial reporting, but not for the purpose of expressing an opinion on the effectiveness of the Trust’s internal control over financial reporting. Accordingly, we express no such opinion.
Our audit included performing procedures to assess the risks of material misstatement of the financial statements, whether due to error or fraud, and performing procedures that respond to those risks. Such procedures included examining, on a test basis, evidence regarding the amounts and disclosures in the financial statements. Our procedures included confirmation of securities owned as of May 31, 2019, by correspondence with the custodian and others or by other appropriate auditing procedures where replies from others were not received. Our audit also included evaluating the accounting principles used and significant estimates made by management, as well as evaluating the overall presentation of the financial statements. We believe that our audit provides a reasonable basis for our opinion.

We have served as the auditor of one or more investment companies in the DWS family of funds since at least 1979, but we are unable to determine the specific year.
Boston, Massachusetts
July 25, 2019
| | | | | | |
| 56 | | | | | DWS Managed Municipal Bond Fund | | |
Information About Your Fund’s Expenses
As an investor of the Fund, you incur two types of costs: ongoing expenses and transaction costs. Ongoing expenses include management fees, distribution and service(12b-1) fees and other Fund expenses. Examples of transaction costs include sales charges (loads) and account maintenance fees, which are not shown in this section. The following tables are intended to help you understand your ongoing expenses (in dollars) of investing in the Fund and to help you compare these expenses with the ongoing expenses of investing in other mutual funds. In the most recentsix-month period, Class S shares limited these expenses; had they not done so, expenses would have been higher. The example in the table is based on an investment of $1,000 invested at the beginning of thesix-month period and held for the entire period (December 1, 2018 to May 31, 2019).
The tables illustrate your Fund’s expenses in two ways:
| – | Actual Fund Return. This helps you estimate the actual dollar amount of ongoing expenses (but not transaction costs) paid on a $1,000 investment in the Fund using the Fund’s actual return during the period. To estimate the expenses you paid over the period, simply divide your account value by $1,000 (for example, an $8,600 account value divided by $1,000 = 8.6), then multiply the result by the number in the “Expenses Paid per $1,000” line under the share class you hold. |
| – | Hypothetical 5% Fund Return. This helps you to compare your Fund’s ongoing expenses (but not transaction costs) with those of other mutual funds using the Fund’s actual expense ratio and a hypothetical rate of return of 5% per year before expenses. Examples using a 5% hypothetical fund return may be found in the shareholder reports of other mutual funds. The hypothetical account values and expenses may not be used to estimate the actual ending account balance or expenses you paid for the period. |
Please note that the expenses shown in these tables are meant to highlight your ongoing expenses only and do not reflect any transaction costs. The “Expenses Paid per $1,000” line of the tables is useful in comparing ongoing expenses only and will not help you determine the relative total expense of owning different funds. Subject to certain exceptions, an account maintenance fee of $20.00 assessed once per calendar year for Classes A, C and S shares may apply for accounts with balances less than $10,000. This fee is not included in these tables. If it was, the estimate of expenses paid for Classes A, C and S shares during the period would be higher, and account value during the period would be lower, by this amount.
| | | | | | | | |
| | DWS Managed Municipal Bond Fund | | | | | | 57 | |
| | | | | | | | | | | | | | | | |
Expenses and Value of a $1,000 Investment
for the six months ended May 31, 2019 (Unaudited) | | | | |
| | | | |
| Actual Fund Return | | Class A | | | Class C | | | Class S | | | Institutional
Class | |
| Beginning Account Value 12/1/18 | | $ | 1,000.00 | | | $ | 1,000.00 | | | $ | 1,000.00 | | | $ | 1,000.00 | |
| Ending Account Value 5/31/19 | | $ | 1,061.10 | | | $ | 1,058.10 | | | $ | 1,063.20 | | | $ | 1,063.30 | |
| Expenses Paid per $1,000* | | $ | 3.96 | | | $ | 8.00 | | | $ | 2.88 | | | $ | 2.93 | |
| | | | |
| Hypothetical 5% Fund Return | | Class A | | | Class C | | | Class S | | | Institutional
Class | |
| Beginning Account Value 12/1/18 | | $ | 1,000.00 | | | $ | 1,000.00 | | | $ | 1,000.00 | | | $ | 1,000.00 | |
| Ending Account Value 5/31/19 | | $ | 1,021.09 | | | $ | 1,017.15 | | | $ | 1,022.14 | | | $ | 1,022.09 | |
| Expenses Paid per $1,000* | | $ | 3.88 | | | $ | 7.85 | | | $ | 2.82 | | | $ | 2.87 | |
| * | Expenses are equal to the Fund’s annualized expense ratio for each share class, multiplied by the average account value over the period, multiplied by 182 (the number of days in the most recentsix-month period), then divided by 365. |
| | | | | | | | | | | | | | | | |
| Annualized Expense Ratios | | Class A | | | Class C | | | Class S | | | Institutional
Class | |
| DWS Managed Municipal Bond Fund | | | .77 | % | | | 1.56 | % | | | .56 | % | | | .57 | % |
For more information, please refer to the Fund’s prospectus.
For an analysis of the fees associated with an investment in the Fund or similar funds, please refer to tools.finra.org/fund_analyzer/.
| | |
| Tax Information | | (Unaudited) |
Of the dividends paid from net investment income for the taxable year ended May 31, 2019, 100% are designated as exempt interest dividends for federal income tax purposes.
Please consult a tax advisor if you have questions about federal or state income tax laws, or on how to prepare your tax returns. If you have specific questions about your account, please call (800) 728-3337.
| | | | | | |
| 58 | | | | | DWS Managed Municipal Bond Fund | | |
Advisory Agreement Board Considerations and Fee Evaluation
The Board of Trustees (hereinafter referred to as the “Board” or “Trustees”) approved the renewal of DWS Managed Municipal Bond Fund’s (the “Fund”) investment management agreement (the “Agreement”) with DWS Investment Management Americas, Inc. (“DIMA”) in September 2018.
In terms of the process that the Board followed prior to approving the Agreement, shareholders should know that:
| – | During the entire process, all of the Fund’s Trustees were independent of DIMA and its affiliates (the “Independent Trustees”). |
| – | The Board met frequently during the past year to discuss fund matters and dedicated a substantial amount of time to contract review matters. Over the course of several months, the Board’s Contract Committee reviewed extensive materials received from DIMA, independent third parties and independent counsel. These materials included an analysis of the Fund’s performance, fees and expenses, and profitability from a fee consultant retained by the Fund’s Independent Trustees (the “Fee Consultant”). Based on its evaluation of the information provided, the Contract Committee presented its findings and recommendations to the Board. The Board then reviewed the Contract Committee’s findings and recommendations. |
| – | The Board also received extensive information throughout the year regarding performance of the Fund. |
| – | The Independent Trustees regularly met privately with counsel to discuss contract review and other matters. In addition, the Independent Trustees were advised by the Fee Consultant in the course of their review of the Fund’s contractual arrangements and considered a comprehensive report prepared by the Fee Consultant in connection with their deliberations. |
| – | In connection with reviewing the Agreement, the Board also reviewed the terms of the Fund’s Rule12b-1 plan, distribution agreement, administrative services agreement, transfer agency agreement and other material service agreements. |
In connection with the contract review process, the Contract Committee and the Board considered the factors discussed below, among others. The Board also considered that DIMA and its predecessors have managed the Fund since its inception, and the Board believes that a long-term relationship with a capable, conscientious advisor is in the best interests of the Fund. The Board considered, generally, that shareholders chose to
| | | | | | | | |
| | DWS Managed Municipal Bond Fund | | | | | | 59 | |
invest or remain invested in the Fund knowing that DIMA managed the Fund. DIMA is part of DWS Group GmbH & Co. KGaA (“DWS Group”). DWS Group is a global asset management business that offers a wide range of investing expertise and resources, including research capabilities in many countries throughout the world. In 2018, approximately 20% of DWS Group’s shares were sold in an initial public offering, with Deutsche Bank AG owning the remaining shares.
As part of the contract review process, the Board carefully considered the fees and expenses of each DWS fund overseen by the Board in light of the fund’s performance. In many cases, this led to the negotiation and implementation of expense caps. As part of these negotiations, the Board indicated that it would consider relaxing these caps in future years following sustained improvements in performance, among other considerations.
While shareholders may focus primarily on fund performance and fees, the Fund’s Board considers these and many other factors, including the quality and integrity of DIMA’s personnel and administrative support services provided by DIMA, such as back-office operations, fund valuations, and compliance policies and procedures.
Nature, Quality and Extent of Services. The Board considered the terms of the Agreement, including the scope of advisory services provided under the Agreement. The Board noted that, under the Agreement, DIMA provides portfolio management services to the Fund and that, pursuant to a separate administrative services agreement, DIMA provides administrative services to the Fund. The Board considered the experience and skills of senior management and investment personnel and the resources made available to such personnel. The Board reviewed the Fund’s performance over short-term and long-term periods and compared those returns to various agreed-upon performance measures, including market index(es) and a peer universe compiled using information supplied by Morningstar Direct (“Morningstar”), an independent fund data service. The Board also noted that it has put into place a process of identifying “Funds in Review” (e.g., funds performing poorly relative to a peer universe), and receives additional reporting from DIMA regarding such funds and, where appropriate, DIMA’s plans to address underperformance. The Board believes this process is an effective manner of identifying and addressing underperforming funds. Based on the information provided, the Board noted that, for theone-, three- and five-year periods ended December 31, 2017, the Fund’s performance (Class A shares) was in the 3rd quartile, 4th quartile and 3rd quartile, respectively, of the applicable Morningstar universe (the 1st quartile being the best performers and the 4th quartile being the worst performers). The Board also observed that the Fund has underperformed its benchmark in theone-, three- and five-year periods ended December 31, 2017. The
| | | | | | |
| 60 | | | | | DWS Managed Municipal Bond Fund | | |
Board noted the disappointing investment performance of the Fund in recent periods and continued to discuss with senior management of DIMA the factors contributing to such underperformance and actions being taken to improve performance. The Board recognized the efforts by DIMA in recent years to enhance its investment platform and improve long-term performance across the DWS fund complex.
Fees and Expenses. The Board considered the Fund’s investment management fee schedule, operating expenses and total expense ratios, and comparative information provided by Broadridge Financial Solutions, Inc. (“Broadridge”) and the Fee Consultant regarding investment management fee rates paid to other investment advisors by similar funds (1st quartile being the most favorable and 4th quartile being the least favorable). With respect to management fees paid to other investment advisors by similar funds, the Board noted that the contractual fee rates paid by the Fund, which include a 0.10% fee paid to DIMA under the Fund’s administrative services agreement, were higher than the median (3rd quartile) of the applicable Broadridge peer group (based on Broadridge data provided as of December 31, 2017). The Board noted that the Fund’s Class A shares total (net) operating expenses (excluding12b-1 fees) were expected to be lower than the median (2nd quartile) of the applicable Broadridge expense universe (based on Broadridge data provided as of December 31, 2017, and analyzing Broadridge expense universe Class A (net) expenses less any applicable12b-1 fees) (“Broadridge Universe Expenses”). The Board also reviewed data comparing each share class’s total (net) operating expenses to the applicable Broadridge Universe Expenses. The Board noted that the expense limitations agreed to by DIMA were expected to help the Fund’s total (net) operating expenses remain competitive. The Board considered the Fund’s management fee rate as compared to fees charged by DIMA to comparable DWS U.S. registered funds (“DWS Funds”) and considered differences between the Fund and the comparable DWS Funds. The information requested by the Board as part of its review of fees and expenses also included information about institutional accounts (including anysub-advised funds and accounts) and funds offered primarily to European investors (“DWS Europe Funds”) managed by DWS Group. The Board noted that DIMA indicated that DWS Group does not manage any institutional accounts or DWS Europe Funds comparable to the Fund.
On the basis of the information provided, the Board concluded that management fees were reasonable and appropriate in light of the nature, quality and extent of services provided by DIMA.
Profitability. The Board reviewed detailed information regarding revenues received by DIMA under the Agreement. The Board considered the estimated costs to DIMA, andpre-tax profits realized by DIMA, from
| | | | | | | | |
| | DWS Managed Municipal Bond Fund | | | | | | 61 | |
advising the DWS Funds, as well as estimates of thepre-tax profits attributable to managing the Fund in particular. The Board also received information regarding the estimated enterprise-wide profitability of DIMA and its affiliates with respect to all fund services in totality and by fund. The Board and the Fee Consultant reviewed DIMA’s methodology in allocating its costs to the management of the Fund. Based on the information provided, the Board concluded that thepre-tax profits realized by DIMA in connection with the management of the Fund were not unreasonable. The Board also reviewed certain publicly available information regarding the profitability of certain similar investment management firms. The Board noted that, while information regarding the profitability of such firms is limited (and in some cases is not necessarily prepared on a comparable basis), DIMA and its affiliates’ overall profitability with respect to the DWS Funds (after taking into account distribution and other services provided to the funds by DIMA and its affiliates) was lower than the overall profitability levels of most comparable firms for which such data was available.
Economies of Scale. The Board considered whether there are economies of scale with respect to the management of the Fund and whether the Fund benefits from any economies of scale. The Board noted that the Fund’s investment management fee schedule includes fee breakpoints. The Board concluded that the Fund’s fee schedule represents an appropriate sharing between the Fund and DIMA of such economies of scale as may exist in the management of the Fund at current asset levels.
Other Benefits to DIMA and Its Affiliates. The Board also considered the character and amount of other incidental or“fall-out” benefits received by DIMA and its affiliates, including any fees received by DIMA for administrative services provided to the Fund, any fees received by an affiliate of DIMA for transfer agency services provided to the Fund and any fees received by an affiliate of DIMA for distribution services. The Board also considered benefits to DIMA related to brokerage and soft-dollar allocations, including allocating brokerage to pay for research generated by parties other than the executing broker dealers, which pertain primarily to funds investing in equity securities. In addition, the Board considered the incidental public relations benefits to DIMA related to DWS Funds advertising and cross-selling opportunities among DIMA products and services. The Board considered these benefits in reaching its conclusion that the Fund’s management fees were reasonable.
Compliance. The Board considered the significant attention and resources dedicated by DIMA to its compliance processes in recent years. The Board noted in particular (i) the experience, seniority and time commitment of the individuals serving as DIMA’s and the Fund’s chief compliance officers and (ii) the substantial commitment of resources by
| | | | | | |
| 62 | | | | | DWS Managed Municipal Bond Fund | | |
DIMA and its affiliates to compliance matters, including the retention of compliance personnel.
Based on all of the information considered and the conclusions reached, the Board unanimously determined that the continuation of the Agreement is in the best interests of the Fund. In making this determination, the Board did not give particular weight to any single factor identified above. The Board considered these factors over the course of numerous meetings, certain of which were in executive session with only the Independent Trustees and counsel present. It is possible that individual Independent Trustees may have weighed these factors differently in reaching their individual decisions to approve the continuation of the Agreement.
| | | | | | | | |
| | DWS Managed Municipal Bond Fund | | | | | | 63 | |
Board Members and Officers
The following table presents certain information regarding the Board Members and Officers of the Fund. Each Board Member’s year of birth is set forth in parentheses after his or her name. Unless otherwise noted, (i) each Board Member has engaged in the principal occupation(s) noted in the table for at least the most recent five years, although not necessarily in the same capacity; and (ii) the address of each Independent Board Member is c/o Keith R. Fox, DWS Funds Board Chair, c/o Thomas R. Hiller, Ropes & Gray LLP, Prudential Tower, 800 Boylston Street, Boston, MA02199-3600. Except as otherwise noted below, the term of office for each Board Member is until the election and qualification of a successor, or until such Board Member sooner dies, resigns, is removed or as otherwise provided in the governing documents of the Fund. Because the Fund does not hold an annual meeting of shareholders, each Board Member will hold office for an indeterminate period. The Board Members may also serve in similar capacities with other funds in the fund complex.
| | | | | | | | |
| Independent Board Members | | | | | | |
Name, Year of
Birth, Position
with the Fund
and Length of
Time Served1 | | Business Experience and Directorships
During the Past Five Years | | Number of
Funds in
DWS Fund
Complex
Overseen | | | Other
Directorships
Held by Board
Member
|
Keith R. Fox, CFA (1954) Chairperson since 2017, and Board Member since 1996 | | Managing General Partner, Exeter Capital Partners (a series of private investment funds) (since 1986). Directorships: Progressive International Corporation (kitchen goods importer and distributor); The Kennel Shop (retailer); former Chairman, National Association of Small Business Investment Companies; former Directorships: BoxTop Media Inc. (advertising); Sun Capital Advisers Trust (mutual funds) (2011–2012) | | | 82 | | | — |
John W. Ballantine (1946) Board Member since 1999 | | Retired; formerly, Executive Vice President and Chief Risk Management Officer, First Chicago NBD Corporation/The First National Bank of Chicago (1996–1998); Executive Vice President and Head of International Banking (1995–1996); former Directorships: Director and Chairman of the Board, Healthways, Inc.2 (population well-being and wellness services) (2003–2014); Stockwell Capital Investments PLC (private equity); Enron Corporation; FNB Corporation; Tokheim Corporation; First Oak Brook Bancshares, Inc. and Oak Brook Bank; Prisma Energy International; Public Radio International. Not-for-Profit Director/Trustee: Palm Beach Civic Association; Window to the World Communications (public media); Life Director of Harris Theater for Music and Dance (Chicago); Life Director of Hubbard Street Dance Chicago | | | 82 | | | Portland
General
Electric2
(utility
company)
(2003–
present) |
| | | | | | |
| 64 | | | | | DWS Managed Municipal Bond Fund | | |
| | | | | | | | |
Name, Year of
Birth, Position
with the Fund
and Length of
Time Served1 | | Business Experience and Directorships
During the Past Five Years | | Number of
Funds in
DWS Fund
Complex
Overseen | | | Other
Directorships
Held by Board
Member
|
Henry P. Becton, Jr. (1943) Board Member since 1990 | | Vice Chair and former President, WGBH Educational Foundation. Directorships: Public Radio International; Public Radio Exchange (PRX); The Pew Charitable Trusts (charitable organization); Massachusetts Humane Society; Overseer of the New England Conservatory; former Directorships: Becton Dickinson and Company2 (medical technology company); Belo Corporation2 (media company); The PBS Foundation; Association of Public Television Stations; Boston Museum of Science; American Public Television; Concord Academy; New England Aquarium; Mass. Corporation for Educational Telecommunications; Committee for Economic Development; Public Broadcasting Service; Connecticut College; North Bennett Street School (Boston); American Documentary, Inc. (public media) | | | 82 | | | — |
Dawn-Marie Driscoll (1946) Board Member since 1987 | | Emeritus Executive Fellow, Center for Business Ethics, Bentley University; formerly: Partner, Palmer & Dodge (law firm) (1988–1990); Vice President of Corporate Affairs and General Counsel, Filene’s (retail) (1978–1988). Directorships: Advisory Board, Center for Business Ethics, Bentley University; Trustee and former Chairman of the Board, Southwest Florida Community Foundation (charitable organization); former Directorships: ICI Mutual Insurance Company (2007–2015); Sun Capital Advisers Trust (mutual funds) (2007–2012), Investment Company Institute (audit, executive, nominating committees) and Independent Directors Council (governance, executive committees) | | | 82 | | | — |
Richard J. Herring (1946) Board Member since 1990 | | Jacob Safra Professor of International Banking and Professor of Finance, The Wharton School, University of Pennsylvania (since July 1972); Director, The Wharton Financial Institutions Center (since 1994); formerly: Vice Dean and Director, Wharton Undergraduate Division (1995–2000) and Director, The Lauder Institute of International Management Studies (2000–2006); Member FDIC Systemic Risk Advisory Committee since 2011, member Systemic Risk Council since 2012 and member of the Advisory Board at the Yale Program on Financial Stability since 2013; Formerly Co-Chair of the Shadow Financial Regulatory Committee (2003–2015), Executive Director of The Financial Economists Roundtable (2008–2015), Director of The Thai Capital Fund (2007–2013), Director of The Aberdeen Singapore Fund (2007–2018), and Nonexecutive Director of Barclays Bank DE (2010–2018) | | | 82 | | | Director,
Aberdeen
Japan Fund
(since 2007) |
| | | | | | | | |
| | DWS Managed Municipal Bond Fund | | | | | | 65 | |
| | | | | | | | |
Name, Year of
Birth, Position
with the Fund
and Length of
Time Served1 | | Business Experience and Directorships
During the Past Five Years | | Number of
Funds in
DWS Fund
Complex
Overseen | | | Other
Directorships
Held by Board
Member
|
William McClayton (1944) Board Member since 2004 | | Private equity investor (since October 2009); previously, Managing Director, Diamond Management & Technology Consultants, Inc. (global consulting firm) (2001–2009); Directorship: Board of Managers, YMCA of Metropolitan Chicago; formerly: Senior Partner, Arthur Andersen LLP (accounting) (1966–2001); Trustee, Ravinia Festival | | | 82 | | | — |
Rebecca W. Rimel (1951) Board Member since 1995 | | President, Chief Executive Officer and Director, The Pew Charitable Trusts (charitable organization) (1994–present); formerly: Executive Vice President, The Glenmede Trust Company (investment trust and wealth management) (1983–2004); Board Member, Investor Education (charitable organization) (2004–2005); Trustee, Executive Committee, Philadelphia Chamber of Commerce (2001–2007); Director, Viasys Health Care2 (January 2007–June 2007); Trustee, Thomas Jefferson Foundation (charitable organization) (1994–2012) | | | 82 | | | Director,
Becton
Dickinson
and
Company2
(medical
technology
company)
(2012–
present);
Director,
BioTelemetry
Inc.2(health
care) (2009–
present) |
William N. Searcy, Jr. (1946) Board Member since 1993 | | Private investor since October 2003; formerly: Pension & Savings Trust Officer, Sprint Corporation2(telecommunications) (November 1989–September 2003); Trustee, Sun Capital Advisers Trust (mutual funds) (1998–2012) | | | 82 | | | — |
Jean Gleason Stromberg (1943) Board Member since 1997 | | Retired. Formerly, Consultant (1997–2001); Director, Financial Markets U.S. Government Accountability Office (1996–1997); Partner, Norton Rose Fulbright, L.L.P. (law firm) (1978–1996); former Directorships: The William and Flora Hewlett Foundation (charitable organization) (2000–2015); Service Source, Inc. (nonprofit), Mutual Fund Directors Forum (2002–2004), American Bar Retirement Association (funding vehicle for retirement plans) (1987–1990 and 1994–1996) | | | 82 | | | — |
| | |
| Officers4 | | |
Name, Year of Birth, Position with the Fund and Length of Time Served5 | | Business Experience and Directorships During the Past Five Years |
Hepsen Uzcan6(1974) President and Chief Executive Officer, 2017–present | | Managing Director,3 DWS; Secretary, DWS USA Corporation (since March 2018); Assistant Secretary, DWS Distributors, Inc. (since June 25, 2018); Director and Vice President, DWS Service Company (since June 25, 2018); Assistant Secretary, DWS Investment Management Americas, Inc. (since June 25, 2018); and Director and President, DB Investment Managers, Inc. (since June 25, 2018); formerly: Vice President for the Deutsche funds (2016–2017); Assistant Secretary for the DWS funds (2013–2019) |
| | | | | | |
| 66 | | | | | DWS Managed Municipal Bond Fund | | |
| | |
Name, Year of Birth, Position with the Fund and Length of Time Served5 | | Business Experience and Directorships During the Past Five Years |
John Millette8(1962) Vice President and Secretary, 1999–present | | Director,3DWS; Chief Legal Officer, DWS Investment Management Americas, Inc. (2015–present); and Director and Vice President, DWS Trust Company (2016–present); formerly: Secretary, Deutsche Investment Management Americas Inc. (2015–2017) |
Diane Kenneally8,9(1966) Chief Financial Officer and Treasurer, since 2018 | | Director,3 DWS; formerly: Assistant Treasurer for the DWS funds (2007–2018) |
Paul Antosca8(1957) Assistant Treasurer, 2007–present | | Director,3DWS |
Sheila Cadogan8(1966) Assistant Treasurer, 2017–present | | Director,3DWS; Director and Vice President, DWS Trust Company (since 2018) |
Scott D. Hogan8(1970) Chief Compliance Officer, 2016–present | | Director,3DWS |
Caroline Pearson8(1962) Chief Legal Officer, 2010–present | | Managing Director,3DWS; formerly: Secretary, Deutsche AM Distributors, Inc. (2002–2017); and Secretary, Deutsche AM Service Company (2010–2017) |
Wayne Salit7(1967) Anti-Money Laundering Compliance Officer, 2014–present | | Director,3 Deutsche Bank; and AML Officer, DWS Trust Company; formerly: Managing Director, AML Compliance Officer at BNY Mellon (2011–2014); and Director, AML Compliance Officer at Deutsche Bank (2004–2011) |
Ciara Crawford10 (1984) Assistant Secretary, since February 8, 2019 | | Associate, DWS (since 2015); previously, Legal Assistant at Accelerated Tax Solutions. |
| 1 | The length of time served represents the year in which the Board Member joined the board of one or more DWS funds currently overseen by the Board. |
| 2 | A publicly held company with securities registered pursuant to Section 12 of the Securities Exchange Act of 1934. |
| 3 | Executive title, not a board directorship. |
| 4 | As a result of their respective positions held with the Advisor or its affiliates, these individuals are considered “interested persons” of the Advisor within the meaning of the 1940 Act. Interested persons receive no compensation from the Fund. |
| 5 | The length of time served represents the year in which the officer was first elected in such capacity for one or more DWS funds. |
| 6 | Address: 345 Park Avenue, New York, NY 10154. |
| 7 | Address: 60 Wall Street, New York, NY 10005. |
| 8 | Address: One International Place, Boston, MA 02110. |
| 9 | Appointed Treasurer and Chief Financial Officer effective July 2, 2018. |
| 10 | Address: 5022 Gate Parkway, Suite 400, Jacksonville, FL 32256. |
The Fund’s Statement of Additional Information (“SAI”) includes additional information about the Board Members. The SAI is available, without charge, upon request. If you would like to request a copy of the SAI, you may do so by calling the followingtoll-free number:(800) 728-3337.
| | | | | | | | |
| | DWS Managed Municipal Bond Fund | | | | | | 67 | |
Account Management Resources
| | |
| For More Information | | The automated telephone system allows you to access personalized account information and obtain information on other DWS funds using either your voice or your telephone keypad. Certain account types within Classes A, C and S also have the ability to purchase, exchange or redeem shares using this system. For more information, contact your financial representative. You may also access our automated telephone system or speak with a Shareholder Service representative by calling: (800)728-3337 |
| Web Site | | dws.com View your account transactions and balances, trade shares, monitor your asset allocation, subscribe to fund and account updates bye-mail, and change your address, 24 hours a day. Obtain prospectuses and applications,news about DWS funds, insight from DWS economists and investment specialists and access to DWS fund account information. |
| Written Correspondence | | DWS PO Box 219151 Kansas City, MO64121-9151 |
| Proxy Voting | | The Fund’s policies and procedures for voting proxies for portfolio securities and information about how the Fund voted proxies
related to its portfolio securities during the most recent12-month period ended June 30 are available on our Web site —dws.com/en-us/resources/proxy-voting — or on the SEC’s Web site — sec.gov. To obtain a written copy of the Fund’s policies and procedures without charge, upon request, call us toll free at(800) 728-3337. |
| Portfolio Holdings | | Following the Fund’s fiscal first and thirdquarter-end, a complete portfolio holdings listing is filed with the SEC on FormN-Q or Form N-PORT (available for filings after March 31, 2019). The Fund’s Form N-Q or Form N-PORT will be available on the SEC’s Web site at sec.gov. The Fund’s portfolio holdings are also posted on dws.com from time to time. Please see the Fund’s current prospectus for more information. |
| Principal Underwriter | | If you have questions, comments or complaints, contact: DWS Distributors, Inc. 222 South Riverside Plaza Chicago, IL60606-5808 (800)621-1148 |
| | | | | | |
| 68 | | | | | DWS Managed Municipal Bond Fund | | |
| | | | | | | | |
| Investment Management | | DWS Investment Management Americas, Inc. (“DIMA” or the “Advisor”), which is part of the DWS Group GmbH & Co. KGaA (“DWS Group”), is the investment advisor for the Fund. DIMA and its predecessors have more than 90 years of experience managing mutual funds and DIMA provides a full range of investment advisory services to both institutional and retail clients. DIMA is an indirect, wholly owned subsidiary of DWS Group. DWS Group is a global organization that offers a wide range of investing expertise and resources, including hundreds of portfolio managers and analysts and an office network that reaches the world’s major investment centers. This well-resourced global investment platform brings together a wide variety of experience and investment insight across industries, regions, asset classes and investing styles. |
| | | | |
| | | Class A | | Class C | | Class S | | Institutional
Class |
| Nasdaq Symbol | | SMLAX | | SMLCX | | SCMBX | | SMLIX |
| CUSIP Number | | 25158T 608 | | 25158T 822 | | 25158T 848 | | 25158T 855 |
| Fund Number | | 466 | | 766 | | 2066 | | 544 |
| | | | | | | | |
| | DWS Managed Municipal Bond Fund | | | | | | 69 | |
Notes
Notes
DMMBF-2
(R-027920-8 7/19)
| | |
| ITEM 2. | CODE OF ETHICS |
| | |
| | As of the end of the period covered by this report, the registrant has adopted a code of ethics, as defined in Item 2 of Form N-CSR that applies to its Principal Executive Officer and Principal Financial Officer. There have been no amendments to, or waivers from, a provision of the code of ethics during the period covered by this report that would require disclosure under Item 2. A copy of the code of ethics is filed as an exhibit to this Form N-CSR. |
| | |
| ITEM 3. | AUDIT COMMITTEE FINANCIAL EXPERT |
| | |
| | The fund’s audit committee is comprised solely of trustees who are "independent" (as such term has been defined by the Securities and Exchange Commission ("SEC") in regulations implementing Section 407 of the Sarbanes-Oxley Act (the "Regulations")). The fund’s Board of Trustees has determined that there are several "audit committee financial experts" (as such term has been defined by the Regulations) serving on the fund’s audit committee including Mr. William McClayton, the chair of the fund’s audit committee. An “audit committee financial expert” is not an “expert” for any purpose, including for purposes of Section 11 of the Securities Act of 1933 and the designation or identification of a person as an “audit committee financial expert” does not impose on such person any duties, obligations or liability that are greater than the duties, obligations and liability imposed on such person as a member of the audit committee and board of directors in the absence of such designation or identification. |
| | |
| ITEM 4. | PRINCIPAL ACCOUNTANT FEES AND SERVICES |
| | |
DWS Managed Municipal Bond fund
form n-csr disclosure re: AUDIT FEES
The following table shows the amount of fees that Ernst & Young LLP (“EY”), the Fund’s current Independent Registered Public Accounting Firm, billed to the Fund during the Fund’s fiscal year ended May 31, 2019 and the amount of fees that PricewaterhouseCoopers, LLP (“PwC”), the Fund’s prior Independent Registered Public Accounting Firm, billed to the Fund during the Fund’s fiscal year ended May 31, 2018. The Audit Committee approved in advance all audit services and non-audit services that EY or PwC provided to the Fund while serving as the Independent Registered Public Accounting Firm.
Services that the Fund’s Independent Registered Public Accounting Firm Billed to the Fund
Fiscal Year
Ended
May 31, | Audit Fees Billed to Fund | Audit-Related
Fees Billed to Fund | Tax Fees Billed to Fund | All
Other Fees Billed to Fund |
| 2019 | $55,933 | $0 | $6,723 | $0 |
| 2018 | $97,849 | $0 | $0 | $0 |
Services that the Fund’s Independent Registered Public Accounting Firm Billed to the Adviser and Affiliated Fund Service Providers
The following table shows the amount of fees billed by EY to DWS Investment Management Americas, Inc. (“DIMA” or the “Adviser”), and any entity controlling, controlled by or under common control with DIMA (“Control Affiliate”) that provides ongoing services to the Fund (“Affiliated Fund Service Provider”), for engagements directly related to the Fund’s operations and financial reporting, during the Fund’s fiscal year ended May 31, 2019 and the amount of fees billed by PwC to the Adviser and any Affiliated Fund Service provider for engagements directly related to the Fund’s operations and financial reporting, during the Fund’s fiscal year ended May 31, 2018.
Fiscal Year
Ended
May 31, | Audit-Related
Fees Billed to Adviser and Affiliated Fund Service Providers | Tax Fees Billed to Adviser and Affiliated Fund Service Providers | All
Other Fees Billed to Adviser and Affiliated Fund Service Providers |
| 2019 | $0 | $1,545,773 | $0 |
| 2018 | $0 | $0 | $0 |
The above “Tax Fees” were billed in connection with tax compliance services and agreed upon procedures. EY also billed $208,775 for tax services during the Fund’s fiscal year ended May 31, 2018.
Non-Audit Services
The following table shows the amount of fees that EY billed during the Fund’s fiscal year ended May 31, 2019 and the amount of fees that PwC billed during the Fund’s fiscal year ended May 31, 2018 for non-audit services . The Audit Committee pre-approved all non-audit services that EY or PwC, while serving as Independent Registered Public Accounting Firm, provided to the Adviser and any Affiliated Fund Service Provider that related directly to the Fund’s operations and financial reporting. The Audit Committee requested and received information from EY and PwC about any non-audit services that EY or PwC rendered to the Adviser and any Affiliated Fund Service Provider. The Committee considered this information in evaluating EY’s and PwC’s independence.
Fiscal Year
Ended
May 31, | Total
Non-Audit Fees Billed to Fund (A) | Total Non-Audit Fees billed to Adviser and Affiliated Fund Service Providers (engagements related directly to the operations and financial reporting of the Fund) (B) | Total Non-Audit Fees billed to Adviser and Affiliated Fund Service Providers (all other engagements) (C) | Total of (A), (B)
and (C) |
| 2019 | $6,723 | $1,545,773 | $0 | $1,552,496 |
| 2018 | $0 | $0 | $0 | $0 |
All other engagement fees were billed for services in connection with agreed upon procedures and tax compliance for DIMA and other related entities.EY also billed $208,775 for tax services during the Fund’s fiscal year ended May 31, 2018.
Audit Committee Pre-Approval Policies and Procedures. Generally, each Fund’s Audit Committee must pre approve (i) all services to be performed for a Fund by a Fund’s Independent Registered Public Accounting Firm and (ii) all non-audit services to be performed by a Fund’s Independent Registered Public Accounting Firm for the DIMA Entities with respect to operations and financial reporting of the Fund, except that the Chairperson or Vice Chairperson of each Fund’s Audit Committee may grant the pre-approval for non-audit services described in items (i) and (ii) above for non-prohibited services for engagements of less than $100,000. All such delegated pre approvals shall be presented to each Fund’s Audit Committee no later than the next Audit Committee meeting.
There were no amounts that were approved by the Audit Committee pursuant to the de minimis exception under Rule 2-01 of Regulation S-X.
According to each principal Independent Registered Public Accounting Firm, substantially all of the principal Independent Registered Public Accounting Firm's hours spent on auditing the registrant's financial statements were attributed to work performed by full-time permanent employees of the principal Independent Registered Public Accounting Firm.
***
In connection with the audit of the 2019 financial statements, the Fund entered into an engagement letter with EY. The terms of the engagement letter required by EY, and agreed to by the Audit Committee, include a provision mandating the use of mediation and arbitration to resolve any controversy or claim between the parties arising out of or relating to the engagement letter or services provided thereunder.
***
Pursuant to PCAOB Rule 3526, EY is required to describe in writing to the Fund’s Audit Committee, on at least an annual basis, all relationships between EY, or any of its affiliates, and the DWS Funds, including the Fund, or persons in financial reporting oversight roles at the DWS Funds that, as of the date of the communication, may reasonably be thought to bear on EY’s independence. Pursuant to PCAOB Rule 3526, EY has reported the matters set forth below that may reasonably be thought to bear on EY’s independence. With respect to each reported matter, individually and in the aggregate, EY advised the Audit Committee that, after careful consideration of the facts and circumstances and the applicable independence rules, it concluded that the matters do not and will not impair EY’s ability to exercise objective and impartial judgement in connection with the audits of the financial statements for the Fund and a reasonable investor with knowledge of all relevant facts and circumstances would conclude that EY has been and is capable of exercising objective and impartial judgment on all issues encompassed within EY’s audit engagements. EY also confirmed to the Audit Committee that it can continue act as the Independent Registered Public Accounting Firm for the Fund.
| · | EY advised the Fund’s Audit Committee that various covered persons within EY’s affiliates held investments in, or had other financial relationships with, entities within the DWS Funds “investment company complex” (as defined in Regulation S-X) (the “DWS Funds Complex”). EY informed the Audit Committee that these investments and financial relationships were inconsistent with Rule 2-01(c)(1) of Regulation S-X. EY reported that all breaches have been resolved and that none of the breaches involved any investments in the Fund or any professionals who were part of the audit engagement team for the Fund or in a position to influence the audit engagement team. In addition, EY noted that the independence breaches did not (i) create a mutual or conflicting interest with the Fund, (ii) place EY in the position of auditing its own work, (iii) result in EY acting as management or an employee of the Fund, or (iv) place EY in a position of being an advocate of the Fund. |
| · | EY advised the Fund’s Audit Committee of certain lending relationships of EY with owners of greater than 10% of the shares of certain investment companies within the DWS Funds Complex that EY had identified as inconsistent with Rule 2-01(c)(l)(ii)(A) of Regulation S-X (referred to as the “Loan Rule”). The Loan Rule specifically provides that an accounting firm would not be independent if it receives a loan from a lender that is a record or beneficial owner of more than ten percent of an audit client’s equity securities. For purposes of the Loan Rule, an audit client includes the Fund as well as all other investment companies in the DWS Funds Complex. EY’s lending relationships affect EY’s independence under the Loan Rule with respect to all investment companies in the DWS Funds Complex. |
EY stated its belief that, in each lending relationship, the lender is or was not able to impact the impartiality of EY or assert any influence over the investment companies in the DWS Funds Complex whose shares the lender owns or owned, or the applicable investment company’s investment adviser. In addition, on June 20, 2016, the SEC Staff issued a “no-action” letter to another mutual fund complex, Fidelity Management & Research Company et al., SEC Staff No-Action Letter (June 20, 2016) (the “Fidelity Letter”), related to similar Loan Rule issues as those described above. In the Fidelity Letter, the SEC Staff confirmed that it would not recommend enforcement action against an investment company that relied on the audit services performed by an audit firm that was not in compliance with the Loan Rule in certain specified circumstances. With respect to each lending relationship identified by EY, the circumstances described in the Fidelity Letter appear to be substantially similar to the circumstances that affected EY’s independence under the Loan Rule with respect to the Fund, and, in each case, EY confirmed to the Audit Committee that it meets the conditions of the Fidelity Letter.
| | |
| ITEM 5. | AUDIT COMMITTEE OF LISTED REGISTRANTS |
| | |
| | Not applicable |
| | |
| ITEM 6. | SCHEDULE OF INVESTMENTS |
| | |
| | Not applicable |
| | |
| ITEM 7. | DISCLOSURE OF PROXY VOTING POLICIES AND PROCEDURES FOR CLOSED-END MANAGEMENT INVESTMENT COMPANIES |
| | |
| | Not applicable |
| | |
| ITEM 8. | PORTFOLIO MANAGERS OF CLOSED-END MANAGEMENT INVESTMENT COMPANIES |
| | |
| | Not applicable |
| | |
| ITEM 9. | PURCHASES OF EQUITY SECURITIES BY CLOSED-END MANAGEMENT INVESTMENT COMPANY AND AFFILIATED PURCHASERS |
| | |
| | Not applicable |
| | |
| ITEM 10. | SUBMISSION OF MATTERS TO A VOTE OF SECURITY HOLDERS |
| | |
| | There were no material changes to the procedures by which shareholders may recommend nominees to the Fund’s Board. The primary function of the Nominating and Governance Committee is to identify and recommend individuals for membership on the Board and oversee the administration of the Board Governance Guidelines. Shareholders may recommend candidates for Board positions by forwarding their correspondence by U.S. mail or courier service to Keith R. Fox, DWS Funds Board Chair, c/o Thomas R. Hiller, Ropes & Gray LLP, Prudential Tower, 800 Boylston Street, Boston, MA 02199-3600. |
| | |
| ITEM 11. | CONTROLS AND PROCEDURES |
| | |
| | (a) | The Chief Executive and Financial Officers concluded that the Registrant’s Disclosure Controls and Procedures are effective based on the evaluation of the Disclosure Controls and Procedures as of a date within 90 days of the filing date of this report. |
| | |
| | (b) | There have been no changes in the registrant’s internal control over financial reporting that occurred during the second fiscal quarter of the period covered by this report that has materially affected, or is reasonably likely to materially affect, the registrant’s internal controls over financial reporting. |
| | |
| ITEM 12. | Disclosure of Securities Lending Activities for Closed-End Management Investment Companies |
| | |
| | Not applicable |
| | |
| ITEM 13. | EXHIBITS |
| | |
| | |
| | (a)(1) | Code of Ethics pursuant to Item 2 of Form N-CSR is filed and attached hereto as EX-99.CODE ETH. |
| | |
| | (a)(2) | Certification pursuant to Rule 30a-2(a) under the Investment Company Act of 1940 (17 CFR 270.30a-2(a)) is filed and attached hereto as Exhibit 99.CERT. |
| | |
| | (a)(3) | Not applicable |
| | |
| | (a)(4)(i) | Certification pursuant to Item 4.01 of Form 8-K under the Exchange Act (17 CFR 249.308) is attached hereto. |
| | |
| | (a)(4)(ii) | Letter from former accountant pursuant to Item 304(a) under Regulation S-K is attached hereto. |
| | |
| | (b) | Certification pursuant to Rule 30a-2(b) under the Investment Company Act of 1940 (17 CFR 270.30a-2(b)) is furnished and attached hereto as Exhibit 99.906CERT. |
SIGNATURES
Pursuant to the requirements of the Securities Exchange Act of 1934 and the Investment Company Act of 1940, the registrant has duly caused this report to be signed on its behalf by the undersigned, thereunto duly authorized.
| Registrant: | DWS Managed Municipal Bond Fund, a series of Deutsche DWS Municipal Trust |
| | |
| | |
| By: | /s/Hepsen Uzcan Hepsen Uzcan President |
| | |
| Date: | 8/2/2019 |
Pursuant to the requirements of the Securities Exchange Act of 1934 and the Investment Company Act of 1940, this report has been signed below by the following persons on behalf of the registrant and in the capacities and on the dates indicated.
| By: | /s/Hepsen Uzcan Hepsen Uzcan President |
| | |
| Date: | 8/2/2019 |
| | |
| | |
| | |
| By: | /s/Diane Kenneally Diane Kenneally Chief Financial Officer and Treasurer |
| | |
| Date: | 8/2/2019 |
| | |