UNITED STATES
SECURITIES AND EXCHANGE COMMISSION
WASHINGTON, D. C. 20549
FORM N-CSR
Investment Company Act file number: 811-02671
Deutsche DWS Municipal Trust
(Exact Name of Registrant as Specified in Charter)
875 Third Avenue
New York, NY 10022-6225
(Address of Principal Executive Offices) (Zip Code)
Registrant’s Telephone Number, including Area Code: (212) 454-4500
Diane Kenneally
100 Summer Street
Boston, MA 02110
(Name and Address of Agent for Service)
| Date of fiscal year end: | 5/31 |
| Date of reporting period: | 5/31/2022 |
| ITEM 1. | REPORT TO STOCKHOLDERS |
| (a) |


| 2 | | | DWS Managed Municipal Bond Fund |
| DWS Managed Municipal Bond Fund | | | 3 |


| 4 | | | DWS Managed Municipal Bond Fund |
| Portfolio Management Review | (Unaudited) |
| DWS Managed Municipal Bond Fund | | | 5 |
| 6 | | | DWS Managed Municipal Bond Fund |
| DWS Managed Municipal Bond Fund | | | 7 |
| 8 | | | DWS Managed Municipal Bond Fund |
| DWS Managed Municipal Bond Fund | | | 9 |
| Performance Summary | May 31, 2022 (Unaudited) |
| Class A | 1-Year | 5-Year | 10-Year |
| Average Annual Total Returns as of 5/31/22 | |||
| Unadjusted for Sales Charge | –8.53% | 1.14% | 2.24% |
| Adjusted for the Maximum Sales Charge (max 2.75% load) | –11.05% | 0.57% | 1.96% |
| Bloomberg Municipal Bond Index† | –6.79% | 1.78% | 2.54% |
| Class C | 1-Year | 5-Year | 10-Year |
| Average Annual Total Returns as of 5/31/22 | |||
| Unadjusted for Sales Charge | –9.24% | 0.34% | 1.44% |
| Adjusted for the Maximum Sales Charge (max 1.00% CDSC) | –9.24% | 0.34% | 1.44% |
| Bloomberg Municipal Bond Index† | –6.79% | 1.78% | 2.54% |
| Class S | 1-Year | 5-Year | 10-Year |
| Average Annual Total Returns as of 5/31/22 | |||
| No Sales Charges | –8.20% | 1.37% | 2.46% |
| Bloomberg Municipal Bond Index† | –6.79% | 1.78% | 2.54% |
| Institutional Class | 1-Year | 5-Year | 10-Year |
| Average Annual Total Returns as of 5/31/22 | |||
| No Sales Charges | –8.31% | 1.38% | 2.48% |
| Bloomberg Municipal Bond Index† | –6.79% | 1.78% | 2.54% |
| 10 | | | DWS Managed Municipal Bond Fund |
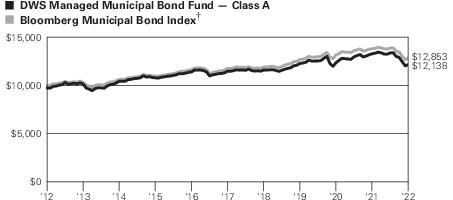
| † | Bloomberg Municipal Bond Index covers the USD-denominated long-term tax exempt bond market. The index has four main sectors: state and local general obligation bonds, revenue bonds, insured bonds, and pre-refunded bonds. |
| DWS Managed Municipal Bond Fund | | | 11 |
| Class A | Class C | Class S | Institutional Class | |
| Net Asset Value | ||||
| 5/31/22 | $ 8.29 | $ 8.29 | $ 8.31 | $ 8.30 |
| 5/31/21 | $ 9.39 | $ 9.39 | $ 9.40 | $ 9.40 |
| Distribution Information as of 5/31/22 | ||||
| Income Dividends, Twelve Months | $ .24 | $ .17 | $ .26 | $ .26 |
| Capital Gain Distributions | $ .0821 | $ .0821 | $ .0821 | $ .0821 |
| May Income Dividend | $ .0204 | $ .0152 | $ .0221 | $ .0221 |
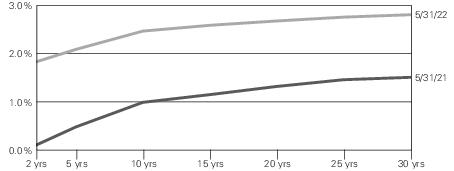
| SEC 30-day Yield‡‡ | 2.89% | 2.23% | 3.20% | 3.20% |
| Tax Equivalent Yield‡‡ | 4.88% | 3.77% | 5.41% | 5.41% |
| Current Annualized Distribution Rate‡‡ | 2.90% | 2.16% | 3.13% | 3.14% |
| ‡‡ | The SEC yield is net investment income per share earned over the month ended May 31, 2022, shown as an annualized percentage of the maximum offering price per share on the last day of the period. The SEC yield is computed in accordance with a standardized method prescribed by the Securities and Exchange Commission. The SEC yields would have been 3.18% for Class S shares, had certain expenses not been reduced. Tax equivalent yield is based on the Fund’s yield and a marginal income tax rate of 40.8%. Current annualized distribution rate is the latest monthly dividend shown as an annualized percentage of net asset value on May 31, 2022. Distribution rate simply measures the level of dividends and is not a complete measure of performance. The current annualized distribution rates would have been 3.11% for Class S shares, had certain expenses not been reduced. Yields and distribution rates are historical, not guaranteed and will fluctuate. |
| 12 | | | DWS Managed Municipal Bond Fund |
| Portfolio Summary | (Unaudited) |
| Asset Allocation (As a % of Investment Portfolio excluding Open-End Investment Companies) | 5/31/22 | 5/31/21 |
| Revenue Bonds | 78% | 76% |
| Lease Obligations | 9% | 9% |
| General Obligation Bonds | 8% | 10% |
| Escrow to Maturity/Prerefunded Bonds | 4% | 5% |
| Variable Rate Demand Notes | 1% | 0% |
| Variable Rate Demand Preferred Shares | 0% | — |
| Other | 0% | — |
| 100% | 100% |
| Interest Rate Sensitivity | 5/31/22 | 5/31/21 |
| Effective Maturity | 7.8 years | 6.4 years |
| Modified Duration | 5.8 years | 5.4 years |
| Quality (As a % of Investment Portfolio excluding Open-End Investment Companies) | 5/31/22 | 5/31/21 |
| AAA | 9% | 11% |
| AA | 34% | 37% |
| A | 31% | 29% |
| BBB | 14% | 15% |
| BB | 3% | 2% |
| B | 0% | — |
| Not Rated | 9% | 6% |
| 100% | 100% |
| Top Five State Allocations (As a % of Investment Portfolio excluding Open-End Investment Companies) | 5/31/22 | 5/31/21 |
| New York | 15% | 18% |
| Texas | 10% | 11% |
| California | 7% | 9% |
| Colorado | 7% | 6% |
| Florida | 6% | 8% |
| DWS Managed Municipal Bond Fund | | | 13 |
| Investment Portfolio | as of May 31, 2022 |
| Principal Amount ($) | Value ($) | ||
| Municipal Investments 99.9% | |||
| Alaska 0.1% | |||
| Alaska, Northern Tobacco Securitization Corp., Tobacco Settlement Revenue, “1” , Series A, 4.0%, 6/1/2050 | 2,045,000 | 1,961,763 | |
| Arizona 1.3% | |||
| Arizona, Salt Verde Financial Corp., Gas Revenue: | |||
| 5.0%, 12/1/2032, GTY: Citigroup Global Markets | 1,600,000 | 1,787,724 | |
| 5.0%, 12/1/2037, GTY: Citigroup Global Markets | 8,405,000 | 9,495,983 | |
| Arizona, State Industrial Development Authority, Education Facility Revenue, Odyssey Preparatory Academy Project, 144A, 5.0%, 7/1/2049 | 5,490,000 | 5,516,654 | |
| Maricopa County, AZ, Industrial Development Authority, Education Revenue, Legacy Traditional Schools Project, Series B, 144A, 5.0%, 7/1/2049 | 4,560,000 | 4,635,915 | |
| Phoenix, AZ, Civic Improvement Corp., Rental Car Facility Revenue, Series A, 4.0%, 7/1/2045 | 7,000,000 | 6,994,810 | |
| Pima County, AZ, Industrial Development Authority, Education Revenue, American Leadership Academy Project: | |||
| Series 2022, 144A, 4.0%, 6/15/2051 | 5,710,000 | 4,911,986 | |
| Series 2022, 144A, 4.0%, 6/15/2057 | 715,000 | 596,686 | |
| 144A, 5.0%, 6/15/2049 | 1,445,000 | 1,457,512 | |
| 144A, 5.0%, 6/15/2052 | 1,410,000 | 1,419,038 | |
| 36,816,308 | |||
| California 7.4% | |||
| California, Community Housing Agency, Essential Housing Revenue, Verdant at Green Valley Project, Series A, 144A, 5.0%, 8/1/2049 | 5,575,000 | 5,525,520 | |
| California, CSCDA Community Improvement Authority, Essential Housing Revenue, Series A, 144A, 5.0%, 7/1/2051 | 7,600,000 | 7,632,729 | |
| California, Golden State Tobacco Securitization Corp., Tobacco Settlement Revenue, Series A, Prerefunded, 5.0%, 6/1/2040 | 11,765,000 | 12,800,958 | |
| California, Housing Finance Agency Municipal Certificates: | |||
| “A", 3.25%, 8/20/2036 | 8,590,240 | 8,016,980 | |
| “A", Series 2021-2, 3.75%, 3/25/2035 | 19,840,729 | 20,273,005 | |
| California, Housing Finance Agency, Municipal Certificates, “A” , Series 2021-1, 3.5%, 11/20/2035 | 5,490,114 | 5,265,808 | |
| California, Morongo Band of Mission Indians Revenue, Series B, 144A, 5.0%, 10/1/2042 | 2,395,000 | 2,586,004 | |
| 14 | | | DWS Managed Municipal Bond Fund |
| Principal Amount ($) | Value ($) | ||
| California, M-S-R Energy Authority, Series B, 7.0%, 11/1/2034, GTY: Citigroup Global Markets | 15,315,000 | 19,550,181 | |
| California, River Islands Public Financing Authority, Special Tax, Community Facilities District No. 2019-1, Phase 2 Public Improvements: | |||
| 3.875%, 9/1/2049 | 1,560,000 | 1,329,550 | |
| 4.0%, 9/1/2046 | 2,265,000 | 2,000,728 | |
| California, State General Obligation, Various Purposes, 4.0%, 4/1/2049 | 6,785,000 | 7,065,869 | |
| California, State Municipal Finance Authority Revenue, LAX Integrated Express Solutions LLC, LINXS Apartment Project, Series A, AMT, 5.0%, 12/31/2047 | 3,200,000 | 3,328,269 | |
| California, State Public Finance Authority Revenue, ENSO Village Project: | |||
| Series A, 144A, 5.0%, 11/15/2046 | 675,000 | 677,506 | |
| Series A, 144A, 5.0%, 11/15/2051 | 340,000 | 339,470 | |
| California, State Public Works Board, Lease Revenue: | |||
| Series C, 5.0%, 8/1/2032 (a) | 3,600,000 | 4,135,917 | |
| Series A, 5.0%, 8/1/2033 | 6,250,000 | 7,423,273 | |
| Series C, 5.0%, 8/1/2033 (a) | 3,765,000 | 4,315,468 | |
| California, State University Revenue, Series A, 5.0%, 11/1/2038 | 7,410,000 | 8,001,276 | |
| California, Statewide Communities Development Authority Revenue, Loma Linda University Medical Center: | |||
| Series A, 144A, 5.0%, 12/1/2046 | 3,500,000 | 3,542,844 | |
| Series A, 5.25%, 12/1/2044 | 7,765,000 | 7,960,645 | |
| Series A, 144A, 5.5%, 12/1/2058 | 2,705,000 | 2,797,429 | |
| Los Angeles, CA, Department of Airports Revenue: | |||
| Series B, AMT, 5.0%, 5/15/2029 | 8,625,000 | 9,524,139 | |
| Series B, AMT, 5.0%, 5/15/2030 | 5,715,000 | 6,288,800 | |
| Series C, AMT, 5.0%, 5/15/2030 | 3,910,000 | 4,272,321 | |
| Series C, AMT, 5.0%, 5/15/2031 | 3,910,000 | 4,261,159 | |
| Los Angeles, CA, Department of Airports Revenue, Los Angeles International Airport, Series D, AMT, 5.0%, 5/15/2048 | 15,000,000 | 16,180,062 | |
| Sacramento County, CA, Airport Systems Revenue: | |||
| Series C, AMT, 5.0%, 7/1/2029 | 9,455,000 | 10,400,076 | |
| Series C, AMT, 5.0%, 7/1/2030 | 13,690,000 | 15,005,920 | |
| Series C, AMT, 5.0%, 7/1/2031 | 3,500,000 | 3,815,789 | |
| Series C, AMT, 5.0%, 7/1/2032 | 3,000,000 | 3,256,199 | |
| 207,573,894 | |||
| DWS Managed Municipal Bond Fund | | | 15 |
| Principal Amount ($) | Value ($) | ||
| Colorado 7.0% | |||
| Colorado, Certificates of Participation, Series A, 4.0%, 12/15/2035 | 5,000,000 | 5,303,662 | |
| Colorado, North Range Metropolitan District No. 3, Series A, 5.25%, 12/1/2050 | 3,833,000 | 3,804,976 | |
| Colorado, Public Energy Authority, Natural Gas Purchase Revenue, 6.5%, 11/15/2038, GTY: Merrill Lynch & Co. | 30,000,000 | 39,306,978 | |
| Colorado, State Health Facilities Authority Revenue, CommonSpirit Health, Series A-2, 5.0%, 8/1/2044 | 17,700,000 | 18,481,520 | |
| Colorado, State Health Facilities Authority Revenue, School Health Systems, Series A, 5.5%, 1/1/2035 | 16,250,000 | 16,981,656 | |
| Colorado, State Health Facilities Authority, Hospital Revenue, CommonSpirit Health Obligation Group, Series A-2, 4.0%, 8/1/2049 | 4,000,000 | 3,910,109 | |
| Colorado, State Health Facilities Authority, Hospital Revenue, SCL Health System, Series A, 4.0%, 1/1/2037 | 2,615,000 | 2,661,561 | |
| Colorado, Trails At Crowfoot Metropolitan District No. 3, Series A, 5.0%, 12/1/2049 | 1,000,000 | 979,508 | |
| Denver City & County, CO, Airport Revenue: | |||
| Series A, AMT, 5.0%, 12/1/2032 | 14,335,000 | 15,622,912 | |
| Series A, AMT, 5.5%, 11/15/2028 | 15,000,000 | 15,608,073 | |
| Series A, AMT, 5.5%, 11/15/2029 | 14,705,000 | 15,290,943 | |
| Series A, AMT, 5.5%, 11/15/2030 | 15,080,000 | 15,658,716 | |
| Series A, AMT, 5.5%, 11/15/2031 | 5,000,000 | 5,191,520 | |
| Denver, CO, Convention Center Hotel Authority Revenue, 5.0%, 12/1/2040 | 2,770,000 | 2,874,833 | |
| Denver, CO, Urban Renewal Authority, Tax Increment Revenue, 9th Urban Redevelopment Area, Series A, 144A, 5.25%, 12/1/2039 | 5,050,000 | 5,252,654 | |
| Douglas County, CO, Rampart Range Metropolitan District No. 5, Series 2021, 4.0%, 12/1/2051 | 4,450,000 | 3,552,529 | |
| University of Colorado, Hospital Authority Revenue, Series A, 5.0%, 11/15/2042 | 26,010,000 | 26,345,532 | |
| 196,827,682 | |||
| Connecticut 2.0% | |||
| Connecticut, Harbor Point Infrastructure Improvement District, Special Obligation Revenue, Harbor Point Project, 144A, 5.0%, 4/1/2039 | 12,000,000 | 12,683,685 | |
| Connecticut, State General Obligation, Series C, 5.0%, 6/15/2029 | 14,690,000 | 16,686,371 | |
| Connecticut, State Health & Educational Facilities Authority Revenue, Sacred Heart University: | |||
| Series L, 5.0%, 7/1/2041 | 3,000,000 | 3,327,924 | |
| Series L, 5.0%, 7/1/2042 | 2,935,000 | 3,248,694 | |
| 16 | | | DWS Managed Municipal Bond Fund |
| Principal Amount ($) | Value ($) | ||
| Connecticut, State Health & Educational Facilities Authority Revenue, Stamford Hospital, Series J, 5.125%, 7/1/2035 | 18,000,000 | 18,056,416 | |
| Connecticut, Steel Point Infrastructure Improvement District Special Obligation Revenue, Steelpointe Harbor Project: | |||
| 144A, 4.0%, 4/1/2041 | 360,000 | 329,141 | |
| 144A, 4.0%, 4/1/2051 | 1,000,000 | 870,108 | |
| 55,202,339 | |||
| Delaware 0.2% | |||
| Delaware, State Health Facilities Authority Revenue, BEEBE Medical Center, Inc., 5.0%, 6/1/2050 | 5,250,000 | 5,553,526 | |
| District of Columbia 1.7% | |||
| District of Columbia, General Obligation, Series A, 5.0%, 6/1/2033 | 7,500,000 | 8,085,380 | |
| District of Columbia, International School Revenue: | |||
| 5.0%, 7/1/2039 | 300,000 | 311,427 | |
| 5.0%, 7/1/2054 | 2,425,000 | 2,479,025 | |
| District of Columbia, Latin American Montessori Bilingual Public Charter School, 5.0%, 6/1/2050 | 4,810,000 | 4,927,786 | |
| District of Columbia, Two Rivers Public Charter School, Inc., 5.0%, 6/1/2055 | 5,330,000 | 5,472,468 | |
| Metropolitan Washington, DC, Airports Authority System Revenue: | |||
| Series A, AMT, 5.0%, 10/1/2031 | 5,355,000 | 5,740,376 | |
| Series A, AMT, 5.0%, 10/1/2032 | 5,000,000 | 5,348,618 | |
| AMT, 5.0%, 10/1/2042 | 10,805,000 | 11,554,662 | |
| Washington, DC, Convention & Sports Authority, Dedicated Tax Revenue: | |||
| Series A, 5.0%, 10/1/2029 | 1,455,000 | 1,640,425 | |
| Series A, 5.0%, 10/1/2030 | 1,455,000 | 1,634,013 | |
| 47,194,180 | |||
| Florida 6.5% | |||
| Broward County, FL, Airport Systems Revenue: | |||
| Series A, AMT, 4.0%, 10/1/2044 | 2,140,000 | 2,137,722 | |
| Series A, AMT, 4.0%, 10/1/2049 | 3,425,000 | 3,414,534 | |
| AMT, 5.0%, 10/1/2042 | 10,000,000 | 10,668,788 | |
| AMT, 5.0%, 10/1/2047 | 8,950,000 | 9,492,565 | |
| Charlotte County, FL, Industrial Development Authority, Utility System Revenue, Town & Country Utilities Project, Series A, 144A, AMT, 4.0%, 10/1/2051, GTY: Babcock Ranch IRR LLC | 1,560,000 | 1,291,220 | |
| DWS Managed Municipal Bond Fund | | | 17 |
| Principal Amount ($) | Value ($) | ||
| Davie, FL, Educational Facilities Revenue, Nova Southeastern University Project, 5.0%, 4/1/2048 | 7,345,000 | 7,894,811 | |
| Florida, Capital Project Finance Authority, Student Housing Revenue, Loan Program: | |||
| Series A-1, 5.0%, 10/1/2032 | 540,000 | 571,239 | |
| Series A-1, 5.0%, 10/1/2033 | 540,000 | 570,461 | |
| Series A-1, 5.0%, 10/1/2034 | 545,000 | 574,931 | |
| Series A-1, 5.0%, 10/1/2035 | 270,000 | 284,454 | |
| Florida, Capital Trust Agency, Educational Growth Fund LLC, Charter School Portfolio Project, Series A-1, 144A, 5.0%, 7/1/2056 | 3,570,000 | 3,606,199 | |
| Florida, Development Finance Corp., Educational Facilities Revenue, Mater Academy Projects: | |||
| Series A, 5.0%, 6/15/2047 | 6,600,000 | 6,808,849 | |
| Series A, 5.0%, 6/15/2052 | 1,980,000 | 2,032,499 | |
| Series A, 5.0%, 6/15/2055 | 5,170,000 | 5,300,040 | |
| Series A, 5.0%, 6/15/2056 | 3,210,000 | 3,289,285 | |
| Florida, Development Finance Corp., Educational Facilities Revenue, River City Science Academy Project: | |||
| Series A-1, 5.0%, 7/1/2042 | 280,000 | 292,424 | |
| Series B, 5.0%, 7/1/2042 (a) | 295,000 | 294,302 | |
| Series A-1, 5.0%, 7/1/2051 | 255,000 | 263,480 | |
| Series B, 5.0%, 7/1/2051 (a) | 420,000 | 410,968 | |
| Series A-1, 5.0%, 2/1/2057 | 370,000 | 378,018 | |
| Series B, 5.0%, 7/1/2057 (a) | 440,000 | 420,017 | |
| Florida, Development Finance Corp., Surface Transportation Facilities Revenue, Brightline Passenger Rail Project, Series B, 144A, AMT, 7.375%, 1/1/2049 | 3,000,000 | 3,035,690 | |
| Florida, Development Finance Corp., Surface Transportation Facilities Revenue, Virgin Trains USA Passenger Rail Project: | |||
| Series A, 144A, AMT, 6.375% (b), 1/1/2049 | 3,105,000 | 3,045,192 | |
| Series A, 144A, AMT, 6.5% (b), 1/1/2049 | 3,400,000 | 3,287,047 | |
| Florida, Higher Educational Facilities Financing Authority Revenue, Ringling College Project: | |||
| 5.0%, 3/1/2029 | 985,000 | 1,061,738 | |
| 5.0%, 3/1/2032 | 1,105,000 | 1,175,857 | |
| 5.0%, 3/1/2034 | 1,200,000 | 1,274,058 | |
| Florida, Higher Educational Facilities Financing Authority Revenue, Rollins College Project, Series A, 4.0%, 12/1/2050 | 15,000,000 | 14,920,817 | |
| Florida, Jacksonville Electric Authority, Electric System Revenue: | |||
| Series B, 4.0%, 10/1/2035 | 2,345,000 | 2,398,359 | |
| 18 | | | DWS Managed Municipal Bond Fund |
| Principal Amount ($) | Value ($) | ||
| Series B, 4.0%, 10/1/2037 | 1,500,000 | 1,529,696 | |
| Florida, State Development Finance Corp., Senior Living Revenue, The Cabana at Jensen Dunes Project, Series A, 144A, 5.25%, 11/15/2056 | 15,000,000 | 11,742,903 | |
| Florida, State Higher Educational Facilities Financial Authority Revenue, Florida Institute of Technology, Series A, 4.0%, 10/1/2044 | 1,000,000 | 937,083 | |
| Florida, State Higher Educational Facilities Financial Authority Revenue, Jacksonville University Project, Series A-1, 144A, 4.75%, 6/1/2038 | 2,150,000 | 2,167,854 | |
| Florida, State Housing Finance Corp., Revenue, Series 1, 3.5%, 7/1/2051 | 2,575,000 | 2,608,532 | |
| Florida, Village Community Development District No. 12, Special Assessment Revenue: | |||
| 144A, 4.25%, 5/1/2043 | 8,450,000 | 8,157,684 | |
| 144A, 4.375%, 5/1/2050 | 7,065,000 | 6,827,056 | |
| Florida, Village Community Development District No. 13, Special Assessment Revenue, Series 2021, 3.25%, 5/1/2052 | 2,280,000 | 1,833,143 | |
| Hillsborough County, FL, Aviation Authority, Tampa International Airport, Series A, AMT, 4.0%, 10/1/2052 | 4,890,000 | 4,884,003 | |
| Jacksonville, FL, Educational Facilities Revenue, Jacksonville University Project, Series B, 144A, 5.0%, 6/1/2053 | 3,250,000 | 3,283,522 | |
| Miami-Dade County, FL, Seaport Revenue, Series B-1, AMT, 4.0%, 10/1/2046 | 6,430,000 | 6,444,258 | |
| Orange County, FL, Health Facilities Authority Revenue, Orlando Health Obligated Group, 4.0%, 10/1/2052 | 10,575,000 | 10,645,787 | |
| Orange County, FL, School Board, Certificates of Participation, Series C, 5.0%, 8/1/2033 | 16,610,000 | 18,222,572 | |
| Pinellas County, FL, Industrial Development Authority Revenue, 2017 Foundation For Global Understanding, Inc. Project, 5.0%, 7/1/2039 | 1,565,000 | 1,624,433 | |
| Tampa, FL, The University of Tampa Project, Series A, 4.0%, 4/1/2050 | 13,380,000 | 12,897,217 | |
| 184,001,307 | |||
| Georgia 2.9% | |||
| Cobb County, GA, Kennestone Hospital Authority, Revenue Anticipation Certificates, Wellstar Health System, Inc. Project, Series A, 5.0%, 4/1/2047 | 18,135,000 | 19,296,822 | |
| DeKalb County, GA, Water & Sewer Revenue: | |||
| Series A, 5.25%, 10/1/2033 | 3,635,000 | 3,643,022 | |
| Series A, 5.25%, 10/1/2036 | 11,115,000 | 11,138,945 | |
| Series A, 5.25%, 10/1/2041 | 5,000,000 | 5,010,334 | |
| DWS Managed Municipal Bond Fund | | | 19 |
| Principal Amount ($) | Value ($) | ||
| Fulton County, GA, Development Authority Hospital Revenue, Revenue Anticipation Certificates, Wellstar Health System, Series A, 5.0%, 4/1/2042 | 3,155,000 | 3,375,294 | |
| Fulton County, GA, Development Authority Hospital Revenue, Wellstar Health System, Obligated Inc. Project, Series A, 4.0%, 4/1/2050 | 7,955,000 | 7,969,877 | |
| George L Smith II, GA, Congress Center Authority, Convention Center Hotel First Tier, Series A, 4.0%, 1/1/2054 | 815,000 | 741,933 | |
| George L Smith II, GA, Congress Center Authority, Convention Center Hotel Second Tier, Series B, 144A, 5.0%, 1/1/2054 | 4,255,000 | 4,100,032 | |
| Georgia, Glynn-Brunswick Memorial Hospital Authority, Anticipation Certificates, Southeast Georgia Health System Project, 5.0%, 8/1/2047 | 2,035,000 | 2,108,403 | |
| Georgia, Main Street Natural Gas, Inc., Gas Project Revenue: | |||
| Series A, 5.5%, 9/15/2023, GTY: Merrill Lynch & Co. | 5,000,000 | 5,190,794 | |
| Series A, 5.5%, 9/15/2027, GTY: Merrill Lynch & Co. | 5,000,000 | 5,569,059 | |
| Series A, 5.5%, 9/15/2028, GTY: Merrill Lynch & Co. | 5,000,000 | 5,615,042 | |
| Georgia, Municipal Electric Authority Revenue, Project One, Series A, 5.0%, 1/1/2035 | 2,995,000 | 3,123,416 | |
| Georgia, State Municipal Electric Authority, Series GG, 5.0%, 1/1/2039 | 5,695,000 | 5,758,012 | |
| 82,640,985 | |||
| Illinois 5.9% | |||
| Chicago, IL, Board of Education: | |||
| Series A, 4.0%, 12/1/2047 | 5,715,000 | 5,366,634 | |
| Series A, 5.0%, 12/1/2034 | 810,000 | 852,788 | |
| Series E, 6.038%, 12/1/2029 | 1,500,000 | 1,546,933 | |
| Chicago, IL, General Obligation: | |||
| Series A, 5.5%, 1/1/2049 | 2,535,000 | 2,712,865 | |
| Series A, 6.0%, 1/1/2038 | 2,290,000 | 2,497,210 | |
| Chicago, IL, O’Hare International Airport, Special Facility Revenue, AMT, 5.0%, 7/1/2048 | 2,630,000 | 2,752,450 | |
| Chicago, IL, Transit Authority, Sales Tax Receipts Revenue: | |||
| Series A, 5.0%, 12/1/2045 | 3,700,000 | 4,013,734 | |
| Series A, 5.0%, 12/1/2057 | 20,000,000 | 21,903,796 | |
| Chicago, IL, Transit Authority, Sales Tax Receipts Revenue, Second Lien, Series A, 4.0%, 12/1/2050 | 3,730,000 | 3,753,724 | |
| Chicago, IL, Waterworks Revenue, 5.0%, 11/1/2023, INS: AGMC | 2,990,000 | 2,997,715 | |
| Cook County, IL, Forest Preservation District, Series C, 5.0%, 12/15/2037 | 3,155,000 | 3,163,637 | |
| 20 | | | DWS Managed Municipal Bond Fund |
| Principal Amount ($) | Value ($) | ||
| Illinois, Metropolitan Pier & Exposition Authority, Dedicated State Tax Revenue, Capital Appreciation-McCormick, Series A, Zero Coupon, 6/15/2038, INS: NATL | 17,305,000 | 8,923,744 | |
| Illinois, Regional Transportation Authority, Series B, 5.75%, 6/1/2033, INS: NATL | 7,000,000 | 8,149,140 | |
| Illinois, State Finance Authority Revenue, Edward Elmhurst Obligated Group: | |||
| Series A, Prerefunded, 5.0%, 1/1/2036 | 2,970,000 | 3,338,011 | |
| Series A, Prerefunded, 5.0%, 1/1/2037 | 3,965,000 | 4,456,302 | |
| Illinois, State Finance Authority Revenue, Friendship Village of Schaumburg, 5.125%, 2/15/2045 | 9,825,000 | 6,485,868 | |
| Illinois, State Finance Authority Revenue, University of Chicago, Series A, 5.0%, 10/1/2038 | 12,000,000 | 12,550,926 | |
| Illinois, State General Obligation: | |||
| 5.0%, 11/1/2034 | 3,500,000 | 3,620,793 | |
| 5.0%, 1/1/2035 | 7,575,000 | 7,789,772 | |
| Series A, 5.0%, 5/1/2040 | 3,000,000 | 3,112,780 | |
| Series A, 5.0%, 12/1/2042 | 5,955,000 | 6,141,408 | |
| Series A, 5.0%, 5/1/2043 | 2,000,000 | 2,062,339 | |
| Series A, 5.0%, 3/1/2046 | 1,995,000 | 2,079,161 | |
| Series A, 5.25%, 12/1/2030 | 6,500,000 | 7,006,360 | |
| Series A, 5.5%, 3/1/2042 (a) | 4,000,000 | 4,392,002 | |
| Series A, 5.5%, 3/1/2047 (a) | 3,665,000 | 3,997,892 | |
| 5.75%, 5/1/2045 | 4,205,000 | 4,592,487 | |
| Illinois, State Toll Highway Authority, Series A, 5.0%, 1/1/2044 | 17,075,000 | 18,806,909 | |
| Springfield, IL, Electric Revenue, Senior Lien, 5.0%, 3/1/2040, INS: AGMC | 5,805,000 | 6,160,360 | |
| 165,227,740 | |||
| Indiana 1.0% | |||
| Indiana, State Finance Authority Revenue, BHI Senior Living Obligated Group, 5.0%, 11/15/2053 | 20,635,000 | 21,021,636 | |
| Indiana, State Finance Authority Revenue, Stadium Project, Series A, 5.25%, 2/1/2031 | 2,595,000 | 2,828,888 | |
| Indiana, State Finance Authority, Health Facilities Revenue, Baptist Healthcare System, Series A, 5.0%, 8/15/2051 | 3,000,000 | 3,147,550 | |
| 26,998,074 | |||
| DWS Managed Municipal Bond Fund | | | 21 |
| Principal Amount ($) | Value ($) | ||
| Iowa 0.9% | |||
| Iowa, State Higher Education Loan Authority Revenue, Private College Facility, Des Moines University Project, 4.0%, 10/1/2045 | 12,905,000 | 12,384,091 | |
| Iowa, State Higher Education Loan Authority Revenue, Private College Facility, Loras College, 0.62% (c), 6/1/2022, LOC: Bank of America NA | 3,250,000 | 3,250,000 | |
| Iowa, Tobacco Settlement Authority Revenue: | |||
| “1", Series A-2, 4.0%, 6/1/2049 | 10,740,000 | 10,395,071 | |
| Series B-1, 4.0%, 6/1/2049 | 295,000 | 293,071 | |
| 26,322,233 | |||
| Kentucky 0.5% | |||
| Kentucky, State Economic Development Finance Authority, Owensboro Health, Inc., Obligated Group: | |||
| Series A, 5.0%, 6/1/2045 | 1,275,000 | 1,323,180 | |
| Series A, 5.25%, 6/1/2041 | 1,915,000 | 2,018,800 | |
| Louisville & Jefferson county, KY, Metro Government Hospital Revenue, UOFL Health Project: | |||
| Series A, 5.0%, 5/15/2047 | 2,440,000 | 2,592,468 | |
| Series A, 5.0%, 5/15/2052 | 7,835,000 | 8,283,727 | |
| 14,218,175 | |||
| Louisiana 0.1% | |||
| Louisiana, New Orleans Aviation Board, General Airport North Terminal, Series B, AMT, 5.0%, 1/1/2048 | 2,830,000 | 2,970,753 | |
| Maryland 0.8% | |||
| Maryland, State Community Development Administration, Department of Housing & Community Development, Series C, 3.5%, 3/1/2050 | 2,435,000 | 2,464,917 | |
| Maryland, State Economic Development Corp., Student Housing Revenue, Morgan State University Project: | |||
| 5.0%, 7/1/2050 | 1,305,000 | 1,348,836 | |
| 5.0%, 7/1/2056 | 2,195,000 | 2,265,729 | |
| Maryland, State Health & Higher Educational Facilities Authority Revenue, Medstar Health Obligated Group: | |||
| Series A, 5.0%, 5/15/2042 | 9,735,000 | 10,271,849 | |
| Series A, 5.0%, 5/15/2045 | 5,000,000 | 5,255,841 | |
| 21,607,172 | |||
| Massachusetts 1.1% | |||
| Massachusetts, State Development Finance Agency Revenue, Lesley University, Series A, 5.0%, 7/1/2049 | 2,750,000 | 2,934,055 | |
| 22 | | | DWS Managed Municipal Bond Fund |
| Principal Amount ($) | Value ($) | ||
| Massachusetts, State Development Finance Agency Revenue, Partners Healthcare System, Inc.: | |||
| Series S-1, 5.0%, 7/1/2028 | 2,700,000 | 3,010,616 | |
| Series S-1, 5.0%, 7/1/2033 | 4,000,000 | 4,319,877 | |
| Massachusetts, State Development Finance Agency Revenue, Springfield College: | |||
| Series B, 4.0%, 6/1/2050 | 3,900,000 | 3,670,174 | |
| Series A, 4.0%, 6/1/2056 | 1,105,000 | 1,014,257 | |
| Massachusetts, State Development Finance Agency Revenue, UMass Memorial Healthcare, Series I, 5.0%, 7/1/2036 | 1,000,000 | 1,051,497 | |
| Massachusetts, State Health & Educational Facilities Authority Revenue, 0.7% (c), 6/7/2022 | 1,000,000 | 1,000,000 | |
| Massachusetts, State Housing Finance Agency, Single Family Housing Revenue, Series 222, 3.0%, 6/1/2051 | 13,000,000 | 12,827,318 | |
| 29,827,794 | |||
| Michigan 0.6% | |||
| Michigan, Finance Authority Revenue, Tobacco Settlement Asset Backed Senior Capital Appreciation Bonds, Series B-2, Zero Coupon, 6/1/2065 | 5,500,000 | 666,800 | |
| Michigan, State Finance Authority Ltd. Obligation Revenue, Albion College: | |||
| 4.0%, 12/1/2046 | 1,710,000 | 1,622,641 | |
| 4.0%, 12/1/2051 | 1,745,000 | 1,626,520 | |
| Michigan, State Finance Authority Revenue, Series A, 4.0%, 2/15/2050 | 5,000,000 | 4,973,772 | |
| Michigan, State Strategic Fund Ltd., Obligation Revenue Improvement Project, Series I, AMT, 5.0%, 12/31/2043 | 5,800,000 | 5,923,290 | |
| Michigan, State Strategic Fund Ltd., Obligation Revenue, Graphic International LLC, Coated Recycled Board Machine Project, AMT, 4.0%, 10/1/2061 | 2,665,000 | 2,729,866 | |
| 17,542,889 | |||
| Minnesota 0.9% | |||
| Duluth, MN, Economic Development Authority, Health Care Facilities Revenue, Essentia Health Obligated Group: | |||
| Series A, 5.0%, 2/15/2048 | 5,000,000 | 5,277,003 | |
| Series A, 5.0%, 2/15/2053 | 14,060,000 | 14,801,463 | |
| Minnesota, State Trunk Highway, Series B, 4.0%, 8/1/2032 | 5,000,000 | 5,415,697 | |
| 25,494,163 | |||
| DWS Managed Municipal Bond Fund | | | 23 |
| Principal Amount ($) | Value ($) | ||
| Missouri 0.4% | |||
| Missouri, State Health & Educational Facilities Authority Revenue, Lutheran Senior Services Projects, Series B, 5.0%, 2/1/2046 | 2,460,000 | 2,512,638 | |
| Missouri, State Health & Educational Facilities Authority Revenue, Medical Research, Lutheran Senior Services: | |||
| 4.0%, 2/1/2042 | 2,640,000 | 2,505,193 | |
| Series A, 5.0%, 2/1/2046 | 3,285,000 | 3,355,290 | |
| Missouri, State Health & Educational Facilities Authority Revenue, St. Louis University, Series B-1, 0.6% (c), 6/1/2022, LOC: Barclays Bank PLC | 350,000 | 350,000 | |
| Missouri, State Housing Development Commission, Single Family Mortgage Revenue, First Homeownership Loan Program, Series B, 4.0%, 5/1/2050 | 3,225,000 | 3,313,786 | |
| 12,036,907 | |||
| Nebraska 0.2% | |||
| Douglas County, NE, Hospital Authority No.2, Health Facilities, Children’s Hospital Obligated Group, 5.0%, 11/15/2047 | 5,205,000 | 5,461,898 | |
| Nevada 0.1% | |||
| Reno, NV, Sales Tax Revenue, Transportation Rail Access, Series C, 144A, Zero Coupon, 7/1/2058 | 34,500,000 | 4,082,043 | |
| New Jersey 2.9% | |||
| Hudson County, NJ, Improvement Authority Revenue, Hudson County Courthouse Project, 4.0%, 10/1/2051 | 11,500,000 | 11,651,070 | |
| New Jersey, State Covid-19 General Obligation Emergency Bonds, Series A, 4.0%, 6/1/2032 | 1,245,000 | 1,340,831 | |
| New Jersey, State Economic Development Authority Revenue: | |||
| Prerefunded, 5.0%, 6/15/2028 | 1,050,000 | 1,051,467 | |
| Series BBB, Prerefunded, 5.5%, 6/15/2030 | 16,440,000 | 18,816,009 | |
| New Jersey, State Economic Development Authority Revenue, Private Activity, The Goethals Bridge Replacement Project, AMT, 5.0%, 1/1/2031, INS: AGMC | 4,000,000 | 4,109,322 | |
| New Jersey, State Economic Development Authority, State Government Buildings Project: | |||
| Series A, 5.0%, 6/15/2042 | 2,885,000 | 3,071,193 | |
| Series A, 5.0%, 6/15/2047 | 3,205,000 | 3,378,100 | |
| New Jersey, State Higher Education Assistance Authority, Student Loan Revenue, Series B, AMT, 2.5%, 12/1/2040 | 2,080,000 | 1,922,442 | |
| 24 | | | DWS Managed Municipal Bond Fund |
| Principal Amount ($) | Value ($) | ||
| New Jersey, State Transportation Trust Fund Authority: | |||
| Series A, 4.0%, 6/15/2038 | 2,335,000 | 2,357,007 | |
| Series A, 4.0%, 6/15/2041 | 7,100,000 | 7,127,537 | |
| New Jersey, State Transportation Trust Fund Authority, Transportation Systems: | |||
| Series A, 5.0%, 12/15/2034 | 9,280,000 | 10,065,727 | |
| Series A, 5.0%, 12/15/2036 | 2,385,000 | 2,581,849 | |
| New Jersey, Tobacco Settlement Financing Corp.: | |||
| Series A, 5.0%, 6/1/2046 | 5,270,000 | 5,591,801 | |
| Series A, 5.25%, 6/1/2046 | 2,630,000 | 2,832,802 | |
| South Jersey, NJ, Transportation Authority System Revenue: | |||
| Series A, 4.0%, 11/1/2050 | 2,000,000 | 1,876,676 | |
| Series A, 5.0%, 11/1/2045 | 3,000,000 | 3,218,033 | |
| 80,991,866 | |||
| New Mexico 0.7% | |||
| New Mexico, State Finance Authority Revenue, Public Project Revolving Fund: | |||
| Series A, 4.0%, 6/1/2029 | 5,765,000 | 6,269,600 | |
| Series A, 4.0%, 6/1/2030 | 5,795,000 | 6,279,565 | |
| New Mexico, State Mortgage Finance Authority, Series A, 3.5%, 1/1/2051 | 3,615,000 | 3,661,425 | |
| New Mexico, State Mortgage Finance Authority, Single Family Mortgage Revenue, “I” , Series D, 3.75%, 1/1/2050 | 3,395,000 | 3,462,078 | |
| 19,672,668 | |||
| New York 15.1% | |||
| Dutchess County, NY, Local Development Corp., Bard College Project, Series A, 144A, 5.0%, 7/1/2051 | 820,000 | 851,993 | |
| New York, Genesee County Funding Corp., Rochester Regional Health Obligation, Series A, 5.25%, 12/1/2052 | 2,000,000 | 2,157,967 | |
| New York, Metropolitan Transportation Authority Revenue: | |||
| Series E-1, 0.65% (c), 6/1/2022, LOC: Barclays Bank PLC | 3,470,000 | 3,470,000 | |
| Series G-1, 0.65% (c), 6/1/2022, LOC: Barclays Bank PLC | 4,200,000 | 4,200,000 | |
| Series A-1, 4.0%, 11/15/2041, INS: AGMC | 12,000,000 | 11,974,706 | |
| Series D, 5.0%, 11/15/2027, INS: AGMC-CR | 16,500,000 | 16,756,867 | |
| Series D, 5.0%, 11/15/2028 | 9,715,000 | 9,861,796 | |
| Series D, 5.0%, 11/15/2038 | 13,635,000 | 14,066,880 | |
| Series B, 5.25%, 11/15/2044 | 25,000,000 | 26,042,862 | |
| DWS Managed Municipal Bond Fund | | | 25 |
| Principal Amount ($) | Value ($) | ||
| New York, Metropolitan Transportation Authority, Dedicated Tax Fund, Series A-1, 0.6% (c), 6/1/2022, LOC: TD Bank NA | 1,500,000 | 1,500,000 | |
| New York, Metropolitan Transportation Authority, Dedicated Tax Fund, Climate Board Certified Green Bond, Series B-2, 5.0%, 11/15/2034 | 10,940,000 | 11,706,082 | |
| New York, State Dormitory Authority Revenues, Non-State Supported Debt, The New School: | |||
| Series A, 4.0%, 7/1/2047 | 1,000,000 | 973,050 | |
| Series A, 4.0%, 7/1/2052 | 1,175,000 | 1,127,908 | |
| New York, State Dormitory Authority, Personal Income Tax Revenue: | |||
| Series A, Prerefunded, 5.0%, 2/15/2035 | 4,305,000 | 4,413,819 | |
| Series B, 5.0%, 2/15/2035 | 29,990,000 | 32,027,395 | |
| Series B, Prerefunded, 5.0%, 2/15/2035 | 10,000 | 10,790 | |
| Series A, 5.0%, 2/15/2039 | 3,950,000 | 4,267,244 | |
| Series C, 5.0%, 3/15/2042 | 14,750,000 | 15,413,673 | |
| New York, State Dormitory Authority, Sales Tax Revenue, Series A, 5.0%, 3/15/2036 | 5,000,000 | 5,520,386 | |
| New York, State Power Authority Revenue, Series A, 4.0%, 11/15/2050 | 10,000,000 | 10,135,100 | |
| New York, State Thruway Authority General Revenue, Junior Indebtedness Obligation, Series B, 4.0%, 1/1/2040, INS: AGMC | 40,000,000 | 41,508,244 | |
| New York, State Transportation Development Corp., Special Facilities Revenue, Delta Air Lines, Inc., LaGuardia Airport C&D Redevelopment: | |||
| AMT, 5.0%, 1/1/2033 | 2,045,000 | 2,123,603 | |
| AMT, 5.0%, 10/1/2040 | 4,000,000 | 4,146,174 | |
| New York, State Transportation Development Corp., Special Facilities Revenue, John F. Kennedy International Airport Project, AMT, 3.0%, 8/1/2031, GTY: American Airlines Group, Inc. | 1,000,000 | 935,592 | |
| New York, State Transportation Development Corp., Special Facilities Revenue, Laguardia Gateway Partners LLC, Redevelopment Project: | |||
| Series A, AMT, 5.0%, 7/1/2041 | 6,660,000 | 6,903,190 | |
| Series A, AMT, 5.0%, 7/1/2046 | 14,190,000 | 14,679,294 | |
| New York, State Transportation Development Corp., Special Facilities Revenue, Terminal 4 John F. Kennedy, International Project, AMT, 5.0%, 12/1/2041 | 3,165,000 | 3,397,291 | |
| New York, State Urban Development Corp. Revenue, State Personal Income Tax: | |||
| Series A, 5.0%, 3/15/2031 | 4,600,000 | 5,117,073 | |
| Series C, 5.0%, 3/15/2047 | 8,300,000 | 9,261,605 | |
| 26 | | | DWS Managed Municipal Bond Fund |
| Principal Amount ($) | Value ($) | ||
| New York, Triborough Bridge & Tunnel Authority Revenue, MTA Bridges And Tunnels: | |||
| Series 4-C, 0.67% (c), 6/1/2022, LOC: U.S. Bank NA | 2,170,000 | 2,170,000 | |
| Series A, 4.0%, 11/15/2056 | 5,000,000 | 5,061,269 | |
| Series A, 5.0%, 5/15/2051 | 4,240,000 | 4,816,066 | |
| Series A, 5.0%, 11/15/2054 | 5,155,000 | 5,761,766 | |
| New York, TSASC, Inc., Series A, 5.0%, 6/1/2041 | 1,195,000 | 1,262,411 | |
| New York, Utility Debt Securitization Authority, Restructuring Revenue: | |||
| Series TE, 5.0%, 12/15/2034 | 3,200,000 | 3,349,635 | |
| Series TE, 5.0%, 12/15/2035 | 4,000,000 | 4,183,937 | |
| New York City, NY, Municipal Water Finance Authority, Water & Sewer Systems Revenue: | |||
| Series AA-1, 4.0%, 6/15/2051 | 10,460,000 | 10,834,250 | |
| Series DD, 5.0%, 6/15/2036 | 6,000,000 | 6,295,617 | |
| Series BB-1, 5.0%, 6/15/2049 | 10,000,000 | 11,141,309 | |
| New York City, NY, Transitional Finance Authority Revenue, Future Tax Secured: | |||
| Series A-1, 4.0%, 5/1/2031 | 5,430,000 | 5,663,733 | |
| Series A, 5.0%, 2/1/2031 | 5,000,000 | 5,526,846 | |
| Series F-1, 5.0%, 5/1/2031 | 4,900,000 | 5,439,120 | |
| Series D-1, 5.0%, 2/1/2038 | 17,655,000 | 18,343,485 | |
| New York City, NY, Transitional Finance Authority, Building Aid Revenue, Series S-3, 5.0%, 7/15/2031 | 4,000,000 | 4,557,104 | |
| New York City, NY, Transitional Finance Authority, Building Aid Revenue, Fiscal 2018, Series S-1, 5.0%, 7/15/2035 | 2,800,000 | 3,108,223 | |
| New York, NY, General Obligation: | |||
| Series E-5, 0.6% (c), 6/1/2022, LOC: TD Bank NA | 4,550,000 | 4,550,000 | |
| Series A-3, 0.63% (c), 6/1/2022, LOC: Mizuho Bank Ltd. | 450,000 | 450,000 | |
| Series B-1, 5.0%, 12/1/2031 | 2,000,000 | 2,215,966 | |
| New York, NY, State Thruway Authority General Revenue, 4.0%, 1/1/2043 | 15,000,000 | 15,354,495 | |
| Port Authority of New York & New Jersey: | |||
| Series 207, AMT, 5.0%, 9/15/2029 | 8,000,000 | 8,753,536 | |
| Series 207, AMT, 5.0%, 9/15/2030 | 20,000,000 | 21,869,040 | |
| Series 207, AMT, 5.0%, 9/15/2032 | 10,000,000 | 10,823,592 | |
| 426,081,984 | |||
| North Carolina 0.8% | |||
| Charlotte-Mecklenberg, NC, Hospital Authority, Health Care System Revenue, Series A, 5.0%, 1/15/2039 | 9,540,000 | 9,734,808 | |
| North Carolina, Charlotte-Mecklenburg Hospital Authorirty Revenue, Healthcare System, Series E, 0.62% (c), 6/1/2022, LOC: Royal Bank of Canada | 1,200,000 | 1,200,000 | |
| DWS Managed Municipal Bond Fund | | | 27 |
| Principal Amount ($) | Value ($) | ||
| North Carolina, State Housing Finance Agency: | |||
| Series 47, 3.0%, 7/1/2051 | 8,000,000 | 7,920,864 | |
| Series 42, 4.0%, 1/1/2050 | 4,910,000 | 5,036,416 | |
| 23,892,088 | |||
| Ohio 3.7% | |||
| Allen Country, OH, Hospital Facilities Revenue, Adena Health System Obligated Group Project, Series C, 0.67% (c), 6/1/2022, LOC: Bank of Montreal | 400,000 | 400,000 | |
| Buckeye, OH, Tobacco Settlement Financing Authority: | |||
| Series A, 4.0%, 6/1/2048 | 9,975,000 | 9,661,203 | |
| “2", Series B-2, 5.0%, 6/1/2055 | 4,975,000 | 5,053,608 | |
| Chillicothe, OH, Hospital Facilities Revenue, Adena Health System Obligated Group Project, 5.0%, 12/1/2047 | 6,035,000 | 6,362,397 | |
| Hamilton County, OH, Health Care Revenue, Life Enriching Communities Project: | |||
| 5.0%, 1/1/2036 | 975,000 | 988,024 | |
| 5.0%, 1/1/2046 | 2,790,000 | 2,809,870 | |
| Ohio, Akron, Bath & Copley Joint Township Hospital District Revenue, 5.25%, 11/15/2046 | 11,610,000 | 12,254,111 | |
| Ohio, Akron, Bath & Copley Joint Township Hospital District Revenue, Children’s Hospital Medical Center of Akron, 5.0%, 11/15/2038 | 15,645,000 | 16,092,733 | |
| Ohio, State Hospital Revenue, Aultman Health Foundation: | |||
| 144A, 5.0%, 12/1/2038 | 7,750,000 | 7,602,525 | |
| 144A, 5.0%, 12/1/2048 | 7,500,000 | 7,094,177 | |
| Ohio, State Housing Finance Agency, Residential Mortgage Revenue, Series B, 4.5%, 3/1/2050 | 4,510,000 | 4,686,884 | |
| Ohio, State Housing Finance Agency, Residential Mortgage Revenue, First Time Homebuyer Program, Series A, 3.75%, 9/1/2050 | 3,555,000 | 3,621,032 | |
| Ohio, State Turnpike Commission, Infrastructure Projects: | |||
| Series A-1, 5.25%, 2/15/2030 | 4,620,000 | 4,733,952 | |
| Series A-1, 5.25%, 2/15/2031 | 9,375,000 | 9,606,233 | |
| Series A-1, 5.25%, 2/15/2032 | 7,500,000 | 7,684,987 | |
| Ohio, State Turnpike Commission, Junior Lien, Infrastructure Projects, Series A, 5.0%, 2/15/2039 (a) | 3,890,000 | 4,461,353 | |
| 103,113,089 | |||
| Oklahoma 0.8% | |||
| Oklahoma, State Development Finance Authority, Health System Revenue, OU Medicine Project: | |||
| Series B, 5.5%, 8/15/2052 | 2,185,000 | 2,241,680 | |
| 28 | | | DWS Managed Municipal Bond Fund |
| Principal Amount ($) | Value ($) | ||
| Series B, 5.5%, 8/15/2057 | 9,385,000 | 9,578,318 | |
| Oklahoma, State Turnpike Authority Revenue, Series E, 4.0%, 1/1/2031 | 6,375,000 | 6,737,648 | |
| Oklahoma, Water & Sewer Revenue, McGee Creek Authority, 6.0%, 1/1/2023, INS: NATL | 2,960,000 | 3,025,338 | |
| 21,582,984 | |||
| Oregon 0.2% | |||
| Oregon, State Facilities Authority Revenue, PeaceHealth Obligated Group, Series A, 0.67% (c), 6/1/2022, LOC: U.S. Bank NA | 5,550,000 | 5,550,000 | |
| Pennsylvania 4.5% | |||
| Franklin County, PA, Industrial Development Authority Revenue, Menno Haven, Inc. Project: | |||
| 5.0%, 12/1/2043 | 665,000 | 658,947 | |
| 5.0%, 12/1/2054 | 1,825,000 | 1,754,222 | |
| Lancaster County, PA, Hospital Authority Revenue, University of Pennsylvania Health System Obligated Group, 5.0%, 8/15/2042 | 2,100,000 | 2,230,575 | |
| Pennsylvania, Certificate of Participations, Series A, 5.0%, 7/1/2043 | 1,115,000 | 1,230,207 | |
| Pennsylvania, Commonwealth Financing Authority Revenue, Series A, 5.0%, 6/1/2033 | 5,000,000 | 5,381,219 | |
| Pennsylvania, Commonwealth Financing Authority, Tobacco Master Settlement Payment Revenue Bonds: | |||
| 5.0%, 6/1/2027 | 1,290,000 | 1,429,613 | |
| 5.0%, 6/1/2028 | 1,290,000 | 1,446,787 | |
| 5.0%, 6/1/2029 | 1,290,000 | 1,439,411 | |
| 5.0%, 6/1/2030 | 855,000 | 950,184 | |
| 5.0%, 6/1/2031 | 865,000 | 956,593 | |
| Pennsylvania, Geisinger Authority Health System Revenue, Series A-2, 5.0%, 2/15/2034 | 3,000,000 | 3,249,898 | |
| Pennsylvania, State General Obligation: | |||
| Series 2, 4.0%, 9/15/2032 | 10,000,000 | 10,241,791 | |
| Series D, 5.0%, 8/15/2032 | 5,000,000 | 5,342,083 | |
| Pennsylvania, State Housing Finance Agency, Single Family Mortgage Revenue: | |||
| Series 136, 3.0%, 10/1/2051 | 5,807,088 | 5,785,573 | |
| Series 132A, 3.5%, 4/1/2051 | 2,355,000 | 2,385,495 | |
| Pennsylvania, State Turnpike Commission Revenue: | |||
| Series B, 4.0%, 12/1/2051 | 10,250,000 | 9,932,363 | |
| Series B, 5.0%, 6/1/2033 | 12,000,000 | 12,869,213 | |
| Series A-1, 5.0%, 12/1/2040 | 15,000,000 | 15,730,548 | |
| Series B-1, 5.0%, 6/1/2042 | 6,950,000 | 7,391,854 | |
| Series A-1, 5.0%, 12/1/2042 | 5,000,000 | 5,414,068 | |
| DWS Managed Municipal Bond Fund | | | 29 |
| Principal Amount ($) | Value ($) | ||
| Series A, 5.0%, 12/1/2044 | 20,335,000 | 21,904,435 | |
| Series A-1, 5.0%, 12/1/2047 | 3,335,000 | 3,591,111 | |
| Series B, 5.0%, 12/1/2051 | 4,335,000 | 4,810,623 | |
| 126,126,813 | |||
| South Carolina 3.5% | |||
| Charleston County, SC, Airport District System Revenue, Series A, AMT, 5.75%, 7/1/2030 | 5,880,000 | 6,063,533 | |
| Lexington County, SC, Health Services District, Lexington Medical Center: | |||
| 5.0%, 11/1/2041 | 2,500,000 | 2,632,123 | |
| 5.0%, 11/1/2046 | 7,490,000 | 7,832,978 | |
| South Carolina, State Public Service Authority Revenue: | |||
| Series A, 4.0%, 12/1/2052 | 20,000,000 | 19,630,524 | |
| Series A, 5.0%, 12/1/2033 | 4,400,000 | 4,673,537 | |
| Series A, 5.0%, 12/1/2036 | 4,780,000 | 5,065,772 | |
| South Carolina, State Public Service Authority Revenue, Santee Cooper, Series A, Prerefunded, 5.75%, 12/1/2043 | 35,555,000 | 37,667,735 | |
| South Carolina, State Transportation Infrastructure Bank Revenue, 5.0%, 10/1/2038 | 15,130,000 | 16,709,578 | |
| 100,275,780 | |||
| South Dakota 1.4% | |||
| South Dakota, State Health & Educational Facilities Authority Revenue, Avera Health: | |||
| 5.0%, 7/1/2044 | 20,475,000 | 21,241,181 | |
| 5.0%, 7/1/2046 | 16,140,000 | 17,041,401 | |
| 38,282,582 | |||
| Tennessee 0.4% | |||
| Metropolitan Government of Nashville & Davidson County, TN, General Obligation, 4.0%, 7/1/2034 | 6,000,000 | 6,367,786 | |
| Metropolitan Nashville, TN, Airport Authority Revenue, Series B, AMT, 4.0%, 7/1/2054 | 6,000,000 | 5,886,184 | |
| 12,253,970 | |||
| Texas 10.6% | |||
| Bowie County, TX, Industrial Development Corp., Revenue, Texarkana Newspapers Inc., Project, 0.63% (c), 6/1/2022, LOC: JPMorgan Chase NA | 3,500,000 | 3,500,000 | |
| Central Texas, Regional Mobility Authority Revenue, Senior Lien: | |||
| Series A, Prerefunded, 5.0%, 1/1/2040 | 4,730,000 | 5,143,634 | |
| Series E, 5.0%, 1/1/2045 | 1,500,000 | 1,630,438 | |
| 30 | | | DWS Managed Municipal Bond Fund |
| Principal Amount ($) | Value ($) | ||
| Clifton, TX, Higher Education Finance Corp., Education Revenue, Series D, 6.125%, 8/15/2048 | 11,465,000 | 12,094,477 | |
| Clifton, TX, Higher Education Finance Corp., Idea Public Schools, Series T, 4.0%, 8/15/2047 | 2,175,000 | 2,272,452 | |
| Greater Texas, Cultural Education Facilities Finance Corp. Lease Revenue, Epicenter Multipurpose Facilities Project: | |||
| Series A, 4.0%, 3/1/2046 | 2,145,000 | 2,170,072 | |
| Series A, 4.0%, 3/1/2050 | 5,055,000 | 5,083,967 | |
| Houston, TX, Hotel Occupancy Tax & Special Revenue, Convention & Entertainment Facilities Department: | |||
| 5.0%, 9/1/2029 | 1,000,000 | 1,127,695 | |
| 5.0%, 9/1/2030 | 1,000,000 | 1,126,842 | |
| 5.0%, 9/1/2031 | 850,000 | 955,270 | |
| Houston, TX, Utility Systems Revenue, First Lien, Series A, 5.0%, 11/15/2033 | 2,475,000 | 2,887,376 | |
| Lower Colorado River, TX, Transmission Contract Authority Revenue, LCRA Transmission Services Corp., Project: | |||
| 5.0%, 5/15/2045 | 1,500,000 | 1,648,959 | |
| 5.0%, 5/15/2050 | 2,500,000 | 2,735,858 | |
| Newark, TX, Higher Education Finance Corp., Texas Revenue, Abilene Christian University Project, Series A, 4.0%, 4/1/2057 | 15,000,000 | 14,595,517 | |
| North Texas, Tollway Authority Revenue, Series B, 5.0%, 1/1/2040 | 8,825,000 | 8,943,510 | |
| North Texas, Tollway Authority Revenue, Second Tier: | |||
| Series B, 5.0%, 1/1/2043 | 3,075,000 | 3,295,329 | |
| Series B, 5.0%, 1/1/2048 | 8,615,000 | 9,192,712 | |
| San Antonio, TX, Education Facilities Corp. Higher Education Revenue, Hallmark University Project: | |||
| Series A, 5.0%, 10/1/2041 | 435,000 | 404,869 | |
| Series A, 5.0%, 10/1/2051 | 645,000 | 572,614 | |
| San Antonio, TX, Education Facilities Corp. Revenue, University of the Incarnate Word Project: | |||
| Series A, 4.0%, 4/1/2051 | 5,500,000 | 5,173,250 | |
| Series A, 4.0%, 4/1/2054 | 2,310,000 | 2,146,175 | |
| San Antonio, TX, Electric & Gas Systems Revenue, 4.0%, 2/1/2032 | 7,000,000 | 7,339,783 | |
| Tarrant County, TX, Cultural Education Facilities Finance Corp. Revenue, Christus Health Obligated Group, Series B, 5.0%, 7/1/2048 | 25,000,000 | 26,647,867 | |
| Tarrant County, TX, Cultural Education Facilities Finance Corp., Hospital Revenue, Scott & White Healthcare, Prerefunded, 5.0%, 8/15/2043 | 9,900,000 | 10,298,813 | |
| DWS Managed Municipal Bond Fund | | | 31 |
| Principal Amount ($) | Value ($) | ||
| Texas, Grand Parkway Transportation Corp., System Toll Revenue, Series B, Prerefunded, 5.25%, 10/1/2051 | 20,000,000 | 20,927,524 | |
| Texas, New Hope Cultural Education Facilities Finance Corp., Educational Revenue, Cumberland Academy Project, Series A, 144A, 5.0%, 8/15/2050 | 4,250,000 | 4,293,499 | |
| Texas, New Hope Cultural Education Facilities Finance Corp., Retirement Facilities Revenue, Westminster Project, 4.0%, 11/1/2055 | 2,295,000 | 2,079,205 | |
| Texas, New Hope Cultural Education Facilities Finance Corp., Senior Living Revenue, Bridgemoor Plano Project, Series A, 7.25%, 12/1/2053 | 4,605,000 | 4,144,500 | |
| Texas, Private Activity Bond, Surface Transportation Corp. Revenue, Senior Lien Revenue, Infrastructure Group LLC, I-635 Managed Lanes Project: | |||
| Series A, 4.0%, 6/30/2038 | 1,145,000 | 1,137,870 | |
| Series A, 4.0%, 12/31/2038 | 1,145,000 | 1,137,713 | |
| Series A, 4.0%, 6/30/2039 | 875,000 | 866,621 | |
| Series A, 4.0%, 12/31/2039 | 1,010,000 | 1,000,133 | |
| Series A, 4.0%, 6/30/2040 | 815,000 | 805,615 | |
| Texas, Private Activity Bond, Surface Transportation Corp. Revenue, Senior Lien, North Mobility Partners Segments LLC, AMT, 5.0%, 6/30/2058 | 13,500,000 | 14,087,690 | |
| Texas, SA Energy Acquisition Public Facility Corp., Gas Supply Revenue, 5.5%, 8/1/2025, GTY: Goldman Sachs Group, Inc. | 2,750,000 | 2,953,336 | |
| Texas, State College Student Loan, AMT, 5.5%, 8/1/2028 | 5,620,000 | 6,309,102 | |
| Texas, State Municipal Gas Acquisition & Supply Corp. I, Gas Supply Revenue, Series D, 6.25%, 12/15/2026, GTY: Merrill Lynch & Co. | 13,210,000 | 14,225,391 | |
| Texas, State Transportation Commission, Turnpike Systems Revenue: | |||
| Series C, 5.0%, 8/15/2034 | 14,410,000 | 14,865,050 | |
| Series C, 5.0%, 8/15/2042 | 5,085,000 | 5,219,150 | |
| Texas, State Water Development Board Revenue, State Water Implementation Revenue Fund: | |||
| 4.0%, 10/15/2030 | 8,500,000 | 9,017,017 | |
| Series B, 4.0%, 10/15/2033 | 20,000,000 | 21,363,836 | |
| Series A, 4.0%, 10/15/2036 | 5,000,000 | 5,247,221 | |
| Series B, 4.0%, 10/15/2036 | 23,580,000 | 24,943,325 | |
| Series B, 4.0%, 10/15/2037 | 7,000,000 | 7,383,031 | |
| Series A, 4.0%, 10/15/2049 | 4,685,000 | 4,845,630 | |
| 297,839,938 | |||
| Utah 0.9% | |||
| Salt Lake City, UT, Airport Revenue: | |||
| Series A, AMT, 5.0%, 7/1/2032 | 5,000,000 | 5,426,998 | |
| 32 | | | DWS Managed Municipal Bond Fund |
| Principal Amount ($) | Value ($) | ||
| Series A, AMT, 5.0%, 7/1/2043 | 3,850,000 | 4,109,166 | |
| Series A, AMT, 5.0%, 7/1/2047 | 13,435,000 | 14,176,800 | |
| Series A, AMT, 5.0%, 7/1/2048 | 2,310,000 | 2,451,984 | |
| 26,164,948 | |||
| Vermont 0.0% | |||
| Vermont, State Educational & Health Buildings Financing Agency Revenue, Landmark College Project, Series A, 0.61% (c), 6/1/2022, LOC: TD Bank NA | 525,000 | 525,000 | |
| Virginia 3.3% | |||
| Stafford County, VA, Economic Development Authority, Hospital Facilities Revenue, Mary Washington Healthcare: | |||
| 5.0%, 10/1/2042 | 895,000 | 962,233 | |
| 5.0%, 10/1/2047 | 3,035,000 | 3,241,884 | |
| 5.0%, 10/1/2052 | 3,900,000 | 4,132,243 | |
| Virginia, Small Business Financing Authority Revenue, 95 Express Lanes LLC Project, AMT, 4.0%, 1/1/2048 | 4,010,000 | 3,863,078 | |
| Virginia, Small Business Financing Authority, Elizabeth River Crossings OPCO LLC Project: | |||
| AMT, 4.0%, 1/1/2038 (a) | 500,000 | 500,280 | |
| AMT, 4.0%, 1/1/2040 (a) | 3,775,000 | 3,765,231 | |
| Virginia, Small Business Financing Authority, I-495 Hot Lanes Project: | |||
| AMT, 5.0%, 12/31/2052 | 3,625,000 | 3,906,948 | |
| AMT, 5.0%, 12/31/2057 | 1,560,000 | 1,670,253 | |
| Virginia, Small Business Financing Authority, Private Activity Revenue, Transform 66 P3 Project: | |||
| AMT, 5.0%, 12/31/2052 | 19,655,000 | 20,423,151 | |
| AMT, 5.0%, 12/31/2056 | 5,000,000 | 5,187,292 | |
| Virginia, State College Building Authority, Educational Facilities Revenue, 21st Century, Series A, 4.0%, 2/1/2031 | 15,145,000 | 15,877,570 | |
| Virginia, State College Building Authority, Educational Facilities Revenue, Public Higher Education: | |||
| Series A, 4.0%, 9/1/2030 | 5,590,000 | 5,956,146 | |
| Series A, 4.0%, 9/1/2031 | 4,710,000 | 4,963,108 | |
| Virginia, State College Building Authority, Educational Facilities Revenue, Regent University Project, 4.0%, 6/1/2046 | 2,420,000 | 2,294,349 | |
| Virginia, State Commonwealth Transportation Board Revenue, Series A, 5.0%, 5/15/2031 | 5,120,000 | 5,801,556 | |
| Virginia, State Public Building Authority, Public Facility Revenue, Series B, AMT, 4.0%, 8/1/2039 | 9,700,000 | 10,200,467 | |
| 92,745,789 | |||
| DWS Managed Municipal Bond Fund | | | 33 |
| Principal Amount ($) | Value ($) | ||
| Washington 5.1% | |||
| King County, WA, School District No. 412 Shoreline: | |||
| 4.0%, 12/1/2035 | 5,505,000 | 5,854,542 | |
| 4.0%, 12/1/2037 | 15,000,000 | 15,927,021 | |
| 5.0%, 12/1/2031 | 14,345,000 | 16,426,425 | |
| Port of Seattle, WA, Revenue Bonds: | |||
| Series A, AMT, 5.0%, 5/1/2029 | 8,280,000 | 9,068,230 | |
| Series A, AMT, 5.0%, 5/1/2030 | 6,200,000 | 6,787,246 | |
| Series A, AMT, 5.0%, 5/1/2031 | 9,200,000 | 10,049,366 | |
| Seattle, WA, Municipal Light & Power Revenue, Series A, 4.0%, 1/1/2038 | 6,875,000 | 7,127,948 | |
| Spokane County, WA, School District No. 81, Series B, 4.0%, 12/1/2030 | 13,000,000 | 13,990,656 | |
| Washington, Energy Northwest Electric Revenue, Series C, 5.0%, 7/1/2030 | 14,405,000 | 16,516,481 | |
| Washington, State Convention Center Public Facilities District: | |||
| Series B, 3.0%, 7/1/2043 | 4,665,000 | 3,527,800 | |
| Series B, 3.0%, 7/1/2048 | 9,170,000 | 6,465,481 | |
| Series B, 3.0%, 7/1/2058 | 4,630,000 | 3,057,417 | |
| Washington, State General Obligation, Series C, 5.0%, 2/1/2031 | 16,000,000 | 18,121,075 | |
| Washington, State Higher Educational Facilities Authority, Seattle University Project, 4.0%, 5/1/2050 | 4,350,000 | 4,370,030 | |
| Washington, State Housing Finance Commission, Non-Profit Housing Revenue, Rockwood Retirement Communities Project, 144A, 5.0%, 1/1/2055 | 9,010,000 | 7,569,882 | |
| 144,859,600 | |||
| West Virginia 1.1% | |||
| West Virginia, Marshall University Revenue, Improvement & Refunding Bonds, Series A, 4.0%, 5/1/2050, INS: AGMC | 9,150,000 | 9,285,514 | |
| West Virginia, State Hospital Finance Authority, State University Health System Obligated Group, Series A, 5.0%, 6/1/2047 | 20,120,000 | 21,121,513 | |
| 30,407,027 | |||
| Wisconsin 2.1% | |||
| Wisconsin, Public Finance Authority Educational Facility Revenue, Noorba College of Osteopathic Media Project, Series B, 144A, 6.5%, 6/1/2045 | 10,000,000 | 7,906,615 | |
| Wisconsin, Public Finance Authority, Fargo-Moorhead Metropolitan Area Flood Risk Management Project, AMT, 4.0%, 9/30/2051 | 7,995,000 | 7,416,095 | |
| 34 | | | DWS Managed Municipal Bond Fund |
| Principal Amount ($) | Value ($) | ||
| Wisconsin, Public Finance Authority, Roseman University of Health Sciences Project: | |||
| 144A, 4.0%, 4/1/2042 | 495,000 | 449,820 | |
| 144A, 4.0%, 4/1/2052 | 845,000 | 728,387 | |
| Wisconsin, Public Finance Authority, Senior Living Community First Mortgage Revenue, Cedars Obligated Group: | |||
| 144A, 5.5%, 5/1/2039 | 1,235,000 | 1,159,894 | |
| 144A, 5.75%, 5/1/2054 | 4,455,000 | 4,130,996 | |
| Wisconsin, Public Finance Authority, Wisconsin Hotel Revenue, Senior Lien Grand Hyatt San Antonio Hotel: | |||
| Series A, 5.0%, 2/1/2062 | 13,750,000 | 14,308,574 | |
| Series B, 144A, 6.0%, 2/1/2062 | 5,000,000 | 5,015,224 | |
| Wisconsin, Public Financing Authority, Retirement Facilities Revenue, Southminster, Inc.: | |||
| 144A, 5.0%, 10/1/2043 | 1,560,000 | 1,531,792 | |
| 144A, 5.0%, 10/1/2053 | 12,415,000 | 11,829,619 | |
| Wisconsin, State Health & Educational Facilities Authority Revenue, Marshfield Clinic Health System, Inc., Series A, 0.65% (c), 6/1/2022, LOC: Barclays Bank PLC | 4,285,000 | 4,285,000 | |
| 58,762,016 | |||
| Guam 0.0% | |||
| Guam, Government Waterworks Authority, Water & Wastewater System Revenue, Series A, 5.0%, 1/1/2050 | 1,090,000 | 1,197,638 | |
| Puerto Rico 1.1% | |||
| Puerto Rico, General Obligation: | |||
| Series A1, 4.0%, 7/1/2041 | 2,075,674 | 1,971,735 | |
| Series A1, 4.0%, 7/1/2046 | 2,576,087 | 2,410,116 | |
| Puerto Rico, Sales Tax Financing Corp., Sales Tax Revenue: | |||
| Series A-1, Zero Coupon, 7/1/2046 | 68,849,000 | 20,948,789 | |
| Series A-1, 5.0%, 7/1/2058 | 7,000,000 | 7,134,509 | |
| 32,465,149 | |||
| Other 0.1% | |||
| Nuveen AMT-Free Municipal Credit Income Fund, Series C, 1.48% (c), 6/1/2022 | 4,200,000 | 4,200,000 | |
| Total Municipal Investments (Cost $2,827,097,631) | 2,816,552,754 | ||
| DWS Managed Municipal Bond Fund | | | 35 |
| Principal Amount ($) | Value ($) | ||
| Underlying Municipal Bonds of Inverse Floaters (d) 0.4% | |||
| New York | |||
| New York, General Obligation, 5.0%, 4/1/2037 (e) (Cost $11,975,833) | 10,000,000 | 11,080,285 | |
| Trust: New York, NY, General Obligation, Series 2020-XM0900, 144A, 15.95%, 4/1/2026, Leverage Factor at purchase date: 4 to 1 | |||
| Corporate Bonds 0.4% | |||
| Consumer Discretionary | |||
| Grand Canyon University, 5.125%, 10/1/2028 (Cost $10,835,000) | 10,835,000 | 10,428,687 | |
| Shares | Value ($) | ||
| Closed-End Investment Companies 0.1% | |||
| Nuveen Quality Municipal Income Fund (Cost $5,031,208) | 344,000 | 4,506,400 | |
| Open-End Investment Companies 0.0% | |||
| BlackRock Liquidity Funds MuniCash Portfolio, Institutional Shares, 0.54% (f) (Cost $15,535) | 15,338 | 15,340 | |
| % of Net Assets | Value ($) | ||
| Total Investment Portfolio (Cost $2,854,955,207) | 100.8 | 2,842,583,466 | |
| Floating Rate Notes (d) | (0.3) | (7,500,000) | |
| Other Assets and Liabilities, Net | (0.5) | (15,343,038) | |
| Net Assets | 100.0 | 2,819,740,428 | |
| (a) | When-issued security. |
| (b) | Variable or floating rate security. These securities are shown at their current rate as of May 31, 2022. For securities based on a published reference rate and spread, the reference rate and spread are indicated within the description above. Certain variable rate securities are not based on a published reference rate and spread but adjust periodically based on current market conditions, prepayment of underlying positions and/or other variables. Securities with a floor or ceiling feature are disclosed at the inherent rate, where applicable. |
| (c) | Variable rate demand notes and variable rate demand preferred shares are securities whose interest rates are reset periodically (usually daily mode or weekly mode) by remarketing agents based on current market levels, and are not directly set as a fixed spread to a reference rate. These securities may be redeemed at par by the holder through a put or tender feature, and are shown at their current rates as of May 31, 2022. Date shown reflects the earlier of demand date or stated maturity date. |
| 36 | | | DWS Managed Municipal Bond Fund |
| (d) | Securities represent the underlying municipal obligations of inverse floating rate obligations held by the Fund. The Floating Rate Notes represents leverage to the Fund and is the amount owed to the floating rate note holders. |
| (e) | Security forms part of the below inverse floater. The Fund accounts for these inverse floaters as a form of secured borrowing, by reflecting the value of the underlying bond in the investments of the Fund and the amount owed to the floating rate note holder as a liability. |
| (f) | Current yield; not a coupon rate. |
| 144A: Security exempt from registration under Rule 144A of the Securities Act of 1933. These securities may be resold in transactions exempt from registration, normally to qualified institutional buyers. |
| AGMC: Assured Guaranty Municipal Corp. |
| AMT: Subject to alternative minimum tax. |
| GTY: Guaranty Agreement |
| INS: Insured |
| LOC: Letter of Credit |
| NATL: National Public Finance Guarantee Corp. |
| Prerefunded: Bonds which are prerefunded are collateralized usually by U.S. Treasury securities which are held in escrow and used to pay principal and interest on tax-exempt issues and to retire the bonds in full at the earliest refunding date. |
| DWS Managed Municipal Bond Fund | | | 37 |
| Assets | Level 1 | Level 2 | Level 3 | Total |
| Municipal Investments (a) | $ — | $2,827,633,039 | $— | $2,827,633,039 |
| Corporate Bonds | — | 10,428,687 | — | 10,428,687 |
| Closed-End Investment Companies | 4,506,400 | — | — | 4,506,400 |
| Open-End Investment Companies | 15,340 | — | — | 15,340 |
| Total | $4,521,740 | $2,838,061,726 | $ — | $2,842,583,466 |
| (a) | See Investment Portfolio for additional detailed categorizations. |
| 38 | | | DWS Managed Municipal Bond Fund |
| Assets | |
| Investment in securities, at value (cost $2,854,955,207) | $ 2,842,583,466 |
| Receivable for investments sold | 24,681,132 |
| Receivable for Fund shares sold | 189,350,799 |
| Dividends receivable | 20,468 |
| Interest receivable | 36,294,950 |
| Other assets | 64,214 |
| Total assets | 3,092,995,029 |
| Liabilities | |
| Cash overdraft | 10,001,578 |
| Payable for investments purchased | 14,251,927 |
| Payable for investments purchased — when-issued securities | 27,946,786 |
| Payable for Fund shares redeemed | 209,539,148 |
| Payable for floating rate notes issued | 7,500,000 |
| Distributions payable | 1,623,956 |
| Accrued management fee | 793,287 |
| Accrued Trustees' fees | 31,548 |
| Other accrued expenses and payables | 1,566,371 |
| Total liabilities | 273,254,601 |
| Net assets, at value | $ 2,819,740,428 |
| Net Assets Consist of | |
| Distributable earnings (loss) | (44,786,076) |
| Paid-in capital | 2,864,526,504 |
| Net assets, at value | $ 2,819,740,428 |
| DWS Managed Municipal Bond Fund | | | 39 |
| Net Asset Value | |
| Class A | |
| Net Asset Value and redemption price per share ($1,008,289,407 ÷ 121,567,874 outstanding shares of beneficial interest, $.01 par value, unlimited number of shares authorized) | $ 8.29 |
| Maximum offering price per share (100 ÷ 97.25 of $8.29) | $ 8.52 |
| Class C | |
| Net Asset Value, offering and redemption price (subject to contingent deferred sales charge) per share ($43,388,756 ÷ 5,232,057 outstanding shares of beneficial interest, $.01 par value, unlimited number of shares authorized) | $ 8.29 |
| Class S | |
| Net Asset Value, offering and redemption price per share ($1,393,035,342 ÷ 167,731,679 outstanding shares of beneficial interest, $.01 par value, unlimited number of shares authorized) | $ 8.31 |
| Institutional Class | |
| Net Asset Value, offering and redemption price per share ($375,026,923 ÷ 45,196,500 outstanding shares of beneficial interest, $.01 par value, unlimited number of shares authorized) | $ 8.30 |
| 40 | | | DWS Managed Municipal Bond Fund |
| Investment Income | |
| Income: | |
| Interest | $ 118,090,404 |
| Dividends | 81,872 |
| Total income | 118,172,276 |
| Expenses: | |
| Management fee | 11,413,874 |
| Administration fee | 3,360,780 |
| Services to shareholders | 4,310,799 |
| Distribution and service fees | 3,363,484 |
| Custodian fee | 31,261 |
| Professional fees | 133,755 |
| Reports to shareholders | 103,852 |
| Registration fees | 106,867 |
| Trustees' fees and expenses | 124,828 |
| Interest expense and fees on floating rate notes issued | 58,326 |
| Other | 177,840 |
| Total expenses before expense reductions | 23,185,666 |
| Expense reductions | (1,332,649) |
| Total expenses after expense reductions | 21,853,017 |
| Net investment income | 96,319,259 |
| Realized and Unrealized Gain (Loss) | |
| Net realized gain (loss) from investments | (20,145,681) |
| Change in net unrealized appreciation (depreciation) on investments | (359,660,428) |
| Net gain (loss) | (379,806,109) |
| Net increase (decrease) in net assets resulting from operations | $ (283,486,850) |
| DWS Managed Municipal Bond Fund | | | 41 |
| Years Ended May 31, | ||
| Increase (Decrease) in Net Assets | 2022 | 2021 |
| Operations: | ||
| Net investment income | $ 96,319,259 | $ 111,312,866 |
| Net realized gain (loss) | (20,145,681) | 34,657,578 |
| Change in net unrealized appreciation (depreciation) | (359,660,428) | 137,925,860 |
| Net increase (decrease) in net assets resulting from operations | (283,486,850) | 283,896,304 |
| Distributions to shareholders: | ||
| Class A | (41,691,860) | (34,811,175) |
| Class C | (1,523,484) | (2,039,676) |
| Class S | (65,291,541) | (59,517,942) |
| Institutional Class | (18,945,043) | (15,557,493) |
| Total distributions | (127,451,928) | (111,926,286) |
| Fund share transactions: | ||
| Proceeds from shares sold | 1,007,687,942 | 566,971,382 |
| Reinvestment of distributions | 113,126,543 | 98,318,846 |
| Payments for shares redeemed | (1,661,285,146) | (934,083,518) |
| Net increase (decrease) in net assets from Fund share transactions | (540,470,661) | (268,793,290) |
| Increase (decrease) in net assets | (951,409,439) | (96,823,272) |
| Net assets at beginning of period | 3,771,149,867 | 3,867,973,139 |
| Net assets at end of period | $ 2,819,740,428 | $3,771,149,867 |
| 42 | | | DWS Managed Municipal Bond Fund |
| DWS Managed Municipal Bond Fund — Class A | |||||
| Years Ended May 31, | |||||
| 2022 | 2021 | 2020 | 2019 | 2018 | |
| Selected Per Share Data | |||||
| Net asset value, beginning of period | $9.39 | $8.98 | $9.21 | $8.98 | $9.17 |
| Income (loss) from investment operations: | |||||
| Net investment income | .24 | .25 | .28 | .28 | .28 |
| Net realized and unrealized gain (loss) | (1.02) | .41 | (.21) | .23 | (.19) |
| Total from investment operations | (.78) | .66 | .07 | .51 | .09 |
| Less distributions from: | |||||
| Net investment income | (.24) | (.25) | (.28) | (.28) | (.28) |
| Net realized gains | (.08) | (.00) * | (.02) | (.00) * | (.00) * |
| Total distributions | (.32) | (.25) | (.30) | (.28) | (.28) |
| Net asset value, end of period | $8.29 | $9.39 | $8.98 | $9.21 | $8.98 |
| Total Return (%)a | (8.53) | 7.52 | .64 | 5.85 | 1.00 |
| Ratios to Average Net Assets and Supplemental Data | |||||
| Net assets, end of period ($ millions) | 1,008 | 1,251 | 1,220 | 1,315 | 1,507 |
| Ratio of expenses (including interest expense) (%)b | .76 | .76 | .76 | .77 | .77 |
| Ratio of expenses (excluding interest expense) (%) | .76 | .76 | .76 | .77 | .76 |
| Ratio of net investment income (%) | 2.65 | 2.77 | 3.02 | 3.18 | 3.08 |
| Portfolio turnover rate (%) | 39 | 29 | 35 | 39 | 42 |
| a | Total return does not reflect the effect of any sales charges. |
| b | Interest expense represents interest and fees on short-term floating rate notes issued in conjunction with inverse floating rate securities. Interest income from such transactions is included in income from investment operations. |
| * | Amount is less than $.005. |
| DWS Managed Municipal Bond Fund | | | 43 |
| DWS Managed Municipal Bond Fund — Class C | |||||
| Years Ended May 31, | |||||
| 2022 | 2021 | 2020 | 2019 | 2018 | |
| Selected Per Share Data | |||||
| Net asset value, beginning of period | $9.39 | $8.98 | $9.21 | $8.98 | $9.17 |
| Income (loss) from investment operations: | |||||
| Net investment income | .17 | .18 | .20 | .21 | .21 |
| Net realized and unrealized gain (loss) | (1.02) | .41 | (.21) | .23 | (.19) |
| Total from investment operations | (.85) | .59 | (.01) | .44 | .02 |
| Less distributions from: | |||||
| Net investment income | (.17) | (.18) | (.20) | (.21) | (.21) |
| Net realized gains | (.08) | (.00) * | (.02) | (.00) * | (.00) * |
| Total distributions | (.25) | (.18) | (.22) | (.21) | (.21) |
| Net asset value, end of period | $8.29 | $9.39 | $8.98 | $9.21 | $8.98 |
| Total Return (%)a | (9.24) b | 6.67 | (.15) | 5.02 b | .21 |
| Ratios to Average Net Assets and Supplemental Data | |||||
| Net assets, end of period ($ millions) | 43 | 65 | 124 | 151 | 208 |
| Ratio of expenses before expense reductions (including interest expense) (%)c | 1.56 | 1.55 | 1.55 | 1.57 | 1.56 |
| Ratio of expenses after expense reductions (including interest expense) (%)c | 1.54 | 1.55 | 1.55 | 1.56 | 1.56 |
| Ratio of expenses after expense reductions (excluding interest expense) (%) | 1.54 | 1.55 | 1.55 | 1.56 | 1.55 |
| Ratio of net investment income (%) | 1.87 | 1.99 | 2.23 | 2.39 | 2.29 |
| Portfolio turnover rate (%) | 39 | 29 | 35 | 39 | 42 |
| a | Total return does not reflect the effect of any sales charges. |
| b | Total return would have been lower had certain expenses not been reduced. |
| c | Interest expense represents interest and fees on short-term floating rate notes issued in conjunction with inverse floating rate securities. Interest income from such transactions is included in income from investment operations. |
| * | Amount is less than $.005. |
| 44 | | | DWS Managed Municipal Bond Fund |
| DWS Managed Municipal Bond Fund — Class S | |||||
| Years Ended May 31, | |||||
| 2022 | 2021 | 2020 | 2019 | 2018 | |
| Selected Per Share Data | |||||
| Net asset value, beginning of period | $9.40 | $8.99 | $9.23 | $9.00 | $9.18 |
| Income (loss) from investment operations: | |||||
| Net investment income | .26 | .27 | .29 | .30 | .30 |
| Net realized and unrealized gain (loss) | (1.01) | .41 | (.22) | .23 | (.18) |
| Total from investment operations | (.75) | .68 | .07 | .53 | .12 |
| Less distributions from: | |||||
| Net investment income | (.26) | (.27) | (.29) | (.30) | (.30) |
| Net realized gains | (.08) | (.00) * | (.02) | (.00) * | (.00) * |
| Total distributions | (.34) | (.27) | (.31) | (.30) | (.30) |
| Net asset value, end of period | $8.31 | $9.40 | $8.99 | $9.23 | $9.00 |
| Total Return (%)a | (8.20) | 7.73 | .73 | 6.07 | 1.32 |
| Ratios to Average Net Assets and Supplemental Data | |||||
| Net assets, end of period ($ millions) | 1,393 | 1,898 | 2,041 | 2,283 | 2,670 |
| Ratio of expenses before expense reductions (including interest expense) (%)b | .61 | .61 | .62 | .61 | .62 |
| Ratio of expenses after expense reductions (including interest expense) (%)b | .54 | .55 | .56 | .56 | .58 |
| Ratio of expenses after expense reductions (excluding interest expense) (%) | .54 | .55 | .56 | .56 | .56 |
| Ratio of net investment income (%) | 2.87 | 2.98 | 3.22 | 3.39 | 3.27 |
| Portfolio turnover rate (%) | 39 | 29 | 35 | 39 | 42 |
| a | Total return would have been lower had certain expenses not been reduced. |
| b | Interest expense represents interest and fees on short-term floating rate notes issued in conjunction with inverse floating rate securities. Interest income from such transactions is included in income from investment operations. |
| * | Amount is less than $.005. |
| DWS Managed Municipal Bond Fund | | | 45 |
| DWS Managed Municipal Bond Fund — Institutional Class | |||||
| Years Ended May 31, | |||||
| 2022 | 2021 | 2020 | 2019 | 2018 | |
| Selected Per Share Data | |||||
| Net asset value, beginning of period | $9.40 | $8.99 | $9.22 | $8.99 | $9.17 |
| Income (loss) from investment operations: | |||||
| Net investment income | .26 | .27 | .30 | .30 | .30 |
| Net realized and unrealized gain (loss) | (1.02) | .41 | (.21) | .23 | (.18) |
| Total from investment operations | (.76) | .68 | .09 | .53 | .12 |
| Less distributions from: | |||||
| Net investment income | (.26) | (.27) | (.30) | (.30) | (.30) |
| Net realized gains | (.08) | (.00) * | (.02) | (.00) * | (.00) * |
| Total distributions | (.34) | (.27) | (.32) | (.30) | (.30) |
| Net asset value, end of period | $8.30 | $9.40 | $8.99 | $9.22 | $8.99 |
| Total Return (%) | (8.31) a | 7.75 | .86 | 6.09 | 1.33 |
| Ratios to Average Net Assets and Supplemental Data | |||||
| Net assets, end of period ($ millions) | 375 | 557 | 484 | 340 | 241 |
| Ratio of expenses before expense reductions (including interest expense) (%)b | .55 | .54 | .55 | .55 | .56 |
| Ratio of expenses after expense reductions (including interest expense) (%)b | .53 | .54 | .55 | .55 | .56 |
| Ratio of expenses after expense reductions (excluding interest expense) (%) | .53 | .54 | .55 | .55 | .55 |
| Ratio of net investment income (%) | 2.87 | 2.99 | 3.22 | 3.41 | 3.29 |
| Portfolio turnover rate (%) | 39 | 29 | 35 | 39 | 42 |
| a | Total return would have been lower had certain expenses not been reduced. |
| b | Interest expense represents interest and fees on short-term floating rate notes issued in conjunction with inverse floating rate securities. Interest income from such transactions is included in income from investment operations. |
| * | Amount is less than $.005. |
| 46 | | | DWS Managed Municipal Bond Fund |
| A. | Organization and Significant Accounting Policies |
| DWS Managed Municipal Bond Fund | | | 47 |
| 48 | | | DWS Managed Municipal Bond Fund |
| DWS Managed Municipal Bond Fund | | | 49 |
| 50 | | | DWS Managed Municipal Bond Fund |
| Undistributed tax-exempt income | $ 5,311,019 |
| Undistributed ordinary income* | $ 2,419,266 |
| Net unrealized appreciation (depreciation) on investments | $ (10,301,752) |
| DWS Managed Municipal Bond Fund | | | 51 |
| Years Ended May 31, | ||
| 2022 | 2021 | |
| Distributions from tax-exempt income | $ 95,136,475 | $ 110,359,830 |
| Distributions from ordinary income* | $ 2,373,668 | $ 1,566,456 |
| Distributions from long-term capital gains | $ 29,941,785 | $ — |
| * | For tax purposes, short-term capital gain distributions are considered ordinary income distributions. |
| B. | Purchases and Sales of Securities |
| C. | Related Parties |
| 52 | | | DWS Managed Municipal Bond Fund |
| First $250 million of the Fund’s average daily net assets | .365% |
| Next $750 million of such net assets | .345% |
| Next $1.5 billion of such net assets | .325% |
| Next $2.5 billion of such net assets | .315% |
| Next $2.5 billion of such net assets | .295% |
| Next $2.5 billion of such net assets | .275% |
| Next $2.5 billion of such net assets | .255% |
| Over $12.5 billion of such net assets | .235% |
| Class A | .80% |
| Class C | 1.55% |
| Class S | .55% |
| Institutional Class | .55% |
| Class A | .78% | |
| Class C | 1.53% | |
| Class S | .53% | |
| Institutional Class | .53% |
| DWS Managed Municipal Bond Fund | | | 53 |
| Class C | $ 9,939 |
| Class S | 1,220,845 |
| Institutional Class | 101,865 |
| $ 1,332,649 |
| Services to Shareholders | Total Aggregated | Unpaid at May 31, 2022 |
| Class A | $ 100,687 | $ 16,659 |
| Class C | 999 | 161 |
| Class S | 221,809 | 36,510 |
| Institutional Class | 945 | 161 |
| $ 324,440 | $ 53,491 |
| 54 | | | DWS Managed Municipal Bond Fund |
| Sub-Recordkeeping | Total Aggregated |
| Class A | $ 775,142 |
| Class C | 57,991 |
| Class S | 2,532,472 |
| Institutional Class | 518,242 |
| $ 3,883,847 |
| Distribution Fee | Total Aggregated | Unpaid at May 31, 2022 |
| Class C | $ 413,791 | $ 27,452 |
| Service Fee | Total Aggregated | Unpaid at May 31, 2022 | Annual Rate |
| Class A | $ 2,811,855 | $ 415,744 | .24% |
| Class C | 137,838 | 17,519 | .25% |
| $ 2,949,693 | $ 433,263 |
| DWS Managed Municipal Bond Fund | | | 55 |
| D. | Line of Credit |
| 56 | | | DWS Managed Municipal Bond Fund |
| E. | Fund Share Transactions |
| Year Ended May 31, 2022 | Year Ended May 31, 2021 | |||
| Shares | Dollars | Shares | Dollars | |
| Shares sold | ||||
| Class A | 5,727,227 | $ 51,742,517 | 11,375,090 | $ 105,416,471 |
| Class C | 341,980 | 3,095,214 | 603,092 | 5,584,487 |
| Class S | 92,438,496 | 806,740,925 | 26,800,410 | 247,844,626 |
| Institutional Class | 16,249,439 | 146,109,286 | 22,386,499 | 208,125,798 |
| $ 1,007,687,942 | $ 566,971,382 | |||
| Shares issued to shareholders in reinvestment of distributions | ||||
| Class A | 4,054,958 | $ 36,802,812 | 3,284,552 | $ 30,438,406 |
| Class C | 157,532 | 1,433,228 | 205,430 | 1,902,356 |
| Class S | 6,324,687 | 57,523,065 | 5,596,811 | 51,923,976 |
| Institutional Class | 1,910,465 | 17,367,438 | 1,515,480 | 14,054,108 |
| $ 113,126,543 | $ 98,318,846 | |||
| Shares redeemed | ||||
| Class A | (21,433,489) | $ (190,506,243) | (17,250,661) | $ (159,798,903) |
| Class C | (2,175,324) | (19,694,384) | (7,656,342) | (71,149,620) |
| Class S | (132,864,925) | (1,164,618,504) | (57,490,998) | (532,464,575) |
| Institutional Class | (32,252,168) | (286,466,015) | (18,427,309) | (170,670,420) |
| $ (1,661,285,146) | $ (934,083,518) | |||
| Net increase (decrease) | ||||
| Class A | (11,651,304) | $ (101,960,914) | (2,591,019) | $ (23,944,026) |
| Class C | (1,675,812) | (15,165,942) | (6,847,820) | (63,662,777) |
| Class S | (34,101,742) | (300,354,514) | (25,093,777) | (232,695,973) |
| Institutional Class | (14,092,264) | (122,989,291) | 5,474,670 | 51,509,486 |
| $ (540,470,661) | $ (268,793,290) | |||
| F. | Other — COVID-19 Pandemic |
| DWS Managed Municipal Bond Fund | | | 57 |
| 58 | | | DWS Managed Municipal Bond Fund |
| DWS Managed Municipal Bond Fund | | | 59 |

| 60 | | | DWS Managed Municipal Bond Fund |
| — | Actual Fund Return. This helps you estimate the actual dollar amount of ongoing expenses (but not transaction costs) paid on a $1,000 investment in the Fund using the Fund’s actual return during the period. To estimate the expenses you paid over the period, simply divide your account value by $1,000 (for example, an $8,600 account value divided by $1,000 = 8.6), then multiply the result by the number in the “Expenses Paid per $1,000” line under the share class you hold. |
| — | Hypothetical 5% Fund Return. This helps you to compare your Fund’s ongoing expenses (but not transaction costs) with those of other mutual funds using the Fund’s actual expense ratio and a hypothetical rate of return of 5% per year before expenses. Examples using a 5% hypothetical fund return may be found in the shareholder reports of other mutual funds. The hypothetical account values and expenses may not be used to estimate the actual ending account balance or expenses you paid for the period. |
| DWS Managed Municipal Bond Fund | | | 61 |
| Actual Fund Return | Class A | Class C | Class S | Institutional Class |
| Beginning Account Value 12/1/21 | $1,000.00 | $1,000.00 | $1,000.00 | $1,000.00 |
| Ending Account Value 5/31/22 | $ 908.80 | $ 905.40 | $ 910.10 | $ 910.00 |
| Expenses Paid per $1,000* | $ 3.66 | $ 7.27 | $ 2.52 | $ 2.52 |
| Hypothetical 5% Fund Return | Class A | Class C | Class S | Institutional Class |
| Beginning Account Value 12/1/21 | $1,000.00 | $1,000.00 | $1,000.00 | $1,000.00 |
| Ending Account Value 5/31/22 | $1,021.09 | $1,017.30 | $1,022.29 | $1,022.29 |
| Expenses Paid per $1,000* | $ 3.88 | $ 7.70 | $ 2.67 | $ 2.67 |
| * | Expenses are equal to the Fund’s annualized expense ratio for each share class, multiplied by the average account value over the period, multiplied by 182 (the number of days in the most recent six-month period), then divided by 365. |
| Annualized Expense Ratios | Class A | Class C | Class S | Institutional Class |
| DWS Managed Municipal Bond Fund | .77% | 1.53% | .53% | .53% |
| Tax Information | (Unaudited) |
| 62 | | | DWS Managed Municipal Bond Fund |
| DWS Managed Municipal Bond Fund | | | 63 |
| — | During the entire process, all of the Fund’s Trustees were independent of DIMA and its affiliates (the “Independent Trustees” ). |
| — | The Board met frequently during the past year to discuss fund matters and dedicated a substantial amount of time to contract review matters. Over the course of several months, the Board reviewed extensive materials received from DIMA, independent third parties and independent counsel. These materials included an analysis of the Fund’s performance, fees and expenses, and profitability from a fee consultant retained by the Fund’s Independent Trustees (the “Fee Consultant” ). |
| — | The Board also received extensive information throughout the year regarding performance of the Fund. |
| — | The Independent Trustees regularly met privately with counsel to discuss contract review and other matters. In addition, the Independent Trustees were advised by the Fee Consultant in the course of their review of the Fund’s contractual arrangements and considered a comprehensive report prepared by the Fee Consultant in connection with their deliberations. |
| — | In connection with reviewing the Agreement, the Board also reviewed the terms of the Fund’s Rule 12b-1 plan, distribution agreement, administrative services agreement, transfer agency agreement and other material service agreements. |
| 64 | | | DWS Managed Municipal Bond Fund |
| DWS Managed Municipal Bond Fund | | | 65 |
| 66 | | | DWS Managed Municipal Bond Fund |
| DWS Managed Municipal Bond Fund | | | 67 |
| 68 | | | DWS Managed Municipal Bond Fund |
| Name, Year of Birth, Position with the Trust/ Corporation and Length of Time Served1 | Business Experience and Directorships During the Past Five Years | Number of Funds in DWS Fund Complex Overseen | Other Directorships Held by Board Member |
| Keith R. Fox, CFA (1954)Chairperson since 2017, and Board Member since 1996 | Managing General Partner, Exeter Capital Partners (a series of private investment funds) (since 1986). Directorships: Progressive International Corporation (kitchen goods designer and distributor); former Chairman, National Association of Small Business Investment Companies; Former Directorships: ICI Mutual Insurance Company; BoxTop Media Inc. (advertising); Sun Capital Advisers Trust (mutual funds) | 70 | — |
| DWS Managed Municipal Bond Fund | | | 69 |
| Name, Year of Birth, Position with the Trust/ Corporation and Length of Time Served1 | Business Experience and Directorships During the Past Five Years | Number of Funds in DWS Fund Complex Overseen | Other Directorships Held by Board Member |
| John W. Ballantine (1946)Board Member since 1999 | Retired; formerly, Executive Vice President and Chief Risk Management Officer, First Chicago NBD Corporation/The First National Bank of Chicago (1996–1998); Executive Vice President and Head of International Banking (1995–1996); Not-for-Profit Directorships: Palm Beach Civic Assn.; Window to the World Communications (public media); Life Director of Harris Theater for Music and Dance (Chicago); Life Director of Hubbard Street Dance Chicago; Former Directorships: Director and Chairman of the Board, Healthways, Inc.2 (population wellbeing and wellness services) (2003–2014); Stockwell Capital Investments PLC (private equity); Enron Corporation; FNB Corporation; Tokheim Corporation; First Oak Brook Bancshares, Inc.; Oak Brook Bank; Portland General Electric2 (utility company (2003–2021); and Prisma Energy International; Former Not-for-Profit Directorships: Public Radio International | 70 | — |
| Dawn-Marie Driscoll (1946)Board Member since 1987 | Advisory Board and former Executive Fellow, Hoffman Center for Business Ethics, Bentley University; formerly: Partner, Palmer & Dodge (law firm) (1988–1990); Vice President of Corporate Affairs and General Counsel, Filene’s (retail) (1978–1988); Directorships: Trustee and former Chairman of the Board, Southwest Florida Community Foundation (charitable organization); Former Directorships: ICI Mutual Insurance Company (2007–2015); Sun Capital Advisers Trust (mutual funds) (2007–2012), Investment Company Institute (audit, executive, nominating committees) and Independent Directors Council (governance, executive committees) | 70 | — |
| 70 | | | DWS Managed Municipal Bond Fund |
| Name, Year of Birth, Position with the Trust/ Corporation and Length of Time Served1 | Business Experience and Directorships During the Past Five Years | Number of Funds in DWS Fund Complex Overseen | Other Directorships Held by Board Member |
| Richard J. Herring (1946)Board Member since 1990 | Jacob Safra Professor of International Banking and Professor of Finance, The Wharton School, University of Pennsylvania (since July 1972); formerly: Director, The Wharton Financial Institutions Center (1994–2020); Vice Dean and Director, Wharton Undergraduate Division (1995–2000) and Director, The Lauder Institute of International Management Studies (2000–2006); Member FDIC Systemic Risk Advisory Committee since 2011, member Systemic Risk Council since 2012 and member of the Advisory Board at the Yale Program on Financial Stability since 2013; Former Directorships: Co-Chair of the Shadow Financial Regulatory Committee (2003–2015), Executive Director of The Financial Economists Roundtable (2008–2015), Director of The Thai Capital Fund (2007–2013), Director of The Aberdeen Singapore Fund (2007–2018), Director, The Aberdeen Japan Fund (2007-2021) and Nonexecutive Director of Barclays Bank DE (2010–2018) | 70 | — |
| William McClayton (1944)Board Member since 2004 | Private equity investor (since October 2009); formerly: Managing Director, Diamond Management & Technology Consultants, Inc. (global consulting firm) (2001–2009); Senior Partner, Arthur Andersen LLP (accounting) (1966–2001); Former Directorships: Board of Managers, YMCA of Metropolitan Chicago; Trustee, Ravinia Festival | 70 | — |
| Chad D. Perry (1972)Board Member or Advisory Board Member since 20213 | Executive Vice President, General Counsel and Secretary, Tanger Factory Outlet Centers, Inc.2 (since 2011); formerly Executive Vice President and Deputy General Counsel, LPL Financial Holdings Inc.2 (2006–2011); Senior Corporate Counsel, EMC Corporation (2005–2006); Associate, Ropes & Gray LLP (1997–2005) | 21 4 | Director - Great Elm Capital Corp. (business development company) (since 2022) |
| DWS Managed Municipal Bond Fund | | | 71 |
| Name, Year of Birth, Position with the Trust/ Corporation and Length of Time Served1 | Business Experience and Directorships During the Past Five Years | Number of Funds in DWS Fund Complex Overseen | Other Directorships Held by Board Member |
| Rebecca W. Rimel (1951)Board Member since 1995 | Director, The Bridgespan Group (nonprofit organization) (since October 2020); formerly: Executive Vice President, The Glenmede Trust Company (investment trust and wealth management) (1983–2004); Board Member, Investor Education (charitable organization) (2004–2005); Former Directorships: Trustee, Executive Committee, Philadelphia Chamber of Commerce (2001–2007); Director, Viasys Health Care2 (January 2007–June 2007); Trustee, Thomas Jefferson Foundation (charitable organization) (1994–2012); President, Chief Executive Officer and Director (1994–2020) and Senior Advisor (2020-2021), The Pew Charitable Trusts (charitable organization); Director, BioTelemetry Inc.2 (acquired by Royal Philips in 2021) (healthcare) (2009–2021); Director, Becton Dickinson and Company2 (medical technology company) (2012-2022) | 70 | — |
| Catherine Schrand (1964)Board Member or Advisory Board Member since 20213 | Celia Z. Moh Professor of Accounting (since 2016) and Professor of Accounting (since 1994), The Wharton School, University of Pennsylvania; formerly Vice Dean, Wharton Doctoral Programs (2016–2019) | 21 4 | — |
| William N. Searcy, Jr. (1946)Board Member since 1993 | Private investor since October 2003; formerly: Pension & Savings Trust Officer, Sprint Corporation2 (telecommunications) (November 1989–September 2003); Former Directorships: Trustee, Sun Capital Advisers Trust (mutual funds) (1998–2012) | 70 | — |
| 72 | | | DWS Managed Municipal Bond Fund |
| Name, Year of Birth, Position with the Trust/Corporation and Length of Time Served6 | Business Experience and Directorships During the Past Five Years |
| Hepsen Uzcan7 (1974)President and Chief Executive Officer, 2017–present | Fund Administration (Head since 2017), DWS; Secretary, DWS USA Corporation (2018–present); Assistant Secretary, DWS Distributors, Inc. (2018–present); Director and Vice President, DWS Service Company (2018–present); Assistant Secretary, DWS Investment Management Americas, Inc. (2018–present); Director and President, DB Investment Managers, Inc. (2018–present); President and Chief Executive Officer, The European Equity Fund, Inc., The New Germany Fund, Inc. and The Central and Eastern Europe Fund, Inc. (2017–present); formerly: Vice President for the Deutsche funds (2016–2017); Assistant Secretary for the DWS funds (2013–2019); Assistant Secretary, The European Equity Fund, Inc., The New Germany Fund, Inc. and The Central and Eastern Europe Fund, Inc. (2013–2020); Directorships: Interested Director, The European Equity Fund, Inc., The New Germany Fund, Inc. and The Central and Eastern Europe Fund, Inc. (since June 25, 2020); ICI Mutual Insurance Company (since October 16, 2020); and Episcopalian Charities of New York (2018–present) |
| John Millette8 (1962)Vice President and Secretary, 1999–present | Legal (Associate General Counsel), DWS; Chief Legal Officer, DWS Investment Management Americas, Inc. (2015–present); Director and Vice President, DWS Trust Company (2016–present); Secretary, DBX ETF Trust (2020–present); Vice President, DBX Advisors LLC (2021–present); Secretary, The European Equity Fund, Inc., The New Germany Fund, Inc. and The Central and Eastern Europe Fund, Inc. 2011–present); formerly: Secretary, Deutsche Investment Management Americas Inc. (2015–2017); and Assistant Secretary, DBX ETF Trust (2019–2020) |
| Ciara Crawford9 (1984)Assistant Secretary, (2019–present) | Fund Administration (Specialist), DWS (2015–present); formerly, Legal Assistant at Accelerated Tax Solutions |
| Diane Kenneally8 (1966)Chief Financial Officer and Treasurer, 2018–present | Fund Administration Treasurer’s Office (Co-Head since 2018), DWS; Treasurer, Chief Financial Officer and Controller, DBX ETF Trust (2019–present); Treasurer and Chief Financial Officer, The European Equity Fund, Inc., The New Germany Fund, Inc. and The Central and Eastern Europe Fund, Inc. (2018–present); formerly: Assistant Treasurer for the DWS funds (2007–2018) |
| Paul Antosca8 (1957)Assistant Treasurer, 2007–present | Fund Administration Tax (Head), DWS; and Assistant Treasurer, DBX ETF Trust (2019–present) |
| Sheila Cadogan8 (1966)Assistant Treasurer, 2017–present | Fund Administration Treasurer’s Office (Co-Head since 2018), DWS; Director and Vice President, DWS Trust Company (2018–present); Assistant Treasurer, DBX ETF Trust (2019–present); Assistant Treasurer, The European Equity Fund, Inc., The New Germany Fund, Inc. and The Central and Eastern Europe Fund, Inc. (2018–present) |
| Scott D. Hogan8 (1970)Chief Compliance Officer, 2016–present | Anti-Financial Crime & Compliance US (Senior Team Lead), DWS; Chief Compliance Officer, The European Equity Fund, Inc., The New Germany Fund, Inc. and The Central and Eastern Europe Fund, Inc. (2016–present) |
| DWS Managed Municipal Bond Fund | | | 73 |
| Name, Year of Birth, Position with the Trust/Corporation and Length of Time Served6 | Business Experience and Directorships During the Past Five Years |
| Caroline Pearson8 (1962)Chief Legal Officer, 2010–present | Legal (Senior Team Lead), DWS; Assistant Secretary, DBX ETF Trust (2020–present); Chief Legal Officer, DBX Advisors LLC (2020–present); Chief Legal Officer, The European Equity Fund, Inc., The New Germany Fund, Inc. and The Central and Eastern Europe Fund, Inc. (2012–present); formerly: Secretary, Deutsche AM Distributors, Inc. (2002–2017); Secretary, Deutsche AM Service Company (2010–2017); and Chief Legal Officer, DBX Strategic Advisors LLC (2020–2021) |
| Christian Rijs7 (1980)Anti-Money Laundering Compliance Officer, since October 6, 2021 | Senior Team Lead Anti-Financial Crime and Compliance, DWS; AML Officer, DWS Trust Company (since November 2, 2021); AML Officer, DBX ETF Trust (since October 21, 2021); AML Officer, The European Equity Fund, Inc., The New Germany Fund, Inc. and The Central and Eastern Europe Fund, Inc. (since November 12, 2021); formerly: DWS UK & Ireland Head of Anti-Financial Crime and MLRO |
| 1 | The length of time served represents the year in which the Board Member joined the board of one or more DWS funds currently overseen by the Board. |
| 2 | A publicly held company with securities registered pursuant to Section 12 of the Securities Exchange Act of 1934. |
| 3 | Mr. Perry and Ms. Schrand are Advisory Board Members of Deutsche DWS Asset Allocation Trust, Deutsche DWS Equity 500 Index Portfolio, Deutsche DWS Global/International Fund, Inc., Deutsche DWS Income Trust, Deutsche DWS Institutional Funds, Deutsche DWS International Fund, Inc., Deutsche DWS Investment Trust, Deutsche DWS Investments VIT Funds, Deutsche DWS Money Market Trust, Deutsche DWS Municipal Trust, Deutsche DWS Portfolio Trust, Deutsche DWS Securities Trust, Deutsche DWS Tax Free Trust, Deutsche DWS Variable Series I and Government Cash Management Portfolio. Mr. Perry and Ms. Schrand are Board Members of each other Trust. |
| 4 | Mr. Perry and Ms. Schrand oversee 21 funds in the DWS Fund Complex as Board Members of various Trusts. Mr. Perry and Ms. Schrand are Advisory Board Members of various Trusts/Corporations comprised of 49 funds in the DWS Fund Complex. |
| 5 | As a result of their respective positions held with the Advisor or its affiliates, these individuals are considered “interested persons” of the Advisor within the meaning of the 1940 Act. Interested persons receive no compensation from the Fund. |
| 6 | The length of time served represents the year in which the officer was first elected in such capacity for one or more DWS funds. |
| 7 | Address: 875 Third Avenue, New York, NY 10022. |
| 8 | Address: 100 Summer Street, Boston, MA 02110. |
| 9 | Address: 5201 Gate Parkway, Jacksonville, FL 32256. |
| 74 | | | DWS Managed Municipal Bond Fund |
| For More Information | The automated telephone system allows you to access personalized account information and obtain information on other DWS funds using either your voice or your telephone keypad. Certain account types within Classes A, C and S also have the ability to purchase, exchange or redeem shares using this system. |
| For more information, contact your financial representative. You may also access our automated telephone system or speak with a Shareholder Service representative by calling: (800) 728-3337 | |
| Web Site | dws.com View your account transactions and balances, trade shares, monitor your asset allocation, subscribe to fund and account updates by e-mail, and change your address, 24 hours a day. |
| Obtain prospectuses and applications, news about DWS funds, insight from DWS economists and investment specialists and access to DWS fund account information. | |
| Written Correspondence | DWSPO Box 219151 Kansas City, MO 64121-9151 |
| Proxy Voting | The Fund’s policies and procedures for voting proxies for portfolio securities and information about how the Fund voted proxies related to its portfolio securities during the most recent 12-month period ended June 30 are available on our Web site — dws.com/en-us/resources/proxy-voting — or on the SEC’s Web site — sec.gov. To obtain a written copy of the Fund’s policies and procedures without charge, upon request, call us toll free at (800) 728-3337. |
| Portfolio Holdings | Following the Fund’s fiscal first and third quarter-end, a complete portfolio holdings listing is posted on dws.com, and is available free of charge by contacting your financial intermediary, or if you are a direct investor, by calling (800) 728-3337. In addition, the portfolio holdings listing is filed with SEC on the Fund’s Form N-PORT and will be available on the SEC’s Web site at sec.gov. Additional portfolio holdings for the Fund are also posted on dws.com from time to time. Please see the Fund’s current prospectus for more information. |
| Principal Underwriter | If you have questions, comments or complaints, contact:DWS Distributors, Inc. 222 South Riverside Plaza Chicago, IL 60606-5808 (800) 621-1148 |
| DWS Managed Municipal Bond Fund | | | 75 |
| Investment Management | DWS Investment Management Americas, Inc. (“DIMA” or the “Advisor” ), which is part of the DWS Group GmbH & Co. KGaA (“DWS Group” ), is the investment advisor for the Fund. DIMA and its predecessors have more than 90 years of experience managing mutual funds and DIMA provides a full range of investment advisory services to both institutional and retail clients. DIMA is an indirect, wholly owned subsidiary of DWS Group. |
| DWS Group is a global organization that offers a wide range of investing expertise and resources, including hundreds of portfolio managers and analysts and an office network that reaches the world’s major investment centers. This well-resourced global investment platform brings together a wide variety of experience and investment insight across industries, regions, asset classes and investing styles. |
| Class A | Class C | Class S | Institutional Class | |
| Nasdaq Symbol | SMLAX | SMLCX | SCMBX | SMLIX |
| CUSIP Number | 25158T 608 | 25158T 822 | 25158T 848 | 25158T 855 |
| Fund Number | 466 | 766 | 2066 | 544 |
| 76 | | | DWS Managed Municipal Bond Fund |
| (b) Not applicable | |
| ITEM 2. | CODE OF ETHICS |
As of the end of the period covered by this report, the registrant has adopted a code of ethics, as defined in Item 2 of Form N-CSR that applies to its Principal Executive Officer and Principal Financial Officer.
There have been no amendments to, or waivers from, a provision of the code of ethics during the period covered by this report that would require disclosure under Item 2.
A copy of the code of ethics is filed as an exhibit to this Form N-CSR. | |
| ITEM 3. | AUDIT COMMITTEE FINANCIAL EXPERT |
| The fund’s audit committee is comprised solely of trustees who are "independent" (as such term has been defined by the Securities and Exchange Commission ("SEC") in regulations implementing Section 407 of the Sarbanes-Oxley Act (the "Regulations")). The fund’s Board of Trustees has determined that there are several "audit committee financial experts" (as such term has been defined by the Regulations) serving on the fund’s audit committee including Mr. William McClayton, the chair of the fund’s audit committee. An “audit committee financial expert” is not an “expert” for any purpose, including for purposes of Section 11 of the Securities Act of 1933 and the designation or identification of a person as an “audit committee financial expert” does not impose on such person any duties, obligations or liability that are greater than the duties, obligations and liability imposed on such person as a member of the audit committee and board of directors in the absence of such designation or identification. | |
| ITEM 4. | PRINCIPAL ACCOUNTANT FEES AND SERVICES |
DWS Managed Municipal Bond Fund
form n-csr disclosure re: AUDIT FEES
The following table shows the amount of fees that Ernst & Young LLP (“EY”), the Fund’s Independent Registered Public Accounting Firm, billed to the Fund during the Fund’s last two fiscal years. The Audit Committee approved in advance all audit services and non-audit services that EY provided to the Fund.
Services that the Fund’s Independent Registered Public Accounting Firm Billed to the Fund
| Fiscal Year Ended May 31, | Audit Fees Billed to Fund | Audit-Related Fees Billed to Fund | Tax Fees Billed to Fund | All Other Fees Billed to Fund |
| 2022 | $55,933 | $0 | $7,880 | $0 |
| 2021 | $55,933 | $0 | $7,880 | $0 |
The above “Tax Fees” were billed for professional services rendered for tax preparation.
Services that the Fund’s Independent Registered Public Accounting Firm Billed to the Adviser and Affiliated Fund Service Providers
The following table shows the amount of fees billed by EY to DWS Investment Management Americas, Inc. (“DIMA” or the “Adviser”), and any entity controlling, controlled by or under common control with DIMA (“Control Affiliate”) that provides ongoing services to the Fund (“Affiliated Fund Service Provider”), for engagements directly related to the Fund’s operations and financial reporting, during the Fund’s last two fiscal years.
| Fiscal Year Ended May 31, | Audit-Related Fees Billed to Adviser and Affiliated Fund Service Providers | Tax Fees Billed to Adviser and Affiliated Fund Service Providers | All Other Fees Billed to Adviser and Affiliated Fund Service Providers |
| 2022 | $0 | $429,517 | $0 |
| 2021 | $0 | $57,532 | $0 |
The above “Tax Fees” were billed in connection with tax compliance services and agreed upon procedures.
Non-Audit Services
The following table shows the amount of fees that EY billed during the Fund’s last two fiscal years for non-audit services. The Audit Committee pre-approved all non-audit services that EY provided to the Adviser and any Affiliated Fund Service Provider that related directly to the Fund’s operations and financial reporting. The Audit Committee requested and received information from EY about any non-audit services that EY rendered during the Fund’s last fiscal year to the Adviser and any Affiliated Fund Service Provider. The Committee considered this information in evaluating EY’s independence.
| Fiscal Year Ended May 31, | Total Non-Audit Fees Billed to Fund (A) | Total Non-Audit Fees billed to Adviser and Affiliated Fund Service Providers (engagements related directly to the operations and financial reporting of the Fund) (B) | Total Non-Audit Fees billed to Adviser and Affiliated Fund Service Providers (all other engagements) (C) | Total of (A), (B) and (C) |
| 2022 | $7,880 | $429,517 | $0 | $437,397 |
| 2021 | $7,880 | $57,532 | $0 | $65,412 |
All other engagement fees were billed for services in connection with agreed upon procedures and tax compliance for DIMA and other related entities.
Audit Committee Pre-Approval Policies and Procedures. Generally, each Fund’s Audit Committee must pre approve (i) all services to be performed for a Fund by a Fund’s Independent Registered Public Accounting Firm and (ii) all non-audit services to be performed by a Fund’s Independent Registered Public Accounting Firm for the DIMA Entities with respect to operations and financial reporting of the Fund, except that the Chairperson or Vice Chairperson of each Fund’s Audit Committee may grant the pre-approval for non-audit services described in items (i) and (ii) above for non-prohibited services for engagements of less than $100,000. All such delegated pre approvals shall be presented to each Fund’s Audit Committee no later than the next Audit Committee meeting.
There were no amounts that were approved by the Audit Committee pursuant to the de minimis exception under Rule 2-01 of Regulation S-X.
According to the registrant’s principal Independent Registered Public Accounting Firm, substantially all of the principal Independent Registered Public Accounting Firm's hours spent on auditing the registrant's financial statements were attributed to work performed by full-time permanent employees of the principal Independent Registered Public Accounting Firm.
***
In connection with the audit of the 2021 and 2022 financial statements, the Fund entered into an engagement letter with EY. The terms of the engagement letter required by EY, and agreed to by the Audit Committee, include a provision mandating the use of mediation and arbitration to resolve any controversy or claim between the parties arising out of or relating to the engagement letter or services provided thereunder.
***
Pursuant to PCAOB Rule 3526, EY is required to describe in writing to the Fund’s Audit Committee, on at least an annual basis, all relationships between EY, or any of its affiliates, and the DWS Funds, including the Fund, or persons in financial reporting oversight roles at the DWS Funds that, as of the date of the communication, may reasonably be thought to bear on EY’s independence. Pursuant to PCAOB Rule 3526, EY has reported the matters set forth below that may reasonably be thought to bear on EY’s independence. With respect to each reported matter in the aggregate, EY advised the Audit Committee that, after careful consideration of the facts and circumstances and the applicable independence rules, it concluded that the matters do not and will not impair EY’s ability to exercise objective and impartial judgement in connection with the audits of the financial statements for the Fund and a reasonable investor with knowledge of all relevant facts and circumstances would conclude that EY has been and is capable of exercising objective and impartial judgment on all issues encompassed within EY’s audit engagements. EY also confirmed to the Audit Committee that it can continue to act as the Independent Registered Public Accounting Firm for the Fund.
| · | EY advised the Fund’s Audit Committee that various covered persons within EY and EY’s affiliates held investments in, or had other financial relationships with, entities within the DWS Funds “investment company complex” (as defined in Regulation S-X) (the “DWS Funds Complex”). EY informed the Audit Committee that these investments and financial relationships were inconsistent with Rule 2-01(c)(1) of Regulation S-X. EY reported that all breaches have been resolved and that none of the breaches involved any professionals who were part of the audit engagement team for the Fund or in the position to influence the audit engagement team for the Fund. |
| ITEM 5. | AUDIT COMMITTEE OF LISTED REGISTRANTS | |
| Not applicable | ||
| ITEM 6. | SCHEDULE OF INVESTMENTS | |
| Not applicable | ||
| ITEM 7. | DISCLOSURE OF PROXY VOTING POLICIES AND PROCEDURES FOR CLOSED-END MANAGEMENT INVESTMENT COMPANIES | |
| Not applicable | ||
| ITEM 8. | PORTFOLIO MANAGERS OF CLOSED-END MANAGEMENT INVESTMENT COMPANIES | |
| Not applicable | ||
| ITEM 9. | PURCHASES OF EQUITY SECURITIES BY CLOSED-END MANAGEMENT INVESTMENT COMPANY AND AFFILIATED PURCHASERS | |
| Not applicable | ||
| ITEM 10. | SUBMISSION OF MATTERS TO A VOTE OF SECURITY HOLDERS | |
| There were no material changes to the procedures by which shareholders may recommend nominees to the Fund’s Board. The primary function of the Nominating and Governance Committee is to identify and recommend individuals for membership on the Board and oversee the administration of the Board Governance Guidelines. Shareholders may recommend candidates for Board positions by forwarding their correspondence by U.S. mail or courier service to Keith R. Fox, DWS Funds Board Chair, c/o Thomas R. Hiller, Ropes & Gray LLP, Prudential Tower, 800 Boylston Street, Boston, MA 02199-3600. | ||
| ITEM 11. | CONTROLS AND PROCEDURES | |
| (a) | The Chief Executive and Financial Officers concluded that the Registrant’s Disclosure Controls and Procedures are effective based on the evaluation of the Disclosure Controls and Procedures as of a date within 90 days of the filing date of this report. | |
| (b) | There have been no changes in the registrant’s internal control over financial reporting that occurred during the period covered by this report that has materially affected, or is reasonably likely to materially affect, the registrant’s internal controls over financial reporting. | |
| ITEM 12. | Disclosure of Securities Lending Activities for Closed-End Management Investment Companies | |
| Not applicable | ||
| ITEM 13. | EXHIBITS | |
| (a)(1) | Code of Ethics pursuant to Item 2 of Form N-CSR is filed and attached hereto as EX-99.CODE ETH. | |
| (a)(2) | Certification pursuant to Rule 30a-2(a) under the Investment Company Act of 1940 (17 CFR 270.30a-2(a)) is filed and attached hereto as Exhibit 99.CERT. | |
| (b) | Certification pursuant to Rule 30a-2(b) under the Investment Company Act of 1940 (17 CFR 270.30a-2(b)) is furnished and attached hereto as Exhibit 99.906CERT. | |
SIGNATURES
Pursuant to the requirements of the Securities Exchange Act of 1934 and the Investment Company Act of 1940, the registrant has duly caused this report to be signed on its behalf by the undersigned, thereunto duly authorized.
| Registrant: | DWS Managed Municipal Bond Fund, a series of Deutsche DWS Municipal Trust |
| By: | /s/Hepsen Uzcan Hepsen Uzcan President |
| Date: | 7/29/2022 |
Pursuant to the requirements of the Securities Exchange Act of 1934 and the Investment Company Act of 1940, this report has been signed below by the following persons on behalf of the registrant and in the capacities and on the dates indicated.
| By: | /s/Hepsen Uzcan Hepsen Uzcan President |
| Date: | 7/29/2022 |
| By: | /s/Diane Kenneally Diane Kenneally Chief Financial Officer and Treasurer |
| Date: | 7/29/2022 |