UNITED STATES
SECURITIES AND EXCHANGE COMMISSION
WASHINGTON, D. C. 20549
FORM N-CSRS
Investment Company Act file number: 811-02671
Deutsche DWS Municipal Trust
(Exact Name of Registrant as Specified in Charter)
875 Third Avenue
New York, NY 10022-6225
(Address of Principal Executive Offices) (Zip Code)
Registrant’s Telephone Number, including Area Code: (212) 454-4500
Diane Kenneally
100 Summer Street
Boston, MA 02110
(Name and Address of Agent for Service)
| Date of fiscal year end: | 10/31 |
| Date of reporting period: | 4/30/2024 |
| ITEM 1. | REPORT TO STOCKHOLDERS |
| (a) | |


Contents
2 | | | DWS Short-Term Municipal Bond Fund |
Class A | 6-Month‡ | 1-Year | 5-Year | 10-Year |
Average Annual Total Returns as of 4/30/24 | ||||
Unadjusted for Sales Charge | 2.92% | 2.72% | 1.06% | 1.00% |
Adjusted for the Maximum Sales Charge (max 2.25% load) | 0.61% | 0.41% | 0.60% | 0.77% |
Bloomberg 1-Year General Obligation Index† | 2.08% | 2.56% | 1.16% | 1.05% |
Bloomberg 3-Year (2–4) Municipal Bond Index†† | 2.80% | 1.90% | 0.99% | 1.14% |
Average Annual Total Returns as of 3/31/24 (most recent calendar quarter end) | ||||
Unadjusted for Sales Charge | 2.90% | 1.13% | 1.05% | |
Adjusted for the Maximum Sales Charge (max 2.25% load) | 0.59% | 0.67% | 0.82% | |
Bloomberg 1-Year General Obligation Index† | 2.26% | 1.17% | 1.05% | |
Bloomberg 3-Year (2–4) Municipal Bond Index†† | 1.80% | 1.06% | 1.21% | |
Class C | 6-Month‡ | 1-Year | 5-Year | 10-Year |
Average Annual Total Returns as of 4/30/24 | ||||
Unadjusted for Sales Charge | 2.65% | 1.95% | 0.31% | 0.25% |
Adjusted for the Maximum Sales Charge (max 1.00% CDSC) | 1.65% | 1.95% | 0.31% | 0.25% |
Bloomberg 1-Year General Obligation Index† | 2.08% | 2.56% | 1.16% | 1.05% |
Bloomberg 3-Year (2–4) Municipal Bond Index†† | 2.80% | 1.90% | 0.99% | 1.14% |
Average Annual Total Returns as of 3/31/24 (most recent calendar quarter end) | ||||
Unadjusted for Sales Charge | 2.13% | 0.37% | 0.30% | |
Adjusted for the Maximum Sales Charge (max 1.00% CDSC) | 2.13% | 0.37% | 0.30% | |
Bloomberg 1-Year General Obligation Index† | 2.26% | 1.17% | 1.05% | |
Bloomberg 3-Year (2–4) Municipal Bond Index†† | 1.80% | 1.06% | 1.21% | |
DWS Short-Term Municipal Bond Fund | | | 3 |
Class S | 6-Month‡ | 1-Year | 5-Year | 10-Year |
Average Annual Total Returns as of 4/30/24 | ||||
No Sales Charges | 3.13% | 2.90% | 1.24% | 1.16% |
Bloomberg 1-Year General Obligation Index† | 2.08% | 2.56% | 1.16% | 1.05% |
Bloomberg 3-Year (2–4) Municipal Bond Index†† | 2.80% | 1.90% | 0.99% | 1.14% |
Average Annual Total Returns as of 3/31/24 (most recent calendar quarter end) | ||||
No Sales Charges | 3.08% | 1.28% | 1.20% | |
Bloomberg 1-Year General Obligation Index† | 2.26% | 1.17% | 1.05% | |
Bloomberg 3-Year (2–4) Municipal Bond Index†† | 1.80% | 1.06% | 1.21% | |
Institutional Class | 6-Month‡ | 1-Year | 5-Year | 10-Year |
Average Annual Total Returns as of 4/30/24 | ||||
No Sales Charges | 3.16% | 3.08% | 1.34% | 1.27% |
Bloomberg 1-Year General Obligation Index† | 2.08% | 2.56% | 1.16% | 1.05% |
Bloomberg 3-Year (2–4) Municipal Bond Index†† | 2.80% | 1.90% | 0.99% | 1.14% |
Average Annual Total Returns as of 3/31/24 (most recent calendar quarter end) | ||||
No Sales Charges | 3.16% | 1.38% | 1.30% | |
Bloomberg 1-Year General Obligation Index† | 2.26% | 1.17% | 1.05% | |
Bloomberg 3-Year (2–4) Municipal Bond Index†† | 1.80% | 1.06% | 1.21% | |
4 | | | DWS Short-Term Municipal Bond Fund |
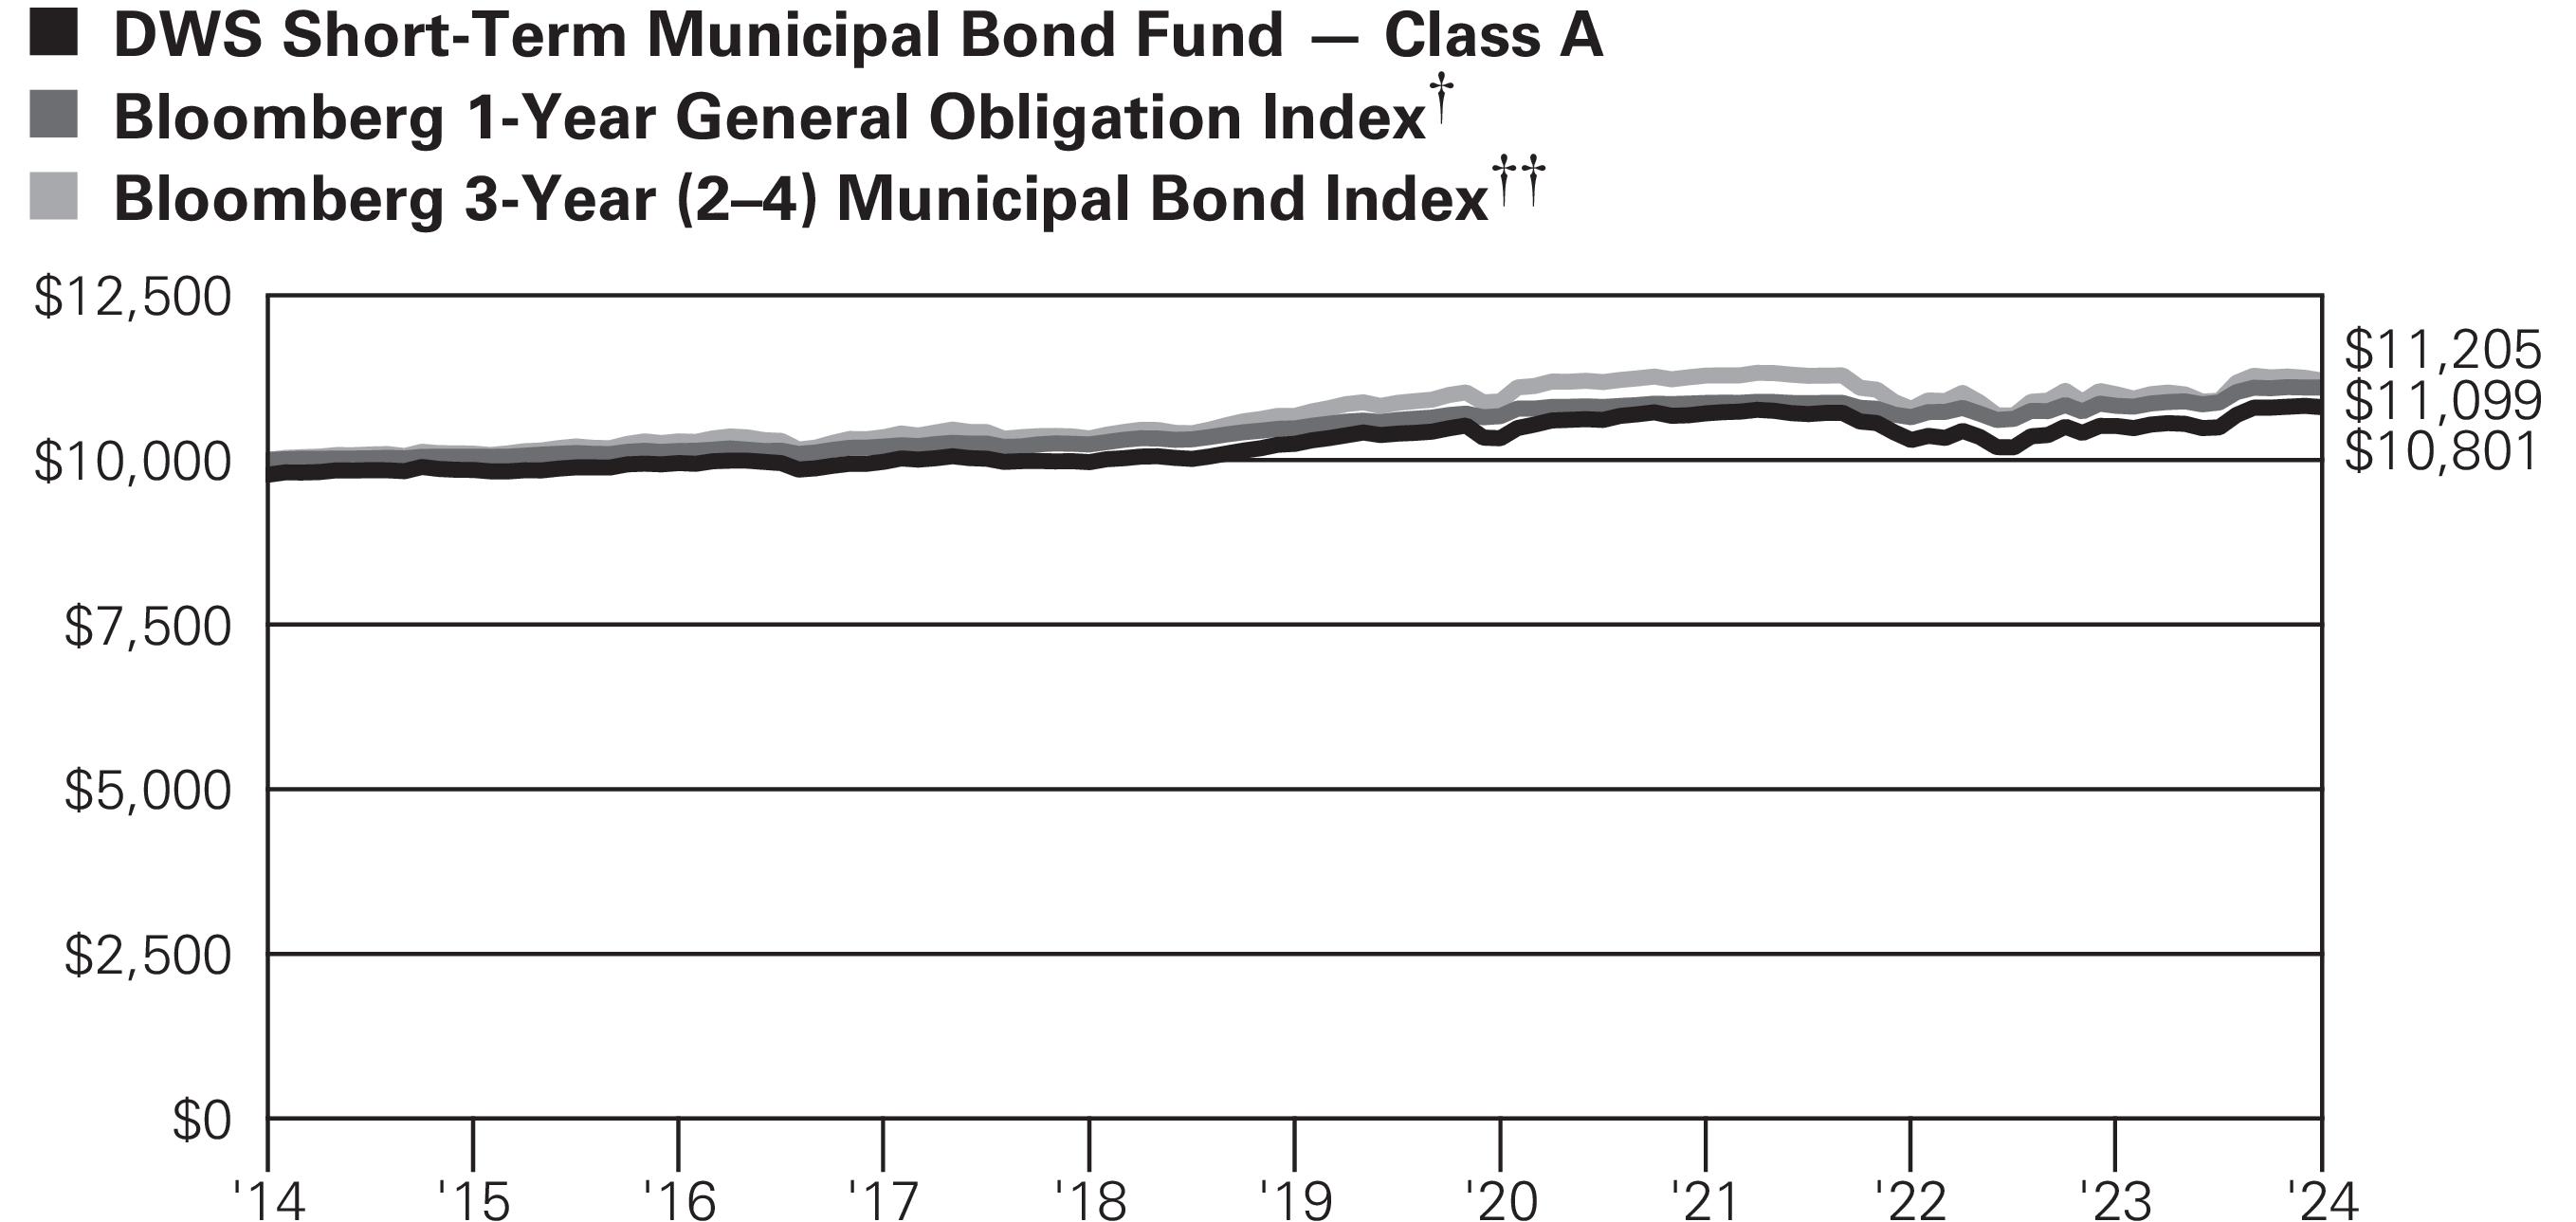 Yearly periods ended April 30
† | The Bloomberg 1-Year General Obligation Index is an unmanaged index including bonds with a minimum credit rating of Baa3, issued as part of a deal of at least $50 million, having an amount outstanding of at least $5 million, a maturity of one to two years, backed by the full faith and credit of an issuer with taxing power. |
†† | The Bloomberg 3-Year (2–4) Municipal Bond Index is an unmanaged subset of the Bloomberg Municipal Bond Index. It includes maturities of two to four years. |
‡ | Total returns shown for periods less than one year are not annualized. |
DWS Short-Term Municipal Bond Fund | | | 5 |
Class A | Class C | Class S | Institutional Class | |
Net Asset Value | ||||
4/30/24 | $9.74 | $9.74 | $9.73 | $9.75 |
10/31/23 | $9.59 | $9.58 | $9.57 | $9.59 |
Distribution Information as of 4/30/24 | ||||
Income Dividends, Six Months | $.13 | $.09 | $.14 | $.14 |
April Income Dividend | $.0224 | $.0164 | $.0239 | $.0244 |
SEC 30-day Yield‡‡ | 2.87% | 2.19% | 3.14% | 3.19% |
Tax Equivalent Yield‡‡ | 4.85% | 3.70% | 5.30% | 5.39% |
Current Annualized Distribution Rate‡‡ | 2.81% | 2.05% | 3.00% | 3.05% |
‡‡ | The SEC yield is net investment income per share earned over the month ended April 30, 2024, shown as an annualized percentage of the maximum offering price per share on the last day of the period. The SEC yield is computed in accordance with a standardized method prescribed by the Securities and Exchange Commission. The SEC yields would have been 2.71%, 2.04%, 2.99% and 3.02% for Class A, Class C, Class S and Institutional Class shares, respectively, had certain expenses not been reduced. Tax equivalent yield is based on the Fund’s yield and a marginal income tax rate of 40.8%. Current annualized distribution rate is the latest monthly dividend shown as an annualized percentage of net asset value on April 30, 2024. Distribution rate simply measures the level of dividends and is not a complete measure of performance. The current annualized distribution rates would have been 2.65%, 1.90%, 2.85% and 2.88% for Class A, Class C, Class S and Institutional Class shares, respectively, had certain expenses not been reduced. Yields and distribution rates are historical, not guaranteed and will fluctuate. |
6 | | | DWS Short-Term Municipal Bond Fund |
DWS Short-Term Municipal Bond Fund | | | 7 |
Asset Allocation (As a % of Investment Portfolio excluding Open-End Investment Companies) | 4/30/24 | 10/31/23 |
Revenue Bonds | 86% | 81% |
General Obligation Bonds | 11% | 13% |
Lease Obligations | 3% | 4% |
Variable Rate Demand Notes | 0% | 2% |
100% | 100% |
Interest Rate Sensitivity | 4/30/24 | 10/31/23 |
Effective Maturity | 2.1 years | 2.2 years |
Modified Duration to Worst | 1.9 years | 1.9 years |
Quality (As a % of Investment Portfolio excluding Open-End Investment Companies) | 4/30/24 | 10/31/23 |
AAA | 21% | 14% |
AA | 34% | 37% |
A | 31% | 33% |
BBB | 8% | 8% |
BB | 2% | 1% |
Not Rated | 4% | 7% |
100% | 100% |
Top Five State Allocations (As a % of Investment Portfolio excluding Open-End Investment Companies) | 4/30/24 | 10/31/23 |
Texas | 12% | 13% |
New York | 10% | 12% |
Pennsylvania | 6% | 5% |
California | 6% | 11% |
New Jersey | 6% | 4% |
8 | | | DWS Short-Term Municipal Bond Fund |
Principal Amount ($) | Value ($) | ||
Municipal Investments 99.7% | |||
Alabama 4.5% | |||
Alabama, Black Belt Energy Gas District Gas Project Revenue: | |||
Series D-1, 4.0%, Mandatory Put 6/1/2027 @ 100, 7/1/2052, GTY: Royal Bank of Canada, LIQ: Royal Bank of Canada | 665,000 | 667,039 | |
Series B-1, 4.0%, Mandatory Put 10/1/2027 @ 100, 4/1/2053, GTY: Goldman Sachs Group, Inc. | 2,885,000 | 2,881,050 | |
Jefferson, AL, Sewer Revenue, 5.0%, 10/1/2026 | 1,500,000 | 1,547,986 | |
Southeast Alabama, Energy Authority A Cooperative District, Series B-1, 5.0%, Mandatory Put 8/1/2028 @ 100, 5/1/2053, GTY: Goldman Sachs Group, Inc. | 1,365,000 | 1,409,002 | |
6,505,077 | |||
Arizona 2.3% | |||
Arizona, Industrial Development Authority, Hospital Revenue Bonds, Phoenix Children Hospital, Series A, 5.0%, 2/1/2027 | 200,000 | 208,602 | |
Arizona, Industrial Development Authority, Revenue Bonds, TWG Glendale LP, 5.0%, Mandatory Put 9/1/2026 @ 100, 3/1/2045 | 550,000 | 559,958 | |
Coconino County, AZ, Pollution Control Corp. Revenue, Nevada Power Co., Series A, AMT, 4.125%, Mandatory Put 3/31/2026 @ 100, 9/1/2032 | 250,000 | 247,662 | |
Maricopa County, AZ, Industrial Development Authority, Revenue Bonds, HonorHealth Obligated Group, Series D, 5.0%, 12/1/2027 (a) | 1,150,000 | 1,201,673 | |
Phoenix, AZ, Civic Improvement Corp., Airport Revenue, AMT, 5.0%, 7/1/2025 | 1,000,000 | 1,013,704 | |
3,231,599 | |||
California 6.2% | |||
California, Municipal Finance Authority, Aldersly Project, Series B, 4.0%, 11/15/2028 | 590,000 | 591,563 | |
California, Municipal Finance Authority, Waste Disposal Revenue, Series A, AMT, 4.125%, Mandatory Put 10/1/2025 @ 100, 10/1/2041, GTY: Waste Management Holdings | 320,000 | 320,220 | |
California, Public Finance Authority Revenue, Sharp Healthcare Obligated Group, Series C, 3.9% (b), 5/1/2024, LOC: Barclays Bank PLC | 700,000 | 700,000 | |
California, State Housing Finance Agency, Multi Family Housing Revene Bonds, Series V, 5.0%, Mandatory Put 11/1/2026 @ 100, 5/1/2054 | 300,000 | 307,343 | |
DWS Short-Term Municipal Bond Fund | | | 9 |
Principal Amount ($) | Value ($) | ||
California, State Infrastructure & Economic Development Bank Revenue: | |||
1.75%, Mandatory Put 8/1/2026 @ 100, 8/1/2055 | 1,100,000 | 1,039,341 | |
Series A, 144A, AMT, 3.95%, Mandatory Put 1/30/2025 @ 100, 1/1/2050 | 500,000 | 499,983 | |
California, State Municipal Finance Authority Revenue, LAX Integrated Express Solutions LLC, APM Project: | |||
Series A, AMT, 5.0%, 12/31/2025 | 1,000,000 | 1,008,722 | |
Series A, AMT, 5.0%, 6/30/2026 | 500,000 | 498,899 | |
California, Statewide Communities Development Authority, Multi-Family Housing Revenue, Foxwood Apartments Project, Series J, 3.36% (b), 5/7/2024, LOC: Wells Fargo Bank NA | 100,000 | 100,000 | |
California State University, University Revenue, Series B-3, 3.125%, Mandatory Put 11/1/2026 @ 100, 11/1/2051 | 1,000,000 | 991,482 | |
Los Angeles County, CA, Department of Airports Revenue, Series A, AMT, 5.0%, 5/15/2025 | 695,000 | 703,705 | |
Los Angeles County, CA, Department of Water & Power System, Series E, 5.0%, 7/1/2025 | 1,000,000 | 1,020,467 | |
San Jose City, CA, Multi Family Housing Revenue, Allied 1510 Parkmoor LP, Series F-2, 5.0%, Mandatory Put 6/1/2026 @ 100, 6/1/2027 | 1,000,000 | 1,023,362 | |
8,805,087 | |||
Colorado 1.8% | |||
Denver City & County, CO, Airport System Revenue: | |||
Series C, 5.0%, 11/15/2025 | 500,000 | 512,396 | |
Series A, AMT, 5.0%, 12/1/2026 | 2,000,000 | 2,061,647 | |
2,574,043 | |||
Connecticut 3.4% | |||
Connecticut, State General Obligation, Series E, 5.0%, 11/15/2025 | 1,000,000 | 1,025,396 | |
Connecticut, State Health & Educational Facilities Authority, Series A, 2.8%, Mandatory Put 2/10/2026 @ 100, 7/1/2048 | 1,500,000 | 1,468,312 | |
Connecticut, State Health & Educational Facilities Authority, Yale University, Series A-3, 2.95%, Mandatory Put 7/1/2027 @ 100, 7/1/2049 | 1,000,000 | 981,782 | |
Connecticut, State Housing Finance Authority, Housing Finance Mortgage Program: | |||
Series C-1, 4.0%, 11/15/2047 | 340,000 | 336,843 | |
Series A-4, MUNIPSA + 0.3%, 4.07% (c), Mandatory Put 11/15/2024 @ 100, 11/15/2050 | 345,000 | 344,350 | |
10 | | | DWS Short-Term Municipal Bond Fund |
Principal Amount ($) | Value ($) | ||
Connecticut, State Housing Finance Program Authority Revenue, Series A-1, 4.0%, 11/15/2047 | 270,000 | 267,462 | |
Connecticut, State Special Tax Obligation Revenue, Series B, 5.0%, 7/1/2025 | 500,000 | 509,084 | |
4,933,229 | |||
District of Columbia 0.7% | |||
District of Columbia, Housing Finance Agency, ECD Edgewood Commons 5 LP, 5.0%, Mandatory Put 6/1/2026 @ 100, 6/1/2027 | 1,000,000 | 1,014,240 | |
Florida 3.4% | |||
Florida, Capital Projects Finance Authority, Student Housing Revenue, Capital Project Loan Program, Series A-1, 5.0%, 10/1/2026 | 500,000 | 502,991 | |
Florida, Development Finance Corp., Surface Transportation Facilities Revenue, Virgin Trains USA Passenger Rail Project, Series A, 144A, AMT, 6.375%, Mandatory Put 1/1/2026 @ 100, 1/1/2049 | 1,000,000 | 1,011,281 | |
Florida, Duval County Public Schools, Series A, 5.0%, 7/1/2025, INS: AGMC | 500,000 | 508,224 | |
Hillsborough County, FL, Solid Waste & Resource Recovery Revenue, Series A, AMT, 5.0%, 9/1/2025 | 2,250,000 | 2,279,936 | |
Lee County, FL, Industrial Development Authority, Health Care Facilities Revenue, Cypress Cove At Healthpark Florida, Inc., Series B2, 3.25%, 10/1/2026 | 435,000 | 417,973 | |
Village, FL, Community Development District No. 13, Special Assessment Revenue, 2.625%, 5/1/2024 | 120,000 | 120,000 | |
4,840,405 | |||
Georgia 5.0% | |||
Burke County, GA, Development Authority, Pollution Control Revenue, Oglethorpe Power Corp., Series E, 3.25%, Mandatory Put 2/3/2025 @ 100, 11/1/2045 | 1,200,000 | 1,184,625 | |
Georgia, Geo L Smith II Congress Center Authority, Convention Center Hotel First Tier Revenue, Series A, 2.375%, 1/1/2031 | 750,000 | 671,292 | |
Georgia, Main Street Natural Gas, Inc., Gas Supply Revenue, Series C, 4.0%, Mandatory Put 9/1/2026 @ 100, 3/1/2050, GTY: Citigroup Global Markets | 2,000,000 | 2,001,616 | |
Georgia, Metropolitan Atlanta Rapid Transit Authority Revenue Bonds, Series C, 5.0%, 7/1/2026 | 1,700,000 | 1,763,214 | |
Georgia, State Road & Tollway Authority, 5.0%, 6/1/2026 | 1,230,000 | 1,272,441 | |
Monroe County, GA, Development Authority, Pollution Control Revenue, Georgia Power Co. Plant Scherer Project, Series 2, 3.875%, Mandatory Put 3/6/2026 @ 100, 10/1/2048 | 250,000 | 250,489 | |
7,143,677 | |||
DWS Short-Term Municipal Bond Fund | | | 11 |
Principal Amount ($) | Value ($) | ||
Illinois 3.6% | |||
Chicago, Midway International Airport Revenue, Series B, 5.0%, 1/1/2026, INS: BAM | 500,000 | 512,678 | |
Chicago, O’Hare International Airport Revenue, Series C, AMT, 5.0%, 1/1/2025 | 850,000 | 854,376 | |
Illinois, General Obligation, Series D, 5.0%, 11/1/2026 | 2,000,000 | 2,063,080 | |
Illinois, State General Obligation: | |||
Series B, 5.0%, 3/1/2025 | 770,000 | 776,559 | |
Series C, 5.0%, 5/1/2025 | 1,000,000 | 1,010,847 | |
5,217,540 | |||
Indiana 0.5% | |||
Indiana, Finance Authority Revenue, Deaconess Health System, Series B, MUNIPSA + 0.3%, 4.07% (c), Mandatory Put 3/1/2027 @ 100, 3/1/2039 | 675,000 | 664,679 | |
Kentucky 5.7% | |||
Boone County, KY, Pollution Control Revenue, Duke Energy Kentucky, Inc., Project, Series A, 3.7%, 8/1/2027 | 750,000 | 740,649 | |
Kentucky, Higher Education Student Loan Corp. Revenue, Taxable Asset Back Notes, “A1A” , Series 2021-1, 1.65%, 3/25/2051 | 570,391 | 507,529 | |
Kentucky, State Public Energy Authority, Gas Supply Revenue: | |||
Series B, 4.0%, Mandatory Put 1/1/2025 @ 100, 1/1/2049, GTY: BP Corp. North America, Inc. | 1,435,000 | 1,434,546 | |
Series A-1, 4.0%, Mandatory Put 6/1/2025 @ 100, 12/1/2049, GTY: Morgan Stanley | 2,750,000 | 2,749,581 | |
Louisville & Jefferson County, KY, Metropolitan Government Control Revenue, Louisville Gas & Celectric Co., Series B, AMT, 1.35%, 11/1/2027 | 3,000,000 | 2,681,866 | |
8,114,171 | |||
Louisiana 5.5% | |||
Lake Charles, LA, Harbor & Terminal District Revenue, Big Lake Fuels LLC Project, AMT, 1.0%, Mandatory Put 12/1/2024 @ 100, 12/1/2051 | 3,000,000 | 2,942,236 | |
Louisiana, Parish of St. John The Baptist LA, Series A-1, 4.05%, Mandatory Put 7/1/2026 @ 100, 6/1/2037 | 2,000,000 | 1,980,322 | |
Louisiana, Public Facilities Authority, ElementUS Minerals LLC, 144A, 5.0%, Mandatory Put 11/1/2025 @ 100, 10/1/2043 | 3,000,000 | 3,014,519 | |
7,937,077 | |||
12 | | | DWS Short-Term Municipal Bond Fund |
Principal Amount ($) | Value ($) | ||
Maryland 0.7% | |||
Maryland, State Health & Higher Educational Facilities Authority Revenue, University of Maryland Medical System Obligated Group, Series B-2, 5.0%, Mandatory Put 7/1/2027 @ 100, 7/1/2045 | 1,000,000 | 1,034,684 | |
Massachusetts 0.1% | |||
Massachusetts, Educational Financing Authority Education Loan Revenue: | |||
Series B, AMT, 2.0%, 7/1/2037 | 150,000 | 128,262 | |
Series B, AMT, 2.625%, 7/1/2036 | 80,000 | 79,362 | |
207,624 | |||
Michigan 4.6% | |||
Michigan, State Finance Authority Revenue, “A1A” , Series 2021-1, 1.3%, 7/25/2061 | 566,800 | 528,912 | |
Michigan, State Finance Authority Revenue, Beaumont-Spectrum, Series C, MUNIPSA + 0.75%, 4.52% (c), Mandatory Put 4/15/2027 @ 100, 4/15/2047 | 1,750,000 | 1,750,360 | |
Michigan, State Finance Authority Revenue, Hospital McLaren Health Care Corp., Series D-1, 1.2%, Mandatory Put 4/13/2028 @ 100, 10/15/2038 | 1,250,000 | 1,104,235 | |
Michigan, State Finance Authority, Trinity Health Corp. Obligated Group, Series A, 5.0%, 12/1/2026 | 2,000,000 | 2,075,122 | |
Michigan, State Housing Development Authority Revenue, Clark Road Family Ltd. Dividend Housing Association LP, 4.5%, Mandatory Put 4/1/2026 @ 100, 12/1/2042 | 1,150,000 | 1,157,938 | |
6,616,567 | |||
Minnesota 1.0% | |||
Minnesota, Municipal Gas Agency Commodity Supply Revenue, Series A, 4.0%, Mandatory Put 12/1/2027 @ 100, 12/1/2052, GTY: Royal Bank of Canada, LIQ: Royal Bank of Canada | 1,500,000 | 1,503,311 | |
Mississippi 0.3% | |||
Lowndes County, MS, Solid Waste Disposal And Pollution Control Refunding Revenue Bonds, International Company Project, 2.65%, Mandatory Put 4/1/2027 @ 100, 4/1/2037, GTY: International Paper Co. | 500,000 | 482,799 | |
Missouri 1.0% | |||
Missouri, Higher Education Loan Authority Revenue, Taxable Student Loan Asset Back Notes, “A1A” , Series 2021-1, 1.53%, 1/25/2061 | 1,154,190 | 977,747 | |
DWS Short-Term Municipal Bond Fund | | | 13 |
Principal Amount ($) | Value ($) | ||
Missouri, Plaza At Noah’s Ark Community Improvement District: | |||
3.0%, 5/1/2024 | 200,000 | 200,000 | |
3.0%, 5/1/2025 | 225,000 | 221,034 | |
1,398,781 | |||
New Hampshire 1.1% | |||
New Hampshire, State Housing Finance Authority Revenue, Series 1, 2.95%, 10/1/2025 | 1,540,000 | 1,508,520 | |
New Jersey 5.9% | |||
Camden, NJ, Multi Family Housing Revenue, Northgate I Apertments Project, 5.0%, Mandatory Put 3/1/2026 @ 100, 3/1/2027 | 1,000,000 | 1,016,630 | |
New Jersey, State Economic Development Authority, Series SSS, 5.0%, 6/15/2026 | 1,500,000 | 1,542,575 | |
New Jersey, State Economic Development Authority, Motor Vehicle Surcharge Revenue, Series A, 3.125%, 7/1/2029 | 195,000 | 182,800 | |
New Jersey, State Higher Education Assistance: | |||
Series A, AMT, 5.0%, 12/1/2025 | 575,000 | 583,683 | |
Series B, AMT, 5.0%, 12/1/2025 | 1,000,000 | 1,015,102 | |
New Jersey, State Turnpike Authority Revenue, Series A, 5.0%, 1/1/2027 (a) | 2,000,000 | 2,078,974 | |
New Jersey, Tobacco Settlement Financing Corp., Series A, 5.0%, 6/1/2025 | 1,955,000 | 1,979,956 | |
8,399,720 | |||
New Mexico 0.3% | |||
New Mexico, Mortgage Finance Authority, Single Family Mortgage, “I” , Series A-1, 4.0%, 1/1/2049 | 365,000 | 360,906 | |
New York 10.0% | |||
New Jersey, State Port Authority Revenue, Series 242, AMT, 5.0%, 12/1/2026 | 1,000,000 | 1,030,078 | |
New York, Amherst Industrial Development Agency, Multi Family Housing Revenue, 3.9%, Mandatory Put 4/1/2025 @ 100, 4/1/2026 | 2,000,000 | 1,993,548 | |
New York, State Transportation Development Corp., Special Facility Revenue, Delta Air Lines, Inc., LaGuardia Airport Terminals C&D Redevelopment Project, Series A, AMT, 5.0%, 1/1/2026 | 2,000,000 | 2,033,408 | |
New York City, NY, Housing Development Corp., Multi-Family Mortgage Revenue, Series A, 1.125%, Mandatory Put 11/1/2024 @ 100, 5/1/2060 | 555,000 | 555,000 | |
New York City, NY, Transitional Finance Authority Future Tax Secured Revenue, Series F-2, 4.47%, 2/1/2027 | 3,000,000 | 2,950,737 | |
New York, NY, General Obligation: | |||
Series D, 5.0%, 8/1/2025 | 1,000,000 | 1,019,632 | |
14 | | | DWS Short-Term Municipal Bond Fund |
Principal Amount ($) | Value ($) | ||
Series F-4, 5.0%, Mandatory Put 12/1/2025 @ 100, 6/1/2044 | 2,000,000 | 2,022,169 | |
Oyster Bay, NY, Public Improvement Refunding Bonds, 4.0%, 11/1/2027, INS: BAM | 315,000 | 324,633 | |
Troy, NY, Capital Resource Corp. Revenue, Rensselaer Polytechnic Institute: | |||
Series A, 5.0%, 9/1/2025 | 300,000 | 303,370 | |
Series A, 5.0%, 9/1/2027 | 500,000 | 520,453 | |
5.0%, 8/1/2028 | 1,000,000 | 1,019,082 | |
Series A, 5.0%, 9/1/2028 | 500,000 | 528,925 | |
14,301,035 | |||
North Carolina 1.6% | |||
North Carolina, General Obligation, Series A, 5.0%, 3/1/2026 | 2,045,000 | 2,107,455 | |
North Carolina, State Housing Finance Agency, Home Ownership Revenue, Series 38-B, 4.0%, 7/1/2047 | 250,000 | 247,462 | |
2,354,917 | |||
North Dakota 0.9% | |||
North Dakota, State Housing Finance Agency, Home Mortgage Housing Finance Program: | |||
Series B, MUNIPSA + 0.2%, 3.97% (c), Mandatory Put 7/1/2024 @100, 1/1/2043 | 925,000 | 924,426 | |
Series A, 4.0%, 7/1/2047 | 380,000 | 376,663 | |
1,301,089 | |||
Ohio 1.8% | |||
Ohio, American Municipal Power, Inc., Prairie State Energy Campus Revenue, Series A, 5.0%, 2/15/2026 | 1,000,000 | 1,024,611 | |
Ohio, Port of Greater Cincinnati Development Authority Revenue, Convention Center Hotel Acquisition And Demolition Project, 144A, 5.0%, 5/1/2025 | 1,500,000 | 1,499,946 | |
2,524,557 | |||
Pennsylvania 6.3% | |||
Dauphin County, PA, General Authority, OPMC Obligated Group, Series A, 5.0%, 6/1/2026 | 650,000 | 664,401 | |
Geisinger, PA, Authority Health System Revenue, Series B, 5.0%, Mandatory Put 2/15/2027 @ 100, 4/1/2043 | 1,000,000 | 1,029,865 | |
Luzerne County, PA, General Obligation, Series A, 5.0%, 12/15/2026, INS: AGMC | 1,000,000 | 1,037,250 | |
Pennsylvania, Commonwealth Financing Authority, Tobacco Master Settlement Payment Revenue Bonds, 5.0%, 6/1/2026 | 2,000,000 | 2,047,529 | |
DWS Short-Term Municipal Bond Fund | | | 15 |
Principal Amount ($) | Value ($) | ||
Pennsylvania, State Economic Development Financing Authority Revenue, Waste Management Inc., Series A-2, 4.6%, Mandatory Put 10/1/2026 @ 100, 10/1/2046, GTY: Waste Management Holdings | 2,000,000 | 2,026,259 | |
Pennsylvania, State Housing Finance Agency, Single Family Mortgage Revenue: | |||
Series 119, AMT, 3.5%, 10/1/2041 | 160,000 | 158,982 | |
Series 122, AMT, 4.0%, 10/1/2046 | 1,100,000 | 1,090,974 | |
Pittsburgh & Allegheny Counties, PA, Sports & Exhibition Authority Revenue, Series B, 5.0%, 2/1/2029, INS: AGMC | 875,000 | 944,293 | |
8,999,553 | |||
South Carolina 0.6% | |||
South Carolina, State Jobs-Economic Development Authority Revenue, International Paper Co., Series A, AMT, 4.0%, Mandatory Put 4/1/2026 @ 100, 4/1/2033, GTY: International Paper Co. | 850,000 | 850,131 | |
South Dakota 0.4% | |||
South Dakota, Housing Development Authority, Homeownership Mortgage, Series B, 4.0%, 11/1/2047 | 555,000 | 550,137 | |
Tennessee 0.4% | |||
Johnson City, TN, Johnson City Health & Educational Facilities Board, Ballad Health Obligated Group, Series A, 5.0%, 7/1/2025 | 500,000 | 504,238 | |
Texas 12.1% | |||
Dallas City, TX, General Obligation, Series B, 5.0%, 2/15/2027 | 2,500,000 | 2,619,003 | |
Fort Bend, TX, Independent School District Variable Rate, Unlimited Tax Building and Refunding Bonds, Series B, 0.875%, Mandatory Put 8/1/2025 @ 100, 8/1/2050 | 385,000 | 370,206 | |
Houston, TX, Airport Systems Revenue: | |||
Series A, AMT, 5.0%, 7/1/2025 | 500,000 | 505,372 | |
Series A, AMT, 5.0%, 7/1/2026 | 1,000,000 | 1,024,537 | |
Series A, AMT, 5.0%, 7/1/2026, INS: AGMC | 865,000 | 888,036 | |
Series C, AMT, 5.0%, 7/1/2026 | 2,500,000 | 2,561,343 | |
Houston, TX, Hotel Occupancy Tax And Special Revenue, Convention and Entertainment Facilities Department, 5.0%, 9/1/2026 | 1,735,000 | 1,789,254 | |
New Hope, TX, Cultural Education Facilities Finance Corporation, Retirement Facility Revenue, Outlook at Windhaven Project, Series B3, 4.25%, 10/1/2026 | 2,000,000 | 1,982,311 | |
North Texas, Tollway Authority Revenue, Series A, 5.0%, 1/1/2026 | 2,000,000 | 2,051,690 | |
16 | | | DWS Short-Term Municipal Bond Fund |
Principal Amount ($) | Value ($) | ||
Texas, Clear Creek Independent School District, General Obligation, 3.6%, Mandatory Put 8/15/2025 @ 100, 2/15/2035 | 1,000,000 | 998,000 | |
Texas, Dallas Fort Worth International Airport Revenue, Series B, 5.0%, 11/1/2025 | 2,000,000 | 2,042,569 | |
Texas, State Municipal Gas Acquisition & Supply Corp., III Gas Supply Revenue, 5.0%, 12/15/2029, GTY: Macquarie Group Ltd. | 500,000 | 518,426 | |
17,350,747 | |||
Utah 0.4% | |||
Salt Lake City, UT, Airport Revenue, Series A, AMT, 5.0%, 7/1/2026 | 500,000 | 511,537 | |
Virginia 4.0% | |||
Louisa, VA, Industrial Development Authority, Pollution Control Revenue, Virginia Electric And Power Company Project, Series C, 1.65%, Mandatory Put 5/31/2024 @ 100, 11/1/2035 | 950,000 | 947,284 | |
Peninsula, VA, Ports Authority, Coal Terminal Revenue, Dominion Terminal Associates Project, Series 2003, 3.8%, Mandatory Put 10/1/2024 @ 100, 10/1/2033 | 750,000 | 746,377 | |
Virginia, Housing Development Authority, Series E2, 3.9%, Mandatory Put 7/1/2025 @ 100, 7/1/2055 | 3,000,000 | 2,983,084 | |
Virginia, Small Business Financing Authority Revenue, Elizabeth River Crossings OpCo., LLC Project, AMT, 4.0%, 7/1/2029 | 1,000,000 | 1,008,590 | |
5,685,335 | |||
Washington 1.2% | |||
King County, WA, Junior Lien Sewer Revenue, Series A, MUNIPSA + 0.23%, 4.0% (c), Mandatory Put 1/1/2027 @ 100, 1/1/2040 | 1,155,000 | 1,143,293 | |
Seattle, WA, Seattle Municipal Light & Power Revenue, Series B, MUNIPSA + 0.25%, 4.02% (c), Mandatory Put 11/1/2026 @ 100, 5/1/2045 | 355,000 | 346,483 | |
Washington, State Housing Finance Commission, Emerald Heights, Series B-1, 4.75%, 7/1/2027 | 245,000 | 245,013 | |
1,734,789 | |||
West Virginia 0.7% | |||
West Virginia, State Economic Development Authority, Solid Waste Disposal Facility, Arch Resources Project, AMT, 4.125%, Mandatory Put 7/1/2025 @ 100, 7/1/2045 | 1,000,000 | 995,072 | |
DWS Short-Term Municipal Bond Fund | | | 17 |
Principal Amount ($) | Value ($) | ||
Wisconsin 1.7% | |||
Wisconsin, State Health & Educational Facilities Authority Revenue, Advocate Aurora Health Credit Group: | |||
Series B-2, 5.0%, Mandatory Put 6/24/2026 @ 100, 8/15/2054 | 1,000,000 | 1,022,199 | |
Series C-3, 5.0%, Mandatory Put 6/24/2026 @ 100, 8/15/2054 | 1,000,000 | 1,022,200 | |
Wisconsin, State Housing & Economic Development Authority, Home Ownership Revenue, Series A, AMT, 3.5%, 3/1/2046 | 385,000 | 379,099 | |
2,423,498 | |||
Total Municipal Investments (Cost $145,082,531) | 142,580,371 | ||
Government & Agency Obligations 1.4% | |||
U.S. Treasury Obligations | |||
U.S. Treasury Notes, 4.0%, 1/15/2027 (Cost $1,991,130) | 2,000,000 | 1,953,984 | |
Shares | Value ($) | ||
Open-End Investment Companies 0.0% | |||
BlackRock Liquidity Funds MuniCash Portfolio, Institutional Shares, 3.42% (d) (Cost $14,985) | 14,983 | 14,985 | |
% of Net Assets | Value ($) | ||
Total Investment Portfolio (Cost $147,088,646) | 101.1 | 144,549,340 | |
Other Assets and Liabilities, Net | (1.1 ) | (1,563,202 ) | |
Net Assets | 100.0 | 142,986,138 | |
(a) | When-issued security. |
(b) | Variable rate demand notes are securities whose interest rates are reset periodically (usually daily mode or weekly mode) by remarketing agents based on current market levels, and are not directly set as a fixed spread to a reference rate. These securities may be redeemed at par by the holder through a put or tender feature, and are shown at their current rates as of April 30, 2024. Date shown reflects the earlier of demand date or stated maturity date. |
18 | | | DWS Short-Term Municipal Bond Fund |
(c) | Variable or floating rate security. These securities are shown at their current rate as of April 30, 2024. For securities based on a published reference rate and spread, the reference rate and spread are indicated within the description above. Certain variable rate securities are not based on a published reference rate and spread but adjust periodically based on current market conditions, prepayment of underlying positions and/or other variables. Securities with a floor or ceiling feature are disclosed at the inherent rate, where applicable. |
(d) | Current yield; not a coupon rate. |
144A: Security exempt from registration under Rule 144A of the Securities Act of 1933. These securities may be resold in transactions exempt from registration, normally to qualified institutional buyers. |
AGMC: Assured Guaranty Municipal Corp. |
AMT: Subject to alternative minimum tax. |
BAM: Build America Mutual |
GTY: Guaranty Agreement |
INS: Insured |
LIQ: Liquidity Facility |
LOC: Letter of Credit |
MUNIPSA: SIFMA Municipal Swap Index Yield |
SIFMA: Securities Industry and Financial Markets Association |
Assets | Level 1 | Level 2 | Level 3 | Total |
Municipal Investments (a) | $— | $142,580,371 | $— | $142,580,371 |
Government & Agency Obligations | — | 1,953,984 | — | 1,953,984 |
Open-End Investment Companies | 14,985 | — | — | 14,985 |
Total | $14,985 | $144,534,355 | $— | $144,549,340 |
(a) | See Investment Portfolio for additional detailed categorizations. |
DWS Short-Term Municipal Bond Fund | | | 19 |
Assets | |
Investment in securities, at value (cost $147,088,646) | $144,549,340 |
Receivable for investments sold | 827,296 |
Receivable for Fund shares sold | 6,800 |
Interest receivable | 1,722,596 |
Other assets | 37,885 |
Total assets | 147,143,917 |
Liabilities | |
Payable for investments purchased — when-issued securities | 3,302,803 |
Payable for Fund shares redeemed | 636,181 |
Distributions payable | 69,143 |
Accrued management fee | 16,036 |
Accrued Trustees' fees | 2,833 |
Other accrued expenses and payables | 130,783 |
Total liabilities | 4,157,779 |
Net assets, at value | $142,986,138 |
Net Assets Consist of | |
Distributable earnings (loss) | (6,815,552 ) |
Paid-in capital | 149,801,690 |
Net assets, at value | $142,986,138 |
20 | | | DWS Short-Term Municipal Bond Fund |
Net Asset Value | |
Class A | |
Net Asset Value and redemption price per share ($59,396,981 ÷ 6,096,134 outstanding shares of beneficial interest, $.01 par value, unlimited number of shares authorized) | $9.74 |
Maximum offering price per share (100 ÷ 97.75 of $9.74) | $9.96 |
Class C | |
Net Asset Value, offering and redemption price (subject to contingent deferred sales charge) per share ($1,178,883 ÷ 121,049 outstanding shares of beneficial interest, $.01 par value, unlimited number of shares authorized) | $9.74 |
Class S | |
Net Asset Value, offering and redemption price per share ($14,432,936 ÷ 1,483,376 outstanding shares of beneficial interest, $.01 par value, unlimited number of shares authorized) | $9.73 |
Institutional Class | |
Net Asset Value, offering and redemption price per share ($67,977,338 ÷ 6,974,839 outstanding shares of beneficial interest, $.01 par value, unlimited number of shares authorized) | $9.75 |
DWS Short-Term Municipal Bond Fund | | | 21 |
Investment Income | |
Income: | |
Interest | $2,403,743 |
Expenses: | |
Management fee | 224,515 |
Administration fee | 72,593 |
Services to shareholders | 75,559 |
Distribution and service fees | 86,255 |
Custodian fee | 413 |
Professional fees | 34,270 |
Reports to shareholders | 15,285 |
Registration fees | 35,337 |
Trustees' fees and expenses | 4,426 |
Other | 12,110 |
Total expenses before expense reductions | 560,763 |
Expense reductions | (140,148 ) |
Total expenses after expense reductions | 420,615 |
Net investment income | 1,983,128 |
Realized and Unrealized Gain (Loss) | |
Net realized gain (loss) from investments | (140,820 ) |
Change in net unrealized appreciation (depreciation) on investments | 2,797,826 |
Net gain (loss) | 2,657,006 |
Net increase (decrease) in net assets resulting from operations | $4,640,134 |
22 | | | DWS Short-Term Municipal Bond Fund |
Six Months Ended April 30, 2024 | Year Ended October 31, | |
Increase (Decrease) in Net Assets | (Unaudited) | 2023 |
Operations: | ||
Net investment income | $1,983,128 | $4,099,828 |
Net realized gain (loss) | (140,820 ) | (1,208,363 ) |
Change in net unrealized appreciation (depreciation) | 2,797,826 | 3,014,648 |
Net increase (decrease) in net assets resulting from operations | 4,640,134 | 5,906,113 |
Distributions to shareholders: | ||
Class A | (855,803 ) | (1,908,304 ) |
Class C | (12,197 ) | (25,079 ) |
Class S | (224,489 ) | (495,107 ) |
Institutional Class | (1,008,036 ) | (1,921,886 ) |
Total distributions | (2,100,525 ) | (4,350,376 ) |
Fund share transactions: | ||
Proceeds from shares sold | 19,983,935 | 42,489,669 |
Reinvestment of distributions | 1,866,518 | 3,889,532 |
Payments for shares redeemed | (34,737,088 ) | (90,687,178 ) |
Net increase (decrease) in net assets from Fund share transactions | (12,886,635 ) | (44,307,977 ) |
Increase (decrease) in net assets | (10,347,026 ) | (42,752,240 ) |
Net assets at beginning of period | 153,333,164 | 196,085,404 |
Net assets at end of period | $142,986,138 | $153,333,164 |
DWS Short-Term Municipal Bond Fund | | | 23 |
DWS Short-Term Municipal Bond Fund — Class A | ||||||
Six Months Ended 4/30/24 | Years Ended October 31, | |||||
(Unaudited) | 2023 | 2022 | 2021 | 2020 | 2019 | |
Selected Per Share Data | ||||||
Net asset value, beginning of period | $9.59 | $9.54 | $10.16 | $10.21 | $10.15 | $9.93 |
Income (loss) from investment operations: | ||||||
Net investment incomea | .12 | .22 | .11 | .08 | .11 | .15 |
Net realized and unrealized gain (loss) | .16 | .06 | (.59 ) | .01 | .09 | .23 |
Total from investment operations | .28 | .28 | (.48 ) | .09 | .20 | .38 |
Less distributions from: | ||||||
Net investment income | (.13 ) | (.23 ) | (.12 ) | (.09 ) | (.12 ) | (.16 ) |
Net realized gains | — | — | (.02 ) | (.05 ) | (.02 ) | — |
Total distributions | (.13 ) | (.23 ) | (.14 ) | (.14 ) | (.14 ) | (.16 ) |
Net asset value, end of period | $9.74 | $9.59 | $9.54 | $10.16 | $10.21 | $10.15 |
Total Return (%)b,c | 2.92 * | 2.98 | (4.72 ) | .84 | 2.00 | 3.83 |
Ratios to Average Net Assets and Supplemental Data | ||||||
Net assets, end of period ($ millions) | 59 | 69 | 88 | 126 | 145 | 180 |
Ratio of expenses before expense reductions (%) | .88 ** | .87 | .82 | .79 | .79 | .91 |
Ratio of expenses after expense reductions (%) | .69 ** | .68 | .69 | .74 | .72 | .72 |
Ratio of net investment income (%) | 2.52 ** | 2.26 | 1.07 | .79 | 1.13 | 1.54 |
Portfolio turnover rate (%) | 40 * | 86 | 112 | 105 | 88 | 109 |
a | Based on average shares outstanding during the period. |
b | Total return does not reflect the effect of any sales charges. |
c | Total return would have been lower had certain expenses not been reduced. |
* | Not annualized |
** | Annualized |
24 | | | DWS Short-Term Municipal Bond Fund |
DWS Short-Term Municipal Bond Fund — Class C | ||||||
Six Months Ended 4/30/24 | Years Ended October 31, | |||||
(Unaudited) | 2023 | 2022 | 2021 | 2020 | 2019 | |
Selected Per Share Data | ||||||
Net asset value, beginning of period | $9.58 | $9.53 | $10.16 | $10.21 | $10.15 | $9.93 |
Income (loss) from investment operations: | ||||||
Net investment incomea | .09 | .15 | .03 | .01 | .04 | .08 |
Net realized and unrealized gain (loss) | .16 | .06 | (.60 ) | .00 * | .09 | .22 |
Total from investment operations | .25 | .21 | (.57 ) | .01 | .13 | .30 |
Less distributions from: | ||||||
Net investment income | (.09 ) | (.16 ) | (.04 ) | (.01 ) | (.05 ) | (.08 ) |
Net realized gains | — | — | (.02 ) | (.05 ) | (.02 ) | — |
Total distributions | (.09 ) | (.16 ) | (.06 ) | (.06 ) | (.07 ) | (.08 ) |
Net asset value, end of period | $9.74 | $9.58 | $9.53 | $10.16 | $10.21 | $10.15 |
Total Return (%)b,c | 2.65 ** | 2.21 | (5.54 ) | .10 | 1.24 | 3.05 |
Ratios to Average Net Assets and Supplemental Data | ||||||
Net assets, end of period ($ millions) | 1 | 1 | 1 | 2 | 3 | 5 |
Ratio of expenses before expense reductions (%) | 1.61 *** | 1.60 | 1.55 | 1.55 | 1.55 | 1.70 |
Ratio of expenses after expense reductions (%) | 1.44 *** | 1.43 | 1.44 | 1.49 | 1.47 | 1.47 |
Ratio of net investment income (%) | 1.77 *** | 1.52 | .30 | .07 | .38 | .85 |
Portfolio turnover rate (%) | 40 ** | 86 | 112 | 105 | 88 | 109 |
a | Based on average shares outstanding during the period. |
b | Total return does not reflect the effect of any sales charges. |
c | Total return would have been lower had certain expenses not been reduced. |
* | Amount is less than $.005. |
** | Not annualized |
*** | Annualized |
DWS Short-Term Municipal Bond Fund | | | 25 |
DWS Short-Term Municipal Bond Fund — Class S | ||||||
Six Months Ended 4/30/24 | Years Ended October 31, | |||||
(Unaudited) | 2023 | 2022 | 2021 | 2020 | 2019 | |
Selected Per Share Data | ||||||
Net asset value, beginning of period | $9.57 | $9.53 | $10.15 | $10.19 | $10.13 | $9.92 |
Income (loss) from investment operations: | ||||||
Net investment incomea | .13 | .23 | .12 | .10 | .13 | .17 |
Net realized and unrealized gain (loss) | .17 | .06 | (.59 ) | .02 | .09 | .21 |
Total from investment operations | .30 | .29 | (.47 ) | .12 | .22 | .38 |
Less distributions from: | ||||||
Net investment income | (.14 ) | (.25 ) | (.13 ) | (.11 ) | (.14 ) | (.17 ) |
Net realized gains | — | — | (.02 ) | (.05 ) | (.02 ) | — |
Total distributions | (.14 ) | (.25 ) | (.15 ) | (.16 ) | (.16 ) | (.17 ) |
Net asset value, end of period | $9.73 | $9.57 | $9.53 | $10.15 | $10.19 | $10.13 |
Total Return (%)b | 3.13 * | 3.03 | (4.59 ) | 1.10 | 2.15 | 3.88 |
Ratios to Average Net Assets and Supplemental Data | ||||||
Net assets, end of period ($ millions) | 14 | 17 | 24 | 48 | 49 | 51 |
Ratio of expenses before expense reductions (%) | .66 ** | .64 | .61 | .60 | .65 | .75 |
Ratio of expenses after expense reductions (%) | .50 ** | .53 | .54 | .58 | .57 | .57 |
Ratio of net investment income (%) | 2.71 ** | 2.41 | 1.19 | .95 | 1.27 | 1.72 |
Portfolio turnover rate (%) | 40 * | 86 | 112 | 105 | 88 | 109 |
a | Based on average shares outstanding during the period. |
b | Total return would have been lower had certain expenses not been reduced. |
* | Not annualized |
** | Annualized |
26 | | | DWS Short-Term Municipal Bond Fund |
DWS Short-Term Municipal Bond Fund — Institutional Class | ||||||
Six Months Ended 4/30/24 | Years Ended October 31, | |||||
(Unaudited) | 2023 | 2022 | 2021 | 2020 | 2019 | |
Selected Per Share Data | ||||||
Net asset value, beginning of period | $9.59 | $9.54 | $10.16 | $10.21 | $10.15 | $9.93 |
Income (loss) from investment operations: | ||||||
Net investment incomea | .13 | .24 | .13 | .11 | .14 | .18 |
Net realized and unrealized gain (loss) | .17 | .07 | (.59 ) | .01 | .09 | .22 |
Total from investment operations | .30 | .31 | (.46 ) | .12 | .23 | .40 |
Less distributions from: | ||||||
Net investment income | (.14 ) | (.26 ) | (.14 ) | (.12 ) | (.15 ) | (.18 ) |
Net realized gains | — | — | (.02 ) | (.05 ) | (.02 ) | — |
Total distributions | (.14 ) | (.26 ) | (.16 ) | (.17 ) | (.17 ) | (.18 ) |
Net asset value, end of period | $9.75 | $9.59 | $9.54 | $10.16 | $10.21 | $10.15 |
Total Return (%)b | 3.16 * | 3.24 | (4.49 ) | 1.09 | 2.26 | 4.09 |
Ratios to Average Net Assets and Supplemental Data | ||||||
Net assets, end of period ($ millions) | 68 | 66 | 82 | 111 | 125 | 94 |
Ratio of expenses before expense reductions (%) | .63 ** | .62 | .57 | .56 | .55 | .69 |
Ratio of expenses after expense reductions (%) | .44 ** | .43 | .44 | .49 | .47 | .48 |
Ratio of net investment income (%) | 2.77 ** | 2.51 | 1.33 | 1.04 | 1.37 | 1.79 |
Portfolio turnover rate (%) | 40 * | 86 | 112 | 105 | 88 | 109 |
a | Based on average shares outstanding during the period. |
b | Total return would have been lower had certain expenses not been reduced. |
* | Not annualized |
** | Annualized |
DWS Short-Term Municipal Bond Fund | | | 27 |
28 | | | DWS Short-Term Municipal Bond Fund |
DWS Short-Term Municipal Bond Fund | | | 29 |
30 | | | DWS Short-Term Municipal Bond Fund |
Purchases | Sales | |
Non-U.S. Treasury Obligations | $58,183,012 | $71,642,110 |
U.S. Treasury Obligations | $1,990,397 | $— |
DWS Short-Term Municipal Bond Fund | | | 31 |
First $500 million of the Fund’s average daily net assets | .300% |
Next $500 million of such net assets | .285% |
Next $1.0 billion of such net assets | .270% |
Over $2.0 billion of such net assets | .255% |
Class A | .68% |
Class C | 1.43% |
Class S | .50% |
Institutional Class | .43% |
32 | | | DWS Short-Term Municipal Bond Fund |
Class A | .70% | |
Class C | 1.45% | |
Institutional Class | .45% |
Class A | $61,961 |
Class C | 1,093 |
Class S | 12,543 |
Institutional Class | 64,551 |
$140,148 |
Services to Shareholders | Total Aggregated | Unpaid at April 30, 2024 |
Class A | $1,031 | $415 |
Class C | 140 | 44 |
Class S | 1,092 | 378 |
Institutional Class | 277 | 100 |
$2,540 | $937 |
DWS Short-Term Municipal Bond Fund | | | 33 |
Sub-Recordkeeping | Total Aggregated |
Class A | $30,743 |
Class C | 361 |
Class S | 8,793 |
Institutional Class | 32,030 |
$71,927 |
Distribution Fee | Total Aggregated | Unpaid at April 30, 2024 |
Class C | $4,744 | $735 |
Service Fee | Total Aggregated | Unpaid at April 30, 2024 | Annualized Rate |
Class A | $79,933 | $21,259 | .25% |
Class C | 1,578 | 886 | .25% |
$81,511 | $22,145 |
34 | | | DWS Short-Term Municipal Bond Fund |
Six Months Ended April 30, 2024 | Year Ended October 31, 2023 | |||
Shares | Dollars | Shares | Dollars | |
Shares sold | ||||
Class A | 265,892 | $2,597,215 | 988,900 | $9,550,859 |
Class C | 20,697 | 201,726 | 64,379 | 622,637 |
Class S | 138,568 | 1,343,813 | 174,711 | 1,686,210 |
Institutional Class | 1,622,482 | 15,841,181 | 3,160,323 | 30,629,963 |
$19,983,935 | $42,489,669 | |||
DWS Short-Term Municipal Bond Fund | | | 35 |
Six Months Ended April 30, 2024 | Year Ended October 31, 2023 | |||
Shares | Dollars | Shares | Dollars | |
Shares issued to shareholders in reinvestment of distributions | ||||
Class A | 80,592 | $787,233 | 180,966 | $1,752,791 |
Class C | 1,243 | 12,139 | 2,578 | 24,963 |
Class S | 21,488 | 209,643 | 47,824 | 462,568 |
Institutional Class | 87,728 | 857,503 | 170,209 | 1,649,210 |
$1,866,518 | $3,889,532 | |||
Shares redeemed | ||||
Class A | (1,463,697 ) | $(14,283,674 ) | (3,227,382 ) | $(31,336,423 ) |
Class C | (37,145 ) | (362,480 ) | (63,912 ) | (619,156 ) |
Class S | (482,140 ) | (4,698,321 ) | (971,636 ) | (9,397,385 ) |
Institutional Class | (1,575,668 ) | (15,392,613 ) | (5,089,882 ) | (49,334,214 ) |
$(34,737,088 ) | $(90,687,178 ) | |||
Net increase (decrease) | ||||
Class A | (1,117,213 ) | $(10,899,226 ) | (2,057,516 ) | $(20,032,773 ) |
Class C | (15,205 ) | (148,615 ) | 3,045 | 28,444 |
Class S | (322,084 ) | (3,144,865 ) | (749,101 ) | (7,248,607 ) |
Institutional Class | 134,542 | 1,306,071 | (1,759,350 ) | (17,055,041 ) |
$(12,886,635 ) | $(44,307,977 ) | |||
36 | | | DWS Short-Term Municipal Bond Fund |
DWS Short-Term Municipal Bond Fund — | | | 37 |
38 | | | DWS Short-Term Municipal Bond Fund |
Actual Fund Return | Class A | Class C | Class S | Institutional Class |
Beginning Account Value 11/1/23 | $1,000.00 | $1,000.00 | $1,000.00 | $1,000.00 |
Ending Account Value 4/30/24 | $1,029.20 | $1,026.50 | $1,031.30 | $1,031.60 |
Expenses Paid per $1,000* | $3.48 | $7.26 | $2.53 | $2.22 |
Hypothetical 5% Fund Return | Class A | Class C | Class S | Institutional Class |
Beginning Account Value 11/1/23 | $1,000.00 | $1,000.00 | $1,000.00 | $1,000.00 |
Ending Account Value 4/30/24 | $1,021.43 | $1,017.70 | $1,022.38 | $1,022.68 |
Expenses Paid per $1,000* | $3.47 | $7.22 | $2.51 | $2.21 |
* | Expenses are equal to the Fund’s annualized expense ratio for each share class, multiplied by the average account value over the period, multiplied by 182 (the number of days in the most recent six-month period), then divided by 366. |
Annualized Expense Ratios | Class A | Class C | Class S | Institutional Class |
DWS Short-Term Municipal Bond Fund | .69% | 1.44% | .50% | .44% |
DWS Short-Term Municipal Bond Fund | | | 39 |
40 | | | DWS Short-Term Municipal Bond Fund |
DWS Short-Term Municipal Bond Fund | | | 41 |
42 | | | DWS Short-Term Municipal Bond Fund |
DWS Short-Term Municipal Bond Fund | | | 43 |
44 | | | DWS Short-Term Municipal Bond Fund |
For More Information | The automated telephone system allows you to access personalized account information and obtain information on other DWS funds using either your voice or your telephone keypad. Certain account types within Classes A, C and S also have the ability to purchase, exchange or redeem shares using this system. |
For more information, contact your financial representative. You may also access our automated telephone system or speak with a Shareholder Service representative by calling: (800) 728-3337 | |
Web Site | dws.com View your account transactions and balances, trade shares, monitor your asset allocation, subscribe to fund and account updates by e-mail, and change your address, 24 hours a day. |
Obtain prospectuses and applications, news about DWS funds, insight from DWS economists and investment specialists and access to DWS fund account information. | |
Written Correspondence | DWS PO Box 219151 Kansas City, MO 64121-9151 |
Proxy Voting | The Fund’s policies and procedures for voting proxies for portfolio securities and information about how the Fund voted proxies related to its portfolio securities during the most recent 12-month period ended June 30 are available on our Web site — dws.com/en-us/resources/proxy-voting — or on the SEC’s Web site — sec.gov. To obtain a written copy of the Fund’s policies and procedures without charge, upon request, call us toll free at (800) 728-3337. |
Portfolio Holdings | Following the Fund’s fiscal first and third quarter-end, a complete portfolio holdings listing is posted on dws.com and is available free of charge by contacting your financial intermediary or, if you are a direct investor, by calling (800) 728-3337. In addition, the portfolio holdings listing is filed with the SEC on the Fund’s Form N-PORT and will be available on the SEC’s Web site at sec.gov. Additional portfolio holdings for the Fund are also posted on dws.com from time to time. Please see the Fund’s current prospectus for more information. |
Principal Underwriter | If you have questions, comments or complaints, contact: DWS Distributors, Inc. 222 South Riverside Plaza Chicago, IL 60606-5808 (800) 621-1148 |
DWS Short-Term Municipal Bond Fund | | | 45 |
Investment Management | DWS Investment Management Americas, Inc. (“DIMA” or the “Advisor” ), which is part of the DWS Group GmbH & Co. KGaA (“DWS Group” ), is the investment advisor for the Fund. DIMA and its predecessors have more than 90 years of experience managing mutual funds and DIMA provides a full range of investment advisory services to both institutional and retail clients. DIMA is an indirect, wholly owned subsidiary of DWS Group. |
DWS Group is a global organization that offers a wide range of investing expertise and resources, including hundreds of portfolio managers and analysts and an office network that reaches the world’s major investment centers. This well-resourced global investment platform brings together a wide variety of experience and investment insight across industries, regions, asset classes and investing styles. |
Class A | Class C | Class S | Institutional Class | |
Nasdaq Symbol | SRMAX | SRMCX | SRMSX | MGSMX |
CUSIP Number | 25158T 863 | 25158T 889 | 25158T 806 | 25158T 830 |
Fund Number | 436 | 736 | 2336 | 536 |
46 | | | DWS Short-Term Municipal Bond Fund |
| (b) Not applicable | ||
| ITEM 2. | CODE OF ETHICS | |
| Not applicable. | ||
| ITEM 3. | AUDIT COMMITTEE FINANCIAL EXPERT | |
| Not applicable | ||
| ITEM 4. | PRINCIPAL ACCOUNTANT FEES AND SERVICES | |
| Not applicable | ||
| ITEM 5. | AUDIT COMMITTEE OF LISTED REGISTRANTS | |
| Not applicable | ||
| ITEM 6. | INVESTMENTS | |
| Not applicable | ||
| ITEM 7. | DISCLOSURE OF PROXY VOTING POLICIES AND PROCEDURES FOR CLOSED-END MANAGEMENT INVESTMENT COMPANIES | |
| Not applicable | ||
| ITEM 8. | PORTFOLIO MANAGERS OF CLOSED-END MANAGEMENT INVESTMENT COMPANIES | |
| Not applicable | ||
| ITEM 9. | PURCHASES OF EQUITY SECURITIES BY CLOSED-END MANAGEMENT INVESTMENT COMPANY AND AFFILIATED PURCHASERS | |
| Not applicable | ||
| ITEM 10. | SUBMISSION OF MATTERS TO A VOTE OF SECURITY HOLDERS | |
| There were no material changes to the procedures by which shareholders may recommend nominees to the Fund’s Board. The primary function of the Nominating and Governance Committee is to identify and recommend individuals for membership on the Board and oversee the administration of the Board Governance Guidelines. Shareholders may recommend candidates for Board positions by forwarding their correspondence by U.S. mail or courier service to Keith R. Fox, DWS Funds Board Chair, c/o Thomas R. Hiller, Ropes & Gray LLP, Prudential Tower, 800 Boylston Street, Boston, MA 02199-3600. | ||
| ITEM 11. | CONTROLS AND PROCEDURES | |
| (a) | The Chief Executive and Financial Officers concluded that the Registrant’s Disclosure Controls and Procedures are effective based on the evaluation of the Disclosure Controls and Procedures as of a date within 90 days of the filing date of this report. | |
| (b) | There have been no changes in the registrant’s internal control over financial reporting that occurred during the period covered by this report that has materially affected, or is reasonably likely to materially affect, the registrant’s internal controls over financial reporting. | |
| ITEM 12. | Disclosure of Securities Lending Activities for Closed-End Management Investment Companies. | |
| Not applicable | ||
| ITEM 13. | EXHIBITS | |
| (a)(1) | Not applicable | |
| (a)(2) | Certification pursuant to Rule 30a-2(a) under the Investment Company Act of 1940 (17 CFR 270.30a-2(a)) is filed and attached hereto as Exhibit 99.CERT. | |
| (b) | Certification pursuant to Rule 30a-2(b) under the Investment Company Act of 1940 (17 CFR 270.30a-2(b)) is furnished and attached hereto as Exhibit 99.906CERT. | |
SIGNATURES
Pursuant to the requirements of the Securities Exchange Act of 1934 and the Investment Company Act of 1940, the registrant has duly caused this report to be signed on its behalf by the undersigned, thereunto duly authorized.
| Registrant: | DWS Short-Term Municipal Bond Fund, a series of Deutsche DWS Municipal Trust |
| By: | /s/Hepsen Uzcan Hepsen Uzcan Principal Executive Officer |
| Date: | 6/28/2024 |
Pursuant to the requirements of the Securities Exchange Act of 1934 and the Investment Company Act of 1940, this report has been signed below by the following persons on behalf of the registrant and in the capacities and on the dates indicated.
| By: | /s/Hepsen Uzcan Hepsen Uzcan Principal Executive Officer |
| Date: | 6/28/2024 |
| By: | /s/Diane Kenneally Diane Kenneally Principal Financial Officer |
| Date: | 6/28/2024 |