
10 February 2016 Investor Presentation (1Q2016)(financials as of Q4 2015)
Forward-looking statements in this report relating to WesBanco’s plans, strategies, objectives, expectations, intentions and adequacy of resources, are made pursuant to the safe harbor provisions of the Private Securities Litigation Reform Act of 1995. The information contained in this report should be read in conjunction with WesBanco’s 2014 Annual Report on Form 10-K and documents subsequently filed by WesBanco with the Securities and Exchange Commission (“SEC”), including WesBanco’s Form 10-Q for the quarters ended March 31, 2015, June 30, 2015 and September 30, 2015, which are available at the SEC’s website, www.sec.gov or at WesBanco’s website, www.wesbanco.com. Investors are cautioned that forward-looking statements, which are not historical fact, involve risks and uncertainties, including those detailed in WesBanco’s most recent Annual Report on Form 10-K filed with the SEC under “Risk Factors” in Part I, Item 1A. Such statements are subject to important factors that could cause actual results to differ materially from those contemplated by such statements. WesBanco does not assume any duty to update forward-looking statements. Forward-Looking Statements *
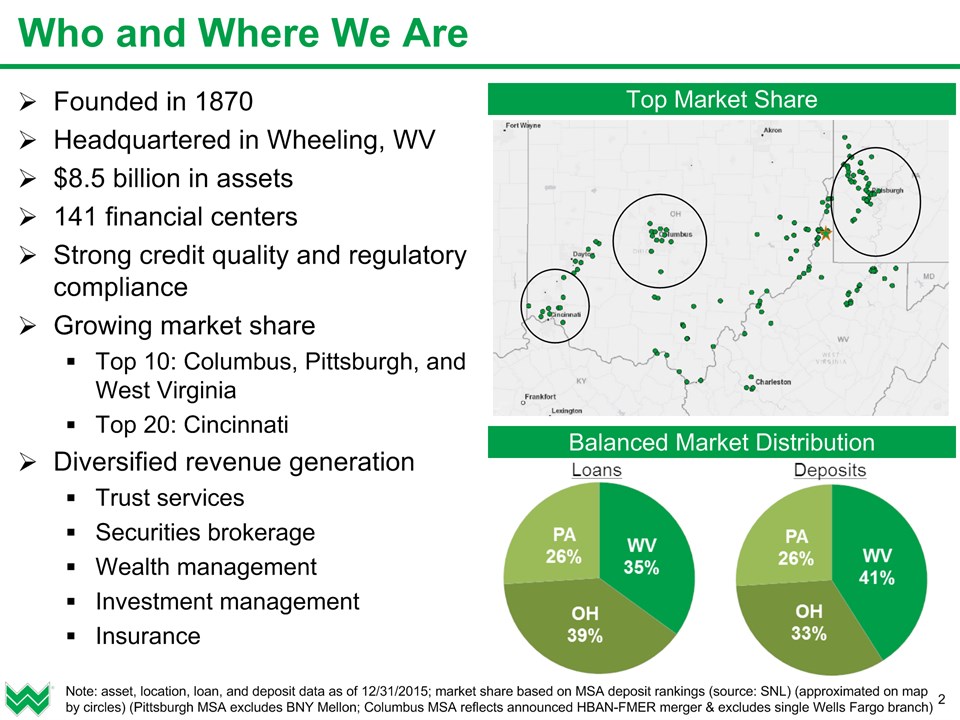
* Who and Where We Are Founded in 1870Headquartered in Wheeling, WV$8.5 billion in assets141 financial centersStrong credit quality and regulatory complianceGrowing market shareTop 10: Columbus, Pittsburgh, and West VirginiaTop 20: CincinnatiDiversified revenue generationTrust servicesSecurities brokerageWealth managementInvestment managementInsurance Top Market Share Balanced Market Distribution Note: asset, location, loan, and deposit data as of 12/31/2015; market share based on MSA deposit rankings (source: SNL) (approximated on map by circles) (Pittsburgh MSA excludes BNY Mellon; Columbus MSA reflects announced HBAN-FMER merger & excludes single Wells Fargo branch)

Executive Position Years inBanking Years atWSBC James Gardill Chairman of the Board 43* 43 Todd Clossin President & Chief Executive Officer 31 2 Robert Young EVP & Chief Financial Officer 29 14 Ivan Burdine EVP & Chief Credit Officer 35 2 Jonathan Dargusch EVP – Wealth Management 34 5 Jay Zatta EVP – Chief Lending Officer 29 7 Lynn Asensio EVP – Retail Administration 37 10 Michael Perkins EVP – Chief Risk & Admin Officer 20 20 Experienced Management Team * as legal counsel to WesBancoNote: all key operating executives listed have large firm experience *
* Key Differentiators Emerging regional financial services company with a community bank at its coreDiversified revenue growth engines with a critical focus on credit qualityWell-balanced loan and deposit distribution across footprintRobust legacy market share combined with three major metropolitan marketsTop ten market share in the Pittsburgh and Columbus MSAsStrong legacy of credit and risk managementSolid, and growing, non-interest income generation$3.6B of assets under management through our 100-year old trust business$900MM AUM through our proprietary mutual funds, the WesMark FundsFocus on cross-selling – average ratio on new consumer relationships has increased 38% to 4.3Strong expense management culture with an efficiency ratio of 56.3%, despite having sizable non-bank fee-based businesses Note: financial data as of quarter ending 12/31/2015; market share based on MSAs (source: SNL); cross-sale data is measured 90 days after relationship opening and reflects Sep-2015 compared to Oct-2013; please see the efficiency ratio reconciliation in the appendix Well-positioned for continued, high-quality growth
* Diversified Growth Strategies Diversified loan portfolio with a focus on Commercial and Industrial (C&I)Increased productivity from and enhancements to the commercial lending teamLong history of strong wealth management capabilitiesProprietary mutual funds, and a century of trust experienceEstablished wealth management, insurance, and private banking services are keys to fee income strategyTraditional retail banking services strategiesFocus on customer convenience and serviceInstitution-wide dedication to cross-selling across multiple marketsStrong culture of expense management Focus on delivering positive operating leverage while making investmentsEmphasis on technology to streamline and improve processesFranchise expansion in contiguous marketsTargeted acquisitions within a reasonable geographic hub of our headquarters

* Diversified Loan Portfolio Realignment of resources to higher growth marketsFocus on Commercial and Industrial (C&I) business with dedicated C&I and Business Banking teams in all metropolitan markets with limited direct and indirect credit exposure to the energy industry Composition as of 12/31/2015 Total Loans = $5.1B Composition as of 12/31/2010 Total Loans = $3.3B

* Diversified Loan Portfolio – Energy Exposure In general, efforts related to the shale oil and gas industry are centered on deposit and wealth management growth as opposed to loan growthMinimal exposure to the oil, gas, and coal industryDirect exposure is approximately 1% of $5.1B total loan portfolioIndirect exposure is an additional approximate 2% of the total loan portfolioReview of loans to the oil, gas, and coal industry performed during the fourth quarter of 2015 did not identify any material portfolio weakness on an aggregate basisWhile reduced oil and natural gas prices have led to a slowdown in new well drilling, investments continue to be made in our regions by large energy companies as these stronger energy players see the proven leases as a long-term investment opportunity Note: loan and asset data as of 12/31/15

* Strong Wealth Management Capabilities Trust, Securities Brokerage, Private Banking, and Insurance consolidated under one executive management team$3.6B of trust and mutual fund assets under management$280MM in private banking loans and depositsMore than 5,000 trust and 950 private banking relationshipsSignificant growth opportunities from shale-related private wealthRobust product capabilities:Trust and investment management, and securities investment salesPrivate client servicesFinancial, retirement, and estate planningInsurance (personal, commercial, title, health) CAGR4% Note: assets and clients as of 12/31/15; WesMark Funds net assets as of 12/31/15 Net Assets GrowthSm. Co. GrowthBalancedGov’t BondWV Muni Bond ($MM)$333.8$ 92.3$101.1$257.9$118.4 Trust Assets (Market Value as of 12/31) ($B)
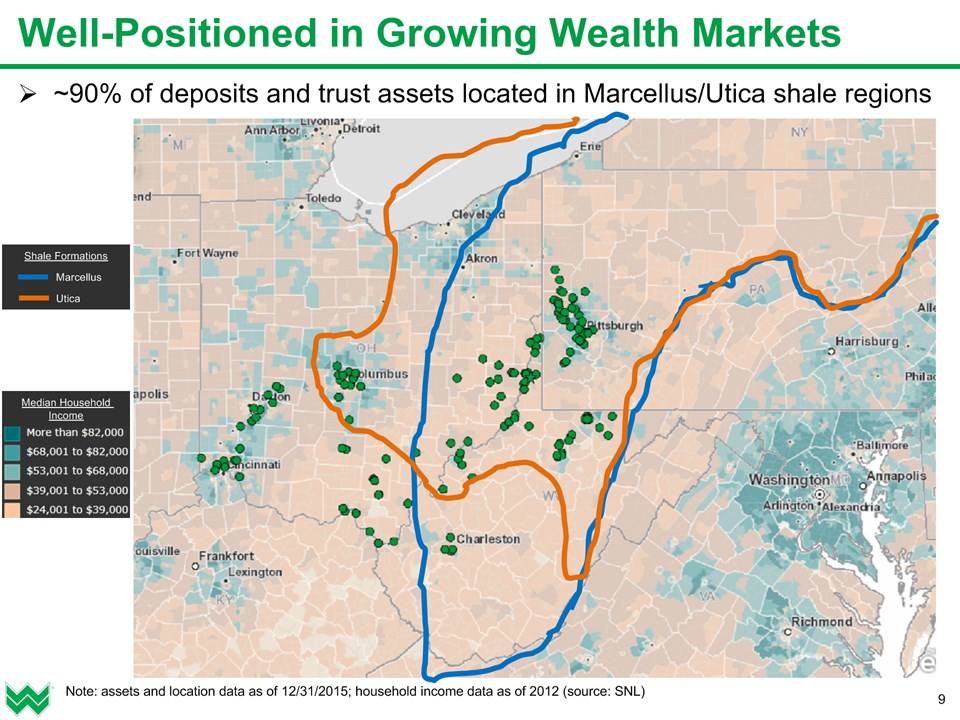
* Well-Positioned in Growing Wealth Markets ~90% of deposits and trust assets located in Marcellus/Utica shale regions Median Household Income Shale Formations Marcellus Utica Note: assets and location data as of 12/31/2015; household income data as of 2012 (source: SNL)
* Retail Banking Strategies Efficient financial center network with effective staff management and technology utilization supported by centralized, low-cost back office functionsFull suite of treasury management products, including international services, and enhanced wire and lockbox capabilitiesTransitioning financial center personnel from transaction-based to sales-based activityFull integration of CRM system to ensure relationship building and referralsCenters in key markets have bankers licensed to offer investment productsMajority of center managers have completed or are enrolled in our Business Banking Academy program Strong growth in securities sales, business banking loans, and e-banking feesContinuous reviews for financial center optimizationTechnology deployments and an omni-channel distribution modelSince 2012, closed nine offices, downsized five, and opened three new offices in more attractive markets Note: location data as of 12/31/2015
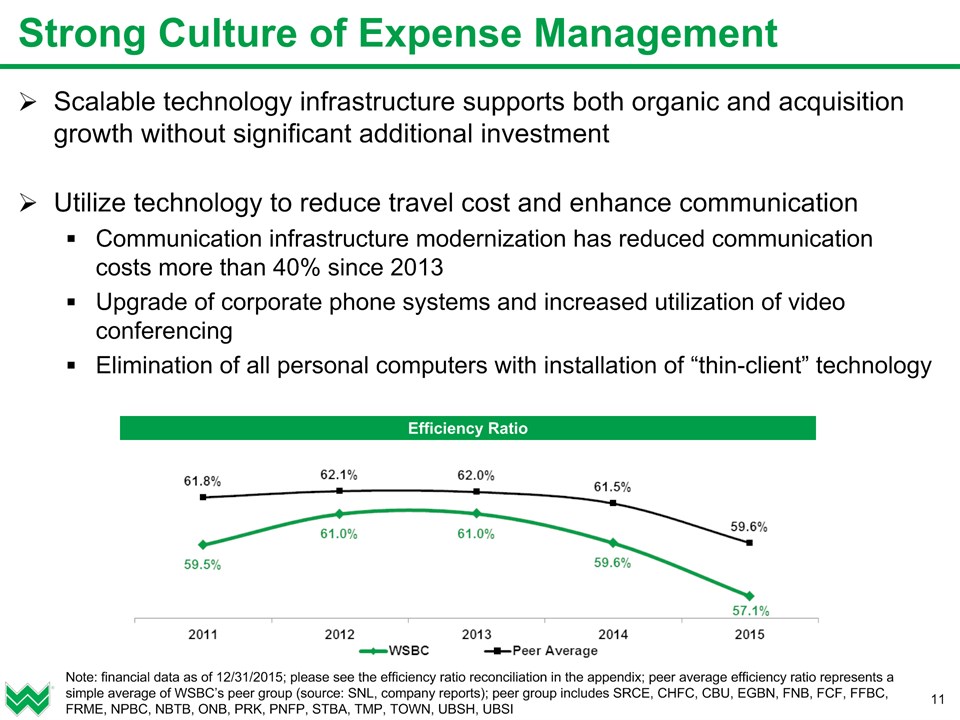
* Strong Culture of Expense Management Scalable technology infrastructure supports both organic and acquisition growth without significant additional investmentUtilize technology to reduce travel cost and enhance communicationCommunication infrastructure modernization has reduced communication costs more than 40% since 2013Upgrade of corporate phone systems and increased utilization of video conferencingElimination of all personal computers with installation of “thin-client” technology Note: financial data as of 12/31/2015; please see the efficiency ratio reconciliation in the appendix; peer average efficiency ratio represents a simple average of WSBC’s peer group (source: SNL, company reports); peer group includes SRCE, CHFC, CBU, EGBN, FNB, FCF, FFBC, FRME, NPBC, NBTB, ONB, PRK, PNFP, STBA, TMP, TOWN, UBSH, UBSI Efficiency Ratio
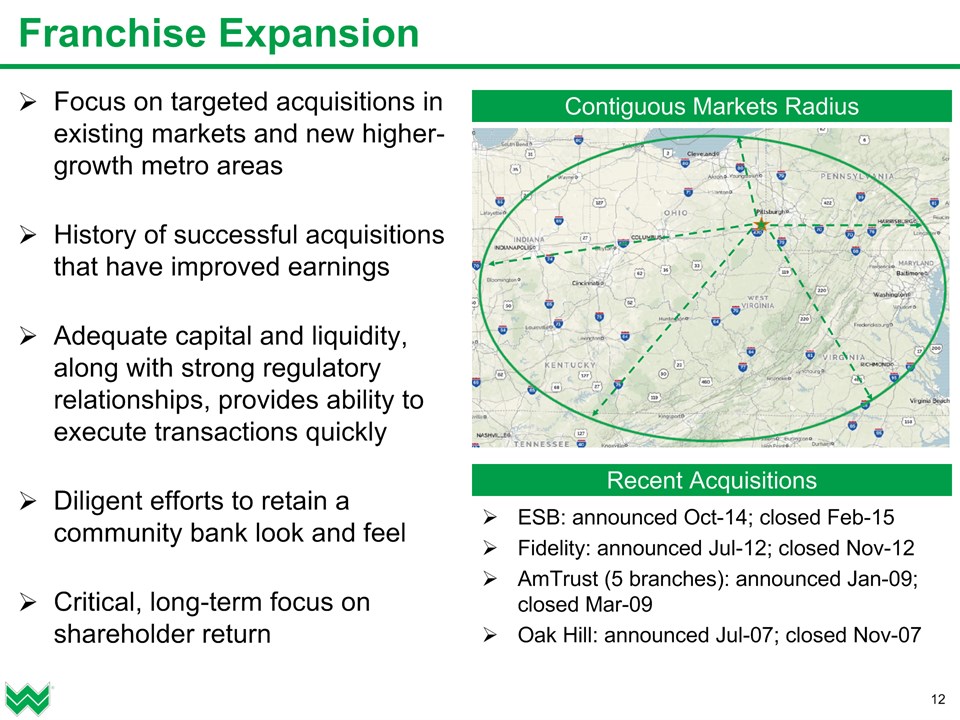
* Franchise Expansion Focus on targeted acquisitions in existing markets and new higher-growth metro areasHistory of successful acquisitions that have improved earningsAdequate capital and liquidity, along with strong regulatory relationships, provides ability to execute transactions quickly Diligent efforts to retain a community bank look and feelCritical, long-term focus on shareholder return Contiguous Markets Radius Recent Acquisitions ESB: announced Oct-14; closed Feb-15Fidelity: announced Jul-12; closed Nov-12AmTrust (5 branches): announced Jan-09; closed Mar-09Oak Hill: announced Jul-07; closed Nov-07
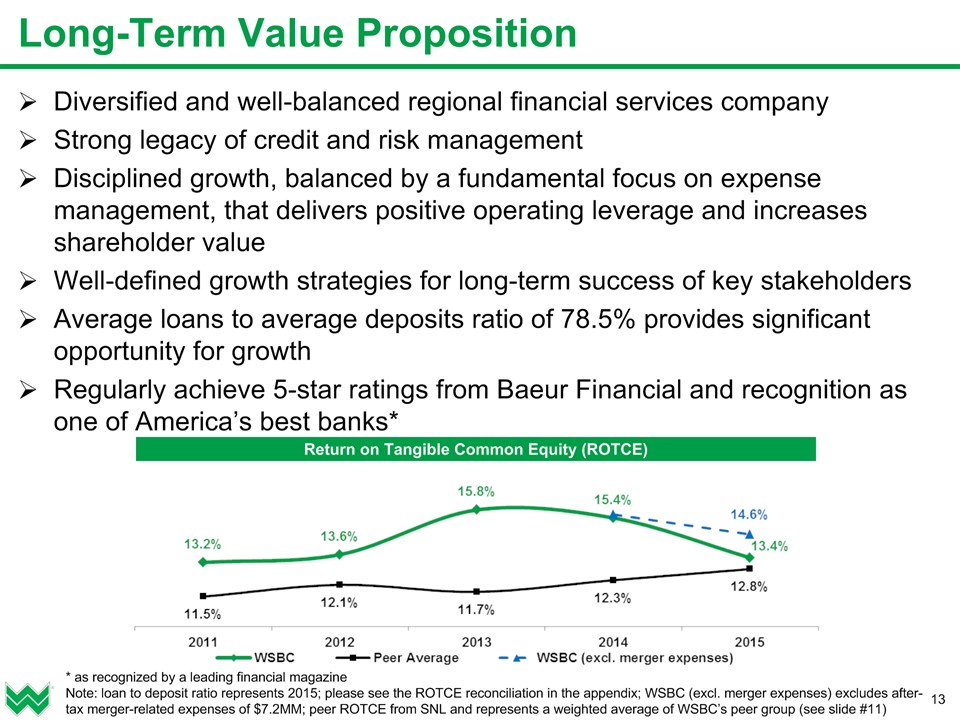
* Long-Term Value Proposition Diversified and well-balanced regional financial services companyStrong legacy of credit and risk managementDisciplined growth, balanced by a fundamental focus on expense management, that delivers positive operating leverage and increases shareholder valueWell-defined growth strategies for long-term success of key stakeholdersAverage loans to average deposits ratio of 78.5% provides significant opportunity for growthRegularly achieve 5-star ratings from Baeur Financial and recognition as one of America’s best banks* * as recognized by a leading financial magazineNote: loan to deposit ratio represents 2015; please see the ROTCE reconciliation in the appendix; WSBC (excl. merger expenses) excludes after-tax merger-related expenses of $7.2MM; peer ROTCE from SNL and represents a weighted average of WSBC’s peer group (see slide #11) Return on Tangible Common Equity (ROTCE)

Financial Overview
* Financial and Operational Highlights – Q4 2015 Net income up 32.7% and EPS up 1.7% (excluding merger-related costs)Return on tangible common equity of 14.7% (excluding merger-related costs)6.8% organic loan growth since 12/31/2014 (exclusive of ESB merger)Non-interest income increased 20.9% year-over-year driven by higher e-banking and deposit fees, trust and brokerage fees, and other incomePositive operating leverage driven by a core focus on return on investment, allowing a strong efficiency ratio of 56.3%, compared to 60.4% a year agoContinued improvement in asset quality as non-performing loans to total loans ratio of 1.04% improved 21 basis points from a year agoPipelines going into 2016 remain robust, and anticipate another solid year of loan growth, tempered by quarterly construction loan portfolio fluctuations Note: financial data as of quarter ending 12/31/2015, which reflects impact of the ESB merger, and compared the quarter ending 12/31/2014; please see the reconciliations to GAAP results in the appendix
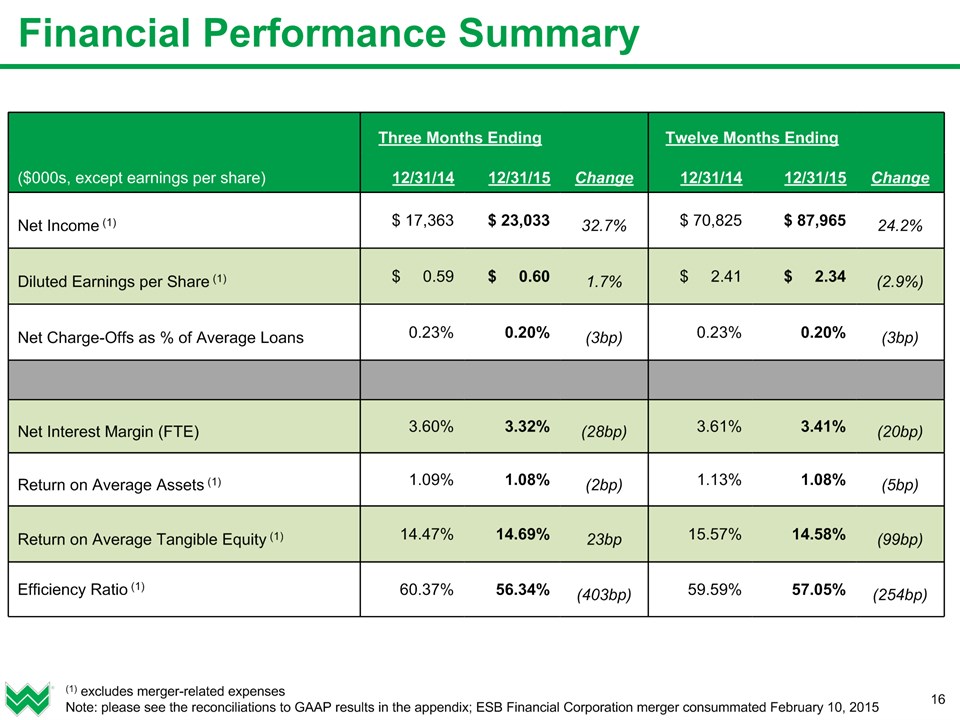
Financial Performance Summary * (1) excludes merger-related expensesNote: please see the reconciliations to GAAP results in the appendix; ESB Financial Corporation merger consummated February 10, 2015 Three Months Ending Three Months Ending Twelve Months Ending Twelve Months Ending ($000s, except earnings per share) 12/31/14 12/31/15 Change 12/31/14 12/31/15 Change Net Income (1) $ 17,363 $ 23,033 32.7% $ 70,825 $ 87,965 24.2% Diluted Earnings per Share (1) $ 0.59 $ 0.60 1.7% $ 2.41 $ 2.34 (2.9%) Net Charge-Offs as % of Average Loans 0.23% 0.20% (3bp) 0.23% 0.20% (3bp) Net Interest Margin (FTE) 3.60% 3.32% (28bp) 3.61% 3.41% (20bp) Return on Average Assets (1) 1.09% 1.08% (2bp) 1.13% 1.08% (5bp) Return on Average Tangible Equity (1) 14.47% 14.69% 23bp 15.57% 14.58% (99bp) Efficiency Ratio (1) 60.37% 56.34% (403bp) 59.59% 57.05% (254bp)
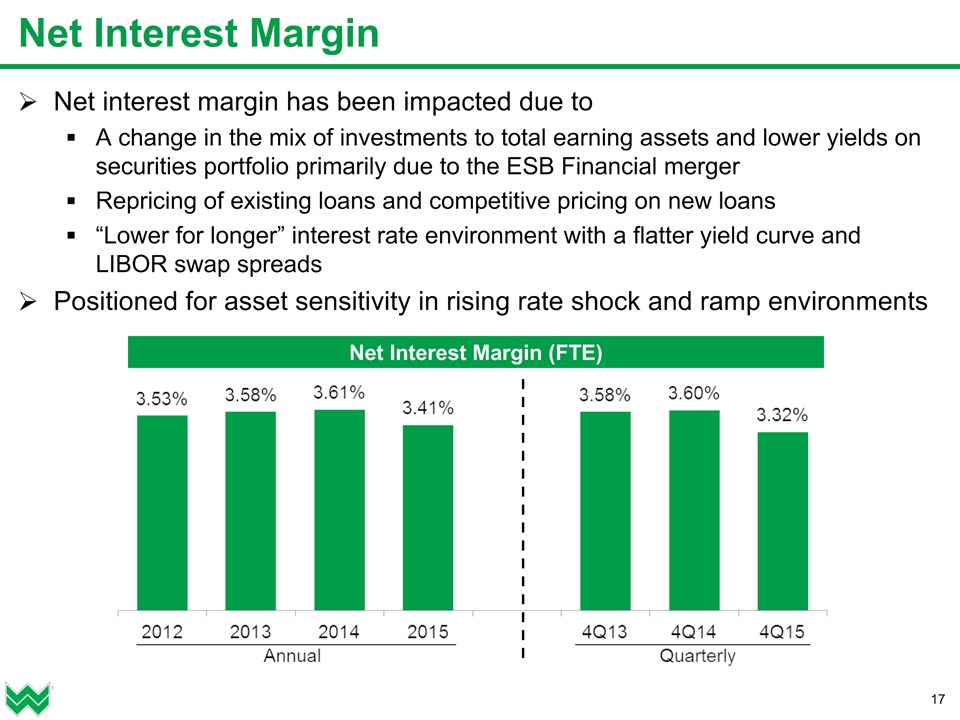
Net Interest Margin Net interest margin has been impacted due toA change in the mix of investments to total earning assets and lower yields on securities portfolio primarily due to the ESB Financial mergerRepricing of existing loans and competitive pricing on new loans“Lower for longer” interest rate environment with a flatter yield curve and LIBOR swap spreadsPositioned for asset sensitivity in rising rate shock and ramp environments * Net Interest Margin (FTE)

Securities Portfolio Securities portfolio represents ~29% of total assetsSelective sales during Q4 2015 to manage risk and portfolio efficiencyNo credit-related issuesHigher percentage of assets due to ESB Financial mergerBalance sheet risk reduction strategyUse to fund future loan growthHelps stay under $10B threshold even with 1-2 smaller acquisitions during next 1-3 years (adjust portfolio size)Average tax-equivalent portfolio yield of 2.90%Weighted average life ~4.5 yearsModified duration 4.0%More than 57% unpledged * Composition as of 12/31/2015 Total Securities = $2.4B Note: financial data as of 12/31/2015
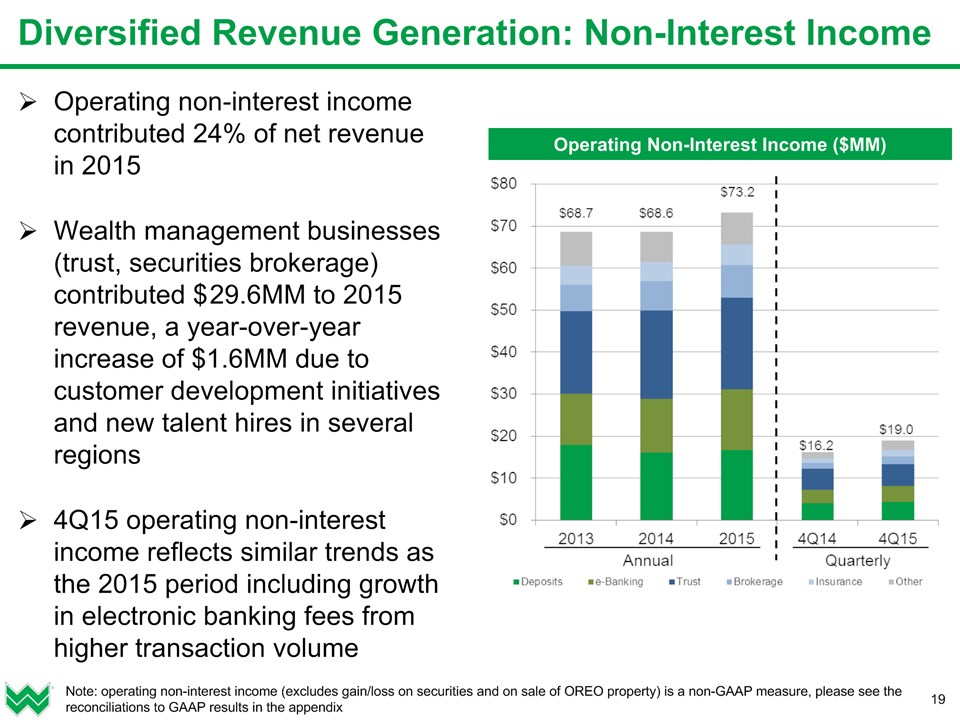
Diversified Revenue Generation: Non-Interest Income Operating non-interest income contributed 24% of net revenue in 2015Wealth management businesses (trust, securities brokerage) contributed $ 29.6MM to 2015 revenue, a year-over-year increase of $1.6MM due to customer development initiatives and new talent hires in several regions4Q15 operating non-interest income reflects similar trends as the 2015 period including growth in electronic banking fees from higher transaction volume * Note: operating non-interest income (excludes gain/loss on securities and on sale of OREO property) is a non-GAAP measure, please see the reconciliations to GAAP results in the appendix Operating Non-Interest Income ($MM)

Conservative underwriting standardsFive consecutive “outstanding” CRA ratingsAnalyzing cost of processes for crossing the $10B Dodd-Frank thresholdLiquidity, loan, and capital stress testing in preparation for post-$10B DFAST reportingEnhancing our strong compliance management systemStrong risk-based capital ratios well above regulatory requirements Risk Management and Regulatory Compliance * Basel III Tier 1 Risk-Based Capital Ratio Basel III Common Equity Tier 1 Capital Ratio
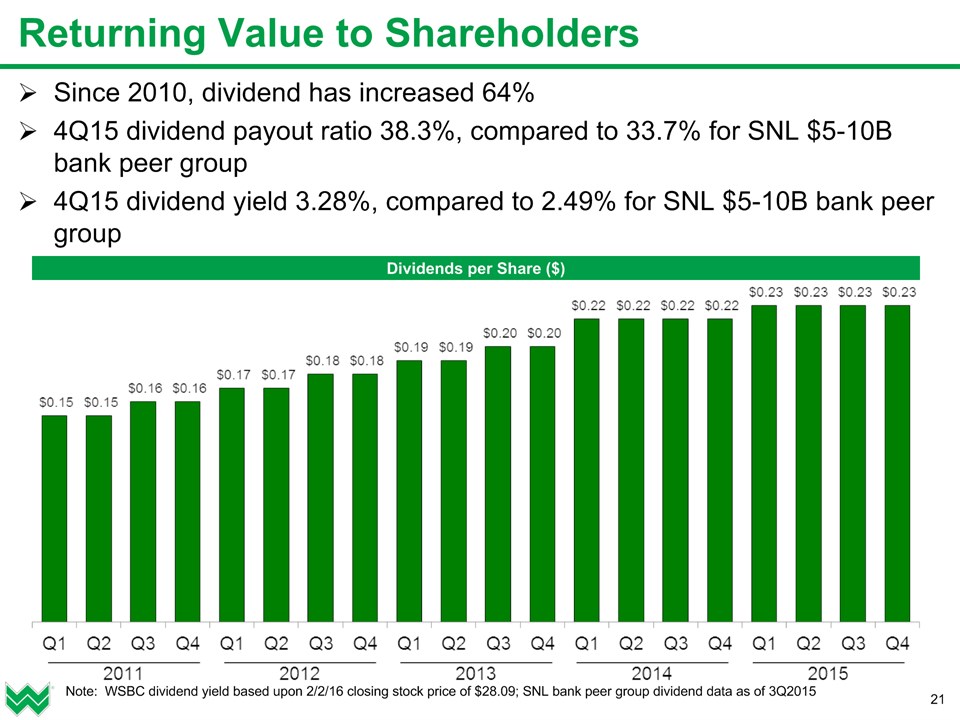
Returning Value to Shareholders Since 2010, dividend has increased 64%4Q15 dividend payout ratio 38.3%, compared to 33.7% for SNL $5-10B bank peer group4Q15 dividend yield 3.28%, compared to 2.49% for SNL $5-10B bank peer group * Dividends per Share ($) Note: WSBC dividend yield based upon 2/2/16 closing stock price of $28.09; SNL bank peer group dividend data as of 3Q2015
* Investment Rationale Diversified and well-balanced regional financial services companyDisciplined growth, balanced by a fundamental focus on expense management, that delivers positive operating leverage and increases shareholder valueStrong legacy of credit and risk managementFavorable asset quality when compared to regional and national peersWell-defined growth strategies for long-term success of key stakeholders Focus on returning value to shareholdersStock trades at a 1-2x multiple discount – despite above peer financial performance Well-positioned for continued, high-quality growth withstrong upside market appreciation potential


Appendix
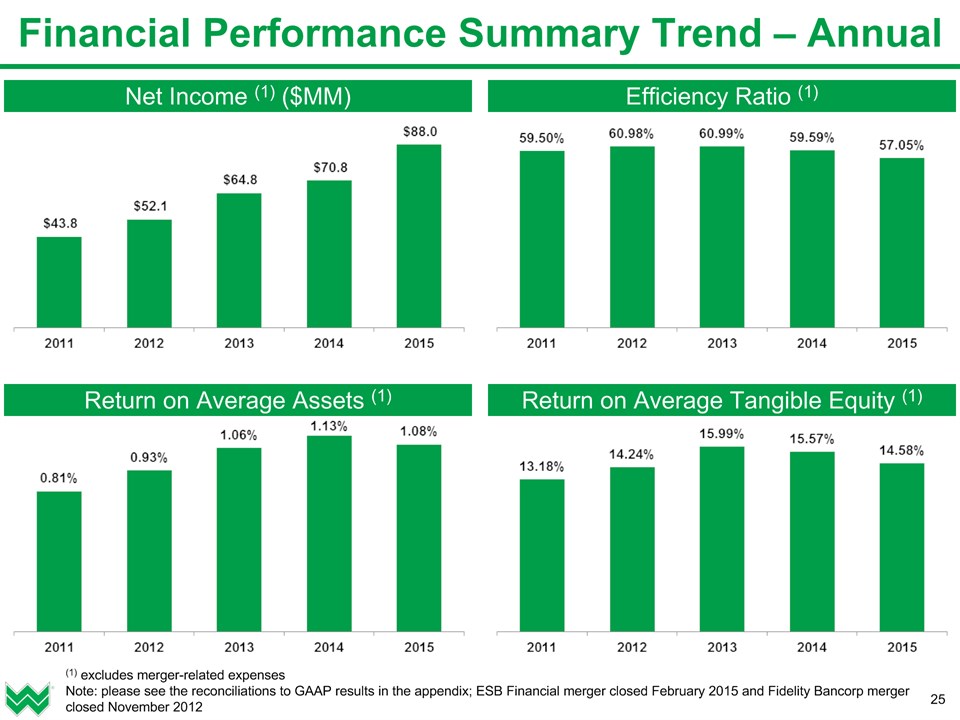
Financial Performance Summary Trend – Annual * Efficiency Ratio (1) Net Income (1) ($MM) (1) excludes merger-related expensesNote: please see the reconciliations to GAAP results in the appendix; ESB Financial merger closed February 2015 and Fidelity Bancorp merger closed November 2012 Return on Average Tangible Equity (1) Return on Average Assets (1)

Interest Rate Sensitivity Positioned for asset sensitivity in a rising rate ramp environment * Immediate Change in Interest Rates Change in Net Interest Income over One Year Change in Net Interest Income over One Year Immediate Change in Interest Rates December 31, 2014 December 31, 2015 +1% Rate Shock +1.9% +3.6% +2% Rate Shock +2.1% +5.5% +3% Rate Shock +0.9% +6.2% +2% Rate Ramp +1.9% +3.0% (1%) Rate Shock (1.8%) (2.7%) EVE +2% Rate Shock +6.0% +1.9% EVE (1%) Rate Shock (11.0%) (8.8%) Note: “EVE” is the economic value of equity, which is defined as the market value of equity in various increasing and decreasing rate scenarios
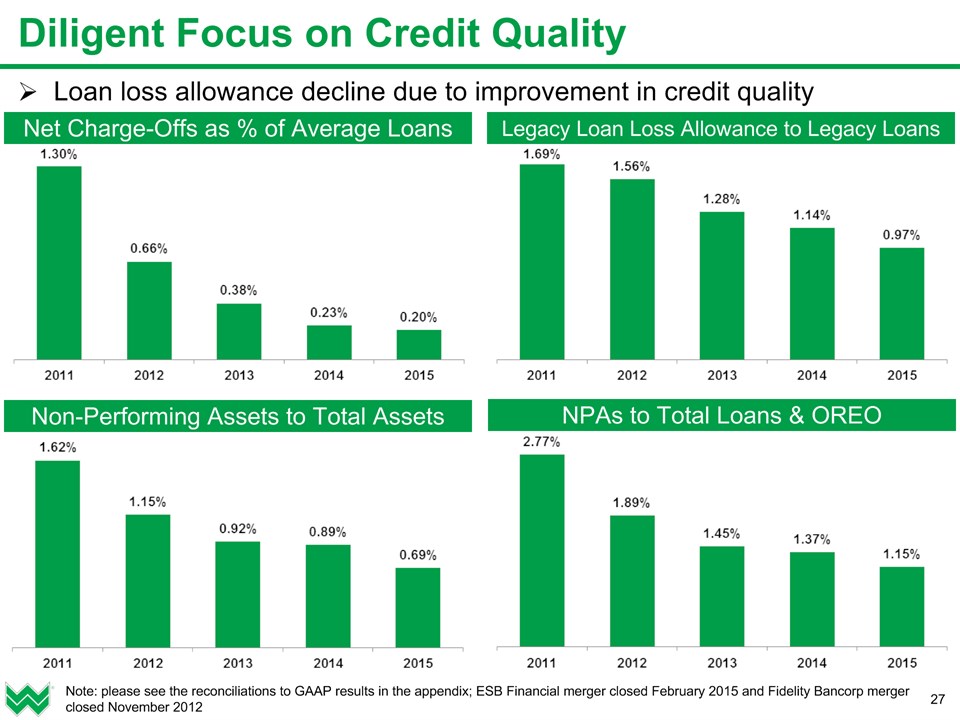
Loan loss allowance decline due to improvement in credit quality Legacy Loan Loss Allowance to Legacy Loans Non-Performing Assets to Total Assets Net Charge-Offs as % of Average Loans NPAs to Total Loans & OREO Diligent Focus on Credit Quality * Note: please see the reconciliations to GAAP results in the appendix; ESB Financial merger closed February 2015 and Fidelity Bancorp merger closed November 2012

Stock Performance: Long-Term Cumulative Return * Note: cumulative return since WSBC IPO compared to the cumulative return for the S&P500 Index over the same time period

Reconciliation: Efficiency Ratio * Note: “efficiency ratio” is non-interest expense excluding restructuring and merger-rated expense divided by total income; FTE represents fully taxable equivalent; ESB Financial merger closed February 2015 and Fidelity Bancorp merger closed November 2012 Three Months Ending Three Months Ending Twelve Months Ending Twelve Months Ending Twelve Months Ending Twelve Months Ending Twelve Months Ending ($000s) 12/31/14 12/31/15 12/31/11 12/31/12 12/31/13 12/31/14 12/31/15 Non-Interest Expense $ 41,972 $ 46,894 $140,295 $150,120 $160,998 $161,633 $193,923 Restructuring & Merger-Related Expense $ (1,309) $ (48) $ -- $ (3,888) $ (1,310) $ (1,309) $(11,082) Non-Interest Expense excluding Restructuring & Merger-Related Exp. $ 40,663 $ 46,846 $140,295 $146,232 $159,688 $160,324 $182,841 Net Interest Income (FTE-basis) $ 50,793 $ 63,121 $175,885 $175,027 $192,556 $200,545 $246,014 Non-Interest Income $ 16,560 $ 20,026 $ 59,888 $ 64,775 $ 69,285 $ 68,504 $ 74,466 Total Income $ 67,353 $ 83,147 $235,773 $239,802 $261,841 $269,049 $320,480 Efficiency Ratio 60.37% 56.34% 59.50% 60.98% 60.99% 59.59% 57.05%

Reconciliation: Net Income and EPS (Diluted) * Three Months Ending Three Months Ending Twelve Months Ending Twelve Months Ending Twelve Months Ending Twelve Months Ending Twelve Months Ending ($000s, except earnings per share) 12/31/14 12/31/15 12/31/11 12/31/12 12/31/13 12/31/14 12/31/15 Net Income $ 16,512 $ 23,002 $ 43,809 $ 49,544 $ 63,925 $ 69,974 $ 80,762 Restructuring & Merger-Related Expense (Net of Tax) $ 851 $ 31 $ -- $ 2,527 $ 852 $ 851 $ 7,203 Net Income (excluding restructuring & merger-related expense) $ 17,363 $ 23,033 $ 43,809 $ 52,071 $ 64,777 $ 70,825 $ 87,965 Net Income per Diluted Share $ 0.56 $ 0.60 $ 1.65 $ 1.84 $ 2.18 $ 2.39 $ 2.15 Restructuring & Merger-Related Expense per Diluted Share (Net of Tax) $ 0.03 $ 0.00 $ -- $ 0.09 $ 0.03 $ 0.03 $ 0.19 Earnings per Diluted Share (excluding restructuring & merger-related expenses) $ 0.59 $ 0.60 $ 1.65 $ 1.93 $ 2.21 $ 2.41 $ 2.34 Average Common Shares Outstanding – Diluted (000s) 29,384 38,539 26,615 26,889 29,345 29,334 37,547 Note: ESB Financial merger closed February 2015 and Fidelity Bancorp merger closed November 2012
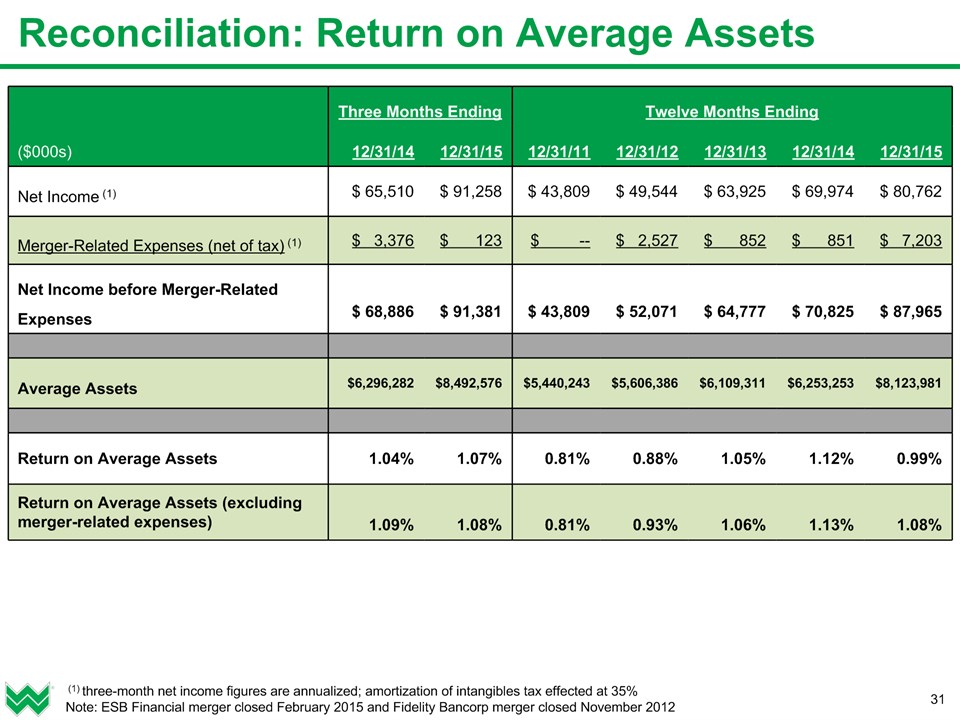
* Three Months Ending Three Months Ending Twelve Months Ending Twelve Months Ending Twelve Months Ending Twelve Months Ending Twelve Months Ending ($000s) 12/31/14 12/31/15 12/31/11 12/31/12 12/31/13 12/31/14 12/31/15 Net Income (1) $ 65,510 $ 91,258 $ 43,809 $ 49,544 $ 63,925 $ 69,974 $ 80,762 Merger-Related Expenses (net of tax) (1) $ 3,376 $ 123 $ -- $ 2,527 $ 852 $ 851 $ 7,203 Net Income before Merger-Related Expenses $ 68,886 $ 91,381 $ 43,809 $ 52,071 $ 64,777 $ 70,825 $ 87,965 Average Assets $6,296,282 $8,492,576 $5,440,243 $5,606,386 $6,109,311 $6,253,253 $8,123,981 Return on Average Assets 1.04% 1.07% 0.81% 0.88% 1.05% 1.12% 0.99% Return on Average Assets (excluding merger-related expenses) 1.09% 1.08% 0.81% 0.93% 1.06% 1.13% 1.08% (1) three-month net income figures are annualized; amortization of intangibles tax effected at 35%Note: ESB Financial merger closed February 2015 and Fidelity Bancorp merger closed November 2012 Reconciliation: Return on Average Assets

* Three Months Ending Three Months Ending Twelve Months Ending Twelve Months Ending Twelve Months Ending Twelve Months Ending Twelve Months Ending ($000s) 12/31/14 12/31/15 12/31/11 12/31/12 12/31/13 12/31/14 12/31/15 Net Income (1) $ 65,510 $ 91,258 $ 43,809 $ 49,544 $ 63,925 $ 69,974 $ 80,762 Amortization of Intangibles (1) $ 1,202 $ 2,091 $ 1,566 $ 1,398 $ 1,487 $ 1,248 $ 2,038 Net Income before Amortization of Intangibles $ 66,712 $ 93,349 $ 45,375 $ 50,942 $ 65,412 $ 71,222 $ 82,800 Merger-Related Expenses (net of tax) (1) $ 3,376 $ 123 $ -- $ 2,527 $ 852 $ 851 $ 7,203 Net Income before Amortization of Intangibles & Merger-Related Expenses $ 70,088 $ 93,472 $ 45,375 $ 53,469 $ 66,264 $ 72,073 $ 90,003 Average Total Shareholders Equity $801,579 $1,124,759 $625,061 $656,684 $733,249 $780,423 $1,059,490 Average Goodwill & Other Intangibles, Net of Deferred Tax Liabilities $(317,061) $(488,677) $(280,718) $(281,326) $(318,913) $(317,523) $(442,215) Average Tangible Equity $484,518 $636,082 $344,343 $375,358 $414,336 $462,900 $617,275 Return on Average Tangible Equity 13.77% 14.68% 13.18% 13.57% 15.79% 15.39% 13.41% Return on Average Tangible Equity (excluding merger-related expenses) 14.47% 14.69% 13.18% 14.24% 15.99% 15.57% 14.58% (1) three-month net income figures are annualized; amortization of intangibles tax effected at 35%Note: ESB Financial merger closed February 2015 and Fidelity Bancorp merger closed November 2012 Reconciliation: Return on Average Tangible Equity

Reconciliation: Operating Non-Interest Income * Twelve Months Ending Twelve Months Ending Twelve Months Ending Three Months Ending Three Months Ending ($000s) 12/31/13 12/31/14 12/31/15 12/31/14 12/31/15 Service Charges on Deposits $ 17,925 $ 16,135 $ 16,743 $ 4,028 $ 4,401 Electronic Banking (e-Banking) Fees $ 12,198 $ 12,708 $ 14,361 $ 3,159 $ 3,691 Trust Fees $ 19,577 $ 21,069 $ 21,900 $ 5,115 $ 5,244 Net Securities Brokerage Revenue $ 6,248 $ 6,922 $ 7,692 $ 1,389 $ 1,795 Bank-Owned Life Insurance $ 4,664 $ 4,614 $ 4,863 $ 1,037 $ 1,598 Other Fee Income $ 8,070 $ 7,139 $ 7,603 $ 1,473 $ 2,228 Operating Non-Interest Income $ 68,682 $ 68,607 $ 73,162 $ 16,201 $ 18,957 Net Securities Gains / (Loss) $ 684 $ 903 $ 948 $ 147 $ 880 Net Gain / (Loss) on Other Real Estate Owned and Other Assets $ (81) $ (1,006) $ 356 $ 212 $ 189 Total Non-Interest Income $ 69,285 $ 68,504 $ 74,446 $ 16,560 $ 20,026 Note: ESB Financial merger closed February 2015 and Fidelity Bancorp merger closed November 2012
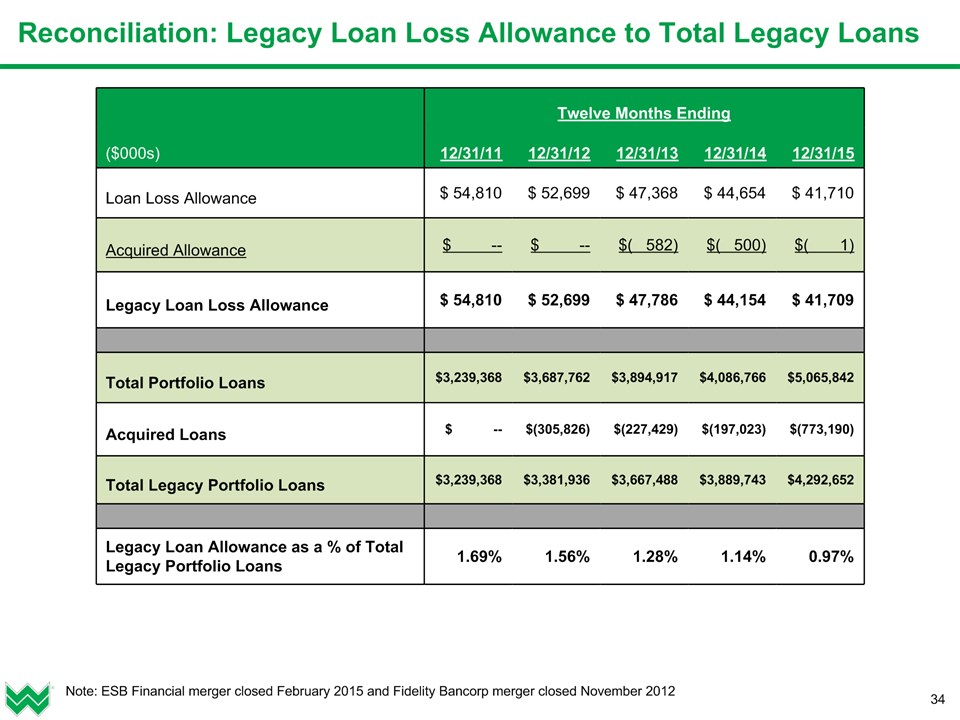
* Twelve Months Ending Twelve Months Ending Twelve Months Ending Twelve Months Ending Twelve Months Ending ($000s) 12/31/11 12/31/12 12/31/13 12/31/14 12/31/15 Loan Loss Allowance $ 54,810 $ 52,699 $ 47,368 $ 44,654 $ 41,710 Acquired Allowance $ -- $ -- $( 582) $( 500) $( 1) Legacy Loan Loss Allowance $ 54,810 $ 52,699 $ 47,786 $ 44,154 $ 41,709 Total Portfolio Loans $3,239,368 $3,687,762 $3,894,917 $4,086,766 $5,065,842 Acquired Loans $ -- $(305,826) $(227,429) $(197,023) $(773,190) Total Legacy Portfolio Loans $3,239,368 $3,381,936 $3,667,488 $3,889,743 $4,292,652 Legacy Loan Allowance as a % of Total Legacy Portfolio Loans 1.69% 1.56% 1.28% 1.14% 0.97% Note: ESB Financial merger closed February 2015 and Fidelity Bancorp merger closed November 2012 Reconciliation: Legacy Loan Loss Allowance to Total Legacy Loans