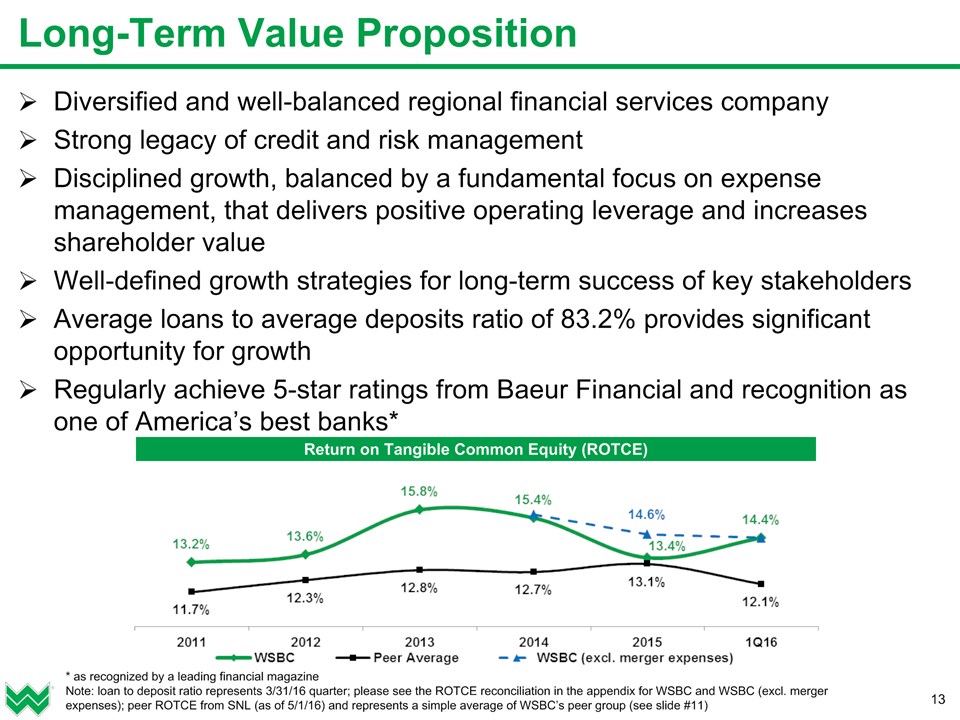
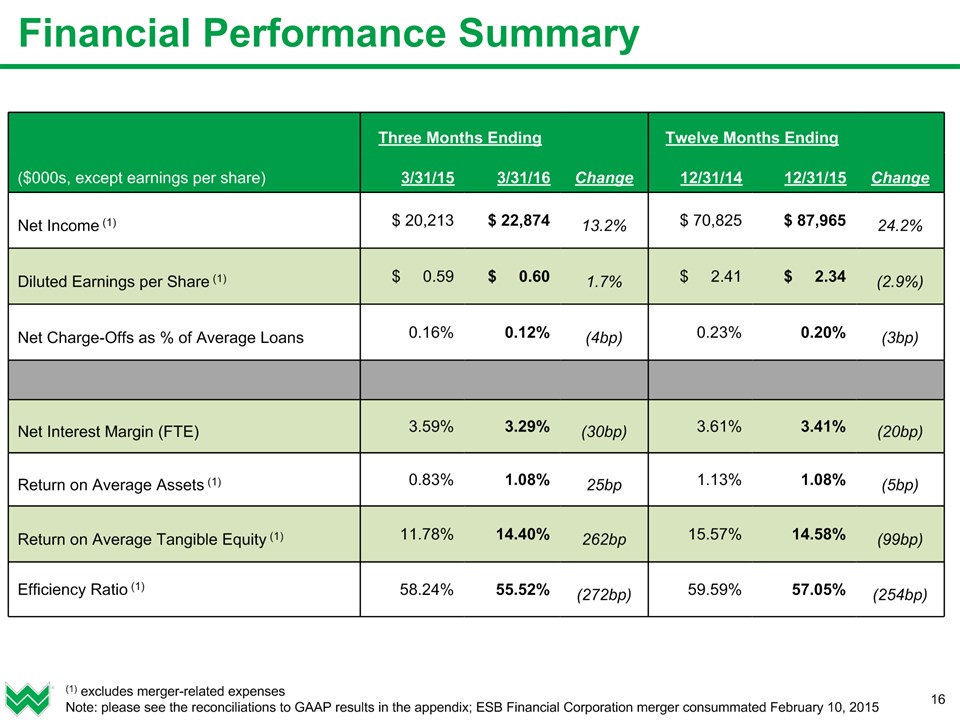
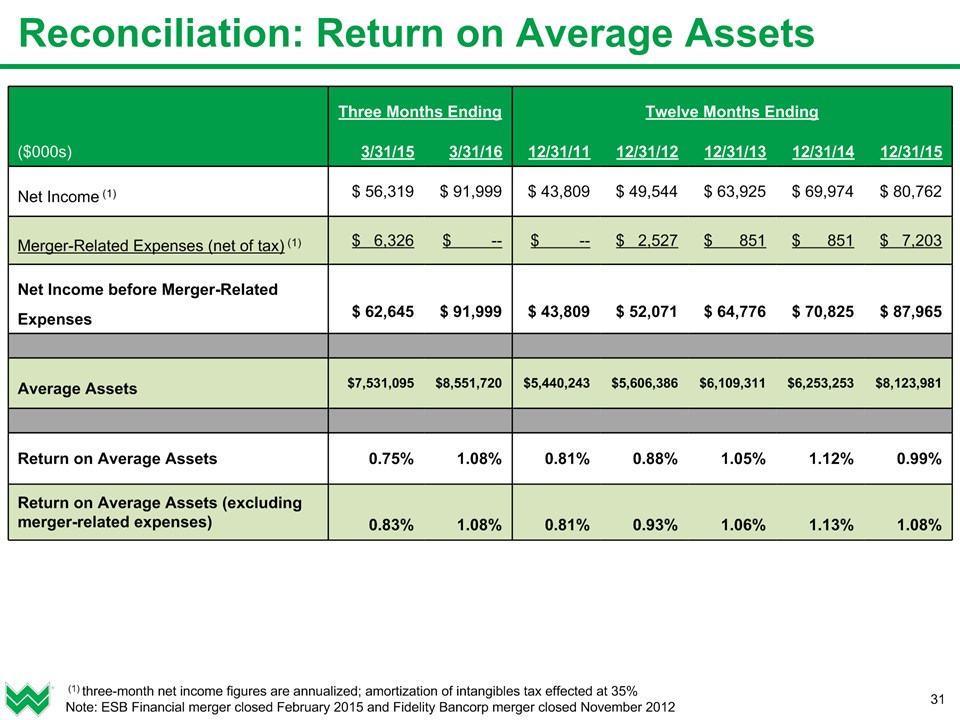
* Three Months Ending Three Months Ending Twelve Months Ending Twelve Months Ending Twelve Months Ending Twelve Months Ending Twelve Months Ending ($000s) 3/31/15 3/31/16 12/31/11 12/31/12 12/31/13 12/31/14 12/31/15 Net Income (1) $ 56,319 $ 91,999 $ 43,809 $ 49,544 $ 63,925 $ 69,974 $ 80,762 Amortization of Intangibles (1) $ 1,491 $ 1,908 $ 1,566 $ 1,398 $ 1,487 $ 1,248 $ 2,038 Net Income before Amortization of Intangibles $ 57,810 $ 93,907 $ 45,375 $ 50,942 $ 65,412 $ 71,222 $ 82,800 Merger-Related Expenses (net of tax) (1) $ 6,326 $ -- $ -- $ 2,527 $ 851 $ 851 $ 7,203 Net Income before Amortization of Intangibles & Merger-Related Expenses $ 64,136 $ 93,907 $ 45,375 $ 53,469 $ 66,263 $ 72,073 $ 90,003 Average Total Shareholders Equity $956,836 $1,139,514 $625,061 $656,684 $733,249 $780,423 $1,059,490 Average Goodwill & Other Intangibles, Net of Deferred Tax Liabilities $(412,454) $(487,210) $(280,718) $(281,326) $(318,913) $(317,523) $(442,215) Average Tangible Equity $544,382 $652,304 $344,343 $375,358 $414,336 $462,900 $617,275 Return on Average Tangible Equity 10.62% 14.40% 13.18% 13.57% 15.79% 15.39% 13.41% Return on Average Tangible Equity (excluding merger-related expenses) 11.78% 14.40% 13.18% 14.24% 15.99% 15.57% 14.58% (1) three-month net income figures are annualized; amortization of intangibles tax effected at 35%Note: ESB Financial merger closed February 2015 and Fidelity Bancorp merger closed November 2012 Reconciliation: Return on Average Tangible Equity