25 January 2022 Fourth Quarter 2021�Earnings Call Presentation
Forward-Looking Statements and Non-GAAP Financial Measures Forward-looking statements in this report relating to WesBanco’s plans, strategies, objectives, expectations, intentions and adequacy of resources, are made pursuant to the safe harbor provisions of the Private Securities Litigation Reform Act of 1995. The information contained in this report should be read in conjunction with WesBanco’s Form 10-K for the year ended December 31, 2020 and documents subsequently filed by WesBanco with the Securities and Exchange Commission (“SEC”), including WesBanco’s Form 10-Q for the quarters ended March 31, 2021, June 30, 2021 and September 30, 2021, which are available at the SEC’s website, www.sec.gov or at WesBanco’s website, www.WesBanco.com. Investors are cautioned that forward-looking statements, which are not historical fact, involve risks and uncertainties, including those detailed in WesBanco’s most recent Annual Report on Form 10-K filed with the SEC under “Risk Factors” in Part I, Item 1A. Such statements are subject to important factors that could cause actual results to differ materially from those contemplated by such statements, including, without limitation, the effects of changing regional and national economic conditions including the effects of the COVID-19 pandemic; changes in interest rates, spreads on earning assets and interest-bearing liabilities, and associated interest rate sensitivity; sources of liquidity available to WesBanco and its related subsidiary operations; potential future credit losses and the credit risk of commercial, real estate, and consumer loan customers and their borrowing activities; actions of the Federal Reserve Board, the Federal Deposit Insurance Corporation, the SEC, the Financial Institution Regulatory Authority, the Municipal Securities Rulemaking Board, the Securities Investors Protection Corporation, and other regulatory bodies; potential legislative and federal and state regulatory actions and reform, including, without limitation, the impact of the implementation of the Dodd-Frank Act; adverse decisions of federal and state courts; fraud, scams and schemes of third parties; cyber-security breaches; competitive conditions in the financial services industry; rapidly changing technology affecting financial services; marketability of debt instruments and corresponding impact on fair value adjustments; and/or other external developments materially impacting WesBanco’s operational and financial performance. WesBanco does not assume any duty to update forward-looking statements. In addition to the results of operations presented in accordance with Generally Accepted Accounting Principles (GAAP), WesBanco's management uses, and this presentation contains or references, certain non-GAAP financial measures, such as pre-tax pre-provision income, tangible common equity/tangible assets; net income excluding after-tax restructuring and merger-related expenses; efficiency ratio; return on average assets; and return on average tangible equity. WesBanco believes these financial measures provide information useful to investors in understanding our operational performance and business and performance trends which facilitate comparisons with the performance of others in the financial services industry. Although WesBanco believes that these non-GAAP financial measures enhance investors' understanding of WesBanco's business and performance, these non-GAAP financial measures should not be considered an alternative to GAAP. The non-GAAP financial measures contained therein should be read in conjunction with the audited financial statements and analysis as presented in the Annual Report on Form 10-K as well as the unaudited financial statements and analyses as presented in the Quarterly Reports on Forms 10-Q for WesBanco and its subsidiaries, as well as other filings that the company has made with the SEC.
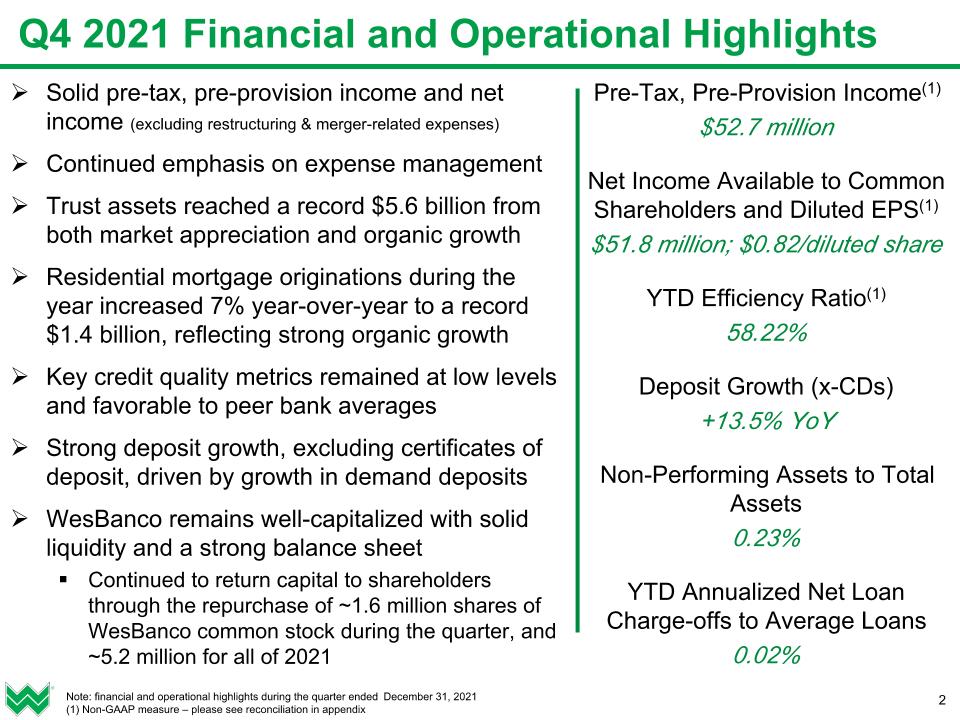
Q4 2021 Financial and Operational Highlights Note: financial and operational highlights during the quarter ended December 31, 2021 (1) Non-GAAP measure – please see reconciliation in appendix Solid pre-tax, pre-provision income and net income (excluding restructuring & merger-related expenses) Continued emphasis on expense management Trust assets reached a record $5.6 billion from both market appreciation and organic growth Residential mortgage originations during the year increased 7% year-over-year to a record $1.4 billion, reflecting strong organic growth Key credit quality metrics remained at low levels and favorable to peer bank averages Strong deposit growth, excluding certificates of deposit, driven by growth in demand deposits WesBanco remains well-capitalized with solid liquidity and a strong balance sheet Continued to return capital to shareholders through the repurchase of ~1.6 million shares of WesBanco common stock during the quarter, and ~5.2 million for all of 2021 Pre-Tax, Pre-Provision Income(1) $52.7 million Net Income Available to Common Shareholders and Diluted EPS(1) $51.8 million; $0.82/diluted share YTD Efficiency Ratio(1) 58.22% Deposit Growth (x-CDs) +13.5% YoY Non-Performing Assets to Total Assets 0.23% YTD Annualized Net Loan Charge-offs to Average Loans 0.02%
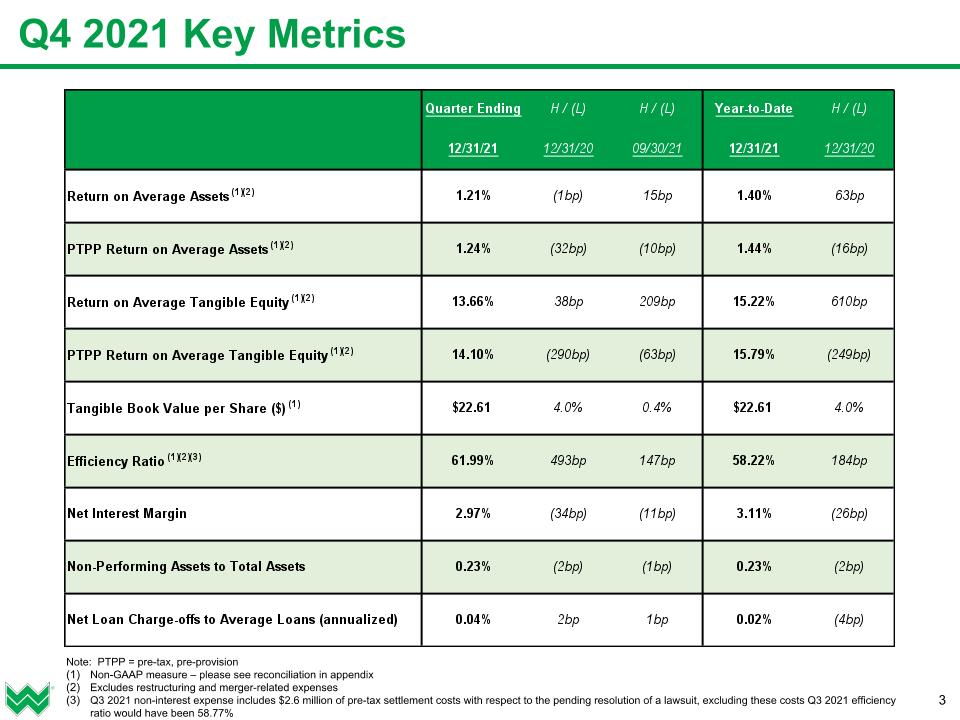
Q4 2021 Key Metrics Note: PTPP = pre-tax, pre-provision Non-GAAP measure – please see reconciliation in appendix Excludes restructuring and merger-related expenses Q3 2021 non-interest expense includes $2.6 million of pre-tax settlement costs with respect to the pending resolution of a lawsuit, excluding these costs Q3 2021 efficiency ratio would have been 58.77%
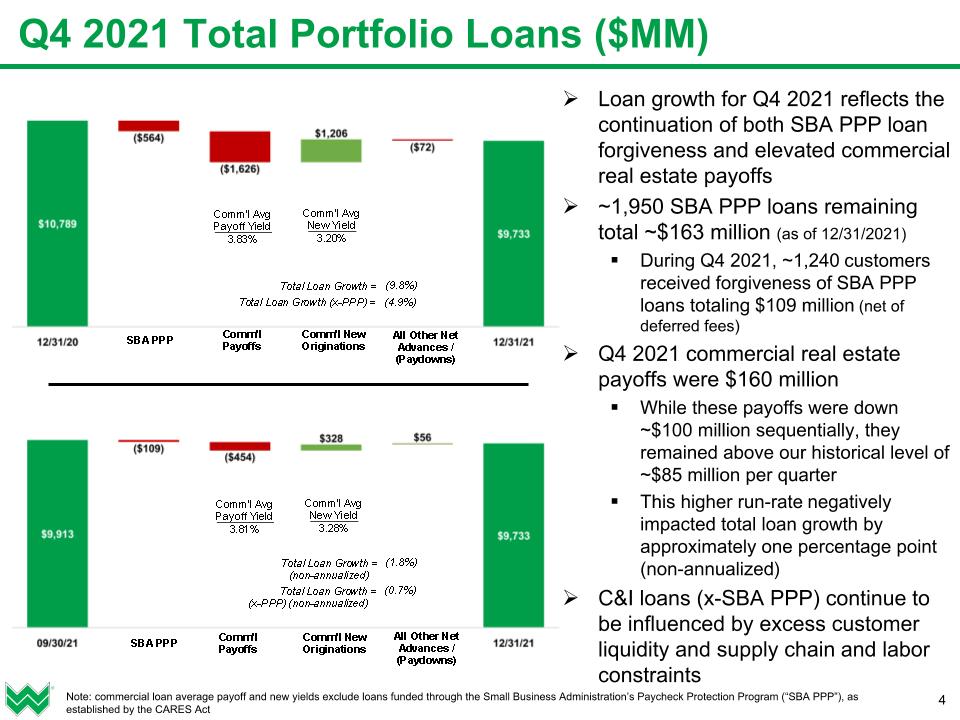
Q4 2021 Total Portfolio Loans ($MM) Loan growth for Q4 2021 reflects the continuation of both SBA PPP loan forgiveness and elevated commercial real estate payoffs ~1,950 SBA PPP loans remaining total ~$163 million (as of 12/31/2021) During Q4 2021, ~1,240 customers received forgiveness of SBA PPP loans totaling $109 million (net of deferred fees) Q4 2021 commercial real estate payoffs were $160 million While these payoffs were down ~$100 million sequentially, they remained above our historical level of ~$85 million per quarter This higher run-rate negatively impacted total loan growth by approximately one percentage point (non-annualized) C&I loans (x-SBA PPP) continue to be influenced by excess customer liquidity and supply chain and labor constraints Note: commercial loan average payoff and new yields exclude loans funded through the Small Business Administration’s Paycheck Protection Program (“SBA PPP”), as established by the CARES Act
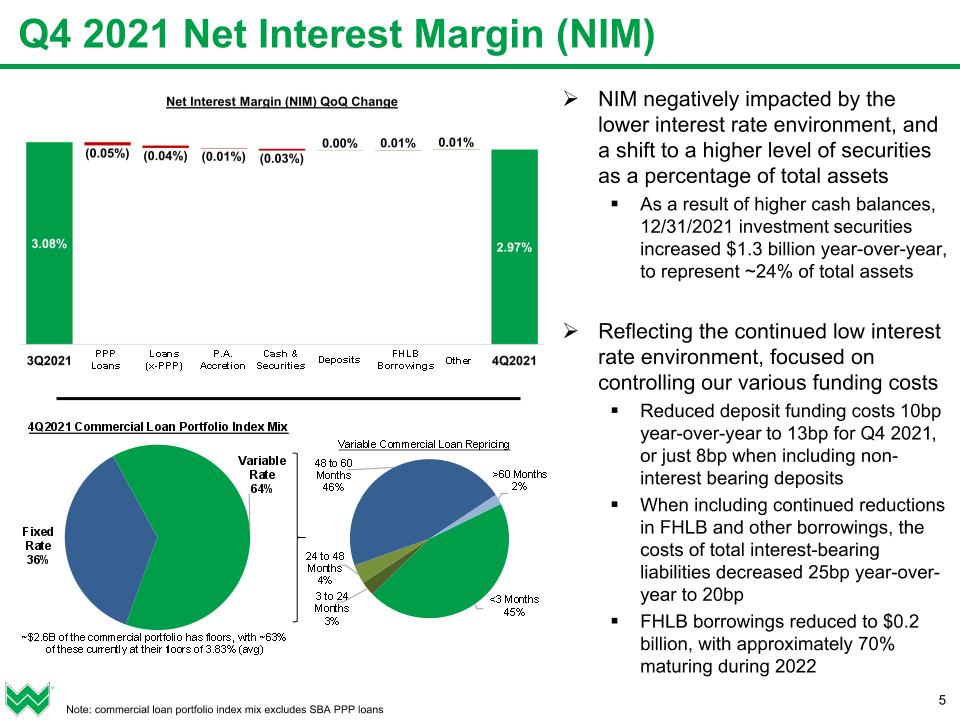
Q4 2021 Net Interest Margin (NIM) NIM negatively impacted by the lower interest rate environment, and a shift to a higher level of securities as a percentage of total assets As a result of higher cash balances, 12/31/2021 investment securities increased $1.3 billion year-over-year, to represent ~24% of total assets Reflecting the continued low interest rate environment, focused on controlling our various funding costs Reduced deposit funding costs 10bp year-over-year to 13bp for Q4 2021, or just 8bp when including non-interest bearing deposits When including continued reductions in FHLB and other borrowings, the costs of total interest-bearing liabilities decreased 25bp year-over-year to 20bp FHLB borrowings reduced to $0.2 billion, with approximately 70% maturing during 2022 Note: commercial loan portfolio index mix excludes SBA PPP loans
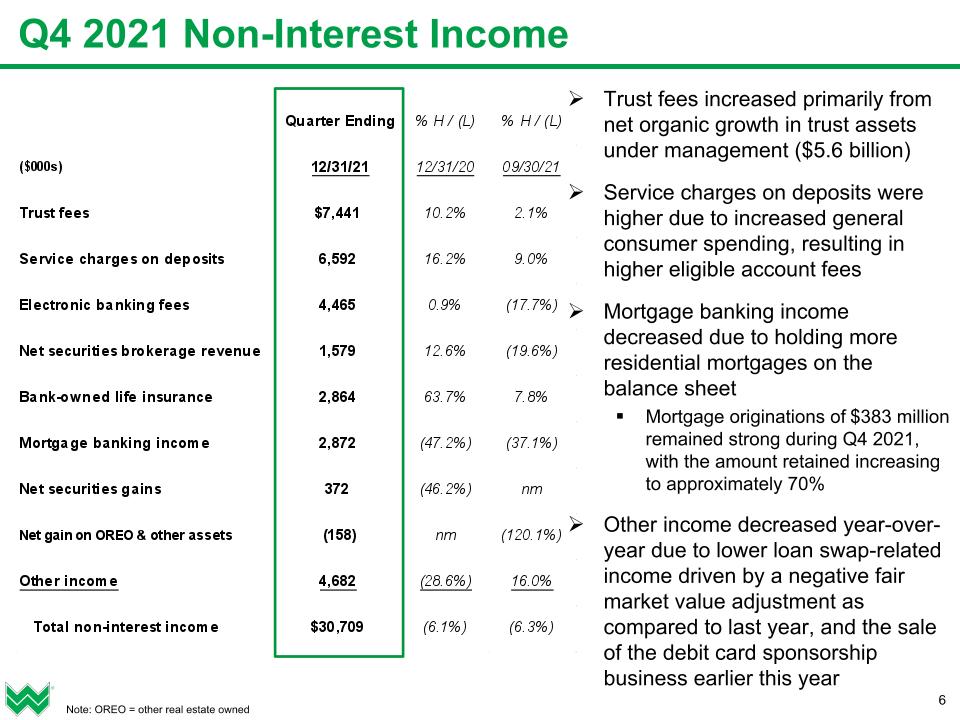
Q4 2021 Non-Interest Income Trust fees increased primarily from net organic growth in trust assets under management ($5.6 billion) Service charges on deposits were higher due to increased general consumer spending, resulting in higher eligible account fees Mortgage banking income decreased due to holding more residential mortgages on the balance sheet Mortgage originations of $383 million remained strong during Q4 2021, with the amount retained increasing to approximately 70% Other income decreased year-over-year due to lower loan swap-related income driven by a negative fair market value adjustment as compared to last year, and the sale of the debit card sponsorship business earlier this year Note: OREO = other real estate owned

Q4 2021 Non-Interest Expense Salaries and wages increased due to higher employee commissions and lower loan contra-costs Base salary expenses decreased $1.7 million and bonus and stock compensation expense decreased $0.6 million, year-over-year Equipment and software increased due primarily to the movement of online banking costs from other operating expenses Marketing is higher from product advertising and brand awareness campaigns that were delayed from 2020 due to the pandemic Other operating expenses decreased due to the aforementioned move of online banking costs, as well as a reduction in ACH and ATM processing charges related to a change in providers, in conjunction with our core banking software system conversion
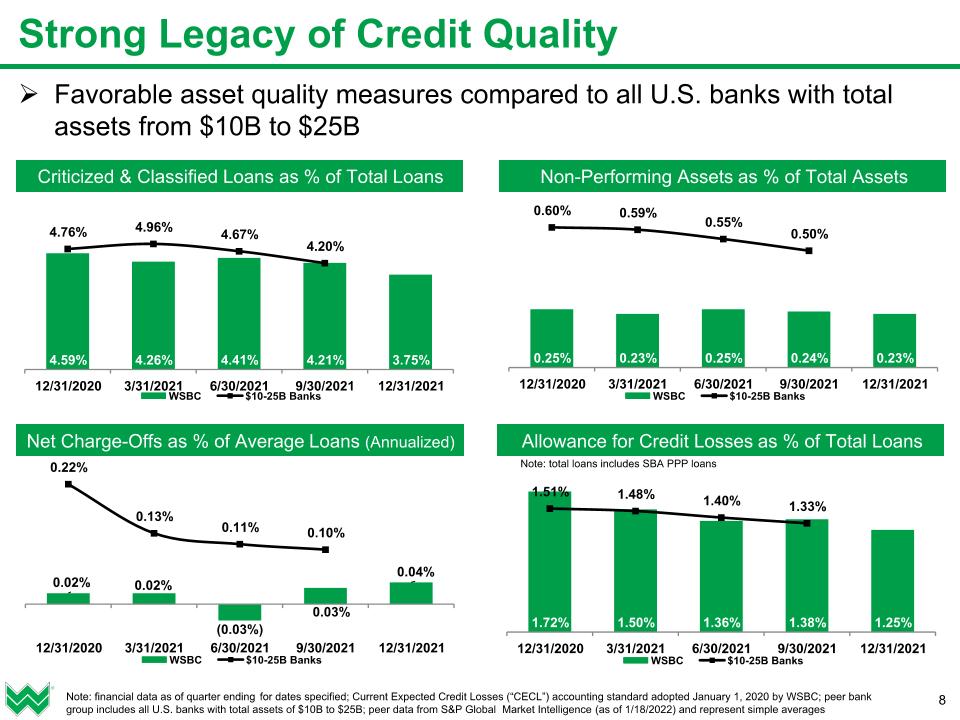
Non-Performing Assets as % of Total Assets Net Charge-Offs as % of Average Loans (Annualized) Allowance for Credit Losses as % of Total Loans Criticized & Classified Loans as % of Total Loans Favorable asset quality measures compared to all U.S. banks with total assets from $10B to $25B Strong Legacy of Credit Quality Note: financial data as of quarter ending for dates specified; Current Expected Credit Losses (“CECL”) accounting standard adopted January 1, 2020 by WSBC; peer bank group includes all U.S. banks with total assets of $10B to $25B; peer data from S&P Global Market Intelligence (as of 1/18/2022) and represent simple averages Note: total loans includes SBA PPP loans
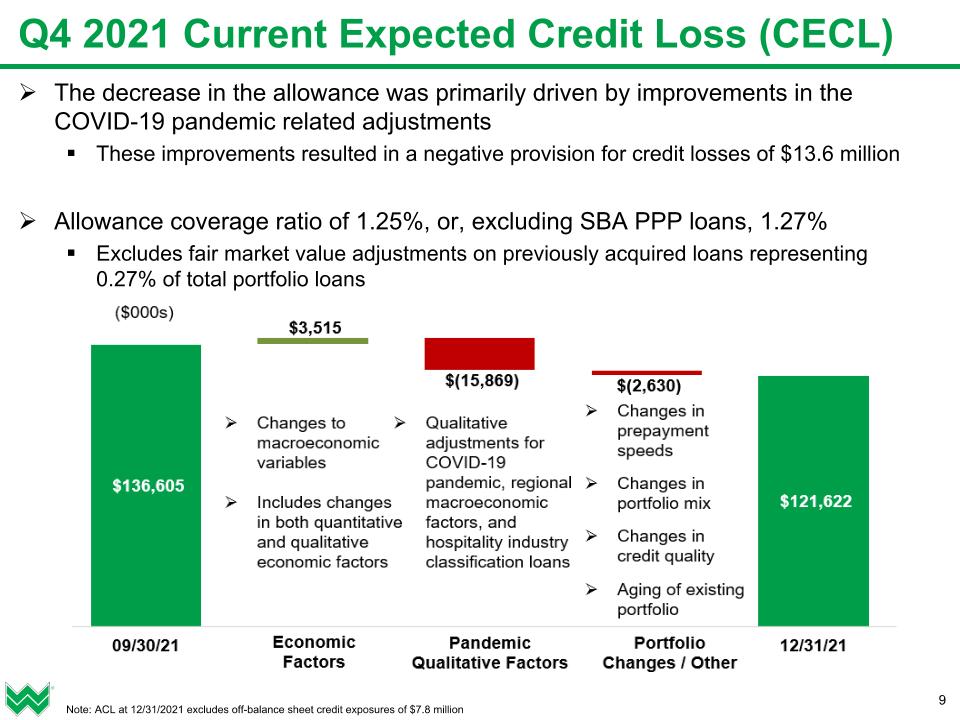
The decrease in the allowance was primarily driven by improvements in the COVID-19 pandemic related adjustments These improvements resulted in a negative provision for credit losses of $13.6 million Allowance coverage ratio of 1.25%, or, excluding SBA PPP loans, 1.27% Excludes fair market value adjustments on previously acquired loans representing 0.27% of total portfolio loans Q4 2021 Current Expected Credit Loss (CECL) Note: ACL at 12/31/2021 excludes off-balance sheet credit exposures of $7.8 million
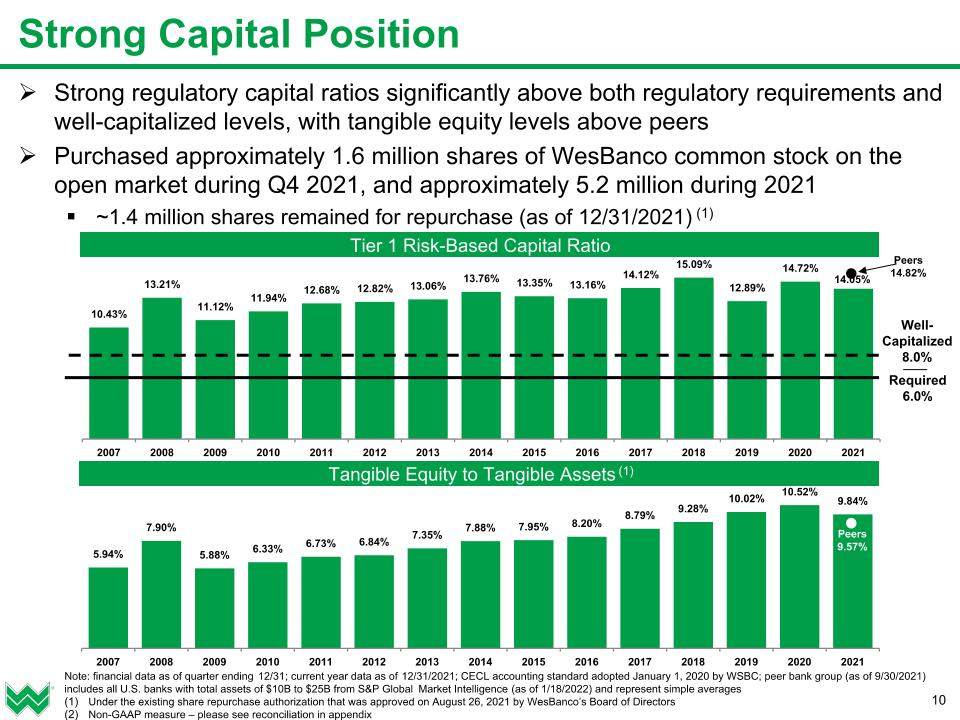
Strong regulatory capital ratios significantly above both regulatory requirements and well-capitalized levels, with tangible equity levels above peers Purchased approximately 1.6 million shares of WesBanco common stock on the open market during Q4 2021, and approximately 5.2 million during 2021 ~1.4 million shares remained for repurchase (as of 12/31/2021) (1) Tangible Equity to Tangible Assets (1) Tier 1 Risk-Based Capital Ratio Strong Capital Position Note: financial data as of quarter ending 12/31; current year data as of 12/31/2021; CECL accounting standard adopted January 1, 2020 by WSBC; peer bank group (as of 9/30/2021) includes all U.S. banks with total assets of $10B to $25B from S&P Global Market Intelligence (as of 1/18/2022) and represent simple averages Under the existing share repurchase authorization that was approved on August 26, 2021 by WesBanco’s Board of Directors Non-GAAP measure – please see reconciliation in appendix Well-Capitalized 8.0% Required 6.0% Peers 14.82% Peers 9.57%
Appendix
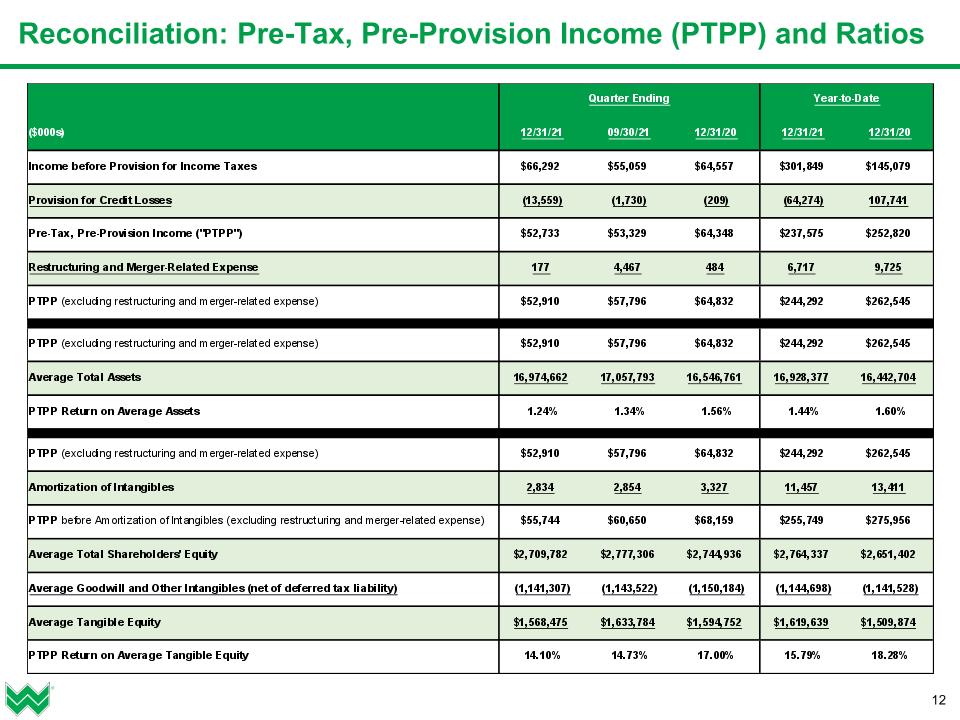
Reconciliation: Pre-Tax, Pre-Provision Income (PTPP) and Ratios

Reconciliation: Net Income, EPS (Diluted), Tangible Book Value per Share
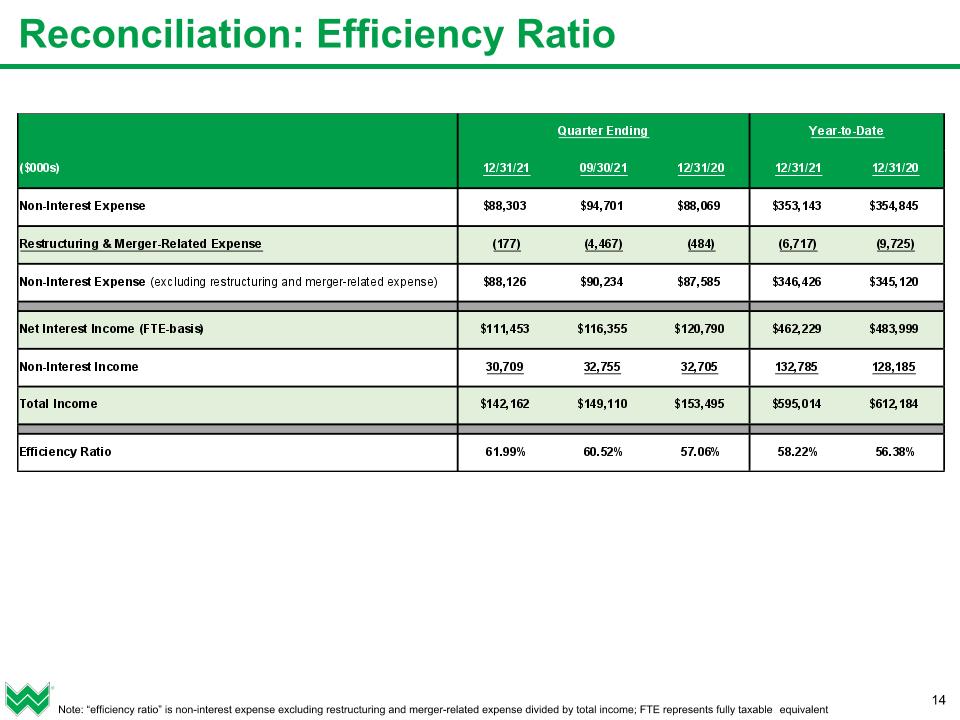
Reconciliation: Efficiency Ratio Note: “efficiency ratio” is non-interest expense excluding restructuring and merger-related expense divided by total income; FTE represents fully taxable equivalent
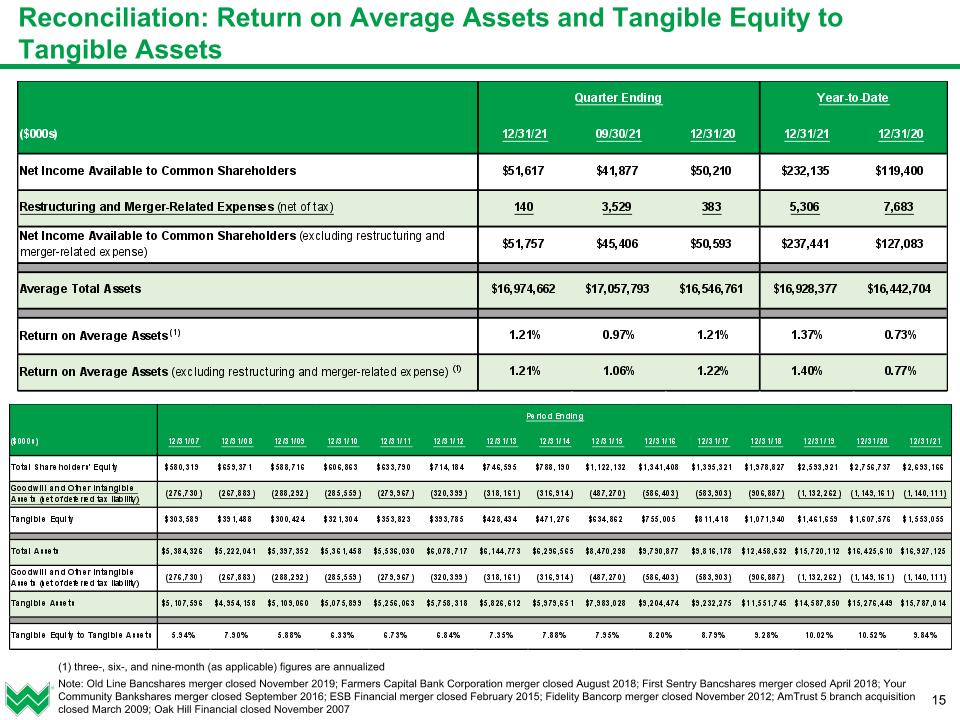
Reconciliation: Return on Average Assets and Tangible Equity to Tangible Assets (1) three-, six-, and nine-month (as applicable) figures are annualized Note: Old Line Bancshares merger closed November 2019; Farmers Capital Bank Corporation merger closed August 2018; First Sentry Bancshares merger closed April 2018; Your Community Bankshares merger closed September 2016; ESB Financial merger closed February 2015; Fidelity Bancorp merger closed November 2012; AmTrust 5 branch acquisition closed March 2009; Oak Hill Financial closed November 2007
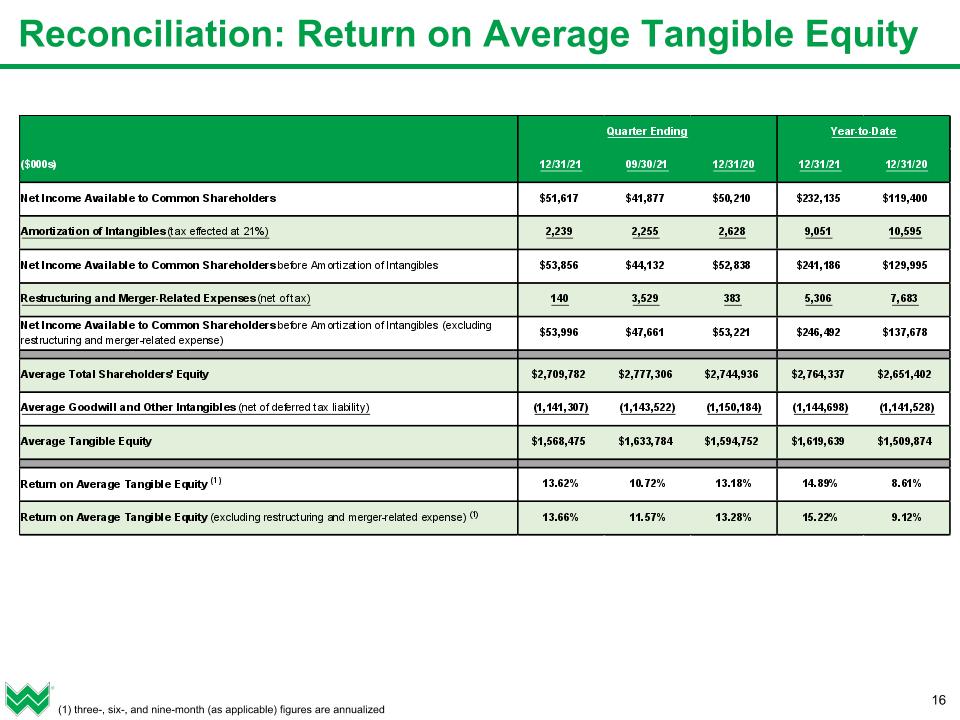
Reconciliation: Return on Average Tangible Equity (1) three-, six-, and nine-month (as applicable) figures are annualized


