UNITED STATES
SECURITIES AND EXCHANGE COMMISSION
WASHINGTON, D.C. 20549
FORM 8-K
CURRENT REPORT
Pursuant to Section 13 or 15(d) of the Securities Exchange Act of 1934
|
Date of Report (Date of earliest event reported): February 10, 2025 |
WESBANCO, INC.
(Exact name of Registrant as Specified in Its Charter)
| | | | |
West Virginia | 001-39442 | 55-0571723 |
(State or Other Jurisdiction
of Incorporation) | (Commission File Number) | (IRS Employer
Identification No.) |
| | | | |
1 Bank Plaza | |
Wheeling, West Virginia | | 26003 |
(Address of Principal Executive Offices) | | (Zip Code) |
|
Registrant’s Telephone Number, Including Area Code: 304 234-9000 |
Former Name or Former Address, if Changed Since Last Report : Not Applicable
Check the appropriate box below if the Form 8-K filing is intended to simultaneously satisfy the filing obligation of the registrant under any of the following provisions:
☒Written communications pursuant to Rule 425 under the Securities Act (17 CFR 230.425)
☐Soliciting material pursuant to Rule 14a-12 under the Exchange Act (17 CFR 240.14a-12)
☐Pre-commencement communications pursuant to Rule 14d-2(b) under the Exchange Act (17 CFR 240.14d-2(b))
☐Pre-commencement communications pursuant to Rule 13e-4(c) under the Exchange Act (17 CFR 240.13e-4(c))
Securities registered pursuant to Section 12(b) of the Act:
| | | | |
Title of each class
| | Trading
Symbol(s) | |
Name of each exchange on which registered
|
Common Stock $2.0833 Par Value | | WSBC | | Nasdaq Global Select Market |
Depositary Shares (each representing 1/40th interest in a share of 6.75% Fixed-Rate Reset Non-Cumulative Perpetual Preferred Stock, Series A) | | WSBCP | | Nasdaq Global Select Market |
Indicate by check mark whether the registrant is an emerging growth company as defined in Rule 405 of the Securities Act of 1933 (§ 230.405 of this chapter) or Rule 12b-2 of the Securities Exchange Act of 1934 (§ 240.12b-2 of this chapter).
Emerging growth company ☐
If an emerging growth company, indicate by check mark if the registrant has elected not to use the extended transition period for complying with any new or revised financial accounting standards provided pursuant to Section 13(a) of the Exchange Act. ☐
Item 7.01 Regulation FD Disclosure.
Regulation FD Disclosure.In accordance with general instruction B.2. of Form 8-K, the following information is furnished and shall not be deemed filed for the purpose of Section 18 of the Securities Exchange Act of 1934.
Representatives of the Registrant are scheduled to make various investor presentations during the first quarter of 2025. A copy of this presentation is being furnished as Exhibit 99.1 in this Form 8-K.
Item 8.01 Other Events.
Additional Information About the Merger and Where to Find It
In connection with the proposed Merger, the Company filed with the Securities and Exchange Commission (the “SEC”) a Registration Statement on Form S-4 which includes a joint proxy statement of Premier Financial and the Company and a prospectus of the Company with respect to shares of the Company’s common stock to be issued in the proposed transaction, as well as other relevant documents concerning the proposed transaction. The Form S-4 was declared effective on October 28, 2024, and Wesbanco and Premier Financial commenced mailing to their respective shareholders on or about November 1, 2024 in connection with their respective special meetings of shareholders, which were held on December 11, 2024, at which the shareholders of both companies approved all matters related to the proposed transaction that were submitted for a vote. This communication is not a substitute for the Registration Statement on Form S-4, the joint proxy statement/Prospectus or any other document that the Company and/or Premier Financial may file with the SEC in connection with the proposed transaction. SHAREHOLDERS OF THE COMPANY, SHAREHOLDERS OF PREMIER FINANCIAL AND OTHER INTERESTED PARTIES ARE URGED TO READ THE REGISTRATION STATEMENT ON FORM S-4 AND THE JOINT PROXY STATEMENT/PROSPECTUS REGARDING THE MERGER AND ANY OTHER RELEVANT DOCUMENTS FILED WITH THE SEC, AS WELL AS ANY AMENDMENTS OR SUPPLEMENTS TO THOSE DOCUMENTS, BECAUSE THEY CONTAIN IMPORTANT INFORMATION. The Registration Statement on Form S-4, which includes the joint proxy statements/prospectus, and other related documents filed by the Company or Premier with the SEC, may be obtained for free at the SEC’s website at www.sec.gov, and from either the Company’s or Premier Financial’s website at www.wesbanco.com or www.premierfincorp.com, respectively.
No Offer or Solicitation
This Current Report on Form 8-K shall not constitute an offer to sell or a solicitation of an offer to buy any securities nor shall there be any sale of securities in any state or jurisdiction in which such offer, solicitation, or sale would be unlawful prior to registration or qualification under the securities laws of any such state or jurisdiction.
Item 9.01 Financial Statements and Exhibits.
(d) Exhibits:
99.1 Presentation on fourth quarter 2024 results by Wesbanco, Inc., at various investor conferences or other events in the first quarter of 2025.
104 Cover Page Interactive Data File (embedded within the Inline XBRL document).
SIGNATURE
Pursuant to the requirements of the Securities Exchange Act of 1934, the registrant has duly caused this report to be signed on its behalf by the undersigned thereunto duly authorized.
| | | |
| | | Wesbanco, Inc.
(registrant) |
| | | |
Date: | February 10, 2025 | By: | /s/ Daniel K. Weiss, Jr. |
| | | Daniel K. Weiss, Jr.
Senior Executive Vice President and
Chief Financial Officer
|
Exhibit 99.1

Investor Presentation(Q1 2025)(WSBC financials as of the three months ended December 31, 2024) John Iannone Senior Vice President, Investor Relations 304-905-7021 ©2025 WesBanco, Inc. | All rights reserved
Forward-looking statements in this report relating to WesBanco’s plans, strategies, objectives, expectations, intentions and adequacy of resources, are made pursuant to the safe harbor provisions of the Private Securities Litigation Reform Act of 1995. The information contained in this report should be read in conjunction with WesBanco’s Form 10-K for the year ended December 31, 2023 and documents subsequently filed by WesBanco with the Securities and Exchange Commission (“SEC”) including WesBanco’s Form 10-Q for the quarters ended March 31, 2024, June 30, 2024 and September 30, 2024, which are available at the SEC’s website, www.sec.gov or at WesBanco’s website, www.WesBanco.com. Investors are cautioned that forward-looking statements, which are not historical fact, involve risks and uncertainties, including those detailed in WesBanco’s most recent Annual Report on Form 10-K filed with the SEC under “Risk Factors” in Part I, Item 1A. Such statements are subject to important factors that could cause actual results to differ materially from those contemplated by such statements, including, without limitation, that the proposed merger with Premier Financial Corp. (“Premier Financial” or “Premier”) may not close when expected, that the businesses of WesBanco and Premier may not be integrated successfully or such integration may take longer to accomplish than expected; the expected cost savings and any revenue synergies from the merger of WesBanco and Premier may not be fully realized within the expected timeframes; disruption from the proposed merger of WesBanco and Premier may make it more difficult to maintain relationships with clients, associates, or suppliers; the required governmental approvals of the proposed Merger may not be obtained on the expected terms and schedule; the effects of changing regional and national economic conditions, changes in interest rates, spreads on earning assets and interest-bearing liabilities, and associated interest rate sensitivity; sources of liquidity available to WesBanco and its related subsidiary operations; potential future credit losses and the credit risk of commercial, real estate, and consumer loan customers and their borrowing activities; actions of the Federal Reserve Board, the Federal Deposit Insurance Corporation, the Consumer Financial Protection Bureau, the SEC, the Financial Institution Regulatory Authority, the Municipal Securities Rulemaking Board, the Securities Investors Protection Corporation, and other regulatory bodies; potential legislative and federal and state regulatory actions and reform, including, without limitation, the impact of the implementation of the Dodd-Frank Act; adverse decisions of federal and state courts; fraud, scams and schemes of third parties; cyber-security breaches; competitive conditions in the financial services industry; rapidly changing technology affecting financial services; marketability of debt instruments and corresponding impact on fair value adjustments; and/or other external developments materially impacting WesBanco’s operational and financial performance. WesBanco does not assume any duty to update forward-looking statements. While forward-looking statements reflect our good-faith beliefs, they are not guarantees of future performance. All forward-looking statements are necessarily only estimates of future results. Accordingly, actual results may differ materially from those expressed in or contemplated by the particular forward-looking statement, and, therefore, you are cautioned not to place undue reliance on such statements. Further, any forward-looking statement speaks only as of the date on which it is made, and we undertake no obligation to update any forward-looking statement to reflect events or circumstances after the date on which the statement is made or to reflect the occurrence of unanticipated events or circumstances, except as required by applicable law. Statements in this presentation with respect to the expected timing of and benefits of the proposed merger between WesBanco and Premier, the parties’ plans, obligations, expectations, and intentions, and the statements with respect to accretion, earn back of tangible book value, tangible book value dilution and internal rate of return, constitute forward-looking statements as defined by federal securities laws. Such statements are subject to numerous assumptions, risks, and uncertainties. Actual results could differ materially from those contained or implied by such statements for a variety of factors including: the businesses of WesBanco and Premier may not be integrated successfully or such integration may take longer to accomplish than expected; the expected cost savings and any revenue synergies from the proposed merger may not be fully realized within the expected time frames; disruption from the proposed merger may make it more difficult to maintain relationships with clients, associates, or suppliers; the required governmental approvals of the proposed merger may not be obtained on the expected terms and schedule; changes in economic conditions; movements in interest rates; competitive pressures on product pricing and services; success and timing of other business strategies; the nature, extent, and timing of governmental actions and reforms; extended disruption of vital infrastructure; and other factors described in WesBanco’s 2023 Annual Report on Form 10-K, Premier’s 2023 Annual Report on Form 10-K, and documents subsequently filed by WesBanco and Premier with the Securities and Exchange Commission. In addition to the results of operations presented in accordance with Generally Accepted Accounting Principles (GAAP), WesBanco's management uses, and this presentation contains or references, certain non-GAAP financial measures, such as pre-tax pre-provision income, tangible common equity/tangible assets; net income excluding after-tax restructuring and merger-related expenses; efficiency ratio; return on average assets; and return on average tangible equity. WesBanco believes these financial measures provide information useful to investors in understanding our operational performance and business and performance trends which facilitate comparisons with the performance of others in the financial services industry. Although WesBanco believes that these non-GAAP financial measures enhance investors' understanding of WesBanco's business and performance, these non-GAAP financial measures should not be considered an alternative to GAAP. The non-GAAP financial measures contained therein should be read in conjunction with the audited financial statements and analysis as presented in the Annual Report on Form 10-K as well as the unaudited financial statements and analyses as presented in the Quarterly Reports on Forms 10-Q for WesBanco and its subsidiaries, as well as other filings that the company has made with the SEC. Forward-Looking Statements and Non-GAAP Financial Measures 2 ©2025 WesBanco, Inc. | All rights reserved
In connection with the proposed Merger, the Company filed with the Securities and Exchange Commission (the “SEC”) a Registration Statement on Form S-4 which includes a joint proxy statement of Premier Financial and the Company and a prospectus of the Company with respect to shares of the Company’s common stock to be issued in the proposed transaction, as well as other relevant documents concerning the proposed transaction. The Form S-4 was declared effective on October 28, 2024, and Wesbanco and Premier Financial commenced mailing to their respective shareholders on or about November 1, 2024 in connection with their respective special meetings of shareholders, which were held on December 11, 2024, at which the shareholders of both companies approved all matters related to the proposed transaction that were submitted for a vote. This communication is not a substitute for the Registration Statement on Form S-4, the joint proxy statement/Prospectus or any other document that the Company and/or Premier Financial may file with the SEC in connection with the proposed transaction. SHAREHOLDERS OF THE COMPANY, SHAREHOLDERS OF PREMIER FINANCIAL AND OTHER INTERESTED PARTIES ARE URGED TO READ THE REGISTRATION STATEMENT ON FORM S-4 AND THE JOINT PROXY STATEMENT/PROSPECTUS REGARDING THE MERGER AND ANY OTHER RELEVANT DOCUMENTS FILED WITH THE SEC, AS WELL AS ANY AMENDMENTS OR SUPPLEMENTS TO THOSE DOCUMENTS, BECAUSE THEY CONTAIN IMPORTANT INFORMATION. The Registration Statement on Form S-4, which includes the joint proxy statements/prospectus, and other related documents filed by the Company or Premier with the SEC, may be obtained for free at the SEC’s website at www.sec.gov, and from either the Company’s or Premier Financial’s website at www.wesbanco.com or www.premierfincorp.com, respectively. This Current Report on Form 8-K shall not constitute an offer to sell or a solicitation of an offer to buy any securities nor shall there be any sale of securities in any state or jurisdiction in which such offer, solicitation, or sale would be unlawful prior to registration or qualification under the securities laws of any such state or jurisdiction. Additional Information about the Acquisition and Where to Find It 3 No Offer or Solicitation ©2025 WesBanco, Inc. | All rights reserved
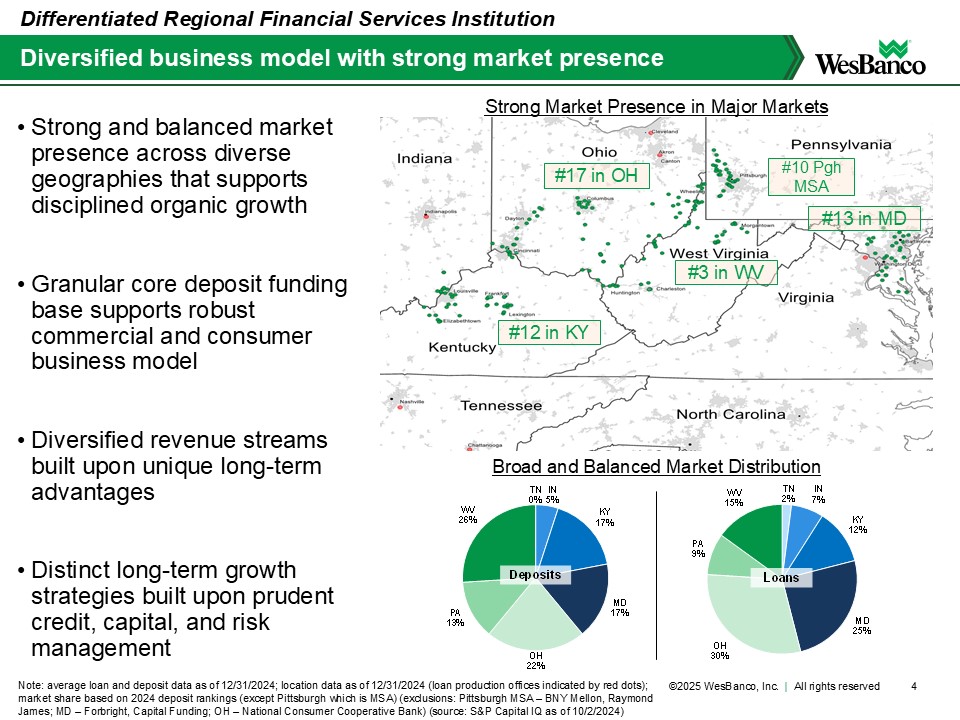
TN 2% IN 7% KY 12% MD 25% OH 30% PA 9% WV 15% Loans TN 0% IN 5% KY 17% MD 17% OH 22% PA 13% WV 26% Deposits • Strong and balanced market presence across diverse geographies that supports disciplined organic growth • Granular core deposit funding base supports robust commercial and consumer business model • Diversified revenue streams built upon unique long-term advantages • Distinct long-term growth strategies built upon prudent credit, capital, and risk management 4 Diversified business model with strong market presence Note: average loan and deposit data as of 12/31/2024; location data as of 12/31/2024 (loan production offices indicated by red dots); market share based on 2024 deposit rankings (except Pittsburgh which is MSA) (exclusions: Pittsburgh MSA – BNY Mellon, Raymond James; MD – Forbright, Capital Funding; OH – National Consumer Cooperative Bank) (source: S&P Capital IQ as of 10/2/2024) Differentiated Regional Financial Services Institution #13 in MD #17 in OH #12 in KY #3 in WV #10 Pgh MSA Strong Market Presence in Major Markets Broad and Balanced Market Distribution ©2025 WesBanco, Inc. | All rights reserved
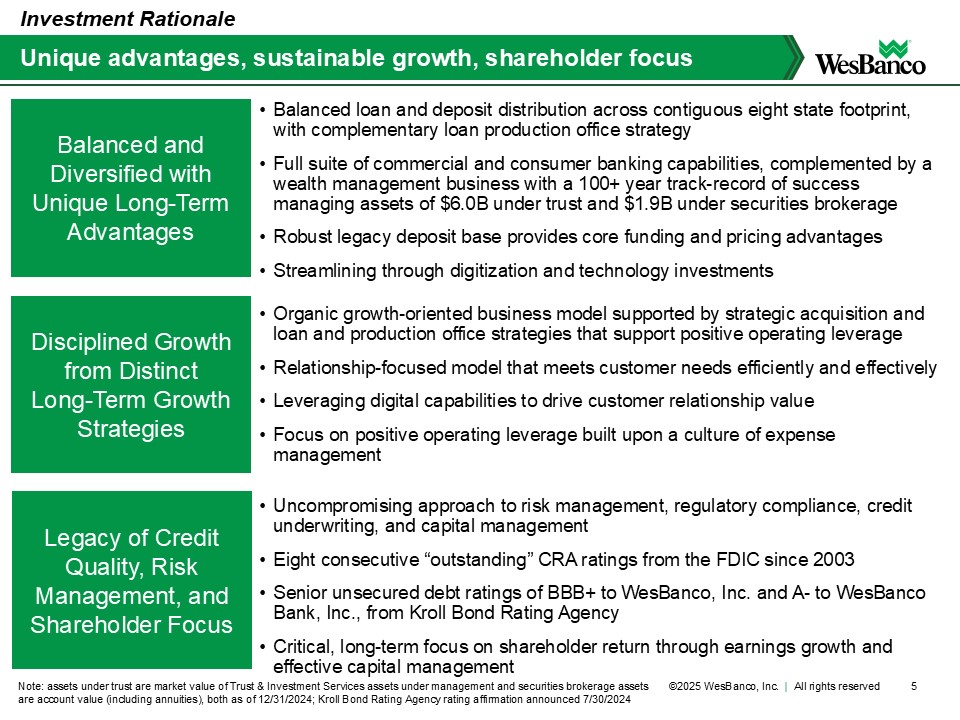
• Balanced loan and deposit distribution across contiguous eight state footprint, with complementary loan production office strategy • Full suite of commercial and consumer banking capabilities, complemented by a wealth management business with a 100+ year track-record of success managing assets of $6.0B under trust and $1.9B under securities brokerage • Robust legacy deposit base provides core funding and pricing advantages • Streamlining through digitization and technology investments 5 Unique advantages, sustainable growth, shareholder focus Note: assets under trust are market value of Trust & Investment Services assets under management and securities brokerage assets are account value (including annuities), both as of 12/31/2024; Kroll Bond Rating Agency rating affirmation announced 7/30/2024 Investment Rationale Balanced and Diversified with Unique Long-Term Advantages Disciplined Growth from Distinct Long-Term Growth Strategies Legacy of Credit Quality, Risk Management, and Shareholder Focus • Organic growth-oriented business model supported by strategic acquisition and loan and production office strategies that support positive operating leverage • Relationship-focused model that meets customer needs efficiently and effectively • Leveraging digital capabilities to drive customer relationship value • Focus on positive operating leverage built upon a culture of expense management • Uncompromising approach to risk management, regulatory compliance, credit underwriting, and capital management • Eight consecutive “outstanding” CRA ratings from the FDIC since 2003 • Senior unsecured debt ratings of BBB+ to WesBanco, Inc. and A- to WesBanco Bank, Inc., from Kroll Bond Rating Agency • Critical, long-term focus on shareholder return through earnings growth and effective capital management ©2025 WesBanco, Inc. | All rights reserved

Strategies for Long-Term Success ©2025 WesBanco, Inc. | All rights reserved
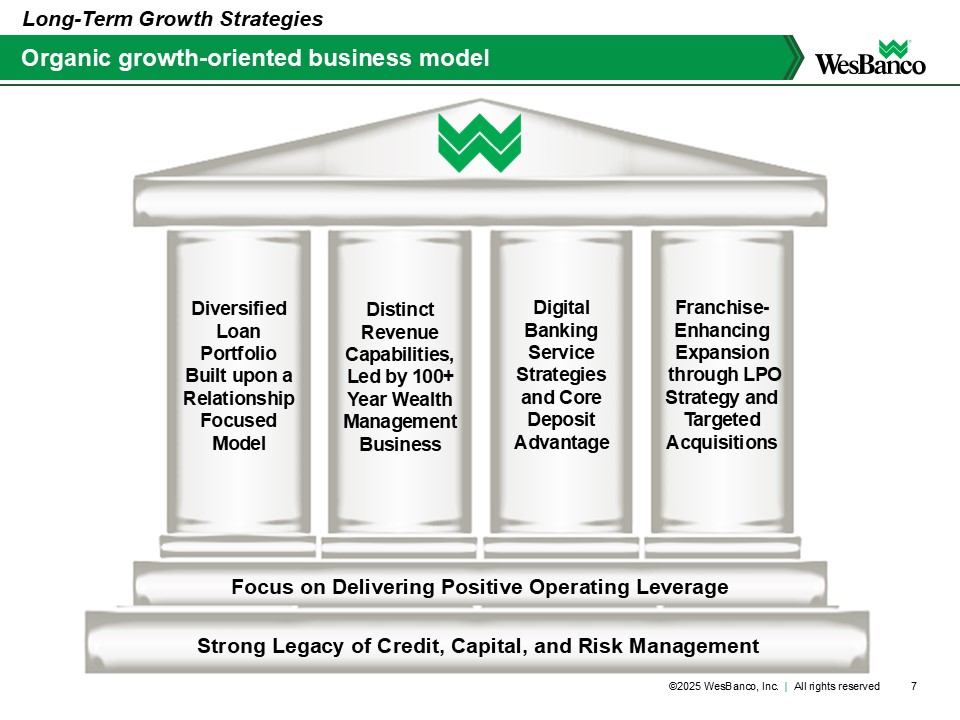
Organic growth-oriented business model Long-Term Growth Strategies Focus on Delivering Positive Operating Leverage Strong Legacy of Credit, Capital, and Risk Management Diversified Loan Portfolio Built upon a Relationship Focused Model Distinct Revenue Capabilities, Led by 100+ Year Wealth Management Business Digital Banking Service Strategies and Core Deposit Advantage Franchise-Enhancing Expansion through LPO Strategy and Targeted Acquisitions ©2025 WesBanco, Inc. | All rights reserved
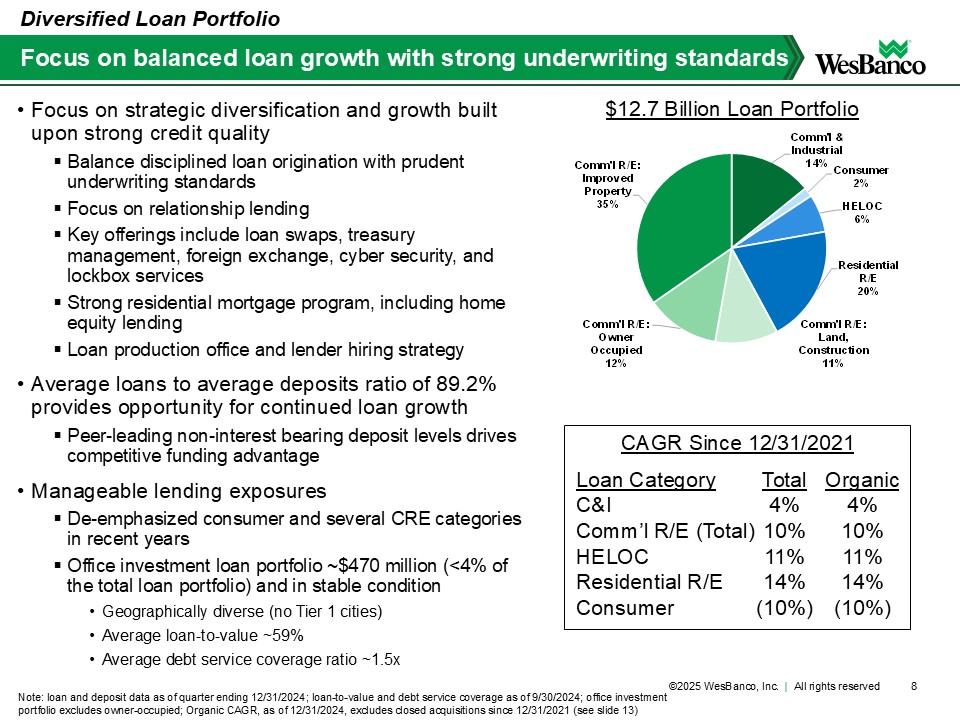
Comm'l & Industrial 14% Consumer 2% HELOC 6% Residential R/E 20% Comm'l R/E: Land, Construction 11% Comm'l R/E: Owner Occupied 12% Comm'l R/E: Improved Property 35% • Focus on strategic diversification and growth built upon strong credit quality ▪ Balance disciplined loan origination with prudent underwriting standards ▪ Focus on relationship lending ▪ Key offerings include loan swaps, treasury management, foreign exchange, cyber security, and lockbox services ▪ Strong residential mortgage program, including home equity lending ▪ Loan production office and lender hiring strategy • Average loans to average deposits ratio of 89.2% provides opportunity for continued loan growth ▪ Peer-leading non-interest bearing deposit levels drives competitive funding advantage • Manageable lending exposures ▪ De-emphasized consumer and several CRE categories in recent years ▪ Office investment loan portfolio ~$470 million (<4% of the total loan portfolio) and in stable condition • Geographically diverse (no Tier 1 cities) • Average loan-to-value ~59% • Average debt service coverage ratio ~1.5x 8 Focus on balanced loan growth with strong underwriting standards Note: loan and deposit data as of quarter ending 12/31/2024; loan-to-value and debt service coverage as of 9/30/2024; office investment portfolio excludes owner-occupied; Organic CAGR, as of 12/31/2024, excludes closed acquisitions since 12/31/2021 (see slide 13) Diversified Loan Portfolio $12.7 Billion Loan Portfolio Loan Category C&I Comm’l R/E (Total) HELOC Residential R/E Consumer Total 4% 10% 11% 14% (10%) Organic 4% 10% 11% 14% (10%) CAGR Since 12/31/2021 ©2025 WesBanco, Inc. | All rights reserved
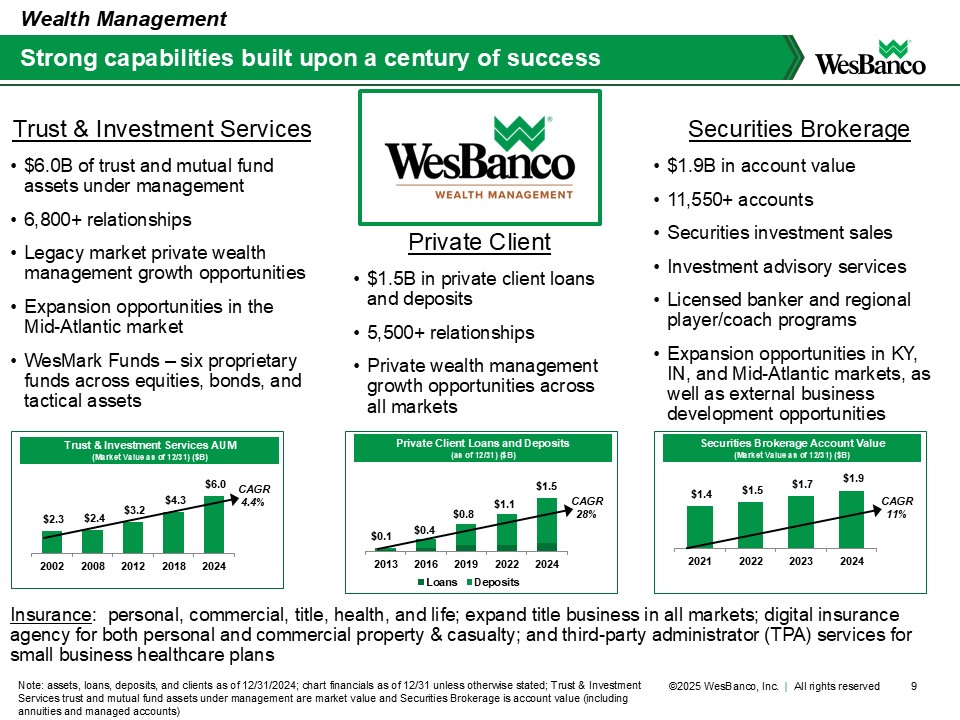
Securities Brokerage • $1.9B in account value • 11,550+ accounts • Securities investment sales • Investment advisory services • Licensed banker and regional player/coach programs • Expansion opportunities in KY, IN, and Mid-Atlantic markets, as well as external business development opportunities Trust & Investment Services • $6.0B of trust and mutual fund assets under management • 6,800+ relationships • Legacy market private wealth management growth opportunities • Expansion opportunities in the Mid-Atlantic market • WesMark Funds – six proprietary funds across equities, bonds, and tactical assets 9 Strong capabilities built upon a century of success Note: assets, loans, deposits, and clients as of 12/31/2024; chart financials as of 12/31 unless otherwise stated; Trust & Investment Services trust and mutual fund assets under management are market value and Securities Brokerage is account value (including annuities and managed accounts) Wealth Management 2013 2016 2019 2022 2024 Loans Deposits $0.1 $0.4 $0.8 $1.1 Private Client Loans and Deposits (as of 12/31) ($B) CAGR 28% $2.3 $2.4 $3.2 $4.3 $6.0 2002 2008 2012 2018 2024 Trust & Investment Services AUM (Market Value as of 12/31) ($B) CAGR 4.4% x/xx x/xx Private Client • $1.5B in private client loans and deposits • 5,500+ relationships • Private wealth management growth opportunities across all markets $1.5 $1.4 $1.5 $1.7 $1.9 2021 2022 2023 2024 Securities Brokerage Account Value (Market Value as of 12/31) ($B) CAGR 11% x/xx Insurance: personal, commercial, title, health, and life; expand title business in all markets; digital insurance agency for both personal and commercial property & casualty; and third-party administrator (TPA) services for small business healthcare plans ©2025 WesBanco, Inc. | All rights reserved
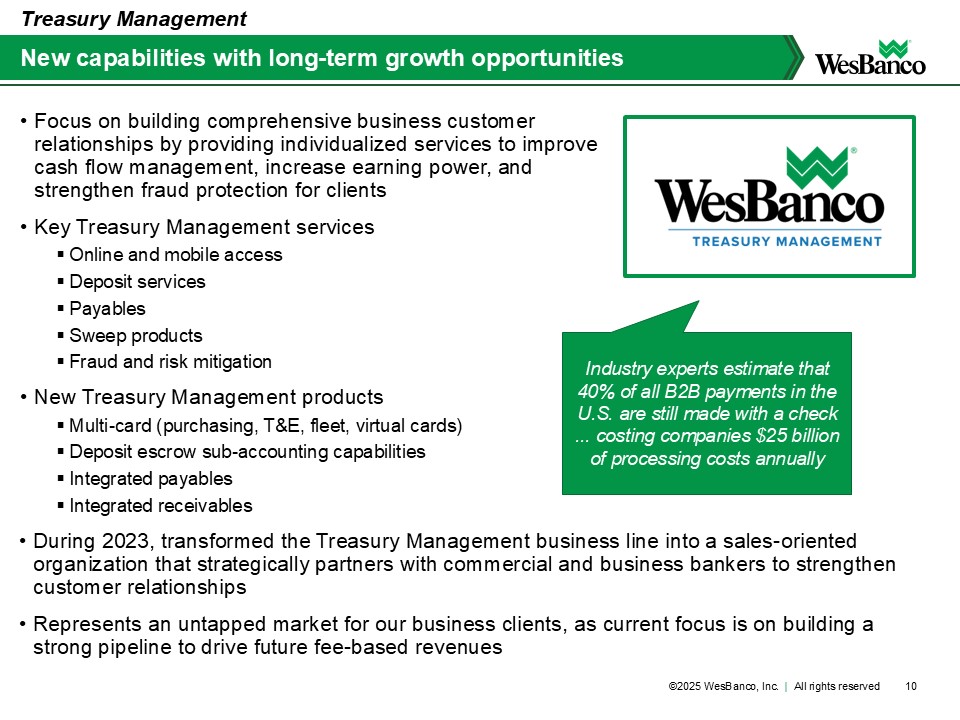
New capabilities with long-term growth opportunities Treasury Management • Focus on building comprehensive business customer relationships by providing individualized services to improve cash flow management, increase earning power, and strengthen fraud protection for clients • Key Treasury Management services ▪ Online and mobile access ▪ Deposit services ▪ Payables ▪ Sweep products ▪ Fraud and risk mitigation • New Treasury Management products ▪ Multi-card (purchasing, T&E, fleet, virtual cards) ▪ Deposit escrow sub-accounting capabilities ▪ Integrated payables ▪ Integrated receivables • During 2023, transformed the Treasury Management business line into a sales-oriented organization that strategically partners with commercial and business bankers to strengthen customer relationships • Represents an untapped market for our business clients, as current focus is on building a strong pipeline to drive future fee-based revenues Industry experts estimate that 40% of all B2B payments in the U.S. are still made with a check ... costing companies $25 billion of processing costs annually ©2025 WesBanco, Inc. | All rights reserved
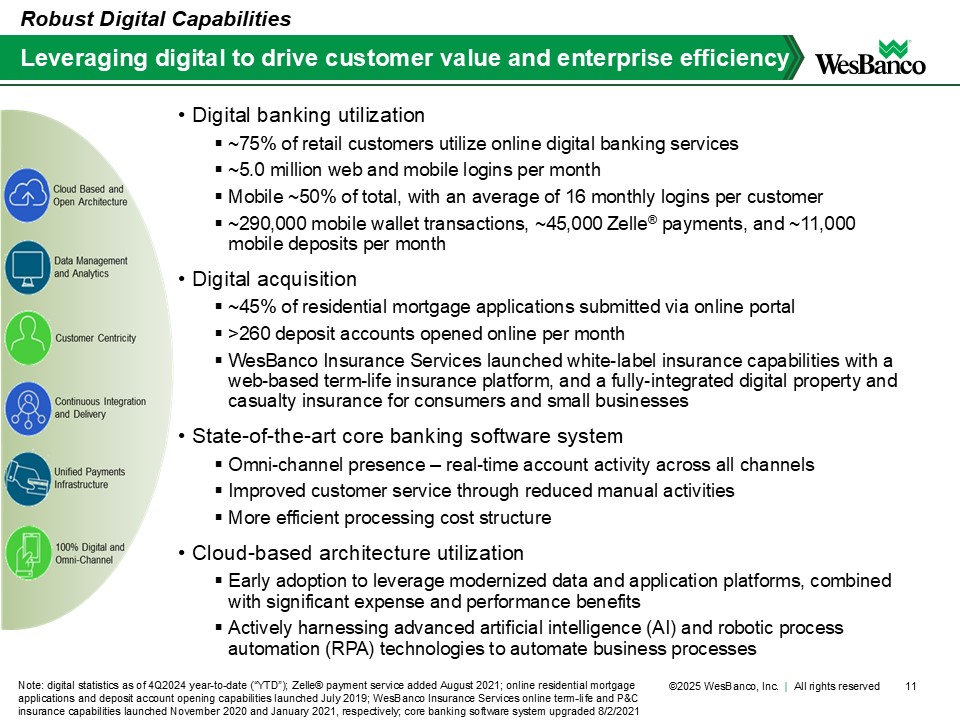
• Digital banking utilization ▪ ~75% of retail customers utilize online digital banking services ▪ ~5.0 million web and mobile logins per month ▪ Mobile ~50% of total, with an average of 16 monthly logins per customer ▪ ~290,000 mobile wallet transactions, ~45,000 Zelle® payments, and ~11,000 mobile deposits per month • Digital acquisition ▪ ~45% of residential mortgage applications submitted via online portal ▪ >260 deposit accounts opened online per month ▪ WesBanco Insurance Services launched white-label insurance capabilities with a web-based term-life insurance platform, and a fully-integrated digital property and casualty insurance for consumers and small businesses • State-of-the-art core banking software system ▪ Omni-channel presence – real-time account activity across all channels ▪ Improved customer service through reduced manual activities ▪ More efficient processing cost structure • Cloud-based architecture utilization ▪ Early adoption to leverage modernized data and application platforms, combined with significant expense and performance benefits ▪ Actively harnessing advanced artificial intelligence (AI) and robotic process automation (RPA) technologies to automate business processes 11 Leveraging digital to drive customer value and enterprise efficiency Note: digital statistics as of 4Q2024 year-to-date (“YTD”); Zelle® payment service added August 2021; online residential mortgage applications and deposit account opening capabilities launched July 2019; WesBanco Insurance Services online term-life and P&C insurance capabilities launched November 2020 and January 2021, respectively; core banking software system upgraded 8/2/2021 Robust Digital Capabilities ©2025 WesBanco, Inc. | All rights reserved
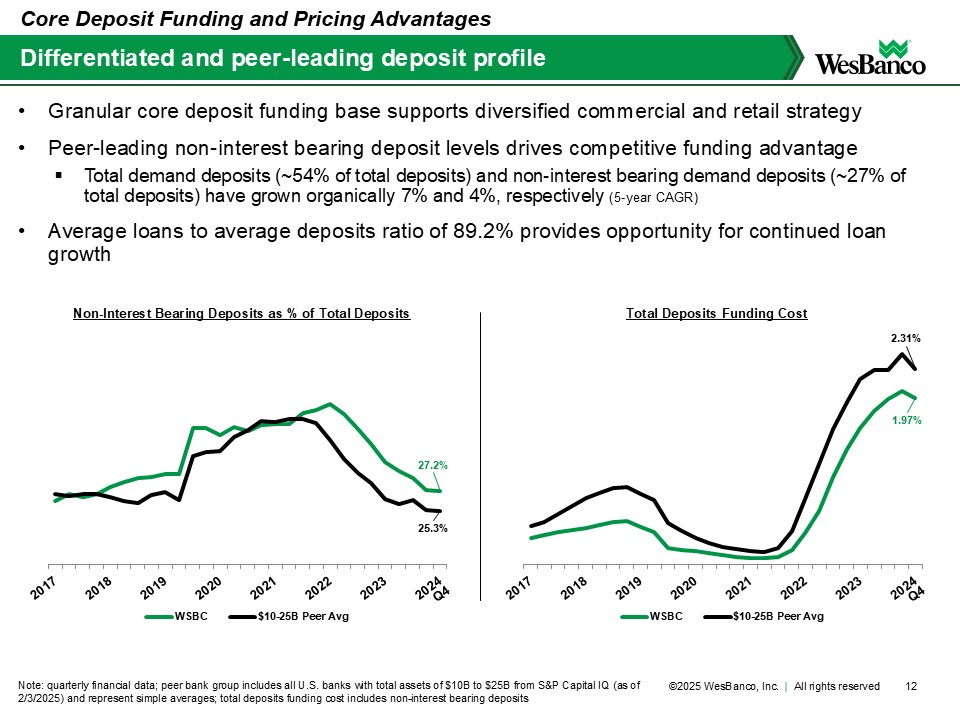
Differentiated and peer-leading deposit profile Note: quarterly financial data; peer bank group includes all U.S. banks with total assets of $10B to $25B from S&P Capital IQ (as of 2/3/2025) and represent simple averages; total deposits funding cost includes non-interest bearing deposits Core Deposit Funding and Pricing Advantages • Granular core deposit funding base supports diversified commercial and retail strategy • Peer-leading non-interest bearing deposit levels drives competitive funding advantage ▪ Total demand deposits (~54% of total deposits) and non-interest bearing demand deposits (~27% of total deposits) have grown organically 7% and 4%, respectively (5-year CAGR) • Average loans to average deposits ratio of 89.2% provides opportunity for continued loan growth 27.2% 25.3% Non-Interest Bearing Deposits as % of Total Deposits WSBC $10-25B Peer Avg 1.97% 2.31% Total Deposits Funding Cost WSBC $10-25B Peer Avg ©2025 WesBanco, Inc. | All rights reserved
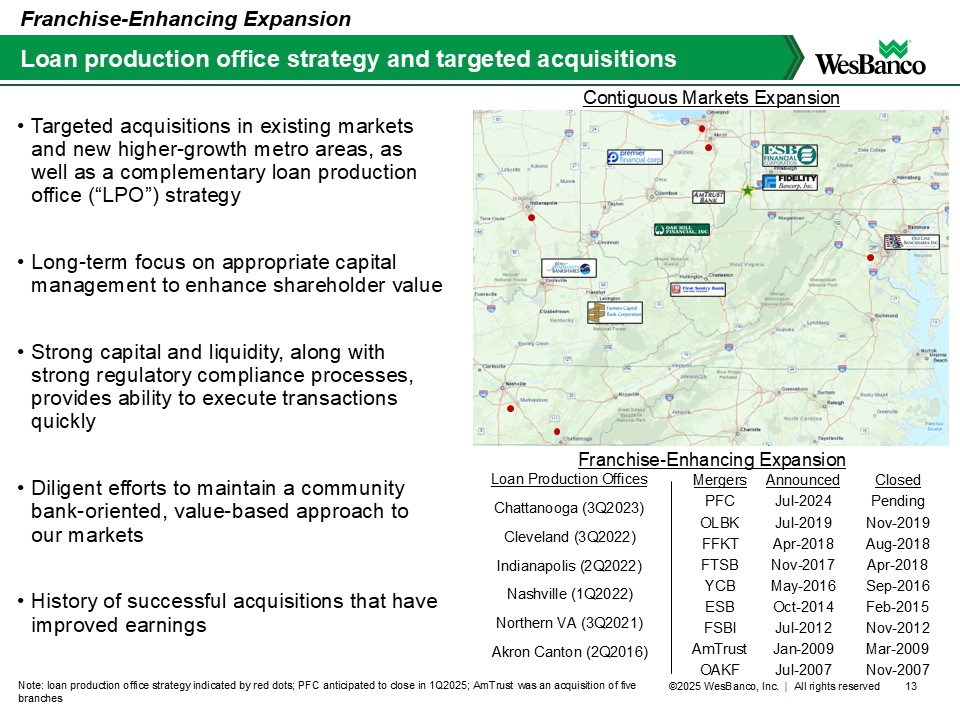
Targeted acquisitions in existing markets and new higher-growth metro areas, as well as a complementary loan production office (“LPO”) strategy • Long-term focus on appropriate capital management to enhance shareholder value • Strong capital and liquidity, along with strong regulatory compliance processes, provides ability to execute transactions quickly • Diligent efforts to maintain a community bank-oriented, value-based approach to our markets • History of successful acquisitions that have improved earnings 13 Franchise-Enhancing Expansion Loan production office strategy and targeted acquisitions Note: loan production office strategy indicated by red dots; PFC anticipated to close in 1Q2025; AmTrust was an acquisition of five branches Franchise-Enhancing Expansion Contiguous Markets Expansion Franchise-Enhancing Expansion Mergers PFC OLBK FFKT FTSB YCB ESB FSBI AmTrust OAKF Announced Jul-2024 Jul-2019 Apr-2018 Nov-2017 May-2016 Oct-2014 Jul-2012 Jan-2009 Jul-2007 Closed Pending Nov-2019 Aug-2018 Apr-2018 Sep-2016 Feb-2015 Nov-2012 Mar-2009 Nov-2007 Loan Production Offices Chattanooga (3Q2023) Cleveland (3Q2022) Indianapolis (2Q2022) Nashville (1Q2022) Northern VA (3Q2021) Akron Canton (2Q2016) ©2025 WesBanco, Inc. | All rights reserved
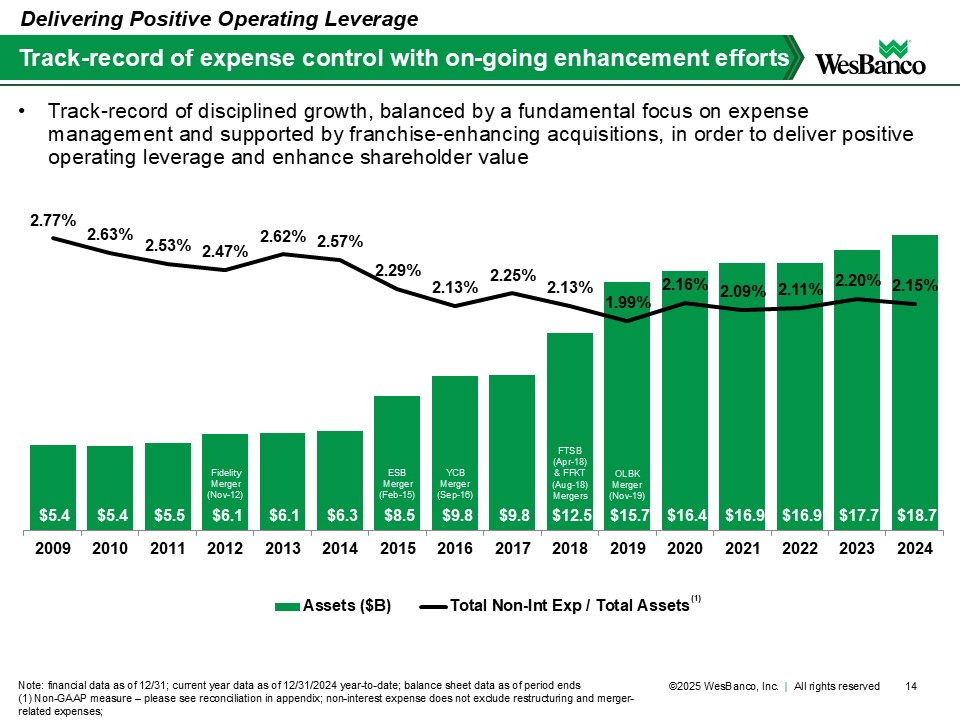
$5.4 $5.4 $5.5 $6.1 $6.1 $6.3 $8.5 $9.8 $9.8 $12.5 $15.7 $16.4 $16.9 $16.9 $17.7 $18.7 2.77% 2.63% 2.53% 2.47% 2.62% 2.57% 2.29% 2.13% 2.25% 2.13% 1.99% 2.16% 2.09% 2.11% 2.20% 2.15% $0.0 $1.0 $2.0 $3.0 $4.0 $5.0 $6.0 $7.0 $8.0 $9.0 $10.0 $11.0 $12.0 $13.0 $14.0 $15.0 $16.0 $17.0 $18.0 $19.0 $20.0 2009 2010 2011 2012 2013 2014 2015 2016 2017 2018 2019 2020 2021 2022 2023 2024 Assets ($B) Total Non-Int Exp / Total Assets(1) 14 Track-record of expense control with on-going enhancement efforts Note: financial data as of 12/31; current year data as of 12/31/2024 year-to-date; balance sheet data as of period ends (1) Non-GAAP measure – please see reconciliation in appendix; non-interest expense does not exclude restructuring and merger-related expenses; Delivering Positive Operating Leverage ESB Merger (Feb-15) Fidelity Merger (Nov-12) YCB Merger (Sep-16) FTSB (Apr-18) & FFKT (Aug-18) Mergers OLBK Merger (Nov-19) • Track-record of disciplined growth, balanced by a fundamental focus on expense management and supported by franchise-enhancing acquisitions, in order to deliver positive operating leverage and enhance shareholder value ©2025 WesBanco, Inc. | All rights reserved
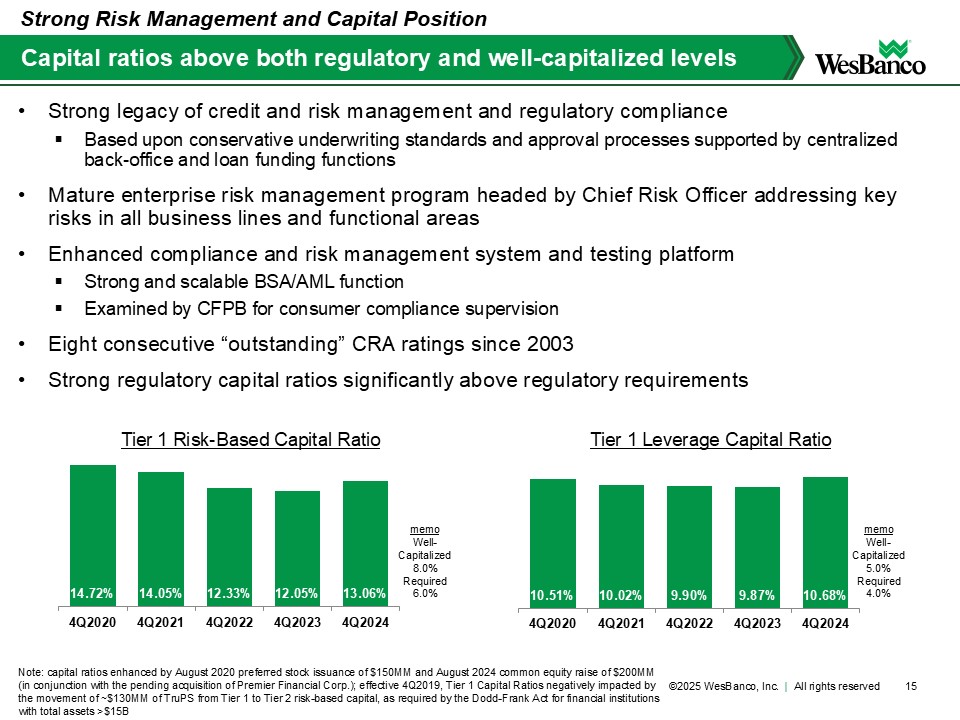
• Strong legacy of credit and risk management and regulatory compliance ▪ Based upon conservative underwriting standards and approval processes supported by centralized back-office and loan funding functions • Mature enterprise risk management program headed by Chief Risk Officer addressing key risks in all business lines and functional areas • Enhanced compliance and risk management system and testing platform ▪ Strong and scalable BSA/AML function ▪ Examined by CFPB for consumer compliance supervision • Eight consecutive “outstanding” CRA ratings since 2003 • Strong regulatory capital ratios significantly above regulatory requirements 15 Capital ratios above both regulatory and well-capitalized levels Note: capital ratios enhanced by August 2020 preferred stock issuance of $150MM and August 2024 common equity raise of $200MM (in conjunction with the pending acquisition of Premier Financial Corp.); effective 4Q2019, Tier 1 Capital Ratios negatively impacted by the movement of ~$130MM of TruPS from Tier 1 to Tier 2 risk-based capital, as required by the Dodd-Frank Act for financial institutions with total assets >$15B Strong Risk Management and Capital Position 10.51% 10.02% 9.90% 9.87% 10.68% 4Q2020 4Q2021 4Q2022 4Q2023 4Q2024 14.72% 14.05% 12.33% 12.05% 13.06% 4Q2020 4Q2021 4Q2022 4Q2023 4Q2024 memo Well-Capitalized 8.0% Required 6.0% memo Well-Capitalized 5.0% Required 4.0% Tier 1 Risk-Based Capital Ratio Tier 1 Leverage Capital Ratio ©2025 WesBanco, Inc. | All rights reserved
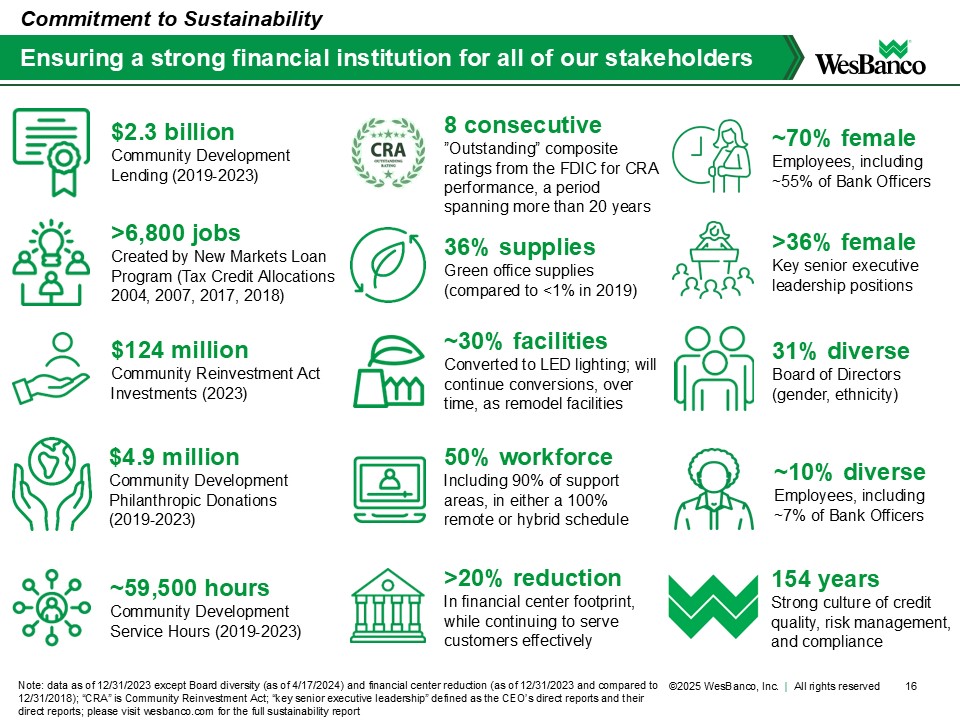
16 Ensuring a strong financial institution for all of our stakeholders Note: data as of 12/31/2023 except Board diversity (as of 4/17/2024) and financial center reduction (as of 12/31/2023 and compared to 12/31/2018); “CRA” is Community Reinvestment Act; “key senior executive leadership” defined as the CEO’s direct reports and their direct reports; please visit wesbanco.com for the full sustainability report Commitment to Sustainability >6,800 jobs Created by New Markets Loan Program (Tax Credit Allocations 2004, 2007, 2017, 2018) $2.3 billion Community Development Lending (2019-2023) $124 million Community Reinvestment Act Investments (2023) $4.9 million Community Development Philanthropic Donations (2019-2023) ~59,500 hours Community Development Service Hours (2019-2023) 8 consecutive ”Outstanding” composite ratings from the FDIC for CRA performance, a period spanning more than 20 years ~70% female Employees, including ~55% of Bank Officers >36% female Key senior executive leadership positions 31% diverse Board of Directors (gender, ethnicity) ~10% diverse Employees, including ~7% of Bank Officers 36% supplies Green office supplies (compared to <1% in 2019) ~30% facilities Converted to LED lighting; will continue conversions, over time, as remodel facilities 50% workforce Including 90% of support areas, in either a 100% remote or hybrid schedule >20% reduction In financial center footprint, while continuing to serve customers effectively 154 years Strong culture of credit quality, risk management, and compliance ©2025 WesBanco, Inc. | All rights reserved
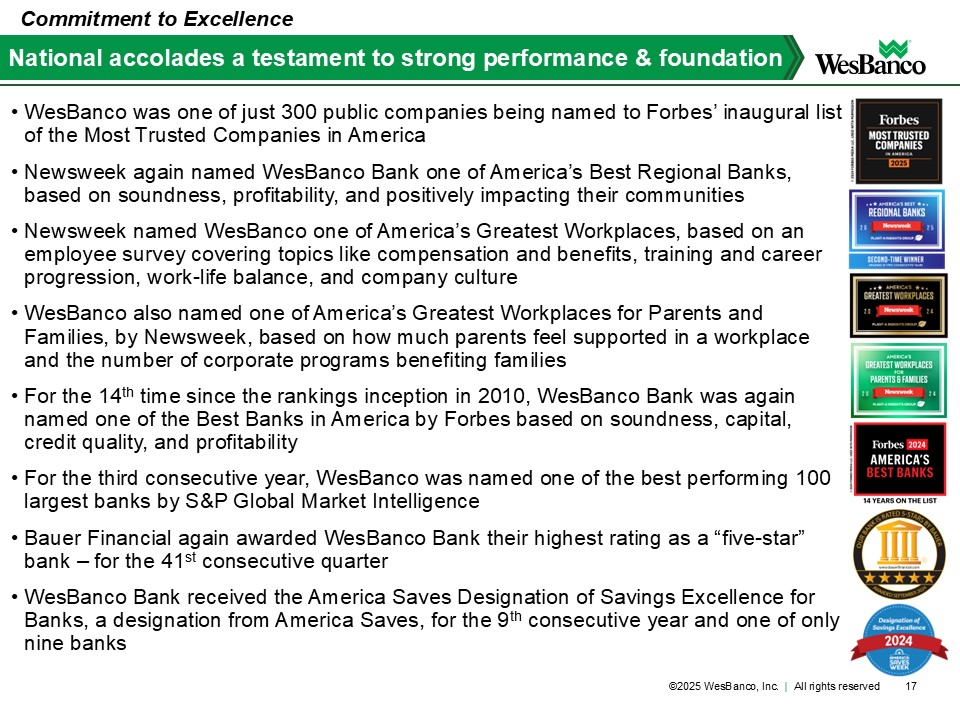
• WesBanco was one of just 300 public companies being named to Forbes’ inaugural list of the Most Trusted Companies in America • Newsweek again named WesBanco Bank one of America’s Best Regional Banks, based on soundness, profitability, and positively impacting their communities • Newsweek named WesBanco one of America’s Greatest Workplaces, based on an employee survey covering topics like compensation and benefits, training and career progression, work-life balance, and company culture • WesBanco also named one of America’s Greatest Workplaces for Parents and Families, by Newsweek, based on how much parents feel supported in a workplace and the number of corporate programs benefiting families • For the 14th time since the rankings inception in 2010, WesBanco Bank was again named one of the Best Banks in America by Forbes based on soundness, capital, credit quality, and profitability • For the third consecutive year, WesBanco was named one of the best performing 100 largest banks by S&P Global Market Intelligence • Bauer Financial again awarded WesBanco Bank their highest rating as a “five-star” bank – for the 41st consecutive quarter • WesBanco Bank received the America Saves Designation of Savings Excellence for Banks, a designation from America Saves, for the 9th consecutive year and one of only nine banks 17 National accolades a testament to strong performance & foundation Commitment to Excellence ©2025 WesBanco, Inc. | All rights reserved
Financial Overview ©2025 WesBanco, Inc. | All rights reserved
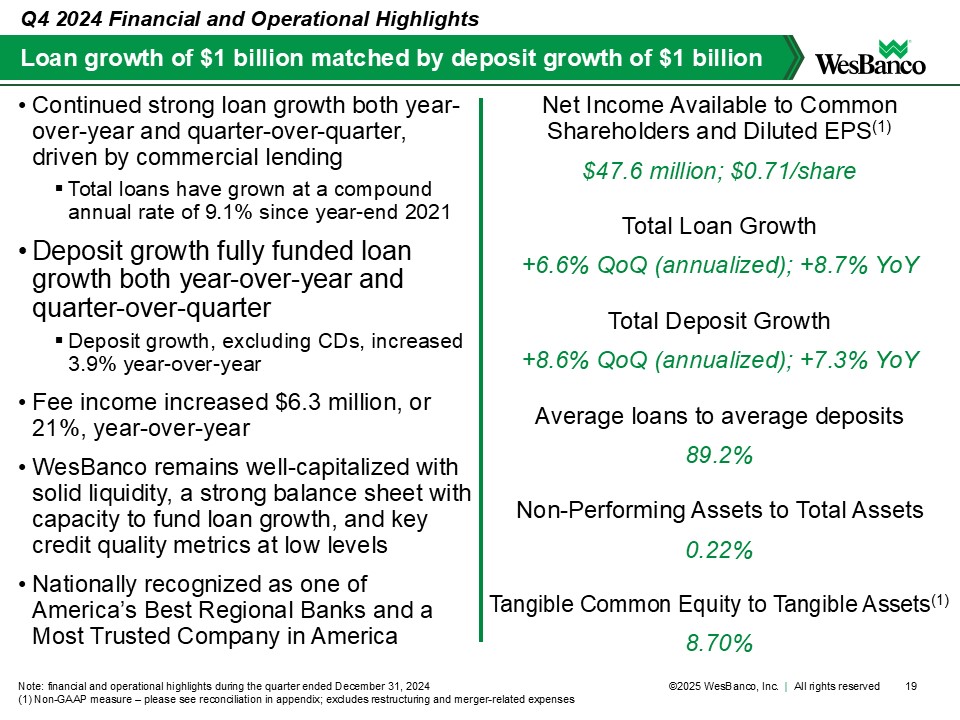
• Continued strong loan growth both year-over-year and quarter-over-quarter, driven by commercial lending ▪ Total loans have grown at a compound annual rate of 9.1% since year-end 2021 • Deposit growth fully funded loan growth both year-over-year and quarter-over-quarter ▪ Deposit growth, excluding CDs, increased 3.9% year-over-year • Fee income increased $6.3 million, or 21%, year-over-year • WesBanco remains well-capitalized with solid liquidity, a strong balance sheet with capacity to fund loan growth, and key credit quality metrics at low levels • Nationally recognized as one of America’s Best Regional Banks and a Most Trusted Company in America 19 Net Income Available to Common Shareholders and Diluted EPS(1) $47.6 million; $0.71/share Total Loan Growth +6.6% QoQ (annualized); +8.7% YoY Total Deposit Growth +8.6% QoQ (annualized); +7.3% YoY Average loans to average deposits 89.2% Non-Performing Assets to Total Assets 0.22% Tangible Common Equity to Tangible Assets(1) 8.70% Loan growth of $1 billion matched by deposit growth of $1 billion Note: financial and operational highlights during the quarter ended December 31, 2024 (1) Non-GAAP measure – please see reconciliation in appendix; excludes restructuring and merger-related expenses Q4 2024 Financial and Operational Highlights ©2025 WesBanco, Inc. | All rights reserved
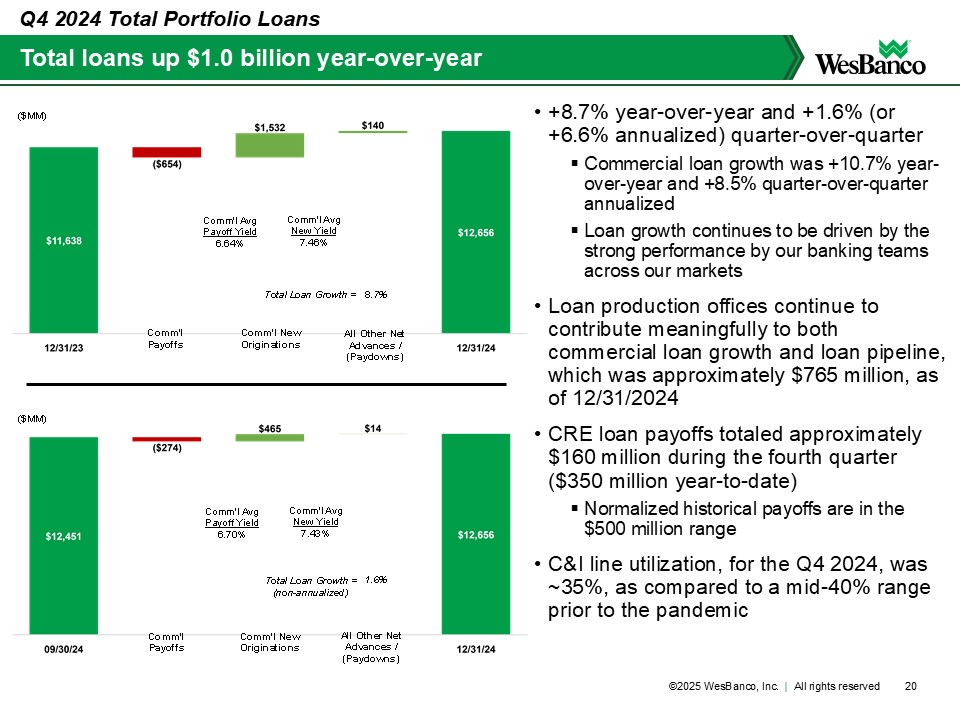
Comm'l Payoffs Comm'l New Originations All Other Net Advances / (Paydowns) Comm'l Avg Payoff Yield 6.64% Comm'l Avg New Yield 7.46% Total Loan Growth = 8.7% ($MM) Comm'l Payoffs Comm'l New Originations All Other Net Advances / (Paydowns) Total Loan Growth = (non-annualized) 1.6% Comm'l Avg Payoff Yield 6.70% Comm'l Avg New Yield 7.43% ($MM) • +8.7% year-over-year and +1.6% (or +6.6% annualized) quarter-over-quarter ▪ Commercial loan growth was +10.7% year-over-year and +8.5% quarter-over-quarter annualized ▪ Loan growth continues to be driven by the strong performance by our banking teams across our markets • Loan production offices continue to contribute meaningfully to both commercial loan growth and loan pipeline, which was approximately $765 million, as of 12/31/2024 • CRE loan payoffs totaled approximately $160 million during the fourth quarter ($350 million year-to-date) ▪ Normalized historical payoffs are in the $500 million range • C&I line utilization, for the Q4 2024, was ~35%, as compared to a mid-40% range prior to the pandemic 20 Total loans up $1.0 billion year-over-year Q4 2024 Total Portfolio Loans ©2025 WesBanco, Inc. | All rights reserved
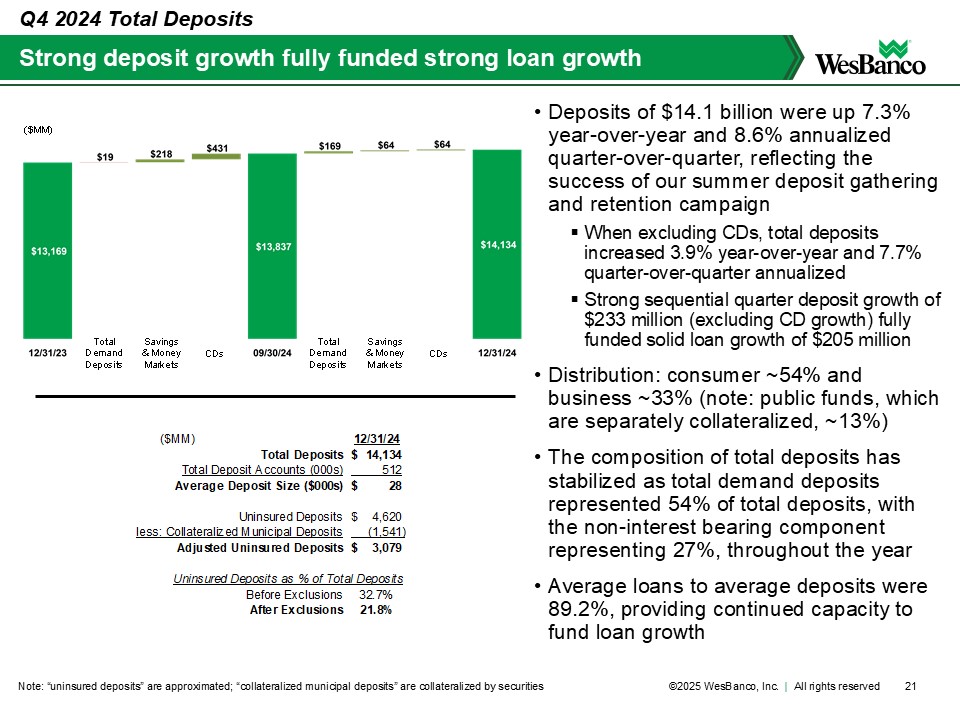
($MM) 12/31/24 Total Deposits $ 1 4,134 Total Deposit Accounts (000s) 512 Average Deposit Size ($000s) $ 28 Uninsured Deposits $ 4 ,620 less: Collateralized Municipal Deposits (1,541) Adjusted Uninsured Deposits $ 3 ,079 Uninsured Deposits as % of Total Deposits Before Exclusions 32.7% After Exclusions 21.8% Total Demand Deposits Savings & Money Markets CDs Total Demand Deposits Savings & Money Markets CDs ($MM) 21 Strong deposit growth fully funded strong loan growth Note: “uninsured deposits” are approximated; “collateralized municipal deposits” are collateralized by securities • Deposits of $14.1 billion were up 7.3% year-over-year and 8.6% annualized quarter-over-quarter, reflecting the success of our summer deposit gathering and retention campaign ▪ When excluding CDs, total deposits increased 3.9% year-over-year and 7.7% quarter-over-quarter annualized ▪ Strong sequential quarter deposit growth of $233 million (excluding CD growth) fully funded solid loan growth of $205 million • Distribution: consumer ~54% and business ~33% (note: public funds, which are separately collateralized, ~13%) • The composition of total deposits has stabilized as total demand deposits represented 54% of total deposits, with the non-interest bearing component representing 27%, throughout the year • Average loans to average deposits were 89.2%, providing continued capacity to fund loan growth Q4 2024 Total Deposits ©2025 WesBanco, Inc. | All rights reserved
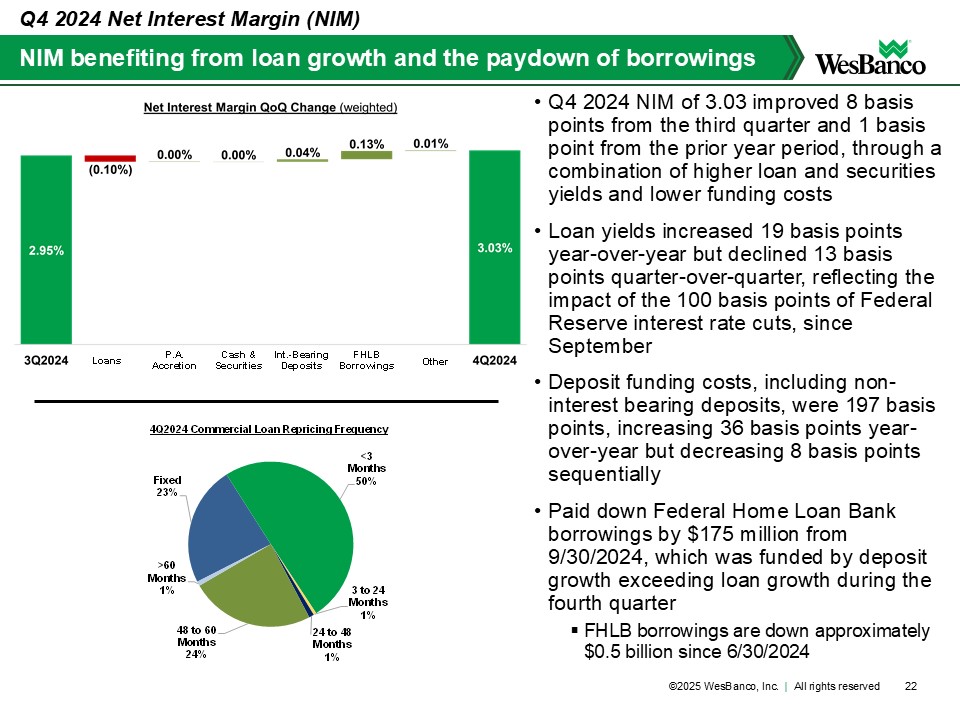
NIM benefiting from loan growth and the paydown of borrowings • Q4 2024 NIM of 3.03 improved 8 basis points from the third quarter and 1 basis point from the prior year period, through a combination of higher loan and securities yields and lower funding costs • Loan yields increased 19 basis points year-over-year but declined 13 basis points quarter-over-quarter, reflecting the impact of the 100 basis points of Federal Reserve interest rate cuts, since September • Deposit funding costs, including non-interest bearing deposits, were 197 basis points, increasing 36 basis points year-over-year but decreasing 8 basis points sequentially • Paid down Federal Home Loan Bank borrowings by $175 million from 9/30/2024, which was funded by deposit growth exceeding loan growth during the fourth quarter ▪ FHLB borrowings are down approximately $0.5 billion since 6/30/2024 Q4 2024 Net Interest Margin (NIM) Fixed 23% <3 Months 50% 3 to 24 Months 1% 24 to 48 Months 1% 48 to 60 Months 24% >60 Months 1% 4Q2024 Commercial Loan Repricing Frequency ©2025 WesBanco, Inc. | All rights reserved
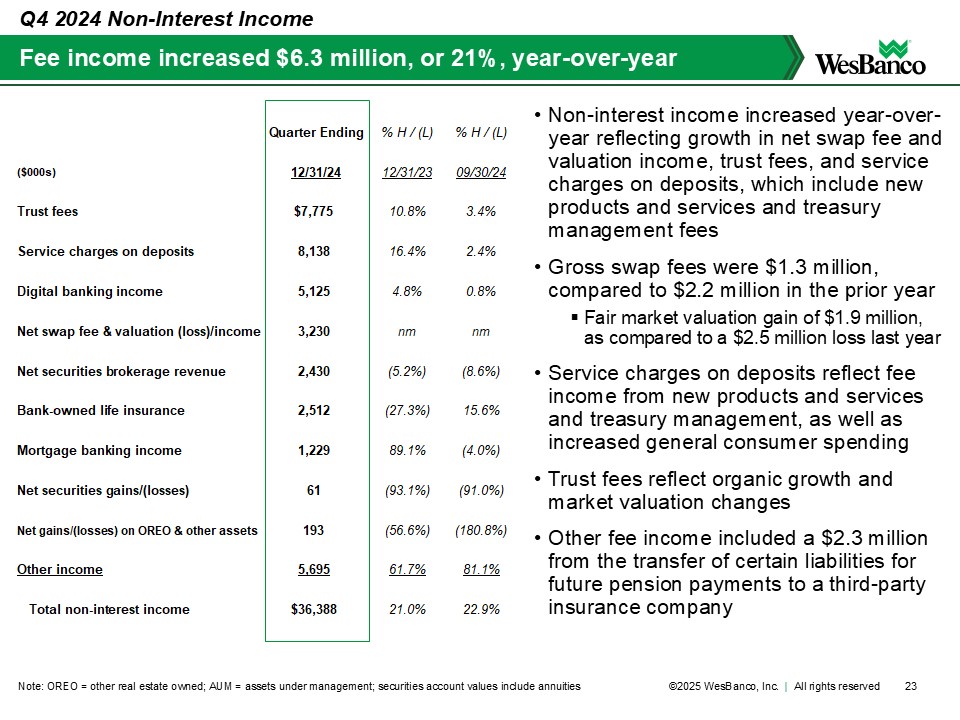
Quarter Ending % H / (L) % H / (L) ($000s) 12/31/24 12/31/23 09/30/24 Trust fees $7,775 10.8% 3.4% Service charges on deposits 8,138 16.4% 2.4% Digital banking income 5,125 4.8% 0.8% Net swap fee & valuation (loss)/income 3,230 nm nm Net securities brokerage revenue 2,430 (5.2%) (8.6%) Bank-owned life insurance 2,512 (27.3%) 15.6% Mortgage banking income 1,229 89.1% (4.0%) Net securities gains/(losses) 61 (93.1%) (91.0%) Net gains/(losses) on OREO & other assets 193 (56.6%) (180.8%) Other income 5,695 61.7% 81.1% Total non-interest income $36,388 21.0% 22.9% • Non-interest income increased year-over-year reflecting growth in net swap fee and valuation income, trust fees, and service charges on deposits, which include new products and services and treasury management fees • Gross swap fees were $1.3 million, compared to $2.2 million in the prior year ▪ Fair market valuation gain of $1.9 million, as compared to a $2.5 million loss last year • Service charges on deposits reflect fee income from new products and services and treasury management, as well as increased general consumer spending • Trust fees reflect organic growth and market valuation changes • Other fee income included a $2.3 million from the transfer of certain liabilities for future pension payments to a third-party insurance company 23 Fee income increased $6.3 million, or 21%, year-over-year Note: OREO = other real estate owned; AUM = assets under management; securities account values include annuities Q4 2024 Non-Interest Income ©2025 WesBanco, Inc. | All rights reserved
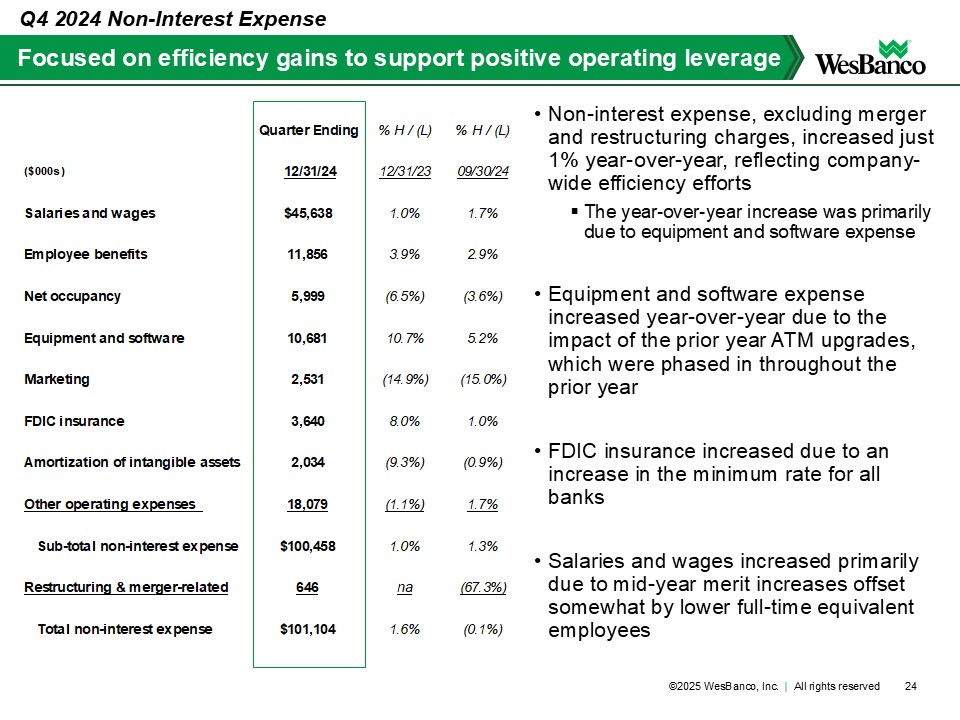
Quarter Ending % H / (L) % H / (L) ($000s) 12/31/24 12/31/23 09/30/24 Salaries and wages $45,638 1.0% 1.7% Employee benefits 11,856 3.9% 2.9% Net occupancy 5,999 (6.5%) (3.6%) Equipment and software 10,681 10.7% 5.2% Marketing 2,531 (14.9%) (15.0%) FDIC insurance 3,640 8.0% 1.0% Amortization of intangible assets 2,034 (9.3%) (0.9%) Other operating expenses 18,079 (1.1%) 1.7% Sub-total non-interest expense $100,458 1.0% 1.3% Restructuring & merger-related 646 na (67.3%) Total non-interest expense $101,104 1.6% (0.1%) Focused on efficiency gains to support positive operating leverage Q4 2024 Non-Interest Expense • Non-interest expense, excluding merger and restructuring charges, increased just 1% year-over-year, reflecting company-wide efficiency efforts ▪ The year-over-year increase was primarily due to equipment and software expense • Equipment and software expense increased year-over-year due to the impact of the prior year ATM upgrades, which were phased in throughout the prior year • FDIC insurance increased due to an increase in the minimum rate for all banks • Salaries and wages increased primarily due to mid-year merit increases offset somewhat by lower full-time equivalent employees 24 ©2025 WesBanco, Inc. | All rights reserved
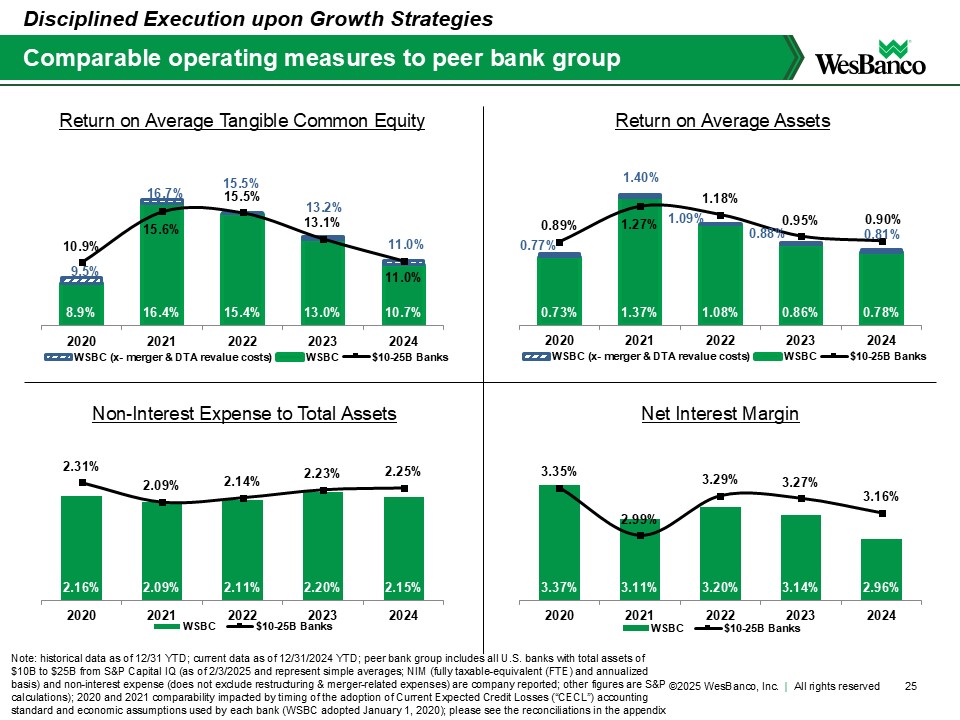
2.16% 2.09% 2.11% 2.20% 2.15% 2.31% 2.09% 2.14% 2.23% 2.25% 2020 2021 2022 2023 2024 WSBC $10-25B Banks 25 Comparable operating measures to peer bank group Note: historical data as of 12/31 YTD; current data as of 12/31/2024 YTD; peer bank group includes all U.S. banks with total assets of $10B to $25B from S&P Capital IQ (as of 2/3/2025 and represent simple averages; NIM (fully taxable-equivalent (FTE) and annualized basis) and non-interest expense (does not exclude restructuring & merger-related expenses) are company reported; other figures are S&P calculations); 2020 and 2021 comparability impacted by timing of the adoption of Current Expected Credit Losses (“CECL”) accounting standard and economic assumptions used by each bank (WSBC adopted January 1, 2020); please see the reconciliations in the appendix Return on Average Assets Non-Interest Expense to Total Assets Net Interest Margin Return on Average Tangible Common Equity Disciplined Execution upon Growth Strategies 3.37% 3.11% 3.20% 3.14% 2.96% 3.35% 2.99% 3.29% 3.27% 3.16% 2020 2021 2022 2023 2024 WSBC $10-25B Banks 0.73% 1.37% 1.08% 0.86% 0.78% 0.89% 1.27% 1.18% 0.95% 0.90% 2020 2021 2022 2023 2024 WSBC (x- merger & DTA revalue costs) WSBC $10-25B Banks 1.40% 0.77% 0.81% 0.88% 1.09% 8.9% 16.4% 15.4% 13.0% 10.7% 10.9% 15.6% 15.5% 13.1% 11.0% 2020 2021 2022 2023 2024 WSBC (x- merger & DTA revalue costs) WSBC $10-25B Banks 16.7% 9.5% 11.0% 15.5% 13.2% ©2025 WesBanco, Inc. | All rights reserved
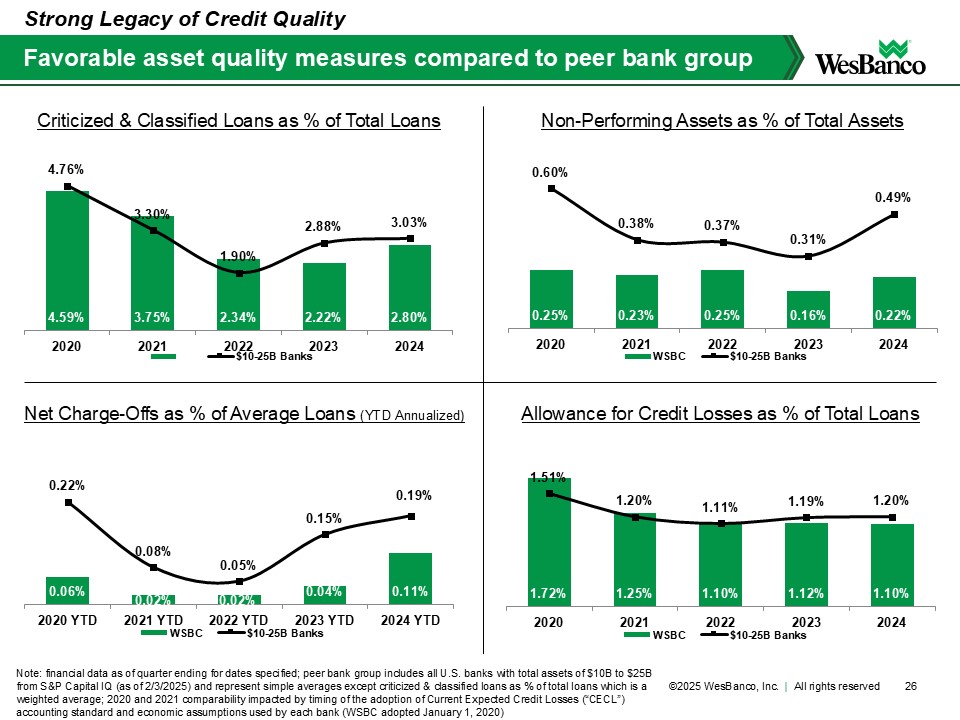
0.25% 0.23% 0.25% 0.16% 0.22% 0.60% 0.38% 0.37% 0.31% 0.49% 2020 2021 2022 2023 2024 WSBC $10-25B Banks 0.06% 0.02% 0.02% 0.04% 0.11% 0.22% 0.08% 0.05% 0.15% 0.19% 2020 YTD 2021 YTD 2022 YTD 2023 YTD 2024 YTD WSBC $10-25B Banks 1.72% 1.25% 1.10% 1.12% 1.10% 1.51% 1.20% 1.11% 1.19% 1.20% 2020 2021 2022 2023 2024 WSBC $10-25B Banks 4.59% 3.75% 2.34% 2.22% 2.80% 4.76% 3.30% 1.90% 2.88% 3.03% 2020 2021 2022 2023 2024 $10-25B Banks 26 Favorable asset quality measures compared to peer bank group Note: financial data as of quarter ending for dates specified; peer bank group includes all U.S. banks with total assets of $10B to $25B from S&P Capital IQ (as of 2/3/2025) and represent simple averages except criticized & classified loans as % of total loans which is a weighted average; 2020 and 2021 comparability impacted by timing of the adoption of Current Expected Credit Losses (“CECL”) accounting standard and economic assumptions used by each bank (WSBC adopted January 1, 2020) Non-Performing Assets as % of Total Assets Net Charge-Offs as % of Average Loans (YTD Annualized) Allowance for Credit Losses as % of Total Loans Criticized & Classified Loans as % of Total Loans Strong Legacy of Credit Quality ©2025 WesBanco, Inc. | All rights reserved
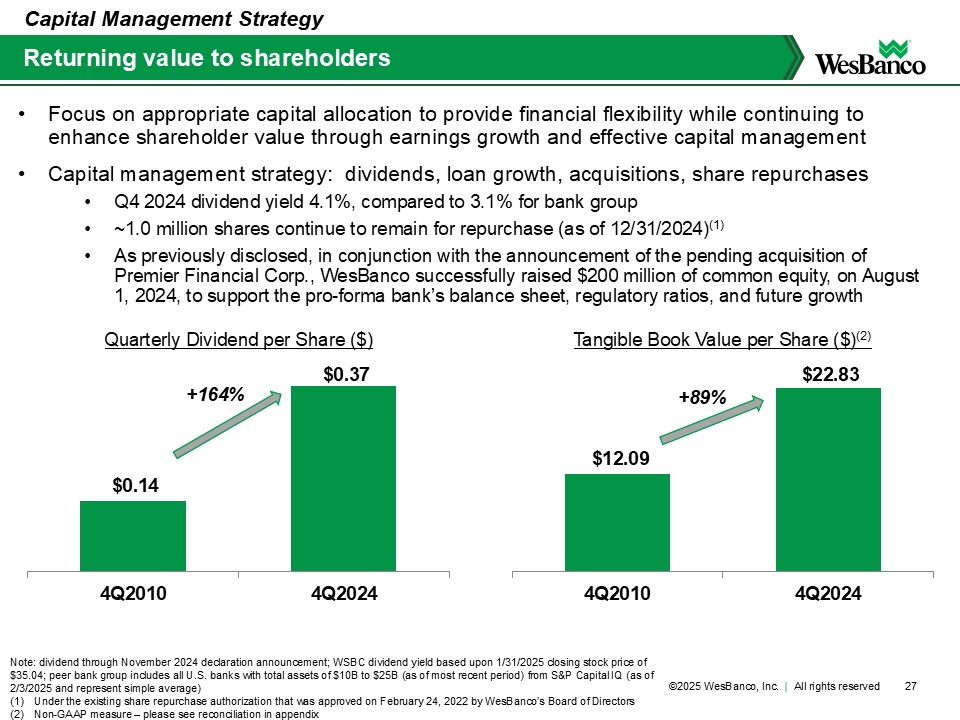
$0.14 $0.37 4Q2010 4Q2024 $12.09 $22.83 4Q2010 4Q2024 27 Returning value to shareholders Note: dividend through November 2024 declaration announcement; WSBC dividend yield based upon 1/31/2025 closing stock price of $35.04; peer bank group includes all U.S. banks with total assets of $10B to $25B (as of most recent period) from S&P Capital IQ (as of 2/3/2025 and represent simple average) (1) Under the existing share repurchase authorization that was approved on February 24, 2022 by WesBanco’s Board of Directors (2) Non-GAAP measure – please see reconciliation in appendix • Focus on appropriate capital allocation to provide financial flexibility while continuing to enhance shareholder value through earnings growth and effective capital management • Capital management strategy: dividends, loan growth, acquisitions, share repurchases • Q4 2024 dividend yield 4.1%, compared to 3.1% for bank group • ~1.0 million shares continue to remain for repurchase (as of 12/31/2024)(1) • As previously disclosed, in conjunction with the announcement of the pending acquisition of Premier Financial Corp., WesBanco successfully raised $200 million of common equity, on August 1, 2024, to support the pro-forma bank’s balance sheet, regulatory ratios, and future growth Capital Management Strategy Tangible Book Value per Share ($)(2) Quarterly Dividend per Share ($) +164% +89% ©2025 WesBanco, Inc. | All rights reserved
Appendix ©2025 WesBanco, Inc. | All rights reserved
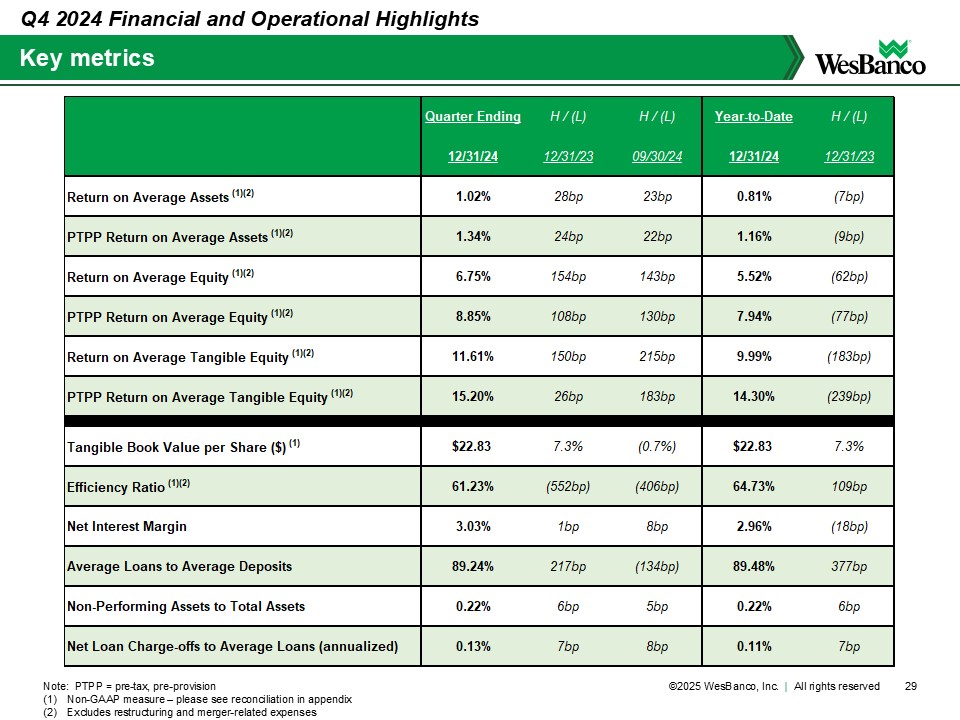
H / (L) H / (L) H / (L) 12/31/24 12/31/23 09/30/24 12/31/24 12/31/23 Return on Average Assets (1)(2) 1.02% 28bp 23bp 0.81% (7bp) PTPP Return on Average Assets (1)(2) 1.34% 24bp 22bp 1.16% (9bp) Return on Average Equity (1)(2) 6.75% 154bp 143bp 5.52% (62bp) PTPP Return on Average Equity (1)(2) 8.85% 108bp 130bp 7.94% (77bp) Return on Average Tangible Equity (1)(2) 11.61% 150bp 215bp 9.99% (183bp) PTPP Return on Average Tangible Equity (1)(2) 15.20% 26bp 183bp 14.30% (239bp) Tangible Book Value per Share ($) (1) $22.83 7.3% (0.7%) $22.83 7.3% Efficiency Ratio (1)(2) 61.23% (552bp) (406bp) 64.73% 109bp Net Interest Margin 3.03% 1bp 8bp 2.96% (18bp) Average Loans to Average Deposits 89.24% 217bp (134bp) 89.48% 377bp Non-Performing Assets to Total Assets 0.22% 6bp 5bp 0.22% 6bp Net Loan Charge-offs to Average Loans (annualized) 0.13% 7bp 8bp 0.11% 7bp Quarter Ending Year-to-Date 29 Key metrics Note: PTPP = pre-tax, pre-provision (1) Non-GAAP measure – please see reconciliation in appendix (2) Excludes restructuring and merger-related expenses Q4 2024 Financial and Operational Highlights ©2025 WesBanco, Inc. | All rights reserved
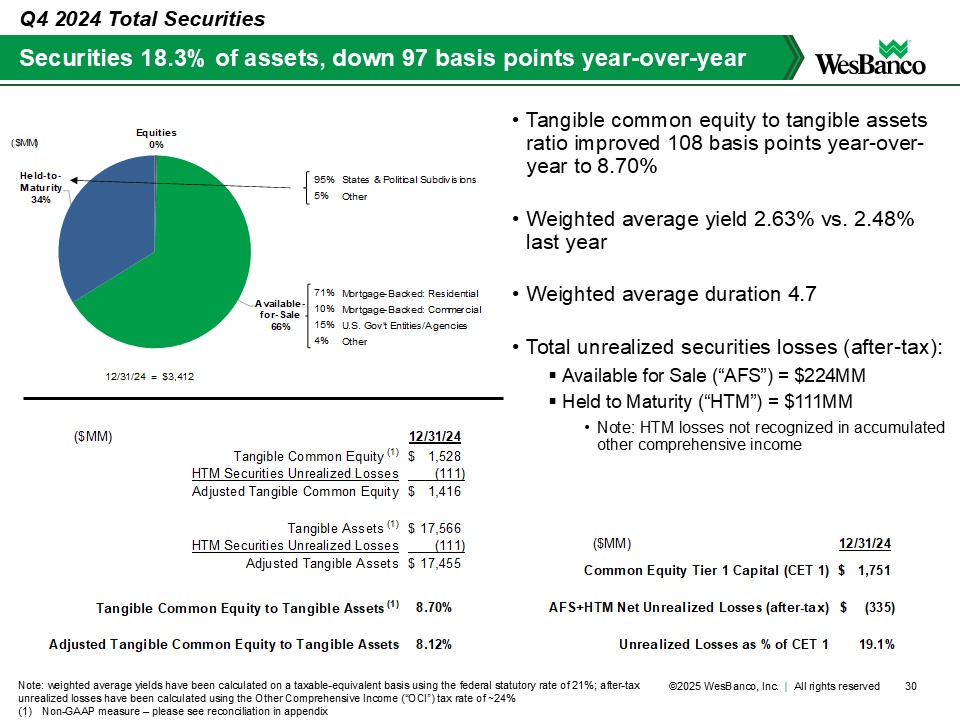
95% States & Political Subdivisions 5% Other 71% Mortgage-Backed: Residential 10% Mortgage-Backed: Commercial 15% U.S. Gov't Entities/Agencies 4% Other Equities 0% Available-for- Sale 66% Held-to- Maturity 34% 12/31/24 $3,412 = ($MM) ($MM) 12/31/24 Tangible Common Equity (1) $ 1 ,528 HTM Securities Unrealized Losses (111) Adjusted Tangible Common Equity $ 1 ,416 Tangible Assets (1) $ 1 7,566 HTM Securities Unrealized Losses (111) Adjusted Tangible Assets $ 1 7,455 8.70% 8.12% Tangible Common Equity to Tangible Assets (1) Adjusted Tangible Common Equity to Tangible Assets ($MM) 12/31/24 $ 1 ,751 $ ( 335) Unrealized Losses as % of CET 1 19.1% AFS+HTM Net Unrealized Losses (after-tax) Common Equity Tier 1 Capital (CET 1) • Tangible common equity to tangible assets ratio improved 108 basis points year-over-year to 8.70% • Weighted average yield 2.63% vs. 2.48% last year • Weighted average duration 4.7 • Total unrealized securities losses (after-tax): ▪ Available for Sale (“AFS”) = $224MM ▪ Held to Maturity (“HTM”) = $111MM • Note: HTM losses not recognized in accumulated other comprehensive income 30 Securities 18.3% of assets, down 97 basis points year-over-year Note: weighted average yields have been calculated on a taxable-equivalent basis using the federal statutory rate of 21%; after-tax unrealized losses have been calculated using the Other Comprehensive Income (“OCI”) tax rate of ~24% (1) Non-GAAP measure – please see reconciliation in appendix Q4 2024 Total Securities ©2025 WesBanco, Inc. | All rights reserved
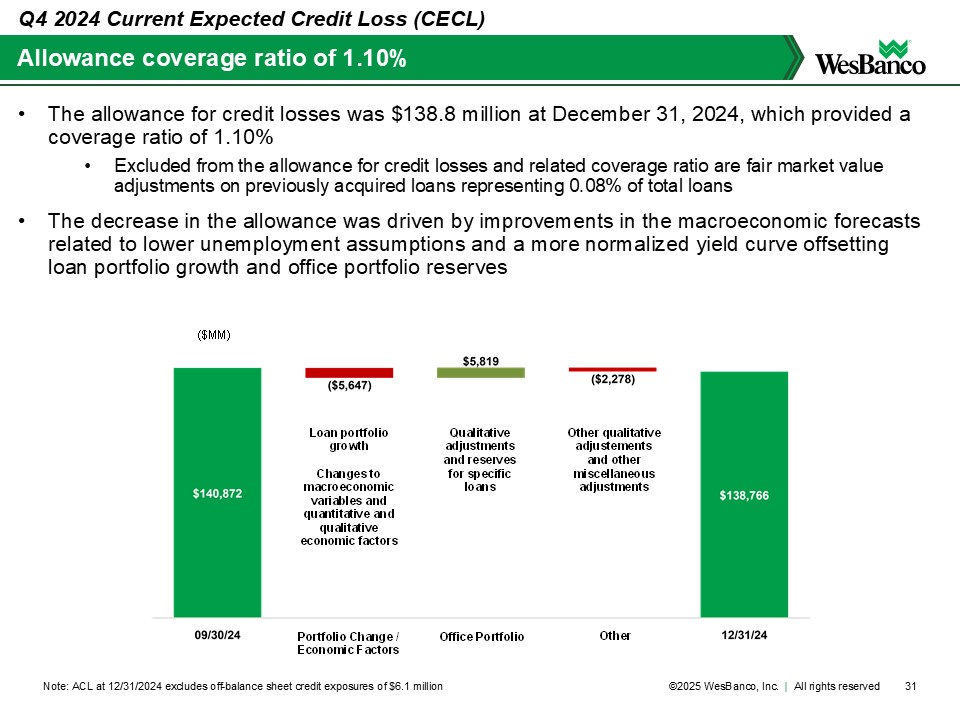
Portfolio Change / Economic Factors Office Portfolio Other Qualitative adjustments and reserves for specific loans Other qualitative adjustements and other miscellaneous adjustments Loan portfolio growth Changes to macroeconomic variables and quantitative and qualitative economic factors ($MM) 31 Allowance coverage ratio of 1.10% Note: ACL at 12/31/2024 excludes off-balance sheet credit exposures of $6.1 million • The allowance for credit losses was $138.8 million at December 31, 2024, which provided a coverage ratio of 1.10% • Excluded from the allowance for credit losses and related coverage ratio are fair market value adjustments on previously acquired loans representing 0.08% of total loans • The decrease in the allowance was driven by improvements in the macroeconomic forecasts related to lower unemployment assumptions and a more normalized yield curve offsetting loan portfolio growth and office portfolio reserves Q4 2024 Current Expected Credit Loss (CECL) ©2025 WesBanco, Inc. | All rights reserved
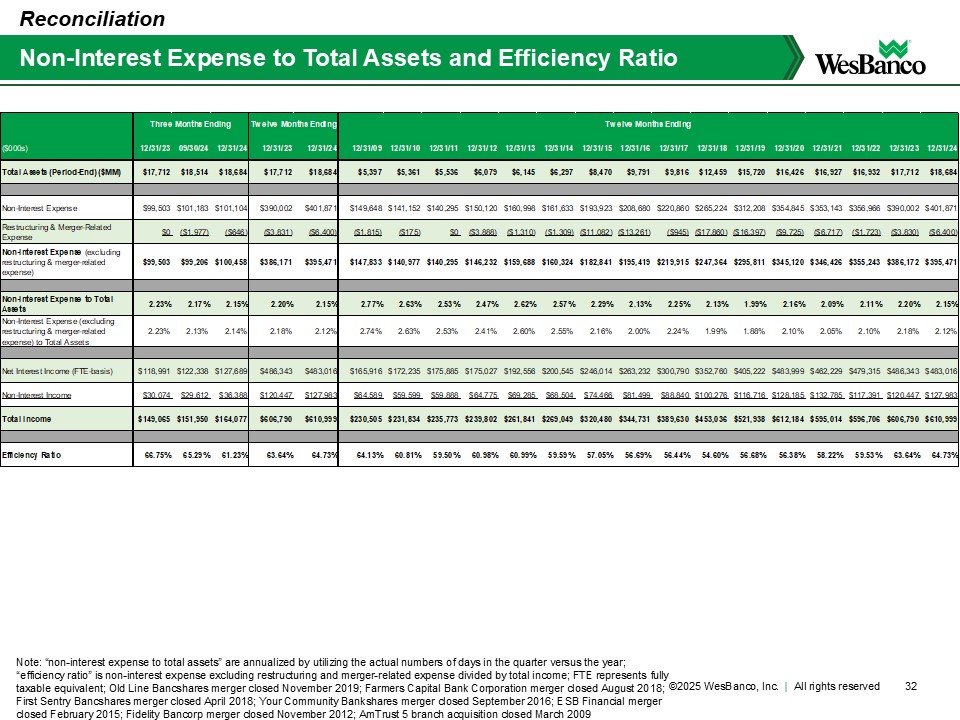
($000s) 12/31/23 09/30/24 12/31/24 12/31/23 12/31/24 12/31/09 12/31/10 12/31/11 12/31/12 12/31/13 12/31/14 12/31/15 12/31/16 12/31/17 12/31/18 12/31/19 12/31/20 12/31/21 12/31/22 12/31/23 12/31/24 Total Assets (Period-End) ($MM) $17,712 $18,514 $18,684 $17,712 $18,684 $5,397 $5,361 $5,536 $6,079 $6,145 $6,297 $8,470 $9,791 $9,816 $12,459 $15,720 $16,426 $16,927 $16,932 $17,712 $18,684 Non-Interest Expense $99,503 $101,183 $101,104 $390,002 $401,871 $149,648 $141,152 $140,295 $150,120 $160,998 $161,633 $193,923 $208,680 $220,860 $265,224 $312,208 $354,845 $353,143 $356,966 $390,002 $401,871 Restructuring & Merger-Related Expense $0 ($1,977) ($646) ($3,831) ($6,400) ($1,815) ($175) $0 ($3,888) ($1,310) ($1,309) ($11,082) ($13,261) ($945) ($17,860) ($16,397) ($9,725) ($6,717) ($1,723) ($3,830) ($6,400) Non-Interest Expense (excluding restructuring & merger-related expense) $99,503 $99,206 $100,458 $386,171 $395,471 $147,833 $140,977 $140,295 $146,232 $159,688 $160,324 $182,841 $195,419 $219,915 $247,364 $295,811 $345,120 $346,426 $355,243 $386,172 $395,471 Non-Interest Expense to Total Assets 2.23% 2.17% 2.15% 2.20% 2.15% 2.77% 2.63% 2.53% 2.47% 2.62% 2.57% 2.29% 2.13% 2.25% 2.13% 1.99% 2.16% 2.09% 2.11% 2.20% 2.15% Non-Interest Expense (excluding restructuring & merger-related expense) to Total Assets 2.23% 2.13% 2.14% 2.18% 2.12% 2.74% 2.63% 2.53% 2.41% 2.60% 2.55% 2.16% 2.00% 2.24% 1.99% 1.88% 2.10% 2.05% 2.10% 2.18% 2.12% Net Interest Income (FTE-basis) $118,991 $122,338 $127,689 $486,343 $483,016 $165,916 $172,235 $175,885 $175,027 $192,556 $200,545 $246,014 $263,232 $300,790 $352,760 $405,222 $483,999 $462,229 $479,315 $486,343 $483,016 Non-Interest Income $30,074 $29,612 $36,388 $120,447 $127,983 $64,589 $59,599 $59,888 $64,775 $69,285 $68,504 $74,466 $81,499 $88,840 $100,276 $116,716 $128,185 $132,785 $117,391 $120,447 $127,983 Total Income $149,065 $151,950 $164,077 $606,790 $610,999 $230,505 $231,834 $235,773 $239,802 $261,841 $269,049 $320,480 $344,731 $389,630 $453,036 $521,938 $612,184 $595,014 $596,706 $606,790 $610,999 Efficiency Ratio 66.75% 65.29% 61.23% 63.64% 64.73% 64.13% 60.81% 59.50% 60.98% 60.99% 59.59% 57.05% 56.69% 56.44% 54.60% 56.68% 56.38% 58.22% 59.53% 63.64% 64.73% Three Months Ending Twelve Months Ending Twelve Months Ending 32 Non-Interest Expense to Total Assets and Efficiency Ratio Reconciliation Note: “non-interest expense to total assets” are annualized by utilizing the actual numbers of days in the quarter versus the year; “efficiency ratio” is non-interest expense excluding restructuring and merger-related expense divided by total income; FTE represents fully taxable equivalent; Old Line Bancshares merger closed November 2019; Farmers Capital Bank Corporation merger closed August 2018; First Sentry Bancshares merger closed April 2018; Your Community Bankshares merger closed September 2016; ESB Financial merger closed February 2015; Fidelity Bancorp merger closed November 2012; AmTrust 5 branch acquisition closed March 2009 ©2025 WesBanco, Inc. | All rights reserved
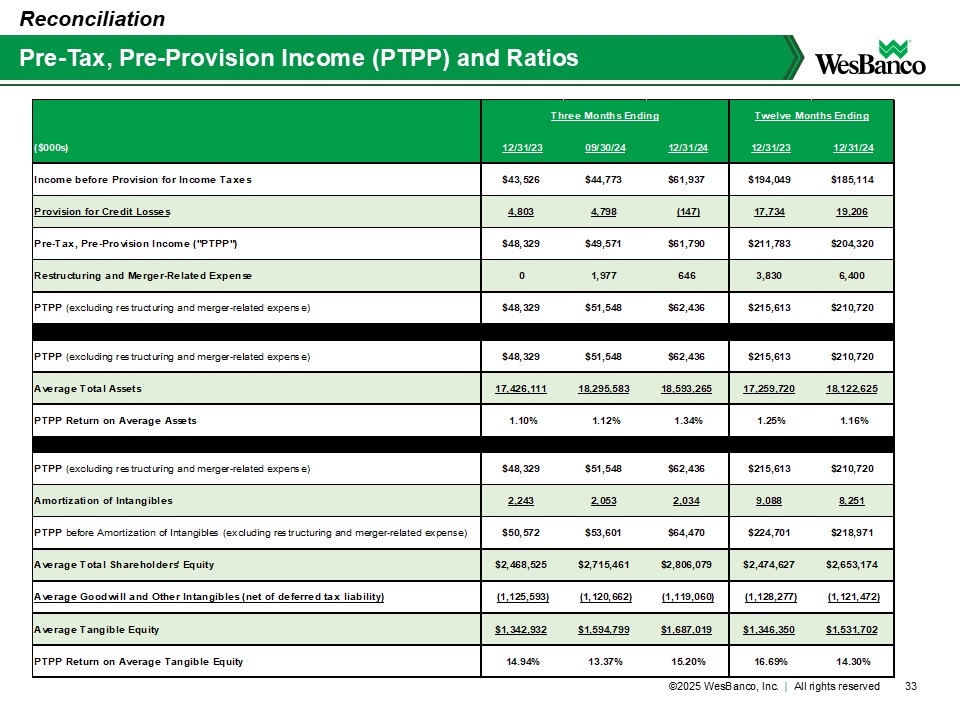
($000s) 12/31/23 09/30/24 12/31/24 12/31/23 12/31/24 Income before Provision for Income Taxes $43,526 $44,773 $61,937 $194,049 $185,114 Provision for Credit Losses 4,803 4,798 (147) 17,734 19,206 Pre-Tax, Pre-Provision Income ("PTPP") $48,329 $49,571 $61,790 $211,783 $204,320 Restructuring and Merger-Related Expense 0 1,977 646 3,830 6,400 PTPP (excluding restructuring and merger-related expense) $48,329 $51,548 $62,436 $215,613 $210,720 PTPP (excluding restructuring and merger-related expense) $48,329 $51,548 $62,436 $215,613 $210,720 Average Total Assets 17,426,111 18,295,583 18,593,265 17,259,720 18,122,625 PTPP Return on Average Assets 1.10% 1.12% 1.34% 1.25% 1.16% PTPP (excluding restructuring and merger-related expense) $48,329 $51,548 $62,436 $215,613 $210,720 Amortization of Intangibles 2,243 2,053 2,034 9,088 8,251 PTPP before Amortization of Intangibles (excluding restructuring and merger-related expense) $50,572 $53,601 $64,470 $224,701 $218,971 Average Total Shareholders' Equity $2,468,525 $2,715,461 $2,806,079 $2,474,627 $2,653,174 Average Goodwill and Other Intangibles (net of deferred tax liability) (1,125,593) (1,120,662) (1,119,060) (1,128,277) (1,121,472) Average Tangible Equity $1,342,932 $1,594,799 $1,687,019 $1,346,350 $1,531,702 PTPP Return on Average Tangible Equity 14.94% 13.37% 15.20% 16.69% 14.30% Three Months Ending Twelve Months Ending 33 Pre-Tax, Pre-Provision Income (PTPP) and Ratios Reconciliation ©2025 WesBanco, Inc. | All rights reserved
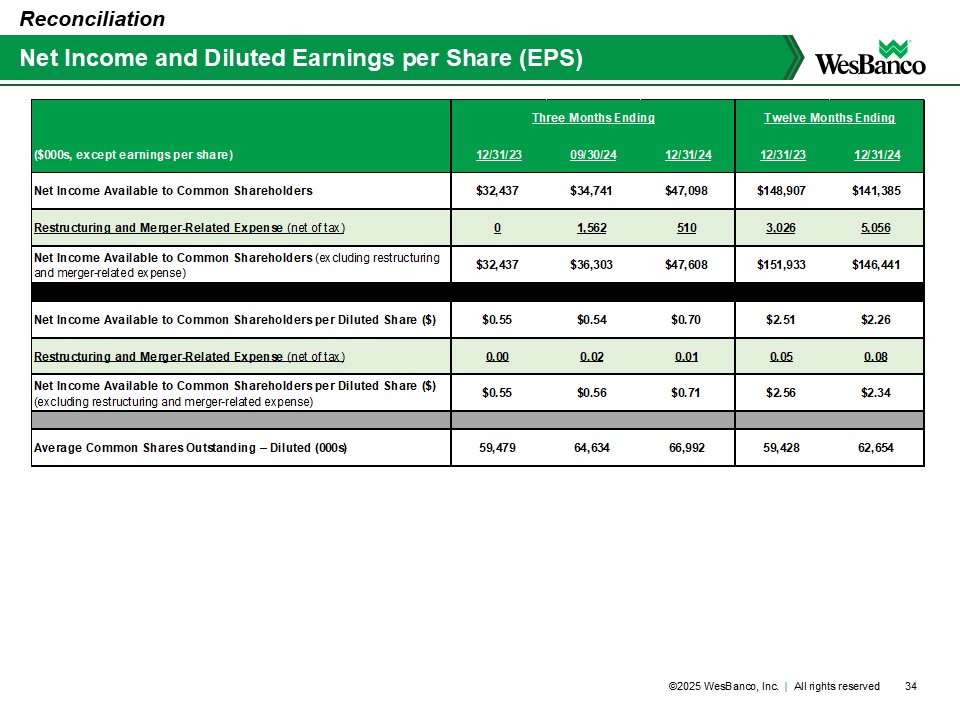
($000s, except earnings per share) 12/31/23 09/30/24 12/31/24 12/31/23 12/31/24 Net Income Available to Common Shareholders $32,437 $34,741 $47,098 $148,907 $141,385 Restructuring and Merger-Related Expense (net of tax) 0 1,562 510 3,026 5,056 Net Income Available to Common Shareholders (excluding restructuring and merger-related expense) $32,437 $36,303 $47,608 $151,933 $146,441 Net Income Available to Common Shareholders per Diluted Share ($) $0.55 $0.54 $0.70 $2.51 $2.26 Restructuring and Merger-Related Expense (net of tax) 0.00 0.02 0.01 0.05 0.08 Net Income Available to Common Shareholders per Diluted Share ($) (excluding restructuring and merger-related expense) $0.55 $0.56 $0.71 $2.56 $2.34 Average Common Shares Outstanding – Diluted (000s) 59,479 64,634 66,992 59,428 62,654 Three Months Ending Twelve Months Ending 34 Net Income and Diluted Earnings per Share (EPS) Reconciliation ©2025 WesBanco, Inc. | All rights reserved
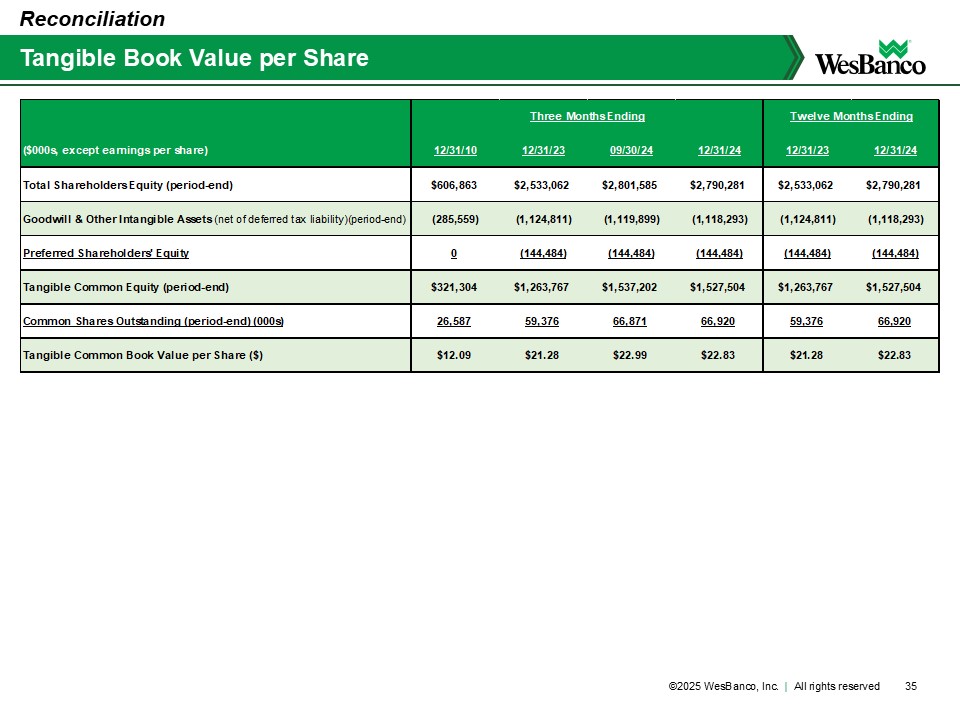
($000s, except earnings per share) 12/31/10 12/31/23 09/30/24 12/31/24 12/31/23 12/31/24 Total Shareholders Equity (period-end) $606,863 $2,533,062 $2,801,585 $2,790,281 $2,533,062 $2,790,281 Goodwill & Other Intangible Assets (net of deferred tax liability)(period-end) (285,559) (1,124,811) (1,119,899) (1,118,293) (1,124,811) (1,118,293) Preferred Shareholders' Equity 0 (144,484) (144,484) (144,484) (144,484) (144,484) Tangible Common Equity (period-end) $321,304 $1,263,767 $1,537,202 $1,527,504 $1,263,767 $1,527,504 Common Shares Outstanding (period-end) (000s) 26,587 59,376 66,871 66,920 59,376 66,920 Tangible Common Book Value per Share ($) $12.09 $21.28 $22.99 $22.83 $21.28 $22.83 Three Months Ending Twelve Months Ending 35 Tangible Book Value per Share Reconciliation ©2025 WesBanco, Inc. | All rights reserved
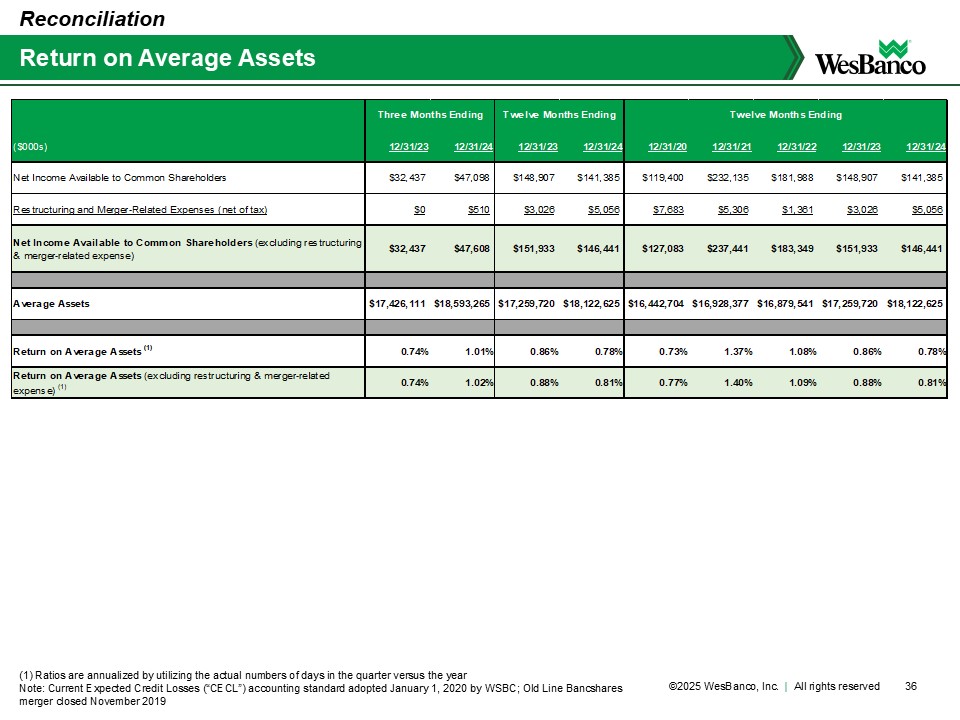
36 Return on Average Assets (1) Ratios are annualized by utilizing the actual numbers of days in the quarter versus the year Note: Current Expected Credit Losses (“CECL”) accounting standard adopted January 1, 2020 by WSBC; Old Line Bancshares merger closed November 2019 Reconciliation ($000s) 12/31/23 12/31/24 12/31/23 12/31/24 12/31/20 12/31/21 12/31/22 12/31/23 12/31/24 Net Income Available to Common Shareholders $32,437 $47,098 $148,907 $141,385 $119,400 $232,135 $181,988 $148,907 $141,385 Restructuring and Merger-Related Expenses (net of tax) $0 $510 $3,026 $5,056 $7,683 $5,306 $1,361 $3,026 $5,056 Net Income Available to Common Shareholders (excluding restructuring & merger-related expense) $32,437 $47,608 $151,933 $146,441 $127,083 $237,441 $183,349 $151,933 $146,441 Average Assets $17,426,111 $18,593,265 $17,259,720 $18,122,625 $16,442,704 $16,928,377 $16,879,541 $17,259,720 $18,122,625 Return on Average Assets (1) 0.74% 1.01% 0.86% 0.78% 0.73% 1.37% 1.08% 0.86% 0.78% Return on Average Assets (excluding restructuring & merger-related expense) (1) 0.74% 1.02% 0.88% 0.81% 0.77% 1.40% 1.09% 0.88% 0.81% Three Months Ending Twelve Months Ending Twelve Months Ending ©2025 WesBanco, Inc. | All rights reserved
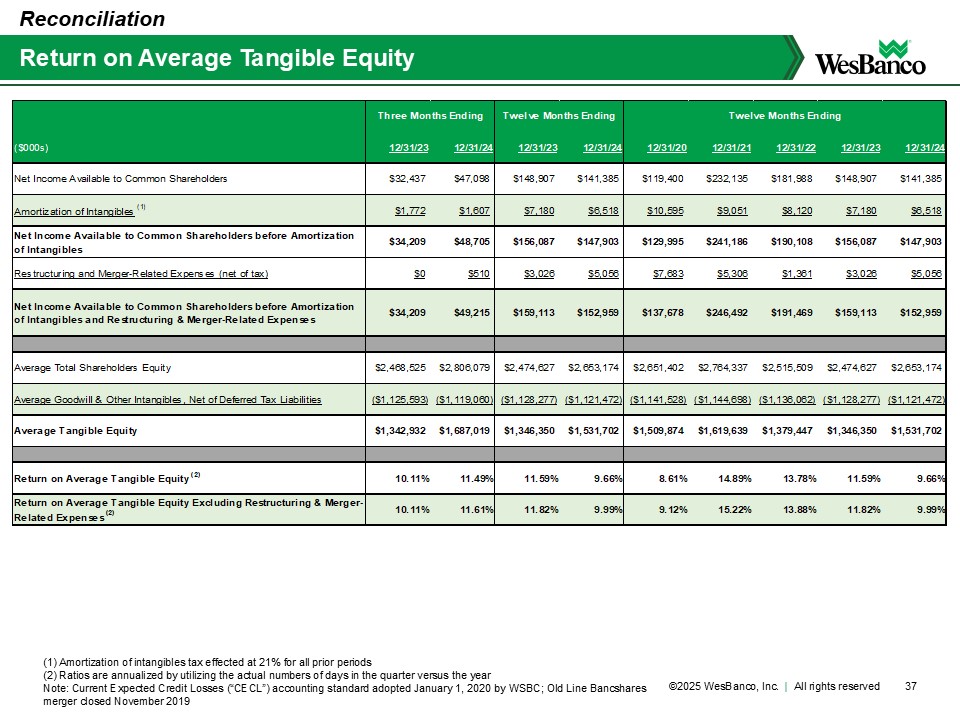
($000s) 12/31/23 12/31/24 12/31/23 12/31/24 12/31/20 12/31/21 12/31/22 12/31/23 12/31/24 Net Income Available to Common Shareholders $32,437 $47,098 $148,907 $141,385 $119,400 $232,135 $181,988 $148,907 $141,385 Amortization of Intangibles (1) $1,772 $1,607 $7,180 $6,518 $10,595 $9,051 $8,120 $7,180 $6,518 Net Income Available to Common Shareholders before Amortization of Intangibles $34,209 $48,705 $156,087 $147,903 $129,995 $241,186 $190,108 $156,087 $147,903 Restructuring and Merger-Related Expenses (net of tax) $0 $510 $3,026 $5,056 $7,683 $5,306 $1,361 $3,026 $5,056 Net Income Available to Common Shareholders before Amortization of Intangibles and Restructuring & Merger-Related Expenses $34,209 $49,215 $159,113 $152,959 $137,678 $246,492 $191,469 $159,113 $152,959 Average Total Shareholders Equity $2,468,525 $2,806,079 $2,474,627 $2,653,174 $2,651,402 $2,764,337 $2,515,509 $2,474,627 $2,653,174 Average Goodwill & Other Intangibles, Net of Deferred Tax Liabilities ($1,125,593) ($1,119,060) ($1,128,277) ($1,121,472) ($1,141,528) ($1,144,698) ($1,136,062) ($1,128,277) ($1,121,472) Average Tangible Equity $1,342,932 $1,687,019 $1,346,350 $1,531,702 $1,509,874 $1,619,639 $1,379,447 $1,346,350 $1,531,702 Return on Average Tangible Equity (2) 10.11% 11.49% 11.59% 9.66% 8.61% 14.89% 13.78% 11.59% 9.66% Return on Average Tangible Equity Excluding Restructuring & Merger- Related Expenses (2) 10.11% 11.61% 11.82% 9.99% 9.12% 15.22% 13.88% 11.82% 9.99% Three Months Ending Twelve Months Ending Twelve Months Ending 37 Return on Average Tangible Equity Reconciliation (1) Amortization of intangibles tax effected at 21% for all prior periods (2) Ratios are annualized by utilizing the actual numbers of days in the quarter versus the year Note: Current Expected Credit Losses (“CECL”) accounting standard adopted January 1, 2020 by WSBC; Old Line Bancshares merger closed November 2019 ©2025 WesBanco, Inc. | All rights reserved
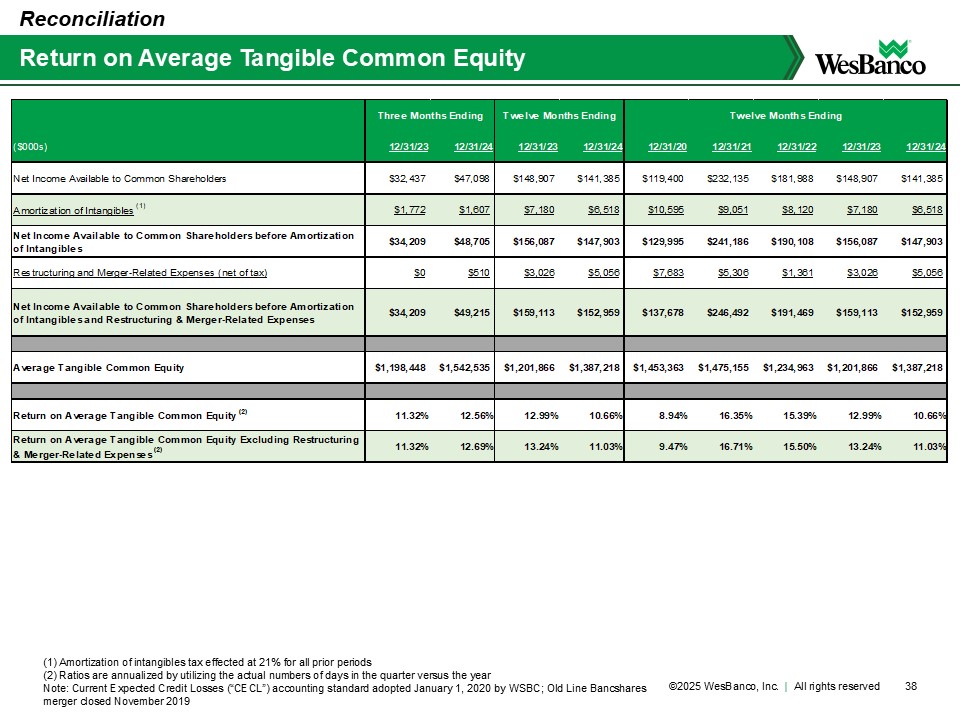
38 Return on Average Tangible Common Equity Reconciliation (1) Amortization of intangibles tax effected at 21% for all prior periods (2) Ratios are annualized by utilizing the actual numbers of days in the quarter versus the year Note: Current Expected Credit Losses (“CECL”) accounting standard adopted January 1, 2020 by WSBC; Old Line Bancshares merger closed November 2019 ($000s) 12/31/23 12/31/24 12/31/23 12/31/24 12/31/20 12/31/21 12/31/22 12/31/23 12/31/24 Net Income Available to Common Shareholders $32,437 $47,098 $148,907 $141,385 $119,400 $232,135 $181,988 $148,907 $141,385 Amortization of Intangibles (1) $1,772 $1,607 $7,180 $6,518 $10,595 $9,051 $8,120 $7,180 $6,518 Net Income Available to Common Shareholders before Amortization of Intangibles $34,209 $48,705 $156,087 $147,903 $129,995 $241,186 $190,108 $156,087 $147,903 Restructuring and Merger-Related Expenses (net of tax) $0 $510 $3,026 $5,056 $7,683 $5,306 $1,361 $3,026 $5,056 Net Income Available to Common Shareholders before Amortization of Intangibles and Restructuring & Merger-Related Expenses $34,209 $49,215 $159,113 $152,959 $137,678 $246,492 $191,469 $159,113 $152,959 Average Tangible Common Equity $1,198,448 $1,542,535 $1,201,866 $1,387,218 $1,453,363 $1,475,155 $1,234,963 $1,201,866 $1,387,218 Return on Average Tangible Common Equity (2) 11.32% 12.56% 12.99% 10.66% 8.94% 16.35% 15.39% 12.99% 10.66% Return on Average Tangible Common Equity Excluding Restructuring & Merger-Related Expenses (2) 11.32% 12.69% 13.24% 11.03% 9.47% 16.71% 15.50% 13.24% 11.03% Three Months Ending Twelve Months Ending Twelve Months Ending ©2025 WesBanco, Inc. | All rights reserved
Appendix for Proposed Acquisition of Premier Financial Corp. NOTE: slides in this section are directly from the presentation filed in conjunction with the acquisition announcement on July 26, 2024 – for additional information, please see the associated Form 8-K filing at https://investor.wesbanco.com/company-financials/sec-filings/ ©2025 WesBanco, Inc. | All rights reserved
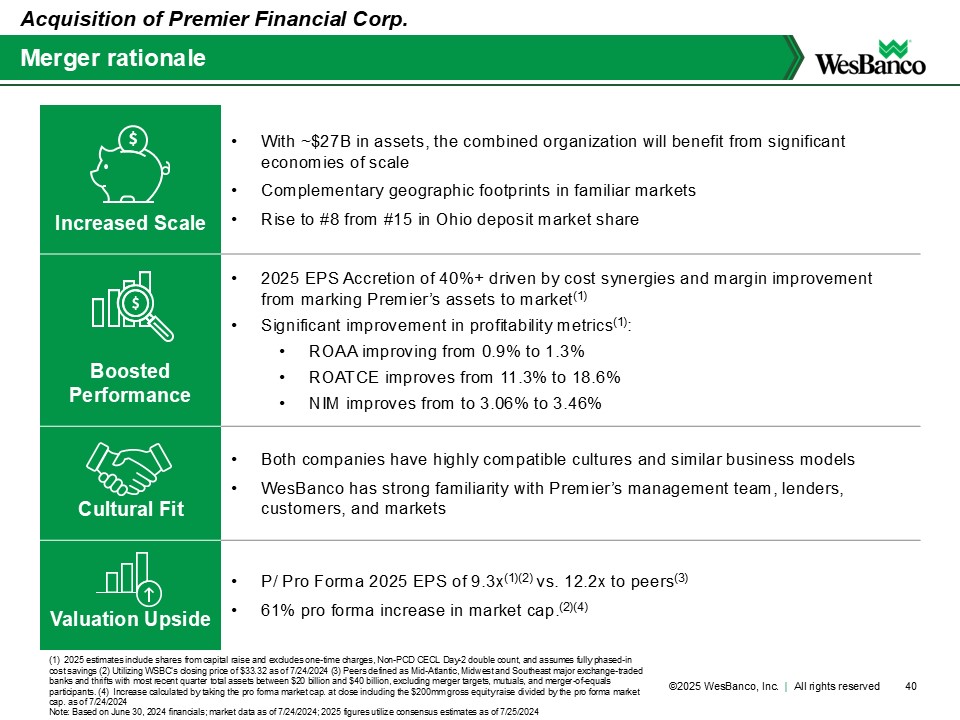
Increased Scale • With ~$27B in assets, the combined organization will benefit from significant economies of scale • Complementary geographic footprints in familiar markets • Rise to #8 from #15 in Ohio deposit market share Boosted Performance • 2025 EPS Accretion of 40%+ driven by cost synergies and margin improvement from marking Premier’s assets to market(1) • Significant improvement in profitability metrics(1): • ROAA improving from 0.9% to 1.3% • ROATCE improves from 11.3% to 18.6% • NIM improves from to 3.06% to 3.46% Cultural Fit • Both companies have highly compatible cultures and similar business models • WesBanco has strong familiarity with Premier’s management team, lenders, customers, and markets Valuation Upside • P/ Pro Forma 2025 EPS of 9.3x(1)(2)vs. 12.2x to peers(3) • 61% pro forma increase in market cap.(2)(4) Merger rationale Acquisition of Premier Financial Corp. 40 (1) 2025 estimates include shares from capital raise and excludes one-time charges, Non-PCD CECL Day-2 double count, and assumes fully phased-in cost savings (2) Utilizing WSBC’s closing price of $33.32 as of 7/24/2024 (3) Peers defined as Mid-Atlantic, Midwest and Southeast major exchange-traded banks and thrifts with most recent quarter total assets between $20 billion and $40 billion, excluding merger targets, mutuals, and merger-of-equals participants. (4) Increase calculated by taking the pro forma market cap. at close including the $200mm gross equity raise divided by the pro forma market cap. as of 7/24/2024 Note: Based on June 30, 2024 financials; market data as of 7/24/2024; 2025 figures utilize consensus estimates as of 7/25/2024 ©2025 WesBanco, Inc. | All rights reserved
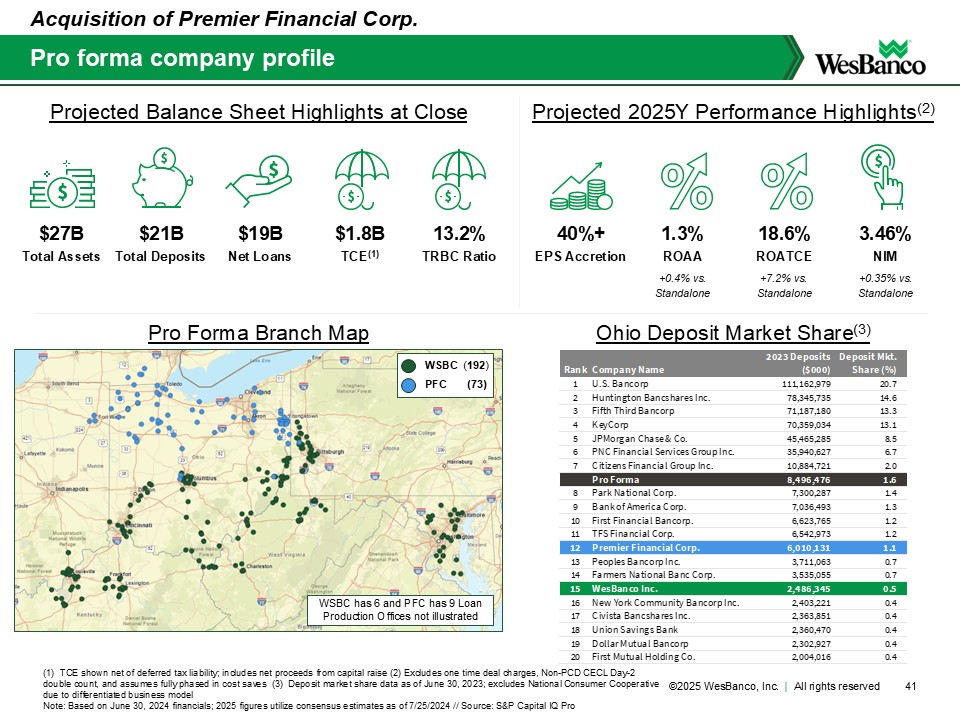
Pro forma company profile 41 (1) TCE shown net of deferred tax liability; includes net proceeds from capital raise (2) Excludes one time deal charges, Non-PCD CECL Day-2 double count, and assumes fully phased in cost saves (3) Deposit market share data as of June 30, 2023; excludes National Consumer Cooperative due to differentiated business model Note: Based on June 30, 2024 financials; 2025 figures utilize consensus estimates as of 7/25/2024 // Source: S&P Capital IQ Pro Acquisition of Premier Financial Corp. Pro Forma Branch Map +0.4% vs. Standalone +7.2% vs. Standalone +0.35% vs. Standalone Projected Balance Sheet Highlights at Close Projected 2025Y Performance Highlights(2) $27B Total Assets $21B Total Deposits $19B Net Loans 13.2% TRBC Ratio 40%+ EPS Accretion 1.3% ROAA 2023 Deposits Deposit Mkt. Rank Company Name ($000) Share (%) 1 U.S. Bancorp 111,162,979 20.7 2 Huntington Bancshares Inc. 78,345,735 14.6 3 Fifth Third Bancorp 71,187,180 13.3 4 KeyCorp 70,359,034 13.1 5 JPMorgan Chase & Co. 45,465,285 8.5 6 PNC Financial Services Group Inc. 35,940,627 6.7 7 Citizens Financial Group Inc. 10,884,721 2.0 Pro Forma 8,496,476 1.6 8 Park National Corp. 7,300,287 1.4 9 Bank of America Corp. 7,036,493 1.3 10 First Financial Bancorp. 6,623,765 1.2 11 TFS Financial Corp. 6,542,973 1.2 12 Premier Financial Corp. 6,010,131 1.1 13 Peoples Bancorp Inc. 3,711,063 0.7 14 Farmers National Banc Corp. 3,535,055 0.7 15 WesBanco Inc. 2,486,345 0.5 16 New York Community Bancorp Inc. 2,403,221 0.4 17 Civista Bancshares Inc. 2,363,851 0.4 18 Union Savings Bank 2,360,470 0.4 19 Dollar Mutual Bancorp 2,302,927 0.4 20 First Mutual Holding Co. 2,004,016 0.4 18.6% ROATCE 3.46% NIM $1.8B TCE(1) Ohio Deposit Market Share(3) WSBC (192) PFC (73) WSBC has 6 and PFC has 9 Loan Production Offices not illustrated ©2025 WesBanco, Inc. | All rights reserved
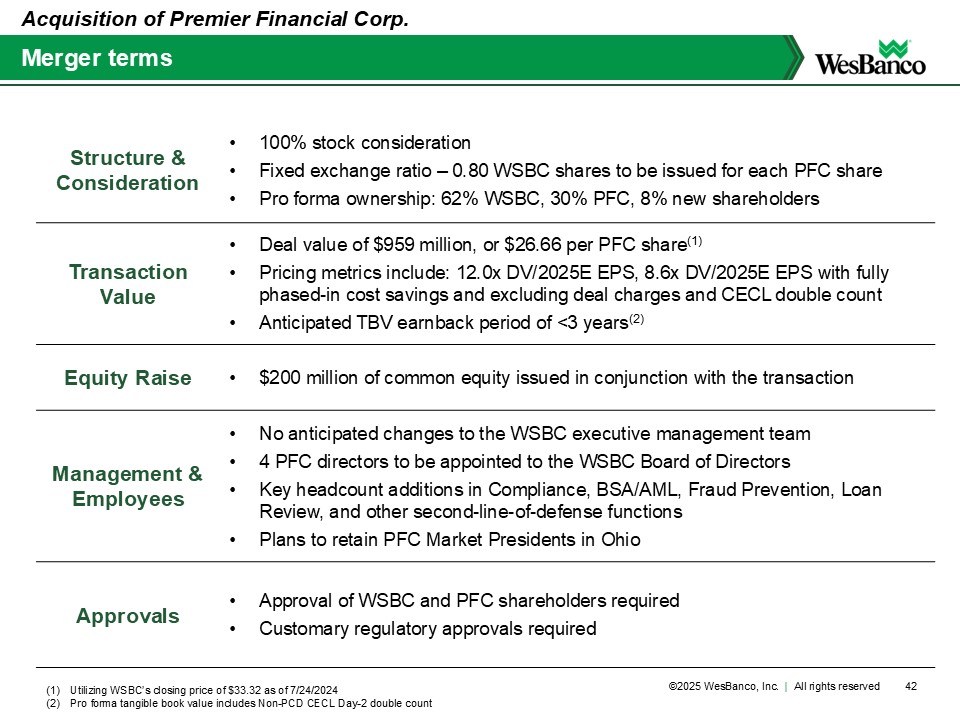
Structure & Consideration • 100% stock consideration • Fixed exchange ratio – 0.80 WSBC shares to be issued for each PFC share • Pro forma ownership: 62% WSBC, 30% PFC, 8% new shareholders Transaction Value • Deal value of $959 million, or $26.66 per PFC share(1) • Pricing metrics include: 12.0x DV/2025E EPS, 8.6x DV/2025E EPS with fully phased-in cost savings and excluding deal charges and CECL double count • Anticipated TBV earnback period of <3 years(2) Equity Raise • $200 million of common equity issued in conjunction with the transaction Management & Employees • No anticipated changes to the WSBC executive management team • 4 PFC directors to be appointed to the WSBC Board of Directors • Key headcount additions in Compliance, BSA/AML, Fraud Prevention, Loan Review, and other second-line-of-defense functions • Plans to retain PFC Market Presidents in Ohio Approvals • Approval of WSBC and PFC shareholders required • Customary regulatory approvals required Merger terms Acquisition of Premier Financial Corp. 42 (1) Utilizing WSBC’s closing price of $33.32 as of 7/24/2024 (2) Pro forma tangible book value includes Non-PCD CECL Day-2 double count ©2025 WesBanco, Inc. | All rights reserved
• Successfully raised $200 million of common equity prior to the announcement of the Premier Financial Corp. acquisition in order to support the pro-forma bank’s balance sheet and regulatory ratios • Equity raised from 10 institutional investors, with a blend of existing and new shareholders • Anchor investment of $125 million by Wellington Management ▪ Additional investment made by Glendon Capital Management LP and Klaros Capital • Adds long-term support to WesBanco’s shareholder base, as well as providing additional liquidity • Common equity raise closed on August 1, 2024 • Proceeds were used to pay-down Federal Home Loan Bank borrowings 43 Successful common equity raise Acquisition of Premier Financial Corp. Note: this slide is supplemental and was not part of the 7/26/2024 presentation filed in conjunction with the acquisition announcement ©2025 WesBanco, Inc. | All rights reserved
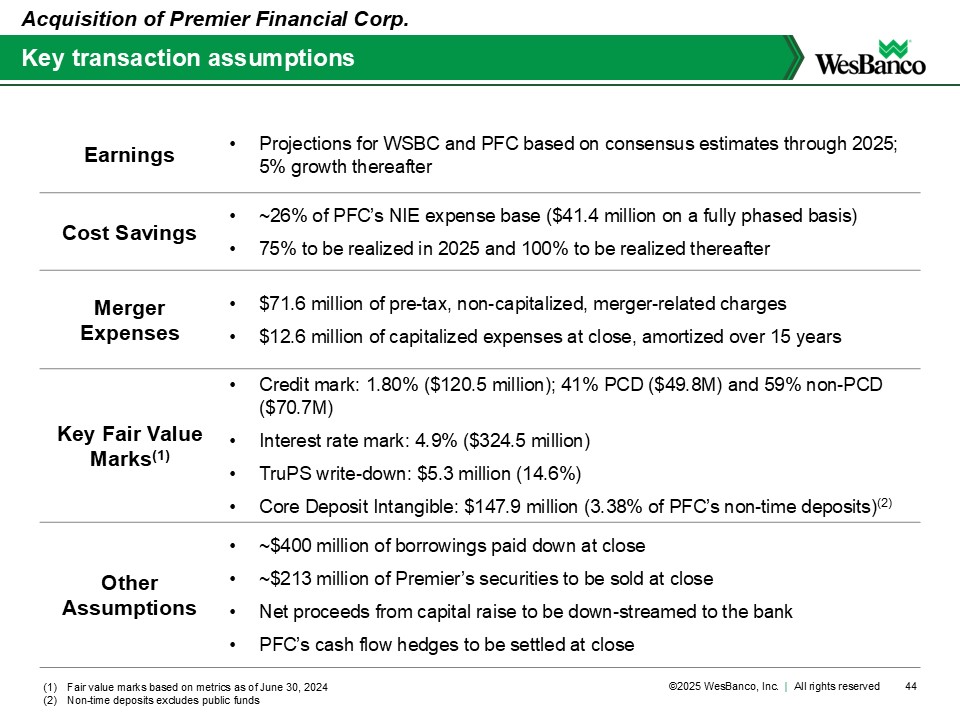
Earnings • Projections for WSBC and PFC based on consensus estimates through 2025; 5% growth thereafter Cost Savings • ~26% of PFC’s NIE expense base ($41.4 million on a fully phased basis) • 75% to be realized in 2025 and 100% to be realized thereafter Merger Expenses • $71.6 million of pre-tax, non-capitalized, merger-related charges • $12.6 million of capitalized expenses at close, amortized over 15 years Key Fair Value Marks(1) • Credit mark: 1.80% ($120.5 million); 41% PCD ($49.8M) and 59% non-PCD ($70.7M) • Interest rate mark: 4.9% ($324.5 million) • TruPS write-down: $5.3 million (14.6%) • Core Deposit Intangible: $147.9 million (3.38% of PFC’s non-time deposits)(2) Other Assumptions • ~$400 million of borrowings paid down at close • ~$213 million of Premier’s securities to be sold at close • Net proceeds from capital raise to be down-streamed to the bank • PFC’s cash flow hedges to be settled at close Key transaction assumptions Acquisition of Premier Financial Corp. 44 (1) Fair value marks based on metrics as of June 30, 2024 (2) Non-time deposits excludes public funds ©2025 WesBanco, Inc. | All rights reserved
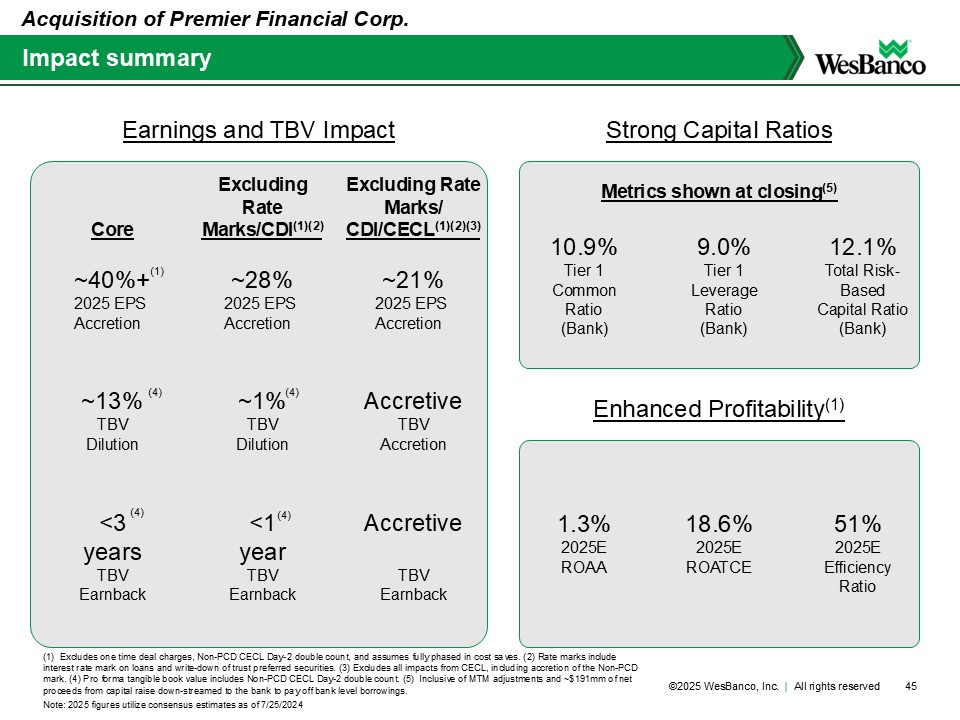
Impact summary Acquisition of Premier Financial Corp. 45 (1) Excludes one time deal charges, Non-PCD CECL Day-2 double count, and assumes fully phased in cost saves. (2) Rate marks include interest rate mark on loans and write-down of trust preferred securities. (3) Excludes all impacts from CECL, including accretion of the Non-PCD mark. (4) Pro forma tangible book value includes Non-PCD CECL Day-2 double count. (5) Inclusive of MTM adjustments and ~$191mm of net proceeds from capital raise down-streamed to the bank to pay off bank level borrowings. Note: 2025 figures utilize consensus estimates as of 7/25/2024 Earnings and TBV Impact Strong Capital Ratios Enhanced Profitability(1) Core Excluding Rate Marks/CDI(1)(2) Excluding Rate Marks/ CDI/CECL(1)(2)(3) ~40%+ 2025 EPS Accretion ~28% 2025 EPS Accretion ~21% 2025 EPS Accretion ~13% TBV Dilution Accretive TBV Accretion ~1% TBV Dilution <3 years TBV Earnback <1 year TBV Earnback Accretive TBV Earnback 10.9% Tier 1 Common Ratio (Bank) 12.1% Total Risk-Based Capital Ratio (Bank) 9.0% Tier 1 Leverage Ratio (Bank) 1.3% 2025E ROAA 18.6% 2025E ROATCE 51% 2025E Efficiency Ratio Metrics shown at closing(5) (1) (4) (4) (4) (4) ©2025 WesBanco, Inc. | All rights reserved
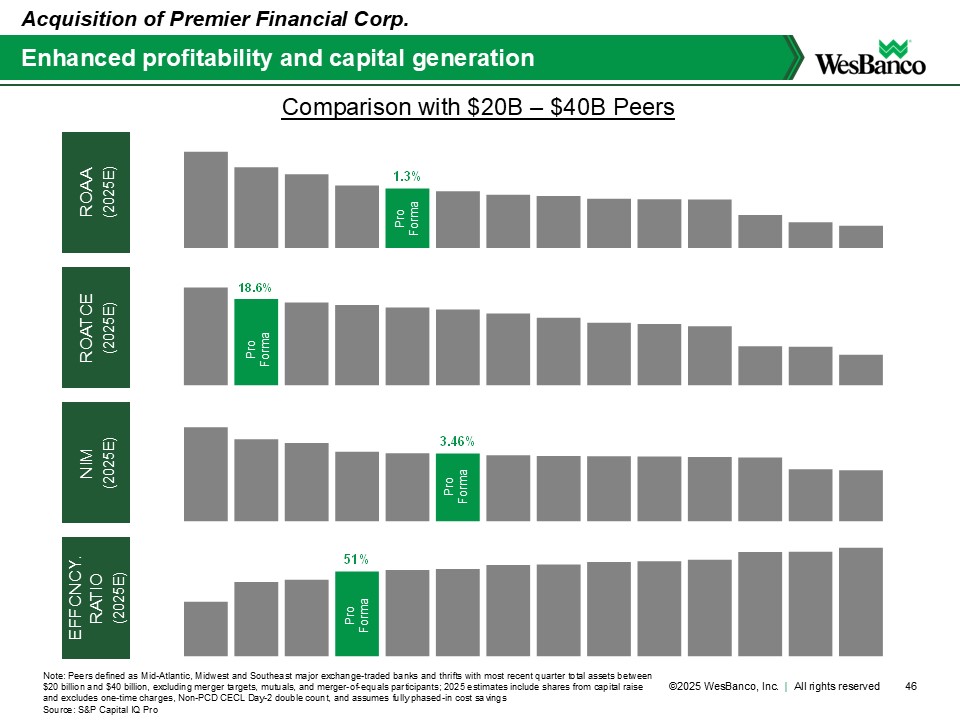
Enhanced profitability and capital generation Acquisition of Premier Financial Corp. 46 Note: Peers defined as Mid-Atlantic, Midwest and Southeast major exchange-traded banks and thrifts with most recent quarter total assets between $20 billion and $40 billion, excluding merger targets, mutuals, and merger-of-equals participants; 2025 estimates include shares from capital raise and excludes one-time charges, Non-PCD CECL Day-2 double count, and assumes fully phased-in cost savings Source: S&P Capital IQ Pro ROATCE (2025E) EFFCNCY. RATIO (2025E) ROAA (2025E) NIM (2025E) 3.46% 1.3% 18.6% 51% Pro Forma Pro Forma Pro Forma Pro Forma Comparison with $20B – $40B Peers ©2025 WesBanco, Inc. | All rights reserved
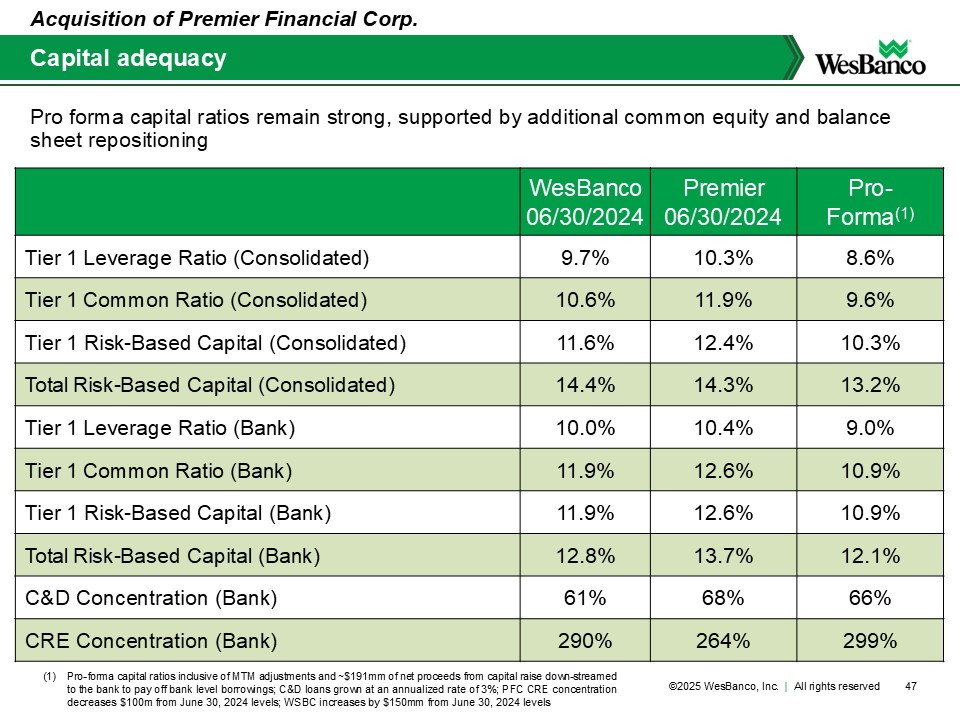
WesBanco 06/30/2024 Premier 06/30/2024 Pro- Forma(1) Tier 1 Leverage Ratio (Consolidated) 9.7% 10.3% 8.6% Tier1CommonRatio (Consolidated) 10.6% 11.9% 9.6% Tier1Risk-BasedCapital (Consolidated) 11.6% 12.4% 10.3% TotalRisk-BasedCapital (Consolidated) 14.4% 14.3% 13.2% Tier1LeverageRatio (Bank) 10.0% 10.4% 9.0% Tier1CommonRatio (Bank) 11.9% 12.6% 10.9% Tier1Risk-BasedCapital (Bank) 11.9% 12.6% 10.9% TotalRisk-BasedCapital (Bank) 12.8% 13.7% 12.1% C&D Concentration (Bank) 61% 68% 66% CRE Concentration (Bank) 290% 264% 299% Pro forma capital ratios remain strong, supported by additional common equity and balance sheet repositioning Acquisition of Premier Financial Corp. 47 Capital adequacy (1) Pro-forma capital ratios inclusive of MTM adjustments and ~$191mm of net proceeds from capital raise down-streamed to the bank to pay off bank level borrowings; C&D loans grown at an annualized rate of 3%; PFC CRE concentration decreases $100m from June 30, 2024 levels; WSBC increases by $150mm from June 30, 2024 levels ©2025 WesBanco, Inc. | All rights reserved
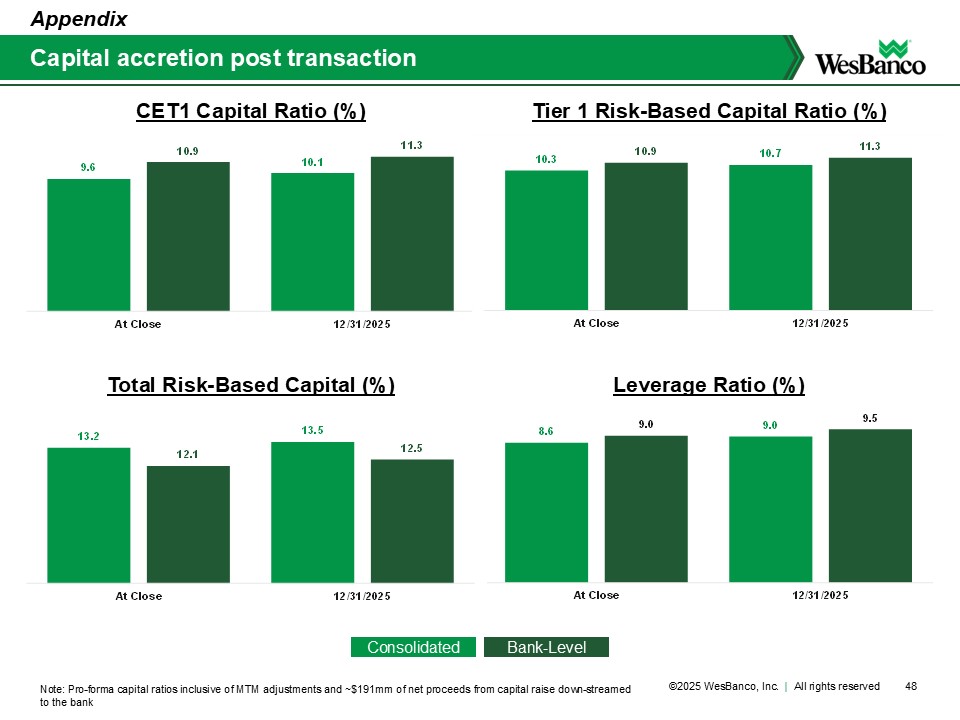
Capital accretion post transaction Appendix 48 CET1 Capital Ratio (%) Total Risk-Based Capital (%) Leverage Ratio (%) Tier 1 Risk-Based Capital Ratio (%) 9.6 10.1 10.9 11.3 At Close 12/31/2025 8.6 9.0 9.0 9.5 At Close 12/31/2025 13.2 13.5 12.1 12.5 At Close 12/31/2025 10.3 10.7 10.9 11.3 At Close 12/31/2025 Note: Pro-forma capital ratios inclusive of MTM adjustments and ~$191mm of net proceeds from capital raise down-streamed to the bank Consolidated Bank-Level ©2025 WesBanco, Inc. | All rights reserved
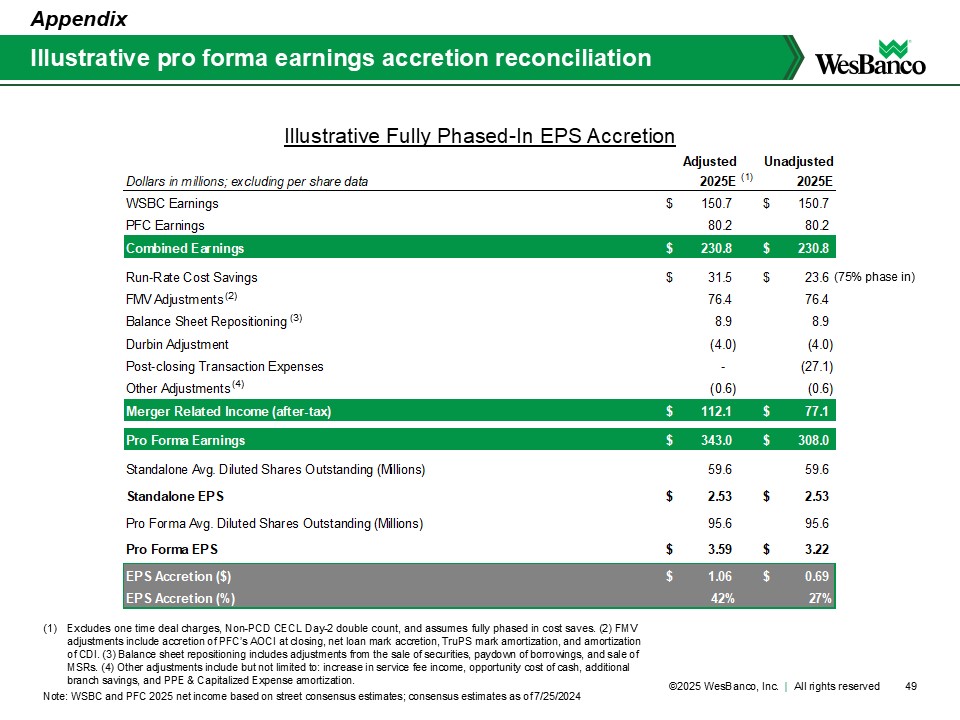
Illustrative pro forma earnings accretion reconciliation Illustrative Fully Phased-In EPS Accretion Appendix 49 Adjusted Unadjusted Dollars in millions; excluding per share data 2025E(1) 2025E WSBC Earnings $ 1 50.7 $ 1 50.7 PFC Earnings 8 0.2 8 0.2 Combined Earnings $ 2 30.8 $ 2 30.8 Run-Rate Cost Savings $ 3 1.5 $ 2 3.6 FMV Adjustments 7 6.4 7 6.4 Balance Sheet Repositioning 8 .9 8 .9 Durbin Adjustment (4 .0) (4 .0) Post-closing Transaction Expenses - (2 7.1) Other Adjustments (0 .6) (0 .6) Merger Related Income (after-tax) $ 1 12.1 $ 7 7.1 Pro Forma Earnings $ 3 43.0 $ 3 08.0 Standalone Avg. Diluted Shares Outstanding (Millions) 59.6 59.6 Standalone EPS $ 2 .53 $ 2 .53 Pro Forma Avg. Diluted Shares Outstanding (Millions) 95.6 95.6 Pro Forma EPS $ 3 .59 $ 3 .22 EPS Accretion ($) $ 1 .06 $ 0 .69 EPS Accretion (%) 42% 27% (1) Excludes one time deal charges, Non-PCD CECL Day-2 double count, and assumes fully phased in cost saves. (2) FMV adjustments include accretion of PFC’s AOCI at closing, net loan mark accretion, TruPS mark amortization, and amortization of CDI. (3) Balance sheet repositioning includes adjustments from the sale of securities, paydown of borrowings, and sale of MSRs. (4) Other adjustments include but not limited to: increase in service fee income, opportunity cost of cash, additional branch savings, and PPE & Capitalized Expense amortization. Note: WSBC and PFC 2025 net income based on street consensus estimates; consensus estimates as of 7/25/2024 (2) (3) (4) (75% phase in) ©2025 WesBanco, Inc. | All rights reserved
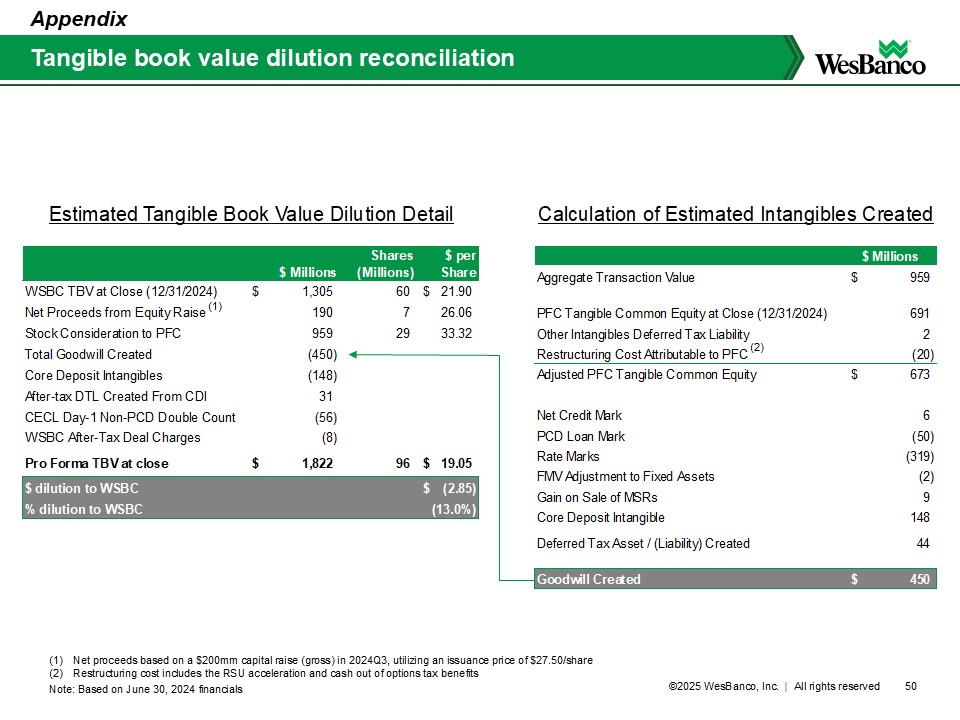
Shares $ per $ Millions (Millions) Share WSBC TBV at Close (12/31/2024) $ 1 ,305 60 $ 2 1.90 Net Proceeds from Equity Raise 190 7 26.06 Stock Consideration to PFC 959 29 33.32 Total Goodwill Created (4 50) Core Deposit Intangibles (1 48) After-tax DTL Created From CDI 31 CECL Day-1 Non-PCD Double Count (5 6) WSBC After-Tax Deal Charges (8 ) Pro Forma TBV at close $ 1 ,822 96 $ 1 9.05 $ dilution to WSBC $ (2 .85) % dilution to WSBC (13.0%) $ Millions Aggregate Transaction Value $ 959 PFC Tangible Common Equity at Close (12/31/2024) 691 Other Intangibles Deferred Tax Liability 2 Restructuring Cost Attributable to PFC (2 0) Adjusted PFC Tangible Common Equity $ 673 Net Credit Mark 6 PCD Loan Mark (5 0) Rate Marks (3 19) FMV Adjustment to Fixed Assets (2 ) Gain on Sale of MSRs 9 Core Deposit Intangible 148 Deferred Tax Asset / (Liability) Created 44 Goodwill Created $ 450 Tangible book value dilution reconciliation Appendix 50 Estimated Tangible Book Value Dilution Detail Calculation of Estimated Intangibles Created (1) Net proceeds based on a $200mm capital raise (gross) in 2024Q3, utilizing an issuance price of $27.50/share (2) Restructuring cost includes the RSU acceleration and cash out of options tax benefits Note: Based on June 30, 2024 financials (1) (2) ©2025 WesBanco, Inc. | All rights reserved
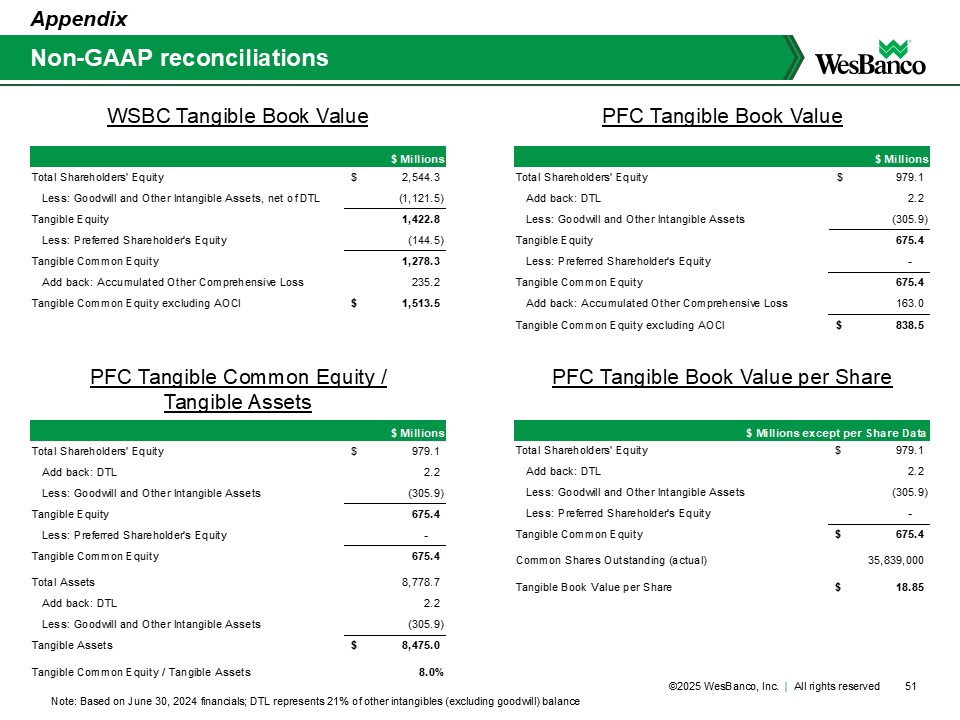
Non-GAAP reconciliations Appendix 51 WSBC Tangible Book Value $ Millions Total Shareholders' Equity $ 2 ,544.3 Less: Goodwill and Other Intangible Assets, net of DTL (1,121.5) Tangible Equity 1,422.8 Less: Preferred Shareholder's Equity (144.5) Tangible Common Equity 1 ,278.3 Add back: Accumulated Other Comprehensive Loss 235.2 Tangible Common Equity excluding AOCI $ 1 ,513.5 PFC Tangible Book Value $ Millions Total Shareholders' Equity $ 9 79.1 Add back: DTL 2 .2 Less: Goodwill and Other Intangible Assets (305.9) Tangible Equity 675.4 Less: Preferred Shareholder's Equity - Tangible Common Equity 6 75.4 Add back: Accumulated Other Comprehensive Loss 163.0 Tangible Common Equity excluding AOCI $ 8 38.5 PFC Tangible Common Equity / Tangible Assets $ Millions Total Shareholders' Equity $ 979.1 Add back: DTL 2 .2 Less: Goodwill and Other Intangible Assets (305.9) Tangible Equity 675.4 Less: Preferred Shareholder's Equity - Tangible Common Equity 675.4 Total Assets 8,778.7 Add back: DTL 2 .2 Less: Goodwill and Other Intangible Assets (305.9) Tangible Assets $ 8 ,475.0 Tangible Common Equity / Tangible Assets 8.0% PFC Tangible Book Value per Share $ Millions except per Share Data Total Shareholders' Equity $ 979.1 Add back: DTL 2 .2 Less: Goodwill and Other Intangible Assets (305.9) Less: Preferred Shareholder's Equity - Tangible Common Equity $ 675.4 Common Shares Outstanding (actual) 35,839,000 Tangible Book Value per Share $ 18.85 Note: Based on June 30, 2024 financials; DTL represents 21% of other intangibles (excluding goodwill) balance