| FREE WRITING PROSPECTUS | ||
| FILED PURSUANT TO RULE 433 | ||
| REGISTRATION FILE NO.: 333-280224-01 | ||
| Dated October 9, 2024 | BMO 2024-5C7 |
| Structural and Collateral Term Sheet | |||||
BMO 2024-5C7 Mortgage Trust | |||||
$959,562,630 (Approximate Mortgage Pool Balance) | |||||
$[] (Approximate Offered Certificates) | |||||
BMO Commercial Mortgage Securities LLC Depositor | |||||
Commercial Mortgage Pass-Through Certificates, Series 2024-5C7 | |||||
Bank of Montreal German American Capital Corporation Starwood Mortgage Capital LLC Citi Real Estate Funding Inc. UBS AG Goldman Sachs Mortgage Company Societe Generale Financial Corporation Greystone Commercial Mortgage Capital LLC
Sponsors and Mortgage Loan Sellers
| |||||
| BMO Capital Markets | Citigroup | Goldman Sachs & Co. LLC | Société Générale | UBS Securities LLC | Deutsche Bank Securities |
| Co-Lead Managers and Joint Bookrunners | |||||
| Academy Securities Co-Manager | Bancroft Capital, LLC Co-Manager | Drexel Hamilton
| |||
| THE INFORMATION IN THIS COLLATERAL TERM SHEET IS NOT COMPLETE AND MAY BE AMENDED PRIOR TO THE TIME OF SALE. THIS TERM SHEET IS NOT AN OFFER TO SELL THESE SECURITIES AND IT IS NOT A SOLICITATION OF AN OFFER TO BUY THESE SECURITIES IN ANY JURISDICTION WHERE THE OFFER OR SALE IS NOT PERMITTED. | ||
| Dated October 9, 2024 | BMO 2024-5C7 |
This material is for your information, and none of BMO Capital Markets Corp., Deutsche Bank Securities Inc., Citigroup Global Markets Inc., Goldman Sachs & Co. LLC, SG Americas Securities, LLC, UBS Securities LLC, Academy Securities, Inc., Bancroft Capital, LLC and Drexel Hamilton, LLC (collectively, the “Underwriters”) are soliciting any action based upon it. This material is not to be construed as an offer to sell or the solicitation of any offer to buy any security in any jurisdiction where such an offer or solicitation would be illegal.
The depositor has filed a registration statement (including the prospectus) with the Securities and Exchange Commission (File No. 333-255934) for the offering to which this communication relates. Before you invest, you should read the prospectus in the registration statement and other documents the depositor has filed with the Securities and Exchange Commission for more complete information about the depositor, the issuing entity and this offering. You may get these documents for free by visiting EDGAR on the SEC website at www.sec.gov. Alternatively, the depositor or BMO Capital Markets Corp., any other underwriter, or any dealer participating in this offering will arrange to send you the prospectus if you request it by calling 1-888-200-0266. The Offered Certificates referred to in these materials, and the asset pool backing them, are subject to modification or revision (including the possibility that one or more Classes of Certificates may be split, combined or eliminated at any time prior to issuance or availability of a final prospectus) and are offered on a “when, as and if issued” basis. You understand that, when you are considering the purchase of these Certificates, a contract of sale will come into being no sooner than the date on which the relevant Class has been priced and we have verified the allocation of Certificates to be made to you; any “indications of interest” expressed by you, and any “soft circles” generated by us, will not create binding contractual obligations for you or us.
Neither this document nor anything contained in this document shall form the basis for any contract or commitment whatsoever. The information contained in this document is preliminary as of the date of this document, supersedes any previous such information delivered to you and will be superseded by any such information subsequently delivered prior to the time of sale. These materials are subject to change, completion or amendment from time to time. The information should be reviewed only in conjunction with the entire offering document relating to the Commercial Mortgage Pass-Through Certificates, Series 2024-5C7 (the “Offering Document”). All of the information contained herein is subject to the same limitations and qualifications contained in the Offering Document. The information contained herein does not contain all relevant information relating to the underlying mortgage loans or mortgaged properties. Such information is described elsewhere in the Offering Document. The information contained herein will be more fully described elsewhere in the Offering Document. The information contained herein should not be viewed as projections, forecasts, predictions or opinions with respect to value. Prior to making any investment decision, prospective investors are strongly urged to read the Offering Document its entirety. Neither the Securities and Exchange Commission nor any state securities commission has approved or disapproved of these securities or determined if this free writing prospectus is truthful or complete. Any representation to the contrary is a criminal offense.
This document has been prepared by the Underwriters for information purposes only and does not constitute, in whole or in part, a prospectus for the purposes of Regulation (EU) 2017/1129 (as amended or superseded) and/or Part VI of the Financial Services and Markets Act 2000 (as amended) or other offering document.
The attached information contains certain tables and other statistical analyses (the “Computational Materials”) which have been prepared in reliance upon information furnished by the Mortgage Loan Sellers. Numerous assumptions were used in preparing the Computational Materials, which may or may not be reflected herein. As such, no assurance can be given as to the Computational Materials’ accuracy, appropriateness or completeness in any particular context; or as to whether the Computational Materials and/or the assumptions upon which they are based reflect present market conditions or future market performance. The Computational Materials should not be construed as either projections or predictions or as legal, tax, financial or accounting advice. You should consult your own counsel, accountant and other advisors as to the legal, tax, business, financial and related aspects of a purchase of these Certificates. Any weighted average lives, yields and principal payment periods shown in the Computational Materials are based on prepayment and/or loss assumptions, and changes in such prepayment and/or loss assumptions may dramatically affect such weighted average lives, yields and principal payment periods. In addition, it is possible that prepayments or losses on the underlying assets will occur at rates higher or lower than the rates shown in the attached Computational Materials. The specific characteristics of the Certificates may differ from those shown in the Computational Materials due to differences between the final underlying assets and the preliminary underlying assets used in preparing the Computational Materials. The principal amount and designation of any security described in the Computational Materials are subject to change prior to issuance. None of the Underwriters or any of their respective affiliates make any representation or warranty as to the actual rate or timing of payments or losses on any of the underlying assets or the payments or yield on the Certificates. The information in this presentation is based upon management forecasts and reflects prevailing conditions and management’s views as of this date, all of which are subject to change. In preparing this presentation, we have relied upon and assumed, without independent verification, the accuracy and completeness of all information available from public sources or which was provided to us by or on behalf of the Mortgage Loan Sellers or which was otherwise reviewed by us.
This document contains forward-looking statements. If and when included in this document, the words “expects”, “intends”, “anticipates”, “estimates” and analogous expressions and all statements that are not historical facts, including statements about our beliefs or expectations, are intended to identify forward-looking statements. Any forward-looking statements are made subject to risks and uncertainties which could cause actual results to differ materially from those stated. Those risks and uncertainties include, among other things, declines in general economic and business conditions, increased competition, changes in demographics, changes in political and social conditions, regulatory initiatives and changes in consumer preferences, many of which are beyond our control and the control of any other person or entity related to this offering. The forward-looking statements made in this document are made as of the date hereof. We have no obligation to update or revise any forward-looking statement.
BMO Capital Markets is a trade name used by BMO Financial Group for the wholesale banking businesses of Bank of Montreal, BMO Harris Bank N.A. (member FDIC), Bank of Montreal Europe p.l.c, and Bank of Montreal (China) Co. Ltd, the institutional broker dealer business of BMO Capital Markets Corp. (Member FINRA and SIPC) and the agency broker dealer business of Clearpool Execution Services, LLC (Member FINRA and SIPC) in the U.S., and the institutional broker dealer businesses of BMO Nesbitt Burns Inc. (Member Investment Industry Regulatory Organization of Canada and Member Canadian Investor Protection Fund) in Canada and Asia, Bank of Montreal Europe p.l.c. (authorized and regulated by the Central Bank of Ireland) in Europe and BMO Capital Markets Limited (authorized and regulated by the Financial Conduct Authority) in the UK and Australia.
Securities and investment banking activities in the United States are performed by Deutsche Bank Securities Inc., a member of NYSE, FINRA and SIPC, and its broker-dealer affiliates. Lending and other commercial banking activities in the United States are performed by Deutsche Bank AG and its banking affiliates.
Société Générale is the marketing name for SG Americas Securities, LLC.
| THE INFORMATION IN THIS COLLATERAL TERM SHEET IS NOT COMPLETE AND MAY BE AMENDED PRIOR TO THE TIME OF SALE. THIS TERM SHEET IS NOT AN OFFER TO SELL THESE SECURITIES AND IT IS NOT A SOLICITATION OF AN OFFER TO BUY THESE SECURITIES IN ANY JURISDICTION WHERE THE OFFER OR SALE IS NOT PERMITTED. | ||
| 2 | ||
| Dated October 9, 2024 | BMO 2024-5C7 |
IMPORTANT NOTICE RELATING TO AUTOMATICALLY-GENERATED EMAIL DISCLAIMERS
Any legends, disclaimers or other notices that may appear at the bottom of any email communication to which this document is attached relating to (1) these materials not constituting an offer (or a solicitation of an offer), (2) no representation that these materials are accurate or complete and may not be updated or (3) these materials possibly being confidential, are not applicable to these materials and should be disregarded. Such legends, disclaimers or other notices have been automatically generated as a result of these materials having been sent via Bloomberg or another system.
THE CERTIFICATES REFERRED TO IN THESE MATERIALS ARE SUBJECT TO MODIFICATION OR REVISION (INCLUDING THE POSSIBILITY THAT ONE OR MORE CLASSES OF CERTIFICATES MAY BE SPLIT, COMBINED OR ELIMINATED AT ANY TIME PRIOR TO ISSUANCE OR AVAILABILITY OF A FINAL PROSPECTUS) AND ARE OFFERED ON A “WHEN, AS AND IF ISSUED” BASIS.
THE UNDERWRITERS MAY FROM TIME TO TIME PERFORM INVESTMENT BANKING SERVICES FOR, OR SOLICIT INVESTMENT BANKING BUSINESS FROM, ANY COMPANY NAMED IN THESE MATERIALS. THE UNDERWRITERS AND/OR THEIR AFFILIATES OR RESPECTIVE EMPLOYEES MAY FROM TIME TO TIME HAVE A LONG OR SHORT POSITION IN ANY CERTIFICATE OR CONTRACT DISCUSSED IN THESE MATERIALS.
| THE INFORMATION IN THIS COLLATERAL TERM SHEET IS NOT COMPLETE AND MAY BE AMENDED PRIOR TO THE TIME OF SALE. THIS TERM SHEET IS NOT AN OFFER TO SELL THESE SECURITIES AND IT IS NOT A SOLICITATION OF AN OFFER TO BUY THESE SECURITIES IN ANY JURISDICTION WHERE THE OFFER OR SALE IS NOT PERMITTED. | ||
| 3 | ||
| Structural and Collateral Term Sheet | BMO 2024-5C7 | |
| Collateral Characteristics | ||
Mortgage Loan Seller | Number of | Number of Mortgaged | Aggregate | % of IPB | Roll-up | Roll-up |
| GACC | 3 | 10 | $111,662,000 | 11.6% | $159,200,462 | 16.6% |
| BMO | 3 | 3 | $49,000,000 | 5.1% | $157,923,077 | 16.5% |
| SMC | 6 | 6 | $153,140,000 | 16.0% | $153,140,000 | 16.0% |
| CREFI | 5 | 9 | $138,850,000 | 14.5% | $138,850,000 | 14.5% |
| UBS AG | 6 | 12 | $138,300,000 | 14.4% | $138,300,000 | 14.4% |
| GSMC | 2 | 2 | $40,000,000 | 4.2% | $81,538,462 | 8.5% |
| SGFC | 3 | 3 | $68,960,630 | 7.2% | $68,960,630 | 7.2% |
| GCMC | 3 | 3 | $19,650,000 | 2.0% | $61,650,000 | 6.4% |
| GCMC, BMO | 1 | 1 | $60,000,000 | 6.3% | - | - |
| BMO, GACC, GSMC | 1 | 1 | $60,000,000 | 6.3% | - | - |
| GACC, BMO | 1 | 1 | $60,000,000 | 6.3% | - | - |
| GSMC, BMO | 1 | 23 | $60,000,000 | 6.3% | - | - |
| Total: | 35 | 74 | $959,562,630 | 100.0% | $959,562,630 | 100.0% |
| Loan Pool | ||
| Initial Pool Balance (“IPB”): | $959,562,630 | |
| Number of Mortgage Loans: | 35 | |
| Number of Mortgaged Properties: | 74 | |
| Average Cut-off Date Balance per Mortgage Loan: | $27,416,075 | |
| Weighted Average Current Mortgage Rate: | 6.38270% | |
| 10 Largest Mortgage Loans as % of IPB: | 57.7% | |
| Weighted Average Remaining Term to Maturity: | 60 months | |
| Weighted Average Seasoning: | 0 month | |
| Credit Statistics | ||
| Weighted Average UW NCF DSCR: | 1.70x | |
| Weighted Average UW NOI Debt Yield: | 11.3% | |
| Weighted Average Cut-off Date Loan-to-Value Ratio (“LTV”): | 60.5% | |
| Weighted Average Maturity Date/ARD LTV: | 60.4% | |
| Other Statistics | ||
| % of Mortgage Loans with Additional Debt: | 3.1% | |
| % of Mortgage Loans with Single Tenants(1): | 15.3% | |
| % of Mortgage Loans secured by Multiple Properties: | 18.2% | |
| Amortization | ||
| Weighted Average Original Amortization Term: | 360 months | |
| Weighted Average Remaining Amortization Term: | 358 months | |
| % of Mortgage Loans with Interest-Only: | 94.2% | |
| % of Mortgage Loans with Interest-Only with Anticipated Repayment Date: | 3.1% | |
| % of Mortgage Loans with Amortizing Balloon: | 2.7% | |
| Lockboxes | ||
| % of Mortgage Loans with Springing Lockboxes: | 46.0% | |
| % of Mortgage Loans with Hard Lockboxes: | 44.6% | |
| % of Mortgage Loans with Soft (Residential); Hard (Commercial) Lockbox: | 6.3% | |
% of Mortgage Loans with Soft Lockbox: | 3.2% | |
| Reserves | ||
| % of Mortgage Loans Requiring Monthly Tax Reserves: | 81.7% | |
| % of Mortgage Loans Requiring Monthly Insurance Reserves: | 53.2% | |
| % of Mortgage Loans Requiring Monthly CapEx Reserves: | 86.4% | |
| % of Mortgage Loans Requiring Monthly TI/LC Reserves(2): | 67.0% | |
| (1) | Excludes mortgage loans that are secured by multiple properties leased to separate single tenants. are occupied by a single tenant. |
| (2) | Calculated only with respect to the Cut-off Date Balance of mortgage loans secured or partially secured by office, retail, industrial, mixed use and multifamily (with commercial tenants) properties. |
| THE INFORMATION IN THIS COLLATERAL TERM SHEET IS NOT COMPLETE AND MAY BE AMENDED PRIOR TO THE TIME OF SALE. THIS TERM SHEET IS NOT AN OFFER TO SELL THESE SECURITIES AND IT IS NOT A SOLICITATION OF AN OFFER TO BUY THESE SECURITIES IN ANY JURISDICTION WHERE THE OFFER OR SALE IS NOT PERMITTED. | ||
| 4 | ||
| Structural and Collateral Term Sheet | BMO 2024-5C7 | |
| Collateral Characteristics | ||
| Ten Largest Mortgage Loans | ||||||||||||
| No. | Loan Name | City, State | Mortgage Loan Seller | No. of Prop. | Cut-off Date Balance | % of IPB | Square Feet / Rooms / Units | Property Type | UW NCF DSCR | UW NOI Debt Yield | Cut-off Date LTV | Maturity Date/ARD LTV |
| 1 | Signum at 375 Dean | Brooklyn, NY | GCMC, BMO | 1 | $60,000,000 | 6.3% | 143 | Multifamily | 1.25x | 7.7% | 68.6% | 68.6% |
| 2 | Colony Square | Atlanta, GA | BMO, GACC, GSMC | 1 | $60,000,000 | 6.3% | 1,085,612 | Mixed Use | 1.51x | 11.8% | 50.4% | 50.4% |
| 3 | GRM South Brunswick | South Brunswick, NJ | SMC | 1 | $60,000,000 | 6.3% | 509,775 | Industrial | 1.37x | 10.0% | 57.1% | 57.1% |
| 4 | 125 Summer | Boston, MA | GACC, BMO | 1 | $60,000,000 | 6.3% | 489,637 | Office | 2.57x | 17.9% | 61.1% | 61.1% |
| 5 | Tank Holding Portfolio | Various, Various | GSMC, BMO | 23 | $60,000,000 | 6.3% | 1,489,315 | Industrial | 2.25x | 11.8% | 65.0% | 65.0% |
| 6 | Louisa Apartments | Portland, OR | GACC | 1 | $58,392,000 | 6.1% | 242 | Multifamily | 1.76x | 9.2% | 72.0% | 72.0% |
| 7 | Interstate Industrial Portfolio | Various, Various | UBS AG | 7 | $54,000,000 | 5.6% | 2,573,860 | Industrial | 1.37x | 9.9% | 63.9% | 63.9% |
| 8 | West Palm Gardens | West Palm Beach, FL | CREFI | 1 | $50,000,000 | 5.2% | 437 | Multifamily | 1.58x | 10.6% | 59.4% | 59.4% |
| 9 | 95-22 147th Place | Jamaica, NY | CREFI | 1 | $46,000,000 | 4.8% | 118 | Multifamily | 1.32x | 8.6% | 62.1% | 62.1% |
| 10 | Hampton Inn JFK | Queens, NY | UBS AG | 1 | $45,000,000 | 4.7% | 216 | Hospitality | 1.66x | 14.2% | 60.7% | 60.7% |
| Top 3 Total/Weighted Average | 3 | $180,000,000 | 18.8% | 1.38x | 9.8% | 58.7% | 58.7% | |||||
| Top 5 Total/Weighted Average | 27 | $300,000,000 | 31.3% | 1.79x | 11.8% | 60.4% | 60.4% | |||||
| Top 10 Total/Weighted Average | 38 | $553,392,000 | 57.7% | 1.68x | 11.2% | 62.1% | 62.1% | |||||
| Non-Top 10 Total/Weighted Average | 36 | $406,170,630 | 42.3% | 1.73x | 11.5% | 58.4% | 58.2% | |||||
| THE INFORMATION IN THIS COLLATERAL TERM SHEET IS NOT COMPLETE AND MAY BE AMENDED PRIOR TO THE TIME OF SALE. THIS TERM SHEET IS NOT AN OFFER TO SELL THESE SECURITIES AND IT IS NOT A SOLICITATION OF AN OFFER TO BUY THESE SECURITIES IN ANY JURISDICTION WHERE THE OFFER OR SALE IS NOT PERMITTED. | ||
| 5 | ||
| Structural and Collateral Term Sheet | BMO 2024-5C7 | |
| Collateral Characteristics | ||
| Pari Passu Companion Loan Summary | |||||||||
No. | Loan Name | Mortgage Loan Seller | Trust Cut-off Date Balance | Aggregate Pari Passu Companion Loan Cut-off Date Balance | Controlling Pooling/Trust & Servicing Agreement | Master | Special | Related Pari Passu Loan(s) Securitizations | Related Pari Passu Companion Loan(s) Original Balance |
| 1 | Signum at 375 Dean | GCMC, BMO | $60,000,000 | $24,000,000 | BMO 2024-5C7 | Midland | Greystone | Future Securitization(s) | $24,000,000 |
| 2 | Colony Square | BMO, GACC, GSMC | $60,000,000 | $200,000,000 | BMO 2024-5C7(1) | Midland(1) | Greystone(1) | Future Securitization(s) | $200,000,000 |
| 3 | GRM South Brunswick | SMC | $60,000,000 | $12,000,000 | BMO 2024-5C7 | Midland | Greystone | Future Securitization(s) | $12,000,000 |
| 4 | 125 Summer | GACC, BMO | $60,000,000 | $42,635,000 | BMO 2024-5C7 | Midland | Greystone | Future Securitization(s) | $42,635,000 |
| 5 | Tank Holding Portfolio | GSMC | $60,000,000 | $26,389,388 | BMO 2024-5C7 | Midland | Greystone | Future Securitization(s) | $26,389,388 |
| 7 | Interstate Industrial Portfolio | UBS AG | $54,000,000 | $58,000,000 | BMO 2024-5C7(1) | Midland(1) | Greystone(1) | Future Securitization(s) | $58,000,000 |
| 14 | 277 Park Avenue | GACC | $30,000,000 | $490,000,000 | COMM 2024-277P | KeyBank | KeyBank | COMM 2024-277P BBCMS 2024-5C29 | $420,000,000 $70,000,000 |
| 15 | Baybrook Mall | SGFC | $25,960,630 | $193,706,236 | BANK5 2024-5YR9 | Wells Fargo | Midland | BANK5 2024-5YR9 Benchmark 2024-V9 BBCMS 2024-5C29 BANK5 2024-5YR10(2) | $88,000,000 $25,000,000 $61,000,000 $20,000,000 |
| 18 | One Park Square | GSMC | $20,000,000 | $27,650,000 | BMO 2024-5C7(1) | Midland(1) | Greystone(1) | Future Securitization(s) | $27,650,000 |
| 20 | Cortland West Champions | GSMC | $20,000,000 | $58,400,000 | BMO 2024-5C7(1) | Midland(1) | Greystone(1) | Future Securitization(s) | $58,400,000 |
| 26 | Westshore Crossing | UBS AG | $10,400,000 | $40,000,000 | BBCMS 2024-5C29 | KeyBank | Argentic | BBCMS 2024-5C29 BMO 2024-5C5 | $25,000,000 $15,000,000 |
| 28 | Northbridge Centre | BMO | $8,000,000 | $88,000,000 | BMO 2024-5C6 | Midland | LNR | BMO 2024-5C6 Future Securitization(s) | $53,000,000 $35,000,000 |
| 31 | Linx | SGFC | $6,000,000 | $88,000,000 | BMO 2024-5C6 | Midland | LNR | BMO 2024-5C6 Future Securitization(s) | $53,000,000 $35,000,000 |
| (1) | In the case of each of Loan Nos. 2, 7, 18 and 20, until the securitization of the related controlling pari passu companion loan, the related whole loan will be serviced and administered pursuant to the pooling and servicing agreement for the BMO 2024-5C7 securitization transaction by the parties thereto. Upon the securitization of the related controlling pari-passu companion loan, servicing of the related whole loan will shift to the servicers under the servicing agreement with respect to such future securitization transaction, which servicing agreement will become the Controlling Pooling/Trust & Servicing Agreement. |
| (2) | Based on a publicly available prospectus, the BANK5 2024-5YR10 transaction is expected to close after the date of this Term Sheet and prior to the closing of this securitization transaction. |
| THE INFORMATION IN THIS COLLATERAL TERM SHEET IS NOT COMPLETE AND MAY BE AMENDED PRIOR TO THE TIME OF SALE. THIS TERM SHEET IS NOT AN OFFER TO SELL THESE SECURITIES AND IT IS NOT A SOLICITATION OF AN OFFER TO BUY THESE SECURITIES IN ANY JURISDICTION WHERE THE OFFER OR SALE IS NOT PERMITTED. | ||
| 6 | ||
| Structural and Collateral Term Sheet | BMO 2024-5C7 | |
| Collateral Characteristics | ||
| Mortgaged Properties by Type |
Weighted Average | ||||||||
| Property Type | Property Subtype | Number of Properties | Cut-off Date Principal Balance | % of IPB | UW NCF DSCR | UW NOI DY | Cut-off Date LTV | Maturity Date/ARD LTV |
| Multifamily | High Rise | 4 | $185,392,000 | 19.3% | 1.43x | 8.5% | 68.1% | 68.1% |
| Garden | 17 | 157,020,000 | 16.4 | 1.50x | 10.2% | 61.6% | 61.6% | |
| Mid Rise | 6 | 129,950,000 | 13.5 | 1.48x | 9.2% | 63.9% | 63.9% | |
| Low Rise | 4 | 17,250,000 | 1.8 | 1.42x | 10.2% | 58.2% | 58.2% | |
| Subtotal: | 31 | $489,612,000 | 51.0% | 1.47x | 9.3% | 64.5% | 64.5% | |
| Industrial | Warehouse | 8 | $114,000,000 | 11.9% | 1.37x | 10.0% | 60.3% | 60.3% |
| Warehouse Distribution/Light manufacturing | 23 | $60,000,000 | 6.3 | 2.25x | 11.8% | 65.0% | 65.0% | |
| Car Dealership/Service Center | 1 | $14,090,000 | 1.5 | 2.97x | 12.8% | 47.9% | 47.9% | |
| Manufacturing | 1 | 12,500,000 | 1.3 | 2.29x | 16.6% | 50.8% | 50.8% | |
| Subtotal: | 33 | $200,590,000 | 20.9% | 1.80x | 11.1% | 60.3% | 60.3% | |
| Office | CBD | 3 | $98,000,000 | 10.2% | 2.53x | 17.8% | 51.4% | 51.4% |
| Suburban | 1 | 20,000,000 | 2.1 | 2.18x | 14.2% | 58.8% | 58.8% | |
| Subtotal: | 4 | $118,000,000 | 12.3% | 2.47x | 17.2% | 52.7% | 52.7% | |
| Mixed Use | Office/Retail | 1 | $60,000,000 | 6.3% | 1.51x | 11.8% | 50.4% | 50.4% |
| Lab/Office | 1 | 6,000,000 | 0.6 | 2.36x | 14.3% | 38.1% | 38.1% | |
| Subtotal: | 2 | $66,000,000 | 6.9% | 1.59x | 12.0% | 49.3% | 49.3% | |
| Hospitality | Limited Service | 2 | $53,500,000 | 5.6% | 1.88x | 15.4% | 58.6% | 58.6% |
| Extended Stay | 1 | 5,900,000 | 0.6 | 1.80x | 15.2% | 56.2% | 56.2% | |
| Subtotal: | 3 | $59,400,000 | 6.2% | 1.87x | 15.4% | 58.3% | 58.3% | |
| Retail | Super Regional Mall | 1 | $25,960,630 | 2.7% | 1.72x | 13.8% | 55.9% | 53.0% |
| Total / Weighted Average: | 74 | $959,562,630 | 100.0% | 1.70x | 11.3% | 60.5% | 60.4% | |
| THE INFORMATION IN THIS COLLATERAL TERM SHEET IS NOT COMPLETE AND MAY BE AMENDED PRIOR TO THE TIME OF SALE. THIS TERM SHEET IS NOT AN OFFER TO SELL THESE SECURITIES AND IT IS NOT A SOLICITATION OF AN OFFER TO BUY THESE SECURITIES IN ANY JURISDICTION WHERE THE OFFER OR SALE IS NOT PERMITTED. | ||
| 7 | ||
| Structural and Collateral Term Sheet | BMO 2024-5C7 | |
| No. 1 – Signum at 375 Dean | ||
| THE INFORMATION IN THIS COLLATERAL TERM SHEET IS NOT COMPLETE AND MAY BE AMENDED PRIOR TO THE TIME OF SALE. THIS TERM SHEET IS NOT AN OFFER TO SELL THESE SECURITIES AND IT IS NOT A SOLICITATION OF AN OFFER TO BUY THESE SECURITIES IN ANY JURISDICTION WHERE THE OFFER OR SALE IS NOT PERMITTED. | ||
| 8 | ||
| Structural and Collateral Term Sheet | BMO 2024-5C7 | |
| No. 1 – Signum at 375 Dean | ||

| THE INFORMATION IN THIS COLLATERAL TERM SHEET IS NOT COMPLETE AND MAY BE AMENDED PRIOR TO THE TIME OF SALE. THIS TERM SHEET IS NOT AN OFFER TO SELL THESE SECURITIES AND IT IS NOT A SOLICITATION OF AN OFFER TO BUY THESE SECURITIES IN ANY JURISDICTION WHERE THE OFFER OR SALE IS NOT PERMITTED. | ||
| 9 | ||
Unfunded
| Structural and Collateral Term Sheet | BMO 2024-5C7 | |
| No. 1 – Signum at 375 Dean | ||
| Mortgage Loan Information | Property Information | |||
| Mortgage Loan Seller: | GCMC, BMO | Single Asset / Portfolio: | Single Asset | |
| Original Principal Balance(1): | $60,000,000 | Title: | Fee | |
| Cut-off Date Principal Balance(1): | $60,000,000 | Property Type – Subtype: | Multifamily – High Rise | |
| % of IPB: | 6.3% | Net Rentable Area (Units)(3): | 143 | |
| Loan Purpose: | Refinance | Location: | Brooklyn, NY | |
| Borrower: | Dean Holdings DE LLC | Year Built / Renovated: | 2023 / NAP | |
| Borrower Sponsor: | Joseph Brunner, Abraham Mandel and Toby Mandel | Occupancy(4): | 96.5% | |
| Interest Rate: | 6.000% | Occupancy Date: | 9/30/2024 | |
| Note Date: | 10/9/2024 | 4th Most Recent NOI (As of)(5): | NAP | |
| Maturity Date: | 11/6/2029 | 3rd Most Recent NOI (As of)(5): | NAP | |
| Interest-only Period: | 60 months | 2nd Most Recent NOI (As of)(5): | NAP | |
| Original Term: | 60 months | Most Recent NOI (As of)(5): | NAP | |
| Original Amortization Term: | None | UW Economic Occupancy(6): | 97.0% | |
| Amortization Type: | Interest Only | UW Revenues: | $7,578,167 | |
| Call Protection(2): | L(24),D(29),O(7) | UW Expenses: | $1,145,992 | |
| Lockbox / Cash Management: | Soft / Springing | UW NOI: | $6,432,176 | |
| Additional Debt(1): | Yes | UW NCF: | $6,391,049 | |
| Additional Debt Balance(1): | $24,000,000 | Appraised Value / Per Unit(7): | $122,500,000 / $856,643 | |
| Additional Debt Type(1): | Pari Passu | Appraisal Date(7): | 4/1/2025 | |
| Escrows and Reserves(8) | Financial Information(1) | ||||||
| Initial | Monthly | Initial Cap | Cut-off Date Loan / Unit: | $587,413 | |||
| Taxes: | $1,061,067 | $33,151 | N/A | Maturity Date Loan / Unit: | $587,413 | ||
| Insurance: | $96,000 | $8,000 | N/A | Cut-off Date LTV: | 68.6% | ||
| Replacement Reserve: | $0 | $2,478 | N/A | Maturity Date LTV: | 68.6% | ||
| TI/LC: | $0 | $949 | N/A | UW NCF DSCR: | 1.25x | ||
| Other: | $126,525 | $0 | N/A | UW NOI Debt Yield: | 7.7% | ||
| (1) | The Signum at 375 Dean Mortgage Loan (as defined below) is part of the Signum at 375 Dean Whole Loan (as defined below), which is comprised of six pari passu promissory notes with an aggregate original balance of $84,000,000. For additional information, see “The Loan” below. The financial information presented above is calculated based on the Signum at 375 Dean Whole Loan. |
| (2) | Defeasance of the Signum at 375 Dean Whole Loan is permitted at any time after the earlier to occur of (a) the end of the two-year period commencing on the closing date of the securitization of the last promissory note representing a portion of the Signum at 375 Dean Whole Loan to be securitized and (b) October [ ], 2027. The assumed defeasance lockout period of 24 payments is based on the anticipated closing date of the BMO 2024-5C7 securitization trust in October 2024. The actual lockout period may be longer. |
| (3) | The Signum at 375 Dean Property (as defined below) also contains 7,592 square feet of commercial space and a 54-space parking garage. |
| (4) | Occupancy represents residential occupancy only. The commercial space at the Signum at 375 Dean Property is 100.0% leased. |
| (5) | Historical NOI is not available, as the Signum at 375 Dean Property was constructed in 2023. |
| (6) | UW Economic Occupancy is 97.0% for the residential portion of the Signum at 375 Dean Property and 95.0% for the commercial portion. |
| (7) | The Appraised Value for the Signum at 375 Dean Property is based on the value upon stabilization, which assumed lease-up of the commercial portion. As of October 1, 2024, the commercial portion of the Signum at 375 Dean Property is 100% leased. |
| (8) | See “Escrows and Reserves” below for further discussion of reserve information. |
| THE INFORMATION IN THIS COLLATERAL TERM SHEET IS NOT COMPLETE AND MAY BE AMENDED PRIOR TO THE TIME OF SALE. THIS TERM SHEET IS NOT AN OFFER TO SELL THESE SECURITIES AND IT IS NOT A SOLICITATION OF AN OFFER TO BUY THESE SECURITIES IN ANY JURISDICTION WHERE THE OFFER OR SALE IS NOT PERMITTED. | ||
| 10 | ||
Unfunded
| Structural and Collateral Term Sheet | BMO 2024-5C7 | |
| No. 1 – Signum at 375 Dean | ||
The Loan. The largest mortgage loan (the “Signum at 375 Dean Mortgage Loan”) is part of a whole loan (the “Signum at 375 Dean Whole Loan”) that is evidenced by six pari passu promissory notes in the aggregate original principal amount of $84,000,000 secured by the borrower’s fee interest in a 143-unit multifamily property located in Brooklyn, New York (the “Signum at 375 Dean Property”). The Signum at 375 Dean Mortgage Loan was originated by Greystone Commercial Mortgage Capital LLC (“GCMC”) on October [9], 2024, and Notes A-4, A-5 and A-6 were subsequently acquired by Bank of Montreal (“BMO”). The Signum at 375 Dean Whole Loan accrues interest at a rate of [6.000]% per annum on an Actual/360 basis and has an outstanding principal balance as of the Cut-off Date of $84,000,000. The Signum at 375 Dean Mortgage Loan has a five-year term and is interest-only for the full term. The Signum at 375 Dean Mortgage Loan is evidenced by the controlling Note A-1 and the non-controlling Notes A-2, A-3, and A-4, with an aggregate original principal balance of $60,000,000.
The relationship between the holders of the Signum at 375 Dean Whole Loan is governed by a co-lender agreement. The Signum at 375 Dean Whole Loan will be serviced pursuant to the pooling and servicing agreement for the BMO 2024-5C7 transaction. See “Description of the Mortgage Pool—The Whole Loans—The Serviced Pari Passu Whole Loans” and “Pooling and Servicing Agreement” in the Preliminary Prospectus.
The table below identifies the promissory notes that comprise Signum at 375 Dean Mortgage Loan:
| Whole Loan Summary | ||||
| Note | Original Balance | Cut-off Date Balance | Note Holder | Controlling Piece |
| A-1 | $20,000,000 | $20,000,000 | BMO 2024-5C7 | Yes |
| A-2 | $15,000,000 | $15,000,000 | BMO 2024-5C7 | No |
| A-3 | $7,000,000 | $7,000,000 | BMO 2024-5C7 | No |
| A-4 | $18,000,000 | $18,000,000 | BMO 2024-5C7 | No |
| A-5(1) | $19,000,000 | $19,000,000 | BMO | No |
| A-6(1) | $5,000,000 | $5,000,000 | BMO | No |
| Whole Loan | $84,000,000 | $84,000,000 | ||
| (1) | Expected to be contributed to one or more future securitization transactions. |
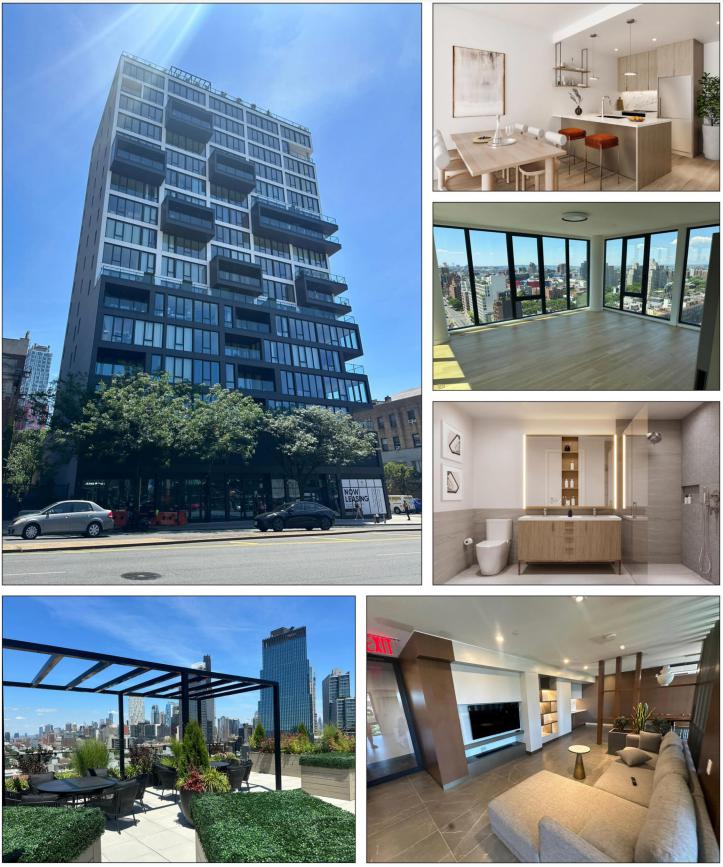
The Property. The Signum at 375 Dean Property is a 143-unit high-rise multifamily property built in 2023. As of September 30, 2024, the residential portion of the Signum at 375 Dean Property was 96.5% leased. The Signum at 375 Dean Property is located at the corner of Dean Street and 4th Avenue, in Brooklyn, New York at the nexus of the Boerum Hill, Park Slope and Prospect Heights neighborhoods. The Signum at 375 Dean Property is located one block from the Barclays Center near Atlantic Terminal, a major transportation hub with access to nine subway lines and the Long Island Rail Road.
The Signum at 375 Dean Property consists of a 17-story building featuring 143 residential units, 7,592 square feet of commercial space and a 54-space parking garage. The residential units feature studio, 1-bedroom, and 2-bedroom layouts, and of the 143 total units, 38 (26.6% of total units) are designated for affordable housing, while the remaining 105 units (73.4%) are leased as market units. Construction on the Signum at 375 Dean Property was completed in 2023, and leasing began in September 2023. The Signum at 375 Dean Property reached 96.5% occupancy on the residential units by September 2024.
Amenities at the Signum at 375 Dean Property include a virtual doorman, indoor and outdoor lounges, a fitness center, bike storage, a package room, entertainment room, coworking and party lounges, and a rooftop deck with views of Downtown Brooklyn. All units contain washers and dryers, stainless steel appliances, floor-to-ceiling windows, and built-in closet systems, with approximately 40% of units having private balconies.
The commercial space at the Signum at 375 Dean Property is 100% leased to Cactus Equity, LLC, on a lease that runs through September 30, 2029.
The Signum at 375 Dean Property is expected to benefit from a 35-year 421-a tax abatement from the NYC Department of Housing Preservation & Development, and is required to reserve at least 10% of units for households earning up to 40% of area median income, 10% of units for households earning up to 60% of area median income, and 5% of the units for households earning up to 130% of area median income under affordable housing guidelines, which 421-a tax abatement phases out in 2058/2059. The Signum at 375 Dean Property’s 421-a workbook was approved by the New York City Department of Housing Preservation & Development on August 2, 2024 and is awaiting the final Certificate of Eligibility.
| THE INFORMATION IN THIS COLLATERAL TERM SHEET IS NOT COMPLETE AND MAY BE AMENDED PRIOR TO THE TIME OF SALE. THIS TERM SHEET IS NOT AN OFFER TO SELL THESE SECURITIES AND IT IS NOT A SOLICITATION OF AN OFFER TO BUY THESE SECURITIES IN ANY JURISDICTION WHERE THE OFFER OR SALE IS NOT PERMITTED. | ||
| 11 | ||
Unfunded
| Structural and Collateral Term Sheet | BMO 2024-5C7 | |
| No. 1 – Signum at 375 Dean | ||
The Signum at 375 Dean Loan borrower sponsor is subject to full-recourse until such final Certificate of Eligibility is received for the 421-a tax abatements.
The following table presents certain information relating to the unit mix at the Signum at 375 Dean Property:
| Signum at 375 Dean Unit Mix | ||||||||
| Unit Type | No. of Units(1) | % of Total Units(1) | Average Unit Size (SF) (1) | Average Rent Per Unit(1) | Average Rent PSF(1) | Market Rent Per Unit(2) | Market Rent PSF(2) | |
| Studio - Market | 22 | 15.4 | % | 335 | $3,455 | $10.32 | $3,455 | $10.32 |
| 1 Bed / 1 Bath - Market | 69 | 48.3 | 526 | $4,929 | $9.37 | $4,950 | $9.41 | |
| 2 Bed / 1 Bath – Market | 9 | 6.3 | 715 | $7,328 | $10.24 | $7,328 | $10.24 | |
| 2 Bed / 2 Bath – Market | 5 | 3.5 | 1,029 | $7,460 | $7.25 | $7,460 | $7.25 | |
| Studio - Affordable | 7 | 4.9 | 378 | $867 | $2.29 | $867 | $2.29 | |
| 1 Bed / 1 Bath - Affordable | 26 | 18.2 | 559 | $1,421 | $2.54 | $1,421 | $2.54 | |
| 2 Bed / 2 Bath - Affordable | 5 | 3.5 | 1,067 | $2,492 | $2.33 | $2,492 | $2.33 | |
| Collateral Total/Wtd. Avg. | 143 | 100.0 | % | 544 | $3,987 | $7.33 | $4,030 | $7.41 |
| (1) | Based on the borrower rent roll dated as of September 30, 2024. |
| (2) | Market rent per the appraisal for market rate units and based on the in-place rent for affordable units. |
The Market. According to the appraisal, the Signum at 375 Dean Property is located in the Kings County multifamily submarket. As of the first quarter of 2024, the Downtown Brooklyn submarket had an inventory of 462,317 units, average monthly asking rent of $2,709, and a vacancy rate of approximately 1.8%, below the submarket’s 10-year average of 2.6%.
| THE INFORMATION IN THIS COLLATERAL TERM SHEET IS NOT COMPLETE AND MAY BE AMENDED PRIOR TO THE TIME OF SALE. THIS TERM SHEET IS NOT AN OFFER TO SELL THESE SECURITIES AND IT IS NOT A SOLICITATION OF AN OFFER TO BUY THESE SECURITIES IN ANY JURISDICTION WHERE THE OFFER OR SALE IS NOT PERMITTED. | ||
| 12 | ||
Unfunded
| Structural and Collateral Term Sheet | BMO 2024-5C7 | |
| No. 1 – Signum at 375 Dean | ||
The following table presents certain information relating to comparable multifamily rental properties to the Signum at 375 Dean Property:
| Comparable Rental Summary(1) | ||||
| Property | Unit Mix | Average SF per Unit | Average Rent per SF | Average Rent per Unit |
Signum at 375 Dean(2) 375 Dean Street Brooklyn, NY | Studio - Market 1 Bed / 1 Bath - Market 2 Bed / 1 Bath - Market 2 Bed / 2 Bath - Market Studio - Affordable 1 Bed / 1 Bath - Affordable 2 Bed / 2 Bath - Affordable | 335 526 715 1,029 378 559 1,067 | $10.32 $9.37 $10.24 $7.25 $2.29 $2.54 $2.33 | $3,455 $4,950 $7,328 $7,460 $867 $1,421 $2,492 |
Saint Marks Place 58 Saint Marks Place Brooklyn, NY | Studio 1 Bed / 1 Bath 2 Bed / 1 Bath 2 Bed / 2 Bath | 412 717 877 877 | $8.56 $6.97 $6.84 $6.84 | $3,525 $5,000 $6,000 $6,000 |
The Bergen 316 Begen Street Brooklyn, NY | Studio 1 Bed / 1 Bath 2 Bed / 1 Bath 2 Bed / 2 Bath | 460 625 900 900 | $7.45 $7.35 $7.44 $7.44 | $3,425 $4,595 $6,700 $6,700 |
461 Dean Street Brooklyn, NY | Studio 1 Bed / 1 Bath 2 Bed / 1 Bath 2 Bed / 2 Bath | 521 689 1,065 1,065 | $6.67 $6.96 $6.15 $6.15 | $3,475 $4,795 $6,550 $6,550 |
Plank Road 662 Pacific Street Brooklyn, NY | Studio 1 Bed / 1 Bath 2 Bed / 1 Bath 2 Bed / 2 Bath | 511 660 1,040 1,040 | $6.86 $6.39 $6.15 $6.15 | $3,505 $4,218 $6,400 $6,400 |
834 Pacific Street Brooklyn, NY | Studio 1 Bed / 1 Bath 2 Bed / 1 Bath 2 Bed / 2 Bath | 355 512 722 722 | $9.58 $8.50 $7.62 $7.62 | $3,400 $4,350 $5,500 $5,500 |
The Heritage Dean 470 Dean Street Brooklyn, NY | Studio 1 Bed / 1 Bath 2 Bed / 1 Bath 2 Bed / 2 Bath | 515 727 1,250 1,250 | $6.41 $5.78 $4.92 $4.92 | $3,300 $4,200 $6,150 $6,150 |
| (1) | Source: Appraisal, unless otherwise indicated. |
| (2) | Based on the borrower rent roll dated as of September 30, 2024. |
Environmental. According to the Phase I environmental site assessment dated July 11, 2024, there was no evidence of any recognized environmental conditions at the Signum at 375 Dean Property.
| THE INFORMATION IN THIS COLLATERAL TERM SHEET IS NOT COMPLETE AND MAY BE AMENDED PRIOR TO THE TIME OF SALE. THIS TERM SHEET IS NOT AN OFFER TO SELL THESE SECURITIES AND IT IS NOT A SOLICITATION OF AN OFFER TO BUY THESE SECURITIES IN ANY JURISDICTION WHERE THE OFFER OR SALE IS NOT PERMITTED. | ||
| 13 | ||
Unfunded
| Structural and Collateral Term Sheet | BMO 2024-5C7 | |
| No. 1 – Signum at 375 Dean | ||
The following table presents certain information relating to operating history and underwritten cash flows at the Signum at 375 Dean Property:
| Operating History and Underwritten Net Cash Flow(1) | |||||
| Borrower Sponsor Proforma | Underwritten | Per Unit | %(2) | ||
| Gross Potential Rent(3) | $7,441,736 | $7,437,003 | $52,007 | 100.0 | % |
| Net Rental Income | $7,441,736 | $7,437,003 | $52,007 | 100.0 | % |
| (Vacancy/Credit Loss)(4) | (244,381) | (233,536) | (1,633) | (3.1 | ) |
| Other Income | 366,900 | 374,700 | 2,620 | 5.0 | |
| Effective Gross Income | $7,564,255 | $7,578,167 | $52,994 | 101.9 | % |
| Total Expenses(5) | $793,014 | $1,145,992 | $8,014 | 15.1 | % |
| Net Operating Income | $6,771,241 | $6,432,176 | $44,980 | 84.9 | % |
| Total TI/LC, Capex/RR | 0 | 41,127 | 288 | 0.5 | |
| Net Cash Flow | $6,771,241 | $6,391,049 | $44,693 | 84.3 | % |
| (1) | Historical financials are not available, as the Signum at 375 Dean Property was constructed in 2023. |
| (2) | % column represents percent of Net Rental Income for revenue fields and represents percent of Effective Gross Income for the remainder of fields |
| (3) | Based on the rent roll as of September 30, 2024 and includes both residential and commercial Gross Potential Rent. |
| (4) | Underwritten Vacancy is 3.0% for the residential component and 5.0% commercial component. |
| (5) | Underwritten Total Expenses reflect real estate taxes based on the anticipated 421-a abated amount. |
The Borrower. The borrower is Dean Holdings DE LLC, a Delaware limited liability company and special purpose entity with two independent directors. Legal counsel to the borrower provided a non-consolidation opinion in connection with the origination of Signum at 375 Dean Loan.
The Borrower Sponsor. The borrower sponsors and guarantors are Joseph Brunner, Abraham Mandel and Toby Mandel. Joseph Brunner and Abraham Mandel are the founders of Bruman Realty, a real estate company specializing in multifamily development and ownership in New York. The borrower sponsors have a combined portfolio of over 40 multifamily, mixed-use, retail and office properties, primarily located in Brooklyn and Queens, New York.
Property Management. The Signum at 375 Dean Property is managed by Bruman Realty LLC, an affiliate of the borrower.
Escrows and Reserves. At origination, the borrower was required to deposit into escrow (i) approximately $1,061,067 for real estate taxes, representing six months of unabated real estate taxes, (ii) approximately $95,639 for insurance, and (iii) $126,525 for free rent related to the commercial space.
Tax Escrows – On a monthly basis, the borrower is required to escrow 1/12th of the annual estimated tax payments, which currently equates to approximately $33,151.
Insurance Escrows – On a monthly basis, the borrower is required to escrow 1/12th of the annual estimated insurance payments, which currently equates to $8,000.
Replacement Reserves – On a monthly basis, the borrower is required to escrow approximately $2,478 for replacement reserves ($200 per unit and $0.15 per square foot of commercial space annually).
TI/LC Reserves – On a monthly basis, the borrower is required to escrow approximately $949 for tenant improvements and leasing commissions ($1.50 per square foot of commercial space annually).
| THE INFORMATION IN THIS COLLATERAL TERM SHEET IS NOT COMPLETE AND MAY BE AMENDED PRIOR TO THE TIME OF SALE. THIS TERM SHEET IS NOT AN OFFER TO SELL THESE SECURITIES AND IT IS NOT A SOLICITATION OF AN OFFER TO BUY THESE SECURITIES IN ANY JURISDICTION WHERE THE OFFER OR SALE IS NOT PERMITTED. | ||
| 14 | ||
Unfunded
| Structural and Collateral Term Sheet | BMO 2024-5C7 | |
| No. 1 – Signum at 375 Dean | ||
Lockbox / Cash Management. The Signum at 375 Dean Mortgage Loan is structured with an in-place soft lockbox and springing cash management.
Upon the occurrence and during the continuance of a Signum at 375 Dean Trigger Event (as defined below), all funds in the lockbox account are required to be swept daily to a cash management account under the control of the lender to be applied and disbursed in accordance with the Signum at 375 Dean Mortgage Loan documents, and all excess cash flow funds remaining in the cash management account after the application of such funds in accordance with the Signum at 375 Dean Mortgage Loan documents are required to be held by the lender in an excess cash flow reserve account as additional collateral for the Signum at 375 Dean Mortgage Loan. To the extent that no Signum at 375 Dean Trigger Event is continuing, all excess cash flow funds are required to be disbursed to the borrower.
A “Signum at 375 Dean Trigger Event” will commence upon the earliest of the following: (i) the occurrence of an event of default under the Signum at 375 Dean Mortgage Loan documents or (ii) commencing on our after October [ ], 2025, the date on which the debt service coverage ratio is less than 1.05x based on the net cash flow for the trailing 12 months.
A Signum at 375 Dean Trigger Event will end: (a) with regard to clause (i), upon the cure of such event of default and the lender’s acceptance of such cure in its sole and absolute discretion; (b) with regard to clause (ii), upon the debt service coverage ratio based on the trailing 12-month period being at least 1.05x for one calendar quarter.
Subordinate Debt and Mezzanine Debt. None.
Permitted Future Subordinate or Mezzanine Debt. Not permitted.
Partial Release. Not permitted.
Ground Lease. None.
| THE INFORMATION IN THIS COLLATERAL TERM SHEET IS NOT COMPLETE AND MAY BE AMENDED PRIOR TO THE TIME OF SALE. THIS TERM SHEET IS NOT AN OFFER TO SELL THESE SECURITIES AND IT IS NOT A SOLICITATION OF AN OFFER TO BUY THESE SECURITIES IN ANY JURISDICTION WHERE THE OFFER OR SALE IS NOT PERMITTED. | ||
| 15 | ||
| Structural and Collateral Term Sheet | BMO 2024-5C7 | |
| No. 2 – Colony Square | ||

| THE INFORMATION IN THIS COLLATERAL TERM SHEET IS NOT COMPLETE AND MAY BE AMENDED PRIOR TO THE TIME OF SALE. THIS TERM SHEET IS NOT AN OFFER TO SELL THESE SECURITIES AND IT IS NOT A SOLICITATION OF AN OFFER TO BUY THESE SECURITIES IN ANY JURISDICTION WHERE THE OFFER OR SALE IS NOT PERMITTED. | ||
| 16 | ||
| Structural and Collateral Term Sheet | BMO 2024-5C7 | |
| No. 2 – Colony Square | ||
| THE INFORMATION IN THIS COLLATERAL TERM SHEET IS NOT COMPLETE AND MAY BE AMENDED PRIOR TO THE TIME OF SALE. THIS TERM SHEET IS NOT AN OFFER TO SELL THESE SECURITIES AND IT IS NOT A SOLICITATION OF AN OFFER TO BUY THESE SECURITIES IN ANY JURISDICTION WHERE THE OFFER OR SALE IS NOT PERMITTED. | ||
| 17 | ||
| Structural and Collateral Term Sheet | BMO 2024-5C7 | |
| No. 2 – Colony Square | ||

| THE INFORMATION IN THIS COLLATERAL TERM SHEET IS NOT COMPLETE AND MAY BE AMENDED PRIOR TO THE TIME OF SALE. THIS TERM SHEET IS NOT AN OFFER TO SELL THESE SECURITIES AND IT IS NOT A SOLICITATION OF AN OFFER TO BUY THESE SECURITIES IN ANY JURISDICTION WHERE THE OFFER OR SALE IS NOT PERMITTED. | ||
| 18 | ||
| Structural and Collateral Term Sheet | BMO 2024-5C7 | |
| No. 2 – Colony Square | ||
| THE INFORMATION IN THIS COLLATERAL TERM SHEET IS NOT COMPLETE AND MAY BE AMENDED PRIOR TO THE TIME OF SALE. THIS TERM SHEET IS NOT AN OFFER TO SELL THESE SECURITIES AND IT IS NOT A SOLICITATION OF AN OFFER TO BUY THESE SECURITIES IN ANY JURISDICTION WHERE THE OFFER OR SALE IS NOT PERMITTED. | ||
| 19 | ||
| Structural and Collateral Term Sheet | BMO 2024-5C7 | |
| No. 2 – Colony Square | ||

| THE INFORMATION IN THIS COLLATERAL TERM SHEET IS NOT COMPLETE AND MAY BE AMENDED PRIOR TO THE TIME OF SALE. THIS TERM SHEET IS NOT AN OFFER TO SELL THESE SECURITIES AND IT IS NOT A SOLICITATION OF AN OFFER TO BUY THESE SECURITIES IN ANY JURISDICTION WHERE THE OFFER OR SALE IS NOT PERMITTED. | ||
| 20 | ||
| Structural and Collateral Term Sheet | BMO 2024-5C7 | |
| No. 2 – Colony Square | ||
| THE INFORMATION IN THIS COLLATERAL TERM SHEET IS NOT COMPLETE AND MAY BE AMENDED PRIOR TO THE TIME OF SALE. THIS TERM SHEET IS NOT AN OFFER TO SELL THESE SECURITIES AND IT IS NOT A SOLICITATION OF AN OFFER TO BUY THESE SECURITIES IN ANY JURISDICTION WHERE THE OFFER OR SALE IS NOT PERMITTED. | ||
| 21 | ||
| Structural and Collateral Term Sheet | BMO 2024-5C7 | |
| No. 2 – Colony Square | ||
| Mortgage Loan Information | Property Information | |||
| Mortgage Loan Seller: | BMO, GACC, GSMC | Single Asset / Portfolio: | Single Asset | |
| Original Principal Balance(1): | $60,000,000 | Title: | Fee | |
| Cut-off Date Principal Balance(1): | $60,000,000 | Property Type – Subtype: | Mixed Use – Office / Retail | |
| % of IPB: | 6.3% | Net Rentable Area (SF): | 1,085,612 | |
| Loan Purpose: | Refinance | Location: | Atlanta, GA | |
| Borrower: | LVA4 Atlanta Colony Square, L.P. | Year Built / Renovated: | 1972, 1974, 2020, 2021 / 2000 | |
| Borrower Sponsors: | North American Ventures LLC and Lionstone U.S. Value-Add Four, L.P. | Occupancy: | 83.0% | |
| Interest Rate: | 7.37500% | Occupancy Date: | 7/1/2024 | |
| Note Date: | 10/2/2024 | 4th Most Recent NOI (As of): | $16,554,450 (12/31/2021) | |
| Maturity Date: | 10/6/2029 | 3rd Most Recent NOI (As of): | $24,041,323 (12/31/2022) | |
| Interest-only Period: | 60 months | 2nd Most Recent NOI (As of): | $29,712,592 (12/31/2023) | |
| Original Term: | 60 months | Most Recent NOI (As of): | $29,188,955 (TTM 7/31/2024) | |
| Original Amortization Term: | None | UW Economic Occupancy: | 83.3% | |
| Amortization Type: | Interest Only | UW Revenues: | $49,913,938 | |
| Call Protection(2): | L(24),DorYM1(29),O(7) | UW Expenses: | $19,331,831 | |
| Lockbox / Cash Management: | Hard / Springing | UW NOI: | $30,582,107 | |
| Additional Debt(1): | Yes | UW NCF: | $29,266,672 | |
| Additional Debt Balance(1): | $200,000,000 | Appraised Value / Per SF: | $516,000,000 / $475 | |
| Additional Debt Type(1): | Pari Passu | Appraisal Date: | 5/24/2024 | |
| Escrows and Reserves(3) | Financial Information(1) | |||||
| Initial | Monthly | Initial Cap | Whole Loan | |||
| Taxes: | $0 | $375,955 | N/A | Cut-off Date Loan / SF: | $240 | |
| Insurance: | $0 | Springing | N/A | Maturity Date Loan / SF: | $240 | |
| Replacement Reserve: | $0 | $19,152 | N/A | Cut-off Date LTV: | 50.4% | |
| Rollover Reserve: | $4,000,000 | $90,468 | N/A | Maturity Date LTV: | 50.4% | |
| Free Rent Reserve: | $965,127 | $0 | N/A | UW NCF DSCR: | 1.51x | |
| Outstanding TI/LC: | $3,965,065 | $425,000 | N/A | UW NOI Debt Yield: | 11.8% | |
| Sources and Uses | ||||||||
| Sources | Proceeds | % of Total | Uses | Proceeds | % of Total | |||
| Whole Loan | $260,000,000 | 87.3 | % | Loan Payoff | $281,760,456 | 94.6 | % | |
| Equity Contribution | 37,832,154 | 12.7 | Upfront Reserves | 8,930,192 | 3.0 | |||
| Closing Costs | 7,141,506 | 2.4 | ||||||
| Total Sources | $297,832,154 | 100.0 | % | Total Uses | $297,832,154 | 100.0 | % | |
| (1) | The Colony Square Mortgage Loan (as defined below) is part of the Colony Square Whole Loan (as defined below), which is comprised of 16 pari passu promissory notes with an aggregate original balance of $260,000,000. The Colony Square Whole Loan was originated by Bank of Montreal (“BMO”), Goldman Sachs Bank USA (“GSBI”) and German American Capital Corporation (“GACC”). For additional information, see “The Loan” below. The information presented under “Financial Information” above is calculated based on the Colony Square Whole Loan. |
| (2) | The lockout period will be at least 24 payment dates beginning with and including the first payment date on November 6, 2024. Defeasance or voluntary prepayment with yield maintenance of the Colony Square Whole Loan in full (but not in part) is permitted at any time following the earlier to occur of (i) November 6, 2028 or (ii) the date that is two years from the closing date of the securitization that includes the last pari passu note to be securitized. The assumed lockout period of 24 payments is based on the expected BMO 2024-5C7 securitization trust closing date in October 2024. The actual lockout period may be longer. |
| (3) | For a full description of Escrows and Reserves, see “Escrows and Reserves” below. |
| THE INFORMATION IN THIS COLLATERAL TERM SHEET IS NOT COMPLETE AND MAY BE AMENDED PRIOR TO THE TIME OF SALE. THIS TERM SHEET IS NOT AN OFFER TO SELL THESE SECURITIES AND IT IS NOT A SOLICITATION OF AN OFFER TO BUY THESE SECURITIES IN ANY JURISDICTION WHERE THE OFFER OR SALE IS NOT PERMITTED. | ||
| 22 | ||
| Structural and Collateral Term Sheet | BMO 2024-5C7 | |
| No. 2 – Colony Square | ||
The Loan. The second largest mortgage loan (the “Colony Square Mortgage Loan”) is part of a whole loan evidenced by 16 pari passu notes that is secured by the borrower’s fee interest in a 1,085,612 square foot mixed-use property in Atlanta, Georgia (the “Colony Square Property”).
The Colony Square Mortgage Loan, which is evidenced by the non-controlling Note A-2, Note A-5, Note A-7 and Note A-12, has an outstanding principal balance as of the Cut-off Date of $60,000,000. The Colony Square Whole Loan was co-originated by Bank of Montreal (“BMO”), Goldman Sachs Bank USA (“GSBI”) and German American Capital Corporation (“GACC”) and has an aggregate outstanding principal balance as of the Cut-off Date of $260,000,000. The Colony Square Whole Loan is interest only for the entire term and accrues interest on an Actual/360 basis.
The Colony Square Whole Loan will be serviced pursuant to the pooling and servicing agreement for the BMO 2024-5C7 securitization trust. See “Description of the Mortgage Pool—The Whole Loans—The Serviced Pari Passu Whole Loans” in the Preliminary Prospectus.
The table below identifies the promissory notes that comprise the Colony Square Whole Loan:
| Whole Loan Summary | |||||||
| Note | Original Balance | Cut-off Date Balance | Note Holder | Controlling Piece | |||
| A-1(1) | $45,000,000 | $45,000,000 | BMO | Yes | |||
| A-2 | $30,000,000 | $30,000,000 | BMO 2024-5C7 | No | |||
| A-3(1) | $25,000,000 | $25,000,000 | BMO | No | |||
| A-4(1) | $30,531,915 | $30,531,915 | BMO | No | |||
| A-5 | $4,468,085 | $4,468,085 | BMO 2024-5C7 | No | |||
| A-6(1) | $16,667,000 | $16,667,000 | GSBI | No | |||
| A-7 | $12,765,957 | $12,765,957 | BMO 2024-5C7 | No | |||
| A-8(1) | $9,259,000 | $9,259,000 | GSBI | No | |||
| A-9(1) | $5,752,043 | $5,752,043 | GSBI | No | |||
| A-10(1) | $5,556,000 | $5,556,000 | GSBI | No | |||
| A-11(1) | $16,667,000 | $16,667,000 | GACC | No | |||
| A-12 | $12,765,957 | $12,765,957 | BMO 2024-5C7 | No | |||
| A-13(1) | $9,259,000 | $9,259,000 | GACC | No | |||
| A-14(1) | $5,752,043 | $5,752,043 | GACC | No | |||
| A-15(1) | $5,556,000 | $5,556,000 | GACC | No | |||
| A-16(1) | $25,000,000 | $25,000,000 | Morgan Stanley Mortgage Capital Holdings LLC | No | |||
| Whole Loan | $260,000,000 | $260,000,000 | |||||
| (1) | Expected to be contributed to one or more future securitization trust(s). |
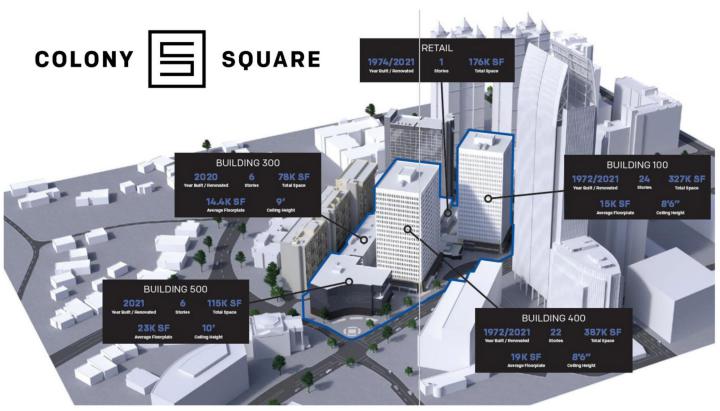
The Property. The Colony Square Property consists of both (i) four Class A office buildings (“Building 100”, “Building 300”, “Building 400” and “Building 500”), (ii) a retail component (the “Retail Component”) and (iii) a parking garage. The Colony Square Property totals 1,085,612 square feet across four buildings, the largest being Building 100 which consists of 329,011 square feet of net rentable area. Building 100 consists of 329,011 square feet (30.3% of NRA and 31.3% of underwritten base rent) including 310,158 square feet of office space, 11,164 square feet of amenity space and 7,689 square feet of storage space. Building 300 consists of 78,100 square feet (7.2% of NRA and 5.8% of underwritten base rent) including 73,200 square feet of office spaces and 4,900 square feet of other spaces. Building 400 consists of 388,411 square feet (35.8% of NRA and 34.1% of underwritten base rent) including 381,034 square feet of office spaces, 7,236 square feet of storage spaces, and 141 square feet of other spaces. Building 500 consists of 121,437 square feet of office spaces (11.2% of NRA and 14.0% of underwritten base rent). The Retail Component consists of 168,653 square feet (15.5% of NRA and 14.9% of underwritten base rent).
| THE INFORMATION IN THIS COLLATERAL TERM SHEET IS NOT COMPLETE AND MAY BE AMENDED PRIOR TO THE TIME OF SALE. THIS TERM SHEET IS NOT AN OFFER TO SELL THESE SECURITIES AND IT IS NOT A SOLICITATION OF AN OFFER TO BUY THESE SECURITIES IN ANY JURISDICTION WHERE THE OFFER OR SALE IS NOT PERMITTED. | ||
| 23 | ||
| Structural and Collateral Term Sheet | BMO 2024-5C7 | |
| No. 2 – Colony Square | ||
| Property Summary(1) | ||||||||||
| Space Type | Total SF | % Total SF | Occupancy | UW Base Rent(2) | % of UW Base Rent(2) | UW Base Rent PSF(2)(3) | ||||
| Office | 885,829 | 81.6% | 80.2% | $28,553,290 | 84.8% | $40.17 | ||||
| Retail | 155,215 | 14.3% | 98.0% | $4,992,868 | 14.8% | $32.81 | ||||
| Storage | 15,609 | 1.4% | 52.2% | $138,439 | 0.4% | $16.99 | ||||
| Amenity/Other | 28,959 | 2.7% | 83.1% | $0 | 0.0% | $0.00 | ||||
| Total / Wtd. Avg. | 1,085,612 | 100.0% | 82.5% | $33,684,597 | 100.0% | $37.63 | ||||
| (1) | Based on the underwritten rent roll dated July 1, 2024. |
| (2) | UW Base Rent, UW Base Rent PSF and % of UW Base Rent are inclusive of contractual rent steps through August 2025. |
| (3) | UW Base Rent PSF excludes vacant space and vacant underwritten base rent. |
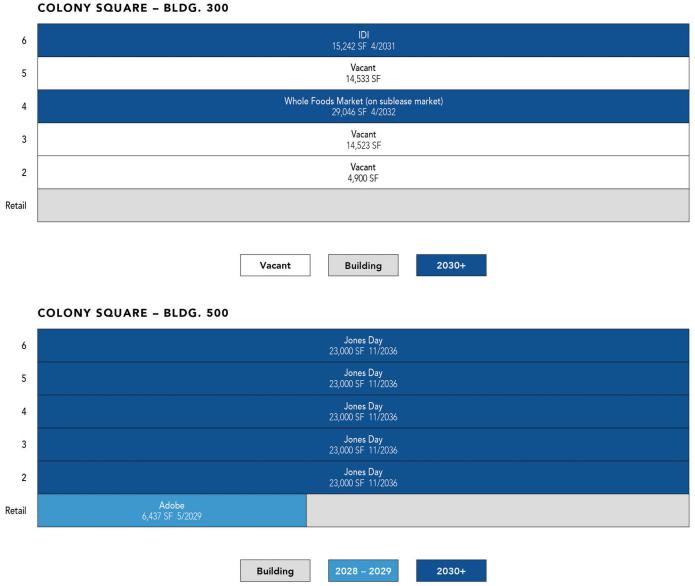
Major Tenants. The largest tenants by underwritten base rent at the Colony Square Property are Jones Day, WeWork and WebMD.
Jones Day (115,000 square feet; 10.6% of Total NRA; 12.9% of underwritten base rent): Jones Day is a global law firm providing legal services to national and multinational corporations. Jones Day provides legal support on complex transactions, high stakes litigation, cyber security, capital markets activities, and many more. The firm employs over 2,400 lawyers in 40 different offices across the world. Jones Day is ranked ninth in law firms based on size, 12th in the Am law 200 ranking, and 15th in the 2024 Global 200 survey. The firm reported approximately $2.7 billion in revenue in 2023 and has worked with clients on over 3,000 transactions that hold a collective value of approximately $1.5 trillion over the past five years. Jones Day’s lease at the Colony Square Property commenced in June 2021, expires on November 30, 2036 and has a contraction option to terminate one floor 120 months (June 2031) after lease commencement date.
WeWork (44,463 square feet; 4.1% of Total NRA; 5.5% of underwritten base rent): Founded in 2010 and headquartered in New York City, WeWork is a provider of shared office and coworking space in 119 cities and 37 countries. WeWork’s private workspace service allows customers to own a private desk, whole office, or an entire floor of private office space. The company’s other coworking services include day to day office rentals, monthly memberships, and additional meeting and event space rentals. WeWork reported approximately $3.2 billion in revenue and $4.8 billion in expenses in 2022. WeWork’s lease at the Colony Square Property commenced in May 2017 and was amended in November 2017 to expand its leased space at the Colony Square Property. WeWork’s lease expires on April 30, 2032 and has two, five-year renewal options and no termination options.
WebMD (42,112 square feet; 3.9% of Total NRA; 5.2% of underwritten base rent): WebMD is an online health information website that provides information on a number of medical conditions, drugs & supplements, overall wellbeing, symptom checking, and medical practitioner location. Beyond their core services, WebMD also creates content such as news, blogs, and podcasts. The company has over 1,800 employees and was bought by private equity firm KKR for $2.8 billion in 2017. WebMD’s lease at the Colony Square Property commenced in August 2010 and is scheduled to expire on March 31, 2028. WebMD has one, five-year renewal option and no termination option.
The following table presents certain information relating to the historical occupancy of the Colony Square Property:
| Historical and Current Occupancy(1) | |||
| 2022 | 2023 | July 2024 | Current(2) |
| 81.3% | 82.8% | 83.3% | 82.5% |
| (1) | Historical occupancies are as of December 31 of each respective year unless otherwise stated. |
| (2) | Current Occupancy is as of July 1, 2024. |
| THE INFORMATION IN THIS COLLATERAL TERM SHEET IS NOT COMPLETE AND MAY BE AMENDED PRIOR TO THE TIME OF SALE. THIS TERM SHEET IS NOT AN OFFER TO SELL THESE SECURITIES AND IT IS NOT A SOLICITATION OF AN OFFER TO BUY THESE SECURITIES IN ANY JURISDICTION WHERE THE OFFER OR SALE IS NOT PERMITTED. | ||
| 24 | ||
| Structural and Collateral Term Sheet | BMO 2024-5C7 | |
| No. 2 – Colony Square | ||
The following table presents certain information relating to the tenants at the Colony Square Property:
| Tenant Summary(1) | ||||||||||
| Tenant | Tenant Type | Ratings Moody’s/S&P/Fitch(2) | Net Rentable Area (SF) | % of Total NRA | UW Base Rent PSF(3) | UW Base Rent(3) | % of Total UW Base Rent(3) | Lease Expiration Date | ||
| Jones Day | Office | NR/NR/NR | 115,000 | 10.6 | % | $37.73 | $4,338,950 | 12.9% | 11/30/2036 | |
| WeWork | Office | NR/NR/NR | 44,463 | 4.1 | $41.77 | 1,857,081 | 5.5 | 4/30/2032 | ||
| WebMD | Office/Storage | NR/NR/NR | 42,112 | 3.9 | $41.92 | 1,765,443 | 5.2 | 3/31/2028 | ||
| SPACES | Office/Retail | NR/NR/NR | 42,273 | 3.9 | $37.11 | 1,568,751 | 4.7 | 5/31/2029 | ||
| iPic Theater | Retail | NR/NR/NR | 38,011 | 3.5 | $39.44 | 1,499,154 | 4.5 | 12/31/2040 | ||
| Whole Foods | Office | NR/NR/NR | 29,046 | 2.7 | $41.41 | 1,202,795 | 3.6 | 4/30/2032 | ||
| CBS Radio East | Office/Storage | Baa2/NR/BBB | 29,688 | 2.7 | $35.40 | 1,050,846 | 3.1 | 11/30/2028 | ||
| Diamond Sports | Office/Storage | NR/NR/NR | 36,883 | 3.4 | $28.49 | 1,050,824 | 3.1 | 9/30/2026 | ||
| Lord, Aeck & Sargent | Office | NR/NR/NR | 30,016 | 2.8 | $31.56 | 947,305 | 2.8 | 11/30/2027 | ||
| Tosca Services | Office | NR/NR/NR | 23,385 | 2.2 | $39.42 | 921,741 | 2.7 | 12/31/2027 | ||
| Office/Retail/Storage Tenants | 430,877 | 39.7 | % | $37.60 | $16,202,890 | 48.1% | ||||
| Remaining Occupied | 464,305 | 42.8 | 37.65 | 17,481,707 | 51.9 | |||||
| Total Occupied | 895,182 | 82.5 | % | $37.63 | $33,684,597 | 100.0% | ||||
| Vacant Space | 190,430 | 17.5 | ||||||||
| Collateral Total | 1,085,612 | 100.0 | % | |||||||
| (1) | Based on the underwritten rent roll dated July 1, 2024, with contractual rent steps through August 2025. |
| (2) | In certain instances, ratings provided are those of the parent company of the entity shown, whether or not the parent company guarantees the lease. |
| (3) | UW Base Rent, UW Base Rent PSF and % of Total UW Base Rent are inclusive of contractual rent steps underwritten through June 2025. |
| THE INFORMATION IN THIS COLLATERAL TERM SHEET IS NOT COMPLETE AND MAY BE AMENDED PRIOR TO THE TIME OF SALE. THIS TERM SHEET IS NOT AN OFFER TO SELL THESE SECURITIES AND IT IS NOT A SOLICITATION OF AN OFFER TO BUY THESE SECURITIES IN ANY JURISDICTION WHERE THE OFFER OR SALE IS NOT PERMITTED. | ||
| 25 | ||
| Structural and Collateral Term Sheet | BMO 2024-5C7 | |
| No. 2 – Colony Square | ||
The following table presents certain information relating to the tenant lease expirations at the Colony Square Property:
| Lease Rollover Schedule(1)(2)(3) | ||||||||||||
| Year | Number of Leases Expiring | Net Rentable Area Expiring | % of NRA Expiring | UW Base Rent Expiring(4) | % of UW Base Rent Expiring(4) | Cumulative Net Rentable Area Expiring | Cumulative % of NRA Expiring | Cumulative UW Base Rent Expiring(4) | Cumulative % of UW Base Rent Expiring(4) | |||
| MTM(5) | 10 | 13,704 | 1.3 | % | $22,466 | 0.1 | % | 13,704 | 1.3% | $22,466 | 0.1% | |
| 2024 | 4 | 4,224 | 0.4 | 44,768 | 0.1 | 17,928 | 1.7% | $67,234 | 0.2% | |||
| 2025 | 17 | 70,888 | 6.5 | 2,386,574 | 7.1 | 88,816 | 8.2% | $2,453,808 | 7.3% | |||
| 2026 | 18 | 96,572 | 8.9 | 3,015,645 | 9.0 | 185,388 | 17.1% | $5,469,453 | 16.2% | |||
| 2027 | 20 | 107,574 | 9.9 | 4,262,340 | 12.7 | 292,962 | 27.0% | $9,731,794 | 28.9% | |||
| 2028 | 27 | 124,858 | 11.5 | 5,249,578 | 15.6 | 417,820 | 38.5% | $14,981,372 | 44.5% | |||
| 2029 | 21 | 104,577 | 9.6 | 4,485,385 | 13.3 | 522,397 | 48.1% | $19,466,757 | 57.8% | |||
| 2030 | 10 | 32,823 | 3.0 | 1,528,896 | 4.5 | 555,220 | 51.1% | $20,995,653 | 62.3% | |||
| 2031 | 11 | 61,332 | 5.6 | 1,809,607 | 5.4 | 616,552 | 56.8% | $22,805,261 | 67.7% | |||
| 2032 | 8 | 79,551 | 7.3 | 3,333,631 | 9.9 | 696,103 | 64.1% | $26,138,891 | 77.6% | |||
| 2033 | 1 | 2,980 | 0.3 | 92,082 | 0.3 | 699,083 | 64.4% | $26,230,973 | 77.9% | |||
| 2034 | 4 | 12,017 | 1.1 | 515,289 | 1.5 | 711,100 | 65.5% | $26,746,262 | 79.4% | |||
| 2035 & Beyond | 7 | 184,082 | 17.0 | 6,938,335 | 20.6 | 895,182 | 82.5% | $33,684,597 | 100.0% | |||
| Vacant | NAP | 190,430 | 17.5 | NAP | NAP | 1,085,612 | 100.0% | NAP | NAP | |||
| Total / Wtd. Avg. | 158(6) | 1,085,612 | 100.0 | % | $33,684,597 | 100.0 | % | |||||
| (1) | Based on the underwritten rent roll dated July 1, 2024. |
| (2) | Lease Rollover Schedule is based on the lease expiration dates of all direct leases in place. Certain tenants have more than one lease. |
| (3) | Certain tenants may have termination or contraction options (which may become exercisable prior to the originally stated expiration date of the tenant lease) that are not considered in the above Lease Rollover Schedule. |
| (4) | UW Base Rent Expiring, % of UW Base Rent Expiring, Cumulative UW Base Rent Expiring and Cumulative % of UW Base Rent Expiring are inclusive of contractual rent steps underwritten through August 2025. |
| (5) | MTM includes leases that are considered amenities, management office, and four storage spaces that are dependable on other tenant leases. |
| (6) | The number of expiring leases includes office, retail, storage and mixed-use tenants. |
| THE INFORMATION IN THIS COLLATERAL TERM SHEET IS NOT COMPLETE AND MAY BE AMENDED PRIOR TO THE TIME OF SALE. THIS TERM SHEET IS NOT AN OFFER TO SELL THESE SECURITIES AND IT IS NOT A SOLICITATION OF AN OFFER TO BUY THESE SECURITIES IN ANY JURISDICTION WHERE THE OFFER OR SALE IS NOT PERMITTED. | ||
| 26 | ||
| Structural and Collateral Term Sheet | BMO 2024-5C7 | |
| No. 2 – Colony Square | ||
The following table presents certain information relating to the operating history and underwritten net cash flow of the Colony Square Property:
| Operating History and Underwritten Net Cash Flow(1) | ||||||||||||
| 2019 | 2020 | 2021 | 2022 | 2023 | 2024 | Underwritten | Per Square Foot | %(2) | ||||
| Base Rent | $18,260,518 | $19,784,299 | $23,062,339 | $28,545,982 | $31,820,621 | $31,929,941 | $32,794,612 | $30.21 | 72.4 | % | ||
| Rent Steps | 0 | 0 | 0 | 0 | 0 | 0 | 889,985 | 0.82 | 2.0 | |||
| Vacancy Lease-Up | 0 | 0 | 0 | 0 | 0 | 0 | 7,564,548 | 6.97 | 16.7 | |||
| Total Base Rent | $18,260,518 | $19,784,299 | $23,062,339 | $28,545,982 | $31,820,621 | $31,929,941 | $41,249,145 | $38.00 | 91.1 | % | ||
| Total Reimbursements | 1,003,124 | 654,243 | 1,078,643 | 3,819,783 | 4,002,407 | 4,014,008 | 4,030,272 | 3.71 | 8.9 | |||
| Gross Potential Rent | $19,263,642 | $20,438,542 | $24,140,982 | $32,365,766 | $35,823,028 | $35,943,949 | $45,279,418 | $41.71 | 100.0 | % | ||
| Other Income(3) | 5,007,108 | 3,069,143 | 6,423,279 | 9,868,036 | 11,866,796 | 11,751,442 | 12,199,068 | 11.24 | 26.9 | |||
| (Vacancy/Credit Loss/Abatements) | 0 | 0 | 0 | 0 | 0 | 0 | (7,564,548) | (6.97) | (16.7 | ) | ||
| Effective Gross Income | $24,270,750 | $23,507,685 | $30,564,261 | $42,233,801 | $47,689,824 | $47,695,391 | $49,913,938 | $45.98 | 100.0 | % | ||
| Total Expenses(4) | 13,662,908 | 11,280,709 | 14,009,811 | 18,192,479 | 17,977,232 | 18,506,436 | 19,331,831 | 17.81 | 38.7 | |||
| Net Operating Income | $10,607,842 | $12,226,976 | $16,554,450 | $24,041,323 | $29,712,592 | $29,188,955 | $30,582,107 | $28.17 | 61.3 | % | ||
| Capital Expenditures | 0 | 0 | 0 | 0 | 0 | 0 | 229,823 | 0.21 | 0.5 | |||
| TI/LC | 0 | 0 | 0 | 0 | 0 | 0 | 1,085,612 | 1.00 | 2.2 | |||
| Net Cash Flow | $10,607,842 | $12,226,976 | $16,554,450 | $24,041,323 | $29,712,592 | $29,188,955 | $29,266,672 | $26.96 | 58.6 | % | ||
| (1) | Based on the underwritten rent roll dated July 1, 2024, with contractual rent steps through August 2025. |
| (2) | % column represents percent of Gross Potential Rent for revenue lines and percent of Effective Gross Income for all remaining fields. |
| (3) | Other Income is based on the borrower’s 2024 budget and is comprised of percentage rent, parking, direct billing, administrative fees, roof and telecom, late fees and deposit fees bad debt, and miscellaneous income. |
| (4) | Total Expenses includes management fees, real estate taxes, insurance, common area maintenance, repairs and maintenance, utilities, payroll, general and administrative, security, elevators and escalators, parking expenses, marketing and direct bill expenses. |
Environmental. According to the Phase I environmental assessment dated June 5, 2024, there was no evidence of any recognized environmental conditions at the Colony Square Property.
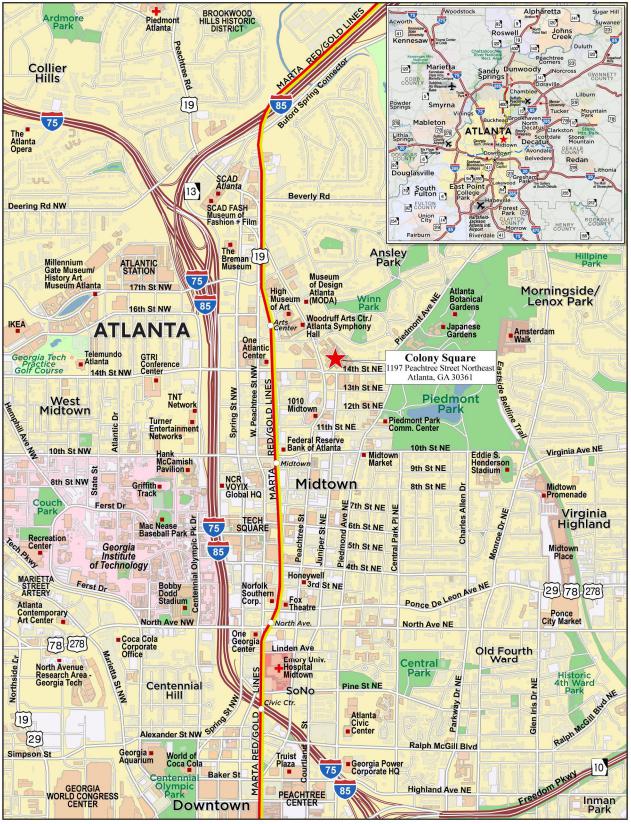
The Market. The Colony Square Property is located in Atlanta, Georgia. According to the appraisal, the Atlanta metropolitan statistical area (“MSA”) has an estimated 2023 population of 6,313,755 which is an average annual 1.2% increase over the 2020 census. Additionally, the current estimated employment in the Atlanta MSA is 3,054,867 jobs which is a 22.0% increase over the past 10 years. Atlanta has the 10th strongest GDP out of all metropolitan area economies in the nation. According to the appraisal, the 2023 total population within a 1-, 3- and 5-mile radii of the Colony Square Property was 34,855, 202,261 and 422,620, respectively, and the 2023 median household income within the same radii was $113,273, $96,372 and $92,474, respectively.
According to the appraisal, the Colony Square Property is located in the Midtown/Brookwood retail submarket. According to the appraisal, this submarket is ranked 27th in inventory in the metro area with 6,904,227 SF, and has an asking rent of $35.96/SF, which is 71.5% greater than the metro area average of $20.97/SF. The Midtown/Brookwood retail submarket also holds a low vacancy rate of 2.3%
According to the appraisal, the Colony Square Property is also located in the Midtown/Pershing Point office submarket. According to the appraisal, the Midtown/Pershing Point office submarket had an inventory of 31.4 million square feet with a 21.4% vacancy rate. The average asking rent is $42.12 per square foot, which is 73.3% greater than the metro area average of $24.30 per square foot.
| THE INFORMATION IN THIS COLLATERAL TERM SHEET IS NOT COMPLETE AND MAY BE AMENDED PRIOR TO THE TIME OF SALE. THIS TERM SHEET IS NOT AN OFFER TO SELL THESE SECURITIES AND IT IS NOT A SOLICITATION OF AN OFFER TO BUY THESE SECURITIES IN ANY JURISDICTION WHERE THE OFFER OR SALE IS NOT PERMITTED. | ||
| 27 | ||
| Structural and Collateral Term Sheet | BMO 2024-5C7 | |
| No. 2 – Colony Square | ||
The following table presents certain information relating to comparable retail leases for the Colony Square Property:
| Comparable Retail Rental Summary(1) | |||||||
| Property / Location | Year Built / Renovated | Gross Building Area (SF) | Tenant Size (SF) | Tenant Name | Base Rent PSF | Commencement | Lease Term (Months) |
| Colony Square Atlanta, GA | 1972, 1974, 2020, 2021 / 2000 | 1,085,612(2) | 3,535(2)(3) | Chic-Fil-A | $32.28(2) | May-19(2) | 143(2) |
2274 Peachtree Road Northwest Atlanta, GA | NAV | NAV | 1,553 | Pulse Performance | $35.00 | Apr-24 | 60.0 |
3050 Peachtree Road Northeast Atlanta, GA | NAV | NAV | 2,672 | Ideal Image | $37.00 | Dec-23 | 60.0 |
4330 Peachtree Road Northeast Brookhaven, GA | NAV | NAV | 2,825 | MHBV Salon | $36.50 | Aug-24 | 120.0 |
2860 Cumberland Mall Atlanta, GA | NAV | NAV | 3,003 | Superior | $45.32 | Oct-23 | 48.0 |
2955 Cobb Parkway Southeast Atlanta, GA | NAV | NAV | 4,000 | Mattress Firm | $49.00 | Oct-23 | 120.0 |
4330 Peachtree Road Atlanta, GA | NAV | NAV | 2,087 | Tobbany | $33.00 | Sep-24 | 60.0 |
2300 Peachtree Road Northwest Atlanta, GA | NAV | NAV | 3,382 | Fete Atlanta | $40.00 | Nov-23 | 60.0 |
| (1) | Information obtained from the appraisal unless otherwise indicated. |
| (2) | Based on the underwritten rent roll dated July 1, 2024. Base Rent PSF includes contractual rent steps through August 2025. |
| (3) | Excluding 150 square feet of Chick-Fil-A’s storage space. |
The following table presents certain information relating to comparable office leases for the Colony Square Property:
| Comparable Office Rental Summary(1) | |||||||
| Property Address/Location | Year Built / Renovated | Gross Building Area (SF) | Tenant Size (SF) | Tenant Name | Base Rent PSF | Commencement | Lease Term (Months) |
Colony Square Atlanta, GA | 1972, 1974, 2020, 2021 / 2000 | 1,085,612(2) | 115.000(2) | Jones Day | $37.73(2) | Jun-21(2) | 186(2) |
One Atlantic Center Atlanta, GA | 1987 / NAP | 1,101,022 | 8,000 | Duff & Phelps | $45.00 | Sep-24 | 120 |
Atlantic Station Atlanta, GA | 2007 / NAP | 390,276 | 4,392 | N/A | $45.00 | Dec-23 | 36 |
Atlantic Station Atlanta, GA | 2007 / NAP | 390,276 | 7,023 | Tractian | $44.00 | Nov-23 | 42 |
Ponce City Market Atlanta, GA | 2014 / NAP | 685,773 | 196,355 | MailChimp | $55.00 | Oct-23 | 6 |
| (1) | Information obtained from the appraisal unless otherwise indicated. |
| (2) | Based on the underwritten rent roll dated July 1, 2024. Base Rent PSF includes contractual rent steps through August 2025. |
The Borrower. The borrower is LVA4 Atlanta Colony Square, L.P., a Delaware limited partnership structured as a single purpose, bankruptcy-remote entity, with its general partner structured as a single purpose, bankruptcy-remote Delaware single member limited liability company with two independent directors. Legal counsel to the borrower delivered a non-consolidation opinion in connection with the origination of the Colony Square Whole Loan.
| THE INFORMATION IN THIS COLLATERAL TERM SHEET IS NOT COMPLETE AND MAY BE AMENDED PRIOR TO THE TIME OF SALE. THIS TERM SHEET IS NOT AN OFFER TO SELL THESE SECURITIES AND IT IS NOT A SOLICITATION OF AN OFFER TO BUY THESE SECURITIES IN ANY JURISDICTION WHERE THE OFFER OR SALE IS NOT PERMITTED. | ||
| 28 | ||
| Structural and Collateral Term Sheet | BMO 2024-5C7 | |
| No. 2 – Colony Square | ||
The Borrower Sponsors. The borrower sponsors and non-recourse carveout guarantors are North American Ventures LLC and Lionstone U.S. Value-Add Four, L.P.
Property Management. The Colony Square Property is managed by North American Properties-Atlanta, LTD., a property management company affiliated with North American Ventures LLC.
Escrows and Reserves. At origination of the Colony Square Whole Loan, the borrower deposited $4,000,000 for a rollover reserve fund, approximately $3,965,065 for outstanding landlord obligations and approximately $965,127 for free rent reserves.
Tax Escrows – On a monthly basis, the borrower is required to escrow 1/12th of the estimated annual real estate tax payments (initially estimated to be approximately $375,955).
Insurance Escrows – On a monthly basis, the borrower is required to escrow 1/12th of the annual estimated insurance payments. Such reserve has been conditionally waived so long as the borrower maintains a blanket policy meeting the requirements of the Colony Square Whole Loan documents and the borrower provides evidence of the renewal of any insurance policy prior to the expiration thereof and receipts for the payment of the applicable premiums.
Replacement Reserve – On a monthly basis, the borrower is required to escrow approximately $19,152 for the payment or reimbursement of approved capital expenses.
Rollover Reserve – On a monthly basis, the borrower is required to escrow (a) approximately $90,468 for approved leasing expenses and (b) $425,000 tenant improvement and leasing commission obligations incurred following the origination date (the “Additional Rollover Reserve”). Such monthly deposits in the Additional Rollover Reserve will not be required during such time that the balance of the Additional Rollover Reserve exceeds $5,100,000 (the “Additional Rollover Reserve Required Amount”).
Free Rent Reserve – Provided that no event of default exists, on each monthly payment date, the free rent funds deposited for each applicable lease will be disbursed in the amounts equal to the applicable monthly rent credits or free rent amounts set forth in the Colony Square Whole Loan documents.
Lockbox / Cash Management. The Colony Square Whole Loan is structured with a hard lockbox and springing cash management. The borrower was required to deliver tenant direction letters to the existing tenants at the Colony Square Property, directing them to remit their rent directly to the lender-controlled lockbox. The borrower is required to cause revenue received by the borrower or the property manager, as applicable, from the Colony Square Property to be deposited into such lockbox within two business days. During the continuance of a Trigger Period (as defined below), provided no event of default is then continuing, all funds in the lockbox account are required to be swept each business day into the lender-controlled cash management account and applied and disbursed in accordance with the Colony Square Whole Loan documents.
A “Trigger Period” means a period commencing upon the earliest to occur of (i) an event of default under the Colony Square Whole Loan, (ii) the debt yield being less than 9.5% (tested on a quarterly basis), (iii) the open date (i.e., the payment date that is 6 months prior to the maturity date) or (iv) the occurrence of an Additional Replacement Reserve Trigger Event (as defined below), and ending if, with respect to a Trigger Period continuing pursuant to (A) clause (i), the event of default commencing the Trigger Period has been cured or waived and such cure has been accepted by the applicable lender or the applicable lender has waived such event of default in writing, and no other event of default is then continuing, (B) clause (ii), the earlier to occur of (x) the date that the debt yield is equal to or greater than 9.5% for two consecutive calendar quarters or (y) the date the borrower posts with the lender cash or a letter of credit in an amount that if applied to repay the Colony Square Whole Loan would cause the debt yield test set forth in the preceding clause (x) to be satisfied, (C) clause (iii), payment in full of the Colony Square Whole Loan in accordance with the terms of the Colony Square Whole Loan documents and (D) clause (iv), the occurrence of an Additional Rollover Reserve Cure Event (as defined below).
An “Additional Replacement Reserve Trigger Event” means the failure by the borrower to make deposits into the Additional Rollover Reserve account in the aggregate amount equal to or exceeding the Additional Rollover Reserve Required Amount prior to or on October 6, 2025.
| THE INFORMATION IN THIS COLLATERAL TERM SHEET IS NOT COMPLETE AND MAY BE AMENDED PRIOR TO THE TIME OF SALE. THIS TERM SHEET IS NOT AN OFFER TO SELL THESE SECURITIES AND IT IS NOT A SOLICITATION OF AN OFFER TO BUY THESE SECURITIES IN ANY JURISDICTION WHERE THE OFFER OR SALE IS NOT PERMITTED. | ||
| 29 | ||
| Structural and Collateral Term Sheet | BMO 2024-5C7 | |
| No. 2 – Colony Square | ||
An “Additional Replacement Reserve Cure Event” means the earlier to occur of (A) the date on which the aggregate amount of the Additional Rollover Reserve deposits made equals or exceeds the Additional Rollover Reserve Required Amount or (B) the date that the borrower otherwise deposits into the Additional Rollover Reserve account additional cash in an amount sufficient to have the aggregate amount of all deposits made into the Additional Rollover Reserve account equal or exceed the Additional Rollover Reserve Required Amount.
Subordinate and Mezzanine Debt. None.
Permitted Future Subordinate and Mezzanine Debt. Not permitted.
Permitted Future Preferred Equity. The borrower is permitted to obtain a one-time preferred equity investment in an amount not to exceed $40,000,000, subject to satisfaction of certain conditions, including the following: (i) the preferred equity investment must be by a qualified institutional investor, (ii) the loan to value ratio (as determined by the lender in its sole but reasonable discretion taking into consideration the contemplated permitted preferred equity) must be equal to or less than 65%, (iii) the debt service coverage ratio (taking into account the permitted preferred equity and based on net cash flow and the current pay interest only preferred return payable) must be equal at least 1.20x, (iv) the debt service coverage ratio (taking into account the permitted preferred equity and based on net operating income on the total preferred return (i.e., the sum of the current pay interest only return and the accrued interest only return) must be at least 1.15x, (v) the debt yield (taking into consideration the permitted preferred equity) must be equal to or greater than 10% and (vi) delivery of a rating agency confirmation.
Partial Release. Not permitted.
Ground Lease. None.
| THE INFORMATION IN THIS COLLATERAL TERM SHEET IS NOT COMPLETE AND MAY BE AMENDED PRIOR TO THE TIME OF SALE. THIS TERM SHEET IS NOT AN OFFER TO SELL THESE SECURITIES AND IT IS NOT A SOLICITATION OF AN OFFER TO BUY THESE SECURITIES IN ANY JURISDICTION WHERE THE OFFER OR SALE IS NOT PERMITTED. | ||
| 30 | ||
| Structural and Collateral Term Sheet | BMO 2024-5C7 | |
| No. 3 – GRM South Brunswick | ||
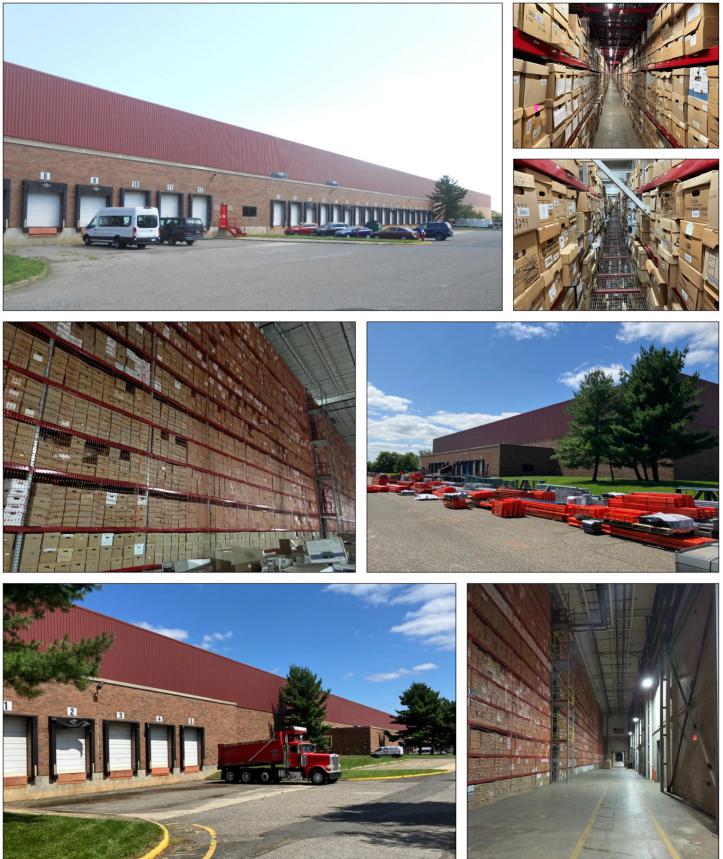
| THE INFORMATION IN THIS COLLATERAL TERM SHEET IS NOT COMPLETE AND MAY BE AMENDED PRIOR TO THE TIME OF SALE. THIS TERM SHEET IS NOT AN OFFER TO SELL THESE SECURITIES AND IT IS NOT A SOLICITATION OF AN OFFER TO BUY THESE SECURITIES IN ANY JURISDICTION WHERE THE OFFER OR SALE IS NOT PERMITTED. | ||
| 31 | ||
| Structural and Collateral Term Sheet | BMO 2024-5C7 | |
| No. 3 – GRM South Brunswick | ||
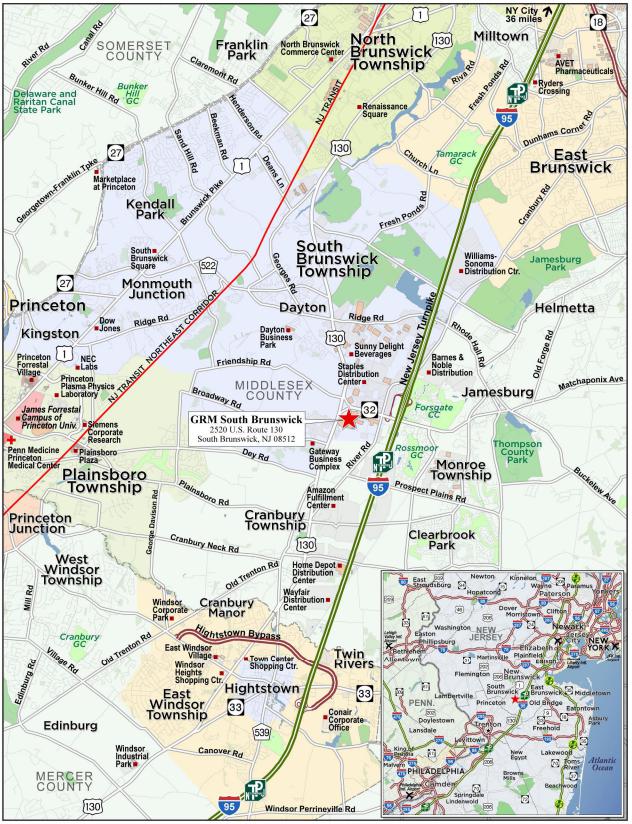
| THE INFORMATION IN THIS COLLATERAL TERM SHEET IS NOT COMPLETE AND MAY BE AMENDED PRIOR TO THE TIME OF SALE. THIS TERM SHEET IS NOT AN OFFER TO SELL THESE SECURITIES AND IT IS NOT A SOLICITATION OF AN OFFER TO BUY THESE SECURITIES IN ANY JURISDICTION WHERE THE OFFER OR SALE IS NOT PERMITTED. | ||
| 32 | ||
| Structural and Collateral Term Sheet | BMO 2024-5C7 | |
| No. 3 – GRM South Brunswick | ||
| Mortgage Loan Information | Property Information | |||
| Mortgage Loan Seller: | SMC | Single Asset / Portfolio: | Single Asset | |
| Original Principal Balance(1): | $60,000,000 | Title: | Fee | |
| Cut-off Date Principal Balance(1): | $60,000,000 | Property Type - Subtype: | Industrial – Warehouse | |
| % of IPB: | 6.3% | Net Rentable Area (SF): | 509,775 | |
| Loan Purpose: | Refinance | Location: | South Brunswick, NJ | |
| Borrower: | Tigerlily Realty, LLC | Year Built / Renovated: | 1983 / 2014 | |
| Borrower Sponsor: | Moishe Mana | Occupancy: | 100.0% | |
| Interest Rate: | 7.05000% | Occupancy Date: | 10/6/2024 | |
| Note Date: | 9/13/2024 | 4th Most Recent NOI (As of)(4): | $2,208,709 (12/31/2021) | |
| Maturity Date: | 10/6/2029 | 3rd Most Recent NOI (As of)(4): | $2,481,604 (12/31/2022) | |
| Interest-only Period: | 60 months | 2nd Most Recent NOI (As of)(4): | $2,486,179 (12/31/2023) | |
| Original Term: | 60 months | Most Recent NOI (As of)(5): | $2,467,444 (TTM 7/31/2024) | |
| Original Amortization Term: | None | UW Economic Occupancy: | 95.0% | |
| Amortization Type: | Interest Only | UW Revenues: | $8,524,236 | |
| Call Protection(2): | L(24),D(30),O(6) | UW Expenses: | $1,326,255 | |
| Lockbox / Cash Management: | Hard / Springing | UW NOI(5): | $7,197,981 | |
| Additional Debt(1): | Yes | UW NCF: | $7,045,049 | |
| Additional Debt Balance(1): | $12,000,000 | Appraised Value / Per SF: | $126,000,000 / $247 | |
| Additional Debt Type(1): | Pari Passu | Appraisal Date: | 8/20/2024 | |
| Escrows and Reserves(3) | Financial Information | |||||
| Initial | Monthly | Initial Cap | Cut-off Date Loan / SF: | $141 | ||
| Taxes: | $211,379 | $52,845 | N/A | Maturity Date Loan / SF: | $141 | |
| Insurance: | $0 | Springing | N/A | Cut-off Date LTV: | 57.1% | |
| Replacement Reserves: | $0 | $4,248 | N/A | Maturity Date LTV: | 57.1% | |
| TI / LC: | $0 | $0 | N/A | UW NCF DSCR: | 1.37x | |
| Deferred Maintenance: | $79,376 | $0 | N/A | UW NOI Debt Yield: | 10.0% | |
| Sources and Uses | |||||||
| Sources | Proceeds | % of Total | Uses | Proceeds | % of Total | ||
| Whole Loan(1) | $72,000,000 | 100.0% | Loan Payoff | $35,931,257 | 49.9 | % | |
| Return of Equity | 34,270,240 | 47.6 | |||||
| Closing Costs(6) | 1,507,748 | 2.1 | |||||
| Upfront Reserves | 290,755 | 0.4 | |||||
| Total Sources | $72,000,000 | 100.0% | Total Uses | $72,000,000 | 100.0 | % | |
| (1) | The GRM South Brunswick Mortgage Loan (as defined below) is part of a whole loan evidenced by three pari passu promissory notes with an aggregate original principal balance of $72,000,000 (the “GRM South Brunswick Whole Loan”). The information under “Financial Information” in the chart above is based on the aggregate outstanding principal balance of the GRM South Brunswick Whole Loan. |
| (2) | The lockout period will be at least 24 payments beginning with and including the first payment date of November 6, 2024. Defeasance of the GRM South Brunswick Whole Loan is permitted after the date that is the earlier to occur of (i) two years from the closing date of the securitization that includes the last note to be securitized and (ii) September 13, 2027. The assumed lockout of 24 payments is based on the expected BMO 2024-5C7 securitization closing date in October 2024. The actual lockout period may be longer. |
| (3) | For a full description of Escrows and Reserves, see “Escrows and Reserves” below. |
| (4) | Historical NOI is lower than underwritten NOI primarily due to the prior rent being based on a below market affiliate lease signed in 2013. In conjunction with the origination of the GRM South Brunswick Mortgage Loan (as defined below), an affiliate of the borrower sponsor, GRM Lease Holdings S Brunswick, LLC (“GRMLH”), entered into a new 15-year lease reflecting a triple-net rent of $15.00 per square foot ($7,646,625) (the “Prime Lease”), which lease is in-line with market rent and fully guaranteed by the borrower sponsor. The GRM South Brunswick Property (as defined below) is 100% occupied by GRM Information Management Services, Inc. (“GRM”), as a subtenant (the “Prime Subtenant”). Both GRMLH and GRM are 100% owned and controlled by the borrower sponsor. |
| (5) | Closing Costs include a $620,000 interest rate buy-down. |
| THE INFORMATION IN THIS COLLATERAL TERM SHEET IS NOT COMPLETE AND MAY BE AMENDED PRIOR TO THE TIME OF SALE. THIS TERM SHEET IS NOT AN OFFER TO SELL THESE SECURITIES AND IT IS NOT A SOLICITATION OF AN OFFER TO BUY THESE SECURITIES IN ANY JURISDICTION WHERE THE OFFER OR SALE IS NOT PERMITTED. | ||
| 33 | ||
| Structural and Collateral Term Sheet | BMO 2024-5C7 | |
| No. 3 – GRM South Brunswick | ||
The Loan. The third largest mortgage loan (the “GRM South Brunswick Mortgage Loan”) is part of a whole loan originated by Starwood Mortgage Capital LLC on September 13, 2024 secured by the borrower’s fee interest in a 509,775 square foot industrial warehouse property located in South Brunswick, New Jersey (the “GRM South Brunswick Property”). The GRM South Brunswick Whole Loan consists of three pari passu notes and accrues interest at a rate of 7.05000% per annum on an Actual/360 basis. The GRM South Brunswick Whole Loan has a five-year interest-only term. The GRM South Brunswick Mortgage Loan is evidenced by the controlling note A-1, which has an original and outstanding principal balance as of the Cut-off Date of $60,000,000. The remaining notes are currently held by Starwood Mortgage Funding II LLC and are expected to be contributed to one or more future securitization trust(s).
The relationship between the holders of the GRM South Brunswick Whole Loan is governed by a co-lender agreement described under “Description of the Mortgage Pool – The Whole Loans – The Serviced Pari Passu Whole Loans” in the Preliminary Prospectus.
The table below identifies the promissory notes that comprise the GRM South Brunswick Whole Loan:
| Whole Loan Summary | ||||
| Note | Original Balance | Cut-off Date Balance | Note Holder | Controlling Piece |
| A-1 | $60,000,000 | $60,000,000 | BMO 2024-5C7 | Yes |
| A-2(1) | $7,000,000 | $7,000,000 | Starwood Mortgage Funding II LLC | No |
| A-3(1) | $5,000,000 | $5,000,000 | Starwood Mortgage Funding II LLC | No |
| Whole Loan | $72,000,000 | $72,000,000 | ||
| (1) | Expected to be contributed to one or more future securitization trust(s). |
The Property. The GRM South Brunswick Property is a 509,775 square foot industrial property situated on approximately 34.6 acres located in South Brunswick, New Jersey, approximately 45 miles from New York City and approximately 55 miles from Philadelphia. The GRM South Brunswick Property is 100% occupied by GRM, a document management company, which is 100% owned and controlled by the borrower sponsor. GRM has occupied the GRM South Brunswick Property since it was acquired by the borrower sponsor (see “Sole Tenant” below).
The borrower sponsor purchased the GRM South Brunswick Property in 2013 and subsequently completed a renovation in 2014. The borrower sponsor completed a vertical expansion of the GRM South Brunswick Property which brought the clear height from approximately 25 feet to approximately 44 feet. Additionally, GRM and the borrower sponsor installed a five-level racking system for the majority of the storage area. The GRM South Brunswick Property is secured by card-key access as well as 24/7 security and video surveillance.
Sole Tenant.
GRM (509,775 square feet; 100.0% of NRA; 100.0% of underwritten base rent). GRM is a document management company that was founded in New York City in 1987 to provide a secure alternative for records storage. GRM’s storage facilities are located in 15 major metro areas, and GRM is the third largest document storage company in the United States. GRM has utilized the GRM South Brunswick Property for document storage since acquisition in 2013. At origination of the GRM South Brunswick Property Mortgage Loan, GRM entered into a new 15-year lease with the borrower at $15.00 per square foot, which is in-line with the appraisal’s concluded market rent. The GRM lease is personally guaranteed by the borrower sponsor for the full 15-year term, which term is ten year beyond the GRM South Brunswick Mortgage Loan maturity date. GRM has no lease renewal options and no termination options under its lease.
| THE INFORMATION IN THIS COLLATERAL TERM SHEET IS NOT COMPLETE AND MAY BE AMENDED PRIOR TO THE TIME OF SALE. THIS TERM SHEET IS NOT AN OFFER TO SELL THESE SECURITIES AND IT IS NOT A SOLICITATION OF AN OFFER TO BUY THESE SECURITIES IN ANY JURISDICTION WHERE THE OFFER OR SALE IS NOT PERMITTED. | ||
| 34 | ||
| Structural and Collateral Term Sheet | BMO 2024-5C7 | |
| No. 3 – GRM South Brunswick | ||
The following table presents certain information relating to the sole tenant at the GRM South Brunswick Property:
| Tenant Summary(1) | ||||||||
| Tenant | Ratings Moody’s/S&P/Fitch | Net Rentable Area (SF) | % of Total NRA | UW Base Rent PSF | UW Base Rent | % of Total UW Base Rent | Lease Exp. Date | |
| GRM(2) | NR / NR / NR | 509,775 | 100.0% | $15.00 | $7,646,625 | 100.0% | 9/12/2039 | |
| Occupied Collateral Total / Wtd. Avg. | 509,775 | 100.0% | $15.00 | $7,646,625 | 100.0% | |||
| Vacant Space | 0 | 0.0% | ||||||
| Collateral Total | 509,775 | 100.0% | ||||||
| (1) | Based on the underwritten rent roll dated September 13, 2024. |
| (2) | GRM is an affiliate of the borrower sponsor. GRM has no lease renewal options and no termination options. The GRM lease is guaranteed by the borrower sponsor. |
The following table presents certain information relating to the lease rollover schedule at the GRM South Brunswick Property:
| Lease Rollover Schedule(1) | ||||||||||||||
| Year | Number of Leases Expiring | Net Rentable Area Expiring | % of NRA Expiring | UW Base Rent Expiring | % of UW Base Rent Expiring | Cumulative Net Rentable Area Expiring | Cumulative % of NRA Expiring | Cumulative UW Base Rent Expiring | Cumulative % of UW Base Rent Expiring | |||||
| Vacant | NAP | 0 | 0.0 | % | NAP | NA | P | 0 | 0.0% | NAP | NAP | |||
| 2024 & MTM | 0 | 0 | 0.0 | $0 | 0.0 | % | 0 | 0.0% | $0 | 0.0% | ||||
| 2025 | 0 | 0 | 0.0 | 0 | 0.0 | 0 | 0.0% | $0 | 0.0% | |||||
| 2026 | 0 | 0 | 0.0 | 0 | 0.0 | 0 | 0.0% | $0 | 0.0% | |||||
| 2027 | 0 | 0 | 0.0 | 0 | 0.0 | 0 | 0.0% | $0 | 0.0% | |||||
| 2028 | 0 | 0 | 0.0 | 0 | 0.0 | 0 | 0.0% | $0 | 0.0% | |||||
| 2029 | 0 | 0 | 0.0 | 0 | 0.0 | 0 | 0.0% | $0 | 0.0% | |||||
| 2030 | 0 | 0 | 0.0 | 0 | 0.0 | 0 | 0.0% | $0 | 0.0% | |||||
| 2031 | 0 | 0 | 0.0 | 0 | 0.0 | 0 | 0.0% | $0 | 0.0% | |||||
| 2032 | 0 | 0 | 0.0 | 0 | 0.0 | 0 | 0.0% | $0 | 0.0% | |||||
| 2033 | 0 | 0 | 0.0 | 0 | 0.0 | 0 | 0.0% | $0 | 0.0% | |||||
| 2034 | 0 | 0 | 0.0 | 0 | 0.0 | 0 | 0.0% | $0 | 0.0% | |||||
| 2035 & Beyond | 1 | 509,775 | 100.0 | $7,646,625 | 100.0 | 509,775 | 100.0% | $7,646,625 | 100.0% | |||||
| Total | 1 | 509,775 | 100.0 | % | $7,646,625 | 100.0 | % | |||||||
| (1) | Based on the underwritten rent roll dated September 13, 2024. |
The Market. The GRM South Brunswick Property is located in South Brunswick, New Jersey in the Northern New Jersey industrial market and the Exit 8A industrial submarket. The neighborhood is accessible from the New Jersey Turnpike (I-95), NJ State Route 32 and US Route 130. I-95 provides accessibility to all east/west highways serving New Jersey, as well as numerous US and state highways and county/local roadways. Newark Liberty International Airport is approximately 45 minutes north of the GRM South Brunswick Property and New York City is a little more than an hour drive north. According to the appraisal, as of the second quarter of 2024, the Northern New Jersey industrial market contained 913,497,769 square feet, a vacancy rate of approximately 6.2% and asking rent of $14.10 per square foot. According to the appraisal, as of the second quarter of 2024, the Exit 8A industrial submarket contained 80,776,472 square feet, a vacancy rate of approximately 3.3% and asking rent of $13.86 per square foot. The appraisal determined market rent of $15.00 per square foot.
According to the appraisal, the 2023 population within a one-, three- and five-mile radius of the GRM South Brunswick Property was 872, 25,877, and 93,044, respectively. The 2023 average household income within the same radii was $228,235, $153,386, and $152,418, respectively.
| THE INFORMATION IN THIS COLLATERAL TERM SHEET IS NOT COMPLETE AND MAY BE AMENDED PRIOR TO THE TIME OF SALE. THIS TERM SHEET IS NOT AN OFFER TO SELL THESE SECURITIES AND IT IS NOT A SOLICITATION OF AN OFFER TO BUY THESE SECURITIES IN ANY JURISDICTION WHERE THE OFFER OR SALE IS NOT PERMITTED. | ||
| 35 | ||
| Structural and Collateral Term Sheet | BMO 2024-5C7 | |
| No. 3 – GRM South Brunswick | ||
The following table presents certain information with respect to comparable leases to the GRM South Brunswick Property as identified in the appraisal:
| Comparable Industrial Leases(1) | |||||||||
| Property Name/Location | Year Built / Renovated | Occ. % | Total NRA (SF) | Distance from Subject | Tenant Name | Lease Date/Term (Yrs.) | Lease Area (SF) | Annual Base Rent PSF | Lease Type |
GRM South Brunswick 2520 U.S. Route 130 South Brunswick, NJ | 1983 / 2014 | 100.0% | 509,775 | - | GRM | Sep. 2024 / 15.0 | 509,775 | $15.00 | NNN |
Prologis Park Cranbury 7 Santa Fe Way Cranbury, NJ | 2000 / NAP | 100.0% | 501,400 | 2.1 miles | Anixter International | Feb. 2024 / 10.0 | 501,400 | $15.85 | NNN |
Pearson Education 258 Prospect Plains Road Cranbury, NJ | 2002 / NAP | 100.0% | 1,773,625 | 1.7 miles | SLM Warehousing Inc. | Mar. 2024 / 5.6 | 255,000 | $13.95 | NNN |
Half Acre Building 324 Half Acre Road Cranbury, NJ | 2006 / NAP | 100.0% | 680,747 | 2.2 miles | L’Occitane | Sep. 2023 / 10.0 | 285,577 | $14.50 | NNN |
1250 South River Road 1250 South River Road Cranbury, NJ | 2001 / NAP | 64.1% | 223,000 | 1.0 mile | Monarch Electric | Jun. 2023 / 5.2 | 142,915 | $16.00 | NNN |
Multi-Tenant Industrial NNJ 21 South Middlesex Avenue Monroe Township, NJ | 1990 / NAP | 100.0% | 204,369 | 2.2 miles | Fleet Distribution | Mar. 2023 / 5.0 | 204,369 | $15.25 | NNN |
| (1) | Source: Appraisal, except for the GRM South Brunswick Property, which is based on the underwritten rent roll dated September 13, 2024. |
Environmental. According to the Phase I environmental assessment dated August 27, 2024, there was no evidence of any recognized environmental conditions at the GRM South Brunswick Property.
The following table presents certain information relating to the historical and current occupancy of the GRM South Brunswick Property:
| Historical and Current Occupancy(1) | |||
| 2021 | 2022 | 2023 | Current(2) |
| 100.0% | 100.0% | 100.0% | 100.0% |
| (1) | Historical Occupancies are as of December 31 of each respective year. |
| (2) | Current Occupancy is as of November 6, 2024. |
Appraisal. According to the appraisal, the GRM South Brunswick Property had an “as-is” appraised value of $126,000,000 as of August 20, 2024. The table below shows the appraisal’s “as-is” conclusions.
| Appraisal Valuation Summary(1) | ||
| Appraisal Approach | Appraised Value | Capitalization Rate(2) |
| Direct Capitalization Approach | $126,000,000 | 5.75% |
| (1) | Source: Appraisal. |
| (2) | The appraisal used a discounted cash flow approach to arrive at the appraised value. The capitalization rates shown above represent the overall capitalization rate. |
| THE INFORMATION IN THIS COLLATERAL TERM SHEET IS NOT COMPLETE AND MAY BE AMENDED PRIOR TO THE TIME OF SALE. THIS TERM SHEET IS NOT AN OFFER TO SELL THESE SECURITIES AND IT IS NOT A SOLICITATION OF AN OFFER TO BUY THESE SECURITIES IN ANY JURISDICTION WHERE THE OFFER OR SALE IS NOT PERMITTED. | ||
| 36 | ||
| Structural and Collateral Term Sheet | BMO 2024-5C7 | |
| No. 3 – GRM South Brunswick | ||
The following table presents certain information relating to the historical and underwritten cash flows at the GRM South Brunswick Property:
| Operating History and Underwritten Net Cash Flow | ||||||||
| 2021(1) | 2022(1) | 2023(1) | TTM(1)(2) | Underwritten(3) | Per Square Foot | %(4) | ||
| Rents in Place | $2,274,867 | $2,451,619 | $2,446,883 | $2,513,234 | $7,646,625 | $15.00 | 85.2 | % |
| Vacant Income | 0 | 0 | 0 | 0 | 0 | 0.00 | 0.0 | |
| Gross Potential Rent | $2,274,867 | $2,451,619 | $2,446,883 | $2,513,234 | $7,646,625 | $15.00 | 85.2 | % |
| Total Reimbursements | 805,675 | 905,199 | 1,018,253 | 1,015,480 | 1,326,255 | 2.60 | 14.8 | |
| Net Rental Income | $3,080,542 | $3,356,818 | $3,465,137 | $3,528,714 | $8,972,880 | $17.60 | 100.0 | % |
| (Vacancy/Credit Loss) | 0 | 0 | 0 | 0 | (448,644) | (0.88) | (5.0 | ) |
| Effective Gross Income | $3,080,542 | $3,356,818 | $3,465,137 | $3,528,714 | $8,524,236 | $16.72 | 95.0 | % |
| Total Expenses | $871,834 | $875,213 | $978,958 | $1,061,270 | $1,326,255 | $2.60 | 15.6 | % |
| Net Operating Income | $2,208,709 | $2,481,604 | $2,486,179 | $2,467,444 | $7,197,981 | $14.12 | 84.4 | % |
| Total TI/LC, Capex/RR | 0 | 0 | 0 | 0 | 152,933 | 0.30 | 1.8 | |
| Net Cash Flow | $2,208,709 | $2,481,604 | $2,486,179 | $2,467,444 | $7,045,049 | $13.82 | 82.6 | % |
| (1) | Historical Net Operating Income is lower than underwritten Net Operating Income primarily due to the prior rent was based on an affiliate lease signed in 2013 that was below market. In conjunction with the origination of the GRM South Brunswick Mortgage Loan, an affiliate of the borrower sponsor entered into a new 15-year lease reflecting a triple-net rent of $15.00 per square foot ($7,646,625), which lease is in-line with market rent and fully guaranteed by the borrower sponsor. |
| (2) | TTM represents the trailing 12-month period ending July 31, 2024. |
| (3) | Based on the underwritten rent roll dated September 13, 2024. |
| (4) | % column represents percent of Net Rental Income for all revenue lines and represents percent of Effective Gross Income for the remainder of fields. |
The Borrower. The borrower is Tigerlily Realty, LLC, a Delaware limited liability company and special purpose entity with one independent director. Legal counsel to the borrower delivered a non-consolidation opinion in connection with the origination of the GRM South Brunswick Mortgage Loan.
The Borrower Sponsor. The borrower sponsor is Moishe Mana. Moishe Mana is an entrepreneur and real estate investor. Mr. Mana founded his first business in the early 1980s, Moishe’s Moving Systems, a moving company in the tri-state area. Moishe Mana then founded GRM, a document and digital storage company, in 1987. Moishe Mana’s real estate investments include large industrial facilities across the country, such as the GRM South Brunswick Property, real estate in the Meatpacking District in New York City and large assemblages of property in the Wynwood and Flagler districts of Miami, Florida.
In addition to a non-recourse carve-out guaranty, the borrower and the borrower sponsor provided an unconditional payment guaranty of 25% of the GRM South Brunswick Mortgage Loan ($18,000,000). Additionally, the GRM South Brunswick Mortgage Loan is not assumable.
Property Management. The GRM South Brunswick Property is managed by M Management Inc., an affiliate of the borrower.
Escrows and Reserves. At origination, the borrower deposited into escrow approximately (i) $211,379 for real estate taxes and (ii) $79,376 for deferred maintenance.
Tax Escrows – On a monthly basis, the borrower is required to escrow 1/12th of the annual estimated tax payments, which currently equates to approximately $52,845.
Insurance Escrows – So long as no Sweep Event Period (as defined below) is occurring, insurance escrows are waived provided, among other conditions, the GRM South Brunswick Property is covered by an acceptable blanket policy (which is currently maintained).
Replacement Reserves – On a monthly basis, the borrower is required to escrow $4,248 for replacement reserves (approximately $0.10 per square foot annually).
| THE INFORMATION IN THIS COLLATERAL TERM SHEET IS NOT COMPLETE AND MAY BE AMENDED PRIOR TO THE TIME OF SALE. THIS TERM SHEET IS NOT AN OFFER TO SELL THESE SECURITIES AND IT IS NOT A SOLICITATION OF AN OFFER TO BUY THESE SECURITIES IN ANY JURISDICTION WHERE THE OFFER OR SALE IS NOT PERMITTED. | ||
| 37 | ||
| Structural and Collateral Term Sheet | BMO 2024-5C7 | |
| No. 3 – GRM South Brunswick | ||
Lockbox / Cash Management. The GRM South Brunswick Mortgage Loan is structured with a hard lockbox and springing cash management. The GRM South Brunswick Mortgage Loan requires that the borrower deliver tenant direction letters to the tenants directing such tenants to pay all rents into the lockbox account. Upon the occurrence and during the continuance of a Sweep Event Period, all funds in the lockbox account are required to be swept daily to a cash management account under the control of the lender to be applied and disbursed in accordance with the GRM South Brunswick Mortgage Loan documents and all excess cash flow funds remaining in the cash management account after the application of such funds in accordance with the GRM South Brunswick Mortgage Loan documents are required to be held by the lender in an excess cash flow reserve account as additional collateral for the GRM South Brunswick Mortgage Loan. To the extent that no Sweep Event Period is continuing, all excess cash flow funds are required to be disbursed to the borrower.
A “Sweep Event Period” will commence upon the earliest of the following: (i) the occurrence of an event of default under the GRM South Brunswick Mortgage Loan documents; (ii) the date on which the debt service coverage ratio is less than 1.30x based on the trailing 12 months or (iii) the occurrence of a Major Tenant Event Period (as defined below).
A Sweep Event Period will end: with regard to clause (i) above, upon the cure of such event of default and the lender’s acceptance of such cure in its sole and absolute discretion; with regard to clause (ii) above, upon the debt service coverage ratio based on the trailing 12-month period being at least 1.35x for two consecutive calendar quarters; and with regard to clause (iii) above, the Major Tenant Event Period is cured, as further described below.
A “Major Tenant Event Period” commences if a Major Tenant (as defined below): (i) defaults under its lease, (ii) gives notice to terminate or terminates its leased space at the GRM South Brunswick Property, (iii) becomes a debtor in any bankruptcy or other insolvency proceeding, (iv) goes dark or otherwise ceases operations at the GRM South Brunswick Property, (v) is not in physical occupancy of its space or (vi) subleases its space in violation of the GRM South Brunswick Mortgage Loan documents.
A “Major Tenant” means, individually or collectively, as the context may require, (i) GRMLH, (ii) GRM and/or (iii) their respective successors and assigns, and any replacement tenant.
Such Major Tenant Event Period will terminate: with regard to clause (i), upon the Major Tenant curing such default for one calendar quarter; with regard to clause (ii), such Major Tenant rescinds its notice to cancel or terminate its lease; with regard to clause (iii), the lease for the Major Tenant is assumed or affirmed in such proceeding and the Major Tenant, among other things, is discharged from bankruptcy such that no proceedings are ongoing; with regard to clause (iv), the Major Tenant, affiliates of the Major Tenant, the borrower or the borrower sponsor have resumed normal business operations and are open during customary hours with respect to the related Major Tenant space pursuant to such lease or leases for a period of two calendar quarters; with respect to clause (v), the Major Tenant, affiliates of the Major Tenant, the borrower or the borrower sponsor have resumed physical occupancy of the related Major Tenant space pursuant to such lease or leases for a period of two calendar quarters; and with respect to clause (vi), all non-permitted subleases have been terminated and the Major Tenant remains in possession of its premises. A Major Tenant Trigger Event Period will also terminate in the event that a Major Tenant Re-Tenanting Event (as defined below) has occurred.
A “Major Tenant Re-Tenanting Event" means that: (i) the related Major Tenant space is leased pursuant to a replacement lease (or leases) for a term of at least five years and on terms acceptable to the lender for the related space; (ii) each such Major Tenant is in occupancy of its premises, open for business and is paying full unabated rent; and (iii) all tenant improvement costs and leasing commissions provided in each such replacement lease have been paid, and the lender has received a reasonably satisfactory estoppel certificate from each such replacement tenant affirming the foregoing and that such replacement tenant is not a debtor in any bankruptcy or other insolvency proceeding.
Subordinate and Mezzanine Debt. Not permitted.
Permitted Future Subordinate or Mezzanine Debt. Not permitted.
Partial Release. Not permitted.
Ground Lease. None.
| THE INFORMATION IN THIS COLLATERAL TERM SHEET IS NOT COMPLETE AND MAY BE AMENDED PRIOR TO THE TIME OF SALE. THIS TERM SHEET IS NOT AN OFFER TO SELL THESE SECURITIES AND IT IS NOT A SOLICITATION OF AN OFFER TO BUY THESE SECURITIES IN ANY JURISDICTION WHERE THE OFFER OR SALE IS NOT PERMITTED. | ||
| 38 | ||
| Structural and Collateral Term Sheet | BMO 2024-5C7 | |
| No. 4 – 125 Summer | ||

| THE INFORMATION IN THIS COLLATERAL TERM SHEET IS NOT COMPLETE AND MAY BE AMENDED PRIOR TO THE TIME OF SALE. THIS TERM SHEET IS NOT AN OFFER TO SELL THESE SECURITIES AND IT IS NOT A SOLICITATION OF AN OFFER TO BUY THESE SECURITIES IN ANY JURISDICTION WHERE THE OFFER OR SALE IS NOT PERMITTED. | ||
| 39 | ||
| Structural and Collateral Term Sheet | BMO 2024-5C7 | |
| No. 4 – 125 Summer | ||

| THE INFORMATION IN THIS COLLATERAL TERM SHEET IS NOT COMPLETE AND MAY BE AMENDED PRIOR TO THE TIME OF SALE. THIS TERM SHEET IS NOT AN OFFER TO SELL THESE SECURITIES AND IT IS NOT A SOLICITATION OF AN OFFER TO BUY THESE SECURITIES IN ANY JURISDICTION WHERE THE OFFER OR SALE IS NOT PERMITTED. | ||
| 40 | ||
| Structural and Collateral Term Sheet | BMO 2024-5C7 | |
| No. 4 – 125 Summer | ||
| Mortgage Loan Information | Property Information | |||
| Mortgage Loan Sellers: | GACC, BMO | Single Asset / Portfolio: | Single Asset | |
| Original Principal Balance(1): | $60,000,000 | Title: | Fee | |
| Cut-off Date Principal Balance(1): | $60,000,000 | Property Type – Subtype: | Office – CBD | |
| % of IPB: | 6.3% | Net Rentable Area (SF): | 489,637 | |
| Loan Purpose: | Refinance | Location: | Boston, MA | |
| Borrowers: | OPG 125 Summer Owner (DE) LLC | Year Built / Renovated: | 1987 / 2016 | |
| Borrower Sponsor: | OPG NA Holdings (DE) LP | Occupancy: | 80.7% | |
| Interest Rate: | 6.56700% | Occupancy Date: | 9/1/2024 | |
| Note Date: | 10/8/2024 | 4th Most Recent NOI (As of): | $16,218,693 (12/31/2021) | |
| Maturity Date: | 11/6/2029 | 3rd Most Recent NOI (As of): | $17,179,749 (12/31/2022) | |
| Interest-only Period: | 61 months | 2nd Most Recent NOI (As of): | $18,572,391 (12/31/2023) | |
| Original Term: | 61 months | Most Recent NOI (As of): | $18,310,188 (TTM 6/31/2024) | |
| Original Amortization Term: | None | UW Economic Occupancy: | 81.7% | |
| Amortization Type: | Interest Only | UW Revenues: | $31,983,144 | |
| Call Protection(2): | L(24),DorYM1(33),O(4) | UW Expenses: | $13,572,636 | |
| Lockbox / Cash Management: | Hard / Springing | UW NOI: | $18,410,508 | |
| Additional Debt(1): | Yes | UW NCF: | $17,578,125 | |
| Additional Debt Balance(1): | $42,635,000 | Appraised Value / Per SF: | $167,900,000 / $343 | |
| Additional Debt Type(1): | Pari Passu | Appraisal Date: | 7/8/2024 | |
| Escrows and Reserves(3) | Financial Information | |||||
| Initial | Monthly | Initial Cap | Cut-off Date Loan / Unit: | $210 | ||
| Taxes: | $0 | Springing | N/A | Maturity Date Loan / Unit: | $210 | |
| Insurance: | $0 | Springing | N/A | Cut-off Date LTV: | 61.1% | |
| Replacement Reserves: | $0 | $8,161 | N/A | Maturity Date LTV: | 61.1% | |
| TI / LC: | $10,000,000 | $61,205 | N/A | UW NCF DSCR: | 2.57x | |
| Other Reserve: | $402,315 | $0 | N/A | UW NOI Debt Yield: | 17.9% | |
| Sources and Uses | ||||||||
| Sources | Proceeds | % of Total | Uses | Proceeds | % of Total | |||
| Mortgage Loan | $102,635,000 | 68.9 | % | Prior Loan Payoff | $135,690,150 | 91.1 | % | |
| Borrower Sponsor Equity | 46,322,255 | 31.1 | Upfront Reserves | 10,402,315 | 7.0 | |||
| Closing Costs(2) | 2,864,790 | 1.9 | ||||||
| Total Sources | $148,957,255 | 100.0 | % | Total Uses | $148,957,255 | 100.0 | % | |
| (1) | The 125 Summer Mortgage Loan (as defined below) is part of the 125 Summer Whole Loan (as defined below) which is comprised of six pari passu promissory notes with an aggregate original principal balance of $102,635,000. The 125 Summer Mortgage Loan was originated by GACC and BMO on October 8, 2024. The Financial Information in the chart above is based on the aggregate outstanding principal balance as of the Cut-off Date of the 125 Summer Whole Loan. |
| (2) | Defeasance of the 125 Summer Whole Loan is permitted at any time after the earlier to occur of (a) the end of the two-year period commencing on the closing date of the securitization of the last promissory note representing a portion of the 125 Summer Whole Loan to be securitized and (b) October 8, 2027. The assumed defeasance lockout period of 24 payments is based on the anticipated closing date of the BMO 2024-5C7 securitization trust in October 2024. The actual lockout period may be longer. |
| (3) | See “Escrows and Reserves” below for further discussion of reserve information. |
| THE INFORMATION IN THIS COLLATERAL TERM SHEET IS NOT COMPLETE AND MAY BE AMENDED PRIOR TO THE TIME OF SALE. THIS TERM SHEET IS NOT AN OFFER TO SELL THESE SECURITIES AND IT IS NOT A SOLICITATION OF AN OFFER TO BUY THESE SECURITIES IN ANY JURISDICTION WHERE THE OFFER OR SALE IS NOT PERMITTED. | ||
| 41 | ||
| Structural and Collateral Term Sheet | BMO 2024-5C7 | |
| No. 4 – 125 Summer | ||
The Loan. The fourth largest mortgage loan (the “125 Summer Mortgage Loan”) is part of a whole loan (the “125 Summer Whole Loan”) that is evidenced by six pari passu promissory notes in the aggregate original principal amount of $102,635,000 secured by a first lien mortgage on the borrower’s fee simple interest in a 489,637 square foot office property located in Boston, Massachusetts (the “125 Summer Property”). The 125 Summer Whole Loan was co-originated by German American Capital Corporation (“GACC”) and Bank of Montreal (“BMO”) on October 8, 2024 and has an outstanding principal balance as of the Cut-off Date of $102,635,000. The 125 Summer Whole Loan accrues interest at a fixed rate of 6.56700% per annum on an Actual/360 basis. The 125 Summer Whole Loan has a 61-month term and is interest-only for the full term. The scheduled maturity date of the 125 Summer Whole Loan November 6, 2029. The 125 Summer Mortgage Loan is evidenced by the controlling note A-1 and non-controlling note A-4, with an original principal balance of $60,000,000.
The relationship between the holders of the 125 Summer Whole Loan is governed by a co-lender agreement as described under “Description of the Mortgage Pool—The Whole Loans—The Serviced Pari Passu Whole Loans” and “Pooling and Servicing Agreement” in the Preliminary Prospectus. The 125 Summer Whole Loan will be serviced pursuant to the pooling and servicing agreement for the BMO 2024-5C7 transaction.
The table below identifies the promissory notes that comprise the 125 Summer Whole Loan:
| Whole Loan Summary | |||||
| Note | Original Balance | Cut-off Date Balance | Note Holder | Controlling Piece | |
| A-1 | $36,000,000 | $36,000,000 | BMO 2024-5C7 | Yes | |
| A-2(1) | $9,000,000 | $9,000,000 | GACC | No | |
| A-3(1) | $16,581,000 | $16,581,000 | GACC | No | |
| A-4 | $24,000,000 | $24,000,000 | BMO 2024-5C7 | No | |
| A-5(1) | $6,000,000 | $6,000,000 | BMO | No | |
| A-6(1) | $11,054,000 | $11,054,000 | BMO | No | |
| Whole Loan | $102,635,000 | $102,635,000 | |||
| (1) | Expected to be contributed to one or more future securitization trusts. |
The Property. The 125 Summer Street Property is a 22-story, Class A, LEED Gold office building located in downtown Boston, Massachusetts. The 125 Summer Property consists of 489,637 square feet of office / retail space and was constructed in 1987 and most recently renovated in 2016. The 125 Summer Property is located adjacent to the historic Dewey Square, in Boston’s financial district and is in close proximity to public transportation such as the South Station – Amtrak, MBTA and Red Line (2 minute walk from the 125 Summer Property). A variety of upgraded common amenities, including a tenant-only fitness center, street level retail–featuring Boston’s famous Tatte bakery–and social spaces, extend the work spaces beyond the office floors. In addition, the 125 Summer Property features a 283-spot parking garage, EV charging stations, bike storage and green/outdoor space.
In 2016, the borrower sponsor invested approximately $16 million to modernize the lobby and enhance the retail and landscaping area on-site. In addition, the borrower sponsor invested approximately $2 million to install a bike room / storage area, state-of-the-art fitness center, and locker room. In total since the acquisiton of the 125 Summer Property in 2014, the borrower sponsors has spent more than $54.8 million in capital improvements including LEED upgrades, common area upgrades, garage coating, and office build-out costs. The 125 Summer Property achieved LEED gold recertification in 2022 and was the 2021 BOMA Toby winner in 250,000-500,000 square foot category for the fourth consecutive year. The borrower sponsor’s cash basis into the 125 Summer Property is approximately $347.3 million representing the purchase price plus their invested capital to date. At loan origination, the borrower sponsors contributed an additional $46.3 million in equity.
As of September 1, 2024, the 125 Summer Property was 80.7% leased to a diverse tenant base of 15 tenants across multiple industries. No tenant accounts for more than 32.6% of net rentable area. The top tenants include Klaviyo (global headquarters), Haemonetics Corporation (global headquarters), Asics America Corporation (east coast headquarters), Analog Devices and Novetta. The retail tenant mix includes Starbucks, Cava Mezze Grill, Juicy Greens, and Petra Barber Shop.
Major Tenants. The three largest tenants at the 125 Summer Property by underwritten base rent are Klaviyo, Haemonsitics Corporation and Asics America Corporation.
Klaviyo (159,860 square feet; 32.6% of NRA; 43.9% of underwritten base rent). Klaviyo, Inc is a global technology company that provides an automatic marketing platform that is commonly used for email markets and short message service
| THE INFORMATION IN THIS COLLATERAL TERM SHEET IS NOT COMPLETE AND MAY BE AMENDED PRIOR TO THE TIME OF SALE. THIS TERM SHEET IS NOT AN OFFER TO SELL THESE SECURITIES AND IT IS NOT A SOLICITATION OF AN OFFER TO BUY THESE SECURITIES IN ANY JURISDICTION WHERE THE OFFER OR SALE IS NOT PERMITTED. | ||
| 42 | ||
| Structural and Collateral Term Sheet | BMO 2024-5C7 | |
| No. 4 – 125 Summer | ||
marketing. A vast majority of the 143,000 merchants who use Klaviyo’s software services are E-Commerce businesses that market their products on Shopify. Klaviyo was founded in 2012 by Andrew Bialecki and Ed Hallen. In August of 2022, Shopify announced that Klaviyo would act as the recommended email solution partner store for its Shopify Plus merchant. As a result, Shopify committed $100 million as a strategic investment into the company. In May of 2023, Klaviyo became a public company raising $576 million in the Initial Public Offering with a $9.2 billion valuation. They have posted TTM revenues of more than $750 million.
The 125 Summer Property is used as the global headquarters for Klaviyo. According to the borrower sponsor, Klaviyo has invested a significant amount of their own capital, above their allotted TI package, which includes the build out of a 3-story atrium (which would cost approximately $3.0 million to restore if vacated), a large deck overlooking the greenway, a speakeasy, and a golf simulator. In total, the estimated buildout of the Klaviyo space was approximately $40.0 million. Klaviyo has no termination options and one five-year renewal option. Klaviyo is in discussions with the borrower sponsor to expand their footprint at the 125 Summer Property, but no terms have been finalized and we cannot assure you any such expansion occurs. The 125 Summer Whole Loan is structured with an 18 month cash flow sweep ahead of the lease expiration date in March 2028, which is equivalent to approximately $111 PSF collected to re-tenant their respective space (see Lockbox / Cash Management below). In addition, the 125 Summer Whole Loan is structured with a $10.0 million upfront TI/LC reserve for future leasing.
Haemonetics Corporation (“Haemonetics”) (62,242 square feet; 12.7% of NRA; 15.4% of underwritten base rent). Haemonetics is a global healthcare company dedicated to providing a suite of innovative medical products and solutions for customers with the aim of reducing the cost of healthcare while improving patient care. Their technology addresses medical markets including blood and plasma collection, the surgical suite, and hospital transfection services. The company’s products are split into two categories which are donor products, marketed towards the blood donation industry, and products marketed to the surgical suite for blood loss management for patients. The company has approximately 3,300 employees with a market cap of $4 billion. Revenues in March TTM were approximately $1.3 billion while EBITDA was nearly $269 millon.
The company’s global headquarters are located at the 125 Summer Street Property. Haemonetics has no termination options and no renewal options.
Asics America Corporation (“Asics”) (56,934 square feet; 11.6% of NRA; 12.4% of underwritten base rent). Asics America Corporation is a Japanese multinational corporation that produces sportswear. Asics is most recognized for its sneakers but also produces other footwear such as sandals. In addition, Asics manufactures clothing and accessory items. In 2021, the company launched Unoha, a sub-brand that is focused on serving women. They focus on using organic and environmentally friendly materials in their products. The 125 Summer Street Property is used as the company’s East Coast headquarters. Asics has no termination options and two five-year renewal options.
The following information presents certain information relating to the historical occupancy of the 125 Summer Property:
| Historical and Current Occupancy(1) | |||||
| 2019 | 2020 | 2021 | 2022 | 2023 | Current(2) |
| 87.0% | 88.0% | 86.0% | 84.0% | 79.0% | 80.7% |
| (1) | Historical occupancies are as of December 31 of each respective year. |
| (2) | Current occupancy is based on the underwritten rent roll as of Sepetember 1, 2024. |
| THE INFORMATION IN THIS COLLATERAL TERM SHEET IS NOT COMPLETE AND MAY BE AMENDED PRIOR TO THE TIME OF SALE. THIS TERM SHEET IS NOT AN OFFER TO SELL THESE SECURITIES AND IT IS NOT A SOLICITATION OF AN OFFER TO BUY THESE SECURITIES IN ANY JURISDICTION WHERE THE OFFER OR SALE IS NOT PERMITTED. | ||
| 43 | ||
| Structural and Collateral Term Sheet | BMO 2024-5C7 | |
| No. 4 – 125 Summer | ||
The following table presents certain information relating to the major tenants at the 125 Summer Property:
Top Tenant Summary(1) | |||||||||
| Tenant | Ratings Moody’s/S&P/Fitch(2) | Net Rentable Area (SF) | % of Total NRA | UW Base Rent PSF | UW Base Rent | % of Total UW Base Rent | Lease Exp. Date | ||
| Klaviyo | NR/NR/NR | 159,860 | 32.6 | % | $75.01 | $11,991,542 | 43.9 | % | 3/31/2028 |
| Haemonetics Corporation | NR/NR/NR | 62,242 | 12.7 | $68.07 | 4,236,681 | 15.5 | 6/30/2032 | ||
| Asics America Corporation | NR/NR/NR | 56,934 | 11.6 | $59.23 | 3,372,302 | 12.4 | 12/31/2029% | ||
| Analog Devices | NR/NR/NR | 45,955 | 9.4 | $66.72 | 3,066,165 | 11.2 | 12/30/2030 | ||
| Novetta / Accenture Federal Service | NR/NR/NR | 21,536 | 4.4 | $60.50 | 1,302,928 | 4.8 | 12/31/2025 | ||
| OPG 125 Summer TRS (DE) | NR/NR/NR | 13,926 | 2.8 | $75.48 | 1,051,134 | 3.9 | 10/31/2025 | ||
| The Northern Trust Company | A2/A+/AA- | 9,393 | 1.9 | $79.59 | 747,589 | 2.7 | 7/31/2031 | ||
| Korn/Ferry Canada Inc. | NR/NR/NR | 7,674 | 1.6 | $77.52 | 594,888 | 2.2 | 3/31/2028 | ||
| Sage Analysis Group(3) | NR/NR/NR | 5,000 | 1.0 | $71.00 | 355,000 | 1.3 | 12/31/2029 | ||
| Tatte Holdings | NR/NR/NR | 4,178 | 0.9 | $53.05 | 221,643 | 0.8 | 1/31/2029 | ||
| Major Tenants | 386,698 | 79.0 | % | $69.67 | $26,939,871 | 98.7 | % | ||
| Other Tenants | 8,433 | 1.7 | % | $42.42 | 357,751 | 1.3 | % | ||
| Occupied Collateral Total | 395,131 | 80.7 | % | $54.52 | $27,297,622 | 100.0 | % | ||
| Vacant Space | 94,506 | 19.3 | |||||||
| Collateral Total | 489,637 | 100.0 | % | ||||||
| (1) | Based on the underwritten rent roll dated September 1, 2024. |
| (2) | In certain instances, ratings provided are those of the parent company of the entity shown, whether or not the parent company guarantees the lease. |
| (3) | Sage Analysis Group will begin moving into their space in November 2024. |
The following table presents certain information relating to the lease rollover schedule at the 125 Summer Property:
| Lease Rollover Schedule(1) | ||||||||||||
| Year | Number of Leases Expiring | Net Rentable Area Expiring | % of NRA Expiring | UW Base Rent Expiring | % of UW Base Rent Expiring | Cumulative Net Rentable Area Expiring | Cumulative % of NRA Expiring | Cumulative UW Base Rent Expiring | Cumulative % of UW Base Rent Expiring | |||
| Vacant | NAP | 94,506 | 19.3 | % | NAP | NAP | 94,506 | 19.3% | NAP | NAP | ||
| 2024 & MTM | 0 | 0 | 0.0 | $0 | 0.0 | % | 94,506 | 19.3% | $0 | 0.0% | ||
| 2025 | 1 | 21,536 | 4.4 | 1,302,928 | 4.8 | 116,042 | 23.7% | $1,302,928 | 4.8% | |||
| 2026 | 0 | 0 | 0.0 | 0 | 0.0 | 116,042 | 23.7% | $1,302,928 | 4.8% | |||
| 2027 | 2 | 2,531 | 0.5 | 181,051 | 0.7 | 118,573 | 24.2% | $1,483,979 | 62.8% | |||
| 2028 | 9 | 167,534 | 34.2 | 12,586,430 | 46.1 | 286,107 | 58.4% | $14,070,409 | 80.4% | |||
| 2029 | 6 | 69,164 | 14.1 | 3,948,945 | 14.5 | 355,271 | 72.6% | $18,019,354 | 92.5% | |||
| 2030 | 6 | 59,881 | 12.2 | 4,117,299 | 15.1 | 415,152 | 84.8% | $22,136,653 | 97.5% | |||
| 2031 | 1 | 9,393 | 1.9 | 747,589 | 2.7 | 424,545 | 86.7% | $22,884,242 | 100.0% | |||
| 2032 | 5 | 62,242 | 12.7 | 4,236,681 | 15.5 | 486,787 | 99.4% | $27,120,922 | 100.0% | |||
| 2033 | 0 | 0 | 0.0 | 0 | 0.0 | 486,787 | 99.4% | $27,120,922 | 100.0% | |||
| 2034 | 1 | 2,850 | 0.6 | 176,700 | 0.6 | 489,637 | 100.0% | $27,297,622 | 100.0% | |||
| 2035 & Beyond | 0 | 0 | 0.0 | 0 | 0.0 | 489,637 | 100.0% | $27,297,622 | 100.0% | |||
| Total | 31 | 489,637 | 100.0 | % | 27,297,622 | 100.0 | % | |||||
| (1) | Based on the underwritten rent roll dated September 1, 2024. |
| THE INFORMATION IN THIS COLLATERAL TERM SHEET IS NOT COMPLETE AND MAY BE AMENDED PRIOR TO THE TIME OF SALE. THIS TERM SHEET IS NOT AN OFFER TO SELL THESE SECURITIES AND IT IS NOT A SOLICITATION OF AN OFFER TO BUY THESE SECURITIES IN ANY JURISDICTION WHERE THE OFFER OR SALE IS NOT PERMITTED. | ||
| 44 | ||
| Structural and Collateral Term Sheet | BMO 2024-5C7 | |
| No. 4 – 125 Summer | ||
The following table presents certain information relating to the historical and underwritten cash flows of the 125 Summer Property:
| Operating History and Underwritten Net Cash Flow | ||||||||
| 2021 | 2022 | 2023 | TTM(1) | Underwritten | Per Square Foot | %(2) | ||
| In Place Rent | $25,402,262 | $25,969,178 | 27,217,520 | $27,027,846 | $27,297,622 | $55.75 | 69.7 | % |
| Rent Step | 0 | 0 | 0 | 0 | 470,460 | 0.96 | 1.2 | |
| IG Rent Steps | 0 | 0 | 0 | 0 | 20,655 | 0.04 | 0.1 | |
| Value of Vacant Space | 0 | 0 | 0 | 0 | 7,169,750 | 14.64 | 18.3 | |
| Gross Potential Rent | $25,402,262 | $25,969,178 | $27,217,520 | $27,027,846 | $34,958,488 | $71.40 | 89.3 | % |
| Other Income | 1,044,975 | 1,473,998 | 1,777,871 | 1,754,267 | 1,386,644 | 2.83 | 3.5 | |
| Total Reimbursements | 1,420,371 | 1,850,741 | 2,413,270 | 2,396,975 | 2,807,762 | 2.90 | 7.2 | |
| Total Gross Income | $27,867,608 | $29,293,917 | $31,408,661 | $31,179,088 | $39,152,894 | $79.96 | 100.0 | % |
| (Vacancy/Credit Loss) | 0 | 0 | 0 | 0 | (7,169,750) | (14.64) | (22.4 | ) |
| Effective Gross Income | $27,867,608 | $29,293,917 | $31,408,661 | $31,179,088 | $31,983,144 | $65.32 | 100.0 | % |
| Total Expenses | $11,648,915 | $12,114,168 | $12,836,270 | $12,868,900 | $13,572,636 | $27.72 | 42.4 | % |
| Net Operating Income | $16,218,693 | $17,179,748 | $18,572,391 | $18,310,188 | $18,410,508 | $37.60 | 57.6 | % |
| Capital Expenditures | 0 | 0 | 0 | 0 | 97,927 | 0.20 | 0.3 | |
| TI/LC | 0 | 0 | 0 | 0 | 734,456 | 1.50 | 2.3 | |
| Net Cash Flow | $16,218,693 | $17,179,748 | $18,572,391 | $18,310,188 | $17,578,125 | $35.90 | 55.0 | % |
| (1) | TTM represents the trailing 12-month period ending July 25, 2024. |
| (2) | % column represents percent of Total Gross Income for all revenue lines and represents percent of Effective Gross Income for the remainder of fields. |
Environmental. According to the Phase I environmental site assessment dated July 25, 2024, there was no evidence of any recognized environmental conditions at the 125 Summer Property.
The Market. The 125 Summer Property is located in the heart of the city’s financial district, adjacent to the historic Dewey Square. This location offers conveneient access to public transit and major highways. The surrounding Boston area is concentrated in information, professional and business services, education and health services, and financial services. Mass General, Harvard, MIT, Fidelity, and Mass Mutual act as some of the most significant employers within the region. The 125 Summer Property is positioned with close proximity to the red line, South Station, and the Fort Point Channel. In addition, the location is accessible from I-93 (North and South) and the Massachusetts Turnpike.
The 125 Summer Property is located in the Financial District Class A submarket of the Metro Boston Class A market. The Financial District Class A submarket accounts for 48% of all class A office inventory within the Metro Boston Class A market. The average vacancy rate for the submarket is 16.7% as of the end of the first quarter of 2024. According to a third party market report, 2025 will exhibit over a 40% decrease in office deliveries compared to 2024. According to the appraisal, the office base rent in the submarket is $49.12 per SF.
According to a third-party market research report, the 2023 population within a one-, three- and five-mile radius of the 125 Summer Property was 59,845, 429,799 and 998,390, respectively. The 2023 average household income within the same radii was $193,363, $156,195 and $141,965, respectively.
| THE INFORMATION IN THIS COLLATERAL TERM SHEET IS NOT COMPLETE AND MAY BE AMENDED PRIOR TO THE TIME OF SALE. THIS TERM SHEET IS NOT AN OFFER TO SELL THESE SECURITIES AND IT IS NOT A SOLICITATION OF AN OFFER TO BUY THESE SECURITIES IN ANY JURISDICTION WHERE THE OFFER OR SALE IS NOT PERMITTED. | ||
| 45 | ||
| Structural and Collateral Term Sheet | BMO 2024-5C7 | |
| No. 4 – 125 Summer | ||
The following table presents recent leasing data at comparable properties to the 125 Summer Property:
| Comparable Office Leases(1) | |||||||
Property Name Location | Year Built / Renovated | Total NRA (SF) |
Tenant | Lease Date/ Term (Mos.) | Lease Size (SF) | Base Rent PSF | Reimb. |
125 Summer Boston, MA | 1987 / 2016 | 489,637(2) | Klaviyo | Various / 103.8 | 159,860(2) | $75.01(2) | Gross |
155 Federal Street Boston, MA | 1983 / NAP | 192,000 | R4 Capital LLC | Jun-25 / 128 | 11,269 | $55.00 | Modified Gross |
1 Federal Street Boston, MA | 1976 / 1995 | 1,115,366 | FTI Consulting | Apr-24 / 127 | 25,244 | $76.00 | Gross + TE |
1 Federal Street Boston, MA | 1976 / 1995 | 1,115,366 | McNamara Salvia | Nov-24 / 132 | 105,997 | $71.42 | Modified Gross |
99 High Street Boston, MA | 1971 / 2019 | 729,666 | SGA Architects | Jan-24 / 120 | 20,256 | $62.00 | Gross + TE |
100 Summer Street Boston, MA | 1974 / 2016 | 1,118,537 | Veeva Systems Inc. | Sep-25 / 142 | 25,724 | $79.00 | Modified Gross |
| (1) | Information obtained from the appraisal unless otherwise indicated. |
| (2) | Based on the underwritten rent roll dated September 1, 2024, inclusive of rent steps through June 2025 totaling $36,055. |
The Borrowers. The borrower is OPG 125 Summer Owner (DE) LLC, a Delaware limited liability company and single purpose entity with two independent directors in its organizational structure.
The Borrower Sponsor. The borrower sponsors are AH 125 Summer Boston LP, OPG Investment Holdings GP (US), LLC and OPG NA Holdings (DE) LP and the non-recourse carveout guarantor is OPG NA Holdings (DE) LP, a subsidiary of Oxford Property Group (“Oxford”). The 125 Summer Property is owned by a joint venture between Oxford (45%) and Alony Hetz Properties & Investments Ltd. (55%). Oxford and its platform companies manage properties across four continents and eight sectors, representing nearly 145 million square feet of commercial space, over 3,400 hotel rooms, nearly 10,000 residential units and a substantial credit portfolio.
Established in 1989, Alony Hetz Properties & Investments Ltd. (“Alony Hetz”) is one of Israel’s largest real-estate investment holding companies. Alony Hetz focuses on holding commercial real estate in Israel and overseas, primarily with long-term leases to quality tenants. Alony Hetz has a reputation for its highly efficient management practices, and for its outstanding record of investments and strong & stable financial resources.
Property Management. The 125 Summer Property is managed by Oxford I Asset Management USA Inc, an affiliate of the borrower sponsor.
Escrows and Reserves. At origination, the borrowers deposited (i) $10,000,000 for future tenant improvements and leasing commissions, (ii) $313,565 for outstanding approved leasing expenses and (iii) $88,750 for outstanding free/gap rent.
Tax Escrows – On a monthly basis during the continuance of a Trigger Period (as defined below), the borrowers are required to deposit 1/12th of an amount that would be sufficient to pay taxes for the next ensuing 12 months.
Insurance Escrows – On a monthly basis, the borrower is required to deposit 1/12th of an amount that would be sufficient to pay insurance premiums for the renewal of coverages; provided, such monthly deposits will be waived so long as the borrowers maintain a blanket insurance policy acceptable to the lender.
Replacement Reserve – On a monthly basis, the borrower is required to deposit $8,161 for replacement reserves.
TI / LC Reserve – On a monthly basis, the borrower is required to deposit $61,205 for rollover reserves.
Lockbox / Cash Management. The 125 Summer Whole Loan is structured with a hard lockbox and springing cash management. At origination of the 125 Summer Whole Loan, the borrower was required to establish and maintain a lockbox and clearing account controlled by the lender (the “Clearing Account”) at a financial institution reasonably acceptable to
| THE INFORMATION IN THIS COLLATERAL TERM SHEET IS NOT COMPLETE AND MAY BE AMENDED PRIOR TO THE TIME OF SALE. THIS TERM SHEET IS NOT AN OFFER TO SELL THESE SECURITIES AND IT IS NOT A SOLICITATION OF AN OFFER TO BUY THESE SECURITIES IN ANY JURISDICTION WHERE THE OFFER OR SALE IS NOT PERMITTED. | ||
| 46 | ||
| Structural and Collateral Term Sheet | BMO 2024-5C7 | |
| No. 4 – 125 Summer | ||
the lender, which satisfies rating agency criteria, into which all rents, revenues and receipts from the 125 Summer Property are required to be deposited directly by the tenants. For so long as a Trigger Period (as defined below) is continuing and has not otherwise been cured, all sums deposited into the Clearing Account will be transferred into the borrower’s operating account on a daily basis. Following a Trigger Period and so long as such Trigger Period is continuing and has not been cured, any transfers to the borrower’s operating account will cease and such sums on deposit in the Clearing Account will be transferred on a daily basis to an account controlled by the lender, at a financial institution selected by the lender, to be applied to payment of all monthly amounts due under the 125 Summer Whole Loan Documents (including, without limitation, taxes and insurance (unless the 125 Summer Property is insured under a “blanket” policy acceptable to the lender), debt service and required reserves) and approved property operating expenses (including all approved budgeted property operating expenses) and approved capital expenditures, with any excess funds (the “Excess Funds”) being deposited, (A) during a Trigger Period continuing due to a Lease Sweep Period (regardless of whether any other Trigger Period is continuing), to the lease sweep reserve account to be held and disbursed in accordance with the 125 Summer Whole Loan documents; or (B) during a Trigger Period (other than a Lease Sweep Period) to the lender’s cash collateral account to be held or disbursed in accordance with the 125 Summer Whole Loan documents.
A “Trigger Period” means a period commencing upon the occurrence of (i) an event of default under the 125 Summer Whole Loan documents; (ii) the debt yield is less than 9.0% as of any calculation date (iii) if the manager is an affiliate of the borrower or guarantor and such manager is bankrupt or insolvent; (iv) the commencement of a Lease Sweep Period.
A “Lease Sweep Period” will commence on the first monthly payment date following (or in the case of clause (a)(x) below, the monthly payment date preceding) the occurrence of any of the following: (a) with respect to each Lease Sweep Lease, the earlier to occur of: (x) 18 months prior to the earliest stated expiration (including the stated expiration of any renewal term) of a Lease Sweep Lease, and (y) the date required under a Lease Sweep Lease by which the tenant thereunder is required to give notice of its exercise of a renewal option thereunder (and such renewal has not been so exercised); (b) the receipt by the borrower or property manager of notice from any tenant under a Lease Sweep Lease exercising its right to terminate its Lease Sweep Lease; (c) the date that a Lease Sweep Lease (or any material portion thereof) is, cancelled or terminated or the receipt by borrower or property manager of notice from any tenant under a Lease Sweep Lease of its intent to surrender, cancel or terminate the Lease Sweep Lease (or any material pertion thereof); (d) the date that any tenant under a Lease Sweep Lease has ceased operating its business (i.e., “goes dark”) at the 125 Summer Property (or the majority thereof) or gives notice that it intends to discontinue its business at its space at the 125 Summer Property (or a majority thereof) (e) upon a monetary or material non-monetary default under a Lease Sweep Lease by the tenant thereunder that continues beyond any applicable notice and cure period; or (f) the occurrence of certain bankruptcy or insolvency events relating to the Lease Sweep Lease tenant or its parent company or lease guarantor.
A Lease Sweep Period will end upon (A) in the case of clauses (a), (b) (c) or (d) above, when the entirety of the Lease Sweep Space (or applicable portion) is leased pursuant to one or more Qualified Leases (as defined below) (or, if applicable, the applicable Lease Sweep Lease is renewed) and sufficient funds have been accumulated in the lease sweep reserve (during the continuance of the applicable Lease Sweep Period), to cover all anticipated leasing expenses, free rent periods, and/or rent abatement periods set forth in all such Qualified Leases (collectively “Reletting Expenses”) and any shortfalls in required payments under the 125 Summer Whole Loan documents or operating expenses as a result of any anticipated down time prior to the commencement of payments under such Qualified Leases; (B) in the case of clause (a) above, the date on which the tenant under the Lease Sweep Lease exercises its renewal or extension option with respect to all of its Lease Sweep Lease tenant space, and sufficient funds have been accumulated in the lease sweep reserve to cover all Reletting Expenses; (C) in the case of clause (b) or clase (c) above, if such termination option is not validly exercised by the applicable tenant by the latest exercise date specified in such Lease Sweep Lease or is otherwise validly waived in writing by the tenant; (D) in the case of clause (e) above, the default has been cured; or (E) in the case of clause (f) above, (a) the applicable bankruptcy or insolvency proceeding has terminated and the applicable Lease Sweep Lease, and each guaranty of the Lease Sweep Lease (if any), has been affirmed or assumed, in a manner reasonably satisfactory to the lender pursuant to a final, non-appealable order of the bankruptcy court, and all defaults under the Lease Sweep Lease are cured and the tenant is paying full, unabated rent and (b) adequate assurance of future performance under the Lease Sweep Lease and, if applicable, each guaranty of the Lease Sweep Lease as reasonably determined by the lender is provided.
A "Lease Sweep Lease" means the Klaviyo lease, or (ii) any replacement lease that, either individually, or when taken together with any other lease with the same tenant or its affiliates, and assuming the exercise of all expansion rights and all preferential rights to lease additional space contained in such lease, covers the majority of the applicable space leased under the Klayvio lease.
| THE INFORMATION IN THIS COLLATERAL TERM SHEET IS NOT COMPLETE AND MAY BE AMENDED PRIOR TO THE TIME OF SALE. THIS TERM SHEET IS NOT AN OFFER TO SELL THESE SECURITIES AND IT IS NOT A SOLICITATION OF AN OFFER TO BUY THESE SECURITIES IN ANY JURISDICTION WHERE THE OFFER OR SALE IS NOT PERMITTED. | ||
| 47 | ||
| Structural and Collateral Term Sheet | BMO 2024-5C7 | |
| No. 4 – 125 Summer | ||
A “Qualified Lease” means either: (A) the original Lease Sweep Lease, as extended in accordance with (i) the express renewal option set forth therein and, with respect to which, the terms of such renewal are on market terms with respect to, among other things, base rent, additional rent and recoveries and tenant improvement allowances or (ii) a modification of the Lease Sweep Lease reasonably approved by the lender, or (B) a replacement lease (i) with a term that extends at least three years beyond the maturity date of the 125 Summer Whole Loan and with an initial term of at least five years,(ii) entered into in accordance with the 125 Summer Whole Loan documents and (iii) on market terms with respect to, among other things, additional rent and recoveries and tenant improvement allowances and base rent equal to or greater than market base rent.
Subordinate and Mezzanine Debt. None.
Permitted Future Mezzanine and Subordinate Debt. Not permitted.
Partial Release. Not permitted.
Ground Lease. None.
Ground Lease. Income received by OPG 125 Summer TRS (DE) LLC (the “TRS Entity”) pursuant to the TRS Service Agreement and other qualifying TRS contracts flows through the TRS to a separate TRS clearing account over which Lender has a security interest. Funds on deposit in the TRS clearing account will be transferred to a Lender controlled account during the continuance of a Trigger Period. The TRS Service Agreement is also subordinate to the mortgage.
| THE INFORMATION IN THIS COLLATERAL TERM SHEET IS NOT COMPLETE AND MAY BE AMENDED PRIOR TO THE TIME OF SALE. THIS TERM SHEET IS NOT AN OFFER TO SELL THESE SECURITIES AND IT IS NOT A SOLICITATION OF AN OFFER TO BUY THESE SECURITIES IN ANY JURISDICTION WHERE THE OFFER OR SALE IS NOT PERMITTED. | ||
| 48 | ||
| Structural and Collateral Term Sheet | BMO 2024-5C7 | |
| No. 5 – Tank Holding Portfolio | ||
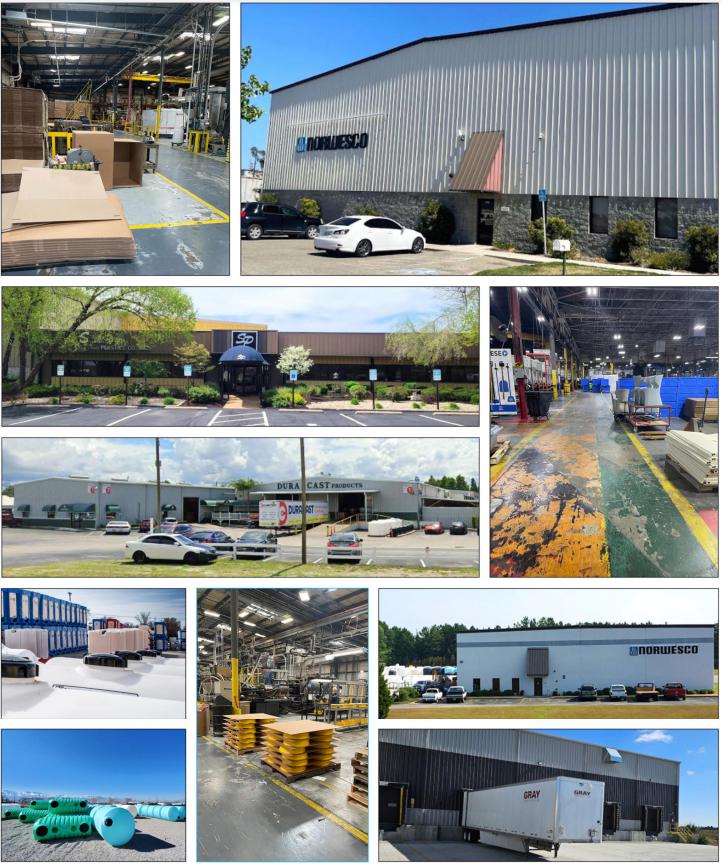
| THE INFORMATION IN THIS COLLATERAL TERM SHEET IS NOT COMPLETE AND MAY BE AMENDED PRIOR TO THE TIME OF SALE. THIS TERM SHEET IS NOT AN OFFER TO SELL THESE SECURITIES AND IT IS NOT A SOLICITATION OF AN OFFER TO BUY THESE SECURITIES IN ANY JURISDICTION WHERE THE OFFER OR SALE IS NOT PERMITTED. | ||
| 49 | ||
| Structural and Collateral Term Sheet | BMO 2024-5C7 | |
| No. 5 – Tank Holding Portfolio | ||
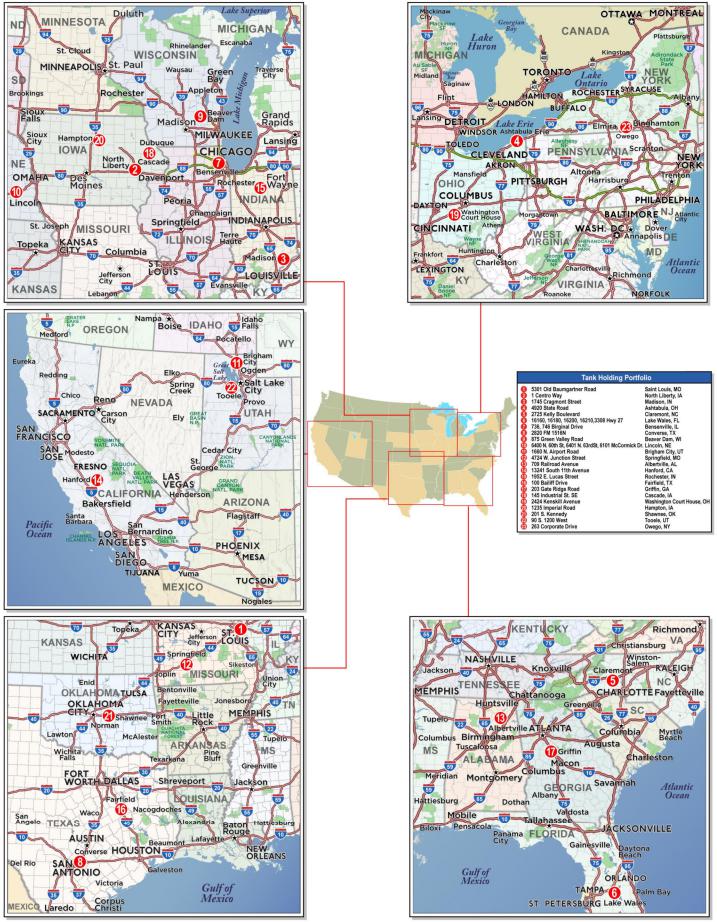
| THE INFORMATION IN THIS COLLATERAL TERM SHEET IS NOT COMPLETE AND MAY BE AMENDED PRIOR TO THE TIME OF SALE. THIS TERM SHEET IS NOT AN OFFER TO SELL THESE SECURITIES AND IT IS NOT A SOLICITATION OF AN OFFER TO BUY THESE SECURITIES IN ANY JURISDICTION WHERE THE OFFER OR SALE IS NOT PERMITTED. | ||
| 50 | ||
| Structural and Collateral Term Sheet | BMO 2024-5C7 | |
| No. 5 – Tank Holding Portfolio | ||
| Mortgage Loan Information | Property Information | |||
| Mortgage Loan Sellers: | GSMC, BMO | Single Asset / Portfolio: | Portfolio | |
| Original Principal Balance(1): | $60,000,000 | Title: | Fee | |
| Cut-off Date Principal Balance(1): | $60,000,000 | Property Type – Subtype: | Industrial – Warehouse | |
| % of IPB: | 6.3% | Distribution/Light Manufacturing | ||
| Loan Purpose: | Recapitalization | Net Rentable Area (SF): | 1,489,315 | |
| Borrower: | NM Tank, L.P. | Location: | Various, Various | |
| Borrower Sponsor: | New Mountain Net Lease Partners II Corporation | Year Built / Renovated: | Various / Various | |
| Interest Rate: | 5.17600% | Occupancy: | 100.0% | |
| Note Date: | 9/27/2024 | Occupancy Date: | 9/27/2024 | |
| Maturity Date: | 10/6/2029 | 4th Most Recent NOI (As of)(4): | NAV | |
| Interest-only Period: | 60 months | 3rd Most Recent NOI (As of)(4): | NAV | |
| Original Term: | 60 months | 2nd Most Recent NOI (As of)(4): | NAV | |
| Original Amortization Term: | None | Most Recent NOI (As of)(4): | NAV | |
| Amortization Type: | Interest Only | UW Economic Occupancy: | 100.0% | |
| Call Protection(2): | L(24),DorYM1(32),O(4) | UW Revenues: | $10,217,206 | |
| Lockbox / Cash Management: | Hard / Springing | UW Expenses: | $0 | |
| Additional Debt(1): | Yes | UW NOI: | $10,217,206 | |
| Additional Debt Balance(1): | $26,389,388 | UW NCF: | $10,217,206 | |
| Additional Debt Type(1): | Pari Passu | Appraised Value / Per SF(5): | $132,910,000 / $89 | |
| Appraisal Date: | Various | |||
| Escrows and Reserves(3) | Financial Information(1) | |||||
| Initial | Monthly | Initial Cap | Cut-off Date Loan / SF: | $58 | ||
| Taxes: | $0 | Springing | N/A | Maturity Date Loan / SF: | $58 | |
| Insurance: | $0 | Springing | N/A | Cut-off Date LTV: | 65.0% | |
| Replacement Reserves: | $0 | Springing | $446,795 | Maturity Date LTV: | 65.0% | |
| TI / LC Reserve: | $0 | Springing | $2,233,973 | UW NCF DSCR: | 2.25x | |
| Free Rent Reserve: | $0 | Springing | N/A | UW NOI Debt Yield: | 11.8% | |
| Sources and Uses | |||||||
| Sources | Proceeds | % of Total | Uses | Proceeds | % of Total | ||
| Whole Loan(1): | $86,389,388 | 100.0% | Principal Equity Distribution: | $80,668,035 | 93.4 | % | |
| Closing Costs(6): | 5,721,353 | 6.6 | |||||
| Total Sources | $86,389,388 | 100.0% | Total Uses: | $86,389,388 | 100.0 | % | |
| (1) | The Tank Holding Portfolio Mortgage Loan (as defined below) is part of the Tank Holding Portfolio Whole Loan (as defined below), which is evidenced by four pari passu promissory notes with an aggregate original principal balance of $86,389,388. The Financial Information presented above is based on the aggregate original principal balance of the promissory notes comprising the Tank Holding Portfolio Whole Loan. |
| (2) | The lockout period will be at least 24 payment dates beginning with and including the first payment date on November 6, 2024. Voluntary prepayment (with the greater of a yield maintenance premium or 1% of the principal balance of the Tank Holding Portfolio Whole Loan in full (but not in part) is permitted at any time following the payment date in November 2026. Defeasance of the Tank Holding Portfolio Whole Loan) in full (or in part in connection with certain property releases) is permitted at any time following the earlier to occur of (i) November 8, 2027 or (ii) the date that is two years from the closing date of the securitization that includes the last pari passu note to be securitized. The assumed lockout period of 24 payments is based on the expected BMO 2024-5C7 securitization trust closing date in October 2024. The actual lockout period may be longer. See “Partial Releases” below. |
| (3) | See “Escrows and Reserves” below for further discussion of reserve information. |
| (4) | Historical financial information is unavailable given the borrower sponsor purchased the Tank Holding Portfolio Properties (as defined below) in a sale leaseback transaction in June 2024. |
| (5) | Inclusive of a 0.1% portfolio premium. |
| (6) | Closing costs include a rate buydown of $4,319,470. |
| THE INFORMATION IN THIS COLLATERAL TERM SHEET IS NOT COMPLETE AND MAY BE AMENDED PRIOR TO THE TIME OF SALE. THIS TERM SHEET IS NOT AN OFFER TO SELL THESE SECURITIES AND IT IS NOT A SOLICITATION OF AN OFFER TO BUY THESE SECURITIES IN ANY JURISDICTION WHERE THE OFFER OR SALE IS NOT PERMITTED. | ||
| 51 | ||
| Structural and Collateral Term Sheet | BMO 2024-5C7 | |
| No. 5 – Tank Holding Portfolio | ||
The Loan. The fifth largest mortgage loan (the “Tank Holding Portfolio Mortgage Loan”) is part of a whole loan (the “Tank Holding Portfolio Whole Loan”) evidenced by four pari passu notes and secured by the borrower’s interest in a portfolio of 23 industrial properties located in various states (the “Tank Holding Portfolio Properties”).
The Tank Holding Portfolio Mortgage Loan, which is evidenced by the controlling note A-1 and non-controlling note A-2, has an outstanding principal balance as of the Cut-off Date of $60,000,000. The Tank Holding Portfolio Whole Loan was co-originated on September 27, 2024 by Goldman Sachs Bank USA (“GSBI”) and Bank of Montreal (“BMO”) and has an aggregate outstanding principal balance as of the Cut-off Date of $86,389,388. Note A-1, with an outstanding principal balance as of the Cut-off Date of $30,000,000, is being sold by Goldman Sachs Mortgage Company and Note A-2, with an outstanding principal balance of $30,000,000 as of the Cut-off Date, is being sold by BMO. The Tank Holding Portfolio Whole Loan has a five-year term, is interest-only for the full term and accrues interest on an Actual/360 basis. The scheduled maturity date of the Tank Holding Portfolio Whole Loan is October 6, 2029.
The Tank Holding Portfolio Whole Loan will be serviced pursuant to the pooling and servicing agreement for the BMO 2024-5C7 securitization trust. The relationship between the holders of the Tank Holding Portfolio Whole Loan is governed by a co-lender agreement. See “Description of the Mortgage Pool—The Whole Loans—The Serviced Pari Passu Whole Loans” and “The Pooling and Servicing Agreement” in the Preliminary Prospectus.
The table below identifies the promissory notes that comprise the Tank Holding Portfolio Whole Loan:
| Whole Loan Summary | ||||
| Note | Original Balance | Cut-off Date Balance | Note Holder | Controlling Piece |
| A-1 | $30,000,000 | $30,000,000 | BMO 2024-5C7 | Yes |
| A-2 | $30,000,000 | $30,000,000 | BMO 2024-5C7 | No |
| A-3(1) | $13,194,694 | $13,194,694 | GSBI | No |
| A-4(1) | $13,194,694 | $13,194,694 | BMO | No |
| Whole Loan | $86,389,388 | $86,389,388 | ||
| (1) | Expected to be contributed to one or more future securitization trusts. |
The Properties. The Tank Holding Portfolio Properties consist of 23 warehouse distribution / light manufacturing industrial properties. The Tank Holding Portfolio Properties are master leased to Tank Holding Corp. (“Tank Holding”) on a triple-net basis. No single Tank Holding Portfolio Property comprises more than 16.1% of base rent or 19.8% of aggregate square footage. The Tank Holding Portfolio Properties are located across 23 unique zip codes within 16 unique states.
The borrower sponsor purchased the Tank Holding Portfolio Properties from affiliates of Tank Holding as part of a sale-leaseback transaction in June 2024. The purchase price was $132,906,747, or approximately $89 per square foot.
| THE INFORMATION IN THIS COLLATERAL TERM SHEET IS NOT COMPLETE AND MAY BE AMENDED PRIOR TO THE TIME OF SALE. THIS TERM SHEET IS NOT AN OFFER TO SELL THESE SECURITIES AND IT IS NOT A SOLICITATION OF AN OFFER TO BUY THESE SECURITIES IN ANY JURISDICTION WHERE THE OFFER OR SALE IS NOT PERMITTED. | ||
| 52 | ||
| Structural and Collateral Term Sheet | BMO 2024-5C7 | |
| No. 5 – Tank Holding Portfolio | ||
The following table includes certain information about the Tank Holding Portfolio Properties:
| Portfolio Summary(1) | ||||||||
| Property | City | State | Square Feet | Square Feet (%) | UW Base Rent ($) | UW Base Rent (%) | ||
| 5301 Old Baumgartner Road | St. Louis | MO | 294,165 | 19.8 | % | $1,643,680 | 16.1 | % |
| 1 Centro Way | North Liberty | IA | 178,836 | 12.0 | 1,137,494 | 11.1 | ||
| 1745 Cragmont Street | Madison | IN | 145,526 | 9.8 | 882,174 | 8.6 | ||
| 4920 State Road | Ashtabula | OH | 76,231 | 5.1 | 649,440 | 6.4 | ||
| 2725 Kelly Boulevard | Claremont | NC | 102,277 | 6.9 | 640,625 | 6.3 | ||
| 736, 746 Birginal Drive | Bensenville | IL | 63,475 | 4.3 | 620,435 | 6.1 | ||
| 16160,16180,16200,16210,3308 Hwy 27 | Lake Wales | FL | 70,937 | 4.8 | 557,902 | 5.5 | ||
| 875 Green Valley Road | Beaver Dam | WI | 101,308 | 6.8 | 546,838 | 5.4 | ||
| 2820 FM 1516N | Converse | TX | 41,783 | 2.8 | 519,049 | 5.1 | ||
| 1660 N. Airport Road | Brigham City | UT | 61,654 | 4.1 | 438,828 | 4.3 | ||
| 6400 N. 60th St, 6401 N. 63rdSt, 6101 McCormick Dr. | Lincoln | NE | 37,618 | 2.5 | 387,908 | 3.8 | ||
| 4724 W. Junction Street | Springfield | MO | 49,159 | 3.3 | 384,013 | 3.8 | ||
| 709 Railroad Avenue | Albertville | AL | 49,159 | 3.3 | 301,350 | 2.9 | ||
| 13241 South 11th Avenue | Hanford | CA | 25,057 | 1.7 | 227,849 | 2.2 | ||
| 1235 Imperial Road | Hampton | IA | 30,070 | 2.0 | 169,125 | 1.7 | ||
| 145 Industrial St. SE | Cascade | IA | 30,000 | 2.0 | 169,125 | 1.7 | ||
| 1952 E. Lucas Street | Rochester | IN | 26,344 | 1.8 | 168,420 | 1.6 | ||
| 100 Bailiff Drive | Fairfield | TX | 21,335 | 1.4 | 159,900 | 1.6 | ||
| 2424 Kenskill Avenue | Washington Court House | OH | 22,072 | 1.5 | 140,938 | 1.4 | ||
| 201 S. Kennedy | Shawnee | OK | 16,967 | 1.1 | 139,400 | 1.4 | ||
| 203 Gate Ridge Road | Griffin | GA | 17,010 | 1.1 | 121,975 | 1.2 | ||
| 90 S. 1200 West | Tooele | UT | 14,258 | 1.0 | 114,800 | 1.1 | ||
| 263 Corporate Drive | Owego | NY | 14,074 | 0.9 | 95,940 | 0.9 | ||
| Total | 1,489,315 | 100.0 | % | $10,217,206 | 100.0 | % | ||
| (1) | Based on the underwritten rent roll dated September 27, 2024, inclusive of rent steps through July 2025. |
Sole Tenant. The Tank Holding Portfolio is leased Tank Holding Corp. on a triple-net basis.
Tank Holding (1,489,315 SF, 100.0% of NRA, 100.0% of underwritten base rent): Tank Holding is a privately-held American manufacturing conglomerate focused on large plastic goods. The largest rotational molder in North America, Tank Holding operates eight manufacturing brands. Tank Holding’s product offering includes liquid storage tanks, plastic containers, pallets and tank accessories. Tank Holding was formed in 2008 upon the merger of Norwesco and Snyder.
Appraisals. According to the appraisals dated as of various dates between July 29, 2024 and August 7, 2024, the Tank Holding Portfolio Properties had an aggregate “As-Is” value of $132,910,000, which includes a 0.1% portfolio premium.
| Appraisal Valuation Summary(1) | ||
| Appraisal Approach | Appraised Value | Capitalization Rate |
| Income Capitalization Approach | $132,910,000 | 6.75%-8.75% |
| (1) | Source: Appraisals. |
Environmental. According to the Phase I environmental assessments for each of the Tank Holding Portfolio Properties, each dated May 16, 2024, there was no evidence of any recognized environmental conditions at the Tank Holding Portfolio Properties. The environmental assessment for the 875 Green Valley Road Property identified a controlled recognized environmental condition (CREC) related to prior on-site industrial uses. See “Description of the Mortgage Pool—Environmental Considerations” in the Preliminary Prospectus.
| THE INFORMATION IN THIS COLLATERAL TERM SHEET IS NOT COMPLETE AND MAY BE AMENDED PRIOR TO THE TIME OF SALE. THIS TERM SHEET IS NOT AN OFFER TO SELL THESE SECURITIES AND IT IS NOT A SOLICITATION OF AN OFFER TO BUY THESE SECURITIES IN ANY JURISDICTION WHERE THE OFFER OR SALE IS NOT PERMITTED. | ||
| 53 | ||
| Structural and Collateral Term Sheet | BMO 2024-5C7 | |
| No. 5 – Tank Holding Portfolio | ||
The following table presents certain information relating to the sole tenant at the Tank Holding Portfolio Properties:
| Sole Tenant Summary(1) | ||||||||
| Tenant Name | Credit Rating (Moody's/ S&P/Fitch)(2) | Net Rentable Area (SF) | % of Total NRA | UW Base Rent PSF | UW Base Rent | % of Total UW Base Rent | Lease Exp. Date | |
| Tank Holding | NR/NR/NR | 1,489,315 | 100.0 | % | $6.86 | $10,217,206 | 100.0% | 6/30/2044 |
| Occupied Total Collateral | 1,489,315 | 100.0 | % | $6.86 | $10,217,206 | 100.0% | ||
| Vacant Space (Owned) | 0 | 0.0 |
| |||||
| Totals/ Wtd. Avg. All Owned Tenants(5) | 1,489,315 | 100.0 | % | |||||
| (1) | Based on the underwritten rent roll dated September 27, 2024, inclusive of rent steps through July 2025. |
The following table presents certain information relating to the lease rollover schedule at the Tank Holding Portfolio Properties:
| Lease Rollover Schedule(1) | ||||||||||
| Year | Number of Leases Expiring | Net Rentable Area Expiring | % of NRA Expiring | UW Base Rent Expiring | % of UW Base Rent Expiring | Cumulative Net Rentable Area Expiring | Cumulative % of NRA Expiring | Cumulative UW Base Rent Expiring | Cumulative % of UW Base Rent Expiring | |
| 2035 & Beyond | 1 | 1,489,315 | 100.0% | $10,217,206 | 100.0 | 1,489,315 | 100.0% | $10,217,206 | 100.0% | |
| Total/Wtd. Avg. | 1 | 1,489,315 | 100.0% | $10,217,206 | 100.0 | % | ||||
| (1) | Based on the underwritten rent roll dated September 27, 2024, inclusive of rent steps through July 2025. |
The following table presents certain information relating to the underwritten cash flows of the Tank Holding Portfolio Properties:
| Underwritten Net Cash Flow(1) | ||||
| Underwritten | PSF | %(2) | ||
| Base Rent(3) | $9,968,006 | $6.69 | 97.6 | % |
| Rent Steps | 249,200 | 0.17 | 2.4 | |
| Total Base Rent | $10,217,206 | $6.86 | 100.0 | % |
| Expense Recoveries | 0 | 0.00 | 0.0 | |
| Total Reimbursements | $0 | $0.00 | 0.0 | % |
| Gross Potential Rent | $10,217,206 | $6.86 | 100.0 | % |
| Total Vacancy | 0 | 0.00 | 0.0 | |
| Effective Gross Income | $10,217,206 | $6.86 | 100.0 | % |
| Management Fees | 0 | 0.00 | 0.0 | |
| Operating Expenses | 0 | 0.00 | 0.0 | |
| Total Expenses | $0 | $0.00 | 0.0 | % |
| Net Operating Income | $10,217,206 | $6.86 | 100.0 | % |
| Total TI/LC | 0 | 0.00 | 0.0 | |
| Capital Expenditures | 0 | 0.00 | 0.0 | |
| Net Cash Flow | $10,217,206 | $6.86 | 100.0 | % |
| (1) | Historical financial information is unavailable given the borrower sponsor purchased the Tank Holding Portfolio Properties in a sale-leaseback transaction in June 2024. |
| (2) | Represents percent of Gross Potential Rent for all revenue fields and percent of Effective Gross Income for all other fields. |
| (3) | Based on the underwritten rent roll dated September 27, 2024, inclusive of rent steps through July 2025. |
| THE INFORMATION IN THIS COLLATERAL TERM SHEET IS NOT COMPLETE AND MAY BE AMENDED PRIOR TO THE TIME OF SALE. THIS TERM SHEET IS NOT AN OFFER TO SELL THESE SECURITIES AND IT IS NOT A SOLICITATION OF AN OFFER TO BUY THESE SECURITIES IN ANY JURISDICTION WHERE THE OFFER OR SALE IS NOT PERMITTED. | ||
| 54 | ||
| Structural and Collateral Term Sheet | BMO 2024-5C7 | |
| No. 5 – Tank Holding Portfolio | ||
The Market. The Tank Holding Portfolio Properties are located across 23 unique zip codes within 16 unique states.
Borrower. The borrower for the Tank Holding Portfolio Whole Loan is NM Tank, L.P., a Delaware limited partnership and single purpose entity with one independent director. Legal counsel to the borrower delivered a non-consolidation opinion in connection with the origination of the Tank Holding Portfolio Whole Loan.
The Borrower Sponsor. The borrower sponsor and non-recourse carveout guarantor for the Tank Holding Portfolio Whole Loan is New Mountain Net Lease Partners II Corporation, a Maryland corporation.
Property Management. The Tank Holding Portfolio Properties are self-managed.
Escrows and Reserves.
Tax Escrows – On a monthly basis, the borrower is required to escrow 1/12th of the annual estimated tax payments; provided that such monthly tax escrow is suspended so long as (a) no Cash Sweep Period is in effect, (b) the Tank Lease (as defined below) (or a replacement lease) remains in full force and effect, (c) Tank (as defined below) (or a replacement tenant) occupies one or more entire tax parcel(s) which, in the aggregate, constitute the entire individual Tank Holding Portfolio Property and is required pursuant to the Tank Lease (or such replacement lease) to pay all taxes directly to the taxing authority and does actually pay such taxes directly to such taxing authority prior to the date such taxes become delinquent, (d) a bankruptcy action with respect to Tank has not occurred and (e) upon request by the lender, the borrower provided (or has caused Tank (or any replacement tenant) to provide) to the lender satisfactory evidence (as determined by the lender) of payment of taxes.
Insurance Escrows – On a monthly basis, the borrower is required to escrow 1/12th of the annual estimated insurance payments; provided that such monthly insurance escrow is suspended (except the borrower will remain obligated to deposit the Deductible Deposit Amount) so long as (a) no Cash Sweep Period is in effect, (b) the Tank Lease (or a replacement lease) remains in full force and effect, (c) the entire Tank Holding Portfolio Property is demised to Tank (or a replacement tenant) pursuant to the Tank Lease (or such replacement lease) and Tank is obligated, pursuant to the Tank Lease, to maintain sufficient insurance on the entire Tank Holding Portfolio Property that at all times is in accordance with the terms of the loan agreement and Tank (or a replacement tenant) performs such obligation, (d) a bankruptcy action with respect to Tank has not occurred and (e) the borrower has provided, or has caused Tank (or a replacement tenant) to provide, to the lender certificates of insurance acceptable to the lender.
“Deductible Deposit Amount” means an amount equal to the difference between the maximum deductible required by the applicable provisions of the loan agreement and the actual deductible set forth in the insurance policy obtained by the borrower or Tank or replacement tenant, as applicable, that (other than the higher deductible) satisfies the applicable requirements of the loan agreement, which Deductible Deposit Amount will be held by (in the form of cash or a letter of credit) the lender in the tax and insurance escrow fund until such time as insurance policies with deductibles conforming to the requirements of the loan agreement have been obtained.
Replacement Reserve – On a monthly basis during a Cash Sweep Period, the borrower is required to escrow approximately $24,822 for replacement reserves, subject to a cap of approximately $446,795.
Rollover Reserve – On a monthly basis during a Cash Sweep Period, the borrower is required to escrow approximately $124,110 for replacement reserves, subject to a cap of approximately $2,233,973.
A “Cash Sweep Period” means each period commencing on the occurrence of a Cash Sweep Event and continuing until the earlier of (a) the related Cash Sweep Event Cure, or (b) until payment in full of all principal and interest on the Tank Holding Portfolio Whole Loan and all other amounts payable under the loan documents or defeasance in full of the Tank Holding Portfolio Whole Loan in accordance with the terms and provisions of the loan documents.
| THE INFORMATION IN THIS COLLATERAL TERM SHEET IS NOT COMPLETE AND MAY BE AMENDED PRIOR TO THE TIME OF SALE. THIS TERM SHEET IS NOT AN OFFER TO SELL THESE SECURITIES AND IT IS NOT A SOLICITATION OF AN OFFER TO BUY THESE SECURITIES IN ANY JURISDICTION WHERE THE OFFER OR SALE IS NOT PERMITTED. | ||
| 55 | ||
| Structural and Collateral Term Sheet | BMO 2024-5C7 | |
| No. 5 – Tank Holding Portfolio | ||
A “Cash Sweep Event” means the occurrence of: (a) an event of default; (b) a DSCR Trigger Event; (c) a Tank Bankruptcy Trigger Event; or (d) a Tank Trigger Event.
“Cash Sweep Event Cure” means (a) if the Cash Sweep Event is caused solely by the occurrence of a DSCR Trigger Event, (y) the occurrence of a DSCR Trigger Event Cure or (z) upon the borrower’s deposit with the lender of a Low DSCR Cure Deposit (in which case a DSCR Trigger Event will be cured for three consecutive months commencing as of the date of the occurrence of the DSCR Trigger Event; provided, however, that if a Low DSCR Cure Deposit is deposited and the debt service coverage ratio is not equal to or greater than 1.25x for two consecutive quarters thereafter by the end of such three month period, then a DSCR Trigger Event will occur upon the expiration of such three month period unless, prior to the expiration of such three month period, the borrower makes an additional Low DSCR Cure Deposit (in which case a DSCR Trigger Event will be avoided for an additional period of three consecutive months)), (b) if the Cash Sweep Event is caused solely by an event of default, a cure of such event of default (provided, however, that if the lender has applied for the appointment of a receiver, accelerated the debt or commenced a foreclosure action, the lender is not obligated to accept such cure and may reject or accept such cure in the lender’s sole and absolute discretion), (c) if the Cash Sweep Event is caused solely by the occurrence of a Tank Bankruptcy Trigger Event, (y) upon the occurrence of a Tank Bankruptcy Trigger Event Cure or (z) upon the borrower’s deposit with the lender of a Tank Cure Deposit (in which case a Tank Bankruptcy Trigger Event will be avoided for three consecutive months commencing on the date of the occurrence of the Tank Bankruptcy Trigger Event; provided, however, that if a Tank Cure Deposit is deposited but the underlying Tank Bankruptcy Trigger Event remains in effect at the end of the applicable three month period, then a Tank Bankruptcy Trigger Event will commence upon the expiration of such three month period unless, prior to the expiration of such three month period, the borrower makes an additional Tank Cure Deposit (in which case a Tank Bankruptcy Trigger Event will be avoided for a subsequent period of three consecutive months)), or (d) if the Cash Sweep Event is caused solely by the occurrence of a Tank Trigger Event, (y) upon the occurrence of a Tank Trigger Event Cure, or (z) upon the borrower’s deposit with the lender of a Tank Cure Deposit (in which case a Tank Trigger Event will be avoided for three consecutive months commencing on the date of the occurrence of the Tank Trigger Event); provided, however, that if a Tank Cure Deposit is deposited but the underlying Tank Trigger Event remains in effect at the end of the applicable three month period, then a Tank Trigger Event will commence upon the expiration of such three month period unless, prior to the expiration of such three month period, the borrower makes an additional Tank Cure Deposit (in which case a Tank Trigger Event will be avoided for a subsequent period of three consecutive months).
A “DSCR Trigger Event” means that, as of the date of determination, the debt service coverage ratio based on the trailing 12-month period immediately preceding such date is less than 1.25x.
A “DSCR Trigger Event Cure” means the achievement of a debt service coverage ratio of 1.25x or greater for two consecutive calendar quarters based upon the trailing 12-month periods immediately preceding the date of determination.
“Low DSCR Cure Deposit” means a deposit from the borrower with the lender in the form of cash or a letter of credit in an aggregate amount equal to the equivalent of all funds that would have been reserved with the lender pursuant to the Tank Holding Portfolio Whole Loan documents during the following three month period (as reasonably determined by the lender) if a DSCR Trigger Event were in effect but assuming for purposes of such calculation that the net operating income is sufficient for the debt service coverage ratio for such period to equal or exceed 1.25x during such period.
“Tank” means Tank Holding Corp., a Delaware corporation; Semco Tank Holding, LLC, a Delaware limited liability company; and Centro, Inc., an Iowa corporation, and together with Tank Holding and Semco, jointly and severally, and individually and collectively as the context may require, “Tenant” for the purposes of the Tank Lease.
“Tank Lease” means the Master Lease Agreement dated June 26, 2024, entered into by and between Tank, as tenant, and the borrower, as landlord, as the same may have been modified, amended and/or assigned from time to time.
| THE INFORMATION IN THIS COLLATERAL TERM SHEET IS NOT COMPLETE AND MAY BE AMENDED PRIOR TO THE TIME OF SALE. THIS TERM SHEET IS NOT AN OFFER TO SELL THESE SECURITIES AND IT IS NOT A SOLICITATION OF AN OFFER TO BUY THESE SECURITIES IN ANY JURISDICTION WHERE THE OFFER OR SALE IS NOT PERMITTED. | ||
| 56 | ||
| Structural and Collateral Term Sheet | BMO 2024-5C7 | |
| No. 5 – Tank Holding Portfolio | ||
A “Tank Bankruptcy Trigger Event” means a bankruptcy action with respect to Tank.
A “Tank Bankruptcy Trigger Event Cure” means either (a) the borrower provides the lender with (i) reasonably satisfactory evidence that the assets of Tank, as applicable, are no longer subject to the jurisdiction of the bankruptcy court, (ii) (A) reasonably satisfactory evidence that the Tank Lease has been affirmed and is unmodified and in full force and effect or (B) in the case of an involuntary bankruptcy action with respect to Tank, evidence that such involuntary bankruptcy action has been discharged or dismissed, and (iii) a tenant estoppel certificate from Tank with respect to the Tank Lease in the form required by such lease or otherwise in form and substance reasonably satisfactory to the lender, or (b) the borrower satisfies the Tank Replacement Lease Criteria.
A “Tank Cure Deposit” means a deposit from the borrower with the lender in the form of cash or a letter of credit in the amount equivalent to (a) the aggregate amount of full unabated base rent to become due and payable by Tank pursuant to the Tank Lease during the following three month period minus (b) the aggregate amount of all regularly scheduled debt service payments to become due and payable by the borrower during such three month period.
A “Tank Trigger Event” means either (i) the Tank Lease is terminated prior to the expiration of the term set forth in the Tank Lease or (ii) Tank subleases or “goes dark” in violation of the terms of the Tank Lease in either (x) individual Tank Holding Portfolio Properties representing more than, individually or in the aggregate, 25% of base rent payable under the Tank Lease at the time Tank subleases or “goes dark” at such Tank Holding Portfolio Property or (y) more than four individual Tank Holding Portfolio Properties; provided, however, with respect to this clause (ii), excluding, in each case, (A) any portion of the Tank Holding Portfolio Property demised pursuant to subleases demising no more than 20% of the leasable square footage of an individual Tank Holding Portfolio Property, (B) any period that an individual Tank Holding Portfolio Property “goes dark” for temporary, customary operational shutdowns or closures for a period not in excess of 180 days in accordance with the provisions of the Tank Lease, or (C) the period of time that it takes Tank to perform, in accordance with the terms of the Tank Lease, any repairs or restoration following a casualty or condemnation of all or part of the Tank Holding Portfolio Property for a period not in excess of 180 days.
A “Tank Trigger Event Cure” means either (a) with respect to clause (ii) of the definition of Tank Trigger Event, (i) Tank is in physical occupancy such that a Tank Trigger Event no longer exists and (ii) the borrower provides the lender with a tenant estoppel certificate from Tank with respect to the Tank Lease in the form required by such lease or other evidence in form and substance reasonably satisfactory to the lender confirming (A) the Tank Lease is in full force and effect and (B) Tank is in physical occupancy of its space to such an extent that a Tank Trigger Event does not exist, and paying full contractual rent under the Tank Lease or (b) with respect to clause (i) or (ii) of the definition of Tank Trigger Event, the borrower satisfies the Tank Replacement Lease Criteria.
“Tank Replacement Lease Criteria” means satisfaction of the following conditions with respect to any or all of the space demised to Tank under the Tank Lease:
| (i) | the borrower entering into one or more replacement leases; |
| (ii) | each replacement tenant is in physical occupancy of the space covered by the applicable replacement lease and paying full contractual rent (without offset, free rent credit or outstanding tenant improvement obligations on the part of the borrower, unless the borrower has deposited with the lender an amount equal to or greater than any free rent credit or outstanding tenant improvement or leasing commission obligations); |
| (iii) | the borrower provides the lender with: (a) a copy of each executed replacement lease; (b) a tenant estoppel certificate in form and substance satisfactory to the lender executed by each replacement tenant; (c) upon request of the lender, a subordination, non-disturbance and attornment agreement in form and substance satisfactory to the lender is executed by each replacement tenant and the lender; (d) satisfactory evidence that the borrower has performed and paid for all tenant improvements relating to such replacement tenant and that there are no unpaid leasing commissions associated with such replacement tenant (or the amount of any outstanding tenant improvement obligations or leasing commission obligations have been deposited with the lender); and (e) an updated rent roll; and |
| (iv) | the projected debt yield after giving effect to all such replacement leases is at least 11.54%. |
| THE INFORMATION IN THIS COLLATERAL TERM SHEET IS NOT COMPLETE AND MAY BE AMENDED PRIOR TO THE TIME OF SALE. THIS TERM SHEET IS NOT AN OFFER TO SELL THESE SECURITIES AND IT IS NOT A SOLICITATION OF AN OFFER TO BUY THESE SECURITIES IN ANY JURISDICTION WHERE THE OFFER OR SALE IS NOT PERMITTED. | ||
| 57 | ||
| Structural and Collateral Term Sheet | BMO 2024-5C7 | |
| No. 5 – Tank Holding Portfolio | ||
Lockbox / Cash Management. The Tank Holding Portfolio Whole Loan is structured with a hard lockbox and springing cash management. The borrower and the property manager, as applicable, are required to cause all rents to be deposited directly into a lender-controlled lockbox account. All revenues received by the borrower or property manager, as applicable, are required to be deposited in the lockbox account within one business day of receipt.
If no Cash Sweep Period is in effect, funds in the lockbox account are required to be swept to an account designated by the borrower.
During a Cash Sweep Period, funds in the lockbox account are required to be swept every business day into a cash management account and applied according to the cash flow waterfall in the loan documents. During a Cash Sweep Period, excess cash flow is required to be swept to an excess cash flow subaccount to be held as additional collateral for the Tank Holding Portfolio Whole Loan, except that if a Cash Sweep Period resulting solely from a DSCR Trigger Event has occurred and is continuing (and no event of default, Tank Bankruptcy Trigger Event or Tank Trigger Event has occurred and is continuing), then if the balance in the excess cash flow reserve equals or exceeds the Excess Cash Flow Reserve Account Threshold Amount, all remaining amounts in excess of the Excess Cash Flow Reserve Account Threshold Amount will be disbursed to an account designated by the borrower.
An “Excess Cash Flow Reserve Account Threshold Amount” means an amount equal to the monthly base rent under the Tank Lease or any replacement lease (as of the date of the commencement of the applicable Cash Sweep Event) multiplied by 18 (and subject to adjustment in the event an individual Tank Holding Portfolio Property is released).
Subordinate and Mezzanine Debt. None.
Permitted Future Mezzanine or Subordinate Debt. Not permitted.
Partial Releases. The borrower has the right to obtain release of any individual Tank Holding Portfolio Property following the occurrence of (I) a casualty or condemnation at any individual Tank Holding Portfolio Property, which casualty or condemnation results in the master tenant (Tank) or any tenant under a replacement master lease terminating the master lease with respect to such Tank Holding Portfolio Property, solely to the extent such termination is permitted by, and effectuated in accordance with, the terms of the master lease and/or (II)(a) a non-monetary default under the loan documents, (b) a monetary default under the loan documents that is solely caused by the master tenant (Tank) or any tenant under a replacement master lease or (c) a material monetary or material non-monetary default by the master tenant under the master lease (or any replacement lease) (any such event as described in clause (II), a “Default Release Event”), provided in either case that, among other conditions, (1) the borrower prepays or partially defeases the Tank Holding Portfolio Whole Loan in an amount equal to 110% of the allocated loan amount for the individual Tank Holding Portfolio Property to be released, plus the payment of a yield maintenance premium in connection with a Default Release Event (if applicable), (2) in the case of a release in connection with a Default Release Event (x) the release of the applicable individual Tank Holding Portfolio Property would cure such Default Release Event, (y) no other default or event of default under the loan documents has occurred and is continuing and (z) such release will be completed prior to the expiration of the cure period for the applicable default as set forth in the loan agreement; provided that if the borrower is diligently pursuing such release and cannot complete it within the applicable cure period, the borrower will have such additional time as necessary to effectuate such release, and (3) except as described in clause (2) above with respect to a Default Release Event, no event of default has occurred and is continuing.
In addition, the borrower is permitted to obtain the release of an individual Tank Holding Portfolio Property from the lien of the related mortgage and the borrower’s obligations under the loan documents with respect to such Tank Holding Portfolio Property in connection with a corresponding substitution of another property of like kind and quality, upon satisfaction of certain conditions, including: (i) such release and substitution do not occur on or prior to the earlier of (x) the “startup day” of the REMIC that holds the portion of the Tank Holding Portfolio Whole Loan last to be securitized and (y) June 30, 2027; (ii) such release and substitution are in accordance with the terms of the Tank Lease; (iii) no event of default exists; (iv) individual Tank Holding Portfolio Properties representing no more than, in the aggregate, 10% of the then-current total base rent may be released and substituted during the term of the Tank Holding Portfolio Whole Loan; (v) after giving effect to the substitution, the debt service coverage ratio for the Tank Holding Portfolio Properties (including the substitute property, but excluding the released property) based on the trailing 12-month period immediately preceding the substitution is equal to or greater than the greater of (a) the aggregate debt service
| THE INFORMATION IN THIS COLLATERAL TERM SHEET IS NOT COMPLETE AND MAY BE AMENDED PRIOR TO THE TIME OF SALE. THIS TERM SHEET IS NOT AN OFFER TO SELL THESE SECURITIES AND IT IS NOT A SOLICITATION OF AN OFFER TO BUY THESE SECURITIES IN ANY JURISDICTION WHERE THE OFFER OR SALE IS NOT PERMITTED. | ||
| 58 | ||
| Structural and Collateral Term Sheet | BMO 2024-5C7 | |
| No. 5 – Tank Holding Portfolio | ||
coverage ratio of the Tank Holding Portfolio Properties immediately prior to the substitution for the twelve full calendar months immediately preceding the substitution or (b) 2.20x; (vi) after giving effect to the substitution, the debt yield for the Tank Holding Portfolio Properties (including the substitute property, but excluding the released property) is equal to or greater than the greater of (a) the debt yield for all of the Tank Holding Portfolio Properties immediately preceding the substitution date or (b) 11.54%; (vii) after giving effect to the substitution, the loan-to-value ratio does not exceed 65.0%; (viii) satisfaction of customary REMIC requirements; and (ix) if required by the lender, receipt of rating agency confirmation.
Ground Lease. None.
| THE INFORMATION IN THIS COLLATERAL TERM SHEET IS NOT COMPLETE AND MAY BE AMENDED PRIOR TO THE TIME OF SALE. THIS TERM SHEET IS NOT AN OFFER TO SELL THESE SECURITIES AND IT IS NOT A SOLICITATION OF AN OFFER TO BUY THESE SECURITIES IN ANY JURISDICTION WHERE THE OFFER OR SALE IS NOT PERMITTED. | ||
| 59 | ||
| Structural and Collateral Term Sheet | BMO 2024-5C7 | |
| No. 6 – Louisa Apartments | ||

| THE INFORMATION IN THIS COLLATERAL TERM SHEET IS NOT COMPLETE AND MAY BE AMENDED PRIOR TO THE TIME OF SALE. THIS TERM SHEET IS NOT AN OFFER TO SELL THESE SECURITIES AND IT IS NOT A SOLICITATION OF AN OFFER TO BUY THESE SECURITIES IN ANY JURISDICTION WHERE THE OFFER OR SALE IS NOT PERMITTED. | ||
| 60 | ||
| Structural and Collateral Term Sheet | BMO 2024-5C7 | |
| No. 6 – Louisa Apartments | ||

| THE INFORMATION IN THIS COLLATERAL TERM SHEET IS NOT COMPLETE AND MAY BE AMENDED PRIOR TO THE TIME OF SALE. THIS TERM SHEET IS NOT AN OFFER TO SELL THESE SECURITIES AND IT IS NOT A SOLICITATION OF AN OFFER TO BUY THESE SECURITIES IN ANY JURISDICTION WHERE THE OFFER OR SALE IS NOT PERMITTED. | ||
| 61 | ||
| Structural and Collateral Term Sheet | BMO 2024-5C7 | |
| No. 6 – Louisa Apartments | ||
| Mortgage Loan Information | Property Information | |||
| Mortgage Loan Seller: | GACC | Single Asset / Portfolio: | Single Asset | |
| Original Principal Balance: | $58,392,000 | Title: | Fee | |
| Cut-off Date Principal Balance: | $58,392,000 | Property Type – Subtype: | Multifamily – High Rise | |
| % of IPB: | 6.1% | Net Rentable Area (Units): | 242 | |
| Loan Purpose: | Acquisition | Location: | Portland, OR | |
| Borrowers: | The Louisa Apts Owner, LLC | Year Built / Renovated: | 2005 / 2020 | |
| Borrower Sponsor: | Thomas B. Brenneke, Jr. | Occupancy: | 93.0% | |
| Interest Rate: | 5.0730% | Occupancy Date: | 8/26/2024 | |
| Note Date: | 9/24/2024 | 4th Most Recent NOI (As of): | $4,424,639 (12/31/2021) | |
| Maturity Date: | 10/6/2029 | 3rd Most Recent NOI (As of): | $4,839,631 (12/31/2022) | |
| Interest-only Period: | 60 months | 2nd Most Recent NOI (As of): | $4,602,484 (12/31/2023) | |
| Original Term: | 60 months | Most Recent NOI (As of): | $4,478,579 (TTM 7/31/2024) | |
| Original Amortization Term: | None | UW Economic Occupancy: | 91.9% | |
| Amortization Type: | Interest Only | UW Revenues: | $8,524,351 | |
| Call Protection: | L(24),D(32),O(4) | UW Expenses: | $3,170,947 | |
| Lockbox / Cash Management: | Springing / Springing | UW NOI: | $5,353,404 | |
| Additional Debt: | No | UW NCF: | $5,286,726 | |
| Additional Debt Balance: | N/A | Appraised Value / Per Unit: | $81,100,000 / $335,124 | |
| Additional Debt Type: | N/A | Appraisal Date: | 6/21/2024 | |
| Escrows and Reserves(1) | |||
| Initial | Monthly | Initial Cap | |
| Taxes: | $1,181,942 | $98,495 | N/A |
| Insurance: | $0 | Springing | N/A |
| Replacement Reserves: | $0 | $5,030 | $132,718 |
| TI / LC: | $98,629 | $3,052 | $73,237 |
| Other Reserve: | $0 | $0 | N/A |
| Financial Information | |
| Cut-off Date Loan / Unit: | $241,289 |
| Maturity Date Loan / Unit: | $241,289 |
| Cut-off Date LTV: | 72.0% |
| Maturity Date LTV: | 72.0% |
| UW NCF DSCR: | 1.76x |
| UW NOI Debt Yield: | 9.2% |
| Sources and Uses | ||||||||
| Sources | Proceeds | % of Total | Uses | Proceeds | % of Total | |||
| Mortgage Loan | $58,392,000 | 67.7 | % | Purchase Price | $80,000,000 | 92.7 | % | |
| Borrower Sponsor Equity | 27,883,098 | 32.3 | Closing Costs(2) | 4,994,527 | 5.8 | |||
| Upfront Reserves | 1,280,571 | 1.5 | ||||||
| Total Sources | $86,275,098 | 100.0 | % | Total Uses | $86,275,098 | 100.0 | % | |
| (1) | See “Escrows and Reserves” below for further discussion of reserve information. |
| (2) | The increase from Most Recent NOI and UW NOI can be attributed to lease up of the multifamily portion of the Louisa Apartments Property to current occupancy of 93.0%. |
| (3) | Closing Costs include an interest rate buydown fee of $2,919,600. |
| THE INFORMATION IN THIS COLLATERAL TERM SHEET IS NOT COMPLETE AND MAY BE AMENDED PRIOR TO THE TIME OF SALE. THIS TERM SHEET IS NOT AN OFFER TO SELL THESE SECURITIES AND IT IS NOT A SOLICITATION OF AN OFFER TO BUY THESE SECURITIES IN ANY JURISDICTION WHERE THE OFFER OR SALE IS NOT PERMITTED. | ||
| 62 | ||
| Structural and Collateral Term Sheet | BMO 2024-5C7 | |
| No. 6 – Louisa Apartments | ||
The Loan. The sixth largest mortgage loan (the “Louisa Apartments Mortgage Loan”) is secured by the borrower’s fee interest in a Class A, 242-unit, multifamily development located in Portland, Oregon (the “Louisa Apartments Property”). The Louisa Apartments Mortgage Loan is comprised of one promissory note with an outstanding principal balance as of the Cut-off Date of $58,392,000. The Louisa Apartments Mortgage Loan was originated on September 24, 2024 by German American Capital Corporation (“GACC”) and accrues interest at a fixed rate of 5.07300% per annum. The Louisa Apartments Mortgage Loan has a term of five years, is interest-only for the full term and accrues interest on an Actual/360 basis. The scheduled maturity date of the Louisa Apartments Mortgage Loan is October 6, 2029.
The Property. The Louisa Apartments Property is a 242-unit, 16-story, high-rise apartment building with 29,295 square feet of ground floor retail located in the Pearl District of Portland, Oregon. The Louisa Apartments Property was constructed in 2005 and is situated on a 0.92-acre lot. The Louisa Apartments Property is walking distance to premier retailers, as well as the largest employment district in Portland. Major national retailers within two blocks of the Louisa Apartments Property are Whole Foods, Lululemon, West Elm, Williams Sonoma, Madewell, CB2, Anthropologie, Free People, Athleta, Deschutes Brewery, Backwoods Brewing, CVS, Patagonia, and Vans.
The Louisa Apartments Property consists of studio, one, and two-bedroom units and offers tenants the option of more than 20 distinct unit layouts. Community amenities include a community kitchen, a TV lounge, an outdoor deck and barbeque area, a dry-cleaning service, and garage parking. In-unit amenities at the Louisa Apartments Property consist of washers and dryers, granite counter tops, hardwood flooring, lofty ceilings, fireplaces, and private patio-balconies. In addition, the Louisa Apartments Property features ground floor retailers such as West Elm (46.3% of commercial SF, 52.9% of commercial base rent), Lululemon (6.8% of commercial SF, 9.5% of commercial base rent) and Williams Sonoma (22.0% of commercial SF, 22.0% of commercial gross rent). The multifamily portion of the Louisa Apartments Property is currently 93.0% leased as of August 26, 2024. As of October 7, 2024, the commercial portion of the Louisa Apartments Property was 86.6% leased with a weighted average remaining lease term of 5.6 years.
The subterranean parking garage (the “Garage”) at the Louisa Apartments Property is connected with the adjacent Whole Foods building, M Financial Plaza, & Brewery Blocks 2 office building. The parking garage runs beneath several blocks/parcels and the various buildings can all be accessed from the singular garage. The Louisa Apartments Property has access to 242 of the total 1,350 spaces in the parking garage (1 space per unit). The operations are managed by Arke Management and the Louisa Apartments Property receives 20.75% of the net operating income from the overall garage. The Garage serves the Louisa Apartments Property (Block 5 a/k/a Block 83) and four other blocks listed in the chart below (each, a “Block” or together, “Blocks”) near the Louisa Apartments Property.
| Block Summary | |
| Block Number | Proportionate Share |
| 1 (a/k/a Block 82) | 9.9% |
| 2 (a/k/a Block 81) | 30.2% |
| 3S (a/k/a Block 82) | 2.1% |
| 4 (a/k/a Lots 1, 2, 3 and 4 of Block 69 | 37.0% |
| 5 (a/k/a Block 83) | 20.8% |
| Total | 100.0% |
The Garage is located underneath (i) the Louisa Apartments Property; (ii) a portion of the other Blocks; and (iii) portions of adjacent public streets owned by the City of Portland (the “City”) and leased by the City, as lessor, to a Block owners’ association (the “Association”), as lessee, pursuant to a ground lease. The mortgage borrower is an equity member of the Association along with the other Block owners. Any future fee owner of any of the Blocks, including a lender foreclosing on the Mortgaged Property, automatically becomes an equity member of the Association. Block Owners proportionately share income and expenses arising from the use, operation, maintenance, repair and restoration of the Garage. The Garage and the Association are managed by a third-party manager, subject to a declaration of easements and agreements, a facility lease, a property management agreement and the Association’s operating Agreement. The manager has day-to-day operational authority, subject to majority, super-majority or unanimous consent of all Association members for certain material actions under such agreements. Since the borrower’s interest in this parking garage revenue may not constitute
| THE INFORMATION IN THIS COLLATERAL TERM SHEET IS NOT COMPLETE AND MAY BE AMENDED PRIOR TO THE TIME OF SALE. THIS TERM SHEET IS NOT AN OFFER TO SELL THESE SECURITIES AND IT IS NOT A SOLICITATION OF AN OFFER TO BUY THESE SECURITIES IN ANY JURISDICTION WHERE THE OFFER OR SALE IS NOT PERMITTED. | ||
| 63 | ||
| Structural and Collateral Term Sheet | BMO 2024-5C7 | |
| No. 6 – Louisa Apartments | ||
an interest in real property, REMIC rules may not permit the trust to foreclose on such interest, in which case the trust may have to assign away the rights to the parking garage revenue.
The following table presents certain information relating to the unit mix at the Louisa Apartments Property:
| Louisa Apartments Unit Mix(1) | |||||||
| Unit Type | # of Units | % of Total | Occupied Units | Occupancy | Average Unit Size (SF) (2) | Average Quoted Rental Rate(2) | |
| Studio | 54 | 22.3 | % | 53 | 98.1% | 682 | $1,804 |
| 1BD/1BA | 138 | 57.0 | 126 | 91.3% | 715 | $2,028 | |
| 1BD/2BA | 4 | 1.7 | 3 | 75.0% | 1,362 | $3,480 | |
| 2BD/1.5BA | 12 | 5.0 | 12 | 100.0% | 1,099 | $3,102 | |
| 2BD/2BA | 32 | 13.2 | 29 | 90.6% | 1,121 | $2,860 | |
| 2BD/2.5BA | 2 | 0.8 | 2 | 100.0% | 1,506 | $4,780 | |
| Total/Wtd. Avg. | 242 | 100.0 | % | 225 | 93.0% | 789 | $2,142 |
| (1) | Based on the underwritten rent roll dated August 26, 2024. |
| (2) | Source: Appraisal. Based on the “classic” units of each unit type denoted in the appraisal. The 2BD/2.5BA is based on the renovated rather than classic as no classic was provided by the appraisal. |
The Market. The Louisa Apartments Property is located within Portland’s Pearl District, which is within walking distance of Portland’s central business district, as well as hundreds of retailers, restaurants, and coffee shops. The Louisa Apartments Property sits on a full city block within the Brewery Blocks redevelopment adjacent to Whole Foods. The Louisa Apartments Property also has direct access to the Portland Streetcar and I-405. According to the appraisal, the 2023 population within a one-, three- and five-mile radius of the Louisa Apartments Property was 50,613, 187,342 and 439,514, respectively. The 2023 median household income within the same radii was $67,683, $87,301 and $93,922, respectively.
According to the appraisal, the Louisa Apartments Property is located in the NW Portland submarket. The average vacancy rate over the last five years has been 6.4%. As of spring 2024, the average rent PSF in the NW Portland submarket was $2.69 PSF, an approximately 12.6% increase from the prior year.
| THE INFORMATION IN THIS COLLATERAL TERM SHEET IS NOT COMPLETE AND MAY BE AMENDED PRIOR TO THE TIME OF SALE. THIS TERM SHEET IS NOT AN OFFER TO SELL THESE SECURITIES AND IT IS NOT A SOLICITATION OF AN OFFER TO BUY THESE SECURITIES IN ANY JURISDICTION WHERE THE OFFER OR SALE IS NOT PERMITTED. | ||
| 64 | ||
| Structural and Collateral Term Sheet | BMO 2024-5C7 | |
| No. 6 – Louisa Apartments | ||
The following table presents certain information relating to comparable sales to the Louisa Apartments Property:
| Multifamily Sales Comparables(1) | |||||
| Property Name / Address | Sale Date | Units | Year Built | Sale Price | Sale Price Per Unit |
Louisa Apartments 123 NW 12th Avenue Portland, OR 97209 | 6/21/2024 | 242(2) | 2005 / 2020 | $80,000,000 | 330,579 |
Kearney Plaza 931 Northwest 11th Avenue Portland, OR 97209 | April-24 | 131 | 2000 / 2016 |
$33,250,000 |
$253,817 |
Skylar Grand 465 NE Davis Street Portland, OR 97232 | Feb-24 | 170 | 2022 / NAP |
$34,000,000 |
$189,794 |
The Beverly 2021 NE 44th Avenue Portland, OR 97213 | Feb-24 | 53 | 2009 / NAP |
$36,000,000 |
$679,245 |
Tessera at Orenco Station 6523 Northeast Cherry Drive Hillsboro, OR 97124 | Dec-23 | 304 |
2014 / NAP |
$99,000,000 |
$325,658 |
The Arbory 9250 NE Rockspring Street Hilsboro, OR 97006 | Dec-23 | 276 |
2018 / NAP |
$78,600,000 |
$284,783 |
| (1) | Source: Appraisal. |
| (2) | Based on the underwritten rent roll dated August 26, 2024 |
The following table presents certain information relating to comparable multifamily properties to the Louisa Apartments Property:
| Multifamily Rent Comparables(1) | |||||||
| Property Name / Address | Distance from Subject | Year Built | Occupancy | Number of Units | Unit Type | Average Unit Size | Average Rent Per Unit |
Louisa Apartments 123 NW 12th Avenue Portland, OR 97209 | – | 2005 / 2020 | 93.4%(2) | 242 | Studio | 682 SF | $1,625 |
| 1BR / 1BA | 715 SF | $1,825 | |||||
| 2BR / 2BA | 1,121 SF | $2,600 | |||||
The Rodney 1470 NW Gilsan Street Portland, OR 97209 | 0.2 mile | 2019 | 98.0% | 230 | Studio | 503 SF | $1,420 – 1,430 |
| 1BR / 1BA | 561 SF | $1,761 - $2,041 | |||||
| 2BR / 2BA | 1,036 SF | $3,035 | |||||
Modera Akoya 1440 NW Hoyt Street and Portland, OR 97209 | 0.2 mile | 2020 | 94.0% | 291 | Studio | 499 - 534 SF | $1,625 – $1,690 |
| 1BR / 1BA | 562 - 685 SF | $1,625 - $2,202 | |||||
| 2BR / 2BA | 959 - 1,165 SF | $2,907 - $3,045 | |||||
Indigo 430 SW 13th Avenue Portland, OR 97205 | 0.1 mile | 2009 | 97.0% | 273 | Studio | 536 - 709 SF | $1,491 - $1,833 |
| 1BR / 1BA | 644 - 908 SF | $1,945 - $2,800 | |||||
| 2BR / 2BA | 1,110 -1,405 SF | $2,651 - $2,874 | |||||
The Gossamer 255 NW 10th Avenue Portland, OR 97209 | 0.1 mile | 2017 / 2020 | 97.0% | 204 | Studio | 465 - 543 SF | $1,650 - $1,730 |
| 1BR / 1BA | 543 - 844 SF | $1,557 - $1,951 | |||||
| 2BR / 2BA | 937 - 1,207 SF | $2,710 - $3,698 | |||||
| (1) | Source: Appraisal. |
| (2) | Based on the underwritten rent roll dated August 26, 2024. |
Environmental. According to the Phase I environmental site assessment dated February 19, 2024, there was no evidence of any recognized environmental conditions at the Louisa Apartments Property.
| THE INFORMATION IN THIS COLLATERAL TERM SHEET IS NOT COMPLETE AND MAY BE AMENDED PRIOR TO THE TIME OF SALE. THIS TERM SHEET IS NOT AN OFFER TO SELL THESE SECURITIES AND IT IS NOT A SOLICITATION OF AN OFFER TO BUY THESE SECURITIES IN ANY JURISDICTION WHERE THE OFFER OR SALE IS NOT PERMITTED. | ||
| 65 | ||
| Structural and Collateral Term Sheet | BMO 2024-5C7 | |
| No. 6 – Louisa Apartments | ||
The following table presents certain information relating to the historical and current occupancy of the Louisa Apartments Property:
| Historical Occupancy | |||
| 2022 | 2023 | Current(1) | |
| Louisa Apartments | 92.1% | 90.3% | 88.5% |
| (1) | Current occupancy is as of July 31, 2024. |
The following table presents certain information relating to the operating history and underwritten net cash flow of the Louisa Apartments Property:
| Operating History and Underwritten Net Cash Flow | ||||||||
| 2021 | 2022 | 2023 | TTM(1) | Underwritten | Per Unit | %(2) | ||
| In-Place Base Rent | $6,166,399 | $6,335,204 | $6,448,554 | $6,360,058 | $6,315,218 | $26,096 | 100.0 | % |
| Vacancy | (398,953) | (499,403) | (627,195) | (729,011) | (454,502) | (1,878) | (7.2 | ) |
| Bad Debt | 13,634 | (37,910) | 1,754 | (63,743) | 0 | 0 | 0.0 | |
| Concessions | (297,121) | (54,306) | (85,721) | (268,062) | 0 | 0 | 0.0 | |
| Net Commercial Income | 1,151,659 | 1,393,356 | 1,177,876 | 1,190,566 | 1,163,008 | 4,806 | 18.4 | |
| Other Income(3) | 463,938 | 453,464 | 586,135 | 608,232 | 640,090 | 2,645 | 10.1 | |
| Effective Gross Income | $7,581,349 | $8,124,562 | $8,210,795 | $7,860,313 | $8,524,351 | $35,225 | 100.0 | % |
| Management Fee | 123,807 | 129,709 | 127,900 | 123,138 | 237,549 | 982 | 2.8 | |
| Real Estate Taxes | 1,106,084 | 1,162,108 | 1,163,273 | 1,185,798 | 1,147,516 | 4,742 | 13.5 | |
| Insurance | 155,406 | 188,160 | 263,475 | 207,785 | 187,000 | 773 | 2.2 | |
| Other Expenses(5) | 1,771,414 | 1,804,954 | 2,053,662 | 1,865,014 | 1,598,881 | 6,607 | 18.8 | |
| Total Expenses | $3,156,710 | $3,284,931 | $3,608,311 | $3,381,735 | $3,170,947 | $13,103 | 37.2 | % |
| Net Operating Income(4) | $4,424,639 | $4,839,631 | $4,602,484 | $4,478,579 | $5,353,404 | $22,122 | 62.8 | % |
| Replacement Reserves | 0 | 0 | 0 | 0 | 66,678 | 276 | 0.8 | |
| Net Cash Flow | $4,424,639 | $4,839,631 | $4,602,484 | $4,478,579 | $5,286,726 | $21,846 | 62.0 | % |
| (1) | The TTM column represents the trailing twelve-month period ending July 31, 2024. |
| (2) | The % column represents percentage of In-Place Base Rent for all revenue lines and represents percentage of Effective Gross Income for the remainder of the fields. |
| (3) | Other Income consists of parking, commercial reimbursements, utility reimbursements and general other income. |
| (4) | The increase in Net Operating Income, and the decrease in Vacancy/Concessions/Credit Loss from 2023 to TTM and from TTM to Underwritten is primarily attributable to the lease up of the Louisa Apartments Property. |
| (5) | Other Expenses consist of payroll and benefits, repairs and maintenance, utilities, advertising and marketing, and general and administrative expenses. |
The Borrower. The borrower is The Louisa Apts Owner, LLC a Delaware limited liability company and single purpose entity having at least two independent directors in its organizational structure. Legal counsel to the borrower delivered a non-consolidation opinion in connection with the origination of the Louisa Apartments Mortgage Loan.
The Borrower Sponsor. The borrower sponsor is Tom Brenneke, owner of Guardian Real Estate Services LLC (“Guardian”) the non-recourse carveout guarantor. Since 2002, Guardian has developed or acquired approximately 11,000 multifamily units and 350,000 square feet of commercial space. Guardian has more than 350 team members and a portfolio consisting of 110 communities across four different states. Tom Brenneke, the indirect majority owner of Guardian, has directed major company growth initiatives that have resulted in more than 100 acquisition/development transactions, translating to an ownership track record of 11,000 multifamily units in four states.
Property Management. The Louisa Apartments Property is managed by Guardian Management, LLC, a borrower affiliated management company.
Escrows and Reserves. At origination of the Louisa Apartments Mortgage Loan, the borrower deposited approximately (i) $1,181,942 into a reserve account for real estate taxes and (ii) $98,629 into a reserve account for commercial tenant improvements and leasing commissions.
| THE INFORMATION IN THIS COLLATERAL TERM SHEET IS NOT COMPLETE AND MAY BE AMENDED PRIOR TO THE TIME OF SALE. THIS TERM SHEET IS NOT AN OFFER TO SELL THESE SECURITIES AND IT IS NOT A SOLICITATION OF AN OFFER TO BUY THESE SECURITIES IN ANY JURISDICTION WHERE THE OFFER OR SALE IS NOT PERMITTED. | ||
| 66 | ||
| Structural and Collateral Term Sheet | BMO 2024-5C7 | |
| No. 6 – Louisa Apartments | ||
Tax Escrows – On a monthly basis, the borrower is required to deposit into a real estate tax reserve 1/12th of the property taxes that the lender estimates will be payable over the next-ensuing 12-month period (initially estimated to be approximately $98,495).
Insurance Escrows – If the liability or casualty policies maintained by the borrower does not constitute an approved blanket or umbrella policy, the borrower will be required to deposit into an insurance reserve, on a monthly basis, 1/12th of the amount which will be sufficient to pay the insurance premiums due for the renewal of coverage afforded by such policies.
Replacement Reserves – On a monthly basis, the borrower is required to deposit approximately $5,030 into a replacement reserve.
TI/LC Reserves – On a monthly basis, the borrower is required to deposit approximately $3,052 into a TI/LC reserve.
Lockbox / Cash Management. The Louisa Apartments Mortgage Loan is structured with a springing lockbox and springing cash management. On the first occurrence of a Lockbox Trigger Event (as defined below), the borrower is required to establish a lender-controlled lockbox account (the “Clearing Account”). Upon the commencement of the first Lockbox Trigger Event and at all times thereafter, the borrower will be required to cause all gross revenue to be transmitted directly by non-residential tenants of the Louisa Apartments Property into the Clearing Account. If the borrower or the property manager receives any gross revenue from the Louisa Apartments Property, then (i) such amounts will be deemed to be collateral for the obligations and will be held in trust for the benefit, and as the property, of the lender, (ii) such amounts will not be commingled with any other funds or property of the borrower or property manager, and (iii) the borrower or property manager will deposit such amounts in the Clearing Account within two business days of receipt. Thereafter, (x) during any Trigger Period, funds deposited into the Clearing Account will be swept on a daily basis into the deposit account and applied and disbursed in accordance with the Louisa Apartments Mortgage Loan documents and (y) if a Trigger Period is not continuing, funds deposited into the Clearing Account will be swept on a daily basis into the borrower’s operating account,
“Lockbox Trigger Event” means a period commencing upon the earliest of (i) the occurrence and continuance of a Trigger Period (as defined below) and (ii) the debt service coverage ratio being less than 1.20x.
“Trigger Period” means a period commencing upon the occurrence of (i) an event of default under the Louisa Apartments Mortgage Loan documents; (ii) the debt service coverage ratio is less than 1.15x as of any calculation date (iii) if the manager is an affiliate of the borrower or guarantor and such manager is bankrupt or insolvent; (iv) if a receiver, liquidator or trustee shall be appointed for borrower or guarantor or if borrower, or guarantor shall be adjudicated a bankrupt or insolvent.
Subordinate and Mezzanine Debt. None.
Permitted Future Subordinate or Mezzanine Debt. Not permitted.
Partial Release. Not permitted.
Ground Lease. None.
| THE INFORMATION IN THIS COLLATERAL TERM SHEET IS NOT COMPLETE AND MAY BE AMENDED PRIOR TO THE TIME OF SALE. THIS TERM SHEET IS NOT AN OFFER TO SELL THESE SECURITIES AND IT IS NOT A SOLICITATION OF AN OFFER TO BUY THESE SECURITIES IN ANY JURISDICTION WHERE THE OFFER OR SALE IS NOT PERMITTED. | ||
| 67 | ||
| Structural and Collateral Term Sheet | BMO 2024-5C7 | |
| No. 7 – Interstate Industrial Portfolio | ||

| THE INFORMATION IN THIS COLLATERAL TERM SHEET IS NOT COMPLETE AND MAY BE AMENDED PRIOR TO THE TIME OF SALE. THIS TERM SHEET IS NOT AN OFFER TO SELL THESE SECURITIES AND IT IS NOT A SOLICITATION OF AN OFFER TO BUY THESE SECURITIES IN ANY JURISDICTION WHERE THE OFFER OR SALE IS NOT PERMITTED. | ||
| 68 | ||
| Structural and Collateral Term Sheet | BMO 2024-5C7 | |
| No. 7 – Interstate Industrial Portfolio | ||

| THE INFORMATION IN THIS COLLATERAL TERM SHEET IS NOT COMPLETE AND MAY BE AMENDED PRIOR TO THE TIME OF SALE. THIS TERM SHEET IS NOT AN OFFER TO SELL THESE SECURITIES AND IT IS NOT A SOLICITATION OF AN OFFER TO BUY THESE SECURITIES IN ANY JURISDICTION WHERE THE OFFER OR SALE IS NOT PERMITTED. | ||
| 69 | ||
| Structural and Collateral Term Sheet | BMO 2024-5C7 | |
| No. 7 – Interstate Industrial Portfolio | ||
| Mortgage Loan Information | Property Information | |||
| Mortgage Loan Seller: | UBS AG | Single Asset / Portfolio: | Portfolio | |
| Original Principal Balance(1): | $54,000,000 | Title: | Fee | |
| Cut-off Date Principal Balance(1): | $54,000,000 | Property Type – Subtype: | Industrial – Warehouse/Distribution | |
| % of IPB: | 5.6% | Net Rentable Area (SF): | 2,573,860 | |
| Loan Purpose: | Refinance | Location: | Various | |
| Borrowers(2): | Various | Year Built / Renovated: | Various / Various | |
| Borrower Sponsor: | Gavriel Alexander | Occupancy: | 98.6% | |
| Interest Rate: | 6.50300% | Occupancy Date: | 9/12/2024 | |
| Note Date: | 10/2/2024 | 4th Most Recent NOI (As of)(3): | $6,177,232 (12/31/2021) | |
| Maturity Date: | 10/6/2029 | 3rd Most Recent NOI (As of)(3): | $9,231,316 (12/31/2022) | |
| Interest-only Period: | 60 months | 2nd Most Recent NOI (As of): | $10,562,333 (12/31/2023) | |
| Original Term: | 60 months | Most Recent NOI (As of): | $10,789,175 (7/31/2024 TTM) | |
| Original Amortization Term: | None | UW Economic Occupancy: | 95.0% | |
| Amortization Type: | Interest Only | UW Revenues: | $15,342,775 | |
| Call Protection: | L(12),YM1(44),O(4) | UW Expenses: | $4,209,461 | |
| Lockbox / Cash Management: | Hard / Springing | UW NOI: | $11,133,314 | |
| Additional Debt(1): | Yes | UW NCF: | $10,103,770 | |
| Additional Debt Balance(1): | $58,000,000 | Appraised Value / Per SF: | $175,350,000 / $68 | |
| Additional Debt Type(1): | Pari Passu | Appraisal Date: | Various | |
| Escrows and Reserves(4) | Financial Information(1) | |||||
| Initial | Monthly | Cap | Cut-off Date Loan / SF: | $44 | ||
| Taxes: | $188,503 | $188,503 | N/A | Maturity Date Loan / SF: | $44 | |
| Insurance: | $265,597 | $40,242 | N/A | Cut-off Date LTV: | 63.9% | |
| Replacement Reserves: | $0 | $32,173 | $772,158 | Maturity Date LTV: | 63.9% | |
| TI / LC: | $1,400,000 | (5) | (5) | UW NCF DSCR: | 1.37x | |
| Immediate Repairs: | $197,044 | $0 | N/A | UW NOI Debt Yield: | 9.9% | |
| Other(6): | $786,168 | $0 | N/A | |||
| Sources and Uses | |||||||
| Sources | Proceeds | % of Total | Uses | Proceeds | % of Total | ||
| Whole Loan(1) | $112,000,000 | 100.0% | Loan Payoff | $104,953,570 | 93.7 | % | |
| Upfront Reserves | 2,837,313 | 2.5 | |||||
| Return of Equity | 2,554,415 | 2.3 | |||||
| Closing Costs | 1,654,702 | 1.5 | |||||
| Total Sources | $112,000,000 | 100.0% | Total Uses | $112,000,000 | 100.0 | % | |
| (1) | The Interstate Industrial Portfolio Mortgage Loan (as defined below) is part of a whole loan evidenced by four pari passu notes with an aggregate outstanding principal balance as of the Cut-off Date of $112.0 million (the “Interstate Industrial Portfolio Whole Loan”). The information under “Financial Information” in the chart above reflects the Interstate Industrial Portfolio Whole Loan. |
| (2) | See “The Borrowers” below for more information. |
| (3) | The increase from 4th Most Recent NOI to 3rd Most Recent NOI is primarily attributed to the lease up at the 2294 Molly Pitcher Highway property from 25.0% in 2021 to 96.1% in 2022. The 2294 Molly Pitcher Highway property accounts for 24.1% of NRA at the Interstate Industrial Portfolio Properties (as defined below). |
| (4) | For a full description of Escrows and Reserves, see “Escrows and Reserves” below. |
| (5) | On a monthly basis, the borrowers are required to deposit an aggregate amount equal to $0.25 per square foot for TI / LC reserves from November 6, 2024 through October 6, 2027. From November 6, 2027 through October 6, 2028, the borrowers are required to deposit an aggregate amount equal to $0.50 per square foot for TI / LC reserves, subject to a cap of $1,500,000 for the full TI / LC reserve. From November 6, 2028 through October 6, 2029, the borrowers are required to deposit an aggregate amount equal to $0.25 per square foot for TI / LC reserves, subject to a cap of $1,500,000 for the full TI / LC reserve. |
| (6) | Other reserves consist of (i) approximately $210,881 for rent concession funds with respect to the Giovanni Food, Inc. lease ($101,703) for underwritten reimbursements for the period of November 2024 through May 2025 and the Triple Eggs LLC lease (approximately $109,178) for rent concessions in months one, two and 25 of the lease term and (ii) approximately $575,287 for tenant allowances and tenant improvements and leasing commissions (“TA TI / LC”) funds associated with Victory Packaging LP (approximately $540,287) and Packaging Corporation of America ($35,000). |
| THE INFORMATION IN THIS COLLATERAL TERM SHEET IS NOT COMPLETE AND MAY BE AMENDED PRIOR TO THE TIME OF SALE. THIS TERM SHEET IS NOT AN OFFER TO SELL THESE SECURITIES AND IT IS NOT A SOLICITATION OF AN OFFER TO BUY THESE SECURITIES IN ANY JURISDICTION WHERE THE OFFER OR SALE IS NOT PERMITTED. | ||
| 70 | ||
| Structural and Collateral Term Sheet | BMO 2024-5C7 | |
| No. 7 – Interstate Industrial Portfolio | ||
The Loan. The seventh largest mortgage loan (the “Interstate Industrial Portfolio Mortgage Loan”) is part of a fixed rate whole loan secured by the borrowers’ fee interest in a 2,573,860 square foot portfolio of seven industrial properties located in New York, Pennsylvania and Ohio (each, an “Interstate Industrial Portfolio Property”, and collectively, the “Interstate Industrial Portfolio Properties”). The Interstate Industrial Portfolio Whole Loan is evidenced by four pari passu notes and accrues interest at a rate of 6.50300% per annum. The Interstate Industrial Portfolio Whole Loan has a five-year term, is interest only for the entire term and accrues interest on an Actual/360 basis. The Interstate Industrial Portfolio Mortgage Loan is evidenced by the non-controlling Note A-2, Note A-3 and Note A-4, with an aggregate principal balance as of the Cut-off Date of $54,000,000. The remaining note is currently held by UBS AG and is expected to be contributed to one or more future securitization trust(s).
The Interstate Industrial Portfolio Whole Loan will initially be serviced pursuant to the pooling and servicing agreement for the BMO 2024-5C7 securitization trust, provided that from and after the securitization of Note A-1, the Interstate Industrial Portfolio Whole Loan will be serviced pursuant to the pooling and servicing agreement for the securitization trust to which Note A-1 is contributed. The relationship between the holders of the Interstate Industrial Portfolio Whole Loan is governed by a co-lender agreement. See “Description of the Mortgage Pool—The Whole Loans—The Serviced Pari Passu Whole Loans” and “The Pooling and Servicing Agreement” in the Preliminary Prospectus.
The table below identifies the promissory notes that comprise the Interstate Industrial Portfolio Whole Loan:
| Whole Loan Summary | |||||
| Note | Original Balance | Cut-off Date Balance | Note Holder | Controlling Piece | |
| A-1(1) | $58,000,000 | $58,000,000 | UBS AG | Yes | |
| A-2 | $32,000,000 | $32,000,000 | BMO 2024-5C7 | No | |
| A-3 | $12,000,000 | $12,000,000 | BMO 2024-5C7 | No | |
| A-4 | $10,000,000 | $10,000,000 | BMO 2024-5C7 | No | |
| Whole Loan | $112,000,000 | $112,000,000 | |||
| (1) | Expected to be contributed to one or more future securitization trust(s). |
The Properties. The Interstate Industrial Portfolio Whole Loan is secured by seven industrial warehouse/distribution properties totaling 2,573,860 square feet located in New York (three properties, 48.0% of NRA), Pennsylvania (two properties, 35.2% of NRA) and Ohio (two properties, 16.7% of NRA). The borrower sponsor acquired the Interstate Industrial Portfolio Properties in 2021 for an aggregate purchase price (inclusive of origination costs) of approximately $145.6 million. Since acquisition, the borrower sponsor has invested approximately $680,000 in capital improvements resulting in a total cost basis of approximately $146.3 million at the Interstate Industrial Portfolio Properties. Twenty tenants, representing 48.4% of NRA and 56.1% of the underwritten base rent, are new leases or have either extended their lease terms or expanded their space at the Interstate Industrial Portfolio Properties. Tenants at the Interstate Industrial Portfolio Properties have a weighted average tenure of approximately 12.1 years. The Interstate Industrial Portfolio Properties were 98.6% occupied by 30 unique tenants as of September 12, 2024, with the five largest tenants accounting for 43.5% of NRA and 39.8% of the underwritten base rent. The remaining tenants represent no more than 6.8% of NRA or 5.0% of the underwritten base rent.
| THE INFORMATION IN THIS COLLATERAL TERM SHEET IS NOT COMPLETE AND MAY BE AMENDED PRIOR TO THE TIME OF SALE. THIS TERM SHEET IS NOT AN OFFER TO SELL THESE SECURITIES AND IT IS NOT A SOLICITATION OF AN OFFER TO BUY THESE SECURITIES IN ANY JURISDICTION WHERE THE OFFER OR SALE IS NOT PERMITTED. | ||
| 71 | ||
| Structural and Collateral Term Sheet | BMO 2024-5C7 | |
| No. 7 – Interstate Industrial Portfolio | ||
The following table presents certain information relating to the Interstate Industrial Portfolio Properties:
| Portfolio Summary | |||||||||||||
| Property | State | Net Rentable Area (SF)(1) | Year Built/ Renovated(2) | % UW NOI(1) | Allocated Loan Amount “ALA” | % of ALA | “As-Is” Appraised Value(2) | % Office(2) | Clear Heights (ft.)(2) | Dock Doors (2) | Drive-In Doors (2) | ||
| 2294 Molly Pitcher Highway | PA | 621,400 | 1960 / 1991 | 22.4 | % | $27,700,000 | 24.7 | % | $44,675,000 | 3.0% | 17' - 32' | 40 | 2 |
| Steelway Industrial Park | NY | 661,623 | 1970, 1977 / NAP | 21.5 | 24,400,000 | 21.8 | 33,300,000 | 1.0% | 27' - 28' | 73 | 5 | ||
| 1001 and 1011 AIP Drive | PA | 285,831 | 1992 / 2012 | 14.5 | 19,400,000 | 17.3 | 31,850,000 | 3.6% | 20' - 30' | 55 | 1 | ||
| Northeastern Industrial Park (Bldgs 8, 21 & 22) | NY | 397,923 | 1947, 1988, 1989 / NAP | 19.5 | 16,100,000 | 14.4 | 29,300,000 | 1.8% | 24' - 36' | 64 | 3 | ||
| Owens Brockway Distribution Warehouse | OH | 300,000 | 1991 / NAP | 9.5 | 10,900,000 | 9.7 | 14,750,000 | 2.0% | 30' | 13 | 1 | ||
| Marway Circle Industrial Buildings | NY | 176,348 | 1975-1980 / NAP | 6.8 | 8,400,000 | 7.5 | 13,900,000 | 23.1% | 18' - 30' | 27 | 3 | ||
| DLG International, Inc. | OH | 130,735 | 1988 / NAP | 5.8 | 5,100,000 | 4.6 | 7,575,000 | 6.8% | 20' - 26' | 19 | 1 | ||
| Total | 2,573,860 | 100.0 | % | $112,000,000 | 100.0 | % | $175,350,000 | 291 | 16 | ||||
| (1) | Based on the underwritten rent rolls dated September 12, 2024. |
| (2) | Source: Appraisals. |
Environmental. According to the Phase I environmental reports dated between August 8, 2024 and August 15, 2024, there was no evidence of recognized environmental conditions at the Interstate Industrial Portfolio Properties.
The following table presents certain information relating to the historical and current occupancy of the Interstate Industrial Portfolio Properties:
| Historical and Current Occupancy(1) | |||
| 2021(2) | 2022(2) | 2023 | Current(3) |
| 81.9% | 99.1% | 100.0% | 98.6% |
| (1) | Historical occupancies are as of December 31 of each respective year. |
| (2) | The increase in occupancy from 2021 to 2022 is primarily attributed to lease up at the 2294 Molly Pitcher Highway property from 25.0% in 2021 to 96.1% in 2022. The 2294 Molly Pitcher Highway property accounts for 24.1% of NRA at the Interstate Industrial Portfolio Properties. |
| (3) | Current occupancy is based on the underwritten rent rolls as of September 12, 2024. See “Top Tenant Summary” below for more information. |
| THE INFORMATION IN THIS COLLATERAL TERM SHEET IS NOT COMPLETE AND MAY BE AMENDED PRIOR TO THE TIME OF SALE. THIS TERM SHEET IS NOT AN OFFER TO SELL THESE SECURITIES AND IT IS NOT A SOLICITATION OF AN OFFER TO BUY THESE SECURITIES IN ANY JURISDICTION WHERE THE OFFER OR SALE IS NOT PERMITTED. | ||
| 72 | ||
| Structural and Collateral Term Sheet | BMO 2024-5C7 | |
| No. 7 – Interstate Industrial Portfolio | ||
The following table presents certain information relating to the largest tenants by underwritten base rent at the Interstate Industrial Portfolio Properties:
| Top Tenant Summary(1) | ||||||||||
| Tenant | Property | Ratings Moody’s/S&P/ Fitch(2) | Net Rentable Area (SF) | % of Total NRA | UW Base Rent PSF(3) | UW Base Rent(3) | % of Total UW Base Rent(3) | Lease Expiration Date | ||
| Owens-Brockway Glass Container, Inc. | Owens Brockway Distribution Warehouse | Ba3/BB-/NR | 300,000 | 11.7 | % | $3.56 | $1,067,271 | 9.1 | % | 4/30/2029 |
| Thyssenkrupp Supply Chain Services NA, Inc.(4) | 2294 Molly Pitcher Highway | Ba3/BB/NR | 255,000 | 9.9 | $4.65 | 1,185,750 | 10.1 | 6/30/2025 | ||
| Victory Packaging LP | Steelway Industrial Park | Baa2/BBB/NR | 195,949 | 7.6 | $4.79 | 938,498 | 8.0 | 9/30/2029 | ||
| D.M. Bowman(5) | 2294 Molly Pitcher Highway | NR/NR/NR | 192,000 | 7.5 | $4.65 | 892,800 | 7.6 | 2/21/2026 | ||
| Rotondo Warehouse | Steelway Industrial Park | NR/NR/NR | 177,222 | 6.9 | $3.38 | 599,125 | 5.1 | Various(6) | ||
| Total Major Tenants | 1,120,171 | 43.5 | % | $4.18 | $4,683,445 | 39.8 | % | |||
| Other Tenants | 1,418,924 | 55.1 | $5.00 | $7,088,162 | 60.2 | % | ||||
| Occupied Collateral Total / Wtd. Avg. | 2,539,095 | 98.6 | % | $4.64 | $11,771,606 | 100.0 | % | |||
| Vacant Space | 34,765 | 1.4 | ||||||||
| Collateral Total | 2,573,860 | 100.0 | % | |||||||
| (1) | Based on the underwritten rent rolls dated September 12, 2024. |
| (2) | In certain instances, ratings provided are those of the parent company of the entity shown, whether or not the parent company guarantees the lease. |
| (3) | UW Base Rent PSF, UW Base Rent and % of Total UW Base Rent are inclusive of approximately $687,882 of contractual rent steps through November 1, 2025. |
| (4) | Thyssenkrupp Supply Chain Services NA, Inc. subleases 255,000 square feet of space from D.M. Bowman, Inc. at the 2294 Molly Pitcher Highway property expiring on June 30, 2025 at a base rental rate of $4.65 per square feet. The 255,000 square foot sublease provides for mutual termination rights at 90 days’ notice. However, D.M. Bowman, Inc. must continue to pay rent and recoveries in accordance with its lease and has signed an estoppel attesting to its intent to honor its lease through its lease expiration date of February 20, 2026. The sublease allows for Thyssenkrupp Supply Chain Services NA, Inc. to extend through D.M. Bowman, Inc.’s lease expiration date of February 20, 2026. |
| (5) | D.M. Bowman is the direct lease tenant with a lease term through February 21, 2026 at a current base rent of $5.10 per square foot NNN, which steps to $5.25 per square foot NNN in February 2025. The tenant vacated its space but continues to pay base rent and reimbursements per the terms of the lease. UBS AG has underwritten to the sublease rent for Thyssenkrupp Supply Chain Services NA, Inc. due to the expectation that Thyssenkrupp Supply Chain Services NA, Inc. will expand into the remaining space. |
| (6) | Rotondo Warehouse leases 112,000 square feet at the Steelway Industrial Park property expiring on June 30, 2026, and 65,222 square feet at the Steelway Industrial Park property expiring on September 30, 2027. |
| THE INFORMATION IN THIS COLLATERAL TERM SHEET IS NOT COMPLETE AND MAY BE AMENDED PRIOR TO THE TIME OF SALE. THIS TERM SHEET IS NOT AN OFFER TO SELL THESE SECURITIES AND IT IS NOT A SOLICITATION OF AN OFFER TO BUY THESE SECURITIES IN ANY JURISDICTION WHERE THE OFFER OR SALE IS NOT PERMITTED. | ||
| 73 | ||
| Structural and Collateral Term Sheet | BMO 2024-5C7 | |
| No. 7 – Interstate Industrial Portfolio | ||
The following table presents certain information relating to the tenant lease expirations of the Interstate Industrial Portfolio Properties:
| Lease Rollover Schedule(1)(2) | ||||||||||||
| Year | Number of Leases Expiring | Net Rentable Area Expiring | % of NRA Expiring | UW Base Rent Expiring | % of UW Base Rent Expiring | Cumulative Net Rentable Area Expiring | Cumulative % of NRA Expiring | Cumulative UW Base Rent Expiring | Cumulative % of UW Base Rent Expiring | |||
| Vacant | NAP | 34,765 | 1.4 | % | NAP | NAP | 34,765 | 1.4% | NAP | NA | P | |
| 2024 & MTM | 0 | 0 | 0.0 | $0 | 0.0 | % | 34,765 | 1.4% | $0 | 0.0% | ||
| 2025 | 6 | 447,730 | 17.4 | 2,093,740 | 17.8 | 482,495 | 18.7% | $2,093,740 | 17.8% | |||
| 2026 | 8 | 674,236 | 26.2 | 3,241,019 | 27.5 | 1,156,731 | 44.9% | $5,334,759 | 45.3% | |||
| 2027 | 4 | 209,394 | 8.1 | 991,949 | 8.4 | 1,366,125 | 53.1% | $6,326,708 | 53.7% | |||
| 2028 | 7 | 313,164 | 12.2 | 1,421,564 | 12.1 | 1,679,289 | 65.2% | $7,748,272 | 65.8% | |||
| 2029 | 4 | 670,349 | 26.0 | 2,598,729 | 22.1 | 2,349,638 | 91.3% | $10,347,001 | 87.9% | |||
| 2030 | 4 | 132,560 | 5.2 | 857,715 | 7.3 | 2,482,198 | 96.4% | $11,204,716 | 95.2% | |||
| 2031 | 3 | 29,846 | 1.2 | 226,902 | 1.9 | 2,512,044 | 97.6% | $11,431,618 | 97.1% | |||
| 2032 | 1 | 61,816 | 2.4 | 339,988 | 2.9 | 2,573,860 | 100.0% | $11,771,606 | 100.0% | |||
| 2033 | 0 | 0 | 0.0 | 0 | 0.0 | 2,573,860 | 100.0% | $11,771,606 | 100.0% | |||
| 2034 | 0 | 0 | 0.0 | 0 | 0.0 | 2,573,860 | 100.0% | $11,771,606 | 100.0% | |||
| 2035 & Beyond | 0 | 0 | 0.0 | 0 | 0.0 | 2,573,860 | 100.0% | $11,771,606 | 100.0% | |||
| Total | 37 | 2,573,860 | 100.0 | % | $11,771,606 | 100.0 | % | |||||
| (1) | Based on the underwritten rent rolls dated September 12, 2024, inclusive of rent steps through November 1, 2025 totaling $687,882. |
| (2) | Certain leases may have termination options that are exercisable prior to the originally stated expiration date of the lease and are not considered in this Lease Rollover Schedule. |
The following table presents certain information relating to the operating history and underwritten cash flows of the Interstate Industrial Portfolio Properties:
| Operating History and Underwritten Net Cash Flow | |||||||||
| 2021 | 2022 | 2023 | TTM(1) | Underwritten | Per Square Foot | %(2) | |||
| Base Rent(3) | $7,601,485 | $10,407,421 | $10,910,113 | $10,996,680 | $11,083,724 | $4.31 | 68.6 | % | |
| Rent Steps(4) | 0 | 0 | 0 | 0 | 687,882 | 0.27 | 4.3 | ||
| Vacant Income | 0 | 0 | 0 | 0 | 260,019 | 0.10 | 1.6 | ||
| Gross Potential Rent | $7,601,485 | $10,407,421 | $10,910,113 | $10,996,680 | $12,031,625 | $4.67 | 74.5 | % | |
| Total Reimbursements | 2,120,588 | 2,886,141 | 3,970,502 | 4,011,774 | 4,074,333 | 1.58 | 25.2 | ||
| Total Other Income | 0 | 0 | 23,073 | 42,507 | 42,507 | 0.02 | 0.3 | ||
| Net Rental Income | $9,722,073 | $13,293,562 | $14,903,689 | $15,050,961 | $16,148,465 | $6.27 | 100.0 | % | |
| (Vacancy/Credit Loss) | 0 | 0 | 0 | 0 | (805,690) | (0.31) | (5.0) | ||
| Effective Gross Income | $9,722,073 | $13,293,562 | $14,903,689 | $15,050,961 | $15,342,775 | $5.96 | 95.0 | % | |
| Total Expenses | 3,544,841 | 4,062,246 | 4,341,356 | 4,261,786 | 4,209,461 | 1.64 | 27.4 | ||
| Net Operating Income(5) | $6,177,232 | $9,231,316 | $10,562,333 | $10,789,175 | $11,133,314 | $4.33 | 72.6 | % | |
| Total TI / LC, Capex/RR | 0 | 0 | 0 | 0 | 1,029,544 | 0.40 | 6.7 | ||
| Net Cash Flow | $6,177,232 | $9,231,316 | $10,562,333 | $10,789,175 | $10,103,770 | $3.93 | 65.9 | % | |
| (1) | TTM represents the trailing 12-month period ending July 31, 2024. |
| (2) | % column represents percent of Net Rental Income for all revenue lines and represents percent of Effective Gross Income for the remainder of the fields. |
| (3) | Base Rent is based on the underwritten rent rolls dated September 12, 2024. |
| (4) | Rent Steps totaling $687,882 are taken through November 1, 2025. |
| (5) | The increase from 2021 Net Operating Income to 2022 Net Operating Income is primarily attributed to the lease up at the 2294 Molly Pitcher Highway property from 25.0% in 2021 to 96.1% in 2022. The 2294 Molly Pitcher Highway property accounts for 24.1% of NRA at the Interstate Industrial Portfolio Properties. |
The Market. The Interstate Industrial Portfolio Properties are located in New York (43.7% of ALA), Pennsylvania (42.1% of ALA) and Ohio (14.3% of ALA).
| THE INFORMATION IN THIS COLLATERAL TERM SHEET IS NOT COMPLETE AND MAY BE AMENDED PRIOR TO THE TIME OF SALE. THIS TERM SHEET IS NOT AN OFFER TO SELL THESE SECURITIES AND IT IS NOT A SOLICITATION OF AN OFFER TO BUY THESE SECURITIES IN ANY JURISDICTION WHERE THE OFFER OR SALE IS NOT PERMITTED. | ||
| 74 | ||
| Structural and Collateral Term Sheet | BMO 2024-5C7 | |
| No. 7 – Interstate Industrial Portfolio | ||
The following table presents certain market information with respect to the Interstate Industrial Portfolio Properties:
| Market Overview(1) | ||||||||
| Property | Net Rentable Area (SF)(2) | Submarket | Property Vacancy(2) | Submarket Vacancy | Appraisal Concluded Vacancy | Submarket Inventory (SF) | UW Base Rent PSF(2)(3) | Submarket Rent PSF |
| 2294 Molly Pitcher Highway | 621,400 | Chambersburg/ Waynesboro | 0.0% | 12.1% | 5.0% | 35,691,682 | $4.30(4) | $6.63 |
| Steelway Industrial Park | 661,623 | NE Outer Onondaga County | 0.0% | 3.6% | 3.0% | 15,102,908 | $4.17 | $7.37 |
| 1001 and 1011 AIP Drive | 285,831 | Harrisburg Area East | 0.0% | 8.1% | 7.0% | 39,766,526 | $5.97 | $8.16 |
| Northeastern Industrial Park (Bldgs 8, 21 & 22) | 397,923 | W Outer Albany County | 0.1% | 2.4% | 3.0% | 9,412,373 | $5.62 | $8.76 |
| Owens Brockway Distribution Warehouse(5) | 300,000 | Zanesville | 0.0% | 1.7% | 0.0% | 9,235,173 | $3.56 | $5.77 |
| Marway Circle Industrial Buildings | 176,348 | Southwest | 19.4% | 10.8% | 3.0% | 14,371,034 | $5.87 | $9.11 |
| DLG International, Inc. | 130,735 | Union County | 0.0% | 2.5% | 0.0% | 14,285,311 | $3.83 | $9.35 |
| Total/Wtd. Avg. | 2,573,860 | 1.4% | 6.2% | 3.4% | 137,865,007 | $4.64 | $7.53 | |
| (1) | Source: Third-party market research reports. |
| (2) | Based on the underwritten rent rolls dated September 12, 2024. |
| (3) | UW Base Rent PSF excludes underwritten vacant space and is inclusive of approximately $687,882 of contractual rent steps through November 1, 2025. |
| (4) | UW Base Rent PSF for the 2294 Molly Pitcher Highway property is based on the Thyssenkrupp Supply Chain Services NA, Inc. sublease base rental rate of $4.65 per square foot. D.M. Bowman, Inc. currently pays a base rental rate of $5.10 per square foot for its space. The tenant vacated its space but continues to pay base rent and reimbursements per the terms of the lease. |
| (5) | No submarket data for the Owens Brockway Distribution Warehouse property was available. Market information is presented in the table above. |
The following table presents certain demographic information with respect to the Interstate Industrial Portfolio Properties:
| Demographics Overview | |||||||||||
| Property | Net Rentable Area (SF)(1) | ALA | % of ALA | UW NOI | % of UW NOI | Estimated 2024 Population (5-mile Radius)(2) | Estimated 2024 Average Household Income (5-mile Radius)(2) | ||||
| 2294 Molly Pitcher Highway | 621,400 | $27,700,000 | 24.7 | % | $2,496,650 | 22.4 | % | 50,828 | $93,790 | ||
| Steelway Industrial Park | 661,623 | 24,400,000 | 21.8 | 2,389,348 | 21.5 | 118,935 | $92,075 | ||||
| 1001 and 1011 AIP Drive | 285,831 | 19,400,000 | 17.3 | 1,609,407 | 14.5 | 54,373 | $103,186 | ||||
| Northeastern Industrial Park (Bldgs 8, 21 & 22) | 397,923 | 16,100,000 | 14.4 | 2,173,697 | 19.5 | 39,068 | $133,739 | ||||
| Owens Brockway Distribution Warehouse | 300,000 | 10,900,000 | 9.7 | 1,055,368 | 9.5 | 32,343 | $67,037 | ||||
| Marway Circle Industrial Buildings | 176,348 | 8,400,000 | 7.5 | 762,041 | 6.8 | 169,535 | $74,723 | ||||
| DLG International, Inc. | 130,735 | 5,100,000 | 4.6 | 646,804 | 5.8 | 33,165 | $121,465 | ||||
| Total/Wtd. Avg. | 2,573,860 | $112,000,000 | 100.0 | % | $11,133,314 | 100.0 | % | 71,992 | $97,550 | ||
| (1) | Based on the underwritten rent rolls dated September 12, 2024. |
| (2) | Information obtained from third-party market research reports. |
The Borrowers. The borrowers are Albany NY Warehouse LLC, Syracuse NY Warehouse LLC, Rochester NY Warehouse LLC, Harrisburg PA Warehouse LLC and Columbus OH Warehouse LLC, each a Delaware limited liability company and a single purpose entity with one independent director. Legal counsel to the borrowers delivered a non-consolidation opinion in connection with the origination of the Interstate Industrial Portfolio Whole Loan.
The Borrower Sponsor. The borrower sponsor and non-recourse carveout guarantor is Gavriel Alexander, founder and chief executive officer of Alexander Property Holdings, LLC (“APH”). APH is a privately held real estate company that is engaged in the acquisition, development, ownership, and management of real estate throughout the country. APH is based in New City, New York, where it controls or manages a portfolio of multifamily communities, office buildings, commercial buildings, and development sites. Resources include accounting services, underwriters, marketing capabilities, and a support staff that provides APH with infrastructure to continue to grow.
Property Management. The Interstate Industrial Portfolio Properties are managed by Heritage Capital Management, LLC.
| THE INFORMATION IN THIS COLLATERAL TERM SHEET IS NOT COMPLETE AND MAY BE AMENDED PRIOR TO THE TIME OF SALE. THIS TERM SHEET IS NOT AN OFFER TO SELL THESE SECURITIES AND IT IS NOT A SOLICITATION OF AN OFFER TO BUY THESE SECURITIES IN ANY JURISDICTION WHERE THE OFFER OR SALE IS NOT PERMITTED. | ||
| 75 | ||
| Structural and Collateral Term Sheet | BMO 2024-5C7 | |
| No. 7 – Interstate Industrial Portfolio | ||
Escrows and Reserves. At origination, the borrowers deposited (i) approximately $188,503 for real estate taxes, (ii) approximately $265,597 for insurance premiums, (iii) $1,400,000 for tenant improvements and leasing commissions, (iv) $197,044 for deferred maintenance, (v) approximately $210,881 for rent concession funds with respect to the Giovanni Food, Inc. lease ($101,703) for underwritten reimbursements for the period of November 2024 through May 2025 and the Triple Eggs LLC lease ($109,178.48) for rent concessions in months one, two and 25 of the lease term and (v) approximately $575,287 for TA TI / LC funds associated with Victory Packaging LP ($540,286.97) and Packaging Corporation of America ($35,000).
Tax Escrows – On a monthly basis, the borrowers are required to deposit 1/12th of an amount that would be sufficient to pay taxes for the next ensuing 12 months (currently equivalent to approximately $188,503 a month).
Insurance Escrows – On a monthly basis, the borrowers are required to deposit 1/12th of an amount that would be sufficient to pay insurance premiums for the renewal of coverages (currently equivalent to approximately $40,242 a month).
Replacement Reserve – On a monthly basis, the borrowers are required to deposit approximately $32,173 for replacement reserves subject to a cap of $772,158.
TI / LC Reserve – On a monthly basis, the borrowers are required to deposit an aggregate amount equal to $0.25 per square foot for TI / LC reserves from November 6, 2024 through October 6, 2027. From November 6, 2027 through October 6, 2028, the borrowers are required to deposit an aggregate amount equal to $0.50 per square foot for TI / LC reserves, subject to a cap of $1,500,000 for the full TI / LC reserve. From November 6, 2028 through October 6, 2029, the borrowers are required to deposit an aggregate amount equal to $0.25 per square foot for TI / LC reserves, subject to a cap of $1,500,000 for the full TI / LC reserve. If the TI / LC reserve exceeds $2,000,000 at any point from November 6, 2024 through October 6, 2027, up to $200,0000 of the TI / LC reserve may be utilized for capital expenditure related items, so long as those capital expenditure funds are depleted.
Lockbox / Cash Management. The Interstate Industrial Portfolio Whole Loan is structured with a hard lockbox and springing cash management upon the occurrence and continuance of a Cash Management Trigger Event (as defined below). Rents from the Interstate Industrial Portfolio Properties are required to be deposited directly into the lockbox account or, if received by the borrowers or the property manager, deposited within three business days of receipt. During the continuance of a Cash Management Trigger Event, all funds in the lockbox account are required to be swept each business day to a lender-controlled cash management account and disbursed in accordance with the Interstate Industrial Portfolio Whole Loan documents, and all excess funds on deposit in the cash management account (after payment of required monthly reserve deposits, debt service payment on the Interstate Industrial Portfolio Whole Loan, operating expenses and cash management bank fees) will be applied as follows: (a) if a Material Tenant Trigger Event (as defined below) has occurred and is continuing, to a Material Tenant (as defined below) rollover reserve, (b) if a Cash Sweep Trigger Event (as defined below) has occurred and is continuing (but not a Material Tenant Trigger Event), to the lender-controlled excess cash flow account or (c) if no Material Tenant Trigger Event or Cash Sweep Trigger Event has occurred and is continuing, to an account designated by the borrowers.
A “Cash Management Trigger Event” means a period commencing upon the occurrence of (i) an event of default under the Interstate Industrial Portfolio Whole Loan documents, (ii) any bankruptcy action involving any of the borrowers, the guarantor or the property manager, (iii) the trailing 12-month period debt service coverage ratio falling below 1.20x, (iv) the indictment for fraud or misappropriation of funds by any of the borrowers, the guarantor or an affiliated or third-party property manager (provided that, in the case of the third-party property manager, such fraud or misappropriation is related to any of the Interstate Industrial Portfolio Properties), or any director or officer of the aforementioned parties or (v) a Material Tenant Trigger Event, and expiring upon (a) with respect to clause (i) above, the cure of such event of default, (b) with respect to clause (ii) above, the filing being discharged, stayed or dismissed within 60 days, and the lender’s determination that such filing does not materially affect the borrowers’, the guarantor’s or the property manager’s monetary obligations, (c) with respect to clause (iii) above, the trailing 12-month debt service coverage ratio being at least 1.20x for two consecutive calendar quarters, (d) with respect to clause (iv) above, the dismissal of the applicable indictment with prejudice or acquittal of the applicable person, or the replacement of the property manager with a third-party property manager that constitutes a qualified property manager under the Interstate Industrial Portfolio Whole Loan documents or (e) with respect to clause (v) above, the cure of such Material Tenant Trigger Event.
A “Cash Sweep Trigger Event” means a period commencing upon the occurrence of (i) an event of default under the Interstate Industrial Portfolio Whole Loan documents, (ii) any bankruptcy action involving any of the borrowers, the guarantor
| THE INFORMATION IN THIS COLLATERAL TERM SHEET IS NOT COMPLETE AND MAY BE AMENDED PRIOR TO THE TIME OF SALE. THIS TERM SHEET IS NOT AN OFFER TO SELL THESE SECURITIES AND IT IS NOT A SOLICITATION OF AN OFFER TO BUY THESE SECURITIES IN ANY JURISDICTION WHERE THE OFFER OR SALE IS NOT PERMITTED. | ||
| 76 | ||
| Structural and Collateral Term Sheet | BMO 2024-5C7 | |
| No. 7 – Interstate Industrial Portfolio | ||
or the property manager or (iii) the trailing 12-month period debt service coverage ratio falling below 1.15x, and expiring upon (a) with respect to clause (i) above, the cure of such event of default, (b) with respect to clause (ii) above, as to an involuntary filing, the filing being discharged, stayed or dismissed within 60 days, and the lender’s determination that such filing does not materially affect the borrowers’, the guarantor’s or the property manager’s monetary obligations or (c) with respect to clause (iii) above, the trailing 12-month debt service coverage ratio is at least 1.15x for two consecutive calendar quarters.
A “Material Tenant” means (i) Owens-Brockway Glass Container, Inc., (ii) Victory Packaging LP, (iii) D.M. Bowman, Inc. or (iv) any tenant at the Interstate Industrial Portfolio Properties that, together with its affiliates, either (a) leases no less than 20% of the total rentable square footage of the Interstate Industrial Portfolio Properties or (b) accounts for (or would account for) no less than 20% of the total in-place base rent at the Interstate Industrial Portfolio Properties.
A “Material Tenant Trigger Event” means a period commencing upon the occurrence of (i) a Material Tenant giving notice of its intention to terminate, cancel, or not to extend or renew its lease, (ii) on or prior to the date that is 12 months prior to the then applicable expiration date under its Material Tenant lease, the Material Tenant does not extend its lease on terms and conditions reasonably acceptable to the lender, (iii) on or prior to the date a Material Tenant is required under its Material Tenant lease to notify the borrowers of its election to extend or renew its lease, if such Material Tenant does not give notice, (iv) an event of default under a Material Tenant lease occurring and continuing beyond any applicable notice and/or cure period, (v) a bankruptcy action of a Material Tenant or a lease guarantor of any Material Tenant lease occurring, (vi) a Material Tenant lease being terminated (in whole or in part) or is no longer in full force and effect, (vii) a Material Tenant (other than D.M. Bowman, Inc., but only for so long as the Thyssenkrupp Supply Chain Services NA, Inc. sublease remains in full force and effect) “going dark”, vacating, ceasing to occupy or ceasing to conduct business in the ordinary course at the applicable property or a portion thereof constituting more than 25% of the total net rentable square footage at the applicable property, (viii) a Material Tenant announcing or disclosing its intention to relocate from or vacate all or substantially all of its Material Tenant space or (ix) all or substantially all of a Material Tenant space is marketed for sublease by or on behalf of a Material Tenant (other than D.M. Bowman, Inc., but only for so long as the Thyssenkrupp Supply Chain Services NA, Inc. sublease remains in full force and effect), and expiring upon (a) with respect to clause (i), (ii), (iii), (vi), (vii), (viii) or (ix) above, (1) the applicable Material Tenant lease is extended or (2) all or substantially all of the applicable Material Tenant space is leased pursuant to one or more qualified leases, (b) with respect to clause (i) above, the date that the applicable Material Tenant revokes or rescinds all termination or cancellation notices, (c) with respect to clause (iv) above, a cure of the applicable event of default, (d) with respect to clause (v) above, the affirmation of the Material Tenant lease in the applicable bankruptcy proceeding and confirmation that the Material Tenant is actually paying all rents and other amounts under its lease (or, if applicable, the discharge or dismissal of the applicable Material Tenant lease guarantor from the applicable bankruptcy proceeding; provided that such bankruptcy (after dismissal or discharge) does not have an adverse effect on such Material Tenant lease guarantor’s ability to perform its obligations under its lease guaranty), (e) with respect to clause (vii) above, the applicable Material Tenant recommences its operations, such that it is no longer dark, and has not vacated or ceased to conduct business at the applicable property, (f) with respect to clause (viii) above, the Material Tenant retracts all announcements or disclosures of its intention to relocate from or vacate any portion of its Material Tenant space and (g) with respect to clause (ix) above, the unconditional cessation of all marketing efforts by or on behalf of the applicable Material Tenant with respect to its Material Tenant space. As of the origination date of the Interstate Industrial Portfolio Whole Loan, there is no Material Tenant Trigger Event in effect.
Subordinate and Mezzanine Debt. None.
Permitted Future Mezzanine and Subordinate Debt. Not permitted.
Partial Release. Not permitted.
Ground Lease. None.
| THE INFORMATION IN THIS COLLATERAL TERM SHEET IS NOT COMPLETE AND MAY BE AMENDED PRIOR TO THE TIME OF SALE. THIS TERM SHEET IS NOT AN OFFER TO SELL THESE SECURITIES AND IT IS NOT A SOLICITATION OF AN OFFER TO BUY THESE SECURITIES IN ANY JURISDICTION WHERE THE OFFER OR SALE IS NOT PERMITTED. | ||
| 77 | ||
| Structural and Collateral Term Sheet | BMO 2024-5C7 | |
| No. 8 – West Palm Gardens | ||

| THE INFORMATION IN THIS COLLATERAL TERM SHEET IS NOT COMPLETE AND MAY BE AMENDED PRIOR TO THE TIME OF SALE. THIS TERM SHEET IS NOT AN OFFER TO SELL THESE SECURITIES AND IT IS NOT A SOLICITATION OF AN OFFER TO BUY THESE SECURITIES IN ANY JURISDICTION WHERE THE OFFER OR SALE IS NOT PERMITTED. | ||
| 78 | ||
| Structural and Collateral Term Sheet | BMO 2024-5C7 | |
| No. 8 – West Palm Gardens | ||
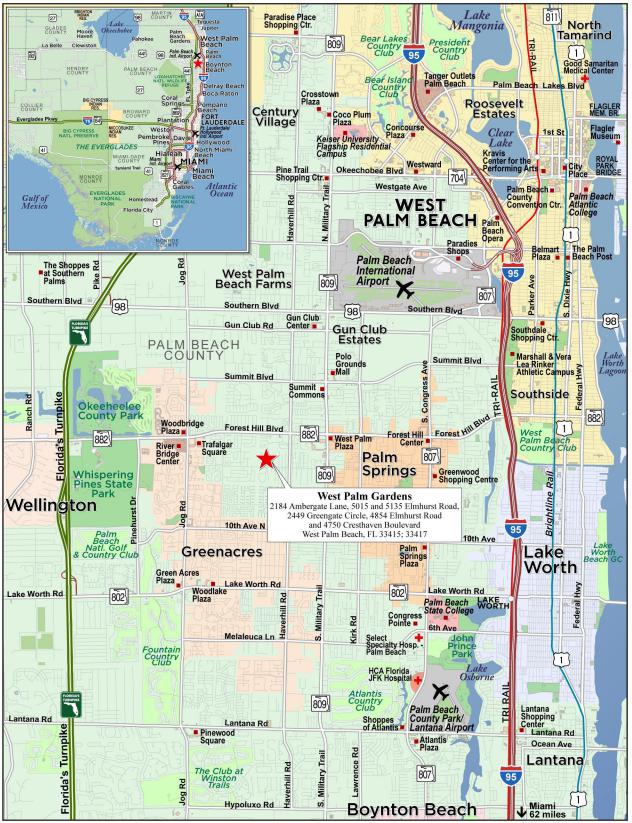
| THE INFORMATION IN THIS COLLATERAL TERM SHEET IS NOT COMPLETE AND MAY BE AMENDED PRIOR TO THE TIME OF SALE. THIS TERM SHEET IS NOT AN OFFER TO SELL THESE SECURITIES AND IT IS NOT A SOLICITATION OF AN OFFER TO BUY THESE SECURITIES IN ANY JURISDICTION WHERE THE OFFER OR SALE IS NOT PERMITTED. | ||
| 79 | ||
| Structural and Collateral Term Sheet | BMO 2024-5C7 | |
| No. 8 – West Palm Gardens | ||
| Mortgage Loan Information | Property Information | |||
| Mortgage Loan Seller: | CREFI | Single Asset / Portfolio: | Single Asset | |
| Original Principal Balance: | $50,000,000 | Title: | Fee | |
| Cut-off Date Principal Balance: | $50,000,000 | Property Type – Subtype: | Multifamily – Garden | |
| % of IPB: | 5.2% | Net Rentable Area (Units): | 437 | |
| Loan Purpose: | Refinance | Location: | West Palm Beach, FL | |
| Borrowers: | West Palm Gardens FL LLC and SDS WPB TIC LP | Year Built / Renovated: | 1982, 1984, 1987 / 2023 | |
| Borrower Sponsor: | Zvi Horowitz and Samuel Pollak | Occupancy: | 94.3% | |
| Interest Rate: | 6.45000% | Occupancy Date: | 8/26/2024 | |
| Note Date: | 9/20/2024 | 4th Most Recent NOI (As of): | $3,177,319 (12/31/2021) | |
| Maturity Date: | 10/6/2029 | 3rd Most Recent NOI (As of)(2): | $3,303,012 (TTM 8/31/2022) | |
| Interest-only Period: | 60 months | 2nd Most Recent NOI (As of): | $4,084,148 (12/31/2023) | |
| Original Term: | 60 months | Most Recent NOI (As of): | $5,024,675 (TTM 7/31/2024) | |
| Original Amortization Term: | None | UW Economic Occupancy: | 94.0% | |
| Amortization Type: | Interest Only | UW Revenues: | $8,255,992 | |
| Call Protection: | L(24),D(29),O(7) | UW Expenses: | $2,970,367 | |
| Lockbox / Cash Management: | Springing / Springing | UW NOI: | $5,285,625 | |
| Additional Debt: | No | UW NCF: | $5,164,467 | |
| Additional Debt Balance: | NAP | Appraised Value / Per Unit(3): | $84,200,000 / $192,677 | |
| Additional Debt Type: | NAP | Appraisal Date: | 7/22/2024 | |
| Escrows and Reserves(1) | Financial Information | |||||
| Initial | Monthly | Initial Cap | Cut-off Date Loan / Unit: | $114,416 | ||
| Taxes: | $564,639 | $51,331 | N/A | Maturity Date Loan / Unit: | $114,416 | |
| Insurance: | $0 | $65,559 | N/A | Cut-off Date LTV(3): | 59.4% | |
| Replacement Reserves: | $0 | $10,096 | N/A | Maturity Date LTV(3): | 59.4% | |
| Deferred Maintenance: | $62,750 | $0 | N/A | UW NCF DSCR: | 1.58x | |
| UW NOI Debt Yield: | 10.6% | |||||
| Sources and Uses | |||||||
| Sources | Proceeds | % of Total | Uses | Proceeds | % of Total | ||
| Mortgage Loan | $50,000,000 | 100.0% | Loan Payoff | $35,003,463 | 70.0 | % | |
| Sponsor Equity | 13,463,805 | 26.9 | |||||
| Closing Costs | 905,343 | 1.8 | |||||
| Upfront Reserves | 627,389 | 1.3 | |||||
| Total Sources | $50,000,000 | 100.0% | Total Uses | $50,000,000 | 100.0 | % | |
| (1) | See “Escrows and Reserves” below for further discussion of reserve information. |
| (2) | 3rd Most Recent NOI represents the TTM as of August 31, 2022. Full year financials for 2022 are not available as the borrower sponsor entered into a purchase and sale agreement for the West Palm Gardens Properties (as defined below) on August 31, 2022. |
| (3) | Appraised Value / Per Unit represents the “as portfolio” value, which includes a portfolio premium of $600,000. Based on the aggregate “as is” appraised values of the West Palm Gardens Properties of $83,600,000, the Cut-off Date LTV and Maturity Date LTV would be 59.8%. |
| THE INFORMATION IN THIS COLLATERAL TERM SHEET IS NOT COMPLETE AND MAY BE AMENDED PRIOR TO THE TIME OF SALE. THIS TERM SHEET IS NOT AN OFFER TO SELL THESE SECURITIES AND IT IS NOT A SOLICITATION OF AN OFFER TO BUY THESE SECURITIES IN ANY JURISDICTION WHERE THE OFFER OR SALE IS NOT PERMITTED. | ||
| 80 | ||
| Structural and Collateral Term Sheet | BMO 2024-5C7 | |
| No. 8 – West Palm Gardens | ||
The Loan. The eighth largest mortgage loan (the “West Palm Gardens Mortgage Loan”) is secured by the borrowers’ fee interest in a 437-unit, garden-style multifamily development comprised of five complexes within a five-mile radius in West Palm Gardens, Florida (the “West Palm Gardens Properties”). The West Palm Gardens Mortgage Loan is evidenced by one promissory note with an outstanding principal balance as of the Cut-off Date of $50,000,000. The West Palm Gardens Mortgage Loan was originated on September 20, 2024 by Citi Real Estate Funding Inc. (“CREFI”) and accrues interest at a fixed rate of 6.45000% per annum. The West Palm Gardens Mortgage Loan has an initial term of five years, is interest-only for the full term and accrues interest on an Actual/360 basis. The scheduled maturity date of the West Palm Gardens Mortgage Loan is October 6, 2029.
The Property. The West Palm Gardens Properties are a 437-unit, garden style, multifamily development comprised of five complexes within a five-mile radius. The complexes include Ambergate Apartments, Elmwood Apartments, Greengate Apartments, Springtree Apartments, and Suntree Apartments, which are situated at 2184 Ambergate Lane (the “Ambergate Apartments Property”), 5015 and 5135 Elmhurst Road (the “Elmwood Apartments Property”), 2449 Greengate Circle (the “Greengate Apartments Property”), 4854 Elmhurst Road (the “Springtree Apartments Property”), and 4750 Cresthaven Boulevard (the “Suntree Apartments Property”) respectively, all of which are located in West Palm Beach, Florida.
The West Palm Gardens Properties are comprised of 65 one-story multifamily buildings and one-leasing office located across five complexes situated on land parcels ranging in size from 5.4 acres to 12.4 acres. As of August 26, 2024, the West Palm Gardens Properties were 94.3% occupied. The West Palm Gardens Properties were constructed as cardinal housing between 1982 and 1987 and were recently renovated in 2023. The borrower sponsor acquired the West Palm Gardens Properties in August 2022 for $52,920,000 and subsequently invested $3,414,941 to renovate the West Palm Gardens Properties in 2023. Renovations included both unit and common area upgrades with units being renovated upon turnover. As of August 26, 2024, 185 units (42.3% of total units) had been renovated, including all five studio units, 117 one-bedroom, one-bathroom units, 50 two-bedroom, one-bathroom units and 13 two-bedroom, two-bathroom units. The sponsor expects to renovate the remaining 252 units on a rolling basis; however, such renovations are not required or reserved for under the West Palm Gardens Mortgage Loan documents.
The West Palm Gardens Properties feature 752 parking spaces resulting in a parking ratio of 1.72 spaces per unit. The unit mix at the West Palm Gardens Properties consists of five studios, 352 one-bedroom units, and 80 two-bedroom units. Community amenities at the West Palm Gardens Properties include a pool at the Greengate Apartments Property and on-site laundry. Unit amenities include in-wall air-conditioning, stainless-steel appliances (renovated units) and granite countertops (renovated units).
The following table presents certain information relating to the five complexes that comprise the West Palm Gardens Properties:
| Property Summary | ||||||||
| Property Name | Year Built / Renovation | Number of Units | Net Rentable Area (SF) | Total Site Size (Acres) | Number of Buildings | Total Occ. % | Parking Spaces | As-is Appraised Value |
| Ambergate Apartments | 1987/2023 | 73 | 43,488 | 9.1 | 10 | 95.9% | 101 | $13,650,000 |
| Elmwood Apartments | 1984/2023 | 104 | 67,392 | 8.6 | 19 | 95.2% | 150 | $20,000,000 |
| Greengate Apartments | 1987/2023 | 119 | 70,560 | 12.4 | 12 | 97.5% | 179 | $21,850,000 |
| Springtree Apartments | 1982/2023 | 73 | 45,504 | 5.5 | 12 | 89.0% | 200 | $13,700,000 |
| Suntree Apartments | 1982/2023 | 68 | 46,368 | 5.4 | 13 | 91.2% | 122 | $14,400,000 |
| Total | 437 | 273,312 | 41.0 | 66 | 94.3% | 752 | $83,600,000 | |
| THE INFORMATION IN THIS COLLATERAL TERM SHEET IS NOT COMPLETE AND MAY BE AMENDED PRIOR TO THE TIME OF SALE. THIS TERM SHEET IS NOT AN OFFER TO SELL THESE SECURITIES AND IT IS NOT A SOLICITATION OF AN OFFER TO BUY THESE SECURITIES IN ANY JURISDICTION WHERE THE OFFER OR SALE IS NOT PERMITTED. | ||
| 81 | ||
| Structural and Collateral Term Sheet | BMO 2024-5C7 | |
| No. 8 – West Palm Gardens | ||
The following tables presents certain information relating to the unit mix at the West Palm Gardens Properties:
| West Palm Gardens Consolidated Unit Mix(1) | |||||||
| Unit Type | # of Units | % of Total | Occupied Units | Occupancy | Average Unit Size (SF) | Average Monthly Rent Per Unit | Average Monthly Market Rent Per Unit(2) |
| Studio- Renovated | 5 | 1.1% | 5 | 100.0% | 288 | $1,320 | $1,320 |
| 1 BR / 1 BA | 235 | 53.8% | 226 | 96.2% | 576 | $1,373 | $1,445 |
| 1 BR / 1 BA - Renovated | 117 | 26.8% | 106 | 90.6% | 576 | $1,612 | $1,445 |
| 2 BR / 1 BA | 13 | 3.0% | 13 | 100.0% | 864 | $1,788 | $1,945 |
| 2 BR / 1 BA - Renovated | 50 | 11.4% | 45 | 90.0% | 864 | $1,984 | $1,945 |
| 2 BR / 2 BA | 4 | 0.9% | 4 | 100.0% | 864 | $1,860 | $2,125 |
| 2 BR / 2 BA - Renovated | 13 | 3.0% | 13 | 100.0% | 864 | $2,196 | $2,125 |
| Total/Wtd. Avg. | 437 | 100.0% | 412 | 94.3% | 625 | $1,544 | $1,542 |
| (1) | Based on the underwritten rent roll dated August 26, 2024. Average Monthly Rent Per Unit is based on occupied units. |
| (2) | Source: Appraisal. |
| THE INFORMATION IN THIS COLLATERAL TERM SHEET IS NOT COMPLETE AND MAY BE AMENDED PRIOR TO THE TIME OF SALE. THIS TERM SHEET IS NOT AN OFFER TO SELL THESE SECURITIES AND IT IS NOT A SOLICITATION OF AN OFFER TO BUY THESE SECURITIES IN ANY JURISDICTION WHERE THE OFFER OR SALE IS NOT PERMITTED. | ||
| 82 | ||
| Structural and Collateral Term Sheet | BMO 2024-5C7 | |
| No. 8 – West Palm Gardens | ||
| West Palm Gardens Unit Mix(1) | ||||||
| Unit Type | # of Units | % of Total Units | Occupancy | Average Unit Size (SF) | Average Monthly Rent Per Unit | Average Monthly Market Rent Per Unit(2) |
| Ambergate Apartments | ||||||
| Studio- Renovated | 1 | 1.4% | 100.0% | 288 | $1,300 | $1,300 |
| 1 BR / 1 BA | 51 | 69.9% | 96.1% | 576 | $1,390 | $1,390 |
| 1 BR / 1 BA - Renovated | 15 | 20.5% | 93.3% | 576 | $1,638 | $1,685 |
| 2 BR / 1 BA | 1 | 1.4% | 100.0% | 864 | $1,850 | $1,850 |
| 2 BR / 1 BA - Renovated | 1 | 1.4% | 100.0% | 864 | $2,100 | $2,100 |
| 2 BR / 2 BA - Renovated | 4 | 5.5% | 100.0% | 864 | $2,300 | $2,300 |
| Property Total | 73 | 100.0% | 95.9% | 596 | $1,507 | $1,515 |
| Elmwood Apartments | ||||||
| Studio- Renovated | 2 | 1.9% | 100.0% | 288 | $1,350 | $1,350 |
| 1 BR / 1 BA | 48 | 46.2% | 93.8% | 576 | $1,348 | $1,335 |
| 1 BR / 1 BA - Renovated | 26 | 25.0% | 92.3% | 576 | $1,577 | $1,570 |
| 2 BR / 1 BA | 5 | 4.8% | 100.0% | 864 | $1,780 | $1,770 |
| 2 BR / 1 BA - Renovated | 14 | 13.5% | 100.0% | 864 | $1,907 | $1,915 |
| 2 BR / 2 BA | 3 | 2.9% | 100.0% | 864 | $1,813 | $1,815 |
| 2 BR / 2 BA - Renovated | 6 | 5.8% | 100.0% | 864 | $2,108 | $2,130 |
| Property Total | 104 | 100.0% | 95.2% | 648 | $1,565 | $1,553 |
| Greengate Apartments | ||||||
| 1 BR / 1 BA | 83 | 69.7% | 100.0% | 576 | $1,391 | $1,385 |
| 1 BR / 1 BA - Renovated | 29 | 24.4% | 96.6% | 576 | $1,646 | $1,650 |
| 2 BR / 1 BA - Renovated | 3 | 2.5% | 33.3% | 864 | $2,100 | $2,100 |
| 2 BR / 2 BA | 1 | 0.8% | 100.0% | 864 | $2,000 | $2,000 |
| 2 BR / 2 BA - Renovated | 3 | 2.5% | 100.0% | 864 | $2,233 | $2,235 |
| Property Total | 119 | 100.0% | 97.5% | 593 | $1,486 | $1,494 |
| Springtree Apartments | ||||||
| Studio- Renovated | 1 | 1.4% | 100.0% | 288 | $1,300 | $1,300 |
| 1 BR / 1 BA | 28 | 38.4% | 89.3% | 576 | $1,334 | $1,325 |
| 1 BR / 1 BA - Renovated | 31 | 42.5% | 83.9% | 576 | $1,563 | $1,565 |
| 2 BR / 1 BA - Renovated | 13 | 17.8% | 100.0% | 864 | $1,915 | $1,920 |
| Property Total | 73 | 100.0% | 89.1% | 623 | $1,534 | $1,533 |
| Suntree Apartments | ||||||
| Studio- Renovated | 1 | 1.5% | 100.0% | 288 | $1,300 | $1,300 |
| 1 BR / 1 BA | 25 | 36.8% | 96.0% | 576 | $1,361 | $1,355 |
| 1 BR / 1 BA - Renovated | 16 | 23.5% | 87.5% | 576 | $1,666 | $1,700 |
| 2 BR / 1 BA | 7 | 10.3% | 100.0% | 864 | $1,786 | $1,790 |
| 2 BR / 1 BA - Renovated | 19 | 27.9% | 84.2% | 864 | $2,094 | $2,095 |
| Property Total | 68 | 100.0% | 91.2% | 682 | $1,666 | $1,687 |
| Portfolio Total | ||||||
| Renovated Total | 185 | 42.3% | 91.4% | 666 | $1,747 | $1,756 |
| Unrenovated Total | 252 | 57.7% | 96.4% | 595 | $1,403 | $1,395 |
| Portfolio Total / Wtd Avg. | 437 | 100.0% | 94.3% | 625 | $1,544 | $1,542 |
| (1) | Based on the underwritten rent roll dated August 26, 2024. Average Monthly Rent Per Unit is based on occupied units. |
| (2) | Source: Appraisal. |
| THE INFORMATION IN THIS COLLATERAL TERM SHEET IS NOT COMPLETE AND MAY BE AMENDED PRIOR TO THE TIME OF SALE. THIS TERM SHEET IS NOT AN OFFER TO SELL THESE SECURITIES AND IT IS NOT A SOLICITATION OF AN OFFER TO BUY THESE SECURITIES IN ANY JURISDICTION WHERE THE OFFER OR SALE IS NOT PERMITTED. | ||
| 83 | ||
| Structural and Collateral Term Sheet | BMO 2024-5C7 | |
| No. 8 – West Palm Gardens | ||
Appraisal. According to the appraisals, dated July 22, 2024, the Sterling Portfolio Properties had an “as portfolio” appraised value of $84,200,000. The appraiser also concluded to an aggregate “as is” value of $83,600,000. The table below shows the appraisals’ “as-is” conclusions. Based on the aggregate “as is” value of $83,600,000, the Cut-off Date LTV and Maturity Date LTV for the West Palm Gardens Mortgage Loan are each 59.8%.
| West Palm Gardens Appraised Value(1) | ||
| Property | As Is Value | Capitalization Rate |
| Ambergate Apartments | $13,650,000 | 6.40% |
| Elmwood Apartments | $20,000,000 | 6.45% |
| Greengate Apartments | $21,850,000 | 6.39% |
| Springtree Apartments | $13,700,000 | 6.47% |
| Suntree Apartments | $14,400,000 | 6.53% |
| Total / Wtd. Avg. | $83,600,000 | 6.44% |
| (1) | Source: Appraisal. |
Environmental. According to the Phase I environmental site assessment dated July 24, 2024, there was no evidence of any recognized environmental conditions at the West Palm Gardens Properties.
The following table presents certain information relating to the historical and current occupancy of the West Palm Gardens Properties:
| Historical and Current Occupancy(1) | ||
| 2023 | Current(2) | |
| West Palm Gardens | 88.9% | 94.3% |
| (1) | Historical occupancies represent the average annual occupancy of each respective year. Historical occupancies prior to 2023 are not available. |
| (2) | Current occupancy is as of August 26, 2024. |
| THE INFORMATION IN THIS COLLATERAL TERM SHEET IS NOT COMPLETE AND MAY BE AMENDED PRIOR TO THE TIME OF SALE. THIS TERM SHEET IS NOT AN OFFER TO SELL THESE SECURITIES AND IT IS NOT A SOLICITATION OF AN OFFER TO BUY THESE SECURITIES IN ANY JURISDICTION WHERE THE OFFER OR SALE IS NOT PERMITTED. | ||
| 84 | ||
| Structural and Collateral Term Sheet | BMO 2024-5C7 | |
| No. 8 – West Palm Gardens | ||
The following table presents certain information relating to the historical operating information and underwritten net cash flow of the West Palm Gardens Properties:
| Operating History and Underwritten Net Cash Flow | ||||||
| 2021 | 2022(1) | 2023 | TTM(2) | Underwritten | Per Unit | |
| In-Place Base Rent(3) | $5,000,436 | $5,137,449 | $5,806,024 | $6,845,834 | $7,634,928 | $17,471 |
| Potential Income from Vacant Units | 0 | 0 | 0 | 0 | 483,600 | 1,107 |
| Gross Potential Rent | $5,000,436 | $5,137,449 | $5,806,024 | $6,845,834 | $8,118,528 | $18,578 |
| Other Income(4) | 489,103 | 453,196 | 563,395 | 620,753 | 621,064 | 1,421 |
| Net Rental Income | $5,489,539 | $5,590,645 | $6,369,419 | $7,466,587 | $8,739,592 | $19,999 |
| (Vacancy/Concessions/Credit Loss) | (449,625) | (348,845) | (24,592) | (26,762) | (483,600) | (1,107) |
| Effective Gross Income | $5,039,914 | $5,241,800 | $6,344,827 | $7,439,824 | $8,255,992 | $18,892 |
| Management Fee | 151,197 | 157,233 | 190,345 | 223,193 | 247,680 | 567 |
| Real Estate Taxes | 468,996 | 468,996 | 670,777 | 688,723 | 782,569 | 1,791 |
| Insurance | 218,204 | 231,592 | 381,890 | 411,870 | 794,249 | 1,818 |
| Other Expenses(5) | 1,024,198 | 1,080,967 | 1,017,667 | 1,091,363 | 1,145,869 | 2,622 |
| Total Expenses | $1,862,595 | $1,938,788 | $2,260,679 | $2,415,149 | $2,970,367 | $6,797 |
| Net Operating Income | $3,177,319 | $3,303,012 | $4,084,148 | $5,024,675 | $5,285,625 | $12,095 |
| Replacement Reserves | 0 | 0 | 0 | 0 | 121,158 | 277 |
| Net Cash Flow | $3,177,319 | $3,303,012 | $4,084,148 | $5,024,675 | $5,164,467 | $11,818 |
| (1) | The 2022 column represents the trailing twelve-month period ending August 2022. |
| (2) | The TTM column represents the trailing twelve-month period ending July 2024. |
| (3) | The increase in In-Place Base Rent from TTM to Underwritten is primarily attributable to increased rents on recently renovated units and increase in occupancy at the West Palm Gardens Properties. |
| (4) | Other Income consists of utility and service fees, laundry income, application fee income, late fees, renters insurance waivers, and other miscellaneous income. |
| (5) | Other Expenses consist of payroll and benefits, repairs and maintenance, utilities, advertising and marketing, and general and administrative expenses. |
The Market. The West Palm Gardens Properties are located at 2184 Ambergate Lane, 5015 and 5135 Elmhurst Road, 2449 Greengate Circle, 4854 Elmhurst Road, and 4750 Cresthaven Boulevard, in West Palm Beach, Florida. West Palm Beach is located in Palm Beach County which is part of the Miami-Fort Lauderdale-Pompano Beach metropolitan statistical area (the “Miami-Fort Lauderdale MSA”). West Palm Beach is approximately 24 miles north of Boca Raton and 68 miles north of Miami. Primary access to the city is provided by Interstate 95, U.S. Routes 1 and 98, and State Route 704.
According to a third-party market research report, the West Palm Gardens Properties are located in the Greenacres apartment submarket of the Miami-Fort Lauderdale MSA. As of June 21, 2024, the Greenacres apartment submarket had inventory of 6,403 units, a vacancy rate of 9.9% and effective rent of $1,888 per unit.
The following table presents certain information relating to the demographics of each parcel at the West Palm Gardens Properties:
| Demographic Summary(1) | ||||||
| Population | Median Household Income | |||||
| Property Name | 1-Mile | 3-Mile | 5-Mile | 1-Mile | 3-Mile | 5-Mile |
| Ambergate Apartments | 22,909 | 173,053 | 355,709 | $53,360 | $57,818 | $64,576 |
| Elmwood Apartments | 18,278 | 117,598 | 281,027 | $42,395 | $55,402 | $59,344 |
| Greengate Apartments | 27,564 | 161,747 | 352,669 | $48,095 | $56,386 | $62,368 |
| Springtree Apartments | 16,317 | 107,916 | 248,462 | $34,857 | $55,468 | $59,157 |
| Suntree Apartments | 22,909 | 173,053 | 355,709 | $53,360 | $57,818 | $64,576 |
| Total Portfolio Average | 21,595 | 146,673 | 318,715 | $46,413 | $56,578 | $62,004 |
| (1) | Source: Appraisal. |
| THE INFORMATION IN THIS COLLATERAL TERM SHEET IS NOT COMPLETE AND MAY BE AMENDED PRIOR TO THE TIME OF SALE. THIS TERM SHEET IS NOT AN OFFER TO SELL THESE SECURITIES AND IT IS NOT A SOLICITATION OF AN OFFER TO BUY THESE SECURITIES IN ANY JURISDICTION WHERE THE OFFER OR SALE IS NOT PERMITTED. | ||
| 85 | ||
| Structural and Collateral Term Sheet | BMO 2024-5C7 | |
| No. 8 – West Palm Gardens | ||
The following table presents certain information relating to comparable multifamily properties to the West Palm Gardens Properties:
| Multifamily Rent Comparables(1) | |||||||||
| Property Name / Address | Distance from Subject(2) | Year Built | Occupancy | Number of Units | Unit Type | Average Unit Size | Average Rent Per Unit | ||
West Palm Gardens
|
| 1982-1987
| 94.3%
| 437
| Studio | 288 SF | $1,320 | ||
| 1 BR / 1 BA | 576 SF | $1,449 | |||||||
| 2 BR / 1BA | 864 SF | $1,941 | |||||||
| 2 BR / 2 BA | 864 SF | $2,117 | |||||||
Lakeside Villas 4652 Cherry Road West Palm Beach, FL | 3.9 miles | 1985 | 99.0% | 104 | 2BR / 2BA | 1000 SF | $1,750 | ||
Alta Villa Gardens 1907-1919 Haverhill Road North West Palm Beach, FL | 4.4 miles | 1981 | 100.0% | 94 | 2 BR / 1BA | 1000 SF | $1,400 | ||
Seasons 704 4970 Haverhill Commons Circle West Palm Beach, FL | 4.0 miles
| 1987
| 93.0%
| 222
| 1 BR / 1 BA | 804 SF | $1,630 | ||
| 2 BR / 1BA | 1038 SF | $2,120 | |||||||
West Palm Lane 537 South Sequoia Drive West Palm Beach, FL | 5.0 miles
| 1974
| 96.0%
| 156
| 1 BR / 1 BA | 700 SF | $1,622 | ||
| 2 BR / 1BA | 877 SF | $1,780 | |||||||
Palo Verde 6164 Forest Hill Boulevard West Palm Beach, FL | 0.9 miles
| 1973
| 98.0%
| 266
| 1 BR / 1 BA | 750 SF | $1,368 | ||
| 2 BR / 1BA | 850 SF | $1,653 | |||||||
| (1) | Source: Appraisals. |
| (2) | Distance from Subject represents the distance from Greengate Apartments. |
| (3) | Based on the underwritten rent roll dated August 26, 2024. |
The Borrowers. The borrowers are West Palm Gardens FL LLC and SDS WPB TIC LP, as tenants-in-common, each a Delaware limited liability entity and single purpose entity having at least one independent director in its organizational structure. Legal counsel to the borrowers delivered a non-consolidation opinion in connection with the origination of the West Palm Gardens Mortgage Loan.
The Borrower Sponsors. The borrower sponsors and non-recourse carveout guarantors are Zvi Horowitz and Samuel Pollak of Northpoint Asset Management. Founded in 2010, Northpoint Asset Management is a real estate private equity firm engaged in the preservation, acquisition, re-development, and management of real estate properties located in New York, New Jersey, Connecticut, Florida and Georgia.
Property Management. The West Palm Gardens Properties are managed by North Point Management Corp., a borrower affiliated management company.
Escrows and Reserves. At origination of the West Palm Gardens Mortgage Loan, the borrowers deposited approximately (i) $564,639 into a reserve account for real estate taxes and (ii) $62,750 into a reserve account for immediate repairs.
Tax Escrows – On a monthly basis, the borrowers are required to deposit into a real estate tax reserve 1/12th of the property taxes that the lender reasonably estimates will be payable over the next-ensuing 12-month period (initially estimated to be approximately $51,331).
Insurance Escrows – On a monthly basis, the borrowers are required to deposit into an insurance reserve 1/12th of the amount which will be sufficient to pay the insurance premiums due for the renewal of coverage afforded by the insurance policies (initially estimated to be approximately $65,559).
Replacement Reserves – On a monthly basis, the borrowers are required to deposit $10,096 into a replacement reserve.
Lockbox / Cash Management. The West Palm Gardens Mortgage Loan is structured with a springing lockbox and springing cash management. On the first occurrence of a Trigger Period (as defined below), the borrowers are required to
| THE INFORMATION IN THIS COLLATERAL TERM SHEET IS NOT COMPLETE AND MAY BE AMENDED PRIOR TO THE TIME OF SALE. THIS TERM SHEET IS NOT AN OFFER TO SELL THESE SECURITIES AND IT IS NOT A SOLICITATION OF AN OFFER TO BUY THESE SECURITIES IN ANY JURISDICTION WHERE THE OFFER OR SALE IS NOT PERMITTED. | ||
| 86 | ||
| Structural and Collateral Term Sheet | BMO 2024-5C7 | |
| No. 8 – West Palm Gardens | ||
establish a lender-controlled lockbox account, and are thereafter required to deposit, or cause the property manager to immediately deposit, all revenue received by the borrowers or the property manager into such lockbox. Within five days after the first occurrence of a Trigger Period, the borrowers are required to deliver a notice to all tenants under non-residential leases at the West Palm Gardens Properties and all credit card companies that the borrowers or property manager have entered into a merchant agreement with directing them to remit rent and all other sums or payments due under the applicable lease or merchant agreement directly to the lender-controlled lockbox account. In addition, upon the first occurrence of a Trigger Period, the lender is required to establish a lender-controlled cash management account. All funds deposited into the lockbox are required to be transferred to, or at the direction of, the borrowers, unless a Trigger Period exists and the lender elects (in its sole and absolute discretion) to deliver a restricted account notice to the institution maintaining the lockbox account, in which case all funds in the lockbox account are required to be swept on each business day to the lender-controlled cash management account to be applied and disbursed in accordance with the West Palm Gardens Mortgage Loan documents, and all excess cash flow funds remaining in the cash management account after the application of such funds in accordance with the West Palm Gardens Mortgage Loan documents are required to be held by the lender in an excess cash flow reserve account as additional collateral for the West Palm Gardens Mortgage Loan. Upon the cure of the applicable Trigger Period, so long as no other Trigger Period exists, the lender is required to return any amounts remaining on deposit in the excess cash flow reserve account to the borrowers. Upon an event of default under the West Palm Gardens Mortgage Loan documents, the lender may apply funds in the accounts to the debt in such priority as it may determine.
“Trigger Period” means a period (A) commencing upon the earliest of (i) the occurrence and continuance of an event of default under the West Palm Gardens Mortgage Loan documents and (ii) the debt service coverage ratio being less than 1.15x (unless the Collateral Cure Conditions (as defined below) are satisfied) and (B) expiring upon (x) with regard to clause (i) above, the cure (if applicable) of such event of default under the West Palm Gardens Mortgage Loan documents and (y) with regard to clause (ii) above, the date that the debt service coverage ratio is equal to or greater than 1.15x for one calendar quarter.
“Collateral Cure Conditions” will be deemed to exist if and for so long as the borrowers deposit cash into an account with lender or deliver to lender a letter of credit which, in either case, serves as additional collateral for the West Palm Gardens Mortgage Loan, in an amount equal to $490,469 and, thereafter, for so long as the borrowers elect to satisfy the Collateral Cure Conditions in order to avoid a Trigger Period (as set forth in clause (A)(ii) of the definition of Trigger Period above) on each one year anniversary of the date that the borrowers made said deposit (or delivered said letter of credit), the borrowers are required to deposit additional cash collateral in the amount of $490,469 or to increase the amount of the letter of credit by an amount equal to $490,469 (as applicable). The borrowers’ cash deposit of $490,469 was sized to represent the dollar difference between a 1.15x and 1.00x debt service coverage ratio.
Subordinate and Mezzanine Debt. None.
Permitted Future Subordinate or Mezzanine Debt. Not permitted.
Partial Release. Not permitted.
Ground Lease. None.
| THE INFORMATION IN THIS COLLATERAL TERM SHEET IS NOT COMPLETE AND MAY BE AMENDED PRIOR TO THE TIME OF SALE. THIS TERM SHEET IS NOT AN OFFER TO SELL THESE SECURITIES AND IT IS NOT A SOLICITATION OF AN OFFER TO BUY THESE SECURITIES IN ANY JURISDICTION WHERE THE OFFER OR SALE IS NOT PERMITTED. | ||
| 87 | ||
| Structural and Collateral Term Sheet | BMO 2024-5C7 | |
| No. 9 – 95-22 147th Place | ||
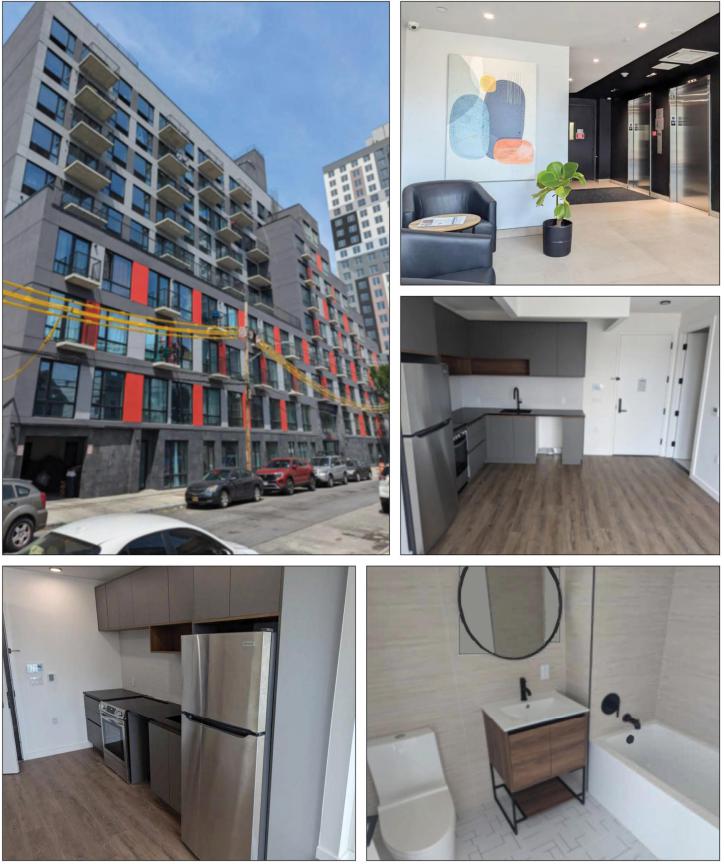
| THE INFORMATION IN THIS COLLATERAL TERM SHEET IS NOT COMPLETE AND MAY BE AMENDED PRIOR TO THE TIME OF SALE. THIS TERM SHEET IS NOT AN OFFER TO SELL THESE SECURITIES AND IT IS NOT A SOLICITATION OF AN OFFER TO BUY THESE SECURITIES IN ANY JURISDICTION WHERE THE OFFER OR SALE IS NOT PERMITTED. | ||
| 88 | ||
| Structural and Collateral Term Sheet | BMO 2024-5C7 | |
| No. 9 – 95-22 147th Place | ||
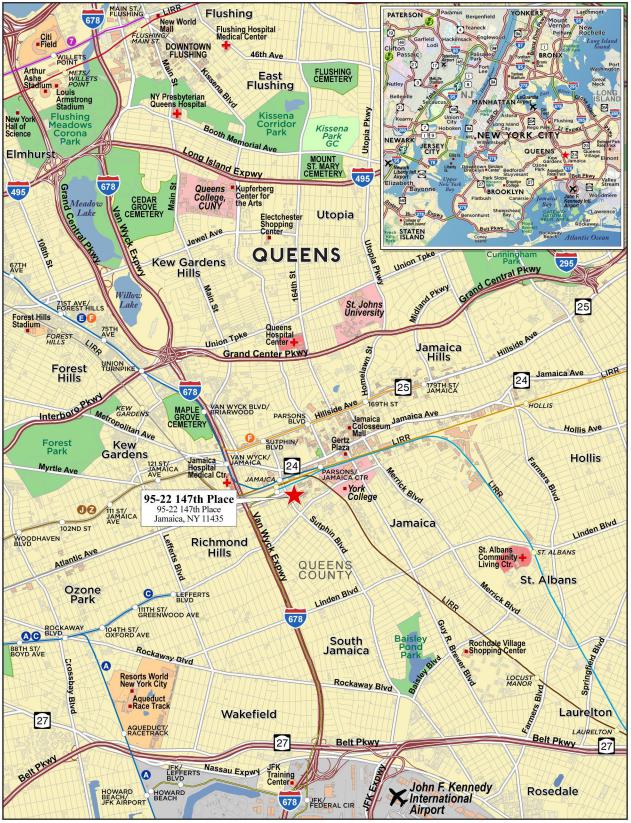
| THE INFORMATION IN THIS COLLATERAL TERM SHEET IS NOT COMPLETE AND MAY BE AMENDED PRIOR TO THE TIME OF SALE. THIS TERM SHEET IS NOT AN OFFER TO SELL THESE SECURITIES AND IT IS NOT A SOLICITATION OF AN OFFER TO BUY THESE SECURITIES IN ANY JURISDICTION WHERE THE OFFER OR SALE IS NOT PERMITTED. | ||
| 89 | ||
| Structural and Collateral Term Sheet | BMO 2024-5C7 | |
| No. 9 – 95-22 147th Place | ||
| Mortgage Loan Information | Property Information | |||
| Mortgage Loan Seller: | CREFI | Single Asset / Portfolio: | Single Asset | |
| Original Principal Balance: | $46,000,000 | Title: | Fee | |
| Cut-off Date Principal Balance: | $46,000,000 | Property Type – Subtype: | Multifamily – High Rise | |
| % of IPB: | 4.8% | Net Rentable Area (Units)(3): | 118 | |
| Loan Purpose: | Refinance | Location: | Jamaica, NY | |
| Borrower: | 147 St Holdings LLC | Year Built / Renovated(2): | 2024 / NAP | |
| Borrower Sponsor: | Moshe Braver | Occupancy(3): | 96.6% | |
| Interest Rate: | 6.34000% | Occupancy Date: | 9/16/2024 | |
| Note Date: | 9/19/2024 | 4th Most Recent NOI (As of)(4): | NAV | |
| Maturity Date: | 10/6/2029 | 3rd Most Recent NOI (As of)(4): | NAV | |
| Interest-only Period: | 60 months | 2nd Most Recent NOI (As of)(4): | NAV | |
| Original Term: | 60 months | Most Recent NOI (As of)(4): | NAV | |
| Original Amortization Term: | None | UW Economic Occupancy: | 97.0% | |
| Amortization Type: | Interest Only | UW Revenues: | $5,041,939 | |
| Call Protection: | L(24),D(30),O(6) | UW Expenses: | $1,103,731 | |
| Lockbox / Cash Management: | Springing / Springing | UW NOI: | $3,938,208 | |
| Additional Debt: | No | UW NCF: | $3,906,703 | |
| Additional Debt Balance: | NAP | Appraised Value / Per Unit: | $74,100,000 / $627,966 | |
| Additional Debt Type: | NAP | Appraisal Date: | 6/26/2024 | |
| Escrows and Reserves(1) | Financial Information | |||||
| Initial | Monthly | Initial Cap | Cut-off Date Loan / Unit(3): | $389,831 | ||
| Taxes: | $23,377 | $4,675 | N/A | Maturity Date Loan / Unit(3): | $389,831 | |
| Insurance: | $16,705 | $8,352 | N/A | Cut-off Date LTV: | 62.1% | |
| Replacement Reserves: | $0 | $2,484 | N/A | Maturity Date LTV: | 62.1% | |
| TI / LC: | $0 | $0 | N/A | UW NCF DSCR: | 1.32x | |
| Deferred Maintenance: | $5,923 | $0 | N/A | UW NCF DSCR: | 8.6% | |
| Sources and Uses | |||||||
| Sources | Proceeds | % of Total | Uses | Proceeds | % of Total | ||
| Mortgage Loan | $46,000,000 | 100.0% | Purchase Price | $35,931,858 | 78.1 | % | |
| Sponsor Equity | 8,851,768 | 19.2 | |||||
| Closing Costs | 1,170,370 | 2.5 | |||||
| Upfront Reserves | 46,005 | 0.1 | |||||
| Total Sources | $46,000,000 | 100.0% | Total Uses | $46,000,000 | 100.0 | % | |
| (1) | See “Escrows and Reserves” below for further discussion of reserve information. |
| (2) | The 95-22 147th Place Property (as defined below) is comprised of two buildings. The main building is an 11-story high rise building that was completed in 2024 and contains 117 units that have been designated as affordable housing units. The second building was constructed in 1925 and contains one retail unit and one market rate multifamily unit. |
| (3) | Net Rentable Area, Occupancy, Cut-off Date Loan / Unit and Maturity Date Loan / Unit are based on the multifamily component of the 95-22 147th Place Property and exclude the one retail unit which is currently occupied by a local deli/grocery store. |
| (4) | Historical NOI information is not available because substantially all of the 95-22 147th Place Property was recently constructed in 2024. |
The Loan. The ninth largest mortgage loan (the “95-22 147th Place Mortgage Loan”) is secured by the borrower’s fee interest in two buildings, including a Class A, 11-story 117-unit high rise multifamily building and a two-story mixed use building with one retail unit and one multifamily unit, each located in the Jamaica neighborhood of the Queens borough in New York City (the “95-22 147th Place Property”). The 95-22 147th Place Mortgage Loan is evidenced by one promissory note with an outstanding principal balance as of the Cut-off Date of $46,000,000. The 95-22 147th Place Mortgage Loan was originated on September 19, 2024 by Citi Real Estate Funding Inc. (“CREFI”) and accrues interest at a fixed rate of 6.34000% per annum. The 95-22 147th Place Mortgage Loan has an initial term of five years, is interest-only for the full term and accrues interest on an Actual/360 basis. The scheduled maturity date of the 95-22 147th Place Mortgage Loan is October 6, 2029.
| THE INFORMATION IN THIS COLLATERAL TERM SHEET IS NOT COMPLETE AND MAY BE AMENDED PRIOR TO THE TIME OF SALE. THIS TERM SHEET IS NOT AN OFFER TO SELL THESE SECURITIES AND IT IS NOT A SOLICITATION OF AN OFFER TO BUY THESE SECURITIES IN ANY JURISDICTION WHERE THE OFFER OR SALE IS NOT PERMITTED. | ||
| 90 | ||
| Structural and Collateral Term Sheet | BMO 2024-5C7 | |
| No. 9 – 95-22 147th Place | ||
The Property. The 95-22 147th Place Property is comprised of (i) a recently constructed, 117-unit, 11-story high-rise multifamily property completed in 2024 and being rented as affordable housing, as described below (the “Main Building”), and (ii) a mixed use building containing one retail unit and one market rate three-bedroom multifamily unit (the “Additional Building”), located adjacent to each other in the Jamaica neighborhood of the Queens borough in New York City. The retail unit at the Additional Building is leased to a deli and grocery store on a five-year term through March 2029. Amenities at the 95-22 147th Place Property include a recreational / fitness center, bike storage, laundry room, terrace and rooftop. The 95-22 147th Place Property also contains onsite parking with 54 garage parking spaces, all of which are currently leased to Prime Structure, Inc. on a two year lease expiring in July 2026. The 95-22 147th Place Property is located adjacent to the Jamaica Station which services the LIRR, E, J and Z subway lines and the AirTrain to John F. Kennedy airport.
The unit mix at the 95-22 147th Place Property consists of 19 studio units, 39 one-bedroom units, 59 two-bedroom units, that are located in the Main Building and one three-bedroom unit located in the Additional Building. Unit amenities at the Main Building of the 95-22 147th Place Property include full appliance packages including a dishwasher, electric stove/oven with a bottom-freezer refrigerator, hardwood floors, and balconies for select units. As of September 16, 2024, the multifamily units at the 95-22 147th Place Property were 96.6% occupied.
The Main Building at the 95-22 147th Place Property benefits from a 35-year 421-a Affordable New York Housing Tax Exemption Program exemption. In order to qualify for the tax exemption, at least 30% of the units at the 95-22 147th Place Property Main Building must be leased as “affordable units,” which are defined as affordable to a household whose income does not exceed 130% of the area median income. The borrower has elected to lease all 117 of the units at the Main Building as affordable units. For the first 25 years of such exemption, 100% of the projected assessed value of the 95-22 147th Place Property Main Building improvements on the tax lot will be exempt from real estate taxes and for the remaining 10 years of the exemption the percentage of the exemption would be equal to the percentage of affordable units (accordingly, such exemption will remain at 100% so long as the borrower continues to lease all of the 117 units at the Main Building at rents that are affordable to households whose income does not exceed 130% of area median income). Taxes were underwritten to the appraisal’s year-one estimated 2024/2025 taxes of $53,433 (based on abated taxes for the Main Building and unabated taxes for the Additional Building) versus the appraisal’s estimated full tax liability for both buildings for 2024/2025 of $968,527. See “Description of the Mortgage Pool—Real Estate and Other Tax Considerations” in the Preliminary Prospectus.
In addition to the affordable housing requirements under the 421-a exemption, the borrower utilized inclusionary housing bonus floor area ratio, which requires 19 of the 117 units at the Main Building to be leased at rents that are affordable to households whose income does not exceed 80% of area median income. In addition, all units at the Main Building are rent stabilized. The borrower is utilizing the Family Homelessness and Eviction Protection Supplement program (“CityFHEPs”), a rental assistance program administered by the New York City Department of Social Services to help tenants find and keep housing. Of the 118 residential units at the 95-22 147th Place Property, all 117 units at the Main Building are affordable-rate units being leased through the CityFHEPs program. The one market rate unit at the 95-22 147th Place Property is a three-bedroom unit located above the retail unit in the Additional Building, and is not currently leased.
The following table presents certain information relating to the multifamily unit mix at the 95-22 147th Place Property:
| 95-22 147th Place Unit Mix(1) | ||||||||
| Unit Type | # of Units | % of Total | Occupied Units | Occupancy | Average Unit Size (SF) | Average Monthly Rental Rate Per Unit | Average Monthly Market Rent Per Unit(2) | |
| Studio | 19 | 16.1 | % | 17 | 89.5% | 345 | $2,941 | $2,200 |
| 1 BR | 39 | 33.1 | % | 39 | 100.0% | 498 | $2,842 | $2,650 |
| 2 BR | 59 | 50.0 | % | 58 | 98.3% | 616 | $3,526 | $3,400 |
| 3 BR | 1 | 0.8 | % | 0 | 0.0% | 1054 | NAV | $2,700 |
| Total/Wtd. Avg. | 118 | 100.0 | % | 114 | 96.6% | 537 | $3,205 | $2,953 |
| (1) | Based on the underwritten rent roll dated September 16, 2024. |
| (2) | Source: Appraisal. |
| THE INFORMATION IN THIS COLLATERAL TERM SHEET IS NOT COMPLETE AND MAY BE AMENDED PRIOR TO THE TIME OF SALE. THIS TERM SHEET IS NOT AN OFFER TO SELL THESE SECURITIES AND IT IS NOT A SOLICITATION OF AN OFFER TO BUY THESE SECURITIES IN ANY JURISDICTION WHERE THE OFFER OR SALE IS NOT PERMITTED. | ||
| 91 | ||
| Structural and Collateral Term Sheet | BMO 2024-5C7 | |
| No. 9 – 95-22 147th Place | ||
Appraisal. According to the appraisal, the 95-22 147th Place Property had an “as-is” appraised value of $74,100,000 as of June 26, 2024. The table below shows the appraisal’s “as-is” conclusions.
| 95-22 147th Place(1) | ||
| Property | Value | Capitalization Rate |
| 95-22 147th Place | $74,100,000 | 5.50% |
| (1) | Source: Appraisal |
Environmental. According to the Phase I environmental site assessment dated July 10, 2024, there was no evidence of any recognized environmental conditions at the 95-22 147th Place Property.
The following table presents certain information relating to the current multifamily occupancy of the 95-22 147th Place Property:
| Current Occupancy(1) | |
| Current(2) | |
| 95-22 147th Place | 96.6% |
| (1) | Historical occupancy information is not available as the Main Building was delivered in 2024. |
| (2) | Current occupancy represents multifamily occupancy as of September 16, 2024. |
| THE INFORMATION IN THIS COLLATERAL TERM SHEET IS NOT COMPLETE AND MAY BE AMENDED PRIOR TO THE TIME OF SALE. THIS TERM SHEET IS NOT AN OFFER TO SELL THESE SECURITIES AND IT IS NOT A SOLICITATION OF AN OFFER TO BUY THESE SECURITIES IN ANY JURISDICTION WHERE THE OFFER OR SALE IS NOT PERMITTED. | ||
| 92 | ||
| Structural and Collateral Term Sheet | BMO 2024-5C7 | |
| No. 9 – 95-22 147th Place | ||
The following table presents certain information relating to the Underwritten Net Cash Flow of the 95-22 147th Place Property:
| Underwritten Net Cash Flow | ||||
| Underwritten | Per Unit(1) | %(2) | ||
| In-Place Base Rent | $4,384,440 | $37,156 | 88.6 | % |
| Potential Income from Vacant Units | 148,896 | $1,262 | 3.0 | |
| Other Income(3) | 414,696 | $3,514 | 8.4 | |
| Gross Potential Income - Residential | $4,948,032 | $41,932 | 100.0 | % |
| (Vacancy/Concessions/Credit Loss) | (147,298) | ($1,248) | (3.0 | ) |
| Effective Gross Income - Residential | $4,800,734 | $40,684 | 97.0 | % |
| Commercial Rental Income | 59,500 | $29 | 23.4 | |
| Parking Income(4) | 194,400 | $94 | 76.6 | |
| Gross Potential Income - Commercial | $253,900 | $123 | 100.0 | % |
| (Vacancy/Concessions/Credit Loss) | (12,695) | ($6) | (5.0 | ) |
| Effective Gross Income - Commercial | $241,205 | $117 | 95.0 | % |
| Total Effective Gross Income | $5,041,939 | $42,728 | 100.0 | % |
| Management Fee | 151,258 | $1,282 | 3.0 | |
| Real Estate Taxes(5) | 53,433 | $453 | 1.1 | |
| Insurance | 95,456 | $809 | 1.9 | |
| Other Expenses(6) | 803,584 | $6,810 | 15.9 | |
| Total Expenses | $1,103,731 | $9,354 | 21.9 | % |
| Net Operating Income | $3,938,208 | $33,375 | 78.1 | % |
| Replacement Reserves - Residential | 29,500 | $250 | 0.6 | |
| Replacement Reserves - Commercial | 310 | $0 | 0.0 | |
| TI/LC - Commercial | 1,696 | $1 | 0.0 | |
| Net Cash Flow | $3,906,703 | $33,108 | 77.5 | % |
| (1) | The per unit column is based on total multifamily units (118 units) for all line items except for commercial items which are based on total commercial SF at the property (2,066 SF) |
| (2) | The % column represents percentage of Gross Potential Income for all corresponding revenue lines (i.e. apartments vs commercial) and represents percentage of Total Effective Gross Income for the remainder of the fields. |
| (3) | Other Income includes fixed monthly utility payments paid by CityFHEPs, miscellaneous income, and laundry income. |
| (4) | Parking Income is derived from a lease to a third-party parking operator. Prime Structure, Inc. leased all 54 parking spaces at the 95-22 147th Place Property on a two-year lease expiring in July 2026. |
| (5) | For the Main Building, real estate taxes were underwritten based on the 421-a exemption and for the Additional Building, real estate taxes were underwritten based on the transitional assessed value and the 2023-2024 tax rate. The appraisal estimated unabated taxes for both buildings to be $968,527. |
| (6) | Other Expenses consist of payroll and benefits, repairs and maintenance, utilities, and general and administrative expenses. |
| THE INFORMATION IN THIS COLLATERAL TERM SHEET IS NOT COMPLETE AND MAY BE AMENDED PRIOR TO THE TIME OF SALE. THIS TERM SHEET IS NOT AN OFFER TO SELL THESE SECURITIES AND IT IS NOT A SOLICITATION OF AN OFFER TO BUY THESE SECURITIES IN ANY JURISDICTION WHERE THE OFFER OR SALE IS NOT PERMITTED. | ||
| 93 | ||
| Structural and Collateral Term Sheet | BMO 2024-5C7 | |
| No. 9 – 95-22 147th Place | ||
The Market. The Main Building at the 95-22 147th Place Property is located at 95-22 147th Place, and the Additional Building is located at 95-09 Sutphin Boulevard, each in the Queens County multifamily submarket of New York, New York. Primary access to the neighborhood is provided by Van Wyck Expressway with public transportation provided by the E, J, Z, and F subway lines, the LIRR, and the JFK AirTrain. The 95-22 147th Place Property is located within the New York metropolitan multifamily market which according to the appraisal, as of March 31, 2024, had total inventory of 1,936,157 units, a vacancy rate of 3.2%, and effective rent of $4,429 per unit.
According to the appraisal, the 95-22 147th Place Property is located in the Queens County multifamily submarket of the New York metropolitan multifamily market. As of March 31, 2024, the Queens County multifamily submarket had total inventory of 280,927 units, a vacancy rate of 1.9%, effective rent of $3,635 per unit and positive net absorption of 1,019 units.
According to the appraisal, the 2023 population in the Jamaica neighborhood of Queens was 57,685. The 2023 average household income within the neighborhood was $107,851.
The following table presents certain information relating to comparable multifamily properties to the 95-22 147th Place Property:
| Multifamily Rent Comparables(1) | ||||||
| Property Name / Address | Distance from Subject | Year Built / Renovated | Number of Units | Unit Type | Average Unit Size | Average Rent Per Unit |
95-22 147th Place Jamaica, NY 11435(2)
| -
| 2024 / NAP
| 118
| Studio | 345 SF | $2,941 |
| 1 BR | 498 SF | $2,842 | ||||
| 2 BR | 616 SF | $3,526 | ||||
| 3 BR | 1054 SF | NAP | ||||
152-11 89th Avenue Jamaica, NY 11432
| 0.6 mi
| 2019 / NAP
| 482
| 0 BR / 1 BA | 426 SF | $2,200 |
| 1 BR / 1 BA | 700 SF | $2,550 | ||||
| 2 BR / 2 BA | 846 SF | $3,450 | ||||
153-30 89th Avenue Jamaica, NY 11432 | 0.7 mi
| 2010 / NAP
| 346
| 1 BR / 1 BA | 703 SF | $2,500 |
| 2 BR / 2 BA | 933 SF | $3,120 | ||||
88-36 139th Street Jamaica, NY 11435 | 1.0 mi
| 2024 / NAP
| 81
| 0 BR / 1 BA | 403 SF | $2,146 |
| 1 BR / 1 BA | 706 SF | $2,792 | ||||
142-07 Pershing Crescent Jamaica, NY 11435 | 1.8 mi | 1940 / NAP | 2 | 3 BR / 2 BA | 1500 SF | $3,000 |
| 178-02 Hillside Avenue | 2.0 mi | 2019 / NAP | 131 | 1 BR / 1 BA | 669 SF | $2,435 |
| Jamaica, NY 11432 | 1 BR / 1 BA | 911 SF | $3,423 | |||
| (1) | Source: Appraisal. |
| (2) | Based on the underwritten rent roll dated September 16, 2024. |
The Borrower. The borrower is 147 St Holdings LLC, a New York limited liability company and single purpose entity having at least one independent director in its organizational structure. Legal counsel to the borrower delivered a non-consolidation opinion in connection with the origination of the 95-22 147th Place Mortgage Loan.
The Borrower Sponsor. The borrower sponsor and non-recourse carveout guarantor is Moshe Braver. Moshe Braver is a New York City based real estate developer with a portfolio of multifamily, retail and office properties. As of June 30, 2024 Moshe Braver had a portfolio of 19 properties including a property leased pursuant to the CityFHEPs program.
Property Management. The 95-22 147th Place Property is managed by Velocity Management LLC, a borrower affiliated management company.
Escrows and Reserves. At origination of the 95-22 147th Place Mortgage Loan, the borrower deposited approximately (i) $23,377 into a reserve account for real estate taxes, (ii) $16,705 into a reserve account for insurance premiums, and (iii)
| THE INFORMATION IN THIS COLLATERAL TERM SHEET IS NOT COMPLETE AND MAY BE AMENDED PRIOR TO THE TIME OF SALE. THIS TERM SHEET IS NOT AN OFFER TO SELL THESE SECURITIES AND IT IS NOT A SOLICITATION OF AN OFFER TO BUY THESE SECURITIES IN ANY JURISDICTION WHERE THE OFFER OR SALE IS NOT PERMITTED. | ||
| 94 | ||
| Structural and Collateral Term Sheet | BMO 2024-5C7 | |
| No. 9 – 95-22 147th Place | ||
$5,923 into a reserve account for immediate repairs.
Tax Escrows – On a monthly basis, the borrower is required to deposit into a real estate tax reserve 1/12th of the property taxes that the lender estimates will be payable over the next-ensuing 12-month period (initially estimated to be approximately $4,675). Deposits into the real estate tax reserve are required to be calculated based on abated taxes.
Insurance Escrows – If the liability or casualty policies maintained by the borrower do not constitute an approved blanket or umbrella policy, the borrower is required to deposit into an insurance reserve, on a monthly basis, 1/12th of the amount which would be sufficient to pay the insurance premiums due for the renewal of coverage afforded by such policies (initially estimated to be approximately $8,352).
Replacement Reserves – On a monthly basis, the borrower is required to deposit approximately $2,484 into a replacement reserve.
Lockbox / Cash Management. The 95-22 147th Place Mortgage Loan is structured with a springing lockbox and springing cash management. On the first occurrence of a Trigger Period (as defined below), the borrower is required to establish a lender-controlled lockbox account, and is thereafter required to deposit, or cause the property manager to immediately deposit, all revenue received by the borrower or the property manager into such lockbox. Within five days after the first occurrence of a Trigger Period, the borrower is required to deliver a notice to all tenants at the 95-22 147th Place Property directing them to remit rent and all other sums due under the applicable lease directly to the lender-controlled lockbox account. In addition, upon the first occurrence of a Trigger Period, the lender is required to establish a lender-controlled cash management account. All funds deposited into the lockbox are required to be transferred on each business day to, or at the direction of, the borrower, unless a Trigger Period exists and the lender elects (in its sole and absolute discretion) to deliver a restricted account notice to the institution maintaining the lockbox account, in which case all funds in the lockbox account are required to be swept on each business day to the lender-controlled cash management account to be applied and disbursed in accordance with the 95-22 147th Place Mortgage Loan documents, and all excess cash flow funds remaining in the cash management account after the application of such funds in accordance with the 95-22 147th Place Mortgage Loan documents are required to be held by the lender in an excess cash flow reserve account as additional collateral for the 95-22 147th Place Mortgage Loan. Upon the cure of the applicable Trigger Period, so long as no other Trigger Period exists, the lender is required to return any amounts remaining on deposit in the excess cash flow reserve account to the borrower. Upon an event of default under the 95-22 147th Place Mortgage Loan documents, the lender may apply funds in the accounts to the debt in such priority as it may determine.
“Trigger Period” means a period (A) commencing upon the earliest of (i) the occurrence and continuance of an event of default under the 95-22 147th Place Mortgage Loan documents and (ii) the debt service coverage ratio being less than 1.10x and (B) expiring upon (x) with regard to clause (i) above, the cure (if applicable) of such event of default under the 95-22 147th Place Mortgage Loan documents and (y) with regard to clause (ii) above, the date that the debt service coverage ratio is equal to or greater than 1.15x for one calendar quarter.
Subordinate and Mezzanine Debt. None.
Permitted Future Subordinate or Mezzanine Debt. Not permitted.
Partial Release. Not permitted.
Ground Lease. None.
| THE INFORMATION IN THIS COLLATERAL TERM SHEET IS NOT COMPLETE AND MAY BE AMENDED PRIOR TO THE TIME OF SALE. THIS TERM SHEET IS NOT AN OFFER TO SELL THESE SECURITIES AND IT IS NOT A SOLICITATION OF AN OFFER TO BUY THESE SECURITIES IN ANY JURISDICTION WHERE THE OFFER OR SALE IS NOT PERMITTED. | ||
| 95 | ||
| Structural and Collateral Term Sheet | BMO 2024-5C7 | |
| No. 10 – Hampton Inn JFK | ||

| THE INFORMATION IN THIS COLLATERAL TERM SHEET IS NOT COMPLETE AND MAY BE AMENDED PRIOR TO THE TIME OF SALE. THIS TERM SHEET IS NOT AN OFFER TO SELL THESE SECURITIES AND IT IS NOT A SOLICITATION OF AN OFFER TO BUY THESE SECURITIES IN ANY JURISDICTION WHERE THE OFFER OR SALE IS NOT PERMITTED. | ||
| 96 | ||
| Structural and Collateral Term Sheet | BMO 2024-5C7 | |
| No. 10 – Hampton Inn JFK | ||
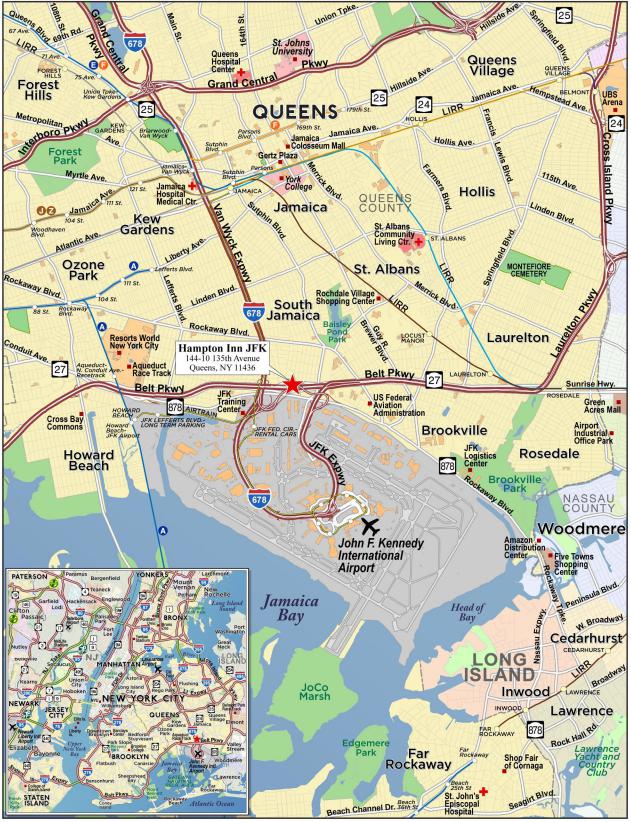
| THE INFORMATION IN THIS COLLATERAL TERM SHEET IS NOT COMPLETE AND MAY BE AMENDED PRIOR TO THE TIME OF SALE. THIS TERM SHEET IS NOT AN OFFER TO SELL THESE SECURITIES AND IT IS NOT A SOLICITATION OF AN OFFER TO BUY THESE SECURITIES IN ANY JURISDICTION WHERE THE OFFER OR SALE IS NOT PERMITTED. | ||
| 97 | ||
| Structural and Collateral Term Sheet | BMO 2024-5C7 | |
| No. 10 – Hampton Inn JFK | ||
| Mortgage Loan Information | Property Information | |||
| Mortgage Loan Seller: | UBS AG | Single Asset / Portfolio: | Single Asset | |
| Original Principal Balance: | $45,000,000 | Title: | Fee | |
| Cut-off Date Principal Balance: | $45,000,000 | Property Type – Subtype: | Hospitality – Select Service | |
| % of IPB: | 4.7% | Net Rentable Area (Rooms): | 216 | |
| Loan Purpose: | Refinance | Location: | Jamaica, NY | |
| Borrower: | ASAP 135th Ave Jamaica, LLC | Year Built / Renovated: | 2001 / 2019 | |
| Borrower Sponsors: | Frank Yuan, Jerome Edward Yuan, Norbert Yuan and Paul Yuan | Occupancy / ADR / RevPAR: | 90.4% / $222.19 / $200.83 | |
| Interest Rate: | 7.50000% | Occupancy / ADR / RevPAR Date: | TTM 8/31/2024 | |
| Note Date: | 10/4/2024 | 4th Most Recent NOI (As of): | $1,659,715 (12/31/2021) | |
| Maturity Date: | 10/6/2029 | 3rd Most Recent NOI (As of): | $3,745,618 (12/31/2022) | |
| Interest-only Period: | 60 months | 2nd Most Recent NOI (As of): | $5,078,321 (12/31/2023) | |
| Original Term: | 60 months | Most Recent NOI (As of): | $6,455,404 (TTM 8/31/2024) | |
| Original Amortization Term: | None | UW Occupancy / ADR / RevPAR: | 90.4% / $222.19 / $200.83 | |
| Amortization Type: | Interest Only | UW Revenues: | $16,883,383 | |
| Call Protection: | L(24),D(29),O(7) | UW Expenses: | $10,511,727 | |
| Lockbox / Cash Management: | Springing / Springing | UW NOI: | $6,371,656 | |
| Additional Debt: | No | UW NCF: | $5,696,320 | |
| Additional Debt Balance: | N/A | Appraised Value / Per Room: | $74,100,000 / $343,056 | |
| Additional Debt Type: | N/A | Appraisal Date: | 8/7/2024 | |
| Escrows and Reserves(1) | Financial Information | |||||
| Initial | Monthly | Cap | Cut-off Date Loan / Room: | $208,333 | ||
| Taxes: | $457,399 | $104,908 | N/A | Maturity Date Loan / Room: | $208,333 | |
| Insurance: | $0 | Springing | N/A | Cut-off Date LTV: | 60.7% | |
| FF&E Reserve: | $0 | $28,139 | N/A | Maturity Date LTV: | 60.7% | |
| Immediate Repairs: | $51,750 | $0 | N/A | UW NCF DSCR: | 1.66x | |
| Other Reserves(1): | $250,000 | Springing | $2,500,000 | UW NOI Debt Yield: | 14.2% | |
| Sources and Uses | |||||||
| Sources | Proceeds | % of Total | Uses | Proceeds | % of Total | ||
| Mortgage Loan | $45,000,000 | 100.0% | Loan Payoff | $43,694,103 | 97.1 | % | |
| Borrower Equity | 9,144 | 0.0% | Upfront Reserves | 759,149 | 1.7 | ||
| Closing Costs | 555,893 | 1.2 | |||||
| Total Sources | $45,009,144 | 100.0% | Total Uses | $45,009,144 | 100.0 | % | |
| (1) | For a full description of Escrows and Reserves, see “Escrows and Reserves” below. |
The Loan. The tenth largest mortgage loan (the “Hampton Inn JFK Mortgage Loan”) is secured by the borrower’s fee interest in a 216-room select service hotel located in Jamaica, New York (the “Hampton Inn JFK Property”). The Hampton Inn JFK Mortgage Loan is evidenced by one promissory note with an outstanding principal balance as of the Cut-off Date of $45,000,000. The Hampton Inn JFK Mortgage Loan was originated on October 4, 2024 by UBS AG. The Hampton Inn JFK Mortgage Loan accrues interest at a fixed rate of 7.50000% per annum. The Hampton Inn JFK Mortgage Loan has a five-year term, is interest-only for the entire term and accrues interest on an Actual/360 basis. The scheduled maturity date of the Hampton Inn JFK Mortgage Loan is October 6, 2029.
The Property. The Hampton Inn JFK Property is a 13-story, 216-room select service hotel located in Jamaica, New York. Built in 2001 and renovated in 2019, the Hampton Inn JFK Property is situated on an approximately 1.14-acre parcel with 42 parking spaces (0.19 spaces per room). The Hampton Inn JFK Property features 216 rooms consisting of 87 king rooms and 129 double/double rooms.
Hampton Inn JFK Property amenities include the 135 Lounge, complimentary hot breakfast, a fitness center featuring Peloton bikes, a business center, a guest laundry room, a sundries shop, free Wi-Fi, 1,050 square feet of meeting space, and a complimentary airport shuttle. The 135 Lounge is a restaurant and bar located in the lobby that offers a full bar and
| THE INFORMATION IN THIS COLLATERAL TERM SHEET IS NOT COMPLETE AND MAY BE AMENDED PRIOR TO THE TIME OF SALE. THIS TERM SHEET IS NOT AN OFFER TO SELL THESE SECURITIES AND IT IS NOT A SOLICITATION OF AN OFFER TO BUY THESE SECURITIES IN ANY JURISDICTION WHERE THE OFFER OR SALE IS NOT PERMITTED. | ||
| 98 | ||
| Structural and Collateral Term Sheet | BMO 2024-5C7 | |
| No. 10 – Hampton Inn JFK | ||
American bar food options. Room amenities include 55-inch flat-screen televisions with both cable and premium networks, a mini fridge, a large desk, and an ergonomic chair. According to the appraisal, the demand estimated segmentation is 56% leisure, 36% commercial, 5% extended stay and 3% meeting and group.
The Hampton Inn JFK Property is subject to a 15-year franchise agreement with Hilton Franchise Holding LLC, a wholly-owned subsidiary of Hilton Worldwide Holdings, Inc. (NYSE: HLT), which commenced in July 2018 and expires in July 2033 with no renewal options. The franchise agreement calls for a royalty fee of 6.0% of gross rooms revenue, and a program fee of 4.0% of gross rooms revenue.
Since acquiring the Hampton Inn JFK Property for approximately $59.8 million in July 2018, the borrower sponsors have invested approximately $2.3 million ($10,783 per room) on capital improvements and completed approximately $1.3 million in property improvement plan work in November 2023. Upgrades to the Hampton Inn JFK Property were made on the lobby, construction of the new kitchen, the bar and dining areas, the front desk relocation, the breakfast area, the fitness center and the meeting rooms.
The following table presents certain information relating to the operating history and underwritten cash flows of the Hampton Inn JFK Property:
| Operating History and Underwritten Net Cash Flow | ||||||||
| 2021 | 2022 | 2023 | TTM(1) | Underwritten | Per Room(2) | % of Total Revenue(3) | ||
| Occupancy | 74.1% | 85.4% | 86.8% | 90.4% | 90.4% | |||
| ADR | $133.19 | $174.49 | $204.85 | $222.19 | $222.19 | |||
| RevPAR | $98.64 | $149.04 | $177.73 | $200.83 | $200.83 | |||
| Room Revenue | $7,776,582 | $11,750,398 | $14,012,266 | $15,876,663 | $15,876,663 | $73,503 | 94.0 | % |
| Food & Beverage Revenue | 0 | 179,501 | 376,424 | 559,078 | 559,078 | 2,588 | 3.3 | |
| Other Departmental Revenue(4) | 308,571 | 348,617 | 382,267 | 447,642 | 447,642 | 2,072 | 2.7 | |
| Total Revenue | $8,085,153 | $12,278,516 | $14,770,957 | $16,883,383 | $16,883,383 | $78,164 | 100.0 | % |
| Room Expenses | $2,215,926 | $3,165,121 | $3,530,773 | $3,891,890 | $3,891,890 | $18,018 | 24.5 | % |
| Food & Beverage Expenses | 0 | 182,966 | 281,587 | 375,800 | 375,800 | 1,740 | 67.2 | |
| Other Departmental Expenses | 43,382 | 41,986 | 59,031 | 71,293 | 71,293 | 330 | 15.9 | |
| Departmental Expenses | $2,259,308 | $3,390,073 | $3,871,391 | $4,338,983 | $4,338,983 | $20,088 | 25.7 | % |
| Departmental Profit | $5,825,845 | $8,888,443 | $10,899,566 | $12,544,400 | $12,544,400 | $58,076 | 74.3 | % |
| Operating Expenses | $2,591,501 | $3,546,422 | $4,097,026 | $4,280,431 | $4,247,051 | $19,662 | 25.2 | % |
| Gross Operating Profit | $3,234,344 | $5,342,021 | $6,802,540 | $8,263,969 | $8,297,349 | $38,414 | 49.1 | % |
| Total Other Expenses | $1,574,629 | $1,596,403 | $1,724,219 | $1,808,565 | $1,925,693 | $8,915 | 11.4 | % |
| Net Operating Income | $1,659,715 | $3,745,618 | $5,078,321 | $6,455,404 | $6,371,656 | $29,498 | 37.7 | % |
| FF&E | 0 | 0 | 0 | 0 | 675,335 | 3,127 | 4.0 | |
| Net Cash Flow | $1,659,715 | $3,745,618 | $5,078,321 | $6,455,404 | $5,696,320 | $26,372 | 33.7 | % |
| (1) | TTM column represents the trailing 12-month period ending August 31, 2024. |
| (2) | Per Room values are based on 216 rooms. |
| (3) | % of Total Revenue column represents percent of Total Revenue except for Room Expenses, Food and Beverage Expenses and Other Departmental Expenses, which are based on their corresponding revenue line items. |
| (4) | Other Departmental Revenue primarily includes guest communications, laundry, parking fees, corner pantry and cancellation fees. |
Environmental. According to the Phase I environmental site assessment dated August 13, 2024, there was no evidence of any recognized environmental conditions at the Hampton Inn JFK Property.
The Market. According to the appraisal, the Hampton Inn JFK Property is located in the Jamaica neighborhood of Queens, New York. The Hampton Inn JFK Property is located less than one mile north of the John F. Kennedy International Airport, approximately 14.8 miles east of Midtown Manhattan, approximately 9.9 miles south of LaGuardia Airport and approximately
| THE INFORMATION IN THIS COLLATERAL TERM SHEET IS NOT COMPLETE AND MAY BE AMENDED PRIOR TO THE TIME OF SALE. THIS TERM SHEET IS NOT AN OFFER TO SELL THESE SECURITIES AND IT IS NOT A SOLICITATION OF AN OFFER TO BUY THESE SECURITIES IN ANY JURISDICTION WHERE THE OFFER OR SALE IS NOT PERMITTED. | ||
| 99 | ||
| Structural and Collateral Term Sheet | BMO 2024-5C7 | |
| No. 10 – Hampton Inn JFK | ||
6.8 miles south of Billie Jean King National Tennis Center. Access to the Hampton Inn JFK Property is primarily provided by major thoroughfares including the Van Wyck Expressway (I-678), JFK Expressway, and Belt Parkway. According to the appraisal, in addition to John F. Kennedy International Airport, demand generators nearby include Jamaica Hospital Medical Center, Charles Memorial Park, Baisley Pond Park, Resorts World New York City and Aqueduct Race Track.
John F. Kennedy International Airport ranks as the sixth busiest airport in the United States serving over 62.4 million passengers in 2023, a 13.2% increase from the prior year and just 0.2% lower than the number of passengers in pre-pandemic 2019, according to The Port Authority of New York & New Jersey. John F. Kennedy International Airport is undergoing an approximately $19 billion capital improvement plan to transform the current complex into a modern 21st-century hub. Construction of the new Terminal 1, a 2.4 million square foot, state-of-the-art facility with 23 gates, began in September 2022 and is set to open in 2026. The terminal will feature expansive, naturally lit public spaces, innovative technology, and over 300,000 square feet of dining, retail, and recreational space. The project also includes an approximately $1.5 billion expansion of Terminal 4 by Delta, construction of a new approximately $4.2 billion Terminal 6, and enhancements to Terminal 8 by American Airlines, which will offer over 60 dining and shopping options.
According to a third-party market research report, the estimated 2024 population within a one-, three- and five-mile radius of the Hampton Inn JFK Property is 40,717, 429,152 and 1,132,683, respectively. The estimated 2024 average household income within the same radii is $113,949, $107,567 and $110,661, respectively. According to a third-party market research report, owner-occupied households outpace renters within a 1-mile radius of the Hampton Inn JFK Property while there are more renters within a 3- and 5-mile radius of the Hampton Inn JFK Property.
The following table presents certain information relating to the current and historical occupancy, ADR and RevPAR at the Hampton Inn JFK Property and its competitive set:
| Historical Occupancy, ADR, RevPAR(1)(2) | |||||||||
| Competitive Set(3) | Hampton Inn JFK Property | Penetration Factor | |||||||
| Year | Occupancy | ADR | RevPAR | Occupancy | ADR | RevPAR | Occupancy | ADR | RevPAR |
| TTM 8/31/2022 | 77.1% | $171.68 | $132.30 | 80.9% | $164.75 | $133.34 | 105.0% | 96.0% | 100.8% |
| TTM 8/31/2023 | 83.8% | $199.78 | $167.51 | 87.3% | $190.89 | $166.65 | 104.1% | 95.5% | 99.5% |
| TTM 8/31/2024 | 87.2% | $223.62 | $195.01 | 90.4% | $222.19 | $200.83 | 103.6% | 99.4% | 103.0% |
| (1) | Source: Third-party market research report. |
| (2) | The variances between underwriting, the appraisal and third-party market research provider data with respect to Occupancy, ADR and RevPAR at the Hampton Inn JFK Property are attributable to differing reporting methodologies and/or timing differences. |
| (3) | The competitive set includes Courtyard New York JFK Airport (166 rooms), Fairfield Inn New York JFK Airport (110 rooms), Hampton Inn Rockville Centre (121 rooms), Hilton Garden Inn Queens/JFK Airport (192 rooms) and Holiday Inn Express Jamaica - JFK AirTrain - NYC (150 rooms). |
The Borrower. The borrower is ASAP 135th Ave Jamaica, LLC, a Delaware limited liability company and single purpose entity with one independent director in its organizational structure. Legal counsel to the borrower delivered a non-consolidation opinion in connection with the origination of the Hampton Inn JFK Mortgage Loan.
The Borrower Sponsors. The non-recourse carveout guarantors and borrower sponsors are Frank Yuan, Jerome Edward Yuan, Paul Yuan and Norbert Yuan. Frank Yuan, Jerome Edward Yuan and Paul Yuan are the chief executive officer, chief investment officer and chief operating officer, respectively, of ASAP Holdings (“ASAP”). ASAP is a private equity firm with a focus on acquiring hospitality and commercial real estate across the United States. Since its founding in 2010, ASAP has acquired over 34 hotels with a portfolio of approximately $2.0 billion in assets under management. As of July 2024, ASAP's portfolio included seven hotels located in Texas, Hawaii, California, Utah, and New York totaling 1,852 rooms, inclusive of the Hampton Inn JFK Property, along with three vacant land parcels for future projects. ASAP's current portfolio has an estimated value of $730.0 million. Three of the four guarantors (Frank Yuan, Jerome Edward Yuan and Norbert Yuan) are named defendants in a pending lawsuit (the “Urban Commons Lawsuit”) in which the plaintiffs seek damages in excess of $140 million in connection with the defendants’ alleged improper sale of stock pledged as collateral for a payment obligation to the plaintiffs. See “Description of the Mortgage Pool—Litigation and Other Legal Considerations” in the Preliminary Prospectus for more information regarding the Urban Commons Lawsuit.
Property Management. The Hampton Inn JFK Property is managed by Remington JFK Employers, LLC.
Escrows and Reserves. At origination, the borrower deposited (i) approximately $457,399 for real estate taxes, (ii) $51,750 for immediate repairs and (iii) $250,000 for seasonality funds. In addition, the borrower is required to deposit (i) on or prior
| THE INFORMATION IN THIS COLLATERAL TERM SHEET IS NOT COMPLETE AND MAY BE AMENDED PRIOR TO THE TIME OF SALE. THIS TERM SHEET IS NOT AN OFFER TO SELL THESE SECURITIES AND IT IS NOT A SOLICITATION OF AN OFFER TO BUY THESE SECURITIES IN ANY JURISDICTION WHERE THE OFFER OR SALE IS NOT PERMITTED. | ||
| 100 | ||
| Structural and Collateral Term Sheet | BMO 2024-5C7 | |
| No. 10 – Hampton Inn JFK | ||
to September 30, 2025, $500,000 into a Guarantor Litigation Funds account (the “Guarantor Litigation Funds”), (ii) on or prior to the date that is seven days prior to November 3, 2025 or such earlier or later date that is set for trial by the applicable court (the “Guarantor Litigation Trial Start Date”), $500,000 and (iii) on each anniversary of the Guarantor Litigation Trial Start Date, an amount equal to $500,000. Notwithstanding the foregoing, the amount in the Guarantor Litigation Funds account is subject to a cap of $2,500,000. The Guarantor Litigation Funds will be held by the lender as additional collateral for the Hampton Inn JFK Mortgage Loan. In lieu of the cash deposits required to be delivered above, the borrower has the right to deposit one or more letters of credit in an amount equal to the amounts required to be deposited by the borrower.
Tax Escrows – On a monthly basis, the borrower is required to deposit 1/12th of an amount that would be sufficient to pay taxes for the next ensuing 12 months (currently equivalent to approximately $104,908 a month).
Insurance Escrows – On a monthly basis, the borrower is required to deposit 1/12th of an amount that would be sufficient to pay insurance premiums for the renewal of coverages; provided, such monthly deposits will be waived so long as the borrower maintains a blanket insurance policy acceptable to the lender. At origination of the Hampton Inn JFK Mortgage Loan, an acceptable blanket policy was in place.
FF&E Reserve – On a monthly basis, the borrower is required to deposit an amount equal to the greater of (i) an amount equal to 1/12th of the aggregate amount required to be reserved under the management agreement and the franchise agreement, which currently equates to approximately $28,139 and (ii) the Minimum Cap Ex Deposit Amount. The “Minimum Cap Ex Deposit Amount” means (i) from November 6, 2024 through and including October 6, 2025, 2% of the gross income during the second calendar month preceding the calendar month in which such monthly payment date occurs, (ii) from November 6, 2025 through and including October 6, 2026, 3% of the gross income during the second calendar month preceding the calendar month in which such monthly payment date occurs and (iii) thereafter, 4% of the gross income during the second calendar month preceding the calendar month in which such monthly payment date occurs.
PIP Reserve – On each payment date during the continuance of a Franchise Trigger Event (as defined below), the borrower is required to deposit all excess cash to pay or reimburse the borrower for the costs and expenses of any work set forth in any PIP approved by the lender.
Seasonality Reserve – On each payment date occurring during April, May, June, July, August, September, October, November, December and January of each year beginning in April 2025, the borrower will deposit with the lender an amount equal to the quotient obtained by dividing (a) the Seasonality Reserve Aggregate Shortfall Amount (as defined below) by (b) 10, to provide some protection for payments due under the Hampton Inn JFK Mortgage Loan documents and budgeted operating expenses during seasonal periods when the rents may be reduced. At any time and from time to time, the lender may reassess its estimate of the amount necessary to pay seasonality shortfalls and may require the borrower to increase the monthly deposits required. The “Seasonality Reserve Aggregate Shortfall Amount” means, commencing in March 2025, the product of (a) the aggregate amount of all seasonality reserve monthly shortfall amounts for the immediately preceding 12 calendar month period, as calculated by the lender in March of each year, multiplied by (b) 1.25.
Lockbox / Cash Management. The Hampton Inn JFK Mortgage Loan is structured with a springing lockbox and springing cash management. Upon the occurrence and continuance of a Lockbox Trigger Event (as defined below), rents from the Hampton Inn JFK Property are required to be deposited directly into the lockbox account or, if received by the borrower or the property manager, deposited within two business days of receipt. Upon the occurrence and continuance of a Cash Management Trigger Event (as defined below), all funds in the lockbox account are required to be swept each business day to a lender-controlled cash management account and disbursed in accordance with the Hampton Inn JFK Mortgage Loan documents, and all excess funds on deposit in the cash management account (after payment of required monthly reserve deposits, debt service payment on the Hampton Inn JFK Mortgage Loan, operating expenses and cash management bank fees) will be applied as follows: (a) if a Franchise Trigger Event has occurred and is continuing, to the PIP account, (b) if a Cash Sweep Trigger Event (as defined below) has occurred and is continuing, to the lender-controlled excess cash flow account or (c) if no Franchise Trigger Event or Cash Sweep Trigger Event then exists, to an account designated by the borrower.
A “Lockbox Trigger Event” means a period commencing upon the earliest of (i) a Cash Management Trigger Event, (ii) the payment date immediately prior to the Guarantor Litigation Trial Start Date and (iii) August 30, 2025.
A “Cash Management Trigger Event” means a period commencing upon the occurrence of (i) an event of default under the Hampton Inn JFK Mortgage Loan documents, (ii) any bankruptcy action involving the borrower, a managing member of
| THE INFORMATION IN THIS COLLATERAL TERM SHEET IS NOT COMPLETE AND MAY BE AMENDED PRIOR TO THE TIME OF SALE. THIS TERM SHEET IS NOT AN OFFER TO SELL THESE SECURITIES AND IT IS NOT A SOLICITATION OF AN OFFER TO BUY THESE SECURITIES IN ANY JURISDICTION WHERE THE OFFER OR SALE IS NOT PERMITTED. | ||
| 101 | ||
| Structural and Collateral Term Sheet | BMO 2024-5C7 | |
| No. 10 – Hampton Inn JFK | ||
the borrower (an “SPC Party”), the guarantors, the key principals or the property manager, (iii) the trailing 12-month period debt service coverage ratio falling below 1.40x, (iv) the indictment for fraud or misappropriation of funds by the borrower, the guarantors, the key principals or an affiliated or third-party property manager, or any director or officer of the aforementioned parties (provided that, in the case of the third-party property manager or any officer or director of such third-party property manager, as applicable, such fraud or misappropriation of funds is related to the Hampton Inn JFK Property), (v) a Franchise Trigger Event or (vi) if the borrower fails to make any of the deposits into the Guarantor Litigation Funds account as and when they are required (a “Guarantor Litigation Trigger Event”) and expiring upon (a) with respect to clause (i) above, the cure of such event of default, (b) with respect to clause (ii) above, if the filing is an involuntary bankruptcy filing against the borrower, any SPC Party, guarantors, or key principals, as applicable, and neither the applicable parties nor their affiliates solicited, consented to, acquiesced in or joined in such filing, the discharge or dismissal of such filing within 60 days of such filing; provided, that such filing does not materially increase such party’s monetary or material non-monetary obligations, materially and adversely affect the guarantors’ or key principals’ ability to perform their respective obligations under the Hampton Inn JFK Mortgage Loan documents, or materially and adversely affect the guarantors’ or key principals’ ability to exercise any authority granted to guarantors or key principals pursuant to any organizational documents of the borrower, any SPC Party or any person that controls the borrower or SPC party, and the borrower is not otherwise in default of the single purpose covenants or transfer provisions in the Hampton Inn JFK Mortgage Loan documents, (c) with respect to clause (ii) above, as it relates to a bankruptcy action of an affiliated property manager, the replacement of such property manager with a third party property manager in accordance with the Hampton Inn JFK Mortgage Loan documents or, if the applicable bankruptcy filing is involuntary and neither the affiliated property manager nor any affiliate of the affiliated property manager solicited, consented to, acquiesced or joined in such filing, the discharge or dismissal of such filing within 60 days; provided, that such filing does not materially and adversely affect such affiliated property manager’s ability to perform its obligations under the management agreement or any Hampton Inn JFK Mortgage Loan document to which it is a party, (d) with respect to clause (iii) above, the trailing 12-month debt service coverage ratio being at least 1.50x for two consecutive calendar quarters, (e) with respect to clause (iv) above, the dismissal of the applicable indictment with prejudice or acquittal of the applicable person, or the replacement of the property manager with a third-party property manager that constitutes a qualified property manager under the Hampton Inn JFK Mortgage Loan documents or (f) with respect to clause (v) above, the cure of a Franchise Trigger Event.
A “Cash Sweep Trigger Event” means a period commencing upon the occurrence of (i) an event of default under the Hampton Inn JFK Mortgage Loan documents, (ii) any bankruptcy action involving the borrower, any SPC Party, the guarantors, the key principals or an affiliated property manager, (iii) the trailing 12-month period debt service coverage ratio falling below 1.20x or (iv) a Guarantor Litigation Trigger Event, and expiring upon (a) with respect to clause (i) above, the cure of such event of default, (b) with respect to clause (ii) above, if the filing is an involuntary bankruptcy filing against the borrower, any SPC Party, guarantors, or key principals, as applicable, and neither the applicable parties nor their affiliates solicited, consented to, acquiesced in or joined in such filing, the discharge or dismissal of such filing within 60 days of such filing; provided that, such filing does not materially increase such party’s monetary or material non-monetary obligations, materially and adversely affect the guarantors’ or key principals’ ability to perform their respective obligations under the Hampton Inn JFK Mortgage Loan documents, or materially and adversely affect the guarantors’ or key principals’ ability to exercise any authority granted to guarantors or key principals pursuant to any organizational documents of the borrower, any SPC Party or any person that controls the borrower or SPC party, and the borrower is not otherwise in default of the single purpose covenants or transfer provisions in the Hampton Inn JFK Mortgage Loan documents, (c) with respect to clause (ii) above, as it relates to a bankruptcy action of an affiliated property manager, the replacement of such property manager with a third party property manager in accordance with the Hampton Inn JFK Mortgage Loan documents or, if the applicable bankruptcy filing is involuntary and neither the affiliated property manager nor any affiliate of the affiliated property manager solicited, consented to, acquiesced or joined in such filing, the discharge or dismissal of such filing within 60 days; provided, that such filing does not materially and adversely affect such affiliated property manager’s ability to perform its obligations under the management agreement or any Hampton Inn JFK Mortgage Loan document to which it is a party or (d) with respect to clause (iii) above, the trailing 12-month debt service coverage ratio is at least 1.30x for two consecutive calendar quarters.
A “Franchise Trigger Event” means a period commencing upon the occurrence of (i) the franchisor giving written notice to the borrower of its intention to terminate or not extend the franchise agreement, (ii) if, on or prior to the date that is six months prior to the then-applicable expiration date under the franchise agreement, the franchise agreement not being extended on terms and conditions reasonably acceptable to the lender, (iii) an event of default by the borrower or an affiliate of the borrower occurs under the franchise agreement, (iv) subject to clause (v) below, a material event of default by the franchisor occurs under the franchise agreement, (v) any bankruptcy action of the franchisor, (vi) the franchise agreement
| THE INFORMATION IN THIS COLLATERAL TERM SHEET IS NOT COMPLETE AND MAY BE AMENDED PRIOR TO THE TIME OF SALE. THIS TERM SHEET IS NOT AN OFFER TO SELL THESE SECURITIES AND IT IS NOT A SOLICITATION OF AN OFFER TO BUY THESE SECURITIES IN ANY JURISDICTION WHERE THE OFFER OR SALE IS NOT PERMITTED. | ||
| 102 | ||
| Structural and Collateral Term Sheet | BMO 2024-5C7 | |
| No. 10 – Hampton Inn JFK | ||
being terminated (in whole or in part) or is no longer in full force and effect or (vii) the franchisor requiring the borrower to perform or otherwise satisfy any PIP work.
Subordinate and Mezzanine Debt. None.
Permitted Future Mezzanine or Subordinate Debt. Not permitted.
Partial Release. Not permitted.
Ground Lease. None.
| THE INFORMATION IN THIS COLLATERAL TERM SHEET IS NOT COMPLETE AND MAY BE AMENDED PRIOR TO THE TIME OF SALE. THIS TERM SHEET IS NOT AN OFFER TO SELL THESE SECURITIES AND IT IS NOT A SOLICITATION OF AN OFFER TO BUY THESE SECURITIES IN ANY JURISDICTION WHERE THE OFFER OR SALE IS NOT PERMITTED. | ||
| 103 | ||