| FREE WRITING PROSPECTUS | ||
| FILED PURSUANT TO RULE 433 | ||
| REGISTRATION FILE NO.: 333-280318-01 | ||
| BANK5 2025-5YR13 | Structural Overview |
 |  |  |  |
BANK5 2025-5YR13
Free Writing Prospectus
Structural and Collateral Term Sheet
$737,090,260
(Approximate Total Mortgage Pool Balance)
$591,699,000
(Approximate Offered Certificates)
J.P. Morgan Chase Commercial Mortgage Securities Corp.
as Depositor
JPMorgan Chase Bank, National Association
Bank of America, National Association
Wells Fargo Bank, National Association
Morgan Stanley Mortgage Capital Holdings LLC
as Sponsors and Mortgage Loan Sellers
Commercial Mortgage Pass-Through Certificates
Series 2025-5YR13
February 3, 2025
| J.P. MORGAN Co-Lead Bookrunner Manager | WELLS FARGO SECURITIES Co-Lead Bookrunner Manager | MORGAN STANLEY Co-Lead Bookrunner Manager | BofA SECURITIES Co-Lead Bookrunner Manager |
| Academy Securities Co-Manager | Drexel Hamilton Co-Manager |
| THE INFORMATION IN THIS STRUCTURAL AND COLLATERAL TERM SHEET IS NOT COMPLETE AND MAY BE AMENDED PRIOR TO THE TIME OF SALE. THIS TERM SHEET IS NOT AN OFFER TO SELL THESE SECURITIES AND IT IS NOT A SOLICITATION OF AN OFFER TO BUY THESE SECURITIES IN ANY JURISDICTION WHERE THE OFFER OR SALE IS NOT PERMITTED. |
| BANK5 2025-5YR13 | Structural Overview |
This material is for your information, and none of J.P. Morgan Securities LLC, BofA Securities, Inc., Wells Fargo Securities, LLC, Morgan Stanley & Co. LLC, Drexel Hamilton, LLC or Academy Securities, Inc. (each individually, an “Underwriter”, and together, the “Underwriters”) are soliciting any action based upon it. This material is not to be construed as an offer to sell or the solicitation of any offer to buy any security in any jurisdiction where such an offer or solicitation would be illegal.
The Depositor has filed a registration statement (including a prospectus) with the SEC (SEC File no. 333-280318) for the offering to which this free writing prospectus relates. Before you invest, you should read the prospectus in the registration statement and other documents the Depositor has filed with the SEC for more complete information about the Depositor, the issuing entity and this offering. You may get these documents for free by visiting EDGAR on the SEC website at www.sec.gov. Alternatively, the Depositor, any Underwriter or any dealer participating in the offering will arrange to send you the prospectus if you request it by calling (800) 408-1016 or by emailing the ABS Syndicate Desk at abs_synd@jpmorgan.com. Neither this document nor anything contained in this document shall form the basis for any contract or commitment whatsoever. The information contained in this document is preliminary as of the date of this document, supersedes any previous such information delivered to you and will be superseded by any such information subsequently delivered prior to the time of sale. These materials are subject to change, completion or amendment from time to time.
This document has been prepared by the Underwriters for information purposes only and does not constitute, in whole or in part, a prospectus for the purposes of Regulation (EU) 2017/1129 (as amended), such Regulation as it forms part of the domestic law of the United Kingdom and/or Part VI of the Financial Services and Markets Act 2000 (as amended); and does not constitute an offering document for any other purpose.
The attached information contains certain tables and other statistical analyses (the “Computational Materials”) that have been prepared in reliance upon information furnished by the Mortgage Loan Sellers. Numerous assumptions were used in preparing the Computational Materials, which may or may not be reflected in this document. The Computational Materials should not be construed as either projections or predictions or as legal, tax, financial or accounting advice. You should consult your own counsel, accountant and other advisors as to the legal, tax, business, financial and related aspects of a purchase of these certificates. Any weighted average lives, yields and principal payment periods shown in the Computational Materials are based on prepayment and/or loss assumptions, and changes in such prepayment and/or loss assumptions may dramatically affect such weighted average lives, yields and principal payment periods. In addition, it is possible that prepayments or losses on the underlying assets will occur at rates higher or lower than the rates shown in the Computational Materials. The specific characteristics of the certificates may differ from those shown in the Computational Materials due to differences between the final underlying assets and the preliminary underlying assets used in preparing the Computational Materials. The principal amount and designation of any certificate described in the Computational Materials are subject to change prior to issuance. None of the Underwriters nor any of their respective affiliates make any representation or warranty as to the actual rate or timing of payments or losses on any of the underlying assets or the payments or yield on the certificates.
This information is based upon management forecasts and reflects prevailing conditions and management’s views as of this date, all of which are subject to change.
This document contains forward-looking statements. Those statements are subject to certain risks and uncertainties that could cause the success of collections and the actual cash flow generated to differ materially from the information set forth in this document. While such information reflects projections prepared in good faith based upon methods and data that are believed to be reasonable and accurate as of their dates, the Depositor undertakes no obligation to revise these forward-looking statements to reflect subsequent events or circumstances. Investors should not place undue reliance on forward-looking statements and are advised to make their own independent analysis and determination with respect to the forecasted periods, which reflect the Depositor’s view only as of the date of this document.
J.P. Morgan is the marketing name for the investment banking businesses of JPMorgan Chase & Co. and its subsidiaries worldwide. Securities, syndicated loan arranging, financial advisory and other investment banking activities are performed by JPMS and its securities affiliates, and lending, derivatives and other commercial banking activities are performed by JPMorgan Chase Bank, National Association and its banking affiliates. JPMS is a member of SIPC and the NYSE.
“BofA Securities” is the marketing name for the global banking and global markets businesses of Bank of America Corporation. Lending, derivatives, and other commercial banking activities are performed globally by banking affiliates of Bank of America Corporation, including Bank of America, N.A., member FDIC. Securities, strategic advisory, and other investment banking activities are performed globally by investment banking affiliates of Bank of America Corporation, including, in the United States, BofA Securities, Inc., which is a registered broker-dealer and member of FINRA and SIPC, and, in other jurisdictions, locally registered entities.
Wells Fargo Securities is the trade name for the capital markets and investment banking services of Wells Fargo & Company and its subsidiaries, including but not limited to Wells Fargo Securities, LLC, a member of the New York Stock Exchange, Financial Industry Regulatory Authority (“FINRA”), the National Futures Association (“NFA”) and the Securities Investor Protection Corporation (“SIPC”), Wells Fargo Prime Services, LLC, a member of FINRA, NFA and SIPC, and Wells Fargo Bank, National Association. Wells Fargo Securities, LLC and Wells Fargo Prime Services, LLC are distinct entities from affiliated banks and thrifts.
Capitalized terms used in this material but not defined herein shall have the meanings ascribed to them in the Preliminary Prospectus (as defined below).
THE CERTIFICATES REFERRED TO IN THESE MATERIALS ARE SUBJECT TO MODIFICATION OR REVISION (INCLUDING THE POSSIBILITY THAT ONE OR MORE CLASSES OF CERTIFICATES MAY BE SPLIT, COMBINED OR ELIMINATED AT ANY TIME PRIOR TO ISSUANCE OR AVAILABILITY OF A FINAL PROSPECTUS) AND ARE OFFERED ON A “WHEN, AS AND IF ISSUED” BASIS.
THE UNDERWRITERS MAY FROM TIME TO TIME PERFORM INVESTMENT BANKING SERVICES FOR, OR SOLICIT INVESTMENT BANKING BUSINESS FROM, ANY COMPANY NAMED IN THESE MATERIALS. THE UNDERWRITERS AND/OR THEIR AFFILIATES OR RESPECTIVE EMPLOYEES MAY FROM TIME TO TIME HAVE A LONG OR SHORT POSITION IN ANY CERTIFICATE OR CONTRACT DISCUSSED IN THESE MATERIALS.
| THE INFORMATION IN THIS STRUCTURAL AND COLLATERAL TERM SHEET IS NOT COMPLETE AND MAY BE AMENDED PRIOR TO THE TIME OF SALE. THIS TERM SHEET IS NOT AN OFFER TO SELL THESE SECURITIES AND IT IS NOT A SOLICITATION OF AN OFFER TO BUY THESE SECURITIES IN ANY JURISDICTION WHERE THE OFFER OR SALE IS NOT PERMITTED. | ||
| T-2 | ||
| BANK5 2025-5YR13 | Structural Overview |
Offered Certificates
| Class | Expected Ratings (Fitch/KBRA/Moody’s)(1) | Approximate Initial Certificate Balance or Notional Amount(2) | Approximate Initial Credit Support(3) | Pass-Through Rate Description | Expected Weighted Average Life (Years)(4) | Expected Principal Window (Months)(4) | Certificate Principal UW NOI Debt Yield(5) | Certificate Principal to Value Ratio(6) |
| Class A-1 | AAAsf/AAA(sf)/Aaa(sf) | $2,050,000 | 30.000% | (7) | 2.52 | 1 - 54 | 18.4% | 40.2% |
| Class A-2(8) | AAAsf/AAA(sf)/Aaa(sf) | (8)(9) | 30.000% | (7)(8) | (9) | (9) | 18.4% | 40.2% |
| Class A-3(8) | AAAsf/AAA(sf)/Aaa(sf) | (8)(9) | 30.000% | (7)(8) | (9) | (9) | 18.4% | 40.2% |
| Class X-A | AAAsf/AAA(sf)/Aaa(sf) | $490,165,000(10) | N/A | Variable IO(11) | N/A | N/A | N/A | N/A |
| Class X-B | A-sf/AAA(sf)/NR | $128,668,000(10) | N/A | Variable IO(11) | N/A | N/A | N/A | N/A |
| Class A-S(8) | AAAsf/AAA(sf)/Aa2(sf) | $66,522,000(8) | 20.500% | (7)(8) | 4.97 | 60 - 60 | 16.2% | 45.6% |
| Class B(8) | AA-sf/AA(sf)/NR | $35,012,000(8) | 15.500% | (7)(8) | 4.97 | 60 - 60 | 15.3% | 48.5% |
Privately Offered Certificates(12)
| Class | Expected Ratings (Fitch/KBRA/Moody’s)(1) | Approximate Initial Certificate Balance or Notional Amount(2) | Approximate Initial Credit Support(3) | Pass-Through Rate Description | Expected Weighted Average Life (Years)(4) | Expected Principal Window (Months)(4) | Certificate Principal UW NOI Debt Yield(5) | Certificate Principal to Value Ratio(6) |
| Class X-D | BBB-sf/BBB(sf)/NR | $24,508,000(10) | N/A | Variable IO(11) | N/A | N/A | N/A | N/A |
| Class X-H | B-sf/BB-(sf)/NR | $10,503,000(10) | N/A | Variable IO(11) | N/A | N/A | N/A | N/A |
| Class X-J | NR/B-(sf)/NR | $7,003,000(10) | N/A | Variable IO(11) | N/A | N/A | N/A | N/A |
| Class X-K | NR/NR/NR | $22,757,747(10) | N/A | Variable IO(11) | N/A | N/A | N/A | N/A |
| Class C(8) | A-sf/A-(sf)/NR | $27,134,000(8) | 11.625% | (7)(8) | 4.97 | 60 - 60 | 14.6% | 50.7% |
| Class D | BBBsf/BBB+(sf)/NR | $16,630,000 | 9.250% | (7) | 4.97 | 60 - 60 | 14.2% | 52.1% |
| Class E | BBB-sf/BBB(sf)/NR | $7,878,000 | 8.125% | (7) | 4.97 | 60 - 60 | 14.0% | 52.7% |
| Class F | BBsf/BBB-(sf)/NR | $9,628,000 | 6.750% | (7) | 4.97 | 60 - 60 | 13.8% | 53.5% |
| Class G | BB-sf/BB+(sf)/NR | $7,003,000 | 5.750% | (7) | 4.97 | 60 - 60 | 13.7% | 54.1% |
| Class H | B-sf/BB-(sf)/NR | $10,503,000 | 4.250% | (7) | 4.97 | 60 - 60 | 13.5% | 55.0% |
| Class J | NR/B-(sf)/NR | $7,003,000 | 3.250% | (7) | 4.97 | 60 - 60 | 13.3% | 55.5% |
| Class K | NR/NR/NR | $22,757,747 | 0.000% | (7) | 4.97 | 60 - 60 | 12.9% | 57.4% |
Non-Offered Eligible Vertical Interest(12)
| Class or Interest | Expected Ratings (Fitch/KBRA/Moody’s)(1) | Approximate Initial VRR Interest Balance(2) | Approximate Initial Credit Support(3) | VRR Interest Rate Description | Expected Weighted Average Life (Years)(4) | Expected Principal Window (Months)(4) | Certificate Principal UW NOI Debt Yield(5) | Certificate Principal to Value Ratio(6) |
| Class RR(13) | NR/NR/NR | $29,104,513.01 | N/A | (14) | 4.89 | 1 - 60 | N/A | N/A |
| RR Interest | NR/NR/NR | $7,750,000.01 | N/A | (14) | 4.89 | 1 - 60 | N/A | N/A |
| (1) | Ratings shown are those of Fitch Ratings, Inc. (“Fitch”), Kroll Bond Rating Agency, LLC (“KBRA”) and Moody’s Investors Service, Inc. (“Moody’s”). Certain nationally recognized statistical rating organizations that were not hired by the depositor may use information they receive pursuant to Rule 17g-5 under the Securities Exchange Act of 1934, as amended, or otherwise to rate the certificates. There can be no assurance as to what ratings a non-hired nationally recognized statistical rating organization would assign. See “Risk Factors—Other Risks Relating to the Certificates—Nationally Recognized Statistical Rating Organizations May Assign Different Ratings to the Certificates; Ratings of the Certificates Reflect Only the Views of the Applicable Rating Agencies as of the Dates Such Ratings Were Issued; Ratings May Affect ERISA Eligibility; Ratings May Be Downgraded” and “Ratings” in the Preliminary Prospectus to be dated on or about the date hereof (the “Preliminary Prospectus”). Capitalized terms used but not defined herein have the meanings assigned to such terms in the Preliminary Prospectus. |
| (2) | Approximate, subject to a variance of plus or minus 5%. In addition, the notional amounts of the Class X-A, Class X-B, Class X-D, Class X-H, Class X-J and Class X-K certificates (collectively, the “Class X certificates”) may vary depending upon the final pricing of the classes of principal balance certificates or trust components whose certificate or principal balances comprise such notional amounts, and, if as a result of such pricing the pass-through rate of any class of the Class X-A, Class X-B, Class X-D, Class X-H, Class X-J and Class X-K certificates, as applicable, would be equal to zero at all times, such class of certificates will not be issued on the closing date of this securitization. |
| (3) | The approximate initial credit support percentages set forth for the certificates are approximate and, for the Class A-1, Class A-2 and Class A-3 certificates, are presented in the aggregate, taking into account the principal balance of the Class A-2 and Class A-3 trust components. The approximate initial credit support percentage set forth for each class of the Class A-S, Class B and Class C certificates represents the approximate credit support for the underlying trust component with the same alphanumeric designation. The VRR Interest provides credit support only to the limited extent that it is allocated a portion of any |
| THE INFORMATION IN THIS STRUCTURAL AND COLLATERAL TERM SHEET IS NOT COMPLETE AND MAY BE AMENDED PRIOR TO THE TIME OF SALE. THIS TERM SHEET IS NOT AN OFFER TO SELL THESE SECURITIES AND IT IS NOT A SOLICITATION OF AN OFFER TO BUY THESE SECURITIES IN ANY JURISDICTION WHERE THE OFFER OR SALE IS NOT PERMITTED. | ||
| T-3 | ||
| BANK5 2025-5YR13 | Structural Overview |
losses incurred on the underlying mortgage loans, which such losses are allocated between it, on the one hand, and to the certificates, on the other hand, pro rata in accordance with their respective Percentage Allocation Entitlements (as defined below). See “Credit Risk Retention” in the Preliminary Prospectus.
| (4) | The Expected Weighted Average Life and Expected Principal Window during which distributions of principal would be received as set forth in the foregoing table with respect to each class of principal balance certificates and the VRR Interest are based on the assumptions set forth under “Yield and Maturity Considerations—Weighted Average Life” in the Preliminary Prospectus and on the assumptions that there are no prepayments, modifications or losses in respect of the mortgage loans and that there are no extensions or forbearances of maturity dates of the mortgage loans. |
| (5) | Certificate Principal UW NOI Debt Yield for any class of principal balance certificates shown in the table above is calculated as the product of (a) the weighted average UW NOI Debt Yield for the mortgage pool, multiplied by (b) a fraction, the numerator of which is the sum of the aggregate initial certificate balance of all the principal balance certificates and the initial principal balance of the VRR Interest, and the denominator of which is the sum of (x) the aggregate initial certificate balance of the subject class of principal balance certificates (or, with respect to the Class A-2, Class A-3, Class A-S, Class B or Class C certificates, the initial principal balance of the trust component with the same alphanumeric designation) and all other classes of principal balance certificates, if any, that are senior to such class and (y) the initial principal balance of the VRR Interest, multiplied by the applicable VRR Interest Computation Percentage. The Certificate Principal UW NOI Debt Yields of the Class A-1, Class A-2 and Class A-3 certificates are calculated in the aggregate for those classes as if they were a single class. |
| (6) | Certificate Principal to Value Ratio for any class of principal balance certificates shown in the table above is calculated as the product of (a) the weighted average Cut-off Date LTV Ratio of the mortgage pool, multiplied by (b) a fraction, the numerator of which is the sum of (x) the aggregate initial certificate balance of the subject class of principal balance certificates (or, with respect to the Class A-2, Class A-3, Class A-S, Class B or Class C certificates, the initial principal balance of the trust component with the same alphanumeric designation) and all other classes of principal balance certificates, if any, that are senior to such class and (y) the initial principal balance of the VRR Interest, multiplied by the applicable VRR Interest Computation Percentage, and the denominator of which is the sum of the aggregate initial certificate balance of all the principal balance certificates and the initial principal balance of the VRR Interest. The Certificate Principal to Value Ratios of the Class A-1, Class A-2 and Class A-3 certificates are calculated in the aggregate for those classes as if they were a single class. With respect to any class of principal balance certificates, the “VRR Interest Computation Percentage” is equal to a fraction, expressed as a percentage, the numerator of which is the aggregate initial certificate balance of the subject class of principal balance certificates (or, with respect to the Class A-2, Class A-3, Class A-S, Class B or Class C certificates, the initial principal balance of the trust component with the same alphanumeric designation) and all other classes of principal balance certificates, if any, that are senior to such class, and the denominator of which is the aggregate initial certificate balance of all the principal balance certificates. |
| (7) | The pass-through rate for each class of the Class A-1, Class A-2, Class A-3, Class A-S, Class B, Class C, Class D, Class E, Class F, Class G Class H, Class J and Class K certificates for any distribution date will be one of the following: (i) a fixed rate per annum, (ii) a variable rate per annum equal to the weighted average of the net mortgage interest rates on the mortgage loans for the related distribution date, (iii) a variable rate per annum equal to the lesser of (a) a fixed rate and (b) the weighted average of the net mortgage interest rates on the mortgage loans for the related distribution date or (iv) a variable rate per annum equal to the weighted average of the net mortgage interest rates on the mortgage loans for the related distribution date minus a specified percentage. For purposes of the calculation of the weighted average of the net mortgage interest rates on the mortgage loans for each distribution date, the mortgage interest rates will be adjusted as necessary to a 30/360 basis. |
| (8) | The Class A-2-1, Class A-2-2, Class A-2-X1, Class A-2-X2, Class A-3-1, Class A-3-2, Class A-3-X1, Class A-3-X2, Class A-S-1, Class A-S-2, Class A-S-X1, Class A-S-X2, Class B-1, Class B-2, Class B-X1 and Class B-X2 certificates are also offered certificates. Such classes of certificates, together with the Class A-2, Class A-3, Class A-S, Class B, Class C, Class C-1, Class C-2, Class C-X1 and Class C-X2 certificates constitute the “Exchangeable Certificates”. The Class A-1, Class D, Class E, Class F, Class G, Class H, Class J and Class K certificates and the Exchangeable Certificates with a certificate balance are referred to as the “principal balance certificates.” Each Class of Exchangeable Certificates will have the certificate balance or notional amount and pass-through rate described below under “Exchangeable Certificates.” Each class of Class A-2, Class A-3, Class A-S, Class B and Class C Exchangeable Certificates will have the same ratings as the Class A-2, Class A-3, Class A-S, Class B and Class C certificates, respectively, shown in the table above. |
| (9) | The exact initial principal balances or notional amounts of the Class A-2, Class A-2-X1, Class A-2-X2, Class A-3, Class A-3-X1 and Class A-3-X2 trust components (and consequently, the exact aggregate initial certificate balances or notional amounts of the Exchangeable Certificates with an “A-2” or “A-3” designation) are unknown and will be determined based on the final pricing of the certificates. However, the initial principal or certificate balances, weighted average lives and principal windows of the Class A-2 and Class A-3 trust components are expected to be within the applicable ranges reflected in the chart below. The aggregate of the initial principal balances of the Class A-2 and Class A-3 trust components is expected to be approximately $488,115,000 , subject to a variance of plus or minus 5%. The Class A-2-X1 and Class A-2-X2 trust components will have initial notional amounts equal to the initial principal balance of the Class A-2 trust component. The Class A-3-X1 and Class A-3-X2 trust components will have initial notional amounts equal to the initial principal balance of the Class A-3 trust component. In the event that the Class A-3 trust component is issued with an initial certificate balance of $488,115,000 , the Class A-2 trust component (and, correspondingly, the Class A-2 Exchangeable Certificates) will not be issued. For purposes of the disclosure herein regarding the aggregate certificate balance of the offered certificates, it is assumed that the maximum amount of the Class A-2 trust component will be issued. |
| Trust Component or Class of Certificates | Expected Range of Initial Principal Balance or Initial Certificate Balance | Expected Range of Weighted Average Life (Years) | Expected Range of Principal Window (Months) |
| Class A-2 trust component | $0 – $200,000,000 | NAP– 4.79 | NAP/ 54 – 59 |
| Class A-3 trust component | $288,115,000– $488,115,000 | 4.90– 4.86 | 59 - 60/ 54 – 60 |
| (10) | The Class X certificates are notional amount certificates and will not be entitled to distributions of principal. The notional amount of the Class X-A certificates will be equal to the aggregate certificate or principal balance of the Class A-1 certificates and the Class A-2 and Class A-3 trust component outstanding from time to time. The notional amount of the Class X-B certificates will be equal to the aggregate principal balance of the Class A-S, Class B and Class C trust components outstanding from time to time. The notional amount of the Class X-D certificates will be equal to the aggregate certificate balance of the Class D and Class E certificates outstanding from time to time. The notional amount of the Class X-H certificates will be equal to the certificate balance of the Class H certificates outstanding from time to time. The notional amount of the Class X-J certificates will be equal to the certificate balance of the Class J certificates outstanding from time to time. The notional amount of the Class X-K certificates will be equal to the certificate balance of the Class K certificates outstanding from time to time. |
| (11) | The pass-through rate for the Class X-A certificates for any distribution date will be a per annum rate equal to the excess, if any, of (a) the weighted average of the net mortgage interest rates on the mortgage loans for the related distribution date, over (b) the weighted average of the pass-through rates on the Class A-1 certificates and the Class A-2, Class A-2-X1 and Class A-2-X2, Class A-3, Class A-3-X1 and Class A-3-X2 trust components for the related distribution date, weighted on the basis of their respective certificate or principal balances or notional amounts outstanding immediately prior to that distribution date (but excluding trust components with a notional amount in the denominator of such weighted average calculation). The pass-through rate for the Class X-B |
| THE INFORMATION IN THIS STRUCTURAL AND COLLATERAL TERM SHEET IS NOT COMPLETE AND MAY BE AMENDED PRIOR TO THE TIME OF SALE. THIS TERM SHEET IS NOT AN OFFER TO SELL THESE SECURITIES AND IT IS NOT A SOLICITATION OF AN OFFER TO BUY THESE SECURITIES IN ANY JURISDICTION WHERE THE OFFER OR SALE IS NOT PERMITTED. | ||
| T-4 | ||
| BANK5 2025-5YR13 | Structural Overview |
certificates for any distribution date will be a per annum rate equal to the excess, if any, of (a) the weighted average of the net mortgage interest rates on the mortgage loans for the related distribution date, over (b) the weighted average of the pass-through rates on the Class A-S, Class A-S-X1, Class A-S-X2, Class B, Class B-X1, Class B-X2, Class C, Class C-X1 and Class C-X2 trust components for the related distribution date, weighted on the basis of their respective certificate or principal balances or notional amounts outstanding immediately prior to that distribution date (but excluding trust components with a notional amount in the denominator of such weighted average calculation). The pass-through rate for the Class X-D certificates for any distribution date will be a per annum rate equal to the excess, if any, of (a) the weighted average of the net mortgage interest rates on the mortgage loans for the related distribution date, over (b) the weighted average of the pass-through rates on the Class D and Class E certificates for the related distribution date, weighted on the basis of their respective certificate balances outstanding immediately prior to that distribution date. The pass-through rate for the Class X-H certificates for any distribution date will be a per annum rate equal to the excess, if any, of (a) the weighted average of the net mortgage interest rates on the mortgage loans for the related distribution date, over (b) the pass-through rate on the Class H certificates for the related distribution date. The pass-through rate for the Class X-J certificates for any distribution date will be a per annum rate equal to the excess, if any, of (a) the weighted average of the net mortgage interest rates on the mortgage loans for the related distribution date, over (b) the pass-through rate on the Class J certificates for the related distribution date. The pass-through rate for the Class X-K certificates for any distribution date will be a per annum rate equal to the excess, if any, of (a) the weighted average of the net mortgage interest rates on the mortgage loans for the related distribution date, over (b) the pass-through rate on the Class K certificates for the related distribution date. For purposes of the calculation of the weighted average of the net mortgage interest rates on the mortgage loans for each distribution date, the mortgage interest rates will be adjusted as necessary to a 30/360 basis
| (12) | Not offered pursuant to the Preliminary Prospectus or this Term Sheet. Information provided in this Term Sheet regarding the characteristics of these certificates and the VRR Interest is provided only to enhance your understanding of the offered certificates. The privately offered certificates also include the Class R certificates, which do not have a certificate balance, notional amount, credit support, pass-through rate, rating, assumed final distribution date or rated final distribution date, and which are not shown in the chart. The Class R certificates represent the beneficial ownership of the residual interest in each of the real estate mortgage investment conduits, as further described in the Preliminary Prospectus. |
| (13) | The Class RR certificates will be certificated but will not be “certificates” for purposes of this Term Sheet. |
| (14) | Although they do not have a specified pass-through rate (other than for tax reporting purposes), the effective pass-through rate for each of the Class RR Certificates and the RR Interest will be a variable rate per annum equal to the weighted average of the net mortgage interest rates on the mortgage loans for the related distribution date (in each case adjusted, if necessary, to accrue on the basis of a 360-day year consisting of twelve 30-day months). |
| THE INFORMATION IN THIS STRUCTURAL AND COLLATERAL TERM SHEET IS NOT COMPLETE AND MAY BE AMENDED PRIOR TO THE TIME OF SALE. THIS TERM SHEET IS NOT AN OFFER TO SELL THESE SECURITIES AND IT IS NOT A SOLICITATION OF AN OFFER TO BUY THESE SECURITIES IN ANY JURISDICTION WHERE THE OFFER OR SALE IS NOT PERMITTED. | ||
| T-5 | ||
| BANK5 2025-5YR13 | Structural Overview |
Issue Characteristics
| Offered Certificates: | $591,699,000 (approximate) monthly pay, multi-class, commercial mortgage pass-through certificates, consisting of 13 principal balance classes (Class A-1, Class A-2, Class A-2-1, Class A-2-2, Class A-3, Class A-3-1, Class A-3-2, Class A-S, Class A-S-1, Class A-S-2, Class B, Class B-1 and Class B-2,) and 10 interest-only classes (Class A-2-X1, Class A-2-X2, Class A-3-X1, Class A-3-X2, Class X-A, Class X-B, Class A-S-X1, Class A-S-X2, Class B-X1 and Class B-X2). |
| Co-Lead Managers and Joint Bookrunners: | J.P. Morgan Securities LLC, BofA Securities, Inc., Wells Fargo Securities, LLC and Morgan Stanley & Co. LLC |
| Co-Managers: | Drexel Hamilton, LLC and Academy Securities, Inc. |
| Mortgage Loan Sellers: | JPMorgan Chase Bank, National Association, Bank of America, National Association, Wells Fargo Bank, National Association and Morgan Stanley Mortgage Capital Holdings LLC |
| Rating Agencies: | Fitch, KBRA and Moody’s |
| Master Servicer: | Wells Fargo Bank, National Association |
| Special Servicer: | K-Star Asset Management LLC |
| Trustee/Certificate Administrator/ Certificate Registrar/Custodian: | Computershare Trust Company, National Association |
| Operating Advisor: | Pentalpha Surveillance LLC |
| Asset Representations Reviewer: | Pentalpha Surveillance LLC |
| Initial Directing Certificateholder: | KKR CMBS IIII Aggregator Category 2 L.P. (or an affiliate) is expected to be appointed as the initial directing certificateholder with respect to all serviced mortgage loans (other than any Excluded Loans). |
| U.S. Credit Risk Retention: | For a discussion on the manner in which the U.S. credit risk retention requirements will be addressed by JPMorgan Chase Bank, National Association, as the retaining sponsor, see “Credit Risk Retention” in the Preliminary Prospectus. |
| EU/UK Risk Retention: | None of the sponsors, the depositor or the underwriters, or their respective affiliates, or any other person, intends to retain a material net economic interest in the securitization constituted by the issue of the certificates and the VRR Interest, or to take any other action in respect of such securitization, in a manner prescribed or contemplated by the EU Securitization Regulation or the UK Securitization Framework. In particular, no such person undertakes to take any action which may be required by any potential investor or certificateholder for the purposes of its compliance with any requirement of the EU Securitization Regulation or the UK Securitization Framework. In addition, the arrangements described under “Credit Risk Retention” in the Preliminary Prospectus have not been structured with the objective of ensuring compliance by any person with any requirement of the EU Securitization Regulation or the UK Securitization Regulation. Consequently, the Offered Certificates may not be a suitable investment for investors that are subject to any requirement of the EU Securitization Regulation or the UK Securitization Framework. See “Risk Factors—Other Risks Relating to the Certificates—EU Securitization Regulation and UK Securitization Framework Due Diligence Requirements” in the Preliminary Prospectus. |
| Cut-off Date: | The mortgage loans will be considered part of the trust fund as of their respective cut-off dates. The cut-off date with respect to each mortgage loan is the respective due date for the monthly debt service payment that is due in February 2025 (or, in the case of any mortgage loan that has its first due date after February 2025, the date that would have been its due date in February 2025 under the terms of that mortgage loan if a monthly debt service payment were scheduled to be due in that month). |
| Expected Pricing Date: | Week of February 3, 2025 |
| Expected Closing Date: | February 25, 2025 |
| Determination Dates: | The 11th day of each month or, if the 11th day is not a business day, then the business day immediately following such 11th day. |
| Distribution Dates: | The 4th business day following each determination date. The first distribution date will be in March 2025. |
| Rated Final Distribution Date: | The distribution date in January 2058. |
| Interest Accrual Period: | Preceding calendar month |
| Payment Structure: | Sequential pay |
| Tax Treatment: | REMIC, except that the Exchangeable Certificates will evidence interests in a grantor trust |
| Optional Termination: | 1.00% clean-up call |
| Minimum Denominations: | $10,000 for each class of Offered Certificates (other than Class X-A and Class X-B certificates); $1,000,000 for the Class X-A and Class X-B certificates |
| Settlement Terms: | DTC, Euroclear and Clearstream |
| Legal/Regulatory Status: | Each class of Offered Certificates is expected to be eligible for exemptive relief under ERISA. Until the SEC adopts rules establishing a different creditworthiness standard, the Class A-1 certificates, the Class A-2 Exchangeable Certificates, the Class A-3 Exchangeable Certificates, the Class X-A certificates, the Class X-B |
| THE INFORMATION IN THIS STRUCTURAL AND COLLATERAL TERM SHEET IS NOT COMPLETE AND MAY BE AMENDED PRIOR TO THE TIME OF SALE. THIS TERM SHEET IS NOT AN OFFER TO SELL THESE SECURITIES AND IT IS NOT A SOLICITATION OF AN OFFER TO BUY THESE SECURITIES IN ANY JURISDICTION WHERE THE OFFER OR SALE IS NOT PERMITTED. | ||
| T-6 | ||
| BANK5 2025-5YR13 | Structural Overview |
| certificates, the Class A-S Exchangeable Certificates and the Class B Exchangeable Certificates will constitute “mortgage related securities” for purposes of SMMEA, so long as they are rated in one of the two highest rating categories by one of the rating agencies or another NRSRO, and the other classes of certificates will not constitute “mortgage related securities” for purposes of SMMEA. | |
| Analytics: | The certificate administrator is expected to make available all distribution date statements, CREFC® reports and supplemental notices received by it to certain modeling financial services as described in the Preliminary Prospectus. |
| Bloomberg Ticker: | BANK5 2025-5YR13<MTGE><GO> |
| Risk Factors: | THE CERTIFICATES INVOLVE CERTAIN RISKS AND MAY NOT BE SUITABLE FOR ALL INVESTORS. SEE THE “RISK FACTORS” SECTION OF THE PRELIMINARY PROSPECTUS. |
| THE INFORMATION IN THIS STRUCTURAL AND COLLATERAL TERM SHEET IS NOT COMPLETE AND MAY BE AMENDED PRIOR TO THE TIME OF SALE. THIS TERM SHEET IS NOT AN OFFER TO SELL THESE SECURITIES AND IT IS NOT A SOLICITATION OF AN OFFER TO BUY THESE SECURITIES IN ANY JURISDICTION WHERE THE OFFER OR SALE IS NOT PERMITTED. | ||
| T-7 | ||
| BANK5 2025-5YR13 | Structural Overview |
Structural Overview
| Allocation Between the VRR Interest and the Certificates: | The aggregate amount available for distributions to the holders of the certificates and the VRR Interest on each distribution date (net of specified expenses of the issuing entity, including fees payable to, and costs and expenses reimbursable to, each applicable master servicer, primary servicer and special servicer, the certificate administrator, the trustee, the operating advisor, the asset representations reviewer and CREFC®) will be allocated between amounts available for distribution to the holders of the VRR Interest, on the one hand, and to the holders of the certificates (other than the Class R Certificates), on the other hand. The portion of such aggregate available funds allocable to: (a) the VRR Interest will at all times be the product of such aggregate available funds multiplied by a fraction, expressed as a percentage, the numerator of which is the initial VRR interest balance of the VRR Interest, and the denominator of which is the sum of the aggregate initial Certificate Balances of the Principal Balance Certificates and the initial VRR Interest Balance of the VRR Interest (the “VRR Percentage”); and (b) the Non-VRR Certificates will at all times be the product of such aggregate available funds multiplied by the difference between 100% and the VRR Percentage (such difference, the “Non-VRR Percentage”) (each of the VRR Percentage and Non-VRR Percentage are referred to as the respective “Percentage Allocation Entitlement”). The Class RR Certificates and the RR Interest will collectively constitute an “eligible vertical interest” (as such term is defined in the Credit Risk Retention Rules), which is expected to be acquired and retained by certain of the sponsors as described under “Credit Risk Retention” in the Preliminary Prospectus. The Class RR Certificates and the RR Interest collectively comprise the “VRR Interest”. |
| Accrual: | Each class of Offered Certificates will accrue interest on a 30/360 basis. |
| Amount and Order of Distributions: | On each distribution date, the certificates’ Percentage Allocation Entitlement of funds available for distribution from the mortgage loans, net of any yield maintenance charges and prepayment premiums, will be distributed in the following amounts and order of priority: First, to the Class A-1, Class X-A, Class X-B, Class X-D, Class X-H, Class X-J and Class X-K certificates and the Class A-2, Class A-2-X1 and Class A-2-X2, Class A-3, Class A-3-X1 and Class A-3-X2 trust components, in respect of interest, up to an amount equal to, and pro rata in accordance with, the interest entitlements for those classes of certificates and trust components; Second, to the Class A-1 certificates and the Class A-2 and Class A-3 trust components, as follows: (i) to the extent of funds allocated to principal and available for distribution: (a) first, to principal on the Class A-1 certificates, until the certificate balance of the Class A-1 certificates has been reduced to zero, (b) second, to principal on the Class A-2 trust component, until the principal balance of the Class A-2 trust component has been reduced to zero, and (c) third, to principal on the Class A-3 trust component, until the principal balance of the Class A-3 trust component has been reduced to zero, or (ii) if the certificate or principal balance of each class of certificates and trust component other than the Class A-1 certificates and Class A-2 and Class A-3 trust component has been reduced to zero as a result of the allocation of mortgage loan losses to those classes of certificates or trust components, funds available for distributions of principal will be distributed to the Class A-1 certificates and Class A-2 and Class A-3 trust component remaining outstanding, pro rata, without regard to the distribution priorities described above; Third, to the Class A-1 certificates and Class A-2 and Class A-3 trust component, to reimburse the Class A-1 certificates and Class A-2 and Class A-3 trust component, first, (i) up to an amount equal to, and pro rata in accordance with, the aggregate previously unreimbursed losses on the mortgage loans allocable to principal that were previously borne by each such class or trust component, then, (ii) up to an amount equal to, and pro rata in accordance with, all accrued and unpaid interest on the amount set forth in clause (i) at the pass-through rate for such class or trust component; Fourth, to the Class A-S, Class A-S-X1 and Class A-S-X2 trust components as follows: (a) to each such trust component in respect of interest, up to an amount equal to, and pro rata in accordance with, the interest entitlements for those trust components; (b) to the extent of funds allocable to principal remaining after distributions in respect of principal to each class of certificates or trust component with a higher priority (as set forth in prior enumerated clauses set forth above), to principal on the Class A-S trust component until its certificate or principal balance has been reduced to zero; and (c) to reimburse the Class A-S trust component, first, in an amount equal to any previously unreimbursed losses on the mortgage loans allocable to principal that were previously borne by those certificates or trust components, and then in an amount equal to interest on that amount at the pass-through rate for such trust component; Fifth, to the Class B, Class B-X1 and Class B-X2 trust components as follows: (a) to each such trust component in respect of interest, up to an amount equal to, and pro rata in accordance with, the interest entitlements for those trust components; (b) to the extent of funds allocable to principal remaining after distributions in respect of principal to each class of certificates or trust component with a higher priority (as set forth in prior enumerated clauses set forth above), to principal on the Class B trust component until its certificate or principal balance has been reduced to zero; and (c) to reimburse the Class B trust component, first, in an amount equal to any previously unreimbursed losses on the mortgage loans allocable to principal that were previously borne by those certificates or trust components, and then in an amount equal to interest on that amount at the pass-through rate for such trust component; Sixth, to the Class C, Class C-X1 and Class C-X2 trust components as follows: (a) to each such trust component in respect of interest, up to an amount equal to, and pro rata in accordance with, the interest entitlements for those trust components; (b) to the extent of funds allocable to principal remaining after distributions in respect of principal to each class of certificates or trust component with a higher priority (as set forth in prior enumerated |
| THE INFORMATION IN THIS STRUCTURAL AND COLLATERAL TERM SHEET IS NOT COMPLETE AND MAY BE AMENDED PRIOR TO THE TIME OF SALE. THIS TERM SHEET IS NOT AN OFFER TO SELL THESE SECURITIES AND IT IS NOT A SOLICITATION OF AN OFFER TO BUY THESE SECURITIES IN ANY JURISDICTION WHERE THE OFFER OR SALE IS NOT PERMITTED. | ||
| T-8 | ||
| BANK5 2025-5YR13 | Structural Overview |
clauses set forth above), to principal on the Class C trust component until its certificate or principal balance has been reduced to zero; and (c) to reimburse the Class C trust component, first, in an amount equal to any previously unreimbursed losses on the mortgage loans allocable to principal that were previously borne by those certificates or trust components, and then in an amount equal to interest on that amount at the pass-through rate for such trust component; Seventh, to the Class D, Class E, Class F, Class G, Class H, Class J and Class K certificates in the amounts and order of priority described in “Description of the Certificates—Distributions” in the Preliminary Prospectus; and Eighth, to the Class R certificates, any remaining amounts. Principal and interest payable on each trust component will be distributed pro rata to the corresponding classes of Exchangeable Certificates representing interests therein in accordance with their Class Percentage Interests therein as described below under “Exchangeable Certificates.” | |
| Interest and Principal Entitlements: | The interest entitlement of each class of Offered Certificates on each distribution date generally will be the interest accrued during the related interest accrual period on the related certificate balance or notional amount at the related pass-through rate, net of any prepayment interest shortfalls allocated to that class for such distribution date as described below. If prepayment interest shortfalls arise from voluntary prepayments on serviced mortgage loans during any collection period, the master servicer is required to make a limited compensating interest payment to offset those shortfalls. See “Description of the Certificates—Prepayment Interest Shortfalls” in the Preliminary Prospectus. The remaining amount of prepayment interest shortfalls will be allocated between the VRR Interest, on one hand, and the certificates, on the other hand, in accordance with their respective Percentage Allocation Entitlements. The prepayment interest shortfalls allocated to the certificates will be allocated among such classes of certificates (other than the Exchangeable Certificates) and trust components that are entitled to interest, on a pro rata basis, based on their respective amounts of accrued interest for the related distribution date, to reduce the interest entitlement on each such class of certificates and trust components. For any distribution date, prepayment interest shortfalls allocated to a trust component will be allocated among the related classes of Exchangeable Certificates, pro rata, in accordance with their respective class percentage interests for that distribution date. If a class of certificates or trust component receives less than the entirety of its interest entitlement on any distribution date, then the shortfall (excluding any shortfall due to prepayment interest shortfalls), together with interest thereon, will be added to its interest entitlement for the next succeeding distribution date. The principal distribution amount for each distribution date generally will be the aggregate amount of principal received or advanced in respect of the mortgage loans, net of any non-recoverable advances and interest thereon and any workout-delayed reimbursement amounts that are reimbursed to the master servicer or the trustee during the related collection period. Non-recoverable advances and interest thereon are reimbursable from principal collections before reimbursement from other amounts. Workout-delayed reimbursement amounts will be reimbursable from principal collections. The certificates and the VRR Interest will be entitled to their respective Percentage Allocation Entitlements of the aggregate principal distribution amount. |
| Exchangeable Certificates: | Certificates of each class of Exchangeable Certificates may be exchanged for certificates of the corresponding classes of Exchangeable Certificates set forth next to such class in the table below, and vice versa. Following any exchange of certificates of one or more classes of Exchangeable Certificates (the applicable “Surrendered Classes”) for certificates of one or more classes of other Exchangeable Certificates (the applicable “Received Classes”), the Class Percentage Interests (as defined below) of the outstanding principal balances or notional amounts of the Corresponding Trust Components that are represented by the Surrendered Classes (and consequently their related certificate balances or notional amounts) will be decreased, and those of the Received Classes (and consequently their related certificate balances or notional amounts) will be increased. The dollar denomination of the certificates of each of the Received Classes must be equal to the dollar denomination of the certificates of each of the Surrendered Classes. No fee will be required with respect to any exchange of Exchangeable Certificates. |
| Surrendered Classes (or Received Classes) of Certificates | Received Classes (or Surrendered Classes) of Certificates | |
| Class A-2 | Class A-2-1, Class A-2-X1 | |
| Class A-2 | Class A-2-2, Class A-2-X2 | |
| Class A-3 | Class A-3-1, Class A-3-X1 | |
| Class A-3 | Class A-3-2, Class A-3-X2 | |
| Class A-S | Class A-S-1, Class A-S-X1 | |
| Class A-S | Class A-S-2, Class A-S-X2 | |
| Class B | Class B-1, Class B-X1 | |
| Class B | Class B-2, Class B-X2 | |
| Class C | Class C-1, Class C-X1 | |
| Class C | Class C-2, Class C-X2 |
| On the closing date, the issuing entity will issue the following “trust components,” each with the initial principal balance (or, if such trust component has an “X” suffix, notional amount) and pass-through rate set forth next to it in the table below. Each trust component with an “X” suffix will not be entitled to distributions of principal. |
| THE INFORMATION IN THIS STRUCTURAL AND COLLATERAL TERM SHEET IS NOT COMPLETE AND MAY BE AMENDED PRIOR TO THE TIME OF SALE. THIS TERM SHEET IS NOT AN OFFER TO SELL THESE SECURITIES AND IT IS NOT A SOLICITATION OF AN OFFER TO BUY THESE SECURITIES IN ANY JURISDICTION WHERE THE OFFER OR SALE IS NOT PERMITTED. | ||
| T-9 | ||
| BANK5 2025-5YR13 | Structural Overview |
| Trust Component | Initial Principal Balance or Notional Amount | Pass-Through Rate | |
| Class A-2 | See footnote (9) to the first table above under “Structural Overview” | Class A-2 certificate pass-through rate minus 1.00% | |
| Class A-2-X1 | Equal to Class A-2 trust component principal balance | 0.50% | |
| Class A-2-X2 | Equal to Class A-2 trust component principal balance | 0.50% | |
| Class A-3 | See footnote (9) to the first table above under “Structural Overview” | Class A-3 certificate pass-through rate minus 1.00% | |
| Class A-3-X1 | Equal to Class A-3 trust component principal balance | 0.50% | |
| Class A-3-X2 | Equal to Class A-3 trust component principal balance | 0.50% | |
| Class A-S | $66,522,000 | Class A-S certificate pass-through rate minus 1.00% | |
| Class A-S-X1 | Equal to Class A-S trust component principal balance | 0.50% | |
| Class A-S-X2 | Equal to Class A-S trust component principal balance | 0.50% | |
| Class B | $35,012,000 | Class B certificate pass-through rate minus 1.00% | |
| Class B-X1 | Equal to Class B trust component principal balance | 0.50% | |
| Class B-X2 | Equal to Class B trust component principal balance | 0.50% | |
| Class C | $27,134,000 | Class C certificate pass-through rate minus 1.00% | |
| Class C-X1 | Equal to Class C trust component principal balance | 0.50% | |
| Class C-X2 | Equal to Class C trust component principal balance | 0.50% |
| Each class of Exchangeable Certificates represents an undivided beneficial ownership interest in the trust components set forth next to it in the table below (the “Corresponding Trust Components”). Each class of Exchangeable Certificates has a pass-through rate equal to the sum of the pass-through rates of the Corresponding Trust Components and represents a percentage interest (the related “Class Percentage Interest”) in each Corresponding Trust Component, including principal and interest payable thereon (and reimbursements of losses allocable thereto), equal to (x) the certificate balance (or, if such class has an “X” suffix, notional amount) of such class of certificates, divided by (y) the principal balance of the Class A-2 trust component (if such class of Exchangeable Certificates has an “A-2” designation), the Class A-3 trust component (if such class of Exchangeable Certificates has an “A-3” designation), the Class A-S trust component (if such class of Exchangeable Certificates has an “A-S” designation), the Class B trust component (if such class of Exchangeable Certificates has a “B” designation), or the Class C trust component (if such class of Exchangeable Certificates has a “C” designation). |
| Group of Exchangeable Certificates | Class of Exchangeable Certificates | Corresponding Trust Components | |
| “Class A-2 Exchangeable Certificates” | Class A-2 | Class A-2, Class A-2-X1, Class A-2-X2 | |
| Class A-2-1 | Class A-2, Class A-2-X2 | ||
| Class A-2-2 | Class A-2 | ||
| Class A-2-X1 | Class A-2-X1 | ||
| Class A-2-X2 | Class A-2-X1, Class A-2-X2 | ||
| “Class A-3 Exchangeable Certificates” | Class A-3 | Class A-3, Class A-3-X1, Class A-3-X2 | |
| Class A-3-1 | Class A-3, Class A-3-X2 | ||
| Class A-3-2 | Class A-3 | ||
| Class A-3-X1 | Class A-3-X1 | ||
| Class A-3-X2 | Class A-3-X1, Class A-3-X2 | ||
| “Class A-S Exchangeable Certificates” | Class A-S | Class A-S, Class A-S-X1, Class A-S-X2 | |
| Class A-S-1 | Class A-S, Class A-S-X2 | ||
| Class A-S-2 | Class A-S | ||
| Class A-S-X1 | Class A-S-X1 | ||
| Class A-S-X2 | Class A-S-X1, Class A-S-X2 | ||
| “Class B Exchangeable Certificates” | Class B | Class B, Class B-X1, Class B-X2 | |
| Class B-1 | Class B, Class B-X2 | ||
| Class B-2 | Class B | ||
| Class B-X1 | Class B-X1 |
| THE INFORMATION IN THIS STRUCTURAL AND COLLATERAL TERM SHEET IS NOT COMPLETE AND MAY BE AMENDED PRIOR TO THE TIME OF SALE. THIS TERM SHEET IS NOT AN OFFER TO SELL THESE SECURITIES AND IT IS NOT A SOLICITATION OF AN OFFER TO BUY THESE SECURITIES IN ANY JURISDICTION WHERE THE OFFER OR SALE IS NOT PERMITTED. | ||
| T-10 | ||
| BANK5 2025-5YR13 | Structural Overview |
| Class B-X2 | Class B-X1, Class B-X2 | ||
| “Class C Exchangeable Certificates” | Class C | Class C, Class C-X1, Class C-X2 | |
| Class C-1 | Class C, Class C-X2 | ||
| Class C-2 | Class C | ||
| Class C-X1 | Class C-X1 | ||
| Class C-X2 | Class C-X1, Class C-X2 |
The maximum certificate balance or notional amount of each class of Class A-2 Exchangeable Certificates, Class A-3 Exchangeable Certificates, Class A-S Exchangeable Certificates, Class B Exchangeable Certificates or Class C Exchangeable Certificates that could be issued in an exchange is equal to the principal balance of the Class A-2, Class A-3, Class A-S, Class B or Class C trust component, respectively. The maximum certificate balances of Class A-2, Class A-3, Class A-S, Class B and Class C certificates (subject to the constraint on the aggregate of the initial principal balances of the Class A-2 and Class A-3 trust components discussed in footnote (9) to the first table above under “Structural Overview”) will be issued on the closing date, and the certificate balance or notional amount of each other class of Exchangeable Certificates will be equal to zero on the closing date. Each class of Class A-2 Exchangeable Certificates, Class A-3 Exchangeable Certificates, Class A-S Exchangeable Certificates, Class B Exchangeable Certificates and Class C Exchangeable Certificates will have a certificate balance or notional amount equal to its Class Percentage Interest multiplied by the principal balance of the Class A-2, Class A-3, Class A-S, Class B or Class C trust component, respectively. Each class of Class A-2 Exchangeable Certificates, A-3 Exchangeable Certificates, Class A-S Exchangeable Certificates, Class B Exchangeable Certificates and Class C Exchangeable Certificates with a certificate balance will have the same approximate initial credit support percentage, Expected Weighted Average Life, Expected Principal Window, Certificate Principal UW NOI Debt Yield and Certificate Principal to Value Ratio as the Class A-2, Class A-3, Class A-S, Class B or Class C certificates, respectively, shown above. |
| Special Servicer Compensation: | The principal compensation to be paid to a special servicer in respect of its special servicing activities will be the special servicing fee, the workout fee and the liquidation fee. The special servicing fee for each distribution date is calculated based on the outstanding principal balance of each serviced mortgage loan that is a specially serviced mortgage loan (and any related serviced companion loan) or as to which the related mortgaged property has become an REO property at the special servicing fee rate, which will be a rate equal to the greater of 0.25% per annum and the per annum rate that would result in a special servicing fee for the related month of $3,500. The special servicing fee will be payable monthly, first, from liquidation proceeds, insurance and condemnation proceeds, and other collections in respect of the related specially serviced mortgage loan or REO property and, then, from general collections on all the mortgage loans and any REO properties. The special servicer will also be entitled to (i) liquidation fees generally equal to 1.0% (or, in any case, if such rate would result in an aggregate liquidation fee less than $25,000, then the liquidation fee rate will be equal to the lesser of (i) 3.0% and (ii) such lower rate as would result in an aggregate liquidation fee equal to $25,000) of liquidation proceeds and certain other collections in respect of each non-specially serviced loan with respect to which it acts as the enforcing servicer or each specially serviced mortgage loan (and any related serviced companion loan) or related REO property and of amounts received in respect of mortgage loan repurchases by the related mortgage loan sellers and (ii) workout fees generally equal to 1.0% of interest (other than default interest) and principal payments made in respect of a rehabilitated mortgage loan (and any related serviced companion loan), subject to a floor of $25,000 with respect to any mortgage loan, whole loan or related REO property, and in the case of each of clause (i) and (ii), subject to certain adjustments and exceptions as described in the Preliminary Prospectus under “Pooling and Servicing Agreement—Servicing and Other Compensation and Payment of Expenses—Special Servicing Compensation”. With respect to any non-serviced mortgage loan, the related special servicer under the related other pooling and servicing agreement pursuant to which such mortgage loan is being serviced will be entitled to similar compensation as that described above with respect to such non-serviced mortgage loan under such other pooling and servicing agreement as further described in the Preliminary Prospectus, although any related fees may accrue at a different rate and there may be a higher (or no) cap on liquidation and workout fees. |
| Prepayment Premiums/Yield Maintenance Charges: | If any yield maintenance charge or prepayment premium is collected during any collection period with respect to any mortgage loan, then on the immediately succeeding distribution date, the certificate administrator will pay: (A) to the classes of certificates specified below, in the following amounts: (1) to the holders of each class of the Class A-1, Class A-2, Class A-2-1, Class A-2-2, Class A-3, Class A-3-1, Class A-3-2, Class A-S, Class A-S-1, Class A-S-2, Class B, Class B-1, Class B-2, Class C, Class C-1, Class C-2 and Class D certificates, the product of (x) the certificates’ Percentage Allocation Entitlement of such yield maintenance charge or prepayment premium, (y) the related Base Interest Fraction for such class and the applicable principal prepayment, and (z) a fraction, the numerator of which is equal to the amount of principal distributed to such class for that distribution date, and the denominator of which is the YM Denominator for that distribution date, (2) to the holders of the Class A-2-X1 certificates, the product of (x) the certificates’ Percentage Allocation Entitlement of such yield maintenance charge or prepayment premium, (y) a fraction, the numerator of which is |
| THE INFORMATION IN THIS STRUCTURAL AND COLLATERAL TERM SHEET IS NOT COMPLETE AND MAY BE AMENDED PRIOR TO THE TIME OF SALE. THIS TERM SHEET IS NOT AN OFFER TO SELL THESE SECURITIES AND IT IS NOT A SOLICITATION OF AN OFFER TO BUY THESE SECURITIES IN ANY JURISDICTION WHERE THE OFFER OR SALE IS NOT PERMITTED. | ||
| T-11 | ||
| BANK5 2025-5YR13 | Structural Overview |
equal to the amount of principal distributed to the Class A-2-1 certificates for that distribution date, and the denominator of which is the YM Denominator for that distribution date, and (z) the difference between (1) the Base Interest Fraction for the Class A-2 certificates and the applicable principal prepayment and (2) the Base Interest Fraction for the Class A-2-1 certificates and the applicable principal prepayment, (3) to the holders of the Class A-2-X2 certificates, the product of (x) the certificates’ Percentage Allocation Entitlement of such yield maintenance charge or prepayment premium, (y) a fraction, the numerator of which is equal to the amount of principal distributed to the Class A-2-2 certificates for that distribution date, and the denominator of which is the YM Denominator for that distribution date, and (z) the difference between (1) the Base Interest Fraction for the Class A-2 certificates and the applicable principal prepayment and (2) the Base Interest Fraction for the Class A-2-2 certificates and the applicable principal prepayment, (4) to the holders of the Class A-3-X1 certificates, the product of (x) the certificates’ Percentage Allocation Entitlement of such yield maintenance charge or prepayment premium, (y) a fraction, the numerator of which is equal to the amount of principal distributed to the Class A-3-1 certificates for that distribution date, and the denominator of which is the YM Denominator for that distribution date, and (z) the difference between (1) the Base Interest Fraction for the Class A-3 certificates and the applicable principal prepayment and (2) the Base Interest Fraction for the Class A-3-1 certificates and the applicable principal prepayment, (5) to the holders of the Class A-3-X2 certificates, the product of (x) the certificates’ Percentage Allocation Entitlement of such yield maintenance charge or prepayment premium, (y) a fraction, the numerator of which is equal to the amount of principal distributed to the Class A-3-2 certificates for that distribution date, and the denominator of which is the YM Denominator for that distribution date, and (z) the difference between (1) the Base Interest Fraction for the Class A-3 certificates and the applicable principal prepayment and (2) the Base Interest Fraction for the Class A-3-2 certificates and the applicable principal prepayment, (4) to the holders of the Class A-S-X1 certificates, the product of (x) the certificates’ Percentage Allocation Entitlement of such yield maintenance charge or prepayment premium, (y) a fraction, the numerator of which is equal to the amount of principal distributed to the Class A-S-1 certificates for that distribution date, and the denominator of which is the YM Denominator for that distribution date, and (z) the difference between (1) the Base Interest Fraction for the Class A-S certificates and the applicable principal prepayment and (2) the Base Interest Fraction for the Class A-S-1 certificates and the applicable principal prepayment, (5) to the holders of the Class A-S-X2 certificates, the product of (x) the certificates’ Percentage Allocation Entitlement of such yield maintenance charge or prepayment premium, (y) a fraction, the numerator of which is equal to the amount of principal distributed to the Class A-S-2 certificates for that distribution date, and the denominator of which is the YM Denominator for that distribution date, and (z) the difference between (1) the Base Interest Fraction for the Class A-S certificates and the applicable principal prepayment and (2) the Base Interest Fraction for the Class A-S-2 certificates and the applicable principal prepayment, (6) to the holders of the Class B-X1 certificates, the product of (x) the certificates’ Percentage Allocation Entitlement of such yield maintenance charge or prepayment premium, (y) a fraction, the numerator of which is equal to the amount of principal distributed to the Class B-1 certificates for that distribution date, and the denominator of which is the YM Denominator for that distribution date, and (z) the difference between (1) the Base Interest Fraction for the Class B certificates and the applicable principal prepayment and (2) the Base Interest Fraction for the Class B-1 certificates and the applicable principal prepayment, (7) to the holders of the Class B-X2 certificates, the product of (x) the certificates’ Percentage Allocation Entitlement of such yield maintenance charge or prepayment premium, (y) a fraction, the numerator of which is equal to the amount of principal distributed to the Class B-2 certificates for that distribution date, and the denominator of which is the YM Denominator for that distribution date, and (z) the difference between (1) the Base Interest Fraction for the Class B certificates and the applicable principal prepayment and (2) the Base Interest Fraction for the Class B-2 certificates and the applicable principal prepayment, (8) to the holders of the Class C-X1 certificates, the product of (x) the certificates’ Percentage Allocation Entitlement of such yield maintenance charge or prepayment premium, (y) a fraction, the numerator of which is equal to the amount of principal distributed to the Class C-1 certificates for that distribution date, and the denominator of which is the YM Denominator for that distribution date, and (z) the difference between (1) the Base Interest Fraction for the Class C certificates and the applicable principal prepayment and (2) the Base Interest Fraction for the Class C-1 certificates and the applicable principal prepayment, (9) to the holders of the Class C-X2 certificates, the product of (x) the certificates’ Percentage Allocation Entitlement of such yield maintenance charge or prepayment premium, (y) a fraction, the numerator of which is equal to the amount of principal distributed to the Class C-2 certificates for that distribution date, and the denominator of which is the YM Denominator for that distribution date, and (z) the difference between (1) the Base Interest Fraction for the Class C certificates and the applicable principal prepayment and (2) the Base Interest Fraction for the Class C-2 certificates and the applicable principal prepayment, (10) to the holders of the Class X-A certificates, the excess, if any, of (x) the product of (1) the certificates’ Percentage Allocation Entitlement of such yield maintenance charge or prepayment premium and (2) a fraction, the numerator of which is equal to the total amount of principal distributed to the Class A-1 certificates, the Class A-2 Exchangeable Certificates and the Class A-3 Exchangeable Certificates for that distribution date, and the denominator of which is the YM Denominator for that distribution date, over (y) the total amount of such yield maintenance charge or prepayment premium distributed to the Class A-1 certificates, the Class A-2 |
| THE INFORMATION IN THIS STRUCTURAL AND COLLATERAL TERM SHEET IS NOT COMPLETE AND MAY BE AMENDED PRIOR TO THE TIME OF SALE. THIS TERM SHEET IS NOT AN OFFER TO SELL THESE SECURITIES AND IT IS NOT A SOLICITATION OF AN OFFER TO BUY THESE SECURITIES IN ANY JURISDICTION WHERE THE OFFER OR SALE IS NOT PERMITTED. | ||
| T-12 | ||
| BANK5 2025-5YR13 | Structural Overview |
Exchangeable Certificates and the Class A-3 Exchangeable Certificates as described above, (11) to the holders of the Class X-B certificates, the excess, if any, of (x) the product of (1) the certificates’ Percentage Allocation Entitlement of such yield maintenance charge or prepayment premium and (2) a fraction, the numerator of which is equal to the total amount of principal distributed to the Class A-S Exchangeable Certificates, Class B Exchangeable Certificates and the Class C Exchangeable Certificates for that distribution date, and the denominator of which is the YM Denominator for that distribution date, over (y) the total amount of such yield maintenance charge or prepayment premium distributed to the Class A-S Exchangeable Certificates, Class B Exchangeable Certificates and the Class C Exchangeable Certificates as described above, and (12) to the holders of the Class X-D certificates, any remaining portion of the certificates’ Percentage Allocation Entitlement of such yield maintenance charge or prepayment premium not distributed as described above; and (B) to the VRR Interest (and, correspondingly, pro rata to the Class RR Certificates and the RR Interest based on their respective Percentage Interests in the VRR Interest), the VRR Interest’s Percentage Allocation Entitlement of such yield maintenance charge or prepayment premium. “YM Denominator” means, for any distribution date, the total amount of principal distributed to the Class A-1, Class D, Class E, Class F, Class G, Class H, Class J and Class K certificates and the Class A-2 Exchangeable Certificates, the Class A-3 Exchangeable Certificates, the Class A-S Exchangeable Certificates, the Class B Exchangeable Certificates and the Class C Exchangeable Certificates. All yield maintenance charges and prepayment premiums referred to above will be net of any liquidation fees or workout fees payable therefrom. Notwithstanding any of the foregoing to the contrary, if at any time the certificate balances of the principal balance certificates (other than the Control Eligible Certificates) have been reduced to zero as a result of the allocation of principal payments on the mortgage loans, the certificate administrator will be required to pay to the holders of each remaining class of principal balance certificates then entitled to distributions of principal on such distribution date the product of (a) the certificates’ Percentage Allocation Entitlement of any yield maintenance charge or prepayment premium distributable on the subject distribution date (net of any liquidation fees payable therefrom) and (b) a fraction, the numerator of which is equal to the amount of principal distributed to such class for that distribution date, and the denominator of which is the total amount of principal distributed to all principal balance certificates for that distribution date. No yield maintenance charges or prepayment premiums will be distributed to the holders of the Class X-H, Class X-J, Class X-K, Class E, Class F, Class G, Class H, Class J, Class K or Class R Certificates. “Base Interest Fraction” means, with respect to any principal prepayment of any mortgage loan that provides for the payment of a yield maintenance charge or prepayment premium, and with respect to any class of principal balance certificates, a fraction (A) the numerator of which is the greater of (x) zero and (y) the difference between (i) the pass‑through rate on that class, and (ii) the applicable discount rate and (B) the denominator of which is the difference between (i) the mortgage interest rate on the related mortgage loan and (ii) the applicable discount rate; provided, that: under no circumstances will the Base Interest Fraction be greater than one; if the discount rate referred to above is greater than or equal to both the mortgage interest rate on the related mortgage loan and the pass‑through rate on that class, then the Base Interest Fraction will equal zero; and if the discount rate referred to above is greater than or equal to the mortgage interest rate on the related mortgage loan and is less than the pass‑through rate on that class, then the Base Interest Fraction will be equal to 1.0. Consistent with the foregoing, the Base Interest Fraction is equal to: |
| (Pass-Through Rate – Discount Rate) | |||
| (Mortgage Rate – Discount Rate) |
| Realized Losses: | On each distribution date, immediately following the distributions to be made to the certificateholders on that date, the certificate administrator is required to calculate the amount, if any, by which (i) the aggregate stated principal balance of the mortgage loans, including any successor REO loans, expected to be outstanding immediately following that distribution date is less than (ii) the sum of the then aggregate certificate balance of the principal balance certificates and the principal balance of the VRR Interest after giving effect to distributions of principal on that distribution date. The certificates’ Percentage Allocation Entitlement of such amount will be applied to the Class K, Class J, Class H, Class G, Class F, Class E and Class D certificates, the Class C, Class B and Class A-S trust components, in that order, in each case until the related certificate or principal balance has been reduced to zero, and then to the Class A-1 certificates and the Class A-2 and Class A 3 trust component, pro rata, based upon their respective certificate or principal balances, until their respective certificate or principal balances have been reduced to zero. The VRR Interest’s Percentage Allocation Entitlement of such amount will be applied to the VRR Interest until the related VRR Interest balance has been reduced to zero. Any portion of such amount applied to the Class A-2, Class A-3, Class A-S, Class B or Class C trust component will reduce the certificate balance or notional amount of each class of certificates in the related group of Exchangeable Certificates by an amount equal to the product of (x) its certificate balance or notional amount, divided by the principal balance of such trust component prior to the applicable reduction, and (y) the amount applied to such trust component. |
| THE INFORMATION IN THIS STRUCTURAL AND COLLATERAL TERM SHEET IS NOT COMPLETE AND MAY BE AMENDED PRIOR TO THE TIME OF SALE. THIS TERM SHEET IS NOT AN OFFER TO SELL THESE SECURITIES AND IT IS NOT A SOLICITATION OF AN OFFER TO BUY THESE SECURITIES IN ANY JURISDICTION WHERE THE OFFER OR SALE IS NOT PERMITTED. | ||
| T-13 | ||
| BANK5 2025-5YR13 | Structural Overview |
The Notional Amount of the Class X-A Certificates will be reduced by the amount of all losses that are allocated to the Class A-1 certificates or Class A-2 or Class A-3 trust components as write-offs in reduction of their principal balances. The Notional Amount of the Class X-B Certificates will be reduced by the amount of all losses that are allocated to the Class A-S, Class B or Class C trust components as write-offs in reduction of their principal balances. | |
| Serviced Whole Loans: | Each of the following mortgaged properties or portfolios of mortgaged properties secures a mortgage loan and one or more pari passu promissory notes and, in some cases, one or more generally subordinate promissory notes (each, a “serviced companion loan”) that will be serviced pursuant to the related intercreditor agreement and the pooling and servicing agreement for this transaction: The Plaza at Walnut Creek. With respect to each such mortgaged property or portfolio of mortgaged properties, the related mortgage loan, together with the related serviced companion loan(s), is referred to herein (for so long as it is serviced under the pooling and servicing agreement for this transaction) as a “serviced whole loan.” Each serviced companion loan is not part of the mortgage pool and may be contributed to one or more future securitization transactions (if not already securitized) or may be otherwise transferred at any time, subject to compliance with the related intercreditor agreement. See the tables below entitled “Mortgage Loans with Pari Passu Companion Loans” and “Mortgage Loans with Subordinate Debt,” as well as “Description of the Mortgage Pool—The Whole Loans” in the Preliminary Prospectus, for additional information regarding each such whole loan. There will be no servicing shift mortgage loans related to the trust as of the Closing Date. |
| Non-Serviced Whole Loans: | Each of the following mortgaged properties or portfolios of mortgaged properties secures a mortgage loan (each, a “non-serviced mortgage loan”), one or more pari passu promissory notes and, in some cases, one or more generally subordinate promissory notes (each such promissory note, a “non-serviced companion loan”) that will be serviced pursuant to the related intercreditor agreement and the pooling and servicing agreement or trust and servicing agreement (referred to herein as a related “pooling and servicing agreement”) for another securitization transaction The Spiral, Gateway Center North and Radius at Harbor Bay. With respect to each such mortgaged property or portfolio of mortgaged properties, the related mortgage loan, together with the related non-serviced companion loan(s), is referred to herein (for so long as it is serviced under the pooling and servicing agreement for another securitization transaction) as a “non-serviced whole loan.” Each non-serviced companion loan is not part of the mortgage pool and may be contributed to one or more future securitization transactions (if not already securitized) or may be otherwise transferred at any time, subject to compliance with the related intercreditor agreement. Servicing of each non-serviced whole loan will generally be directed by the holder of the related control note (or, if such control note is included in a securitization, the directing certificateholder thereunder (or other party designated thereunder to exercise the rights of such control note)), and such holder will have the right to replace the special servicer with respect to the related whole loan with or without cause. See the tables below entitled “Mortgage Loans with Pari Passu Companion Loans” and “Mortgage Loans with Subordinate Debt,” as well as “Description of the Mortgage Pool—The Whole Loans” in the Preliminary Prospectus, for additional information regarding each such whole loan. |
| Directing Certificateholder/ Controlling Class: | The “Directing Certificateholder” will be (i) with respect to a servicing shift mortgage loan, the related Loan-Specific Directing Certificateholder, and (ii) with respect to each other mortgage loan, the Controlling Class Certificateholder (or its representative) selected by more than 50% (by certificate balance) of the Controlling Class Certificateholders; provided, that (1) absent that selection, (2) until a Directing Certificateholder is so selected or (3) upon receipt of a notice from a majority of the Controlling Class Certificateholders (by certificate balance) that a Directing Certificateholder is no longer designated, the Controlling Class Certificateholder that owns the largest aggregate certificate balance of the Controlling Class (or its representative) will be the Directing Certificateholder; provided, that (a) in the case of clause (3), if no one holder owns the largest aggregate certificate balance of the Controlling Class, then there will be no Directing Certificateholder until appointed in accordance with the terms of the pooling and servicing agreement, and (b) the certificate administrator and the other parties to the pooling and servicing agreement will be entitled to assume that the identity of the Directing Certificateholder has not changed until such parties receive written notice of a replacement of the Directing Certificateholder from a party holding the requisite interest in the Controlling Class (as confirmed by the certificate registrar), or the resignation of the then current Directing Certificateholder. As used herein, the term “Directing Certificateholder,” unless used in relation to a Servicing Shift Mortgage Loan, means the entity determined pursuant to clause (ii) of the definition of such term. The “Loan-Specific Directing Certificateholder” at any date of determination with respect to a servicing shift mortgage loan is the then applicable the “controlling holder”, the “directing certificateholder”, the “directing holder”, “directing lender” or any analogous concept under the related intercreditor agreement. Prior to the securitization of the related lead servicing note, the Loan-Specific Directing Certificateholder with respect to a servicing shift mortgage loan will be the holder of the related control note. On and after the securitization of the related lead servicing note, there will be no Loan-Specific Directing Certificateholder under the pooling and servicing agreement for this transaction (the “PSA”) with respect to such servicing shift mortgage loan. The “Controlling Class” will be, as of any time of determination, the most subordinate class of Control Eligible Certificates then outstanding that has an aggregate certificate balance (as notionally reduced by any Cumulative Appraisal Reduction Amounts (as defined below) allocable to such class) at least equal to 25% of the initial certificate balance of that class; provided, that if at any time the certificate balances of the principal balance certificates (other than the Control Eligible Certificates) have been reduced to zero as a result of principal payments on the mortgage loans, then the Controlling Class will be the most subordinate class of Control Eligible Certificates that has a certificate balance greater than zero without regard to the application of the allocable portion of any Cumulative Appraisal Reduction Amounts. The Controlling Class as of the closing date will be the Class K |
| THE INFORMATION IN THIS STRUCTURAL AND COLLATERAL TERM SHEET IS NOT COMPLETE AND MAY BE AMENDED PRIOR TO THE TIME OF SALE. THIS TERM SHEET IS NOT AN OFFER TO SELL THESE SECURITIES AND IT IS NOT A SOLICITATION OF AN OFFER TO BUY THESE SECURITIES IN ANY JURISDICTION WHERE THE OFFER OR SALE IS NOT PERMITTED. | ||
| T-14 | ||
| BANK5 2025-5YR13 | Structural Overview |
certificates. The Control Eligible Certificates will not include the VRR Interest, and the VRR Interest is not permitted to be a Controlling Class. The “Control Eligible Certificates” will be any of the Class H, Class J, and Class K certificates. | |
| Control Rights: | Prior to a Control Termination Event, the Directing Certificateholder will have certain consent and consultation rights under the pooling and servicing agreement with respect to certain major decisions and other matters. A “Control Termination Event” will occur when the Class H certificates have a certificate balance (taking into account the application of any Cumulative Appraisal Reduction Amounts to notionally reduce the certificate balance thereof) of less than 25% of the initial certificate balance of that class; provided that no Control Termination Event may occur with respect to a Loan-Specific Directing Certificateholder, and the term “Control Termination Event” will not be applicable to a Loan-Specific Directing Certificateholder; provided, further, that a Control Termination Event will be not deemed continuing in the event that the certificate balances of the principal balance certificates (other than the Control Eligible Certificates) have been reduced to zero as a result of principal payments on the mortgage loans. After the occurrence of a Control Termination Event but prior to the occurrence of a Consultation Termination Event, the Directing Certificateholder will not have any consent rights, but the Directing Certificateholder will have certain non-binding consultation rights under the pooling and servicing agreement with respect to certain major decisions and other matters. A “Consultation Termination Event” will occur when no class of Control Eligible Certificates has a certificate balance (without regard to the application of any Cumulative Appraisal Reduction Amounts) at least equal to 25% of the initial certificate balance of that class; provided that no Consultation Termination Event may occur with respect to a Loan-Specific Directing Certificateholder, and the term “Consultation Termination Event” will not be applicable to a Loan-Specific Directing Certificateholder; provided, further, that a Consultation Termination Event will be deemed not continuing in the event that the certificate balances of the principal balance certificates (other than the Control Eligible Certificates) have been reduced to zero as a result of principal payments on the mortgage loans. After the occurrence of a Consultation Termination Event, the Directing Certificateholder will not have any consent or consultation rights, except with respect to any rights expressly set forth in the pooling and servicing agreement. If an Operating Advisor Consultation Event has occurred and is continuing, the operating advisor will have certain non-binding consultation rights under the PSA with respect to certain major decisions and other matters. Notwithstanding any proviso to, or any other contrary provision in, the definitions of “Control Termination Event” and “Consultation Termination Event”, a Control Termination Event and a Consultation Termination Event will each be deemed to have occurred with respect to any Excluded Loan with respect to the Directing Certificateholder or the holder of the majority of the Controlling Class, and neither the Directing Certificateholder nor any Controlling Class Certificateholder will have any consent or consultation rights with respect to the servicing of such Excluded Loan. An “Excluded Loan” means a Mortgage Loan or Whole Loan with respect to which, as of any date of determination, the Directing Certificateholder or the holder of the majority of the Controlling Class is a Borrower Party or (b) with respect to any Risk Retention Consultation Party or the holder of the majority of the VRR Interest, a Mortgage Loan or Whole Loan with respect to which, as of any date of determination, such Risk Retention Consultation Party or the holder of the majority of the VRR Interest is a Borrower Party. Additionally, in the event that any of the entities identified on Schedule X of the mortgage loan agreement for the 310 Greenwich Ave Mortgage Loan is appointed as the Directing Certificateholder, then the 310 Greenwich Ave Mortgage Loan will be an Excluded Loan for so long as such party remains the Directing Certificateholder. It is expected that there will be no Excluded Loans with respect to this securitization on the closing date. “Borrower Party” means a borrower, a mortgagor, a manager of a mortgaged property, the holder of a mezzanine loan that has been accelerated or as to which foreclosure or enforcement proceedings have been commenced against the equity collateral pledged to secure the related mezzanine loan, or any Borrower Party Affiliate. “Borrower Party Affiliate” means, with respect to a borrower, a mortgagor, a manager of a mortgaged property or the holder of a mezzanine loan that has been accelerated or as to which foreclosure or enforcement proceedings have been commenced against the equity collateral pledged to secure the related mezzanine loan, (a) any other person controlling or controlled by or under common control with such borrower, mortgagor, manager or mezzanine lender, as applicable, or (b) any other person owning, directly or indirectly, 25% or more of the beneficial interests in such borrower, mortgagor, manager or mezzanine lender, as applicable. For the purposes of this definition, “control” when used with respect to any specified person means the power to direct the management and policies of such person, directly or indirectly, whether through the ownership of voting securities, by contract or otherwise and the terms “controlling” and “controlled” have meanings correlative to the foregoing. Notwithstanding any of the foregoing to the contrary, if any mortgage loan is part of a whole loan, the Directing Certificateholder’s consent and/or consultation rights with respect thereto may be limited as described in the Preliminary Prospectus. In particular, with respect to each non-serviced whole loan and each servicing shift whole loan, the Directing Certificateholder (other than a Loan-Specific Directing Certificateholder) will only have certain consultation rights with respect to certain major decisions and other matters related to such whole loan, in each case only prior to a Consultation Termination Event, and the Loan-Specific Directing Certificateholder will be entitled to similar consent and/or consultation rights with respect to such whole loan. |
| THE INFORMATION IN THIS STRUCTURAL AND COLLATERAL TERM SHEET IS NOT COMPLETE AND MAY BE AMENDED PRIOR TO THE TIME OF SALE. THIS TERM SHEET IS NOT AN OFFER TO SELL THESE SECURITIES AND IT IS NOT A SOLICITATION OF AN OFFER TO BUY THESE SECURITIES IN ANY JURISDICTION WHERE THE OFFER OR SALE IS NOT PERMITTED. | ||
| T-15 | ||
| BANK5 2025-5YR13 | Structural Overview |
| Appraisal Reduction Amounts and Collateral Deficiency Amounts: | An “Appraisal Reduction Amount” generally will be created in the amount, if any, by which the principal balance of a required appraisal loan (which is a mortgage loan with respect to which certain defaults, modifications or insolvency events have occurred as further described in the Preliminary Prospectus) plus other amounts overdue or advanced in connection with such mortgage loan exceeds 90% of the appraised value of the related mortgaged property plus certain escrows and reserves (including letters of credit) held with respect to the mortgage loan. A mortgage loan will cease to be subject to an Appraisal Reduction Amount when it has been brought current for at least three consecutive months, no additional event of default is foreseeable in the reasonable judgment of the applicable special servicer and no other circumstances exist that would cause such mortgage loan or any related companion loan to be a specially serviced loan; however, a “Collateral Deficiency Amount” may exist with respect to any mortgage loan that is modified into an AB loan structure (an “AB Modified Loan”) and remains a corrected mortgage loan and, if so, will generally equal the excess of (i) the stated principal balance of such AB Modified Loan (taking into account the related junior note(s) and any pari passu notes included therein), over (ii) the sum of (in the case of a whole loan, solely to the extent allocable to the subject mortgage loan) (x) the most recent appraised value for the related mortgaged property or mortgaged properties, plus (y) solely to the extent not reflected or taken into account in such appraised value (or in the calculation of any related Appraisal Reduction Amount) and to the extent on deposit with, or otherwise under the control of, the lender as of the date of such determination, any capital or additional collateral contributed by the related borrower at the time the mortgage loan became (and as part of the modification related thereto) such AB Modified Loan for the benefit of the related mortgaged property or mortgaged properties (provided that in the case of an non-serviced mortgage loan, the amounts set forth in this clause (y) will be taken into account solely to the extent relevant information is received by the master servicer), plus (z) any other escrows or reserves (in addition to any amounts set forth in the immediately preceding clause (y) and solely to the extent not reflected or taken into account in the calculation of any related Appraisal Reduction Amount) held by the lender in respect of such AB Modified Loan as of the date of such determination, which such excess, for the avoidance of doubt, will be determined separately from and exclude any related Appraisal Reduction Amounts. As used herein, a “Cumulative Appraisal Reduction Amount” will be the sum of any Appraisal Reduction Amounts and any Collateral Deficiency Amounts. Any Appraisal Reduction Amount in respect of any non-serviced mortgage loan generally will be calculated in accordance with the other servicing agreement pursuant to which such mortgage loan is being serviced, which calculations are expected to be generally similar to those provided for in the pooling and servicing agreement for this transaction. If any mortgage loan is part of a whole loan, any Appraisal Reduction Amount or Collateral Deficiency Amount will (or effectively will) be calculated in respect of such whole loan taken as a whole and allocated, to the extent provided in the related intercreditor agreement and the related pooling and servicing agreement, first, to any related subordinate companion loan, and second, to the related mortgage loan and any pari passu companion loan on a pro rata basis by unpaid principal balance. Appraisal Reduction Amounts will proportionately reduce the interest portion of debt service advances required to be made in respect of the related mortgage loan. Appraisal Reduction Amounts and Collateral Deficiency Amounts (in each case, to the extent of the certificates’ Percentage Allocation Entitlement thereof) will be (i) taken into account in determining the identity of the controlling class entitled to appoint the Directing Certificateholder, the existence of a Control Termination Event and the allocation and/or exercise of voting rights for certain purposes (see “Directing Certificateholder/Controlling Class” above) and (ii) allocated to the following classes of certificates and trust components, in each case to notionally reduce their certificate balances or principal balances until the certificate balance or principal balance of each such class or trust component is notionally reduced to zero: the Class K, Class J, Class H, Class G, Class F, Class E and Class D certificates and the Class C, Class B and Class A-S trust components, in that order, and then pro rata to the Class A-1 certificates and Class A-2 and Class A-3 trust components. Appraisal Reduction Amounts and Collateral Deficiency Amounts allocated to the Class A-2, Class A-3, Class A-S, Class B or Class C trust components will be allocated to the corresponding classes of Exchangeable Certificates with certificate balances pro rata to notionally reduce their certificate balances in accordance with their Class Percentage Interests therein. |
| Appraised-Out Class: | An “Appraised-Out Class” is any class of Control Eligible Certificates, the certificate balance of which (taking into account the application of the certificates’ Percentage Allocation Entitlement of any Appraisal Reduction Amounts or Collateral Deficiency Amounts to notionally reduce the certificate balance of such class) has been reduced to less than 25% of its initial certificate balance. Any Appraised-Out Class may not exercise any direction, control, consent and/or similar rights of the Controlling Class until such time, if any, as such class is reinstated as the Controlling Class, and the rights of the Controlling Class will be exercised by the next most senior class of Control Eligible Certificates that is not an Appraised-Out Class, if any, during such period. Any Appraised Out Class will no longer be the Controlling Class; provided, however, that if at any time, the Certificate Balances of the certificates other than the Control Eligible Certificates have been reduced to zero as a result of principal payments on the mortgage loans, then the Controlling Class will be the most subordinate class of Control Eligible Certificates that has a certificate balance greater than zero without regard to any Appraisal Reduction Amounts. |
| Appraisal Remedy: | The holders of the majority (by certificate balance) of an Appraised-Out Class (such holders, the “Requesting Holders”) will have the right, at their sole expense, to require the special servicer to order (or, with respect to a non-serviced mortgage loan, require the master servicer to request from the applicable non-serviced special servicer) |
| THE INFORMATION IN THIS STRUCTURAL AND COLLATERAL TERM SHEET IS NOT COMPLETE AND MAY BE AMENDED PRIOR TO THE TIME OF SALE. THIS TERM SHEET IS NOT AN OFFER TO SELL THESE SECURITIES AND IT IS NOT A SOLICITATION OF AN OFFER TO BUY THESE SECURITIES IN ANY JURISDICTION WHERE THE OFFER OR SALE IS NOT PERMITTED. | ||
| T-16 | ||
| BANK5 2025-5YR13 | Structural Overview |
a second appraisal of any mortgage loan (or serviced whole loan) for which an appraisal reduction event has occurred or as to which there exists a Collateral Deficiency Amount. With respect to any serviced mortgage loan, the special servicer will be required to use its reasonable efforts to cause that such appraisal is delivered within 30 days from receipt of the Requesting Holders’ written request and will be required to cause such appraisal to be prepared on an “as-is” basis by an MAI appraiser. With respect to any non-serviced mortgage loan, the master servicer will be required to use commercially reasonable efforts to obtain such second appraisal from the applicable non-serviced special servicer. Upon receipt of such supplemental appraisal, the master servicer (for Collateral Deficiency Amounts on any non-serviced mortgage loans), the non-serviced special servicer (for Appraisal Reduction Amounts on non-serviced mortgage loans to the extent provided for in the applicable non-serviced servicing agreement and applicable intercreditor agreement) and the special servicer (for any mortgage loan (other than a non-serviced mortgage loan)) will be required to determine, in accordance with the Servicing Standard, whether, based on its assessment of such supplemental appraisal, any recalculation of the applicable Appraisal Reduction Amount or Collateral Deficiency Amount is warranted and, if so warranted, such person will recalculate such Appraisal Reduction Amount or Collateral Deficiency Amount, as applicable, based upon such supplemental appraisal as described above. If required by any such recalculation, the applicable Appraised-Out Class will be reinstated as the Controlling Class and each Appraised-Out Class will, if applicable, have its related certificate balance notionally restored to the extent required by such recalculation of the Appraisal Reduction Amount or Collateral Deficiency Amount, if applicable. | |
| Sale of Defaulted Loans: | Under certain circumstances the special servicer may be required to use reasonable efforts to solicit offers for a defaulted serviced mortgage loan (and any related companion loan (to the extent provided under the related intercreditor agreement) and/or related REO properties). The Directing Certificateholder will not have a right of first refusal to purchase a defaulted loan. If the special servicer does not receive an offer at least equal to the outstanding principal balance plus all accrued and unpaid interest and outstanding costs and expenses and certain other amounts specified in the pooling and servicing agreement (the “Par Purchase Price”), the special servicer may purchase the defaulted loan or REO property at the Par Purchase Price or may accept the first cash offer received from any person that is determined to be a fair price for such defaulted loan or REO property. If multiple offers are received during the period designated by the special servicer for receipt of offers, the special servicer is generally required to select the highest offer. The special servicer will be required to determine whether any cash offer constitutes a fair price for any defaulted loan or REO property if the highest offeror is a person other than a party to the PSA, the Directing Certificateholder, any Risk Retention Consultation Parties, any sponsor, any Borrower Party, any independent contractor engaged by a special servicer or any known affiliate of any of the preceding entities, and, with respect to a whole loan if it is a defaulted loan, the depositor, the master servicer, the special servicer (or any independent contractor engaged by the special servicer) or the trustee for the securitization of a companion loan, and each related companion loan holder or its representative, any holder of a related mezzanine loan or any known affiliate of any of the preceding entities (each, an “Interested Person”). If the offer is made by an Interested Person (provided that the trustee may not be an offeror), then the trustee will be required to determine whether the offer constitutes a fair price unless (i) the offer is equal to or greater than the applicable Par Purchase Price and (ii) the offer is the highest offer received. Absent an offer at least equal to the Par Purchase Price, no offer from an Interested Person will constitute a fair price unless (x) it is the highest offer received and (y) at least two other offers are received from independent third parties. Neither the trustee nor any of its affiliates may make an offer for or purchase any specially serviced loan or REO property. Notwithstanding any of the foregoing to the contrary, the special servicer is not required to accept the highest offer and may accept a lower offer for a defaulted loan or REO property if the special servicer determines, in accordance with the Servicing Standard (and subject to the requirements of any related intercreditor agreement), that a rejection of such offer would be in the best interests of the certificateholders, the VRR Interest owners and any related companion loan holders as a collective whole as if they constituted a single lender, so long as such lower offer was not made by such special servicer or any of its affiliates. If title to any mortgaged property is acquired by the trust fund, the special servicer will generally be required to sell such mortgaged property prior to the close of the third calendar year beginning after the year of acquisition. The foregoing applies to mortgage loans serviced under the PSA. With respect to any non-serviced whole loan, if the special servicer under the applicable pooling and servicing agreement determines to sell the related controlling companion loan if it becomes a defaulted loan, then the special servicer will be required to sell the related whole loan, including the related mortgage loan included in the BANK5 2025-5YR13 securitization trust and the related pari passu companion loan(s) and, under certain circumstances, any subordinate companion loan(s), as a single loan. In connection with any such sale, the special servicer under the applicable pooling and servicing agreement will be required to follow procedures substantially similar to those set forth above. |
| Risk Retention Consultation Parties: | The risk retention consultation parties will have certain non-binding consultation rights with respect to certain material servicing actions. The owners of the VRR Interest, which is expected to be transferred by the depositor on the Closing Date to JPMCB, Bank of America, National Association, Wells Fargo Bank, National Association and Morgan Stanley Bank, N.A., or its respective “majority-owned affiliate”, will each be entitled to appoint a risk retention consultation party. JPMCB, Wells Fargo Bank, National Association, Morgan Stanley Mortgage Capital Holdings LLC and Bank of America, National Association are expected to be appointed as the initial risk retention consultation parties. |
| THE INFORMATION IN THIS STRUCTURAL AND COLLATERAL TERM SHEET IS NOT COMPLETE AND MAY BE AMENDED PRIOR TO THE TIME OF SALE. THIS TERM SHEET IS NOT AN OFFER TO SELL THESE SECURITIES AND IT IS NOT A SOLICITATION OF AN OFFER TO BUY THESE SECURITIES IN ANY JURISDICTION WHERE THE OFFER OR SALE IS NOT PERMITTED. | ||
| T-17 | ||
| BANK5 2025-5YR13 | Structural Overview |
| Appointment and Replacement of each Special Servicer: | The Directing Certificateholder will appoint the initial special servicer as of the closing date. Prior to the occurrence and continuance of a Control Termination Event, the special servicer may generally be replaced by the Directing Certificateholder with or without cause at any time. After the occurrence and during the continuance of a Control Termination Event and upon (a) the written direction of holders of principal balance certificates evidencing not less than 25% of the voting rights (taking into account the application of Cumulative Appraisal Reduction Amounts to notionally reduce the certificate balances of classes to which such Cumulative Appraisal Reduction Amounts are allocable) requesting a vote to replace the special servicer with a replacement special servicer, (b) payment by such requesting holders to the certificate administrator of all reasonable fees and expenses to be incurred by the certificate administrator in connection with administering such vote and (c) delivery by such holders of a rating agency confirmation from each applicable rating agency, the certificate administrator will be required to promptly post such notice on its internet website and by mail and conduct the solicitation of votes of all certificates in such regard, which requisite affirmative votes must be received within 180 days of the posting of such notice. Upon the written direction of holders of at least 66 2/3% of a Certificateholder Quorum, the trustee will be required to immediately replace the applicable special servicer with a qualified replacement special servicer designated by such holders of certificates. If the operating advisor determines, in its sole discretion exercised in good faith, that (i) the special servicer is not performing its duties as required under the pooling and servicing agreement or is otherwise not acting in accordance with the Servicing Standard and (ii) the replacement of the special servicer would be in the best interests of the certificateholders as a collective whole, then the operating advisor will have the right to recommend the replacement of such special servicer. The operating advisor’s recommendation to replace such special servicer must be confirmed by an affirmative vote of holders of certificates representing at least a majority of a quorum of certificateholders (which, for this purpose, is the holders of certificates that (i) evidence at least 20% of the voting rights (taking into account the application of any Appraisal Reduction Amounts to notionally reduce the respective certificate balances) of all principal balance certificates on an aggregate basis and (ii) consist of at least three certificateholders or certificate owners that are not “affiliated with” (as defined in Regulation RR) each other). A “Certificateholder Quorum” means, in connection with any solicitation of votes in connection with the replacement of a special servicer or the asset representations reviewer, the holders of certificates evidencing at least 50% of the aggregate voting rights (taking into account the application of realized losses and, other than with respect to the termination of the asset representations reviewer, any Cumulative Appraisal Reduction Amounts to notionally reduce the certificate balance of the certificates) of all classes of certificates entitled to principal on an aggregate basis. With respect to each serviced whole loan, any holder of a related pari passu companion loan, following a servicer termination event with respect to the special servicer that affects such holder, will be entitled to direct the trustee (and the trustee will be required) to terminate such special servicer solely with respect to such serviced whole loan. A replacement special servicer will be selected by the trustee or, prior to a Control Termination Event, by the Directing Certificateholder; provided, that any successor special servicer appointed to replace the special servicer with respect to such whole loan cannot be the entity (or its affiliate) that was terminated at the direction of the holder of the related pari passu companion loan. Notwithstanding any of the foregoing to the contrary, with respect to each servicing shift whole loan, the holder of the related control note will be entitled to replace the special servicer with respect to such whole loan at any time, with or without cause, and while it is a serviced whole loan, no other party may replace the applicable special servicer for such whole loan unless there is a servicer termination event with respect thereto. With respect to any non-serviced whole loan, subject to conditions or restrictions in the applicable intercreditor agreement, the BANK5 2025-5YR13 trust, as holder of the related mortgage loan, has the right to terminate the special servicer under the related pooling and servicing agreement if a servicer termination event occurs with respect to the special servicer that affects the trust in its capacity as such holder. Such rights may be exercised by the Directing Certificateholder prior to a Consultation Termination Event (or the applicable special servicer, following the occurrence and during the continuance of a Consultation Termination Event). The successor special servicer will be selected pursuant to the applicable pooling and servicing agreement by the related directing holder prior to a control termination event under such pooling and servicing agreement. |
| Servicing Standard: | Each of the master servicer and the special servicer are obligated to service and administer the mortgage loans (and, if applicable, the serviced companion loans) in accordance with the definition of the “Servicing Standard” described in the Preliminary Prospectus and the terms of the pooling and servicing agreement, provided that each non-serviced mortgage loan, if any, will be serviced by another master servicer or special servicer under the pooling and servicing agreement with respect to the securitization of a related companion loan, which entities will be obligated to service and administer such non-serviced mortgage loan pursuant to a similar standard set forth in the related pooling and servicing agreement. |
| Excluded Special Servicer: | If the special servicer obtains knowledge that it has become a Borrower Party with respect to any mortgage loan or serviced whole loan (an “Excluded Special Servicer Loan”), the special servicer will be required to resign as special servicer of that Excluded Special Servicer Loan, and prior to the occurrence and continuance of a Control Termination Event, the Directing Certificateholder will be required to appoint (and may remove and replace with or without cause) a separate special servicer that is not a Borrower Party (an “Excluded Special Servicer”) with respect to any Excluded Special Servicer Loan, unless such Excluded Special Servicer Loan is also an Excluded Loan with respect to the Directing Certificateholder or the holder of the majority of the Controlling Class. At any time after the occurrence and during the continuance of a Control Termination Event, or if at any time the applicable Excluded Special Servicer Loan is also an Excluded Loan with respect to the |
| THE INFORMATION IN THIS STRUCTURAL AND COLLATERAL TERM SHEET IS NOT COMPLETE AND MAY BE AMENDED PRIOR TO THE TIME OF SALE. THIS TERM SHEET IS NOT AN OFFER TO SELL THESE SECURITIES AND IT IS NOT A SOLICITATION OF AN OFFER TO BUY THESE SECURITIES IN ANY JURISDICTION WHERE THE OFFER OR SALE IS NOT PERMITTED. | ||
| T-18 | ||
| BANK5 2025-5YR13 | Structural Overview |
| Directing Certificateholder or the holder of the majority of the Controlling Class or if the Directing Certificateholder is entitled to appoint the Excluded Special Servicer but does not so appoint a replacement special servicer within 30 days of notice of such resignation (provided that the conditions required to be satisfied for the appointment of the replacement special servicer to be effective are not required to be completed within such 30-day period but in any event are to be completed within 120 days), the resigning special servicer will be required to use reasonable efforts to select the related Excluded Special Servicer. Any Excluded Special Servicer will be required to perform all of the obligations of the special servicer and will be entitled to all special servicing compensation with respect to such Excluded Special Servicer Loan earned while the related mortgage loan is an Excluded Special Servicer Loan. | |
| Liquidated Loan Waterfall: | On liquidation of any mortgage loan, all net liquidation proceeds related to the mortgage loan (but not any related companion loan) will be applied so that amounts allocated as a recovery of accrued and unpaid interest will not, in the first instance, include any delinquent interest that was not advanced as a result of Appraisal Reduction Amounts (or would not have been advanced in the absence of a non-recoverability determination) or accrued on the portion of the stated principal balance thereof equal to any related Collateral Deficiency Amount in effect from time to time and as to which no advance was made (collectively, the “Subordinated Interest Amount”). After the adjusted interest amount is so allocated, any remaining liquidation proceeds will be allocated to pay principal on the mortgage loan until the unpaid principal amount of the mortgage loan has been reduced to zero. Any remaining liquidation proceeds will then be allocated to pay the Subordinated Interest Amount. |
| Operating Advisor: | The operating advisor will be required to perform certain review duties if a Control Termination Event has occurred and is continuing, which will generally include a limited annual review of, and the preparation of a report regarding, certain actions of the applicable special servicer with respect to the resolution and/or liquidation of specially serviced loans. The review and report generally will be based on any asset status reports and additional information delivered to the operating advisor by such special servicer. In addition, if a Control Termination Event has occurred and is continuing, the applicable special servicer must consult with the operating advisor (in addition to the Directing Certificateholder if no Consultation Termination Event has occurred and is continuing) in connection with major decisions with respect to mortgage loans. Furthermore, under certain circumstances, but only if a Consultation Termination Event has occurred and is continuing, the operating advisor may recommend the replacement of the applicable special servicer as described above under “—Appointment and Replacement of each Special Servicer”; however, the operating advisor will not have any rights or obligations with respect to a non-serviced whole loan. If a Consultation Termination Event has occurred and is continuing, the operating advisor may be removed and replaced without cause upon the affirmative direction of certificates owners holding not less than 75% of the voting rights of all certificates (taking into account the application of Cumulative Appraisal Reduction Amounts), following a proposal from certificate owners holding not less than 25% of the voting rights of all certificates (taking into account the application of Cumulative Appraisal Reduction Amounts). The certificateholders who initiate a vote on a termination and replacement of the operating advisor without cause must cause the payment of the fees and expenses incurred in the replacement. In addition, in the event there are no classes of certificates outstanding other than the Control Eligible Certificates, and the Class X-H, Class X-J, Class X-K and Class R certificates, then all of the rights and obligations of the operating advisor under the PSA will terminate without payment of any penalty or termination fee (other than any rights or obligations that accrued prior to the date of such termination (including accrued and unpaid compensation) and other than indemnification rights arising out of events occurring prior to such termination). See “Pooling and Servicing Agreement—The Operating Advisor—Termination of the Operating Advisor Without Cause” in the Preliminary Prospectus. |
| Asset Representations Reviewer: | The asset representations reviewer will be required to review certain delinquent mortgage loans after a specified delinquency threshold has been met and the required percentage of certificateholders vote to direct a review as described below. The asset representations reviewer will be entitled to the Asset Representations Reviewer Fee with respect to such review. See “Pooling and Servicing Agreement—The Asset Representations Reviewer” in the Preliminary Prospectus. The certificate administrator will be required to notify certificateholders if the specified delinquency threshold has been met as described in the Preliminary Prospectus under “—The Asset Representations Reviewer”. If certificateholders evidencing not less than 5.0% of the voting rights request a vote to commence an asset review, and if subsequently (i) a majority of those certificateholders who cast votes and (ii) a majority of an Asset Review Quorum authorizes an asset review within 150 days of the request for a vote, the asset representations reviewer will be required to conduct an asset review of delinquent loans. The asset representations reviewer may be terminated and replaced without cause. Upon (i) the written direction of certificateholders evidencing not less than 25% of the voting rights (without regard to the application of any Cumulative Appraisal Reduction Amounts) requesting a vote to terminate and replace the asset representations reviewer with a proposed successor asset representations reviewer that is an eligible asset representations reviewer, and (ii) payment by such holders to the certificate administrator of the reasonable fees and expenses to be incurred by the certificate administrator in connection with administering such vote, the certificate administrator will be required to promptly provide notice to all certificateholders and the asset representations reviewer of such request by posting such notice on its internet website, and by mailing such notice to all certificateholders and the asset representations reviewer. Upon the written direction of certificateholders evidencing at least 75% of a Certificateholder Quorum (without regard to the application of any Cumulative Appraisal Reduction Amounts), the trustee will be required to terminate all of the rights and obligations of the asset representations reviewer under the pooling and servicing agreement (other than any rights or obligations that accrued prior to the date of such termination and other than indemnification rights arising out of events occurring prior to such termination) by written notice to the asset representations reviewer, and the proposed |
| THE INFORMATION IN THIS STRUCTURAL AND COLLATERAL TERM SHEET IS NOT COMPLETE AND MAY BE AMENDED PRIOR TO THE TIME OF SALE. THIS TERM SHEET IS NOT AN OFFER TO SELL THESE SECURITIES AND IT IS NOT A SOLICITATION OF AN OFFER TO BUY THESE SECURITIES IN ANY JURISDICTION WHERE THE OFFER OR SALE IS NOT PERMITTED. | ||
| T-19 | ||
| BANK5 2025-5YR13 | Structural Overview |
successor asset representations reviewer will be appointed. See “Pooling and Servicing Agreement—The Asset Representations Reviewer” in the Preliminary Prospectus. An “Asset Review Quorum” means, in connection with any solicitation of votes to authorize an Asset Review as described above, the holders of certificates evidencing at least 5.0% of the aggregate voting right. | |
| Dispute Resolution Provisions: | The mortgage loan sellers will be subject to the dispute resolution provisions set forth in the PSA to the extent those provisions are triggered with respect to any mortgage loan sold to the depositor by a mortgage loan seller, and such mortgage loan seller will be obligated under the related mortgage loan purchase agreement to comply with all applicable provisions and to take part in any mediation or arbitration proceedings that may result. Generally, in the event that a Repurchase Request is not “Resolved” within 180 days after the related mortgage loan seller receives such Repurchase Request, then the enforcing servicer will be required to send a notice to the first certificateholder (or beneficial owner) to deliver a certificateholder repurchase request with respect to the mortgage loan (the “Initial Requesting Certificateholder”) (if any) and to the certificate administrator (which will be required to make such notice available to certificateholders and the VRR Interest owners via the certificate administrator’s website) indicating the enforcing servicer’s intended course of action with respect to the Repurchase Request. If (a) the enforcing servicer’s intended course of action with respect to the Repurchase Request does not involve pursuing further action to exercise rights against the related mortgage loan seller with respect to the Repurchase Request and the Initial Requesting Certificateholder, if any, or any other certificateholder, or certificate owner wishes to exercise its right to refer the matter to mediation (including non-binding arbitration) or arbitration, or (b) the enforcing servicer’s intended course of action is to pursue further action to exercise rights against the related mortgage loan seller with respect to the Repurchase Request but the Initial Requesting Certificateholder, if any, or any other certificateholder or certificate owner does not agree with the dispute resolution method selected by the enforcing servicer, then the Initial Requesting Certificateholder, if any, or such other certificateholder or certificate owner may deliver a written notice to the enforcing servicer indicating its intent to exercise its right to refer the matter to either mediation or arbitration. “Resolved” means, with respect to a Repurchase Request, (i) that the related material defect or breach has been cured, (ii) the related mortgage loan has been repurchased in accordance with the related mortgage loan purchase agreement, (iii) a mortgage loan has been substituted for the related mortgage loan in accordance with the related mortgage loan purchase agreement, (iv) the applicable mortgage loan seller has made a loss of value payment, (v) a contractually binding agreement has been entered into between the enforcing servicer, on behalf of the issuing entity, and the related mortgage loan seller that settles the related mortgage loan seller’s obligations under the related mortgage loan purchase agreement, or (vi) the related mortgage loan is no longer property of the issuing entity as a result of a sale or other disposition in accordance with the pooling and servicing agreement. See “Pooling and Servicing Agreement—Dispute Resolution Provisions” in the Preliminary Prospectus. |
| Investor Communications: | The certificate administrator is required to include on any Form 10-D any request received from a certificateholder to communicate with other certificateholders related to certificateholders exercising their rights under the terms of the PSA. Any certificateholder wishing to communicate with other certificateholders regarding the exercise of its rights under the terms of the PSA will be able to deliver a written request signed by an authorized representative of the requesting investor to the certificate administrator. |
| Deal Website: | The certificate administrator will be required to maintain a deal website which will include, among other items: (a) summaries of asset status reports prepared by a special servicer, (b) inspection reports, (c) appraisals, (d) various “special notices” described in the Preliminary Prospectus, (e) the “Investor Q&A Forum” and (f) a voluntary “Investor Registry”. Investors may access the deal website following execution of a certification and confidentiality agreement. |
| THE INFORMATION IN THIS STRUCTURAL AND COLLATERAL TERM SHEET IS NOT COMPLETE AND MAY BE AMENDED PRIOR TO THE TIME OF SALE. THIS TERM SHEET IS NOT AN OFFER TO SELL THESE SECURITIES AND IT IS NOT A SOLICITATION OF AN OFFER TO BUY THESE SECURITIES IN ANY JURISDICTION WHERE THE OFFER OR SALE IS NOT PERMITTED. | ||
| T-20 | ||
| BANK5 2025-5YR13 | Collateral Overview |
| Mortgage Loan Sellers | No. of Mortgage Loans | No. of Mortgaged Properties | Aggregate Cut-off Date Balance | % of Pool |
| JPMorgan Chase Bank, National Association | 6 | 10 | $130,500,000 | 17.7% |
| Bank of America, National Association | 10 | 10 | $201,415,000 | 27.3% |
| Morgan Stanley Mortgage Capital Holdings LLC | 9 | 24 | $172,645,300 | 23.4% |
| Wells Fargo Bank, National Association | 5 | 14 | $159,029,960 | 21.6% |
| JPMorgan Chase Bank, National Association / Bank of America, National Association / Wells Fargo Bank, National Association | 1 | 1 | $73,500,000 | 9.97% |
| Total: | 31 | 59 | $737,090,260 | 100.0% |
| Pool Statistics(1)(2) | |
| Aggregate Cut-off Date Balance: | $737,090,260 |
| Number of Mortgage Loans: | 31 |
| Average Cut-off Date Balance per Mortgage Loan: | $23,777,105 |
| Number of Mortgaged Properties: | 59 |
| Average Cut-off Date Balance per Mortgaged Property: | $12,493,055 |
| Weighted Average Mortgage Rate: | 6.6851% |
| % of Pool Secured by 5 Largest Mortgage Loans: | 42.7% |
| % of Pool Secured by 10 Largest Mortgage Loans: | 64.7% |
| % of Pool Secured by ARD Loans: | 0.0% |
| Weighted Average Original Term to Maturity (months): | 60 |
| Weighted Average Remaining Term to Maturity (months): | 59 |
| Weighted Average Seasoning (months): | 1 |
| % of Pool Secured by Single Tenant Mortgaged Properties: | 10.2% |
| % of Pool Secured by Refinance Loans: | 73.8% |
| % of Pool Secured by Acquisition Loans: | 16.2% |
| % of Pool Secured by Recapitalization Loans: | 9.97% |
| Additional Debt | |
| % of Pool with Pari Passu Mortgage Debt: | 33.3% |
| % of Pool with Subordinate Debt: | 9.97% |
| % of Pool with Mezzanine Mortgage Debt: | 0.0% |
| Credit Statistics | |
| Weighted Average UW NOI DSCR: | 1.92x |
| Weighted Average UW NOI Debt Yield: | 12.9% |
| Weighted Average UW NCF DSCR: | 1.81x |
| Weighted Average UW NCF Debt Yield: | 12.2% |
| Weighted Average Cut-off Date LTV Ratio(3): | 57.4% |
| Weighted Average Maturity Date LTV Ratio(3): | 57.2% |
Footnotes are set forth on the following page.
| THE INFORMATION IN THIS STRUCTURAL AND COLLATERAL TERM SHEET IS NOT COMPLETE AND MAY BE AMENDED PRIOR TO THE TIME OF SALE. THIS TERM SHEET IS NOT AN OFFER TO SELL THESE SECURITIES AND IT IS NOT A SOLICITATION OF AN OFFER TO BUY THESE SECURITIES IN ANY JURISDICTION WHERE THE OFFER OR SALE IS NOT PERMITTED. | ||
| T-21 | ||
| BANK5 2025-5YR13 | Collateral Overview |
Amortization
| Weighted Average Original Amortization Term (months): | 360 |
| Weighted Average Remaining Amortization Term (months): | 359 |
| % of Pool Interest Only through Maturity: | 93.3% |
| % of Pool Amortizing Balloon: | 3.4% |
| % of Pool Interest Only, Amortizing Balloon: | 3.3% |
Lockboxes
| % of Pool with Hard Lockboxes: | 52.2% |
| % of Pool with Springing Lockboxes: | 34.1% |
| % of Pool with Soft (Residential) / Hard (Commercial) Lockboxes: | 1.6% |
| % of Pool with No Lockboxes: | 1.2% |
| % of Pool with Soft Lockboxes: | 10.9% |
Reserves
| % of Pool Requiring Tax Reserves: | 76.5% |
| % of Pool Requiring Insurance Reserves: | 29.0% |
| % of Pool Requiring Replacement Reserves: | 75.0% |
| % of Pool Requiring TI/LC Reserves(4): | 52.5% |
Call Protection
| % of Pool with lockout period, followed by defeasance until open period: | 72.6% |
| % of Pool with lockout period, followed by the greater of a prepayment premium and yield maintenance, followed by defeasance or the greater of a prepayment premium and yield maintenance until open period: | 13.8% |
| % of Pool with lockout period, followed by the greater of a prepayment premium and yield maintenance until open period: | 13.5% |
| (1) | Unless otherwise indicated, all references to “% of Pool” in this Term Sheet reflect a percentage of the aggregate principal balance of the mortgage pool as of the Cut-off Date, after application of all payments of principal due during or prior to February 2025. |
| (2) | With respect to any mortgage loan that is part of a whole loan, unless otherwise indicated, all LTV, DSCR and Debt Yield calculations in this Term Sheet include any related pari passu companion loans and exclude any subordinate companion loans and/or mezzanine loans, as applicable. Additionally, LTV, DSCR and Debt Yield figures in this Term Sheet are calculated for mortgage loans without regard to any additional indebtedness that may be incurred at a future date. For mortgaged properties securing residential cooperative mortgage loans all LTV, DSCR and Debt Yield calculations do not take into account any subordinate debt (whether or not secured by the related mortgaged property), that currently exists or is allowed under the terms of any mortgage loan. |
| (3) | The LTV ratios set forth in this Term Sheet are generally based on the “as-is” values of the related mortgaged properties; provided that the “as-is” value for a portfolio of mortgaged properties may include a premium relating to the valuation of the mortgaged properties as a whole rather than as the sum of individually valued mortgaged properties; provided, further, that such LTV ratios may be based on “as-stabilized”, “as complete” or other contingent values in certain cases in which reserves have been established at origination for the applicable condition or circumstance that is expected to result in stabilization provided, further, that such LTV ratios may have been calculated based on a principal balance that is net of a holdback or earnout reserve. See the definition of “Appraised Value” under “Description of the Mortgage Pool—Certain Calculations and Definitions” in the Preliminary Prospectus. |
| (4) | Excludes multifamily, self storage, manufactured housing and hospitality properties. |
| THE INFORMATION IN THIS STRUCTURAL AND COLLATERAL TERM SHEET IS NOT COMPLETE AND MAY BE AMENDED PRIOR TO THE TIME OF SALE. THIS TERM SHEET IS NOT AN OFFER TO SELL THESE SECURITIES AND IT IS NOT A SOLICITATION OF AN OFFER TO BUY THESE SECURITIES IN ANY JURISDICTION WHERE THE OFFER OR SALE IS NOT PERMITTED. | ||
| T-22 | ||
| BANK5 2025-5YR13 | Characteristics of the Mortgage Loans |
| Top 10 Mortgage Loans(1) | |||||||||||||
| Loan No. | Mortgage Loan Seller | Property Name | City | State | Property Type | Cut-off Date Balance | % of Pool | SF/Rooms/ Units | Cut-off Date Balance per SF/Room/Units | UW NCF DSCR | UW NOI Debt Yield | Cut-off Date LTV | Maturity Date LTV |
| 1 | JPMCB/BANA/WFB | The Spiral | New York | NY | Office | $73,500,000 | 9.97% | 2,844,343 | $730.12 | 1.99x | 11.4% | 45.1% | 45.1% |
| 2 | BANA | Gateway Center North | Brooklyn | NY | Retail | $73,500,000 | 9.97% | 601,212 | $498.99 | 1.20x | 8.5% | 67.7% | 67.7% |
| 3 | WFB | The Plaza at Walnut Creek | Walnut Creek | CA | Office | $73,500,000 | 9.97% | 352,870 | $275.46 | 2.66x | 18.2% | 59.8% | 59.8% |
| 4 | BANA | Storage Depot - Virginia Beach | Virginia Beach | VA | Self Storage | $51,500,000 | 7.0% | 388,718 | $132.49 | 1.24x | 8.4% | 67.1% | 67.1% |
| 5 | JPMCB | AHIP Hotel Portfolio | Various | Various | Hospitality | $43,000,000 | 5.8% | 554 | $77,617.33 | 1.78x | 15.8% | 55.2% | 55.2% |
| 6 | WFB | Green Caye Village | Dickinson | TX | Mixed Use | $40,000,000 | 5.4% | 894 | $44,742.73 | 1.31x | 8.8% | 53.4% | 53.4% |
| 7 | MSMCH | Sheraton Imperial Raleigh Durham | Durham | NC | Hospitality | $35,000,000 | 4.7% | 331 | $105,740.18 | 1.91x | 16.0% | 64.8% | 64.8% |
| 8 | JPMCB | Crowne Plaza North Augusta | North Augusta | SC | Hospitality | $29,000,000 | 3.9% | 180 | $161,111.11 | 1.86x | 16.4% | 67.1% | 67.1% |
| 9 | MSMCH | ExchangeRight Net Leased Portfolio #69 | Various | Various | Retail | $28,890,300 | 3.9% | 224,189 | $128.87 | 1.81x | 11.3% | 53.0% | 53.0% |
| 10 | MSMCH | Rockaway Hotel and Spa | Rockaway Park | NY | Hospitality | $28,750,000 | 3.9% | 61 | $471,311.48 | 1.44x | 13.3% | 55.3% | 55.3% |
| Total/Wtd. Avg. | $476,640,300 | 64.7% | 1.76x | 12.6% | 58.7% | 58.7% | |||||||
| (1) | With respect to any mortgage loan that is part of a whole loan, unless otherwise indicated, all LTV, DSCR, Debt Yield and Balance per SF/Room/Units calculations in this Term Sheet include any related pari passu companion loans and exclude any subordinate companion loans and/or mezzanine loans, as applicable. Additionally, LTV, DSCR, Debt Yield and Balance per SF/Room/Units figures in this Term Sheet are calculated for mortgage loans without regard to any additional indebtedness that may be incurred at a future date. |
| THE INFORMATION IN THIS STRUCTURAL AND COLLATERAL TERM SHEET IS NOT COMPLETE AND MAY BE AMENDED PRIOR TO THE TIME OF SALE. THIS TERM SHEET IS NOT AN OFFER TO SELL THESE SECURITIES AND IT IS NOT A SOLICITATION OF AN OFFER TO BUY THESE SECURITIES IN ANY JURISDICTION WHERE THE OFFER OR SALE IS NOT PERMITTED. | ||
| T-23 | ||
| BANK5 2025-5YR13 | Characteristics of the Mortgage Loans |
| Mortgage Loans with Pari Passu Companion Loans | ||||||||||||
| Loan No. | Mortgage Loan Seller | Property Name | Mortgage Loan Cut-off Date Balance | Aggregate Pari Passu Companion Loan Cut-off Date Balance | Combined Cut-off Date Balance | Lead Servicing Agreement | Master Servicer | Special Servicer | Control Rights | Combined UW NCF DSCR(1) | Combined UW NOI Debt Yield(1) | Combined Cut-off Date LTV(1) |
| 1 | JPMCB/BANA/WFB | The Spiral | $73,500,000 | $2,003,200,000 | $2,076,700,000 | Hudson Yards 2025-SPRL | Wells Fargo | Midland | Hudson Yards 2025-SPRL | 1.99x | 11.4% | 45.1% |
| 2 | BANA | Gateway Center North | $73,500,000 | $226,500,000 | $300,000,000 | BANK5 2024-5YR11 | Wells Fargo | Midland | BANK5 2024-5YR11 | 1.20x | 8.5% | 67.7% |
| 3 | WFB | The Plaza at Walnut Creek | $73,500,000 | $23,700,000 | $97,200,000 | BANK5 2025-5YR13 | Wells Fargo | K-Star | BANK5 2025-5YR13 | 2.66x | 18.2% | 59.8% |
| 13 | WFB | Radius at Harbor Bay | $24,979,960 | $186,850,104 | $211,830,064 | WFCM 2025-5C3 | Wells Fargo | Argentic Services Company LP | WFCM 2025-5C3 | 1.45x | 10.7% | 67.0% |
| (1) | DSCR, Debt Yield and LTV calculations include any related pari passu companion loans and exclude any subordinate companion loans and/or mezzanine loans, as applicable. |
| THE INFORMATION IN THIS STRUCTURAL AND COLLATERAL TERM SHEET IS NOT COMPLETE AND MAY BE AMENDED PRIOR TO THE TIME OF SALE. THIS TERM SHEET IS NOT AN OFFER TO SELL THESE SECURITIES AND IT IS NOT A SOLICITATION OF AN OFFER TO BUY THESE SECURITIES IN ANY JURISDICTION WHERE THE OFFER OR SALE IS NOT PERMITTED. | ||
| T-24 | ||
| BANK5 2025-5YR13 | Characteristics of the Mortgage Loans |
| Prior Securitization History(1) | ||||||||||||||
| Loan No. | Mortgage Loan Seller | Property Name | City | State | Property Type | Cut-off Date Balance | % of Pool | SF/Units/Rooms /Beds/Spaces | Cut-off Date Balance per SF/Unit/Rooms/Beds | UW NCF DSCR | UW NOI Debt Yield | Cut-off Date LTV | Maturity Date LTV | Prior Securitization |
| 2 | BANA | Gateway Center North | Brooklyn | NY | Retail | $73,500,000 | 9.97% | 601,212 | $498.99 | 1.20x | 8.5% | 67.7% | 67.7% | WFRBS 2014-C24 |
| 6 | WFB | Green Caye Village | Dickinson | TX | Mixed Use | $40,000,000 | 5.4% | 894 | $44,742.73 | 1.31x | 8.8% | 53.4% | 53.4% | MF1 2022-FL8 |
| 12 | BANA | Maritime Hotel | New York | NY | Hospitality | $26,000,000 | 3.5% | 126 | $206,349.21 | 3.34x | 22.0% | 34.7% | 34.7% | COMM 2015-DC1 |
| 17 | BANA | US Storage Centers - Chatsworth | Chatsworth | CA | Self Storage | $15,100,000 | 2.0% | 89,655 | $168.42 | 1.90x | 12.1% | 48.2% | 48.2% | MSBAM 2015-C20 |
| 20 | JPMCB | 321 Starr Street | Brooklyn | NY | Retail | $12,500,000 | 1.7% | 28,874 | $432.92 | 1.34x | 10.4% | 62.3% | 62.3% | LCCM 2021-FL2 |
| 25 | JPMCB | Carriage House | Ithaca | NY | Multifamily | $6,500,000 | 0.9% | 104 | $62,500.00 | 2.17x | 15.3% | 43.6% | 43.6% | FREMF 2014-K39 |
| 27 | BANA | US Storage Centers - Stanton | Stanton | CA | Self Storage | $3,300,000 | 0.4% | 68,374 | $48.26 | 7.44x | 45.3% | 13.7% | 13.7% | CSAIL 2015-C1 |
| 28 | BANA | US Storage Centers - Cerritos | Cerritos | CA | Self Storage | $3,100,000 | 0.4% | 60,476 | $51.26 | 7.04x | 44.5% | 13.6% | 13.6% | CSAIL 2015-C1 |
| 31 | BANA | US Storage Centers - Irwindale | Irwindale | CA | Self Storage | $2,400,000 | 0.3% | 35,252 | $68.08 | 6.33x | 39.6% | 17.1% | 17.1% | CSAIL 2015-C1 |
| Total | $182,400,000 | 24.7% | ||||||||||||
| (1) | Includes mortgage loans for which all or a portion of the previously existing debt was most recently securitized in conduit securitizations, based on information provided by the related borrower or obtained through searches of a third-party database. The information has not otherwise been confirmed by the mortgage loan sellers. With respect to any mortgage loan that is part of a whole loan, unless otherwise indicated, all LTV, DSCR, Debt Yield and Cut-off Date Balance per SF/Unit/Rooms/Beds calculations include any related pari passu companion loans and exclude any related subordinate companion loans and/or mezzanine loans, as applicable. |
| THE INFORMATION IN THIS STRUCTURAL AND COLLATERAL TERM SHEET IS NOT COMPLETE AND MAY BE AMENDED PRIOR TO THE TIME OF SALE. THIS TERM SHEET IS NOT AN OFFER TO SELL THESE SECURITIES AND IT IS NOT A SOLICITATION OF AN OFFER TO BUY THESE SECURITIES IN ANY JURISDICTION WHERE THE OFFER OR SALE IS NOT PERMITTED. | ||
| T-25 | ||
| BANK5 2025-5YR13 | Characteristics of the Mortgage Loans |
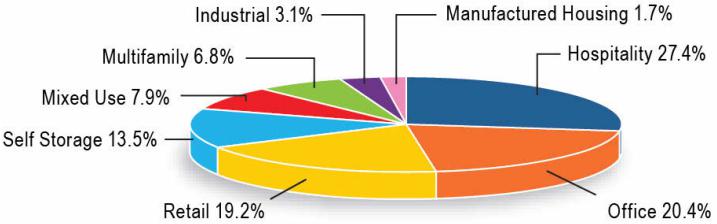
| Property Type Distribution(1) | ||||||||
| Property Type | Number of Mortgaged Properties | Aggregate Cut-off Date Balance | % of Pool | Wtd. Avg. Mortgage Rate | Wtd. Avg. UW NCF DSCR | Wtd. Avg. UW NOI Debt Yield | Wtd. Avg. Cut-off Date LTV | Wtd. Avg. Maturity Date LTV |
| Hospitality | 11 | $201,750,000 | 27.4% | 7.2232% | 1.94 | 16.0% | 57.1% | 56.9% |
| Full Service | 4 | $118,750,000 | 16.1% | 7.0414% | 2.10 | 16.8% | 56.5% | 56.5% |
| Limited Service | 4 | $46,082,798 | 6.3% | 7.6412% | 1.67 | 15.2% | 58.0% | 56.9% |
| Select Service | 2 | $24,166,239 | 3.3% | 7.1047% | 1.74 | 14.2% | 59.6% | 59.6% |
| Extended Stay | 1 | $12,750,963 | 1.7% | 7.6300% | 1.78 | 15.8% | 55.2% | 55.2% |
| Office | 3 | $150,530,215 | 20.4% | 6.0507% | 2.30 | 14.7% | 52.8% | 52.7% |
| Suburban | 2 | $77,030,215 | 10.5% | 6.5764% | 2.60 | 17.9% | 60.1% | 59.9% |
| CBD | 1 | $73,500,000 | 9.97% | 5.4997% | 1.99 | 11.4% | 45.1% | 45.1% |
| Retail | 15 | $141,390,300 | 19.2% | 6.7474% | 1.42 | 9.9% | 61.8% | 61.8% |
| Anchored | 3 | $101,000,000 | 13.7% | 6.9392% | 1.23 | 8.9% | 65.8% | 65.8% |
| Single Tenant | 12 | $40,390,300 | 5.5% | 6.2679% | 1.90 | 12.5% | 52.0% | 52.0% |
| Self Storage | 8 | $99,800,000 | 13.5% | 6.6007% | 1.88 | 12.4% | 58.2% | 58.2% |
| Self Storage | 8 | $99,800,000 | 13.5% | 6.6007% | 1.88 | 12.4% | 58.2% | 58.2% |
| Mixed Use | 9 | $58,459,481 | 7.9% | 6.3251% | 1.35 | 9.4% | 57.7% | 56.4% |
| Multifamily/RV Park/Manufactured Housing/Self Storage | 1 | $40,000,000 | 5.4% | 6.4170% | 1.31 | 8.8% | 53.4% | 53.4% |
| R&D/Lab/Office | 8 | $18,459,481 | 2.5% | 6.1260% | 1.45 | 10.7% | 67.0% | 62.9% |
| Multifamily | 9 | $49,815,000 | 6.8% | 6.7884% | 1.47 | 10.5% | 56.0% | 56.0% |
| Garden | 8 | $46,750,000 | 6.3% | 6.7901% | 1.49 | 10.6% | 55.4% | 55.4% |
| Mid Rise | 1 | $3,065,000 | 0.4% | 6.7620% | 1.22 | 8.5% | 65.2% | 65.2% |
| Industrial | 2 | $22,990,264 | 3.1% | 6.7471% | 1.55 | 11.5% | 58.4% | 57.9% |
| Warehouse/Distribution | 1 | $20,000,000 | 2.7% | 6.8400% | 1.57 | 11.6% | 57.1% | 57.1% |
| R&D | 1 | $2,990,264 | 0.4% | 6.1260% | 1.45 | 10.7% | 67.0% | 62.9% |
| Manufactured Housing | 2 | $12,355,000 | 1.7% | 6.7694% | 1.42 | 10.0% | 63.3% | 63.3% |
| Manufactured Housing | 2 | $12,355,000 | 1.7% | 6.7694% | 1.42 | 10.0% | 63.3% | 63.3% |
| Total/Wtd. Avg. | 59 | $737,090,260 | 100.0% | 6.6851% | 1.81 | 12.9% | 57.4% | 57.2% |
| (1) | All numerical information concerning the mortgage loans is approximate and, in the case of mortgage loans secured by multiple properties, is based on allocated loan amounts with respect to such properties. All weighted average information regarding the mortgage loans reflects the weighting of the mortgage loans based on their outstanding principal balances as of the Cut-off Date or, in the case of mortgage loans secured by multiple properties, allocated loan amounts. The sum of numbers and percentages in columns may not match the “Total” due to rounding. With respect to any mortgage loan that is part of a whole loan, unless otherwise indicated, all LTV, DSCR and Debt Yield calculations include any related pari passu companion loans and exclude any related subordinate companion loans and/or mezzanine loans, as applicable. For mortgaged properties securing residential cooperative mortgage loans, the UW NCF DSCR and UW NOI Debt Yield for each such mortgaged property is calculated using underwritten net operating income or underwritten net cash flow, as applicable, for the related residential cooperative property which is the projected net operating income or net cash flow, as applicable, reflected in the most recent appraisal obtained by or otherwise in the possession of the related mortgage loan seller as of the Cut-off Date. LTV calculations are based upon the appraised value of the residential cooperative property determined as if such residential cooperative property is operated as a residential cooperative, inclusive of the amount of the underlying debt encumbering such residential cooperative property. The UW NCF DSCR, UW NOI Debt Yield and LTV calculations do not take into account any subordinate debt (whether or not secured by the related mortgaged property), that currently exists or is allowed under the terms of any mortgage loan. |
| THE INFORMATION IN THIS STRUCTURAL AND COLLATERAL TERM SHEET IS NOT COMPLETE AND MAY BE AMENDED PRIOR TO THE TIME OF SALE. THIS TERM SHEET IS NOT AN OFFER TO SELL THESE SECURITIES AND IT IS NOT A SOLICITATION OF AN OFFER TO BUY THESE SECURITIES IN ANY JURISDICTION WHERE THE OFFER OR SALE IS NOT PERMITTED. | ||
| T-26 | ||
| BANK5 2025-5YR13 | Characteristics of the Mortgage Loans |
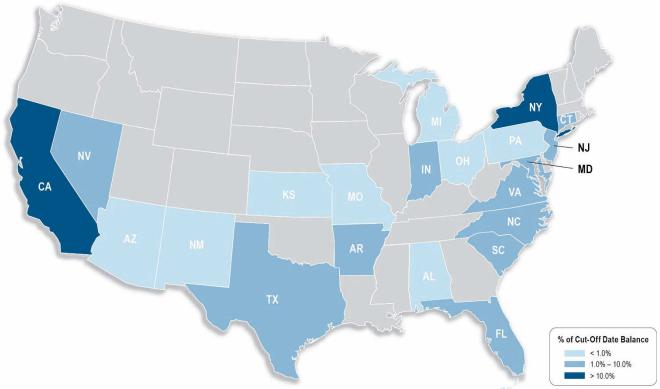
| Geographic Distribution(1) | ||||||||
| State or Other Jurisdiction | Number of Mortgaged Properties | Aggregate Cut-off Date Balance | % of Pool | Wtd. Avg. Mortgage Rate | Wtd. Avg. UW NCF DSCR | Wtd. Avg. UW NOI Debt Yield | Wtd. Avg. Cut-off Date LTV | Wtd. Avg. Maturity Date LTV |
| New York | 8 | 238,815,000 | 32.4% | 6.4163% | 1.74 | 11.8% | 54.1% | 54.1% |
| California | 16 | 134,129,960 | 18.2% | 6.4589% | 2.51 | 17.0% | 55.6% | 54.9% |
| California – Northern(2) | 11 | 98,479,960 | 13.4% | 6.4783% | 2.35 | 16.3% | 61.6% | 60.6% |
| California – Southern(2) | 5 | 35,650,000 | 4.8% | 6.4056% | 2.95 | 18.9% | 39.0% | 39.0% |
| Virginia | 2 | 67,000,000 | 9.1% | 6.6872% | 1.35 | 9.5% | 65.9% | 65.9% |
| North Carolina | 3 | 62,950,000 | 8.5% | 7.0149% | 1.75 | 14.0% | 61.9% | 61.9% |
| Indiana | 8 | 62,446,286 | 8.5% | 7.0021% | 1.54 | 12.1% | 60.1% | 59.3% |
| Texas | 1 | 40,000,000 | 5.4% | 6.4170% | 1.31 | 8.8% | 53.4% | 53.4% |
| South Carolina | 2 | 32,550,037 | 4.4% | 7.6097% | 1.85 | 15.8% | 65.6% | 65.6% |
| Connecticut | 2 | 20,166,239 | 2.7% | 7.1225% | 1.97 | 15.6% | 52.0% | 52.0% |
| New Jersey | 1 | 12,750,963 | 1.7% | 7.6300% | 1.78 | 15.8% | 55.2% | 55.2% |
| Nevada | 1 | 12,600,000 | 1.7% | 6.9050% | 1.36 | 9.7% | 57.8% | 57.8% |
| Florida | 2 | 11,360,071 | 1.5% | 7.0173% | 1.59 | 12.8% | 59.7% | 59.7% |
| Maryland | 1 | 10,818,999 | 1.5% | 7.6300% | 1.78 | 15.8% | 55.2% | 55.2% |
| Arkansas | 1 | 8,800,000 | 1.2% | 6.8260% | 1.36 | 9.5% | 67.7% | 67.7% |
| Arizona | 1 | 4,928,037 | 0.7% | 6.0800% | 1.81 | 11.3% | 53.0% | 53.0% |
| Pennsylvania | 1 | 3,808,728 | 0.5% | 7.6300% | 1.78 | 15.8% | 55.2% | 55.2% |
| Michigan | 3 | 3,426,208 | 0.5% | 6.0800% | 1.81 | 11.3% | 53.0% | 53.0% |
| Ohio | 1 | 3,311,537 | 0.4% | 6.0800% | 1.81 | 11.3% | 53.0% | 53.0% |
| Missouri | 1 | 3,000,000 | 0.4% | 7.2200% | 1.42 | 10.9% | 59.1% | 59.1% |
| Alabama | 2 | 2,157,822 | 0.3% | 6.0800% | 1.81 | 11.3% | 53.0% | 53.0% |
| New Mexico | 1 | 1,090,836 | 0.1% | 6.0800% | 1.81 | 11.3% | 53.0% | 53.0% |
| Kansas | 1 | 979,537 | 0.1% | 6.0800% | 1.81 | 11.3% | 53.0% | 53.0% |
| Total/Wtd. Avg. | 59 | $737,090,260 | 100.0% | 6.6851% | 1.81 | 12.9% | 57.4% | 57.2% |
| (1) | All numerical information concerning the mortgage loans is approximate and, in the case of mortgage loans secured by multiple properties, is based on allocated loan amounts with respect to such properties. All weighted average information regarding the mortgage loans reflects the weighting of the mortgage loans based on their outstanding principal balances as of the Cut-off Date or, in the case of mortgage loans secured by multiple properties, allocated loan amounts. The sum of numbers and percentages in columns may not match the “Total” due to rounding. With respect to any mortgage loan that is part of a whole loan, unless otherwise indicated, all LTV, DSCR and Debt Yield calculations include any related pari passu companion loans and exclude any related subordinate companion loans and/or mezzanine loans, as applicable. For mortgaged properties securing residential cooperative mortgage loans, the UW NCF DSCR and UW NOI Debt Yield for each such mortgaged property is calculated using underwritten net operating income or underwritten net cash flow, as applicable, for the related residential cooperative property which is the projected net operating income or net cash flow, as applicable, reflected in the most recent appraisal obtained by or otherwise in the possession of the related mortgage loan seller as of the Cut-off Date. LTV calculations are based upon the appraised value of the residential cooperative property determined as if such residential cooperative property is operated as a residential cooperative, inclusive of the amount of the underlying debt encumbering such residential cooperative property. |
| (2) | “California – Northern” includes zip codes above 93600, and “California – Southern” includes zip codes at or below 93600. |
| THE INFORMATION IN THIS STRUCTURAL AND COLLATERAL TERM SHEET IS NOT COMPLETE AND MAY BE AMENDED PRIOR TO THE TIME OF SALE. THIS TERM SHEET IS NOT AN OFFER TO SELL THESE SECURITIES AND IT IS NOT A SOLICITATION OF AN OFFER TO BUY THESE SECURITIES IN ANY JURISDICTION WHERE THE OFFER OR SALE IS NOT PERMITTED. | ||
| T-27 | ||
| BANK5 2025-5YR13 | Collateral Statistics |
Collateral Statistics(1)
Cut-off Date Balance ($)
| No. of Mortgage Loans | Aggregate Cut-off Date Balance ($) | % of Pool | |||
| 2,400,000-9,999,999 | 9 | 42,520,000 | 5.8 | ||
| 10,000,000-19,999,999 | 7 | 93,950,000 | 12.7 | ||
| 20,000,000-29,999,999 | 8 | 210,620,260 | 28.6 | ||
| 30,000,000-39,999,999 | 1 | 35,000,000 | 4.7 | ||
| 40,000,000-49,999,999 | 2 | 83,000,000 | 11.3 | ||
| 50,000,000-73,500,000 | 4 | 272,000,000 | 36.9 | ||
| Total: | 31 | $737,090,260 | 100.0 | % | |
| Min: $2,400,000 | Max: $73,500,000 | Avg: $23,777,105 | |||
State or Other Jurisdiction(2)
| No. of Mortgaged Properties | Aggregate Cut-off Date Balance ($) | % of Pool |
| |
| New York | 8 | 238,815,000 | 32.4 | |
| California | 16 | 134,129,960 | 18.2 | |
| California – Northern(3) | 11 | 98,479,960 | 13.4 | |
| California – Southern(3) | 5 | 35,650,000 | 4.8 | |
| Virginia | 2 | 67,000,000 | 9.1 | |
| North Carolina | 3 | 62,950,000 | 8.5 | |
| Indiana | 8 | 62,446,286 | 8.5 | |
| Texas | 1 | 40,000,000 | 5.4 | |
| South Carolina | 2 | 32,550,037 | 4.4 | |
| Connecticut | 2 | 20,166,239 | 2.7 | |
| New Jersey | 1 | 12,750,963 | 1.7 | |
| Nevada | 1 | 12,600,000 | 1.7 | |
| Florida | 2 | 11,360,071 | 1.5 | |
| Maryland | 1 | 10,818,999 | 1.5 | |
| Arkansas | 1 | 8,800,000 | 1.2 | |
| Arizona | 1 | 4,928,037 | 0.7 | |
| Pennsylvania | 1 | 3,808,728 | 0.5 | |
| Michigan | 3 | 3,426,208 | 0.5 | |
| Ohio | 1 | 3,311,537 | 0.4 | |
| Missouri | 1 | 3,000,000 | 0.4 | |
| Alabama | 2 | 2,157,822 | 0.3 | |
| New Mexico | 1 | 1,090,836 | 0.1 | |
| Kansas | 1 | 979,537 | 0.1 | |
| Total: | 59 | $737,090,260 | 100.0 | % |
Property Type(2)
| No. of Mortgaged Properties | Aggregate Cut-off Date Balance ($) | % of Pool | ||
| Hospitality | 11 | 201,750,000 | 27.4 | |
| Full Service | 4 | 118,750,000 | 16.1 | |
| Limited Service | 4 | 46,082,798 | 6.3 | |
| Select Service | 2 | 24,166,239 | 3.3 | |
| Extended Stay | 1 | 12,750,963 | 1.7 | |
| Office | 3 | 150,530,215 | 20.4 | |
| Suburban | 2 | 77,030,215 | 10.5 | |
| CBD | 1 | 73,500,000 | 9.97 | |
| Retail | 15 | 141,390,300 | 19.2 | |
| Anchored | 3 | 101,000,000 | 13.7 | |
| Single Tenant | 12 | 40,390,300 | 5.5 | |
| Self Storage | 8 | 99,800,000 | 13.5 | |
| Self Storage | 8 | 99,800,000 | 13.5 | |
| Mixed Use | 9 | 58,459,481 | 7.9 | |
| Various(4) | 1 | 40,000,000 | 5.4 | |
| R&D/Lab/Office | 8 | 18,459,481 | 2.5 | |
| Multifamily | 9 | 49,815,000 | 6.8 | |
| Garden | 8 | 46,750,000 | 6.3 | |
| Mid Rise | 1 | 3,065,000 | 0.4 | |
| Industrial | 2 | 22,990,264 | 3.1 | |
| Warehouse/Distribution | 1 | 20,000,000 | 2.7 | |
| R&D | 1 | 2,990,264 | 0.4 | |
| Manufactured Housing | 2 | 12,355,000 | 1.7 | |
| Manufactured Housing | 2 | 12,355,000 | 1.7 | |
| Total: | 59 | $737,090,260 | 100 | .0% |
Mortgage Rate (%)
| No. of Mortgage Loans | Aggregate Cut-off Date Balance ($) | % of Pool | |||
| 5.4997 - 6.4990 | 10 | 221,675,260 | 30.1 | ||
| 6.5000 - 6.9990 | 12 | 316,715,000 | 43.0 | ||
| 7.0000 - 7.4990 | 6 | 102,200,000 | 13.9 | ||
| 7.5000 - 7.7970 | 3 | 96,500,000 | 13.1 | ||
| Total: | 31 | $737,090,260 | 100.0 | % | |
| Min: 5.4997% | Max: 7.7970% | Wtd Avg: 6.6851% | |||
Original Term to Maturity or ARD (mos.)
| No. of Mortgage Loans | Aggregate Cut-off Date Balance ($) | % of Pool | |||
| 60 | 31 | $737,090,260 | 100.0% | ||
| Total: | 31 | $737,090,260 | 100.0% | ||
| Min: 60 mos. | Max: 60 mos. | Wtd Avg: 60 mos. | |||
Remaining Term to Maturity or ARD (mos.)
| No. of Mortgage Loans | Aggregate Cut-off Date Balance ($) | % of Pool | |||
| 54 - 57 | 2 | 76,565,000 | 10.4% | ||
| 58 - 60 | 29 | 660,525,260 | 89.6% | ||
| Total: | 31 | $737,090,260 | 100.0% | ||
| Min: 54 mos. | Max: 60 mos. | Wtd Avg: 59 mos. | |||
Original Amortization Term (mos.)
| No. of Mortgage Loans | Aggregate Cut-off Date Balance ($) | % of Pool | |||
| Interest Only | 29 | 687,610,300 | 93.3 | ||
| 360 | 2 | 49,479,960 | 6.7 | ||
| Total: | 31 | $737,090,260 | 100.0 | % | |
| Min: 360 | Max: 360 | Wtd Avg: 359 | |||
Remaining Amortization Term (mos.)
| No. of Mortgage Loans | Aggregate Cut-off Date Balance ($) | % of Pool | |||
| Interest Only | 29 | 687,610,300 | 93.3 | ||
| 359 - 360 | 2 | 49,479,960 | 6.7 | ||
| Total: | 31 | $737,090,260 | 100.0 | % | |
| Min: 359 | Max: 360 | Wtd Avg: 359 | |||
Mortgage Loan Sellers
| No. of Mortgage Loans | Aggregate Cut-off Date Balance ($) | % of Pool | |||
| JPMCB | 6 | 130,500,000 | 17.7 | ||
| BANA | 10 | 201,415,000 | 27.3 | ||
| WFB | 5 | 159,029,960 | 21.6 | ||
| MSMCH | 9 | 172,645,300 | 23.4 | ||
| JPMCB/BANA/WFB | 1 | 73,500,000 | 9.97 | ||
| Total: | 31 | $737,090,260 | 100.0% | ||
Amortization Type
| No. of Mortgage Loans | Aggregate Cut-off Date Balance ($) | % of Pool | ||
| Interest Only | 29 | 687,610,300 | 93.3 | |
| Amortizing Balloon | 1 | 24,979,960 | 3.4 | |
| Interest Only, Amortizing Balloon | 1 | 24,500,000 | 3.3 | |
| Total: | 31 | $737,090,260 | 100.0 | % |
Cut-off Date LTV Ratio (%)
| No. of Mortgage Loans | Aggregate Cut-off Date Balance ($) | % of Pool | ||
| 13.6 - 49.9 | 9 | 153,150,000 | 20.8 | |
| 50.0 - 54.9 | 2 | 68,890,300 | 9.3 | |
| 55.0 - 59.9 | 7 | 195,850,000 | 26.6 | |
| 60.0 - 64.9 | 6 | 123,950,000 | 16.8 | |
| 65.0 - 67.7 | 7 | 195,249,960 | 26.5 | |
| Total: | 31 | $737,090,260 | 100.0 | % |
| Min: 13.6% | Max: 67.7% | Wtd Avg: 57.4 | % | |
Maturity Date or ARD LTV Ratio (%)
| No. of Mortgage Loans | Aggregate Cut-off Date Balance ($) | % of Pool | ||
| 13.6 - 49.9 | 9 | 153,150,000 | 20.8 | |
| 50.0 - 59.9 | 10 | 289,240,300 | 39.2 | |
| 60.0 - 64.9 | 6 | 124,429,960 | 16.9 | |
| 65.0 - 67.7 | 6 | 170,270,000 | 23.1 | |
| Total: | 31 | $737,090,260 | 100.0 | % |
| Min: 13.6% | Max: 67.7% | Wtd Avg: 57.2 | % | |
UW NCF DSCR (x)
| No. of Mortgage Loans | Aggregate Cut-off Date Balance ($) | % of Pool | ||
| 1.20 - 1.49 | 15 | 326,299,960 | 44.3 | |
| 1.50 - 1.99 | 9 | 284,490,300 | 38.6 | |
| 2.00 - 2.49 | 2 | 18,000,000 | 2.4 | |
| 2.50 - 7.44 | 5 | 108,300,000 | 14.7 | |
| Total: | 31 | $737,090,260 | 100.0 | % |
| Min: 1.20x | Max: 7.44x | Wtd Avg: 1.81 | x | |
UW NOI Debt Yield (%)
| No. of Mortgage Loans | Aggregate Cut-off Date Balance ($) | % of Pool | ||
| 8.1 - 9.0 | 5 | 172,470,000 | 23.4 | |
| 9.1 - 10.0 | 4 | 48,150,000 | 6.5 | |
| 10.1 - 11.0 | 5 | 76,929,960 | 10.4 | |
| 11.1 - 12.0 | 3 | 122,390,300 | 16.6 | |
| 12.1 - 13.0 | 1 | 15,100,000 | 2.0 | |
| 13.1 14.0 | 2 | 44,250,000 | 6.0 | |
| 14.1 15.0 | 1 | 24,500,000 | 3.3 | |
| 15.1 16.0 | 4 | 96,000,000 | 13.0 | |
| 16.1 45.3 | 6 | 137,300,000 | 18.6 | |
| Total: | 31 | $737,090,260 | 100.0 | % |
| Min: 8.1% | Max: 45.3% | Wtd Avg: 12.9 | % | |
| (1) | All numerical information concerning the mortgage loans is approximate. All weighted average information regarding the mortgage loans reflects the weighting of the mortgage loans based on their outstanding principal balances as of the Cut-off Date. The sum of numbers and percentages in columns may not match the “Total” due to rounding. With respect to any mortgage loan that is part of a whole loan, unless otherwise indicated, all LTV, DSCR and Debt Yield calculations include any related pari passu companion loans and exclude any related subordinate companion loans and/or mezzanine loans, as applicable. For mortgaged properties securing residential cooperative mortgage loans, the UW DSCR and UW NOI Debt Yield for each such mortgaged property is calculated using underwritten net operating income or underwritten net cash flow, as applicable, for the related residential cooperative property which is the projected net operating income or net cash flow, as applicable, reflected in the most recent appraisal obtained by or otherwise in the possession of the related mortgage loan seller as of the Cut-off Date. LTV calculations are based upon the appraised value of the residential cooperative property determined as if such residential cooperative property is operated as a residential cooperative, inclusive of the amount of the underlying debt encumbering such residential cooperative property. The UW NCF DSCR, UW NOI Debt Yield and LTV calculations do not take into account any subordinate debt (whether or not secured by the related mortgaged property), that currently exists or is allowed under the terms of any mortgage loan. |
| (2) | In the case of mortgage loans secured by multiple properties, cut-off date balance information is based on allocated loan amounts with respect to such properties. |
| (3) | “California – Northern” includes zip codes above 93600, and “California – Southern” includes zip codes at or below 93600. |
| (4) | One Property is mixed use, with various subtypes including Multifamily/RV Park/Manufactured Housing/Self Storage. |
| THE INFORMATION IN THIS STRUCTURAL AND COLLATERAL TERM SHEET IS NOT COMPLETE AND MAY BE AMENDED PRIOR TO THE TIME OF SALE. THIS TERM SHEET IS NOT AN OFFER TO SELL THESE SECURITIES AND IT IS NOT A SOLICITATION OF AN OFFER TO BUY THESE SECURITIES IN ANY JURISDICTION WHERE THE OFFER OR SALE IS NOT PERMITTED. | ||
| T-28 | ||
| Office – CBD | Loan #1 | Cut-off Date Balance: | $73,500,000 | |
| 66 Hudson Boulevard | The Spiral | Cut-off Date LTV: | 45.1% | |
| New York, NY 10001 | UW NCF DSCR: | 1.99x | ||
| UW NOI Debt Yield: | 11.4% |

| THE INFORMATION IN THIS STRUCTURAL AND COLLATERAL TERM SHEET IS NOT COMPLETE AND MAY BE AMENDED PRIOR TO THE TIME OF SALE. THIS TERM SHEET IS NOT AN OFFER TO SELL THESE SECURITIES AND IT IS NOT A SOLICITATION OF AN OFFER TO BUY THESE SECURITIES IN ANY JURISDICTION WHERE THE OFFER OR SALE IS NOT PERMITTED. | ||
| T-29 | ||
| Office – CBD | Loan #1 | Cut-off Date Balance: | $73,500,000 | |
| 66 Hudson Boulevard | The Spiral | Cut-off Date LTV: | 45.1% | |
| New York, NY 10001 | UW NCF DSCR: | 1.99x | ||
| UW NOI Debt Yield: | 11.4% |
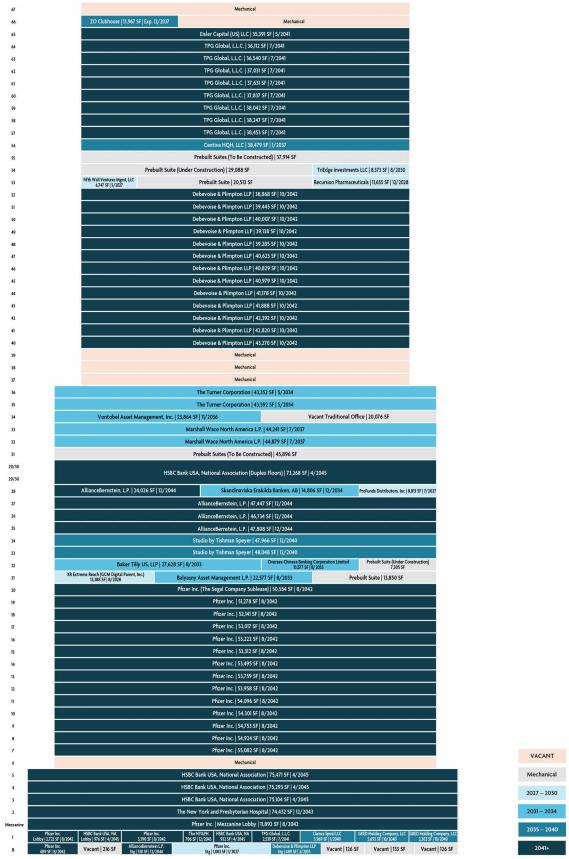
| THE INFORMATION IN THIS STRUCTURAL AND COLLATERAL TERM SHEET IS NOT COMPLETE AND MAY BE AMENDED PRIOR TO THE TIME OF SALE. THIS TERM SHEET IS NOT AN OFFER TO SELL THESE SECURITIES AND IT IS NOT A SOLICITATION OF AN OFFER TO BUY THESE SECURITIES IN ANY JURISDICTION WHERE THE OFFER OR SALE IS NOT PERMITTED. | ||
| T-30 | ||
| Office – CBD | Loan #1 | Cut-off Date Balance: | $73,500,000 | |
| 66 Hudson Boulevard | The Spiral | Cut-off Date LTV: | 45.1% | |
| New York, NY 10001 | UW NCF DSCR: | 1.99x | ||
| UW NOI Debt Yield: | 11.4% |
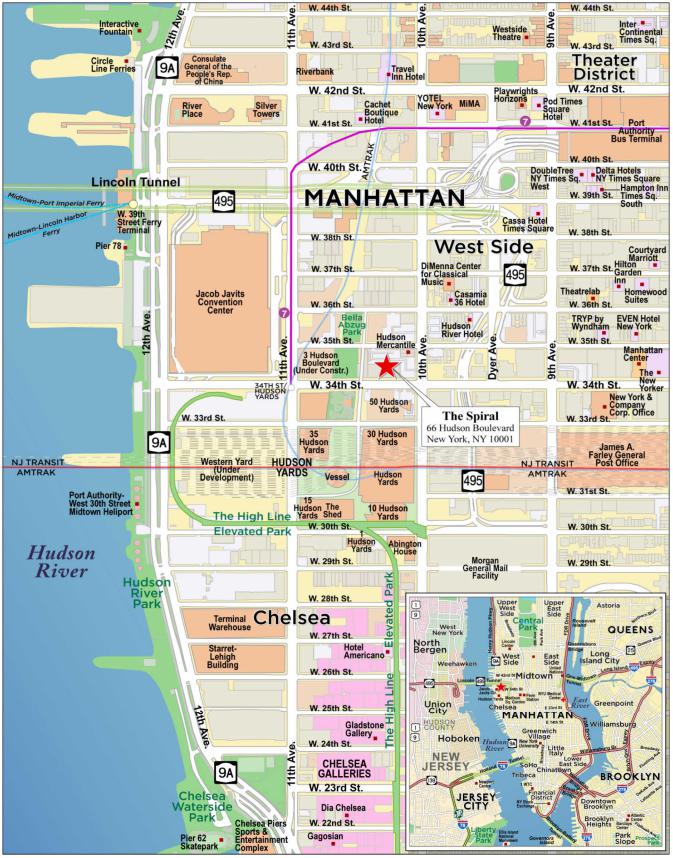
| THE INFORMATION IN THIS STRUCTURAL AND COLLATERAL TERM SHEET IS NOT COMPLETE AND MAY BE AMENDED PRIOR TO THE TIME OF SALE. THIS TERM SHEET IS NOT AN OFFER TO SELL THESE SECURITIES AND IT IS NOT A SOLICITATION OF AN OFFER TO BUY THESE SECURITIES IN ANY JURISDICTION WHERE THE OFFER OR SALE IS NOT PERMITTED. | ||
| T-31 | ||
| Mortgage Loan No. 1 – The Spiral |
| Mortgage Loan Information | Property Information | |||||
| Mortgage Loan Seller: | JPMCB/BANA/WFB | Single Asset/Portfolio: | Single Asset | |||
| Credit Assessment (Fitch/Moody’s/KBRA): | AA-/Aa3/A | Location: | New York, NY 10001 | |||
| Original Balance(1): | $73,500,000 | General Property Type: | Office | |||
| Cut-off Date Balance(1): | $73,500,000 | Detailed Property Type: | CBD | |||
| % of Initial Pool Balance: | 9.97% | Title Vesting: | Fee(7) | |||
| Loan Purpose: | Refinance | Year Built/Renovated: | 2022/NAP | |||
| Borrower Sponsor: | Tishman Speyer Crown | Size: | 2,844,343 SF | |||
| Equities 2007 LLC | Cut-off Date Balance PSF(1): | $730 | ||||
| Guarantor: | NAP | Maturity Date Balance PSF(1): | $730 | |||
| Mortgage Rate(2): | 5.499691075% | Property Manager: | Tishman Speyer Properties, L.L.C. | |||
| Note Date: | 1/9/2025 | (borrower-affiliate) | ||||
| Maturity Date: | 1/9/2030 | |||||
| Term to Maturity: | 60 months | |||||
| Amortization Term: | 0 months | Underwriting and Financial Information | ||||
| IO Period: | 60 months | UW NOI(8): | $236,785,998 | |||
| Seasoning: | 1 month | UW NCF | $230,528,443 | |||
| Prepayment Provisions(3): | L(25),D(28),O(7) | UW NOI Debt Yield(1): | 11.4% | |||
| Lockbox/Cash Mgmt Status: | Hard/Springing | UW NCF Debt Yield(1): | 11.1% | |||
| Additional Debt Type(1): | Pari Passu / Subordinate | UW NOI Debt Yield at Maturity(1): | 11.4% | |||
| Additional Debt Balance(1): | $2,003,200,000 / $773,300,000 | UW NCF DSCR(1): | 1.99x | |||
| Future Debt Permitted (Type)(4): | Yes (Mezzanine) | Most Recent NOI(8): | $72,123,305 (11/30/2024 TTM) | |||
| Reserves(5) | 2nd Most Recent NOI: | NAV (NAV) | ||||
| Type | Initial | Monthly | Cap | 3rd Most Recent NOI: | NAV (NAV) | |
| RE Taxes: | $0 | Springing | NAP | Most Recent Occupancy: | 93.8% (1/1/2025) | |
| Insurance: | $0 | Springing | NAP | 2nd Most Recent Occupancy: | NAV (NAV) | |
| Replacement Reserve: | $0 | Springing | $853,308 | 3rd Most Recent Occupancy: | NAV (NAV) | |
| Leasing Reserve: | $0 | Springing | (6) | Appraised Value (as of)(9): | $4,600,000,000 (12/1/2026) | |
| Specified Tenant Reserve: | $220,726,391 | $0 | NAP | Appraised Value PSF: | $1,617 | |
| Cut-off Date LTV Ratio(1)(9): | 45.1% | |||||
| Maturity Date LTV Ratio(1)(9): | 45.1% | |||||
| Sources and Uses | ||||||
| Sources | Proceeds | % of Total | Uses | Proceeds | % of Total | |
| Mortgage Loan Amount: | $2,076,700,000 | 72.9% | Loan Payoff: | $1,561,081,096 | 54.8% | |
| Subordinate Debt: | $773,300,000 | 27.1% | Return of Equity: | $990,913,460 | 34.8% | |
| Upfront Reserves: | $220,726,391 | 7.7% | ||||
| Closing Costs: | $77,279,053 | 2.7% | ||||
| Total Sources: | $2,850,000,000 | 100.0% | Total Uses: | $2,850,000,000 | 100.0% | |
| (1) | The Spiral Mortgage Loan (as defined below) is part of the Spiral Whole Loan (as defined below), which is comprised of 15 pari passu senior promissory notes and four pari passu junior promissory notes, with an aggregate original principal balance and Cut-off Date Balance of $2,850,000,000. The Cut-off Date Balance PSF, Maturity Date Balance PSF, UW NOI Debt Yield, UW NCF Debt Yield, UW NOI Debt Yield at Maturity, UW NCF DSCR, Cut-off Date LTV Ratio and Maturity Date LTV Ratio presented above are based on the principal balance of the Spiral Senior Notes (as defined below). The Cut-off Date Balance PSF, Maturity Date Balance PSF, UW NOI Debt Yield, UW NCF Debt Yield, UW NOI Debt Yield at Maturity, UW NCF DSCR (based on a weighted average interest rate of (5.73551255157895%) per annum on the Spiral Whole Loan), Cut-off Date LTV Ratio and Maturity Date LTV Ratio for the Spiral Whole Loan are $1,002, $1,002, 8.3%, 8.1%, 8.3%, 1.39x, 62.0% and 62.0%, respectively. See defined term “Weighted Average Interest Rate” set forth under “Description of the Mortgage Pool—Definitions” in the prospectus. |
| (2) | Mortgage Rate represents the Weighted Average Interest Rate of component A and component B of the Spiral Whole Loan applicable to the Spiral Senior Companion Notes (as defined below), weighted on the basis of the respective principal balances of the Spiral Senior Companion Notes. Component A has an interest rate of 5.469840% per annum and component B has an interest rate of 5.761070% per annum. The Mortgage Rate does not represent the weighted average interest rate of component A or component B applicable to the Spiral Senior SASB Notes (as defined below) or component C, component D, component E and component F applicable to the Spiral Junior Notes (as defined below). See defined term “Weighted Average Interest Rate” set forth under “Description of the Mortgage Pool—Definitions” in the prospectus. |
| (3) | Defeasance of the Spiral Whole Loan is permitted at any time after the date that is the earliest to occur of (i) two years after the closing date of the securitization that includes the last note to be securitized and (ii) February 9, 2028. The assumed defeasance lockout period of 25 payments is based on the anticipated closing date of the BANK5 2025-5YR13 securitization trust in February 2025. The actual defeasance lockout period may be longer. |
| (4) | The borrower is permitted to obtain mezzanine financing from a mezzanine lender acceptable to the lender, provided certain conditions are met including, without limitation, the following: (a) the mezzanine financing does not exceed $142,500,000, (b) the aggregate LTV (based on the Spiral Whole Loan and the mezzanine financing) do not exceed 62.0%, (c) the actual combined DSCR must be not less than 1.35x, (d) the actual combined debt yield must be not less than 8.1%. |
| (5) | See “Escrows and Reserves” below for further discussion of reserve requirements. |
| (6) | The Leasing Reserve is capped at an amount equal to the aggregate SF of the applicable Lease Sweep Premises (as defined below) multiplied by $150. |
| (7) | The Spiral Mortgage Loan is secured by the borrower’s fee interest as well as an overlapping leasehold interest of New York City Industrial Development Agency. See “The Property” below for additional information. |
| (8) | The increase in NOI from TTM 11/30/2024 to UW is primarily attributable to recently executed office leases including TPG Global, L.L.C (302,432 SF), HSBC Bank USA, National Association (301,260 SF) and AllianceBernstein L.P. (166,525 SF) and burn-off of associated free rent. |
| (9) | Appraised Value of $4,600,000,000 represents the appraisal’s concluded “As Stabilized” value as of December 1, 2026 and assumes The Spiral Property (as defined below) has achieved a stabilized income by December 1, 2026, when The Spiral Property has no further free rent and tenant improvements and leasing commissions owed in connection with leases executed to date. The appraisal’s concluded “As Is” value as of November 20, 2024 for The Spiral Property is $4,175,000,000 which results in a Cut-off Date LTV Ratio and Maturity Date LTV Ratio for the Spiral Whole Loan of 68.3% and 68.3%, respectively and a Cut-off Date LTV Ratio and Maturity Date LTV Ratio for the Spiral Senior Notes of 49.7% and 49.7%, respectively. |
| THE INFORMATION IN THIS STRUCTURAL AND COLLATERAL TERM SHEET IS NOT COMPLETE AND MAY BE AMENDED PRIOR TO THE TIME OF SALE. THIS TERM SHEET IS NOT AN OFFER TO SELL THESE SECURITIES AND IT IS NOT A SOLICITATION OF AN OFFER TO BUY THESE SECURITIES IN ANY JURISDICTION WHERE THE OFFER OR SALE IS NOT PERMITTED. | ||
| T-32 | ||
| Office – CBD | Loan #1 | Cut-off Date Balance: | $73,500,000 | |
| 66 Hudson Boulevard | The Spiral | Cut-off Date LTV: | 45.1% | |
| New York, NY 10001 | UW NCF DSCR: | 1.99x | ||
| UW NOI Debt Yield: | 11.4% |
The Mortgage Loan. The largest mortgage loan is part of a whole loan with an aggregate outstanding balance of $2,850,000,000 (the “Spiral Whole Loan”) and is comprised of (i) 15 pari passu senior notes with an aggregate outstanding balance of $2,076,700,000 inclusive of Notes A-1, A-2, A-3 and A-4 (the “Spiral Senior SASB Notes”) and Notes A-5-1, A-5-2, A-6-1, A-6-2, A-7, A-8-1, A-8-2, A-9, A-10, A-11 and A-12 (the “Spiral Senior Companion Notes” and, together with the Spiral Senior SASB Notes, the “Spiral Senior Notes”) and (ii) four pari passu junior notes with an outstanding balance of $773,300,000 (the “Spiral Junior Notes”). Among the Spiral Senior Companion Notes are the non-controlling Notes A-5-1, A-6-1 and A-8-1, with an aggregate initial principal balance of $73,500,000, which will be contributed to the BANK5 2025-5YR13 securitization trust (“The Spiral Mortgage Loan”). The Spiral Junior Notes are generally subordinate in right of payment to the Spiral Senior Notes. The Spiral Whole Loan was co-originated by JPMorgan Chase Bank, National Association, Bank of America, National Association (“BANA”), Goldman Sachs Bank USA (“GS Bank”) and Wells Fargo Bank, National Association (“WFB”) on January 9, 2025. The Spiral Whole Loan is secured by a first priority fee mortgage encumbering a 66-story, Class A office tower totaling approximately 2.8 million SF located in New York, NY ("The Spiral Property”). The Spiral Whole Loan is serviced pursuant to the trust and servicing agreement for the Hudson Yards 2025-SPRL securitization. See “Description of the Mortgage Pool—The Whole Loans—The Non-Serviced AB Whole Loan” and “Pooling and Servicing Agreement” in the prospectus. The relationship between the holders of the Spiral Whole Loan is governed by a co-lender agreement as described under “Description of the Mortgage Pool—The Whole Loans— The Non-Serviced Pari Passu Whole Loans” and “The Pooling and Servicing Agreement-Servicing of the Non-Serviced Mortgage Loans” in the prospectus.
The promissory notes comprising the Spiral Whole Loan are summarized in the below table.
| The Spiral Whole Loan Summary | ||||
Note | Original Balance | Cut-off Date Balance | Note Holder | Controlling Piece |
| A-1 | $469,175,000 | $469,175,000 | Hudson Yards 2025-SPRL | Yes |
| A-2 | $469,175,000 | $469,175,000 | Hudson Yards 2025-SPRL | No |
| A-3 | $469,175,000 | $469,175,000 | Hudson Yards 2025-SPRL | No |
| A-4 | $469,175,000 | $469,175,000 | Hudson Yards 2025-SPRL | No |
| A-5-1 | $24,500,000 | $24,500,000 | BANK5 2025-5YR13 | No |
| A-5-2(1) | $500,000 | $500,000 | JPMCB | No |
| A-6-1 | $24,500,000 | $24,500,000 | BANK5 2025-5YR13 | No |
| A-6-2(1) | $500,000 | $500,000 | BANA | No |
| A-7(1) | $25,000,000 | $25,000,000 | GS Bank | No |
| A-8-1 | $24,500,000 | $24,500,000 | BANK5 2025-5YR13 | No |
| A-8-2(1) | $500,000 | $500,000 | WFB | No |
| A-9(1) | $25,000,000 | $25,000,000 | JPMCB | No |
| A-10(1) | $25,000,000 | $25,000,000 | BANA | No |
| A-11(1) | $25,000,000 | $25,000,000 | GS Bank | No |
| A-12(1) | $25,000,000 | $25,000,000 | WFB | No |
| Total Senior Notes | $2,076,700,000 | $2,076,700,000 | ||
| B-1(2) | $193,325,000 | $193,325,000 | Hudson Yards 2025-SPRL | No |
| B-2(2) | $193,325,000 | $193,325,000 | Hudson Yards 2025-SPRL | No |
| B-3(2) | $193,325,000 | $193,325,000 | Hudson Yards 2025-SPRL | No |
| B-4(2) | $193,325,000 | $193,325,000 | Hudson Yards 2025-SPRL | No |
| Total Junior Notes | $773,300,000 | $773,300,000 | ||
| Whole Loan | $2,850,000,000 | $2,850,000,000 | ||
| (1) | Expected to be contributed to one or more future securitization transactions or may otherwise be transferred at any time. | |
| (2) | The Spiral Junior Notes are subordinate in right of payment to the Spiral Senior Notes. |
The Borrower and the Borrower Sponsor. The borrower is 509 W 34, L.L.C., a Delaware limited liability company and single purpose entity with one independent director indirectly owned and controlled by Tishman Speyer Crown Equities 2007 LLC (the “Borrower Sponsor”) and indirectly owned by other investment vehicles managed and controlled by one or more affiliates of Tishman Speyer. There is no separate non-recourse carveout guarantor, and the borrower is the sole indemnitor under the related environmental indemnity agreement. See “Description of the Mortgage Pool—Non Recourse Carveout Limitations” in the prospectus for additional information.
Tishman Speyer is a leading owner, developer, operator and fund manager of first-class real estate. Founded in 1978, Tishman Speyer is active across the United States, Europe, Latin America and Asia, building and managing premier office, residential, life science, industrial, data center and retail space in over 37 key global markets for industry-leading tenants. Signature assets include New York City's Rockefeller Center, The Springs in Shanghai, Paris Bourse in Paris and Frankfurt’s OpernTurm and TaunusTurm. As of September 30, 2024, Tishman Speyer operated and owned a portfolio of over 83 million SF worth approximately $63 billion and currently owns and/or manages 20 assets in the New York metropolitan area totaling approximately 24.7 million SF. Tishman Speyer has major projects in various phases of predevelopment or development in Austin, greater Seattle, Boston, Beijing, Dusseldorf, Hamburg, Los Angeles, Madrid, New York City, Rio de Janeiro, San Diego, San Francisco, São Paulo, Shanghai, Shenzhen and Washington, D.C.
| THE INFORMATION IN THIS STRUCTURAL AND COLLATERAL TERM SHEET IS NOT COMPLETE AND MAY BE AMENDED PRIOR TO THE TIME OF SALE. THIS TERM SHEET IS NOT AN OFFER TO SELL THESE SECURITIES AND IT IS NOT A SOLICITATION OF AN OFFER TO BUY THESE SECURITIES IN ANY JURISDICTION WHERE THE OFFER OR SALE IS NOT PERMITTED. | ||
| T-33 | ||
| Office – CBD | Loan #1 | Cut-off Date Balance: | $73,500,000 | |
| 66 Hudson Boulevard | The Spiral | Cut-off Date LTV: | 45.1% | |
| New York, NY 10001 | UW NCF DSCR: | 1.99x | ||
| UW NOI Debt Yield: | 11.4% |
The Property. The Spiral Property is a 1,031-foot tall, 66-story, Class A office tower totaling approximately 2.8 million SF. Delivered by the Borrower Sponsor in 2022, The Spiral Property was designed by the Bjarke Ingels Group and offers greenery with accessible gardens and fresh air on each tower floor, emphasizing sustainable design with LEED Gold and Fitwel 2-star certifications received in 2023. The Spiral Property is the only building in its competitive set with a dedicated tenant amenity space on the top floor, featuring the ZO Clubhouse, a tenant exclusive lounge with an open-air terrace, Café Llama, an all-day café and state-of-the-art conference and meeting rooms. The Spiral Property caters to multiple large, high-density tenants with vast, nearly column-free floor plates (35,391 SF to 75,471 SF), slab-to-slab heights of 14-18 feet and floor-to-ceiling windows allowing natural light to fill each floor. The podium floors, located on floors 2 through 5, have 18-foot slab heights and set The Spiral Property apart from other Hudson Yards office buildings, which have either no or smaller podium floors. Ground-level amenities include 24/7 executive valet parking available to both tenants and the public, Papa San by The Llama Group, a street-level public restaurant opening in early 2025, two additional street-level public restaurants by 2-star Michelin Chef Gabriel Kreuther also expected to open in 2025, and an on-site bike room complete with a changing room and private showers.
In connection with the development of The Spiral Property, the borrower entered into a “Straight-Lease Transaction” payment in lieu of taxes (“PILOT”) arrangement with the New York City Industrial Development Agency (“NYCIDA”), pursuant to which the borrower leases the entire The Spiral Property to the NYCIDA, and the NYCIDA subleases The Spiral Property back to the borrower. The PILOT commenced in the 2022/23 tax year and expires in 2041/42 tax year. See “Description of the Mortgage Pool—Real Estate and Other Tax Considerations” in the prospectus for additional information.
The Borrower Sponsor acquired all land parcels in 2014 and subsequently signed a lease with anchor tenant Pfizer, Inc. (“Pfizer”) in April 2018, enabling the commencement of vertical construction. Subsequently, Debevoise & Plimpton LLP (“Debevoise”) and AllianceBernstein L.P. (“AB”) both executed leases in 2019, bringing the pre-delivery leasing total to 51.5% of NRA. As these leases were signed prior to 2020, the associated in-place base rents are at a discount to market rents as determined by the appraiser as described herein. The Borrower Sponsor has maintained strong post-COVID leasing momentum and has executed 572,234 SF (20.1% of NRA) of new leases since January 2023, including TPG Global, L.L.C’s (“TPG”) relocation to the Property. TPG’s space represents an expansion of approximately 94,000 SF from its two prior Midtown Manhattan locations and will be the largest TPG-occupied space globally.
As of January 1, 2025, The Spiral Property is 93.8% leased to a premier tenant roster of 22 tenants with a weighted average remaining lease term of 16.7 years across multiple industries. The Spiral Property generates 84.4% of UW Base Rent (77.2% of NRA) from investment-grade rated tenants and Debevoise, a top 50 law firm by gross revenue in 2024. Due to The Spiral Property’s recent delivery, the current rent roll offers long term and durable cash flow, with 91.4% of underwritten base rent attributable to leases expiring beyond 2035. Several of the largest tenants signed 15+ year leases, with none of the top 10 largest tenants’ office space rolling prior to 2034. Additionally, only four office tenants have leases expiring prior to maturity of the Spiral Whole Loan in January 2030 (2.0% of UW Base Rent / 1.4% of NRA) and only 10 office tenants have leases expiring for office space before 2036 (8.6% of underwritten base rent / 7.5% of NRA). Eleven tenants have either their Global or U.S. headquarters at The Spiral Property. Pfizer announced in April 2018 that it would be moving its new headquarters to The Spiral Property, leasing floors 7 through 20 for approximately 2,500 employees. Debevoise opened its headquarters at The Spiral Property in January 2023 to take advantage of the custom-designed space to meet its future needs.
The Spiral Property features 13,864 SF (0.5% of NRA) of prime ground floor retail space leased to three restaurant concepts anticipated to open throughout 2025. Papa San by The Llama Group will showcase Peruvian-Japanese cuisine in an upscale yet comfortable setting and is slated to open in February 2025 under a 15-year management agreement. The Llama Group is jointly owned and run by Juan Correa and Chef Erik Ramirez, focusing on bringing a modern take to Peruvian food. Erik Ramirez is Peruvian-American and has received numerous accolades, including a 3/4-star review from the NYT and a James Beard Foundation finalist for Outstanding North American Chef. Renowned for his 2-star Michelin restaurant in Midtown, Chef Gabriel Kreuther is expected to launch two new restaurants at The Spiral Property. The first concept is an expansive Alsatian brasserie and the second is a European-inspired grab-and-go café. Both restaurants are anticipated to open in late 2025 and are each subject to a 15-year management agreement.
The ZO Clubhouse (13,967 SF; 0.5% of NRA) is situated on the top floor of The Spiral Property, serving as an exclusive tenant lounge and workspace. The ZO Clubhouse features an open-air terrace at its southeast corner offering panoramic city views, a furnished lounge, meeting rooms, event space and a state-of-the-art conference space. The ZO Clubhouse holds a liquor license, with food and beverage services managed by the Llama Group team (Café Llama). Café Llama serves breakfast, lunch and dinner. As tenants continue to occupy the building, activating the amenity through curated social events and speakers has been essential in driving traffic to the floor. ZO is Tishman Speyer’s global amenity network, providing members with access to world class spaces, services and experiences. ZO members at The Spiral Property have access to a variety of benefits in addition to accessing the ZO Clubhouse, including access to (i) work and lounge spaces across the Tishman Speyer portfolio, (ii) events and programming including cultural events, speaker panels and happy hours, (iii) access discounts, exclusive perks and special offers at local retailers and partners and (iv) a curated collection of services that leverage local partnerships for excellent hospitality and wellness.
Major Tenants.
Pfizer Inc. (766,586 SF; 27.0% of NRA; 25.3% of underwritten base rent). Pfizer Inc. (NYSE: PFE), a global leader in the pharmaceutical industry, has its global headquarters strategically located at The Spiral. Pfizer was founded by Charles Pfizer and Charles Erhart in 1849 and has grown to become one of the world’s largest research-based pharmaceuticals firms. The United States is Pfizer’s largest market and accounts for about half of all revenues. The company operates in more than 90 international markets, including Japan, Australia, Canada, Finland and South Korea. Major manufacturing facilities are located in several locations including China, Germany, Italy and Japan. Pfizer sells its products in over 125 countries globally. Pfizer is ranked 38th on the Fortune 500 and 39th in the Forbes’ Global 2000. Pfizer’s lease expires in August 2042, with renewal and termination options as detailed in “Tenant Summary” below.
Debevoise & Plimpton LLP (531,211 SF; 18.7% of NRA; 21.0% of underwritten base rent). Debevoise is an international law firm based in New York City, founded in 1931. Debevoise specializes in areas such as private equity, financial services transactions, private funds and international arbitration. The firm operates globally, with approximately 855 lawyers across nine offices, including locations in New York, Washington D.C., London, Hong Kong, Shanghai and Luxembourg. Debevoise's practice is divided into three main areas: Corporate, Litigation and Tax. Debevoise is ranked on The American Lawyer’s 2024 A-List and No. 18 in Vault’s 2024 rankings of prestigious law firms. Debevoise is ranked No. 1 on The American Lawyer's "10-Year A-List" for its consistent performance in revenue, pro bono service, associate satisfaction and diversity. Debevoise’s lease expires in October 2042, with renewal and termination options as detailed in “Tenant Summary” below.
| THE INFORMATION IN THIS STRUCTURAL AND COLLATERAL TERM SHEET IS NOT COMPLETE AND MAY BE AMENDED PRIOR TO THE TIME OF SALE. THIS TERM SHEET IS NOT AN OFFER TO SELL THESE SECURITIES AND IT IS NOT A SOLICITATION OF AN OFFER TO BUY THESE SECURITIES IN ANY JURISDICTION WHERE THE OFFER OR SALE IS NOT PERMITTED. | ||
| T-34 | ||
| Office – CBD | Loan #1 | Cut-off Date Balance: | $73,500,000 | |
| 66 Hudson Boulevard | The Spiral | Cut-off Date LTV: | 45.1% | |
| New York, NY 10001 | UW NCF DSCR: | 1.99x | ||
| UW NOI Debt Yield: | 11.4% |
TPG Global, L.L.C (302,432 SF; 10.6% of NRA; 16.3% of underwritten base rent). TPG Global, L.L.C (NASDAQ: TPG) was founded in 1992 and has grown to become one of the largest alternative asset managers globally, with $239 billion in AUM as of November 4, 2024. TPG is based in Fort Worth, Texas, managing funds in growth capital, venture capital, public equity and debt investments. It invests across a variety of sectors, including consumer goods, media, telecommunications, technology, healthcare and more. TPG employs over 1,800 professionals globally and is responsible for actively managing over 300 active portfolio companies. Additionally, since 2017, TPG has appointed 400 diverse directors to their portfolio companies. TPG’s lease expires in July 2041, with renewal and termination options as detailed in “Tenant Summary” below.
The following table presents certain information relating to the tenancy at The Spiral Property:
| Tenant Summary(1)(2) | |||||||||
| Tenant Name | Credit Rating (Moody's/S&P/ Fitch)(3) | Tenant SF | Approx % of Total SF | Annual UW Rent | % of Total Annual UW Rent | Annual UW Rent PSF | Lease Expiration | Renewal Options | Term. Option (Y/N) |
| Major Tenants | |||||||||
| Pfizer Inc.(4) | A2/A/NR | 766,586 | 27.0% | $71,006,943 | 25.3% | $92.63 | 8/31/2042 | (5) | Y(5) |
| Debevoise & Plimpton LLP(6) | AMLaw:#37 | 531,211 | 18.7% | $58,997,355 | 21.0% | $111.06 | 10/31/2042 | (7) | Y(8) |
| TPG Global, L.L.C | A3/BBB+/BBB+ | 302,432 | 10.6% | $45,703,151 | 16.3% | $151.12 | 7/31/2041 | 2 x 5 yr | Y(9) |
| HSBC Bank USA, National Association | Aa3/A+/AA- | 301,260 | 10.6% | $30,834,900 | 11.0% | $102.35 | 4/30/2045 | (7) | Y(10) |
| AllianceBernstein L.P. | A2/NR/NR | 166,525 | 5.9% | $17,449,950 | 6.2% | $104.79 | 12/31/2044 | (11) | Y(11) |
| Marshall Wace North America L.P. | NR/NR/NR | 89,120 | 3.1% | $10,307,604 | 3.7% | $115.66 | 7/31/2037 | 1 x 5 yr | Y(12) |
| The Turner Corporation | NR/NR/NR | 86,944 | 3.1% | $8,172,736 | 2.9% | $94.00 | 5/31/2034 | (7) | N |
| The New York and Presbyterian Hospital | Aa2/NR/AA | 75,138 | 2.6% | $7,102,508 | 2.5% | $94.53 | 12/31/2043 | 1 x 10 yr | N |
| Eisler Capital (US) LLC | NR/NR/NR | 35,391 | 1.2% | $7,078,200 | 2.5% | $200.00 | 5/31/2041 | 2 x 5 yr | Y(13) |
| Centiva HQH, LLC | NR/NR/NR | 38,479 | 1.4% | $5,579,455 | 2.0% | $145.00 | 1/31/2037 | 1 x 5 yr | Y(14) |
| Subtotal/Wtd. Avg. | 2,393,086 | 84.1% | $262,232,802 | 93.3% | $109.58 | ||||
| Other Occupied Tenants | 261,306 | 9.2% | $18,826,812 | 6.7% | $72.05 | ||||
| Amenity Space | 13,967 | 0.5% | $0 | 0.0% | $0.00 | ||||
| Occupied Collateral Total(15) | 2,668,359 | 93.8% | $281,059,614 | 100.0% | $105.33 | ||||
| Vacant Space | 175,984 | 6.2% | |||||||
| Total/Wtd. Avg. | 2,844,343 | 100.0% | |||||||
| (1) | Based on the underwritten rent roll as of January 1, 2025. |
| (2) | Certain tenants have storage space and/or retail space in addition to the floor(s) listed. Debevoise has storage space with a lease expiration date in February 2035. This storage space is not considered in Lease Expiration. |
| (3) | In certain instances, ratings provided are those of the parent company of the entity shown, whether or not the parent company guarantees the lease. |
| (4) | Pfizer Inc. has subleased (the “Pfizer Sublease”) the entire 20th floor, containing 50,554 square feet of rentable area, to The Segal Company (Eastern States), Inc. pursuant to a sublease executed on August 21, 2023. The term of the Pfizer Sublease is scheduled to expire on July 30, 2042. |
| (5) | Pfizer Inc. has the option to renew its lease for either (a) two renewal terms of 10 years each or (b) four renewal terms of five years each. Pfizer Inc. has a one-time right to terminate its lease with respect to certain ancillary spaces on the ground and mezzanine floors, effective at any time from and after September 1, 2032 upon 12-months’ notice with no termination fee. |
| (6) | Debevoise’s had a lease commencement date of October 1, 2021, for floors 40 through 45, and November 1, 2021, for floors 46 through 52. |
| (7) | Tenant has the option to renew its lease for either (a) one renewal term of 10 years or (b) two renewal terms of five years each. |
| (8) | Debevoise has (a) a one-time right to terminate its lease with respect to a portion of the premises equal to no more than one full floor of the premises, which must be, at the tenant’s option, either (x) the highest or lowest floor of any contiguous block of the premises or (y) a full floor which is not part of or contiguous to the largest block of contiguous floors comprising the premises, as more fully described in the lease, (i) effective as of October 1, 2031, with at least 15-months prior notice and the payment of an amount equal to the rentable square feet (“RSF”) of the applicable space multiplied by $160.39, or (ii) effective as of October 1, 2036, with at least 15-months prior notice and the payment of an amount equal to the RSF of the applicable space multiplied by $80.20, and (b) a one-time right to terminate its lease with respect to the entire premises effective on April 1, 2038, with at least 24-months prior notice and the payment of an amount equal to the sum of (x) the RSF of the premises, multiplied by $91.12, plus (y) an amount equal to four months of certain recurring additional charges under the lease at the rate last paid by the tenant prior to exercising its termination option. |
| (9) | TPG has (a) the right, upon written notice to the landlord, to terminate its lease with respect to the lobby on the later of (i) 18 months after the tenant’s notice to the landlord and (ii) August 1, 2029, with the payment of an amount equal to the various unamortized costs and expenses; (b) a one-time right to terminate its entire premises or a portion of the then office premises effective on August 1, 2036, with 20-months prior notice and the payment of an amount equal to the various unamortized costs and expenses with respect to the applicable space; (c) a one-time right to terminate its lease with respect to any full floor of the office portion of the premises with at least 20-months prior notice and the payment of an amount equal to the various unamortized costs and expenses with respect to the applicable space; (d) a one-time right to terminate its lease with respect to the 57th floor, with notice on or prior to March 31, 2025, with an estimated termination fee of $7,713,362. |
| (10) | HSBC Bank USA, National Association has a one-time right to terminate its lease (a) effective as of May 1, 2032, (b) effective as of May 1, 2035, or (c) effective as of May 1, 2037, with respect to a portion of the premises equal to (x) all or 50% of the RSF of the highest or lowest full floor or, at the tenant’s election, more of the premises located on the block of floors starting on the second floor through the fifth floor (the “Podium Stack”), (y) the entirety of the 29th and 30th floors (the “Duplex Premises”; collectively, with the second and third floors of the building, the “Office Premises”), and/or (z) all of any full or partial floor of the Office Premises which is not contiguous to any full or partial floor of the Office Premises then leased by the tenant (with the aggregate RSF of the space for both the 7-Year Contraction Option and 10-Year Contraction Option not exceeding 125,000 RSF), with at least 20-months prior notice if the space is equal to or greater than 50,000 RSF or 18-months prior notice if the terminated space is less than 50,000 RSF, and the payment of an amount equal to the various unamortized costs and expenses with respect to the applicable space, including, without limitation, an amount equal to the RSF of the applicable space multiplied by $113.00. |
| (11) | AllianceBernstein L.P. has the option to renew its lease for either (a) two renewal term of 10 years each or (b) two renewal terms of five years each. AllianceBernstein L.P. has a one-time right to terminate the lease (a) effective as of December 31, 2034, with respect to the highest full floor of the premises and any partial floor contiguous to the highest floor, with at least 18-month prior notice and the payment of an amount equal to the various unamortized costs and expenses with respect to the applicable space, and (b) effective as of January 1, 2040, with respect to (i) the entirety of the premises or (ii) the highest full floor and any full floor and/or partial floor contiguous to the highest floor, with at least 18-months prior notice if the terminated space is one floor, at least 24-months notice if the space is more than one floor but less than three floors, or at least 30-months prior notice if the space terminated is more than three floors, and the payment of an amount equal to the various unamortized costs and expenses with respect to the applicable space. |
| (12) | Marshall Wace North America L.P. has the right to terminate its expansion space on the 33rd floor as of July 1, 2030, with 15-months prior notice and the payment of a termination fee equal to $1,695,046. |
| (13) | Eisler Capital (US) LLC has a one-time right effective as of June 1, 2036 to terminate its lease with respect to the entire premises with at least 15-months prior notice and the payment of payment of an amount equal to the various unamortized costs and expenses with respect to the applicable space, including, without limitation, the landlord’s contributions in connection with any work performed, the cost of any free rent, and brokerage commissions. |
| (14) | Centiva HQH, LLC has a one-time right to terminate its lease with respect to the entire premises effective as of November 18, 2031 with at least 18-months prior notice and a payment equal to $8,498,945, provided it has not exercised its option under the lease to also lease part or all of the 56th floor. |
| (15) | Tenant SF attributable to the ZO Clubhouse, Studio and the three restaurants, representing a combined 4.4% NRA, is included in occupied NRA calculations despite having no Annual UW Rent attributable to such spaces. |
| THE INFORMATION IN THIS STRUCTURAL AND COLLATERAL TERM SHEET IS NOT COMPLETE AND MAY BE AMENDED PRIOR TO THE TIME OF SALE. THIS TERM SHEET IS NOT AN OFFER TO SELL THESE SECURITIES AND IT IS NOT A SOLICITATION OF AN OFFER TO BUY THESE SECURITIES IN ANY JURISDICTION WHERE THE OFFER OR SALE IS NOT PERMITTED. | ||
| T-35 | ||
| Office – CBD | Loan #1 | Cut-off Date Balance: | $73,500,000 | |
| 66 Hudson Boulevard | The Spiral | Cut-off Date LTV: | 45.1% | |
| New York, NY 10001 | UW NCF DSCR: | 1.99x | ||
| UW NOI Debt Yield: | 11.4% |
The following table presents certain information relating to the lease rollover schedule at The Spiral Property:
| Lease Rollover Schedule(1)(2) | ||||||||
| Year | # of Leases Rolling | SF Rolling(3) | Approx. % of Total SF Rolling | Approx. Cumulative % of SF Rolling | Total UW Rent Rolling | Approx. % of Total Rent Rolling | Approx. Cumulative % of Total Rent Rolling | UW Rent PSF Rolling |
| MTM/2025 | 0 | 0 | 0.0% | 0.0% | $0 | 0.0% | 0.0% | $0.00 |
| 2026 | 0 | 0 | 0.0% | 0.0% | $0 | 0.0% | 0.0% | $0.00 |
| 2027 | 2 | 15,560 | 0.5% | 0.5% | $2,168,200 | 0.8% | 0.8% | $139.34 |
| 2028 | 2 | 25,043 | 0.9% | 1.4% | $3,416,313 | 1.2% | 2.0% | $136.42 |
| 2029 | 0 | 0 | 0.0% | 1.4% | $0 | 0.0% | 2.0% | $0.00 |
| 2030 | 1 | 8,373 | 0.3% | 1.7% | $1,423,410 | 0.5% | 2.5% | $170.00 |
| 2031 | 0 | 0 | 0.0% | 1.7% | $0 | 0.0% | 2.5% | $0.00 |
| 2032 | 0 | 0 | 0.0% | 1.7% | $0 | 0.0% | 2.5% | $0.00 |
| 2033 | 3 | 63,782 | 2.2% | 4.0% | $7,357,033 | 2.6% | 5.1% | $115.35 |
| 2034(3) | 2 | 101,750 | 3.6% | 7.5% | $9,890,232 | 3.5% | 8.6% | $97.20 |
| 2035 | 1 | 489 | 0.0% | 7.6% | $34,915 | 0.0% | 8.6% | $71.40 |
| 2036 & Thereafter | 13 | 2,439,395 | 85.8% | 93.3% | $256,769,511 | 91.4% | 100.0% | $105.26 |
| Vacant | 0 | 175,984 | 6.2% | 99.5% | $0 | 0.0% | 100.0% | $0.00 |
| Amenity Space(3) | 0 | 13,967 | 0.5% | 100.0% | $0 | 0.0% | 100.0% | $0.00 |
| Total/Wtd. Avg. | 24 | 2,844,343 | 100.0% | $281,059,614 | 100.0% | $98.81 | ||
| (1) | Based on the underwritten rent roll as of January 1, 2025. |
| (2) | Certain tenants may have lease termination options that are exercisable prior to the originally stated expiration date of the related lease that are not considered in the Lease Rollover Schedule. |
| (3) | SF Rolling attributable to the ZO Clubhouse, Studio and the three restaurants, representing a combined 4.4% NRA, is included in NRA and is treated as being occupied by tenants for purposes of occupancy calculations despite having no UW Rent Rolling attributable to such spaces. The tenants at those spaces or related leases are included in the rollover schedule above. |
The Market. The Spiral Property is located in Penn Plaza/Garment District office submarket and within the Hudson Yards micro-market in Manhattan, New York. According to a third-party research report, Manhattan office leasing velocity built on Q2 2024 positive momentum, totaling 9.5 million SF in Q3 2024, the strongest quarter of leasing since Q4 2019. Leasing volume now totals 25.0 million SF through the first three quarters of 2024, putting Manhattan on track for its strongest leasing year since the start of the pandemic. Blackstone’s 1.1 million SF renewal and expansion at 345 Park Avenue was the largest lease executed in Q3 2024, with three other leases by Christie’s, Willkie Farr & Gallagher and Ares Management all topping 300,000 SF. Financial Services tenants were active in Q3 2024, accounting for 38.8% of all leasing volume, including four of the top ten largest leases.
According to a third-party research report, tenant preference for best-in-class space shows no sign of diminishing. In Q3 2024, the Class A availability rate declined 0.7% from Q2 2024 to 19.3%, while Class B/C availability held flat at 20.1%. This continued divergence was pronounced in Midtown where Class A availability dropped 0.6% to 16.0%. Available sublet space decreased by 1.0 million SF in Q3 2024 to 19.7 million SF, Manhattan’s lowest level since the end of 2021. Direct available space dropped as well, falling 900,000 SF on the quarter, the first decline in two years.
Average asking rents in Manhattan overall increased 0.5% from Q1 2024 to $76.63 PSF, but rent movement varied significantly by location and space type. Midtown Class A asking rents rebounded from their drop in Q1 2024, growing 2.6% on the quarter to $93.27 PSF and reflecting the outsized demand for well-located, high-end product in that part of the market. This compares to a 1.4% increase for Class A rents in Manhattan overall. Meanwhile, Class B/C asking rents fell 3.3% on the quarter in Midtown and 0.9% in Manhattan overall.
According to a third-party research report, the Hudson Yards office micro-market contains only eight properties that (i) are Class A, (ii) have a 2010+ vintage or have been recently renovated and (iii) total more than 1.0 million SF. The Hudson Yards Class A, trophy micro-market includes 17.4 million SF of inventory and boasts a low average vacancy rate of 4.0% and average asking rent of $137 PSF. In comparison, the greater Penn Plaza/Garment District office submarket has a vacancy rate of 16.9% and average asking rent of $69 PSF. Excluding 2 Manhattan West, which is currently in its initial lease-up phase, the micro-market's weighted average vacancy rate stands at just 2.5%.
| THE INFORMATION IN THIS STRUCTURAL AND COLLATERAL TERM SHEET IS NOT COMPLETE AND MAY BE AMENDED PRIOR TO THE TIME OF SALE. THIS TERM SHEET IS NOT AN OFFER TO SELL THESE SECURITIES AND IT IS NOT A SOLICITATION OF AN OFFER TO BUY THESE SECURITIES IN ANY JURISDICTION WHERE THE OFFER OR SALE IS NOT PERMITTED. | ||
| T-36 | ||
| Office – CBD | Loan #1 | Cut-off Date Balance: | $73,500,000 | |
| 66 Hudson Boulevard | The Spiral | Cut-off Date LTV: | 45.1% | |
| New York, NY 10001 | UW NCF DSCR: | 1.99x | ||
| UW NOI Debt Yield: | 11.4% |
The following table presents certain information relating to the appraisal’s office market rent conclusions for The Spiral Property:
| Market Rent Summary(1) | ||||||
| Market Rent (PSF) | Reimbursement Type | Average Lease Term (Years) | Escalations | Tenant Improvements (New/Renewal) | Leasing Commissions (New/Renewal) | |
| Office Major (2-5) | $100.00 | Modified Gross | 15 plus free rent | 8.50% every 5 years | $160 / 80 | 3.50% / 1.75% |
| Office Major (6-10) | $105.00 | Modified Gross | 15 plus free rent | 8.50% every 5 years | $160 / 80 | 3.50% / 1.75% |
| Office Major (11-15) | $110.00 | Modified Gross | 15 plus free rent | 8.50% every 5 years | $160 / 80 | 3.50% / 1.75% |
| Office Major (16-20) | $115.00 | Modified Gross | 15 plus free rent | 8.50% every 5 years | $160 / 80 | 3.50% / 1.75% |
| Office Major (21-24) | $120.00 | Modified Gross | 15 plus free rent | 8.50% every 5 years | $160 / 80 | 3.50% / 1.75% |
| Office Minor (21-24) | $120.00 | Modified Gross | 10 plus free rent | 8.50% every 5 years | $150 / 75 | 4.00% / 2.00% |
| Office Major (25-28) | $125.00 | Modified Gross | 15 plus free rent | 8.50% every 5 years | $160 / 80 | 3.50% / 1.75% |
| Office Minor (25-28) | $125.00 | Modified Gross | 10 plus free rent | 8.50% every 5 years | $150 / 75 | 4.00% / 2.00% |
| Office Major (29-30) | $135.00 | Modified Gross | 15 plus free rent | 8.50% every 5 years | $160 / 80 | 3.50% / 1.75% |
| Office Major (31-36) | $130.00 | Modified Gross | 15 plus free rent | 8.50% every 5 years | $160 / 80 | 3.50% / 1.75% |
| Office Minor (31-36) | $130.00 | Modified Gross | 10 plus free rent | 8.50% every 5 years | $150 / 75 | 4.00% / 2.00% |
| Office Major (40-45) | $140.00 | Modified Gross | 15 plus free rent | 8.50% every 5 years | $160 / 80 | 3.50% / 1.75% |
| Office Major (46-50) | $150.00 | Modified Gross | 15 plus free rent | 8.50% every 5 years | $160 / 80 | 3.50% / 1.75% |
| Office Major (51-55) | $160.00 | Modified Gross | 15 plus free rent | 8.50% every 5 years | $160 / 80 | 3.50% / 1.75% |
| Office Minor (51-55) | $160.00 | Modified Gross | 10 plus free rent | 8.50% every 5 years | $150 / 75 | 4.00% / 2.00% |
| Office Major (56-59) | $165.00 | Modified Gross | 15 plus free rent | 8.50% every 5 years | $160 / 80 | 3.50% / 1.75% |
| Office Minor (56-59) | $165.00 | Modified Gross | 10 plus free rent | 8.50% every 5 years | $150 / 75 | 4.00% / 2.00% |
| Office Major (60-62) | $175.00 | Modified Gross | 15 plus free rent | 8.50% every 5 years | $160 / 80 | 3.50% / 1.75% |
| Office Major (63-65) | $200.00 | Modified Gross | 15 plus free rent | 8.50% every 5 years | $160 / 80 | 3.50% / 1.75% |
| Office Minor (63-65) | $200.00 | Modified Gross | 10 plus free rent | 8.50% every 5 years | $150 / 75 | 4.00% / 2.00% |
| (1) | Information obtained from appraisal. |
The following table presents information relating to comparable sales pertaining to The Spiral Property:
| Sales Comparable(1) | ||||||
| Property Name/Location | Year Built/Renovated | Size (SF) | Occupancy | Sale Date | Sale Price | Sale Price (PSF) |
The Spiral New York, NY | 2022/NAP | 2,844,343(2) | 93.8%(2) | Dec-26(3) | $4,600,000,000(3) | $1,617.25(3) |
799 Broadway New York, NY | 2022/NAP | 177,535 | 71.0% | Nov-24 | $255,000,000 | $1,436.34 |
One Vanderbilt Avenue New York, NY | 2020/NAP | 1,653,445 | 100.0% | Nov-24 | $4,700,000,000 | $2,842.55 |
245 Park Avenue New York, NY | 1965/2000 | 1,776,217 | 84.9% | Jun-23 | $2,000,000,000 | $1,125.99 |
200 Fifth Avenue New York, NY | 1909/2007 | 868,904 | 92.0% | Nov-22 | $1,050,000,000 | $1,208.42 |
450 Park Avenue New York, NY | 1972/2006 | 336,871 | 80.0% | Jun-22 | $433,000,000 | $1,285.36 |
| (1) | Information obtained from appraisal. | |
| (2) | Information is based on the underwritten rent roll as of January 1, 2025. |
| (3) | Reflects the appraisal’s concluded “As Stabilized” value as of December 1, 2026. The appraisal’s concluded “As Is” value of $4,175,000,000 as of November 20, 2024 results in a Sale Price (PSF) of $1,467.83. |
| THE INFORMATION IN THIS STRUCTURAL AND COLLATERAL TERM SHEET IS NOT COMPLETE AND MAY BE AMENDED PRIOR TO THE TIME OF SALE. THIS TERM SHEET IS NOT AN OFFER TO SELL THESE SECURITIES AND IT IS NOT A SOLICITATION OF AN OFFER TO BUY THESE SECURITIES IN ANY JURISDICTION WHERE THE OFFER OR SALE IS NOT PERMITTED. | ||
| T-37 | ||
| Office – CBD | Loan #1 | Cut-off Date Balance: | $73,500,000 | |
| 66 Hudson Boulevard | The Spiral | Cut-off Date LTV: | 45.1% | |
| New York, NY 10001 | UW NCF DSCR: | 1.99x | ||
| UW NOI Debt Yield: | 11.4% |
The following table presents certain information relating to the comparable office leases for The Spiral Property:
| Comparable Office Leases(1) | |||||||
| Property Name/Location | Year Built/Renovated | Total NRA (SF) | Tenant Name | Tenant Size (SF) | Lease Date | Rent PSF | Lease Term (years) |
The Spiral New York, NY | 2022/NAP | 2,844,343(2) | Pfizer Inc.(2) | 766,586(2) | May-21(2) | $92.63(2)(3) | 17.57(2) |
1 Penn New York, NY | 1972/2020 | 2,072,136 | Roivant Sciences | 54,702 | Oct-24 | $130.00 | 16.75 |
50 Hudson Yards New York, NY | 2022/NAP | 2,866,692 | Diameter Capital | 26,619 | Sept-24 | $175.00 | 9.17 |
50 Hudson Yards New York, NY | 2022/NAP | 2,866,692 | OMERS | 49,183 | Jun-24 | $210.00 | 16.75 |
50 Hudson Yards New York, NY | 2022/NAP | 2,866,692 | LIV Golf | 27,846 | May-24 | $160.00 | 8.67 |
Penn 2 New York, NY | 1968/2023 | 1,842,678 | Major League Soccer | 125,013 | Apr-24 | $90.00 | 16.75 |
50 Hudson Yards New York, NY | 2022/NAP | 2,866,692 | Viatris | 22,604 | Mar-24 | $150.00 | 16.00 |
2 Manhattan West New York, NY | 2023/NAP | 1,930,985 | PGIM Real Estate | 36,166 | Feb-24 | $149.00 | 11.67 |
55 Hudson Yards New York, NY | 2019/NAP | 1,411,528 | Point72 Asset Management | 56,858 | Nov-23 | $135.00 | 10.50 |
| (1) | Source: Appraisal. |
| (2) | Based on the underwritten rent roll as of January 1, 2025. |
| (3) | Represents the weighted average Rent PSF of all occupied suites. |
Appraisal. The appraisal concluded to an “As Stabilized” value for The Spiral Property of $4,600,000,000 as of December 1, 2026 and assumes The Spiral Property has achieved a stabilized income by December 1, 2026, when The Spiral Property has no further free rent and tenant improvements and leasing commissions owed in connection with leases executed to date. The appraisal concluded to an “As Is” value as of November 20, 2024 for The Spiral Property of $4,175,000,000.
Environmental Matters. The Phase I environmental site assessment dated November 18, 2024 has identified certain historical recognized environmental conditions (“HREC”) at The Spiral Property, because The Spiral Property site was formerly developed with several manufacturing facilities and a parking garage. The Spiral Property was given an “E-Designation” given its location within the Hudson Yards Rezoning Area, and has since undergone several subsurface investigations and remedial actions, resulting in issuance by New York State Department of Environmental Conservation of a Certificate of Completion in November 2021 and a Final Notice of Satisfaction by the New York City Office of Environmental Remediation in December 2023.
| THE INFORMATION IN THIS STRUCTURAL AND COLLATERAL TERM SHEET IS NOT COMPLETE AND MAY BE AMENDED PRIOR TO THE TIME OF SALE. THIS TERM SHEET IS NOT AN OFFER TO SELL THESE SECURITIES AND IT IS NOT A SOLICITATION OF AN OFFER TO BUY THESE SECURITIES IN ANY JURISDICTION WHERE THE OFFER OR SALE IS NOT PERMITTED. | ||
| T-38 | ||
| Office – CBD | Loan #1 | Cut-off Date Balance: | $73,500,000 | |
| 66 Hudson Boulevard | The Spiral | Cut-off Date LTV: | 45.1% | |
| New York, NY 10001 | UW NCF DSCR: | 1.99x | ||
| UW NOI Debt Yield: | 11.4% |
Operating History and Underwritten Net Cash Flow. The following table presents certain information relating to the historical operating performance and Underwritten Net Cash Flow at The Spiral Property:
| Cash Flow Analysis | |||
| TTM 11/30/2024 | UW | UW PSF | |
| Rents in Place | $223,834,575 | $281,059,614 | $98.81 |
| Rent Steps(1) | $0 | $71,021 | $0.02 |
| IG Rent Steps(2) | $0 | $15,024,990 | $5.28 |
| Vacant Income(3) | $0 | $25,117,360 | $8.83 |
| Gross Potential Rent | $223,834,575 | $321,272,985 | $112.95 |
| CAM | $2,527,573 | $5,767,376 | $2.03 |
| Gross Potential Income | $226,362,148 | $327,040,362 | $114.98 |
| Restaurant Income | $0 | $1,806,776 | $0.64 |
| Other Income(4) | $14,864,496 | $21,572,398 | $7.58 |
| (Free Rent) | ($79,175,365) | $0 | $0.00 |
| (Vacancy & Credit Loss)(3) | $0 | ($19,150,880) | ($6.73) |
| Effective Gross Income | $162,051,278 | $331,268,656 | $116.47 |
| Real Estate Taxes | $39,721,826 | $46,931,656 | $16.50 |
| Insurance | $2,224,456 | $2,901,542 | $1.02 |
| Management Fee | $2,352,869 | $1,000,000 | $0.35 |
| Other Operating Expenses | $45,628,822 | $43,649,460 | $15.35 |
| Total Expenses | $89,927,973 | $94,482,658 | $33.22 |
| Net Operating Income5) | $72,123,305 | $236,785,998 | $83.25 |
| Replacement Reserves | $0 | $568,869 | $0.20 |
| TI/LC | $0 | $5,688,686 | $2.00 |
| Net Cash Flow( | $72,123,305 | $230,528,443 | $81.05 |
| Occupancy % | 93.4% | 95.4%(3) | |
| NOI DSCR | 0.62x | 2.04x(6) | |
| NCF DSCR | 0.62x | 1.99x(6) | |
| NOI Debt Yield | 3.5% | 11.4%(6) | |
| NCF Debt Yield | 3.5% | 11.1%(6) | |
| (1) | Rent Steps shown above includes contractual rent steps through January 2026. | |
| (2) | IG Rent Steps represents the net present value of rent through lease term for all investment grade tenants and Debevoise. |
| (3) | The vacancy was underwritten to an economic vacancy of 6.0%, which is above the micro market vacancy of 4.0% as of November 2024 according to a third party market data provider. The Spiral Property was 93.8% leased as of January 1, 2025 and continues to stabilize as evidenced by recent leasing. |
| (4) | Other Income includes among other items, rental income from the 23rd and 24th floor “Studio” amenity space that was nearly 100% leased as of October 2024. |
| (5) | The increase in Net Operating Income from TTM 11/30/2024 to UW is primarily attributable to recently executed office leases including TPG Global, L.L.C (302,432 SF), HSBC Bank USA, National Association (301,260 SF) and AllianceBernstein L.P. (166,525 SF) and burn-off of associated free rent. |
| (6) | The NOI DSCR, NCF DSCR, NOI Debt Yield and NCF Debt Yield presented above are based on the principal balance of the Spiral Senior Notes. NOI DSCR (based on a weighted average interest rate of (5.73551255157895%) per annum on the Spiral Whole Loan), NCF DSCR (based on a weighted average interest rate of (5.73551255157895%) per annum on the Spiral Whole Loan), NOI Debt Yield and NCF Debt Yield for the Spiral Whole Loan are 8.3%, 8.1%, 1.43x and 1.39x, respectively. See defined term “Weighted Average Interest Rate” set forth under “Description of the Mortgage Pool—Definitions” in the prospectus. |
Escrows and Reserves.
Real Estate Taxes – During a Cash Trap Event Period (as defined below), the borrower is required to deposit on each payment date 1/12th of an amount that the lender reasonably estimates will be payable for taxes during the next ensuing 12 months.
Insurance – During a Cash Trap Event Period, the borrower is required to escrow 1/12th of the annual estimated insurance payments on a monthly basis, unless no event of default is continuing and The Spiral Property is insured under a blanket policy meeting the requirements set forth in the related loan agreement (in which case, no insurance escrows will be required).
Replacement Reserve – During a Cash Trap Event Period, if the amount in the replacement reserve account is less than $853,308 (the “Replacement Reserve Cap”), the borrower is required to deposit into a replacement reserve, on a monthly basis, an amount equal to $47,406 (or such lesser amount which would cause the amounts on deposit in the replacement reserve account to equal the Replacement Reserve Cap).
| THE INFORMATION IN THIS STRUCTURAL AND COLLATERAL TERM SHEET IS NOT COMPLETE AND MAY BE AMENDED PRIOR TO THE TIME OF SALE. THIS TERM SHEET IS NOT AN OFFER TO SELL THESE SECURITIES AND IT IS NOT A SOLICITATION OF AN OFFER TO BUY THESE SECURITIES IN ANY JURISDICTION WHERE THE OFFER OR SALE IS NOT PERMITTED. | ||
| T-39 | ||
| Office – CBD | Loan #1 | Cut-off Date Balance: | $73,500,000 | |
| 66 Hudson Boulevard | The Spiral | Cut-off Date LTV: | 45.1% | |
| New York, NY 10001 | UW NCF DSCR: | 1.99x | ||
| UW NOI Debt Yield: | 11.4% |
Leasing Reserve - During a Cash Trap Event Period, the borrower is required to deposit into a rollover reserve, on a monthly basis, an amount equal to $474,057, capped at an amount equal to the aggregate square footage of the applicable Lease Sweep Premises multiplied by $150.
Specified Tenant Reserve – On the loan origination date, the borrower was required to make an upfront deposit of $220,726,391 into a specified tenant reserve for $110,932,361 of free rent, $107,441,326 of outstanding tenant improvement allowances and $2,352,704 of outstanding leasing commissions associated with certain tenants as set forth in the Spiral Whole Loan documents.
Lockbox and Cash Management. The Spiral Whole Loan is structured with a hard lockbox and springing cash management. The borrower and property manager are required to direct tenants to pay rent directly into the lockbox account, and to deposit any rents otherwise received into such lockbox account within two business days after receipt. If no Cash Trap Event Period is continuing, all funds in the lockbox account will be swept each business day to the borrower’s operating account. During the continuance of a Cash Trap Event Period, all funds in the lockbox account are required to be swept on each business day to a lender-controlled cash management account and applied in accordance with the Spiral Whole Loan documents. During the continuance of a Cash Trap Event Period, any excess cash is required to be deposited into an excess cash flow reserve account to be held as additional security for the Spiral Whole Loan in accordance with the Spiral Whole Loan documents. During the continuance of an event of default or a bankruptcy trigger event, all funds in the cash management account may be applied by the lender in such order and priority as the lender determines. Upon payment in full of the debt, all sums remaining on deposit in the excess cash flow reserve account will be disbursed to the borrower.
A “Cash Trap Event Period” means the period commencing upon the occurrence of (i) an event of default under the Spiral Whole Loan documents, (ii) an event of default with respect to a mezzanine loan approved by the lender (the “Approved Mezzanine Loan”), (iii) the debt yield of the Spiral Whole Loan being less than 7.00% on a trailing 12-month basis, (iv) the debt service coverage ratio of the Spiral Whole Loan being less than 1.10x on a trailing 12-month basis, or (v) a Lease Sweep Period (as defined below), and expiring upon (a) if triggered by clause (i) above, a cure or waiver of such event of default accepted by the lender, (b) if triggered by clause (ii) above, a cure or waiver of such event of default accepted by the applicable mezzanine lender, (c) if triggered by clause (iii) above, either (x) the debt yield of the Spiral Whole Loan being at least than 7.00% on a trailing 12-month basis or (y) the borrower depositing the Cash Trap Event Cure Collateral (as defined below) allocable to the Spiral Whole Loan and the Approved Mezzanine Loan on a pro rata basis attributable to the Spiral Whole Loan and, if applicable, Approved Mezzanine Loan, to be held in accordance with the Spiral Whole Loan documents, (d) if triggered by clause (iv) above, either (x) the debt service coverage ratio of the Spiral Whole Loan being at least 1.10x on a trailing 12-month basis or (y) the date upon which the borrower deposits with Lender the pro rata basis of Cash Trap Event Cure Collateral attributable to the Spiral Whole Loan and, if applicable, Approved Mezzanine Loan, to be held in accordance with the Spiral Whole Loan documents, and (e) if triggered by clause (v) above, termination of the applicable Lease Sweep Period.
A “Lease Sweep Period” means a period (1) commencing upon the first monthly payment following the first of the following to occur: (i) the date that is the earlier of (a) 12 months prior to the expiration of the applicable Major Lease (as defined below), (b) the expiration date of the notice period to exercise any extension option contained within any such Major Lease, and (c) the date the subject Major Tenant (as defined below) gives notice of its intention not to extend the applicable Major Lease as to more than 50% of the applicable Lease Sweep Premises (as defined below), in the case of each of (a), (b), and (c), unless the subject Major Tenant has given notice of renewal or extension of the applicable Major Lease as to at least 50% of the applicable Lease Sweep Premises or the borrower enters into one or more replacement leases in accordance with the Spiral Whole Loan documents covering at least 90% of the terminated space (or an equivalent amount of space elsewhere at The Spiral Property); (ii) the date on which a Major Tenant terminates or gives a valid notice in accordance with its Major Lease that it is exercising a contractual right to terminate as to more than 50% of the applicable Lease Sweep Premises and such termination is to occur within 12 months thereafter; unless the borrower enters into one or more replacement leases in accordance with the Spiral Whole Loan documents covering at least 90% of the terminated space (or an equivalent amount of space elsewhere at The Spiral Property); (iii) the date on which a Major Tenant has gone dark (unless such Major Tenant or any replacement tenant is investment grade) as to more than 50% of the applicable Lease Sweep Premises; (iv) the occurrence of a monetary default with respect to base rent or material non-monetary default by a Major Tenant under its Major Lease; provided, that a Major Tenant’s non-payment of rents of up to $2,500,000 in the aggregate will not constitute a Lease Sweep Period if (x) such non-payment is the result of a good faith dispute on the part of the Major Tenant, (y) the borrower in a commercially reasonable manner is pursuing an expeditious resolution of such dispute and (z) such dispute is resolved within 180 days of the occurrence of the applicable non-payment; or (v) the date on which a Major Tenant or any related guarantor becomes subject to any bankruptcy proceedings; provided, in accordance with the Spiral Whole Loan documents, that the release of any press release or other public announcements by a Major Tenant regarding its intent not to continue conducting business or operating at The Spiral Property will not be deemed notice of intent not to renew its lease triggering a Lease Sweep Period; and (2) ending upon, provided no other Lease Sweep Period has occurred and is continuing: (a) with respect to clauses (i), (ii), (iii), (iv), and (v) above, entry into one or more replacement leases covering at least 90% of the applicable square footage that was the subject of the Lease Sweep Period (or an equivalent amount of space elsewhere at The Spiral Property) and, in either case, certain lease sweep cure conditions (including, among other conditions, the replacement tenant has no contractual right to terminate the replacement lease, the amount of any gap rent or abated or free rent has been reserved for, or, if such replacement lease is a Major Lease, all related leasing expenses have been paid or reserved for) have been satisfied with respect to such replacement lease(s); (b) with respect to clauses (i), (ii), (iii), (iv), and (v) above, the date upon which the amount of funds deposited into the excess cash flow subaccount as a result of the applicable Lease Sweep Period equals the lease sweep cap; (c) with respect to clause (iii) above, the date on which the applicable Major Tenant has reoccupied at least 50% of the applicable Lease Sweep Premises for a period of not less than three months; (d) with respect to clause (iv) above, the date on which the applicable monetary or material non-monetary default has been cured; or (e) with respect to clause (v) above, the date on which the Major Tenant or any related guarantor’s bankruptcy proceedings have terminated and the Major Lease or the applicable guaranty has been affirmed, assumed, or assigned in a manner reasonably satisfactory to the lender.
“Lease Sweep Premises” means, with respect to any Major Tenant, the total rentable SF subject to all applicable Major Leases for such Major Tenant.
“Major Lease” means: (a) any lease with an affiliate of the borrower as tenant except for leases covering the offices of the property manager (if any) (except to the extent the same would constitute Major Leases as a result of clause (b), (c) and/or (d) of this definition), any co-working space leases (except to the extent the same would constitute Major Leases as a result of clause (b), (c) and/or (d) of this definition) and any restaurant operating leases, (b) any lease (other than a storage lease) which in aggregate demises 15% or more of The Spiral Property’s net rentable area (assuming the exercise of all expansion rights and all preferential rights to lease additional space contained in such lease), (c) any lease which contains an option, offer, right of first refusal or other similar entitlement or preferential right to purchase all or any portion of The Spiral Property or (d) any lease that is entered into during the continuance of an event of default under the Spiral Whole Loan documents.
| THE INFORMATION IN THIS STRUCTURAL AND COLLATERAL TERM SHEET IS NOT COMPLETE AND MAY BE AMENDED PRIOR TO THE TIME OF SALE. THIS TERM SHEET IS NOT AN OFFER TO SELL THESE SECURITIES AND IT IS NOT A SOLICITATION OF AN OFFER TO BUY THESE SECURITIES IN ANY JURISDICTION WHERE THE OFFER OR SALE IS NOT PERMITTED. | ||
| T-40 | ||
| Office – CBD | Loan #1 | Cut-off Date Balance: | $73,500,000 | |
| 66 Hudson Boulevard | The Spiral | Cut-off Date LTV: | 45.1% | |
| New York, NY 10001 | UW NCF DSCR: | 1.99x | ||
| UW NOI Debt Yield: | 11.4% |
“Major Tenant” means the Tenant under any Major Lease, which, as of the loan origination date were (1) Pfizer Inc. and (2) Debevoise & Plimpton LLP.
Terrorism Insurance. The borrower is required to obtain and maintain property insurance for 100% of full replacement cost and business interruption insurance for 24 months. Such insurance is required to cover perils of terrorism and acts of terrorism, provided that, if TRIPRA or a similar statute is not in effect, the amount of insurance premium that the borrower will be required to spend will be capped at 2x the amount of the annual insurance premium that is payable at such time with respect to the policies set forth in the Spiral Whole Loan documents. See “Risk Factors—Risks Relating to the Mortgage Loans—Terrorism Insurance May Not Be Available for All Mortgaged Properties” in the prospectus.
| THE INFORMATION IN THIS STRUCTURAL AND COLLATERAL TERM SHEET IS NOT COMPLETE AND MAY BE AMENDED PRIOR TO THE TIME OF SALE. THIS TERM SHEET IS NOT AN OFFER TO SELL THESE SECURITIES AND IT IS NOT A SOLICITATION OF AN OFFER TO BUY THESE SECURITIES IN ANY JURISDICTION WHERE THE OFFER OR SALE IS NOT PERMITTED. | ||
| T-41 | ||
| Retail – Anchored | Loan #2 | Cut-off Date Balance: | $73,500,000 | |
| 501 Gateway Drive | Gateway Center North | Cut-off Date LTV: | 67.7% | |
| Brooklyn, NY 11239 | UW NCF DSCR: | 1.20x | ||
| UW NOI Debt Yield: | 8.5% |
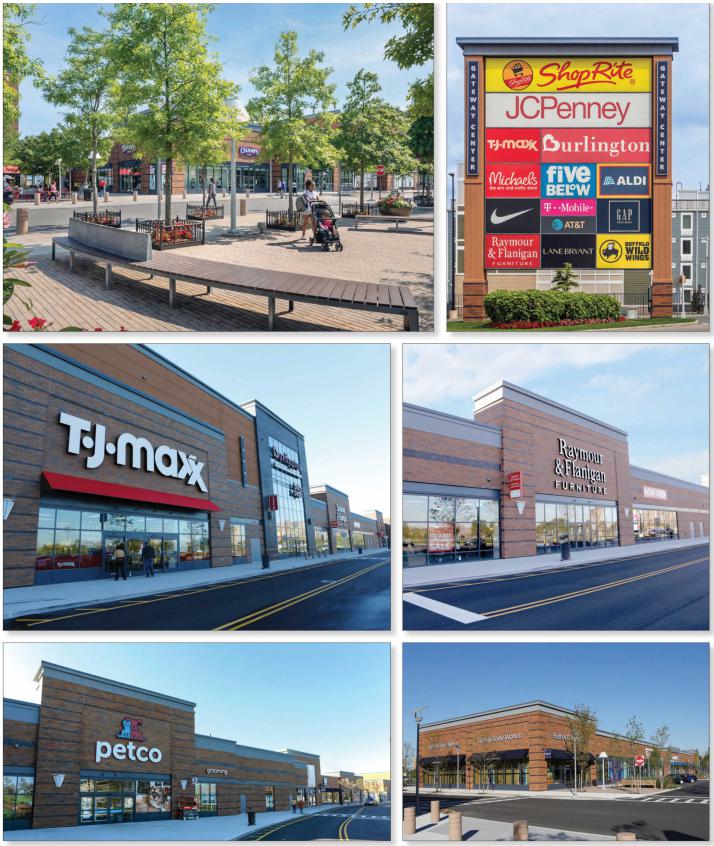
| THE INFORMATION IN THIS STRUCTURAL AND COLLATERAL TERM SHEET IS NOT COMPLETE AND MAY BE AMENDED PRIOR TO THE TIME OF SALE. THIS TERM SHEET IS NOT AN OFFER TO SELL THESE SECURITIES AND IT IS NOT A SOLICITATION OF AN OFFER TO BUY THESE SECURITIES IN ANY JURISDICTION WHERE THE OFFER OR SALE IS NOT PERMITTED. | ||
| T-42 | ||
| Retail – Anchored | Loan #2 | Cut-off Date Balance: | $73,500,000 | |
| 501 Gateway Drive | Gateway Center North | Cut-off Date LTV: | 67.7% | |
| Brooklyn, NY 11239 | UW NCF DSCR: | 1.20x | ||
| UW NOI Debt Yield: | 8.5% |
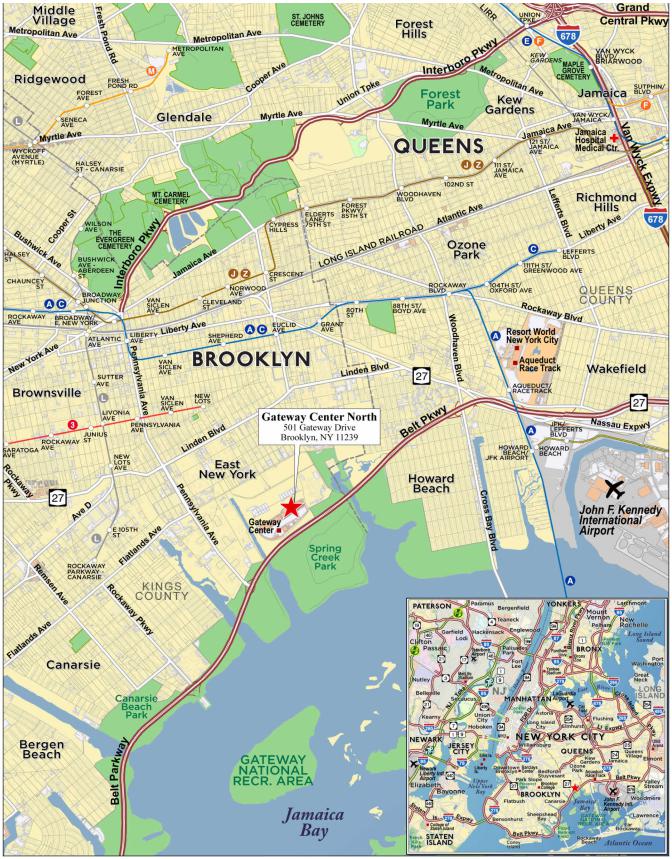
| THE INFORMATION IN THIS STRUCTURAL AND COLLATERAL TERM SHEET IS NOT COMPLETE AND MAY BE AMENDED PRIOR TO THE TIME OF SALE. THIS TERM SHEET IS NOT AN OFFER TO SELL THESE SECURITIES AND IT IS NOT A SOLICITATION OF AN OFFER TO BUY THESE SECURITIES IN ANY JURISDICTION WHERE THE OFFER OR SALE IS NOT PERMITTED. | ||
| T-43 | ||
| Mortgage Loan No. 2 – Gateway Center North |
| Mortgage Loan Information | Property Information | |||||
| Mortgage Loan Seller: | BANA | Single Asset/Portfolio: | Single Asset | |||
| Credit Assessment (Fitch/Moody’s/KBRA): | NR/NR/NR | Location: | Brooklyn, NY 11239 | |||
| Original Balance(1): | $73,500,000 | General Property Type: | Retail | |||
| Cut-off Date Balance(1): | $73,500,000 | Detailed Property Type: | Anchored | |||
| % of Initial Pool Balance: | 9.97% | Title Vesting: | Fee | |||
| Loan Purpose: | Refinance | Year Built/Renovated: | 2014/NAP | |||
| Borrower Sponsor: | The Related Companies, L.P. | Size: | 601,212 SF | |||
| Guarantor: | The Related Companies, L.P. | Cut-off Date Balance PSF(1): | $499 | |||
| Mortgage Rate: | 6.8270% | Maturity Date Balance PSF(1): | $499 | |||
| Note Date: | 10/22/2024 | Property Manager: | Related Gateway Phase II, LLC | |||
| Maturity Date: | 11/6/2029 | (borrower-related) | ||||
| Original Term to Maturity: | 60 months | Underwriting and Financial Information | ||||
| Original Amortization Term: | 0 months | UW NOI: | $25,481,475 | |||
| IO Period: | 60 months | UW NCF: | $24,931,003 | |||
| Seasoning: | 3 months | UW NOI Debt Yield(1): | 8.5% | |||
| Prepayment Provisions(2): | L(23),YM1(4),DorYM1(26),O(7) | UW NCF Debt Yield(1): | 8.3% | |||
| Lockbox/Cash Mgmt Status: | Hard/Springing | UW NOI Debt Yield at Maturity(1): | 8.5% | |||
| Additional Debt Type(1): | Pari Passu | UW NCF DSCR(1): | 1.20x | |||
| Additional Debt Balance(1): | $226,500,000 | Most Recent NOI: | $25,542,737 (8/31/2024 TTM) | |||
| Future Debt Permitted (Type): | No (NAP) | 2nd Most Recent NOI: | $24,988,506 (12/31/2023) | |||
| 3rd Most Recent NOI: | $24,542,492 (12/31/2022) | |||||
| Reserves(3) | Most Recent Occupancy: | 96.3% (9/3/2024) | ||||
| Type | Initial | Monthly | Cap | 2nd Most Recent Occupancy: | 100.0% (12/31/2023) | |
| RE Taxes: | $0 | Springing | NAP | 3rd Most Recent Occupancy: | 99.6% (12/31/2022) | |
| Insurance: | $0 | Springing | NAP | Appraised Value (as of): | $443,000,000 (9/6/2024) | |
| Replacement Reserve: | $0 | Springing | $143,599 | Appraised Value PSF: | $737 | |
| TI/LC Reserve: | $0 | Springing | $957,344 | Cut-off Date LTV Ratio(1): | 67.7% | |
| Other Reserves(4): | $3,084,213 | $0 | NAP | Maturity Date LTV Ratio(1): | 67.7% | |
| Sources and Uses | ||||||
| Sources | Proceeds | % of Total | Uses | Proceeds | % of Total | |
| Whole Loan Amount: | $300,000,000 | 97.9% | Loan Payoff: | $301,105,790 | 98.2% | |
| Borrower Sponsor Equity: | $6,527,983 | 2.1% | Upfront Reserves: | $3,084,213 | 1.0% | |
| Closing Costs: | $2,337,979 | 0.8% | ||||
| Total Sources: | $306,527,983 | 100.0% | Total Uses: | $306,527,983 | 100.0% | |
| (1) | The Gateway Center North Mortgage Loan (as defined below) is part of the Gateway Center North Whole Loan (as defined below), which is evidenced by seven pari passu promissory notes with an aggregate principal balance of $300,000,000. The information presented is based on the aggregate principal balance of the promissory notes comprising the Gateway Center North Whole Loan. |
| (2) | Defeasance of the Gateway Center North Whole Loan is permitted at any time after the earlier to occur of (a) the end of the two-year period commencing on the closing date of the securitization of the last portion of the Gateway Center North Whole Loan to be securitized and (b) December 6, 2027. The assumed defeasance lockout period of 27 payments is based on the closing date of this transaction in February 2025. |
| (3) | See “Escrows and Reserves” below for further discussion information. |
| (4) | Other Reserves include upfront landlord obligations reserve of $1,353,710 and a gap rent reserve of $1,730,503 for the sixth largest tenant, Urban Air. |
The Mortgage Loan. The second largest mortgage loan (the “Gateway Center North Mortgage Loan”) is part of a whole loan (the “Gateway Center North Whole Loan”) that is evidenced by seven pari passu promissory notes in the aggregate original principal amount of $300,000,000 and secured by a first priority fee mortgage encumbering a 601,212 SF anchored retail center located in Brooklyn, New York (the “Gateway Center North Property”). The Gateway Center North Mortgage Loan is evidenced by the non-controlling Note A-3 and Note A-6, with an aggregate original principal balance of $73,500,000. The remaining promissory notes comprising the Gateway Center North Whole Loan are summarized in the below table. The Gateway Center North Whole Loan is being serviced pursuant to the pooling and servicing agreement for the BANK5 2024-5YR11 securitization trust. The relationship between the holders of the Gateway Center North Whole Loan is governed by a co-lender agreement. See “Description of the Mortgage Pool—The Whole Loans—The Non-Serviced Pari Passu Whole Loans” and “Pooling and Servicing Agreement—Servicing of the Non-Serviced Mortgage Loans” in the prospectus.
| THE INFORMATION IN THIS STRUCTURAL AND COLLATERAL TERM SHEET IS NOT COMPLETE AND MAY BE AMENDED PRIOR TO THE TIME OF SALE. THIS TERM SHEET IS NOT AN OFFER TO SELL THESE SECURITIES AND IT IS NOT A SOLICITATION OF AN OFFER TO BUY THESE SECURITIES IN ANY JURISDICTION WHERE THE OFFER OR SALE IS NOT PERMITTED. | ||
| T-44 | ||
| Retail – Anchored | Loan #2 | Cut-off Date Balance: | $73,500,000 | |
| 501 Gateway Drive | Gateway Center North | Cut-off Date LTV: | 67.7% | |
| Brooklyn, NY 11239 | UW NCF DSCR: | 1.20x | ||
| UW NOI Debt Yield: | 8.5% |
| Gateway Center North Whole Loan Summary | ||||
Note | Original Balance | Cut-off Date Balance | Note Holder | Controlling Note |
| A-1 | $77,000,000 | $77,000,000 | BANK5 2024-5YR11 | Yes |
| A-2(1) | $59,500,000 | $59,500,000 | Bank of America, N.A. | No |
| A-3 | $53,500,000 | $53,500,000 | BANK5 2025-5YR13 | No |
| A-4 | $50,000,000 | $50,000,000 | BANK5 2024-5YR12 | No |
| A-5(1) | $25,000,000 | $25,000,000 | Bank of America, N.A. | No |
| A-6 | $20,000,000 | $20,000,000 | BANK5 2025-5YR13 | No |
| A-7 | $15,000,000 | $15,000,000 | BANK5 2024-5YR12 | No |
| Whole Loan | $300,000,000 | $300,000,000 | ||
| (1) | Expected to be contributed to one or more future securitization transactions or may otherwise be transferred at any time. |
The Borrower and the Borrower Sponsor. The borrower for the Gateway Center North Whole Loan is Gateway Center Properties Phase II Owner, LLC, a Delaware limited liability company and single purpose entity with two independent directors. The non-recourse carveout guarantor and borrower sponsor for the Gateway Center North Whole Loan is The Related Companies, L.P. (“Related”).
Founded in 1972, Related is a privately-owned, fully integrated global real estate and lifestyle company with experience in development, acquisition, management, finance, marketing and sales. Headquartered in New York City, Related has offices and major developments in Boston, Chicago, Los Angeles, San Francisco, Austin, West Palm Beach, Miami, Washington, D.C., Abu Dhabi and London, with a team of approximately 4,000 professionals. Related’s assets include the 28-acre Hudson Yards neighborhood on Manhattan’s West Side, The Square in Downtown West Palm Beach, The Grand LA and Related Santa Clara in California and The 78 in Chicago.
The Property. The Gateway Center North Property consists of a 601,212 SF anchored retail power center situated on 40.49 acres in Brooklyn, New York. The Gateway Center North Property is comprised of eight one- and two-story buildings and three pad sites. The Gateway Center North Property has a total of 1,542 parking spaces, resulting in a ratio of approximately 2.56 spaces per 1,000 SF. The Gateway Center North Property was constructed by the borrower sponsor in 2014 and is anchored by JCPenney, as the tenant under a ground lease, ShopRite, and Burlington Coat Factory, which account for 47.6% of the rentable area and 26.7% of the underwritten base rent. The Gateway Center North Property was the second phase expansion to Gateway Center South (not part of the collateral), which was originally developed and opened by the borrower sponsor in 2002, and is currently owned by the borrower sponsor. Gateway Center South is 100.0% leased and is anchored by BJ’s Wholesale Club, Home Depot, and Target, and together with the Gateway Center North Property, makes up Gateway Center, which serves as the primary retail location within the Brooklyn market.
The Gateway Center North Property has a granular rent roll, with no tenant contributing greater than 11.4% of the total underwritten rent. The top 10 tenants at the Gateway Center North Property represent 77.5% of total SF and generate 60.3% of total underwritten rent. There are six investment-grade rated tenants at the Gateway Center North Property representing 13.8% of underwritten rent. The Gateway Center North Property has averaged 99.0% occupancy since 2020. As of September 3, 2024, the Gateway Center North Property was 96.3% leased to 35 tenants.
Major Tenants.
JCPenney (122,473 SF, 20.4% of NRA, 4.7% of underwritten base rent). JCPenney was founded in Wyoming in 1902 and has been one of the United States’ largest retailers of apparel, home, jewelry and beauty merchandise, with a growing portfolio of national brands. JCPenney has more than 650 stores across the United States and Puerto Rico and employs more than 50,000 people worldwide. JCPenney has been wholly owned and operated by Brookfield Asset Management and Simon Property Group since emerging from Chapter 11 bankruptcy in 2020. JCPenney has been a tenant at the Gateway Center North Property since 2014. JCPenney is the tenant under a ground lease that has a current expiration of August 31, 2034, with eleven five-year renewal options remaining, and no termination options. JCPenney currently pays a base rent of $10.23 PSF, increasing to $11.05 PSF effective September 1, 2029. JCPenney reported sales of $146 PSF, $146 PSF, and $139 PSF in 2022, 2023 and TTM August 2024.
ShopRite (89,774 SF, 14.9% of NRA, 10.6% of underwritten base rent). ShopRite is a grocery chain owned by the parent company Wakefern Food Corporation. ShopRite started in the 1940’s, when eight mom-and-pop grocers came together to start Wakefern Food Corporation. ShopRite has grown into the largest cooperative in the United States and the largest employer in New Jersey. ShopRite operates 50 individually-owned and 365 affiliate-owned stores, all under its corporate and distribution arm, Wakefern Food Corporation, in nine states: Connecticut, Delaware, Maryland, New Jersey, New York, Pennsylvania, Massachusetts, New Hampshire and Rhode Island. ShopRite has been a tenant at the Gateway Center North Property since 2014. ShopRite operates under a lease that has a current expiration of October 31, 2034, with five five-year renewal options and one three year and eleven month renewal option. ShopRite currently pays a base rent of $31.48 PSF effective November 1, 2024. ShopRite is not required to report sales.
Burlington Coat Factory (73,864 SF, 12.3% of NRA, 11.4% of underwritten base rent). Burlington Coat Factory (S&P: BB+) started approximately 50 years ago as a business selling off-price coats out of a factory building. The company sells an assortment of low priced brand name ladies, men’s, and kids/baby apparel and accessories, home décor and various other products. Burlington Coat Factory operates more than 1,000 stores in 46 states and Puerto Rico, with its corporate headquarters located in Burlington Township, New Jersey. Burlington Coat Factory has been a tenant at the Gateway Center North Property since 2014 and currently has a lease expiration date of February 28, 2030, with three five-year renewal options. Burlington Coat Factory currently pays a base rent of $41.14 PSF and pays 3.0% of annual sales over a $31,281,404 ($424 PSF) sales breakpoint. Burlington Coat Factory reported sales of $419 PSF in 2022 and $427 PSF in 2023.
| THE INFORMATION IN THIS STRUCTURAL AND COLLATERAL TERM SHEET IS NOT COMPLETE AND MAY BE AMENDED PRIOR TO THE TIME OF SALE. THIS TERM SHEET IS NOT AN OFFER TO SELL THESE SECURITIES AND IT IS NOT A SOLICITATION OF AN OFFER TO BUY THESE SECURITIES IN ANY JURISDICTION WHERE THE OFFER OR SALE IS NOT PERMITTED. | ||
| T-45 | ||
| Retail – Anchored | Loan #2 | Cut-off Date Balance: | $73,500,000 | |
| 501 Gateway Drive | Gateway Center North | Cut-off Date LTV: | 67.7% | |
| Brooklyn, NY 11239 | UW NCF DSCR: | 1.20x | ||
| UW NOI Debt Yield: | 8.5% |
The following table presents sales information for certain tenants at the Gateway Center North Property:
| Tenant Sales(1) | |||||
| TTM August 2024 | |||||
| Tenant | SF | 2022 Sales(2) | 2023 Sales(2) | Sales | Sales PSF |
| JCPenney (Ground Lease) | 122,473 | $17,936,910 | $17,862,294 | $17,012,579 | $139 |
| Burlington Coat Factory | 73,864 | $30,930,333 | $31,525,577 | NAV | NAV |
| DSW Shoe Warehouse | 20,088 | $5,705,268 | $3,947,682 | NAV | NAV |
| Petco | 12,117 | $3,896,310 | $2,913,461 | NAV | NAV |
| Nike | 11,940 | $9,698,923 | $11,059,264 | $9,412,061 | $788 |
| Buffalo Wild Wings | 8,002 | $4,109,414 | $2,630,923 | NAV | NAV |
| Applebee's | 7,881 | $7,300,506 | $5,409,442 | NAV | NAV |
| Victoria's Secret | 7,401 | $2,218,993 | $4,475,645 | $4,137,535 | $559 |
| Lane Bryant | 5,909 | $2,022,821 | $1,917,178 | NAV | NAV |
| Panera Bread | 4,208 | $2,506,574 | $3,365,669 | NAV | NAV |
| Carter's Retail | 4,041 | $2,213,071 | $1,934,224 | $1,825,254 | $452 |
| Bath & Body Works | 3,502 | $5,895,523 | $5,887,539 | $5,962,095 | $1,702 |
| Smashburger | 2,155 | $3,180,694 | $3,240,034 | $3,030,106 | $1,406 |
| Davis Visionworks | 1,919 | $1,714,925 | $1,782,552 | NAV | NAV |
| Pizza Studio | 1,156 | $1,333,908 | $504,742 | NAV | NAV |
| (1) | Tenant Sales were provided by the borrower sponsor and represent all tenants that report sales data. |
| (2) | Shown as of December 31 of each respective year. |
The following table presents certain information relating to the tenancy at the Gateway Center North Property:
| Tenant Summary(1) | ||||||||||||
| August 2024 TTM Sales(3) | ||||||||||||
| Tenant Name | Credit Rating (Fitch/ Moody’s/ S&P)(2) | Tenant SF | % of Total SF | Annual UW Rent | % of Total Annual UW Rent | Annual UW Rent PSF | Sales $ | Sales PSF | Occ Cost | Lease Exp | Renewal Option | Term. Option |
| Anchor Tenants | ||||||||||||
| JCPenney (Ground Lease)(4) | NR/NR/NR | 122,473 | 20.4% | $1,253,465 | 4.7% | $10.23 | $17,012,579 | $139 | 7.4% | 8/31/2034 | 11 x 5 yr | None |
| ShopRite | NR/NR/NR | 89,774 | 14.9% | $2,826,086 | 10.6% | $31.48 | NAV | NAV | NAV | 10/31/2034 | (5) | None |
| Burlington Coat Factory | NR/NR/BB+ | 73,864 | 12.3% | $3,038,765 | 11.4% | $41.14 | $31,525,577 | $427 | 9.6% | 2/28/2030 | 3 x 5 yr | None |
| Anchor Tenants Subtotal/Wtd. Avg. | 286,111 | 47.6% | $7,118,316 | 26.7% | $24.88 | |||||||
| Junior Anchors | ||||||||||||
| P.C. Richard & Son | NR/NR/NR | 33,593 | 5.6% | $1,274,854 | 4.8% | $37.95 | NAV | NAV | NAV | 1/31/2027 | (6) | None |
| T.J. Maxx | NR/A2/A | 32,960 | 5.5% | $1,595,264 | 6.0% | $48.40 | NAV | NAV | NAV | 8/31/2029 | 2 x 5 yr | None |
| Urban Air(7) | NR/NR/NR | 32,718 | 5.4% | $1,730,503 | 6.5% | $52.89 | NAV | NAV | NAV | 10/1/2034 | 2 x 5 yr | None |
| Raymour & Flanigan | NR/NR/NR | 31,479 | 5.2% | $1,752,121 | 6.6% | $55.66 | NAV | NAV | NAV | 7/31/2027 | 3 x 5 yr | None |
| DSW Shoe Warehouse | NR/NR/NR | 20,088 | 3.3% | $775,000 | 2.9% | $38.58 | $3,947,682 | $197 | 19.6% | 1/31/2030 | 1 x 5 yr | None |
| Aldi | NR/NR/NR | 16,859 | 2.8% | $925,650 | 3.5% | $54.91 | NAV | NAV | NAV | 11/30/2033 | 4 x 5 yr | None |
| Petco | NR/B3/B | 12,117 | 2.0% | $911,198 | 3.4% | $75.20 | $2,913,461 | $240 | 31.3% | 9/30/2027 | 3 x 5 yr | None |
| Junior Anchors Subtotal/Wtd. Avg. | 179,814 | 29.9% | $8,964,591 | 33.6% | $49.85 | |||||||
| Other Tenants | 112,771 | 18.8% | $10,609,318 | 39.7% | $94.08 | |||||||
| Occupied Collateral Total / Wtd. Avg. | 578,696 | 96.3% | $26,692,225 | 100.0% | $46.12 | |||||||
| Vacant Space | 22,516 | 3.7% | ||||||||||
| Total/Wtd. Avg. | 601,212 | 100.0% | ||||||||||
| (1) | Based on the underwritten rent roll dated September 3, 2024, inclusive of rent steps through October 2025. |
| (2) | Certain ratings are those of the parent company whether or not the parent guarantees the lease. |
| (3) | All sales information is based upon information provided by the borrower sponsor. In certain instances, sales figures represent estimates because the tenants are not required to report, or otherwise may not have reported, sales information on a timely basis. Further, because sales are self-reported by tenants, such information is not independently verified by the borrower sponsor. Sales information for Burlington Coat Factory, DSW Shoe Warehouse and Petco is as of year-end 2023. |
| (4) | JCPenney operates under a ground lease and owns its own improvements. |
| (5) | ShopRite has five five-year renewal options and one three-year and eleven month renewal option. |
| (6) | P.C. Richard & Son has 5 extension periods of 3 years for the first extension, 5 years for the second, third and fourth extensions, and 2 years for the fifth extension. |
| (7) | Urban Air executed its lease in October 2024 and is currently building out its space and is expected to commence rent payments in October 2025. All outstanding landlord obligations and gap rent for twelve months was reserved at origination. We cannot assure you that the tenant will take occupancy or commence paying rent. |
| THE INFORMATION IN THIS STRUCTURAL AND COLLATERAL TERM SHEET IS NOT COMPLETE AND MAY BE AMENDED PRIOR TO THE TIME OF SALE. THIS TERM SHEET IS NOT AN OFFER TO SELL THESE SECURITIES AND IT IS NOT A SOLICITATION OF AN OFFER TO BUY THESE SECURITIES IN ANY JURISDICTION WHERE THE OFFER OR SALE IS NOT PERMITTED. | ||
| T-46 | ||
| Retail – Anchored | Loan #2 | Cut-off Date Balance: | $73,500,000 | |
| 501 Gateway Drive | Gateway Center North | Cut-off Date LTV: | 67.7% | |
| Brooklyn, NY 11239 | UW NCF DSCR: | 1.20x | ||
| UW NOI Debt Yield: | 8.5% |
The following table presents certain information relating to the lease rollover schedule at the Gateway Center North Property:
| Lease Rollover Schedule(1)(2) | ||||||||
| Year | # of Leases Rolling | SF Rolling | Approx. % of SF Rolling | Approx. Cumulative % of SF Rolling | Total UW Rent Rolling | Approx. % of Total UW Rent Rolling | Approx. Cumulative % of Total UW Rent Rolling | UW Rent PSF Rolling |
| MTM | 0 | 0 | 0.0% | 0.0% | $0 | 0.0% | 0.0% | $0.00 |
| 2025 | 1 | 4,208 | 0.7% | 0.7% | $336,640 | 1.3% | 1.3% | $80.00 |
| 2026 | 4 | 21,212 | 3.5% | 4.2% | $1,459,035 | 5.5% | 6.7% | $68.78 |
| 2027 | 6 | 94,525 | 15.7% | 20.0% | $5,834,770 | 21.9% | 28.6% | $61.73 |
| 2028 | 1 | 8,002 | 1.3% | 21.3% | $577,500 | 2.2% | 30.8% | $72.17 |
| 2029(3) | 7 | 63,186 | 10.5% | 31.8% | $4,500,743 | 16.9% | 47.6% | $71.23 |
| 2030 | 6 | 102,684 | 17.1% | 48.9% | $4,823,644 | 18.1% | 65.7% | $46.98 |
| 2031 | 1 | 6,006 | 1.0% | 49.9% | $420,420 | 1.6% | 67.3% | $70.00 |
| 2032 | 1 | 7,401 | 1.2% | 51.1% | $592,080 | 2.2% | 69.5% | $80.00 |
| 2033 | 2 | 19,018 | 3.2% | 54.3% | $1,206,320 | 4.5% | 74.0% | $63.43 |
| 2034 | 6 | 252,454 | 42.0% | 96.3% | $6,941,074 | 26.0% | 100.0% | $27.49 |
| 2035 & Thereafter | 0 | 0 | 0.0% | 96.3% | $0 | 0.0% | 100.0% | $0.00 |
| Vacant | 0 | 22,516 | 3.7% | 100.0% | $0 | 0.0% | 100.0% | $0.00 |
| Total/Wtd. Avg. | 35 | 601,212 | 100.0% | $26,692,225 | 100.0% | $46.12(4) | ||
| (1) | Based on the underwritten rent roll dated September 3, 2024, inclusive of rent steps through October 2025. |
| (2) | Certain tenants may have lease termination options that are exercisable prior to the originally stated expiration date of the related lease and are not considered in the rollover schedule. |
| (3) | The Gateway Center North Mortgage Loan has a maturity date of November 6, 2029. |
| (4) | Wtd. Avg. UW Rent PSF Rolling excludes vacant space. |
The Market. The Gateway Center North Property is located in Brooklyn, New York, along Gateway Drive just north of the Belt Parkway, a major regional expressway. The Gateway Center North Property is visible from the Belt Parkway and is located five miles west of John F. Kennedy International Airport. The area surrounding the Gateway Center North Property is primarily residential, with commercial and industrial development serving the needs of the local population of over 525,000 residents.
The Gateway Center North Property is located in the New York retail market and the North Brooklyn submarket, which includes the neighborhoods of Greenpoint, Williamsburg, Park Slope, Crown Heights, and East New York. According to the appraisal, as of the second quarter of 2024, the New York retail market contains approximately 645.8 million SF of space and the North Brooklyn submarket contains approximately 51.3 million SF, or 7.94% of the total market’s inventory. As of the second quarter of 2024, the overall vacancy rate for the market was 4.03%, with asking rents of $47.56 PSF, and the North Brooklyn submarket had a vacancy rate of 3.05% with asking rents of $54.45 PSF.
According to the appraisal, the 2024 population within a 1-, 3- and 5-mile radius of the Gateway Center North Property was 40,386, 560,297 and 1,732,087, respectively. The 2024 average household income within the same radii was $66,933, $89,647 and $105,003, respectively.
The following table presents certain information relating to the appraisal’s market rent conclusion for the Gateway Center North Property:
| Market Rent Summary | |||
| Space Type | Market Rent PSF | Lease Term (Years) | Rent Increase Projection |
| Anchor | $40.00 | 10 | 10% Yr. 5 |
| Jr. Anchor | $50.00 | 10 | 10% Yr. 5 |
| In-Line (>10,000 SF) | $65.00 | 10 | 10% Yr. 5 |
| In-Line (5,000 - 10,000 SF) | $80.00 | 10 | 10% Yr. 5 |
| In-Line (<5,000 SF) | $125.00 | 10 | 10% Yr. 5 |
| Outparcel - Restaurant | $85.00 | 10 | 10% Yr. 5 |
| Outparcel - Bank | $200.00 | 10 | 10% Yr. 5 |
| THE INFORMATION IN THIS STRUCTURAL AND COLLATERAL TERM SHEET IS NOT COMPLETE AND MAY BE AMENDED PRIOR TO THE TIME OF SALE. THIS TERM SHEET IS NOT AN OFFER TO SELL THESE SECURITIES AND IT IS NOT A SOLICITATION OF AN OFFER TO BUY THESE SECURITIES IN ANY JURISDICTION WHERE THE OFFER OR SALE IS NOT PERMITTED. | ||
| T-47 | ||
| Retail – Anchored | Loan #2 | Cut-off Date Balance: | $73,500,000 | |
| 501 Gateway Drive | Gateway Center North | Cut-off Date LTV: | 67.7% | |
| Brooklyn, NY 11239 | UW NCF DSCR: | 1.20x | ||
| UW NOI Debt Yield: | 8.5% |
The following table presents information regarding certain competitive properties to the Gateway Center North Property:
| Competitive Retail Center Summary(1) | |||||
| Property Name/Location | Year Built/ Renovated | Total NRA (SF) | Total Occupancy | Distance to Subject | Major Tenants |
Gateway Center North 501 Gateway Drive Brooklyn, NY | 2014/NAP | 601,212(2) | 96.3%(2) | NAP | JCPenney, ShopRite, Burlington Coat Factory, P.C. Richard & Son, T.J.Maxx(2) |
Shops at Atlantic Center 625 Atlantic Ave Brooklyn, NY | 1996/NAP | 482,550 | 92.2% | 7.1 miles | Burlington, Marshalls, Old Navy, Stop & Shop |
Gateway Center South(3) 339-579 Gateway Dr Brooklyn, NY | 2001/NAP | 669,293 | 100.0% | 0.2 miles | The Home Depot, Target, BJ’s
|
Kings Plaza Shopping Center 5100 Kings Plz Brooklyn, NY | 1970/2018 | 1,146,000 | 100.0% | 5.0 miles | Burlington, Lowe’s, Macy’s |
Green Acres Mall 1150-2034 Green Acres Mall Valley Stream, NY | 1956/2016 | 2,042,000 | 95.8% | 8.6 miles | BJ’s, Macy’s, Walmart |
Five Towns Shopping Center 253-01 Rockaway Blvd Rosedale, NY | 1968/1990 | 408,096 | 99.0% | 8.2 miles | Lowe’s, Party City, T.J.Maxx |
The Shops at Atlas Park 8000 Cooper Ave Glendale, NY | 2006/NAP | 509,068 | 93.5% | 6.0 miles | Burlington, Marshalls, Old Navy, Stop & Shop |
| (1) | Source: Third party report, unless otherwise indicated. |
| (2) | Information is based on the underwritten rent roll dated September 3, 2024. |
| (3) | Gateway Center South is also owned by the borrower sponsor. |
Appraisal. The appraisal concluded to an “as-is” value for the Gateway Center North Property of $443,000,000 as of September 6, 2024.
Environmental Matters. According to the Phase I environmental site assessment dated September 19, 2024, there was no evidence of any recognized environmental conditions at the Gateway Center North Property.
| THE INFORMATION IN THIS STRUCTURAL AND COLLATERAL TERM SHEET IS NOT COMPLETE AND MAY BE AMENDED PRIOR TO THE TIME OF SALE. THIS TERM SHEET IS NOT AN OFFER TO SELL THESE SECURITIES AND IT IS NOT A SOLICITATION OF AN OFFER TO BUY THESE SECURITIES IN ANY JURISDICTION WHERE THE OFFER OR SALE IS NOT PERMITTED. | ||
| T-48 | ||
| Retail – Anchored | Loan #2 | Cut-off Date Balance: | $73,500,000 | |
| 501 Gateway Drive | Gateway Center North | Cut-off Date LTV: | 67.7% | |
| Brooklyn, NY 11239 | UW NCF DSCR: | 1.20x | ||
| UW NOI Debt Yield: | 8.5% |
Operating History and Underwritten Net Cash Flow. The following table presents certain information relating to the historical operating performance and Underwritten Net Cash Flow at the Gateway Center North Property:
| Cash Flow Analysis | ||||||
| 2021 | 2022 | 2023 | 8/31/2024 TTM | UW | UW PSF | |
| Base Rental Income(1) | $25,317,063 | $25,398,637 | $25,943,888 | $26,383,569 | $27,818,025 | $46.27 |
| Straight Line Rent(2) | $0 | $0 | $0 | $0 | $2,616 | $0.00 |
| Percentage Rent(3) | $436,246 | $290,290 | $86,412 | $109,523 | $57,476 | $0.10 |
| Expense Reimbursements | $7,853,283 | $8,161,537 | $8,203,391 | $8,325,205 | $8,614,796 | $14.33 |
| Deferred Rent Repay/Abatements | ($182,186) | $0 | $0 | $0 | $0 | $0.00 |
| Net Rental Income | $33,424,407 | $33,850,465 | $34,233,691 | $34,818,297 | $36,492,912 | $60.70 |
| (Vacancy & Credit Loss) | $0 | $0 | $0 | $0 | ($1,470,739) | ($2.45) |
| Direct Billed Income | $299,728 | $187,180 | $226,992 | $242,864 | $198,320 | $0.33 |
| Other Income(4) | $472,736 | $441,596 | $388,014 | $390,231 | $420,104 | $0.70 |
| Effective Gross Income | $34,196,870 | $34,479,241 | $34,848,697 | $35,451,392 | $35,640,597 | $59.28 |
| Real Estate Taxes(5) | $3,882,864 | $4,046,170 | $4,035,096 | $4,049,038 | $4,186,595 | $6.96 |
| Insurance | $251,891 | $298,571 | $368,493 | $402,043 | $377,939 | $0.63 |
| Other Operating Expenses | $6,195,429 | $5,592,007 | $5,456,601 | $5,457,574 | $5,594,587 | $9.31 |
| Total Operating Expenses | $10,330,185 | $9,936,749 | $9,860,190 | $9,908,655 | $10,159,122 | $16.90 |
| Net Operating Income | $23,866,686 | $24,542,492 | $24,988,506 | $25,542,737 | $25,481,475 | $42.38 |
| Replacement Reserves | $0 | $0 | $0 | $0 | $71,801 | $0.12 |
| TI/LC | $0 | $0 | $0 | $0 | $478,672 | $0.80 |
| Net Cash Flow | $23,866,686 | $24,542,492 | $24,988,506 | $25,542,737 | $24,931,003 | $41.47 |
| Occupancy % | 100.0% | 99.6% | 100.0% | 96.3%(6) | 94.7%(7) | |
| NOI DSCR(8) | 1.15x | 1.18x | 1.20x | 1.23x | 1.23x | |
| NCF DSCR(8) | 1.15x | 1.18x | 1.20x | 1.23x | 1.20x | |
| NOI Debt Yield(8) | 8.0% | 8.2% | 8.3% | 8.5% | 8.5% | |
| NCF Debt Yield(8) | 8.0% | 8.2% | 8.3% | 8.5% | 8.3% | |
| (1) | Base Rental Income is based on the underwritten rent roll dated September 3, 2024, inclusive of rent steps through October 2025 and rent for Urban Air, which executed its lease in October 2024 and is expected to commence paying rent in October 2025. All outstanding landlord obligations and gap rent for twelve months was reserved at origination. We cannot assure you that the tenant will take occupancy or commence paying rent. |
| (2) | UW Straight Line Rent includes rent averaged over the loan term for T-Mobile and Bank of America. |
| (3) | UW Percentage Rent is based on the terms of applicable leases using TTM August 2024 sales figures. |
| (4) | Other income is based on the borrower sponsor’s budget and includes income from solar lease, storage income, late fees, vending income and other miscellaneous income. |
| (5) | The Gateway North Center Property currently benefits from a 25-year ICAP Tax Abatement, which has been in place since the 2015/2016 tax year and will continue through the 2040/2041 tax year. The tax abatement for the 2024/2025 tax year is approximately $8.0 million and the underwritten real estate taxes and expense reimbursements shown above are net of the abatement. |
| (6) | Represents occupancy per the underwritten rent roll dated September 3, 2024. |
| (7) | Based on the economic vacancy of 5.3%. |
| (8) | DSCRs and Debt Yields are based on the Gateway Center North Whole Loan. |
Escrows and Reserves. At origination, the borrower deposited into escrow (i) $1,353,710 for tenant improvement allowances and leasing commissions related to Urban Air and (ii) $1,730,503 for a gap rent reserve related to Urban Air.
Real Estate Taxes – During a Cash Sweep Event Period (as defined below), the borrower is required make monthly deposits equal to 1/12th of the annual estimated tax payments during the ensuing 12 months.
Insurance – During a Cash Sweep Event Period, the borrower is required to make monthly deposits equal to 1/12th of the annual estimated insurance premiums; however, provided no event of default is continuing, the borrower will not be required to make monthly deposits so long as the Gateway Center North Property is insured under a blanket policy and the borrower provides evidence of renewal and proof of payment of insurance premiums.
Replacement Reserve – During a Cash Sweep Event Period, the borrower is required to make monthly deposits of approximately $5,983 for capital expenditures, capped at approximately $143,599.
TI/LC Reserve – During a Cash Sweep Event Period, the borrower is required to make monthly deposits of approximately $39,889 for tenant improvements and leasing commissions, capped at $957,344.
| THE INFORMATION IN THIS STRUCTURAL AND COLLATERAL TERM SHEET IS NOT COMPLETE AND MAY BE AMENDED PRIOR TO THE TIME OF SALE. THIS TERM SHEET IS NOT AN OFFER TO SELL THESE SECURITIES AND IT IS NOT A SOLICITATION OF AN OFFER TO BUY THESE SECURITIES IN ANY JURISDICTION WHERE THE OFFER OR SALE IS NOT PERMITTED. | ||
| T-49 | ||
| Retail – Anchored | Loan #2 | Cut-off Date Balance: | $73,500,000 | |
| 501 Gateway Drive | Gateway Center North | Cut-off Date LTV: | 67.7% | |
| Brooklyn, NY 11239 | UW NCF DSCR: | 1.20x | ||
| UW NOI Debt Yield: | 8.5% |
Lockbox and Cash Management. The Gateway Center North Whole Loan is structured with a hard lockbox and springing cash management. The borrower is required to cause all tenants at the Gateway Center North Property to pay rents directly into the account controlled by the lender (the “Lockbox Account”), and to deposit any rents otherwise received by the borrower or property manager into such Lockbox Account within two business days after receipt. If a Cash Sweep Event Period is not in effect, all funds in the Lockbox Account will be swept daily to the borrower’s operating account. During a Cash Sweep Event Period, all funds deposited into the Lockbox Account are required to be swept each business day into a cash management account controlled by the lender to be applied and disbursed in accordance with the Gateway Center North Whole Loan documents.
A “Cash Sweep Event Period” will commence upon the occurrence of any of the following events:
| (i) | an event of default; |
| (ii) | the borrower filing for bankruptcy; or |
| (iii) | the net cash flow debt service coverage ratio (“NCF DSCR”) on the Gateway Center North Whole Loan being less than 1.10x, tested quarterly. |
A “Cash Sweep Event Period” will end upon:
| ● | with respect to clause (i) above, the cure of such event of default; |
| ● | with respect to clause (ii) above, the bankruptcy proceeding being discharged; or |
| ● | with respect to clause (iii) above, the NCF DSCR being greater than 1.10x for one calendar quarter. |
For purposes of the NCF DSCR test, the net cash flow is the difference between (A) the annualized amount of all operating income including (i) leases with rent commencing during the succeeding 12 months provided all rent abatements have been reserved by the lender and (ii) contractual rent escalations during the succeeding 12 months, and excluding disqualified leases and non-recurring revenue minus (B) actual costs and expenses paid for operations, maintenance and management for the trailing twelve months, adjusted for (i) known increases in taxes and insurance premiums, TI/LCs equal to $0.35 PSF (the “TI Deduction”) and capital expenditures equal to $0.10 PSF and (ii) excluding one-time expenses, extraordinary expenses, non-cash items, debt service and contributions to any reserve accounts. The TI Deduction will be reduced by 1/10th the positive difference of the amount deposited to the TI/LC reserve minus the amount disbursed (so long as the related tenant’s rent is included in operating income in clause (A) above). The NCF DSCR on the Gateway Center North Whole Loan at the time of loan origination was 1.20x.
Terrorism Insurance. The Gateway Center North Whole Loan documents require that the “all risk” insurance policy required to be maintained by the borrower provides coverage for terrorism in an amount equal to the full replacement cost of the property, as well as business interruption insurance covering no less than the 24-month period following the occurrence of a casualty event plus a 6-month extended period of indemnity (provided that if the Terrorism Risk Insurance Program Reauthorization Act of 2007 or a similar statute is not in effect, the borrower will not be obligated to pay terrorism insurance premiums in excess of two times the then-applicable annual premium for the property insurance coverage). The Gateway Center North Whole Loan documents allow Relsure Vermont Inc., a licensed captive insurance company (“RVI”), to provide terrorism coverage, so long as (i) the policy issued by RVI has (A) no aggregate limit, and (B) a deductible of no greater than $250,000, and (ii) certain conditions are satisfied, including that RVI obtains reinsurance with a cut through endorsement acceptable to the lender and the rating agencies from an insurance company meeting the rating requirements set forth in the related loan documents for the remaining portion of terrorism coverage not subject to the applicable federal backstop percentage, the Terrorism Risk Insurance Program Reauthorization Act of 2007 or a similar statute is in effect and except with respect to the $250,000 deductible permitted, those covered losses which are not reinsured by the federal government under the Terrorism Risk Insurance Program Reauthorization Act of 2007 and paid to RVI will be reinsured with a cut through endorsement acceptable to the lender and the rating agencies by insurance companies that are qualified insurers or maintain such higher rating as may be required by a rating agency, not to exceed “AA-” with S&P and “A2” with Moody’s. The related loan documents also allow the borrower to utilize a “Retention Amount” which is funded by RVI in addition to the required deductible for all losses, excluding wind and earthquake related losses, so long as (1) the retention amount is aggregated annually, (2) the retention amount remain prefunded at all times during the term of the Gateway Center North Whole Loan and (3) the borrower has submitted evidence satisfactory to the lender and rating agencies of such prefunded arrangement at the request of the lender or a rating agency. The “Retention Amount” is $5,000,000 aggregate deductible, subject to a $2,500,000 per occurrence deductible. See “Risk Factors—Risks Relating to the Mortgage Loans—Terrorism Insurance May Not Be Available for All Mortgaged Properties” in the prospectus.
| THE INFORMATION IN THIS STRUCTURAL AND COLLATERAL TERM SHEET IS NOT COMPLETE AND MAY BE AMENDED PRIOR TO THE TIME OF SALE. THIS TERM SHEET IS NOT AN OFFER TO SELL THESE SECURITIES AND IT IS NOT A SOLICITATION OF AN OFFER TO BUY THESE SECURITIES IN ANY JURISDICTION WHERE THE OFFER OR SALE IS NOT PERMITTED. | ||
| T-50 | ||
| Office - Suburban | Loan #3 | Cut-off Date Balance: | $73,500,000 | |
| 1331-1333 North California Boulevard | The Plaza at Walnut Creek | Cut-off Date LTV: | 59.8% | |
| Walnut Creek, CA 94596 | UW NCF DSCR: | 2.66x | ||
| UW NOI Debt Yield: | 18.2% |
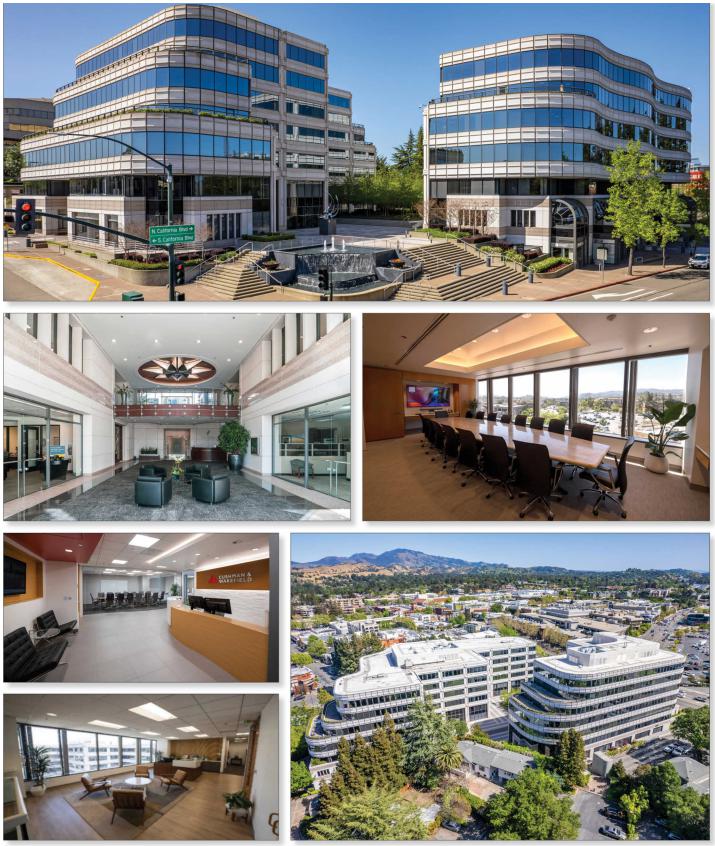
| THE INFORMATION IN THIS STRUCTURAL AND COLLATERAL TERM SHEET IS NOT COMPLETE AND MAY BE AMENDED PRIOR TO THE TIME OF SALE. THIS TERM SHEET IS NOT AN OFFER TO SELL THESE SECURITIES AND IT IS NOT A SOLICITATION OF AN OFFER TO BUY THESE SECURITIES IN ANY JURISDICTION WHERE THE OFFER OR SALE IS NOT PERMITTED. | ||
| T-51 | ||
| Office - Suburban | Loan #3 | Cut-off Date Balance: | $73,500,000 | |
| 1331-1333 North California Boulevard | The Plaza at Walnut Creek | Cut-off Date LTV: | 59.8% | |
| Walnut Creek, CA 94596 | UW NCF DSCR: | 2.66x | ||
| UW NOI Debt Yield: | 18.2% |
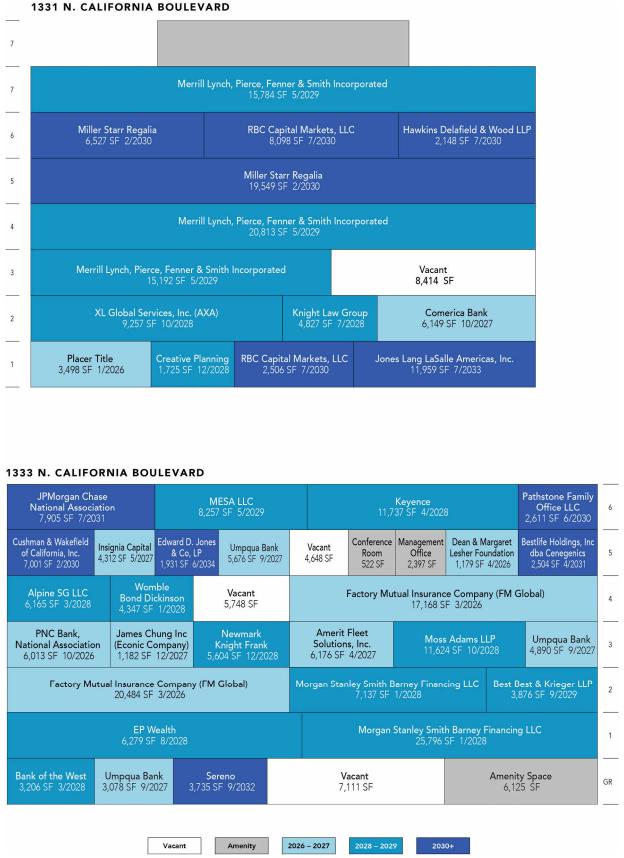
| THE INFORMATION IN THIS STRUCTURAL AND COLLATERAL TERM SHEET IS NOT COMPLETE AND MAY BE AMENDED PRIOR TO THE TIME OF SALE. THIS TERM SHEET IS NOT AN OFFER TO SELL THESE SECURITIES AND IT IS NOT A SOLICITATION OF AN OFFER TO BUY THESE SECURITIES IN ANY JURISDICTION WHERE THE OFFER OR SALE IS NOT PERMITTED. | ||
| T-52 | ||
| Office - Suburban | Loan #3 | Cut-off Date Balance: | $73,500,000 | |
| 1331-1333 North California Boulevard | The Plaza at Walnut Creek | Cut-off Date LTV: | 59.8% | |
| Walnut Creek, CA 94596 | UW NCF DSCR: | 2.66x | ||
| UW NOI Debt Yield: | 18.2% |
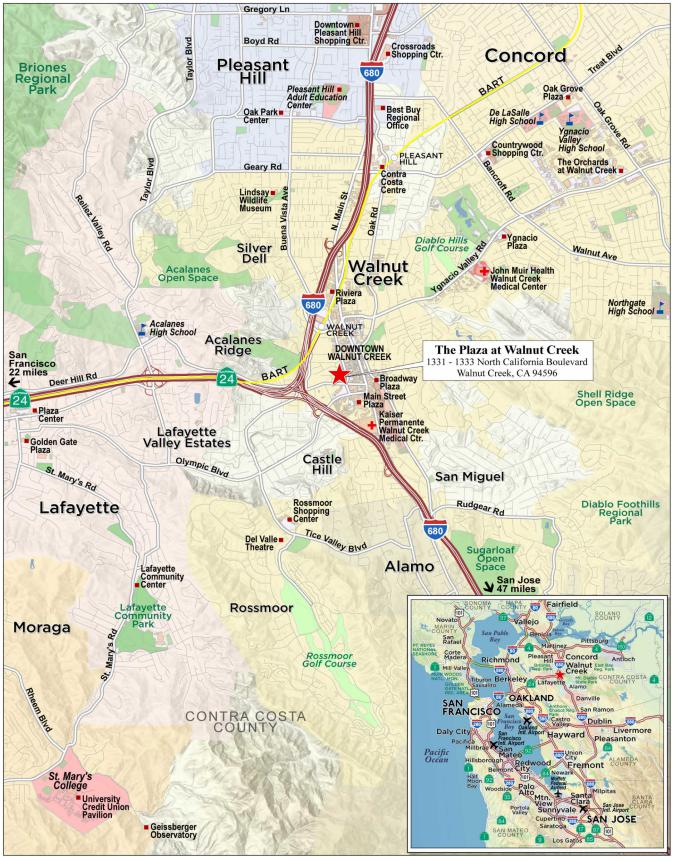
| THE INFORMATION IN THIS STRUCTURAL AND COLLATERAL TERM SHEET IS NOT COMPLETE AND MAY BE AMENDED PRIOR TO THE TIME OF SALE. THIS TERM SHEET IS NOT AN OFFER TO SELL THESE SECURITIES AND IT IS NOT A SOLICITATION OF AN OFFER TO BUY THESE SECURITIES IN ANY JURISDICTION WHERE THE OFFER OR SALE IS NOT PERMITTED. | ||
| T-53 | ||
| Mortgage Loan No. 3 – The Plaza at Walnut Creek |
| Mortgage Loan Information | Property Information | |||||
| Mortgage Loan Seller: | WFB | Single Asset/Portfolio: | Single Asset | |||
| Credit Assessment (Fitch/Moody’s/KBRA): | NR/NR/NR | Location: | Walnut Creek, CA 94596 | |||
| Original Balance(1): | $73,500,000 | General Property Type: | Office | |||
| Cut-off Date Balance(1): | $73,500,000 | Detailed Property Type: | Suburban | |||
| % of Initial Pool Balance: | 9.97% | Title Vesting: | Fee | |||
| Loan Purpose: | Recapitalization | Year Built/Renovated: | 1985-1987/NAP | |||
| Borrower Sponsor: | SFF Realty Fund IV, L.P. | Size: | 352,870 SF | |||
| Guarantor: | SFF Realty Fund IV, L.P. | Cut-off Date Balance PSF(1): | $275 | |||
| Mortgage Rate: | 6.59800% | Maturity Balance PSF(1): | $275 | |||
| Note Date: | 1/22/2025 | Property Manager: | Cushman & Wakefield U.S., Inc. | |||
| Maturity Date: | 2/11/2030 | Underwriting and Financial Information(1) | ||||
| Term to Maturity: | 60 months | UW NOI(4): | $17,719,413 | |||
| Amortization Term: | 0 months | UW NCF | $17,275,455 | |||
| IO Period: | 60 months | UW NOI Debt Yield: | 18.2% | |||
| Seasoning: | 0 months | UW NCF Debt Yield: | 17.8% | |||
| Prepayment Provisions(2): | L(24),D(29),O(7) | UW NOI Debt Yield at Maturity: | 18.2% | |||
| Lockbox/Cash Mgmt Status: | Soft/Springing | UW NCF DSCR: | 2.66x | |||
| Additional Debt Type(1): | Pari Passu | Most Recent NOI(4): | $15,335,309 (9/19/2024 T-9 Annualized) | |||
| Additional Debt Balance(1): | $23,700,000 | 2nd Most Recent NOI(4): | $13,121,598 (12/31/2023) | |||
| Future Debt Permitted (Type): | No (NAP) | 3rd Most Recent NOI(4): | $9,875,575 (12/31/2022) | |||
| Reserves(3) | Most Recent Occupancy: | 92.7% (1/31/2025) | ||||
| Type | Initial | Monthly | Cap | 2nd Most Recent Occupancy: | 89.0% (12/31/2023) | |
| RE Taxes: | $0 | $77,188 | NAP | 3rd Most Recent Occupancy: | 89.4% (12/31/2022) | |
| Insurance: | $0 | Springing | NAP | Appraised Value (as of): | $162,500,000 (12/4/2024) | |
| Replacement Reserve: | $0 | $7,352 | NAP | Appraised Value PSF: | $461 | |
| TI/LC Reserves: | $3,500,000 | $58,812 | NAP | Cut-off Date LTV Ratio: | 59.8% | |
| Outstanding TI/LC Reserve: | $0(5) | $0 | NAP | Maturity Date LTV Ratio: | 59.8% | |
| Free Rent Reserve: | $0(5) | $0 | NAP | |||
| Sources and Uses | ||||||
| Sources | Proceeds | % of Total | Uses | Proceeds | % of Total | |
| Whole Loan Amount: | $97,200,000 | 58.2% | Purchase Price: | $162,000,000 | 96.9% | |
| Sponsor Equity: | $69,945,791 | 41.8% | Upfront Reserves: | $3,500,000 | 2.1% | |
| Closing Costs: | $1,645,791 | 1.0% | ||||
| Total Sources: | $167,145,791 | 100.0% | Total Uses: | $167,145,791 | 100.0% | |
| (1) | The Plaza at Walnut Creek Mortgage Loan (as defined below) is part of a whole loan evidenced by two pari passu promissory notes with an aggregate original principal balance of $97,200,000. The financial information presented above is based on The Plaza at Walnut Creek Whole Loan (as defined below). |
| (2) | Defeasance of The Plaza at Walnut Creek Whole Loan is permitted at any time after the date that is the earliest to occur of (i) two years after the closing date of the securitization that includes the last note to be securitized and (ii) March 11, 2028. The assumed defeasance lockout period of 24 payments is based on the anticipated closing date of the BANK5 2025-5YR13 securitization trust in February 2025. The actual defeasance lockout period may be longer. |
| (3) | See “Escrows and Reserves” below for further discussion of reserve requirements. |
| (4) | The increase in Net Operating Income from 2022 to UW was primarily attributed to partial/full year rents for new/expansion leases commencing in 2023 and 2024 and an approximately $1.8 million decrease in free rent booked in 2023. |
| (5) | In lieu of a reserve, the total amount of $4,579,274 in outstanding TILCs and free rent was guaranteed by the guarantor. |
The Mortgage Loan. The third largest mortgage loan (“The Plaza at Walnut Creek Mortgage Loan”) is part of a whole loan (“The Plaza at Walnut Creek Whole Loan”) evidenced by two pari passu promissory notes with an aggregate original principal amount of $97,200,000. The Plaza at Walnut Creek Whole Loan is secured by a first priority mortgage encumbering the borrower’s fee interest in an office building totaling 352,870 SF located in Walnut Creek, California (“The Plaza at Walnut Creek Property”). The Plaza at Walnut Creek Mortgage Loan is evidenced by the controlling Note A-1, with an outstanding principal balance of $73,500,000 as of the Cut-off Date. The Plaza at Walnut Creek Whole Loan will be serviced pursuant to the pooling and servicing agreement for the BANK5 2025-5YR13 transaction. See “Description of the Mortgage Pool—The Serviced Pari Passu Whole Loans” and “Pooling and Servicing Agreement” in the Preliminary Prospectus.
| The Plaza at Walnut Creek Whole Loan Summary | ||||
| Note | Original Balance | Cut-off Date Balance | Note Holder | Controlling Note |
| A-1 | $73,500,000 | $73,500,000 | BANK5 2025-5YR13 | Yes |
| A-2(1) | $23,700,000 | $23,700,000 | WFB | No |
| Total | $97,200,000 | $97,200,000 | ||
| (1) | Expected to be contributed to one or more future securitization trust(s). |
| THE INFORMATION IN THIS STRUCTURAL AND COLLATERAL TERM SHEET IS NOT COMPLETE AND MAY BE AMENDED PRIOR TO THE TIME OF SALE. THIS TERM SHEET IS NOT AN OFFER TO SELL THESE SECURITIES AND IT IS NOT A SOLICITATION OF AN OFFER TO BUY THESE SECURITIES IN ANY JURISDICTION WHERE THE OFFER OR SALE IS NOT PERMITTED. | ||
| T-54 | ||
| Office - Suburban | Loan #3 | Cut-off Date Balance: | $73,500,000 | |
| 1331-1333 North California Boulevard | The Plaza at Walnut Creek | Cut-off Date LTV: | 59.8% | |
| Walnut Creek, CA 94596 | UW NCF DSCR: | 2.66x | ||
| UW NOI Debt Yield: | 18.2% |
The Borrower and the Borrower Sponsor. The borrower is SFF PWC LLC, a special purpose, bankruptcy-remote entity and a Delaware limited liability company with one independent director.
The borrower sponsor and non-recourse carveout guarantor is SFF Realty Fund IV, L.P. PSAI Realty Partners (“PRP”) and its successor entity serve as the general partner of SFF Realty Fund IV, L.P. and are led by its three Managing Directors/Key Principals: Peter Sullivan, Michael Feldman and Erik Foraker. The PRP entities have been active buyers of San Francisco Bay Area office and industrial properties since 1993.
The Property. The Plaza at Walnut Creek Property comprises two, seven-story multi-tenant office buildings totaling 352,870 SF located on a 3.02-acre site in Walnut Creek, California. Built in 1985 and 1987, The Plaza at Walnut Creek Property includes an existing conference center with an outdoor plaza and has direct access to shopping and experiential retail within downtown Walnut Creek. The Plaza at Walnut Creek Property has a three-level parking garage with 770 parking spaces, in addition to a small surface lot with 26 parking spaces, which results in a parking ratio of approximately 2.3 spaces per 1,000 SF of NRA. As of January 31, 2025, The Plaza at Walnut Creek Property was 92.7% occupied by 33 tenants and the 10-year average occupancy is 92.9%.
Major Tenants.
Merrill Lynch, Pierce, Fenner & Smith Incorporated (51,789 SF, 14.7% of NRA; 16.6% of underwritten base rent). Merrill Lynch, Pierce, Fenner & Smith Incorporated (“Merrill Lynch”), was founded in 1914 and is the investment and wealth management division of Bank of America. The firm offers financial solutions, including retirement planning, Individual Retirement Accounts (IRAs), corporate and small business retirement plans, and consumer lending. Merrill Lynch has been a tenant since 1998 and is on a lease expiring in May 2029 with two, five-year extension options and no termination options; however, Merrill Lynch has a one-time right to reduce the square footage under its lease by 6,786 SF as of September 30, 2026, provided that the tenant delivers to the landlord written notice exercising its contraction option no later than September 30, 2025.
Factory Mutual Insurance Company (FM Global) (37,652 SF, 10.7% of NRA; 11.8% of underwritten base rent). Factory Mutual Insurance Company (“FM”) (formerly FM Global) is an American mutual insurance company headquartered in Johnston, Rhode Island, United States. FM provides businesses with comprehensive insurance, loss prevention, and risk management solutions, serving one in four Fortune 500 companies. FM has been a tenant at The Plaza at Walnut Creek Property since 2013 and is on a lease expiring in March 2026 with one, five-year extension option and no termination options.
Morgan Stanley Smith Barney Financing LLC (32,933 SF, 9.3% of NRA; 10.0% of underwritten base rent). Morgan Stanley Smith Barney Financing LLC (“Morgan Stanley”) is an American multinational investment bank and financial services company headquartered in Midtown Manhattan. Morgan Stanley was founded in 1935 and provides a comprehensive range of investment banking, securities, wealth management, and investment management services. Morgan Stanley operates in 42 countries with approximately 80,000 employees. Morgan Stanley has been a tenant at The Plaza at Walnut Creek Property since 1987 and is on a lease expiring in January 2028 with two, five-year extension options and no termination options.
The following table presents certain information relating to the tenancy at The Plaza at Walnut Creek Property:
| Tenant Summary(1) | |||||||||
| Tenant Name | Credit Rating (Fitch/Moody's/S&P)(2) | Tenant SF | Approx % of Total SF | Annual UW Rent(3) | % of Total Annual UW Rent(3) | Annual UW Rent PSF(3) | Lease Expiration | Term. Option (Y/N) | Renewal Options |
| Merrill Lynch, Pierce, Fenner & Smith Incorporated | AA-/A1/A- | 51,789 | 14.7% | $3,737,891 | 16.6% | $72.18 | 5/31/2029 | Y(4) | 2 x 5 Yr |
| Factory Mutual Insurance Company (FM Global) | NR/NR/AA- | 37,652 | 10.7% | $2,653,498 | 11.8% | $70.47 | 3/31/2026 | N | 1 x 5 Yr |
| Morgan Stanley Smith Barney Financing LLC | A+/A1/A- | 32,933 | 9.3% | $2,245,575 | 10.0% | $68.19 | 1/31/2028 | N | 2 x 5 Yr |
| Miller Starr Regalia(5) | NR/NR/NR | 26,076 | 7.4% | $1,796,115 | 8.0% | $68.88 | 2/28/2030 | N | 1 x 5 Yr |
| Umpqua Bank | BBB+/NR/BBB- | 13,644 | 3.9% | $984,703 | 4.4% | $72.17 | 9/30/2027 | N | 1 x 5 Yr |
| Subtotal/Wtd. Avg. | 162,094 | 45.9% | $11,417,782 | 50.8% | $70.44 | ||||
| Other Tenants | 164,855 | 46.7% | $11,078,777 | 49.2% | $67.20 | ||||
| Occupied Collateral Total | 326,949 | 92.7% | $22,496,559 | 100.0% | $68.81 | ||||
| Vacant Space | 25,921 | 7.3% | |||||||
| Total/Wtd. Avg. | 352,870 | 100.0% | |||||||
| (1) | Based on the underwritten rent roll dated January 31, 2025. |
| (2) | Represents the credit rating of the parent company, whether or not the parent company guarantees the lease. |
| (3) | The Annual UW Rent, % of Total Annual UW Rent and Annual UW Rent PSF includes rent steps through January 2026 totaling $375,696 and straight line rent averaging for investment grade tenants totaling $421,843. |
| (4) | Merrill Lynch has a one-time right to reduce the square footage under its lease by 6,786 SF as of September 30, 2026, provided that the tenant delivers to the landlord written notice exercising its contraction option no later than September 30, 2025. |
| (5) | Miller Starr Regalia subleases 2,000 SF (approximately 7.7% of its total space) effective January 1, 2025 through December 31, 2029. |
| THE INFORMATION IN THIS STRUCTURAL AND COLLATERAL TERM SHEET IS NOT COMPLETE AND MAY BE AMENDED PRIOR TO THE TIME OF SALE. THIS TERM SHEET IS NOT AN OFFER TO SELL THESE SECURITIES AND IT IS NOT A SOLICITATION OF AN OFFER TO BUY THESE SECURITIES IN ANY JURISDICTION WHERE THE OFFER OR SALE IS NOT PERMITTED. | ||
| T-55 | ||
| Office - Suburban | Loan #3 | Cut-off Date Balance: | $73,500,000 | |
| 1331-1333 North California Boulevard | The Plaza at Walnut Creek | Cut-off Date LTV: | 59.8% | |
| Walnut Creek, CA 94596 | UW NCF DSCR: | 2.66x | ||
| UW NOI Debt Yield: | 18.2% |
The following table presents certain information relating to the lease rollover schedule at The Plaza at Walnut Creek Property:
| Lease Rollover Schedule(1)(2) | ||||||||
| Year | # of Leases Rolling | SF Rolling | Approx. % of Total SF Rolling | Approx. Cumulative % of SF Rolling | Total UW Rent Rolling(3) | Approx. % of Total Rent Rolling | Approx. Cumulative % of Total Rent Rolling | UW Rent PSF Rolling(3) |
| MTM/2025 | 0 | 9,044(4) | 2.6% | 2.6% | $0 | 0.0% | 0.0% | $0.00 |
| 2026 | 4 | 48,342 | 13.7% | 16.3% | $3,423,943 | 15.2% | 15.2% | $70.83 |
| 2027 | 5 | 31,463 | 8.9% | 25.2% | $2,233,894 | 9.9% | 25.1% | $71.00 |
| 2028 | 11 | 97,704 | 27.7% | 52.9% | $6,833,044 | 30.4% | 55.5% | $69.94 |
| 2029 | 3 | 63,922 | 18.1% | 71.0% | $4,580,282 | 20.4% | 75.9% | $71.65 |
| 2030 | 5 | 48,440 | 13.7% | 84.7% | $3,420,313 | 15.2% | 91.1% | $70.61 |
| 2031 | 2 | 10,409 | 2.9% | 87.7% | $744,232 | 3.3% | 94.4% | $71.50 |
| 2032 | 1 | 3,735 | 1.1% | 88.7% | $269,368 | 1.2% | 95.6% | $72.12 |
| 2033 | 1 | 11,959 | 3.4% | 92.1% | $852,587 | 3.8% | 99.4% | $71.29 |
| 2034 | 1 | 1,931 | 0.5% | 92.7% | $138,895 | 0.6% | 100.0% | $71.93 |
| 2035 | 0 | 0 | 0.0% | 92.7% | $0 | 0.0% | 100.0% | $0.00 |
| Thereafter | 0 | 0 | 0.0% | 92.7% | $0 | 0.0% | 100.0% | $0.00 |
| Vacant | 0 | 25,921 | 7.3% | 100.0% | $0 | 0.0% | 100.0% | $0.00 |
| Total/Wtd. Avg. | 33 | 352,870 | 100.0% | $22,496,559 | 100.0% | $68.81 | ||
| (1) | Based on the underwritten rent roll dated January 31, 2025 and includes rent steps through January 2026 totaling $375,696 and straight line rent averaging for investment grade tenants totaling $421,843. |
| (2) | Certain tenants may have lease termination options that are exercisable prior to the stated expiration date of the subject lease or leases which are not considered in the Lease Rollover Schedule. |
| (3) | Total UW Rent Rolling and UW Rent PSF Rolling does not include vacant space. |
| (4) | Consists of 2,397 SF of management space and 6,647 SF of amenity space. |
The Market. The Plaza at Walnut Creek Property is located in Walnut Creek, California, 0.7 miles from Walnut Creek Bay Area Rapid Transit Station. The Plaza at Walnut Creek Property is accessed from three streets, with the main entrance and primary point of ingress/egress being North California Boulevard. Major transportation arterials within proximity to the subject include Highway 24 and Interstate 680, providing linkage to the surrounding area, including Oakland, California. Buchanan Field Airport is located approximately 7.0 miles away from The Plaza at Walnut Creek Property. According to the appraisal, the estimated 2024 population within a one, three and five-mile radius was approximately 17,223, 103,175 and 205,555 respectively, and the estimated 2024 average household income within the same radii was approximately $187,315, $201,166, and $206,562, respectively.
According to the appraisal, The Plaza at Walnut Creek Property is located within Downtown Walnut Creek Office submarket of Contra Costa County, California. As of the third quarter of 2024, the Downtown Walnut Creek Office submarket reported a total inventory of approximately 8.68 million SF with a 21.8% vacancy rate and an average asking rent of $41.02 PSF, net. The appraiser identified four directly comparable office leases located within Contra Costa County with rents ranging from $58.20 to $72.60 PSF, Full-Service Gross. The appraiser concluded a market rent for The Plaza at Walnut Creek Property of $69.00, Full-Service Gross for the Office and $68.40 PSF, Full-Service Gross for the Office-Large.
The following table presents certain information relating to the appraisal’s market rent conclusions for The Plaza at Walnut Creek Property:
| Market Rent Summary | ||
| Office | Office-Large | |
| Market Rent (PSF) | $69.00 | $68.40 |
| Lease Term (Years) | 5 | 7 |
| Lease Type | Full-Service Gross | Full-Service Gross |
| Escalations | 3.0% annually | 3.0% annually |
| Tenant Improvements (New/Renewal | $50 / $20 | $50 / $20 |
| Leasing Commissions (New/Renewal) | 7.5% / 3.8% | 7.5% / 3.8% |
| Free Rent (Months) (New/Renewal) | 5 / 3 | 7 / 4 |
| Source: Appraisal. |
| THE INFORMATION IN THIS STRUCTURAL AND COLLATERAL TERM SHEET IS NOT COMPLETE AND MAY BE AMENDED PRIOR TO THE TIME OF SALE. THIS TERM SHEET IS NOT AN OFFER TO SELL THESE SECURITIES AND IT IS NOT A SOLICITATION OF AN OFFER TO BUY THESE SECURITIES IN ANY JURISDICTION WHERE THE OFFER OR SALE IS NOT PERMITTED. | ||
| T-56 | ||
| Office - Suburban | Loan #3 | Cut-off Date Balance: | $73,500,000 | |
| 1331-1333 North California Boulevard | The Plaza at Walnut Creek | Cut-off Date LTV: | 59.8% | |
| Walnut Creek, CA 94596 | UW NCF DSCR: | 2.66x | ||
| UW NOI Debt Yield: | 18.2% |
The following table presents certain information relating to the appraiser’s market rent conclusions for The Plaza at Walnut Creek Property:
| Comparable Office Leases(1) | ||||||||
| Property Name/Location | Year Built/ Renovated | Total GLA (SF) | Tenant | Tenant Size (SF) | Lease Start Date | Lease Term (months) | Annual Base Rent PSF | Lease Type |
The Plaza at Walnut Creek 1331-1333 North California Boulevard, Walnut Creek, CA 94596 | 1985-1987/NAP | 352,870(2) | Merrill Lynch(2) | 51,789(2) | Oct-23(2) | 53.0(2) | $72.18(2) | MG(2) |
Growers Square 1646 North California Boulevard, Walnut Creek, CA 94596 | 1985/NAP | 85,846 | Donahue Fitzgerald | 8,234 | Oct-24 | 66.0 | $69.00 | FSG |
Growers Square 1646 North California Boulevard, Walnut Creek, CA 94596 | 1985/NAP | 85,846 | Prudential Insurance | 2,207 | Oct-25 | 39.6 | $72.60 | FSG |
Growers Square 1646 North California Boulevard, Walnut Creek, CA 94596 | 1985/NAP | 87,770 | Basic American | 4,240 | May-24 | 62.4 | $68.40 | FSG |
Lafayette Mercantile 3585 Mount Diablo Boulevard, Lafayette, CA 94549 | 2006/NAP | 56,614 | Compass | 6,408 | Mar-24 | 64.8 | $58.20 | FSG |
| (1) | Information obtained from the appraisal, unless otherwise indicated. |
| (2) | Information obtained from the underwritten rent roll dated January 31, 2025. |
| (3) | Annual Base Rent PSF includes rent steps over the lease term. |
| THE INFORMATION IN THIS STRUCTURAL AND COLLATERAL TERM SHEET IS NOT COMPLETE AND MAY BE AMENDED PRIOR TO THE TIME OF SALE. THIS TERM SHEET IS NOT AN OFFER TO SELL THESE SECURITIES AND IT IS NOT A SOLICITATION OF AN OFFER TO BUY THESE SECURITIES IN ANY JURISDICTION WHERE THE OFFER OR SALE IS NOT PERMITTED. | ||
| T-57 | ||
| Office - Suburban | Loan #3 | Cut-off Date Balance: | $73,500,000 | |
| 1331-1333 North California Boulevard | The Plaza at Walnut Creek | Cut-off Date LTV: | 59.8% | |
| Walnut Creek, CA 94596 | UW NCF DSCR: | 2.66x | ||
| UW NOI Debt Yield: | 18.2% |
Operating History and Underwritten Net Cash Flow. The following table presents certain information relating to the historical operating performance and Underwritten Net Cash Flow at The Plaza at Walnut Creek Property:
| Cash Flow Analysis | |||||||
| 2021 | 2022 | 2023 | 9/19/2024 YTD Ann. | UW | UW PSF | ||
| Base Rent(1) | $17,317,450 | $14,083,973 | $17,544,367 | $18,909,357 | $22,496,559 | $63.75 | |
| Grossed Up Vacant Space | $0 | $0 | $0 | $0 | $1,788,549 |
| $5.07 |
| Gross Potential Rent | $17,317,450 | $14,083,973 | $17,544,367 | $18,909,357 | $24,285,108 | $68.82 | |
| Other Income(2) | $279,977 | $267,070 | $297,971 | $280,186 | $125,054 | $0.35 | |
| Parking/Garage/Other | $958,398 | $1,080,001 | $1,192,407 | $1,255,979 | $1,255,979 | $3.56 | |
| Total Recoveries | $265,510 | $55,369 | $419,669 | $806,062 | $992,126 |
| $2.81 |
| Net Rental Income | $18,821,334 | $15,486,413 | $19,454,413 | $21,251,584 | $26,658,268 | $75.55 | |
| (Vacancy & Credit Loss) | $0 | $0 | $0 | $0 | ($1,788,549) |
| ($5.07) |
| Effective Gross Income | $18,821,334 | $15,486,413 | $19,454,413 | $21,251,584 | $24,869,719 | $70.48 | |
| Real Estate Taxes | $1,004,459 | $1,016,762 | $1,033,442 | $960,113 | $1,802,924 | $5.11 | |
| Insurance | $505,143 | $426,426 | $604,544 | $686,879 | $171,939 | $0.49 | |
| Management Fee | $716,072 | 466,383 | $631,460 | $641,700 | $746,092 | $2.11 | |
| Other Operating Expenses | $3,542,423 | 3,701,267 | $4,063,369 | $3,627,584 | $4,429,351 | $12.55 | |
| Other Fixed Expense | $0 | $0 | $0 | $0 | $0 |
| $0.00 |
| Total Expenses | $5,768,097 | $5,610,838 | $6,332,815 | $5,916,275 | $7,150,306 | $20.26 | |
| Net Operating Income(3) | $13,053,238 | $9,875,575 | $13,121,598 | $15,335,309 | $17,719,413 | $50.22 | |
| Replacement Reserves | $0 | $0 | $0 | $0 | $88,218 | $0.25 | |
| TI/LC | $0 | $0 | $0 | $0 | $705,740 | $2.00 | |
| Non-Recurring Items | $0 | $0 | $0 | $0 | ($350,000) |
| ($0.99) |
| Net Cash Flow | $13,053,238 | $9,875,575 | $13,121,598 | $15,335,309 | $17,275,455 | $48.96 | |
| Occupancy % | 95.6% | 89.4% | 89.0% | 92.7%(4) | 92.6% | (4) | |
| NOI DSCR(5) | 2.01x | 1.52x | 2.02x | 2.36x | 2.73x | ||
| NCF DSCR(5) | 2.01x | 1.52x | 2.02x | 2.36x | 2.66x | ||
| NOI Debt Yield(5) | 13.4% | 10.2% | 13.5% | 15.8% | 18.2% | ||
| NCF Debt Yield(5) | 13.4% | 10.2% | 13.5% | 15.8% | 17.8% | ||
| (1) | UW Base Rent includes rent steps through January 2026 totaling $375,696, representing approximately 1.7% of underwritten base rent (excluding such rent steps), and straight line rent averaging for investment grade tenants totaling $421,843. | |
| (2) | UW Other Income is comprised of approximately $36,000 of storage rent, approximately $20,000 of antenna fees, and other miscellaneous income from tenant billbacks, license fees and OT HVAC income of approximately $69,000. The higher figures during the historical periods included the seller's recovery of management office rent ranging from approximately $133,000 to approximately $159,000 each year, which is no longer applicable. |
| (3) | The decrease in Net Operating Income from 2021 to 2022 was primarily attributed to an additional approximately $3.4 million in free rent booked in 2022 compared to 2021. The subsequent increase in Net Operating Income from 2022 to UW was primarily attributed to partial/full year rents for new/expansion leases commencing in 2023 and 2024 and an approximately $1.8 million decrease in free rent booked in 2023. |
| (4) | UW Occupancy % represents economic occupancy. The Plaza at Walnut Creek Property was 92.7% physically occupied as of January 31, 2025. |
| (5) | The financial information presented above is based on The Plaza at Walnut Creek Whole Loan. |
| THE INFORMATION IN THIS STRUCTURAL AND COLLATERAL TERM SHEET IS NOT COMPLETE AND MAY BE AMENDED PRIOR TO THE TIME OF SALE. THIS TERM SHEET IS NOT AN OFFER TO SELL THESE SECURITIES AND IT IS NOT A SOLICITATION OF AN OFFER TO BUY THESE SECURITIES IN ANY JURISDICTION WHERE THE OFFER OR SALE IS NOT PERMITTED. | ||
| T-58 | ||
| Office - Suburban | Loan #3 | Cut-off Date Balance: | $73,500,000 | |
| 1331-1333 North California Boulevard | The Plaza at Walnut Creek | Cut-off Date LTV: | 59.8% | |
| Walnut Creek, CA 94596 | UW NCF DSCR: | 2.66x | ||
| UW NOI Debt Yield: | 18.2% |
Escrows and Reserves.
Real Estate Taxes – The loan documents require ongoing monthly reserves for real estate taxes in an amount equal to 1/12th of the real estate taxes that the lender estimates will be payable during the next 12 months, initially estimated to be $77,188.
Insurance – The loan documents require an ongoing monthly deposit into an insurance reserve equal to 1/12th of the insurance premiums that the lender reasonably estimates will be payable for the renewal of the coverage afforded by the policies; provided that no deposits are required so long as the borrower maintains insurance coverage for The Plaza at Walnut Creek Property as part of blanket or umbrella coverage reasonably approved by the lender.
Replacement Reserve – The loan documents require an ongoing monthly replacement reserve deposit of $7,352.
Leasing Reserve – The loan documents required the borrower to make an upfront deposit of $3,500,000 and ongoing monthly deposits of $58,812 for tenant improvements and leasing commissions.
Lockbox and Cash Management. The Plaza at Walnut Creek Whole Loan is structured with a soft lockbox and springing cash management. The borrower and property manager are required to deposit all rents and other income directly into an established deposit account within three business days of receipt. So long as no Trigger Period (as defined below) is continuing, all funds in the lockbox account will be transferred on each business day to the borrower’s operating account. During the continuance of a Trigger Period, funds in the lockbox account are required to be swept to a lender-controlled cash management account to be disbursed in accordance with the cash management waterfall set forth in the loan documents. Any excess funds after the waterfall are required to be deposited into an excess cash flow account to serve as additional collateral for the loan.
A “Trigger Period” will commence upon the earlier of the following:
| (i) | the occurrence and continuance of an event of default; or |
| (ii) | the debt service coverage ratio (“DSCR”) being less than 1.40x as of the end of any calendar quarter. |
A Trigger Period will end upon the occurrence of the following:
| (i) | with regard to clause (i) above, the cure of such event of default; or |
| (ii) | with regard to clause (ii) above, the DSCR being equal to or greater than 1.45x. |
Outstanding TI/LC and Free Rent Guaranty. In lieu of a reserve, the total amount of $4,579,274 in outstanding TILCs and free rent was guaranteed by the guarantor.
Terrorism Insurance. The Plaza at Walnut Creek Whole Loan documents require an “all risk” insurance policy on a full replacement cost basis, including business interruption insurance covering no less than the 18-month period following the occurrence of a casualty event, together with an extended period of indemnity of six months. See “Risk Factors—Risks Relating to the Mortgage Loans—Terrorism Insurance May Not Be Available for All Mortgaged Properties” in the prospectus.
| THE INFORMATION IN THIS STRUCTURAL AND COLLATERAL TERM SHEET IS NOT COMPLETE AND MAY BE AMENDED PRIOR TO THE TIME OF SALE. THIS TERM SHEET IS NOT AN OFFER TO SELL THESE SECURITIES AND IT IS NOT A SOLICITATION OF AN OFFER TO BUY THESE SECURITIES IN ANY JURISDICTION WHERE THE OFFER OR SALE IS NOT PERMITTED. | ||
| T-59 | ||
| Self Storage – Self Storage | Loan #4 | Cut-off Date Balance: | $51,500,000 | |
| 2424 Castleton Commerce Way | Storage Depot - Virginia Beach | Cut-off Date LTV: | 67.1% | |
| Virginia Beach, VA 23456 | U/W NCF DSCR: | 1.24x | ||
| U/W NOI Debt Yield: | 8.4% |
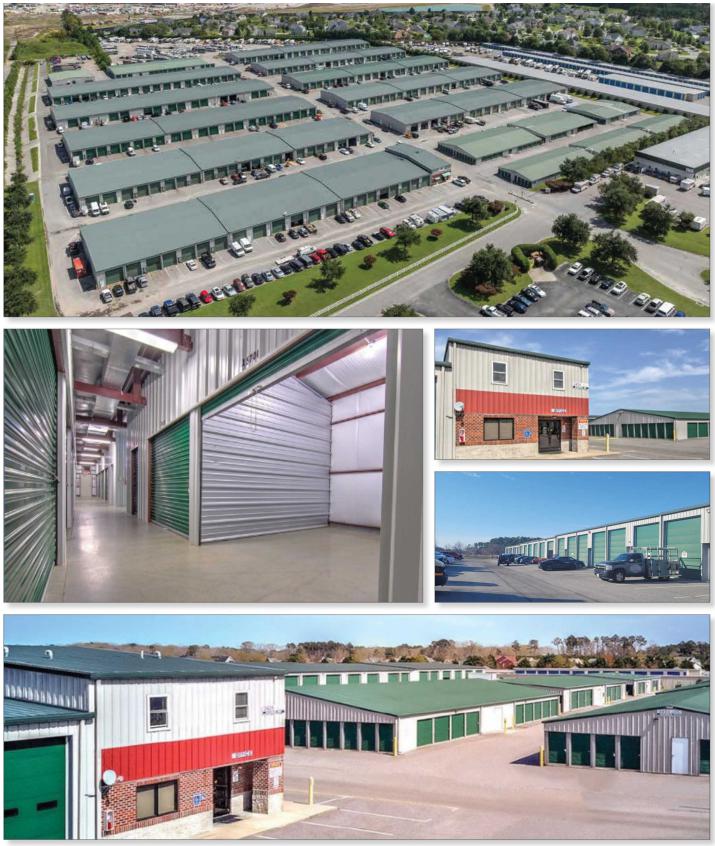
| THE INFORMATION IN THIS STRUCTURAL AND COLLATERAL TERM SHEET IS NOT COMPLETE AND MAY BE AMENDED PRIOR TO THE TIME OF SALE. THIS TERM SHEET IS NOT AN OFFER TO SELL THESE SECURITIES AND IT IS NOT A SOLICITATION OF AN OFFER TO BUY THESE SECURITIES IN ANY JURISDICTION WHERE THE OFFER OR SALE IS NOT PERMITTED. | ||
| T-60 | ||
| Self Storage – Self Storage | Loan #4 | Cut-off Date Balance: | $51,500,000 | |
| 2424 Castleton Commerce Way | Storage Depot - Virginia Beach | Cut-off Date LTV: | 67.1% | |
| Virginia Beach, VA 23456 | U/W NCF DSCR: | 1.24x | ||
| U/W NOI Debt Yield: | 8.4% |
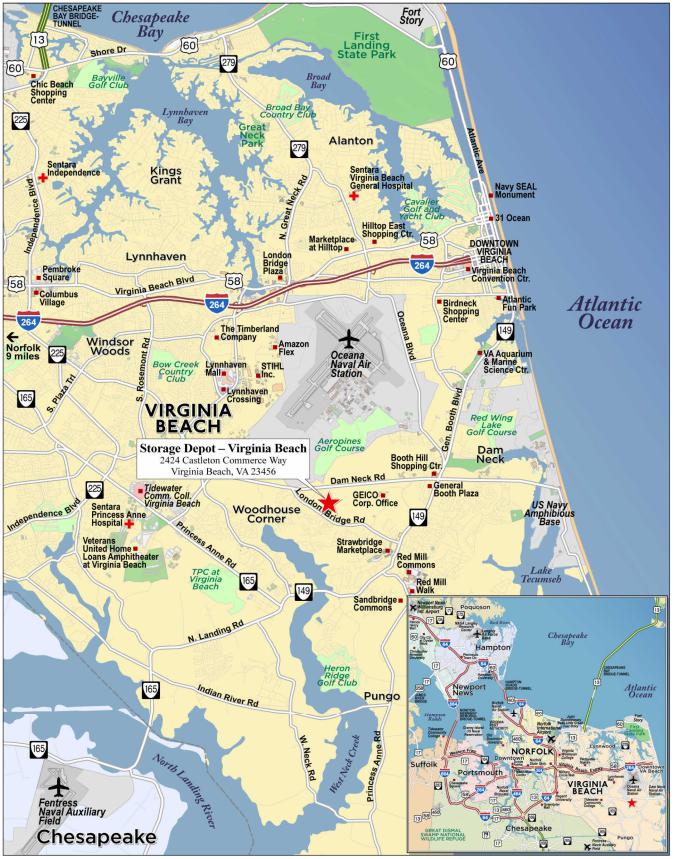
| THE INFORMATION IN THIS STRUCTURAL AND COLLATERAL TERM SHEET IS NOT COMPLETE AND MAY BE AMENDED PRIOR TO THE TIME OF SALE. THIS TERM SHEET IS NOT AN OFFER TO SELL THESE SECURITIES AND IT IS NOT A SOLICITATION OF AN OFFER TO BUY THESE SECURITIES IN ANY JURISDICTION WHERE THE OFFER OR SALE IS NOT PERMITTED. | ||
| T-61 | ||
| Mortgage Loan No. 4 – Storage Depot - Virginia Beach |
| Mortgage Loan Information | Property Information | ||||||
| Mortgage Loan Seller: | BANA | Single Asset/Portfolio: | Single Asset | ||||
| Credit Assessment (Fitch/Moody’s/KBRA): | NR/NR/NR | Location: | Virginia Beach, VA 23456 | ||||
| Original Balance: | $51,500,000 | General Property Type: | Self Storage | ||||
| Cut-off Date Balance: | $51,500,000 | Detailed Property Type: | Self Storage | ||||
| % of Initial Pool Balance: | 7.0% | Title Vesting: | Fee | ||||
| Loan Purpose: | Refinance | Year Built/Renovated: | 2008/2014 | ||||
| Borrower Sponsor: | Cohen Investment Group | Size(2): | 388,718 SF | ||||
| Guarantors: | Hugh D. Cohen and Joel T. Flax | Cut-off Date Balance per SF(2): | $132 | ||||
| Mortgage Rate: | 6.6500% | Maturity Date Balance per SF(2): | $132 | ||||
| Note Date: | 12/5/2024 | Property Manager: | Storage Asset Management, LLC | ||||
| Maturity Date: | 1/1/2030 | Underwriting and Financial Information | |||||
| Term to Maturity: | 60 months | UW NOI: | $4,326,876 | ||||
| Amortization Term: | 0 months | UW NCF: | $4,297,686 | ||||
| IO Period: | 60 months | UW NOI Debt Yield: | 8.4% | ||||
| Seasoning: | 1 month | UW NCF Debt Yield: | 8.3% | ||||
| Prepayment Provisions: | L(25),D(28),O(7) | UW NOI Debt Yield at Maturity: | 8.4% | ||||
| Lockbox/Cash Mgmt Status: | Springing/Springing | UW NCF DSCR: | 1.24x | ||||
| Additional Debt Type: | NAP | Most Recent NOI: | $4,062,324 (10/31/2024 TTM) | ||||
| Additional Debt Balance: | NAP | 2nd Most Recent NOI: | $4,073,172 (12/31/2023) | ||||
| Future Debt Permitted (Type): | No (NAP) | 3rd Most Recent NOI: | $4,038,646 (12/31/2022) | ||||
| Most Recent Occupancy(3): | 89.8% (11/4/2024) | ||||||
| Reserves(1) | 2nd Most Recent Occupancy: | 91.8% (12/31/2023) | |||||
| Type | Initial | Monthly | Cap | 3rd Most Recent Occupancy: | 93.7% (12/31/2022) | ||
| RE Taxes: | $93,433 | $46,716 | NAP | Appraised Value (as of): | $76,800,000 (10/8/2024) | ||
| Insurance: | $0 | Springing | NAP | Appraised Value per SF(2): | $198 | ||
| Replacement Reserve: | $0 | $2,433 | NAP | Cut-off Date LTV Ratio: | 67.1% | ||
| Building 1400B Restoration Reserve(3): | $429,649 | $0 | NAP | Maturity Date LTV Ratio: | 67.1% | ||
| Sources and Uses | ||||||
| Sources | Proceeds | % of Total | Uses | Proceeds | % of Total | |
| Loan Amount: | $51,500,000 | 85.1% | Loan Payoff: | $57,257,250 | 94.6% | |
| Borrower Sponsor Equity: | $9,005,015 | 14.9% | Closing Costs: | $2,724,683 | 4.5% | |
| Reserves: | $523,082 | 0.9% | ||||
| Total Sources: | $60,505,015 | 100.0% | Total Uses: | $60,505,015 | 100.0% | |
| (1) | See “Escrows and Reserves” below for further discussion of reserve information. |
| (2) | The Storage Depot - Virginia Beach Property (as defined below) features traditional storage units and larger warehouse units with an average unit size of 496 SF. |
| (3) | There was a fire at the Storage Depot - Virginia Beach Property on August 19, 2024, which affected 39 units (25 drive up and 14 indoor units). After origination, the borrower deposited approximately $429,649 (which represents the property insurance proceeds) to a reserve for the reconstruction of the units, which the borrower expects to be completed by April 2025. Most recent occupancy adjusted for the units affected by the fire is 90.5%. |
The Mortgage Loan. The fourth largest mortgage loan (the “Storage Depot - Virginia Beach Mortgage Loan”) is evidenced by a promissory note in the original principal amount of $51,500,000 and secured by a first priority fee mortgage encumbering a 388,718 SF self storage property located in Virginia Beach, Virginia (the “Storage Depot - Virginia Beach Property”).
The Borrower and the Borrower Sponsor. The borrower is CIG Castleton LLC, a Delaware limited liability company and single purpose entity with one independent director. The borrower sponsor is Cohen Investment Group (“CIG”) and the non-recourse carveout guarantors are Hugh D. Cohen and Joel T. Flax.
Hugh D. Cohen and Joel T. Flax are principals of CIG, a privately owned commercial real estate investment firm headquartered in Virginia Beach, Virginia and specializing in asset management, accounting, property management, acquisitions, dispositions, analysis and reporting. With a footprint spanning 13 states in the Southeast, Mid-Atlantic, and Midwest United States, CIG owns a diverse portfolio of assets with a core focus on multifamily and self storage properties. CIG's current investment portfolio includes 51 self storage and seven multifamily properties.
The Property. The Storage Depot - Virginia Beach Property is a 388,718 SF, 783-unit self storage facility located in Virginia Beach, Virginia. The Storage Depot - Virginia Beach Property was developed in phases from 2008 through 2014 and is comprised of one two-story building and seventeen single-story buildings situated on a 29.42-acre site. The Storage Depot - Virginia Beach Property offers a variety of unit types, including exterior drive-up non-climate-controlled units, interior non-climate-controlled units, interior climate-controlled units and commercial warehouse units. Additionally, there are 190 uncovered parking spaces available to rent as well as a 950 SF apartment unit over the manager's office. The storage units range from 25 SF to 420 SF, and the warehouse units range from 450 SF to 2,700 SF, with an average unit size of 496 SF. The commercial warehouse units operate like flex industrial space and are rented on a month-to-month basis like typical storage units.
| THE INFORMATION IN THIS STRUCTURAL AND COLLATERAL TERM SHEET IS NOT COMPLETE AND MAY BE AMENDED PRIOR TO THE TIME OF SALE. THIS TERM SHEET IS NOT AN OFFER TO SELL THESE SECURITIES AND IT IS NOT A SOLICITATION OF AN OFFER TO BUY THESE SECURITIES IN ANY JURISDICTION WHERE THE OFFER OR SALE IS NOT PERMITTED. | ||
| T-62 | ||
| Self Storage – Self Storage | Loan #4 | Cut-off Date Balance: | $51,500,000 | |
| 2424 Castleton Commerce Way | Storage Depot - Virginia Beach | Cut-off Date LTV: | 67.1% | |
| Virginia Beach, VA 23456 | U/W NCF DSCR: | 1.24x | ||
| U/W NOI Debt Yield: | 8.4% |
In addition to the storage buildings, the Storage Depot - Virginia Beach Property includes a management and leasing office and supply store. Amenities at the Storage Depot - Virginia Beach Property include secured entry with electronic gate and keypad access, perimeter fencing, 24-hour video surveillance, onsite management, wide driveways for the drive-up units and exterior lighting. As of November 4, 2024, the Storage Depot - Virginia Beach Property was 89.8% occupied. Since the borrower’s acquisition of the Storage Depot – Virginia Beach Property in 2021, monthly occupancies have ranged from approximately 90%-96%.
The following table presents certain information relating to the unit mix at the Storage Depot - Virginia Beach Property:
| Unit Mix(1) | ||||||||||||
| Unit Type | Net Rentable Area (SF) | % of Net Rentable Area (SF) | Occupied SF | Occupancy % (SF)(2) | # of Units | % of Total Units | Occupied Units | Avg. Unit Size (SF) |
Avg. Actual Rent Per Unit(3) |
Avg. Market Rent Per Unit | ||
| Apartment | 950 | 0.2% | 950 | 100.0% | 1 | 0.1% | 1 | 950 | $1,000 | $1,000 | ||
| Drive-up Non-Climate Controlled | 25,558 | 6.6% | 17,898 | 70.0% | 138 | 17.6% | 109 | 185 | $288 | $278 | ||
| Interior Non-Climate Controlled | 5,660 | 1.5% | 3,690 | 65.2% | 44 | 5.6% | 25 | 129 | $182 | $198 | ||
| Interior Climate Controlled | 29,675 | 7.6% | 27,755 | 93.5% | 227 | 29.0% | 210 | 131 | $207 | $209 | ||
| Warehouse Units | 326,875 | 84.1% | 298,750 | 91.4% | 373 | 47.6% | 341 | 876 | $1,066 |
| $1,075 |
|
| Total/Wtd. Avg. | 388,718 | 100.0% | 349,043 | 89.8% | 783 | 100.0% | 686 | 496 | $630 | $634 | ||
| (1) | Based on the borrower rent roll dated November 4, 2024. |
| (2) | There was a fire at the Storage Depot - Virginia Beach Property on August 19, 2024, which affected 39 units (25 drive up and 14 indoor units). After origination, the borrower deposited approximately $429,649 (which represents the property insurance proceeds) to a reserve for the reconstruction of the units, which the borrower expects to be completed by April 2025. Most recent occupancy adjusted for the units affected by the fire is 90.5%. |
| (3) | Avg. Actual Rent Per Unit is calculated using actual rent for occupied units and market rent for vacant units. |
The Market. The Storage Depot - Virginia Beach Property is located in Virginia Beach, Virginia and is part of the Norfolk/Hampton Roads market and Lynnhaven/Oceana sub-market. The Storage Depot - Virginia Beach Property is situated approximately four miles south of Naval Air Station Oceana, eight miles southeast of the Virginia Beach Central Business District and eight miles southwest of the Virginia Beach oceanfront. The Naval Air Station Oceana is a major demand driver in the submarket with approximately 10,500 active navy personnel, 10,000 family members and 4,500 civilian personnel, making it the second-largest employer in Virginia Beach. Amazon recently completed a 219,000 SF delivery station and is constructing a new 650,000 SF fulfillment center less than a mile away from the Storage Depot - Virginia Beach Property. The two centers are expected to bring more than 1,000 direct new jobs to the city of Virginia Beach and numerous indirect businesses and jobs surrounding the Amazon centers.
According to the appraisal, as of October 2024, there was 1,237,844 SF of self storage space (5,653 units) located within a three-mile radius of the Storage Depot - Virginia Beach Property, with an average vacancy of 8.8%. The Storage Depot - Virginia Beach Property is located in the Lynnhaven industrial submarket, which as of the third quarter of 2024, had an inventory of approximately 11.76 million SF with vacancy of 1.5%.
The competitive self storage properties identified in the appraisal have non-climate-controlled rents ranging from $64 per unit to $238 per unit and climate-controlled rents ranging from $49 per unit to $398 per unit. The warehouse rents range from $11.33 PSF to $25.00 PSF, with an average of $15.65 PSF. Overall, the appraiser concluded an average market rent of $634 per unit for the Storage Depot - Virginia Beach Property. The current average in-place rents at the Storage Depot - Virginia Beach Property are $611 per unit, which are 3.8% lower than market rent. The appraiser also concluded the average parking space actual rents of $236 per unit which are in line with the average market rents at the Storage Depot - Virginia Beach Property of $237 per unit.
According to the appraisal, the 2023 population within a one-, three- and five-mile radius of the Storage Depot - Virginia Beach Property was 5,513, 53,839 and 162,461, respectively. The 2023 average household income within the same radii was $151,751, $133,863 and $119,901, respectively.
| THE INFORMATION IN THIS STRUCTURAL AND COLLATERAL TERM SHEET IS NOT COMPLETE AND MAY BE AMENDED PRIOR TO THE TIME OF SALE. THIS TERM SHEET IS NOT AN OFFER TO SELL THESE SECURITIES AND IT IS NOT A SOLICITATION OF AN OFFER TO BUY THESE SECURITIES IN ANY JURISDICTION WHERE THE OFFER OR SALE IS NOT PERMITTED. | ||
| T-63 | ||
| Self Storage – Self Storage | Loan #4 | Cut-off Date Balance: | $51,500,000 | |
| 2424 Castleton Commerce Way | Storage Depot - Virginia Beach | Cut-off Date LTV: | 67.1% | |
| Virginia Beach, VA 23456 | U/W NCF DSCR: | 1.24x | ||
| U/W NOI Debt Yield: | 8.4% |
The following table presents information regarding certain competitive properties to the Storage Depot - Virginia Beach Property:
| Competitive Properties Summary(1) | ||||||
| Property Name/Location | Year Built / Renovated | Net Rentable Area (SF) | Occupancy | Number of Units | Distance to Subject | Amenities |
Storage Depot - Virginia Beach 2424 Castleton Commerce Way Virginia Beach, VA | 2008 / 2014 | 388,718(2) | 89.8%(2)(3) | 783(2) | - | Exterior Lighting, Keypad Entry, On-Site Manager, Parking, Perimeter Fence, Video Cameras, Electronic Gate, Loading Bay |
Allsafe Self Storage - 2100 2100 McComas Way Virginia Beach, VA | 2001 / NAP | 58,326 | 90.5% | 502 | 1.4 miles | Exterior Lighting, Keypad Entry, On-Site Manager, Perimeter Fence, Video Cameras, Electronic Gate |
Extra Space - 1533 1533 Harpers Road Virginia Beach, VA | 2003 / NAP | 38,640 | 89.0% | 368 | 1.6 miles | Exterior Lighting, Keypad Entry, On-Site Manager, Parking, Perimeter Fence, Video Cameras, Electronic Gate |
Prime (Fort) Storage - 2744 2744 Dam Neck Road Virginia Beach, VA | 2007 / NAP | 66,060 | NAV | 686 | 1.7 miles | Exterior Lighting, Keypad Entry, On-Site Manager, Parking, Perimeter Fence, Video Cameras, Electronic Gate |
Extra Space - 1545 1545 General Booth Blvd Virginia Beach, VA | 2002 / NAP | 107,026 | 97.0% | 1,043 | 2.2 miles | Exterior Lighting, Keypad Entry, On-Site Manager, Perimeter Fence, Video Cameras, Electronic Gate |
Public Storage - 1489 1489 General Booth Blvd Virginia Beach, VA | 1988 / NAP | 50,100 | 91.5% | 449 | 2.2 miles | Exterior Lighting, Keypad Entry, On-Site Manager, Parking, Perimeter Fence, Video Cameras, Electronic Gate |
StorageMart - 3212 3212 Dam Neck Road Virginia Beach, VA | 2001 / NAP | 145,994 | 90.0% | 889 | 2.4 miles | Exterior Lighting, Keypad Entry, On-Site Manager, Parking, Perimeter Fence, Video Cameras, Electronic Gate |
| (1) | Source: Appraisal. |
| (2) | Based on the borrower rent roll dated November 4, 2024. |
| (3) | There was a fire at the Storage Depot - Virginia Beach Property on August 19, 2024, which affected 39 units (25 drive up and 14 indoor units). After origination, the borrower deposited approximately $429,649 (which represents the property insurance proceeds) to a reserve for the reconstruction of the units, which the borrower expects to be completed by April 2025. Most recent occupancy adjusted for the units affected by the fire is 90.5%. |
Appraisal. The appraiser concluded to an “as-is” value for the Storage Depot - Virginia Beach Property of $76,800,000 as of October 8, 2024.
Environmental Matters. According to the Phase I environmental site assessment dated November 19, 2024, there was no evidence of any recognized environmental conditions at the Storage Depot - Virginia Beach Property.
| THE INFORMATION IN THIS STRUCTURAL AND COLLATERAL TERM SHEET IS NOT COMPLETE AND MAY BE AMENDED PRIOR TO THE TIME OF SALE. THIS TERM SHEET IS NOT AN OFFER TO SELL THESE SECURITIES AND IT IS NOT A SOLICITATION OF AN OFFER TO BUY THESE SECURITIES IN ANY JURISDICTION WHERE THE OFFER OR SALE IS NOT PERMITTED. | ||
| T-64 | ||
| Self Storage – Self Storage | Loan #4 | Cut-off Date Balance: | $51,500,000 | |
| 2424 Castleton Commerce Way | Storage Depot - Virginia Beach | Cut-off Date LTV: | 67.1% | |
| Virginia Beach, VA 23456 | U/W NCF DSCR: | 1.24x | ||
| U/W NOI Debt Yield: | 8.4% |
Operating History and Underwritten Net Cash Flow. The following table presents certain information relating to the historical operating performance and Underwritten Net Cash Flow at the Storage Depot - Virginia Beach Property:
| Cash Flow Analysis(1) | |||||
| 2022 | 2023 | 10/31/2024 TTM | UW | UW Per SF | |
| Gross Potential Rent(2) | $5,287,055 | $5,498,662 | $5,574,035 | $6,474,743 | $16.66 |
| Vacancy/Credit Loss | $0 | $0 | $0 | ($792,739) | ($2.04) |
| Other Income(3) | $126,062 | $217,567 | $285,366 | $294,235 | $0.76 |
| Effective Gross Income | $5,413,117 | $5,716,229 | $5,859,401 | $5,976,239 | $15.37 |
| Real Estate Taxes | $325,082 | $506,884 | $543,878 | $539,868 | $1.39 |
| Insurance | $332,918 | $393,807 | $517,672 | $399,744 | $1.03 |
| Other Operating Expenses | $716,471 | $742,366 | $735,527 | $709,751 | $1.83 |
| Total Operating Expenses | $1,374,471 | $1,643,057 | $1,797,077 | $1,649,363 | $4.24 |
| Net Operating Income | $4,038,646 | $4,073,172 | $4,062,324 | $4,326,876 | $11.13 |
| Replacement Reserves | $0 | $0 | $0 | $29,190 | $0.08 |
| Net Cash Flow | $4,038,646 | $4,073,172 | $4,062,324 | $4,297,686 | $11.06 |
| Occupancy | 93.7% | 91.8% | 89.8%(4) | 87.8%(5) | |
| NOI DSCR | 1.16x | 1.17x | 1.17x | 1.25x | |
| NCF DSCR | 1.16x | 1.17x | 1.17x | 1.24x | |
| NOI Debt Yield | 7.8% | 7.9% | 7.9% | 8.4% | |
| NCF Debt Yield | 7.8% | 7.9% | 7.9% | 8.3% | |
| (1) | Further historical information is not available as the borrower purchased the Storage Depot – Virginia Beach Property in 2021. |
| (2) | UW Gross Potential Rent is based on the borrower rent roll dated November 4, 2024. |
| (3) | Other Income includes admin fees, late fees, stored property protection fees and commissions, ancillary services and store sales. |
| (4) | Represents occupancy based on the borrower rent roll dated November 4, 2024. |
| (5) | Based on an economic vacancy of 12.2%. |
Escrows and Reserves. At origination, the borrower deposited into escrow approximately $93,433 for real estate taxes. After origination, the borrower deposited approximately $429,649 (which represents the property insurance proceeds) into a reserve for the reconstruction of the 39 units damaged by fire.
Real Estate Taxes – On a monthly basis, the borrower is required to escrow 1/12th of the annual estimated tax payments, which currently equates to approximately $46,716.
Insurance – If there is no approved blanket policy in place, the borrower is required to escrow 1/12th of the annual estimated insurance payments on a monthly basis. The Storage Depot - Virginia Beach Property is currently insured under a blanket insurance policy.
Replacement Reserves – On a monthly basis, the borrower is required to deposit $2,433 for replacement reserves.
Lockbox and Cash Management. The Storage Depot - Virginia Beach Mortgage Loan is structured with a springing lockbox and springing cash management. Upon the first occurrence of a Cash Sweep Period (defined below) or an event of default, the borrower is required to establish a lockbox account for the benefit of the lender, into which all rents and other revenue from the Storage Depot - Virginia Beach Property are required to be deposited by the borrower. During a Cash Sweep Period, all funds in the lockbox account are required to be transferred to the lender-controlled cash management account on each business day and disbursed in accordance with the Storage Depot - Virginia Beach Mortgage Loan documents. Also, during a Cash Sweep Period, all excess cash is required to be collected by the lender and held as additional security for the Storage Depot - Virginia Beach Mortgage Loan.
A “Cash Sweep Period” will commence upon (i) the occurrence of a Building 1400B Restoration Funds Trigger Event (as defined below) or (ii) the debt service coverage ratio falling below 1.15x on a trailing six-month basis (tested quarterly), and will expire upon (a) with respect to clause (i) above, the Building 1400B Restoration Funds Trigger Event having been cured or (b) with respect to clause (ii) above, the debt service coverage ratio being at least 1.20x on a trailing six-month basis (tested quarterly) for two consecutive quarters.
A “Building 1400B Restoration Funds Trigger Event” means the borrower’s failure to deposit approximately $429,649 into the Building 1400B Restoration Reserve account within 30 days of loan origination.
Terrorism Insurance. The borrower is required to obtain and maintain property insurance and is required to obtain and maintain business interruption insurance for 18 months plus a 6-month extended period of indemnity. Such insurance is required to cover perils of terrorism and acts of terrorism; provided that if TRIPRA or a subsequent statute is in effect and covers both foreign and domestic acts of terror, the provisions of TRIPRA will determine the acts of terrorism for which coverage will be required. See “Risk Factors—Risks Relating to the Mortgage Loans—Terrorism Insurance May Not Be Available for All Mortgaged Properties” in the prospectus.
| THE INFORMATION IN THIS STRUCTURAL AND COLLATERAL TERM SHEET IS NOT COMPLETE AND MAY BE AMENDED PRIOR TO THE TIME OF SALE. THIS TERM SHEET IS NOT AN OFFER TO SELL THESE SECURITIES AND IT IS NOT A SOLICITATION OF AN OFFER TO BUY THESE SECURITIES IN ANY JURISDICTION WHERE THE OFFER OR SALE IS NOT PERMITTED. | ||
| T-65 | ||
| Hospitality – Various | Loan #5 | Cut-off Date Balance: | $43,000,000 | |
| Various | AHIP Hotel Portfolio | Cut-off Date LTV: | 55.2% | |
| Various | U/W NCF DSCR: | 1.78x | ||
| U/W NOI Debt Yield: | 15.8% |
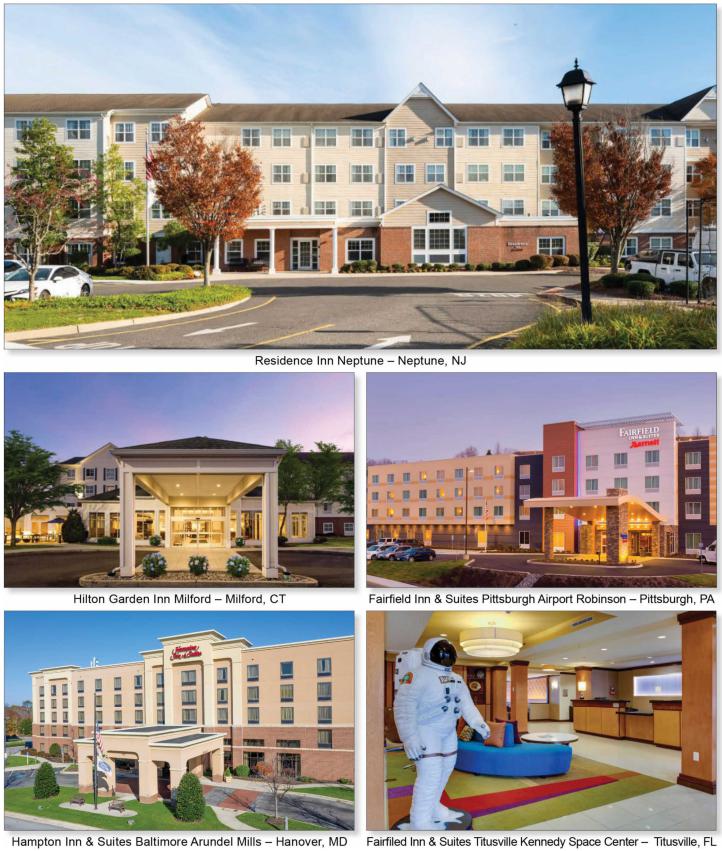
| THE INFORMATION IN THIS STRUCTURAL AND COLLATERAL TERM SHEET IS NOT COMPLETE AND MAY BE AMENDED PRIOR TO THE TIME OF SALE. THIS TERM SHEET IS NOT AN OFFER TO SELL THESE SECURITIES AND IT IS NOT A SOLICITATION OF AN OFFER TO BUY THESE SECURITIES IN ANY JURISDICTION WHERE THE OFFER OR SALE IS NOT PERMITTED. | ||
| T-66 | ||
| Hospitality – Various | Loan #5 | Cut-off Date Balance: | $43,000,000 | |
| Various | AHIP Hotel Portfolio | Cut-off Date LTV: | 55.2% | |
| Various | U/W NCF DSCR: | 1.78x | ||
| U/W NOI Debt Yield: | 15.8% |
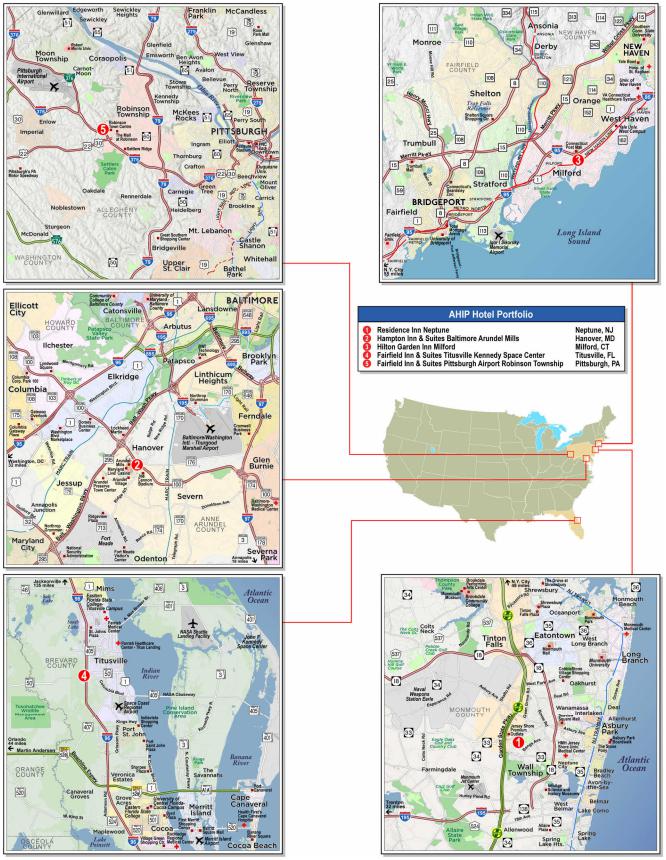
| THE INFORMATION IN THIS STRUCTURAL AND COLLATERAL TERM SHEET IS NOT COMPLETE AND MAY BE AMENDED PRIOR TO THE TIME OF SALE. THIS TERM SHEET IS NOT AN OFFER TO SELL THESE SECURITIES AND IT IS NOT A SOLICITATION OF AN OFFER TO BUY THESE SECURITIES IN ANY JURISDICTION WHERE THE OFFER OR SALE IS NOT PERMITTED. | ||
| T-67 | ||
| Mortgage Loan No. 5 – AHIP Hotel Portfolio |
| Mortgage Loan Information | Property Information | |||||
| Mortgage Loan Seller: | JPMCB | Single Asset/Portfolio: | Portfolio | |||
| Credit Assessment (Fitch/Moody’s/KBRA): | NR/NR/NR | Location(3): | Various | |||
| Original Balance: | $43,000,000 | General Property Type: | Hospitality | |||
| Cut-off Date Balance: | $43,000,000 | Detailed Property Type(3): | Various | |||
| % of Initial Pool Balance: | 5.8% | Title Vesting: | Fee | |||
| Loan Purpose: | Refinance | Year Built/Renovated(3): | Various/Various | |||
| Borrower Sponsor: | American Hotel Income Properties | Size: | 554 Rooms | |||
| REIT Inc. | Cut-off Date Balance per Room: | $77,617 | ||||
| Guarantor: | American Hotel Income Properties | Maturity Date Balance per Room: | $77,617 | |||
| REIT Inc. | Property Manager(4)(5): | Various | ||||
| Mortgage Rate: | 7.63000% | |||||
| Note Date: | 1/24/2025 | |||||
| Maturity Date: | 2/6/2030 | Underwriting and Financial Information | ||||
| Term to Maturity: | 60 months | UW NOI: | $6,775,362 | |||
| Amortization Term: | 0 months | UW NCF: | $5,907,595 | |||
| IO Period: | 60 months | UW NOI Debt Yield: | 15.8% | |||
| Seasoning: | 0 months | UW NCF Debt Yield: | 13.7% | |||
| Prepayment Provisions: | L(24),D(30),O(6) | UW NOI Debt Yield at Maturity: | 15.8% | |||
| Lockbox/Cash Mgmt Status: | Hard/Springing | UW NCF DSCR: | 1.78x | |||
| Additional Debt Type: | NAP | Most Recent NOI(6): | $6,585,109 (10/31/2024 TTM) | |||
| Additional Debt Balance: | NAP | 2nd Most Recent NOI(6): | $4,933,508 (12/31/2023) | |||
| Future Debt Permitted (Type): | No (NAP) | 3rd Most Recent NOI(6): | $6,500,166 (12/31/2022) | |||
| Reserves(1) | Most Recent Occupancy(6): | 73.2% (10/31/2024) | ||||
| Type | Initial | Monthly | Cap | 2nd Most Recent Occupancy(6): | 65.3% (12/31/2023) | |
| RE Taxes: | $82,821 | $65,747 | NAP | 3rd Most Recent Occupancy(6): | 74.4% (12/31/2022) | |
| Insurance: | $335,263 | Springing | NAP | Appraised Value (as of)(3): | $77,900,000 (Various) | |
| FF&E Reserve: | $83,560 | (2) | NAP | Appraised Value per Room: | $140,614 | |
| PIP Reserve: | $3,000,000 | Springing | NAP | Cut-off Date LTV Ratio: | 55.2% | |
| Immediate Repairs: | $56,979 | $0 | NAP | Maturity Date LTV Ratio: | 55.2% | |
| Sources and Uses | ||||||
| Sources | Proceeds | % of Total | Uses | Proceeds | % of Total | |
| Loan Amount: | $43,000,000 | 99.3% | Loan Payoff: | $38,403,969 | 88.7% | |
| Sponsor Equity: | $281,511 | 0.7% | Upfront Reserves: | $3,558,623 | 8.2% | |
| Closing Costs: | $1,318,920 | 3.0% | ||||
| Total Sources: | $43,281,511 | 100.0% | Total Uses: | $43,281,511 | 100.0% | |
| (1) | See “Escrows and Reserves ” below for further discussion of reserve requirements. |
| (2) | On each payment date the borrowers will deposit an amount equal to 5.0% of the sum of gross rents and operating income for the calendar month two months prior to such payment date. |
| (3) | See “AHIP Hotel Portfolio Summary” table below for details regarding individual properties. |
| (4) | Property managers at the Hampton Inn & Suites Baltimore Arundel Mills Property, Residence Inn Neptune Property, Fairfield Inn & Suites Titusville Kennedy Space Center Property, Hilton Garden Inn Milford Property and Fairfield Inn & Suites Pittsburgh Airport Robinson Township Property are One MD Hanover HI Management LLC, One NJ Neptune 230 Management LLC, One FL Titusville FI Management LLC, One CT Milford HGI Management LLC and One Lodging Management, LLC (the “Managers”), respectively, and One Lodging Holdings LLC (the “Master Manager”), all of whom are affiliates of Aimbridge Hospitality LLC (together with the Managers and the Master Manager, the “Manager Parties”), the AHIP Hotel Portfolio is managed per a master hotel management agreement with the Master Manager (the “Master Agreement”). |
| (5) | The borrowers and certain of their affiliates (collectively, the “Enterprise Parties”) are subject to a lawsuit pending before the Supreme Court of British Columbia filed by the Manager Parties in response to the Enterprise Parties’ notice of default sent to the Manager Parties indicating the Manager Parties’ management failures have caused the Enterprise Parties material harm and seeking resolutions through the alternative dispute resolution provisions set forth in the Master Agreement. The Manager Parties are seeking, among other things, unspecified damages and costs and injunctive relief preventing the Enterprise Parties from taking any steps until the court has determined such alternative dispute resolution is appropriate. The borrowers have represented under the AHIP Hotel Portfolio Mortgage Loan documents that any adverse determination against the Enterprise Parties is unlikely to result in a material adverse effect on any of the borrowers or AHIP Hotel Portfolio Properties. See “Description of the Mortgage Pool—Litigation and Other Considerations” in the prospectus for additional information. |
| (6) | The decrease in Occupancy and Net Operating Income from 2022 to 2023 and subsequent recovery from 2023 to TTM October 2024 is primarily attributable to (i) a burst pipe and subsequent renovations at the Residence Inn Neptune Property (as defined below), which caused the hotel to close from January through April of 2023, totaling 12,600 room nights offline, (ii) additional renovations at the Residence Inn Neptune Property, which resulted in an additional 2,389 rooms nights offline from May through December of 2023, and (iii) ongoing renovations at the Hilton Garden Inn Milford Property (as defined below), which resulted in approximately 4,215 displaced room nights between January and December 2023. |
The Mortgage Loan. The fifth largest mortgage loan (the “AHIP Hotel Portfolio Mortgage Loan”) is evidenced by a promissory note in the original principal balance of $43,000,000 and secured by the fee interest in 3 limited service, 1 extended-stay and 1 select service hotels located in Hanover, MD, Neptune, NJ, Titusville, FL, Milford, CT, and Pittsburgh, PA (each individually, an “AHIP Hotel Portfolio Property”, and collectively, the “AHIP Hotel Portfolio Properties”).
| THE INFORMATION IN THIS STRUCTURAL AND COLLATERAL TERM SHEET IS NOT COMPLETE AND MAY BE AMENDED PRIOR TO THE TIME OF SALE. THIS TERM SHEET IS NOT AN OFFER TO SELL THESE SECURITIES AND IT IS NOT A SOLICITATION OF AN OFFER TO BUY THESE SECURITIES IN ANY JURISDICTION WHERE THE OFFER OR SALE IS NOT PERMITTED. | ||
| T-68 | ||
| Hospitality – Various | Loan #5 | Cut-off Date Balance: | $43,000,000 | |
| Various | AHIP Hotel Portfolio | Cut-off Date LTV: | 55.2% | |
| Various | U/W NCF DSCR: | 1.78x | ||
| U/W NOI Debt Yield: | 15.8% |
The Borrowers and the Borrower Sponsor. The borrowers are AHIP NJ Neptune Properties LLC, AHIP NJ Neptune Enterprises LLC, AHIP MD Hanover 7027 Properties LLC, AHIP MD Hanover 7027 Enterprises LLC, AHIP FL Titusville Properties LLC, AHIP FL Titusville Enterprises LLC, AHIP CT Milford Properties LLC, AHIP CT Milford Enterprises LLC, AHIP PA Pittsburgh 1004 Properties LLC and AHIP PA Pittsburgh 1004 Enterprises LLC, each a single-purpose, Delaware limited liability company with one independent director.
The Borrower Sponsor is American Hotel Income Properties REIT Inc. (“AHIP” or the “Borrower Sponsor”). AHIP is a limited partnership formed under the Limited Partnership Act (Ontario) to invest in hotel real estate properties located in the United States. AHIP maintains a portfolio of 49 premium branded, select-service hotels across 20 states and 35 cities in secondary markets with diverse and stable demand generators. AHIP is traded on the Toronto Stock Exchange, while AHIP hotels operate under brands affiliated with Marriott, Hilton, IHG and Choice Hotels through license agreements.
The Properties. The AHIP Hotel Portfolio Properties are comprised of five hotels located across five states (Maryland, New Jersey, Florida, Connecticut and Pennsylvania), totaling 554 rooms: Hampton Inn & Suites Baltimore Arundel Mills (the “Hampton Inn & Suites Baltimore Arundel Mills Property”), Residence Inn Neptune (the “Residence Inn Neptune Property”), Fairfield Inn & Suites Titusville Kennedy Space Center (the “Fairfield Inn & Suites Titusville Property”), Hilton Garden Inn Milford (the “Hilton Garden Inn Milford Property”) and Fairfield Inn & Suites Pittsburgh Airport Robinson Township (the “Fairfield Inn & Suites Pittsburgh Property”). The AHIP Hotel Portfolio Properties each benefit from brand affiliations with either Marriott (3 hotels / 54.9% of rooms) or Hilton (2 hotels / 45.1% of rooms), both market leaders in the select-service and extended-stay hotel sectors.
The following table presents certain information relating to the AHIP Hotel Portfolio Properties:
| AHIP Hotel Portfolio Summary | |||||||||
Property Name
| Property Sub-Type | Allocated Cut-Off Date Balance | % of Portfolio Cut-Off Date Balance | Year Built/Renovated | Rooms |
Underwritten NCF |
% of Underwritten NCF | Appraised Value | % of Appraised Value |
| Residence Inn Neptune Property | Extended Stay | $12,750,963 | 29.7% | 2007 / 2022 | 105 | $1,677,199 | 28.4% | $23,100,000 | 29.7% |
| Hampton Inn & Suites Baltimore Arundel Mills Property | Limited Service | $10,818,999 | 25.2% | 2002 / 2014, 2022-2023 | 130 | $1,648,164 | 27.9% | $19,600,000 | 25.2% |
| Hilton Garden Inn Milford Property | Select Service | $8,666,239 | 20.2% | 2009 / 2023-2024 | 120 | $934,716 | 15.8% | $15,700,000 | 20.2% |
| Fairfield Inn & Suites Titusville Property | Limited Service | $6,955,071 | 16.2% | 2008 / 2018 | 96 | $1,188,319 | 20.1% | $12,600,000 | 16.2% |
| Fairfield Inn & Suites Pittsburgh Property | Limited Service | $3,808,728 | 8.9% | 2015 / NAP | 103 | $459,198 | 7.8% | $6,900,000 | 8.9% |
| Total | $43,000,000 | 100.0% | 554 | $5,907,595 | 100.0% | $77,900,000 | 100.0% | ||
The Residence Inn Neptune Property (29.7% of allocated cut-off date balance): The Residence Inn Neptune Property is a four-story, 105-room, extended-stay hotel that was constructed in 2007. The Residence Inn Neptune Property is located in Neptune, New Jersey in close proximity to the Jersey Shore. Hotel amenities include a fitness room, a lobby workstation, breakfast dining area, a market pantry, a guest laundry room, 400 SF of meeting space, a sports court, 110 surface parking spaces and an outdoor patio and barbecue area. Guestroom offerings include studio queens/kings, one-bedroom suites and two-bedroom suites, featuring separate living and sleeping areas, sleeper sofas, kitchens with full-size appliances, workspaces and smart TVs. The Residence Inn Neptune Property most recently completed a $3.2 million PIP in 2022, including soft goods updates as well as case goods improvements in the breakfast dining area. The Residence Inn Neptune Property is subject to a franchise agreement with Marriott, executed in June 2017 and expiring in March 2027 (March 2037 if the 10-year renewal option is exercised). If, among other events, the franchise agreement fails to be renewed or replaced by no later than 12 months prior to the franchise expiration date, a cash sweep will be triggered requiring a monthly deposit into the FF&E reserve of not less than $185,000, which will be funded by the excess cash flow generated at the Residence Inn Neptune Property and, if necessary, the borrowers. Such funds are required to be allocated toward completion of property improvement plan in connection with franchise renewal. See “Escrows and Reserves” herein. According to the appraisal, as of 2023, the estimated segmentation at the Residence Inn Neptune Property is approximately 31% extended-stay, 59% transient and 10% group.
For the trailing 12 months period ending October 2024, the Residence Inn Neptune Property was outperforming its competitive set in occupancy, ADR and RevPAR, having successfully rebounded from damage related disruption and capitalized on recent renovation. The following table presents historical occupancy, ADR, and RevPAR penetration rates of the Residence Inn Neptune Property:
| Historical Occupancy, ADR, RevPAR(1) | |||||||||||||
| Competitive Set(2) | Residence Inn Neptune Property(3) | Penetration Factor | |||||||||||
| Year | Occupancy | ADR | RevPAR | Occupancy | ADR | RevPAR | Occupancy | ADR | RevPAR | ||||
| 2021 | 64.7% | $150.08 | $97.17 | 88.0% | $139.09 | $122.39 | 135.9% | 92.7% | 126.0% | ||||
| 2022 | 70.3% | $165.79 | $116.60 | 73.2% | $162.94 | $119.33 | 104.1% | 98.3% | 102.3% | ||||
| 2023(4) | 75.4% | $177.04 | $133.46 | 39.5% | $179.78 | $71.08 | 52.5% | 101.5% | 53.3% | ||||
| Oct. 2024(4) | 67.1% | $176.35 | $118.37 | 69.2% | $186.30 | $128.89 | 103.1% | 105.6% | 108.9% | ||||
Source: Third-party research report.
| (1) | Variances between the underwriting, the appraisal and industry report data with respect to occupancy, ADR and RevPAR are attributable in part to variances in reporting methodologies and/or timing differences. |
| (2) | According to a third-party research report, the competitive set includes the Hawthorn Suites by Wyndham Tinton Falls, Homewood Suites by Hilton Eatontown, Hampton Inn Neptune/Wall and Holiday Inn Express Neptune. |
| (3) | Residence Inn Neptune metrics are based on the historical operating statements provided by the Borrower Sponsor. |
| (4) | The Residence Inn Neptune Property experienced (i) a burst pipe and subsequent renovations which caused the hotel to close from January through April of 2023, totaling 12,600 room nights offline, and (ii) additional renovations, which resulted in an additional 2,389 rooms nights offline from May through December of 2023. |
| THE INFORMATION IN THIS STRUCTURAL AND COLLATERAL TERM SHEET IS NOT COMPLETE AND MAY BE AMENDED PRIOR TO THE TIME OF SALE. THIS TERM SHEET IS NOT AN OFFER TO SELL THESE SECURITIES AND IT IS NOT A SOLICITATION OF AN OFFER TO BUY THESE SECURITIES IN ANY JURISDICTION WHERE THE OFFER OR SALE IS NOT PERMITTED. | ||
| T-69 | ||
| Hospitality – Various | Loan #5 | Cut-off Date Balance: | $43,000,000 | |
| Various | AHIP Hotel Portfolio | Cut-off Date LTV: | 55.2% | |
| Various | U/W NCF DSCR: | 1.78x | ||
| U/W NOI Debt Yield: | 15.8% |
Hampton Inn & Suites Baltimore Arundel Mills Property (25.2% of allocated cut-off date balance): The Hampton Inn & Suites Baltimore Arundel Mills Property is a five-story, 130-room, limited-service hotel that was constructed in 2002. The Hampton Inn & Suites Baltimore Arundel Mills Property is located in Hanover, Maryland, situated along major routes, including interstates and highways, providing accessibility to Baltimore, Maryland. Hotel amenities include an outdoor pool, a fitness room, a breakfast dining area, a business center, a market pantry, a coffee station, a guest laundry room, 1,128 SF of meeting space and 141 surface parking spaces. Guestrooms, 30% of which are suites, are equipped with workspaces, sleeper sofas and HDTVs. The Hampton Inn & Suites Baltimore Arundel Mills Property underwent extensive renovations between November 2022 and March 2023 in connection with the most recent franchise mandated PIP for which the Borrower Sponsor invested approximately $4.1 million ($31,903 per key). Renovations included updates to both public spaces and guestrooms with new carpeting, wall vinyl, light fixtures and furniture, and conversions of all king room tubs to showers. The Hampton Inn & Suites Baltimore Arundel Mills Property is subject to a franchise agreement with Hilton, executed in June 2017 and expiring in June 2032. According to the appraisal, as of 2023, the estimated segmentation at the Hampton Inn & Suites Baltimore Arundel Mills Property is approximately 60% commercial/government, 30% leisure and 10% group with top corporate accounts including Horror Book, RDU Football, EasyPost and Fry Family Group.
For the trailing 12 months period ending October 2024, the Hampton Inn & Suites Baltimore Arundel Mills Property outperformed its competitive set in occupancy, ADR and RevPAR, demonstrating material improvement from 2023 during which the Property underwent significant renovation.
The following table presents historical occupancy, ADR, and RevPAR penetration rates of the Hampton Inn & Suites Baltimore Arundel Mills Property:
| Historical Occupancy, ADR, RevPAR(1) | ||||||||||||
| Competitive Set(2) | Hampton Inn & Suites Baltimore Arundel Mills Property(3) | Penetration Factor | ||||||||||
| Year | Occupancy | ADR | RevPAR | Occupancy | ADR | RevPAR | Occupancy | ADR | RevPAR | |||
| 2021 | 60.0% | $95.15 | $57.08 | 60.8% | $112.18 | $68.24 | 101.4% | 117.9% | 119.6% | |||
| 2022 | 72.8% | $109.50 | $79.77 | 72.0% | $130.06 | $93.64 | 98.8% | 118.8% | 117.4% | |||
| 2023 | 78.5% | $111.89 | $87.87 | 69.1% | $134.84 | $93.21 | 88.0% | 120.5% | 106.1% | |||
| Oct. 2024 | 76.4% | $117.01 | $89.42 | 80.0% | $135.00 | $107.98 | 104.7% | 115.4% | 120.8% | |||
Source: Third-party research report.
| (1) | Variances between the underwriting, the appraisal and industry report data with respect to occupancy, ADR and RevPAR are attributable in part to variances in reporting methodologies and/or timing differences. |
| (2) | According to a third-party research report, the competitive set includes the Holiday Inn Express Baltimore BWI Airport West, SpringHill Suites Baltimore BWI Airport, Hampton Inn Baltimore/Glen Burnie, Aloft Arundel Mills BWI Airport, Fairfield Inn & Suites Arundel Mills BWI Airport, Hilton Garden Inn Hanover Arundel Mills BWI Airport. |
| (3) | Hampton Inn & Suites Baltimore Arundel Mills metrics are based on the historical operating statements provided by the Borrower Sponsor. |
The Hilton Garden Inn Milford Property (20.2% of allocated cut-off date balance): The Hilton Garden Inn Milford Property is a four-story, 120-room, select-service hotel that was constructed in 2009. The Hilton Garden Inn Milford Property is located in the county of New Haven, Connecticut, situated in close proximity to Yale University. Hotel amenities include a restaurant and lounge, an indoor pool, a fitness room, a business center, a market pantry, a guest laundry room, an outdoor patio, 2,701 SF of meeting space and 132 surface parking spaces. Guestroom offerings include double queen and king rooms, as well as king junior and king suites. The Hilton Garden Inn Milford Property underwent extensive renovations between October 2023 and March 2024 in connection with the most recent franchise mandated PIP, updating guestrooms and public areas with new carpeting, wallcoverings, lighting, window treatments and bedding with the Borrower Sponsor having invested $2.8 million. The Hilton Garden Inn Milford Property is subject to a franchise agreement with Hilton, executed in June 2017 and expiring in June 2032. According to the appraisal, as of 2023, the estimated segmentation at the Hilton Garden Inn Milford Property is approximately 60% commercial, 35% leisure and 5% group with top corporate accounts including Dynamic Surface Application, Avelop Airlines, Edgewell Personal Care, Netjets and General Electric.
Historically, the Hilton Garden Inn Milford Property has consistently outperformed its competitive set in both ADR and RevPar since 2021. The following table presents historical occupancy, ADR, and RevPAR penetration rates of the Hilton Garden Inn Milford Property:
| Historical Occupancy, ADR, RevPAR(1) | |||||||||||||
| Competitive Set(2) | Hilton Garden Inn Milford Property(3) | Penetration Factor | |||||||||||
| Year | Occupancy | ADR | RevPAR | Occupancy | ADR | RevPAR | Occupancy | ADR | RevPAR | ||||
| 2021 | 53.3% | $110.29 | $58.79 | 66.5% | $116.43 | $77.45 | 124.8% | 105.6% | 131.7% | ||||
| 2022 | 66.4% | $122.05 | $81.00 | 73.6% | $137.36 | $101.07 | 110.9% | 112.5% | 124.8% | ||||
| 2023(4) | 64.9% | $125.41 | $81.33 | 69.4% | $138.72 | $96.26 | 107.0% | 110.6% | 118.4% | ||||
| Oct. 2024 | 68.1% | $125.81 | $85.64 | 67.9% | $139.73 | $94.81 | 99.7% | 111.1% | 110.7% | ||||
Source: Third-party research report.
| (1) | Variances between the underwriting, the appraisal and industry report data with respect to occupancy, ADR and RevPAR are attributable in part to variances in reporting methodologies and/or timing differences. |
| (2) | According to a third-party research report, the competitive set includes Hampton Inn Milford, Executive Hotel of New Haven West Haven, Courtyard New Haven Orange/Milford, Holiday Inn Express & Suites Milford and Hyatt Place Milford / New Haven. |
| (3) | Hilton Garden Inn Milford metrics are based on the historical operating statements provided by the Borrower Sponsor. |
| (4) | The Hilton Garden Inn Milford Property experienced ongoing renovations, which resulted in approximately 4,215 displaced room nights between January and December 2023. |
| THE INFORMATION IN THIS STRUCTURAL AND COLLATERAL TERM SHEET IS NOT COMPLETE AND MAY BE AMENDED PRIOR TO THE TIME OF SALE. THIS TERM SHEET IS NOT AN OFFER TO SELL THESE SECURITIES AND IT IS NOT A SOLICITATION OF AN OFFER TO BUY THESE SECURITIES IN ANY JURISDICTION WHERE THE OFFER OR SALE IS NOT PERMITTED. | ||
| T-70 | ||
| Hospitality – Various | Loan #5 | Cut-off Date Balance: | $43,000,000 | |
| Various | AHIP Hotel Portfolio | Cut-off Date LTV: | 55.2% | |
| Various | U/W NCF DSCR: | 1.78x | ||
| U/W NOI Debt Yield: | 15.8% |
The Fairfield Inn & Suites Titusville Property (16.2% of allocated cut-off date balance): The Fairfield Inn & Suites Titusville Property is a four-story, 96-room, limited-service hotel that was constructed in 2008. The Fairfield Inn & Suites Titusville Property is located in Titusville, Florida, adjacent to Interstate 95, the East Coast’s main highway route, providing easy access to the leisure attractions of Orlando. Hotel amenities include an outdoor pool, a fitness room, a breakfast dining area, a business center, a market pantry, a guest laundry room, 1,008 SF of meeting space and 97 surface parking spaces. Guestroom offerings include double queen and king rooms, as well as executive and spa suites, equipped with mini fridges, microwaves, TVs, sleeper sofas and living areas. The hotel underwent renovations in 2018, which included the updating of furnishings and flooring in most areas of the hotel. According to the appraisal, as of 2023, the segmentation at the Fairfield Inn & Suites Titusville Property is approximately 60% commercial/government, 30% leisure and 10% group with top corporate accounts including the United States Department of Defense, United States Department of the Navy and National Aeronautics and Space Administration. According to the Borrower Sponsor, the Fairfield Inn & Suites Titusville Property is scheduled for renovation in 2026 for which a portion of the $3 million upfront reserve is allocated. The Fairfield Inn & Suites Titusville Property is subject to a franchise agreement with Marriott executed in November 2014 and expiring in July 2028. If, among other events, the franchise agreement fails to be renewed or replaced by no later than 12 months prior to the franchise expiration date, a cash sweep will be triggered requiring a monthly deposit into the FF&E reserve of not less than $185,000, which will be funded by the excess cash flow generated at the Fairfield Inn & Suites Titusville Property and, if necessary, the borrowers. Such funds are required to be allocated toward completion of property improvement plan in connection with franchise renewal. See “Escrows and Reserves” herein.
For the trailing 12 months period ending October 2024, the Fairfield Inn & Suites Titusville Property materially outperformed its competitive set in RevPAR and has consistently done so since 2021. Further, the Fairfield Inn & Suites Titusville Property achieved Net Cash Flow growth in the trailing twelve months period of 22.5% to relative 2023.
The following table presents historical occupancy, ADR, and RevPAR penetration rates of the Fairfield Inn & Suites Titusville Property:
| Historical Occupancy, ADR, RevPAR(1) | |||||||||||||
| Competitive Set(2) | Fairfield Inn & Suites Titusville Property(3) | Penetration Factor | |||||||||||
| Year | Occupancy | ADR | RevPAR | Occupancy | ADR | RevPAR | Occupancy | ADR | RevPAR | ||||
| 2021 | 61.2% | $77.86 | $47.68 | 64.1% | $101.70 | $65.21 | 104.7% | 130.6% | 136.8% | ||||
| 2022 | 69.2% | $104.30 | $72.21 | 79.2% | $120.56 | $95.47 | 114.4% | 115.6% | 132.2% | ||||
| 2023 | 69.2% | $113.10 | $78.31 | 75.9% | $130.11 | $98.81 | 109.7% | 115.0% | 126.2% | ||||
| Oct. 2024 | 68.9% | $114.16 | $78.69 | 75.0% | $141.37 | $106.02 | 108.8% | 123.8% | 134.7% | ||||
Source: Third-party research report.
| (1) | Variances between the underwriting, the appraisal and industry report data with respect to occupancy, ADR and RevPAR are attributable in part to variances in reporting methodologies and/or timing differences. |
| (2) | According to a third-party research report, the competitive set includes Best Western Space Shuttle Inn, Days Inn Titusville Kennedy Space Center, Hampton Inn Titusville/I-95 Kennedy Space Center and Holiday Inn Titusville - Kennedy Space Center. |
| (3) | Fairfield Inn & Suites Titusville metrics are based on the historical operating statements provided by the Borrower Sponsor. |
The Fairfield Inn & Suites Pittsburgh Property (8.9% of allocated cut-off date balance): The Fairfield Inn & Suites Pittsburgh Property is a four-story, 103-room, limited-service hotel that was constructed in 2015. The Fairfield Inn & Suites Pittsburgh Property is located in Pittsburgh, Pennsylvania with shuttle access to and from Robinson Township Airport. Hotel amenities include an indoor pool and whirlpool, a fitness room, breakfast dining area with complimentary daily breakfast, a lobby workstation, a market pantry, 375 SF of meeting space, 101 surface parking spaces and an outdoor patio and barbecue area. Guestroom offerings include double queen and king rooms, as well as queen and king suites, outfitted with mini fridges, microwaves and TVs, as well as sleeper sofas and workspaces. According to the Borrower Sponsor, the Fairfield Inn & Suites Pittsburgh Property is scheduled for renovation in 2026 for which a portion of the $3 million upfront reserve is allocated. Fairfield Inn & Suites Pittsburgh Property is subject to a franchise agreement with Marriott, executed in December 2019 and expiring in October 2035. According to the appraisal, as of 2023, the estimated segmentation at the Fairfield Inn & Suites Pittsburgh Property is approximately 50% commercial, 30% leisure and 20% group with top corporate accounts being Park/Fly, FedEx, CLC, TA Connections and Accenture.
| THE INFORMATION IN THIS STRUCTURAL AND COLLATERAL TERM SHEET IS NOT COMPLETE AND MAY BE AMENDED PRIOR TO THE TIME OF SALE. THIS TERM SHEET IS NOT AN OFFER TO SELL THESE SECURITIES AND IT IS NOT A SOLICITATION OF AN OFFER TO BUY THESE SECURITIES IN ANY JURISDICTION WHERE THE OFFER OR SALE IS NOT PERMITTED. | ||
| T-71 | ||
| Hospitality – Various | Loan #5 | Cut-off Date Balance: | $43,000,000 | |
| Various | AHIP Hotel Portfolio | Cut-off Date LTV: | 55.2% | |
| Various | U/W NCF DSCR: | 1.78x | ||
| U/W NOI Debt Yield: | 15.8% |
For the trailing 12 months period ending October 2024, the Fairfield Inn & Suites Pittsburgh Property was outperforming its competitive set in ADR, RevPAR and occupancy and has consistently outperformed its competitive set in occupancy and RevPar since 2021. The following table presents historical occupancy, ADR, and RevPAR penetration rates of Fairfield Inn & Suites Pittsburgh Property:
| Historical Occupancy, ADR, RevPAR(1) | |||||||||||||
| Competitive Set(2) | Fairfield Inn & Suites Pittsburgh Property(3) | Penetration Factor | |||||||||||
| Year | Occupancy | ADR | RevPAR | Occupancy | ADR | RevPAR | Occupancy | ADR | RevPAR | ||||
| 2021 | 46.5% | $87.92 | $40.89 | 64.1% | $87.58 | $56.16 | 137.9% | 99.6% | 137.3% | ||||
| 2022 | 49.6% | $97.71 | $48.44 | 75.2% | $94.35 | $70.99 | 151.8% | 96.6% | 146.5% | ||||
| 2023 | 51.3% | $102.51 | $52.61 | 71.9% | $105.67 | $75.99 | 140.1% | 103.1% | 144.5% | ||||
| Oct. 2024 | 50.2% | $102.15 | $51.30 | 73.4% | $105.73 | $77.63 | 146.2% | 103.5% | 151.3% | ||||
Source: Third-party research report.
| (1) | Variances between the underwriting, the appraisal and industry report data with respect to occupancy, ADR and RevPAR are attributable in part to variances in reporting methodologies and/or timing differences. |
| (2) | According to a third-party research report, the competitive set includes Red Roof PLUS+ Pittsburgh South – Airport, Holiday Inn Express & Suites Pittsburgh Airport, La Quinta Inns & Suites Pittsburgh Airport, Comfort Suites Pittsburgh, Wyndham Garden Hotel Pittsburgh Airport, Hilton Garden Inn Pittsburgh Airport South-Robinson Mall. |
| (3) | Fairfield Inn & Suites Pittsburgh metrics are based on the historical operating statements provided by the Borrower Sponsor. |
The Markets. The AHIP Hotel Portfolio Properties are located across five distinct competitive markets in the eastern United States. The following highlights key statistics for each relevant market.
Residence Inn Neptune Property: Located in Neptune, New Jersey, the Residence Inn Neptune Property benefits from a variety of tourism and leisure attractions within the area, including the New Jersey Shore, Gateway National Recreation Area, Monmouth Park Racetrack and Adventure Crossing USA. Additional demand generators during key weekends include special events such as the Garden State Film Festival and the Fall Harvest Festival. The competitive market for the Residence Inn Neptune Property consists of four properties, ranging in size from 95 to 131 rooms, with 431 total rooms (the “Residence Inn Neptune Property Competitive Market”).
The following table presents the primary competitive properties to the Residence Inn Neptune Property:
| Competitive Property Summary | ||||||||
| Property | Year Built | Rooms | Extended-Stay | Transient | Group | 2023 Occupancy | 2023 ADR | 2023 RevPAR |
| Residence Inn Neptune(1) | 2007 | 105 | 31% | 59% | 10% | 39.5%(2) | $179.78 | $71.08 |
| Hawthorn Suites by Wyndham Tinton Falls | 1988 | 96 | 5% | 80% | 15% | 65%-70% | $130-$140 | $90-$95 |
| Homewood Suites by Hilton Eatontown | 2004 | 131 | 30% | 60% | 10% | 80%-85% | $200-$210 | $170-$180 |
| Hampton by Hilton Neptune/Wall | 2012 | 109 | 5% | 80% | 15% | 60%-65% | $180-$190 | $115-$120 |
| Holiday Inn Express Neptune | 2010 | 95 | 30% | 60% | 10% | 55%-60% | $170-$180 | $95-$100 |
| Total/Average | 536 | 20% | 68% | 12% | 68% | $178 | $121 | |
Source: Appraisal unless otherwise noted.
| (1) | Residence Inn Neptune Property 2023 Occupancy, ADR and RevPAR are based on the historical operating statements provided by the Borrower Sponsor. |
| (2) | Between January and December 2023, the Residence Inn Neptune Property experienced approximately 2,436 offline room nights due to a burst pipe, resulting in a decrease in occupancy and RevPAR at the Residence Inn Neptune Property. |
Hampton Inn & Suites Baltimore Arundel Mills Property: Located in Hanover, Maryland within the Washington-Baltimore-Arlington metropolitan statistical area, the Hampton Inn & Suites Baltimore Arundel Mills Property benefits from its proximity to a variety of tourist and leisure attractions. Demand generators include the Inner Harbor, The National Aquarium in Baltimore, Pimlico Race Course and Oriole Park at Camden Yards, while special events, including the International Auto Show and the Preakness race, serve as demand drivers during key weekends. The competitive market for the Hampton Inn & Suites Baltimore Arundel Mills Property consists of seven properties, ranging in size from 96 to 159 rooms, with 925 total rooms (the “Hampton Inn & Suites Baltimore Arundel Mills Property Competitive Market”). The appraisal notes that a Hyatt House recently entered the Hampton Inn & Suites Baltimore Arundel Mills Property Competitive Market and that the existing Sleep Inn is anticipated to be converted into a Holiday Inn Express. According to the appraisal, the newly developed property is not considered to be fully competitive given the differences in product-type, demand base and brand.
| THE INFORMATION IN THIS STRUCTURAL AND COLLATERAL TERM SHEET IS NOT COMPLETE AND MAY BE AMENDED PRIOR TO THE TIME OF SALE. THIS TERM SHEET IS NOT AN OFFER TO SELL THESE SECURITIES AND IT IS NOT A SOLICITATION OF AN OFFER TO BUY THESE SECURITIES IN ANY JURISDICTION WHERE THE OFFER OR SALE IS NOT PERMITTED. | ||
| T-72 | ||
| Hospitality – Various | Loan #5 | Cut-off Date Balance: | $43,000,000 | |
| Various | AHIP Hotel Portfolio | Cut-off Date LTV: | 55.2% | |
| Various | U/W NCF DSCR: | 1.78x | ||
| U/W NOI Debt Yield: | 15.8% |
The following table presents the primary competitive properties to the Hampton Inn & Suites Baltimore Arundel Mills Property:
| Competitive Property Summary | ||||||||
| Property | Year Built | Rooms | Commercial | Group | Leisure | 2023 Occupancy | 2023 ADR | 2023 RevPAR |
| Hampton Inn & Suites Baltimore Arundel Mills(1) | 2002 | 130 | 60% | 10% | 30% | 69.1% | $134.84 | $93.21 |
| SpringHill Suites by Marriott Arundel Mills BWI Airport | 2006 | 128 | 60% | 10% | 30% | 70%-75% | $115-$120 | $80-$85 |
| Aloft Arundel Mills | 2009 | 142 | 65% | 10% | 25% | 75%-80% | $110-$115 | $85-$90 |
| Hilton Garden Inn Hanover Arundel Mills BWI Airport | 2009 | 151 | 60% | 15% | 25% | 80%-85% | $130-$140 | $105-$110 |
| Fairfield by Marriott Arundel Mills BWI Airport | 2011 | 96 | 60% | 5% | 35% | 75%-80% | $105-$110 | $85-$90 |
| Holiday Inn Express BWI Airport West | 1989 | 159 | 60% | 5% | 35% | 75%-80% | $95-$100 | $70-$75 |
| Hampton by Hilton Baltimore Glen Burnie | 1989 | 116 | 60% | 5% | 35% | 75%-80% | $115-$120 | $90-$95 |
| SpringHill Suites by Marriott Baltimore BWI Airport | 2001 | 133 | 60% | 10% | 30% | 70%-75% | $105-$110 | $75-$80 |
| Total/Average | 1,055 | 61% | 9% | 30% | 76% | $115 | $87 | |
Source: Appraisal unless otherwise noted.
| (1) | The Hampton Inn & Suites Baltimore Arundel Mills Property 2023 Occupancy, ADR and RevPAR are based on the historical operating statements provided by the Borrower Sponsor. |
Hilton Garden Inn Milford Property: The Hilton Garden Inn Milford Property, located in New Haven County in Milford, Connecticut, benefits from its location along Interstate 95, the primary corridor traversing the New England region. Owing to the presence of Yale University, New Haven has become an important cultural center, contributing to the county’s various demand generators. Special events, including Yale football games and the Milford Oyster Festival, further bolster lodging demand within the area. The competitive market for the Hilton Garden Inn Milford Property consists of five properties, ranging in size from 86 to 148 rooms, with 550 total rooms (the “Hilton Garden Inn Milford Property Competitive Market”). The appraisal notes that no new hotels are expected within the Hilton Garden Inn Milford Property Competitive Market at this time.
The following table presents the primary competitive properties to the Hilton Garden Inn Milford Property:
| Competitive Property Summary | ||||||||
| Property | Year Built | Rooms | Commercial | Group | Leisure | 2023 Occupancy | 2023 ADR | 2023 RevPAR |
| Hilton Garden Inn Milford(1) | 2009 | 120 | 60% | 5% | 35% | 69.4% | $138.72 | $96.26 |
| Best Western Executive Hotel of New Haven West Haven | 1985 | 101 | 50% | 5% | 45% | 60%-65% | $110-$115 | $65-$70 |
| Courtyard by Marriott New Haven Orange Milford | 1997 | 121 | 60% | 5% | 35% | 65%-70% | $130-$140 | $95-$100 |
| Hampton by Hilton Milford | 1986 | 148 | 55% | 5% | 40% | 55%-60% | $120-$125 | $70-$75 |
| Holiday Inn Express & Suites Milford | 1985 | 94 | 55% | 5% | 40% | 65%-70% | $120-$125 | $80-$85 |
| Hyatt Place Milford | 2007 | 86 | 60% | 5% | 35% | 70%-75% | $130-$140 | $90-$95 |
| Total/Average | 670 | 57% | 5% | 38% | 66% | $129 | $85 | |
Source: Appraisal unless otherwise noted.
| (1) | Hilton Garden Inn Milford Property 2023 Occupancy, ADR and RevPAR are based on the historical operating statements provided by the Borrower Sponsor. |
Fairfield Inn & Suites Titusville Property: The Fairfield Inn & Suites Titusville Property, situated in the county of Brevard in Titusville, Florida, benefits from its proximity to the Kennedy Space Center as well as the presence of prominent aerospace and military technology companies within the area, including Boeing, Lockheed Martin, Embraer, SpaceX, Astrotech, and Blue Origin. Leisure attractions in the market range from numerous beaches and nature preserves to rocket launches and space industry museums and attractions. The competitive market for the Fairfield Inn & Suites Titusville Property consists of four properties, ranging in size from 86 to 141 rooms, with 479 total rooms (the “Fairfield Inn & Suites Titusville Property Competitive Market”). The appraisal notes that various hotels have been proposed for development throughout the market; however, given the speculative nature of these projects, they are yet to be considered direct competitors.
The following table presents the primary competitive properties to the Fairfield Inn & Suites Titusville Property:
| Competitive Property Summary | ||||||||
| Property | Year Built | Rooms | Commercial | Group | Leisure | 2023 Occupancy | 2023 ADR | 2023 RevPAR |
| Fairfield Inn & Suites Titusville Kennedy Space Center(1) | 2008 | 96 | 60% | 10% | 30% | 75.9% | $130.11 | $98.81 |
| Best Western Space Shuttle Inn | 1972 | 129 | 25% | 10% | 65% | 60%-65% | $95-$100 | $60-$65 |
| Days Inn by Wyndham Titusville Kennedy Space Center | 1985 | 141 | 45% | 5% | 50% | 65%-70% | $90-$95 | $60-$65 |
| Hampton by Hilton Titusville I 95 Kennedy Space Center | 2004 | 86 | 45% | 10% | 45% | 70%-75% | $140-$150 | $100-$105 |
| Holiday Inn Titusville Kennedy Space Center | 2010 | 123 | 35% | 10% | 55% | 65%-70% | $125-$130 | $90-$95 |
| Total/Average | 575 | 41% | 9% | 50% | 70% | $115 | $80 | |
Source: Appraisal unless otherwise noted.
| (1) | Fairfield Inn & Suites Titusville Property 2023 Occupancy, ADR and RevPAR are based on the historical operating statements provided by the Borrower Sponsor. |
| THE INFORMATION IN THIS STRUCTURAL AND COLLATERAL TERM SHEET IS NOT COMPLETE AND MAY BE AMENDED PRIOR TO THE TIME OF SALE. THIS TERM SHEET IS NOT AN OFFER TO SELL THESE SECURITIES AND IT IS NOT A SOLICITATION OF AN OFFER TO BUY THESE SECURITIES IN ANY JURISDICTION WHERE THE OFFER OR SALE IS NOT PERMITTED. | ||
| T-73 | ||
| Hospitality – Various | Loan #5 | Cut-off Date Balance: | $43,000,000 | |
| Various | AHIP Hotel Portfolio | Cut-off Date LTV: | 55.2% | |
| Various | U/W NCF DSCR: | 1.78x | ||
| U/W NOI Debt Yield: | 15.8% |
Fairfield Inn & Suites Pittsburgh Property: The Fairfield Inn & Suites Pittsburgh Property, located in Pittsburgh, Pennsylvania, benefits from its proximity to Pittsburgh International Airport. Demand generators within the area include Station Square, Acrisure Stadium, Phipps Conservatory and Botanical Gardens, Andy Warhol Museum, Senator John Heinz History Center, Pittsburgh Zoo & Aquarium and the Carnegie Museum of Art. Special events, such as Pittsburgh Steelers NFL games, as well as notable weekends, including graduations and move in/out dates at the area's many local universities, also play a role generating demand. The competitive market for the Fairfield Inn & Suites Pittsburgh Property consists of six properties, ranging in size from 70 to 149 rooms, with 719 total rooms (the “Fairfield Inn & Suites Pittsburgh Property Competitive Market”). The appraisal notes a number of other hotels have been proposed for development throughout the wider market; however, their distance from the Fairfield Inn & Suites Pittsburgh Property does not make them direct competitors.
The following table presents the primary competitive properties to the Fairfield Inn & Suites Pittsburgh Property:
| Competitive Property Summary | ||||||||
| Property | Year Built | Rooms | Commercial | Group | Leisure | 2023 Occupancy | 2023 ADR | 2023 RevPAR |
| Fairfield Inn & Suites Pittsburgh Airport Robinson Township (1) | 2015 | 103 | 50% | 20% | 30% | 71.9% | $105.67 | $75.99 |
| La Quinta Inn Pittsburgh Airport | 1985 | 129 | 55% | 10% | 35% | 45%-50% | $95-$100 | $40-$45 |
| Hilton Garden Inn Pittsburgh Airport South- Robinson Mall | 2016 | 118 | 65% | 15% | 20% | 65%-70% | $125-$130 | $85-$90 |
| Holiday Inn Express & Suites Pittsburgh Airport | 1987 | 149 | 60% | 20% | 20% | 60%-65% | $100-$105 | $65-$70 |
| Comfort Suites Pittsburgh | 2000 | 70 | 50% | 15% | 35% | 40%-45% | $95-$100 | $40-$45 |
| Red Roof Inn Pittsburgh Airport | 1977 | 113 | 65% | 5% | 30% | 35%-40% | $85-$90 | $30-$35 |
| Wyndham Garden Pittsburgh Airport | 1972 | 140 | 55% | 20% | 25% | 40%-45% | $90-$95 | $35-$40 |
| Total/Average | 822 | 58% | 16% | 26% | 54% | $103 | $56 | |
Source: Appraisal unless otherwise noted.
| (1) | Fairfield Inn & Suites Pittsburgh Property 2023 Occupancy, ADR and RevPAR are based on the historical operating statements provided by the Borrower Sponsor. |
Appraisal. The appraisals concluded to an aggregate “as is” value for the AHIP Hotel Portfolio Properties of $77,900,000 as of various dates from September 26, 2024 to October 2, 2024.
Environmental Matters. According to the Phase I environmental site assessments dated October 17, 2024 and October 19, 2024, there was no evidence of any recognized environmental conditions at the AHIP Hotel Portfolio Properties.
| THE INFORMATION IN THIS STRUCTURAL AND COLLATERAL TERM SHEET IS NOT COMPLETE AND MAY BE AMENDED PRIOR TO THE TIME OF SALE. THIS TERM SHEET IS NOT AN OFFER TO SELL THESE SECURITIES AND IT IS NOT A SOLICITATION OF AN OFFER TO BUY THESE SECURITIES IN ANY JURISDICTION WHERE THE OFFER OR SALE IS NOT PERMITTED. | ||
| T-74 | ||
| Hospitality – Various | Loan #5 | Cut-off Date Balance: | $43,000,000 | |
| Various | AHIP Hotel Portfolio | Cut-off Date LTV: | 55.2% | |
| Various | U/W NCF DSCR: | 1.78x | ||
| U/W NOI Debt Yield: | 15.8% |
Operating History and Underwritten Net Cash Flow. The following table presents certain information relating to the historical operating performance and Underwritten Net Cash Flow at the AHIP Hotel Portfolio Properties:
| Cash Flow Analysis | ||||||||
| 2019 | 2020 | 2021 | 2022(1) | 2023(1) | TTM 10/31/2024 | UW(2) | UW per Room | |
| Occupancy | 81.1% | 49.5% | 68.4% | 74.4% | 65.3% | 73.2% | 73.52% | |
| ADR | $122.57 | $104.76 | $113.65 | $129.29 | $133.96 | $140.81 | $140.81 | |
| RevPAR | $99.40 | $51.82 | $77.73 | $96.23 | $87.44 | $103.11 | $103.52 | |
| Room Revenue | $20,099,200 | $10,507,494 | $15,717,208 | $19,457,786 | $17,682,129 | $20,906,675 | $20,932,459 | $37,784 |
| Food & Beverage | $515,551 | $130,088 | $134,101 | $233,941 | $245,440 | $262,511 | $284,898 | $514 |
| Other Departmental Income | $386,484 | $193,496 | $281,916 | $354,572 | $359,762 | $464,960 | $476,813 | $861 |
| Total Revenue | $21,001,235 | $10,831,078 | $16,133,226 | $20,046,299 | $18,287,330 | $21,634,146 | $21,694,169 | $39,159 |
| Room Expense | $4,469,172 | $2,427,416 | $3,192,243 | $4,679,565 | $4,390,474 | $5,089,108 | $5,064,447 | $9,142 |
| Food & Beverage Expense | $611,543 | $140,792 | $109,961 | $325,213 | $385,128 | $407,450 | $401,038 | $724 |
| Other Departmental Expense | $109,604 | $61,211 | $78,851 | $106,461 | $105,291 | $121,531 | $129,358 | $233 |
| Total Department Expenses | $5,190,319 | $2,629,419 | $3,381,055 | $5,111,239 | $4,880,892 | $5,618,090 | $5,594,843 | $10,099 |
| Departmental Profit | $15,810,916 | $8,201,659 | $12,752,171 | $14,935,060 | $13,406,438 | $16,016,056 | $16,099,327 | $29,060 |
| Management Fee | $605,310 | $290,832 | $418,829 | $593,826 | $545,711 | $646,763 | $650,825 | $1,175 |
| Real Estate Taxes | $870,709 | $928,948 | $897,071 | $880,807 | $798,103 | $781,445 | $765,979 | $1,383 |
| Insurance | $175,662 | $204,955 | $260,335 | $297,437 | $510,283 | $590,603 | $465,035 | $839 |
| Other Expenses | $47,416 | $51,710 | $52,047 | $41,435 | $83,788 | $69,961 | $68,138 | $123 |
| Total Undistributed Expenses(3) | $6,995,289 | $4,362,256 | $5,266,846 | $6,621,389 | $6,535,045 | $7,342,176 | $7,373,987 | $13,310 |
| Total Expenses | $13,884,705 | $8,468,120 | $10,276,183 | $13,546,133 | $13,353,823 | $15,049,037 | $14,918,807 | $26,929 |
| Net Operating Income | $7,116,530 | $2,362,958 | $5,857,043 | $6,500,166 | $4,933,508 | $6,585,109 | $6,775,362 | $12,230 |
| FF&E | $840,049 | $433,243 | $645,750 | $801,853 | $731,502 | $880,292 | $867,767 | $1,566 |
| Net Cash Flow | $6,276,480 | $1,929,715 | $5,211,293 | $5,698,313 | $4,202,006 | $5,704,817 | $5,907,595 | $10,664 |
| NOI DSCR | 2.14x | 0.71x | 1.76x | 1.95x | 1.48x | 1.98x | 2.04x | |
| NCF DSCR | 1.89x | 0.58x | 1.57x | 1.71x | 1.26x | 1.71x | 1.78x | |
| NOI Debt Yield | 16.6% | 5.5% | 13.6% | 15.1% | 11.5% | 15.3% | 15.8% | |
| NCF Debt Yield | 14.6% | 4.5% | 12.1% | 13.3% | 9.8% | 13.3% | 13.7% | |
| (1) | The decrease in Occupancy and Net Operating Income from 2022 to 2023 and subsequent recovery from 2023 to TTM October 2024 is primarily attributable to (i) a burst pipe and subsequent renovations at the Residence Inn Neptune Property, which caused the hotel to close from January through April of 2023, totaling 12,600 room nights offline, (ii) additional renovations at the Residence Inn Neptune Property, which resulted in an additional 2,389 rooms nights offline from May through December of 2023, and (iii) ongoing renovations at the Hilton Garden Inn Milford Property, which resulted in approximately 4,215 displaced room nights between January and December 2023. | |
| (2) | Between November and December of 2023 a total of 1,844 room nights were offline at the Hilton Garden Inn Milford. For purposes of the lender underwriting presented above, occupancy is based on TTM October 2024 with exception of November and December of 2024 with respect to the Hilton Garden Inn Milford Property, which were adjusted based on a 105.0% penetration index as compared to the competitive set identified by a third party market data provider for the related months. |
| (3) | Undistributed Expenses is comprised of administrative & general, information & telecom systems, sales & marketing, franchise fees, property maintenance and utilities expenses. |
| THE INFORMATION IN THIS STRUCTURAL AND COLLATERAL TERM SHEET IS NOT COMPLETE AND MAY BE AMENDED PRIOR TO THE TIME OF SALE. THIS TERM SHEET IS NOT AN OFFER TO SELL THESE SECURITIES AND IT IS NOT A SOLICITATION OF AN OFFER TO BUY THESE SECURITIES IN ANY JURISDICTION WHERE THE OFFER OR SALE IS NOT PERMITTED. | ||
| T-75 | ||
| Hospitality – Various | Loan #5 | Cut-off Date Balance: | $43,000,000 | |
| Various | AHIP Hotel Portfolio | Cut-off Date LTV: | 55.2% | |
| Various | U/W NCF DSCR: | 1.78x | ||
| U/W NOI Debt Yield: | 15.8% |
The following table presents historical and underwritten Net Cash Flows at the AHIP Hotel Portfolio Properties:
| AHIP Hotel Portfolio Property Cash Flows(1) | |||||||
| Property Name | 2019 NCF | 2020 NCF | 2021 NCF | 2022 NCF | 2023 NCF | TTM 10/31/2024 NCF | JPM UW |
| Residence Inn Neptune Property(2) | 1,349,037 | 1,263,482 | 2,020,527 | 1,567,478 | 571,540 | 1,580,846 | 1,677,199 |
| Hampton Inn & Suites Baltimore Arundel Mills Property | 1,803,621 | 346,684 | 1,089,472 | 1,476,040 | 1,264,723 | 1,683,406 | 1,648,163.52 |
| Hilton Garden Inn Milford Property(3) | 858,204 | (45,540) | 855,826 | 1,094,105 | 900,628 | 780,056 | 934,715.97 |
| Fairfield Inn & Suites Titusville Property | 1,715,541 | 528,959 | 770,022 | 1,081,181 | 971,007 | 1,189,346 | 1,188,319.09 |
| Fairfield Inn & Suites Pittsburgh Property | 550,077 | (163,870) | 475,445 | 479,508 | 494,109 | 471,163 | 459,197.51 |
| Total | 6,276,480 | 1,929,715 | 5,211,293 | 5,698,313 | 4,202,006 | 5,704,817 | 5,907,595 |
| (1) | Metrics are based on the historical operating statements provided by the Borrower Sponsor. |
| (2) | The decrease in Net Cash Flow from 2022 to 2023 and subsequent recovery at Residence Inn Neptune Property from 2023 to TTM October 2024 is primarily attributable to (i) a burst pipe and subsequent renovations at the Residence Inn Neptune Property, which caused the hotel to close from January through April of 2023, totaling 12,600 room nights offline and (ii) additional renovations at the Residence Inn Neptune Property, which resulted in an additional 2,389 rooms nights offline from May through December of 2023. |
| (3) | The decrease in Net Cash Flow from 2022 to 2023 and TTM October 2024 is primarily attributable to ongoing renovations at the Hilton Garden Inn Milford Property, which resulted in approximately 4,215 displaced room nights between January and December 2023. |
Escrows and Reserves.
Real Estate Taxes – On the loan origination date, the borrowers were required to make an upfront deposit of $82,821 into a reserve for real estate taxes. In addition, the borrowers are required to deposit into a real estate tax reserve, on a monthly basis, an amount equal to 1/12 of the real estate taxes that the lender estimates will be payable during the ensuing 12 months (initially estimated to be $65,747).
Insurance – On the loan origination date, the borrowers were required to make an upfront deposit of $335,263 into a reserve to satisfy the requirement to deposit one month’s premium finance installment plan. The borrowers are required to deposit into an insurance reserve, on a monthly basis, an amount equal to 1/12 of the insurance premiums that the lender estimates will be payable for the renewal of the insurance coverage; provided, however, that such monthly reserves for insurance premiums have been conditionally suspended so long as (i) no event of default has occurred and is continuing and (ii) the insurance coverage for the AHIP Hotel Portfolio Properties is included in a blanket policy approved by the lender in its reasonable discretion. Notwithstanding the foregoing, if the borrowers have provided satisfactory evidence that the borrowers are financing the insurance premiums in accordance with the AHIP Hotel Portfolio Mortgage Loan documents, (a) the borrowers are required to have on deposit with the lender an amount equal to one month’s premium finance installment payment, and the monthly insurance premium deposit requirement will be waived and (b) so long as the insurance premiums are being financed, such amount is required to be held as additional collateral for the AHIP Hotel Portfolio Mortgage Loan.
FF&E – On the loan origination date, the borrowers were required to make an upfront deposit of $83,560 into a reserve for replacements, improvements and repairs to FF&E required to be made during the calendar year. In addition, the borrowers are required to deposit into an FF&E reserve, on a monthly basis, an amount equal to 5.0% of gross rents and operating income from the AHIP Hotel Portfolio Property for the calendar month 2 months prior to such payment date, or such higher amount recommended or required by the applicable franchise agreement.
PIP Reserve – On the loan origination date, the borrowers were required to make an initial deposit of $3,000,000 ($5,415 per room) for replacements and repairs to FF&E required by any property improvement plan (other than any property improvement plan required to satisfy any Franchise Renewal Criteria (as defined below) or Franchise Replacement Criteria (as defined below)) for the Fairfield Inn & Suites Pittsburgh Property or Fairfield Inn & Suites Titusville Property (the “PA/FL PIP Replacements”). If at any time Lender determines that amounts then on deposit for PA/FL PIP Replacements will be less than 120% of the amounts needed to complete any property improvement plan required at the Fairfield Inn & Suites Pittsburgh Property or Fairfield Inn & Suites Titusville Property at the time such PA/FL PIP Replacement is to be completed thereunder, the borrowers are required to deposit the additional sums required to complete the PA/FL PIP Replacements.
On each payment date during the continuance of a Franchise Trigger Event (as defined below), (i) all excess cash flow is required to be deposited into the FF&E reserve for replacements and repairs required by any property improvement plan required by the franchisor in connection with the borrowers’ satisfaction of the Franchise Renewal Criteria and Franchise Replacement Criteria and (ii) in the event such excess cash flow deposited in accordance with the foregoing clause (i) is less than $185,000 on such payment date, the borrowers are required to pay an amount such that, together with all excess cash flow deposited, the total amount deposited on the applicable payment date is $185,000. Failure of the borrowers to deposit at least $185,000 on the applicable payment date is recourse to the guarantor in the amount of the shortfall. The franchise agreements for the Residence Inn Neptune Property and the Fairfield Inn & Suites Titusville Property are scheduled to expire, respectively, on March 1, 2027 (March 1, 2037 if the 10-year renewal option is exercised) and July 23, 2028. The borrowers are also required to deposit, on each payment date, an amount required to complete all work required by any future property improvement plan (the “Future PIP Monthly Deposit”) other than those described in the foregoing paragraphs.
Immediate Repairs – On the loan origination date, the borrowers were required to make an upfront deposit of $56,979 into a reserve for required repairs. The borrowers are responsible for completing all required repairs within 90 days from the loan origination date.
Lockbox and Cash Management. The AHIP Hotel Portfolio Mortgage Loan is structured with a hard lockbox and springing cash management. The borrowers and property manager are required to direct credit card companies to deposit all credit card receipts directly into the lockbox account and to deposit any rents otherwise received in such account within one business day after receipt. If no Cash Sweep Event (as defined below) is continuing, all funds in the lockbox account will be swept each business day to the borrowers’ operating account. During the continuance of a Cash Sweep Event, all funds in the lockbox account are required to be swept each business day to lender-controlled cash management accounts. Funds in the cash management account are required to be applied to debt service and the reserves and escrows described above, with any excess funds to be deposited into an excess cash flow reserve account held by the lender as cash collateral for the AHIP Hotel Portfolio Mortgage Loan.
| THE INFORMATION IN THIS STRUCTURAL AND COLLATERAL TERM SHEET IS NOT COMPLETE AND MAY BE AMENDED PRIOR TO THE TIME OF SALE. THIS TERM SHEET IS NOT AN OFFER TO SELL THESE SECURITIES AND IT IS NOT A SOLICITATION OF AN OFFER TO BUY THESE SECURITIES IN ANY JURISDICTION WHERE THE OFFER OR SALE IS NOT PERMITTED. | ||
| T-76 | ||
| Hospitality – Various | Loan #5 | Cut-off Date Balance: | $43,000,000 | |
| Various | AHIP Hotel Portfolio | Cut-off Date LTV: | 55.2% | |
| Various | U/W NCF DSCR: | 1.78x | ||
| U/W NOI Debt Yield: | 15.8% |
A “Cash Sweep Event” means the occurrence of (i) an event of default, (ii) a bankruptcy action of the borrowers or property manager, (iii) the debt service coverage ratio based on the trailing 12-month period immediately preceding the date of determination being less than 1.20x, (iv) the date that is 12 months prior to the expiration date of any franchise agreement or (v) the termination of any franchise agreement (each of the foregoing (iv) and (v), a “Franchise Trigger Event”).
A Cash Sweep Event will end (a) with respect to clause (i) above, if a cure of the event of default has been accepted by the lender, (b) with respect to clause (ii) above, solely with respect to the property manager, if the property manager is replaced within 120 days with a qualified property manager under a replacement management agreement, (c) with respect to clause (ii) above, solely with respect to the borrowers, based on an involuntary petition against the borrowers with respect to which none of the borrowers, guarantor nor any affiliate thereof colluded with or solicited petitioning creditors or acquiesced in or joined in such involuntary petition, upon such involuntary petition being discharged, stayed or dismissed within 60 days of such filing, otherwise in accordance with the AHIP Hotel Portfolio Mortgage Loan documents, (d) with respect to clause (iii) above, if the debt service coverage ratio is greater than or equal to 1.20x for two consecutive quarters based upon the trailing 12-month period immediately preceding the date of determination, (e) with respect to clause (iv) above, if the borrowers satisfy either (x) the Franchise Renewal Criteria (as defined below) or (y) the Franchise Replacement Criteria (as defined below); or (f) with respect to clause (v), if the borrowers satisfy the Franchise Replacement Criteria; subject, however, to the following: (A) no event of default is continuing, (B) the borrowers have paid all of the lender’s reasonable expenses incurred in connection with the cure of the Cash Sweep Event, including reasonable attorney’s fees and expenses, (C) the borrowers may not cure a Cash Sweep Event more than a total of five times in the aggregate during the term of AHIP Hotel Portfolio Mortgage Loan and (D) except as set forth above, the borrowers have no right to cure a Cash Sweep Event caused by a bankruptcy action of the borrowers.
“Franchise Renewal Criteria” means the lender has received with respect to the franchise agreement that is the subject of the Franchise Trigger Event: (i) a fully executed renewal of the franchise agreement or similar document with a term of at least 10 years acceptable to the lender in its sole discretion, (ii) an updated comfort letter from the applicable franchisor acceptable to the lender in its sole discretion and (iii) (x) completion of any property improvement plan required in connection with such renewed franchise agreement as determined by the lender in its sole discretion or (y) the amount on deposit in the franchise PIP subaccount and allocated specifically for any property improvement plan required in connection with such renewed franchise agreement equals or exceeds an amount equal to 120% of the amount necessary to complete all work described in such property improvement plan (the “Franchise PIP Deposit”).
“Franchise Replacement Criteria” means satisfaction of the following conditions with respect to the franchise agreement that is the subject of the Franchise Trigger Event: (i) the borrowers have entered into a replacement franchise agreement having a term of at least 10 years, and on terms and conditions acceptable to the lender with a qualified franchisor acceptable to the lender; (ii) the delivery to the lender of a tri-party agreement, franchisor comfort letter or similar agreement acceptable to the lender; and (iii) (x) completion of any property improvement plan required in connection with such renewed franchise agreement as determined by the lender in its sole discretion or (y) the amount on deposit in the Franchise PIP Subaccount and allocated specifically for any property improvement plan required in connection with such replacement franchise agreement equals or exceeds the applicable Franchise PIP Deposit.
Partial Release. Other than during the period that is 60 days prior to and 60 days after a securitization, on and after the date that is the earlier of two years from the closing date of the securitization to hold the last note and March 6, 2029, if the borrowers have elected to prepay or defease a portion of the AHIP Hotel Portfolio Mortgage Loan, the borrowers may obtain the release of the Hampton Inn & Suites Baltimore Arundel Mills Property and/or Fairfield Inn & Suites Airport Robinson Township Pittsburgh Property (but no other individual AHIP Hotel Portfolio Property (each, an “Individual Property”) from the related lien, upon the satisfaction of certain conditions set forth in the AHIP Hotel Portfolio Mortgage Loan documents, including, without limitation, the following: (a) the amount of the principal balance of the AHIP Hotel Portfolio Mortgage Loan to be defeased (or prepaid) must equal or exceed 120% of the applicable release amount; (b) after giving effect to such release, the combined loan to value ratio following the release may not exceed 55.20%; (c) delivery of a REMIC opinion, (d) following the release, (x) the debt service coverage ratio for the remaining portion of the AHIP Hotel Portfolio Properties based on the trailing 12-month period immediately preceding the release must be equal to or greater than the greater of (i) 1.78x, and (ii) the debt service coverage ratio immediately preceding the release based on the trailing 12-month period immediately preceding the release and (y) the debt yield for the remaining portion of the AHIP Hotel Portfolio Properties must be equal to or greater than the greater of (i) 13.74%, and (ii) the debt yield immediately preceding the release; (d) if required by the lender, a rating agency confirmation; and (e) the applicable individual borrower must convey the Individual Property being released, concurrently with the release, to a person other than a borrower or a borrower affiliate, and (d) satisfaction of REMIC related conditions.
Terrorism Insurance. The borrowers are required to obtain and maintain property insurance for 100% of full replacement cost and business interruption insurance for 18 months plus a 12-month extended period of indemnity. Such insurance is required to cover perils of terrorism and acts of terrorism. See “Risk Factors—Risks Relating to the Mortgage Loans—Terrorism Insurance May Not Be Available for All Mortgaged Properties” in the prospectus.
| THE INFORMATION IN THIS STRUCTURAL AND COLLATERAL TERM SHEET IS NOT COMPLETE AND MAY BE AMENDED PRIOR TO THE TIME OF SALE. THIS TERM SHEET IS NOT AN OFFER TO SELL THESE SECURITIES AND IT IS NOT A SOLICITATION OF AN OFFER TO BUY THESE SECURITIES IN ANY JURISDICTION WHERE THE OFFER OR SALE IS NOT PERMITTED. | ||
| T-77 | ||
| Mixed Use – Multifamily/RV Park/ | Loan #6 | Cut-off Date Balance: | $40,000,000 | |
| Manufactured Housing/Self Storage | Green Caye Village | Cut-off Date LTV: | 53.4% | |
| 2500 Caroline Street | UW NCF DSCR: | 1.31x | ||
| Dickinson, TX 77539 | UW NOI Debt Yield: | 8.8% |

| THE INFORMATION IN THIS STRUCTURAL AND COLLATERAL TERM SHEET IS NOT COMPLETE AND MAY BE AMENDED PRIOR TO THE TIME OF SALE. THIS TERM SHEET IS NOT AN OFFER TO SELL THESE SECURITIES AND IT IS NOT A SOLICITATION OF AN OFFER TO BUY THESE SECURITIES IN ANY JURISDICTION WHERE THE OFFER OR SALE IS NOT PERMITTED. | ||
| T-78 | ||
| Mixed Use – Multifamily/RV Park/ | Loan #6 | Cut-off Date Balance: | $40,000,000 | |
| Manufactured Housing/Self Storage | Green Caye Village | Cut-off Date LTV: | 53.4% | |
| 2500 Caroline Street | UW NCF DSCR: | 1.31x | ||
| Dickinson, TX 77539 | UW NOI Debt Yield: | 8.8% |
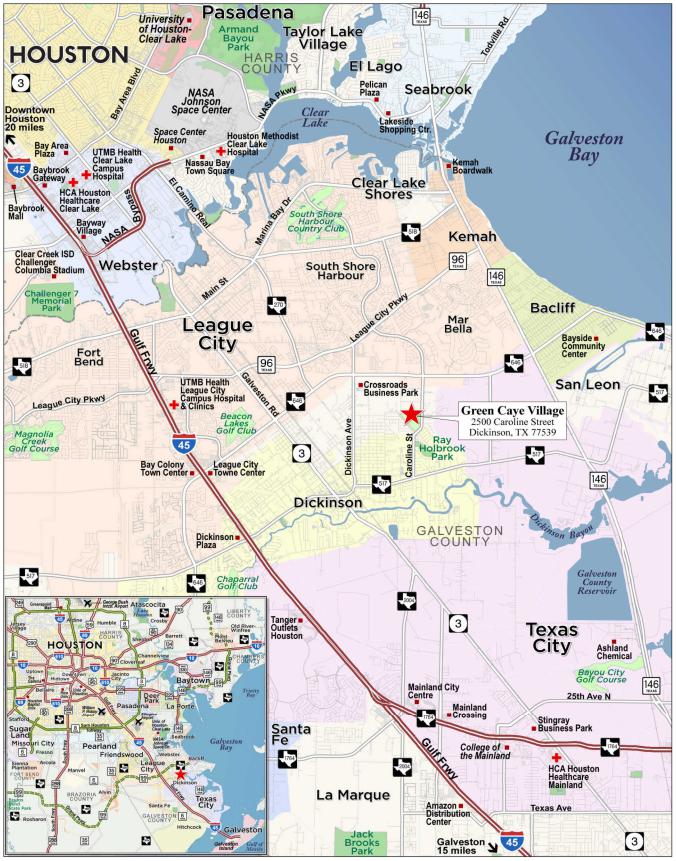
| THE INFORMATION IN THIS STRUCTURAL AND COLLATERAL TERM SHEET IS NOT COMPLETE AND MAY BE AMENDED PRIOR TO THE TIME OF SALE. THIS TERM SHEET IS NOT AN OFFER TO SELL THESE SECURITIES AND IT IS NOT A SOLICITATION OF AN OFFER TO BUY THESE SECURITIES IN ANY JURISDICTION WHERE THE OFFER OR SALE IS NOT PERMITTED. | ||
| T-79 | ||
| Mortgage Loan No. 6 – Green Caye Village |
| Mortgage Loan Information | Property Information | ||||||
| Mortgage Loan Seller: | WFB | Single Asset/Portfolio: | Single Asset | ||||
| Credit Assessment (Fitch/Moody’s/KBRA): | NR/NR/NR | Location: | Dickinson, TX 77539 | ||||
| Original Balance: | $40,000,000 | General Property Type: | Mixed Use | ||||
| Cut-off Date Balance: | $40,000,000 | Detailed Property Type: | Multifamily/RV Park/Manufactured | ||||
| % of Initial Pool Balance: | 5.4% | Housing/Self Storage | |||||
| Loan Purpose: | Refinance | Title Vesting: | Fee | ||||
| Borrower Sponsor: | Stonetown MRE Texas, LLC | Year Built/Renovated: | 1997/2023-2024 | ||||
| Guarantor: | Stonetown MRE Texas, LLC | Size: | 894 Units | ||||
| Mortgage Rate: | 6.41700% | Cut-off Date Balance per Unit: | $44,743 | ||||
| Note Date: | 1/14/2025 | Maturity Balance per Unit: | $44,743 | ||||
| Maturity Date: | 2/11/2030 | Property Manager: | Cairn Communities, LLC | ||||
| Original Term to Maturity: | 60 months | (borrower-related) | |||||
| Original Amortization Term: | 0 months | Underwriting and Financial Information | |||||
| IO Period: | 60 months | UW NOI: | $3,532,687 | ||||
| Seasoning: | 0 months | UW NCF: | $3,412,372 | ||||
| Prepayment Provisions: | L(24),YM1(29),O(7) | UW NOI Debt Yield: | 8.8% | ||||
| Lockbox/Cash Mgmt Status: | Springing/Springing | UW NCF Debt Yield: | 8.5% | ||||
| Additional Debt Type: | NAP | UW NOI Debt Yield at Maturity: | 8.8% | ||||
| Additional Debt Balance: | NAP | UW NCF DSCR: | 1.31x | ||||
| Future Debt Permitted (Type): | No (NAP) | Most Recent NOI: | $3,153,499 (TTM 10/31/2024) | ||||
| 2nd Most Recent NOI: | $3,283,268 (12/31/2023) | ||||||
| 3rd Most Recent NOI: | $3,160,204 (12/31/2022) | ||||||
| Reserves(1) | Most Recent Occupancy: | 89.4% (12/23/2024) | |||||
| Type | Initial | Monthly | Cap | 2nd Most Recent Occupancy: | 85.7% (12/31/2023) | ||
| RE Taxes: | $64,109 | $64,109 | NAP | 3rd Most Recent Occupancy: | 87.4% (12/31/2022) | ||
| Insurance: | $187,068 | $93,534 | NAP | Appraised Value (as of): | $74,900,000 (10/28/2024) | ||
| Replacement Reserve: | $0 | $10,026 | NAP | Appraised Value per Unit: | $83,781 | ||
| Cut-off Date LTV Ratio: | 53.4% | ||||||
| Maturity Date LTV Ratio: | 53.4% | ||||||
Sources and Uses | ||||||
| Sources | Proceeds | % of Total | Uses | Proceeds | % of Total | |
| Loan Amount: | $40,000,000 | 89.0% | Loan Payoff: | $40,632,345 | 90.4% | |
| Borrower Sponsor Equity: | $4,941,749 | 11.0% | Closing Costs: | $4,058,228 | 9.0% | |
| Upfront Reserves: | $251,177 | 0.6% | ||||
| Total Sources: | $44,941,749 | 100.0% | Total Uses: | $44,941,749 | 100.0% | |
| (1) | See “Escrows and Reserves” below for further discussion of reserve requirements. |
The Mortgage Loan. The sixth largest mortgage loan (the “Green Caye Village Mortgage Loan”) is evidenced by a promissory note in the original principal amount of $40,000,000 and secured by the fee interest in a mixed use property consisting of 270 multifamily units, 289 RV spaces, 157 manufactured housing pad sites, and 178 self storage/parking units located in Dickinson, TX (the “Green Caye Village Property”).
The Borrower and the Borrower Sponsor. The borrower is Stonetown Green Caye Borrower, LLC, a single purpose Delaware limited liability company with one independent director. The borrower sponsor and non-recourse carveout guarantor of the Green Caye Village Property is Stonetown MRE Texas, LLC (“Green Caye Guarantor”). The Green Caye Guarantor is a joint venture between Meritage Group LP, an investment advisor registered with the U.S. Securities and Exchange Commission with $12.0 billion in assets under management as of January 1, 2024, and Stonetown Capital Group, an owner and operator of manufactured housing communities, RV resorts, and multifamily assets with more than 23,000 units in approximately 150 locations in 11 states.
The Property. The Green Caye Village Property is situated on a 92.6-acre site and is comprised of 270 multifamily units, (30.2% of total units, 56.1% of underwritten base rent), 289 RV spaces (32.3% of total units, 26.3% of underwritten base rent), 157 manufactured housing pad sites (17.6% of total units, 15.4% of underwritten base rent), and 178 self storage units, including 40 parking spaces, (19.9% of total units, 2.2% of underwritten base rent).
The multifamily component includes 194 townhomes, 74 duplexes and two single family homes. 127 of the 157 manufactured housing pad sites at the Green Caye Village Property have park-owned homes, whereby an affiliate of the borrower owns the home on top of the pad. The pad site is collateral and the park owned homes are not collateral for the Green Caye Village Mortgage Loan. Each multifamily and manufactured housing unit includes private backyards and assigned parking. Amenities include a swimming pool, fishing lake, playground, walking trails, and outdoor kitchen areas with grilling stations. The Green Caye Village Property is 89.4% occupied as of December 23, 2024 and has averaged 87.4% since January 2022 as of June 2024.
| THE INFORMATION IN THIS STRUCTURAL AND COLLATERAL TERM SHEET IS NOT COMPLETE AND MAY BE AMENDED PRIOR TO THE TIME OF SALE. THIS TERM SHEET IS NOT AN OFFER TO SELL THESE SECURITIES AND IT IS NOT A SOLICITATION OF AN OFFER TO BUY THESE SECURITIES IN ANY JURISDICTION WHERE THE OFFER OR SALE IS NOT PERMITTED. | ||
| T-80 | ||
| Mixed Use – Multifamily/RV Park/ | Loan #6 | Cut-off Date Balance: | $40,000,000 | |
| Manufactured Housing/Self Storage | Green Caye Village | Cut-off Date LTV: | 53.4% | |
| 2500 Caroline Street | UW NCF DSCR: | 1.31x | ||
| Dickinson, TX 77539 | UW NOI Debt Yield: | 8.8% |
The following table presents certain information relating to the space type mix of the Green Caye Village Property:
| Property Summary(1) | |||||||
| Space Type | Total No. of Units | Occupied Units | % of Total Units | Occupancy | Average Unit Size (SF) | Average Underwritten Monthly Rent per Unit/Pad(2) | % of UW Base Rent |
| Multifamily | 270 | 256 | 30.2% | 94.8% | 1,136 | $1,397 | 56.1% |
| RV Spaces | 289 | 223 | 32.3% | 77.2%(3) | NAP | $601 | 26.3% |
| MHC Pad Sites | 157 | 151 | 17.6% | 96.2% | NAP | $663 | 15.4% |
| Self Storage | 178 | 169 | 19.9% | 94.9% | NAP | $82 | 2.2% |
| Total/Wtd. Avg. | 894 | 799 | 100.0% | 89.4% | NAP | NAP | 100.0% |
| (1) | Information based on the underwritten rent roll dated December 23, 2024. |
| (2) | Based on occupied units. |
| (3) | Between 2023 and 2024, the borrower sponsor added 57 of the 289 total RV spaces. |
The following table presents certain information relating to the unit mix of the Green Caye Village Property for multifamily units:
| Unit Mix(1) | ||||||
| Unit Type | Total No. of Units | Occupied Units | % of Total Units | Occupancy | Average Unit Size (SF) | Average Underwritten Monthly Rent per Unit (2) |
| Two Bedroom, Two Bath (Townhome) | 194 | 183 | 71.9% | 94.3% | 1,149 | $1,389 |
| Two Bedroom (Duplex) | 74 | 72 | 27.4% | 97.3% | 1,069 | $1,390 |
| Three Bedroom, Two Bath (Single Family Home) | 2 | 1 | 0.7% | 50.0% | 2,346 | $3,200 |
| Total/Weighted Average | 270 | 256 | 100.0% | 94.8% | 1,136 | $1,397 |
| (1) | Information based on the underwritten rent roll dated December 23, 2024. |
| (2) | Based on occupied units. |
The Market. The Green Caye Village Property is located in the northeast area of Dickinson, Texas, approximately 31.5 miles from Houston, and approximately 24.4 miles from Galveston. Primary access to the area is provided by Interstate 45, a major arterial that connects Dickinson to Houston and is located approximately 4.5 miles from the property. Major employers in the area include HSG Constructors, Anesthesia Billing Bridge, and Keen Transport, which are each located within 3.5 miles of the Green Caye Village Property.
The 2024 total population within a one, three- and five- mile radius of the Green Caye Village Property is 8,636, 45,724 and 121,762 respectively. The 2024 median household income within in the same radii is $64,178, $95,711 and $93,019, respectively. The Green Caye Village Property is located in the North Galveston County multifamily submarket of the Houston market. As of January 2025, the North Galveston County submarket had 10,152 units with an overall vacancy rate of 8.7% and average asking rents of $1,458 per unit.
The appraisal identified five directly competitive multifamily comparables with average asking rents ranging from $715 to $1,649 per unit and are further detailed in the table below:
| Multifamily Competitive Set(1) | ||||||
| Green Caye Village(2) | Banyan Cove | Hollister | Creekside Apartments | Dickinson Arms | Calder Square | |
| Location | Dickinson, TX | League City, TX | Dickinson, TX | Dickinson, TX | Dickinson, TX | League City, TX |
| Distance to Subject | -- | 2.0 | 2.8 | 3.1 | 3.4 | 4.6 |
| Year Built/Renovated | 1997/2023-2024 | 1976 | 1976 | 1975 | 1984/2016 | 1983/2019 |
| Number of Units | 270 | 125 | 156 | 294 | 96 | 164 |
| Monthly Rent (per unit) | ||||||
| 1 Bedroom | NAP | $875 - $1,024 | $715 - $1,005 | $798 | $853 - $935 | $1,080 - $1,285 |
| 2 Bedrooms | $1,043 - $1,600(3) | $1,088 - $1,119 | $1,250 - $1,415 | $1,023 - $1,125 | $1,051 - 1,212 | $1,325 - $1,450 |
| 3 Bedrooms | $1,700 - $3,200(3) | $1,649 | $1,553 - $1,575 | $1,325 | NAP | NAP |
| Occupancy | 94.8% | 94.4% | 96.2% | 96.6% | 96.9% | 96.3% |
Source: Appraisal, unless otherwise indicated.
| (1) | Information based on multifamily units. |
| (2) | Information based on the underwritten rent roll dated December 23, 2024, other than location, property type and year built/renovated. |
| (3) | Based on occupied units. |
| THE INFORMATION IN THIS STRUCTURAL AND COLLATERAL TERM SHEET IS NOT COMPLETE AND MAY BE AMENDED PRIOR TO THE TIME OF SALE. THIS TERM SHEET IS NOT AN OFFER TO SELL THESE SECURITIES AND IT IS NOT A SOLICITATION OF AN OFFER TO BUY THESE SECURITIES IN ANY JURISDICTION WHERE THE OFFER OR SALE IS NOT PERMITTED. | ||
| T-81 | ||
| Mixed Use – Multifamily/RV Park/ | Loan #6 | Cut-off Date Balance: | $40,000,000 | |
| Manufactured Housing/Self Storage | Green Caye Village | Cut-off Date LTV: | 53.4% | |
| 2500 Caroline Street | UW NCF DSCR: | 1.31x | ||
| Dickinson, TX 77539 | UW NOI Debt Yield: | 8.8% |
The appraisal identified five directly competitive manufactured housing comparables with average asking rents ranging from $400 to $660 per pad and are further detailed in the table below:
| Manufactured Housing Competitive Set(1) | ||||||
| Green Caye Village(2) | Turtle Creek Crossing | Rancho Del Ray | Morningside Village | Mustang Road MHP | Oak Crest of Manvel | |
| Location | Dickinson, TX | Dickinson, TX | League City, TX | Dickinson, TX | Alvin, TX | Manvel, TX |
| Distance to Subject | -- | 1.2 | 4.8 | 1.7 | 16.3 | 26.7 |
| Year Built/Renovated | 1997/2023-2024 | 1980 | 1975 | 1999 | 1974 | 1999 |
| Number of Pads | 157 | 105 | 220 | 123 | 90 | 353 |
| Average Monthly Rent (per pad) | $663(3) | $600 | $400 | $660 | $465 | $625 |
| Occupancy | 96.2% | 98.0% | 98.0% | 100% | 100% | 100% |
Source: Appraisal, unless otherwise indicated.
| (1) | Information based on manufactured housing pads. |
| (2) | Information based on the underwritten rent roll dated December 23, 2024, other than location, property type and year built/renovated. |
| (3) | Based on occupied units. |
Appraisal. The appraiser concluded to an “as-is” value for the Green Caye Village Property of $74,900,000 as of October 28, 2024.
Environmental Matters. According to the Phase I environmental site assessment dated December 16, 2024, there was no evidence of any recognized environmental conditions at the Green Caye Village Property.
Operating History and Underwritten Net Cash Flow. The following table presents certain information relating to the historical operating performance and underwritten net cash flow at the Green Caye Village Property:
| Cash Flow Analysis(1) | |||||
| 2022 | 2023 | 10/31/2024 TTM | UW | UW per Unit | |
| Base Rent | $6,081,684 | $6,450,841 | $6,777,840 | $7,265,820 | $8,127 |
| Grossed Up Vacant Space | $0 | $0 | $0 | $811,647 | $908 |
| Gross Potential Rent | $6,081,684 | $6,450,841 | $6,777,840 | $8,077,467 | $9,035 |
| Utility Reimbursements(2) | $175,479 | $208,790 | $210,361 | $210,361 | $235 |
| Other Income(3) | $244,721 | $316,150 | $379,138 | $379,138 | $424 |
| Net Rentable Income | $6,501,884 | $6,975,781 | $7,367,339 | $8,666,966 | $9,695 |
| (Collection Loss) | ($5,038) | ($50,821) | ($88,994) | ($88,994) | ($100) |
| (Concessions) | $0 | $0 | ($0) | ($0) | $0 |
| (Vacancy) | $0 | $0 | ($0) | ($811,647) | ($908) |
| Effective Gross Income | $6,496,846 | $6,924,960 | $7,278,345 | $7,766,325 | $8,687 |
| Management Fee | $202,141 | $211,912 | $223,772 | $232,990 | $261 |
| Real Estate Taxes | $650,768 | $638,772 | $719,599 | $732,674 | $820 |
| Insurance | $780,881 | $856,823 | $982,466 | $1,068,965 | $1,196 |
| Other Operating Expenses | $1,702,852 | $1,934,185 | $2,199,009 | $2,199,009 | $2,460 |
| Total Operating Expenses | $3,336,642 | $3,641,692 | $4,124,846 | $4,233,638 | $4,736 |
| Net Operating Income | $3,160,204 | $3,283,268 | $3,153,499 | $3,532,687 | $3,952 |
| Replacement Reserves | $0 | $0 | $0 | $120,316 | $135 |
| Net Cash Flow | $3,160,204 | $3,283,268 | $3,153,499 | $3,412,372 | $3,817 |
| Occupancy (%)(4) | 87.4% | 85.7% | 89.4% | 90.0% | |
| NOI DSCR | 1.21x | 1.26x | 1.21x | 1.36x | |
| NCF DSCR | 1.21x | 1.26x | 1.21x | 1.31x | |
| NOI Debt Yield | 7.9% | 8.2% | 7.9% | 8.8% | |
| NCF Debt Yield | 7.9% | 8.2% | 7.9% | 8.5% | |
| (1) | Information based on the underwritten cash flow. |
| (2) | Reflects utility reimbursements from by tenants residing in the multifamily and manufactured housing components. |
| (3) | Other Income consists of late fees, pet fees, application fee income, nonrefundable gate key charges, extra person and vehicle charges, non-sufficient funds fees, laundry income, comcast revenue share, and other miscellaneous revenues. |
| (4) | UW Occupancy (%) represents economic occupancy. Historical occupancies represent physical occupancies.10/31/2024 TTM Occupancy (%) is based on the underwritten rent roll dated December 23, 2024. |
| THE INFORMATION IN THIS STRUCTURAL AND COLLATERAL TERM SHEET IS NOT COMPLETE AND MAY BE AMENDED PRIOR TO THE TIME OF SALE. THIS TERM SHEET IS NOT AN OFFER TO SELL THESE SECURITIES AND IT IS NOT A SOLICITATION OF AN OFFER TO BUY THESE SECURITIES IN ANY JURISDICTION WHERE THE OFFER OR SALE IS NOT PERMITTED. | ||
| T-82 | ||
| Mixed Use – Multifamily/RV Park/ | Loan #6 | Cut-off Date Balance: | $40,000,000 | |
| Manufactured Housing/Self Storage | Green Caye Village | Cut-off Date LTV: | 53.4% | |
| 2500 Caroline Street | UW NCF DSCR: | 1.31x | ||
| Dickinson, TX 77539 | UW NOI Debt Yield: | 8.8% |
Escrows and Reserves.
Real Estate Taxes – The loan documents required an upfront deposit of $64,109 for real estate taxes and ongoing monthly deposits equal to 1/12th of the taxes that the lender reasonably estimates will be payable over the next-ensuing 12-month period (initially estimated to be approximately $64,109).
Insurance – The loan documents required an upfront deposit of $187,068 for insurance and ongoing monthly reserves equal to 1/12th of the amount which will be sufficient to pay the insurance premiums due for the renewal of coverage afforded by such policies (initially estimated to be approximately $93,534).
Replacement Reserve – The borrower is required to deposit into a replacement reserve, on a monthly basis, $10,026 to be used for replacements at the Green Caye Village Property.
Lockbox and Cash Management. The Green Caye Village Mortgage Loan is structured with a springing lockbox and springing cash management. Upon the occurrence of a Deposit Account Establishment Trigger (as defined below), the borrower is required to establish a lender-controlled lockbox account and is thereafter required to deposit, or cause the property manager to deposit, all revenue generated by the Green Caye Village Property directly into such lender-controlled lockbox account. All funds deposited into the lockbox are required to be transferred on a periodic basis at the direction of the lender unless a Cash Trap Event Period (as defined below) exists and the lender elects (in its sole and absolute discretion) to deliver a restricted account notice, in which case all amounts in the lockbox account will be automatically transferred to the lender-controlled cash management account to be applied and disbursed in accordance with the Green Caye Village Mortgage Loan documents, and all excess cash flow funds remaining in the cash management account after the application of such funds in accordance with the Green Caye Village Mortgage Loan documents are required to be held by the lender in an excess cash flow reserve account as additional collateral for the Green Caye Village Mortgage Loan. Upon the cure of the applicable Cash Trap Event Period, so long as no other Cash Trap Event Period exists, the lender is required to return any amounts remaining on deposit in the excess cash flow reserve account to the borrower. Upon an event of default under the Green Caye Village Mortgage Loan documents, the lender may apply funds to the debt in such priority as it may determine.
A “Deposit Account Establishment Trigger” will occur upon the earlier of the following:
| (i) | the occurrence and continuance of an event of default under the Green Caye Village Loan documents, or |
| (ii) | the net cash flow debt service coverage ratio (“NCF DSCR”) being less than 1.20x, tested quarterly. |
A “Cash Trap Event Period” will commence upon the earlier of the following:
| (i) | the occurrence and continuance of an event of default under the Green Caye Village Mortgage Loan documents, or |
| (ii) | the NCF DSCR being less than 1.15x, tested quarterly. |
A Cash Trap Event Period will end upon:
| (i) | with respect to clause (i), the cure of such event of default, and |
| (ii) | with respect to clause (ii), the NCF DSCR being equal to or greater than 1.20x for two consecutive calendar quarters. |
Terrorism Insurance. The loan documents require an “all risk” insurance policy on a replacement cost basis, together with (i) business interruption insurance covering no less than the 12-month period following the occurrence of a casualty event, together with a 6-month extended period of indemnity, windstorm/named storm insurance with a deductible up to 5% of the total insurable value, and (iii) terrorism insurance as defined by TRIPRA. See “Risk Factors—Risks Relating to the Mortgage Loans—Terrorism Insurance May Not Be Available for All Mortgaged Properties” in the prospectus.
| THE INFORMATION IN THIS STRUCTURAL AND COLLATERAL TERM SHEET IS NOT COMPLETE AND MAY BE AMENDED PRIOR TO THE TIME OF SALE. THIS TERM SHEET IS NOT AN OFFER TO SELL THESE SECURITIES AND IT IS NOT A SOLICITATION OF AN OFFER TO BUY THESE SECURITIES IN ANY JURISDICTION WHERE THE OFFER OR SALE IS NOT PERMITTED. | ||
| T-83 | ||
| Hospitality – Full Service | Loan #7 | Cut-off Date Balance: | $35,000,000 | |
| 4700 Emperor Boulevard | Sheraton Imperial Raleigh Durham | Cut-off Date LTV: | 64.8% | |
| Durham, NC 27703 | UW NCF DSCR: | 1.91x | ||
| UW NOI Debt Yield: | 16.0% |

| THE INFORMATION IN THIS STRUCTURAL AND COLLATERAL TERM SHEET IS NOT COMPLETE AND MAY BE AMENDED PRIOR TO THE TIME OF SALE. THIS TERM SHEET IS NOT AN OFFER TO SELL THESE SECURITIES AND IT IS NOT A SOLICITATION OF AN OFFER TO BUY THESE SECURITIES IN ANY JURISDICTION WHERE THE OFFER OR SALE IS NOT PERMITTED. | ||
| T-84 | ||
| Hospitality – Full Service | Loan #7 | Cut-off Date Balance: | $35,000,000 | |
| 4700 Emperor Boulevard | Sheraton Imperial Raleigh Durham | Cut-off Date LTV: | 64.8% | |
| Durham, NC 27703 | UW NCF DSCR: | 1.91x | ||
| UW NOI Debt Yield: | 16.0% |
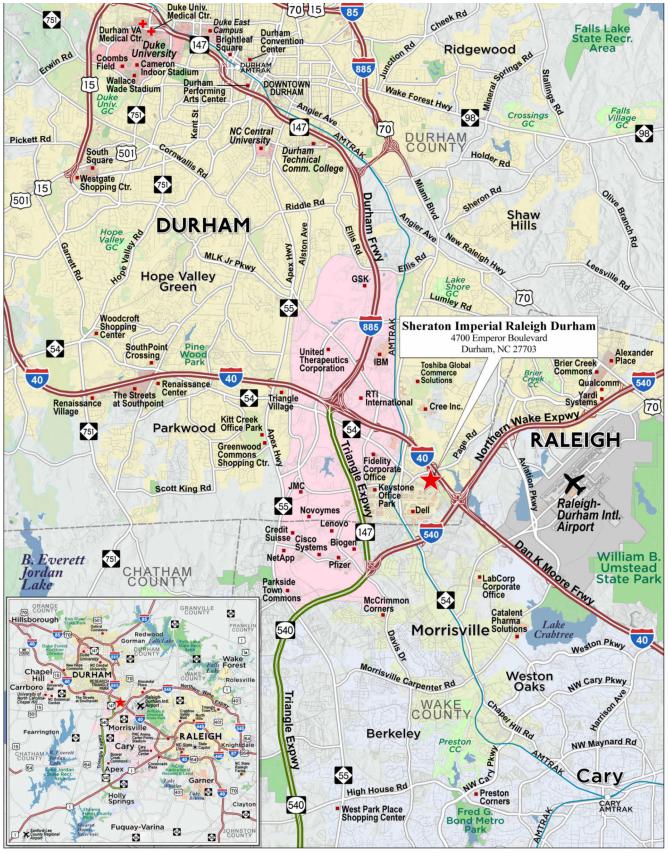
| THE INFORMATION IN THIS STRUCTURAL AND COLLATERAL TERM SHEET IS NOT COMPLETE AND MAY BE AMENDED PRIOR TO THE TIME OF SALE. THIS TERM SHEET IS NOT AN OFFER TO SELL THESE SECURITIES AND IT IS NOT A SOLICITATION OF AN OFFER TO BUY THESE SECURITIES IN ANY JURISDICTION WHERE THE OFFER OR SALE IS NOT PERMITTED. | ||
| T-85 | ||
| Mortgage Loan No. 7 – Sheraton Imperial Raleigh Durham |
| Mortgage Loan Information | Property Information | |||||
| Mortgage Loan Seller: | MSMCH | Single Asset/Portfolio: | Single Asset | |||
| Credit Assessment (Fitch/Moody’s/KBRA): | NR/NR/NR | Location: | Durham, NC 27703 | |||
| Original Balance: | $35,000,000 | General Property Type: | Hospitality | |||
| Cut-off Date Balance: | $35,000,000 | Detailed Property Type: | Full Service | |||
| % of Initial Pool Balance: | 4.7% | Title Vesting: | Fee | |||
| Loan Purpose: | Acquisition | Year Built/Renovated: | 1986/2023 | |||
| Borrower Sponsors: | Jacob K. Kuo, Esther Kuo and Lydia Hsu | Size: | 331 Rooms | |||
| Guarantors: | Jacob K. Kuo, Esther Kuo and Lydia Hsu | Cut-off Date Balance Per Room: | $105,740 | |||
| Mortgage Rate: | 7.08000% | Maturity Date Balance Per Room: | $105,740 | |||
| Note Date: | 1/9/2025 | Property Manager: | Concord Hospitality Enterprises | |||
| Maturity Date: | 2/1/2030 | Company, LLC | ||||
| Term to Maturity: | 60 months | Underwriting and Financial Information | ||||
| Amortization Term: | 0 months | UW NOI: | $5,603,785 | |||
| IO Period: | 60 months | UW NCF: | $4,789,374 | |||
| Seasoning: | 0 months | UW NOI Debt Yield: | 16.0% | |||
| Prepayment Provisions: | L(24),D(29),O(7) | UW NCF Debt Yield: | 13.7% | |||
| Lockbox/Cash Mgmt Status: | Springing/Springing | UW NOI Debt Yield at Maturity: | 16.0% | |||
| Additional Debt Type: | NAP | UW NCF DSCR: | 1.91x | |||
| Additional Debt Balance: | NAP | Most Recent NOI: | $5,424,390 (TTM 11/30/2024) | |||
| Future Debt Permitted (Type): | No (NAP) | 2nd Most Recent NOI: | $4,306,041 (12/31/2023) | |||
| 3rd Most Recent NOI: | $2,346,275 (12/31/2022) | |||||
| Reserves(1) | Most Recent Occupancy: | 69.6% (11/30/2024) | ||||
| Type | Initial | Monthly | Cap | 2nd Most Recent Occupancy: | 63.2% (12/31/2023) | |
| RE Taxes: | $117,571 | $58,786 | NAP | 3rd Most Recent Occupancy: | 40.2% (12/31/2022) | |
| Insurance: | $0 | Springing | NAP | Appraised Value (as of): | $54,000,000 (11/25/2024) | |
| Deferred Maintenance: | $26,250 | $0 | NAP | Appraised Value Per Room: | $163,142 | |
| Replacement Reserve: | $0 | $67,868 | NAP | Cut-off Date LTV Ratio: | 64.8% | |
| PIP Reserve: | $579,000 | $0 | NAP | Maturity Date LTV Ratio: | 64.8% | |
| Sources and Uses | ||||||
| Sources | Proceeds | % of Total | Uses | Proceeds | % of Total | |
| Mortgage Loan Amount: | $35,000,000 | 65.7% | Purchase Price: | $51,500,000 | 96.7% | |
| Borrower Sponsor Equity | $18,253,555 | 34.3% | Closing Costs: | $1,030,733 | 1.9% | |
| Reserves: | $722,821 | 1.4% | ||||
| Total Sources: | $53,253,555 | 100.0% | Total Uses: | $53,253,555 | 100.0% | |
| (1) | See “Escrows and Reserves” below for further discussion of reserve requirements. |
The Mortgage Loan. The seventh largest mortgage loan (the “Sheraton Imperial Raleigh Durham Mortgage Loan”) is evidenced by a promissory note in the original principal amount of $35,000,000. The Sheraton Imperial Raleigh Durham Mortgage Loan is secured by a first priority fee mortgage encumbering a hospitality property located in Durham, North Carolina (the “Sheraton Imperial Raleigh Durham Property”).
The Borrower and the Borrower Sponsors. The borrowing entities for the Sheraton Imperial Raleigh Durham Mortgage Loan are Bliss Hospitality LLC, Oasis Hospitality LLC and Sherd Group LLC, Delaware limited liability companies and single purpose entities with one independent director. Bliss Hospitality LLC and Sherd Group LLC own the fee interest in the Sheraton Imperial Raleigh Durham Property, as tenants-in-common, and have leased the Sheraton Imperial Raleigh Durham Property to Oasis Hospitality LLC (“Operating Lessee Borrower”) pursuant to an operating lease. The borrower sponsors and the non-recourse carveout guarantors are Jacob K. Kuo, Esther Kuo and Lydia Hsu. Jacob K. Kuo and Esther Kuo, who indirectly own 100% of the borrower Bliss Hospitality, LLC, are the owners of Greensboro, North Carolina-based South Asia Furniture Manufacturing Company, which manufactures household furniture products including sofas, chat tables, dining chairs, tables, gliders, coffee tables, and shelves under two brands, South Sea Outdoor Living and Oasis Home. Lydia Hsu, who together with other members of the Hsu family owns 100% of the borrower Sherd Group LLC, is the sister of Esther Kuo and is in the insurance business. The Operating Lessee Borrower is owned 50% each by the other two borrowers.
| THE INFORMATION IN THIS STRUCTURAL AND COLLATERAL TERM SHEET IS NOT COMPLETE AND MAY BE AMENDED PRIOR TO THE TIME OF SALE. THIS TERM SHEET IS NOT AN OFFER TO SELL THESE SECURITIES AND IT IS NOT A SOLICITATION OF AN OFFER TO BUY THESE SECURITIES IN ANY JURISDICTION WHERE THE OFFER OR SALE IS NOT PERMITTED. | ||
| T-86 | ||
| Hospitality – Full Service | Loan #7 | Cut-off Date Balance: | $35,000,000 | |
| 4700 Emperor Boulevard | Sheraton Imperial Raleigh Durham | Cut-off Date LTV: | 64.8% | |
| Durham, NC 27703 | UW NCF DSCR: | 1.91x | ||
| UW NOI Debt Yield: | 16.0% |
The Property. The Sheraton Imperial Raleigh Durham Property is a 331-room, ten-story, full-service hotel located on a site with approximately 22.35 acres. The Sheraton Imperial Raleigh Durham Property also includes a single, two-story retail building with 30,628 gross rentable square feet that opened in 1986 simultaneously with the opening of the hotel. The two-story retail building is currently leased to an exercise and health club known as Fitness Connection. Current amenities and facilities at the Sheraton Imperial Raleigh Durham Property include the Visit & More Lobby Café & Bar, Seasons restaurant, Gatherings lobby bar, a club lounge, an outdoor pool, a business center, and 27,840 SF of dedicated meeting and event space. Additionally, guests of the hotel are allowed complimentary access to the Fitness Connection facility, including access to outdoor tennis courts. There is also an additional lease for use of an antenna on the rooftop. Since 2008, upgrades to the Sheraton Imperial Raleigh Durham Property have totaled over $17 million ($51,564/key), including over $2 million between 2012 and 2014, over $7.2 million between 2015 and 2021, and over $5.0 million since 2021.
The full-service hotel features 331 guestrooms comprised of 137 king and 173 queen/queen guestrooms that range from 338 to 350 SF in size as well 19 one-bedroom king suites with pullout sofas and two parlor suites (presidential and governors suites). Guestrooms are accessible via four passenger elevators. Standard amenities include a work area, a nightstand, a dresser, a sofa chair, a flat screen television, internet, an iron and ironing board, a coffee maker, and a mini-refrigerator. Suites offer additional living space and elevated amenities. Club Level rooms are available for a premium. According to the appraisal, demand segmentation at the Sheraton Imperial Raleigh Durham Property is 50% commercial, 30% meeting and group and 20% leisure.
The Sheraton Imperial Raleigh Durham Property is managed by Concord Hospitality Enterprises Company, LLC and is under a new 20-year franchise agreement between the Operating Lessee Borrower and Marriott International, Inc. which expires in January 2045. The Sheraton Imperial Raleigh Durham Property is currently subject to a franchisor mandated property improvement plan (“PIP”), which is generally required to be completed by January 9, 2027, and includes renovations and repairs to the exterior and porte cochere, landscaping, lobby and other common areas, and miscellaneous guestroom and bathroom upgrades, among others. At origination, $579,000 was reserved for the estimated cost of the PIP.
The following table presents certain information relating to the performance of the Sheraton Imperial Raleigh Durham Property:
| Historical Occupancy, ADR, RevPAR | |||||||||
| Sheraton Imperial Raleigh Durham(1) | Competitive Set(2) | Penetration Factor | |||||||
| Year | Occupancy | ADR | RevPAR | Occupancy | ADR | RevPAR | Occupancy | ADR | RevPAR |
| 2021 | 24.0% | $98.11 | $23.57 | 44.4% | $103.29 | $45.87 | 54.1% | 95.0% | 51.4% |
| 2022 | 40.2% | $136.04 | $54.64 | 62.8% | $128.33 | $80.56 | 64.0% | 106.0% | 67.8% |
| 2023 | 63.2% | $148.52 | $93.83 | 68.7% | $143.17 | $98.33 | 92.0% | 103.7% | 95.4% |
| TTM Nov. 2024 | 69.6% | $148.10 | $103.04 | 70.6% | $153.95 | $108.65 | 98.6% | 96.2% | 94.8% |
| (1) | Occupancy, ADR and RevPAR for the Sheraton Imperial Raleigh Durham Property are based on historical financial information provided by the borrower sponsor. |
| (2) | Occupancy, ADR and RevPAR for the Competitive Set are based on data provided by a third-party hospitality research report. The Competitive Set includes the Marriott at Research Triangle Park, DoubleTree Raleigh-Durham Airport at Research Triangle Park, Embassy Suites by Hilton Raleigh Durham Research Triangle, Delta Hotel Raleigh Durham at Research Triangle, Comfort Suites Raleigh Durham Airport RTP and Hyatt House Raleigh Durham Airport. |
The Market. The Sheraton Imperial Raleigh Durham Property is located in Durham, North Carolina within Durham County and is considered to be in the Durham-Chapel Hill Metropolitan Statistical Area (MSA). The MSA is well known for being home to Duke University, The University of North Carolina at Chapel Hill, NC State University at Raleigh, and the Research Triangle Park, an approximately 7,000-acre site that is home to more than 300 companies, including IBM, Syngenta, Cisco and GlaxoSmithKline, that employ 55,000 workers, making it the largest research park in the United States. The immediate neighborhood consists of hotels, office parks, and retail stores. The Sheraton Imperial Raleigh Durham Property is located less than five miles from Raleigh-Durham International Airport. The Sheraton Imperial Raleigh Durham Property benefits from access to Interstate I-40 and I-540. I-40 is a major east-west interstate highway running from California to North Carolina. I-540 is part of a partially completed beltway around the city of Raleigh forming the Raleigh Outer Loop. When complete, the route is expected to completely encircle the city. Raleigh is the capital of North Carolina, and is home to numerous government agencies, universities, and research institutions, with a significant population of professionals working in state government, education, healthcare, and technology sectors. Durham is located approximately 23 miles northwest of Raleigh.
The following table presents certain information relating to comparable sales from the appraisal for the Sheraton Imperial Raleigh Durham Property:
| Comparable Sales | ||||||
| Property | Location | Year Opened | Number of Rooms | Sale Date | Sales Price | Price Per Room(1) |
| Sheraton Imperial Raleigh Durham | Durham, NC | 1986 | 331 | Jan-25 | $51,500,000 | $155,589 |
| Hilton Raleigh North Hills | Raleigh, NC | 1983 | 333 | August-23 | $53,000,000 | $159,159 |
| DoubleTree by Hilton Hotel Chattanooga Downtown | Chattanooga, TN | 1974 | 186 | May-23 | $33,600,000 | $180,645 |
| Hilton New Orleans Airport | New Orleans, LA | 1989 | 319 | Sept-22 | $53,150,000 | $166,614 |
Source: Appraisal.
| (1) | Reflects the adjusted price per room for the comparable sales. |
| THE INFORMATION IN THIS STRUCTURAL AND COLLATERAL TERM SHEET IS NOT COMPLETE AND MAY BE AMENDED PRIOR TO THE TIME OF SALE. THIS TERM SHEET IS NOT AN OFFER TO SELL THESE SECURITIES AND IT IS NOT A SOLICITATION OF AN OFFER TO BUY THESE SECURITIES IN ANY JURISDICTION WHERE THE OFFER OR SALE IS NOT PERMITTED. | ||
| T-87 | ||
| Hospitality – Full Service | Loan #7 | Cut-off Date Balance: | $35,000,000 | |
| 4700 Emperor Boulevard | Sheraton Imperial Raleigh Durham | Cut-off Date LTV: | 64.8% | |
| Durham, NC 27703 | UW NCF DSCR: | 1.91x | ||
| UW NOI Debt Yield: | 16.0% |
The following table presents certain information relating to the primary hotel competition from the appraisal for the Sheraton Imperial Raleigh Durham Property:
| Appraisal Primary Competitive Set | ||||||
| Property | Location | Year Opened | Number of Rooms | Occupancy | ADR | RevPAR |
| Sheraton Imperial Raleigh Durham(1) | Durham, NC | 1986 | 331 | 69.6% | $148.10 | $103.04 |
| Marriott at Research Triangle Park | Durham, NC | 1988 | 225 | 70% - 75% | $150 - $160 | $110 - $120 |
| DoubleTree by Hilton Raleigh-Durham Airport at Research Triangle Park | Durham, NC | 1988 | 249 | 65% - 70% | $160 - $170 | $105 - $115 |
| Embassy Suites by Hilton Raleigh Durham Research Triangle | Cary, NC | 1997 | 273 | 65% - 70% | $155 - $165 | $105 - $115 |
| Delta Hotel Raleigh Durham at Research Triangle | Durham, NC | 2009 | 125 | 70% - 75% | $135 - $145 | $100 - $110 |
| Westin Raleigh-Durham Airport | Raleigh, NC | 2023 | 236 | 60% - 65% | $160 - $170 | $100 - $110 |
Source: Appraisal unless otherwise noted. Occupancy, ADR and RevPAR are based on estimated November 2024 values.
| (1) | Sheraton Imperial Raleigh Durham Property metrics are based on financial information provided by the borrower sponsor for November 2024 TTM. |
Appraisal. The appraisal concluded to an “As-is” value for the Sheraton Imperial Raleigh Durham Property of $54,000,000 as of November 25, 2024.
Environmental Matters. According to the Phase I environmental site assessment dated November 27, 2024, there was no evidence of any recognized environmental conditions at the Sheraton Imperial Raleigh Durham Property.
Operating History and Underwritten Net Cash Flow. The following table presents certain information relating to the historical operating performance and the Underwritten Net Cash Flow at the Sheraton Imperial Raleigh Durham Property:
| Operating History and Underwritten Net Cash Flow(1) | ||||||
| 2021 | 2022 | 2023 | TTM 11/30/2024 | Underwritten | UW Per Room | |
| Occupancy(1) | 24.0% | 40.2% | 63.2% | 69.6% | 69.6% | |
| ADR(1) | $98.11 | $136.04 | $148.52 | $148.10 | $148.35 | |
| RevPAR(1) | $23.57 | $54.64 | $93.83 | $103.04 | $103.21 | |
| Room Revenue | $2,847,115 | $6,601,496 | $11,335,855 | $12,503,786 | $12,469,623 | $37,673 |
| Food and Beverage Revenue | $1,305,867 | $4,328,180 | $5,986,335 | $7,063,694 | $7,044,394 | $21,282 |
| Misc Income | $480,422 | $733,410 | $727,268 | $848,583 | $846,264 | $2,557 |
| Other Departmental Revenue | $0 | $0 | $0 | $0 | $0 | $0 |
| Total Revenue | $4,633,404 | $11,663,086 | $18,049,458 | $20,416,063 | $20,360,281 | $61,511 |
| Room Expense | $1,148,064 | $1,958,579 | $3,353,277 | $3,655,552 | $3,645,564 | $11,014 |
| Food and Beverage Expense | $856,275 | $2,892,406 | $4,119,934 | $4,411,085 | $4,399,033 | $13,290 |
| Real Estate Taxes | $333,299 | $567,600 | $657,259 | $720,893 | $684,882 | $2,069 |
| Property Insurance | $46,373 | $119,850 | $134,077 | $254,003 | $191,691 | $579 |
| Other Expenses | $2,514,342 | $3,778,276 | $5,478,870 | $5,950,140 | $5,835,326 | $17,629 |
| Total Expenses | $4,898,353 | $9,316,711 | $13,743,417 | $14,991,673 | $14,756,496 | $44,582 |
| Net Operating Income | ($264,949) | $2,346,375 | $4,306,041 | $5,424,390 | $5,603,785 | $16,930 |
| FF&E | $185,336 | $466,523 | $721,978 | $816,643 | $814,411 | $2,460 |
| Net Cash Flow | ($450,285) | $1,879,852 | $3,584,063 | $4,607,747 | $4,789,374 | $14,469 |
| NOI DSCR | -0.11x | 0.93x | 1.71x | 2.16x | 2.23x | |
| NCF DSCR | -0.18x | 0.75x | 1.43x | 1.83x | 1.91x | |
| NOI Debt Yield | -0.8% | 6.7% | 12.3% | 15.5% | 16.0% | |
| NCF Debt Yield | -1.3% | 5.4% | 10.2% | 13.2% | 13.7% | |
| (1) | The variances between the underwriting, the appraisal and the industry report data with respect to Occupancy, ADR and RevPAR at the Sheraton Imperial Raleigh Durham Property are attributable to variances in reporting methodologies and/or timing differences. |
| THE INFORMATION IN THIS STRUCTURAL AND COLLATERAL TERM SHEET IS NOT COMPLETE AND MAY BE AMENDED PRIOR TO THE TIME OF SALE. THIS TERM SHEET IS NOT AN OFFER TO SELL THESE SECURITIES AND IT IS NOT A SOLICITATION OF AN OFFER TO BUY THESE SECURITIES IN ANY JURISDICTION WHERE THE OFFER OR SALE IS NOT PERMITTED. | ||
| T-88 | ||
| Hospitality – Full Service | Loan #7 | Cut-off Date Balance: | $35,000,000 | |
| 4700 Emperor Boulevard | Sheraton Imperial Raleigh Durham | Cut-off Date LTV: | 64.8% | |
| Durham, NC 27703 | UW NCF DSCR: | 1.91x | ||
| UW NOI Debt Yield: | 16.0% |
Escrows and Reserves.
Deferred Maintenance – The Sheraton Imperial Raleigh Durham Mortgage Loan documents provide for an upfront reserve of approximately $26,250 for deferred maintenance.
Tax – The Sheraton Imperial Raleigh Durham Mortgage Loan documents provide for an upfront reserve of approximately $117,571 for real estate taxes, and ongoing monthly reserves equal to 1/12th of the real estate taxes the lender estimates will be payable during the next twelve months (initially estimated to be $58,786).
Insurance – The Sheraton Imperial Raleigh Durham Mortgage Loan documents do not require monthly reserves for insurance premiums as long as (i) no event of default is continuing under the Sheraton Imperial Raleigh Durham Mortgage Loan, (ii) the liability and casualty insurance coverage for the Sheraton Imperial Raleigh Durham Property is included in a blanket or umbrella policy approved by the lender in its reasonable discretion, and (iii) the borrowers provide the lender with certificates of insurance for such policies and paid receipts for insurance premiums no later than 10 days prior to the expiration dates of the policies. If such conditions are not satisfied, the Sheraton Imperial Raleigh Durham Mortgage Loan documents provide for ongoing monthly reserves for insurance premiums in an amount equal to 1/12th of the insurance premiums that the lender estimates will be payable for the renewal of the insurance coverage.
FF&E – The Sheraton Imperial Raleigh Durham Mortgage Loan documents provide for ongoing monthly reserves for furniture, fixtures and equipment (“FF&E”) in an amount equal to the greater of (A) 1/12th of 4% of the operating income for the Sheraton Imperial Raleigh Durham Property for the preceding calendar year and (B) the amount of the deposit (if any) required by the franchisor under the franchise agreement for FF&E. The amount of such monthly deposit is $67,868 for each month in 2025, and thereafter may be adjusted annually by the lender on the monthly payment date in January of each year, based on the foregoing formula.
PIP Reserve – The Sheraton Imperial Raleigh Durham Mortgage Loan documents provide for an upfront reserve of $579,000 for the current property improvement plan (“PIP”) for the Sheraton Imperial Raleigh Durham Property. In addition, on the date that any new PIP is imposed by the franchisor, the borrowers are required to deposit an amount equal to 125% of the sum required to pay for such new PIP into a PIP reserve.
Lockbox and Cash Management. The Sheraton Imperial Raleigh Durham Mortgage Loan is structured with a springing lockbox and springing cash management. Upon the occurrence of a Cash Sweep Event Period (as defined below), the borrowers are required to establish a lockbox for the benefit of the lender and to direct each of the credit card banks and credit card companies with which the borrowers have entered into agreements for clearance of credit card receipts or merchants agreements to deposit all credit card receipts with respect to the Sheraton Imperial Raleigh Durham Property into the lockbox account. In addition, upon the occurrence of a Cash Sweep Event Period, the borrowers are required to direct commercial tenants to pay rents directly into the lockbox account. If, notwithstanding the foregoing direction, the borrowers or property manager receive any rents or revenues from the Sheraton Imperial Raleigh Durham Property following the occurrence of a Cash Sweep Event Period, they are required to deposit such amounts into the lockbox account within one business day of receipt. In addition, upon the occurrence of a Cash Sweep Event Period the lender is required to establish, and the borrowers are required to cooperate to establish, a cash management account, into which all funds on deposit in the lockbox account will be required to be transferred, and applied, provided no event of default is continuing under the Sheraton Imperial Raleigh Durham Mortgage Loan, as follows: (i) to fund the required tax and insurance reserves deposits, if any, as described above under “Escrows and Reserves,” (ii) to fund the payment of debt service on the Sheraton Imperial Raleigh Durham Mortgage Loan, (iii) to fund the required monthly deposit into the FF&E reserve, as described above under “Escrows and Reserves,” (iv) to pay operating expenses set forth in the lender-approved annual budget and lender-approved extraordinary expenses, (v) if either a Franchise Default Event (as defined below) or Franchise Termination Event (as defined below) remains uncured, all amounts remaining in the cash management account will be deposited into the FF&E reserve account until the lender is provided with a new comfort letter from the franchisor (a “Comfort Letter Event”) and (vi) all remaining amounts in the cash management account will be deposited into an excess cash flow account to be held as additional collateral for the Sheraton Imperial Raleigh Durham Mortgage Loan (a) after the occurrence of a Comfort Letter Event but prior to the termination of a Cash Sweep Event Period and (b) during the continuance of a Cash Sweep Event Period caused by clauses (i) or (ii) in the definition of Cash Sweep Event Period.
A “Cash Sweep Event Period” means a period:
(A) commencing upon the earliest of:
| (i) | the occurrence of an event of default under the Sheraton Imperial Raleigh Durham Mortgage Loan; |
| (ii) | the debt service coverage ratio being less than 1.35x at the end of any calendar quarter (such event, a “DSCR Event”); |
| (iii) | the occurrence of a Franchise Default Event; and/or |
| (iv) | the occurrence of a Franchise Termination Event. |
and (B) expiring upon:
| (i) | regarding any Cash Sweep Event Period commenced in connection with clause (A)(i) above, the cure (if applicable) of such event of default; |
| (ii) | regarding any DSCR Event, the date that the debt service coverage ratio is equal to or greater than 1.35x for two consecutive calendar quarters; |
| (iii) | regarding any Franchise Default Event, such default has been remedied by the borrower to the satisfaction of the lender and the franchisor; and |
| (iv) | regarding any Franchise Termination Event, the borrower has entered into a new franchise agreement containing terms acceptable to the lender with a reputable and experienced franchisor possessing experience in flagging hotel properties similar in size, scope, use and value as the Sheraton Imperial Raleigh Durham Property and approved by the lender, and the new franchisor has provided the lender with a comfort letter acceptable to it in its reasonable discretion. |
| THE INFORMATION IN THIS STRUCTURAL AND COLLATERAL TERM SHEET IS NOT COMPLETE AND MAY BE AMENDED PRIOR TO THE TIME OF SALE. THIS TERM SHEET IS NOT AN OFFER TO SELL THESE SECURITIES AND IT IS NOT A SOLICITATION OF AN OFFER TO BUY THESE SECURITIES IN ANY JURISDICTION WHERE THE OFFER OR SALE IS NOT PERMITTED. | ||
| T-89 | ||
| Hospitality – Full Service | Loan #7 | Cut-off Date Balance: | $35,000,000 | |
| 4700 Emperor Boulevard | Sheraton Imperial Raleigh Durham | Cut-off Date LTV: | 64.8% | |
| Durham, NC 27703 | UW NCF DSCR: | 1.91x | ||
| UW NOI Debt Yield: | 16.0% |
“Franchise Default Event” means the franchisor has provided written notice to the borrowers or lender that (i) the Operating Lessee Borrower is in default under the franchise agreement, or (ii) the Operating Lessee Borrower is no longer in good standing with the franchisor due to the failure of the Sheraton Imperial Raleigh Durham Property to be operated and maintained in accordance with the standards set forth in the franchise agreement, and in each such case such default or failure has not been cured within 30 days of the borrower’s receipt of such notice.
“Franchise Termination Event” means the date which is the earlier of (x) the date either the franchisor or the Operating Lessee Borrower gives written notice to terminate the franchise agreement or (y) the date the franchise agreement is surrendered, cancelled or otherwise terminated.
Right of First Refusal. The franchisor, Marriott International, Inc. has a right of first refusal if there is a proposed transfer of the Sheraton Imperial Raleigh Durham Property or an ownership interest in the Operating Lessee Borrower or a control affiliate of the Operating Lessee Borrower, to a Competitor. As more fully defined in the franchise agreement, a “Competitor” includes any person or entity, or affiliate of such person or entity that has a direct or indirect ownership interest in, or control of, is the master franchisee for, or is the franchisor or licensor of a competing brand (generally, a brand, trade name, trademark, system, collection or chain of hotels, vacation club products, whole ownership facilities, condominiums, apartments, short-term rentals, home sharing facilities or similar lodging facilities that compete with any hotels and other lodging products, vacation club products, residential products, restaurants or other products, services, activities and business operations that are managed, franchised, licensed, owned, leased, developed, promoted, or provided by or associated with the franchisor or any of its affiliates.
Terrorism Insurance. The Sheraton Imperial Raleigh Durham Mortgage Loan documents require that the borrowers maintain comprehensive “all risk” or “special form” insurance in an amount equal to 100% of full replacement cost and 18 months of business income/loss of rents insurance with a 6 month extended period of indemnity, which includes coverage for acts of terrorism. If “acts of terrorism” or other similar acts or events or “fire following” such acts or events are excluded from such policies, the borrowers are required to obtain an endorsement to such policy or policies, or a separate policy, insuring against all such excluded acts or events and “fire following” in the amounts set forth above. Notwithstanding the foregoing, for so long as the Terrorism Risk Insurance Act of 2002, as extended and modified by the Terrorism Risk Insurance Program Reauthorization Act of 2015 (“TRIPRA”) (including any extensions thereof or if another federal governmental program is in effect relating to “acts of terrorism” which provides substantially similar protections as TRIPRA) is in effect, and continues to cover both domestic and foreign acts of terrorism, the lender is required to accept terrorism insurance which covers against “covered acts” as defined by TRIPRA (or such other program). See “Risk Factors—Risks Relating to the Mortgage Loans—Terrorism Insurance May Not Be Available for All Mortgaged Properties” in the prospectus.
| THE INFORMATION IN THIS STRUCTURAL AND COLLATERAL TERM SHEET IS NOT COMPLETE AND MAY BE AMENDED PRIOR TO THE TIME OF SALE. THIS TERM SHEET IS NOT AN OFFER TO SELL THESE SECURITIES AND IT IS NOT A SOLICITATION OF AN OFFER TO BUY THESE SECURITIES IN ANY JURISDICTION WHERE THE OFFER OR SALE IS NOT PERMITTED. | ||
| T-90 | ||
| Hospitality - Full Service | Loan #8 | Cut-off Date Balance: | $29,000,000 | |
| 1060 Center Street | Crowne Plaza North Augusta | Cut-off Date LTV: | 67.1% | |
| North Augusta, SC 29841 | UW NCF DSCR: | 1.86x | ||
| UW NOI Debt Yield: | 16.4% |
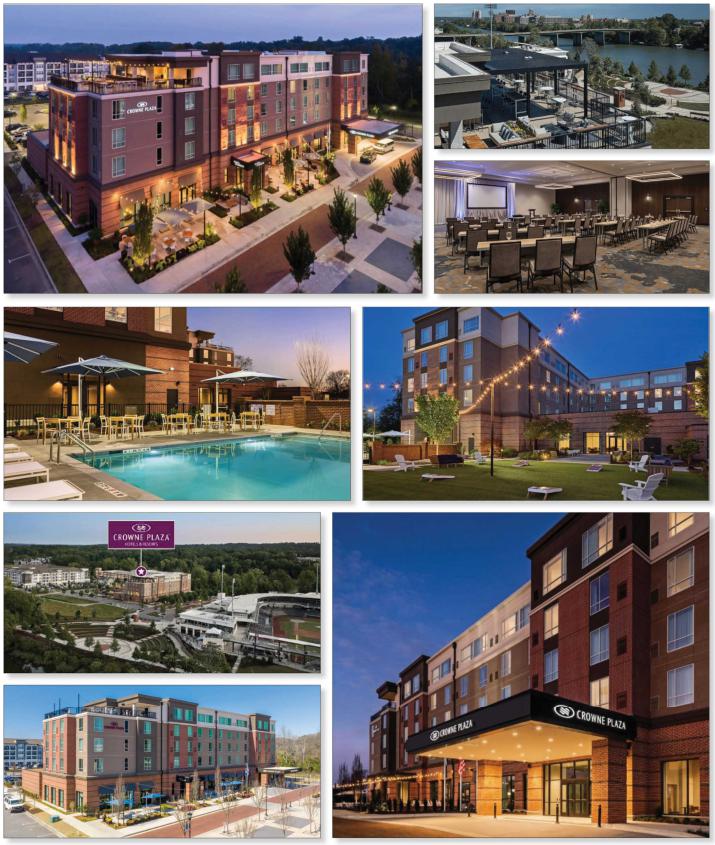
| THE INFORMATION IN THIS STRUCTURAL AND COLLATERAL TERM SHEET IS NOT COMPLETE AND MAY BE AMENDED PRIOR TO THE TIME OF SALE. THIS TERM SHEET IS NOT AN OFFER TO SELL THESE SECURITIES AND IT IS NOT A SOLICITATION OF AN OFFER TO BUY THESE SECURITIES IN ANY JURISDICTION WHERE THE OFFER OR SALE IS NOT PERMITTED. | ||
| T-91 | ||
| Hospitality - Full Service | Loan #8 | Cut-off Date Balance: | $29,000,000 | |
| 1060 Center Street | Crowne Plaza North Augusta | Cut-off Date LTV: | 67.1% | |
| North Augusta, SC 29841 | UW NCF DSCR: | 1.86x | ||
| UW NOI Debt Yield: | 16.4% |

| THE INFORMATION IN THIS STRUCTURAL AND COLLATERAL TERM SHEET IS NOT COMPLETE AND MAY BE AMENDED PRIOR TO THE TIME OF SALE. THIS TERM SHEET IS NOT AN OFFER TO SELL THESE SECURITIES AND IT IS NOT A SOLICITATION OF AN OFFER TO BUY THESE SECURITIES IN ANY JURISDICTION WHERE THE OFFER OR SALE IS NOT PERMITTED. | ||
| T-92 | ||
| Mortgage Loan No. 8 – Crowne Plaza North Augusta |
| Mortgage Loan Information | Property Information | |||||
| Mortgage Loan Seller: | JPMCB | Single Asset/Portfolio: | Single Asset | |||
| Credit Assessment (Fitch/Moody’s/KBRA): | NR/NR/NR | Location: | North Augusta, SC 29841 | |||
| Original Balance: | $29,000,000 | General Property Type: | Hospitality | |||
| Cut-off Date Balance: | $29,000,000 | Detailed Property Type: | Full Service | |||
| % of Initial Pool Balance: | 3.9% | Title Vesting(3): | Fee | |||
| Loan Purpose: | Acquisition | Year Built/Renovated: | 2019/NAP | |||
| Borrower Sponsor: | Michael Flacks | Size: | 180 Rooms | |||
| Guarantor: | Michael Flacks | Cut-off Date Balance per Room: | $161,111 | |||
| Mortgage Rate: | 7.79700% | Maturity Date Balance per Room: | $161,111 | |||
| Note Date: | 11/20/2024 | Property Manager: | SSH North Augusta LLC | |||
| Maturity Date: | 12/1/2029 | (borrower-related) | ||||
| Term to Maturity: | 60 months | Underwriting and Financial Information | ||||
| Amortization Term: | 0 months | UW NOI: | $4,765,220 | |||
| IO Period: | 60 months | UW NCF: | $4,253,486 | |||
| Seasoning: | 2 months | UW NOI Debt Yield: | 16.4% | |||
| Prepayment Provisions: | L(26),D(28),O(6) | UW NCF Debt Yield: | 14.7% | |||
| Lockbox/Cash Mgmt Status: | Hard/Springing | UW NOI Debt Yield at Maturity: | 16.4% | |||
| Additional Debt Type: | NAP | UW NCF DSCR: | 1.86x | |||
| Additional Debt Balance: | NAP | Most Recent NOI(4): | $4,723,882 (10/31/2024 TTM) | |||
| Future Debt Permitted (Type): | No (NAP) | 2nd Most Recent NOI(4): | $3,812,351 (12/31/2023) | |||
| Reserves(1) | 3rd Most Recent NOI(4): | $2,546,274 (12/31/2022) | ||||
| Type | Initial | Monthly | Cap | Most Recent Occupancy(4): | 63.0% (10/31/2024) | |
| RE Taxes: | $100 | $23,421 | NAP | 2nd Most Recent Occupancy(4): | 60.0% (12/31/2023) | |
| Insurance: | $0 | Springing | NAP | 3rd Most Recent Occupancy(4): | 47.6% (12/31/2022) | |
| FF&E Reserve: | $100 | (2) | NAP | Appraised Value (as of): | $43,200,000 (9/17/2024) | |
| Deferred Maintenance Reserve: | $20,130 | $0 | NAP | Appraised Value per Room: | $240,000 | |
| Seasonality Reserve: | $500,000 | Springing | NAP | Cut-off Date LTV Ratio: | 67.1% | |
| PIP Reserve: | $28,400 | Springing | NAP | Maturity Date LTV Ratio: | 67.1% | |
| Special Event Advance Deposit Reserve: | $0 | Springing | NAP | |||
| Sources and Uses | ||||||
| Sources | Proceeds | % of Total | Uses | Proceeds | % of Total | |
| Mortgage Loan Amount: | $29,000,000 | 66.9% | Purchase Price: | $41,600,000 | 95.9% | |
| Sponsor Equity: | $14,359,762 | 33.1% | Closing Costs: | $1,211,032 | 2.8% | |
| Upfront Reserves: | $548,730 | 1.3% | ||||
| Total Sources: | $43,359,762 | 100.0% | Total Uses: | $43,359,762 | 100.0% | |
| (1) | See “Escrows and Reserves ” herein. |
| (2) | On each payment date the borrower will deposit 4.0% of gross rents for the calendar month two months prior to such payment date into an FF&E Reserve. |
| (3) | The Crowne Plaza North Augusta Mortgage Loan (as defined below) is secured by the borrower’s fee interest, as well as the borrower’s overlapping subleasehold interest with respect to a portion of the Crowne Plaza North Augusta Property (which is also owned in fee). See “The Property” below for additional information. |
| (4) | The increase in UW and Most Recent NOI and Occupancy in each historical period is primarily attributable to the recent construction of the Crowne Plaza North Augusta Property (as defined below) in 2019 and ramp up of performance subsequent to the Covid-19 pandemic. |
The Mortgage Loan. The eighth largest mortgage loan (the “Crowne Plaza North Augusta Mortgage Loan”) is evidenced by a promissory note in the original principal balance of $29,000,000 and secured by the fee interest in a 180-room full-service hotel located in North Augusta, South Carolina (the “Crowne Plaza North Augusta Property”).
The Borrower and the Borrower Sponsor. The borrower is Augusta Hotel Property LLC, a single-purpose, Delaware limited liability company with one independent director.
The borrower sponsor and non-recourse guarantor is Michael Flacks, the Chairman, CEO and Founder of Flacks Group. Flacks Group owns over $3 billion of real estate globally. Flacks Group’s global acquisition team focuses on hospitality, industrial and commercial properties and special situations. Flacks Group maintains a number of in-house corporate functions such as consumer research and development, real estate brokerage services, construction, acquisition asset management and legal, among others. Flacks Group owns real estate assets across the United States and overseas in countries such as Germany and Brazil. Flacks Group has 40 years of experience acquiring and managing real estate assets.
| THE INFORMATION IN THIS STRUCTURAL AND COLLATERAL TERM SHEET IS NOT COMPLETE AND MAY BE AMENDED PRIOR TO THE TIME OF SALE. THIS TERM SHEET IS NOT AN OFFER TO SELL THESE SECURITIES AND IT IS NOT A SOLICITATION OF AN OFFER TO BUY THESE SECURITIES IN ANY JURISDICTION WHERE THE OFFER OR SALE IS NOT PERMITTED. | ||
| T-93 | ||
| Hospitality - Full Service | Loan #8 | Cut-off Date Balance: | $29,000,000 | |
| 1060 Center Street | Crowne Plaza North Augusta | Cut-off Date LTV: | 67.1% | |
| North Augusta, SC 29841 | UW NCF DSCR: | 1.86x | ||
| UW NOI Debt Yield: | 16.4% |
The Property. The Crowne Plaza North Augusta Property is a five-story, 180-room, full-service hotel located in North Augusta, South Carolina. The borrower sponsor acquired the Crowne Plaza North Augusta Property in November 2024, contributing approximately $14.4 million in fresh equity. Constructed in 2019, the Crowne Plaza North Augusta Property is among the newest in its competitive set and has achieved steady RevPAR growth in each historical period dating back to 2021. Further, the Crowne Plaza North Augusta Property has demonstrated steady growth relative to its competitive set with RevPAR penetration rates above 100% in all historical periods since 2021, reaching its highest level (112.1%) as of the trailing twelve months ending September 2024. Guest room configurations include 101 King rooms, 51 Double Queen rooms, 3 Suites, 17 King River View rooms and 8 Double Queen River View rooms. The Crowne Plaza North Augusta Property features amenities such as an outdoor pool, a fitness center, an outdoor patio rooftop deck, and two restaurants (Salt + Marrow Kitchen and Jackson’s Bluff Rooftop Bar). Additionally, the Crowne Plaza North Augusta Property features a total of 8,050 SF of meeting space, with the largest meeting/ballroom space measuring 5,400 SF. Top corporate accounts as of 2023 include Government, Piedmont Care Inc, Textron Inc, Aurubus AG and FedRiins.
The Crowne Plaza North Augusta Property is situated in North Augusta, South Carolina, approximately 4.5 miles from Augusta National, home to the Master’s Golf Tournament and the Augusta Women’s Amateur Golf Tournament. According to the appraisal, the Masters Golf Tournament is estimated to draw upwards of 40,000 visitors per day and, according to the borrower sponsor, the entire property has been prebooked for both the upcoming 2025 Augusta Women’s Amateur Golf Tournament and Masters Golf Tournament. Additionally, the Crowne Plaza North Augusta Property is located within the recently delivered Riverside Village development (“Riverside Village”). Riverside Village is an over $200-million mixed-use development featuring a $40 million minor league baseball stadium for the Augusta Green Jackets, a 590-space stadium parking deck, 72,000 SF of office space, approximately 32,900 SF of additional retail space, a 280-unit multifamily development and a 164-unit senior living facility. The City of North Augusta contributed approximately $72 million in connection with the Riverside Village development.
According to the appraisal, the Crowne Plaza North Augusta Property submarket is comprised of 102 hotel properties which contain approximately 8,100 rooms, of which, 3,758 are classified as either luxury & upper upscale or upscale & upper midscale, resulting in a limited number of nearby, full-service properties in the local area capable of servicing the demand generated by the Masters. During April of each year (month of the Masters Tournament), the Crowne Plaza North Augusta Property generates outsized demand, most recently reaching an ADR and occupancy rate of approximately $537 and 77% in April 2024, respectively. Given this outsized demand during the Masters Golf Tournament and associated increase in both room rate and occupancy, the Crowne Plaza North Augusta Property generates approximately 40% of its overall net cash flow in the month of April. As such, the Crowne Plaza North Augusta Mortgage Loan is structured with an upfront seasonality reserve of $500,000 (equivalent to approximately 2.6 months of debt service payments or approximately 120% of operating shortfalls from December 2023-April 2024), which is re-calibrated in March based on 125% of the prior year’s aggregate shortfall, subject to minimum of $390,000 (approximately two months debt service). Subject to the aforementioned re-sizing, the seasonality reserve is to be “trued-up” in connection with the May payment date (first payment date after the Masters), such that sufficient funds are reserved for the subsequent 12 month period.
In connection with building the conference center at the Crowne Plaza North Augusta Property, the predecessor-in-interest to the current borrower, as the ground lessor, and the City of North Augusta, as the ground lessee, entered into a ground lease in 2017 to allow the City to use the bond financing from the tax increment financing program available in the zone within which the Crowne Plaza North Augusta Property is located. The City has subleased the conference center portion of the hotel back to the borrower such that the borrower has full operational control including all revenues and expenses. The annual rent for the ground lease and sublease is each $1.00 and both leases expire the earlier of (a) November 2048 and (b) the date the bonds issued to finance the development of the Crowne Plaza North Augusta Property are fully repaid. If the ground lease terminates or expires, the borrower then owns the entire hotel building and property, including the conference center, in fee. For clarity, the Crowne Plaza North Augusta Property currently does not benefit from tax increment financing or any other tax benefits.
According to the appraisal, demand segmentation for the Crowne Plaza North Augusta Property is 68% transient and 32% group. The Crowne Plaza North Augusta Property is subject to a newly executed, long-term franchise agreement with Holiday Hospitality Franchising, LLC, an affiliate of IHG, expiring in November 2049.
The following table presents historical occupancy, ADR and RevPAR penetration rates of the Crowne Plaza North Augusta Property:
| Historical Occupancy, ADR, RevPAR(1) | |||||||||||||
| Competitive Set(2) | Crowne Plaza North Augusta Property(3) | Penetration Factor | |||||||||||
| Year | Occupancy | ADR | RevPAR | Occupancy | ADR | RevPAR | Occupancy | ADR | RevPAR | ||||
| 2021 | 51.2% | $134.44 | $68.89 | 43.1% | $164.63 | $70.90 | 84.1% | 122.5% | 102.9% | ||||
| 2022 | 54.1% | $160.53 | $86.81 | 47.6% | $185.14 | $88.07 | 87.9% | 115.3% | 101.5% | ||||
| 2023 | 63.3% | $162.34 | $102.71 | 60.0% | $184.40 | $110.59 | 94.7% | 113.6% | 107.7% | ||||
| TTM September 2024 | 66.0% | $167.46 | $110.55 | 62.2% | $199.18 | $123.94 | 94.3% | 118.9% | 112.1% | ||||
Source: Third-party industry report.
| (1) | Variances between the lender underwriting, appraisal and third party industry report with respect to occupancy, ADR and RevPAR are attributable in part to variances in reporting methodologies and/or timing. |
| (2) | According to a third party industry report, the competitive set for 2021-2023 includes Marriott Augusta at the Convention Center, The Partridge Inn Augusta, Curio Collection by Hilton, Sheraton Augusta Hotel, DoubleTree by Hilton Hotel Augusta, Hilton Garden Inn Augusta and Hyatt House Augusta Downtown and the competitive set for TTM September 2024 includes Marriott Augusta at the Convention Center, DoubleTree by Hilton Hotel Augusta, The Partridge Inn Augusta, Curio Collection by Hilton, Hilton Garden Inn Augusta, Hampton by Hilton Inn & Suites Augusta-Washington Rd and Hyatt House Augusta Downtown. |
| (3) | 2021, 2022 and 2023 Occupancy, ADR and RevPAR figures for the Crowne Plaza North Augusta Property are based on historical operating statements provided by the borrower sponsor. TTM September 2024 figures for the Crowne Plaza North Augusta Property are according to a third party research report. |
| THE INFORMATION IN THIS STRUCTURAL AND COLLATERAL TERM SHEET IS NOT COMPLETE AND MAY BE AMENDED PRIOR TO THE TIME OF SALE. THIS TERM SHEET IS NOT AN OFFER TO SELL THESE SECURITIES AND IT IS NOT A SOLICITATION OF AN OFFER TO BUY THESE SECURITIES IN ANY JURISDICTION WHERE THE OFFER OR SALE IS NOT PERMITTED. | ||
| T-94 | ||
| Hospitality - Full Service | Loan #8 | Cut-off Date Balance: | $29,000,000 | |
| 1060 Center Street | Crowne Plaza North Augusta | Cut-off Date LTV: | 67.1% | |
| North Augusta, SC 29841 | UW NCF DSCR: | 1.86x | ||
| UW NOI Debt Yield: | 16.4% |
The Market. The Crowne Plaza North Augusta Property is located in the Augusta-Richmond County, GA-SC Metropolitan Statistical Area (“Augusta MSA”), which has an area population of 635,137 and has grown by approximately 3.0% annually since 2020. The Crowne Plaza North Augusta Property is located within close proximity to a number of demand drivers which represent the Augusta MSA’s primary sources of lodging demand such as Augusta National which is home to the Master’s Golf Tournament and the Augusta National Women’s Amateur every year. According to the appraisal, the Masters Tournament is estimated to draw upwards of 40,000 visitors per day. Other demand drivers include (i) Fort Eisenhower, a military base which hosts more than 20,000 enlisted and civilian staff, (ii) Augusta Convention Center, which offers more than 80,000 SF of meeting space, (iii) Riverview Park, which includes 10 baseball and softball fields, 7 tennis courts, 5 soccer fields, racquetball and basketball facilities and an 18-hole disc golf course, (iv) Augusta University and (v) medical centers such as Piedmont Hospital, Cancer Center, Children's Hospital and the Norwood VA Medical Center. Further, the Crowne Plaza North Augusta Property is located within the recently developed Riverside Village complex which was delivered for an amount in excess of $200 million.
According to the appraisal, the 2024 population within a one-, three- and five-mile radius of the Crowne Plaza North Augusta Property was 5,561, 49,801 and 103,656, respectively, and the 2024 average household income for the same radii was $81,228, $79,320 and $82,652, respectively.
According to the appraisal, the property is located in the Augusta CBD/North Augusta submarket, which is comprised of 102 hotel properties and approximately 8,100 rooms in total. As of August 2024, the Augusta CBD/North Augusta submarket had a trailing-twelve month occupancy, ADR and RevPAR of 57.7%, $109.14 and $62.91, respectively. Further, according to the appraisal, just seven properties and 1,193 rooms within the submarket are competitive to the Crowne Plaza North Augusta Property. The appraisal did not identify any new hotels under construction or planned for near term development that are expected to directly compete with the Crowne Plaza North Augusta Property.
The following table presents the primary competitive properties defined in the Crowne Plaza North Augusta Property appraisal report:
| Competitive Property Summary(1) | |||||||
| Property | Year Built | Rooms | Transient | Group | 2023 Occupancy | 2023 ADR | 2023 RevPAR |
| Crowne Plaza North Augusta | 2019 | 180 | 68% | 32% | 60.0%(2) | $184.40(2) | $110.59(2) |
| Marriott Hotel & Suites | 1992 | 372 | 50% - 55% | 50% - 55% | 60% - 70% | $175 - $185 | $110 - $120 |
| Hyatt House | 2019 | 100 | 75% - 80% | 25% - 30% | 65% - 75% | $130 - $140 | $90 - $100 |
| The Partridge Inn | 1901 | 143 | 65% - 70% | 35% - 40% | 60% - 70% | $185 - $195 | $120 - $130 |
| Courtyard Augusta | 1984 | 130 | 75% - 80% | 25% - 30% | 55% - 65% | $130 - $140 | $80 - $90 |
| Sheraton | 2009 | 152 | 80% - 85% | 20% - 25% | 55% - 65% | $135 - $145 | $80 - $90 |
| Hilton Garden Inn | 2008 | 114 | 80% - 85% | 20% - 25% | 65% - 75% | $140 - $150 | $100 - $110 |
| Doubletree Hotel | 1990 | 182 | 60% - 65% | 40% - 45% | 55% - 65% | $130 - $140 | $80 - $90 |
| Comp Set Total/Average | 1,373 | 65% | 35% | 64% | $160.09 | $102.73 | |
Source: Appraisal, unless otherwise noted.
| (1) | Variances between the underwriting, the appraisal and the industry report with respect to occupancy, ADR and RevPAR are attributable in part to variances in reporting methodologies and timing differences. |
| (2) | 2023 Occupancy, 2023 ADR and 2023 RevPAR figures for the Crowne Plaza North Augusta Property represent the annual period ending December 2023 based on historical operating statements provided by the borrower sponsor. |
Appraisal. The appraisal concluded to an “as-is” value for the Crowne Plaza North Augusta Property of $43,200,000 as of September 17, 2024.
Environmental Matters. According to the Phase I environmental site assessment dated September 27, 2024, there was no evidence of any recognized environmental conditions at the Crowne Plaza North Augusta Property.
| THE INFORMATION IN THIS STRUCTURAL AND COLLATERAL TERM SHEET IS NOT COMPLETE AND MAY BE AMENDED PRIOR TO THE TIME OF SALE. THIS TERM SHEET IS NOT AN OFFER TO SELL THESE SECURITIES AND IT IS NOT A SOLICITATION OF AN OFFER TO BUY THESE SECURITIES IN ANY JURISDICTION WHERE THE OFFER OR SALE IS NOT PERMITTED. | ||
| T-95 | ||
| Hospitality - Full Service | Loan #8 | Cut-off Date Balance: | $29,000,000 | |
| 1060 Center Street | Crowne Plaza North Augusta | Cut-off Date LTV: | 67.1% | |
| North Augusta, SC 29841 | UW NCF DSCR: | 1.86x | ||
| UW NOI Debt Yield: | 16.4% |
Operating History and Underwritten Net Cash Flow. The following table presents certain information relating to the historical operating performance and Underwritten Net Cash Flow at the Crowne Plaza North Augusta Property:
| Cash Flow Analysis(1) | |||||||
| 2021 | 2022 | 2023 | TTM (10/31/2024) | UW | UW per Room | ||
| Occupancy(2) | 43.1% | 47.6% | 60.0% | 63.0% | 63.0% | ||
| ADR | $164.63 | $185.14 | $184.40 | $198.13 | $198.13 | ||
| RevPAR | $70.90 | $88.07 | $110.59 | $124.88 | $124.88 | ||
| Rooms Revenue | $4,658,369 | $5,786,276 | $7,265,602 | $8,227,035 | $8,204,557 | $45,581 | |
| Food & Beverage | $1,704,488 | $2,735,464 | $3,288,169 | $3,542,049 | $3,532,371 | $19,624 | |
| Parking Income | $208,185 | $212,961 | $332,269 | $370,521 | $369,509 | $2,053 | |
| Other Income(3) | $214,872 | $285,541 | $540,082 | $688,795 | $686,913 | $3,816 | |
| Total Revenue | $6,785,914 | $9,020,242 | $11,426,122 | $12,828,400 | $12,793,350 | $71,074 | |
| Room Expense | $877,539 | $1,056,635 | $1,246,105 | $1,331,413 | $1,327,775 | $7,377 | |
| Food & Beverage Expense | $1,252,448 | $1,927,440 | $2,310,599 | $2,465,735 | $2,458,998 | $13,661 | |
| Parking Expense | $83,274 | $85,185 | $132,907 | $148,208 | $147,803 | $821 | |
| Other Department Expense | $45,322 | $16,651 | $52,289 | $72,087 | $71,890 | $399 | |
| Total Department Expenses | $2,258,583 | $3,085,911 | $3,741,900 | $4,017,443 | $4,006,466 | $22,258 | |
| Departmental Profit | $4,527,331 | $5,934,331 | $7,684,222 | $8,810,957 | $8,786,883 | $48,816 | |
| Management Fees | $203,577 | $270,607 | $342,784 | $384,852 | $383,800 | $2,132 | |
| Property Tax | $559,409 | $576,540 | $434,263 | $582,117 | $582,117 | $3,234 | |
| Insurance | $83,977 | $144,815 | $199,164 | $190,300 | $232,005 | $1,289 | |
| Other Expenses | $20,200 | $14,448 | $150,115 | $2,700 | $0 | $0 | |
| Total Undistributed Expenses | $1,872,609 | $2,381,647 | $2,745,545 | $2,927,106 | $2,823,741 | $15,687 | |
| Total Expenses | $4,998,355 | $6,473,968 | $7,613,771 | $8,104,518 | $8,028,130 | $44,601 | |
| Net Operating Income(2) | $1,787,559 | $2,546,274 | $3,812,351 | $4,723,882 | $4,765,220 | $26,473 | |
| FF&E | $271,437 | $360,810 | $457,045 | $513,136 | $511,734 | $2,843 | |
| Net Cash Flow | $1,516,122 | $2,185,464 | $3,355,306 | $4,210,746 | $4,253,486 | $23,630 | |
| NOI DSCR | 0.78x | 1.11x | 1.66x | 2.06x | 2.08x | ||
| NCF DSCR | 0.66x | 0.95x | 1.46x | 1.84x | 1.86x | ||
| NOI Debt Yield | 6.2% | 8.8% | 13.1% | 16.3% | 16.4% | ||
| NCF Debt Yield | 5.2% | 7.5% | 11.6% | 14.5% | 14.7% | ||
| (1) | Variances between the underwriting, the appraisal and the industry report with respect to occupancy, ADR and RevPAR are attributable in part to variances in reporting methodologies and timing differences. |
| (2) | The increase in Occupancy and Net Operating Income in each historical period is primarily attributable to the recent construction of the Crowne Plaza North Augusta Property in 2019 and ramp up subsequent to the Covid-19 pandemic. |
| (3) | Other Income is inclusive of resort fees, gift shop and miscellaneous income. |
Escrows and Reserves.
Real Estate Taxes – On the loan origination date, the borrower was required to make an upfront deposit of $100 into a reserve for real estate taxes. In addition, the borrower is required to deposit into a real estate tax reserve, on a monthly basis, an amount equal to 1/12 of the real estate taxes that the mortgage lender estimates will be payable during the ensuing 12 months (initially estimated to be $23,420.75).
Insurance – The borrower is required to deposit into an insurance reserve, on a monthly basis, an amount equal to 1/12 of the insurance premiums that the mortgage lender estimates will be payable during the ensuing 12 months; provided, however, the foregoing requirement will be waived so long as (i) no event of default is continuing, (ii) the borrower maintains insurance coverage for the Crowne Plaza North Augusta Property as part of blanket or umbrella coverage reasonably approved by the lender and (iii) the borrower provides the lender with evidence of the renewals of the insurance policies and paid receipts for the payment of the insurance premiums no later than 10 days prior to the expiration dates of the policies.
PIP Reserve – On the loan origination date, the borrower was required to make an initial deposit of $28,400. Thereafter, the borrower is required to deposit the sums required to complete all work described in any subsequent property improvement plan (other than the closing date property improvement plan) required by a franchisor, payable on each payment date in monthly installments reasonably estimated by the lender to provide for adequate funds to complete the work described in any property improvement plan within the timeframes required by the property improvement plan.
| THE INFORMATION IN THIS STRUCTURAL AND COLLATERAL TERM SHEET IS NOT COMPLETE AND MAY BE AMENDED PRIOR TO THE TIME OF SALE. THIS TERM SHEET IS NOT AN OFFER TO SELL THESE SECURITIES AND IT IS NOT A SOLICITATION OF AN OFFER TO BUY THESE SECURITIES IN ANY JURISDICTION WHERE THE OFFER OR SALE IS NOT PERMITTED. | ||
| T-96 | ||
| Hospitality - Full Service | Loan #8 | Cut-off Date Balance: | $29,000,000 | |
| 1060 Center Street | Crowne Plaza North Augusta | Cut-off Date LTV: | 67.1% | |
| North Augusta, SC 29841 | UW NCF DSCR: | 1.86x | ||
| UW NOI Debt Yield: | 16.4% |
FF&E Reserve – On the origination date, the borrower deposited $100 into an FF&E reserve and on each payment date thereafter is required to deposit 4.0% of gross rents for the calendar month two months prior to such payment date.
Seasonality Reserve – On the origination date, the borrower was required to make an initial deposit of $500,000. Additionally, in May of each year, if applicable, the borrower will deposit an amount such that the amount on deposit in the seasonality reserve account after making such seasonality reserve annual deposit is at least equal to 125% of the aggregate shortfall in net cash flow after debt service for the immediately preceding period, as determined by the lender in April of each year based on the financial reports required pursuant to the Crowne Plaza North Augusta Mortgage Loan documents; provided, however, in no event shall the amount on deposit in the Seasonality Reserve Account after making such seasonality reserve annual deposit be less than $390,000.
Immediate Repairs Reserve – On the origination date, the borrower was required to make an initial deposit of $20,130 to cover the costs associated with immediate repairs at the property.
Special Event Advance Deposits Reserve – As applicable, in connection with any special event (e.g., sporting event, entertainment event, social gathering or conference), the borrower will deposit any non-refundable advance booking deposit received, equal to or exceeding $100,000 collectively. Provided no event of default has occurred and is continuing, the lender will use commercially reasonable efforts, upon a request by borrower, to disburse the Special Event Advance Deposit to the lockbox account within 10 business days of such request.
Lockbox and Cash Management. The Crowne Plaza North Augusta Mortgage Loan is structured with a hard lockbox and springing cash management. The borrower is required to deliver direction letters to each of the credit card companies with which borrower has entered into a merchant’s or other credit card agreement directing them to pay to the lender-controlled lockbox account all payments which would otherwise be paid to borrower under the applicable credit card processing agreement. The borrower is required to (or cause the property manager to) deposit all revenue generated by the Crowne Plaza North Augusta Property into the lender-controlled lockbox account within one business day. All funds deposited into the lockbox are required to be transferred on each business day to or at the direction of the borrower unless a Cash Sweep Event Period (as defined below) exists. Upon the occurrence and during the continuance of a Cash Sweep Event Period, all funds in the lockbox account are required to be swept on each business day to a lender-controlled cash management account to be applied and disbursed in accordance with the Crowne Plaza North Augusta Mortgage Loan documents. All excess cash flow funds remaining in the cash management account after the application of such funds in accordance with the Crowne Plaza North Augusta Loan documents may be held by the lender in an excess cash flow reserve account as additional collateral for the Crowne Plaza North Augusta Mortgage Loan.
A “Cash Sweep Event Period” means the occurrence of (i) an event of default; (ii) a bankruptcy action of borrower or manager or (iii) the net cash flow debt service coverage ratio falling below 1.20x based on the trailing 12-months (a “DSCR Trigger Event”).
A Cash Sweep Event Period will end upon (a) with regard to clause (i), the cure of such event of default, (b) with regard to clause (ii), if the Cash Sweep Event is caused solely by a bankruptcy action of manager, the borrower replacing the manager with a qualified manager under a replacement management agreement within 60 days after such bankruptcy action, (c) with regard to clause (iii), the net cash flow debt service coverage ratio being at least 1.20x for two consecutive calendar quarters; provided, however, that, such Cash Sweep Event Cure set forth in this definition shall be subject to the following conditions, (x) no event of default shall have occurred and be continuing under the Crowne Plaza North Augusta Mortgage Loan documents, (y) with respect to clause (iii), a Cash Sweep Event Cure may occur an unlimited number of times and with respect to any other Cash Sweep Event, a Cash Sweep Event Cure may occur no more than a total of four times in the aggregate during the term of the Crowne Plaza North Augusta Mortgage Loan and (z) the borrower shall have paid all of the lender's reasonable expenses incurred in connection with such Cash Sweep Event Cure including, reasonable attorney's fees and expenses. In no event will the borrower be entitled to cure a Cash Sweep Event caused by a bankruptcy action of borrower.
Ground Lease. See “The Property” above for additional information.
Terrorism Insurance. The loan documents require that the “all risk” insurance policy required to be maintained by the borrower provides coverage for terrorism in an amount equal to the full replacement cost of the Crowne Plaza North Augusta Property, as well as business interruption insurance covering no less than the 12-month period following the occurrence of a casualty event, together with a 6-month extended period of indemnity. See “Risk Factors-Risks Relating to the Mortgage Loans-Terrorism Insurance May Not Be Available for All Mortgaged Properties” in the Preliminary Prospectus.
| THE INFORMATION IN THIS STRUCTURAL AND COLLATERAL TERM SHEET IS NOT COMPLETE AND MAY BE AMENDED PRIOR TO THE TIME OF SALE. THIS TERM SHEET IS NOT AN OFFER TO SELL THESE SECURITIES AND IT IS NOT A SOLICITATION OF AN OFFER TO BUY THESE SECURITIES IN ANY JURISDICTION WHERE THE OFFER OR SALE IS NOT PERMITTED. | ||
| T-97 | ||
| Retail – Single Tenant | Loan #9 | Cut-off Date Balance: | $28,890,300 | |
| Various | ExchangeRight Net Leased Portfolio #69 | Cut-off Date LTV: | 53.0% | |
| Various | U/W NCF DSCR: | 1.81x | ||
| U/W NOI Debt Yield: | 11.3% |

| THE INFORMATION IN THIS STRUCTURAL AND COLLATERAL TERM SHEET IS NOT COMPLETE AND MAY BE AMENDED PRIOR TO THE TIME OF SALE. THIS TERM SHEET IS NOT AN OFFER TO SELL THESE SECURITIES AND IT IS NOT A SOLICITATION OF AN OFFER TO BUY THESE SECURITIES IN ANY JURISDICTION WHERE THE OFFER OR SALE IS NOT PERMITTED. | ||
| T-98 | ||
| Retail – Single Tenant | Loan #9 | Cut-off Date Balance: | $28,890,300 | |
| Various | ExchangeRight Net Leased Portfolio #69 | Cut-off Date LTV: | 53.0% | |
| Various | U/W NCF DSCR: | 1.81x | ||
| U/W NOI Debt Yield: | 11.3% |
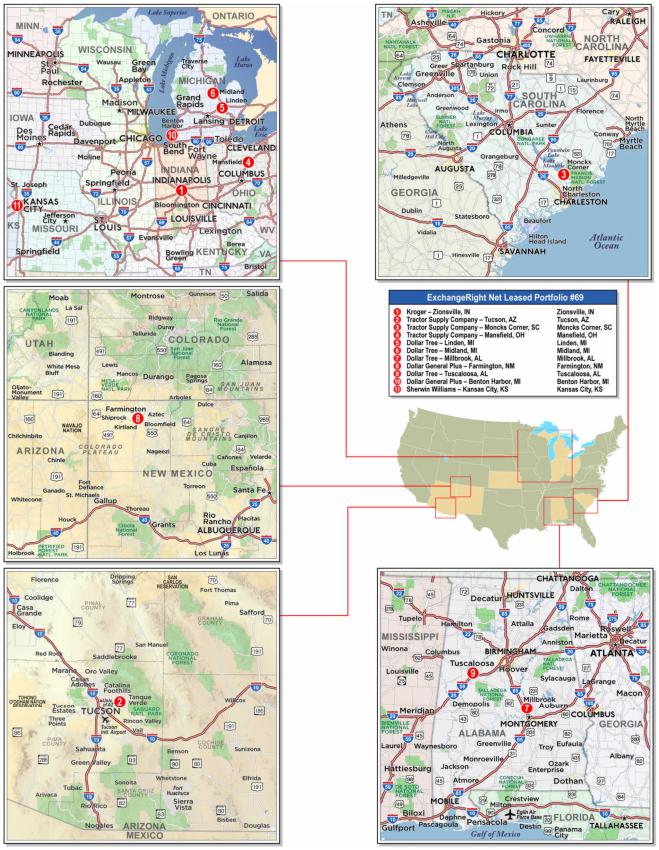
| THE INFORMATION IN THIS STRUCTURAL AND COLLATERAL TERM SHEET IS NOT COMPLETE AND MAY BE AMENDED PRIOR TO THE TIME OF SALE. THIS TERM SHEET IS NOT AN OFFER TO SELL THESE SECURITIES AND IT IS NOT A SOLICITATION OF AN OFFER TO BUY THESE SECURITIES IN ANY JURISDICTION WHERE THE OFFER OR SALE IS NOT PERMITTED. | ||
| T-99 | ||
| Mortgage Loan No. 9 – ExchangeRight Net Leased Portfolio #69 |
| Mortgage Loan Information | Property Information | ||||||
| Mortgage Loan Seller: | MSMCH | Single Asset/Portfolio: | Portfolio | ||||
| Credit Assessment (Fitch/Moody’s/KBRA): | NR/NR/NR | Location(2): | Various, Various | ||||
| Original Balance: | $28,890,300 | General Property Type(2): | Retail | ||||
| Cut-off Date Balance: | $28,890,300 | Detailed Property Type(2): | Single Tenant | ||||
| % of Initial Pool Balance: | 3.9% | Title Vesting: | Fee | ||||
| Loan Purpose: | Acquisition | Year Built/Renovated(2): | Various/Various | ||||
| Borrower Sponsors: | David Fisher, Warren Thomas, Joshua | Size: | 224,189 SF | ||||
| Ungerecht and | Cut-off Date Balance Per SF: | $129 | |||||
| ExchangeRight Real Estate, LLC | Maturity Date Balance Per SF: | $129 | |||||
| Guarantors: | David Fisher, Warren Thomas, | Property Manager: | NLP Management, LLC (borrower- | ||||
| Joshua Ungerecht and | related) | ||||||
| ExchangeRight Real Estate, LLC | |||||||
| Mortgage Rate: | 6.0800% | ||||||
| Note Date: | 1/14/2025 | ||||||
| Maturity Date: | 2/1/2030 | Underwriting and Financial Information | |||||
| Term to Maturity: | 60 months | UW NOI: | $3,263,086 | ||||
| Amortization Term: | 0 months | UW NCF: | $3,228,879 | ||||
| IO Period: | 60 months | UW NOI Debt Yield: | 11.3% | ||||
| Seasoning: | 0 months | UW NCF Debt Yield: | 11.2% | ||||
| Prepayment Provisions: | L(24),D(29),O(7) | UW NOI Debt Yield at Maturity: | 11.3% | ||||
| Lockbox/Cash Mgmt Status: | Hard/Springing | UW NCF DSCR: | 1.81x | ||||
| Additional Debt Type: | NAP | Most Recent NOI(3): | NAV | ||||
| Additional Debt Balance: | NAP | 2nd Most Recent NOI(3): | NAV | ||||
| Future Debt Permitted (Type): | No (NAP) | 3rd Most Recent NOI(3): | NAV | ||||
| Reserves(1) | Most Recent Occupancy: | 100.0% (2/1/2025) | |||||
| Type | Initial | Monthly | Cap | 2nd Most Recent Occupancy(3): | NAV | ||
| RE Taxes: | $13,470 | $13,470 | NAP | 3rd Most Recent Occupancy(3): | NAV | ||
| Insurance: | $0 | Springing | NAP | Appraised Value (as of)(4): | $54,530,000 (Various) | ||
| Replacement Reserve: | $20,330 | Springing | NAP | Appraised Value per SF: | $243 | ||
| Deferred Maintenance: | $3,780 | $0 | NAP | Cut-off Date LTV Ratio: | 53.0% | ||
| TI/LC Reserve: | $500,000 | Springing | NAP | Maturity Date LTV Ratio: | 53.0% | ||
| Sources and Uses | ||||||
| Sources | Proceeds | % of Total | Uses | Proceeds | % of Total | |
| Mortgage Loan Amount: | $28,890,300 | 51.5% | Purchase Price: | $53,835,816 | 96.0% | |
| Borrower Equity: | $27,188,011 | 48.5% | Closing Costs: | $1,704,915 | 3.0% | |
| Reserves: | $537,580 | 1.0% | ||||
| Total Sources: | $56,078,311 | 100.0% | Total Uses: | $56,078,311 | 100.0% | |
| (1) | See “Escrows and Reserves” below for further discussion of reserve requirements. |
| (2) | See “The Properties” section below. |
| (3) | Historical occupancy and NOI are unavailable because the ExchangeRight Properties (as defined below) were acquired by the borrower between July 22, 2024 and October 28, 2024. |
| (4) | The individual appraised value as-of dates are between August 22, 2024 and November 13, 2024. |
The Mortgage Loan. The ninth largest mortgage loan (the “ExchangeRight Net Leased Portfolio #69 Mortgage Loan”) is evidenced by a promissory note in the original principal amount of $28,890,300 and secured by the fee interests in 11 net leased, single-tenant retail properties, located in eight states (the “ExchangeRight Properties”).
The Borrower and the Borrower Sponsors. The borrower for the ExchangeRight Net Leased Portfolio #69 Mortgage Loan is ExchangeRight Net-Leased Portfolio 69 DST, a Delaware statutory trust with at least one independent director. The borrower sponsors are David Fisher, Warren Thomas, Joshua Ungerecht and ExchangeRight Real Estate, LLC. ExchangeRight Real Estate, LLC has more than 25 million SF of commercial properties under management and owns more than 1,300 investment-grade retail and multifamily properties located across 47 states. ExchangeRight Real Estate, LLC and its three owners, David Fisher, Warren Thomas and Joshua Ungerecht (collectively, the “Individual Guarantors”), are the guarantors of certain non-recourse carveout liabilities under the ExchangeRight Net Leased Portfolio #69 Mortgage Loan.
The borrower has master leased the ExchangeRight Properties to a master tenant (the “ExchangeRight Net Leased Portfolio #69 Master Tenant”) owned by ExchangeRight Real Estate, LLC, which is in turn owned by the Individual Guarantors. The ExchangeRight Net Leased Portfolio #69 Master Tenant is a Delaware limited liability company structured to be bankruptcy-remote, with one independent director. The master lease generally imposes responsibility on the ExchangeRight Net Leased Portfolio #69 Master Tenant for the operation, maintenance and management of the ExchangeRight Properties and payment of all expenses incurred in the maintenance and repair of the ExchangeRight Properties, other than capital expenses. The ExchangeRight Net Leased Portfolio #69 Master Tenant’s interest in all tenant rents was assigned to the borrower, which in turn collaterally assigned its interest to the lender.
| THE INFORMATION IN THIS STRUCTURAL AND COLLATERAL TERM SHEET IS NOT COMPLETE AND MAY BE AMENDED PRIOR TO THE TIME OF SALE. THIS TERM SHEET IS NOT AN OFFER TO SELL THESE SECURITIES AND IT IS NOT A SOLICITATION OF AN OFFER TO BUY THESE SECURITIES IN ANY JURISDICTION WHERE THE OFFER OR SALE IS NOT PERMITTED. | ||
| T-100 | ||
| Retail – Single Tenant | Loan #9 | Cut-off Date Balance: | $28,890,300 | |
| Various | ExchangeRight Net Leased Portfolio #69 | Cut-off Date LTV: | 53.0% | |
| Various | U/W NCF DSCR: | 1.81x | ||
| U/W NOI Debt Yield: | 11.3% |
The master lease is subordinate to the ExchangeRight Net Leased Portfolio #69 Mortgage Loan and, upon an event of default under the ExchangeRight Net Leased Portfolio #69 Mortgage Loan, the lender has the right to cause the borrower to terminate the master lease. A default under the master lease is an event of default under the ExchangeRight Net Leased Portfolio #69 Mortgage Loan and gives rise to recourse liability to the non-recourse carveout guarantors for losses, unless such default arises solely in connection with the failure of the ExchangeRight Net Leased Portfolio #69 Master Tenant to pay rent as a result of the ExchangeRight Properties not generating sufficient cash flow for the payment of such rent.
The lender has the right to require the borrower to convert from a Delaware statutory trust to a limited liability company upon (i) an event of default or the lender’s good faith determination of imminent default under the ExchangeRight Net Leased Portfolio #69 Mortgage Loan, (ii) the lender’s good faith determination that the borrower will be unable to make a material decision or take a material action required in connection with the operation and maintenance of the ExchangeRight Properties, or (iii) 90 days prior to the maturity date of the ExchangeRight Net Leased Portfolio #69 Mortgage Loan, if an executed commitment from an institutional lender to refinance the ExchangeRight Net Leased Portfolio #69 Mortgage Loan is not delivered to the lender.
At any time following January 14, 2026, the borrower sponsor has the right to effect a Qualified Transfer. A “Qualified Transfer” means a one-time transfer of all (but not less than all) of the outstanding ownership interests in the borrower and the ExchangeRight Net Leased Portfolio #69 Master Tenant to an Approved Transferee (as defined below) and a replacement of the non-recourse carveout guarantors as the person who controls the borrower with such Approved Transferee (or other acceptable replacement guarantor); provided that certain conditions are satisfied, including among others: (i) no event of default exists under the ExchangeRight Net Leased Portfolio #69 Mortgage Loan, (ii) the ExchangeRight Properties will continue to be managed by a qualified manager, (iii) prior to any release of the guarantor, the Approved Transferee (or other acceptable replacement guarantor) executes a full guarantee and indemnity pursuant to which it agrees to be liable (from and after the transfer) for all indemnity obligations (including environmental liabilities and obligations) for which the existing non-recourse carveout guarantors are liable under the non-recourse carveout guaranty, (iv) the Approved Transferee owns 100% of the beneficial ownership interests in, and controls, the borrower and ExchangeRight Net Leased Portfolio #69 Master Tenant, (v) the delivery of opinions regarding existence, authority, enforceability and non-consolidation satisfactory to the lender and (vi) if required by the lender, rating agency confirmation from each applicable rating agency.
"Approved Transferee" means either (A) an eligible institution that is, or is wholly-owned and controlled by, a bank, savings and loan association, investment bank, insurance company, trust company, real estate investment trust, commercial credit corporation, pension plan, pension fund or pension advisory firm, mutual fund, government entity or plan or institution similar to any of the foregoing or (B) any person that (1) is a Qualified Transferee (as defined below) and for whom the lender has received a reasonably acceptable credit check and searches, (2) is regularly engaged in the business of owning or operating commercial properties, or interests therein, which are similar to the ExchangeRight Properties, (3) owns interests in, or operates, at least five retail properties with a minimum of 750,000 SF in the aggregate, (4) maintains either (i) a minimum net worth of at least $200,000,000 and total assets of at least $400,000,000 (excluding the ExchangeRight Properties) or (ii) an investment grade rating by S&P or Moody’s, (5) at all times owns no less than 100% of the legal and beneficial ownership of the borrower, and (6) causes borrower to be converted from a Delaware statutory trust unless borrower is solely owned by a person under management control of the Individual Guarantors and is no longer treated as an investment trust pursuant to Regulation Section 301.7701-4(c) of the Internal Revenue Code.
A “Qualified Transferee” means a transferee that (i) has never been indicted or convicted of, or pled guilty or no contest to a felony, (ii) has never been indicted or convicted of, or pled guilty or no contest to, a Patriot Act offense and is not on any government watch list, (iii) has never been the subject of a voluntary or involuntary (to the extent the same has not been discharged) bankruptcy proceeding, (iv) has no material outstanding judgments, litigations or regulatory actions against it or its interests and (v) is not a crowdfunded entity or controlled by a crowdfunded entity.
In addition, at any time following January 14, 2026, the borrower sponsors have the right to effect a one-time transfer of all (but not less than all) of the outstanding ownership interests in the borrower and the ExchangeRight Net Leased Portfolio #69 Master Tenant to an Approved REIT (as defined below) or a subsidiary thereof that is management controlled by the Approved REIT and meets the requirements of a Qualified Transferee and to replace the non-recourse carveout guarantors with such Approved REIT, or provided such entity has total assets of at least $400,000,000 (excluding the ExchangeRight Properties) and at least $200,000,000 in shares of beneficial interest owned by investors, ExchangeRight Income Fund Operating Partnership, LP, a Delaware limited partnership (or such other acceptable replacement guarantor(s) satisfactory to the lender in its sole discretion), provided certain conditions are satisfied, including among others: (i) no event of default exists under the ExchangeRight Net Leased Portfolio #69 Mortgage Loan, (ii) the ExchangeRight Properties will continue to be managed by a qualified manager, (iii) prior to any release of the guarantor, the Approved REIT (or other acceptable replacement guarantor) executes a guarantee of recourse obligations (in substantially the form as the guarantee delivered at origination) pursuant to which it agrees to be liable under such guaranty (from and after the transfer), (iv) the Approved REIT (or a subsidiary thereof that is management controlled by the Approved REIT) owns 51% of the beneficial ownership interests in the borrower and ExchangeRight Net Leased Portfolio #69 Master Tenant, (v) the delivery of opinions regarding existence, authority, enforceability and non-consolidation satisfactory to the lender and (vi) if required by the lender, rating agency confirmation from each applicable rating agency.
“Approved REIT” means a real estate investment trust that (i) meets the requirements of a Qualified Transferee and for whom the lender receives a reasonably acceptable credit check and searches; (ii) is at all times (a) owned, directly or indirectly, by the Individual Guarantors in an amount that is equal to either (x) 0.50% of all equity interests or (y) equity interests valued at not less than $15,000,000, and (b) under the management control of one or more persons that (1) meet the requirements of a Qualified Transferee and for whom the lender receives a reasonably acceptable credit check and searches, and (2) is at all times under management control by the Individual Guarantors (provided such management control is not required if the Approved REIT has acquired a controlling interest in ExchangeRight Real Estate, LLC and has total assets of at least $400,000,000 (excluding the ExchangeRight Properties) and at least $200,000,000 in shares of beneficial interest owned by investors); and (iii) is otherwise reasonably acceptable to the lender in all respects. Subject to the satisfaction of clauses (i) and (ii) above, each of (x) ExchangeRight Income Fund (doing business as the ExchangeRight Essential Income Strategy), a Maryland statutory trust, (y) ExchangeRight Income Fund Operating Partnership, LP, a Delaware limited partnership, and (z) any real estate investment trust or the operating partnership that is under the management control of such real estate investment trust, will be deemed to have satisfied clause (iii) above provided such entity has total assets of at least $400,000,000 (excluding the ExchangeRight Properties) and at least $200,000,000 in shares of beneficial interest owned by investors.
| THE INFORMATION IN THIS STRUCTURAL AND COLLATERAL TERM SHEET IS NOT COMPLETE AND MAY BE AMENDED PRIOR TO THE TIME OF SALE. THIS TERM SHEET IS NOT AN OFFER TO SELL THESE SECURITIES AND IT IS NOT A SOLICITATION OF AN OFFER TO BUY THESE SECURITIES IN ANY JURISDICTION WHERE THE OFFER OR SALE IS NOT PERMITTED. | ||
| T-101 | ||
| Retail – Single Tenant | Loan #9 | Cut-off Date Balance: | $28,890,300 | |
| Various | ExchangeRight Net Leased Portfolio #69 | Cut-off Date LTV: | 53.0% | |
| Various | U/W NCF DSCR: | 1.81x | ||
| U/W NOI Debt Yield: | 11.3% |
The Properties. The ExchangeRight Properties are comprised of 11 single-tenant retail properties totaling 224,189 SF and located across eight states. The ExchangeRight Properties are located in Indiana (one property, 29.1% of NRA and 30.7% of underwritten rent), Arizona (one property, 17.3% of NRA and 16.7% of underwritten rent), Ohio (one property, 15.3% of NRA and 11.2% of underwritten rent), Michigan (three properties, 13.5% of NRA and 13.4% of underwritten rent), Alabama (two properties, 9.0% of NRA and 8.2% of underwritten rent) and South Carolina (one property, 8.5% of NRA and 12.1% of underwritten rent) with the two remaining ExchangeRight Properties located in New Mexico and Kansas. Built between 1973 and 2024, with seven of the 11 properties built in 2024, the ExchangeRight Properties range in size from 5,640 SF to 65,182 SF.
The ExchangeRight Properties are leased to the following five nationally recognized tenants operating in diverse retail segments: Tractor Supply, Kroger, Dollar Tree, Dollar General Plus, and Sherwin-Williams. As of the cut-off date, the ExchangeRight Properties have a weighted average remaining lease term of approximately 15.0 years. Leases representing 100.0% of NRA and 100.0% of the underwritten base rent expire after the maturity date of the ExchangeRight Net Leased Portfolio #69 Mortgage Loan.
The following table presents certain information relating to the state locations of the ExchangeRight Properties:
| Geographic Summary | ||||||
| State | Number of Properties | Tenant SF | % of Collateral SF | Annual UW Rent | Annual UW Base Rent PSF | % of Annual UW Base Rent |
| IN | 1 | 65,182 | 29.1% | $1,070,000 | $16.42 | 30.7% |
| AZ | 1 | 38,869 | 17.3% | $581,933 | $14.97 | 16.7% |
| OH | 1 | 34,347 | 15.3% | $391,652 | $11.40 | 11.2% |
| MI | 3 | 30,338 | 13.5% | $466,718 | $15.38 | 13.4% |
| AL | 2 | 20,076 | 9.0% | $286,400 | $14.27 | 8.2% |
| SC | 1 | 19,097 | 8.5% | $421,050 | $22.05 | 12.1% |
| NM | 1 | 10,640 | 4.7% | $148,070 | $13.92 | 4.2% |
| KS | 1 | 5,640 | 2.5% | $124,287 | $22.04 | 3.6% |
| Subtotal/Wtd. Avg. | 11 | 224,189 | 100.0% | $3,490,109 | $15.57 | 100.0% |
| Source: | Appraisals and Underwritten Rent Roll |
The following table presents certain information relating to the ExchangeRight Properties, which are presented in descending order of their Appraised Values.
| ExchangeRight Properties Summary | ||||||||||
| Property Name | Year Built/ Renovated(1) | Tenant NRSF | %of Portfolio NRSF | Lease Expiration Date | Appraised Value(1) | % of Portfolio Appraised Value | Annual UW Base Rent | Annual UW Base Rent PSF | % of Annual UW Base Rent | Renewal Options |
| Kroger - Zionsville, IN | 1999 / 2018 | 65,182 | 29.1% | 4/30/2037(2) | $17,825,000 | 32.7% | $1,070,000 | $16.42 | 30.7% | None |
| Tractor Supply - Tucson, AZ | 2024 / NAP | 38,869 | 17.3% | 8/31/2044 | $9,300,000 | 17.1% | $581,933 | $14.97 | 16.7% | 4, 5-Year |
| Tractor Supply - Moncks Corner, SC | 2017 / NAP | 19,097 | 8.5% | 9/30/2044 | $6,700,000 | 12.3% | $421,050 | $22.05 | 12.1% | 3, 5-Year |
| Tractor Supply - Mansfield, OH | 1973 / 1991 | 34,347 | 15.3% | 10/31/2044 | $6,250,000 | 11.5% | $391,652 | $11.40 | 11.2% | 3, 5-Year |
| Dollar Tree - Linden, MI | 2024 / NAP | 9,870 | 4.4% | 2/28/2035 | $2,500,000 | 4.6% | $185,000 | $18.74 | 5.3% | 5, 5-Year |
| Dollar Tree - Midland, MI | 2024 / NAP | 9,828 | 4.4% | 2/28/2035 | $2,110,000 | 3.9% | $156,000 | $15.87 | 4.5% | 4, 5-Year |
| Dollar Tree - Millbrook, AL | 2024 / NAP | 10,076 | 4.5% | 6/30/2034 | $2,100,000 | 3.9% | $147,500 | $14.64 | 4.2% | 5, 5-Year |
| Dollar General Plus - Farmington, NM | 2024 / NAP | 10,640 | 4.7% | 10/31/2039 | $2,060,000 | 3.8% | $148,070 | $13.92 | 4.2% | 3, 5-Year |
| Dollar Tree - Tuscaloosa, AL | 2024 / NAP | 10,000 | 4.5% | 9/30/2034 | $1,975,000 | 3.6% | $138,900 | $13.89 | 4.0% | 5, 5-Year |
| Dollar General Plus - Benton Harbor, MI | 2024 / NAP | 10,640 | 4.7% | 9/30/2039 | $1,860,000 | 3.4% | $125,718 | $11.82 | 3.6% | 5, 5-Year |
| Sherwin-Williams - Kansas City, KS | 1988 / 2024 | 5,640 | 2.5% | 11/30/2034 | $1,850,000 | 3.4% | $124,287 | $22.04 | 3.6% | 4, 5-Year |
| Total/Weighted Average | 224,189 | 100.0% | $54,530,000 | 100.0% | $3,490,109 | $15.57 | 100.0% | |||
Source: Underwritten Rent Roll
| (1) | Information obtained from the appraisals. |
| (2) | Kroger has the right to terminate its lease effective July 1, 2032, upon 180 days’ prior written notice. |
| THE INFORMATION IN THIS STRUCTURAL AND COLLATERAL TERM SHEET IS NOT COMPLETE AND MAY BE AMENDED PRIOR TO THE TIME OF SALE. THIS TERM SHEET IS NOT AN OFFER TO SELL THESE SECURITIES AND IT IS NOT A SOLICITATION OF AN OFFER TO BUY THESE SECURITIES IN ANY JURISDICTION WHERE THE OFFER OR SALE IS NOT PERMITTED. | ||
| T-102 | ||
| Retail – Single Tenant | Loan #9 | Cut-off Date Balance: | $28,890,300 | |
| Various | ExchangeRight Net Leased Portfolio #69 | Cut-off Date LTV: | 53.0% | |
| Various | U/W NCF DSCR: | 1.81x | ||
| U/W NOI Debt Yield: | 11.3% |
The following table presents a summary regarding the tenants at the ExchangeRight Properties:
| Tenant Summary(1) | |||||||
| Tenant Name | Credit Rating (S&P/ Moody’s/Fitch)(2) | No. of Properties | Tenant SF | Approx.% of SF | Annual UW Base Rent | Annual UW Base Rent PSF | Approx. % of Total Annual UW base Rent |
| Tractor Supply | BBB / Baa1 / NR | 3 | 92,313 | 41.2% | $1,394,635 | $15.11 | 40.0% |
| Kroger | BBB / Baa1 / NR | 1 | 65,182 | 29.1% | $1,070,000 | $16.42 | 30.7% |
| Dollar Tree | BBB / Baa2 / NR | 4 | 39,774 | 17.7% | $627,400 | $15.77 | 18.0% |
| Dollar General Plus | BBB / Baa2 / NR | 2 | 21,280 | 9.5% | $273,788 | $12.87 | 7.8% |
| Sherwin-Williams | BBB / Baa2 / BBB+ | 1 | 5,640 | 2.5% | $124,287 | $22.04 | 3.6% |
| Subtotal/Wtd. Avg. | 11 | 224,189 | 100.0% | $3,490,109 | $15.57 | 100.0% | |
| Vacant | 0 | 0 | 0.0% | ||||
| Total/Wtd. Avg. | 11 | 224,189 | 100.0% | ||||
| (1) | Information is based on the underwritten rent roll. |
| (2) | Certain ratings are those of the parent company whether or not the parent guarantees the lease. |
The following table presents certain information relating to the lease rollover at the ExchangeRight Properties:
| Lease Rollover Schedule(1)(2) | ||||||||
| Year | # of Leases Rolling | SF Rolling | Annual UW Base Rent PSF Rolling | Approx. % of Total SF Rolling | Approx. Cumulative % of SF Rolling | Total UW Base Rent Rolling | Approx. % of Total UW Base Rent Rolling | Approx. Cumulative % of Total UW Base Rent Rolling |
| MTM | 0 | 0 | $0.00 | 0.0% | 0.0% | $0 | 0.0% | 0.0% |
| 2025 | 0 | 0 | $0.00 | 0.0% | 0.0% | $0 | 0.0% | 0.0% |
| 2026 | 0 | 0 | $0.00 | 0.0% | 0.0% | $0 | 0.0% | 0.0% |
| 2027 | 0 | 0 | $0.00 | 0.0% | 0.0% | $0 | 0.0% | 0.0% |
| 2028 | 0 | 0 | $0.00 | 0.0% | 0.0% | $0 | 0.0% | 0.0% |
| 2029 | 0 | 0 | $0.00 | 0.0% | 0.0% | $0 | 0.0% | 0.0% |
| 2030 | 0 | 0 | $0.00 | 0.0% | 0.0% | $0 | 0.0% | 0.0% |
| 2031 | 0 | 0 | $0.00 | 0.0% | 0.0% | $0 | 0.0% | 0.0% |
| 2032 | 0 | 0 | $0.00 | 0.0% | 0.0% | $0 | 0.0% | 0.0% |
| 2033 | 0 | 0 | $0.00 | 0.0% | 0.0% | $0 | 0.0% | 0.0% |
| 2034 | 3 | 25,716 | $15.97 | 11.5% | 11.5% | $410,687 | 11.8% | 11.8% |
| 2035 & Beyond | 8 | 198,473 | $15.52 | 88.5% | 100.0% | $3,079,423 | 88.2% | 100.0% |
| Vacant | 0 | 0 | $0.00 | 0.0% | 100.0% | $0 | 0.0% | 100.0% |
| Total/Wtd. Avg. | 11 | 224,189 | $15.57 | 100.0% | $3,490,109 | 100.0% | ||
| (1) | Information is based on the underwritten rent roll. |
| (2) | Certain tenants may have lease termination options that are exercisable prior to the stated expiration date of the subject lease or leases which are not considered in the lease rollover schedule. |
Appraisal. The appraisal concluded to an aggregate “As-is” appraised value for the ExchangeRight Properties of $54,530,000 as of between August 22, 2024 and November 13, 2024.
Environmental Matters. According to the Phase I environmental site assessments dated between August 6, 2024 and November 19, 2024, there was no evidence of any recognized environmental conditions at the ExchangeRight Properties. The environmental site assessment for Sherwin-Williams – Kansas City, KS property identified a controlled recognized environmental condition. See “Description of the Mortgage Pool—Environmental Considerations” in the prospectus.
| THE INFORMATION IN THIS STRUCTURAL AND COLLATERAL TERM SHEET IS NOT COMPLETE AND MAY BE AMENDED PRIOR TO THE TIME OF SALE. THIS TERM SHEET IS NOT AN OFFER TO SELL THESE SECURITIES AND IT IS NOT A SOLICITATION OF AN OFFER TO BUY THESE SECURITIES IN ANY JURISDICTION WHERE THE OFFER OR SALE IS NOT PERMITTED. | ||
| T-103 | ||
| Retail – Single Tenant | Loan #9 | Cut-off Date Balance: | $28,890,300 | |
| Various | ExchangeRight Net Leased Portfolio #69 | Cut-off Date LTV: | 53.0% | |
| Various | U/W NCF DSCR: | 1.81x | ||
| U/W NOI Debt Yield: | 11.3% |
Underwritten Net Cash Flow. The following table presents certain information relating to the Underwritten Net Cash Flow for the ExchangeRight Properties:
| Cash Flow Analysis(1) | ||
| UW | UW Per SF | |
| Gross Potential Rent | $3,490,109 | $15.57 |
| Total Recoveries | $0 | $0.00 |
| Other Income | $0 | $0.00 |
| Less Vacancy & Credit Loss | ($126,103) | ($0.56) |
| Effective Gross Income | $3,364,006 | $15.01 |
| Real Estate Taxes | $0 | $0.00 |
| Insurance | $0 | $0.00 |
| Management Fee(2) | $100,920 | $0.45 |
| Total Expenses(2) | $100,920 | $0.45 |
| Net Operating Income | $3,263,086 | $14.56 |
| Capital Expenditures | $33,628 | $0.15 |
| TI/LC | $50,579 | $0.23 |
| Plus TI/LC Credit(3) | ($50,000) | ($0.22) |
| Net Cash Flow | $3,228,879 | $14.40 |
| Occupancy %(4) | 96.4% | |
| NOI DSCR | 1.83x | |
| NCF DSCR | 1.81x | |
| NOI Debt Yield | 11.3% | |
| NCF Debt Yield | 11.2% | |
| (1) | Historical financial information is not available because the ExchangeRight Properties were acquired by the borrower sponsor between July 22, 2024 and October 28, 2024. |
| (2) | Total Expenses consist of a 3.0% management fee. |
| (3) | Plus TI/LC Credit means credit for one tenth of the $500,000 initial deposit into the TI/LC reserve was underwritten. |
| (4) | Occupancy % represents economic occupancy at the ExchangeRight Properties. As of February 1, 2025, the ExchangeRight Properties were 100.0% occupied. |
Escrows and Reserves.
Real Estate Taxes – The ExchangeRight Net Leased Portfolio #69 Mortgage Loan documents provide for an upfront reserve of $13,470 for real estate taxes. The borrower will be required to make monthly deposits into the real estate tax reserve in an amount equal to 1/12th of the real estate taxes that the lender estimates will be payable during the next 12 months, initially $13,470 per month, except that no deposits will be required on account of taxes with respect to the Direct Tax Pay Tenants (as defined below) for so long as the Direct Pay Conditions (as defined below) are satisfied. “Direct Tax Pay Tenant” means any tenant that has the right or the obligation pursuant to its lease to pay taxes for the applicable ExchangeRight Property directly to the applicable taxing authority and is actually exercising such right or complying with such obligation, as applicable. The ExchangeRight Net Leased Portfolio #69 Mortgage Loan documents provide that the initial such Direct Tax Pay Tenants are the tenants at the (i) Kroger – Zionsville, IN, (ii) Tractor Supply Company – Mansfield, OH, (iii) Tractor Supply Company – Moncks Corner, SC, and (iv) Tractor Supply Company – Tucson, AZ ExchangeRight Properties.
“Direct Pay Conditions” means (i) no event of default under the ExchangeRight Net Leased Portfolio #69 Mortgage Loan has occurred and is continuing, (ii) the borrower provides proof of payment by the applicable tenant (or the borrower) of the applicable tax, insurance or capital expense (in the case of taxes and insurance, on or before (i) in the case of taxes, 15 days prior to the last date on which the taxes can be paid without the accrual of interest or penalties or (ii) in the case of insurance premiums, on or before 15 days prior to the due date for such insurance premium, as applicable), (iii) the tenant’s lease is not subject to any default beyond any applicable grace or notice and cure period by either the borrower or such tenant, and (iv) no material adverse change has (in the lender’s reasonable determination) occurred with respect to the tenant such that its ability to timely pay the applicable expense has been materially jeopardized.
Insurance – The borrower will be required to make monthly deposits into an insurance reserve in an amount equal to 1/12th of the insurance premiums that the lender estimates will be payable for the renewal of the coverage afforded by the insurance policies upon the expiration thereof (initially, approximately $0.00), except that no deposits will be required on account of insurance premiums with respect to the Direct Insurance Pay Tenants (as defined below) for so long as the Direct Pay Conditions are satisfied. In addition, the borrower will not be required to make or cause to be made deposits for insurance premiums for which the borrower or ExchangeRight Net Leased Portfolio #69 Master Tenant is responsible pursuant to the terms of the loan agreement or master lease so long as (A) a lender-approved blanket insurance policy is in full force and effect and (B) no event of default is continuing under the ExchangeRight Net Leased Portfolio #69 Mortgage Loan.
| THE INFORMATION IN THIS STRUCTURAL AND COLLATERAL TERM SHEET IS NOT COMPLETE AND MAY BE AMENDED PRIOR TO THE TIME OF SALE. THIS TERM SHEET IS NOT AN OFFER TO SELL THESE SECURITIES AND IT IS NOT A SOLICITATION OF AN OFFER TO BUY THESE SECURITIES IN ANY JURISDICTION WHERE THE OFFER OR SALE IS NOT PERMITTED. | ||
| T-104 | ||
| Retail – Single Tenant | Loan #9 | Cut-off Date Balance: | $28,890,300 | |
| Various | ExchangeRight Net Leased Portfolio #69 | Cut-off Date LTV: | 53.0% | |
| Various | U/W NCF DSCR: | 1.81x | ||
| U/W NOI Debt Yield: | 11.3% |
“Direct Insurance Pay Tenant” means any tenant that has the right or the obligation pursuant to its lease to maintain all or a portion of the insurance for the applicable ExchangeRight Property and to pay insurance premiums directly to the applicable insurance company and is actually exercising such right or complying with such obligation, as applicable. The ExchangeRight Net Leased Portfolio #69 Mortgage Loan documents provide that the initial such Direct Insurance Pay Tenants (which maintain property and terrorism insurance for the applicable property) are the tenants at the (i) Dollar General Plus – Benton Harbor, MI, (ii) Dollar General Plus – Farmington, NM, (iii) Kroger – Zionsville, IN, (iv) Tractor Supply Company – Mansfield, OH, (v) Tractor Supply Company – Moncks Corner, SC, and (vi) Tractor Supply Company – Tucson, AZ ExchangeRight Properties
Required Repairs – The ExchangeRight Net Leased Portfolio #69 Mortgage Loan documents provide for an upfront deposit of $3,780 into a reserve for required repairs.
Replacement Reserve – The ExchangeRight Net Leased Portfolio #69 Mortgage Loan documents provide for an upfront deposit of $20,330 into a reserve for approved capital expenses. In addition, if a Cash Management Period (as defined below) is continuing, the borrower will be required to make or cause to be made monthly deposits into such reserve in an amount equal to 1/12th of the product obtained by multiplying $0.15 by the aggregate number of rentable square feet of space at the ExchangeRight Properties (initially, approximately $1,722 per month); provided that no deposit will be required to be made with respect to the aggregate number of rentable square feet at the ExchangeRight Properties for which tenants are obligated under their applicable leases to pay capital expenses for their respective premises; in each case, to the extent the Direct Pay Conditions are satisfied. The ExchangeRight Net Leased Portfolio #69 Mortgage Loan documents provide that the initial such tenants are the tenants at the (i) Dollar General Plus – Benton Harbor, MI, Dollar General Plus – Farmington, NM and Kroger-Zionsville, IN ExchangeRight Properties.
TI/LC Reserve – The ExchangeRight Net Leased Portfolio #69 Mortgage Loan documents provide for an upfront reserve of $500,000 for tenant improvements and leasing commissions. During a Cash Management Period, the borrower will be required to deposit monthly an amount equal to 1/12th of the product obtained by multiplying $0.70 by the aggregate rentable square feet of space at the ExchangeRight Properties (initially approximately $13,078 per month) for tenant improvements and leasing commissions.
Lockbox and Cash Management. The ExchangeRight Net Leased Portfolio #69 Mortgage Loan is structured with a hard lockbox and springing cash management. The borrower is required to (or to cause the ExchangeRight Net Leased Portfolio #69 Master Tenant or property manager to) cause all rents relating to the ExchangeRight Properties to be transmitted directly by the tenants into the lockbox account and, to the extent that such rents are received by the borrower (or ExchangeRight Net Leased Portfolio #69 Master Tenant or property manager), cause such amounts to be deposited into the lockbox account within two business days of receipt. The lockbox account bank is required to sweep such funds into the ExchangeRight Net Leased Portfolio #69 Master Tenant’s operating account on each business day other than during a Cash Management Period. During a Cash Management Period, funds in the lockbox account are required to be swept into a lender controlled cash management account, and provided no event of default is continuing, funds in the cash management account are required to be applied (i) to make the next monthly deposits (to the extent required) into the real estate taxes and insurance reserves as described above under “Escrows and Reserves”, (ii) to pay the next monthly debt service payment due on the ExchangeRight Net Leased Portfolio #69 Mortgage Loan, (iii) to make the next monthly deposits (to the extent required) into the capital expenses reserve and the rollover reserve as described above under “Escrows and Reserves”, (iv) to pay operating expenses set forth in the annual budget (which is required to be reasonably approved by the lender during a Cash Management Period) and, if a Cash Management Period exists solely as a result of a decline in the debt service coverage ratio, to pay additional operating expenses approved by the lender, and (v) to deposit any remainder into a cash collateral subaccount to be held as additional security for the ExchangeRight Net Leased Portfolio #69 Mortgage Loan during such Cash Management Period. Upon cessation of a Cash Management Period, all available amounts on deposit in the cash collateral account must be released to the borrower or ExchangeRight Net Leased Portfolio #69 Master Tenant.
A “Cash Management Period" means a period: (i) commencing upon a default or an event of default under the ExchangeRight Net Leased Portfolio #69 Mortgage Loan and ending when such default or event of default has been cured or waived in writing by the lender, or (ii) commencing when the debt service coverage ratio (based on net operating income for the trailing 12 months) as of the end of any calendar quarter is less than 1.50x and ending when the debt service coverage ratio (based on net operating income for the trailing 12 months) is at least 1.50x as of the end of each of two consecutive calendar quarters, or (iii) commencing on the payment date that occurs in November 2029, unless a Qualified Transfer (as defined below) has occurred as of such date, and ending when a Qualified Transfer occurs.
Partial Release. On any payment date after the expiration of the defeasance lockout period, the borrower has the right to obtain the release of any individual ExchangeRight Property in connection with a bona fide third party sale of such ExchangeRight Property, upon defeasance of a release price equal to the greater of (x) 115% of the allocated loan amount of such ExchangeRight Property and (y) 90% of the net sales proceeds of such ExchangeRight Property, and satisfaction of the following conditions, among others: (i) after giving effect to such release, the debt service coverage ratio of the remaining ExchangeRight Properties is not less than the greater of the debt service coverage ratio immediately preceding the release and 1.81x, (ii) after giving effect to such release, the debt yield of the remaining ExchangeRight Properties is not less than the greater of the debt yield immediately preceding the release and 11.0%, and (iii) satisfaction of REMIC related conditions.
Right of First Refusal. The related single tenant at each of the following ExchangeRight Properties has a right of first refusal (“ROFR”) to purchase the related ExchangeRight Property: (i) Tractor Supply – Tucson, AZ, (ii) Tractor Supply – Moncks Corner, SC and (iii) Tractor Supply – Mansfield, OH. With respect to each such lease, the related tenant entered into a subordination non-disturbance and attornment agreement (“SNDA”) pursuant to which it agreed its ROFR would be subordinate to the related mortgage; however such SNDAs do not provide that such right would not apply upon a foreclosure or deed-in-lieu thereof.
Terrorism Insurance. The borrower is required to obtain and maintain an “all risk” property insurance policy that covers terrorist acts in an amount equal to the “full replacement cost” of the ExchangeRight Properties together with 18 months of business income insurance, plus a 365-day extended period of indemnity, provided that such coverage is available. If such coverage is not available from a carrier which satisfies the ratings requirements in the loan documents, the borrower is required to obtain such coverage from the highest rated insurance company providing such coverage. See “Risk Factors—Risks Relating to the Mortgage Loans—Terrorism Insurance May Not Be Available for All Mortgaged Properties” in the prospectus.
| THE INFORMATION IN THIS STRUCTURAL AND COLLATERAL TERM SHEET IS NOT COMPLETE AND MAY BE AMENDED PRIOR TO THE TIME OF SALE. THIS TERM SHEET IS NOT AN OFFER TO SELL THESE SECURITIES AND IT IS NOT A SOLICITATION OF AN OFFER TO BUY THESE SECURITIES IN ANY JURISDICTION WHERE THE OFFER OR SALE IS NOT PERMITTED. | ||
| T-105 | ||
| Hospitality – Full Service | Loan #10 | Cut-off Date Balance: | $28,750,000 | |
| 108-10 Rockaway Beach Drive | Rockaway Hotel and Spa | Cut-off Date LTV: | 55.3% | |
| Rockaway Park, NY 11694 | UW NCF DSCR: | 1.44x | ||
| UW NOI Debt Yield: | 13.3% |
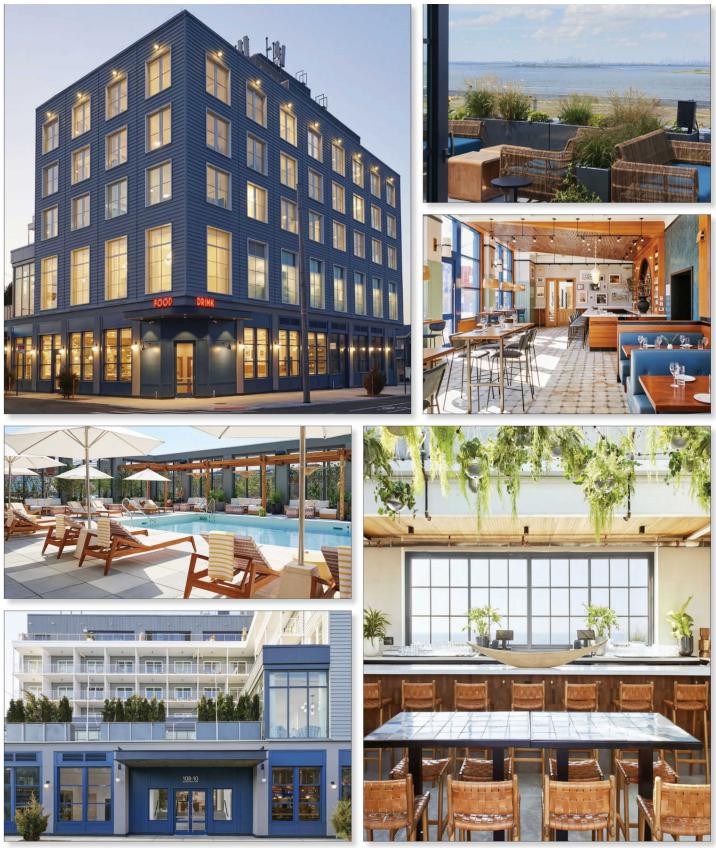
| THE INFORMATION IN THIS STRUCTURAL AND COLLATERAL TERM SHEET IS NOT COMPLETE AND MAY BE AMENDED PRIOR TO THE TIME OF SALE. THIS TERM SHEET IS NOT AN OFFER TO SELL THESE SECURITIES AND IT IS NOT A SOLICITATION OF AN OFFER TO BUY THESE SECURITIES IN ANY JURISDICTION WHERE THE OFFER OR SALE IS NOT PERMITTED. | ||
| T-106 | ||
| Hospitality – Full Service | Loan #10 | Cut-off Date Balance: | $28,750,000 | |
| 108-10 Rockaway Beach Drive | Rockaway Hotel and Spa | Cut-off Date LTV: | 55.3% | |
| Rockaway Park, NY 11694 | UW NCF DSCR: | 1.44x | ||
| UW NOI Debt Yield: | 13.3% |
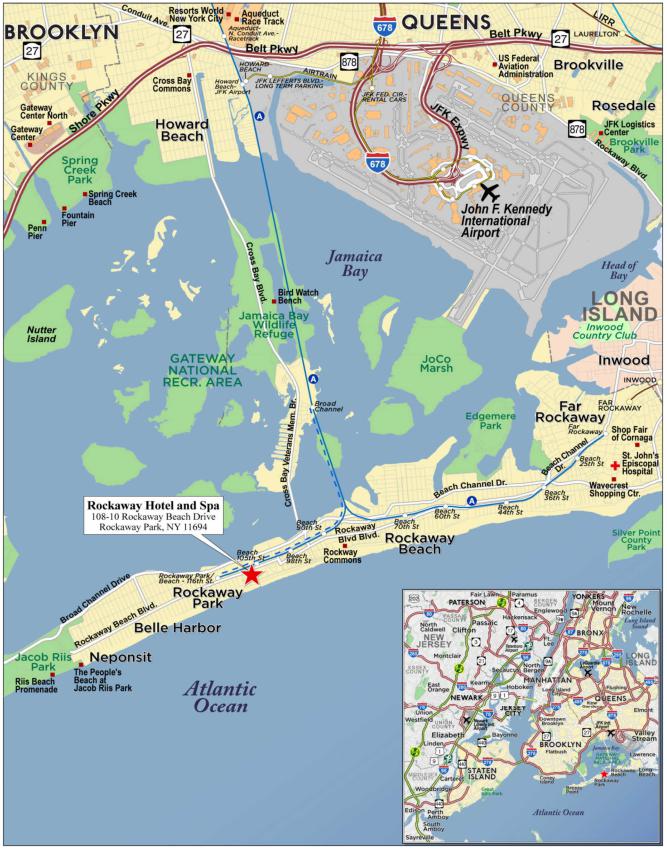
| THE INFORMATION IN THIS STRUCTURAL AND COLLATERAL TERM SHEET IS NOT COMPLETE AND MAY BE AMENDED PRIOR TO THE TIME OF SALE. THIS TERM SHEET IS NOT AN OFFER TO SELL THESE SECURITIES AND IT IS NOT A SOLICITATION OF AN OFFER TO BUY THESE SECURITIES IN ANY JURISDICTION WHERE THE OFFER OR SALE IS NOT PERMITTED. | ||
| T-107 | ||
| Mortgage Loan No. 10 – Rockaway Hotel and Spa |
| Mortgage Loan Information | Property Information | ||||||
| Mortgage Loan Seller: | MSMCH | Single Asset/Portfolio: | Single Asset | ||||
| Credit Assessment (Fitch/Moody’s/KBRA): | NR/NR/NR | Location: | Rockaway Park, NY 11694 | ||||
| Original Balance: | $28,750,000 | General Property Type: | Hospitality | ||||
| Cut-off Date Balance: | $28,750,000 | Detailed Property Type: | Full Service | ||||
| % of Initial Pool Balance: | 3.9% | Title Vesting: | Fee | ||||
| Loan Purpose: | Refinance | Year Built/Renovated: | 2020/NAP | ||||
| Borrower Sponsors: | Jeff Brosi, Daniel Tubridy, Samuel | Size: | 61 Rooms | ||||
| Provisero, Ben Igoe, Leland Hensch | Cut-off Date Balance Per Room: | $471,311 | |||||
| and Jonathan Krasner | Maturity Date Balance Per Room: | $471,311 | |||||
| Guarantors: | Jeff Brosi, Daniel Tubridy, Samuel | Property Manager: | IGC Hotel LLC | ||||
| Provisero, Ben Igoe, Leland Hensch | |||||||
| and Jonathan Krasner | |||||||
| Mortgage Rate: | 7.47500% | ||||||
| Note Date: | 12/23/2024 | Underwriting and Financial Information | |||||
| Maturity Date: | 1/1/2030 | UW NOI: | $3,815,422 | ||||
| Term to Maturity: | 60 months | UW NCF: | $3,136,519 | ||||
| Amortization Term: | 0 months | UW NOI Debt Yield: | 13.3% | ||||
| IO Period: | 60 months | UW NCF Debt Yield: | 10.9% | ||||
| Seasoning: | 1 month | UW NOI Debt Yield at Maturity: | 13.3% | ||||
| Prepayment Provisions: | L(25),D(31),O(4) | UW NCF DSCR: | 1.44x | ||||
| Lockbox/Cash Mgmt Status: | Hard/Springing | Most Recent NOI: | $4,515,863 (TTM 10/31/2024) | ||||
| Additional Debt Type: | NAP | 2nd Most Recent NOI: | $4,518,377 (12/31/2023) | ||||
| Additional Debt Balance: | NAP | 3rd Most Recent NOI: | $3,246,904 (12/31/2022) | ||||
| Future Debt Permitted (Type): | No (NAP) | Most Recent Occupancy: | 78.4% (10/31/2024) | ||||
| Reserves | 2nd Most Recent Occupancy: | 73.2% (12/31/2023) | |||||
| Type | Initial | Monthly | Cap | 3rd Most Recent Occupancy: | 65.5% (12/31/2022) | ||
| RE Taxes: | $0 | $25,820 | NAP | Appraised Value (as of): | $52,000,000 (10/4/2024) | ||
| Insurance: | $0 | $50,173 | NAP | Appraised Value Per Room: | $852,459 | ||
| FF&E Reserve: | $0 | (1) | NAP | Cut-off Date LTV Ratio: | 55.3% | ||
| Seasonality Reserve: | $230,000 | Springing | NAP | Maturity Date LTV Ratio: | 55.3% | ||
| Condominium Reserve: | $0 | Springing | NAP | ||||
| Sources and Uses | ||||||
| Sources | Proceeds | % of Total | Uses | Proceeds | % of Total | |
| Mortgage Loan Amount: | $28,750,000 | 96.5% | Loan Payoff: | $28,164,410 | 94.5% | |
| Borrower Sponsor Equity: | $1,056,109 | 3.5% | Closing Costs: | $1,411,699 | 4.7% | |
| Reserves: | $230,000 | 0.8% | ||||
| Total Sources: | $29,806,109 | 100.0% | Total Uses: | $29,806,109 | 100.0% | |
| (1) | The greater of (i) 56,575.29 or (ii) the amount of the deposit required by the franchisor on account of FF&E under the franchise agreement (if any). |
The Mortgage Loan. The tenth largest mortgage loan (the “Rockaway Hotel and Spa Mortgage Loan”) is evidenced by a promissory note in the original principal amount of $28,750,000. The Rockaway Hotel and Spa Mortgage Loan is secured by a first priority fee mortgage encumbering a hospitality property located in Rockaway Park, New York (the “Rockaway Hotel and Spa Property”).
The Borrower and the Borrower Sponsors. The borrowing entity for the Rockaway Hotel and Spa Mortgage Loan is Rockaway Hotel Owner LLC, a Delaware limited liability company and single purpose entity with one independent director. The borrower sponsors and non-recourse carveout guarantors are Jeff Brosi, Daniel Tubridy, Samuel Provisero, Ben Igoe, Leland Hensch and Jonathan Krasner. The borrowing entity, Rockaway Hotel Owner LLC, is wholly owned by Rock Away Team LLC, which in turn is wholly owned by Rockaway Beach Hotel LLC, both of which are managed by a board of six individuals, all of whom are the non-recourse carve-out guarantors.
The Property. The Rockaway Hotel and Spa Property is a 5-story, 61-room, unflagged independent full-service hospitality property built in 2020. The Rockaway Hotel and Spa Property offers amenities including a restaurant, a rooftop bar, approximately 9,040 SF of indoor and outdoor meeting space, a spa, a supply shop, a coffee shop, an outdoor swimming pool and bar area, house bicycles, and surfboard storage. The Rockaway Hotel and Spa Property offers 53 traditional hotel rooms in addition to 8 bungalow rooms which are configured similarly to apartment units. The bungalow rooms include a separate sitting room and a kitchenette and can be rented on a transient basis or for longer stays. According to the appraisal, the transient commercial segment accounted for 34% of the Rockaway Hotel and Spa Property’s occupancy and transient leisure accounted for 37%, with 25% from the group segment and 4% extended stay.
| THE INFORMATION IN THIS STRUCTURAL AND COLLATERAL TERM SHEET IS NOT COMPLETE AND MAY BE AMENDED PRIOR TO THE TIME OF SALE. THIS TERM SHEET IS NOT AN OFFER TO SELL THESE SECURITIES AND IT IS NOT A SOLICITATION OF AN OFFER TO BUY THESE SECURITIES IN ANY JURISDICTION WHERE THE OFFER OR SALE IS NOT PERMITTED. | ||
| T-108 | ||
| Hospitality – Full Service | Loan #10 | Cut-off Date Balance: | $28,750,000 | |
| 108-10 Rockaway Beach Drive | Rockaway Hotel and Spa | Cut-off Date LTV: | 55.3% | |
| Rockaway Park, NY 11694 | UW NCF DSCR: | 1.44x | ||
| UW NOI Debt Yield: | 13.3% |
The Rockaway Hotel and Spa Property consists of two condominium units comprising two tax lots. Lot 1001, comprising the hotel unit, includes the hotel guest rooms, common areas, restaurants, bars, pool and other amenities, and Lot 1002 comprises the residential unit and includes the eight residential units which are rented out as the bungalow hotel rooms, and are entitled to use the amenities in the hotel unit. Each of the hotel unit and the residential unit are subject to separate license and management agreements with affiliates of the borrower. The borrower owns 100% of the condominium regime including both the hotel unit and the residential unit and all appurtenant common areas. Lot 1001 comprising the hotel unit benefits from a 15-year New York City Industrial and Commercial Abatement Program (“ICAP”) abatement. The abatement is currently in its fourth year and extends through the 2035/36 tax year. The ICAP provides a 100% abatement through the 2031/2032 fiscal year and then declines by 20% a year thereafter. The appraisal estimates real estate taxes for the 2024/2025 fiscal year to be $777,516 without the abatement and estimates the net present value of the abatement to be $4,000,000. The Rockaway Hotel and Spa Mortgage Loan was underwritten based on the abated taxes, as set forth in the tax invoices for 2024, of $287,121.
All valet and employee parking for the Rockaway Hotel and Spa Property is provided pursuant to a license agreement from a nearby parking lot. The license agreement provides for rent of $15,000 per month plus real estate taxes allocable to the parking lot, expires March 31, 2026, and may be terminated by either party upon 90 days’ notice, provided that the termination date may not fall between May 1 and October 31 of any year. It is an event of default under the Rockaway Hotel and Spa Mortgage Loan if the license agreement expires without a replacement being obtained.
The following table presents certain information relating to the performance of the Rockaway Hotel and Spa Property:
| Historical Occupancy, ADR, RevPAR | |||||||||
| Rockaway Hotel and Spa(1) | Competitive Set(2) | Penetration Factor | |||||||
| Year | Occupancy | ADR | RevPAR | Occupancy | ADR | RevPAR | Occupancy | ADR | RevPAR |
| 2021 | 62.9% | $296.85 | $186.82 | 59.7% | $324.74 | $193.95 | 105.4% | 91.4% | 96.3% |
| 2022 | 65.5% | $329.42 | $215.77 | 58.7% | $348.40 | $204.67 | 111.5% | 94.6% | 105.4% |
| 2023 | 73.2% | $349.20 | $255.73 | 61.0% | $327.52 | $199.79 | 120.0% | 106.6% | 128.0% |
| TTM Oct. 2024 | 78.4% | $318.60 | $249.79 | 58.8% | $340.42 | $200.32 | 133.2% | 93.6% | 124.7% |
| (1) | Occupancy, ADR and RevPAR for the Rockaway Hotel and Spa Property are based on historical financial information provided by the borrower sponsor. |
| (2) | Occupancy, ADR and RevPAR for the Competitive Set are based on data provided by a third-party hospitality research report. The Competitive Set includes the Sound View Greenport, Allegria Hotel, The Asbury Hotel and Wave Resort & Spa. |
The Market. The Rockaway Hotel and Spa Property is located in Rockaway Park, New York within Queens County. The neighborhood surrounding the Rockaway Hotel and Spa Property is characterized by its coastal environment and proximity to the Atlantic Ocean, offering residents and visitors access to Rockaway Beach, a popular destination for swimming, surfing, and other water activities. The area features a blend of residential buildings and local businesses, providing essentials to both permanent residents and seasonal visitors. It is well connected by various public transportation options, including the A train, which links Rockaway Park to other parts of New York City, alongside bus routes that facilitate movement within the peninsula. Additionally, the neighborhood is approximately a 20-minute drive from John F. Kennedy International Airport, making it conveniently accessible for both domestic and international travelers. The area also benefits from open green spaces like the Rockaway Beach Boardwalk and nearby parks.
The following table presents certain information relating to the primary hotel competition for the Rockaway Hotel and Spa Property from the appraisal:
| Appraisal Primary Competitive Set | ||||||
| Property | Location | Year Opened | Number of Rooms | Occupancy | ADR | RevPAR |
| Rockaway Hotel and Spa(1) | Rockaway Park, NY | 2020 | 61 | 73.2% | $349.20 | $255.73 |
| Sound View Greenport | Greenport, NY | 1952 | 65 | 50% - 55% | $355 - $360 | $175 - $180 |
| Allegria Hotel | Long Beach, NY | 2009 | 156 | 60% - 65% | $330 - $335 | $200 - $205 |
| The Asbury Hotel | Asbury Park, NJ | 2016 | 110 | 65% - 70% | $300 - $305 | $195 - $200 |
| Wave Resort & Spa | Long Branch, NJ | 2019 | 67 | 65% - 70% | $345 - $350 | $225 - $230 |
Source: Appraisal unless otherwise noted. Occupancy, ADR and RevPAR are based on estimated 2023 values.
| (1) | Rockaway Hotel and Spa Property information is based on financial information provided by the borrower sponsor for 2023. |
Appraisal. The appraisal concluded to an “As-is” appraised value for the Rockaway Hotel and Spa Property of $52,000,000 as of October 4, 2024.
Environmental Matters. According to the Phase I environmental site assessment dated November 12, 2024, there was no evidence of any recognized environmental conditions at the Rockaway Hotel and Spa Property.
| THE INFORMATION IN THIS STRUCTURAL AND COLLATERAL TERM SHEET IS NOT COMPLETE AND MAY BE AMENDED PRIOR TO THE TIME OF SALE. THIS TERM SHEET IS NOT AN OFFER TO SELL THESE SECURITIES AND IT IS NOT A SOLICITATION OF AN OFFER TO BUY THESE SECURITIES IN ANY JURISDICTION WHERE THE OFFER OR SALE IS NOT PERMITTED. | ||
| T-109 | ||
| Hospitality – Full Service | Loan #10 | Cut-off Date Balance: | $28,750,000 | |
| 108-10 Rockaway Beach Drive | Rockaway Hotel and Spa | Cut-off Date LTV: | 55.3% | |
| Rockaway Park, NY 11694 | UW NCF DSCR: | 1.44x | ||
| UW NOI Debt Yield: | 13.3% |
Operating History and Underwritten Net Cash Flow. The following table presents certain information relating to the historical operating performance and the Underwritten Net Cash Flow at the Rockaway Hotel and Spa Property:
| Operating History and Underwritten Net Cash Flow | ||||||
| 2021 | 2022 | 2023 | TTM 10/31/2024 | Underwritten | Per Room | |
| Occupancy(1) | 62.9% | 65.5% | 73.2% | 78.4% | 78.4% | |
| ADR(1) | $296.85 | $329.42 | $349.20 | $318.60 | $318.60 | |
| RevPAR(1) | $186.82 | $215.77 | $255.73 | $249.79 | $249.79 | |
| Room Revenue | $4,159,509 | $4,804,184 | $5,693,738 | $5,576,742 | $5,561,505 | $91,172 |
| Food and Beverage Revenue | $7,431,645 | $9,624,034 | $9,475,011 | $9,560,876 | $9,534,753 | $156,307 |
| Misc Income | $413,817 | $457,225 | $572,222 | $582,995 | $581,402 | $9,531 |
| Other Departmental Revenue | $261,580 | $861,820 | $1,159,879 | $1,298,473 | $1,294,925 | $21,228 |
| Total Revenue | $12,266,551 | $15,747,263 | $16,900,850 | $17,019,086 | $16,972,585 | $278,239 |
| Room Expense | $1,058,881 | $1,321,962 | $1,417,622 | $1,351,914 | $1,348,220 | $22,102 |
| Food and Beverage Expense | $5,744,049 | $7,710,939 | $7,434,680 | $7,509,463 | $7,488,945 | $122,770 |
| Real Estate Taxes(2) | $0 | $90,366 | $92,004 | $92,432 | $287,121 | $4,707 |
| Property Insurance | $92,133 | $383,287 | $125,851 | $174,942 | $602,077 | $9,870 |
| Other Expenses | $2,047,298 | $2,993,805 | $3,312,316 | $3,374,472 | $3,430,800 | $56,243 |
| Total Expenses | $8,942,361 | $12,500,359 | $12,382,473 | $12,503,223 | $13,157,163 | $215,691 |
| Net Operating Income | $3,324,190 | $3,246,904 | $4,518,377 | $4,515,863 | $3,815,422 | $62,548 |
| FF&E | $0 | $122,465 | $148,517 | $149,164 | $678,903 | $11,130 |
| Net Cash Flow | $3,324,190 | $3,124,439 | $4,369,860 | $4,366,699 | $3,136,519 | $51,418 |
| NOI DSCR | 1.53x | 1.49x | 2.07x | 2.07x | 1.75x | |
| NCF DSCR | 1.53x | 1.43x | 2.01x | 2.00x | 1.44x | |
| NOI Debt Yield | 11.6% | 11.3% | 15.7% | 15.7% | 13.3% | |
| NCF Debt Yield | 11.6% | 10.9% | 15.2% | 15.2% | 10.9% | |
| (1) | The variances between the underwriting, the appraisal and the industry report data with respect to Occupancy, ADR and RevPAR at the Rockaway Hotel and Spa Property are attributable to variances in reporting methodologies and/or timing differences. |
| (2) | Real estate taxes were underwritten based on the ICAP abatement for the hotel unit. |
Escrows and Reserves.
Seasonality – The Rockaway Hotel and Spa Mortgage Loan documents provide for an upfront reserve of $230,000 and monthly deposits of $160,000 in June, July and August of each year, for the purpose of funding debt service payments during seasonal periods when operating income may be insufficient for such purpose.
Tax – The Rockaway Hotel and Spa Mortgage Loan documents provide for ongoing monthly reserves equal to 1/12th of the taxes the lender estimates will be payable during the next twelve months (initially estimated to be $25,820).
Insurance – The Rockaway Hotel and Spa Mortgage Loan documents provide for ongoing monthly reserves equal to 1/12th of the insurance premiums that the lender estimates will be payable for the renewal of the insurance coverage (initially estimated to be $50,173). Notwithstanding the foregoing, the borrower will not be required to make monthly deposits into the insurance fund if (i) no event of default is continuing under the Rockaway Hotel and Spa Mortgage Loan, (ii) the liability and casualty insurance coverage for the Rockaway Hotel and Spa Property is included in a blanket or umbrella policy approved by the lender in its reasonable discretion, and (iii) the borrower provides the lender with certificates of insurance for such policies and paid receipts for insurance premiums no later than 10 days prior to the expiration dates of the policies.
FF&E – The Rockaway Hotel and Spa Mortgage Loan documents provide for ongoing monthly reserves for furniture, fixtures and equipment (“FF&E”) in an amount equal to the greater of (A) approximately $56,575 and (B) the amount of the deposit (if any) required by the franchisor under the franchise agreement (if any) for FF&E. The Rockaway Hotel and Spa Property is not currently affiliated with a franchise.
Condominium Reserve Funds – If during any period the condominium board is authorized to, and does, collect condominium assessments, the Rockaway Hotel and Spa Mortgage Loan documents require a minimum balance to be maintained in a reserve for the payment of condominium assessments. Such minimum balance is an amount equal to 1/12th of the annual condominium common charges payable or estimated by the lender to be payable by the borrower in respect of the Rockaway Hotel and Spa Property.
| THE INFORMATION IN THIS STRUCTURAL AND COLLATERAL TERM SHEET IS NOT COMPLETE AND MAY BE AMENDED PRIOR TO THE TIME OF SALE. THIS TERM SHEET IS NOT AN OFFER TO SELL THESE SECURITIES AND IT IS NOT A SOLICITATION OF AN OFFER TO BUY THESE SECURITIES IN ANY JURISDICTION WHERE THE OFFER OR SALE IS NOT PERMITTED. | ||
| T-110 | ||
| Hospitality – Full Service | Loan #10 | Cut-off Date Balance: | $28,750,000 | |
| 108-10 Rockaway Beach Drive | Rockaway Hotel and Spa | Cut-off Date LTV: | 55.3% | |
| Rockaway Park, NY 11694 | UW NCF DSCR: | 1.44x | ||
| UW NOI Debt Yield: | 13.3% |
Lockbox and Cash Management. The Rockaway Hotel and Spa Mortgage Loan is structured with a hard lockbox and springing cash management. At origination, the borrower was required to establish a lender-controlled deposit account, and to direct each tenant under each lease, and each of the credit card banks and credit card companies with which the borrower has entered into agreements for clearance of credit card receipts or merchants agreements, to deposit all payments due or credit card receipts with respect to the Rockaway Hotel and Spa Property into the deposit account. If, notwithstanding the foregoing direction, the borrower or property manager receives any rents or revenues from the Rockaway Hotel and Spa Property, they are required to deposit such amounts into the deposit account within one business day of receipt. In addition, upon the occurrence of a Trigger Period (as defined below) the lender is required to establish, and the borrower is required to cooperate to establish, a lender-controlled cash management account, into which all funds on deposit in the lockbox account will be required to be transferred, and applied, provided no event of default is continuing under the Rockaway Hotel and Spa Mortgage Loan, (i) to fund the required tax and insurance reserve deposits, if any, as described above under “Escrows and Reserves,” (ii) to fund the payment of debt service on the Rockaway Hotel and Spa Mortgage Loan, (iii) to fund the required monthly deposits into the FF&E reserve and the seasonality reserve, if applicable, as described above under “Escrows and Reserves,” (iv) to pay operating expenses set forth in the lender-approved annual budget and lender-approved extraordinary expenses, and (v) to deposit all remaining amounts in the cash management account into an excess cash flow account to be held as additional collateral for the Rockaway Hotel and Spa Mortgage Loan during the continuance of a Trigger Period.
A “Trigger Period” means a period:
| (A) | commencing upon the earliest of: |
| (i) | the occurrence and continuance of an event of default under the Rockaway Hotel and Spa Mortgage Loan; |
| (ii) | the debt service coverage ratio being less than 1.40x at the end of any calendar quarter (such event, a “DSCR Trigger Event”); |
| (iii) | at any time a franchise agreement is in place (which is not currently the case), the occurrence of a franchise agreement trigger period; |
| (iv) | at any time a franchise agreement is in place, the occurrence of a franchise renewal trigger event; |
| (v) | the occurrence of a bankruptcy event with respect to any person acting as manager under any management agreement relating to the Rockaway Hotel and Spa Property; and/or |
| (vi) | the occurrence of a bankruptcy event with respect to Licensee (as defined below). |
and (B) expiring upon:
| (i) | regarding any Trigger Period commenced in connection with clause (A)(i) above, the cure (if applicable) of such event of default; |
| (ii) | regarding any DSCR Trigger Event, the date that the debt service coverage ratio is equal to or greater than 1.40x for two consecutive calendar quarters; |
| (iii) | regarding any Trigger Period commenced in connection with clause (A)(iii) above, such franchise agreement trigger period ceasing to exist; |
| (iv) | regarding any Trigger Period commenced in connection with clause (A)(iv) above, the occurrence of a franchise renewal event; |
| (v) | regarding any Trigger Period commenced in connection with clause (A)(v) above, the borrower’s replacement of the applicable manager with a new manager is that is a qualified manager engaged pursuant to a qualified management agreement; and |
| (vi) | regarding any Trigger Period commenced in connection with clause (A)(vi) above, either the borrower’s termination of the License Agreement (as defined below) or the borrower’s replacement of the applicable Licensee. |
“License Agreement” means, individually or collectively, one or both of two license agreements entered into between the borrower, as licensor, and RBH Rest LLC or RBH Hotel LLC, respectively, as licensee.
“Licensee” means either of RBH Rest LLC and RBH Hotel LLC, both of which are affiliates of the borrower.
Terrorism Insurance. The Rockaway Hotel and Spa Mortgage Loan documents require that the borrowers maintain comprehensive “all risk” or “special form” insurance in an amount equal to 100% of full replacement cost and 12 months of business income/loss of rents insurance with an extended period of indemnity of up to six months, which includes coverage for acts of terrorism. If “acts of terrorism” or other similar acts or events or “fire following” such acts or events are excluded from such policies, the borrower is required to obtain an endorsement to such policy or policies, or a separate policy, insuring against all such excluded acts or events and “fire following” in the amounts set forth above. Notwithstanding the foregoing, for so long as the Terrorism Risk Insurance Act of 2002, as extended and modified by the Terrorism Risk Insurance Program Reauthorization Act of 2015 (“TRIPRA”) (including any extensions thereof or if another federal governmental program is in effect relating to “acts of terrorism” which provides substantially similar protections as TRIPRA) is in effect, and continues to cover both domestic and foreign acts of terrorism, the lender is required to accept terrorism insurance which covers against “covered acts” as defined by TRIPRA (or such other program). See “Risk Factors—Risks Relating to the Mortgage Loans—Terrorism Insurance May Not Be Available for All Mortgaged Properties” in the prospectus.
| THE INFORMATION IN THIS STRUCTURAL AND COLLATERAL TERM SHEET IS NOT COMPLETE AND MAY BE AMENDED PRIOR TO THE TIME OF SALE. THIS TERM SHEET IS NOT AN OFFER TO SELL THESE SECURITIES AND IT IS NOT A SOLICITATION OF AN OFFER TO BUY THESE SECURITIES IN ANY JURISDICTION WHERE THE OFFER OR SALE IS NOT PERMITTED. | ||
| T-111 | ||
| Mortgage Loan No. 11 – Wechsler Multifamily Portfolio |
| Mortgage Loan Information | Property Information | ||||||
| Mortgage Loan Seller: | MSMCH | Single Asset/Portfolio: | Portfolio | ||||
| Credit Assessment (Fitch/Moody’s/KBRA): | NR/NR/NR | Location(3): | Various, IN | ||||
| Original Balance: | $28,500,000 | General Property Type: | Multifamily | ||||
| Cut-off Date Balance: | $28,500,000 | Detailed Property Type: | Garden | ||||
| % of Initial Pool Balance: | 3.9% | Title Vesting: | Fee | ||||
| Loan Purpose: | Refinance | Year Built/Renovated(3): | Various/Various | ||||
| Borrower Sponsor: | Moshe Wechsler | Size(3): | 365 Units | ||||
| Guarantor: | Moshe Wechsler | Cut-off Date Balance per Unit: | $78,082 | ||||
| Mortgage Rate: | 6.7500% | Maturity Date Balance per Unit: | $78,082 | ||||
| Note Date: | 11/27/2024 | Property Manager: | CYM Living LLC | ||||
| Maturity Date: | 12/1/2029 | (borrower-related) | |||||
| Term to Maturity: | 60 months | Underwriting and Financial Information | |||||
| Amortization Term: | 0 months | UW NOI: | $2,869,488 | ||||
| IO Period: | 60 months | UW NCF: | $2,772,842 | ||||
| Seasoning: | 2 months | UW NOI Debt Yield: | 10.1% | ||||
| Prepayment Provisions: | L(23),YM1(3),DorYM1(27),O(7) | UW NCF Debt Yield: | 9.7% | ||||
| Lockbox/Cash Mgmt Status: | Springing/Springing | UW NOI Debt Yield at Maturity: | 10.1% | ||||
| Additional Debt Type: | NAP | UW NCF DSCR: | 1.42x | ||||
| Additional Debt Balance: | NAP | Most Recent NOI: | $2,782,762 (8/31/2024 TTM) | ||||
| Future Debt Permitted (Type): | No (NAP) | 2nd Most Recent NOI: | $2,445,889 (12/31/2023) | ||||
| Reserves | 3rd Most Recent NOI(4): | NAV | |||||
| Type | Initial | Monthly | Cap | Most Recent Occupancy: | 95.9% (10/11/2024) | ||
| RE Taxes: | $38,170 | $19,085 | NAP | 2nd Most Recent Occupancy: | 93.5% (12/31/2023) | ||
| Insurance: | $88,438 | $12,634(1) | NAP | 3rd Most Recent Occupancy(4): | NAV | ||
| Deferred Maintenance: | $5,290 | $0 | NAP | Appraised Value (as of): | $45,900,000 (Various) | ||
| Replacement Reserve: | $0 | $8,060 | NAP | Appraised Value per Unit: | $125,753 | ||
| Radon Mitigation Reserve: | $60,375(2) | $0 | NAP | Cut-off Date LTV Ratio: | 62.1% | ||
| Maturity Date LTV Ratio: | 62.1% | ||||||
| Sources and Uses | ||||||
| Sources | Proceeds | % of Total | Uses | Proceeds | % of Total | |
| Mortgage Loan Amount: | $28,500,000 | 100.0% | Loan Payoff: | $27,011,590 | 94.8% | |
| Return of Equity: | $712,479 | 2.5% | ||||
| Closing Costs: | $583,658 | 2.0% | ||||
| Reserves: | $192,273 | 0.7% | ||||
| Total Sources: | $28,500,000 | 100.0% | Total Uses: | $28,500,000 | 100.0% | |
| (1) | Monthly insurance deposits are waived provided no event of default is continuing, the liability and casualty insurance policies are part of a blanket policy approved by the lender, and the borrower provides the lender with evidence of renewal of such policies and paid receipts for insurance premiums no later than 10 days prior to the expiration dates of the policies. |
| (2) | Environmental reserve is for radon testing and mitigation, if required. |
| (3) | See “Portfolio Summary” below. |
| (4) | Historical occupancy and NOI prior to 2023 are unavailable as the borrower sponsor acquired the Wechsler Multifamily Portfolio Properties (as defined below) in 2022. |
The Mortgage Loan. The eleventh largest mortgage loan (the “Wechsler Multifamily Portfolio Mortgage Loan”) is evidenced by a promissory note in the original principal amount of $28,500,000. The Wechsler Multifamily Portfolio Mortgage Loan is secured by a first priority fee mortgage encumbering six multifamily properties located across Indiana (the “Wechsler Multifamily Portfolio Properties”).
The Borrower and the Borrower Sponsors. The borrowers for the Wechsler Multifamily Portfolio Mortgage Loan are Indy Fort Wayne EOM LLC, Indy Hunters EOM LLC, Indy Deer EOM LLC, Indy Jefferson EOM LLC and Indy Elkhart EOM LLC, each a single-purpose Delaware limited liability company with two independent directors in its organizational structure. The borrower sponsor and non-recourse carveout guarantor for the Wechsler Multifamily Portfolio Mortgage Loan is Moshe Wechsler. Moshe Wechsler is the founder and Chief Executive Officer of Emerald Empire, a national real estate firm that buys, owns, and operates residential and commercial properties. Founded in 2013, Emerald Empire has acquired over 12,000 apartments across Massachusetts, New York, New Jersey, Georgia, Illinois, Indiana, Connecticut, and Missouri with a current portfolio of 10,000 units and 1.5 million SF of office and industrial space. In addition to Emerald Empire, Moshe Wechsler has founded several other ventures, including an aviation company, a property management firm, and construction companies operating in multiple states.
| THE INFORMATION IN THIS STRUCTURAL AND COLLATERAL TERM SHEET IS NOT COMPLETE AND MAY BE AMENDED PRIOR TO THE TIME OF SALE. THIS TERM SHEET IS NOT AN OFFER TO SELL THESE SECURITIES AND IT IS NOT A SOLICITATION OF AN OFFER TO BUY THESE SECURITIES IN ANY JURISDICTION WHERE THE OFFER OR SALE IS NOT PERMITTED. | ||
| T-112 | ||
| Multifamily – Garden | Loan #11 | Cut-off Date Balance: | $28,500,000 | |
| Various | Wechsler Multifamily Portfolio | Cut-off Date LTV: | 62.1% | |
| Various, IN Various | U/W NCF DSCR: | 1.42x | ||
| U/W NOI Debt Yield: | 10.1% |
The Property. The Wechsler Multifamily Portfolio Properties are comprised of six garden style multifamily properties totaling 365 units located in Indiana, clustered around Elkhart and Fort Wayne. The Wechsler Multifamily Portfolio Properties were built between 1984 and 2003, and were acquired by the borrower sponsor in 2022 as part of two separate transactions for an aggregate purchase price of $38.1 million. Since acquiring the portfolio in 2022, the borrower sponsor has invested approximately $837,000 in capital expenditures on roof replacements, heating, ventilation, and air conditioning, common areas, and unit repairs, among other items. The Wechsler Multifamily Portfolio Properties are configured as one-, two-, and three-bedroom units. The average in-place monthly rent for the portfolio is $965. As of October 11, 2024, the Wechsler Multifamily Portfolio Properties were 95.9% occupied in the aggregate.
The following table presents detailed information with respect to the Wechsler Multifamily Portfolio Properties:
| Portfolio Summary | |||||||||
| Property Name | City, State(1) | Units(2) | Year Built / Renovated(1) | Occupancy(2) | Allocated Loan Cut-off Date Balance | % of Allocated Loan Cut-off Date Balance | Appraised Value(1) | UW NOI | % of UW NOI |
| Hunter's Pond Apartments | Elkhart, IN | 76 | 1987 / NAP | 96.1% | $8,258,200 | 29.0% | $12,300,000 | $801,751 | 27.9% |
| Woodwind Apartments | Elkhart, IN | 95 | 1984 / NAP | 93.7% | $7,637,300 | 26.8% | $13,300,000 | $826,901 | 28.8% |
| Crossings At Bellbrook Villas | Decatur, IN | 70 | 2003 / 2023 | 98.6% | $4,532,700 | 15.9% | $7,300,000 | $497,686 | 17.3% |
| Jefferson Place Villas | Ossian, IN | 48 | 2002 / NAP | 95.8% | $3,290,800 | 11.5% | $5,300,000 | $308,191 | 10.7% |
| Deer Creek Crossing | Garrett, IN | 46 | 1999 / 2024 | 97.8% | $2,856,200 | 10.0% | $4,600,000 | $280,597 | 9.8% |
| Country Squire Villas | Ossian, IN | 30 | 1987 / 2024 | 93.3% | $1,924,800 | 6.8% | $3,100,000 | $154,362 | 5.4% |
| Total/Wtd. Avg. | 365 | 95.9% | $28,500,000 | 100.0% | $45,900,000 | $2,869,488 | 100.0% | ||
| (1) | Information obtained from the appraisal. |
| (2) | Information is based on the borrower rent roll dated October 11, 2024. |
The following table presents detailed information with respect to the units at the Hunter’s Pond Apartments property:
| Apartment Unit Mix(1) | ||||||
| Unit Mix / Type | Total Units | Leased Units | % Leased | Average SF per Unit | Monthly Average Rent per Unit | Monthly Wtd. Average Rent PSF |
| 2 BR / 1.5 BA | 52 | 51 | 98.1% | 1,030 | $1,203 | $1.17 |
| 2 BR / 2 BA | 24 | 22 | 91.7% | 1,065 | $1,271 | $1.19 |
| Total/ Wtd. Average | 76 | 73 | 96.1% | 1,041 | $1,224 | $1.18 |
| (1) | Information is based on the borrower rent roll dated October 11, 2024. |
The following table presents detailed information with respect to the units at the Woodwind Apartments property:
| Apartment Unit Mix(1) | ||||||
| Unit Mix / Type | Total Units | Leased Units | % Leased | Average SF per Unit | Monthly Average Rent per Unit | Monthly Wtd. Average Rent PSF |
| 1 BR / 1 BA | 30 | 25 | 83.3% | 550 | $880 | $1.60 |
| 2 BR / 1 BA | 43 | 43 | 100.0% | 770 | $1,015 | $1.32 |
| 2 BR / 2 BA | 21 | 20 | 95.2% | 940 | $1,061 | $1.13 |
| 3 BD / 1.5 BA | 1 | 1 | 100.0% | 1020 | $1,170 | $1.15 |
| Total/ Wtd. Average | 95 | 89 | 93.7% | 741 | $984 | $1.33 |
| (1) | Information is based on the borrower rent roll dated October 11, 2024. |
The following table presents detailed information with respect to the units at the Crossings At Bellbrook Villas property:
| Apartment Unit Mix(1) | ||||||
| Unit Mix / Type | Total Units | Leased Units | % Leased | Average SF per Unit | Monthly Average Rent per Unit | Monthly Wtd. Average Rent PSF |
| 2 BR / 1 BA | 70 | 69 | 98.6% | 950 | $870 | $0.92 |
| Total/ Wtd. Average | 70 | 69 | 98.6% | 950 | $870 | $0.92 |
| (1) | Information is based on the borrower rent roll dated October 11, 2024. |
| THE INFORMATION IN THIS STRUCTURAL AND COLLATERAL TERM SHEET IS NOT COMPLETE AND MAY BE AMENDED PRIOR TO THE TIME OF SALE. THIS TERM SHEET IS NOT AN OFFER TO SELL THESE SECURITIES AND IT IS NOT A SOLICITATION OF AN OFFER TO BUY THESE SECURITIES IN ANY JURISDICTION WHERE THE OFFER OR SALE IS NOT PERMITTED. | ||
| T-113 | ||
| Multifamily – Garden | Loan #11 | Cut-off Date Balance: | $28,500,000 | |
| Various | Wechsler Multifamily Portfolio | Cut-off Date LTV: | 62.1% | |
| Various, IN Various | U/W NCF DSCR: | 1.42x | ||
| U/W NOI Debt Yield: | 10.1% |
The following table presents detailed information with respect to the units at the Jefferson Place Villas property:
| Apartment Unit Mix(1) | ||||||
| Unit Mix / Type | Total Units | Leased Units | % Leased | Average SF per Unit | Monthly Average Rent per Unit | Monthly Wtd. Average Rent PSF |
| 1 BR / 1 BA | 14 | 14 | 100.0% | 747 | $766 | $1.03 |
| 2 BR / 1 BA | 34 | 32 | 94.1% | 947 | $911 | $0.96 |
| Total/ Wtd. Average | 48 | 46 | 95.8% | 889 | $869 | $0.98 |
| (1) | Information is based on the borrower rent roll dated October 11, 2024. |
The following table presents detailed information with respect to the units at the Deer Creek Crossing property:
| Apartment Unit Mix(1) | ||||||
| Unit Mix / Type | Total Units | Leased Units | % Leased | Average SF per Unit | Monthly Average Rent per Unit | Monthly Wtd. Average Rent PSF |
| 1 BR / 1 BA | 14 | 14 | 100.0% | 767 | $795 | $1.04 |
| 2 BR / 1 BA | 32 | 31 | 96.9% | 969 | $890 | $0.92 |
| Total/ Wtd. Average | 46 | 45 | 97.8% | 908 | $861 | $0.95 |
| (1) | Information is based on the borrower rent roll dated October 11, 2024. |
The following table presents detailed information with respect to the units at the Country Squire Villas property:
| Apartment Unit Mix(1) | ||||||
| Unit Mix / Type | Total Units | Leased Units | % Leased | Average SF per Unit | Monthly Average Rent per Unit | Monthly Wtd. Average Rent PSF |
| 1 BR / 1 BA | 6 | 6 | 100.0% | 720 | $708 | $0.98 |
| 2 BR / 1 BA | 24 | 22 | 91.7% | 768 | $806 | $1.05 |
| Total/ Wtd. Average | 30 | 28 | 93.3% | 758 | $787 | $1.04 |
| (1) | Information is based on the borrower rent roll dated October 11, 2024. |
The Market. The Wechsler Multifamily Portfolio Properties are located in four cities across Indiana, in the Fort Wayne metropolitan apartment market and the Elkhart metropolitan apartment market.
The Hunters Pond Apartments and Woodwind Apartments properties are both located in Elkhart, Indiana, within the Elkhart metropolitan apartment market and within four miles of each other. According to the appraisal, as of the second quarter of 2024, the Elkhart metropolitan apartment market had an inventory of 5,761 units, a vacancy rate of 5.4%, and an average rent per unit of $1,046.
The Hunter’s Pond Apartments property is located in a suburban neighborhood two miles northeast of the Elkhart central business district. The property is approximately three miles south of Interstate 90 and the Elkhart Municipal Airport. There are numerous restaurants and stores in the immediate vicinity including a Martin’s Super Market and a Kroger grocery store. The Woodwind Apartments property is located in a suburban neighborhood two miles southeast of the Elkhart central business district. The property is adjacent to U.S. Route 20 which provides access throughout the region. Additionally, the property is approximately six miles south of Interstate 90 and the Elkhart Municipal Airport. There are numerous restaurants and stores in the immediate vicinity including a Martin’s Super Market. The main employers in the area include businesses in the transportation/warehousing, manufacturing, and wholesale/retail trade sectors. Norfolk Southern, a Class I freight railroad and a prominent transporter of coal, automotive, and industrial products, is one of the largest employers in the region. Other prominent employers include Always in Stone Monument Company, a designer and manufacturer of custom headstones and monuments and Keystone RV Company, a manufacturer of towable recreational vehicles.
According to the appraisal, the 2023 population within a one-, three-, and five-mile radius of the Hunter’s Pond Apartments property was 8,275, 50,270, and 91,277, respectively. According to the appraisal, the 2023 average household income within the same radii was $81,409, $72,952, and $76,049, respectively. According to the appraisal, the 2023 population within a one-, three, and five mile radius for the Woodwind Apartments property was 6,356, 63,064, and 94,672, respectively. According to the appraisal, the 2023 average household income within the same radii was $72,305, $70,694, and $76,851, respectively.
The Crossings At Bellbrook Villas, Jefferson Place Villas, Deer Creek Crossing and Country Squire Villas properties are all located within the Fort Wayne metropolitan apartment market. According to the appraisal, as of the second quarter of 2024, the Fort Wayne metropolitan apartment market had an inventory of 21,056 units, a vacancy rate of 3.0%, and an average rent per unit of $862.
The Crossings At Bellbrook Villas Property is located in Adams County, within the Fort Wayne, Indiana metropolitan statistical area. Crossings At Bellbrook Villas is located in a suburban cluster off of U.S. Route 224. The property is approximately one mile from a middle and high school. There is a variety of supporting retail within four miles including a Dollar General, Kroger, and Walmart. The top employers in Adams County are mostly within the
| THE INFORMATION IN THIS STRUCTURAL AND COLLATERAL TERM SHEET IS NOT COMPLETE AND MAY BE AMENDED PRIOR TO THE TIME OF SALE. THIS TERM SHEET IS NOT AN OFFER TO SELL THESE SECURITIES AND IT IS NOT A SOLICITATION OF AN OFFER TO BUY THESE SECURITIES IN ANY JURISDICTION WHERE THE OFFER OR SALE IS NOT PERMITTED. | ||
| T-114 | ||
| Multifamily – Garden | Loan #11 | Cut-off Date Balance: | $28,500,000 | |
| Various | Wechsler Multifamily Portfolio | Cut-off Date LTV: | 62.1% | |
| Various, IN Various | U/W NCF DSCR: | 1.42x | ||
| U/W NOI Debt Yield: | 10.1% |
manufacturing sector. One of the top employers in the area is Thunderbird Products, Inc, a marine manufacturing business that specializes in a wide variety of boating options for different types of sailing. Other prominent employers include Smith Brothers of Berne, Inc., an upholstery manufacturing business that creates furniture lineups as well as custom sofas and Goldshield Fiberglass, which manufactures molded fiberglass pieces for different products in the transportation, medical, agro-industrial and recreational industries. According to the appraisal, the 2023 population within a one-, three-, and five-mile radius for the Crossings At Bellbrook Villas property was 1,276, 11,825 and 14,932, respectively. According to the appraisal, the 2023 average household income within the same radii was $79,187, $59,096, and $62,924, respectively.
The Jefferson Place Villas and Country Squire Villas properties are located adjacent to one another, located in Wells County, within the Fort Wayne, Indiana metropolitan statistical area. Jefferson Place Villas and Country Squire Villas are located in a suburban cluster within a rural area located less than a half mile from State Route 1. Additionally, U.S. Route 224 is four miles south and Interstate 469 is six miles north of the properties. There is an elementary school and supporting retail including a Ginger Fresh Market grocery store located within two miles of the properties. Top employers in the region include businesses in the transportation/warehousing, healthcare/social assistance, and manufacturing sectors. Peyton’s Northern Distribution is one of the largest employers, offering transportation, logistics, supply chain, and storage services. Other prominent employers include Park Center, a mental health institution located in Bluffton, Indiana and Ti Fluid Systems, a multinational enterprise focused on the development, manufacturing, and supply of automotive fluid storage, carrying and delivery systems. According to the appraisal, the 2023 population within a one-, three-, and five-mile radius for the Jefferson Place Villas property was 2,589, 5195 and 7,738, respectively. According to the appraisal, the 2023 average household income within the same radii was $75,099, $80,189 and $82,063, respectively. According to the appraisal, the 2023 population within a one-, three-, and five-mile radius for the Country Squire Villas property was 3,170, 5,228 and 7,711, respectively. According to the appraisal, the 2023 average household income within the same radii was $76,200, $80,280 and $81,953, respectively.
The Deer Creek Crossing property is located in DeKalb County, within the Fort Wayne, Indiana metropolitan statistical area. Deer Creek Crossing is located in a suburban cluster near major arterials. The property is approximately one mile east of State Route 327, two miles south of State Route 8, and three miles west of Interstate 69 which provide connectivity to the greater area including Fort Wayne. The property is in close proximity to a kindergarten through high school and within five miles of a variety of supporting retail including a DG Market, a Walmart, a Kroger, and an Aldi. The top employers in DeKalb County are found in the manufacturing sector. One of the largest employers is Rieke Corp, which is headquartered in the city of Auburn and develops and manufactures closures and dispensing systems. Other prominent employers include Therma Tru, a manufacturer of entry and patio door system solutions, including decorative glass door lights, sidelights, transoms, and door components and Steel Dynamics, a steel producer based in Fort Wayne, which is the third largest producer of carbon steel products in the country. According to the appraisal, the 2023 population within a one-, three-, and five-mile radius for the Deer Creek Crossing property was 3,455, 10,720 and 24,505, respectively. According to the appraisal, the 2023 average household income within the same radii was $66,345, $63,302 and $74,986, respectively.
The following table presents certain information relating to the appraisals’ market rent conclusion for the Wechsler Multifamily Portfolio Properties:
| Market Rent Summary | |||||||
| Property Name | Unit Mix/Type | Units(1) | Average Size (SF) (1) | Avg. Monthly Rent per Unit(1) | Avg. Monthly Rent PSF(1) | Avg. Monthly Market Rent per Unit(2) | Avg. Monthly Market Rent PSF(2) |
| Hunter's Pond Apartments | 2 BR / 1.5 BA 2 BR / 2 BA | 52 24 | 1,030 1,065 | $1,203 $1,271 | $1.17 $1.19 | $1,225 $1,275 | $1.19 $1.20 |
| Woodwind Apartments | 1 BR / 1 BA 2 BR / 1 BA 2 BR / 2 BA 3 BD / 1.5 BA | 30 43 21 1 | 550 770 940 1,020 | $880 $1,015 $1,061 $1,170 | $1.60 $1.32 $1.13 $1.15 | $925 $1,025 $1,075 $1,400 | $1.68 $1.33 $1.14 $1.37 |
| Crossings At Bellbrook Villas | 2 BR / 1 BA | 70 | 950 | $870 | $0.92 | $890 | $0.94 |
| Jefferson Place Villas | 1 BR / 1 BA 2 BR / 1 BA | 14 34 | 747 947 | $766 $911 | $1.03 $0.96 | $825 $925 | $1.10 $0.98 |
| Deer Creek Crossing | 1 BR / BA 2 BR / 1 BA | 14 32 | 767 969 | $795 $890 | $1.04 $0.92 | $840 $900 | $1.10 $0.93 |
| Country Squire Villas | 1 BR / 1 BA 2 BR / 1 BA | 6 24 | 720 768 | $708 $806 | $0.98 $1.05 | $750 $900 | $1.04 $1.17 |
| Total/ Wtd. Average | 365 | 885 | $965 | $1.11 | $992 | $1.14 | |
| (1) | Based on the borrower rent roll dated October 11, 2024. |
| (2) | Based on the appraisals. |
| THE INFORMATION IN THIS STRUCTURAL AND COLLATERAL TERM SHEET IS NOT COMPLETE AND MAY BE AMENDED PRIOR TO THE TIME OF SALE. THIS TERM SHEET IS NOT AN OFFER TO SELL THESE SECURITIES AND IT IS NOT A SOLICITATION OF AN OFFER TO BUY THESE SECURITIES IN ANY JURISDICTION WHERE THE OFFER OR SALE IS NOT PERMITTED. | ||
| T-115 | ||
| Multifamily – Garden | Loan #11 | Cut-off Date Balance: | $28,500,000 | |
| Various | Wechsler Multifamily Portfolio | Cut-off Date LTV: | 62.1% | |
| Various, IN Various | U/W NCF DSCR: | 1.42x | ||
| U/W NOI Debt Yield: | 10.1% |
Operating History and Underwritten Net Cash Flow. The following table presents certain information relating to the historical operating performance and Underwritten Net Cash Flow for the Wechsler Multifamily Portfolio Properties:
| Cash Flow Analysis | ||||
| 2023 | 8/31/2024 TTM | UW | UW per Unit | |
| Gross Potential Rent(1) | $3,926,794 | $4,159,797 | $4,224,168 | $11,573 |
| Other Income(2) | $380,366 | $427,079 | $443,630 | $1,215 |
| Discounts Concessions | ($8,462) | ($13,720) | $0 | $0 |
| Vacancy & Credit Loss | ($312,847) | ($285,253) | ($230,872) | ($633) |
| Effective Gross Income | $3,985,851 | $4,287,904 | $4,436,927 | $12,156 |
| Real Estate Taxes | $301,212 | $306,680 | $326,154 | $894 |
| Insurance | $92,485 | $112,664 | $147,190 | $403 |
| Other Expenses | $1,146,265 | $1,085,799 | $1,094,094 | $2,998 |
| Total Expenses | $1,539,963 | $1,505,142 | $1,567,439 | $4,294 |
| Net Operating Income | $2,445,889 | $2,782,762 | $2,869,488 | $7,862 |
| Capital Expenditures | $0 | $0 | $96,646 | $265 |
| Net Cash Flow | $2,445,889 | $2,782,762 | $2,772,842 | $7,597 |
| Occupancy % | 93.5% | 95.9%(3) | 94.8% | |
| NOI DSCR | 1.25x | 1.43x | 1.47x | |
| NCF DSCR | 1.25x | 1.43x | 1.42x | |
| NOI Debt Yield | 8.6% | 9.8% | 10.1% | |
| NCF Debt Yield | 8.6% | 9.8% | 9.7% | |
| (1) | UW Gross Potential Rent has been underwritten based on the contractual rent in place based on the borrower rent roll dated October 11, 2024. |
| (2) | Other Income is comprised of application fees, termination fees, late rent fees, pet fees, and ratio utility billing system. |
| (3) | 8/31/2024 TTM Occupancy is based on the underwritten rent roll dated October 11, 2024. |
| THE INFORMATION IN THIS STRUCTURAL AND COLLATERAL TERM SHEET IS NOT COMPLETE AND MAY BE AMENDED PRIOR TO THE TIME OF SALE. THIS TERM SHEET IS NOT AN OFFER TO SELL THESE SECURITIES AND IT IS NOT A SOLICITATION OF AN OFFER TO BUY THESE SECURITIES IN ANY JURISDICTION WHERE THE OFFER OR SALE IS NOT PERMITTED. | ||
| T-116 | ||
| Mortgage Loan No. 12 – Maritime Hotel |
| Mortgage Loan Information | Property Information | |||||||
| Mortgage Loan Seller: | BANA | Single Asset/Portfolio: | Single Asset | |||||
| Credit Assessment (Fitch/Moody’s/KBRA): | BBB-/A2/BBB | Location: | New York, NY 10011 | |||||
| Original Balance: | $26,000,000 | General Property Type: | Hospitality | |||||
| Cut-off Date Balance: | $26,000,000 | Detailed Property Type: | Full Service | |||||
| % of Initial Pool Balance: | 3.5% | Title Vesting: | Fee | |||||
| Loan Purpose: | Refinance | Year Built/Renovated: | 1969, 2003/2012-2014 | |||||
| Borrower Sponsors: | Richard Born, Ira Drukier, Sean | Size: | 126 Rooms | |||||
| MacPherson and Eric Goode | Cut-off Date Balance Per Room: | $206,349 | ||||||
| Guarantors: | Richard Born, Ira Drukier, Sean | Maturity Date Balance Per Room: | $206,349 | |||||
| MacPherson and Eric Goode | Property Manager: | Self-Managed | ||||||
| Mortgage Rate: | 5.66700% | |||||||
| Note Date: | 12/4/2024 | Underwriting and Financial Information | ||||||
| Maturity Date: | 1/1/2030 | UW NOI: | $5,710,136 | |||||
| Term to Maturity: | 60 months | UW NCF: | $4,990,085 | |||||
| Amortization Term: | 0 months | UW NOI Debt Yield: | 22.0% | |||||
| IO Period: | 60 months | UW NCF Debt Yield: | 19.2% | |||||
| Seasoning: | 1 month | UW NOI Debt Yield at Maturity: | 22.0% | |||||
| Prepayment Provisions: | L(25),YM1(28),O(7) | UW NCF DSCR: | 3.34x | |||||
| Lockbox/Cash Mgmt Status: | Springing/Springing | Most Recent NOI: | $7,952,383 (10/31/2024 TTM) | |||||
| Additional Debt Type: | NAP | 2nd Most Recent NOI: | $6,150,744 (12/31/2023) | |||||
| Additional Debt Balance: | NAP | 3rd Most Recent NOI: | $6,572,748 (12/31/2022) | |||||
| Future Debt Permitted (Type): | No (NAP) | Most Recent Occupancy: | 89.4% (10/31/2024) | |||||
| 2nd Most Recent Occupancy: | 90.5% (12/31/2023) | |||||||
| Reserves | 3rd Most Recent Occupancy: | 87.4% (12/31/2022) | ||||||
| Type | Initial | Monthly(1) | Cap | Appraised Value (as of): | $75,000,000 (9/11/2024) | |||
| RE Taxes: | $0 | Springing | NAP | Appraised Value Per Room: | $595,238 | |||
| Insurance: | $0 | Springing | NAP | Cut-off Date LTV Ratio: | 34.7% | |||
| FF&E Reserve: | $0 | Springing | NAP | Maturity Date LTV Ratio: | 34.7% | |||
| Sources and Uses | ||||||
| Sources | Proceeds | % of Total | Uses | Proceeds | % of Total | |
| Loan Amount: | $26,000,000 | 100.0% | Loan Payoff: | $25,069,792 | 96.4% | |
| Closing Costs: | $510,810 | 2.0% | ||||
| Return of Equity: | $419,398 | 1.6% | ||||
| Total Sources: | $26,000,000 | 100.0% | Total Uses: | $26,000,000 | 100.0% | |
| (1) | During the continuance of an event of default or when the debt service coverage ratio is less than 1.20x for two consecutive quarters, the borrower will be required to deposit monthly (i) 1/12th of the annual estimated tax payments, (ii) if there is no approved blanket policy in place, 1/12th of the annual estimated insurance payments and (iii) 4% of rents for the calendar month two months prior to such payment date for FF&E reserves. |
The Mortgage Loan. The twelfth largest mortgage loan (the “Maritime Hotel Mortgage Loan”) is evidenced by a single promissory note in the original principal amount of $26,000,000 and secured by a first mortgage encumbering the fee interest in a 126-room full-service hotel located in New York, New York (the “Maritime Hotel Property”).
The Borrowers and the Borrower Sponsors. The borrowers are Market Corner Realty Associates LLC and Hudson River Inn LLC, each a recycled single-purpose, New York limited liability company with one independent director. The borrower sponsors and non-recourse carve-out guarantors are Richard Born, Ira Drukier, Sean MacPherson and Eric Goode.
Richard Born and Ira Drukier are the founders of BD Hotels which currently owns and operates over 28 hotels in New York City, with the majority being boutique hotels, making them the largest independent hotel owners in New York City. Notable New York City hotels in their portfolio include The Jane Hotel, the Ludlow Hotel, the Mercer Hotel, The Gansevoort, Pod 39, Pod 51, The Wellington and The Greenwich Hotel. BD Hotels’ portfolio also includes residential and retail properties.
The Property. The Maritime Hotel Property is a 126-room full-service hotel located in New York, New York. The improvements are located on a 0.42-acre site and are comprised of a 12-story tower that totals approximately 110,286 SF of gross building area. The building was originally developed in 1969 as the headquarters for the National Maritime Union and has nautical-inspired architecture with pothole-shaped windows that give it a ship like appearance. Currently, the Maritime Hotel Property is operated as an independent, luxury class hotel with no franchise agreement in place.
The guestroom mix at the Maritime Hotel Property is comprised of 121 queen/queen rooms, two junior penthouses, two terrace penthouses and one rooftop penthouse. Each of the guestrooms features a flat-screen television, a desk with a chair, a dresser, a nightstand and a lounge chair. Hotel amenities include a lobby lounge, a fitness room and two food and beverage outlets including TAO Downtown and Catch Steak.
| THE INFORMATION IN THIS STRUCTURAL AND COLLATERAL TERM SHEET IS NOT COMPLETE AND MAY BE AMENDED PRIOR TO THE TIME OF SALE. THIS TERM SHEET IS NOT AN OFFER TO SELL THESE SECURITIES AND IT IS NOT A SOLICITATION OF AN OFFER TO BUY THESE SECURITIES IN ANY JURISDICTION WHERE THE OFFER OR SALE IS NOT PERMITTED. | ||
| T-117 | ||
| Hospitality – Full Service | Loan #12 | Cut-off Date Balance: | $26,000,000 | |
| 363 West 16th Street | Maritime Hotel | Cut-off Date LTV: | 34.7% | |
| New York, NY 10011 | UW NCF DSCR: | 3.34x | ||
| UW NOI Debt Yield: | 22.0% |
The TAO Downtown lease is with Asia One Six LLC for the approximately 22,000 SF lower-level restaurant and nightclub space. The lease commenced on April 1, 2012 and expires on January 31, 2033, with no renewal options. TAO Downtown does not have any lease termination options. The current base rent is $1,438,830, which will increase to $1,575,519 in April 2025, $1,725,193 in April 2028 and $1,889,086 in April 2031. The tenant has reportedly invested approximately $30 million into its leased space.
The Catch Steak lease is with 88 Ninth Avenue Hospitality, LLC for the lobby level restaurant, terrace and second floor encompassing approximately 12,280 SF. The lease commenced on January 1, 2019 and expires on January 31, 2033, with one 11-month renewal option with three months' notice. The current base rent is $1,320,000, which will increase to $1,452,000 in year nine and $1,597,200 in year 13 of the lease. Additionally, the tenant pays percent rent of 4% on gross sales between $16,500,000 and $20,000,000 and 8% on gross sales above $20,000,000. The tenant has reportedly invested approximately $15,000,000 into its leased space. As of January, 2025, Catch Steak is only providing daily breakfast and room service to hotel guests and no longer offering dining services to outside customers. Catch Steak remains current on its lease payment obligations and has the right, pursuant to its lease, to assign its lease at the same terms and provide a replacement lease guarantor, subject to the lender’s consent. Catch Steak does not have any lease termination options. Catch Steak is reportedly in negotiations with a potential replacement tenant. There can be no assurances that this or any replacement tenant will take assignment of the Catch Steak lease.
According to the appraisal, the property segmentation at the Maritime Hotel Property is estimated at 95% transient and 5% meeting and group.
The following table presents certain information relating to the Occupancy, ADR and RevPAR of the Maritime Hotel Property and its competitive set:
| Historical Occupancy, ADR, RevPAR(1)(2) | |||||||||
| Competitive Set | Maritime Hotel Property | Penetration Factor | |||||||
| Year | Occupancy | ADR | RevPAR | Occupancy | ADR | RevPAR | Occupancy | ADR | RevPAR |
| 12/31/2021 | 53.6% | $279.90 | $150.03 | 75.8% | $262.59 | $199.06 | 141.4% | 93.8% | 132.7% |
| 12/31/2022 | 75.9% | $369.03 | $280.09 | 87.7% | $319.07 | $279.90 | 115.6% | 86.5% | 99.9% |
| 12/31/2023 | 83.2% | $362.84 | $301.80 | 90.8% | $332.70 | $301.97 | 109.1% | 91.7% | 100.1% |
| 10/31/2024 TTM | 85.6% | $368.45 | $315.21 | 89.4% | $344.75 | $308.14 | 104.5% | 93.6% | 97.8% |
Source: Industry Report
| (1) | The competitive set includes Gansevoort Meatpacking, The Moore, Dream Downtown, Walker Hotel Greenwich Village, The Standard, High Line NYC, MOXY NYC Chelsea, Hotel Hugo Soho and The Evelyn. |
| (2) | The variances between the underwriting, the appraisal and the industry report data with respect to Occupancy, ADR and RevPAR at the Maritime Hotel Property are attributable in part to variances in reporting methodologies and/or timing differences. |
The Market. The Maritime Hotel Property is located along the east side of Ninth Avenue, between West 16th & West 17th Streets, in the Chelsea neighborhood of New York City and is served by the L, A/C/E, and 1/2/3 subway lines The neighborhood benefits from its proximity to the Meatpacking district, Greenwich Village and the West Village located to the south and Hudson Yards and the Penn Station district to the north. To the east are the neighborhoods of Gramercy Park, Union Square and the Flatiron district.
The Maritime Hotel Property is located within walking distance to the High Line elevated park, Chelsea Piers, Chelsea Market, museums, restaurants and shops. Additionally, it is within close proximity to the bike path along the Hudson River. For commercial demand, the Maritime Hotel benefits from its location amidst the corporate presence of companies including InterActive Corp., Warner Music Group, Twitter, Warner Brothers Discovery, Food Network, Apple, Meta, Amazon, Nike, Samsung and Yelp. Additionally, the Maritime Hotel Property is located across the street from the Google corporate office, which is one of four buildings that comprise its New York campus. The Maritime Hotel Property's top corporate accounts in 2023 were Google (3,957 room nights), the Whitney Museum of Art (257 room nights), Theory LLC (256 room nights), Gagosian Gallery (155 room nights) and Dorothee Schumacher (132 room nights).
According to the appraisal, the estimated 2023 population within a one-, three-, and five-mile radius of the Maritime Hotel Property was 147,229, 1,183,374 and 2,557,900, respectively. The 2023 average household income within the same radii was $208,342, $182,179 and $160,886, respectively.
The following table presents the primary competitive properties to the Maritime Hotel Property as identified by the appraisal, which in total represent 1,789 rooms. The average 2023 occupancy, ADR and RevPar for these properties was 83.7%, $360.54 and $301.82, respectively, as compared to the 2023 occupancy, ADR and RevPar for the Maritime Hotel Property of 90.5%, $332.97 and $301.38, respectively.
| Competitive Property Summary | |||
| Property | Year Built/ Renovated | Rooms | Class |
| Maritime Hotel (subject) | 1969/2003; 2012-2014 | 126 | Luxury |
| Gansevoort Meatpacking | 2004 | 186 | Luxury |
| The Moore | 2008 | 81 | Upper Upscale |
| Dream Downtown | 2011 | 314 | Upper Upscale |
| Walker Hotel Greenwich Village | 2013 | 113 | Luxury |
| The Standard, High Line | 2008 | 338 | Luxury |
| MOXY NYC Chelsea | 2019 | 350 | Upper Midscale |
| Hotel Hugo Soho | 2014 | 122 | Luxury |
| The Evelyn | 1905 | 159 | Luxury |
| THE INFORMATION IN THIS STRUCTURAL AND COLLATERAL TERM SHEET IS NOT COMPLETE AND MAY BE AMENDED PRIOR TO THE TIME OF SALE. THIS TERM SHEET IS NOT AN OFFER TO SELL THESE SECURITIES AND IT IS NOT A SOLICITATION OF AN OFFER TO BUY THESE SECURITIES IN ANY JURISDICTION WHERE THE OFFER OR SALE IS NOT PERMITTED. | ||
| T-118 | ||
| Hospitality – Full Service | Loan #12 | Cut-off Date Balance: | $26,000,000 | |
| 363 West 16th Street | Maritime Hotel | Cut-off Date LTV: | 34.7% | |
| New York, NY 10011 | UW NCF DSCR: | 3.34x | ||
| UW NOI Debt Yield: | 22.0% |
Appraisal. The appraiser concluded to an “as-is” value for the Maritime Hotel Property of $75,000,000 as of September 11, 2024.
Environmental Matters. According to the Phase I environmental report dated October 3, 2024, there was no evidence of any recognized environmental conditions at the Maritime Hotel Property.
Operating History and Underwritten Net Cash Flow. The following table presents certain information relating to the historical operating performance and underwritten cash flow at the Maritime Hotel Property:
| Cash Flow Analysis(1) | |||||||
| 2019 | 2021 | 2022 | 2023 | 10/31/2024 TTM | UW | UW per Room | |
| Occupancy(2) | 84.0% | 75.9% | 87.4% | 90.5% | 89.4% | 89.4% | |
| ADR(2) | $289.20 | $210.64 | $319.89 | $332.97 | $343.96 | $343.96 | |
| RevPAR(2) | $242.78 | $159.80 | $279.48 | $301.38 | $307.50 | $307.50 | |
| Room Revenue | $11,125,957 | $6,146,693 | $12,853,067 | $13,860,452 | $14,180,857 | $14,142,111 | $112,239 |
| Rentals and Other Income(3) | $2,077,472 | $2,261,364 | $4,077,059 | $3,568,167 | $3,761,448 | $3,647,398 | $28,948 |
| Other Income(4) | $213,350 | $146,621 | $259,587 | $212,126 | $211,759 | $211,759 | $1,681 |
| Total Revenue | $13,416,779 | $8,554,678 | $17,189,713 | $17,640,745 | $18,154,064 | $18,001,268 | $142,867 |
| Room Expense | $3,622,080 | $2,867,518 | $4,942,238 | $5,646,394 | $5,944,520 | $5,928,279 | $47,050 |
| Other Income Expense | $87,119 | $59,027 | $80,980 | $86,653 | $88,012 | $88,012 | $699 |
| Real Estate Taxes(5) | $1,580,491 | $1,483,220 | $1,378,053 | $1,378,053 | $0 | $1,533,763 | $12,173 |
| Insurance | $190,064 | $204,724 | $244,695 | $252,415 | $244,615 | $276,506 | $2,194 |
| Other Expenses | $3,163,382 | $2,652,838 | $3,970,999 | $4,126,486 | $3,924,534 | $4,464,572 | $35,433 |
| Total Expenses(6) | $8,643,136 | $7,267,327 | $10,616,965 | $11,490,001 | $10,201,681 | $12,291,132 | $97,549 |
| Net Operating Income | $4,773,643 | $1,287,351 | $6,572,748 | $6,150,744 | $7,952,383 | $5,710,136 | $45,319 |
| FF&E | $0 | $184,401 | $385,592 | $415,814 | $544,622 | $720,051 | $5,715 |
| Net Cash Flow | $4,773,643 | $1,102,950 | $6,187,156 | $5,734,930 | $7,407,761 | $4,990,085 | $39,604 |
| NOI DSCR | 3.20x | 0.86x | 4.40x | 4.12x | 5.32x | 3.82x | |
| NCF DSCR | 3.20x | 0.74x | 4.14x | 3.84x | 4.96x | 3.34x | |
| NOI Debt Yield | 18.4% | 5.0% | 25.3% | 23.7% | 30.6% | 22.0% | |
| NCF Debt Yield | 18.4% | 4.2% | 23.8% | 22.1% | 28.5% | 19.2% | |
| (1) | The decrease in Occupancy and Net Operating Income from 2019 to 2021, as well as the recovery from 2021 through 2023, was primarily due to the mandated closures and effects of the COVID-19 pandemic on the hospitality industry. |
| (2) | The variances between the underwriting, the appraisal, and the industry report data with respect to Occupancy, ADR and RevPAR at the Maritime Hotel Property are attributable in part to variances in reporting methodologies and/or timing differences. |
| (3) | Rentals and Other Income is based on restaurant leases in place. |
| (4) | Other Income includes minibar revenue, laundry and valet income, parking income and miscellaneous income. |
| (5) | Historical and UW real estate tax expense is reported net of tax reimbursements from TAO Downtown and Catch Steak leases. |
| (6) | 10/31/2024 TTM expenses excludes management fee and real estate tax expense. |
| THE INFORMATION IN THIS STRUCTURAL AND COLLATERAL TERM SHEET IS NOT COMPLETE AND MAY BE AMENDED PRIOR TO THE TIME OF SALE. THIS TERM SHEET IS NOT AN OFFER TO SELL THESE SECURITIES AND IT IS NOT A SOLICITATION OF AN OFFER TO BUY THESE SECURITIES IN ANY JURISDICTION WHERE THE OFFER OR SALE IS NOT PERMITTED. | ||
| T-119 | ||
| Mortgage Loan No.13 – Radius at Harbor Bay |
| Mortgage Loan Information | Property Information | ||||||
| Mortgage Loan Seller: | WFB | Single Asset/Portfolio: | Portfolio | ||||
| Credit Assessment (Fitch/ Moody’s KBRA): | NR/NR/NR | Location: | Alameda, CA 94502 | ||||
| Original Balance(1): | $25,000,000 | General Property Type: | Various | ||||
| Cut-off Date Balance(1): | $24,979,960 | Detailed Property Type: | Various | ||||
| % of Initial Pool Balance: | 3.4% | Title Vesting: | Fee | ||||
| Loan Purpose: | Refinance | Year Built/Renovated: | Various/Various | ||||
| Borrower Sponsors: | TNREF IV REIV, LLC and True North Real Estate Fund IV, L.P. | Size: | 643,220 SF | ||||
| Cut-off Date Balance per SF(1): | $329 | ||||||
| Guarantors: | TNREF IV REIV, LLC and True North Real | Maturity Balance per SF(1): | $309 | ||||
| Estate Fund IV, L.P. | Property Manager: | CBRE, Inc. | |||||
| Mortgage Rate: | 6.12600% | ||||||
| Note Date: | 12/30/2024 | ||||||
| Maturity Date: | 1/11/2030 | ||||||
| Original Term to Maturity: | 60 months | Underwriting and Financial Information(1) | |||||
| Original Amortization Term: | 360 months | UW NOI(4): | $22,761,221 | ||||
| IO Period: | 0 months | UW NCF: | $22,439,357 | ||||
| Seasoning: | 1 month | UW NOI Debt Yield: | 10.7% | ||||
| Prepayment Provisions(2): | L(25),D(28),O(7) | UW NCF Debt Yield: | 10.6% | ||||
| Lockbox/Cash Mgmt Status: | Hard/Springing | UW NOI Debt Yield at Maturity: | 11.4% | ||||
| Additional Debt Type(1): | Pari Passu | UW NCF DSCR: | 1.45x | ||||
| Additional Debt Balance(1): | $186,850,104 | Most Recent NOI(4): | $18,029,392 (9/30/2024 TTM) | ||||
| Future Debt Permitted (Type): | No (NAP) | 2nd Most Recent NOI(4): | $12,162,354 (12/31/2023) | ||||
| Reserves | 3rd Most Recent NOI(4): | $10,220,790 (12/31/2022) | |||||
| Type | Initial | Monthly | Cap | Most Recent Occupancy(4): | 93.9% (Various) | ||
| RE Taxes: | $1,000,744 | $250,186 | NAP | 2nd Most Recent Occupancy(4): | 89.5% (12/31/2023) | ||
| Insurance: | $0 | Springing | NAP | 3rd Most Recent Occupancy(4): | 90.7% (12/31/2022) | ||
| Replacement Reserve: | $0 | $10,721 | $385,932 | Appraised Value (as of)(5): | $316,270,000 (Various) | ||
| Leasing Reserve: | $4,500,000 | $53,602 | (3) | Appraised Value per SF(5): | $492 | ||
| Abbott Reserve: | $0 | Springing | (3) | Cut-off Date LTV Ratio: | 67.0% | ||
| Existing TI/LC Reserve: | $20,860,736 | $0 | NAP | Maturity Date LTV Ratio: | 62.9% | ||
| Rent Concessions Reserve: | $355,039 | $0 | NAP | ||||
| Sources and Uses | ||||||
| Sources | Proceeds | % of Total | Uses | Proceeds | % of Total | |
| Whole Loan Amount(1): | $212,000,000 | 98.1% | Loan Payoff: | $177,584,940 | 82.2% | |
| Borrower Sponsor Equity: | $4,133,191 | 1.9% | Reserves: | $26,716,519 | 12.4% | |
| Closing Costs: | $11,831,733 | 5.5% | ||||
| Total Sources: | $216,133,191 | 100.0% | Total Uses: | $216,133,191 | 100.0% | |
| (1) | The Radius at Harbor Bay Mortgage Loan (as defined below) is part of a whole loan evidenced by five pari passu promissory notes with an aggregate original principal balance of $212,000,000. The information presented is based on the Radius at Harbor Bay Whole Loan (as defined below). |
| (2) | Defeasance of Radius at Harbor Bay Whole Loan is permitted at any time after the date that is the earliest to occur of (i) two years after the closing date of the securitization that includes the last note to be securitized and (ii) December 30, 2027. The assumed defeasance lockout period of 24 payments is based on the anticipated closing date of the BANK5 2025-5YR13 securitization trust in February 2025. The actual defeasance lockout period may be longer. |
| (3) | The loan documents require ongoing leasing reserve deposits as follows: (i) $53,602 on each monthly payment date until Abbott exercises its extension option in writing or a replacement tenant event (an “Abbott Renewal Event”) has occurred, and (ii) following an Abbott Renewal Event, if leasing reserve funds are less than $1,400,000, $53,602 on each monthly payment date up to a cap of $1,400,000. Commencing in August 2028, the loan documents require an ongoing monthly replacement reserve deposit for the Abbott Reserve of $500,000 on each monthly payment date until the earlier of (i) the occurrence of an Abbott Renewal Event has occurred, or (ii) the combined amounts deposit sum for the leasing reserve, excess cash flow subaccount, and Abbott Reserve equals $12,000,000, provided, however, that such reserve fund will no longer apply from and after the release of the 1420 Harbor Bay Parkway property. |
| (4) | The increase in NOI from 2022 to UW was primarily due to an increase in occupancy from 90.7% to 93.9% and an increase in average rental rates from $22.08 PSF to $37.62 PSF. Additionally, Penumbra, Inc. is converting the 1451 Harbor Bay Parkway property into an R&D facility on a lease through December 31, 2036, totaling 86,055 SF. Demolition has started, and Penumbra, Inc. is expected to complete the buildout by July 2025. |
| (5) | The appraisal provided “hypothetical as-stabilized” or “hypothetical as-complete/stabilized” values for eight of the ten Radius at Harbor Bay Properties (as defined below) and as-is values for the other two. Of those eight properties, six “hypothetical as-stabilized” or “hypothetical as- complete/stabilized” values were used because the respective property conversions from office to life science use have been completed, property occupancies have stabilized and all outstanding TI/LC reserves of $20,860,736 have been reserved for up-front. For the remaining two non-stabilized properties and the two properties that had been already stabilized, as-is values were used. The aggregate portfolio value on this combined basis was $316,270,000 as of October 21, 2024 and October 23, 2024. |
The Mortgage Loan. The thirteenth largest mortgage loan (the “Radius at Harbor Bay Mortgage Loan”) is part of a whole loan (the “Radius at Harbor Bay Whole Loan”) evidenced by four pari passu promissory notes with an aggregate original principal amount $212,000,000. The Radius at Harbor Bay Whole Loan is secured by a first priority mortgage encumbering the borrowers’ fee interests in 10 office, industrial, and mixed use properties totaling 643,220 SF located in Alameda, California, (collectively the “Radius at Harbor Bay Properties”). The Radius at Harbor Bay Mortgage Loan is evidenced by the non-controlling Note A-2-2, with an outstanding principal balance of $24,979,960 as of the Cut-off Date. The Radius at Harbor Bay Whole Loan is serviced
| THE INFORMATION IN THIS STRUCTURAL AND COLLATERAL TERM SHEET IS NOT COMPLETE AND MAY BE AMENDED PRIOR TO THE TIME OF SALE. THIS TERM SHEET IS NOT AN OFFER TO SELL THESE SECURITIES AND IT IS NOT A SOLICITATION OF AN OFFER TO BUY THESE SECURITIES IN ANY JURISDICTION WHERE THE OFFER OR SALE IS NOT PERMITTED. | ||
| T-120 | ||
| Various – Various | Loan #13 | Cut-off Date Balance: | $24,979,960 | |
| Alameda, CA 94502 | Radius at Harbor Bay | Cut-off Date LTV: | 67.0% | |
| UW NCF DSCR: | 1.45x | |||
| UW NOI Debt Yield: | 10.7% |
pursuant to the pooling and servicing agreement for the WFCM 2025-5C3 transaction. See “Description of the Mortgage Pool—The Non-Serviced Pari Passu Whole Loans” and “Pooling and Servicing Agreement” in the Preliminary Prospectus.
| Radius at Harbor Bay Whole Loan Summary | ||||
| Note | Original Balance | Cut-off Date Balance | Note Holder | Controlling Note |
| A-1 | $83,000,000 | $82,933,468 | WFCM 2025-5C3 | Yes |
| A-2-1(1) | $50,000,000 | $49,959,921 | WFB | No |
| A-2-2 | $25,000,000 | $24,979,960 | BANK5 2025-5YR13 | No |
| A-3(1) | $11,600,000 | $11,590,702 | WFB | No |
| A-4(1) | $42,400,000 | $42,366,013 | GACC | No |
| Total | $212,000,000 | $211,830,064 | ||
| (1) | Expected to be contributed to one or more future securitization trust(s). |
The Borrowers and the Borrower Sponsors. The borrowers are Harbor Bay Parkway LLC, 1640 South Loop Road LLC, 1501 Harbor Bay LLC, 1321 & 1351 Harbor Bay LLC, 1411 Harbor Bay LLC, 1420 Harbor Bay LLC, 1451 Harbor Bay LLC and 1350 South Loop LLC, each a single-purpose, Delaware limited liability company with one independent director.
The borrower sponsors and non-recourse carveout guarantors are TNREF IV REIV, LLC and True North Real Estate Fund IV, L.P. (individually or collectively, “True North Management Group”). True North Management Group is a real estate investment firm that invests in middle market real estate assets in growing United States metropolitan areas. True North Management Group has raised over $1.5 billion in discretionary institutional equity capital across four funds and multiple co-investment vehicles.
The Properties. The Radius at Harbor Bay Properties comprise 643,220 SF across 10 buildings consisting of a mix of R&D, laboratory, and office uses located on approximately 33.93-acres in Alameda, California. The Radius at Harbor Bay Properties consist of 435,949 SF of mixed use (R&D/Lab/Office) space, 121,216 SF of headquartered office space, and 86,055 SF of industrial R&D space. As of October 16, 2024, November 26, 2024 and February 11, 2025, the Radius at Harbor Bay Properties were 93.9% leased to 18 unique tenants with a weighted average remaining lease term of approximately 8.6 years. The Radius at Harbor Bay Properties also include 2,525 on-site parking spaces (3.93 spaces per 1,000 SF), inclusive of 1,498 spaces shared on a non-exclusive basis to the entire Empire Parkway Centre condominium regime.
The following table presents certain information relating to the Radius at Harbor Bay Properties:
| Radius at Harbor Bay Properties Summary | |||||||||
| Property Name / Property Type / Property Sub-Type | Allocated Whole Loan Cut-off Date Balance | % of Portfolio Cut-off Date Balance | Occupancy(1) | Year Built / Renovated(2) | Net Rentable Area (SF)(1) | Appraised Value(2)(3) | Allocated Cut-off Date LTV | UW NOI(1) | % of UW NOI(1) |
1420 Harbor Bay Parkway Office / Suburban | $29,936,224 | 14.1% | 100.0% | 1986 / Various | 121,216 | $46,420,000 | 64.5% | $4,225,296 | 18.6% |
1351 Harbor Bay Parkway Mixed Use / R&D/Lab/Office | $28,872,140 | 13.6% | 100.0% | 1984 / Various | 97,980 | $44,770,000 | 64.5% | $2,826,526 | 12.4% |
1451 Harbor Bay Parkway Industrial / R&D | $25,357,440 | 12.0% | 100.0% | 1984 / Various | 86,055 | $39,320,000 | 64.5% | $2,482,514 | 10.9% |
1640 South Loop Road Mixed Use / R&D/Lab/Office | $23,538,823 | 11.1% | 100.0% | 1996 / 2021-2022 | 51,780 | $36,500,000 | 64.5% | $3,245,026 | 14.3% |
1650 Harbor Bay Parkway Mixed Use / R&D/Lab/Office | $23,474,333 | 11.1% | 67.1% | 2001 / 2019-2024 | 67,537 | $29,600,000 | 79.3% | $1,400,062 | 6.2% |
1600 Harbor Bay Parkway Mixed Use / R&D/Lab/Office | $23,022,904 | 10.9% | 100.0% | 2001 / 2019-2024 | 62,696 | $35,700,000 | 64.5% | $2,692,701 | 11.8% |
1350 South Loop Road Mixed Use / R&D/Lab/Office | $20,307,878 | 9.6% | 100.0% | 1987 / 2022 | 43,645 | $31,490,000 | 64.5% | $2,827,643 | 12.4% |
1321 Harbor Bay Parkway Mixed Use / R&D/Lab/Office | $14,787,540 | 7.0% | 100.0% | 1984 / Various | 50,177 | $22,930,000 | 64.5% | $1,447,506 | 6.4% |
1501 Harbor Bay Parkway Mixed Use / R&D/Lab/Office | $14,187,784 | 6.7% | 49.8% | 1985 / 2021 | 33,817 | $16,600,000 | 85.5% | $797,057 | 3.5% |
1411 Harbor Bay Parkway Mixed Use / R&D/Lab/Office | $8,344,996 | 3.9% | 100.0% | 1984 / Various | 28,317 | $12,940,000 | 64.5% | $816,889 | 3.6% |
| Total/Weighted Average | $211,830,064 | 100.0% | 93.9% | 643,220 | $316,270,000 | 67.0% | $22,761,221 | 100.0% | |
| (1) | Information based on the underwritten rent rolls dated October 16, 2024, November 26, 2024 and February 11, 2025. |
| (2) | Source: Appraisal. |
| (3) | The appraisal provided “hypothetical as-stabilized” or “hypothetical as-complete/stabilized” values for eight of the ten Radius at Harbor Bay Properties (as defined below) and as-is values for the other two. Of those eight properties, six “hypothetical as-stabilized” or “hypothetical as- complete/stabilized” values were used because the respective property conversions from office to life science use have been completed, property occupancies have stabilized and all outstanding TI/LC reserves of $20,860,736 have been reserved for up-front. For the remaining two non-stabilized properties and the two properties that had been already stabilized, as-is values were used. For the remaining two non-stabilized properties and the two properties that had been already stabilized, as-is values were used. The aggregate portfolio value on this combined basis was $316,270,000 as of October 21, 2024 and October 23, 2024. |
| THE INFORMATION IN THIS STRUCTURAL AND COLLATERAL TERM SHEET IS NOT COMPLETE AND MAY BE AMENDED PRIOR TO THE TIME OF SALE. THIS TERM SHEET IS NOT AN OFFER TO SELL THESE SECURITIES AND IT IS NOT A SOLICITATION OF AN OFFER TO BUY THESE SECURITIES IN ANY JURISDICTION WHERE THE OFFER OR SALE IS NOT PERMITTED. | ||
| T-121 | ||
| Various – Various | Loan #13 | Cut-off Date Balance: | $24,979,960 | |
| Alameda, CA 94502 | Radius at Harbor Bay | Cut-off Date LTV: | 67.0% | |
| UW NCF DSCR: | 1.45x | |||
| UW NOI Debt Yield: | 10.7% |
Major Tenants.
Penumbra, Inc. (262,529 SF, 40.8% net rentable area, 31.3% underwritten base rent). Founded in 2004, Penumbra, Inc. (NYSE: PEN) is a global provider of neurological and vascular medical devices. Penumbra, Inc. offers a 3D computer-based technology platform for the surgical removal of fluid and tissue from the ventricles and cerebrum. Penumbra, Inc. started occupying the 1351 Harbor Bay Parkway property in May 2008, and has since expanded into the 1451 Harbor Bay Parkway property, 1411 Harbor Bay Parkway property, and 1321 Harbor Bay Parkway property. In addition, Penumbra, Inc. also occupies space at five adjacent buildings (non-collateral) including its headquarters located at 1310 Harbor Bay Parkway (non-collateral). Penumbra, Inc. employs more than 4,200 individuals and generates annual revenue of approximately $1.06 billion through a combination of direct sales and distributor arrangements. The Penumbra, Inc. lease has a current expiration of December 31, 2036, with three five-year renewal options and no termination options remaining.
Abbott Diabetes Care, Inc. (121,216 SF, 18.8% of net rentable area; 17.4% of underwritten base rent). Abbott Labs (NYSE: ABT), the parent company of Abbott Diabetes Care, Inc. (“Abbott”) is a global medical device company that develops and sells healthcare products worldwide. Abbott’s product portfolio spans across four segments: pharmaceutical products, diagnostic products, nutritional products, and medical devices. Abbott generated $40.1 billion in sales in 2023. The Abbott lease has a current expiration of December 31, 2029, with two five-year renewals and no termination options.
Vivani Medical, Inc. (43,645 SF; 6.8% of net rentable area; 11.7% of underwritten base rent). Vivani Medical, Inc. (Nasdaq: VANI) is a biopharmaceutical company that specializes in miniaturized and subdermal implants, utilizing its advanced nano portal implant technology to treat chronic diseases. The Vivani Medical, Inc. lease has a current expiration of September 30, 2033, with two five-year renewals and no termination options remaining.
The following table presents certain information relating to the tenancy at the Radius at Harbor Bay Properties:
| Tenant Summary(1) | |||||||||
| Tenant Name | Credit Rating (Fitch/Moody's/S&P)(2) | Tenant SF | % of Total SF | Annual UW Rent(3) | % of Total Annual UW Rent(3) | Annual UW Rent PSF(3) | Lease Expiration | Term. Option (Y/N) | Renewal Options |
| Penumbra, Inc.(4) | NR/NR/NR | 262,529 | 40.8% | $7,573,435 | 31.3% | $28.85 | 12/31/2036 | N | 3 x 5 Yr |
| Abbott Diabetes Care, Inc. | NR/Aa3/AA- | 121,216 | 18.8% | $4,216,554 | 17.4% | $34.79 | 12/31/2029 | N | 2 x 5 Yr |
| Vivani Medical, Inc. | NR/NR/NR | 43,645 | 6.8% | $2,839,299 | 11.7% | $65.05 | 9/30/2033 | N | 2 x 5 Yr |
| Bay Area Disruptor | NR/NR/NR | 28,488 | 4.4% | $1,589,630 | 6.6% | $55.80 | 9/30/2037 | N | None |
| AllCells, LLC | NR/NR/NR | 25,865 | 4.0% | $1,580,554 | 6.5% | $61.11 | 11/30/2033 | N | 1 x 5 Yr |
| Subtotal/Wtd. Avg. | 481,743 | 74.9% | $17,799,472 | 73.6% | $36.95 | ||||
| Other Tenants | 122,285 | 19.0% | $6,399,187 | 26.4% | $52.33 | ||||
| Total Occupied Space | 604,028 | 93.9% | $24,198,660 | 100.0% | $40.06 | ||||
| Vacant Space | 39,192 | 6.1% | |||||||
| Total/Wtd. Avg. | 643,220 | 100.0% | |||||||
| (1) | Information based on the underwritten rent rolls dated October 16, 2024, November 26, 2024 and February 11, 2025. |
| (2) | Credit Ratings are those of the parent company, whether or not the parent company guarantees the lease. |
| (3) | The Annual UW Rent, % of Total Annual UW Rent and Annual UW Rent PSF includes rent steps through December 2025 totaling $1,036,969. |
| (4) | Penumbra, Inc. is converting the 1451 Harbor Bay Parkway property into an R&D facility on a lease through December 31, 2036, totaling 86,055 SF. Demolition has started, and Penumbra, Inc. is expected to complete the buildout by July 2025. |
| THE INFORMATION IN THIS STRUCTURAL AND COLLATERAL TERM SHEET IS NOT COMPLETE AND MAY BE AMENDED PRIOR TO THE TIME OF SALE. THIS TERM SHEET IS NOT AN OFFER TO SELL THESE SECURITIES AND IT IS NOT A SOLICITATION OF AN OFFER TO BUY THESE SECURITIES IN ANY JURISDICTION WHERE THE OFFER OR SALE IS NOT PERMITTED. | ||
| T-122 | ||
| Various – Various | Loan #13 | Cut-off Date Balance: | $24,979,960 | |
| Alameda, CA 94502 | Radius at Harbor Bay | Cut-off Date LTV: | 67.0% | |
| UW NCF DSCR: | 1.45x | |||
| UW NOI Debt Yield: | 10.7% |
The following table presents certain information relating to the lease rollover schedule at the Radius at Harbor Bay Properties:
| Lease Rollover Schedule(1)(2) | ||||||||
| Year | # of Leases Rolling | SF Rolling | Approx. % of SF Rolling | Approx. Cumulative % of SF Rolling | Total UW Rent Rolling | Approx. % of Total UW Rent Rolling | Approx. Cumulative % of Total UW Rent Rolling | UW Rent PSF Rolling |
| MTM/2025 | 2 | 18,267 | 2.8% | 2.8% | $559,096 | 2.3% | 2.3% | $30.61 |
| 2026 | 2 | 11,363 | 1.8% | 4.6% | $616,283 | 2.5% | 4.9% | $54.24 |
| 2027 | 2 | 13,772 | 2.1% | 6.7% | $742,411 | 3.1% | 7.9% | $53.91 |
| 2028 | 2 | 16,830 | 2.6% | 9.4% | $584,790 | 2.4% | 10.3% | $34.75 |
| 2029 | 2 | 131,044 | 20.4% | 29.7% | $4,860,913 | 20.1% | 30.4% | $37.09 |
| 2030 | 0 | 0 | 0.0% | 29.7% | $0 | 0.0% | 30.4% | $0.00 |
| 2031 | 2 | 25,915 | 4.0% | 33.8% | $1,657,538 | 6.8% | 37.3% | $63.96 |
| 2032 | 2 | 26,310 | 4.1% | 37.9% | $1,594,711 | 6.6% | 43.9% | $60.61 |
| 2033 | 2 | 69,510 | 10.8% | 48.7% | $4,419,853 | 18.3% | 62.1% | $63.59 |
| 2034 | 0 | 0 | 0.0% | 48.7% | $0 | 0.0% | 62.1% | $0.00 |
| 2035 | 0 | 0 | 0.0% | 48.7% | $0 | 0.0% | 62.1% | $0.00 |
| Thereafter | 2 | 291,017 | 45.2% | 93.9% | $9,163,065 | 37.9% | 100.0% | $31.49 |
| Vacant | 0 | 39,192 | 6.1% | 100.0% | $0 | 0.0% | 100.0% | $0.00 |
| Total/Wtd. Avg.(3) | 18 | 643,220 | 100.0% | $24,198,660 | 100.0% | $40.06 | ||
| (1) | Information is based on the underwritten rent rolls and includes rent steps through December 2025 totaling $1,036,969. |
| (2) | Certain tenants may have lease termination options that are exercisable prior to the stated expiration date of the subject lease or leases which are not considered in the lease rollover schedule. |
| (3) | Total/Wtd. Avg. UW Rent PSF Rolling excludes vacant space. |
The Market. The Radius at Harbor Bay Properties are located within Alameda County, California, and are part of the San Francisco-Oakland-Fremont, CA, metropolitan surrounding area. The Radius at Harbor Bay Properties are located in the southern section of Alameda in an area known as Bay Farm Island. The Bay Farm Island neighborhood consists of a mix of residential and commercial uses. Commercial uses in the area include hotels, office buildings, R&D developments, industrial developments and a shopping center. Primary access to the Radius at Harbor Bay neighborhood is provided by State Route 61 (Doolittle Drive). The nearest freeway, which is Interstate 880, is approximately one mile from the neighborhood, but is about a four-mile drive from the Radius at Harbor Bay Properties. Oakland International Airport is located approximately 1.3 miles southeast of the Radius at Harbor Bay Properties.
The Radius at Harbor Bay Properties are located in the Alameda office submarket. The Alameda office submarket consists of approximately 4,329,309 SF of office space with a 5.1% vacancy rate as of the first quarter of 2025.
The following table presents certain information relating to the appraisals’ market rent conclusions for the Radius at Harbor Bay Properties:
| Market Rent Summary | |||||||||||||
| 1321 Harbor Bay Parkway | 1351 Harbor Bay Parkway | 1411 Harbor Bay Parkway | 1451 Harbor Bay Parkway | 1420 Harbor Bay Parkway | 1350 South Loop Road | 1501 Harbor Bay Parkway - Café | 1501 Harbor Bay Parkway - Office/Lab | 1640 South Loop Road | 1600 Harbor Bay Parkway-Lab | 1600 Harbor Bay Parkway-Office | 1650 Harbor Bay Parkway-Lab | 1650 Harbor Bay Parkway-Office | |
| Market Rent (PSF) | $42.00 | $42.00 | $42.00 | $42.00 | $32.40 | $55.20 | $30.00 | $55.20 | $55.20 | $55.20 | $42.00 | $55.20 | $42.00 |
| Average Lease Term (Years) | 7 | 7 | 7 | 7 | 5 | 7 | 5 | 7 | 7 | 7 | 5 | 7 | 5 |
| Lease Type | NNN | NNN | NNN | NNN | Net | NNN | MG | Net | Net | Net | Base Year Stop | Net | Base Year Stop |
| Rent Increase Projection | 3.0% per annum | 3.0% per annum | 3.0% per annum | 3.0% per annum | 3.0% per annum | 3.0% per annum | 3.0% per annum | 3.0% per annum | 3.0% per annum | 3.0% per annum | 3.0% per annum | 3.0% per annum | 3.0% per annum |
| Tenant Improvements (New) | $25 PSF | $25 PSF | $25 PSF | $25 PSF | $50 PSF | $25 PSF | $10 PSF | $25 PSF | $25 PSF | $25 PSF | $25 PSF | $25 PSF | $25 PSF |
| Leasing Commissions (New) | 6.00% | 6.00% | 6.00% | 6.00% | 6.00% | 6.00% | 6.00% | 6.00% | 6.00% | 6.00% | 6.00% | 6.00% | 6.00% |
| Free Rent (New) | NAP | NAP | NAP | NAP | NAP | NAP | NAP | NAP | NAP | NAP | NAP | NAP | NAP |
| THE INFORMATION IN THIS STRUCTURAL AND COLLATERAL TERM SHEET IS NOT COMPLETE AND MAY BE AMENDED PRIOR TO THE TIME OF SALE. THIS TERM SHEET IS NOT AN OFFER TO SELL THESE SECURITIES AND IT IS NOT A SOLICITATION OF AN OFFER TO BUY THESE SECURITIES IN ANY JURISDICTION WHERE THE OFFER OR SALE IS NOT PERMITTED. | ||
| T-123 | ||
| Various – Various | Loan #13 | Cut-off Date Balance: | $24,979,960 | |
| Alameda, CA 94502 | Radius at Harbor Bay | Cut-off Date LTV: | 67.0% | |
| UW NCF DSCR: | 1.45x | |||
| UW NOI Debt Yield: | 10.7% |
Appraisal. The appraisal provided “hypothetical as-stabilized” or “hypothetical as-complete/stabilized” values for eight of the ten Radius at Harbor Bay Properties (as defined below) and as-is values for the other two. Of those eight properties, six “hypothetical as-stabilized” or “hypothetical as- complete/stabilized” values were used because the respective property conversions from office to life science use have been completed, property occupancies have stabilized and all outstanding TI/LC reserves of $20,860,736 have been reserved for up-front. For the remaining two non-stabilized properties and the two properties that had been already stabilized, as-is values were used. The aggregate portfolio value on this combined basis was $316,270,000 as of October 21, 2024 and October 23, 2024.
Environmental Matters. According to the Phase I environmental site assessments dated October 16, 2024, there was no evidence of any recognized environmental l conditions at the Radius at Harbor Bay Properties.
Operating History and Underwritten Net Cash Flow. The following table presents certain information relating to the historical operating performance and underwritten net cash flow at the Radius at Harbor Bay Properties:
| Cash Flow Analysis | ||||||
| 2021 | 2022 | 2023 | TTM 9/30/2024 | UW | UW PSF | |
| Base Rent(1) | $6,907,151 | $14,203,703 | $18,060,546 | $21,415,565 | $24,198,660 | $37.62 |
| Grossed Up Vacant Space | $0 | $0 | $0 | $0 | $2,163,398 | $3.36 |
| Gross Potential Rent | $6,907,151 | $14,203,703 | $18,060,546 | $21,415,565 | $26,362,058 | $40.98 |
| Total Recoveries | $1,271,131 | $2,764,535 | $5,146,479 | $5,754,206 | $7,209,534 | $11.21 |
| Free Rent Adjustment | ($66,025) | ($231,018) | ($3,079,675) | ($955,146) | $0 | $0.00 |
| Other Income | $40,054 | $3,294 | $5,676 | $27,968 | $27,968 | $0.04 |
| Parking/Garage/Other | $32,980 | $33,969 | $34,988 | $35,774 | $36,302 | $0.06 |
| Less Vacancy & Credit Loss | $0 | $0 | $0 | $0 | ($2,163,398) | ($3.36) |
| Effective Gross Income | $8,185,291 | $16,774,483 | $20,168,014 | $26,278,366 | $31,472,463 | $48.93 |
| Management Fee | $195,980 | $401,493 | $584,721 | $703,679 | $944,174 | $1.47 |
| Real Estate Taxes | $1,362,226 | $2,367,596 | $2,692,786 | $2,795,238 | $2,957,367 | $4.60 |
| Insurance | $164,552 | $380,590 | $463,153 | $500,199 | $559,844 | $0.87 |
| Other Operating Expenses | $1,942,768 | $3,404,014 | $4,264,999 | $4,249,857 | $4,249,857 | $6.61 |
| Total Expenses | $3,665,526 | $6,553,693 | $8,005,660 | $8,248,974 | $8,711,242 | $13.54 |
| Net Operating Income | $4,519,765 | $10,220,790(2) | $12,162,354(2) | $18,029,392(2) | $22,761,221(2) | $35.39 |
| CapEx | $0 | $0 | $0 | $0 | $128,644 | $0.20 |
| TI/LC | $0 | $0 | $0 | $0 | $643,220 | $1.00 |
| TI/LC Reserve(3) | $0 | $0 | $0 | $0 | ($450,000) | ($0.70) |
| Net Cash Flow | $4,519,765 | $10,220,790 | $12,162,354 | $18,029,392 | $22,439,357 | $34.89 |
| Occupancy % | 85.9% | 90.7% | 89.5% | 93.9%(4) | 91.8%(4) | |
| NOI DSCR(5) | 0.29x | 0.66x | 0.79x | 1.17x | 1.47x | |
| NCF DSCR(5) | 0.29x | 0.66x | 0.79x | 1.17x | 1.45x | |
| NOI Debt Yield(5) | 2.1% | 4.8% | 5.7% | 8.5% | 10.7% | |
| NCF Debt Yield(5) | 2.1% | 4.8% | 5.7% | 8.5% | 10.6% | |
| (1) | UW Base Rent includes rent steps through December 2025 totaling $1,036,969 representing approximately 4.5% of the underwritten base rent (excluding such rent steps). |
| (2) | The increase in NOI from 2022 to UW was primarily due to an increase in occupancy from 90.7% to 93.9% and an increase in average rental rates from $22.08 PSF to $37.62 PSF. Additionally, Penumbra, Inc. is converting the 1451 Harbor Bay Parkway property into an R&D facility on a lease through December 31, 2036, totaling 86,055 SF. Demolition has started, and Penumbra, Inc. is expected to complete the buildout by July 2025. |
| (3) | Represents a credit for 10% of the upfront TI/LC reserve of $4,500,000. |
| (4) | The underwritten economic vacancy is 8.2%. The Radius at Harbor Bay Properties were 93.9% physically occupied as of October 16, 2024, November 26, 2024 and February 11, 2025. |
| (5) | The information presented is based on the Radius at Harbor Bay Whole Loan. |
| THE INFORMATION IN THIS STRUCTURAL AND COLLATERAL TERM SHEET IS NOT COMPLETE AND MAY BE AMENDED PRIOR TO THE TIME OF SALE. THIS TERM SHEET IS NOT AN OFFER TO SELL THESE SECURITIES AND IT IS NOT A SOLICITATION OF AN OFFER TO BUY THESE SECURITIES IN ANY JURISDICTION WHERE THE OFFER OR SALE IS NOT PERMITTED. | ||
| T-124 | ||
| Mortgage Loan No. 14 – SpringHill Suites Bloomington |
| Mortgage Loan Information | Property Information | ||||||
| Mortgage Loan Seller: | JPMCB | Single Asset/Portfolio: | Single Asset | ||||
| Credit Assessment (Fitch/Moody’s/KBRA): | NR/NR/NR | Location: | Bloomington, IN 47404 | ||||
| Original Balance: | $24,500,000 | General Property Type: | Hospitality | ||||
| Cut-off Date Balance: | $24,500,000 | Detailed Property Type: | Limited Service | ||||
| % of Initial Pool Balance: | 3.3% | Title Vesting: | Fee | ||||
| Loan Purpose: | Refinance | Year Built/Renovated: | 2014/2023 | ||||
| Borrower Sponsors: | Civitas Pretium Fund, LP and Civitas | Size: | 158 Rooms | ||||
| Capital Management, LLC | Cut-off Date Balance Per Room: | $155,063 | |||||
| Guarantors: | Civitas Pretium Fund, LP and Civitas | Maturity Date Balance Per Room: | $149,707 | ||||
| Capital Management, LLC | Property Manager: | Aimbridge Hospitality, LLC | |||||
| Mortgage Rate: | 7.6510% | ||||||
| Note Date: | 1/24/2025 | Underwriting and Financial Information | |||||
| Maturity Date: | 2/5/2030 | UW NOI: | $3,606,928 | ||||
| Term to Maturity: | 60 months | UW NCF: | $3,301,021 | ||||
| Amortization Term: | 360 months | UW NOI Debt Yield: | 14.7% | ||||
| IO Period: | 12 months | UW NCF Debt Yield: | 13.5% | ||||
| Seasoning: | 0 months | UW NOI Debt Yield at Maturity: | 15.2% | ||||
| Prepayment Provisions: | L(24),D(30),O(6) | UW NCF DSCR: | 1.74x (IO) 1.58x(P&I) | ||||
| Lockbox/Cash Mgmt Status: | Hard / Springing | Most Recent NOI: | $3,546,362 (11/30/2024 TTM) | ||||
| Additional Debt Type: | NAP | 2nd Most Recent NOI(1): | $3,324,571 (12/31/2023) | ||||
| Additional Debt Balance: | NAP | 3rd Most Recent NOI(1): | $2,672,317 (12/31/2022) | ||||
| Future Debt Permitted (Type): | No (NAP) | Most Recent Occupancy: | 73.1% (11/30/2024) | ||||
| Reserves | 2nd Most Recent Occupancy(1): | 72.6% (12/31/2023) | |||||
| Type | Initial | Monthly | Cap | 3rd Most Recent Occupancy(1): | 67.5% (12/31/2022) | ||
| RE Taxes: | $107,771 | $26,943 | NAP | Appraised Value (as of): | $40,500,000 (12/10/2024) | ||
| Insurance: | $0 | Springing | NAP | Appraised Value Per Room: | $256,329 | ||
| FF&E Reserve: | $100 | (2) | NAP | Cut-off Date LTV Ratio: | 60.5% | ||
| PIP Reserve | $0 | Springing | NAP | Maturity Date LTV Ratio: | 58.4% | ||
| Sources and Uses | ||||||
| Sources | Proceeds | % of Total | Uses | Proceeds | % of Total | |
| Mortgage Loan Amount: | $24,500,000 | 100.0% | Loan Payoff: | $14,995,916 | 61.2% | |
| Return of Equity: | $8,908,631 | 36.4% | ||||
| Closing Costs: | $487,582 | 2.0% | ||||
| Upfront Reserves: | $107,871 | 0.4% | ||||
| Total Sources: | $24,500,000 | 100.0% | Total Uses: | $24,500,000 | 100.0% | |
| (1) | The increase in Occupancy and NOI from 2022 to 2023 was primarily due to renovations at the SpringHill Suites Bloomington Property between 2022 and 2023. |
| (2) | On each payment date the borrower will deposit an amount equal to 4.0% of the sum of gross rents and operating income for the calendar month two months prior to such payment date. |
The Mortgage Loan. The fourteenth largest mortgage loan (the “SpringHill Suites Bloomington Mortgage Loan”) is evidenced by a promissory note in the original principal balance of $24,500,000 and secured by the fee interest in a 158-room limited service hotel located in Bloomington, Indiana (the “SpringHill Suites Bloomington Property”). The SpringHill Suites Bloomington Mortgage Loan will be interest only for the first twelve payment dates, followed by a 30-year amortization schedule until maturity. The maturity balance for the SpringHill Suites Bloomington Mortgage Loan will be $23,653,639.
The Borrower and the Borrower Sponsors. The borrower for the SpringHill Suites Bloomington Mortgage Loan is Pretium Bloomington Suites, LLC, a single-purpose, Delaware limited liability company with one independent director. Legal counsel to the borrower delivered a non-consolidation opinion in connection with the origination of the SpringHill Suites Bloomington Mortgage Loan.
The Borrower Sponsors and Guarantors are Civitas Pretium Fund, LP and Civitas Capital Management, LLC (“Civitas” or the “Borrower Sponsors”). Civitas is a U.S.-based private real estate investment advisor, serving institutional investors, family offices, wealth management advisors and high-net-worth individuals. Civitas provides their clients with exposure to U.S. real estate through a variety of products and services, including joint venture investments and projects undertaken by the firm’s in-house development arm. Since 2009, Civitas has deployed more than $700 million into U.S. real estate across a range of property types including office, hotel, multifamily apartments and mixed-use developments. Over the past decade, Civitas has completed 82 debt and equity transactions across a broad spectrum of asset classes, taking various positions within the capital stack.
| THE INFORMATION IN THIS STRUCTURAL AND COLLATERAL TERM SHEET IS NOT COMPLETE AND MAY BE AMENDED PRIOR TO THE TIME OF SALE. THIS TERM SHEET IS NOT AN OFFER TO SELL THESE SECURITIES AND IT IS NOT A SOLICITATION OF AN OFFER TO BUY THESE SECURITIES IN ANY JURISDICTION WHERE THE OFFER OR SALE IS NOT PERMITTED. | ||
| T-125 | ||
| Hospitality – Limited Service | Loan #14 | Cut-off Date Balance: | $24,500,000 | |
| 501 North College Avenue | SpringHill Suites Bloomington | Cut-off Date LTV: | 60.5% | |
| Bloomington, IN 47404 | UW NCF DSCR: | 1.58x | ||
| UW NOI Debt Yield: | 14.7% |
The Property. The SpringHill Suites Bloomington Property is a 158-room, limited service hospitality property built on a 0.83 acre site in Bloomington, Indiana. The Borrower Sponsor acquired the SpringHill Suites Bloomington Property in March 2020 and subsequently invested a total of $2.4 million ($15,190/key) in connection with the most recent franchise mandated PIP from 2022 to 2023. A majority of the expenditures were allocated toward a complete guestroom renovation, including new carpeting, drapes, beds and bedding as well as public space modernization, inclusive of lounge, breakfast area, meeting room and lobby renovations.
Constructed in 2014 and most recently renovated in 2023, the SpringHill Suites Bloomington Property represents one of the newest properties in its competitive set. Since completion of the renovation in 2023, the SpringHill Suites Bloomington Property has achieved steady growth, seizing outsized market share relative to its competitive set, as evidenced by November 2024 TTM Occupancy and RevPAR penetration rates of 130.4% and 114.4%, respectively. Guestroom configurations include 120 Double Queen rooms and 38 King suites with each guestroom featuring amenities such as a flat-screen television with premium channels, a telephone, a desk with a chair, a dresser, a nightstand and a lounge chair. The SpringHill Suites Bloomington Property features a robust amenity package, including a fitness center, an indoor swimming pool, a convenience store, a gift shop, a lobby bar, daily complimentary breakfast and 2,028 SF of meeting space.
The SpringHill Suites Bloomington Property is situated in Bloomington, Indiana, approximately 0.8 miles from Indiana University Bloomington, the flagship campus of Indiana University. The SpringHill Suites Bloomington Property benefits from Indiana University’s enrollment of over 48,424 students, as well as visitors drawn to the university's renowned academic programs, research conferences and NCAA Division I, Power 5 athletic events. Over the past ten years, the Indiana University Bloomington campus has experienced an enrollment CAGR of 1.2%. Approximately 51% of Indiana University students are from out of state or international, creating consistent hospitality demand. The presence of the Kelley School of Business and the O’Neil School of Public and Environmental Affairs serves as a further demand driver for visitors. During notable university events, accommodations at Bloomington hotels, including the SpringHill Suites Bloomington Property, are in high demand with lodging frequently filling to capacity. The SpringHill Suites Bloomington Property’s accessibility is augmented by its proximity to the intersection of Interstate 69 and State Road 46, facilitating easy travel for university guests. The SpringHill Suites Bloomington Property also benefits from local events, including Little 500, the largest collegiate bike race in the United States, attracting on average 25,000 spectators, hosted annually at Indiana University Bloomington’s campus. The SpringHill Suites Bloomington Property’s proximity to Kirkwood Avenue, the city’s primary retail and dining corridor, serves as a further demand driver, enhancing the area’s appeal.
According to the appraisal, demand segmentation for the SpringHill Suites Bloomington is 90% transient and 10% meeting & group. The SpringHill Suites Bloomington Property is subject to a long-term franchise agreement with Marriott International, Inc., executed in March 2020 and expiring in March 2035, and benefits from access to Marriott’s reservation system and guest loyalty program.
The following table presents certain information relating to the Occupancy, ADR and RevPAR of the SpringHill Suites Bloomington Property and its competitive set:
| Historical Occupancy, ADR, RevPAR(1) | |||||||||
| Competitive Set(2) | SpringHill Suites Bloomington Property(3) | Penetration Factor | |||||||
| Year | Occupancy | ADR | RevPAR | Occupancy | ADR | RevPAR | Occupancy | ADR | RevPAR |
| 2021 | 53.6% | $136.71 | $73.28 | 58.8% | $116.42 | $68.50 | 109.8% | 85.2% | 93.5% |
| 2022 | 56.6% | $168.72 | $95.50 | 67.5% | $150.36 | $101.55 | 119.3% | 89.1% | 106.3% |
| 2023 | 59.5% | $180.74 | $107.46 | 72.6% | $160.23 | $116.26 | 122.0% | 88.7% | 108.2% |
| TTM Nov. 2024 | 56.0% | $190.73 | $106.84 | 73.1% | $167.26 | $122.20 | 130.4% | 87.7% | 114.4% |
Source: Third-party research report.
| (1) | The variances between the underwriting, the appraisal and industry report data with respect to occupancy, ADR and RevPAR are attributable in part to variances in reporting methodologies and/or timing differences. |
| (2) | According to a third-party research report, the competitive set for 2021 through 2023 and TTM Nov. 2024 includes SpringHill Suites Bloomington, Indiana Memorial Union Biddle Hotel & Conference Center, Courtyard Bloomington, Hilton Garden Inn Bloomington, Hyatt Place Bloomington and Graduate Hotel Bloomington. |
| (3) | SpringHill Suites Bloomington Property metrics are based on the historical operating statements provided by the Borrower Sponsor. |
The Market. The SpringHill Suites Bloomington Property is located in Monroe County, approximately 50 miles southwest of Indianapolis, 160 miles west of Cincinnati and 226 miles east of St. Louis. Monroe County is home to Indiana University, the area’s largest employer, which provides the region with an educated and skilled workforce. Bloomington offers modern urban amenities combined with a forested landscape featuring three major area lakes. The city’s walkable downtown district is home to restaurants, bars, shops and venues as well as an arts scene. Other local demand drivers include the Monroe Convention Center, which is located only two miles south of the SpringHill Suites Bloomington Property and offers 24,000 SF of meeting space with 10 private meeting rooms and banquet facilities. Leisure demand generators include attractions such as, among others, Lake Monroe, Eagle Pointe Golf Resort, Brown County State Park and Yellowwood National Forest .
Monroe County’s economy features job growth that has outpaced the state and nation. The region’s economy is strengthened by a manufacturing industry, which produces appliances, medical and surgical equipment, and electronics. Moreover, Bloomington is also home to the state’s only national forest, the state’s largest inland lake and a large number of parks, offering a variety of outdoor recreational opportunities. According to the appraisal, the area has seen considerable investment in recent years. In June 2024, Simtra BioPharma Solutions began construction on a $250 million expansion at its Bloomington sterile fill/finish manufacturing campus which is expected to be completed in late 2026 and is expected to add hundreds of jobs. Additionally, infrastructure construction of the new Hopewell neighborhood development project, which is expected to support up to 1,000 new units, on the former Indiana University Hospital site began in July 2023, with the city investing nearly $14 million. The appraisal further notes that the Government sector is the largest employer in Monroe County, accounting for roughly 29.9% of the regional workforce. Education & Health Services and Trade, Transportation & Utilities sectors are the second and third largest industries in the area, accounting for 15% and 12.5% of total employment, respectively. Together, these three industries comprise 57.4% of the region’s share of employment. Bloomington’s employment in the life sciences field is six times greater than the U.S. average, and employment in the technology field has grown by more than 80% in recent years.
| THE INFORMATION IN THIS STRUCTURAL AND COLLATERAL TERM SHEET IS NOT COMPLETE AND MAY BE AMENDED PRIOR TO THE TIME OF SALE. THIS TERM SHEET IS NOT AN OFFER TO SELL THESE SECURITIES AND IT IS NOT A SOLICITATION OF AN OFFER TO BUY THESE SECURITIES IN ANY JURISDICTION WHERE THE OFFER OR SALE IS NOT PERMITTED. | ||
| T-126 | ||
| Hospitality – Limited Service | Loan #14 | Cut-off Date Balance: | $24,500,000 | |
| 501 North College Avenue | SpringHill Suites Bloomington | Cut-off Date LTV: | 60.5% | |
| Bloomington, IN 47404 | UW NCF DSCR: | 1.58x | ||
| UW NOI Debt Yield: | 14.7% |
According to a third-party market research report, the estimated 2024 population within a one-, three-, and five-mile radius of the SpringHill Suites Bloomington Property was 19,797, 74,704, and 106,661, respectively. According to the same third party market research report, the 2024 average household income within the same radii was $34,144, $57,388, and $70,095, respectively.
The following table presents the primary competitive properties to the SpringHill Suites Bloomington Property:
| Competitive Property Summary(1) | |||||||
| Property | Year Built | Rooms | Transient | Meeting & Group | 2023 Occupancy(2) | 2023 ADR(2) | 2023 RevPAR(2) |
| SpringHill Suites Bloomington | 2014 | 158 | 90% | 10% | 72.6% | $160.23 | $116.26 |
| Indiana Memorial Union Biddle Hotel & Conference Center | 1959 | 186 | 80% | 20% | NAV | NAV | NAV |
| Courtyard Bloomington | 1996 | 117 | 90% | 10% | NAV | NAV | NAV |
| Hilton Garden Inn Bloomington | 2006 | 168 | 90% | 10% | NAV | NAV | NAV |
| Hyatt Place Bloomington | 2014 | 172 | 90% | 10% | NAV | NAV | NAV |
| Graduate Hotel Bloomington | 2018 | 150 | 90% | 10% | NAV | NAV | NAV |
| Comp. Set Total/Average(3) | 793 | 59.5% | $180.74 | $107.46 | |||
Source: Appraisal, unless otherwise indicated.
| (1) | Variances between the lender underwriting, appraisal and third party industry report with respect to occupancy, ADR and RevPAR are attributable in part to variances in reporting methodologies and/or timing. |
| (2) | 2023 Occupancy, ADR and RevPAR figures for the SpringHill Suites Bloomington Property represent the annual period ending December 2023 based on historical operating statements provided by the Borrower Sponsor. |
| (3) | According to a third-party industry report. |
Appraisal. The appraiser concluded to an “as-is” value for the SpringHill Suites Bloomington Property of $40,500,000 as of December 10, 2024.
Environmental Matters. According to the Phase I environmental site assessment dated December 20, 2024, there was no evidence of any recognized environmental conditions at the SpringHill Suites Bloomington Property.
| THE INFORMATION IN THIS STRUCTURAL AND COLLATERAL TERM SHEET IS NOT COMPLETE AND MAY BE AMENDED PRIOR TO THE TIME OF SALE. THIS TERM SHEET IS NOT AN OFFER TO SELL THESE SECURITIES AND IT IS NOT A SOLICITATION OF AN OFFER TO BUY THESE SECURITIES IN ANY JURISDICTION WHERE THE OFFER OR SALE IS NOT PERMITTED. | ||
| T-127 | ||
| Hospitality – Limited Service | Loan #14 | Cut-off Date Balance: | $24,500,000 | |
| 501 North College Avenue | SpringHill Suites Bloomington | Cut-off Date LTV: | 60.5% | |
| Bloomington, IN 47404 | UW NCF DSCR: | 1.58x | ||
| UW NOI Debt Yield: | 14.7% |
Operating History and Underwritten Net Cash Flow. The following table presents certain information relating to the historical operating performance and the Underwritten Net Cash Flow at the SpringHill Suites Bloomington Property:
| Cash Flow Analysis(1) | ||||||||
| 2019 | 2020 | 2021(2) | 2022(2) | 2023 | TTM 11/30/2024 | UW | UW per Room | |
| Occupancy | 68.6% | 37.3% | 58.8% | 67.5% | 72.6% | 73.1% | 73.1% | |
| ADR | $131.24 | $106.84 | $116.42 | $150.36 | $160.23 | $167.26 | $167.26 | |
| RevPAR | $90.03 | $39.85 | $68.50 | $101.55 | $116.26 | $122.20 | $122.20 | |
| Room Revenue | $5,192,060 | $2,304,380 | $3,950,425 | $5,856,661 | $6,704,864 | $7,066,736 | $7,047,429 | $44,604 |
| Food & Beverage | $0 | $23,709 | $67,243 | $87,541 | $131,014 | $143,556 | $143,164 | $906 |
| Parking Income | $477,546 | $223,222 | $281,567 | $343,865 | $354,097 | $458,353 | $457,101 | $2,893 |
| Total Revenue | $5,669,606 | $2,551,311 | $4,299,235 | $6,288,067 | $7,189,975 | $7,668,645 | $7,647,693 | $48,403 |
| Room Expense | $1,382,904 | $549,853 | $667,081 | $940,853 | $1,053,190 | $1,127,078 | $1,123,999 | $7,114 |
| Food & Beverage Expense | $0 | $14,992 | $52,110 | $92,315 | $89,175 | $90,867 | $90,619 | $574 |
| Parking Expense | $110,496 | $17,201 | $34,537 | $39,302 | $28,843 | $39,905 | $39,796 | $252 |
| Total Department Expenses | $1,493,400 | $582,046 | $753,728 | $1,072,470 | $1,171,208 | $1,257,850 | $1,254,413 | $7,939 |
| Departmental Profit | $4,176,206 | $1,969,265 | $3,545,507 | $5,215,597 | $6,018,767 | $6,410,795 | $6,393,280 | $40,464 |
| Management Fee | $170,088 | $76,539 | $128,977 | $188,642 | $215,699 | $230,059 | $229,431 | $1,452 |
| Real Estate Taxes | $138,422 | $264,562 | $359,569 | $251,892 | $291,562 | $396,566 | $313,896 | $1,987 |
| Insurance | $31,709 | $28,489 | $55,340 | $43,700 | $57,429 | $64,674 | $74,832 | $474 |
| Other Expenses | $0 | $1,680 | $197 | $0 | $0 | $0 | $0 | $0 |
| Total Undistributed Expenses | $1,631,992 | $1,037,804 | $1,531,381 | $2,059,046 | $2,129,506 | $2,173,134 | $2,168,193 | $13,723 |
| Total Expenses | $3,465,611 | $1,991,120 | $2,829,192 | $3,615,750 | $3,865,404 | $4,122,283 | $4,040,765 | $25,574 |
| Net Operating Income | $2,203,995 | $560,191 | $1,470,043 | $2,672,317 | $3,324,571 | $3,546,362 | $3,606,928 | $22,829 |
| FF&E | $226,784 | $102,052 | $171,969 | $251,523 | $287,599 | $306,746 | $305,908 | $1,936 |
| Net Cash Flow | $1,977,211 | $458,138 | $1,298,074 | $2,420,794 | $3,036,972 | $3,239,616 | $3,301,021 | $20,893 |
| NOI DSCR | 1.06x | 0.27x | 0.70x | 1.28x | 1.59x | 1.70x | 1.73x | |
| NCF DSCR | 0.95x | 0.22x | 0.62x | 1.16x | 1.46x | 1.55x | 1.58x | |
| NOI Debt Yield | 9.0% | 2.3% | 6.0% | 10.9% | 13.6% | 14.5% | 14.7% | |
| NCF Debt Yield | 8.1% | 1.9% | 5.3% | 9.9% | 12.4% | 13.2% | 13.5% | |
| (1) | The variances between the underwriting, the appraisal and industry report data with respect to occupancy, ADR and RevPAR are attributable in part to variances in reporting methodologies and/or timing differences. |
| (2) | The increase in Occupancy and NOI from 2022 to 2023 was primarily due to renovations at the SpringHill Suites Bloomington Property between 2022 and 2023. |
| THE INFORMATION IN THIS STRUCTURAL AND COLLATERAL TERM SHEET IS NOT COMPLETE AND MAY BE AMENDED PRIOR TO THE TIME OF SALE. THIS TERM SHEET IS NOT AN OFFER TO SELL THESE SECURITIES AND IT IS NOT A SOLICITATION OF AN OFFER TO BUY THESE SECURITIES IN ANY JURISDICTION WHERE THE OFFER OR SALE IS NOT PERMITTED. | ||
| T-128 | ||
| Mortgage Loan No. 15 – 100 Ceramic Tile Drive |
| Mortgage Loan Information | Property Information | ||||||
| Mortgage Loan Seller: | MSMCH | Single Asset/Portfolio: | Single Asset | ||||
| Credit Assessment (Fitch/Moody’s/KBRA): | NR/NR/NR | Location: | Morganton, NC 28655 | ||||
| Original Balance: | $20,000,000 | General Property Type: | Industrial | ||||
| Cut-off Date Balance: | $20,000,000 | Detailed Property Type: | Warehouse/Distribution | ||||
| % of Initial Pool Balance: | 2.7% | Title Vesting: | Fee | ||||
| Loan Purpose: | Refinance | Year Built/Renovated: | 1989/2021 | ||||
| Borrower Sponsor: | Sam Hakim | Size: | 378,692 SF | ||||
| Guarantor: | Sam Hakim | Cut-off Date Balance PSF: | $53 | ||||
| Mortgage Rate: | 6.84000% | Maturity Date Balance PSF: | $53 | ||||
| Note Date: | 12/18/2024 | Property Manager: | Self-Managed | ||||
| Maturity Date: | 1/1/2030 | Underwriting and Financial Information | |||||
| Term to Maturity: | 60 months | UW NOI: | $2,318,938 | ||||
| Amortization Term: | 0 months | UW NCF: | $2,170,694 | ||||
| IO Period: | 60 months | UW NOI Debt Yield: | 11.6% | ||||
| Seasoning: | 1 month | UW NCF Debt Yield: | 10.9% | ||||
| Prepayment Provisions: | L(25),D(28),O(7) | UW NOI Debt Yield at Maturity: | 11.6% | ||||
| Lockbox/Cash Mgmt Status: | Hard/Springing | UW NCF DSCR: | 1.57x | ||||
| Additional Debt Type: | NAP | Most Recent NOI(3): | NAV | ||||
| Additional Debt Balance: | NAP | 2nd Most Recent NOI(3): | NAV | ||||
| Future Debt Permitted (Type): | No (NAP) | 3rd Most Recent NOI(3): | NAV | ||||
| Reserves | Most Recent Occupancy: | 100.0% (2/1/2025) | |||||
| Type | Initial | Monthly | Cap | 2nd Most Recent Occupancy(3): | NAV | ||
| RE Tax: | $22,885 | $4,577 | NAP | 3rd Most Recent Occupancy(3): | NAV | ||
| Insurance: | $0 | Springing(1) | NAP | Appraised Value (as of): | $35,000,000 (9/5/2024) | ||
| Deferred Maintenance(2): | $129,750 | $0 | NAP | Appraised Value PSF: | $92 | ||
| Replacement Reserve: | $0 | $3,156 | NAP | Cut-off Date LTV Ratio: | 57.1% | ||
| TI/LC Reserve: | $0 | $6,312 | NAP | Maturity Date LTV Ratio: | 57.1% | ||
| Sources and Uses | ||||||
| Sources | Proceeds | % of Total | Uses | Proceeds | % of Total | |
| Mortgage Loan Amount: | $20,000,000 | 100.0% | Loan Payoff: | $11,852,376 | 59.3% | |
| Return of Equity: | $7,466,112 | 37.3% | ||||
| Closing Costs: | $528,877 | 2.6% | ||||
| Reserves: | $152,635 | 0.8% | ||||
| Total Sources: | $20,000,000 | 100.0% | Total Uses: | $20,000,000 | 100.0% | |
| (1) | Springing monthly insurance payments upon (i) the occurrence of an event of default or (ii) evidence of an acceptable blanket insurance policy is not provided to the lender. |
| (2) | Includes, among other items, repair or replacement of structural columns damaged by forklifts and sectional full depth replacement of entry drive. |
| (3) | Historical NOI and occupancy are not available due to the borrower acquiring the 100 Ceramic Tile Drive Property (as defined below) in 2020, the subsequent renovation in 2021, and the execution of a new master lease in 2024. |
The Mortgage Loan. The fifteenth largest mortgage loan (the “100 Ceramic Tile Drive Mortgage Loan”) is evidenced by a promissory note in the original principal amount of $20,000,000 and secured by a first priority fee mortgage encumbering a 378,692 SF industrial property located in Morganton, North Carolina (the “100 Ceramic Tile Drive Property”).
The Borrower and Borrower Sponsor. The borrower for the 100 Ceramic Tile Drive Mortgage Loan is Ceramic Drive Holdings, LLC, a single-purpose Delaware limited liability company with one independent director in its organizational structure. The borrower is wholly owned by AC Morganton, LLC. AC Morganton, LLC is owned by various members of the Hakim, Melamed and Arianpour families, none of which account for more than 19.0% of the ownership interest. Sam Hakim holds a 15.0% ownership interest in AC Morganton, LLC and serves as its managing member. Bobby (Babak) Melamed, who currently serves as the chief executive officer of Unix Packaging, LLC (“Unix”), the sole subtenant of the 100 Ceramic Drive Property, holds an 18.5% interest in AC Morganton, LLC.
The borrower sponsor and the non-recourse carveout guarantor is Sam Hakim, the founder of SM Management and Citi Real Estate, a family owned and operated real estate investment company. Sam Hakim also holds a 15.0% ownership interest in Unix. Sam Hakim has been active in real estate over 20 years and has been responsible for the new development of over 5,000 multifamily units and 300,000 SF of retail and office properties throughout Southern California. The Hakim family real estate companies have owned and/or developed over 100,000 apartment units and over 3 million SF of office and retail space. The borrower sponsor also maintains a personal real estate portfolio with ownership interests in 28 assets located across Beverly Hills and Los Angeles, California, which includes multifamily, single family rental, retail and office properties.
| THE INFORMATION IN THIS STRUCTURAL AND COLLATERAL TERM SHEET IS NOT COMPLETE AND MAY BE AMENDED PRIOR TO THE TIME OF SALE. THIS TERM SHEET IS NOT AN OFFER TO SELL THESE SECURITIES AND IT IS NOT A SOLICITATION OF AN OFFER TO BUY THESE SECURITIES IN ANY JURISDICTION WHERE THE OFFER OR SALE IS NOT PERMITTED. | ||
| T-129 | ||
| Industrial – Warehouse/Distribution | Loan #15 | Cut-off Date Balance: | $20,000,000 | |
| 100 Ceramic Tile Drive | 100 Ceramic Tile Drive | Cut-off Date LTV: | 57.1% | |
| Morganton, NC 28655 | UW NCF DSCR: | 1.57x | ||
| UW NOI Debt Yield: | 11.6% |
The Property. The 100 Ceramic Tile Drive Property consists of one warehouse/distribution industrial building comprising 378,692 SF on a 50.25-acre site in Morganton, North Carolina that includes 92 total parking spaces (0.24 per 1,000 SF). The 100 Ceramic Tile Drive Property was originally constructed in 1989, and was acquired by the borrower sponsor in 2020 for approximately $4.58 million. The building was subsequently renovated in 2021 for approximately $11.2 million, which included a 50,280 SF building expansion, upgraded floor drains for the bottling lines, expanded sprinkler systems, new restrooms, LED light replacements, new overhead electrical conduit lines, expansion of the heating, ventilation and air conditioning systems, and adding a climate controlled cooler area for the bottling process. Additionally, the borrower sponsor has spent approximately $65.0 million to outfit the building with specialized state of the art equipment and machinery for its bottling and manufacturing use. The 100 Ceramic Tile Drive Property features 15 dock high doors, 5 grade level doors, and clear heights of 20’ to 35’. The 100 Ceramic Tile Drive Property is 100.0% occupied by Unix.
Sole Tenant.
Unix (378,692 SF, 100.0% of NRA, 100.0% of underwritten rent). Unix is a privately held contract beverage manufacturer that was founded in 2010 by Bobby (Babak) Melamed who currently serves as the firm’s chief executive officer, and is partially owned by the borrower sponsor (15.0%). The company specializes in complete turn-key production lines and offers a variety of options including PET (polyethylene terephthalate) blow mold solutions, high speed carbonated glass and PET lines, high speed PET water liens, and specialty boutique lines that cater to both small and large volume runs for private label and branded customers. Unix manufactures a variety of drink types including functional beverages, carbonated soft drinks, purified/enhanced waters, alkaline waters, kombucha and teas. Unix’s diverse customer base includes established brands such as Voss, Prime, and numerous Coca-Cola brands including Vitamin Water, Smartwater, and BodyArmor. Additionally, Unix provides private label offerings for companies which include Costco, Target and Walmart, Trader Joe’s, and Whole Foods. Unix has occupied the 100 Ceramic Tile Drive Property since 2021, with the facility at the 100 Ceramic Tile Drive Property being its largest manufacturing plant in the company’s portfolio, and the only distribution hub in the eastern United States.
In connection with the origination of the 100 Ceramic Tile Drive Mortgage Loan, the borrower has entered into a new 14-year master lease agreement (the “Master Lease”) with an affiliate of the borrower, which is guaranteed by the borrower sponsor and the existing base lease with Unix has been converted to a sublease that is junior and subordinate to the Master Lease. Unix’s sublease is an 18-year triple-net sublease that is scheduled to expire in December 2038, with two, five-year renewal options remaining, and no termination options. Unix currently pays an annual base rent of $2,472,083 annually ($6.53 PSF) with 3.0% annual escalations. The Master Lease is coterminous with the Unix sublease, and provides for fixed rental payments that are $5,000 less than the annual payments under the Unix sublease.
The following table presents certain information relating to the sole subtenant at the 100 Ceramic Tile Drive Property:
| Tenant Summary(1) | |||||||||
| Tenant Name | Credit Rating (Fitch/ Moody's/S&P) | Tenant SF | Approx.% of SF | Annual UW Base Rent | Annual UW Base Rent PSF | % of Total Annual UW Base Rent | Lease Expiration | Renewal Option | Term. Option (Y/N) |
| Unix | NR/NR/NR | 378,692 | 100.0% | $2,467,083 | $6.51 | 100.0% | 12/31/2038 | 2 x 5 year | N |
| Subtotal/Wtd. Avg. | 378,692 | 100.0% | $2,467,083 | $6.51 | 100.0% | ||||
| Vacant Space | 0 | 0.0% | $0 | $0.00 | 0.0% | ||||
| Total/Wtd. Avg. | 378,692 | 100.0% | $2,467,083 | $6.51 | 100.0% | ||||
| (1) | Information is based on the underwritten rent roll. |
The following table presents certain information relating to the lease rollover schedule at the 100 Ceramic Tile Drive Property:
| Lease Rollover Schedule(1) | ||||||||
| Year | # of Leases Rolling | SF Rolling | UW Base Rent PSF Rolling | Approx. % of Total SF Rolling | Approx. Cumulative % of SF Rolling | Total UW Base Rent Rolling | Approx. % of Total Rent Rolling | Approx. Cumulative % of Total Rent Rolling |
| MTM | 0 | 0 | $0.00 | 0.0% | 0.0% | $0 | 0.0% | 0.0% |
| 2025 | 0 | 0 | $0.00 | 0.0% | 0.0% | $0 | 0.0% | 0.0% |
| 2026 | 0 | 0 | $0.00 | 0.0% | 0.0% | $0 | 0.0% | 0.0% |
| 2027 | 0 | 0 | $0.00 | 0.0% | 0.0% | $0 | 0.0% | 0.0% |
| 2028 | 0 | 0 | $0.00 | 0.0% | 0.0% | $0 | 0.0% | 0.0% |
| 2029 | 0 | 0 | $0.00 | 0.0% | 0.0% | $0 | 0.0% | 0.0% |
| 2030 | 0 | 0 | $0.00 | 0.0% | 0.0% | $0 | 0.0% | 0.0% |
| 2031 | 0 | 0 | $0.00 | 0.0% | 0.0% | $0 | 0.0% | 0.0% |
| 2032 | 0 | 0 | $0.00 | 0.0% | 0.0% | $0 | 0.0% | 0.0% |
| 2033 | 0 | 0 | $0.00 | 0.0% | 0.0% | $0 | 0.0% | 0.0% |
| 2034 | 0 | 0 | $0.00 | 0.0% | 0.0% | $0 | 0.0% | 0.0% |
| 2035 | 0 | 0 | $0.00 | 0.0% | 0.0% | $0 | 0.0% | 0.0% |
| 2036 & Beyond | 1 | 378,692 | $6.51 | 100.0% | 100.0% | $2,467,083 | 100.0% | 100.0% |
| Vacant | 0 | 0 | $0.00 | 0.0% | 100.0% | $0 | 0.0% | 100.0% |
| Total/Wtd. Avg. | 1 | 378,692 | $6.51 | 100.0% | $2,467,083 | 100.0% | ||
| (1) | Information is based on the underwritten rent roll. |
| THE INFORMATION IN THIS STRUCTURAL AND COLLATERAL TERM SHEET IS NOT COMPLETE AND MAY BE AMENDED PRIOR TO THE TIME OF SALE. THIS TERM SHEET IS NOT AN OFFER TO SELL THESE SECURITIES AND IT IS NOT A SOLICITATION OF AN OFFER TO BUY THESE SECURITIES IN ANY JURISDICTION WHERE THE OFFER OR SALE IS NOT PERMITTED. | ||
| T-130 | ||
| Industrial – Warehouse/Distribution | Loan #15 | Cut-off Date Balance: | $20,000,000 | |
| 100 Ceramic Tile Drive | 100 Ceramic Tile Drive | Cut-off Date LTV: | 57.1% | |
| Morganton, NC 28655 | UW NCF DSCR: | 1.57x | ||
| UW NOI Debt Yield: | 11.6% |
The Market. The 100 Ceramic Tile Drive Property is located in Morganton, North Carolina within the Burke County submarket of the metropolitan Hickory – NC, USA warehouse market. The 100 Ceramic Tile Drive Property is approximately 50 miles northeast from downtown Ashville, approximately 79.2 miles northwest from downtown Charlotte, and approximately 74.9 miles northwest from the Charlotte Douglas International Airport. Morganton is a suburban area comprised of a mixture of commercial, industrial, and residential developments. The surrounding neighborhood is primarily industrial in nature with a mix of commercial and support developments including shopping centers, franchise restaurants, service stations, convenience stores, office buildings and recreational areas. The region’s economy is predominantly based on manufacturing, health care/social assistance, and retail trade industries that represent a combined total of 50% of the workforce. The 100 Ceramic Tile Drive Property is located along the Interstate 40 corridor which serves as the area’s commercial and industrial hub. Other nearby industrial users include Greenworks, VEKA East, Cherokee Manufactory, and Sustainable Corrugated. The area provides good access to various transportation networks that pass within one mile of the 100 Ceramic Tile Drive Property including US. Highway 70 to the north and Interstate 40 to the south. I-40 is the third longest interstate highway in the U.S. that runs from southern California to the Atlantic coast of North Carolina and is the primary thoroughfare in the region providing access to nearby major cities.
According to the appraisal, as of the second quarter of 2024, the vacancy rate in the metropolitan Hickory – NC USA warehouse market was approximately 2.9%, with average asking rents of $4.92 PSF and an inventory of approximately 67.3 million SF. According to the appraisal, as of the second quarter of 2024, the vacancy rate in the Burke County submarket was approximately 2.8%, with average asking rents of $4.08 PSF and an inventory of 9.8 million SF. According to the appraisal, the 2024 population within a one-, three-, and five-mile radius of the 100 Ceramic Tile Drive Property was 821, 7,507, and 17,632, respectively. The 2024 average household income within the same radii was $77,320, $85,610, and $87,519, respectively.
The following table presents certain information relating to the appraisal’s market rent conclusions for the 100 Ceramic Tile Drive Property:
| Market Rent Summary | ||||||
| Category | Market Rent (PSF) | Lease Term (Yrs) | Rental Increase Projection | Tenant Improvements (New / Renewals) | Leasing Commissions (New / Renewals) | Reimbursements |
| Industrial Space | $6.50 | 10 | 3% per annum | $1.00 / $0.50 | 6.0% / 4.0% | NNN |
Source: Appraisal.
The following table presents comparable industrial leases with respect to the 100 Ceramic Tile Drive Property:
| Comparable Industrial Lease Summary | |||||||
| Property Name/Location | Year Built / Renovated | Total SF | Tenant Name | Lease SF | Lease Term (Yrs.) | Rent PSF | Lease Type |
100 Ceramic Tile Drive (1) Morganton, North Carolina | 1989 / 2021 | 378,692 | Unix | 378,692 | 18(2) | $6.51 | NNN |
Lincoln Commerce Center West – Building 1 1011 Lincoln Commerce Court Denver, NC | 2024 / NAP | 534,087 | Shenzhen Senior Technology Materials / Green New Energy Materials | 534,087 | 11.0 | $7.50 | NNN |
Statesville Commerce Center – Building Two 146 Barkley Road East Statesville, North Carolina | 2023 / NAP | 263,690 | Weinig Holz-Her | 149,110 | 10.1 | $7.15 | NNN |
Former ABB Warehouse 101 Reliance Drive Kings Mountain, North Carolina | 1981 / 2020 | 237,000 | Actega | 237,000 | 15.7 | $4.58 | NNN |
Circor International 1710 Airport Road Monroe, North Carolina | 1979 / NAP | 183,509 | Circor | 183,509 | 15.0 | $6.25 | Absolute Net |
Carolina 85 Logistics Center 300 Woodlake Parkway Kings Mountain, North Carolina | 2022 / NAP | 300,240 | UTZ | 150,120 | 5.0 | $6.12 | NNN |
Source: Appraisal, unless otherwise noted.
| (1) | Information is based on the underwritten rent roll other than Year Built / Renovated. |
| THE INFORMATION IN THIS STRUCTURAL AND COLLATERAL TERM SHEET IS NOT COMPLETE AND MAY BE AMENDED PRIOR TO THE TIME OF SALE. THIS TERM SHEET IS NOT AN OFFER TO SELL THESE SECURITIES AND IT IS NOT A SOLICITATION OF AN OFFER TO BUY THESE SECURITIES IN ANY JURISDICTION WHERE THE OFFER OR SALE IS NOT PERMITTED. | ||
| T-131 | ||
| Industrial – Warehouse/Distribution | Loan #15 | Cut-off Date Balance: | $20,000,000 | |
| 100 Ceramic Tile Drive | 100 Ceramic Tile Drive | Cut-off Date LTV: | 57.1% | |
| Morganton, NC 28655 | UW NCF DSCR: | 1.57x | ||
| UW NOI Debt Yield: | 11.6% |
Underwritten Net Cash Flow. The following table presents certain information relating to the Underwritten Net Cash Flow at the 100 Ceramic Tile Drive Property:
| Cash Flow Analysis(1) | |||
| UW | UW PSF | ||
| Gross Potential Rent(2) | $2,467,083 | $6.51 | |
| Reimbursement | $495,821 | $1.31 | |
| Other Income | $0 | $0.00 | |
| Less Vacancy & Credit Loss | ($148,145) |
| ($0.39) |
| Effective Gross Income | $2,814,759 | $7.43 | |
| Real Estate Taxes | $53,319 | $0.14 | |
| Insurance | $168,714 | $0.45 | |
| Other Operating Expenses | $273,789 |
| $0.72 |
| Total Operating Expenses | $495,821 | $1.31 | |
| Net Operating Income | $2,318,938 | $6.12 | |
| Capital Expenditures | $37,869 | $0.10 | |
| TI/LC | $110,375 |
| $0.29 |
| Net Cash Flow | $2,170,694 | $5.73 | |
| Occupancy % | 95.0% | (3) | |
| NOI DSCR | 1.67x | ||
| NCF DSCR | 1.57x | ||
| NOI Debt Yield | 11.6% | ||
| NCF Debt Yield | 10.9% | ||
| (1) | Historical financial and occupancy information is not available due to the borrower acquiring the property in 2020, the subsequent renovation in 2021, and the execution of the Master Lease in 2024. |
| (2) | UW Gross Potential Rent is based on the rent roll (based on the Unix sublease) as of December 1, 2024 and includes rent steps of $72,002 through January 2025. |
| (3) | UW Occupancy % represents economic occupancy. |
| THE INFORMATION IN THIS STRUCTURAL AND COLLATERAL TERM SHEET IS NOT COMPLETE AND MAY BE AMENDED PRIOR TO THE TIME OF SALE. THIS TERM SHEET IS NOT AN OFFER TO SELL THESE SECURITIES AND IT IS NOT A SOLICITATION OF AN OFFER TO BUY THESE SECURITIES IN ANY JURISDICTION WHERE THE OFFER OR SALE IS NOT PERMITTED. | ||
| T-132 | ||