FRONTIER COMMUNICATIONS CORPORATION
FORM 10-K
ANNUAL REPORT PURSUANT TO SECTION 13 OR 15(d)
OF THE SECURITIES EXCHANGE ACT OF 1934
FOR THE YEAR ENDED DECEMBER 31, 2009
UNITED STATES SECURITIES AND EXCHANGE COMMISSION
WASHINGTON, D.C. 20549
FORM 10-K
(Mark one)
x ANNUAL REPORT PURSUANT TO SECTION 13 OR 15(d) OF THE SECURITIES EXCHANGE ACT OF 1934
For the fiscal year ended December 31, 2009
OR
¨ TRANSITION REPORT PURSUANT TO SECTION 13 OR 15(d) OF THE SECURITIES EXCHANGE ACT OF 1934
For the transition period from _________ to ___________
Commission file number 001-11001
FRONTIER COMMUNICATIONS CORPORATION
(Exact name of registrant as specified in its charter)
| Delaware | | 06-0619596 |
| (State or other jurisdiction of | | (I.R.S. Employer Identification No.) |
| incorporation or organization) | | |
| | | |
| 3 High Ridge Park | | |
| Stamford, Connecticut | | 06905 |
| (Address of principal executive offices) | | (Zip Code) |
| | | |
Registrant's telephone number, including area code: (203) 614-5600
Securities registered pursuant to Section 12(b) of the Act:
| Title of each class | | Name of each exchange on which registered |
| Common Stock, par value $.25 per share | | New York Stock Exchange |
| Series A Participating Preferred Stock Purchase Rights | | New York Stock Exchange |
Securities registered pursuant to Section 12(g) of the Act: NONE
Indicate by check mark if the registrant is a well-known seasoned issuer, as defined in Rule 405 of the Securities Act.
Yes X No __
Indicate by check mark if the registrant is not required to file reports pursuant to Section 13 or 15(d) of the Act. Yes No X
Indicate by check mark whether the registrant (1) has filed all reports required to be filed by Section 13 or 15(d) of the Securities Exchange Act of 1934 during the preceding 12 months (or for such shorter period that the registrant was required to file such reports), and (2) has been subject to such filing requirements for the past 90 days. Yes X No __
Indicate by check mark whether the registrant has submitted electronically and posted on its corporate Web site, if any, every Interactive Data File required to be submitted and posted pursuant to Rule 405 of Regulation S-T during the preceding 12 months (or for such shorter period that the registrant was required to submit and post such files). Yes __ No ___
Indicate by check mark if disclosure of delinquent filers pursuant to Item 405 of Regulation S-K is not contained herein, and will not be contained, to the best of registrant's knowledge, in definitive proxy or information statements incorporated by reference in Part III of this Form 10-K or any amendment to this Form 10-K. [ ]
Indicate by check mark whether the registrant is a large accelerated filer, an accelerated filer, a non-accelerated filer or a smaller reporting company. See definition of “accelerated filer”, “large accelerated filer” and “smaller reporting company” in Rule 12b-2 of the Exchange Act. (Check one):
Large Accelerated Filer [X] Accelerated Filer [ ] Non-Accelerated Filer [ ] Smaller Reporting Company [ ]
Indicate by check mark whether the registrant is a shell company (as defined in Rule 12b-2 of the Exchange Act).Yes No X
The aggregate market value of common stock held by non-affiliates of the registrant on June 30, 2009 was approximately $2,211,628,000 based on the closing price of $7.14 per share on such date.
The number of shares outstanding of the registrant's Common Stock as of February 16, 2010 was 312,284,000.
DOCUMENT INCORPORATED BY REFERENCE
Portions of the Proxy Statement for the Company's 2010 Annual Meeting of Stockholders are incorporated by reference into Part III of this Form 10-K.
FRONTIER COMMUNICATIONS CORPORATION AND SUBSIDIARIES
TABLE OF CONTENTS
| PART 1 | | Page |
| | | |
| Item 1. | Business | 2 |
| | | |
| Item 1A. | Risk Factors | 10 |
| | | |
| Item 1B. | Unresolved Staff Comments | 20 |
| | | |
| Item 2. | Properties | 20 |
| | | |
| Item 3. | Legal Proceedings | 21 |
| | | |
| Item 4. | Submission of Matters to a Vote of Security Holders | 21 |
| | | |
| Executive Officers | | 22 |
| | | |
| PART II | | |
| | | |
| Item 5. | Market for Registrant’s Common Equity, Related Stockholder Matters and Issuer Purchases of Equity Securities | 24 |
| | | |
| Item 6. | Selected Financial Data | 27 |
| | | |
| Item 7. | Management’s Discussion and Analysis of Financial Condition and Results of Operations | 28 |
| | | |
| Item 7A. | Quantitative and Qualitative Disclosures About Market Risk | 49 |
| | | |
| Item 8. | Financial Statements and Supplementary Data | 50 |
| | | |
| Item 9. | Changes in and Disagreements with Accountants on Accounting and Financial Disclosure | 50 |
| | | |
| Item 9A. | Controls and Procedures | 50 |
| | | |
| Item 9B. | Other Information | 50 |
| | | |
| PART III | | |
| | | |
| Item 10. | Directors, Executive Officers and Corporate Governance | 50 |
| | | |
| Item 11. | Executive Compensation | 50 |
| | | |
| Item 12. | Security Ownership of Certain Beneficial Owners and Management and Related Stockholder Matters | 50 |
| | | |
| Item 13. | Certain Relationships and Related Transactions, and Director Independence | 51 |
| | | |
| Item 14. | Principal Accountant Fees and Services | 51 |
| | | |
| PART IV | | |
| | | |
| Item 15. | Exhibits and Financial Statement Schedules | 51 |
| | | |
| Index to Consolidated Financial Statements | | F-1 |
PART I
Item 1. Business
Frontier Communications Corporation (Frontier) (formerly known as Citizens Communications Company through July 30, 2008) and its subsidiaries are referred to as the “Company,” “we,” “us” or “our” throughout this report and references to the “combined company” refer to the Company following the completion of the Verizon Transaction (as defined below). Frontier was incorporated in the State of Delaware in 1935 as Citizens Utilities Company.
Our mission is to be the leader in providing communications services to residential and business customers in our markets. We are committed to delivering innovative and reliable products and solutions with an emphasis on convenience, service and customer satisfaction. We offer a variety of voice, data, internet, and television services that are available as bundled or packaged solutions and for some products, á la carte. We believe that our local management structure, superior customer service and innovative product positioning will continue to differentiate us from our competitors in the markets in which we compete.
We are a communications company providing services to rural areas and small and medium-sized towns and cities. Revenue was $2.1 billion in 2009. Among the highlights for 2009:
· | Verizon Transaction As previously announced, on May 13, 2009, we entered into an Agreement and Plan of Merger (the merger agreement), which provides for a merger (the merger) in which New Communications Holdings, Inc. (Spinco), a newly formed subsidiary of Verizon Communications, Inc. (Verizon) will be merged into Frontier (the Verizon Transaction). We expect the merger to close during the second quarter of 2010. |
| | The combined company is expected to be the nation’s largest communications services provider focused on rural areas and small and medium-sized towns and cities, and the nation’s fifth largest incumbent local exchange carrier, with more than 6.3 million access lines, 8 million voice and broadband connections and 15,000 employees in 27 states on a pro forma basis as of December 31, 2009. The combined company will offer voice, data and video services to customers in its expanded geographic footprint. |
| | Assuming the Verizon Transaction closes, based on the lower level of Spinco debt we will be assuming from Spinco relative to Spinco’s projected operating cash flows, the combined company’s overall debt will increase but its capacity to service the debt will be significantly enhanced as compared to Frontier’s capacity today. At December 31, 2009, Frontier’s net debt to 2009 operating cash flow (“leverage ratio”) was 3.9 times. It is expected that the combined company’s leverage ratio will be significantly lower at closing. |
· | Debt Refinancing During 2009, we completed two registered offerings of senior unsecured notes for an aggregate $1.2 billion principal amount. The proceeds were used to repurchase approximately $1.1 billion of our long-term debt, primarily with maturities in 2011 and 2013. As a result of these debt transactions, as of December 31, 2009, we had reduced our debt maturities through 2013 to approximately $7.2 million maturing in 2010, $280.0 million maturing in 2011, $180.4 million maturing in 2012, and $709.9 million maturing in 2013. We do not expect the Verizon Transaction to change the amount of these near-term debt maturities. |
· | Stockholder Value During 2009, we continued to pay an annual dividend of $1.00 per common share. In connection with the Verizon Transaction, we announced that the annual dividend would be reduced to $0.75 per share upon completion of the Verizon Transaction. Payment of dividends is at the discretion of our Board of Directors. |
· | Product Growth During 2009, we added approximately 56,000 new High-Speed Internet (HSI) subscribers. At December 31, 2009, we had approximately 636,000 HSI customers. We offer a television product with the DISH Network (DISH), and we added approximately 53,000 DISH subscribers during 2009. At December 31, 2009, we had approximately 173,000 DISH customers. |
· | Customer Revenue During 2009, our customer revenue from both residential and business customers declined by $74.0 million, or 4%, although our average monthly customer revenue per access line improved by $1.81, or 3%. |
· | Access Lines During 2009, our rate of access line loss for both residential and business access lines improved from the prior year. We believe this is primarily attributable to the customer recognition of the value of our product bundles, fewer residential moves out of territory, fewer moves by businesses to competitors and our ability to compete with cable telephony in a maturing market place. |
As of December 31, 2009, we operated as an incumbent local exchange carrier (ILEC) in 24 states.
The communications industry is undergoing significant changes and difficulties and our financial results reflect the impact of this challenging environment. Accordingly, as discussed in more detail in “Management’s Discussion and Analysis of Financial Condition and Results of Operations” (MD&A), our revenues have decreased in 2009.
Our business is with both residential and business customers. Our services include:
| | • | data and internet services; |
| | • | television services; and |
Frontier is typically the leading incumbent carrier in the markets we serve and provides the "last mile" of telecommunications services to residential and business customers in these markets.
Access services. Switched access services allow other carriers to use our facilities to originate and terminate their long distance voice and data traffic. These services are generally offered on a month-to-month basis and the service is billed on a minutes-of-use basis. Access charges are based on access rates filed with the Federal Communications Commission (FCC) for interstate services and with the respective state regulatory agency for intrastate services. In addition, subsidies received from state and federal universal service funds based on the higher cost of providing telephone service to certain rural areas are a part of our access services revenue.
Revenue is recognized when services are provided to customers or when products are delivered to customers. Monthly recurring access service fees are billed in advance. The unearned portion of this revenue is initially deferred as a component of other liabilities on our balance sheet and recognized as revenue over the period that the services are provided.
Local services. We provide basic telephone wireline services to residential and business customers in our service areas. We also provide enhanced services to our customers by offering a number of calling features, including call forwarding, conference calling, caller identification, voicemail and call waiting. We also offer packages of communications services. These packages permit customers to bundle their basic telephone line service with their choice of enhanced, long distance, television and internet services for a monthly fee and/or usage fee depending on the plan.
We intend to continue our efforts to increase the penetration of our enhanced services. We believe that increased sales of such services will produce revenue with higher operating margins due to the relatively low marginal operating costs necessary to offer such services. We believe that our ability to integrate these services with other services will provide us with the opportunity to capture an increased percentage of our customers' communications expenditures (wallet share).
Long distance services. We offer long distance services in our territories to our customers. We believe that many customers prefer the convenience of obtaining their long distance service through their local telephone company and receiving a single bill. Long distance network service to and from points outside of our operating territories is provided by interconnection with the facilities of interexchange carriers (IXCs). Our long distance services are billed either as unlimited/fixed number of minutes in advance or on a per minute-of-use basis.
Data and internet services. We offer data services including internet access (via high-speed or dial up internet access), portal and e-mail products frame relay, Metro Ethernet, asynchronous transfer mode (ATM), switching services, hard drive back-up services and 24-7 help desk PC support. We offer other data transmission services to other carriers and high-volume commercial customers with dedicated high-capacity circuits ranging from DS-1’s to Gig E. Such services are generally offered on a contract basis and the service is billed on a fixed monthly recurring charge basis. Data and internet services are typically billed monthly in advance.
Directory services. Directory services involves the provision of white and yellow page directories for residential and business listings. We provide this service through two third-party contractors. In the majority of our markets, the contractor is paid a percentage of revenues from the sale of advertising in these directories. In the remaining markets, we receive a flat fee from the contractor. Our directory service also includes “Frontier Pages,” an internet-based directory service which generates digital advertising revenue.
Television services. We offer a television product in an agency relationship with DISH. We provide access to all-digital television channels featuring movies, sports, news, music and high-definition TV programming. We offer packages of 100, 200 or 250 channels and include high-definition channels, premium channels, family channels and foreign language channels. We also provide access to local channels. We bill the customer for the monthly services and remit those billings to DISH without recognizing any revenue. We in turn receive from DISH and recognize as revenue activation fees, other residual fees and nominal management, billing and collection fees.
Wireless services. During 2006, we began offering wireless data services in certain markets. As of December 31, 2009, we provided wireless data WiFi networks in 19 municipalities and to five colleges and universities and over 360 business establishments. Certain contracts are billed in advance on an annual or semi-annual basis. Colleges, universities and businesses are billed on a monthly recurring basis for a fixed number of users. Hourly, daily and weekly casual end-users are billed by credit card at the time of use.
The following table sets forth the aggregate number of our access lines and HSI subscribers by state as of December 31, 2009 and 2008.
| | | Access Lines and High-Speed | |
| | | Internet Subscribers at December 31, | |
| State | | 2009 | | | 2008 | |
| | | | | | | |
| New York………………………………….. | | | 782,700 | | | | 825,700 | |
| Pennsylvania…………….…..…………… | | | 487,900 | | | | 506,100 | |
| Minnesota………………………...………. | | | 276,500 | | | | 280,500 | |
| Arizona…………………………………….. | | | 189,600 | | | | 192,800 | |
| West Virginia……………………………… | | | 189,100 | | | | 188,200 | |
| California……………………………..…… | | | 188,100 | | | | 193,200 | |
| Illinois……………………………………… | | | 129,000 | | | | 127,900 | |
| Tennessee…………………………………. | | | 102,100 | | | | 105,300 | |
| Wisconsin…………………………………. | | | 77,600 | | | | 79,100 | |
| Iowa……………………………………...… | | | 56,000 | | | | 56,900 | |
| Nebraska……………….…………….…….. | | | 50,000 | | | | 51,400 | |
| All other states (13)……………….………. | | | 224,900 | | | | 227,200 | |
| Total | | | 2,753,500 | | | | 2,834,300 | |
| | | | | | | | | |
Change in the number of our access lines is one factor that is important to our revenue and profitability. We have lost access lines primarily as a result of competition and business downsizing, and because of changing consumer behavior (including wireless substitution), economic conditions, changing technology and by some customers disconnecting second lines when they add HSI. We lost approximately 136,800 access lines (net) during the year ended December 31, 2009, but added approximately 56,000 HSI subscribers (net) during this same period. With respect to the access lines we lost in 2009, 104,700 were residential customer lines and 32,100 were business customer lines. Without taking into account the Verizon Transaction, we expect to continue to lose access lines but to partially offset those losses with an increase in HSI subscribers during 2010. A substantial further loss of access lines, combined with increased competition and the other factors discussed in MD&A, may cause our revenues, profitability and cash flows to decrease during 2010.
Our Company, like others in the industry, utilizes reporting metrics focused on units. Consistent with our strategy to focus on the customer, we also utilize residential customer metrics that, when combined with unit counts provides additional insight into the results of our strategic initiatives outlined above.
| | | | | | | |
| | | As of or for the year ended December 31, | |
| | | 2009 | | | 2008 | |
| Residential: | | | | | | |
| Customers | | | 1,254,500 | | | | 1,347,400 | |
| Revenue (in ‘000’s) | | $ | 899,800 | | | $ | 949,284 | |
Average monthly residential customer revenue per customer | | $ | 57.62 | | | $ | 56.42 | |
Percent of customers on price protection plans | | | 53.2 | % | | | 44.6 | % |
| Customer monthly churn | | | 1.47 | % | | | 1.57 | % |
| Products per residential customer* | | | 2.54 | | | | 2.37 | |
| | | | | | | | | |
* Products per Residential Customer: Primary Residential Voice line, HSI, Video products have a value of 1. FTR long distance, POM, second lines, Feature Packages and Dial-up have a value of 0.5.
General
The majority of our operations are regulated by the FCC and various state regulatory agencies, often called public service or utility commissions.
Certain of our revenue is subject to regulation by the FCC and various state regulatory agencies. We expect federal and state lawmakers to continue to review the statutes governing the level and type of regulation for telecommunications services.
The Telecommunications Act of 1996, or the 1996 Act, dramatically changed the telecommunications industry. The main purpose of the 1996 Act was to open local telecommunications marketplaces to competition. The 1996 Act preempts state and local laws to the extent that they prevent competition with respect to communications services. Under the 1996 Act, however, states retain authority to impose requirements on carriers necessary to preserve universal service, protect public safety and welfare, ensure quality of service and protect consumers. States are also responsible for mediating and arbitrating interconnection agreements between competitive local exchange carriers (CLECs) and ILECs if voluntary negotiations fail. In order to create an environment in which local competition is a practical possibility, the 1996 Act imposes a number of requirements for access to network facilities and interconnection on all local communications providers. Incumbent local carriers must interconnect with other carriers, unbundle some of their services at wholesale rates, permit resale of some of their services, enable collocation of equipment, provide local telephone number portability and dialing parity, provide access to poles, ducts, conduits and rights-of-way, and complete calls originated by competing carriers under termination arrangements.
At the federal level and in a number of the states in which we operate, we are subject to price cap or incentive regulation plans under which prices for regulated services are capped in return for the elimination or relaxation of earnings oversight. The goal of these plans is to provide incentives to improve efficiencies and increased pricing flexibility for competitive services while ensuring that customers receive reasonable rates for basic services. Some of these plans have limited terms and, as they expire, we may need to renegotiate with various states. These negotiations could impact rates, service quality and/or infrastructure requirements which could impact our earnings and capital expenditures. In other states in which we operate, we are subject to rate of return regulation that limits levels of earnings and returns on investments. We continue to advocate our position for no regulation with various regulatory agencies. In some of our states, we have been successful in reducing or eliminating price regulation on end-user services under state commission jurisdiction.
For interstate services regulated by the FCC, we have elected to comply with price caps for most of our operations. In May 2000, the FCC adopted a methodology for regulating the interstate access rates of price cap providers through May 2005. The program, known as the Coalition for Affordable Local and Long Distance Services, or CALLS plan, reduced prices for interstate-switched access services and phased out many of the implicit subsidies in interstate access rates. The CALLS program expired in 2005 but continues in effect until the FCC takes further action.
Another goal of the 1996 Act was to remove implicit subsidies from the rates charged by local telecommunications companies. The CALLS plan addressed this requirement for interstate services. Some state legislatures and regulatory agencies are looking to reduce the implicit subsidies in intrastate rates. The most common subsidies are in intrastate access rates that historically have been priced above their costs to allow basic local rates to be priced below cost. Legislation has been considered in several states to require regulators to eliminate these subsidies and implement state universal service programs where necessary to maintain reasonable basic local rates. However, not all the reductions in access charges would be fully offset. We anticipate additional state legislative and regulatory pressure to lower intrastate access rates.
Recent and Potential Regulatory Developments
Federal legislators, the FCC and state regulators are currently considering a number of proposals for changing the manner in which eligibility for federal subsidies is determined as well as the amounts of such subsidies. In May 2008, the FCC issued an order to cap Competitive Eligible Telecommunications Companies (CETC) receipts from the high cost Federal Universal Service Fund. In 2009, the federal court upheld the FCC’s order and the cap remains in place pending any future reform.
The FCC is considering proposals that may significantly change interstate, intrastate and local intercarrier compensation and would revise the Federal Universal Service funding and disbursement mechanisms to incent expanded broadband availability. When and how these proposed changes will be addressed are unknown and, accordingly, we are unable to predict the impact of future changes on our results of operations. However, future reductions in our subsidy and access revenues will directly affect our profitability and cash flows as those regulatory revenues do not have associated variable expenses. As discussed in MD&A, our access and subsidy revenues declined in 2009 compared to 2008. Our access and subsidy revenues are both likely to decline further in 2010.
Certain states have opened proceedings to address reform to intrastate access charges and other intercarrier compensation. We cannot predict when or how these matters will be decided or the effect on our subsidy or access revenues. In addition, we have been approached by, and/or are involved in formal state proceedings with, various carriers seeking reductions in intrastate access rates in certain states.
Regulators at both the federal and state levels continue to address whether voice over internet protocol (VOIP) services are subject to the same or different regulatory and financial models as traditional telephony. The FCC has concluded that certain VOIP services are jurisdictionally interstate in nature and are thereby exempt from state telecommunications regulations. The FCC has not addressed other related issues, such as: whether or under what terms VOIP originated traffic may be subject to intercarrier compensation; and whether VOIP services are subject to general state requirements relating to taxation and general commercial business requirements. The FCC has stated its intent to address these open questions in subsequent orders in its ongoing “IP-Enabled Services Proceeding.” Internet telephony may have an advantage over our traditional services if it remains less regulated.
In January 2008, the FCC released public notices requesting comments on two petitions that have been filed regarding net neutrality and the application of the FCC’s Internet Policy Statement. In addition, in October 2009 the FCC issued a proposed rulemaking looking at rules to “Preserve a Free and Open Internet.” The timing and the impact of any decision by the FCC are unknown.
Some state regulators have in the past considered imposing on regulated companies (including us) cash management practices that could limit the ability of a company to transfer cash between its subsidiaries or to its parent company. None of the existing state requirements (New York) materially affect our cash management but future changes by state regulators could affect our ability to freely transfer cash within our consolidated companies.
In February 2009, the President signed into law an economic stimulus package, the American Recovery and Reinvestment Act (ARRA), that includes $7.2 billion in funding, through grants and loans, for new broadband investment and adoption in unserved and underserved communities. We filed applications for the first round of stimulus funding in West Virginia, but were notified in February 2010 that we were not selected. The federal agencies responsible for administering the programs released rules and evaluation criteria for the second round of funding, with applications due by March 15, 2010. The Company will evaluate opportunities but has not made a decision on whether it will apply for any funding in this round.
Under the ARRA, the FCC is required to create a National Broadband Plan by February 17, 2010. This date has been extended to March 17, 2010. The Commission has requested comments from the public on a variety of topics, including but not limited to availability, adoption, public safety and the roles of Universal Service and Intercarrier Compensation in the Plan. The outcome of the Plan is likely to lead to a series of proposed rulemakings from the Commission, and the timing and impact of the outcome on Frontier are unknown.
Competition
Competition in the communications industry is intense and increasing. We experience competition from many communications service providers. These providers include cable operators offering video, data and VOIP products, wireless carriers, long distance providers, competitive local exchange carriers, Internet providers and other wireline carriers. We believe that as of December 31, 2009, approximately 73% of the households in our territories had VOIP as an available service option. We also believe that competition will continue in 2010 and may result in reduced revenues.
The lingering impact of the severe contraction in the global financial markets that occurred in 2008 and 2009 and the subsequent recession has impacted residential and business customer behavior to reduce expenditures by not purchasing our services, reducing usage of our services or by discontinuing some or all of our services. These trends may continue and may result in a continued challenging revenue environment. These factors could also result in increased delinquencies and bankruptcies and, therefore, affect our ability to collect money owed to us by residential and business customers.
We employ a number of strategies to combat the competitive pressures and changes in consumer behavior noted above. Our strategies are focused on preserving and generating new revenue through customer retention, upgrading and up-selling services to our existing customer base, new customer growth, win backs of former customers, new product deployment, and upon managing our profitability and cash flow through targeted reductions in operating expenses and capital expenditures.
We seek to achieve our customer retention goals by offering attractive packages of value-added services to our access line customers and providing exemplary customer service. Bundled services include HSI, unlimited long distance calling, enhanced telephone features and video offerings. We tailor these services to the needs of our residential and business customers and continually evaluate the introduction of new and complementary products and services, many of which can also be purchased separately. Customer retention is also enhanced by offering one-, two- and three-year price protection plans where customers commit to a term in exchange for predictable pricing and/or promotional offers. Additionally, we are focused on enhancing the customer experience as we believe exceptional customer service will continue to differentiate us from our competition. Our commitment to providing exemplary customer service is demonstrated by the expansion of our customer services hours, shorter scheduling windows for in-home appointments and the implementation of call reminders and follow up calls for service appointments. In addition, our 70 local area markets are operated by local managers with responsibility for the customer experience, as well as the financial results, in those markets. Customers in our markets have direct access to those local managers to help them manage their communications needs.
We utilize targeted and innovative promotions like “aspirational gifts” (e.g., personal computers) or promotional credits to attract new customers, including those moving into our territory, to win back former customers and to upgrade and up-sell existing customers a variety of service offerings, including HSI, video, and enhanced long distance and feature packages in order to maximize the average revenue per customer (wallet share) paid to Frontier. Depending upon market and economic conditions, we may offer such promotions to drive sales in the future.
We have restructured and augmented our sales distribution channels to improve coverage of all segments of our business customer base. This includes adding new sales teams dedicated to small business customers and enhancing the business selling and support skills in our customer sales and service centers. We have also increased our focus on customer premise equipment (CPE) sales for customers requiring an equipment solution, and have extended our CPE sales reach beyond a handful of markets. In addition, we are introducing new products utilizing wireless and Internet technologies. We believe the combination of new products and distribution channel improvements will help us improve business customer acquisition and retention.
We are also focused on increasing sales of newer products, including unlimited long distance minutes, bundles of long distance minutes, wireless data, internet portal advertising, and the “Frontier Peace of Mind” product suite. This last category is a suite of products that is aimed at managing the total communications and personal computing experience for our customers and designed to provide value and simplicity to meet our customers’ ever-changing needs. The Frontier Peace of Mind products and services suite includes services such as an in-home, full installation of our HSI product, two hour appointment windows for the installation, hard drive back-up services, 24-7 help desk PC support and inside wire maintenance (when bundled). In 2009, the Frontier Peace of Mind products generated approximately $3.2 million in revenue. Most recently, we introduced our myfitv.com website which provides easy online access to video content, entertainment and news available on the worldwide web. Although we are optimistic about the opportunities provided by each of these initiatives to increase revenue and reduce churn, we can provide no assurance about their long term profitability or impact on revenue. Our hard drive back-up services, 24-7 help desk PC support and myfitv.com services are also available outside of our service territories.
We believe that the combination of offering multiple products and services to our customers pursuant to price protection programs, billing customers in a single bill, providing superior customer service, and being active in our local communities will make our customers more loyal, and will help us generate additional, and retain existing, customer revenue.
Additional Information on Verizon Transaction
Pursuant to the Verizon Transaction, Spinco will merge with and into Frontier, and Frontier will survive as the combined company conducting the combined business operations of Frontier and Spinco. Spinco will hold defined assets and liabilities of the local exchange business and related landline activities of Verizon in Arizona, Idaho, Illinois, Indiana, Michigan, Nevada, North Carolina, Ohio, Oregon, South Carolina, Washington, West Virginia and Wisconsin, and in portions of California bordering Arizona, Nevada and Oregon (collectively, the Spinco territory), including Internet access and long distance services and broadband video provided to designated customers in the Spinco territory (collectively, the Spinco business). Immediately prior to the merger, Spinco will be spun off to Verizon stockholders. The merger will result in Frontier acquiring approximately 4.2 million access lines, based on access lines of the Spinco business as of December 31, 2009, and certain related business assets from Verizon. The Spinco business generated revenues of approximately $4.4 billion for the year ended December 31, 2008, the last full year of available revenue for Spinco, and $3.1 billion for the nine months ended September 30, 2009. Following the merger, the separate existence of Spinco will cease and the combined company will continue to operate under the Frontier name. The forgoing transactions are collectively referred to as the “Verizon Transaction.” The completion of the Verizon Transaction is subject to a number of conditions.
Our stockholders have approved proposals related to the Verizon Transaction at a special meeting of stockholders on October 27, 2009. No vote by Verizon stockholders is required in connection with the Verizon Transaction; Verizon, as the sole stockholder of Spinco, has already approved the Verizon Transaction. The completion of the Verizon Transaction is subject to a number of conditions, including availability of financing on terms that satisfy certain requirements, receipt of regulatory approvals and other customary closing conditions. As of February 26, 2010, we have received approval for the Verizon Transaction from state regulatory commissions in Arizona, California, Nevada, Ohio and South Carolina. Commission hearings have been completed in all of the four remaining states where we expect regulatory approval to be required (Illinois, Oregon, Washington and West Virginia) and we have reached settlement or an agreement with most of the intervening parties in all of those remaining states. We have also received, as of such date, all of the required video local franchise approvals for the Verizon Transaction subject to the satisfaction of certain conditions. Verizon has received a favorable ruling from the IRS regarding the tax consequences of the Verizon Transaction which was a condition to the Merger Agreement. As of February 26, 2010, none of the conditions imposed in the approval orders or settlements (which have generally focused on local rate stability; service quality metrics and reporting, capital investment (including commitments to expand broadband availability), pre-funding certain broadband expansion into restricted cash accounts at closing, and periodic reporting of certain operational and financial information) are expected to have a material impact on our plans to operate the Spinco properties.
Segment Information
We currently operate in only one reportable segment.
Financial Information about Foreign and Domestic Operations and Export Sales
We have no foreign operations.
General
Order backlog is not a significant consideration in our business. We have no material contracts or subcontracts that may be subject to renegotiation of profits or termination at the election of the Federal government. We hold no patents, licenses or concessions that are material.
Employees
As of December 31, 2009, we had approximately 5,400 employees. Approximately 2,800 of our employees are affiliated with a union. The number of union employees covered by agreements expiring during 2010 is approximately 750. We consider our relations with our employees to be good.
We are subject to the informational requirements of the Securities Exchange Act of 1934. Accordingly, we file periodic reports, proxy statements and other information with the Securities and Exchange Commission (SEC). Such reports, proxy statements and other information may be obtained by visiting the Public Reference Room of the SEC at 100 F Street, NE, Washington, D.C. 20549 or by calling the SEC at 1-800-SEC-0330. In addition, the SEC maintains an Internet site (www.sec.gov) that contains reports, proxy and information statements and other information regarding the Company and other issuers that file electronically. Material filed by us can also be inspected at the offices of the New York Stock Exchange, Inc. (NYSE), 20 Broad Street, New York, NY 10005, on which our common stock is listed.
We make available, free of charge on our website, our Annual Report on Form 10-K, Quarterly Reports on Form 10-Q, Current Reports on Form 8-K and amendments to these reports filed or furnished pursuant to Section 13(a) or 15(d) of the Exchange Act, as soon as practicable after we electronically file these documents with, or furnish them to, the SEC. These documents may be accessed through our website at www.frontier.com under “Investor Relations.” The information posted or linked on our website is not part of this report.
We also make available on our website, or in printed form upon request, free of charge, our Corporate Governance Guidelines, Code of Business Conduct and Ethics, and the charters for the Audit, Compensation, and Nominating and Corporate Governance committees of the Board of Directors. Stockholders may request printed copies of these materials by writing to: 3 High Ridge Park, Stamford, Connecticut 06905 Attention: Corporate Secretary. Our website address is www.frontier.com.
Item 1A. Risk Factors
Before you make an investment decision with respect to any of our securities, you should carefully consider all the information we have included or incorporated by reference in this Form 10-K and our subsequent periodic filings with the SEC. In particular, you should carefully consider the risk factors described below and read the risks and uncertainties related to “forward-looking statements” as set forth in the “Management’s Discussion and Analysis of Financial Condition and Results of Operations” section of this Form 10-K. The risks and uncertainties described below are not the only ones facing our company. Additional risks and uncertainties that are not presently known to us or that we currently deem immaterial or that are not specific to us, such as general economic conditions, may also adversely affect our business and operations. The following risk factors should be read in conjunction with MD&A and the consolidated financial statements and related notes included in this report.
Risks Related to the Verizon Transaction
References to "the Company" in this section refer to Frontier as the combined company following the closing of the Verizon Transaction, assuming the Verizon Transaction closes.
The Verizon Transaction may not be consummated on the terms or timeline currently contemplated or at all.
The consummation of the Verizon Transaction is subject to certain conditions, including (i) the availability of financing on terms that satisfy certain requirements (including with respect to pricing and maturity) and the receipt of the proceeds thereof that, taken together with any Spinco debt securities and the aggregate amount of Spinco indebtedness at the distribution date, equal $3.333 billion, (ii) the absence of a governmental order that would constitute a materially adverse regulatory condition, (iii) the receipt of applicable regulatory consents, (iv) the receipt of certain favorable tax rulings from the Internal Revenue Service (which have been obtained) and certain tax opinions, (v) the absence of a material adverse effect on Frontier or on Spinco or the Spinco business and (vi) other customary closing conditions. We can make no assurances that the Verizon Transaction will be consummated on the terms or timeline currently contemplated, or at all. We have and will continue to expend a significant amount of capital and management’s time and resources on the Verizon Transaction, and a failure to consummate the transaction as currently contemplated, or at all, could have a material adverse effect on our business and results of operations. In addition, Spinco may (with Frontier’s consent and participation) choose to raise all or a portion of the financing required to complete the Verizon Transaction described above prior to the closing of the Verizon Transaction. If Spinco does so, and if the Verizon transaction is ultimately not consummated or is delayed for a significant period of time, we could be obligated to pay significant interest expense and other costs in connection with the financing without ever achieving the expected benefits of the Verizon Transaction. The trading price of our securities could be adversely affected if the Verizon Transaction is not consummated as currently contemplated, or at all.
Frontier’s effort to combine Frontier’s business and the Spinco business may not be successful.
The acquisition of the Spinco business is the largest and most significant acquisition Frontier has undertaken. Our management will be required to devote a significant amount of time and attention to the process of integrating the operations of Frontier’s business and the Spinco business, which may decrease the time it will have to serve existing customers, attract new customers and develop new services or strategies. We expect that the Spinco business will operate on an independent basis, separate from Verizon’s other businesses and operations, immediately prior to the closing of the merger (other than with respect to the portion operated in West Virginia, which is expected to be ready for integration into Frontier’s existing business at the closing of the merger) and will not require significant post-closing integration for Frontier to continue the operations of the Spinco business immediately after the merger. However, the size and complexity of the Spinco business and the process of using Frontier’s existing common support functions and systems to manage the Spinco business after the merger, if not managed successfully by management, may result in interruptions of the business activities of the Company that could have a material adverse effect on the Company’s business, financial condition and results of operations. In addition, management will be required to devote a significant amount of time and attention before completion of the merger to the process of migrating the systems and processes supporting the operations of the Spinco business in West Virginia from systems owned and operated by Verizon to those owned and operated by Frontier. The size, complexity and timing of this migration, if not managed successfully by management, may result in interruptions of Frontier’s business activities.
The Company may not realize the growth opportunities and cost synergies that are anticipated from the merger.
The success of the merger will depend, in part, on the ability of the Company to realize anticipated growth opportunities and cost synergies. The Company’s success in realizing these growth opportunities and cost synergies, and the timing of this realization, depends on the successful integration of Frontier’s business and operations and the Spinco business and operations. Even if the Company is able to integrate the Frontier and Spinco businesses and operations successfully, this integration may not result in the realization of the full benefits of the growth opportunities and cost synergies that Frontier currently expects from this integration within the anticipated time frame or at all. For example, the Company may be unable to eliminate duplicative costs, or the benefits from the merger may be offset by costs incurred or delays in integrating the companies.
After the close of the Verizon Transaction, sales of our common stock may negatively affect its market price.
The market price of Frontier common stock could decline as a result of sales of Frontier common stock in the market after the completion of the Verizon Transaction or the perception that these sales could occur.
Depending on the trading prices of Frontier common stock prior to the closing of the Verizon Transaction and before accounting for (1) the elimination of fractional shares and (2) any additional shares that may be issued as a result of amounts paid, payable or forgone by Verizon pursuant to orders or settlements that are issued or entered into in order to obtain governmental approvals in the Spinco territory that are required to complete the transaction (with the number of additional shares that may be issued under clause (2) above being restricted by certain regulatory and other covenants and conditions to the transaction as agreed to by the parties), Verizon stockholders will collectively own between approximately 66% and 71% of our outstanding equity immediately following the closing of the transaction.
If the assets contributed to Spinco by Verizon are insufficient to operate the Spinco business, it could adversely affect the Company’s business, financial condition and results of operations.
Pursuant to the distribution agreement executed in connection with the Verizon Transaction, Verizon will contribute to Spinco defined assets and liabilities of its local exchange business and related landline activities in the Spinco territory, including Internet access and long distance services and broadband video provided to designated customers in the Spinco territory. The merger agreement provides that all the contributions will be made so that the Spinco business (other than the portion conducted in West Virginia) is segregated from Verizon’s other businesses at least 60 days prior to the closing of the spin-off and merger. However, the contributed assets may not be sufficient to operate all aspects of the Spinco business and the Company may have to use assets or resources from Frontier’s existing business or acquire additional assets in order to operate the Spinco business, which could adversely affect the Company’s business, financial condition and results of operations.
Pursuant to the distribution agreement, Frontier has certain rights to cause Verizon to transfer to it any assets required to be contributed to Spinco under that agreement that were not contributed as required. If Verizon were unable or unwilling to transfer those assets to the Company, or if Verizon and Frontier were to disagree about whether those assets were required to be contributed to Spinco under the distribution agreement, the Company might not be able to obtain those assets or similar assets from others without significant costs or at all.
The Company’s business, financial condition and results of operations may be adversely affected following the merger if it is not able to obtain consents to assign certain Verizon contracts to Spinco.
Certain wholesale, large business, Internet service provider and other customer contracts that are required to be assigned to Spinco by Verizon require the consent of the customer party to the contract to effect this assignment. Verizon and Frontier may be unable to obtain these consents on terms favorable to the Company or at all, which could have a material adverse impact on the Company’s business, financial condition and results of operations following the merger.
Regulatory agencies may delay approval of the Verizon Transaction, fail to approve it, or approve it in a manner that may diminish the anticipated benefits of the merger.
Completion of the Verizon Transaction is conditioned upon the receipt of certain government consents, approvals, orders and authorizations. While Frontier and Verizon have obtained certain, and intend to pursue vigorously all other, required governmental approvals and do not know of any reason why they would not be able to obtain the necessary approvals in a timely manner, the requirement to receive these approvals before completion of the Verizon Transaction could delay the completion of the Verizon Transaction. Any delay in the completion of the Verizon Transaction could diminish the anticipated benefits of the Verizon Transaction or result in additional transaction costs, loss of revenues or other effects associated with uncertainty about the transaction. Any uncertainty over the ability of the companies to complete the Verizon Transaction could make it more difficult for Frontier to maintain or to pursue particular business strategies. In addition, until the Verizon Transaction is completed, the attention of Frontier management may be diverted from ongoing business concerns and regular business responsibilities to the extent management is focused on obtaining regulatory approvals.
Further, governmental agencies may decline to grant required approvals, or they may impose conditions on their approval of the Verizon Transaction that could have an adverse effect on the Company’s business, financial condition and results of operations. Any amounts paid, payable or forgone by Verizon pursuant to orders or settlements that are issued or entered into in order to obtain governmental approvals in the Spinco territory that are required to complete the Verizon Transaction will increase the aggregate number of shares of Frontier common stock to be issued pursuant to the merger agreement, and any such increase could be significant. If any governmental agency declines to grant any required approval for the Verizon Transaction, then the Verizon Transaction may not be consummated. In addition, conditions imposed by governmental agencies in connection with their approval of the Verizon Transaction (such as service quality or capital expenditure requirements) may restrict the Company’s ability to modify the operations of its business in response to changing circumstances for a period of time after the closing of the merger and/or its ability to expend cash for other uses, including for payment of dividends.
The merger agreement contains provisions that may discourage other companies from trying to acquire Frontier.
The merger agreement contains provisions that may discourage a third party from submitting a business combination proposal to Frontier prior to the closing of the merger that might result in greater value to Frontier stockholders than the merger. The merger agreement generally prohibits Frontier from soliciting any acquisition proposal, and Frontier may not terminate the merger agreement in order to accept an alternative business combination proposal that might result in greater value to Frontier stockholders than the merger. If the merger agreement is terminated by Frontier or Verizon in certain circumstances, Frontier may be obligated to pay a termination fee of $80.0 million to Verizon, which would represent an additional cost for a potential third party seeking a business combination with Frontier.
Failure to complete the merger could adversely affect the trading price of Frontier’s securities as well as Frontier’s business, financial condition and results of operations.
If the merger is not completed for any reason, the trading price of Frontier’s common stock may decline to the extent that the market price of the common stock reflects positive market assumptions that the merger will be completed and the related benefits will be realized. Frontier may also be subject to additional risks if the merger is not completed, including:
| | • | the requirement in the merger agreement that, under certain circumstances, Frontier pay Verizon a termination fee of $80.0 million; |
| | • | substantial costs related to the merger, such as legal, accounting, filing, financial advisory, financial printing fees, and integration costs that have already been incurred or will continue up to closing. While the Company continues to evaluate certain other expenses, we currently expect to incur approximately $100.0 million of integration expenses and approximately $75.0 million of capital expenditures in 2010; |
| | • | substantial interest expense will be incurred if Spinco initiates the financing of the approximately $3.0 billion prior to closing; and |
| | • | potential disruption to the business of Frontier and distraction of its workforce and management team. |
If the spin-off does not qualify as a tax-free spin-off under Section 355 of the Internal Revenue Code (the Code), including as a result of subsequent acquisitions of stock of Verizon or Frontier, then Verizon or Verizon stockholders may be required to pay substantial U.S. federal income taxes, and Frontier may be obligated to indemnify Verizon for such taxes imposed on Verizon.
The spin-off and merger are conditioned upon Verizon’s receipt of a private letter ruling from the IRS to the effect that the spin-off and certain related transactions will qualify as tax-free to Verizon, Spinco and the Verizon stockholders for U.S. federal income tax purposes (the IRS ruling). A private letter ruling from the IRS generally is binding on the IRS. The favorable IRS private letter ruling has been received by Verizon. As expected, the IRS ruling does not rule that the spin-off satisfies every requirement for a tax-free spin-off, and the parties will rely solely on the opinion of counsel described below for comfort that such additional requirements are satisfied.
The IRS ruling is based on, among other things, certain representations and assumptions as to factual matters made by Verizon, Spinco and Frontier. The failure of any factual representation or assumption to be true, correct and complete in all material respects could adversely affect the validity of the IRS ruling. In addition, the IRS ruling is based on current law, and cannot be relied upon if current law changes with retroactive effect.
The spin-off will be taxable to Verizon pursuant to Section 355(e) of the Code if there is a 50% or more change in ownership of either Verizon or Spinco, directly or indirectly, as part of a plan or series of related transactions that include the spin-off. Because Verizon stockholders will collectively own more than 50% of the Frontier common stock following the merger, the merger alone will not cause the spin-off to be taxable to Verizon under Section 355(e). However, Section 355(e) might apply if other acquisitions of stock of Verizon before or after the merger, or of Frontier after the merger, are considered to be part of a plan or series of related transactions that include the spin-off. If Section 355(e) applied, Verizon might recognize a very substantial amount of taxable gain.
Under a tax sharing agreement, in certain circumstances, and subject to certain limitations, Frontier is required to indemnify Verizon against taxes on the spin-off that arise as a result of actions or failures to act by Frontier, or as a result of changes in ownership of the stock of Frontier after the merger. In some cases, however, Verizon might recognize gain on the spin-off without being entitled to an indemnification payment under the tax sharing agreement.
If the merger does not qualify as a tax-free reorganization under Section 368 of the Code, Frontier may be required to pay substantial U.S. federal income taxes.
Frontier expects that the merger will qualify as a tax-free reorganization under Section 368(a) of the Code, and the obligation of Frontier to consummate the merger is conditioned upon receiving an opinion of counsel to that effect. Such opinion will be based upon, among other things, certain representations and assumptions as to factual matters made by Verizon, Spinco and Frontier. The failure of any factual representation or assumption to be true, correct and complete in all material respects could adversely affect the validity of the opinion. An opinion of counsel represents counsel’s best legal judgment, is not binding on the IRS or the courts, and the IRS or the courts may not agree with the opinion. In addition, the opinion will be based on current law, and cannot be relied upon if current law changes with retroactive effect. If the merger were taxable, Spinco stockholders would recognize taxable gain or loss on their receipt of Frontier stock in the merger, and Spinco would be considered to have made a taxable sale of its assets to Frontier.
Frontier will be unable to take certain actions after the merger because such actions could jeopardize the tax-free status of the spin-off or the merger, and such restrictions could be significant.
Frontier is prohibited pursuant to a tax sharing agreement from taking actions that could reasonably be expected to cause the spin-off to be taxable or to jeopardize the conclusions of the IRS ruling or opinions of counsel received by Verizon or Frontier. In particular, for two years after the spin-off, Frontier may not:
| | • | enter into any agreement, understanding or arrangement or engage in any substantial negotiations with respect to any transaction involving the acquisition, issuance, repurchase or change of ownership of Frontier capital stock, or options or other rights in respect of Frontier capital stock, subject to certain exceptions relating to employee compensation arrangements, stock splits, open market stock repurchases and stockholder rights plans; |
| | • | permit certain wholly owned subsidiaries owned by Spinco at the time of the spin-off to cease the active conduct of the Spinco business to the extent it was conducted immediately prior to the spin-off; or |
| | • | voluntarily dissolve, liquidate, merge or consolidate with any other person, unless Frontier survives and the transaction otherwise complies with the restrictions in the tax sharing agreement. |
The tax sharing agreement further restricts Frontier from prepaying, or modifying the terms of, the Spinco debt securities, if any.
Nevertheless, Frontier is permitted to take any of the actions described above if it obtains Verizon’s consent, or if it obtains a supplemental IRS private letter ruling (or an opinion of counsel that is reasonably acceptable to Verizon) to the effect that the action will not affect the tax-free status of the spin-off or the merger. However, the receipt by Frontier of any such consent, opinion or ruling does not relieve Frontier of any obligation it has to indemnify Verizon for an action it takes that causes the spin-off to be taxable to Verizon.
Because of these restrictions, for two years after the merger, Frontier may be limited in the amount of capital stock that it can issue to make acquisitions or to raise additional capital. Also, Frontier’s indemnity obligation to Verizon may discourage, delay or prevent a third party from acquiring control of Frontier during this two-year period in a transaction that stockholders of Frontier might consider favorable.
Investors holding shares of Frontier common stock immediately prior to the merger will, in the aggregate, have a significantly reduced ownership and voting interest after the merger.
After the merger’s completion, Frontier stockholders will, in the aggregate, own a significantly smaller percentage of the Company than they will collectively own of Frontier immediately prior to the merger. Depending on the trading prices of Frontier common stock prior to the closing of the merger and before accounting for the elimination of fractional shares and adjustments for any amounts paid, payable or forgone by Verizon pursuant to orders or settlements that are issued or entered into in order to obtain governmental approvals in the Spinco territory that are required to complete the merger and the spin-off, Frontier stockholders will collectively own between approximately 29% and 34% of the Company’s outstanding equity immediately following the closing of the merger. Consequently, Frontier stockholder votes, collectively, will have significantly less influence over the policies of the Company than they would be able to exercise over the policies of Frontier immediately prior to the merger. Moreover, the number of shares of Frontier common stock to be issued to Verizon stockholders pursuant to the merger agreement is subject to increase by any amounts paid, payable or forgone by Verizon pursuant to orders or settlements that are issued or entered into in order to obtain government approvals in the Spinco territory that are required to complete the merger or the spin-off, and any such increase may be significant. In addition, Verizon intends to exercise its right to designate three of the twelve members of the board of directors of the Company.
The pendency of the merger could adversely affect the business and operations of Frontier and the Spinco business.
In connection with the pending merger, some customers of each of Frontier and the Spinco business may delay or defer decisions or may end their relationships with the relevant company, which could negatively affect the revenues, earnings and cash flows of Frontier and the Spinco business, regardless of whether the merger is completed. Similarly, current and prospective employees of Frontier and the Spinco business may experience uncertainty about their future roles with the Company following the merger, which may materially adversely affect the ability of each of Frontier and the Spinco business to attract and retain key personnel during the pendency of the merger.
Risks Related to Frontier and the Company’s Business Following the Merger
The risks discussed below in this section refer to the “Company” for ease of reference. The risks apply to Frontier as a stand-alone entity before the Verizon Transaction is completed, will continue to apply to Frontier if the Verizon Transaction is not completed for any reason and will also apply to the combined company assuming the Verizon Transaction closes.
The Company will likely face further reductions in access lines, switched access minutes of use, long distance revenues and federal and state subsidy revenues, which could adversely affect it.
The businesses that will make up the Company have experienced declining access lines, switched access minutes of use, long distance revenues, federal and state subsidies and related revenues because of economic conditions, increasing competition, changing consumer behavior (such as wireless displacement of wireline use, e-mail use, instant messaging and increasing use of VOIP), technology changes and regulatory constraint. For example, Frontier’s access lines declined 6% in 2009 and 7% in 2008. In addition, Frontier’s switched access minutes of use declined 12% in 2009 and 9% in 2008 (after excluding the switched access minutes added through acquisitons in 2007). The Spinco business’s access lines declined 11.6% in 2009 and 10% in 2008. In addition, the Spinco business’s switched access minutes of use declined 10% in 2009 and 11% in 2008. These factors, among others, are likely to cause the Company’s local network service, switched network access, long distance and subsidy revenues to continue to decline, and these factors may cause the Company’s cash generated by operations to decrease.
The Company will face intense competition, which could adversely affect it.
The communications industry is extremely competitive and competition is increasing. The traditional dividing lines between local, long distance, wireless, cable and Internet service providers are becoming increasingly blurred. Through mergers and various service expansion strategies, service providers are striving to provide integrated solutions both within and across geographic markets. The Company’s competitors will include competitive local exchange carriers and other providers of services, such as Internet service providers, wireless companies, VOIP providers and cable companies that may provide services competitive with the services that the Company will offer or will intend to introduce. Competition will continue to be intense following the merger, and Frontier cannot assure you that the Company will be able to compete effectively. Frontier also believes that wireless and cable telephony providers have increased their penetration of various services in Frontier’s and Spinco’s markets. Frontier expects the Company to continue to lose access lines and that competition with respect to all the products and services of the Company will increase.
Frontier expects competition to intensify as a result of the entrance of new competitors, penetration of existing competitors into new markets, changing consumer behavior and the development of new technologies, products and services that can be used in substitution for the Company’s products and services. Frontier cannot predict which of the many possible future technologies, products or services will be important in order to maintain the Company’s competitive position or what expenditures will be required to develop and provide these technologies, products or services. The Company’s ability to compete successfully will depend on the success and cost of capital expenditure investments in the Frontier and Spinco territories as well as the cost of marketing efforts and on the Company’s ability to anticipate and respond to various competitive factors affecting the industry, including a changing regulatory environment that may affect the Company and its competitors differently, new services that may be introduced (including wireless broadband offerings), changes in consumer preferences, demographic trends, economic conditions and pricing strategies by competitors. Increasing competition may reduce the Company’s revenues and increase the Company’s marketing and other costs as well as require the Company to increase its capital expenditures and thereby decrease its cash flow.
Some of the Company’s future competitors will have superior resources, which may place the Company at a cost and price disadvantage.
Some of the companies that will be competitors of the Company will have market presence, engineering, technical and marketing capabilities and financial, personnel and other resources substantially greater than those of the Company. In addition, some of these future competitors will be able to raise capital at a lower cost than the Company. Consequently, some of these competitors may be able to develop and expand their communications and network infrastructures more quickly, adapt more swiftly to new or emerging technologies and changes in customer requirements, take advantage of acquisition and other opportunities more readily and devote greater resources to the marketing and sale of their products and services than the Company. Additionally, the greater brand name recognition of some future competitors may require the Company to price its services at lower levels in order to retain or obtain customers. Finally, the cost advantages of some of these competitors may give them the ability to reduce their prices for an extended period of time if they so choose.
The Company may be unable to grow its revenues and cash flows despite the initiatives Frontier has implemented and intends to continue after the merger.
The Company must produce adequate revenues and cash flows that, when combined with funds available under Frontier’s revolving credit facility, will be sufficient to service the Company’s debt, fund its capital expenditures, pay its taxes, fund its pension and other employee benefit obligations and pay dividends pursuant to its dividend policy. Frontier has identified some potential areas of opportunity and has implemented and will continue to implement several growth initiatives, including increasing marketing promotions and related expenditures and launching new products and services with a focus on areas that are growing or demonstrate meaningful demand such as wireline and wireless HSI, satellite video products and the “Frontier Peace of Mind” suite of products, including computer technical support. Frontier cannot assure you that management will choose the best initiatives to pursue, that their approaches to these opportunities will be successful or that these initiatives will improve the Company’s financial position or its results of operations.
Weak economic conditions may decrease demand for the Company’s services.
The Company could be sensitive to the ongoing recession if current economic conditions or their effects continue. Downturns in the economy and competition in the Company’s markets could cause some of the Company’s customers to reduce or eliminate their purchases of the Company’s basic and enhanced services, HSI and video services and make it difficult for the Company to obtain new customers. In addition, if current economic conditions continue, they could cause the Company’s customers to delay or discontinue payment for its services.
Disruption in the Company’s networks, infrastructure and information technology may cause the Company to lose customers and incur additional expenses.
To attract and retain customers, the Company will need to provide customers with reliable service. Some of the risks to the Company’s networks, infrastructure and information technology include physical damage, security breaches, capacity limitations, power surges or outages, software defects and disruptions beyond its control, such as natural disasters and acts of terrorism. From time to time in the ordinary course of business, the Company could experience short disruptions in its service due to factors such as cable damage, inclement weather and service failures of the Company’s third-party service providers. The Company could experience more significant disruptions in the future. The Company could also face disruptions due to capacity limitations if changes in the Company’s customers’ usage patterns for its HSI services result in a significant increase in capacity utilization, such as through increased usage of video or peer-to-peer file sharing applications. Disruptions may cause interruptions in service or reduced capacity for customers, either of which could cause the Company to lose customers and incur additional expenses, and thereby adversely affect its business, revenues and cash flows.
The Company’s business will be sensitive to the creditworthiness of its wholesale customers.
The Company will have substantial business relationships with other telecommunications carriers for whom it will provide service. While bankruptcies of these carriers have not had a material adverse effect on Frontier or the Spinco business in recent years, future bankruptcies in their industry could result in the loss of significant customers by the Company, as well as more price competition and uncollectible accounts receivable. Such bankruptcies may be more likely in the future if current economic conditions continue through 2010 or beyond. As a result, the Company’s revenues and results of operations could be materially and adversely affected.
A significant portion of the Company’s workforce will be represented by labor unions and will therefore be subject to collective bargaining agreements, and if the Company is unable to enter into new agreements or renew existing agreements before they expire, the Company workers subject to collective bargaining agreements could engage in strikes or other labor actions that could materially disrupt the Company’s ability to provide services to its customers.
As of December 31, 2009, Frontier had approximately 5,400 active employees. Approximately 2,800, or 52%, of these employees were represented by unions and were therefore subject to collective bargaining agreements. Of the union-represented employees, approximately 750, or 27%, are subject to collective bargaining agreements that expire in 2010 and approximately 1,200, or 43%, are subject to collective bargaining agreements that expire in 2011.
As of December 31, 2009, assuming the Verizon Transaction had taken place as of that date, Spinco would have had approximately 9,500 active employees. Approximately 6,800, or 72%, of these employees were represented by unions and were therefore subject to collective bargaining agreements. Of the union-represented employees, approximately 3,300, or 49%, are subject to collective bargaining agreements that expire in 2010.
Frontier cannot predict the outcome of negotiations for the collective bargaining agreements of the Company. If the Company is unable to reach new agreements or renew existing agreements, employees subject to collective bargaining agreements may engage in strikes, work slowdowns or other labor actions, which could materially disrupt the Company’s ability to provide services. New labor agreements or the renewal of existing agreements may impose significant new costs on the Company, which could adversely affect its financial condition and results of operations in the future.
The Company may complete a significant strategic transaction that may not achieve intended results or could increase the number of its outstanding shares or amount of outstanding debt or result in a change of control.
The management of the Company will evaluate and may in the future enter into additional strategic transactions. Any such transaction could happen at any time following the closing of the merger, could be material to the Company’s business and could take any number of forms, including, for example, an acquisition, merger or a sale of all or substantially all of the Company’s assets.
Evaluating potential transactions and integrating completed ones may divert the attention of the Company’s management from ordinary operating matters. The success of these potential transactions will depend, in part, on the Company’s ability to realize the anticipated growth opportunities and cost synergies through the successful integration of the businesses the Company acquires with its existing business. Even if the Company is successful in integrating the acquired businesses, Frontier cannot assure you that these integrations will result in the realization of the full benefit of any anticipated growth opportunities or cost synergies or that these benefits will be realized within the expected time frames. In addition, acquired businesses may have unanticipated liabilities or contingencies.
If the Company completes an acquisition, investment or other strategic transaction, the Company may require additional financing that could result in an increase in the number of its outstanding shares or the aggregate amount of its debt, although there are restrictions on the ability of the Company to issue additional shares of stock for these purposes for two years after the merger. See Risks Relating to the Verizon Transaction—“Frontier will be unable to take certain actions after the merger because such actions could jeopardize the tax-free status of the spin-off or the merger, and such restrictions could be significant.” The number of shares of the Company’s common stock or the aggregate principal amount of its debt that it may issue may be significant. A strategic transaction may result in a change in control of the Company or otherwise materially and adversely affect its business.
A significant portion of the Company’s work force is retirement eligible.
As of December 31, 2009, approximately 1,200, or 22%, of Frontier's approximately 5,400 active employees are retirement eligible. It is expected that a significant number of the Spinco employees are or will be retirement eligible at or prior to the time of closing of the Verizon Transaction. If these employees were to retire and could not be promptly replaced, customer service could be negatively impacted, which could have a material impact on the Company’s operations and financial results.
If the Company is unable to hire or retain key personnel, it may be unable to successfully operate its business.
The Company’s success will depend in part upon the continued services of its management. The Company cannot guarantee that these key personnel and others will not leave or compete with it. The loss, incapacity or unavailability for any reason of key members of the management team could have a material impact on the Company’s business. In addition, the Company’s financial results and its ability to compete will suffer should it become unable to attract, integrate or retain other qualified personnel in the future.
Risks Related to Liquidity, Financial Resources and Capitalization
The risks discussed below in this section refer to the “Company” for ease of reference. The risks apply to Frontier as a stand-alone entity before the Verizon Transaction is completed and will continue to apply to Frontier if the Verizon Transaction is not completed for any reason and will also apply to the combined company assuming the Verizon Transaction closes.
If the lingering impact of the severe contraction in the global financial markets and current economic conditions continue through 2010, this economic scenario may have an impact on the Company’s business and financial condition.
The diminished availability of credit and liquidity due to the lingering impact of the severe contraction in the global financial markets and current economic conditions may continue through 2010. This economic scenario may affect the financial health of the Company’s customers, vendors and partners, which in turn may negatively affect the Company’s revenues, operating expenses and cash flows. In addition, although Frontier believes, based on currently available information, that the financial institutions that have outstanding commitments under Frontier’s revolving credit facility will be able to fulfill their commitments to the Company, if the current economic environment and the recent severe contraction in the global financial markets continue through 2010 or beyond, this could change in the future. It is Frontier’s intention to replace its existing $250.0 million revolving credit facility with a significantly larger facility by the closing date of the Verizon Transaction.
Volatility in asset values related to Frontier’s pension plan and our assumption of Spinco’s pension plan obligations may require us to make cash contributions to fund pension plan liabilities.
As a result of the ongoing payment of benefits and negative investment returns arising from a contraction in the global financial markets, Frontier’s pension plan assets have declined from $822.2 million at December 31, 2007, to $608.6 million at December 31, 2009, a decrease of $213.6 million, or 26%. This decrease consisted of a decline in asset value of $72.8 million, or 9%, and benefits paid of $140.8 million, or 17%. As a result of the continued accrual of pension benefits under the applicable pension plan and the cumulative negative investment returns arising from the contraction of the global financial markets since 2007, Frontier’s pension expenses increased in 2009. While the pension asset values have increased in 2009, Frontier expects to make a cash contribution to its pension plan of $10.0 million in 2010. Once the merger is consummated, the Company will maintain Frontier’s pension plan and will be responsible for contributions to fund the plan’s liabilities, and may be required to continue making these cash contributions in respect of liabilities under Frontier’s pension plan. The Company will also, upon consummation of the merger, maintain pension plans that assume the Spinco business’s pension plan liabilities for active employees. The applicable Verizon tax-qualified pension plans will transfer assets to the Spinco pension plans pursuant to applicable law and the terms of the employee matters agreement entered into among Verizon, Spinco and Frontier. The aggregate transfer related to the tax-qualified pension plans for active union employees will be sufficient for full funding of projected benefit obligations in the aggregate. Following the merger, the Company will be responsible for making any required contributions to the new pension plans to fund liabilities of the plans, and the ongoing pension expenses of the Spinco business may require the Company to make cash contributions in respect of the Spinco business’s pension plan liabilities.
Substantial debt and debt service obligations may adversely affect us.
We have a significant amount of indebtedness, which amounted to approximately $4.8 billion at December 31, 2009. We may also obtain additional long-term debt and working capital lines of credit to meet future financing needs, subject to certain restrictions under the terms of our existing indebtedness, which would increase our total debt. If the Verizon Transaction is completed, the Company will have additional indebtedness in the amount of approximately $3.4 billion at the closing of the Verizon Transaction. Despite the substantial additional indebtedness that the Company would then have, the Company would not be prohibited from incurring even more indebtedness. If the Verizon Transaction is completed and the Company was to incur additional indebtedness, the risks that result from our substantial indebtedness could be magnified.
The potential significant negative consequences on our financial condition and results of operations that could result from our substantial debt include:
| | • | limitations on our ability to obtain additional debt or equity financing, particularly in light of the current credit environment; |
| | • | instances in which we are unable to meet the financial covenants contained in our debt agreements or to generate cash sufficient to make required debt payments, which circumstances have the potential of accelerating the maturity of some or all of our outstanding indebtedness; |
| | • | the allocation of a substantial portion of our cash flow from operations to service our debt, thus reducing the amount of our cash flow available for other purposes, including operating costs, capital expenditures and dividends that could improve our competitive position, results of operations or stock price; |
| | • | requiring us to sell debt or equity securities or to sell some of our core assets, possibly on unfavorable terms, to meet payment obligations; |
| | • | compromising our flexibility to plan for, or react to, competitive challenges in our business and the communications industry; and |
| | • | the possibility of our being put at a competitive disadvantage with competitors who do not have as much debt as us, and competitors who may be in a more favorable position to access additional capital resources. |
The Company will require substantial capital to upgrade and enhance its operations.
Verizon’s historical capital expenditures in connection with the Spinco business, excluding FiOS, have been significantly lower than Frontier’s level of capital expenditures. Replacing or upgrading the Company’s infrastructure will require significant capital expenditures, including any expected or unexpected expenditures necessary to make replacements or upgrades to the existing infrastructure of the Spinco business. If this capital is not available when needed, the Company’s business will be adversely affected. Responding to increases in competition, offering new services, and improving the capabilities of, or reducing the maintenance costs associated with, the Company’s plant may cause the Company’s capital expenditures to increase in the future. In addition, the Company’s anticipated annual dividend will utilize a significant portion of the Company’s cash generated by operations and therefore could limit the Company’s ability to increase capital expenditures significantly. While Frontier believes that the Company’s anticipated cash flows will be adequate to maintain this dividend policy while allowing for appropriate capital spending and other purposes, any material reduction in cash generated by operations and any increases in planned capital expenditures, interest expense or cash taxes would reduce the amount of cash available for further capital expenditures and payment of dividends. Accelerated losses of access lines, the effects of increased competition, lower subsidy and access revenues and the other factors described above may reduce the Company’s cash generated by operations and may require the Company to increase capital expenditures.
Risks Related to Regulation
The risks discussed below in this section refer to the “Company” for ease of reference. The risks apply to Frontier as a stand-alone entity before the Verizon Transaction is completed and will continue to apply to Frontier if the Verizon Transaction is not completed for any reason and will also apply to the combined company assuming the Verizon Transaction closes.
Changes in federal or state regulations may reduce the access charge revenues the Company will receive.
A significant portion of Frontier’s revenues (approximately $246.3 million, or 12%, in 2009) are derived from access charges paid by other carriers for services Frontier provides in originating and terminating intrastate and interstate long distance traffic. As a result, Frontier expects a significant portion (approximately 7%) of the Company’s revenues to continue to be derived from access charges paid by these carriers for services that the Company will provide in originating and terminating this traffic. The amount of access charge revenues that Frontier and the Spinco business receive (and, after the closing, the Company will receive) for these services is regulated by the FCC and state regulatory agencies.
The FCC is considering proposals that may significantly change interstate, intrastate and local intercarrier compensation. When and how these proposed changes will be addressed are unknown and, accordingly, Frontier cannot predict the impact of future changes on the Company’s results of operations. However, future reductions in the Company’s access revenues will directly affect the Company’s profitability and cash flows as those regulatory revenues do not have associated variable expenses.
Certain states also have open proceedings to address reform to access charges and other intercarrier compensation. Frontier cannot predict when or how these matters will be decided or the effect on the Company’s subsidy or access revenues. In addition, Frontier has been approached by, and is currently involved in formal state proceedings with, various carriers seeking reductions in intrastate access rates in certain states. Certain of those claims have led to formal complaints to the applicable state regulatory agencies. A material reduction in the access revenues the Company will receive would adversely affect its financial results.
The Company will be reliant on support funds provided under federal and state laws.
A portion of Frontier’s revenues (approximately $113.3 million in the aggregate, or 5%, in 2009) are derived from federal and state subsidies for rural and high cost support, commonly referred to as universal service fund subsidies, including the Federal High Cost Loop Fund, federal interstate access support, federal interstate common line support, federal local switching support fund, various state funds and surcharges billed to customers. The FCC and state regulatory agencies are currently considering a number of proposals for changing the manner in which eligibility for federal and state subsidies is determined as well as the amounts of such subsidies. The FCC issued an order on May 1, 2008 to cap the amounts that CETCs may receive from the high cost Federal Universal Service Fund (USF). In 2009, a Federal court upheld the FCC’s order and the cap remains in place pending any future reform. In November 2008, the FCC issued a Further Notice of Proposed Rulemaking seeking comment on several different alternatives, some of which could significantly reduce the amount of federal high cost universal service support that the Company would receive. Frontier cannot predict if or when the FCC will take additional actions or the effect of any such actions on the Company’s subsidy revenues.
Federal subsidies representing interstate access support, rural high cost loop support and local switching support represented approximately $69.1 million, or 3%, of Frontier’s revenues in 2009. Frontier currently expects that as a result of both an increase in the national average cost per loop and a decrease in Frontier’s and the Spinco business’s cost structure, there will be a decrease in the subsidy revenues Frontier and the Spinco business will earn in 2010 through the Federal High Cost Loop Fund. The amount of federal interstate access support funds received may also decline as that fund is also subject to a national cap and the amounts allocated among carriers within that cap can vary from year to year. State subsidies represented approximately $8.7 million, or less than 1%, of Frontier’s revenues in 2009. Approximately $35.5 million, or 2%, of Frontier’s 2009 revenues, represents a surcharge to customers (local, long distance and interconnection) to recover universal service fund contribution fees which are remitted to the FCC and recorded as an expense in “other operating expenses.” Frontier expects that approximately 5% of the Company’s revenue will continue to be derived from federal and state subsidies, and from surcharges to customers.
The Company and its industry will likely remain highly regulated, and the Company will likely incur substantial compliance costs that could constrain its ability to compete in its target markets.
As an incumbent local exchange carrier, the Company will be subject to significant regulation from federal, state and local authorities. This regulation will restrict the Company’s ability to change its rates, especially on its basic services and its access rates, and will impose substantial compliance costs on the Company. Regulation will constrain the Company’s ability to compete and, in some jurisdictions, it may restrict how the Company is able to expand its service offerings. In addition, changes to the regulations that govern the Company may have an adverse effect upon its business by reducing the allowable fees that it may charge, imposing additional compliance costs or otherwise changing the nature of its operations and the competition in its industry.
Pending FCC rulemakings and state regulatory proceedings, including those relating to intercarrier compensation and universal service, could have a substantial adverse impact on the Company’s operations.
Risks Related to Technology
The risks discussed below in this section refer to the “Company” for ease of reference. The risks apply to Frontier as a stand-alone entity before the Verizon Transaction is completed and will continue to apply to Frontier if the Verizon Transaction is not completed for any reason and will also apply to the combined company assuming the Verizon Transaction closes.
In the future, as competition intensifies within the Company’s markets, the Company may be unable to meet the technological needs or expectations of its customers, and may lose customers as a result.
The communications industry is subject to significant changes in technology. If the Company does not replace or upgrade technology and equipment, it may be unable to compete effectively because it will not be able to meet the needs or expectations of its customers. Replacing or upgrading the combined infrastructure could result in significant capital expenditures.
In addition, rapidly changing technology in the communications industry may influence the Company’s customers to consider other service providers. For example, the Company may be unable to retain customers who decide to replace their wireline telephone service with wireless telephone service. In addition, VoIP technology, which operates on broadband technology, now provides the Company’s competitors with a competitive alternative to provide voice services to the Company’s customers, and wireless broadband technologies may permit the Company’s competitors to offer broadband data services to the Company’s customers throughout most or all of its service areas.
Item 1B. Unresolved Staff Comments
None.
Item 2. Properties
Our principal corporate offices are located in leased premises at 3 High Ridge Park, Stamford, Connecticut 06905.
Operations support offices are currently located in leased premises at 180 South Clinton Avenue, Rochester, New York 14646 and at 100 CTE Drive, Dallas, Pennsylvania 18612. Call center support offices are currently located in leased premises at 14450 Burnhaven Drive, Burnsville, Minnesota 55306 and 1398 South Woodland Blvd., DeLand, Florida 32720. In addition, we lease and own space in our operating markets throughout the United States.
Our telephone properties include: connecting lines between customers' premises and the central offices; central office switching equipment; fiber-optic and microwave radio facilities; buildings and land; and customer premise equipment. The connecting lines, including aerial and underground cable, conduit, poles, wires and microwave equipment, are located on public streets and highways or on privately owned land. We have permission to use these lands pursuant to local governmental consent or lease, permit, franchise, easement or other agreement.
Item 3. Legal Proceedings
We are party to various legal proceedings arising in the normal course of our business. The outcome of individual matters is not predictable. However, we believe that the ultimate resolution of all such matters, after considering insurance coverage, will not have a material adverse effect on our financial position, results of operations, or our cash flows.
Item 4. Submission of Matters to a Vote of Security Holders
(a) The registrant held a Special Meeting of Stockholders on October 27, 2009 (the “Meeting”).
(b) Matters submitted to stockholders at the Meeting:
(1) Adoption of the Agreement and Plan of Merger, dated as of May 13, 2009, as amended by Amendment No. 1 thereto, dated as of July 24, 2009, by and among Verizon Communications Inc., New Communications Holdings Inc. and the Company (the “Merger Agreement”). The matter passed with the following vote:
| Number of votes FOR | 182,102,556 |
| Number of votes AGAINST | 5,295,793 |
| Number of votes ABSTAINING | 1,227,112 |
(2) Amendment to the Company’s Restated Certificate of Incorporation, as amended, to increase the number of authorized shares of the Company’s common stock from 600,000,000 to 1,750,000,000. The matter passed with the following vote:
| Number of votes FOR | 177,956,211 |
| Number of votes AGAINST | 9,245,127 |
| Number of votes ABSTAINING | 1,424,123 |
(3) Approval of the issuance of the Company’s common stock pursuant to the Merger Agreement. The matter passed with the following vote:
| Number of votes FOR | 181,328,959 |
| Number of votes AGAINST | 6,012,151 |
| Number of votes ABSTAINING | 1,284,351 |
Executive Officers of the Registrant
Our Executive Officers as of February 1, 2010 were:
| Name | Age | Current Position and Officer |
| Mary Agnes Wilderotter | 55 | Chairman of the Board, President and Chief Executive Officer |
| Donald R. Shassian | 54 | Executive Vice President and Chief Financial Officer |
| Hilary E. Glassman | 47 | Senior Vice President, General Counsel and Secretary |
| Peter B. Hayes | 52 | Executive Vice President, Commercial Sales |
| Robert J. Larson | 50 | Senior Vice President and Chief Accounting Officer |
| Daniel J. McCarthy | 45 | Executive Vice President and Chief Operating Officer |
| Cecilia K. McKenney | 47 | Executive Vice President, Human Resources and Call Center Sales & Services |
| Melinda White | 50 | Executive Vice President and General Manager, Marketing and New Business Operations |
There is no family relationship between directors or executive officers. The term of office of each of the foregoing officers of Frontier will continue until the next annual meeting of the Board of Directors and until a successor has been elected and qualified.
MARY AGNES WILDEROTTER has been with Frontier since November 2004. She was elected President and Chief Executive Officer in November 2004 and Chairman of the Board in December 2005. Prior to joining Frontier, she was Senior Vice President - Worldwide Public Sector of Microsoft Corp. from February 2004 to November 2004 and Senior Vice President - Worldwide Business Strategy of Microsoft Corp. from 2002 to 2004. Before that she was President and Chief Executive Officer of Wink Communications from 1997 to 2002.
DONALD R. SHASSIAN has been with Frontier since April 2006. He is currently Executive Vice President and Chief Financial Officer. Previously, he was Chief Financial Officer from April 2006 to February 2008. Prior to joining Frontier, Mr. Shassian had been an independent consultant since 2001 primarily providing M&A advisory services to several organizations in the communications industry. In his role as independent consultant, Mr. Shassian also served as Interim Chief Financial Officer of the Northeast region of Health Net, Inc. for a short period of time, and assisted in the evaluation of acquisition, disposition and capital raising opportunities for several companies in the communications industry, including AT&T, Consolidated Communications and smaller companies in the rural local exchange business. Mr. Shassian is a certified public accountant, and served for 5 years as the Senior Vice President and Chief Financial Officer of Southern New England Telecommunications Corporation and for more than 16 years at Arthur Andersen, where his last position was as Partner in Charge of the North American Telecom Industry.
HILARY E. GLASSMAN has been with Frontier since July 2005 as Senior Vice President, General Counsel and Secretary. Prior to joining Frontier, from February 2003, she was associated with Sandler O'Neill & Partners, L.P., an investment bank with a specialized financial institutions practice, first as Managing Director, Associate General Counsel and then as Managing Director, Deputy General Counsel. From February 2000 through February 2003, Ms. Glassman was Vice President and General Counsel of Newview Technologies, Inc. (formerly e-Steel Corporation), a privately-held software company.
PETER B. HAYES has been with Frontier since February 2005. He is currently Executive Vice President, Commercial Sales. Previously, Mr. Hayes was Executive Vice President, Sales, Marketing and Business Development from December 2005 to August 2009 and prior to that, Senior Vice President, Sales, Marketing and Business Development from February 2005 to December 2005. Prior to joining Frontier, he was associated with Microsoft Corp. and served as Vice President, Public Sector, Europe, Middle East, Africa from 2003 to 2005 and Vice President and General Manager, Microsoft U.S. Government from 1997 to 2003.
ROBERT J. LARSON has been with Frontier since July 2000. He was elected Senior Vice President and Chief Accounting Officer of Frontier in December 2002. Previously, he was Vice President and Chief Accounting Officer from July 2000 to December 2002. Prior to joining Frontier, he was Vice President and Controller of Century Communications Corp.
DANIEL J. McCARTHY has been with Frontier since December 1990. He is currently Executive Vice President and Chief Operating Officer. Previously, he was Senior Vice President, Field Operations from December 2004 to December 2005. He was Senior Vice President Broadband Operations from January 2004 to December 2004, President and Chief Operating Officer of Electric Lightwave from January 2002 to December 2004, President and Chief Operating Officer, Public Services Sector from November 2001 to January 2002, Vice President and Chief Operating Officer, Public Services Sector from March 2001 to November 2001 and Vice President, Citizens Arizona Energy from April 1998 to March 2001.
CECILIA K. McKENNEY has been with Frontier since February 2006. She is currently Executive Vice President, Human Resources and Call Center Sales & Service. Previously, she was Senior Vice President, Human Resources from February 2006 to February 2008. Prior to joining Frontier, she was Group Vice President, Headquarters Human Resources, of The Pepsi Bottling Group (PBG) from 2004 to 2005. Previously at PBG Ms. McKenney was Vice President, Headquarters Human Resources from 2000 to 2004.
MELINDA WHITE has been with Frontier since January 2005. She is currently Executive Vice President and General Manager, Marketing and New Business Operations. Previously, she was Senior Vice President and General Manager, Marketing and New Business Operations from July 2009 to November 2009. Prior to that, Ms. White was Senior Vice President and General Manager of New Business Operations from October 2007 to July 2009 and prior to that, Senior Vice President, Commercial Sales and Marketing from January 2006 to October 2007. Ms. White was Vice President and General Manager of Electric Lightwave from January 2005 to July 2006. Prior to joining Frontier, she was Executive Vice President, National Accounts/Business Development for Wink Communications from 1996 to 2002. From 2002 to 2005, Ms. White pursued a career in music.
FRONTIER COMMUNICATIONS CORPORATION AND SUBSIDIARIES
PART II
| | Item 5. Market for Registrant's Common Equity, Related Stockholder Matters and Issuer Purchases of Equity Securities |
PRICE RANGE OF COMMON STOCK
Our common stock is traded on the New York Stock Exchange under the symbol FTR. The following table indicates the high and low intra-day sales prices, as reported by the New York Stock Exchange, per share during the periods indicated.
| | | 2009 | | | 2008 | |
| | | High | | | Low | | | High | | | Low | |
| | | | | | | | | | | | | |
| First Quarter | | $ | 8.87 | | | $ | 5.32 | | | $ | 12.84 | | | $ | 9.75 | |
| Second Quarter | | $ | 8.16 | | | $ | 6.62 | | | $ | 11.96 | | | $ | 10.01 | |
| Third Quarter | | $ | 7.60 | | | $ | 6.43 | | | $ | 12.94 | | | $ | 11.14 | |
| Fourth Quarter | | $ | 8.57 | | | $ | 7.12 | | | $ | 11.80 | | | $ | 6.35 | |
As of February 16, 2010, the approximate number of security holders of record of our common stock was 23,341. This information was obtained from our transfer agent, Computershare Inc.
DIVIDENDS
The amount and timing of dividends payable on our common stock are within the sole discretion of our Board of Directors. Since the third quarter of 2004, we have paid a regular annual cash dividend of $1.00 per share of common stock to be paid quarterly. On May 13, 2009, we announced that concurrent with the closing of the Verizon Transaction we intend to reduce our annual cash dividend from $1.00 per share to $0.75 per share, to be paid quarterly, subject to applicable law and within the discretion of our Board of Directors. Cash dividends paid to shareholders were approximately $312.4 million, $318.4 million and $336.0 million in 2009, 2008 and 2007, respectively. There are no material restrictions on our ability to pay dividends, except for the period leading up to the merger, during which time pursuant to the merger agreement we may not pay dividends other than quarterly dividends in an amount not to exceed $0.25 per share. The table below sets forth dividends paid per share during the periods indicated.
| | | 2009 | | | 2008 | | | 2007 | |
| | | | | | | | | | |
| | | | | | | | | | |
| First Quarter | | $ | 0.25 | | | $ | 0.25 | | | $ | 0.25 | |
| Second Quarter | | $ | 0.25 | | | $ | 0.25 | | | $ | 0.25 | |
| Third Quarter | | $ | 0.25 | | | $ | 0.25 | | | $ | 0.25 | |
| Fourth Quarter | | $ | 0.25 | | | $ | 0.25 | | | $ | 0.25 | |
STOCKHOLDER RETURN PERFORMANCE GRAPH
The following performance graph compares the cumulative total return of our common stock to the S&P 500 Stock Index and to the S&P Telecommunications Services Index for the five-year period commencing December 31, 2004.
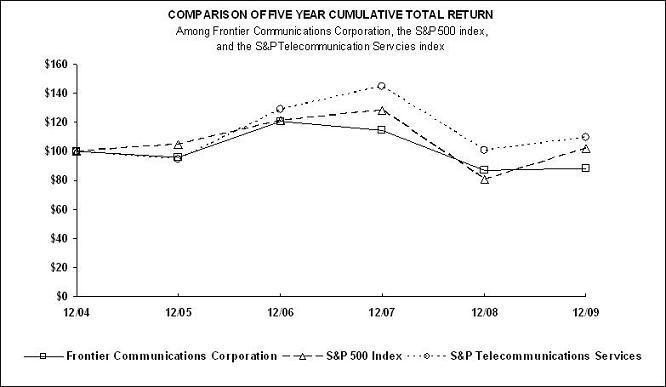 The graph assumes that $100 was invested on December 31, 2004 in each of our common stock, the S&P 500 Stock Index and the S&P Telecommunications Services Index and that all dividends were reinvested.
| | | | | | | |
| | | Base | | | INDEXED RETURNS Years Ending | |
| | | Period | | | | | | | | | | | | | | | | |
| Company / Index | | | 12/04 | | | | 12/05 | | | | 12/06 | | | | 12/07 | | | | 12/08 | | | | 12/09 | |
| Frontier Communications Corporation | | | 100 | | | | 95.70 | | | | 120.90 | | | | 114.82 | | | | 86.70 | | | | 88.47 | |
| S&P 500 Index | | | 100 | | | | 104.91 | | | | 121.48 | | | | 128.16 | | | | 80.74 | | | | 102.11 | |
| S&P Telecommunications Services | | | 100 | | | | 94.37 | | | | 129.10 | | | | 144.52 | | | | 100.45 | | | | 109.42 | |
| | | | | | | | | | | | | | | | | | | | | | | | | |
The foregoing performance graph and related information shall not be deemed “soliciting material” or to be “filed” with the SEC, nor shall such information be incorporated by reference into any future filings under the Securities Act of 1933 or the Securities Exchange Act of 1934, each as amended, except to the extent we specifically incorporate it by reference into such filing.
RECENT SALES OF UNREGISTERED SECURITIES, USE OF PROCEEDS FROM REGISTERED SECURITIES
None in the quarter ended December 31, 2009. ISSUER PURCHASES OF EQUITY SECURITIES
| | | | | | | |
| Period | | Total Number of Shares Purchased | | | Average Price Paid per Share | |
| | | | | | | |
| October 1, 2009 to October 31, 2009 | | | | | | |
Employee Transactions (1) | | | - | | | $ | - | |
| | | | | | | | | |
| November 1, 2009 to November 30, 2009 | | | | | | | | |
Employee Transactions (1) | | | 12,756 | | | $ | 7.22 | |
| | | | | | | | | |
| December 1, 2009 to December 31, 2009 | | | | | | | | |
Employee Transactions (1) | | | 230 | | | $ | 7.65 | |
| | | | | | | | | |
| Totals October 1, 2009 to December 31, 2009 | | | | | | | | |
Employee Transactions (1) | | | 12,986 | | | $ | 7.22 | |
| | | | | | | | | |
| | | | | | | | | |
| | (1) | Includes restricted shares withheld (under the terms of grants under employee stock compensation plans) to offset minimum tax withholding obligations that occur upon the vesting of restricted shares. The Company’s stock compensation plans provide that the value of shares withheld shall be the average of the high and low price of the Company’s common stock on the date the relevant transaction occurs. |
Item 6. Selected Financial Data
The following tables present selected historical consolidated financial information of Frontier for the periods indicated. The selected historical consolidated financial information of Frontier as of and for each of the five fiscal years in the period ended December 31, 2009 has been derived from Frontier’s historical consolidated financial statements. The selected historical consolidated financial information as of December 31, 2009 and 2008 and for the three years ended December 31, 2009 is derived from the audited historical consolidated financial statements of Frontier included elsewhere in this Form 10-K. The selected historical consolidated financial information as of December 31, 2007, 2006 and 2005 and for the years ended December 31, 2006 and 2005 is derived from the audited historical consolidated financial statements of Frontier not included in this Form 10-K.
| ($ in thousands, except per share amounts) | Year Ended December 31, |
| | 2009 | | 2008 | | 2007 | | 2006 | | 2005 |
Revenue (1) | $ 2,117,894 | | $ 2,237,018 | | $ 2,288,015 | (4) | $ 2,025,367 | | $ 2,017,041 |
Income from continuing operations (2) | $ 123,181 | | $ 184,274 | | $ 216,514 | (5) | $ 258,321 | (6) | $ 189,923 |
| Net income attributable to common shareholders of Frontier | $ 120,783 | | $ 182,660 | | $ 214,654 | | $ 344,555 | | $ 202,375 |
| Basic income per share of common stock | | | | | | | | | |
from continuing operations (3) | $ 0.38 | | $ 0.57 | | $ 0.64 | (4)(5) | $ 0.78 | (6) | $ 0.55 |
| Earnings attributable to common shareholders of Frontier | | | | | | | | | |
per basic share (3) | $ 0.38 | | $ 0.57 | | $ 0.64 | (4)(5) | $ 1.06 | (6) | $ 0.60 |
| Earnings attributable to common shareholders of Frontier | | | | | | | | | |
per diluted share (3) | $ 0.38 | | $ 0.57 | | $ 0.64 | (4)(5) | $ 1.06 | (6) | $ 0.59 |
| Cash dividends declared (and paid) per common share | $ 1.00 | | $ 1.00 | | $ 1.00 | | $ 1.00 | | $ 1.00 |
| | | | | | | | | | |
| | As of December 31, |
| | 2009 | | 2008 | | 2007 | | 2006 | | 2005 |
| Total assets | $ 6,878,255 | | $ 6,888,676 | | $ 7,256,069 | | $ 6,797,536 | | $ 6,427,567 |
| Long-term debt | $ 4,794,129 | | $ 4,721,685 | | $ 4,736,897 | | $ 4,467,086 | | $ 3,995,130 |
| Total shareholders' equity of Frontier | $ 327,611 | | $ 519,045 | | $ 997,899 | | $ 1,058,032 | | $ 1,041,809 |
| | | | | | | | | | |
| (1) | Operating results include activities for Commonwealth Telephone Enterprises, Inc. (Commonwealth or CTE) from the date of its acquisition on March 8, 2007 and for Global Valley Networks, Inc. and GVN Services (together GVN) from the date of their acquisition on October 31, 2007. |
| (2) | Operating results exclude activities for Electric Lightwave, LLC (ELI) for 2006 and 2005. In 2006, we sold our CLEC business, ELI for $255.3 million (including the sale of associated real estate) in cash plus the assumption of approximately $4.0 million in capital lease obligations. We recognized a pre-tax gain on the sale of ELI of approximately $116.7 million. Our pre-tax gain on the sale was $71.6 million. |
| (3) | Operating results include the pre-tax impacts of losses on retirement of debt or exchanges of debt of $45.9 million ($28.9 million after tax or $0.09 per share), $6.3 million ($4.0 million after tax or $0.01 per share), $18.2 million ($11.5 million after tax or $0.03 per share), $2.4 million ($1.5 million after tax or $0.01 per share) and $3.2 million ($2.0 million after tax or $0.01 per share) for 2009, 2008, 2007, 2006 and 2005, respectively. |
| (4) | Revenue for 2007 includes the favorable one-time impact of $38.7 million ($24.4 million after tax or $0.07 per share) for a significant favorable settlement of a carrier dispute. |
| (5) | Operating results for 2007 reflect the positive pre-tax impact of a pension curtailment gain of $14.4 million ($9.1 million after tax or $0.03 per share), resulting from the freeze placed on certain pension benefits of the former CTE non-union employees. |
| (6) | Operating results for 2006 reflect the favorable pre-tax impact of a $61.4 million ($38.7 million after tax or $0.12 per share) gain recognized on the liquidation and dissolution of Rural Telephone Bank. |
Item 7. Management's Discussion and Analysis of Financial Condition and Results of Operations
Forward-Looking Statements
This annual report on Form 10-K contains forward-looking statements that are subject to risks and uncertainties that could cause actual results to differ materially from those expressed or implied in the statements. Statements that are not historical facts are forward-looking statements made pursuant to the safe harbor provisions of The Private Securities Litigation Reform Act of 1995. Words such as “believe,” “anticipate,” “expect” and similar expressions are intended to identify forward-looking statements. Forward-looking statements (including oral representations) are only predictions or statements of current plans, which we review continuously. Forward-looking statements may differ from actual future results due to, but not limited to, and our future results may be adversely affected by, any of the following possibilities:
| | · | Our ability to complete the Verizon Transaction; |
| | · | The failure to obtain, delays in obtaining or adverse conditions contained in any required regulatory approvals for the Verizon Transaction; |
| | · | For two years after the merger, Frontier may be limited in the amount of capital stock that it can issue to make acquisitions or to raise additional capital. Also, Frontier’s indemnity obligation to Verizon may discourage, delay or prevent a third party from acquiring control of Frontier during this two-year period in a transaction that stockholders of Frontier might consider favorable; |
| | · | The ability to successfully integrate the Verizon operations into our existing operations; |
| | · | The effects of increased expenses incurred due to activities related to the Verizon Transaction; |
| | · | The ability to migrate Verizon’s West Virginia operations from Verizon owned and operated systems and processes to our owned and operated systems and processes successfully; |
| | · | The risk that the growth opportunities and cost synergies from the Verizon Transaction may not be fully realized or may take longer to realize than expected; |
| | · | The sufficiency of the assets contributed by Verizon to enable the combined company to operate the acquired business; |
| | · | Disruption from the Verizon Transaction making it more difficult to maintain relationships with customers, employees or suppliers; |
| | · | The effects of greater than anticipated competition requiring new pricing, marketing strategies or new product or service offerings and the risk that we or, if the Verizon Transaction is completed, the combined company will not respond on a timely or profitable basis; |
| | · | Reductions in the number of our access lines or, if the Verizon Transaction is completed, the combined company’s access lines that cannot be offset by increases in HSI subscribers and sales of other products; |
| | · | Our ability to sell enhanced and data services in order to offset ongoing declines in revenues from local services, switched access services and subsidies; |
| | · | The effects of ongoing changes in the regulation of the communications industry as a result of federal and state legislation and regulation; |
| | · | The effects of competition from cable, wireless and other wireline carriers (through VOIP or otherwise); |
| | · | Our ability to adjust successfully to changes in the communications industry and to implement strategies for growth; |
| | · | Adverse changes in the credit markets or in the ratings given to our debt securities or, if the Verizon Transaction is completed, the combined company’s debt securities, by nationally accredited ratings organizations, which could limit or restrict the availability, or increase the cost, of financing; |
| | · | Continued reductions in switched access revenues as a result of regulation, competition or technology substitutions; |
| | · | The effects of changes in both general and local economic conditions on the markets that we serve or that, if the Verizon Transaction is completed, the combined company will serve, which can affect demand for our or its products and services, customer purchasing decisions, collectability of revenues and required levels of capital expenditures related to new construction of residences and businesses; |
| | · | Our ability to effectively manage service quality in our existing territories, and if the Verizon Transaction is completed, in our new territories; |
| | · | Our ability to successfully introduce new product offerings, including our ability to offer bundled service packages on terms that are both profitable to us and attractive to our customers; |
| | · | Changes in accounting policies or practices adopted voluntarily or as required by generally accepted accounting principles or regulations; |
| | · | Our ability to effectively manage our or, if the Verizon Transaction is completed, the combined company’s operations, operating expenses and capital expenditures, and to repay, reduce or refinance our or the combined company’s debt; |
| | · | The effects of bankruptcies and home foreclosures, which could result in difficulty in collection of revenues and loss of customers; |
| | · | The effects of technological changes and competition on our capital expenditures and product and service offerings or, if the Verizon Transaction is completed, the capital expenditures and product and service offerings of the combined company, including the lack of assurance that the ongoing network improvements will be sufficient to meet or exceed the capabilities and quality of competing networks; |
| | · | The effects of increased medical, retiree and pension expenses and related funding requirements; |
| | · | Changes in income tax rates, tax laws, regulations or rulings, and/or federal or state tax assessments; |
| | · | The effects of state regulatory cash management policies on our ability or, if the Verizon transaction is completed, the combined company’s ability to transfer cash among our or the combined company’s subsidiaries and to the parent company; |
| | · | Our ability to successfully renegotiate union contracts expiring in 2010 and thereafter; |
| | · | Declines in the value of our pension plan assets or, if the Verizon Transaction is completed, the combined company’s pension plan assets, which could require us or the combined company to make contributions to the pension plan in 2011 and beyond; |
| | · | Our ability to pay dividends in respect of our common shares or, if the Verizon Transaction is completed, the combined company’s common shares, which may be affected by our or the combined company’s cash flow from operations, amount of capital expenditures, debt service requirements, cash paid for income taxes and our or the combined company’s liquidity; |
| | · | The effects of any unfavorable outcome with respect to any current or future legal, governmental or regulatory proceedings, audits or disputes with respect to us or, if the Verizon Transaction is completed, the combined company; |
| | · | The possible impact of adverse changes in political or other external factors over which we or, if the Verizon Transaction is completed, the combined company, would have no control; and |
| | · | The effects of hurricanes, ice storms or other natural disasters. |
Any of the foregoing events, or other events, could cause financial information to vary from management’s forward-looking statements included in this report. You should consider these important factors, as well as the risks set forth under Item 1A. “Risk Factors” above, in evaluating any statement in this report on Form 10-K or otherwise made by us or on our behalf. The following information is unaudited and should be read in conjunction with the consolidated financial statements and related notes included in this report. We have no obligation to update or revise these forward-looking statements.
Overview
We are a full–service communications provider and one of the largest exchange telephone carriers in the country. As of December 31, 2009, we operated in 24 states with approximately 5,400 employees.
On May 13, 2009, we entered into a definitive agreement with Verizon under which Frontier will acquire defined assets and liabilities of the local exchange business and related landline activities of Verizon in the Spinco territory, including Internet access and long distance services and broadband video provided to designated customers in the Spinco territory. Assuming that the merger occurred on December 31, 2009, the merger would have resulted in Frontier acquiring approximately 4.2 million access lines and certain business related assets from Verizon. The Verizon Transaction will be financed with approximately $5.3 billion of common stock plus the assumption of approximately $3.33 billion in debt. Certain of the conditions to the closing of the Verizon Transaction have already been met: (1) Frontier’s shareholders approved the Verizon Transaction at a special meeting of shareholders held on October 27, 2009; (2) the Federal Trade Commission has granted early termination of the waiting period under the Hart-Scott-Rodino Act; (3) approvals of all necessary local video franchise authorities (subject to the satisfaction of certain conditions); (4) receipt by Verizon of a favorable ruling from the IRS regarding the tax consequences of the Verizon Transaction; and (5) five of the nine required state regulatory approvals. Completion of the Verizon Transaction remains subject to a number of other conditions, including the receipt of the remaining four state regulatory approvals, approval from the FCC, the completion of financing on terms that satisfy certain conditions as well as other customary closing conditions. Subject to satisfaction of these conditions, we anticipate closing this transaction during the second quarter of 2010.
During 2007, we completed the acquisitions of Commonwealth Telephone Enterprises, Inc. (Commonwealth or CTE), and Global Valley Networks, Inc. and GVN Services (together GVN) which expanded our presence in Pennsylvania and California, and strengthened our position as a leading full-service communications provider to rural markets.
Our revenues declined in 2009. Revenues from data and internet services such as HSI grew and increased as a percentage of our total revenues and revenues from local access lines and access charges (including federal and state subsidies) declined and decreased as a percentage of our total revenues.
Regulatory revenue includes switched access and subsidy revenue and represents 17% of our revenues in 2009. Switched access revenue was $246.3 million in 2009, or 12% of our revenues, down from $284.9 million in 2008, or 13% of our revenues. Federal and state subsidy revenue, including surcharges billed to customers that are remitted to the FCC, was $113.3 million in 2009, or 5% of our revenues, down from $119.8 million in 2008, or 5% of our revenues. We expect these revenue trends in switched access and subsidy revenue to continue in 2010.
Competition in the communications industry is intense and increasing. We experience competition from many communications service providers. These providers include cable operators offering video, data, and VOIP products, wireless carriers, long distance providers, competitive local exchange carriers, Internet providers and other wireline carriers. We believe that as of December 31, 2009, approximately 73% of the households in our territories had VOIP as an available service option. We also believe that competition will continue in 2010 and may result in reduced revenues.
The lingering impact of the severe contraction in the global financial markets that occurred in 2008 and 2009 and the subsequent recession has impacted residential and business customer behavior to reduce expenditures by not purchasing our services or by discontinuing some or all of our services. These trends may continue and may result in a continued challenging revenue environment. These factors could also result in increased delinquencies and bankruptcies and, therefore, affect our ability to collect money owed to us by residential and business customers.
We employ a number of strategies to combat the competitive pressures and changes in consumer behavior noted above. Our strategies are focused on preserving and generating new revenues through customer retention, upgrading and up-selling services to our existing customer base, new customer growth, win backs of former customers, new product deployment, and upon managing our profitability and cash flow through targeted reductions in operating expenses and capital expenditures.
We seek to achieve our customer retention goals by offering attractive packages of value-added services to our access line customers and providing exemplary customer service. Bundled services include HSI, unlimited long distance calling, enhanced telephone features and video offerings. We tailor these services to the needs of our residential and business customers and continually evaluate the introduction of new and complementary products and services, many of which can also be purchased separately. Customer retention is also enhanced by offering one-, two-and three-year price protection plans where customers commit to a term in exchange for predictable pricing and/or promotional offers. Additionally, we are focused on enhancing the customer experience as we believe exceptional customer service will differentiate us from our competition. Our commitment to providing exemplary customer service is demonstrated by our expanded customer service hours, shorter scheduling windows for in-home appointments and the previously implemented call reminders and follow-up calls for service appointments. In addition, our 70 local area markets are operated by local managers with responsibility for the customer experience, as well as the financial results, in those markets. Customers in our markets have direct access to those local managers to help them manage their communications needs.
We utilize targeted and innovative promotions like “aspirational gifts” (e.g., personal computers) or promotional credits to attract new customers, including those moving into our territory, to win back former customers and to upgrade and up-sell existing customers a variety of service offerings including HSI, video, and enhanced long distance and feature packages in order to maximize the average revenue per customer (wallet share) paid to us. Depending upon market and economic conditions, we may offer such promotions to drive sales in the future.
We have restructured and augmented our sales distribution channels to improve coverage of all segments of the business customer base. This includes adding new sales teams dedicated to small business customers and enhancing the business selling and support skills in our customer sales and service centers. We have also increased our focus on customer premise equipment (CPE) sales for customers requiring an equipment solution, and have extended our CPE sales reach beyond a handful of markets. In addition, we are introducing new products utilizing wireless and Internet technologies. We believe the combination of new products and distribution channel improvements will help us improve business customer acquisition and retention.
We are also focused on increasing sales of newer products, including unlimited long distance minutes, bundles of long distance minutes, wireless data, Internet portal advertising, and the Frontier Peace of Mind product suite. This last category is a suite of products that is aimed at managing the total communications and personal computing experience for our customers and designed to provide value and simplicity to meet our customers’ ever-changing needs. The Frontier Peace of Mind products and services suite includes services such as an in-home, full installation of our HSI product, two hour appointment windows for the installation, hard drive back-up services, 24-7 help desk PC support and inside wire maintenance (when bundled). In 2009, the Frontier Peace of Mind products generated approximately $3.2 million in revenue. Most recently, we introduced our myfitv.com website which provides easy online access to video content, entertainment and news available on the worldwide web. Our hard drive back-up services, 24-7 help desk PC support and myfitv.com services are also available outside of our service territories. Although we are optimistic about the opportunities provided by each of these initiatives to increase revenue and reduce churn, we can provide no assurance about their long-term profitability or impact on revenue.
We believe that the combination of offering multiple products and services to our customers pursuant to price protection programs, billing them on a single bill, providing superior customer service, and being active in our local communities will make our customers more loyal, and will help us generate new, and retain existing, customer revenue.
(a) Liquidity and Capital Resources
As of December 31, 2009, we had cash and cash equivalents aggregating $358.7 million. Our primary source of funds continued to be cash generated from operations. For the year ended December 31, 2009, we used cash flow from operations, new borrowings and cash on hand to fund all of our investing and financing activities, including debt repayments.
We believe our operating cash flows, existing cash balances, and revolving credit facility will be adequate to finance our working capital requirements, fund capital expenditures, make required debt payments, pay taxes, pay dividends to our stockholders in accordance with our dividend policy, pay our acquisition and integration costs and capital expenditures, and support our short-term and long-term operating strategies through 2010. However, a number of factors, including but not limited to, losses of access lines, pricing pressure from increased competition, lower subsidy and access revenues and the impact of the current economic environment are expected to reduce our cash generated by operations. In addition, although we believe, based on information available to us, that the financial institutions syndicated under our revolving credit facility would be able to fulfill their commitments to us, given the current economic environment and the recent severe contraction in the global financial markets, this could change in the future. Further, the current credit market turmoil and our below-investment grade credit ratings may also make it more difficult and expensive to refinance our maturing debt. As of December 31, 2009, we have approximately $7.2 million and $280.0 million of debt maturing in 2010 and 2011, respectively.
The consummation of the Verizon Transaction would result in a combined company with significantly larger business operations and, consequently, greater working capital, capital expenditure and other liquidity needs. Upon consummation of the Verizon Transaction, we will be assuming approximately $3.4 billion of Spinco debt. As a result of the greater liquidity requirements of the combined company, it is anticipated that we will seek to expand our revolving credit facility in order to ensure that the combined company has sufficient flexibility to meet its liquidity needs. In addition, the Company may need or elect to raise capital in order to finance or pre-fund commitments which may be made to governmental agencies in connection with their approval of the Verizon Transaction, including commitments with regard to capital expenditures.
In addition, if Spinco (with Frontier’s consent and participation) chooses to raise all or a portion of the financing required to complete the Verizon Transaction prior to the closing of the Verizon Transaction, and the Verizon Transaction is ultimately not consummated or is delayed for a significant period of time, we could be obligated to pay significant interest expense and other costs in connection with the financing without ever achieving the expected benefits of the Verizon Transaction, which may impact our liquidity.
Assuming the Verizon Transaction closes, based on the lower level of Spinco debt we will be assuming from Spinco relative to Spinco’s projected operating cash flows, the combined company’s overall debt will increase but its capacity to service the debt will be significantly enhanced as compared to Frontier’s capacity today. At December 31, 2009, the ratio of Frontier’s net debt to 2009 operating cash flow (“leverage ratio”) was 3.9 times. It is expected that the combined company’s leverage ratio will be significantly lower at closing.
Cash Flow provided by Operating Activities
Cash flow provided by operating activities improved $3.5 million for 2009 as compared to 2008.
Cash flow provided by operating activities declined $82.4 million, or 10%, for 2008 as compared to 2007. The decline resulted from a drop in operating income, as adjusted for non-cash items, lower investment income, a decrease in accounts payable and an increase in current income tax expenditures. These declines were partially offset by a decrease in accounts receivable that positively impacted our cash position as compared to the prior year. We paid $78.9 million in cash taxes during 2008.
Cash paid for taxes was $59.7 million, $78.9 million and $54.4 million in 2009, 2008 and 2007, respectively. Our 2009 cash taxes were lower than 2008 and reflect the benefits from accelerated tax depreciation arising from the 2009 American Recovery and Reinvestment Act (ARRA), utilization of AMT credits and higher interest expense arising from our debt offerings not fully offset by debt repurchases. We expect that in 2010 our cash taxes will be less than $10.0 million. We expect that our 2010 cash taxes will be reduced by the receipt of tax refunds arising from the retroactive application of a change in tax accounting for repairs and maintenance costs. In addition, our 2010 cash taxes will be impacted by approximately $60.0 million of tax benefits arising from our integration activities and secondarily, our 2009 debt refinancing activities. Absent the tax benefits generated by these integration and refinancing activities, we estimate that cash taxes would be approximately $60.0 million to $70.0 million in 2010.
In connection with the pending Verizon Transaction, the Company commenced activities during 2009 to obtain the necessary regulatory approvals, plan and implement systems conversions and begin other initiatives necessary to effectuate the closing, which is expected to occur during the second quarter of 2010, and enable the combined company to implement its “go to market” strategy at closing. As a result, the Company incurred $28.3 million of acquisition and integration costs and $25.0 million in capital expenditures related to Verizon integration activities in 2009. While the Company continues to evaluate certain other expenses, we currently expect to incur operating expenses and capital expenditures of approximately $100.0 million and $75.0 million, respectively, in 2010 related to these integration activities.
Cash Flow used by Investing Activities
Acquisitions
On March 8, 2007, we acquired Commonwealth in a cash-and-stock taxable transaction, for a total consideration of approximately $1.1 billion. We paid $804.1 million in cash ($663.7 million net, after cash acquired) and issued our common stock with a value of approximately $249.8 million.
In connection with the acquisition of Commonwealth, we assumed $35.0 million of debt under a revolving credit facility and $191.8 million face amount of Commonwealth convertible notes (fair value of $209.6 million). During March 2007, we paid down in full the $35.0 million credit facility. We retired all of the Commonwealth notes as of December 31, 2008.
On October 31, 2007, we acquired GVN for a total cash consideration of $62.0 million.
Capital Expenditures
In 2009, 2008 and 2007, our capital expenditures were $256.0 million (including $25.0 million of Verizon integration-related capital expenditures), $288.3 million and $315.8 million, respectively. We continue to closely scrutinize all of our capital projects, emphasize return on investment and focus our capital expenditures on areas and services that have the greatest opportunities with respect to revenue growth and cost reduction. We anticipate capital expenditures of approximately $220.0 million to $240.0 million for 2010 related to our currently owned properties, and an additional $75.0 million of capital expenditures related to the integration activities of the pending Verizon Transaction.
Cash Flow used by and provided from Financing Activities
Issuance of Debt Securities
On October 1, 2009, we completed a registered debt offering of $600.0 million aggregate principal amount of 8.125% senior unsecured notes due 2018. The issue price was 98.441% of the principal amount of the notes, and we received net proceeds of approximately $578.7 million from the offering after deducting underwriting discounts and offering expenses. We used the net proceeds from the offering, together with cash on hand (including cash proceeds from our April 2009 debt offering described below), to finance a cash tender offer for our outstanding 9.250% Senior Notes due 2011 (the 2011 Notes) and our outstanding 6.250% Senior Notes due 2013 (the 2013 Notes), as described below.
On April 9, 2009, we completed a registered offering of $600.0 million aggregate principal amount of 8.25% senior unsecured notes due 2014. The issue price was 91.805% of the principal amount of the notes. We received net proceeds of approximately $538.8 million from the offering after deducting underwriting discounts and offering expenses. We used the net proceeds from the offering to repurchase outstanding debt, as described below.
On March 28, 2008, we borrowed $135.0 million under a senior unsecured term loan facility that was established on March 10, 2008. The loan matures in 2013 and bears interest based on the prime rate or London Interbank Offered Rate (LIBOR), at our election, plus a margin which varies depending on our debt leverage ratio. We used the proceeds to repurchase, during the first quarter of 2008, $128.7 million principal amount of the 2011 Notes and to pay for the $6.3 million of premium on early retirement of those notes.
On March 23, 2007, we issued in a private placement an aggregate $300.0 million principal amount of 6.625% Senior Notes due 2015 and $450.0 million principal amount of 7.125% Senior Notes due 2019. Proceeds from the sale were used to pay down in full $200.0 million principal amount of indebtedness borrowed on March 8, 2007 under a bridge loan facility in connection with the acquisition of Commonwealth, and to redeem, on April 26, 2007, $495.2 million principal amount of our 7.625% Senior Notes due 2008. In the second quarter of 2007, we completed an exchange offer (to publicly register the debt) for the $750.0 million in total of private placement notes described above, in addition to the $400.0 million principal amount of 7.875% Senior Notes due 2027 issued in a private placement on December 22, 2006, for registered notes.
Debt Reduction
In 2009, we retired an aggregate principal amount of $1,048.3 million of debt, consisting of $1,047.3 million of senior unsecured debt, as described in more detail below, and $1.0 million of rural utilities service loan contracts.
During the fourth quarter of 2009, the Company purchased and retired, in accordance with the terms of the tender offer referred to above, approximately $564.4 million aggregate principal amount of the 2011 Notes and approximately $83.4 million aggregate principal amount of the 2013 Notes. The aggregate consideration for these debt repurchases was $701.6 million, which was financed with the proceeds of the October 2009 debt offering and a portion of the proceeds of the April 2009 debt offering, each as described above. The repurchases in the tender offer resulted in a loss on the early retirement of debt of approximately $53.7 million, which we recognized in the fourth quarter of 2009.
In addition to the debt tender offer, we used $388.9 million of the April 2009 debt offering proceeds to repurchase in 2009 $396.7 million principal amount of debt, consisting of $280.8 million of the 2011 Notes, $54.1 million of our 7.875% Senior Notes due January 15, 2027, $35.9 million of the 2013 Notes, $16.0 million of our 7.125% Senior Notes due March 15, 2019 and $9.9 million of our 6.80% Debentures due August 15, 2026. An additional $7.8 million net gain was recognized and included in Other income (loss), net in our consolidated statements of operations for the year ended December 31, 2009 as a result of these other debt repurchases.
As a result of these 2009 debt transactions described above, as of December 31, 2009, we had reduced our debt maturities through 2013 to approximately $7.2 million maturing in 2010, $280.0 million maturing in 2011, $180.4 million maturing in 2012 and $709.9 million maturing in 2013. We do not expect the Verizon Transaction to change the amount of these near-term debt maturities.
In 2008, we retired an aggregate principal amount of $144.7 million of debt, consisting of $128.7 million principal amount of the 2011 Notes, $12.0 million of other senior unsecured debt and rural utilities service loan contracts, and $4.0 million of 5% Company Obligated Mandatorily Redeemable Convertible Preferred Securities (EPPICS).
In 2007, we retired an aggregate principal amount of $967.2 million of debt, including $3.3 million of EPPICS, and $17.8 million of 3.25% Commonwealth convertible notes that were converted into our common stock. On April 26, 2007, we redeemed $495.2 million principal amount of our 7.625% Senior Notes due 2008 at a price of 103.041% plus accrued and unpaid interest. During the first quarter of 2007, we borrowed and repaid $200.0 million utilized to temporarily fund the acquisition of Commonwealth, and we paid down in full the $35.0 million Commonwealth credit facility. Through December 31, 2007, we retired $183.3 million face amount of Commonwealth convertible notes for which we paid $165.4 million in cash and $36.7 million in common stock. We also paid down $44.6 million of industrial development revenue bonds and $4.3 million of rural utilities service loan contracts.
We may from time to time repurchase our debt in the open market, through tender offers, exchanges of debt securities, by exercising rights to call or in privately negotiated transactions. We may also refinance existing debt or exchange existing debt for newly issued debt obligations.
As of December 31, 2008 and 2009, there was no EPPICS related debt outstanding to third parties. The following disclosure provides the history regarding this issuance.
In 1996, our consolidated wholly owned subsidiary, Citizens Utilities Trust (the Trust), issued, in an underwritten public offering, 4,025,000 shares of 5% Company Obligated Mandatorily Redeemable Convertible Preferred Securities due 2036 (Trust Convertible Preferred Securities or EPPICS), representing preferred undivided interests in the assets of the Trust, with a liquidation preference of $50 per security (for a total liquidation amount of $201.3 million). These securities had an adjusted conversion price of $11.46 per share of our common stock. The conversion price was reduced from $13.30 to $11.46 during the third quarter of 2004 as a result of the $2.00 per share of common stock special, non-recurring dividend. The proceeds from the issuance of the Trust Convertible Preferred Securities and a Company capital contribution were used to purchase $207.5 million aggregate liquidation amount of 5% Partnership Convertible Preferred Securities due 2036 from another wholly owned consolidated subsidiary, Citizens Utilities Capital L.P. (the Partnership). The proceeds from the issuance of the Partnership Convertible Preferred Securities and a Company capital contribution were used to purchase from us $211.8 million aggregate principal amount of 5% Convertible Subordinated Debentures due 2036. The sole assets of the Trust were the Partnership Convertible Preferred Securities, and our Convertible Subordinated Debentures were substantially all the assets of the Partnership. Our obligations under the agreements relating to the issuances of such securities, taken together, constituted a full and unconditional guarantee by us of the Trust’s obligations relating to the Trust Convertible Preferred Securities and the Partnership’s obligations relating to the Partnership Convertible Preferred Securities.
In accordance with the terms of the issuances, we paid the annual 5% interest in quarterly installments on the Convertible Subordinated Debentures in 2008 and 2007. Cash was paid (net of investment returns) to the Partnership in payment of the interest on the Convertible Subordinated Debentures. The cash was then distributed by the Partnership to the Trust and then by the Trust to the holders of the EPPICS.
As of December 31, 2008, EPPICS representing the total aggregate liquidation preference of $197.8 million have been converted into 15,969,645 shares of our common stock. There were no outstanding EPPICS as of December 31, 2008 and 2009. As a result of the redemption of all outstanding EPPICS as of December 31, 2008, the $10.5 million in debt with related parties was reclassified by the Company against an offsetting investment.
Interest Rate Management
On January 15, 2008, we terminated all of our interest rate swap agreements representing $400.0 million notional amount of indebtedness associated with our 2011 Notes and 2013 Notes. Cash proceeds from the swap terminations of approximately $15.5 million were received in January 2008. The related gain has been deferred on the consolidated balance sheet, and is being amortized into interest expense over the term of the associated debt. We recognized $7.6 million and $5.0 million of deferred gain during 2009 and 2008, respectively, and anticipate recognizing an additional $1.0 million of deferred gain during 2010. For 2007, the interest expense resulting from these interest rate swaps totaled approximately $2.4 million. At December 31, 2009 and 2008, we did not have any derivative instruments.
Credit Facility
As of December 31, 2009, we had an available line of credit under our revolving credit facility with seven financial institutions in the aggregate amount of $250.0 million and there were no outstanding standby letters of credit issued under the facility. Associated facility fees vary, depending on our debt leverage ratio, and were 0.225% per annum as of December 31, 2009. The expiration date for this $250.0 million five year revolving credit agreement is May 18, 2012. During the term of the credit facility we may borrow, repay and reborrow funds subject to customary borrowing conditions. The credit facility is available for general corporate purposes but may not be used to fund dividend payments.
Covenants
The terms and conditions contained in our indentures and credit facility agreements include the timely payment of principal and interest when due, the maintenance of our corporate existence, keeping proper books and records in accordance with U.S. GAAP, restrictions on liens on our assets, and restrictions on asset sales and transfers, mergers and other changes in corporate control. We currently have no restrictions on the payment of dividends either by contract, rule or regulation, other than those imposed by the General Corporation Law of the State of Delaware. However, we would be restricted under our credit facilities from declaring dividends if an event of default has occurred and is continuing at the time or will result from the dividend declaration.
Our $200.0 million term loan facility with the Rural Telephone Finance Cooperative (RTFC), which matures in 2011, our $250.0 million credit facility, and our $150.0 million and $135.0 million senior unsecured term loans, each contain a maximum leverage ratio covenant. Under those covenants, we are required to maintain a ratio of (i) total indebtedness minus cash and cash equivalents in excess of $50.0 million to (ii) consolidated adjusted EBITDA (as defined in the agreements) over the last four quarters no greater than 4.50 to 1.
Our credit facilities and certain indentures for our senior unsecured debt obligations limit our ability to create liens or merge or consolidate with other companies and our subsidiaries’ ability to borrow funds, subject to important exceptions and qualifications.
As of December 31, 2009, we were in compliance with all of our debt and credit facility covenants.
Proceeds from the Sale of Equity Securities
We receive proceeds from the issuance of our common stock upon the exercise of options pursuant to our stock-based compensation plans. For the years ended December 31, 2009, 2008 and 2007, we received approximately $0.8 million, $1.4 million and $13.8 million, respectively, upon the exercise of outstanding stock options.
Share Repurchase Programs
There were no shares repurchased during 2009 under a share repurchase program.
During 2008, we repurchased 17,778,300 shares of our common stock at an aggregate cost of $200.0 million. During 2007, we repurchased 17,279,600 shares of our common stock at an aggregate cost of $250.0 million.
Dividends
We intend to pay regular quarterly dividends. Our ability to fund a regular quarterly dividend will be impacted by our ability to generate cash from operations. The declarations and payment of future dividends will be at the discretion of our Board of Directors, and will depend upon many factors, including our financial condition, results of operations, growth prospects, funding requirements, applicable law, restrictions in agreements governing our indebtedness and other factors our Board of Directors deems relevant. We have announced that after the closing of the Verizon Transaction we intend to reduce our annual cash dividend from $1.00 per share to $0.75 per share, subject to applicable law and within the discretion of our Board of Directors, as discussed above. Until consummation of the Verizon Transaction or termination of the merger agreement, we are also restricted from increasing the amount of our dividends by the terms of our merger agreement with Verizon.
Off-Balance Sheet Arrangements
We do not maintain any off-balance sheet arrangements, transactions, obligations or other relationships with unconsolidated entities that would be expected to have a material current or future effect upon our financial statements.
A summary of our future contractual obligations and commercial commitments as of December 31, 2009 is as follows:
Contractual Obligations:
| | | | | | | | | | | | | | | | |
| ($ in thousands) | | | | | Payment due by period | |
| | | Total | | | 2010 | | | | 2011-2012 | | | | 2013-2014 | | | Thereafter | |
| Long-term debt obligations, | | | | | | | | | | | | | | | | | |
| excluding interest | | $ | 4,884,151 | | | $ | 7,236 | | | $ | 460,322 | | | $ | 1,310,372 | | | $ | 3,106,221 | |
| | | | | | | | | | | | | | | | | | | | | |
| Interest on long-term debt | | | 4,593,546 | | | | 362,308 | | | | 703,055 | | | | 592,803 | | | | 2,935,380 | |
| | | | | | | | | | | | | | | | | | | | | |
| Operating lease obligations | | | 64,288 | | | | 24,417 | | | | 20,034 | | | | 12,903 | | | | 6,934 | |
| | | | | | | | | | | | | | | | | | | | | |
| Purchase obligations | | | 30,269 | | | | 11,026 | | | | 10,828 | | | | 8,250 | | | | 165 | |
| | | | | | | | | | | | | | | | | | | | | |
| Liability for uncertain tax positions | | | 56,860 | | | | 3,454 | | | | 45,538 | | | | 7,587 | | | | 281 | |
| Total | | $ | 9,629,114 | | | $ | 408,441 | | | $ | 1,239,777 | | | $ | 1,931,915 | | | $ | 6,048,981 | |
| | | | | | | | | | | | | | | | | | | | | |
At December 31, 2009, we have outstanding performance letters of credit totaling $27.7 million.
On August 24, 1999, our Board of Directors approved a plan to divest our public utilities services businesses, which included gas, electric and water and wastewater businesses. We have sold all of these properties. In 2006, we disposed of ELI, our former CLEC business. All of the agreements relating to the sales provide that we will indemnify the buyer against certain liabilities (typically liabilities relating to events that occurred prior to sale), including environmental liabilities, for claims made by specified dates and that exceed threshold amounts specified in each agreement (see Note 21).
Critical Accounting Policies and Estimates
We review all significant estimates affecting our consolidated financial statements on a recurring basis and record the effect of any necessary adjustment prior to their publication. Uncertainties with respect to such estimates and assumptions are inherent in the preparation of financial statements; accordingly, it is possible that actual results could differ from those estimates and changes to estimates could occur in the near term. The preparation of our financial statements in conformity with U.S. GAAP requires management to make estimates and assumptions that affect the reported amounts of assets and liabilities at the date of the financial statements, the disclosure of contingent assets and liabilities, and the reported amounts of revenue and expenses during the reporting period. Estimates and judgments are used when accounting for allowance for doubtful accounts, impairment of long-lived assets, intangible assets, depreciation and amortization, pension and other postretirement benefits, income taxes, contingencies and purchase price allocations, among others.
Management has discussed the development and selection of these critical accounting estimates with the Audit Committee of our Board of Directors and our Audit Committee has reviewed our disclosures relating to such estimates.
Allowance for Doubtful Accounts
We maintain an allowance for estimated bad debts based on our estimate of collectability of our accounts receivable through a review of aging categories and specific customer accounts. In 2009 and 2008, we had no “critical estimates” related to telecommunications bankruptcies.
Asset Impairment
In 2009 and 2008, we had no “critical estimates” related to asset impairments.
Intangibles
Our indefinite lived intangibles consist of goodwill and trade name, which resulted from the purchase of ILEC properties. We test for impairment of these assets annually, or more frequently, as circumstances warrant. We reorganized our management and operating structure during the first quarter of 2009 to include our Rochester market with our existing New York State properties and the rest of the East Region. This structure is consistent with how our Chief Operating Decision Makers (CEO, CFO, COO) review our results on a daily, weekly and monthly basis. As a result of the change, our operating segments (reporting units) decreased from 4 (at December 31, 2008) to 3 (effective as of March 31, 2009). After making the change in our operating segments, we reviewed our goodwill impairment test by comparing the EBITDA multiples for each reporting unit to their carrying values noting that no impairment indicator was present. Further, we determined that no impairment was indicated at December 31, 2008 and March 31, 2009 for either the East or Rochester reporting units and combining them did not alter the conclusion at either date. No potential impairment was indicated and no further analysis was deemed necessary.
All of our ILEC properties share similar economic characteristics and as a result, we aggregate our three operating segments into one reportable segment. In determining fair value of goodwill during 2009 we compared the net book value of the reporting units to current trading multiples of ILEC properties as well as trading values of our publicly traded common stock. Additionally, we utilized a range of prices to gauge sensitivity. Our test determined that fair value exceeded book value of goodwill for each of our reporting units as of December 31, 2009.
Goodwill by reporting unit (operating segment) at December 31, 2009 is as follows:
| | | Reporting Units | |
| ($ in thousands) | | East | | | West | | | Central | |
| | | | | | | | | | |
| Goodwill | | $ | 1,201,387 | | | $ | 34,736 | | | $ | 1,406,200 | |
We did not have any changes to our operating segments, reporting units, or changes in the allocation of goodwill by reporting unit during the years ended December 31, 2007 and 2008. During the first quarter of 2007 we acquired Commonwealth and included their operations and any related goodwill in our Central region.
Each of the above noted reporting units is an operating segment. The first step in the goodwill impairment test compares the carrying value of net assets of the reporting unit to its fair value. The result of this first step indicated that fair value of each reporting unit exceeded the carrying value of such reporting units by a wide margin. As a result, the second step of the goodwill impairment test was not required.
We estimate fair value in two ways: (1) market or transaction based and (2) equity based utilizing our share price. Market values for rural ILEC properties are typically quoted as a multiple of cash flow or EBITDA. Marketplace transactions and analyst reports support a range of values around a multiple of 6 to 6.5 times annualized EBITDA. For the purpose of the goodwill impairment test we define EBITDA as operating income plus depreciation and amortization. We determined the fair value estimates using 6 times EBITDA but also used lower EBITDA multiples to gauge the sensitivity of the estimate and its effect on the margin of excess of fair value over the carrying values of the reporting units. Additionally, a second test was performed using our public market equity value or market capitalization. Market capitalization (current market stock price times total shares outstanding) is a public market indicator of equity value and is useful in corroborating the 6 times EBITDA valuation because we are singularly engaged in rural ILEC operating activities. Our stock price on December 31, 2009 was $7.81 and when compared to the fair value using the EBITDA multiple obtained above, exceeded such value before consideration of any applicable control premium. We also used lower per share stock prices to gauge the sensitivity of the estimate and its effect on the margin of excess fair value over the carrying value. Total market capitalization determined in this manner is then allocated to the reporting units based upon each unit’s relative share of consolidated EBITDA. Our method of determining fair value has been consistently applied for the three years ending December 31, 2009.
Depreciation and Amortization
The calculation of depreciation and amortization expense is based on the estimated economic useful lives of the underlying property, plant and equipment and identifiable intangible assets. An independent study updating the estimated remaining useful lives of our property, plant and equipment assets is performed annually. We adopted the lives proposed in the study effective October 1, 2009. Our “composite depreciation rate” decreased from 5.6% to 5.2% as a result of the study. We anticipate depreciation expense of approximately $335.0 million to $355.0 million for 2010 related to our currently owned properties. We periodically reassess the useful life of our intangible assets to determine whether any changes to those lives are required.
Pension and Other Postretirement Benefits
Our estimates of pension expense, other postretirement benefits including retiree medical benefits and related liabilities are “critical accounting estimates.” We sponsor a noncontributory defined benefit pension plan covering a significant number of our current and former employees and other postretirement benefit plans that provide medical, dental, life insurance and other benefits for covered retired employees and their beneficiaries and covered dependents. The pension plans for the majority of our current employees are frozen. All of the employees who are still accruing pension benefits are represented employees. The accounting results for pension and other postretirement benefit costs and obligations are dependent upon various actuarial assumptions applied in the determination of such amounts. These actuarial assumptions include the following: discount rates, expected long-term rate of return on plan assets, future compensation increases, employee turnover, healthcare cost trend rates, expected retirement age, optional form of benefit and mortality. We review these assumptions for changes annually with our independent actuaries. We consider our discount rate and expected long-term rate of return on plan assets to be our most critical assumptions.
The discount rate is used to value, on a present value basis, our pension and other postretirement benefit obligations as of the balance sheet date. The same rate is also used in the interest cost component of the pension and postretirement benefit cost determination for the following year. The measurement date used in the selection of our discount rate is the balance sheet date. Our discount rate assumption is determined annually with assistance from our actuaries based on the pattern of expected future benefit payments and the prevailing rates available on long-term, high quality corporate bonds that approximate the benefit obligation. In making this determination we consider, among other things, the yields on the Citigroup Pension Discount Curve, the Citigroup Above-Median Pension Curve, the general movement of interest rates and the changes in those rates from one period to the next. This rate can change from year-to-year based on market conditions that affect corporate bond yields. Our discount rate was 5.75% at year-end 2009, and 6.50% at year-end 2008.
The expected long-term rate of return on plan assets is applied in the determination of periodic pension and postretirement benefit cost as a reduction in the computation of the expense. In developing the expected long-term rate of return assumption, we considered published surveys of expected market returns, 10 and 20 year actual returns of various major indices, and our own historical 5 year, 10 year and 20 year investment returns. The expected long-term rate of return on plan assets is based on an asset allocation assumption of 35% to 55% in fixed income securities, 35% to 55% in equity securities and 5% to 15% in alternative investments. We review our asset allocation at least annually and make changes when considered appropriate. Our asset return assumption is made at the beginning of our fiscal year. In 2009, we changed our expected long-term rate of return on plan assets to 8.0% from the 8.25% used in 2008. For 2010, we will assume a rate of return of 8.00%. Our pension plan assets are valued at fair value as of the measurement date.
We expect that our pension and other postretirement benefit expenses for 2010 will be $45.0 million to $55.0 million (they were $48.6 million in 2009), and that we will make a $10.0 million cash contribution to our pension plan in 2010. No contributions were made to our pension plan during 2007, 2008 or 2009.
Income Taxes
Our effective tax rates in 2007, 2008 and 2009 were approximately at the statutory rates.
Contingencies
At December 31, 2006, we had a reserve of $8.0 million in connection with a potential environmental claim in Bangor, Maine. This claim was settled with a payment of $7.625 million plus additional expenses during the third quarter of 2007.
We currently do not have any contingencies in excess of $5.0 million recorded on our books.
Purchase Price Allocation – Commonwealth and GVN
The allocation of the approximate $1.1 billion paid to the “fair market value” of the assets and liabilities of Commonwealth is a critical estimate. We finalized our estimate of the fair values assigned to plant, customer list and goodwill, as more fully described in Notes 3 and 6 to the consolidated financial statements. Additionally, the estimated expected life of a customer (used to amortize the customer list) is a critical estimate.
New Accounting Pronouncements
The following new accounting standards were adopted by the Company in 2009 without any material financial statement impact. All of these standards are more fully described in Note 2 to the consolidated financial statements.
| | · | Fair Value Measurements (SFAS No. 157, ASC Topic 820), as amended |
| | · | Business Combinations (SFAS No. 141R, ASC Topic 805), as amended |
| | · | Noncontrolling Interests in Consolidated Financial Statements (SFAS No. 160, ASC Topic 810) |
| | · | Determining Whether Instruments Granted in Share-Based Payment Transactions are Participating Securities (FSP EITF No. 03-6-1, ASC Topic 260) |
| | · | Subsequent Events (SFAS No. 165, ASC Topic 855) |
| | · | The FASB Accounting Standards Codification and the Hierarchy of Generally Accepted Accounting Principles (SFAS No. 168, ASC Topic 105) |
| | · | Employers’ Disclosures about Postretirement Benefit Plan Assets (FSP SFAS No. 132(R)-1, ASC Topic 715) |
FRONTIER COMMUNICATIONS CORPORATION AND SUBSIDIARIES
(b) Results of Operations
Our historical results include the results of operations of CTE from the date of its acquisition on March 8, 2007 and of GVN from the date of its acquisition on October 31, 2007. Accordingly, results of operations for 2009, 2008 and 2007 are not directly comparable as 2009 and 2008 results reflect the inclusion of a full year of operations of CTE and GVN, whereas 2007 results reflect the inclusion of approximately ten months of operations of CTE and of two months of operations of GVN.
REVENUE
Revenue is generated primarily through the provision of local, network access, long distance, and data and internet services. Such revenues are generated through either a monthly recurring fee or a fee based on usage at a tariffed rate and revenue recognition is not dependent upon significant judgments by management, with the exception of a determination of a provision for uncollectible amounts.
Consolidated revenue for 2009 decreased $119.1 million, or 5%, to $2,117.9 million as compared to 2008. This decline is a result of lower local services revenue, switched access revenue, long distance services revenue and subsidy revenue, partially offset by a $31.3 million, or 5%, increase in data and internet services revenue, each as described in more detail below.
Consolidated revenue for 2008 decreased $51.0 million, or 2%, to $2,237.0 million as compared to 2007. Excluding additional revenue attributable to the CTE and GVN acquisitions for a full year in 2008 and for a partial period in 2007, our revenue decreased $107.3 million during 2008, or 5%, as compared to 2007. During the first quarter of 2007, we had a significant favorable settlement of a carrier dispute that resulted in a favorable one-time impact to our revenue of $38.7 million. Excluding the additional revenue due to the one-time favorable settlement in the first quarter of 2007 and the additional revenue attributable to the CTE and GVN acquisitions in 2008 and 2007, our revenue for the year ended December 31, 2008 declined $68.6 million, or 3%, as compared to the prior year. This decline is a result of lower local services revenue, switched access revenue and subsidy revenue, partially offset by a $37.3 million, or 8%, increase in data and internet services revenue, each as described in more detail below.
Change in the number of our access lines is one factor that is important to our revenue and profitability. We have lost access lines primarily because of changing consumer behavior (including wireless substitution), economic conditions, changing technology, competition, and by some customers disconnecting second lines when they add HSI or cable modem service. In 2009, we lost approximately 136,800 access lines (net), or 6% on an annual basis. This represents an improvement in our rate of access line loss over 2008, during which we lost approximately 174,800 access lines (net) or 7% on an annual basis. We believe this improvement is attributable to the customer recognition of the value of our product bundles, fewer residential moves out of territory, fewer moves by businesses to competitors and our ability to compete with cable telephony in a maturing marketplace. Economic conditions and/or increasing competition could make it more difficult to sell our bundles, and cause us to increase our promotions and/or lower our prices for our products and services, which would adversely affect our revenue, profitability and cash flow.
During 2009, we added approximately 56,000 HSI subscribers. We expect to continue to increase HSI subscribers in 2010 (although not enough to offset the expected continued loss in access lines).
While the number of access lines is an important metric to gauge certain revenue trends, it is not necessarily the best or only measure to evaluate our business. Management believes that customer counts and understanding different components of revenue is most important. For this reason, presented in the table titled “Other Financial and Operating Data” below is a breakdown that presents residential customer counts, average monthly revenue, percentage of customers on price protection plans and churn. It also categorizes revenue into customer revenue (residential and business) and regulatory revenue (switched access and subsidy revenue). Despite the 7% decline in residential customers and the 6% decline in total access lines, our customer revenue, which is all revenue except switched access and subsidy revenue, declined in 2009 by 4 percent as compared to the prior year period. The average monthly residential and total customer revenue per customer has improved, and resulted in an increased wallet share. A substantial further loss of customers and access lines, combined with increased competition and the other factors discussed herein may cause our revenue, profitability and cash flows to decrease in 2010.
| OTHER FINANCIAL AND OPERATING DATA | |
| | | | | | | | | | | | | | | | | | | |
| | | As of | | | | % Increase | | | As of | | | | % Increase | | | As of | | | | |
| | | December 31, 2009 | | | | (Decrease) | | | December 31, 2008 | | | | (Decrease) | | | December 31, 2007 | | | | |
| Access lines: | | | | | | | | | | | | | | | | | | | | |
| Residential | | | 1,349,510 | | | | | (7 | %) | | | 1,454,268 | | | | | (8 | %) | | | 1,587,930 | | | | |
| Business | | | 768,002 | | | | | (4 | %) | | | 800,065 | | | | | (5 | %) | | | 841,212 | | | | |
| Total access lines | | | 2,117,512 | | | | | (6 | %) | | | 2,254,333 | | | | | (7 | %) | | | 2,429,142 | | | | |
| | | | | | | | | | | | | | | | | | | | | | | | | | |
| High-Speed Internet subscribers | | | 635,947 | | | | | 10 | % | | | 579,943 | | | | | 11 | % | | | 522,845 | | | | |
| Video subscribers | | | 172,961 | | | | | 44 | % | | | 119,919 | | | | | 28 | % | | | 93,596 | | | | |
| | | | | | | | | | | | | | | | | | | | | | | | | | |
| | | For the year ended December 31, | | | | | | | | |
| | | | | | $ Increase | | % Increase | | | | | | $ Increase | | % Increase | | | | | | | | |
| | | | 2009 | | (Decrease) | | (Decrease) | | | | 2008 | | (Decrease) | | (Decrease) | | | | 2007 | | | | |
| Revenue (in 000's): | | | | | | | | | | | | | | | | | | | | | | | | | |
| Residential | | $ | 899,800 | | $ | (49,484 | ) | | (5 | %) | | $ | 949,284 | | $ | (9,169 | ) | | (1 | %) | | $ | 958,453 | | | | |
| Business | | | 858,460 | | | (24,561 | ) | | (3 | %) | | | 883,021 | | | 32,921 | | | 4 | % | | | 850,100 | | | | |
| Total customer revenue | | | 1,758,260 | | | (74,045 | ) | | (4 | %) | | | 1,832,305 | | | 23,752 | | | 1 | % | | | 1,808,553 | | | | |
| | | | | | | | | | | | | | | | | | | | | | | | | | | | |
| Regulatory (Access Services) | | | 359,634 | | | (45,079 | ) | | (11 | %) | | | 404,713 | | | (74,749 | ) | | (16 | %) | | | 479,462 | | | | |
| Total revenue | | $ | 2,117,894 | | $ | (119,124 | ) | | (5 | %) | | $ | 2,237,018 | | $ | (50,997 | ) | | (2 | %) | | $ | 2,288,015 | | | | |
| | | | | | | | | | | | | | | | | | | | | | | | | | | | |
| Switched access minutes of use | | | | | | | | | | | | | | | | | | | | | | | | | | | |
| (in millions) | | | 8,854 | | | | | | (12 | %) | | | 10,027 | | | | | | (5 | %) | | | 10,592 | | | | |
| Average monthly total revenue per | | | | | | | | | | | | | | | | | | | | | | | | | | | |
| access line | | $ | 80.74 | | | | | | 1 | % | | $ | 79.62 | | | | | | 2 | % | | $ | 77.72 | (1) | | | | |
| Average monthly customer revenue | | | | | | | | | | | | | | | | | | | | | | | | | | | | |
| per access line | | $ | 67.03 | | | | | | 3 | % | | $ | 65.22 | | | | | | 4 | % | | $ | 62.49 | | | | | |
| | | | | | | | | | | | | | | | | | | | | | | | | | | | | |
| | | As of | | | | | | | | | As of | | | | | | | | | | | | | | | |
| | | December 31, 2009 | | | | | | | | | December 31, 2008 | | | | | | | | | | | | | | | |
| Residential Customer Metrics: | | | | | | | | | | | | | | | | | | | | | | | | | | | | |
| Customers | | | 1,254,508 | | | | | | (7 | %) | | | 1,347,423 | | | | | | | | | | | | | | | |
| Revenue (in 000's) | | $ | 899,800 | | | | | | (5 | %) | | $ | 949,284 | | | | | | | | | | | | | | | |
| Average Monthly Residential Customer | | | | | | | | | | | | | | | | | | | | | | | | | | | | |
| Revenue per Customer | | $ | 57.62 | | | | | | 2 | % | | $ | 56.42 | | | | | | | | | | | | | | | |
| Percent of Customers on Price Protection | | | | | | | | | | | | | | | | | | | | | | | | | | | | |
| Plans | | | 53.2 | % | | | | | 19 | % | | | 44.6 | % | | | | | | | | | | | | | | |
| Customer Monthly Churn | | | 1.47 | % | | | | | (6 | %) | | | 1.57 | % | | | | | | | | | | | | | | |
Products per Residential Customer (2) | | | 2.54 | | | | | | 7 | % | | | 2.37 | | | | | | | | | | | | | | | |
| | | | | | | | | | | | | | | | | | | | | | | | | | | | | |
| | (1) For the year ended December 31, 2007, the calculation includes CTE and GVN data and excludes the $38.7 million favorable one-time impact from the first quarter 2007 settlement of a switched access dispute. The amount is $79.06 with the $38.7 million favorable one-time impact from the settlement. |
| | (2) Products per Residential Customer: Primary Residential Voice line, HSI, Video products have a value of 1. FTR long distance, POM, second lines, Feature Packages and Dial-up have a value of 0.5. |
| REVENUE | |
| | | | | | | | | | | | | | | | | | | |
| | | 2009 | | | 2008 | | | 2007 | |
| ($ in thousands) | | | | $ Increase | | % Increase | | | | | | $ Increase | | % Increase | | | | |
| | | Amount | | (Decrease) | | (Decrease) | | | Amount | | | (Decrease) | | (Decrease) | | | Amount | |
| Local services | | $ | 781,388 | | $ | (67,005 | ) | | (8 | %) | | $ | 848,393 | | | $ | (27,369 | ) | | (3 | %) | | $ | 875,762 | |
| Data and internet services | | | 636,943 | | | 31,328 | | | 5 | % | | | 605,615 | | | | 61,851 | | | 11 | % | | | 543,764 | |
| Access services | | | 359,634 | | | (45,079 | ) | | (11 | %) | | | 404,713 | | | | (74,749 | ) | | (16 | %) | | | 479,462 | |
| Long distance services | | | 165,774 | | | (16,785 | ) | | (9 | %) | | | 182,559 | | | | 2,034 | | | 1 | % | | | 180,525 | |
| Directory services | | | 107,096 | | | (6,251 | ) | | (6 | %) | | | 113,347 | | | | (1,239 | ) | | (1 | %) | | | 114,586 | |
| Other | | | 67,059 | | | (15,332 | ) | | (19 | %) | | | 82,391 | | | | (11,525 | ) | | (12 | %) | | | 93,916 | |
| | | $ | 2,117,894 | | $ | (119,124 | ) | | (5 | %) | | $ | 2,237,018 | | | $ | (50,997 | ) | | (2 | %) | | $ | 2,288,015 | |
| | | | | | | | | | | | | | | | | | | | | | | | | | |
Local services revenue for 2009 decreased $67.0 million, or 8%, to $781.4 million as compared with 2008, primarily due to the continued loss of access lines that accounted for $41.9 million of the decline and a reduction in all other related services revenue of $25.1 million. Enhanced services revenue in 2009 decreased $14.7 million, as compared with 2008, primarily due to a decline in access lines and a shift in customers purchasing our unlimited voice communications packages with features included in the bundle instead of purchasing individual features.
Local services revenue for 2008 decreased $27.4 million, or 3%, to $848.4 million as compared to 2007. Local services revenue for 2008 increased $20.4 million as a result of the CTE and GVN acquisitions, and legacy Frontier operations decreased $47.8 million, or 6%, as compared to 2007, primarily due to the continued loss of access lines which accounted for $40.4 million of the decline and a reduction in all other related services of $7.4 million. Enhanced services revenue for 2008, excluding the impact of the CTE and GVN acquisitions for 2008 and 2007, decreased $5.6 million, or 3%, as compared to 2007, primarily due to a decline in access lines and a shift in customers purchasing our unlimited voice communications packages instead of individual features. Rate increases that were effective August 2007 resulted in a favorable 2008 impact of $3.0 million.
Data and Internet Services
Data and internet services revenue for 2009 increased $31.3 million, or 5%, to $636.9 million as compared with 2008, primarily due to the overall growth in the number of HSI subscribers and high-capacity internet and ethernet circuits purchased by customers. As of December 31, 2009, the number of the Company’s HSI subscribers had increased by approximately 56,000, or 10%, since December 31, 2008. We have used “aspirational gifts” or promotional credits to drive growth in HSI subscribers. Data and internet services also includes revenue from data transmission services to other carriers and high-volume commercial customers with dedicated high-capacity Internet and ethernet circuits. Revenue from these dedicated high-capacity circuits increased $7.3 million in 2009, as compared with 2008, primarily due to growth in the number of those circuits.
Data and internet services revenue for 2008 increased $61.9 million, or 11%, to $605.6 million as compared to 2007. Data and internet services revenue for 2008 increased $24.6 million as a result of the CTE and GVN acquisitions, and legacy Frontier operations increased $37.3 million, or 8%, as compared to 2007, primarily due to the overall growth in the number of HSI subscribers. As of December 31, 2008, the number of the Company’s HSI subscribers increased by approximately 57,100, or 11%, since December 31, 2007. Revenue from dedicated high-capacity circuits, including the impact of $10.5 million attributable to the CTE and GVN acquisitions, increased $26.9 million in 2008, as compared to 2007, primarily due to growth in the number of those circuits.
In February 2009, the President signed into law an economic stimulus package, ARRA, that includes $7.2 billion in funding, through grants and loans, for new broadband investment and adoption in unserved and underserved communities. We filed applications for the first round of stimulus funding in West Virginia, but were notified in February 2010 that we were not selected. The federal agencies responsible for administering the programs released rules and evaluation criteria for the second round of funding, with applications due by March 15, 2010. The Company will evaluate opportunities but has not made a decision on whether it will apply for any funding in this round.
Access Services
Access services revenue for 2009 decreased $45.1 million, or 11%, to $359.6 million as compared with 2008. Switched access revenue in 2009 of $246.3 million decreased $38.6 million, or 14%, as compared with 2008, primarily due to the impact of a decline in minutes of use related to access line losses and the displacement of minutes of use by wireless, email and other communications services. Access services revenue includes subsidy payments we receive from federal and state agencies, including surcharges billed to customers that are remitted to the FCC. Subsidy revenue, including surcharges billed to customers, for 2009 of $113.3 million decreased $6.5 million, or 5%, as compared with 2008, primarily due to lower receipts under the Federal High Cost Fund (FHCF) program resulting from our reduced cost structure and an increase in the program’s National Average Cost per Local Loop (NACPL) used by the FCC to allocate funds among all recipients.
Access services revenue for 2008 decreased $74.7 million, or 16%, to $404.7 million as compared to 2007. Access services revenue for 2008 increased $2.6 million as a result of the CTE and GVN acquisitions, and legacy Frontier operations decreased $77.3 million, or 19%, as compared to 2007. Switched access revenue for 2008, excluding the unfavorable impact of the CTE and GVN acquisitions, decreased $56.8 million, or 20%, as compared to 2007, primarily due to the settlement of a carrier dispute resulting in a favorable impact on our 2007 revenue of $38.7 million (a one-time event), and the impact of a decline in minutes of use related to access line losses and the displacement of minutes of use by wireless, email and other communications services. Excluding the impact of that one-time favorable settlement in 2007, our switched access revenue for 2008 declined by $18.1 million, or 7% from 2007. Subsidy revenue for 2008, excluding the additional subsidy revenue attributable to the CTE and GVN acquisitions in 2008 and 2007, decreased $20.5 million, or 16%, in 2008 to $104.1 million, as compared to 2007, primarily due to lower receipts under the FHCF program resulting from our reduced cost structure and an increase in the program’s NACPL used by the FCC to allocate funds among all recipients. Subsidy revenue in 2008 was also negatively impacted by $2.5 million in unfavorable adjustments resulting from audits of the FHCF program.
Many factors may lead to further increases in the NACPL, thereby resulting in decreases in our federal subsidy revenue in the future. The FCC and state regulatory agencies are currently considering a number of proposals for changing the manner in which eligibility for federal subsidies is determined as well as the amounts of such subsidies. On May 1, 2008, the FCC issued an order to cap Competitive Eligible Telecommunications Companies (CETC) receipts from the high cost Federal Universal Service Fund. In 2009, the federal court upheld the FCC’s order and the cap remains in place pending any future reform.
The FCC is considering proposals that may significantly change interstate, intrastate and local intercarrier compensation and would revise the Federal Universal Service funding and disbursement mechanisms. When and how these proposed changes will be addressed are unknown and, accordingly, we are unable to predict the impact of future changes on our results of operations. However, future reductions in our subsidy and access revenues will directly affect our profitability and cash flows as those regulatory revenues do not have associated variable expenses.
Certain states have open proceedings to address reform to intrastate access charges and other intercarrier compensation. We cannot predict when or how these matters will be decided or the effect on our subsidy or access revenues. In addition, we have been approached by, and/or are involved in formal state proceedings with, various carriers seeking reductions in intrastate access rates in certain states.
Long Distance Services
Long distance services revenue for 2009 decreased $16.8 million, or 9%, to $165.8 million as compared with 2008, primarily due to a 3% reduction in the overall minutes of use and a reduction in the average revenue per minute of use. We expect our long distance services revenue to continue to trend downward. We have actively marketed a package of unlimited long distance minutes with our digital phone and state unlimited bundled service offerings. These offerings have resulted in an increase in long distance customers, and an increase in the minutes used by these customers. This has lowered our overall average rate per minute billed. While these package offerings have grown our long distance customer base, those customers who still pay on a per minute of use basis have reduced their calling volumes.
Long distance services revenue for 2008 increased $2.0 million, or 1%, to $182.6 million as compared to 2007. Long distance services revenue for 2008 increased $5.8 million as a result of the CTE and GVN acquisitions, and legacy Frontier operations decreased $3.8 million, or 2%, as compared to 2007. During 2008, we actively marketed a package of unlimited long distance minutes with our digital phone and state unlimited bundled service offerings.
Our long distance services revenue may decrease in the future due to further declines in minutes of use or increased penetration of our unlimited calling packages. Competing services such as wireless, VOIP and cable telephony are resulting in a loss of customers, minutes of use and further declines in the rates we charge our customers. We expect these factors will continue to adversely affect our long distance revenue in the future.
Directory services revenue for 2009 decreased $6.3 million, or 6%, to $107.1 million as compared with 2008, primarily due to lower revenues from yellow pages local advertising.
Directory services revenue for 2008 decreased $1.2 million, or 1%, to $113.3 million as compared to 2007. Directory services revenue for 2008 increased $2.8 million as a result of the CTE and GVN acquisitions, and our legacy Frontier operations decreased $4.0 million, or 4%, as compared to 2007 due to lower revenues from yellow pages advertising, mainly in Rochester, New York.
Other
Other revenue for 2009 decreased $15.3 million, or 19%, to $67.1 million as compared with 2008, primarily due to video promotional discounts of approximately $13.6 million.
Other revenue for 2008 decreased $11.5 million, or 12%, to $82.4 million as compared to 2007. Other revenue was impacted by a decrease in equipment sales of $7.0 million, a decrease in service activation fee revenue of $3.3 million and decreased “bill and collect” fee revenue of $3.2 million, partially offset by higher DISH video revenue of $3.3 million.
OPERATING EXPENSES
| NETWORK ACCESS EXPENSES |
| | | | | | | | | | | | | | | | |
| | | | 2009 | | 2008 | | 2007 |
| ($ in thousands) | | | | $ Increase | | % Increase | | | | $ Increase | | % Increase | | |
| | | | Amount | | (Decrease) | | (Decrease) | | Amount | | (Decrease) | | (Decrease) | | Amount |
| Network access | | $ 225,907 | | $ 3,894 | | 2% | | $ 222,013 | | $ (6,229) | | (3%) | | $ 228,242 |
Network access
Network access expenses for 2009 increased $3.9 million, or 2%, to $225.9 million as compared to 2008 due to higher “aspirational gift” costs (e.g., personal computers), higher long distance carriage costs and additional data backbone costs.
Network access expenses for 2008 decreased $6.2 million, or 3%, to $222.0 million as compared to 2007 primarily due to decreasing rates resulting from more efficient circuit routing for our long distance and data products. Network access expenses for 2008 increased $8.9 million as a result of the CTE and GVN acquisitions, and legacy Frontier operations decreased $15.1 million, or 8%, as compared to 2007.
During 2008, we expensed $4.2 million of promotional costs for Master Card gift cards issued to new HSI customers entering into a two-year price protection plan and to existing customers who purchased additional services under a two-year price protection plan and $3.0 million for a flat screen television promotion. In the fourth quarter of 2007, we expensed $11.4 million of promotional costs associated with fourth quarter HSI promotions that subsidized the cost of a new personal computer or a new digital camera provided to customers entering into a multi-year commitment for certain bundled services.
As we continue to offer “aspirational gifts” as part of our promotions, increase our sales of data products such as HSI and increase the penetration of our unlimited long distance calling plans, our network access expense may increase in the future. A decline in expenses associated with access line losses may offset some of the increase.
| OTHER OPERATING EXPENSES | |
| | | | | | | | | | | | | | | | |
| | 2009 | | 2008 | | 2007 | |
| ($ in thousands) | | | $ Increase | | % Increase | | | | | $ Increase | | % Increase | | | |
| | Amount | | (Decrease) | | (Decrease) | | Amount | | | (Decrease) | | (Decrease) | | Amount | |
| Wage and benefit expenses | $ | 360,551 | | $ | (23,173 | ) | | (6%) | | $ | 383,724 | | | $ | (12,210 | ) | | (3%) | | $ | 395,934 | |
| Pension costs | | 34,196 | | | 34,033 | | NM | | | 163 | | | | 14,771 | | | 101% | | | (14,608 | ) |
| Severance and early retirement costs | | 3,788 | | | (3,810 | ) | | (50%) | | | 7,598 | | | | (6,276 | ) | | (45%) | | | 13,874 | |
| Stock based compensation | | 9,368 | | | 1,580 | | | 20% | | | 7,788 | | | | (1,234 | ) | | (14%) | | | 9,022 | |
| All other operating expenses | | 373,194 | | | (38,281 | ) | | (9%) | | | 411,475 | | | | 7,196 | | | 2% | | | 404,279 | |
| | $ | 781,097 | | $ | (29,651 | ) | | (4%) | | $ | 810,748 | | | $ | 2,247 | | | 0% | | $ | 808,501 | |
| | | | | | | | | | | | | | | | | | | | | | | |
Wage and benefit expenses
Wage and benefit expenses for 2009 decreased $23.2 million, or 6%, to $360.6 million as compared to 2008, primarily due to headcount reductions, decreases in compensation, reduced overtime costs and lower benefit expenses.
Wage and benefit expenses for 2008 decreased $12.2 million, or 3%, to $383.7 million as compared to 2007. Wage and benefit expenses related to the CTE and GVN acquisitions decreased $4.2 million and legacy Frontier operations decreased $8.0 million primarily due to headcount reductions and associated decreases in compensation and benefit costs attributable to the integration of the back office, customer service and administrative support functions of the CTE and GVN operations acquired in 2007.
Pension Costs
The decline in the value of our pension plan assets during 2008 resulted in an increase in our pension expense in 2009. Pension costs for 2009 and 2008 were approximately $34.2 million and $0.2 million, respectively. Pension costs for 2009 include pension expense of $41.7 million, less amounts capitalized into the cost of capital expenditures of $7.5 million.
Pension costs for 2008 and 2007 were approximately $0.2 million and $(14.6) million, respectively. The amount for 2007 includes the costs for our CTE plans acquired in 2007 and reflects the positive impact of a pension curtailment gain of $14.4 million, resulting from the freeze placed on certain pension benefits of the former CTE non-union employees. Also, effective December 31, 2007, the CTE Employees’ Pension Plan was merged into the Frontier Pension Plan.
The Company’s pension plan assets have increased from $589.8 million at December 31, 2008 to $608.6 million at December 31, 2009, an increase of $18.8 million, or 3%. This increase is a result of positive investment returns of $90.2 million, or 15%, partially offset by ongoing benefit payments of $71.4 million, or 12%, during 2009.
Based on current assumptions and plan asset values, we estimate that our 2010 pension and other postretirement benefit expenses (which were $48.6 million in 2009) will be approximately $45.0 million to $55.0 million. No contributions were made to Frontier’s pension plan during 2007, 2008 and 2009. We expect that we will make a $10.0 million cash contribution to our pension plan in 2010.
Severance and early retirement costs
Severance and early retirement costs for 2009 decreased $3.8 million, or 50%, to $3.8 million as compared with 2008.
Severance and early retirement costs for 2008 decreased $6.3 million, or 45%, as compared to 2007. Severance and early retirement costs of $7.6 million in 2008 include charges recorded in the first half of 2008 of $3.4 million related to employee early retirements and terminations for 42 Rochester, New York employees. Additional severance costs of $4.0 million were recorded in the fourth quarter of 2008, including $1.7 million of enhanced early retirement pension benefits related to 55 employees.
Severance and early retirement costs of $13.9 million in 2007 include a third quarter charge of approximately $12.1 million related to initiatives to enhance customer service, streamline operations and reduce costs. Approximately 120 positions were eliminated as part of this 2007 initiative, most of which were filled by new employees at our remaining call centers. In addition, approximately 50 field operations employees agreed to participate in an early retirement program and another 30 employees from a variety of functions left the Company in 2007.
Stock based compensation for 2009 increased $1.6 million, or 20%, to $9.4 million as compared with 2008, due to increased costs for restricted stock awards.
Stock based compensation for 2008 decreased $1.2 million, or 14%, as compared to 2007 due to reduced costs associated with stock units and stock options.
All other operating expenses
All other operating expenses for 2009 decreased $38.3 million, or 9%, to $373.2 million as compared to 2008, due to reduced costs for outside contractors and other vendors, as well as lower fuel, travel and USF surcharges, partially offset by slightly higher marketing expenses.
All other operating expenses for 2008 increased $7.2 million, or 2%, to $411.5 million as compared to 2007, primarily due to the additional expenses attributable to the CTE and GVN acquisitions of $10.0 million in 2008 versus 2007, as 2008 includes a full year of expenses for CTE and GVN while 2007 included approximately ten months of costs for CTE and two months of costs for GVN. Our purchase of CTE has enabled us to realize cost savings by leveraging our centralized back office, customer service and administrative support functions over a larger customer base.
| DEPRECIATION AND AMORTIZATION EXPENSE | |
| | | | | | | | | | | | | | | | | | | | | |
| | | 2009 | | 2008 | | | 2007 | |
| ($ in thousands) | | | | | $ Increase | | | % Increase | | | | | $ Increase | | | % Increase | | | | |
| | | Amount | | | (Decrease) | | | (Decrease) | | Amount | | | (Decrease) | | | (Decrease) | | | Amount | |
| Depreciation expense | | $ | 362,228 | | | $ | (17,262 | ) | | | (5%) | | $ | 379,490 | | | $ | 5,055 | | | | 1% | | | $ | 374,435 | |
| Amortization expense | | | 114,163 | | | | (68,148 | ) | | | (37%) | | | 182,311 | | | | 10,890 | | | | 6% | | | | 171,421 | |
| | | $ | 476,391 | | | $ | (85,410 | ) | | | (15%) | | $ | 561,801 | | | $ | 15,945 | | | | 3% | | | $ | 545,856 | |
| | | | | | | | | | | | | | | | | | | | | | | | | | | | |
Depreciation and amortization expense for 2009 decreased $85.4 million, or 15%, to $476.4 million as compared to 2008. The decrease is primarily due to reduced amortization expense, as discussed below, and a declining net asset base, partially offset by changes in the remaining useful lives of certain assets. An independent study updating the estimated remaining useful lives of our plant assets is performed annually. We revised our useful lives based on the study effective October 1, 2009. Our “composite depreciation rate” decreased from 5.6% to 5.2% as a result of the study. We anticipate depreciation expense of approximately $335.0 million to $355.0 million and amortization expense of approximately $56.2 million for 2010 related to our currently owned properties.
Amortization expense for 2009 is comprised of $57.9 million for amortization associated with our legacy Frontier properties, which were fully amortized in June 2009, and $56.3 million for intangible assets (customer base and trade name) that were acquired in the Commonwealth and Global Valley acquisitions. Amortization expense for our legacy Frontier properties was $126.4 million for 2008 and 2007.
Depreciation and amortization expense for 2008 increased $15.9 million, or 3%, to $561.8 million as compared to 2007. Depreciation and amortization expense increased $26.6 million as a result of the CTE and GVN acquisitions, and decreased $10.7 million, or 2%, as compared to 2007, primarily due to a declining net asset base for our legacy Frontier properties, partially offset by changes in the remaining useful lives of certain assets.
| ACQUISITION AND INTEGRATION COSTS |
| | | | | | | | | | | | |
| | 2009 | 2008 | 2007 |
| | | | $ Increase | | % Increase | | | $ Increase | | % Increase | |
| ($ in thousands) | Amount | | (Decrease) | | (Decrease) | Amount | | (Decrease) | | (Decrease) | Amount |
| Acquisition and | | | | | | | | | | | |
| integration costs | $ 28,334 | | $ 28,334 | | 100% | $ - | | $ - | | - | $ - |
Acquisition and integration costs represent expenses incurred to close the transaction (legal, financial advisory, accounting, regulatory and other related costs) and integrate the network and information technology platforms. While the Company continues to evaluate certain other expenses, we currently expect to incur acquisition and integration costs of approximately $100.0 million in 2010. We anticipate closing the Verizon Transaction during the second quarter of 2010.
| INVESTMENT INCOME/OTHER INCOME (LOSS), NET / INTEREST EXPENSE / | |
| INCOME TAX EXPENSE | |
| | | | | | | | | | | | | | | | | | | | | |
| | | 2009 | | 2008 | | | 2007 | |
| ($ in thousands) | | | | | $ Increase | | | % Increase | | | | | $ Increase | | | % Increase | | | | |
| | | Amount | | | (Decrease) | | | (Decrease) | | Amount | | | (Decrease) | | | (Decrease) | | | Amount | |
| Investment income | | $ | 6,285 | | | $ | (9,833 | ) | | | (61%) | | $ | 16,118 | | | $ | (21,523 | ) | | | (57%) | | | $ | 37,641 | |
| Other income (loss), net | | $ | (41,127 | ) | | $ | (35,957 | ) | | NM | | $ | (5,170 | ) | | $ | 12,663 | | | | 71% | | | $ | (17,833 | ) |
| Interest expense | | $ | 378,214 | | | $ | 15,580 | | | | 4% | | $ | 362,634 | | | $ | (18,062 | ) | | | (5%) | | | $ | 380,696 | |
| Income tax expense | | $ | 69,928 | | | $ | (36,568 | ) | | | (34%) | | $ | 106,496 | | | $ | (21,518 | ) | | | (17%) | | | $ | 128,014 | |
| | | | | | | | | | | | | | | | | | | | | | | | | | | | |
Investment Income
Investment income for 2009 declined $9.8 million, or 61%, to $6.3 million as compared with 2008 primarily due to reduced equity earnings of $4.2 million and a decrease of $5.6 million in income from short-term investments of cash and cash equivalents, as higher cash balances were more than offset by significantly lower short-term investment rates.
Investment income for 2008 decreased $21.5 million, or 57%, to $16.1 million as compared to 2007, primarily due to a decrease of $22.1 million in income from short-term investments of cash and cash equivalents due to a lower investable cash balance.
Our average cash balances were $318.0 million, $177.5 million and $594.2 million for 2009, 2008 and 2007, respectively. The 2007 amount reflects the impact of borrowing $550.0 million in December 2006 in anticipation of the Commonwealth acquisition in 2007.
Other Income (Loss), net
Other income (loss), net for 2009 declined $36.0 million to $(41.1) million as compared with 2008, primarily due to premiums paid on the early retirement of debt of $45.9 million in 2009, partially offset by increased litigation settlement proceeds of $3.8 million.
Other income (loss), net for 2008 improved $12.7 million, or 71%, to $(5.2) million as compared to 2007. Other income (loss), net improved in 2008 primarily due to a reduction in the loss on retirement of debt of $11.9 million and the $4.1 million expense of a bridge loan fee recorded during the first quarter of 2007.
Interest Expense
Interest expense for 2009 increased $15.6 million, or 4%, to $378.2 million as compared with 2008, primarily due to higher average debt levels and interest rates in 2009. Our composite average borrowing rate as of December 31, 2009 as compared with the prior year was 31 basis points higher, increasing from 7.54% to 7.85%.
Interest expense for 2008 decreased $18.1 million, or 5%, to $362.6 million as compared to 2007, primarily due to the amortization of the deferred gain associated with the termination of our interest rate swap agreements and retirement of related debt during the first quarter of 2008, along with slightly lower average debt levels and average interest rates. Our composite average borrowing rate as of December 31, 2008, as compared to 2007, was 40 basis points lower, decreasing from 7.94% to 7.54%.
Our average debt outstanding was $4,867.2 million, $4,753.0 million and $4,834.5 million for 2009, 2008 and 2007, respectively. The higher average debt levels for 2009 result primarily from our April 2009 debt offering of $600.0 million, as the net proceeds were not fully utilized to retire existing debt until the fourth quarter of 2009.
Income Tax Expense
Income tax expense for 2009 decreased $36.6 million, or 34%, to $69.9 million as compared with 2008, primarily due to lower taxable income arising from lower operating income, lower investment income and loss on debt repurchases. The second quarter of 2008 included a reduction in income tax expense of $7.5 million that resulted from the expiration of certain statute of limitations on April 15, 2008, as discussed below.
The effective tax rate for 2009 was 36.2% as compared with 36.6% for 2008 and 37.2% for 2007.
Cash paid for taxes was $59.7 million, $78.9 million and $54.4 million in 2009, 2008 and 2007, respectively. Our 2009 cash taxes were lower than 2008 and reflect the benefits from accelerated tax depreciation arising from the ARRA, utilization of AMT credits and higher interest expense arising from our debt offerings not fully offset by debt repurchases. We expect that in 2010 our cash taxes will be less than $10.0 million. We expect that our 2010 cash taxes will be reduced by the receipt of tax refunds arising from the retroactive application of a change in tax accounting for repairs and maintenance costs. In addition, our 2010 cash taxes will be impacted by approximately $60.0 million of tax benefits arising from our integration activities and secondarily, our 2009 debt refinancing activities. Absent the tax benefits generated by these integration and refinancing activities, we estimate that cash taxes would be approximately $60.0 million to $70.0 million in 2010.
Refunds of approximately $56.2 million have been applied for in the Company’s 2008 tax returns. The refunds result from a tax methods change applied for during the third quarter of 2009. Refunds are recorded on our balance sheet at December 31, 2009 in current assets within income taxes. We recorded approximately $8.2 million (net) related to uncertain tax positions under FASB Interpretation No. (FIN) 48 (ASC Topic 740) in 2009.
Income tax expense for 2008 decreased $21.5 million, or 17%, as compared to 2007, primarily due to lower taxable income and the reduction in income tax expense of $7.5 million recorded in the second quarter of 2008 that resulted from the expiration of certain statute of limitations on April 15, 2008, as discussed below.
As a result of the expiration of certain statute of limitations on April 15, 2008, the liabilities on our books as of December 31, 2007 related to uncertain tax positions recorded under FASB Interpretation No. (FIN) 48 (ASC Topic 740) were reduced by $16.2 million in the second quarter of 2008. This reduction lowered income tax expense by $7.5 million, goodwill by $3.0 million and deferred income tax assets by $5.7 million during the second quarter of 2008.
| INCOME ATTRIBUTABLE TO THE NONCONTROLLING INTEREST | |
| IN A PARTNERSHIP | |
| | | | | | | | | | | | | | | | | |
| | | 2009 | | 2008 | | | 2007 | |
| ($ in thousands) | | | | $ Increase | | % Increase | | | | $ Increase | | % Increase | | | | |
| | | Amount | | (Decrease) | | (Decrease) | | Amount | | (Decrease) | | (Decrease) | | | Amount | |
| Income attributable to | | | | | | | | | | | | | | | | |
| the noncontrolling interest | | | | | | | | | | | | | | | | |
| in a partnership | | $ | 2,398 | | $ | 784 | | | 49% | | $ | 1,614 | | $ | (246 | ) | | (13%) | | | $ | 1,860 | |
| | | | | | | | | | | | | | | | | | | | | | | | |
Income attributable to the noncontrolling interest relates to our joint venture, Mohave Cellular LP.
Item 7A. Quantitative and Qualitative Disclosures about Market Risk
Disclosure of primary market risks and how they are managed
We are exposed to market risk in the normal course of our business operations due to ongoing investing and funding activities, including those associated with our pension assets. Market risk refers to the potential change in fair value of a financial instrument as a result of fluctuations in interest rates and equity prices. We do not hold or issue derivative instruments, derivative commodity instruments or other financial instruments for trading purposes. As a result, we do not undertake any specific actions to cover our exposure to market risks, and we are not party to any market risk management agreements other than in the normal course of business. Our primary market risk exposures are interest rate risk and equity price risk as follows:
Interest Rate Exposure
Our exposure to market risk for changes in interest rates relates primarily to the interest-bearing portion of our investment portfolio. Our long-term debt as of December 31, 2009 was approximately 94% fixed rate debt with minimal exposure to interest rate changes. We had no interest rate swap agreements related to our fixed rate debt in effect at December 31, 2009.
Our objectives in managing our interest rate risk are to limit the impact of interest rate changes on earnings and cash flows and to lower our overall borrowing costs. To achieve these objectives, all but $278.1 million of our outstanding borrowings at December 31, 2009 have fixed interest rates. In addition, our undrawn $250.0 million revolving credit facility has interest rates that float with LIBOR, as defined. Consequently, we have limited material future earnings or cash flow exposures from changes in interest rates on our long-term debt. An adverse change in interest rates would increase the amount that we pay on our variable obligations and could result in fluctuations in the fair value of our fixed rate obligations. Based upon our overall interest rate exposure at December 31, 2009, a near-term change in interest rates would not materially affect our consolidated financial position, results of operations or cash flows.
On January 15, 2008, we terminated all of our interest rate swap agreements representing $400.0 million notional amount of indebtedness associated with our Senior Notes due in 2011 and 2013. Cash proceeds on the swap terminations of approximately $15.5 million were received in January 2008. The related gain has been deferred on the consolidated balance sheet, and is being amortized into interest expense over the term of the associated debt.
Sensitivity analysis of interest rate exposure
At December 31, 2009, the fair value of our long-term debt was estimated to be approximately $4.6 billion, based on our overall weighted average borrowing rate of 7.85% and our overall weighted average maturity of approximately 11.5 years. As of December 31, 2009, the weighted average maturity applicable to our obligations had been extended over the weighted average maturity as of December 31, 2008 by approximately 1.5 years due to the debt offerings and refinancing activities that occurred during 2009.
Equity Price Exposure
Our exposure to market risks for changes in security prices as of December 31, 2009 is limited to our pension assets. We have no other security investments of any material amount.
During 2008 and 2009, the diminished availability of credit and liquidity in the United States and throughout the global financial system has resulted in substantial volatility in financial markets and the banking system. These and other economic events have had an adverse impact on investment portfolios.
The decline in the value of our pension plan assets during 2008 resulted in an increase in our pension expense in 2009. The Company’s pension plan assets have increased from $589.8 million at December 31, 2008 to $608.6 million at December 31, 2009, an increase of $18.8 million, or 3%. This increase is a result of positive investment returns of $90.2 million, or 15%, partially offset by ongoing benefit payments of $71.4 million, or 12%, during 2009. We expect that we will make a $10.0 million cash contribution to our pension plan in 2010. Item 8. Financial Statements and Supplementary Data
The following documents are filed as part of this Report:
1. Financial Statements, See Index on page F-1.
2. Supplementary Data, Quarterly Financial Data is included in the Financial Statements (see 1. above).
Item 9. Changes in and Disagreements with Accountants on Accounting and Financial Disclosure
None.
Item 9A. Controls and Procedures
| (i) | Evaluation of Disclosure Controls and Procedures |
We carried out an evaluation, under the supervision and with the participation of our management, including our principal executive officer and principal financial officer, regarding the effectiveness of the design and operation of our disclosure controls and procedures (as defined in Rules 13a–15(e) and 15d–15(e) under the Securities Exchange Act of 1934) . Based upon this evaluation, our principal executive officer and principal financial officer concluded, as of the end of the period covered by this report, December 31, 2009, that our disclosure controls and procedures were effective.
| | (ii) | Internal Control Over Financial Reporting |
| | (a) | Management’s annual report on internal control over financial reporting |
Our management report on internal control over financial reporting appears on page F-2.
(b) Report of registered public accounting firm
The report of KPMG LLP, our independent registered public accounting firm, on internal control over financial reporting appears on page F-4.
(c) Changes in internal control over financial reporting
We reviewed our internal control over financial reporting at December 31, 2009. There has been no change in our internal control over financial reporting identified in an evaluation thereof that occurred during the last fiscal quarter of 2009 that materially affected, or is reasonably likely to materially affect, our internal control over financial reporting.
Item 9B. Other Information
None.
PART III
Item 10. Directors, Executive Officers and Corporate Governance
The information required by this Item is incorporated by reference from our definitive proxy statement for the 2010 Annual Meeting of Stockholders to be filed with the SEC pursuant to Regulation 14A within 120 days after December 31, 2009. See “Executive Officers of the Registrant” in Part I of this Report following Item 4 for information relating to executive officers.
Item 11. Executive Compensation
The information required by this Item is incorporated by reference from our definitive proxy statement for the 2010 Annual Meeting of Stockholders to be filed with the SEC pursuant to Regulation 14A within 120 days after December 31, 2009.
Item 12. Security Ownership of Certain Beneficial Owners and Management and Related Stockholder Matters
The information required by this Item is incorporated by reference from our definitive proxy statement for the 2010 Annual Meeting of Stockholders to be filed with the SEC pursuant to Regulation 14A within 120 days after December 31, 2009.
Item 13. Certain Relationships and Related Transactions, and Director Independence
The information required by this Item is incorporated by reference from our definitive proxy statement for the 2010 Annual Meeting of Stockholders to be filed with the SEC pursuant to Regulation 14A within 120 days after December 31, 2009.
Item 14. Principal Accountant Fees and Services
The information required by this Item is incorporated by reference from our definitive proxy statement for the 2010 Annual Meeting of Stockholders to be filed with the SEC pursuant to Regulation 14A within 120 days after December 31, 2009.
PART IV
Item 15. Exhibits and Financial Statement Schedules
List of Documents Filed as a Part of This Report:
| | (1) | Index to Consolidated Financial Statements: |
Reports of Independent Registered Public Accounting Firm
Consolidated Balance Sheets as of December 31, 2009 and 2008
Consolidated Statements of Operations for the years ended
December 31, 2009, 2008 and 2007
Consolidated Statements of Equity for the years ended
December 31, 2009, 2008 and 2007
Consolidated Statements of Comprehensive Income for the years ended
December 31, 2009, 2008 and 2007
Consolidated Statements of Cash Flows for the years ended
December 31, 2009, 2008 and 2007
Notes to Consolidated Financial Statements
All other schedules have been omitted because the required information is included in the consolidated financial statements or the notes thereto, or is not applicable or not required.
FRONTIER COMMUNICATIONS CORPORATION AND SUBSIDIARIES
(2) Index to Exhibits:
All documents referenced below were filed pursuant to the Securities Exchange Act of 1934 by the Company, file number 001-11001, unless otherwise indicated.
| 2.1 | Agreement and Plan of Merger, dated as of May 13, 2009, by and among Verizon Communications Inc. (“Verizon”), New Communications Holdings Inc. (“Spinco”) and the Company (“Agreement and Plan of Merger”) (filed as Exhibit 2.1 to the Company’s Current Report on Form 8-K filed on May 15, 2009 (the “May 15, 2009 8-K)). * |
| 2.2 | Amendment No. 1 to Agreement and Plan of Merger, dated as of July 24, 2009, by and among Verizon, Spinco and the Company (filed as Exhibit 2.2 to the Company’s Registration Statement on Form S-4 (No. 333-160789) filed on July 24, 2009).* |
| 3.1 | Restated Certificate of Incorporation (filed as Exhibit 3.200.1 to the Company’s Quarterly Report on Form 10-Q for the fiscal quarter ended June 30, 2000). * |
| 3.2 | Certificate of Amendment of Restated Certificate of Incorporation, effective July 31, 2008 (filed as Exhibit 3.1 to the Company’s Quarterly Report on Form 10-Q for the fiscal quarter ended June 30, 2008). * |
| 3.3 | By-laws, as amended February 6, 2009 (filed as Exhibit 99.1 to the Company’s Current Report on Form 8-K filed on February 6, 2009). * |
| 4.1 | Rights Agreement, dated as of March 6, 2002, between the Company and Mellon Investor Services, LLC, as Rights Agent (filed as Exhibit 1 to the Company’s Registration Statement on Form 8-A filed on March 22, 2002).* |
| 4.2 | Amendment No. 1 to Rights Agreement, dated as of January 16, 2003, between the Company and Mellon Investor Services LLC, as Rights Agent (filed as Exhibit 1.1 to the Company's Registration Statement on Form 8-A/A, dated January 16, 2003).* |
| 4.3 | Amendment No. 2 to Rights Agreement, dated as of May 12, 2009, between the Company and Mellon Investor Services LLC, as Rights Agent (filed as Exhibit 4.1 to the May 15, 2009 8-K).* |
| 4.4 | Indenture of Securities, dated as of August 15, 1991, between the Company and JPMorgan Chase Bank, N.A. (as successor to Chemical Bank), as Trustee (the “August 1991 Indenture”) (filed as Exhibit 4.100.1 to the Company’s Quarterly Report on Form 10-Q for the fiscal quarter ended September 30, 1991).* |
| 4.5 | Fourth Supplemental Indenture to the August 1991 Indenture, dated October 1, 1994, between the Company and JPMorgan Chase Bank, N.A. (as successor to Chemical Bank), as Trustee (filed as Exhibit 4.100.7 to the Company’s Current Report on Form 8-K filed on January 3, 1995).* |
| 4.6 | Fifth Supplemental Indenture to the August 1991 Indenture, dated as of June 15, 1995, between the Company and JPMorgan Chase Bank, N.A. (as successor to Chemical Bank), as Trustee (filed as Exhibit 4.100.8 to the Company’s Current Report on Form 8-K filed on March 29, 1996 (the “March 29, 1996 8-K”)).* |
| 4.7 | Sixth Supplemental Indenture to the August 1991 Indenture, dated as of October 15, 1995, between the Company and JPMorgan Chase Bank, N.A. (as successor to Chemical Bank), as Trustee (filed as Exhibit 4.100.9 to the March 29, 1996 8-K).* |
| 4.8 | Seventh Supplemental Indenture to the August 1991 Indenture, dated as of June 1, 1996, between the Company and JPMorgan Chase Bank, N.A. (as successor to Chemical Bank), as Trustee (filed as Exhibit 4.100.11 to the Company’s Annual Report on Form 10-K for the year ended December 31, 1996 (the “1996 10-K”)).* |
| 4.9 | Eighth Supplemental Indenture to the August 1991 Indenture, dated as of December 1, 1996, between the Company and JPMorgan Chase Bank, N.A. (as successor to Chemical Bank), as Trustee (filed as Exhibit 4.100.12 to the 1996 10-K).* |
| 4.10 | Senior Indenture, dated as of May 23, 2001, between the Company and JPMorgan Chase Bank, N.A. (as successor to The Chase Manhattan Bank), as trustee (the “May 2001 Indenture”) (filed as Exhibit 4.1 to the Company’s Current Report on Form 8-K filed on May 24, 2001 (the “May 24, 2001 8-K”)).* |
| 4.11 | First Supplemental Indenture to the May 2001 Indenture, dated as of May 23, 2001, between the Company and JPMorgan Chase Bank, N.A. (filed as Exhibit 4.2 to the May 24, 2001 8-K).* |
| 4.12 | Form of Senior Note due 2011 (filed as Exhibit 4.4 to the May 24, 2001 8-K).* |
| 4.13 | Third Supplemental Indenture to the May 2001 Indenture, dated as of November 12, 2004, between the Company and JPMorgan Chase Bank, N.A. (filed as Exhibit 4.1 to the Company’s Current Report on Form 8-K filed on November 12, 2004 (the “November 12, 2004 8-K”)).* |
| 4.14 | Form of Senior Note due 2013 (filed as Exhibit A to Exhibit 4.1 to the November 12, 2004 8-K).* |
| 4.15 | Indenture, dated as of August 16, 2001, between the Company and JPMorgan Chase Bank, N.A. (as successor to The Chase Manhattan Bank), as Trustee (including the form of note attached thereto) (filed as Exhibit 4.1 of the Company’s Current Report on Form 8-K filed on August 22, 2001).* |
| 4.16 | Indenture, dated as of December 22, 2006, between the Company and The Bank of New York, as Trustee (filed as Exhibit 4.1 to the Company’s Current Report on Form 8-K filed on December 29, 2006).* |
| 4.17 | Indenture dated as of March 23, 2007 by and between the Company and The Bank of New York with respect to the 6.625% Senior Notes due 2015 (including the form of such note attached thereto) (filed as Exhibit 4.1 to the Company’s Current Report on Form 8-K filed on March 27, 2007 (the “March 27, 2007 8-K”)).* |
| 4.18 | Indenture dated as of March 23, 2007 by and between the Company and The Bank of New York with respect to the 7.125% Senior Notes due 2019 (including the form of such note attached thereto) (filed as Exhibit 4.2 to the March 27, 2007 8-K).* |
| 4.19 | Indenture dated as of April 9, 2009, between the Company and The Bank of New York Mellon, as Trustee (the “April 2009 Indenture”) (filed as Exhibit 4.1 to the Company’s Current Report on Form 8-K filed on April 9, 2009 (the “April 9, 2009 8-K”)).* |
| 4.20 | First Supplemental Indenture to the April 2009 Indenture, dated as of April 9, 2009, between the Company and The Bank of New York Mellon, as Trustee (filed as Exhibit 4.2 to the April 9, 2009 8-K).* |
| 4.21 | Second Supplemental Indenture to the April 2009 Indenture, dated as of October 1, 2009, between the Company and The Bank of New York Mellon, as Trustee (filed as Exhibit 4.1 to the Company’s Current Report on Form 8-K filed on October 1, 2009).* |
| 10.1 | Loan Agreement between the Company and Rural Telephone Finance Cooperative for $200,000,000 dated October 24, 2001 (filed as Exhibit 10.39 to the Company’s Quarterly Report on Form 10-Q for the fiscal quarter ended September 30, 2001).* |
| 10.2 | Amendment No. 1, dated as of March 31, 2003, to Loan Agreement between the Company and Rural Telephone Finance Cooperative (filed as Exhibit 10.1 to the Company’s Quarterly Report on Form 10-Q for the fiscal quarter ended March 31, 2003).* |
| 10.3 | Amendment No. 2, dated as of May 6, 2009, to Loan Agreement between the Company and Rural Telephone Finance Cooperative (filed as Exhibit 10.1 to the Company’s Quarterly Report on Form 10-Q for the fiscal quarter ended March 31, 2009).* |
| 10.4 | Credit Agreement, dated as of December 6, 2006, among the Company, as the Borrower, and CoBank, ACB, as the Administrative Agent, the Lead Arranger and a Lender, and the other Lenders referred to therein (filed as Exhibit 10.1 to the Company’s Current Report on Form 8-K filed on December 7, 2006).* |
| 10.5 | Loan Agreement, dated as of March 8, 2007, among the Company, as borrower, the Lenders listed therein, Citicorp North America, Inc., as Administrative Agent, and Citigroup Global Markets Inc., Credit Suisse Securities (USA) LLC and J.P. Morgan Securities Inc. as Joint-Lead Arrangers and Joint Book-Running Managers (filed as Exhibit 10.3 to the March 9, 2007 8-K).* |
| 10.6 | Credit Agreement, dated as of May 18, 2007, among the Company, the lenders party thereto and Deutsche Bank AG New York Branch, as Administrative Agent, and Deutsche Bank Securities Inc., as Sole Lead Arranger and Bookrunner (filed as Exhibit 10.5 to the Company’s Annual Report on Form 10-K for the year ended December 31, 2007 (the “2007 10-K”)). * |
| 10.7 | Credit Agreement, dated as of March 10, 2008, among the Company, as the Borrower, and CoBank, ACB, as the Administrative Agent, the Lead Arranger and a Lender, and the other Lenders referred to therein (filed as Exhibit 10.1 to the Company’s Current Report on Form 8-K filed on March 10, 2008).* |
| 10.8 | Distribution Agreement, dated as of May 13, 2009, by and among Verizon and Spinco (“Distribution Agreement”) (filed as Exhibit 10.1 to the May 15, 2009 8-K).* |
| 10.9 | Amendment No. 1 to Distribution Agreement, dated as of July 24, 2009, by and between Verizon and Spinco (filed as Exhibit 10.2 to the Company’s Registration Statement on Form S-4 (No. 333-160789) filed on July 24, 2009). * |
| 10.10 | Employee Matters Agreement, dated as of May 13, 2009, by and among Verizon, Spinco and the Company (filed as Exhibit 10.2 to the May 15, 2009 8-K).* |
| 10.11 | Tax Sharing Agreement, dated as of May 13, 2009, by and among Verizon, Spinco and the Company (filed as Exhibit 10.3 to the May 15, 2009 8-K).* |
| 10.12 | Non-Employee Directors' Deferred Fee Equity Plan, as amended and restated December 29, 2008 (filed as Exhibit 10.7 to the Company’s Annual Report on Form 10-K for the year ended December 31, 2008 (the “2008 10-K”).* |
| 10.13 | Non-Employee Directors’ Equity Incentive Plan, as amended and restated December 29, 2008 (filed as Exhibit 10.8 to the 2008 10-K).* |
| 10.14 | Separation Agreement between the Company and Leonard Tow effective July 10, 2004 (filed as Exhibit 10.2.4 of the Company’s Quarterly Report on Form 10-Q for the fiscal quarter ended June 30, 2004).* |
| 10.15 | Citizens Executive Deferred Savings Plan dated January 1, 1996 (filed as Exhibit 10.19 to the Company’s Annual Report on Form 10-K for the year ended December 31, 1999 (the “1999 10-K”)).* |
| 10.16 | 1996 Equity Incentive Plan, as amended and restated December 29, 2008 (filed as Exhibit 10.11 to the 2008 10-K).* |
| 10.17 | Frontier Bonus Plan (formerly Citizens Incentive Plan) (filed as Appendix A to the Company's Proxy Statement dated April 10, 2007).* |
| 10.18 | Amended and Restated 2000 Equity Incentive Plan, as amended and restated December 29, 2008 (filed as Exhibit 10.13 to the 2008 10-K).* |
| 10.19 | 2009 Equity Incentive Plan (filed as Appendix A to the Company’s Proxy Statement dated April 6, 2009).* |
| 10.20 | Amended Employment Agreement, dated as of December 29, 2008, between the Company and Mary Agnes Wilderotter (filed as Exhibit 10.14 to the 2008 10-K).* |
| 10.21 | Amended Employment Agreement, dated as of December 24, 2008, between the Company and Robert Larson (filed as Exhibit 10.15 to the 2008 10-K). * |
| 10.22 | Employment Letter, dated May 27, 2009, between the Company and Robert Larson. |
| 10.23 | Offer of Employment Letter, dated December 31, 2004, between the Company and Peter B. Hayes (“Hayes Offer Letter”) (filed as Exhibit 10.23 to the Company’s Annual Report on Form 10-K for the year ended December 31, 2004).* |
| 10.24 | Amendment to Hayes Offer Letter, dated December 24, 2008 (filed as Exhibit 10.17 to the 2008 10-K).* |
| 10.25 | Offer of Employment Letter, dated March 7, 2006, between the Company and Donald R. Shassian (“Shassian Offer Letter”) (filed as Exhibit 10.1 to the Company’s Quarterly Report on Form 10-Q for the fiscal quarter ended March 31, 2006).* |
| 10.26 | Amendment to Shassian Offer Letter, dated December 30, 2008 (filed as Exhibit 10.19 to the 2008 10-K).* |
| 10.27 | Form of Arrangement with Daniel J. McCarthy and Melinda M. White with respect to vesting of restricted stock upon a change-in-control (filed as Exhibit 10.22 to the 2007 10-K). * |
| 10.28 | Offer of Employment Letter, dated January 13, 2006, between the Company and Cecilia K. McKenney (“McKenney Offer Letter”) (filed as Exhibit 10.1 to the Company’s Quarterly Report on Form 10-Q for the fiscal quarter ended March 31, 2008). * |
| 10.29 | Amendment to McKenney Offer Letter, dated December 24, 2008 (filed as Exhibit 10.23 to the 2008 10-K).* |
| 10.30 | Offer of Employment Letter, dated July 8, 2005, between the Company and Hilary E. Glassman (the “Glassman Offer Letter”) (filed as Exhibit 10.24 to the 2008 10-K).* |
| 10.31 | Amendment to Glassman Offer Letter, dated December 29, 2008 (filed as Exhibit 10.25 to the 2008 10-K).* |
| 10.32 | Form of Restricted Stock Agreement for CEO. |
| 10.33 | Form of Restricted Stock Agreement for named executive officers other than CEO. |
| 10.34 | Summary of Non-Employee Directors’ Compensation Arrangements Outside of Formal Plans (filed as Exhibit 10.28 to the 2008 10-K).* |
| 10.35 | Membership Interest Purchase Agreement between the Company and Integra Telecom Holdings, Inc. dated February 6, 2006 (filed as Exhibit 10.1 to the Company’s Current Report on Form 8-K filed on February 9, 2006).* |
| 10.36 | Stock Purchase Agreement, dated as of July 3, 2007, between the Company and Country Road Communications LLC (filed as Exhibit 2.1 to the Company’s Current Report on Form 8-K filed on July 9, 2007).* |
| 12.1 | Computation of ratio of earnings to fixed charges (this item is included herein for the sole purpose of incorporation by reference). |
| 21.1 | Subsidiaries of the Registrant. |
| 31.1 | Certification of Principal Executive Officer pursuant to Rule 13a-14(a) under the Securities Exchange Act of 1934 (the “1934 Act”). |
| 31.2 | Certification of Principal Financial Officer pursuant to Rule 13a-14(a) under the 1934 Act. |
| 32.1 | Certification of Chief Executive Officer pursuant to 18 U.S.C. Section 1350, as adopted pursuant to Section 906 of the Sarbanes-Oxley Act of 2002 (“SOXA”). |
| 32.2 | Certification of Chief Financial Officer pursuant to 18 U.S.C. Section 1350, as adopted pursuant to Section 906 of SOXA. |
Exhibits 10.12 through 10.34 are management contracts or compensatory plans or arrangements.
* Incorporated by reference.
FRONTIER COMMUNICATIONS CORPORATION AND SUBSIDIARIES
SIGNATURES
Pursuant to the requirements of Section 13 or 15(d) of the Securities Exchange Act of 1934, the Registrant has duly caused this report to be signed on its behalf by the undersigned, thereunto duly authorized.
| | FRONTIER COMMUNICATIONS CORPORATION |
| | (Registrant) |
| | |
| | By: /s/ Mary Agnes Wilderotter |
| | Mary Agnes Wilderotter |
| | Chairman of the Board, President and Chief Executive Officer |
| | |
| | February 26, 2010 |
FRONTIER COMMUNICATIONS CORPORATION AND SUBSIDIARIES
Pursuant to the requirements of the Securities Exchange Act of 1934, this report has been signed below by the following persons on behalf of the registrant and in the capacities indicated on the 26th day of February 2010.
| Signature | | Title |
| | | |
| | | |
| /s/ Leroy T. Barnes, Jr. | | Director |
| (Leroy T. Barnes, Jr.) | | |
| | | |
| /s/ Peter C. B. Bynoe | | Director |
| (Peter C. B. Bynoe) | | |
| | | |
| /s/ Jeri B. Finard | | Director |
| (Jeri B. Finard) | | |
| | | |
| /s/ Lawton W. Fitt | | Director |
| (Lawton W. Fitt) | | |
| | | |
| /s/ William M. Kraus | | Director |
| (William M. Kraus) | | |
| | | |
| /s/ Robert J. Larson | | Senior Vice President and Chief Accounting Officer |
| (Robert J. Larson) | | |
| | | |
| /s/ Howard L. Schrott | | Director |
| (Howard L. Schrott) | | |
| | | |
| /s/ Larraine D. Segil | | Director |
| (Larraine D. Segil) | | |
| | | |
| /s/ Donald R. Shassian | | Executive Vice President and Chief Financial Officer |
| (Donald R. Shassian) | | |
| | | |
| /s/ David H. Ward | | Director |
| (David H. Ward) | | |
| | | |
| /s/ Myron A. Wick III | | Director |
| (Myron A. Wick III) | | |
| | | |
| /s/ Mary Agnes Wilderotter | | Chairman of the Board, President and Chief Executive Officer |
| (Mary Agnes Wilderotter) | | |
| | | |
| | | |
| | | |
FRONTIER COMMUNICATIONS CORPORATION AND SUBSIDIARIES
Index to Consolidated Financial Statements
| Item | Page |
| | |
| Management’s Report on Internal Control Over Financial Reporting | F-2 |
| | |
| Reports of Independent Registered Public Accounting Firm | F-3 and F-4 |
| | |
| Consolidated Balance Sheets as of December 31, 2009 and 2008 | F-5 |
| | |
Consolidated Statements of Operations for the years ended December 31, 2009, 2008 and 2007 | F-6 |
| | |
Consolidated Statements of Equity for the years ended December 31, 2009, 2008 and 2007 | F-7 |
| | |
Consolidated Statements of Comprehensive Income for the years ended December 31, 2009, 2008 and 2007 | F-8 |
| | |
Consolidated Statements of Cash Flows for the years ended December 31, 2009, 2008 and 2007 | F-9 |
| | |
| Notes to Consolidated Financial Statements | F-10 |
| | |
Management’s Report On Internal Control Over Financial Reporting
The Board of Directors and Shareholders
Frontier Communications Corporation:
The management of Frontier Communications Corporation and subsidiaries is responsible for establishing and maintaining adequate internal control over financial reporting, as such term is defined in Exchange Act Rules 13a-15(f) and 15d-15(f).
Under the supervision and with the participation of our management, we conducted an evaluation of the effectiveness of our internal control over financial reporting based on the framework in Internal Control-Integrated Framework issued by the Committee of Sponsoring Organizations of the Treadway Commission. Based on our evaluation our management concluded that our internal control over financial reporting was effective as of December 31, 2009 and for the period then ended.
Our independent registered public accounting firm, KPMG LLP, has audited the consolidated financial statements included in this report and, as part of their audit, has issued their report, included herein, on the effectiveness of our internal control over financial reporting.
Stamford, Connecticut
February 26, 2010
Report Of Independent Registered Public Accounting Firm
The Board of Directors and Shareholders
Frontier Communications Corporation:
We have audited the accompanying consolidated balance sheets of Frontier Communications Corporation and subsidiaries as of December 31, 2009 and 2008, and the related consolidated statements of operations, equity, comprehensive income and cash flows for each of the years in the three-year period ended December 31, 2009. These consolidated financial statements are the responsibility of the Company’s management. Our responsibility is to express an opinion on these consolidated financial statements based on our audits.
We conducted our audits in accordance with the standards of the Public Company Accounting Oversight Board (United States). Those standards require that we plan and perform the audit to obtain reasonable assurance about whether the financial statements are free of material misstatement. An audit includes examining, on a test basis, evidence supporting the amounts and disclosures in the financial statements. An audit also includes assessing the accounting principles used and significant estimates made by management, as well as evaluating the overall financial statement presentation. We believe that our audits provide a reasonable basis for our opinion.
In our opinion, the consolidated financial statements referred to above present fairly, in all material respects, the financial position of Frontier Communications Corporation and subsidiaries as of December 31, 2009 and 2008 and the results of their operations and their cash flows for each of the years in the three-year period ended December 31, 2009, in conformity with U.S. generally accepted accounting principles.
We also have audited, in accordance with the standards of the Public Company Accounting Oversight Board (United States), Frontier Communications Corporation’s internal control over financial reporting as of December 31, 2009, based on criteria established in Internal Control—Integrated Framework issued by the Committee of Sponsoring Organizations of the Treadway Commission (COSO), and our report dated February 26, 2010 expressed an unqualified opinion on the effectiveness of the Company’s internal control over financial reporting.
| | /s/ KPMG LLP |
| | |
| Stamford, Connecticut | |
| February 26, 2010 | |
Report Of Independent Registered Public Accounting Firm
The Board of Directors and Shareholders
Frontier Communications Corporation:
We have audited Frontier Communications Corporation’s internal control over financial reporting as of December 31, 2009, based on criteria established in Internal Control—Integrated Framework issued by the Committee of Sponsoring Organizations of the Treadway Commission (COSO). Frontier Communications Corporation’s management is responsible for maintaining effective internal control over financial reporting and for its assessment of the effectiveness of internal control over financial reporting, included in the accompanying Management’s Report on Internal Control Over Financial Reporting. Our responsibility is to express an opinion on the Company’s internal control over financial reporting based on our audit.
We conducted our audit in accordance with the standards of the Public Company Accounting Oversight Board (United States). Those standards require that we plan and perform the audit to obtain reasonable assurance about whether effective internal control over financial reporting was maintained in all material respects. Our audit included obtaining an understanding of internal control over financial reporting, assessing the risk that a material weakness exists, and testing and evaluating the design and operating effectiveness of internal control based on the assessed risk. Our audit also included performing such other procedures as we considered necessary in the circumstances. We believe that our audit provides a reasonable basis for our opinion.
A company’s internal control over financial reporting is a process designed to provide reasonable assurance regarding the reliability of financial reporting and the preparation of financial statements for external purposes in accordance with generally accepted accounting principles. A company’s internal control over financial reporting includes those policies and procedures that (1) pertain to the maintenance of records that, in reasonable detail, accurately and fairly reflect the transactions and dispositions of the assets of the company; (2) provide reasonable assurance that transactions are recorded as necessary to permit preparation of financial statements in accordance with generally accepted accounting principles, and that receipts and expenditures of the company are being made only in accordance with authorizations of management and directors of the company; and (3) provide reasonable assurance regarding prevention or timely detection of unauthorized acquisition, use, or disposition of the company’s assets that could have a material effect on the financial statements.
Because of its inherent limitations, internal control over financial reporting may not prevent or detect misstatements. Also, projections of any evaluation of effectiveness to future periods are subject to the risk that controls may become inadequate because of changes in conditions, or that the degree of compliance with the policies or procedures may deteriorate.
In our opinion, Frontier Communications Corporation maintained, in all material respects, effective internal control over financial reporting as of December 31, 2009, based on criteria established in Internal Control—Integrated Framework issued by the Committee of Sponsoring Organizations of the Treadway Commission (COSO).
We also have audited, in accordance with the standards of the Public Company Accounting Oversight Board (United States), the consolidated balance sheets of Frontier Communications Corporation and subsidiaries as of December 31, 2009 and 2008, and the related consolidated statements of operations, equity, comprehensive income and cash flows for each of the years in the three-year period ended December 31, 2009, and our report dated February 26, 2010 expressed an unqualified opinion on those consolidated financial statements.
| | /s/ KPMG LLP |
| | |
| Stamford, Connecticut | |
| February 26, 2010 | |
FRONTIER COMMUNICATIONS CORPORATION AND SUBSIDIARIES
CONSOLIDATED BALANCE SHEETS
AS OF DECEMBER 31, 2009 AND 2008
($ in thousands)
| | | | | | | |
| | | 2009 | | | 2008 | |
| ASSETS | | | | | | |
| Current assets: | | | | | | |
| Cash and cash equivalents | | $ | 358,693 | | | $ | 163,627 | |
| Accounts receivable, less allowances of $30,171 and $40,125, respectively | | | 190,745 | | | | 222,247 | |
| Prepaid expenses | | | 28,081 | | | | 33,265 | |
| Income taxes | | | 102,561 | | | | 48,820 | |
| Total current assets | | | 680,080 | | | | 467,959 | |
| | | | | | | | | |
| Property, plant and equipment, net | | | 3,133,521 | | | | 3,239,973 | |
| Goodwill, net | | | 2,642,323 | | | | 2,642,323 | |
| Other intangibles, net | | | 247,527 | | | | 359,674 | |
| Other assets | | | 174,804 | | | | 178,747 | |
| Total assets | | $ | 6,878,255 | | | $ | 6,888,676 | |
| | | | | | | | | |
| LIABILITIES AND EQUITY | | | | | | | | |
| Current liabilities: | | | | | | | | |
| Long-term debt due within one year | | $ | 7,236 | | | $ | 3,857 | |
| Accounts payable | | | 139,556 | | | | 141,940 | |
| Advanced billings | | | 49,589 | | | | 51,225 | |
| Other taxes accrued | | | 28,750 | | | | 25,585 | |
| Interest accrued | | | 107,119 | | | | 102,370 | |
| Other current liabilities | | | 60,427 | | | | 57,798 | |
| Total current liabilities | | | 392,677 | | | | 382,775 | |
| | | | | | | | | |
| Deferred income taxes | | | 722,192 | | | | 670,489 | |
| Other liabilities | | | 630,187 | | | | 584,121 | |
| Long-term debt | | | 4,794,129 | | | | 4,721,685 | |
| | | | | | | | | |
| Equity: | | | | | | | | |
| Shareholders' equity of Frontier: | | | | | | | | |
| Common stock, $0.25 par value (600,000,000 authorized shares; 312,328,000 and 311,314,000 | | | | | |
| outstanding, respectively, and 349,456,000 issued at December 31, 2009 and 2008) | | | 87,364 | | | | 87,364 | |
| Additional paid-in capital | | | 956,401 | | | | 1,117,936 | |
| Retained earnings | | | 2,756 | | | | 38,163 | |
| Accumulated other comprehensive loss, net of tax | | | (245,519 | ) | | | (237,152 | ) |
| Treasury stock | | | (473,391 | ) | | | (487,266 | ) |
| Total shareholders' equity of Frontier | | | 327,611 | | | | 519,045 | |
| Noncontrolling interest in a partnership | | | 11,459 | | | | 10,561 | |
| Total equity | | | 339,070 | | | | 529,606 | |
| Total liabilities and equity | | $ | 6,878,255 | | | $ | 6,888,676 | |
| | | | | | | | | |
The accompanying Notes are an integral part of these Consolidated Financial Statements
FRONTIER COMMUNICATIONS CORPORATION AND SUBSIDIARIES
CONSOLIDATED STATEMENTS OF OPERATIONS
FOR THE YEARS ENDED DECEMBER 31, 2009, 2008 AND 2007
($ in thousands, except for per-share amounts)
| | | 2009 | | | 2008 | | | 2007 | |
| | | | | | | | | | |
| Revenue | | $ | 2,117,894 | | | $ | 2,237,018 | | | $ | 2,288,015 | |
| | | | | | | | | | | | | |
| Operating expenses: | | | | | | | | | | | | |
| Network access expenses | | | 225,907 | | | | 222,013 | | | | 228,242 | |
| Other operating expenses | | | 781,097 | | | | 810,748 | | | | 808,501 | |
| Depreciation and amortization | | | 476,391 | | | | 561,801 | | | | 545,856 | |
| Acquisition and integration costs | | | 28,334 | | | | - | | | | - | |
| Total operating expenses | | | 1,511,729 | | | | 1,594,562 | | | | 1,582,599 | |
| | | | | | | | | | | | | |
| Operating income | | | 606,165 | | | | 642,456 | | | | 705,416 | |
| | | | | | | | | | | | | |
| Investment income | | | 6,285 | | | | 16,118 | | | | 37,641 | |
| Other income (loss), net | | | (41,127 | ) | | | (5,170 | ) | | | (17,833 | ) |
| Interest expense | | | 378,214 | | | | 362,634 | | | | 380,696 | |
| Income before income taxes | | | 193,109 | | | | 290,770 | | | | 344,528 | |
| | | | | | | | | | | | | |
| Income tax expense | | | 69,928 | | | | 106,496 | | | | 128,014 | |
| | | | | | | | | | | | | |
| Net income | | | 123,181 | | | | 184,274 | | | | 216,514 | |
| Less: Income attributable to the noncontrolling | | | | | | | | | | | | |
| interest in a partnership | | | 2,398 | | | | 1,614 | | | | 1,860 | |
| Net income attributable to common shareholders | | | | | | | | | | | | |
| of Frontier | | $ | 120,783 | | | $ | 182,660 | | | $ | 214,654 | |
| | | | | | | | | | | | | |
| Basic and diluted income per common share | | | | | | | | | | | | |
| attributable to common shareholders of Frontier | | $ | 0.38 | | | $ | 0.57 | | | $ | 0.64 | |
| | | | | | | | | | | | | |
The accompanying Notes are an integral part of these Consolidated Financial Statements.
FRONTIER COMMUNICATIONS CORPORATION AND SUBSIDIARIES
CONSOLIDATED STATEMENTS OF EQUITY
FOR THE YEARS ENDED DECEMBER 31, 2009, 2008 AND 2007
($ and shares in thousands, except for per-share amounts)
| | Frontier Shareholders | | | | | | | |
| | | | | | | | | | | | | | Accumulated | | | | | | | | | | | | |
| | | | | | | | Additional | | | | | | Other | | | | | | | | | | | | |
| | Common Stock | | | Paid-In | | | Retained | | | Comprehensive | | Treasury Stock | | | Noncontrolling | | | Total | |
| | Shares | | | Amount | | | Capital | | | Earnings | | | Loss | | Shares | | | Amount | | | Interest | | | Equity | |
| Balance December 31, 2006 | | 343,956 | | | $ | 85,989 | | | $ | 1,207,399 | | | $ | 134,705 | | | $ | (81,899 | ) | | (21,691 | ) | | $ | (288,162 | ) | | $ | 10,587 | | | $ | 1,068,619 | |
| Stock plans | | - | | | | - | | | | (6,237 | ) | | | 667 | | | | - | | | 1,824 | | | | 25,399 | | | | - | | | | 19,829 | |
| Acquisition of Commonwealth | | 5,500 | | | | 1,375 | | | | 77,939 | | | | - | | | | - | | | 12,640 | | | | 168,121 | | | | - | | | | 247,435 | |
| Conversion of EPPICS | | - | | | | - | | | | (549 | ) | | | - | | | | - | | | 291 | | | | 3,888 | | | | - | | | | 3,339 | |
| Conversion of Commonwealth notes | | - | | | | - | | | | 1,956 | | | | - | | | | - | | | 2,508 | | | | 34,775 | | | | - | | | | 36,731 | |
| Dividends on common stock of | | | | | | | | | | | | | | | | | | | | | | | | | | | | | | | | | | |
| $1.00 per share | | - | | | | - | | | | - | | | | (336,025 | ) | | | - | | | - | | | | - | | | | - | | | | (336,025 | ) |
| Shares repurchased | | - | | | | - | | | | - | | | | - | | | | - | | | (17,279 | ) | | | (250,000 | ) | | | - | | | | (250,000 | ) |
| Net income | | - | | | | - | | | | - | | | | 214,654 | | | | - | | | - | | | | - | | | | 1,860 | | | | 216,514 | |
| Other comprehensive income, net of tax | | | | | | | | | | | | | | | | | | | | | | | | | | | | | | | | | | |
| and reclassification adjustments | | - | | | | - | | | | - | | | | - | | | | 3,904 | | | - | | | | - | | | | - | | | | 3,904 | |
| Balance December 31, 2007 | | 349,456 | | | | 87,364 | | | | 1,280,508 | | | | 14,001 | | | | (77,995 | ) | | (21,707 | ) | | | (305,979 | ) | | | 12,447 | | | | 1,010,346 | |
| Stock plans | | - | | | | - | | | | (1,759 | ) | | | - | | | | - | | | 1,096 | | | | 15,544 | | | | - | | | | 13,785 | |
| Acquisition of Commonwealth | | - | | | | - | | | | 1 | | | | - | | | | - | | | 3 | | | | 38 | | | | - | | | | 39 | |
| Conversion of EPPICS | | - | | | | - | | | | (74 | ) | | | - | | | | - | | | 51 | | | | 664 | | | | - | | | | 590 | |
| Conversion of Commonwealth notes | | - | | | | - | | | | (801 | ) | | | - | | | | - | | | 193 | | | | 2,467 | | | | - | | | | 1,666 | |
| Dividends on common stock of | | | | | | | | | | | | | | | | | | | | | | | | | | | | | | | | | | |
| $1.00 per share | | - | | | | - | | | | (159,939 | ) | | | (158,498 | ) | | | - | | | - | | | | - | | | | - | | | | (318,437 | ) |
| Shares repurchased | | - | | | | - | | | | - | | | | - | | | | - | | | (17,778 | ) | | | (200,000 | ) | | | - | | | | (200,000 | ) |
| Net income | | - | | | | - | | | | - | | | | 182,660 | | | | - | | | - | | | | - | | | | 1,614 | | | | 184,274 | |
| Other comprehensive loss, net of tax | | | | | | | | | | | | | | | | | | | | | | | | | | | | | | | | | | |
| and reclassification adjustments | | - | | | | - | | | | - | | | | - | | | | (159,157 | ) | | - | | | | - | | | | - | | | | (159,157 | ) |
| Distributions | | - | | | | - | | | | - | | | | - | | | | - | | | - | | | | - | | | | (3,500 | ) | | | (3,500 | ) |
| Balance December 31, 2008 | | 349,456 | | | | 87,364 | | | | 1,117,936 | | | | 38,163 | | | | (237,152 | ) | | (38,142 | ) | | | (487,266 | ) | | | 10,561 | | | | 529,606 | |
| Stock plans | | - | | | | - | | | | (5,359 | ) | | | - | | | | - | | | 1,014 | | | | 13,875 | | | | - | | | | 8,516 | |
| Dividends on common stock of | | | | | | | | | | | | | | | | | | | | | | | | | | | | | | | | | | |
| $1.00 per share | | - | | | | - | | | | (156,176 | ) | | | (156,190 | ) | | | - | | | - | | | | - | | | | - | | | | (312,366 | ) |
| Net income | | - | | | | - | | | | - | | | | 120,783 | | | | - | | | - | | | | - | | | | 2,398 | | | | 123,181 | |
| Other comprehensive income, net of tax | | | | | | | | | | | | | | | | | | | | | | | | | | | | | | | | | | |
| and reclassification adjustments | | - | | | | - | | | | - | | | | - | | | | (8,367 | ) | | - | | | | - | | | | - | | | | (8,367 | ) |
| Distributions | | - | | | | - | | | | - | | | | - | | | | - | | | - | | | | - | | | | (1,500 | ) | | | (1,500 | ) |
| Balance December 31, 2009 | | 349,456 | | | $ | 87,364 | | | $ | 956,401 | | | $ | 2,756 | | | $ | (245,519 | ) | | (37,128 | ) | | $ | (473,391 | ) | | $ | 11,459 | | | $ | 339,070 | |
| | | | | | | | | | | | | | | | | | | | | | | | | | | | | | | | | | | |
The accompanying Notes are an integral part of these Consolidated Financial Statements.FRONTIER COMMUNICATIONS CORPORATION AND SUBSIDIARIES
CONSOLIDATED STATEMENTS OF COMPREHENSIVE INCOME
FOR THE YEARS ENDED DECEMBER 31, 2009, 2008 AND 2007
($ in thousands)
| | | 2009 | | | 2008 | | | 2007 | |
| | | | | | | | | | |
| Net income | | $ | 123,181 | | | $ | 184,274 | | | $ | 216,514 | |
| Other comprehensive income (loss), net of tax | | | | | | | | | | | | |
| and reclassification adjustments (see Note 16) | | | (8,367 | ) | | | (159,157 | ) | | | 3,904 | |
| Comprehensive income | | | 114,814 | | | | 25,117 | | | | 220,418 | |
| Less: Comprehensive income attributable to | | | | | | | | | | | | |
| the noncontrolling interest in a partnership | | | 2,398 | | | | 1,614 | | | | 1,860 | |
| Comprehensive income attributable to the common | | | | | | | | | | | | |
| shareholders of Frontier | | $ | 112,416 | | | $ | 23,503 | | | $ | 218,558 | |
| | | | | | | | | | | | | |
The accompanying Notes are an integral part of these Consolidated Financial Statements.
FRONTIER COMMUNICATIONS CORPORATION AND SUBSIDIARIES
CONSOLIDATED STATEMENTS OF CASH FLOWS
FOR THE YEARS ENDED DECEMBER 31, 2009, 2008 AND 2007
($ in thousands)
| | | 2009 | | | 2008 | | | 2007 | |
| Cash flows provided by (used in) operating activities: | | | | | | | | | |
| Net income | | $ | 123,181 | | | $ | 184,274 | | | $ | 216,514 | |
| | | | | | | | | | | | | |
| Adjustments to reconcile net income to net cash provided by | | | | | | | | | | | | |
| operating activities: | | | | | | | | | | | | |
| Depreciation and amortization expense | | | 476,391 | | | | 561,801 | | | | 545,856 | |
| Stock based compensation expense | | | 9,368 | | | | 7,788 | | | | 9,022 | |
| Pension expense | | | 34,196 | | | | 163 | | | | (14,608 | ) |
| Loss on extinguishment of debt, net | | | 45,939 | | | | 6,290 | | | | 20,186 | |
| Other non-cash adjustments | | | 2,080 | | | | (8,658 | ) | | | (9,458 | ) |
| Deferred income taxes | | | 61,217 | | | | 33,967 | | | | 81,011 | |
| Legal settlement | | | - | | | | - | | | | (7,905 | ) |
| Change in accounts receivable | | | 21,906 | | | | 9,746 | | | | (4,714 | ) |
| Change in accounts payable and other liabilities | | | 13,297 | | | | (52,210 | ) | | | (21,649 | ) |
| Change in prepaid expenses and income taxes | | | (44,855 | ) | | | (3,895 | ) | | | 7,428 | |
| Net cash provided by operating activities | | | 742,720 | | | | 739,266 | | | | 821,683 | |
| | | | | | | | | | | | | |
| Cash flows provided from (used by) investing activities: | | | | | | | | | | | | |
| Capital expenditures - Business operations | | | (230,966 | ) | | | (288,264 | ) | | | (306,203 | ) |
| Capital expenditures - Integration activities | | | (24,999 | ) | | | - | | | | (9,590 | ) |
| Cash paid for acquisitions (net of cash acquired) | | | - | | | | - | | | | (725,548 | ) |
| Other assets purchased and distributions received, net | | | 673 | | | | 5,489 | | | | 6,629 | |
| Net cash used by investing activities | | | (255,292 | ) | | | (282,775 | ) | | | (1,034,712 | ) |
| | | | | | | | | | | | | |
| Cash flows provided from (used by) financing activities: | | | | | | | | | | | | |
| Long-term debt borrowings | | | 1,117,476 | | | | 135,000 | | | | 950,000 | |
| Financing costs paid | | | (2,204 | ) | | | (857 | ) | | | (12,196 | ) |
| Long-term debt payments | | | (1,027,408 | ) | | | (142,480 | ) | | | (946,070 | ) |
| Premium paid to retire debt | | | (66,868 | ) | | | (6,290 | ) | | | (20,186 | ) |
| Settlement of interest rate swaps | | | - | | | | 15,521 | | | | - | |
| Issuance of common stock | | | 751 | | | | 1,398 | | | | 13,808 | |
| Common stock repurchased | | | - | | | | (200,000 | ) | | | (250,000 | ) |
| Dividends paid | | | (312,366 | ) | | | (318,437 | ) | | | (336,025 | ) |
| Repayment of customer advances for construction | | | | | | | | | | | | |
| and distributions to noncontrolling interests | | | (1,743 | ) | | | (3,185 | ) | | | (942 | ) |
| Net cash used by financing activities | | | (292,362 | ) | | | (519,330 | ) | | | (601,611 | ) |
| | | | | | | | | | | | | |
| Increase (decrease) in cash and cash equivalents | | | 195,066 | | | | (62,839 | ) | | | (814,640 | ) |
| Cash and cash equivalents at January 1, | | | 163,627 | | | | 226,466 | | | | 1,041,106 | |
| | | | | | | | | | | | | |
| Cash and cash equivalents at December 31, | | $ | 358,693 | | | $ | 163,627 | | | $ | 226,466 | |
| | | | | | | | | | | | | |
| Cash paid during the period for: | | | | | | | | | | | | |
| Interest | | $ | 364,167 | | | $ | 365,858 | | | $ | 364,381 | |
| Income taxes | | $ | 59,735 | | | $ | 78,878 | | | $ | 54,407 | |
| | | | | | | | | | | | | |
| Non-cash investing and financing activities: | | | | | | | | | | | | |
| Change in fair value of interest rate swaps | | $ | - | | | $ | 7,909 | | | $ | 18,198 | |
| Conversion of EPPICS | | $ | - | | | $ | 590 | | | $ | 3,339 | |
| Conversion of Commonwealth notes | | $ | - | | | $ | 1,666 | | | $ | 36,731 | |
| Shares issued for Commonwealth acquisition | | $ | - | | | $ | 39 | | | $ | 247,435 | |
| Acquired debt | | $ | - | | | $ | - | | | $ | 244,570 | |
| Other acquired liabilities | | $ | - | | | $ | - | | | $ | 112,194 | |
| | | | | | | | | | | | | |
The accompanying Notes are an integral part of these Consolidated Financial Statements.
FRONTIER COMMUNICATIONS CORPORATION AND SUBSIDIARIES
Notes to Consolidated Financial Statements
| (1) | Description of Business and Summary of Significant Accounting Policies: |
(a) Description of Business:
Frontier Communications Corporation (formerly known as Citizens Communications Company through July 30, 2008) and its subsidiaries are referred to as “we,” “us,” “our,” or the “Company” in this report. We are a communications company providing services to rural areas and small and medium-sized towns and cities as an incumbent local exchange carrier, or ILEC.
(b) Basis of Presentation and Use of Estimates:
Our consolidated financial statements have been prepared in accordance with accounting principles generally accepted in the United States of America (U.S. GAAP). Certain reclassifications of balances previously reported have been made to conform to the current presentation. All significant intercompany balances and transactions have been eliminated in consolidation.
Our consolidated financial statements have been adjusted on a retrospective basis to reflect the adoption of two new accounting standards: Accounting Standards Codification (ASC) Topic 810, (formerly Statement of Financial Accounting Standards (SFAS) No. 160, “Noncontrolling Interests in Consolidated Financial Statements”) and ASC Topic 260 (formerly FASB Staff Position (FSP) EITF No. 03-6-1, “Determining Whether Instruments Granted in Share-Based Payment Transactions are Participating Securities.”) The prior period data for 2008 and 2007 presented in these consolidated financial statements and notes herein have been adjusted retrospectively in accordance with ASC Topic 810 and ASC Topic 260. See Note 2 for further discussion.
The preparation of our financial statements in conformity with U.S. GAAP requires management to make estimates and assumptions that affect the reported amounts of assets and liabilities at the date of the financial statements, the disclosure of contingent assets and liabilities, and the reported amounts of revenue and expenses during the reporting period. Actual results may differ from those estimates. Estimates and judgments are used when accounting for allowance for doubtful accounts, impairment of long-lived assets, intangible assets, depreciation and amortization, income taxes, purchase price allocations, contingencies, and pension and other postretirement benefits, among others.
(c) Cash Equivalents:
We consider all highly liquid investments with an original maturity of three months or less to be cash equivalents.
(d) Revenue Recognition:
Revenue is recognized when services are provided or when products are delivered to customers. Revenue that is billed in advance includes: monthly recurring network access services, special access services and monthly recurring local line and unlimited fixed long-distance bundle charges. The unearned portion of these fees are initially deferred as a component of other liabilities on our consolidated balance sheet and recognized as revenue over the period that the services are provided. Revenue that is billed in arrears includes: non-recurring network access services, switched access services, non-recurring local services and long-distance services. The earned but unbilled portion of these fees are recognized as revenue in our consolidated statements of operations and accrued in accounts receivable in the period that the services are provided. Excise taxes are recognized as a liability when billed. Installation fees and their related direct and incremental costs are initially deferred and recognized as revenue and expense over the average term of a customer relationship. We recognize as current period expense the portion of installation costs that exceeds installation fee revenue.
The Company collects various taxes from its customers and subsequently remits such funds to governmental authorities. Substantially all of these taxes are recorded through the consolidated balance sheet and presented on a net basis in our consolidated statements of operations. We also collect Universal Service Fund (USF) surcharges from customers (primarily federal USF) which we have recorded on a gross basis in our consolidated statements of operations and included in revenue and other operating expenses at $35.5 million, $37.1 million and $35.9 million for the years ended December 31, 2009, 2008 and 2007, respectively.
(e) Property, Plant and Equipment:
Property, plant and equipment are stated at original cost or fair market value for our acquired properties, including capitalized interest. Maintenance and repairs are charged to operating expenses as incurred. The gross book value of routine property, plant and equipment retired is charged against accumulated depreciation.
(f) Goodwill and Other Intangibles:
Intangibles represent the excess of purchase price over the fair value of identifiable tangible net assets acquired. We undertake studies to determine the fair values of assets and liabilities acquired and allocate purchase prices to assets and liabilities, including property, plant and equipment, goodwill and other identifiable intangibles. We annually (during the fourth quarter) or more frequently, if appropriate, examine the carrying value of our goodwill and trade name to determine whether there are any impairment losses. We test for goodwill impairment at the “operating segment” level, as that term is defined in ASC Topic 350 (formerly Statement of Financial Accounting Standards (SFAS) No. 142, “Goodwill and Other Intangible Assets”). The Company revised its management and operating structure during the first quarter of 2009 and now has three “operating segments.” Our “operating segments” are aggregated into one reportable segment.
(g) Impairment of Long-Lived Assets and Long-Lived Assets to Be Disposed Of:
We review long-lived assets to be held and used and long-lived assets to be disposed of, including customer lists, for impairment whenever events or changes in circumstances indicate that the carrying amount of such assets may not be recoverable. Recoverability of assets to be held and used is measured by comparing the carrying amount of the asset to the future undiscounted net cash flows expected to be generated by the asset. Recoverability of assets held for sale is measured by comparing the carrying amount of the assets to their estimated fair market value. If any assets are considered to be impaired, the impairment is measured by the amount by which the carrying amount of the assets exceeds the estimated fair value. Also, we periodically reassess the useful lives of our tangible and intangible assets to determine whether any changes are required.
(h) Derivative Instruments and Hedging Activities:
We account for derivative instruments and hedging activities in accordance with ASC 815 (formerly SFAS No. 133, “Accounting for Derivative Instruments and Hedging Activities”) ASC 815 requires that all derivative instruments, such as interest rate swaps, be recognized in the financial statements and measured at fair value regardless of the purpose or intent of holding them.
(i) Investments:
Investments in entities that we do not control, but where we have the ability to exercise significant influence over operating and financial policies, are accounted for using the equity method of accounting.
(j) Income Taxes and Deferred Income Taxes:
We file a consolidated federal income tax return. We utilize the asset and liability method of accounting for income taxes. Under the asset and liability method, deferred income taxes are recorded for the tax effect of temporary differences between the financial statement basis and the tax basis of assets and liabilities using tax rates expected to be in effect when the temporary differences are expected to reverse.
(k) Stock Plans:
We have various stock-based compensation plans. Awards under these plans are granted to eligible officers, management employees, non-management employees and non-employee directors. Awards may be made in the form of incentive stock options, non-qualified stock options, stock appreciation rights, restricted stock, restricted stock units or other stock-based awards. We have no awards with market or performance conditions. Our general policy is to issue shares upon the grant of restricted shares and exercise of options from treasury.
The compensation cost recognized is based on awards ultimately expected to vest. ASC Topic 718 requires forfeitures to be estimated and revised, if necessary, in subsequent periods if actual forfeitures differ from those estimates.
(l) Net Income Per Common Share Attributable to Common Shareholders:
Basic net income per common share is computed using the weighted average number of common shares outstanding during the period being reported on, excluding unvested restricted stock awards. The impact of dividends paid on unvested restricted stock awards have been deducted in the determination of basic and diluted net income attributable to common shareholders of Frontier. Except when the effect would be antidilutive, diluted net income per common share reflects the dilutive effect of the assumed exercise of stock options using the treasury stock method at the beginning of the period being reported on as well as common shares that would result from the conversion of convertible preferred stock (EPPICS) and convertible notes. In addition, the related interest on convertible debt (net of tax) is added back to income since it would not be paid if the debt was converted to common stock.
(2) Recent Accounting Literature and Changes in Accounting Principles:
Fair Value Measurements
In September 2006, the FASB issued SFAS No. 157, “Fair Value Measurements” (currently ASC Topic 820), which defines fair value, establishes a framework for measuring fair value, and expands disclosures about fair value measurements. In February 2008, the FASB amended SFAS No. 157 (ASC Topic 820) to defer the application of this standard to nonfinancial assets and liabilities until 2009. The provisions of SFAS No. 157 (ASC Topic 820) related to financial assets and liabilities were effective as of the beginning of 2008. Our partial adoption of SFAS No. 157 (ASC Topic 820) in the first quarter of 2008 had no impact on our financial position, results of operations or cash flows. The adoption of SFAS No. 157 (ASC Topic 820), as amended, in the first quarter of 2009 with respect to its effect on nonfinancial assets and liabilities had no impact on our financial position, results of operations or cash flows.
Business Combinations
In December 2007, the FASB revised SFAS No. 141, “Business Combinations” (currently ASC Topic 805). The revised statement, SFAS No. 141R (ASC Topic 805), as amended by FSP SFAS No. 141(R)-1 (ASC Topic 805), requires an acquiring entity to recognize all the assets acquired and liabilities assumed in a transaction at the acquisition date at fair value, to recognize and measure preacquisition contingencies, including contingent consideration, at fair value (if possible), to remeasure liabilities related to contingent consideration at fair value in each subsequent reporting period and to expense all acquisition related costs. The effective date of SFAS No. 141R (ASC Topic 805) was for business combinations for which the acquisition date was on or after the beginning of the first annual reporting period beginning on or after December 15, 2008. We will account for our pending acquisition of approximately 4.2 million access lines (as of December 31, 2009) from Verizon Communications Inc. (Verizon) using the guidance included in SFAS No. 141R (ASC Topic 805). For the year ended December 31, 2009, we incurred approximately $28.3 million of acquisition and integration costs in connection with our pending acquisition from Verizon. In accordance with SFAS No. 141R (ASC Topic 805), such costs are required to be expensed as incurred and are reflected in “Acquisition and integration costs” in our consolidated statements of operations.
Noncontrolling Interests in Consolidated Financial Statements
In December 2007, the FASB issued SFAS No. 160, “Noncontrolling Interests in Consolidated Financial Statements” (currently ASC Topic 810). SFAS No. 160 (ASC Topic 810) establishes requirements for ownership interest in subsidiaries held by parties other than the Company (sometimes called “minority interest”) be clearly identified, presented and disclosed in the consolidated statement of financial position within equity, but separate from the parent’s equity. All changes in the parent’s ownership interest are required to be accounted for consistently as equity transactions and any noncontrolling equity investments in unconsolidated subsidiaries must be measured initially at fair value. SFAS No. 160 (ASC Topic 810) was effective, on a prospective basis, for fiscal years beginning after December 15, 2008. However, presentation and disclosure requirements must be retrospectively applied to comparative financial statements. The adoption of SFAS No. 160 (ASC Topic 810) in the first quarter of 2009 did not have a material impact on our financial position, results of operations or cash flows.
Determining Whether Instruments Granted in Share-Based Payment Transactions are Participating Securities
In June 2008, the FASB ratified FSP EITF No. 03-6-1, “Determining Whether Instruments Granted in Share-Based Payment Transactions are Participating Securities” (currently ASC Topic 260). FSP EITF No. 03-6-1 (ASC Topic 260) addresses whether instruments granted in share-based payment transactions are participating securities prior to vesting and, therefore, should be included in the earnings allocation in computing earnings per share under the two-class method. FSP EITF No. 03-6-1 (ASC Topic 260) was effective, on a retrospective basis, for financial statements issued for fiscal years beginning after December 15, 2008, and interim periods within those years. Our outstanding non-vested restricted stock is a participating security in accordance with FSP EITF No. 03-6-1 (ASC Topic 260) and we have adjusted our previously reported basic and diluted income per common share. The adoption of FSP EITF No. 03-6-1 (ASC Topic 260) in the first quarter of 2009 did not have a material impact on our basic and diluted income per common share.
Employers’ Disclosures about Postretirement Benefit Plan Assets
In December 2008, the FASB issued FSP SFAS No. 132 (R)-1, “Employers’ Disclosures about Postretirement Benefit Plan Assets” (currently ASC Topic 715). FSP SFAS No. 132(R)-1 (ASC Topic 715) amends SFAS No. 132, “Employers’ Disclosures about Pensions and Other Postretirement Benefits,” (ASC Topic 230) to provide guidance on an employers’ disclosures about plan assets of a defined benefit pension or other postretirement plan. FSP SFAS No. 132(R)-1 (ASC Topic 715) requires additional disclosures about investment policies and strategies, categories of plan assets, fair value measurements of plan assets and significant concentrations of risk. The disclosures about plan assets required by FSP SFAS No. 132(R)-1 (ASC Topic 715) are effective for fiscal years ending after December 15, 2009. The adoption of the disclosure requirements of FSP SFAS No. 132(R)-1 (ASC Topic 715) in 2009 did not have a material impact on our financial position, results of operations or cash flows.
Subsequent Events
In May 2009, the FASB issued SFAS No. 165, “Subsequent Events” (currently ASC Topic 855), which establishes general standards of accounting for and disclosure of events that occur after the balance sheet date but before financial statements are issued or are available to be issued. In particular, SFAS No. 165 (ASC Topic 855) sets forth the period after the balance sheet date during which management of a reporting entity should evaluate events or transactions that may occur for potential recognition or disclosure in the financial statements, the circumstances under which an entity should recognize events or transactions occurring after the balance sheet date in its financial statements, and the disclosures that an entity should make about events or transactions that occurred after the balance sheet date. SFAS No. 165 (ASC Topic 855) was effective for interim or annual reporting periods ending after June 15, 2009. The adoption of SFAS No. 165 (ASC Topic 855) in the second quarter of 2009 had no impact on our financial position, results of operations or cash flows.
Accounting Standards Codification
In June 2009, the FASB issued SFAS No. 168, “The FASB Accounting Standards Codification and the Hierarchy of Generally Accepted Accounting Principals” (currently ASC Topic 105). SFAS No. 168 (ASC Topic 105) replaces the guidance that previously existed in SFAS No. 162, entitled “The Hierarchy of Generally Accepted Accounting Principals” and designates the FASB Accounting Standards Codification as the sole source of authoritative accounting technical literature for nongovernmental entities. All accounting guidance that is not included in the Accounting Standards Codification is now considered to be non-authoritative. SFAS No. 168 (ASC Topic 105) was effective for financial statements issued for interim and annual periods ending after September 15, 2009. The adoption of SFAS No. 168 (ASC Topic 105) in the third quarter of 2009 had no impact on our financial position, results of operations or cash flows.
(3) Acquisitions:
Pending Acquisition:
On May 13, 2009, we entered into a definitive agreement with Verizon under which Frontier will acquire defined assets and liabilities of the local exchange business and related landline activities of Verizon, including Internet access and long distance services and broadband video provided to designated customers. Assuming that the merger occurred on December 31, 2009, the merger would have resulted in Frontier acquiring approximately 4.2 million access lines and certain business related assets from Verizon. The Verizon Transaction will be financed with approximately $5.3 billion of common stock plus the assumption of approximately $3.33 billion in debt. Certain of the conditions to the closing of the Verizon Transaction have already been met: (1) Frontier’s shareholders approved the Verizon Transaction at a special meeting of shareholders held on October 27, 2009; (2) the Federal Trade Commission has granted early termination of the waiting period under the Hart-Scott-Rodino Act; (3) approvals of all necessary local video franchise authorities (subject to the satisfaction of certain conditions); (4) receipt by Verizon of a favorable ruling from the IRS regarding the tax consequences of the Verizon Transaction; and (5) five of the nine required state regulatory approvals. Completion of the Verizon Transaction remains subject to a number of other conditions, including the receipt of the remaining four state regulatory approvals, approval from the FCC, the completion of financing, on terms that satisfy certain conditions as well as other customary closing conditions. Subject to satisfaction of these conditions, we anticipate closing this transaction during the second quarter of 2010.
Acquisitions of Commonwealth Telephone and Global Valley Networks
On March 8, 2007, we acquired Commonwealth Telephone Enterprises, Inc. (“Commonwealth” or “CTE”) in a cash-and-stock taxable transaction, for a total consideration of approximately $1.1 billion. We paid $804.1 million in cash ($663.7 million net, after cash acquired) and issued common stock with a value of $249.8 million.
On October 31, 2007, we acquired Global Valley Networks, Inc. and GVN Services (together GVN) through the purchase from Country Road Communications, LLC of 100% of the outstanding common stock of Evans Telephone Holdings, Inc., the parent Company of GVN. The purchase price of $62.0 million was paid with cash on hand.
We have accounted for the acquisitions of Commonwealth and GVN as purchases under U.S. GAAP. Under the purchase method of accounting, the assets and liabilities of Commonwealth and GVN were recorded as of their respective acquisition dates, at their respective fair values, and consolidated with those of Frontier.
The following schedule provides a summary of the final purchase price paid by Frontier in the acquisitions of Commonwealth and GVN:
($ in thousands) | | | | | | |
| | | Commonwealth | | | GVN | |
Cash paid | | $ | 804,554 | | | $ | 62,001 | |
Value of Frontier common stock issued | | | 249,804 | | | | - | |
Total Purchase Price | | $ | 1,054,358 | | | $ | 62,001 | |
| | | | | | | | | |
| | | | | | | | | |
With respect to our acquisitions of Commonwealth and GVN, the purchase price has been allocated based on fair values to the net tangible and intangible assets acquired and liabilities assumed. The final allocations were as follows:
| ($ in thousands) | | | | | | |
| | | Commonwealth | | | GVN | |
| Allocation of purchase price: | | | | | | |
Current assets (1) | | $ | 187,986 | | | $ | 1,581 | |
| Property, plant and equipment | | | 387,343 | | | | 23,578 | |
| Goodwill | | | 690,262 | | | | 34,311 | |
| Other intangibles | | | 273,800 | | | | 7,250 | |
| Other assets | | | 11,285 | | | | 812 | |
| Current portion of debt | | | (35,000 | ) | | | (17 | ) |
| Accounts payable and other current liabilities | | | (80,375 | ) | | | (626 | ) |
| Deferred income taxes | | | (143,539 | ) | | | (3,740 | ) |
| Convertible notes | | | (209,553 | ) | | | - | |
| Other liabilities | | | (27,851 | ) | | | (1,148 | ) |
| Total Purchase Price | | $ | 1,054,358 | | | $ | 62,001 | |
| | | | | | | | | |
(1) Includes $140.6 million of total acquired cash.
The following unaudited pro forma financial information presents the combined results of operations of Frontier, Commonwealth and GVN as if the acquisitions had occurred at the beginning of 2007. The historical results of the Company include the results of Commonwealth from the date of its acquisition on March 8, 2007, and GVN from the date of its acquisition on October 31, 2007. The pro forma information is not necessarily indicative of what the financial position or results of operations actually would have been had the acquisitions been completed at the beginning of 2007. In addition, the unaudited pro forma financial information does not purport to project the future financial position or operating results of Frontier after completion of the acquisitions.
| | | 2007 | |
($ in thousands, except per share amounts) | | | |
| | | | |
Revenue | | $ | 2,362,695 | |
Operating income | | $ | 720,476 | |
Net income attributable to common shareholders | | | | |
of Frontier | | $ | 218,428 | |
| | | | | |
Basic and diluted income per common share | | $ | 0.65 | |
| (4) | Property, Plant and Equipment: |
The components of property, plant and equipment at December 31, 2009 and 2008 are as follows:
| | | Estimated | | | | | | | |
($ in thousands) | | Useful Lives | | | 2009 | | | 2008 | |
| | | | | | | | | | |
Land | | | N/A | | | $ | 22,416 | | | $ | 22,631 | |
Buildings and leasehold improvements | | 41 years | | | | 348,002 | | | | 344,839 | |
General support | | 5 to 17 years | | | | 517,958 | | | | 508,825 | |
Central office/electronic circuit equipment | | 5 to 11 years | | | | 3,042,665 | | | | 2,959,440 | |
Cable and wire | | 15 to 60 years | | | | 3,730,998 | | | | 3,623,193 | |
Other | | 20 to 30 years | | | | 24,368 | | | | 24,703 | |
Construction work in progress | | | | | | | 116,655 | | | | 97,429 | |
| | | | | | | | 7,803,062 | | | | 7,581,060 | |
Less: Accumulated depreciation | | | | | | | (4,669,541 | ) | | | (4,341,087 | ) |
Property, plant and equipment, net | | | | | | $ | 3,133,521 | | | $ | 3,239,973 | |
| | | | | | | | | | | | | |
| | Depreciation expense is principally based on the composite group method. Depreciation expense was $362.2 million, $379.5 million and $374.4 million for the years ended December 31, 2009, 2008 and 2007, respectively. Effective with the completion of an independent study of the estimated useful lives of our plant assets we adopted new lives beginning October 1, 2009. |
The components of accounts receivable, net at December 31, 2009 and 2008 are as follows:
($ in thousands) | | 2009 | | | 2008 | |
| | | | | | | |
End user | | $ | 205,384 | | | $ | 244,395 | |
Other | | | 15,532 | | | | 17,977 | |
Less: Allowance for doubtful accounts | | | (30,171 | ) | | | (40,125 | ) |
Accounts receivable, net | | $ | 190,745 | | | $ | 222,247 | |
| | | | | | | | | |
An analysis of the activity in the allowance for doubtful accounts for the years ended December 31, 2009, 2008 and 2007 is as follows:
| | | | | | | | | | | | | | | | | | | |
| | | | | | Additions | | | | | | | |
| | | Balance at | | | Balance of | | | Charged to | | | Charged to other | | | | | | Balance at | |
| | | beginning of | | | acquired | | | bad debt | | | accounts - | | | | | | end of | |
Allowance for doubtful accounts | | Period | | | properties | | | expense* | | | Revenue | | | Deductions | | | Period | |
| | | | | | | | | | | | | | | | | | | |
| | | | | | | | | | | | | | | | | | | |
| 2007 | | $ | 108,537 | | | $ | 1,499 | | | $ | 31,131 | | | $ | (77,898 | ) | | $ | 30,521 | | | $ | 32,748 | |
| 2008 | | $ | 32,748 | | | $ | 1,150 | | | $ | 31,700 | | | $ | 2,352 | | | $ | 27,825 | | | $ | 40,125 | |
| 2009 | | $ | 40,125 | | | $ | - | | | $ | 33,682 | | | $ | (6,181 | ) | | $ | 37,455 | | | $ | 30,171 | |
* | Such amounts are included in bad debt expense and for financial reporting purposes are classified as contra-revenue. |
We maintain an allowance for estimated bad debts based on our estimate of our ability to collect our accounts receivable. Bad debt expense is recorded as a reduction to revenue.
Our allowance for doubtful accounts (and “end user” receivables) declined in 2007, primarily as a result of the resolution of a principal carrier dispute. On March 12, 2007, we entered into a settlement agreement with a carrier pursuant to which we were paid $37.5 million, resulting in a favorable impact on our revenue in the first quarter of 2007 of $38.7 million.
The components of other intangibles at December 31, 2009 and 2008 are as follows:
($ in thousands) | | 2009 | | | 2008 | |
| | | | | | | |
Customer base | | $ | 270,309 | | | $ | 1,265,052 | |
Trade name and license | | | 134,680 | | | | 132,664 | |
Other intangibles | | | 404,989 | | | | 1,397,716 | |
Less: Accumulated amortization | | | (157,462 | ) | | | (1,038,042 | ) |
Total other intangibles, net | | $ | 247,527 | | | $ | 359,674 | |
| | | | | | | | | |
Amortization expense was $114.2 million, $182.3 million and $171.4 million for the years ended December 31, 2009, 2008 and 2007, respectively. Amortization expense for 2009 is comprised of $57.9 million for amortization associated with our “legacy” Frontier properties, which were fully amortized in June 2009, and $56.3 million for intangible assets (customer base and trade name) that were acquired in the Commonwealth and Global Valley acquisitions. As of December 31, 2008, $263.5 million has been allocated to the customer base (five year life) and $10.3 million to the trade name (five year life) acquired in the Commonwealth acquisition, and $7.0 million to the customer base (five year life) and $0.3 million to the trade name (five year life) acquired in the Global Valley acquisition. Amortization expense, based on our estimate of useful lives, is estimated to be $56.2 million in 2010 and 2011 and $11.3 million in 2012.
The activity in our long-term debt from December 31, 2008 to December 31, 2009 is summarized as follows:
| | | | | | Year Ended | | | | | Interest | |
| | | | | | December 31, 2009 | | | | | Rate* at | |
| | | December 31, | | | | | | New | | December 31, | | | December 31, | |
| ($ in thousands) | | 2008 | | | Retirements | | | Borrowings | | 2009 | | | 2009 | |
| | | | | | | | | | | | | | |
| Rural Utilities Service | | | | | | | | | | | | | |
| Loan Contracts | | $ | 16,607 | | | $ | (1,007 | ) | | $ | - | | $ | 15,600 | | | | 6.07% | |
| | | | | | | | | | | | | | | | | | | | |
| Senior Unsecured Debt | | | 4,702,331 | | | | (1,047,330 | ) | | | 1,200,000 | | | 4,855,001 | | | | 7.86% | |
| | | | | | | | | | | | | | | | | | | | |
| Industrial Development | | | | | | | | | | | | | | | | | | | |
| Revenue Bonds | | | 13,550 | | | | - | | | | - | | | 13,550 | | | | 6.33% | |
| | | | | | | | | | | | | | | | | | | | |
| TOTAL LONG-TERM | | | | | | | | | | | | | | | | | | | |
| DEBT | | $ | 4,732,488 | | | $ | (1,048,337 | ) | | $ | 1,200,000 | | $ | 4,884,151 | | | | 7.85% | |
| | | | | | | | | | | | | | | | | | | | |
| Less: Debt Discount | | | (6,946 | ) | | | | | | | | | | (82,786 | ) | | | | |
| Less: Current Portion | | | (3,857 | ) | | | | | | | | | | (7,236 | ) | | | | |
| | | | | | | | | | | | | | | | | | | | |
| | $ | 4,721,685 | | | $ | 4,794,129 | |
| | | | | | | | | | | | | | | | | | | | |
| * | Interest rate includes amortization of debt issuance costs, debt premiums or discounts, and deferred gain on interest rate swap terminations. The interest rates at December 31, 2009 represent a weighted average of multiple issuances. |
Additional information regarding our Senior Unsecured Debt at December 31:
| | | 2009 | | 2008 | |
| | | Principal | | Interest | | Principal | | Interest | |
($ in thousands) | | Outstanding | | Rate | | Outstanding | | Rate | |
| | | | | | | | | | |
Senior Notes: | | | | | | | | | |
Due 5/15/2011 | | $ | 76,089 | | | 9.250% | | $ | 921,276 | | | 9.250% | |
Due 10/24/2011 | | | 200,000 | | | 6.270% | | | 200,000 | | | 6.270% | |
Due 12/31/2012 | | | 145,500 | | 1.625% (Variable) | | | 147,000 | | 2.448% (Variable) | |
Due 1/15/2013 | | | 580,724 | | | 6.250% | | | 700,000 | | | 6.250% | |
Due 12/31/2013 | | | 132,638 | | 2.000% (Variable) | | | 133,988 | | 2.250% (Variable) | |
Due 5/1/2014 | | | 600,000 | | | 8.250% | | | - | | | | |
Due 3/15/2015 | | | 300,000 | | | 6.625% | | | 300,000 | | | 6.625% | |
Due 10/1/2018 | | | 600,000 | | | 8.125% | | | - | | | | |
Due 3/15/2019 | | | 434,000 | | | 7.125% | | | 450,000 | | | 7.125% | |
Due 1/15/2027 | | | 345,858 | | | 7.875% | | | 400,000 | | | 7.875% | |
Due 8/15/2031 | | | 945,325 | | | 9.000% | | | 945,325 | | | 9.000% | |
| | | | | | | | | | | | | | |
| | | | 4,360,134 | | | | | | 4,197,589 | | | | |
| | | | | | | | | | | | | | |
Debentures: | | | | | | | | | | | | | |
Due 11/1/2025 | | | 138,000 | | | 7.000% | | | 138,000 | | | 7.000% | |
Due 8/15/2026 | | | 1,739 | | | 6.800% | | | 11,614 | | | 6.800% | |
Due 10/1/2034 | | | 628 | | | 7.680% | | | 628 | | | 7.680% | |
Due 7/1/2035 | | | 125,000 | | | 7.450% | | | 125,000 | | | 7.450% | |
Due 10/1/2046 | | | 193,500 | | | 7.050% | | | 193,500 | | | 7.050% | |
| | | | 458,867 | | | | | | 468,742 | | | | |
Subsidiary Senior | | | | | | | | | | | | | |
Notes due 12/1/2012 | | | 36,000 | | | 8.050% | | | 36,000 | | | 8.050% | |
| | | | | | | | | | | | | | |
Total | | $ | 4,855,001 | | | 7.86% | | $ | 4,702,331 | | | 7.54% | |
| | | | | | | | | | | | | | |
During 2009, we retired an aggregate principal amount of $1,048.3 million of debt, consisting of $1,047.3 million of senior unsecured debt, as described in more detail below, and $1.0 million of rural utilities service loan contracts.
On October 1, 2009, we completed a registered debt offering of $600.0 million aggregate principal amount of 8.125% senior unsecured notes due 2018. The issue price was 98.441% of the principal amount of the notes, and we received net proceeds of approximately $578.7 million from the offering after deducting underwriting discounts and offering expenses. We used the net proceeds from the offering, together with cash on hand, to finance a cash tender offer for up to $700.0 million to purchase our outstanding 9.250% Senior Notes due 2011 (the 2011 Notes) and our outstanding 6.250% Senior Notes due 2013 (the 2013 Notes), as described below.
On April 9, 2009, we completed a registered offering of $600.0 million aggregate principal amount of 8.25% senior unsecured notes due 2014. The issue price was 91.805% of the principal amount of the notes. We received net proceeds of approximately $538.8 million from the offering after deducting underwriting discounts and offering expenses.
The Company accepted for purchase, in accordance with the terms of the tender offer referred to above, approximately $564.4 million aggregate principal amount of the 2011 Notes and approximately $83.4 million of the 2013 Notes tendered during the tender period, which expired on October 16, 2009. The aggregate consideration for these debt repurchases was $701.6 million, which was financed with the proceeds of the debt offering described above and cash on hand. The repurchases resulted in a loss on the early retirement of debt of $53.7 million, which we recognized in the fourth quarter of 2009.
In addition to the debt tender offer, we used $388.9 million of the debt offering proceeds in 2009 to repurchase $396.7 million principal amount of debt, consisting of $280.8 million of the 2011 Notes, $54.1 million of our 7.875% Senior Notes due January 15, 2027, $35.9 million of the 2013 Notes, $16.0 million of our 7.125% Senior Notes due March 15, 2019 and $9.9 million of our 6.80% Debentures due August 15, 2026. As a result of these repurchases, a $7.8 million net gain was recognized and included in Other income (loss), net in our consolidated statements of operations for the year ended December 31, 2009.
As a result of these 2009 debt financing, tender activities and other debt repurchases described above, as of December 31, 2009, we reduced our 2011 debt maturity to $280.0 million.
As of December 31, 2009, we had an available line of credit with seven financial institutions in the aggregate amount of $250.0 million. Associated facility fees vary, depending on our debt leverage ratio, and were 0.225% per annum as of December 31, 2009. The expiration date for this $250.0 million five year revolving credit agreement is May 18, 2012. During the term of the credit facility we may borrow, repay and reborrow funds, subject to customary borrowing conditions. The credit facility is available for general corporate purposes but may not be used to fund dividend payments.
During 2008, we retired an aggregate principal amount of $144.7 million of debt, consisting of $128.7 million principal amount of the 2011 Notes, $12.0 million of other senior unsecured debt and rural utilities service loan contracts, and $4.0 million of 5% Company Obligated Mandatorily Redeemable Convertible Preferred Securities (EPPICS).
On March 28, 2008, we borrowed $135.0 million under a senior unsecured term loan facility that was established on March 10, 2008. The loan matures in 2013 and bears interest of 2.00% as of December 31, 2009. The interest rate is based on the prime rate or LIBOR, at our election, plus a margin which varies depending on our debt leverage ratio. We used the proceeds to repurchase, during the first quarter of 2008, $128.7 million principal amount of the 2011 Notes and to pay for the $6.3 million of premium on early retirement of these notes.
As of December 31, 2008, EPPICS representing a total principal amount of $197.8 million have been converted into 15,969,645 shares of our common stock. There were no outstanding EPPICS as of December 31, 2008. As a result of the redemption of all outstanding EPPICS as of December 31, 2008, the $10.5 million in debt with related parties was reclassified by the Company against an offsetting investment.
On January 15, 2008, we terminated all of our interest rate swap agreements representing $400.0 million notional amount of indebtedness associated with our Senior Notes due in 2011 and 2013. Cash proceeds on the swap terminations of approximately $15.5 million were received in January 2008. The related gain has been deferred on the consolidated balance sheet, and is being amortized into interest expense over the term of the associated debt.
During 2007, we retired an aggregate principal amount of $967.2 million of debt, including $3.3 million of EPPICS and $17.8 million of 3.25% Commonwealth convertible notes that were converted into our common stock. As further described below, we temporarily borrowed and repaid $200.0 million during the month of March 2007, utilized to temporarily fund our acquisition of Commonwealth.
In connection with the acquisition of Commonwealth, we assumed $35.0 million of debt under a revolving credit facility and approximately $191.8 million face amount of Commonwealth convertible notes (fair value of approximately $209.6 million). During March 2007, we paid down the $35.0 million credit facility, and through December 31, 2007, we retired approximately $183.3 million face amount (for which we paid $165.4 million in cash and $36.7 million in common stock) of the convertible notes (premium paid of $18.9 million was recorded as $17.8 million to goodwill and $1.1 million to other income (loss), net). The remaining outstanding balance of $8.5 million was fully redeemed in the fourth quarter of 2008.
On March 23, 2007, we issued in a private placement an aggregate $300.0 million principal amount of 6.625% Senior Notes due 2015 and $450.0 million principal amount of 7.125% Senior Notes due 2019. Proceeds from the sale were used to pay down $200.0 million principal amount of indebtedness borrowed on March 8, 2007 under a bridge loan facility in connection with the acquisition of Commonwealth, and redeem, on April 26, 2007, $495.2 million principal amount of our 7.625% Senior Notes due 2008.
During the first quarter of 2007, we incurred and expensed approximately $4.1 million of fees associated with the bridge loan facility established to temporarily fund our acquisition of Commonwealth. In the second quarter of 2007, we completed an exchange offer (to publicly register the debt) for the $750.0 million in total of private placement notes described above, in addition to the $400.0 million principal amount of 7.875% Senior Notes issued in a private placement on December 22, 2006, for registered Senior Notes due 2027. On April 26, 2007, we redeemed $495.2 million principal amount of our 7.625% Senior Notes due 2008 at a price of 103.041% plus accrued and unpaid interest. The debt retirement generated a pre-tax loss on the early extinguishment of debt at a premium of approximately $16.3 million in the second quarter of 2007 and is included in other income (loss), net. As a result of this debt redemption, we also terminated three interest rate swap agreements hedging an aggregate $150.0 million notional amount of indebtedness. Payments on the swap terminations of approximately $1.0 million were made in the second quarter of 2007.
As of December 31, 2009, we were in compliance with all of our debt and credit facility financial covenants.
Our principal payments for the next five years are as follows:
| | | Principal | |
| ($ in thousands) | | Payments | |
| | | | |
| 2010 | | $ | 7,236 | |
| 2011 | | $ | 279,956 | |
| 2012 | | $ | 180,366 | |
| 2013 | | $ | 709,855 | |
| 2014 | | $ | 600,517 | |
| | | | | |
| (8) | Derivative Instruments and Hedging Activities: |
Interest rate swap agreements were used to hedge a portion of our debt that is subject to fixed interest rates. Under our interest rate swap agreements, we agreed to pay an amount equal to a specified variable rate of interest times a notional principal amount, and to receive in return an amount equal to a specified fixed rate of interest times the same notional principal amount. The notional amounts of the contracts were not exchanged. No other cash payments are made unless the agreement is terminated prior to maturity, in which case the amount paid or received in settlement is established by agreement at the time of termination and represents the market value, at the then current rate of interest, of the remaining obligations to exchange payments under the terms of the contracts.
On January 15, 2008, we terminated all of our interest rate swap agreements representing $400.0 million notional amount of indebtedness associated with our Senior Notes due in 2011 and 2013. Cash proceeds on the swap terminations of approximately $15.5 million were received in January 2008. The related gain has been deferred on the consolidated balance sheet, and is being amortized into interest expense over the term of the associated debt. For the years ended December 31, 2009 and 2008, we recognized $7.6 million and $5.0 million, respectively, of deferred gain and anticipate recognizing $1.0 million during 2010. For the year ended December 31, 2007, the interest expense resulting from these interest rate swaps totaled approximately $2.4 million. At December 31, 2009 and 2008, we did not have any derivative instruments.
The components of investment income for the years ended December 31, 2009, 2008 and 2007 are as follows:
($ in thousands) | | 2009 | | | 2008 | | | 2007 | |
| | | | | | | | | | |
Interest and dividend income | | $ | 5,291 | | | $ | 10,928 | | | $ | 32,986 | |
Equity earnings | | | 994 | | | | 5,190 | | | | 4,655 | |
Total investment income | | $ | 6,285 | | | $ | 16,118 | | | $ | 37,641 | |
| | | | | | | | | | | | | |
| (10) | Other Income (Loss), net: |
The components of other income (loss), net for the years ended December 31, 2009, 2008 and 2007 are as follows:
| | 2009 | | | 2008 | | | 2007 | |
Loss on retirement of debt, net | | $ | (45,939 | ) | | $ | (6,290 | ) | | $ | (18,217 | ) |
Bridge loan fee | | | - | | | | - | | | | (4,069 | ) |
Litigation settlement proceeds/(costs) | | | 2,749 | | | | (1,037 | ) | | | - | |
Gain on expiration/settlement of customer advances, net | | | 2,741 | | | | 4,520 | | | | 2,031 | |
Other, net | | | (678 | ) | | | (2,363 | ) | | | 2,422 | |
Total other income (loss), net | | $ | (41,127 | ) | | $ | (5,170 | ) | | $ | (17,833 | ) |
| | | | | | | | | | | | | |
During the fourth quarter of 2009, we recognized a loss of $53.7 million on the early retirement of debt in connection with a $700.0 million debt tender offer. During 2009, we also recognized a $7.8 million gain as a result of repurchasing $396.7 million principal amount of debt. During 2009, we recorded litigation settlement proceeds of $2.7 million in connection with the Bangor, Maine legal matter.
During 2008, we retired certain debt and recognized a loss of $6.3 million on the early extinguishment of debt at a premium, mainly for the 9.25% Senior Notes due 2011. During 2008, we recorded legal fees and settlement costs in connection with the Bangor, Maine legal matter of $1.0 million. During 2007, we incurred $4.1 million of fees associated with a bridge loan facility. In 2007, we retired certain debt and recognized a loss of $18.2 million on the early extinguishment of debt at a premium, mainly for the 7.625% Senior Notes due 2008. During 2009, 2008 and 2007, we recognized income of $2.7 million, $4.5 million and $2.0 million, respectively, in connection with certain retained liabilities that have terminated, associated with customer advances for construction from our disposed water properties.
| (11) | Company Obligated Mandatorily Redeemable Convertible Preferred Securities: |
As of December 31, 2008, we fully redeemed the EPPICS related debt outstanding to third parties. The following disclosure provides the history regarding this issue.
In 1996, our consolidated wholly-owned subsidiary, Citizens Utilities Trust (the Trust), issued, in an underwritten public offering, 4,025,000 shares of EPPICS, representing preferred undivided interests in the assets of the Trust, with a liquidation preference of $50 per security (for a total liquidation amount of $201.3 million). These securities had an adjusted conversion price of $11.46 per share of our common stock. The conversion price was reduced from $13.30 to $11.46 during the third quarter of 2004 as a result of the $2.00 per share of common stock special, non-recurring dividend. The proceeds from the issuance of the Trust Convertible Preferred Securities and a Company capital contribution were used to purchase $207.5 million aggregate liquidation amount of 5% Partnership Convertible Preferred Securities due 2036 from another wholly-owned subsidiary, Citizens Utilities Capital L.P. (the Partnership). The proceeds from the issuance of the Partnership Convertible Preferred Securities and a Company capital contribution were used to purchase from us $211.8 million aggregate principal amount of 5% Convertible Subordinated Debentures due 2036. The sole assets of the Trust were the Partnership Convertible Preferred Securities, and our Convertible Subordinated Debentures were substantially all the assets of the Partnership. Our obligations under the agreements related to the issuances of such securities, taken together, constituted a full and unconditional guarantee by us of the Trust’s obligations relating to the Trust Convertible Preferred Securities and the Partnership’s obligations relating to the Partnership Convertible Preferred Securities.
In accordance with the terms of the issuances, we paid the annual 5% interest in quarterly installments on the Convertible Subordinated Debentures in 2008 and 2007. Cash was paid (net of investment returns) to the Partnership in payment of the interest on the Convertible Subordinated Debentures. The cash was then distributed by the Partnership to the Trust and then by the Trust to the holders of the EPPICS.
As of December 31, 2008, EPPICS representing a total principal amount of $197.8 million have been converted into 15,969,645 shares of our common stock. There were no outstanding EPPICS as of December 31, 2008. As a result of the redemption of all outstanding EPPICS as of December 31, 2008, the $10.5 million in debt with related parties was reclassified by the Company against an offsetting investment.
(12) Capital Stock:
On October 27, 2009, in conjunction with the shareholder vote to approve the Verizon Transaction, our stockholders approved an increase in the number of authorized shares of Frontier common stock from 600,000 to 1,750,000. The Certificate of Amendment to our Restated Certificate of Incorporation effectuating the increase will be filed and become effective immediately prior to the effective time of the merger. The amount and timing of dividends payable on common stock are, subject to applicable law, within the sole discretion of our Board of Directors.
At December 31, 2009, we had five stock-based compensation plans under which grants have been made and awards remained outstanding. These plans, which are described below, are the 1996 Equity Incentive Plan (1996 EIP), the Amended and Restated 2000 Equity Incentive Plan (2000 EIP), the Non-Employee Directors’ Deferred Fee Equity Plan (Deferred Fee Plan), the Non-Employee Directors’ Equity Incentive Plan (Directors’ Equity Plan, and together with the Deferred Fee Plan, the Director Plans) and the 2009 Equity Incentive Plan that was adopted on May 14, 2009 (2009 EIP).
Our general policy is to issue shares upon the grant of restricted shares and exercise of options from treasury. At December 31, 2009, there were 12,540,761 shares authorized for grant under these plans and 12,057,989 shares available for grant under two of the plans. No further awards may be granted under three of the plans: the 1996 EIP, the 2000 EIP or the Deferred Fee Plan.
In connection with the Director Plans, compensation costs associated with the issuance of stock units was $0.7 million, $0.8 million and $1.6 million in 2009, 2008 and 2007, respectively. Cash compensation associated with the Director Plans was $0.6 million in 2009 and $0.5 million in each of 2008 and 2007. These costs are recognized in Other operating expenses.
We have granted restricted stock awards to key employees in the form of our common stock. The number of shares issued as restricted stock awards during 2009, 2008 and 2007 were 1,119,000, 887,000 and 722,000, respectively. None of the restricted stock awards may be sold, assigned, pledged or otherwise transferred, voluntarily or involuntarily, by the employees until the restrictions lapse, subject to limited exceptions. The restrictions are time based. At December 31, 2009, 2,193,000 shares of restricted stock were outstanding. Compensation expense, recognized in Other operating expenses, of $8.7 million, $6.9 million and $6.6 million, for the years ended December 31, 2009, 2008 and 2007, respectively, has been recorded in connection with these grants.
1996, 2000 and 2009 Equity Incentive Plans
Since the expiration dates of the 1996 EIP and the 2000 EIP on May 22, 2006 and May 14, 2009, respectively, no awards have been or may be granted under the 1996 EIP and the 2000 EIP. Under the 2009 EIP, awards of our common stock may be granted to eligible officers, management employees and non-management employees in the form of incentive stock options, non-qualified stock options, SARs, restricted stock or other stock-based awards. As discussed under the Non-Employee Directors’ Compensation Plans below, prior to May 25, 2006 non-employee directors received an award of stock options under the 2000 EIP upon commencement of service.
At December 31, 2009, there were 10,000,000 shares authorized for grant under the 2009 EIP and 9,979,000 shares available for grant. No awards were granted more than 10 years after the effective date (May 14, 2009) of the 2009 EIP plan. The exercise price of stock options and SARs under the 2009, 2000 and 1996 EIPs generally are equal to or greater than the fair market value of the underlying common stock on the date of grant. Stock options are not ordinarily exercisable on the date of grant but vest over a period of time (generally four years). Under the terms of the EIPs, subsequent stock dividends and stock splits have the effect of increasing the option shares outstanding, which correspondingly decrease the average exercise price of outstanding options.
The following summary presents information regarding outstanding stock options and changes with regard to options under the EIP:
| | | | | | Weighted | | Weighted | | | | |
| | | Shares | | | Average | | Average | | | Aggregate | |
| | | Subject to | | | Option Price | | Remaining | | | Intrinsic | |
| | | Option | | | Per Share | | Life in Years | | | Value | |
| Balance at January 1, 2007 | | | 5,242,000 | | | $ | 12.41 | | | 4.4 | | | $ | 14,490,000 | |
| Options granted | | | - | | | $ | - | | | | | | | | |
| Options exercised | | | (1,254,000 | ) | | $ | 10.19 | | | | | | $ | 6,033,000 | |
| Options canceled, forfeited or lapsed | | | (33,000 | ) | | $ | 10.79 | | | | | | | | |
| Balance at December 31, 2007 | | | 3,955,000 | | | $ | 13.13 | | | 3.4 | | | $ | 5,727,000 | |
| Options granted | | | - | | | $ | - | | | | | | | | |
| Options exercised | | | (187,000 | ) | | $ | 7.38 | | | | | | $ | 743,000 | |
| Options canceled, forfeited or lapsed | | | (55,000 | ) | | $ | 10.40 | | | | | | | | |
| Balance at December 31, 2008 | | | 3,713,000 | | | $ | 13.46 | | | 2.5 | | | $ | 495,000 | |
| Options granted | | | - | | | $ | - | | | | | | | | |
| Options exercised | | | (114,000 | ) | | $ | 6.58 | | | | | | $ | 65,000 | |
| Options canceled, forfeited or lapsed | | | (48,000 | ) | | $ | 9.24 | | | | | | | | |
| Balance at December 31, 2009 | | | 3,551,000 | | | $ | 13.74 | | | 1.5 | | | $ | - | |
| | | | | | | | | | | | | | | | |
The following table summarizes information about shares subject to options under the EIP at December 31, 2009:
| Options Outstanding | | Options Exercisable | |
| | | | | | | Weighted Average | | | | | Weighted | |
| Number | | Range of | | Weighted Average | | Remaining | | Number | | | Average | |
| Outstanding | | Exercise Prices | | Exercise Price | | Life in Years | | Exercisable | | | Exercise Price | |
| | 394,000 | | $ | 8.19 - 8.19 | | $ | 8.19 | | | 2.37 | | | 394,000 | | | $ | 8.19 | |
| | 511,000 | | | 10.44 - 10.44 | | | 10.44 | | | 3.4 | | | 511,000 | | | | 10.44 | |
| | 199,000 | | | 11.15 - 11.15 | | | 11.15 | | | 0.8 | | | 199,000 | | | | 11.15 | |
| | 476,000 | | | 11.79 - 11.79 | | | 11.79 | | | 1.38 | | | 476,000 | | | | 11.79 | |
| | 167,000 | | | 11.90 - 14.27 | | | 13.44 | | | 3.77 | | | 166,000 | | | | 13.44 | |
| | 582,000 | | | 15.02 - 15.02 | | | 15.02 | | | 0.75 | | | 582,000 | | | | 15.02 | |
| | 640,000 | | | 15.94 - 16.74 | | | 16.67 | | | 0.73 | | | 640,000 | | | | 16.67 | |
| | 582,000 | | | 18.46 - 18.46 | | | 18.46 | | | 0.75 | | | 582,000 | | | | 18.46 | |
| | 3,551,000 | | $ | 8.19 - 18.46 | | $ | 13.74 | | | 1.54 | | | 3,550,000 | | | $ | 13.74 | |
| | | | | | | | | | | | | | | | | | | |
The number of options exercisable at December 31, 2008 and 2007 were 3,706,000 and 3,938,000, with a weighted average exercise price of $13.46 and $13.13, respectively.
Cash received upon the exercise of options during 2009, 2008 and 2007 was $0.8 million, $1.4 million and $13.8 million, respectively. There is no remaining unrecognized compensation cost associated with unvested stock options at December 31, 2009.
For purposes of determining compensation expense, the fair value of each option grant is estimated on the date of grant using the Black-Scholes option-pricing model which requires the use of various assumptions including expected life of the option, expected dividend rate, expected volatility, and risk-free interest rate. The expected life (estimated period of time outstanding) of stock options granted was estimated using the historical exercise behavior of employees. The risk free interest rate is based on the U.S. Treasury yield curve in effect at the time of the grant. Expected volatility is based on historical volatility for a period equal to the stock option’s expected life, calculated on a monthly basis. No stock option grants were issued in 2007, 2008 and 2009 under the EIP.
The following summary presents information regarding unvested restricted stock and changes with regard to restricted stock under the EIP:
| | | | | | Weighted | | | | |
| | | | | | Average | | | | |
| | | Number of | | | Grant Date | | | Aggregate | |
| | | Shares | | | Fair Value | | | Fair Value | |
| Balance at January 1, 2007 | | | 1,174,000 | | | $ | 12.89 | | | $ | 16,864,000 | |
| Restricted stock granted | | | 722,000 | | | $ | 15.04 | | | $ | 9,187,000 | |
| Restricted stock vested | | | (587,000 | ) | | $ | 12.94 | | | $ | 7,465,000 | |
| Restricted stock forfeited | | | (100,000 | ) | | $ | 13.95 | | | | | |
| Balance at December 31, 2007 | | | 1,209,000 | | | $ | 14.06 | | | $ | 15,390,000 | |
| Restricted stock granted | | | 887,000 | | | $ | 11.02 | | | $ | 7,757,000 | |
| Restricted stock vested | | | (367,000 | ) | | $ | 13.90 | | | $ | 3,209,000 | |
| Restricted stock forfeited | | | (27,000 | ) | | $ | 13.39 | | | | | |
| Balance at December 31, 2008 | | | 1,702,000 | | | $ | 12.52 | | | $ | 14,876,000 | |
| Restricted stock granted | | | 1,119,000 | | | $ | 8.42 | | | $ | 8,738,000 | |
| Restricted stock vested | | | (557,000 | ) | | $ | 12.77 | | | $ | 4,347,000 | |
| Restricted stock forfeited | | | (71,000 | ) | | $ | 11.02 | | | | | |
| Balance at December 31, 2009 | | | 2,193,000 | | | $ | 10.41 | | | $ | 17,126,000 | |
| | | | | | | | | | | | | |
For purposes of determining compensation expense, the fair value of each restricted stock grant is estimated based on the average of the high and low market price of a share of our common stock on the date of grant. Total remaining unrecognized compensation cost associated with unvested restricted stock awards at December 31, 2009 was $15.2 million and the weighted average period over which this cost is expected to be recognized is approximately two years.
Non-Employee Directors’ Compensation Plans
Upon commencement of his or her service on the Board of Directors, each non-employee director receives a grant of 10,000 stock options. These options are currently awarded under the Directors’ Equity Plan. Prior to effectiveness of the Directors’ Equity Plan on May 25, 2006, these options were awarded under the 2000 EIP. The exercise price of these options, which become exercisable six months after the grant date, is the fair market value (as defined in the relevant plan) of our common stock on the date of grant. Options granted under the Directors’ Equity Plan expire on the earlier of the tenth anniversary of the grant date or the first anniversary of termination of service as a director. Options granted to non-employee directors under the 2000 EIP expire on the tenth anniversary of the grant date.
Each non-employee director also receives an annual grant of 3,500 stock units. These units are currently awarded under the Directors’ Equity Plan and prior to effectiveness of that plan, were awarded under the Deferred Fee Plan. Since the effectiveness of the Directors’ Equity Plan, no further grants have been made under the Deferred Fee Plan. Prior to April 20, 2004, each non-employee director received an award of 5,000 stock options. The exercise price of such options was set at 100% of the fair market value on the date the options were granted. The options were exercisable six months after the grant date and remain exercisable for ten years after the grant date.
In addition, each year, each non-employee director is also entitled to receive a retainer, meeting fees, and, when applicable, fees for serving as a committee chair or as Lead Director. For 2009, each non-employee director had to elect, by December 31 of the preceding year, to receive $40,000 cash or 5,760 stock units as an annual retainer and to receive meeting fees and Lead Director and committee chair stipends in the form of cash or stock units. Stock units are awarded under the Directors’ Equity Plan. Directors making a stock unit election must also elect to convert the units to either common stock (convertible on a one-to-one basis) or cash upon retirement or death.
The number of shares of common stock authorized for issuance under the Directors’ Equity Plan is 2,540,761, which includes 540,761 shares that were available for grant under the Deferred Fee Plan on the effective date of the Directors’ Equity Plan. In addition, if and to the extent that any “plan units” outstanding on May 25, 2006 under the Deferred Fee Plan are forfeited or if any option granted under the Deferred Fee Plan terminates, expires, or is cancelled or forfeited, without having been fully exercised, shares of common stock subject to such “plan units” or options cancelled shall become available under the Directors’ Equity Plan. At December 31, 2009, there were 2,078,989 shares available for grant. There were 11 directors participating in the Directors’ Plans during all or part of 2009. In 2009, the total options, plan units, and stock earned were 0, 76,326, and 0, respectively. In 2008, the total options, plan units, and stock earned were 0, 102,673, and 0, respectively. In 2007, the total options, plan units, and stock earned were 10,000, 98,070 and 0, respectively. Options granted prior to the adoption of the Directors’ Equity Plan were granted under the 2000 EIP. At December 31, 2009, 182,951 options were outstanding and exercisable under the Director Plans at a weighted average exercise price of $12.68.
For 2009, each non-employee director received fees of $2,000 for each in-person Board of Directors and committee meeting attended and $1,000 for each telephone Board and committee meeting attended. The chairs of the Audit, Compensation, Nominating and Corporate Governance and Retirement Plan Committees were paid an additional annual fee of $25,000, $20,000, $7,500 and $7,500, respectively. In addition, the Lead Director, who heads the ad hoc committee of non-employee directors, received an additional annual fee of $15,000. A director must elect, by December 31 of the preceding year, to receive meeting and other fees in cash, stock units, or a combination of both. All fees paid to the non-employee directors in 2009 were paid quarterly. If the director elects stock units, the number of units credited to the director’s account is determined as follows: the total cash value of the fees payable to the director are divided by 85% of the closing prices of our common stock on the last business day of the calendar quarter in which the fees or stipends were earned. Units are credited to the director’s account quarterly.
We account for the Deferred Fee Plan and Directors’ Equity Plan in accordance with ASC Topic 718 (formerly SFAS No. 123R). To the extent directors elect to receive the distribution of their stock unit account in cash, they are considered liability-based awards. To the extent directors elect to receive the distribution of their stock unit accounts in common stock, they are considered equity-based awards. Compensation expense for stock units that are considered equity-based awards is based on the market value of our common stock at the date of grant. Compensation expense for stock units that are considered liability-based awards is based on the market value of our common stock at the end of each period.
(14) Income Taxes:
The following is a reconciliation of the provision for income taxes computed at Federal statutory rates to the effective rates for the years ended December 31, 2009, 2008 and 2007:
| | | | | | 2009 | | 2008 | | 2007 |
Consolidated tax provision at federal statutory rate | 35.0% | | 35.0% | | 35.0% |
State income tax provisions, net of federal income tax benefit | 2.8 | | 2.8 | | 1.8 |
Tax reserve adjustment | - | | (1.4) | | 1.0 |
All other, net | (1.6) | | 0.2 | | (0.6) |
| | | | | | 36.2% | | 36.6% | | 37.2% |
| | | | | | | | | | |
The components of the net deferred income tax liability (asset) at December 31 are as follows:
| ($ in thousands) | | 2009 | | | 2008 | |
| | | | | | | |
| Deferred income tax liabilities: | | | | | | |
| Property, plant and equipment basis differences | | $ | 666,393 | | | $ | 642,598 | |
| Intangibles | | | 292,736 | | | | 248,520 | |
| Other, net | | | 3,924 | | | | 15,946 | |
| | | | 963,053 | | | | 907,064 | |
| | | | | | | | | |
| Deferred income tax assets: | | | | | | | | |
| Additional pension/OPEB liability | | | 154,856 | | | | 146,997 | |
| Tax operating loss carryforward | | | 94,284 | | | | 72,434 | |
| Employee benefits | | | 74,226 | | | | 62,482 | |
| State tax liability | | | 2,531 | | | | 7,483 | |
| Accrued expenses | | | 15,712 | | | | 19,726 | |
| Bad debts | | | 9,435 | | | | 12,026 | |
| Other, net | | | 13,121 | | | | 14,550 | |
| | | | 364,165 | | | | 335,698 | |
| Less: Valuation allowance | | | (91,537 | ) | | | (67,331 | ) |
| Net deferred income tax asset | | | 272,628 | | | | 268,367 | |
| Net deferred income tax liability | | $ | 690,425 | | | $ | 638,697 | |
| | | | | | | | | |
| | | | | | | | | |
| Deferred tax assets and liabilities are reflected in the following | | | | | | | | |
| captions on the consolidated balance sheet: | | | | | | | | |
| Deferred income taxes | | $ | 722,192 | | | $ | 670,489 | |
| Income taxes | | | (31,767 | ) | | | (31,792 | ) |
| Net deferred income tax liability | | $ | 690,425 | | | $ | 638,697 | |
| | | | | | | | | |
Our state tax operating loss carryforward as of December 31, 2009 is estimated at $1.2 billion. A portion of our state loss carryforward begins to expire in 2010.
The provision (benefit) for Federal and state income taxes, as well as the taxes charged or credited to shareholders’ equity of Frontier, includes amounts both payable currently and deferred for payment in future periods as indicated below:
| ($ in thousands) | | 2009 | | | 2008 | | | 2007 | |
| | | | | | | | | | |
| Income taxes charged to the consolidated statement of | | | | | | | | | |
| operations: | | | | | | | | | |
| Current: | | | | | | | | | |
| Federal | | $ | 11,618 | | | $ | 68,114 | | | $ | 37,815 | |
| State | | | (2,630 | ) | | | 4,415 | | | | 9,188 | |
Total current | | | 8,988 | | | | 72,529 | | | | 47,003 | |
| | | | | | | | | | | | | |
| Deferred: | | | | | | | | | | | | |
| Federal | | | 49,916 | | | | 32,984 | | | | 75,495 | |
| State | | | 11,024 | | | | 983 | | | | 5,516 | |
Total deferred | | | 60,940 | | | | 33,967 | | | | 81,011 | |
| Total income taxes charged to the consolidated statement of | | | 69,928 | | | | 106,496 | | | | 128,014 | |
| operations (a) | | | | | | | | | | | | |
| | | | | | | | | | | | | |
| Income taxes charged (credited) to shareholders' equity of Frontier: | | | | | | | | | | | | |
| Deferred income tax benefits on unrealized/realized gains or | | | | | | | | | | | | |
| losses on securities classified as available-for-sale | | | - | | | | - | | | | (11 | ) |
| Current benefit arising from stock options exercised and restricted stock | | | 881 | | | | (4,877 | ) | | | (552 | ) |
| Deferred income taxes (benefits) arising from the recognition of | | | | | | | | | | | | |
| additional pension/OPEB liability | | | (4,353 | ) | | | (88,410 | ) | | | (6,880 | ) |
| Total income taxes charged (credited) to shareholders' equity of Frontier (b) | | | (3,472 | ) | | | (93,287 | ) | | | (7,443 | ) |
| Total income taxes: (a) plus (b) | | $ | 66,456 | | | $ | 13,209 | | | $ | 120,571 | |
| | | | | | | | | | | | | |
During 2009, we retrospectively changed our method of accounting for repairs and maintenance costs for tax return purposes. The effect of this change was a decrease of our current tax expense and an offsetting increase of our deferred tax expense of approximately $35.8 million in our 2009 income tax provision. Additionally, in part due to the above noted accounting change, refunds of approximately $56.2 million have been applied for in the Company’s 2008 tax returns. Refunds are recorded on our balance sheet at December 31, 2009 in current assets within income taxes.�� We recorded approximately $8.2 million (net) related to uncertain tax positions under FASB Interpretation No. (FIN) 48 (ASC Topic 740) in 2009.
ASC Topic 740 (formerly FASB Interpretation No. (FIN) 48, “Accounting for Uncertainty in Income Taxes”) requires applying a “more likely than not” threshold to the recognition and derecognition of uncertain tax positions either taken or expected to be taken in the Company’s income tax returns. The total amount of our gross tax liability for tax positions that may not be sustained under a “more likely than not” threshold amounts to $61.9 million as of December 31, 2009 including interest of $5.0 million. The amount of our total tax liabilities reflected above that would positively impact the calculation of our effective income tax rate, if our tax positions are sustained, is $29.3 million as of December 31, 2009.
The Company’s policy regarding the classification of interest and penalties is to include these amounts as a component of income tax expense. This treatment of interest and penalties is consistent with prior periods. We have recognized in our consolidated statement of operations for the year ended December 31, 2009, additional interest in the amount of $1.4 million. We are subject to income tax examinations generally for the years 2006 forward for Federal and 2005 for state filing jurisdictions. We also maintain uncertain tax positions in various state jurisdictions. Amounts related to uncertain tax positions that may change within the next twelve months are not material.
The following table sets forth the changes in the Company’s balance of unrecognized tax benefits for the years ended December 31, 2009 and 2008 in accordance with ASC Topic 740:
($ in thousands) | | | | | | |
| | | 2009 | | | 2008 | |
Unrecognized tax benefits - beginning of year | | $ | 48,711 | | | $ | 59,717 | |
Gross decreases - prior year tax positions | | | (3,133 | ) | | | (2,070 | ) |
Gross increases - current year tax positions | | | 12,412 | | | | 2,379 | |
Gross decreases - expired statute of limitations | | | (1,130 | ) | | | (11,315 | ) |
Unrecognized tax benefits - end of year | | $ | 56,860 | | | $ | 48,711 | |
| | | | | | | | | |
The amounts above exclude $5.0 million of accrued interest that we have recorded and would be payable should the Company’s tax positions not be sustained.
| (15) | Net Income Per Common Share: |
The reconciliation of the net income per common share calculation for the years ended December 31, 2009, 2008 and 2007 is as follows:
($ in thousands, except per-share amounts) | | | | | | |
| | | 2009 | | | 2008 | | | 2007 | |
| Net income used for basic and diluted | | | | | | | | | |
earnings per common share: | | | | | | | | | |
| | | | | | | | | | | | | |
| Net income attributable to common shareholders of Frontier | | $ | 120,783 | | | $ | 182,660 | | | $ | 214,654 | |
| Less: Dividends allocated to unvested restricted stock awards | | | (2,248 | ) | | | (1,744 | ) | | | (1,408 | ) |
| Total basic net income attributable to common shareholders | | | | | | | | | | | | |
| of Frontier | | | 118,535 | | | | 180,916 | | | | 213,246 | |
| | | | | | | | | | | | | |
| Effect of conversion of preferred securities - EPPICS | | | - | | | | 130 | | | | 152 | |
| Total diluted net income attributable to common shareholders | | | | | | | | | | | | |
| of Frontier | | $ | 118,535 | | | $ | 181,046 | | | $ | 213,398 | |
| | | | | | | | | | | | | |
| Basic earnings per common share: | | | | | | | | | | | | |
| Total weighted-average shares and unvested restricted stock awards | | | | | | | | | | | | |
| outstanding - basic | | | 312,183 | | | | 319,161 | | | | 332,377 | |
| Less: Weighted-average unvested restricted stock awards | | | (2,162 | ) | | | (1,660 | ) | | | (1,340 | ) |
| Total weighted-average shares outstanding - basic | | | 310,021 | | | | 317,501 | | | | 331,037 | |
| Net income per share attributable to common shareholders | | | | | | | | | | | | |
| of Frontier | | $ | 0.38 | | | $ | 0.57 | | | $ | 0.64 | |
| | | | | | | | | | | | | |
| Diluted earnings per common share: | | | | | | | | | | | | |
| Total weighted-average shares outstanding - basic | | | 310,021 | | | | 317,501 | | | | 331,037 | |
| Effect of dilutive shares | | | 92 | | | | 435 | | | | 940 | |
| Effect of conversion of preferred securities - EPPICS | | | - | | | | 306 | | | | 401 | |
| Total weighted-average shares outstanding - diluted | | | 310,113 | | | | 318,242 | | | | 332,378 | |
| Net income per share attributable to common shareholders | | | | | | | | | | | | |
| of Frontier | | $ | 0.38 | | | $ | 0.57 | | | $ | 0.64 | |
| | | | | | | | | | | | | |
For the years ended December 31, 2009, 2008 and 2007, options to purchase 3,551,000 shares (at exercise prices ranging from $8.19 to $18.46), 2,647,000 shares (at exercise prices ranging from $11.15 to $18.46) and 1,804,000 shares (at exercise prices ranging from $15.02 to $18.46), respectively, issuable under employee compensation plans were excluded from the computation of diluted earnings per share (EPS) for those periods because the exercise prices were greater than the average market price of our common stock and, therefore, the effect would be antidilutive. In calculating diluted EPS we apply the treasury stock method and include future unearned compensation as part of the assumed proceeds.
In addition, for the years ended December 31, 2009, 2008 and 2007, the impact of dividends paid on unvested restricted stock awards have been deducted from net income attributable to common shareholders of Frontier in accordance with FSP EITF No. 03-6-1 (ASC Topic 260), which we adopted in the first quarter of 2009 on a retrospective basis.
EPPICS
There were no outstanding EPPICS at December 31, 2008 and 2009. At December 31, 2007, we had 80,307 shares of potentially dilutive EPPICS, which were convertible into our common stock at a 4.3615 to 1 ratio at an exercise price of $11.46 per share. If all EPPICS that remained outstanding as of December 31, 2007 were converted, we would have issued approximately 350,259 shares of our common stock. These securities have been included in the diluted earnings per common share calculation for the period ended December 31, 2007.
Stock Units
At December 31, 2009, 2008 and 2007, we had 440,463, 324,806 and 225,427 stock units, respectively, issued under the Director Plans. These securities have not been included in the diluted income per share of common stock calculation because their inclusion would have had an antidilutive effect.
Share Repurchase Programs
There were no shares repurchased during 2009 under a share repurchase program.
During 2008, we repurchased approximately 17.8 million shares of our common stock at an aggregate cost of $200.0 million. During 2007, we repurchased approximately 17.3 million shares of our common stock at an aggregate cost of $250.0 million.
| (16) | Comprehensive Income: |
Comprehensive income consists of net income and other gains and losses affecting shareholders’ investment and pension/OPEB liabilities that, under GAAP, are excluded from net income.
The components of accumulated other comprehensive loss, net of tax at December 31, 2009 and 2008 are as follows:
($ in thousands) | | 2009 | | | 2008 | |
| | | | | | | |
Pension costs | | $ | 374,157 | | | $ | 376,086 | |
Postretirement costs | | | 21,554 | | | | 8,045 | |
Deferred taxes on pension and OPEB costs | | | (150,284 | ) | | | (146,997 | ) |
All other | | | 92 | | | | 18 | |
| | | $ | 245,519 | | | $ | 237,152 | |
| | | | | | | | | |
Our other comprehensive income (loss) for the years ended December 31, 2009, 2008 and 2007 is as follows:
| | | 2009 |
| | | Before-Tax | | Tax Expense/ | | Net-of-Tax |
| ($ in thousands) | Amount | | (Benefit) | | Amount |
| | | | | | | |
| | Net actuarial loss | $ (35,759) | | $ (10,149) | | $ (25,610) |
| | Amortization of pension and postretirement costs | 24,179 | | 6,862 | | 17,317 |
| | All other | (74) | | - | | (74) |
| Other comprehensive (loss) | $ (11,654) | | $ (3,287) | | $ (8,367) |
| | | | | | | |
| | | 2008 |
| | | Before-Tax | | Tax Expense/ | | Net-of-Tax |
| | | Amount | | (Benefit) | | Amount |
| | | | | | | |
| | Net actuarial loss | $ (252,358) | | $ (90,122) | | $ (162,236) |
| | Amortization of pension and postretirement costs | 4,795 | | 1,712 | | 3,083 |
| | All other | (4) | | - | | (4) |
| Other comprehensive (loss) | $ (247,567) | | $ (88,410) | | $ (159,157) |
| | | | | | | |
| | | 2007 |
| | | Before-Tax | | Tax Expense/ | | Net-of-Tax |
| | | Amount | | (Benefit) | | Amount |
| | | | | | | |
| | Amortization of pension and postretirement costs | $ (3,023) | | $ (6,880) | | $ 3,857 |
| | All other | 35 | | (12) | | 47 |
| Other comprehensive income | $ (2,988) | | $ (6,892) | | $ 3,904 |
| | | | | | | |
We operate in one reportable segment, Frontier. Frontier provides both regulated and unregulated voice, data and video services to residential, business and wholesale customers and is typically the incumbent provider in its service areas.
As permitted by ASC Topic 280 (formerly SFAS No. 131), we have utilized the aggregation criteria in combining our operating segments because all of our Frontier properties share similar economic characteristics, in that they provide the same products and services to similar customers using comparable technologies in all of the states in which we operate. The regulatory structure is generally similar. Differences in the regulatory regime of a particular state do not materially impact the economic characteristics or operating results of a particular property.
| (18) | Quarterly Financial Data (Unaudited): |
($ in thousands, except per share amounts) | | | | | | | | | | | | | | | |
| | | | | | | | | | | | | | | | |
| 2009 | | First Quarter | | | Second Quarter | | | Third Quarter | | | Fourth Quarter | | | Total Year | |
| Revenue | | $ | 537,956 | | | $ | 532,142 | | | $ | 526,816 | | | $ | 520,980 | | | $ | 2,117,894 | |
| Operating income | | | 139,510 | | | | 136,616 | | | | 172,490 | | | | 157,549 | | | | 606,165 | |
| Net income attributable to common shareholders of Frontier | | | 36,303 | | | | 27,918 | | | | 52,159 | | | | 4,403 | | | | 120,783 | |
| Net income available for common shareholders per basic | | | | | | | | | | | | | | | | | | | | |
| and diluted share | | $ | 0.12 | | | $ | 0.09 | | | $ | 0.17 | | | $ | 0.01 | | | $ | 0.38 | |
| | | | | | | | | | | | | | | | | | | | | |
| 2008 | | | | | | | | | | | | | | | | | | | | |
| Revenue | | $ | 569,205 | | | $ | 562,550 | | | $ | 557,871 | | | $ | 547,392 | | | $ | 2,237,018 | |
| Operating income | | | 164,312 | | | | 161,969 | | | | 164,241 | | | | 151,934 | | | | 642,456 | |
| Net income attributable to common shareholders of Frontier | | | 45,589 | | | | 55,778 | | | | 46,995 | | | | 34,298 | | | | 182,660 | |
| Net income available for common shareholders per basic | | | | | | | | | | | | | | | | | | | | |
| and diluted share | | $ | 0.14 | | | $ | 0.17 | | | $ | 0.15 | | | $ | 0.11 | | | $ | 0.57 | |
| | | | | | | | | | | | | | | | | | | | | |
The quarterly net income per common share amounts are rounded to the nearest cent. Annual net income per common share may vary depending on the effect of such rounding. We recognized $10.8 million ($6.8 million or $0.02 per share after tax), $3.7 million ($2.3 million or $0.01 per share after tax) and $13.9 million ($8.8 million or $0.03 per share after tax) of acquisition and integration costs during the second, third and fourth quarters of 2009, respectively. During the fourth quarter of 2009, we recognized a loss of $53.7 million ($33.8 million or $0.11 per share after tax) on the early retirement of debt in connection with a $700.0 million debt tender offer.
We sponsor a noncontributory defined benefit pension plan covering a significant number of our former and current employees and other postretirement benefit plans that provide medical, dental, life insurance and other benefits for covered retired employees and their beneficiaries and covered dependents. The benefits are based on years of service and final average pay or career average pay. Contributions are made in amounts sufficient to meet ERISA funding requirements while considering tax deductibility. Plan assets are invested in a diversified portfolio of equity and fixed-income securities and alternative investments.
The accounting results for pension and other postretirement benefit costs and obligations are dependent upon various actuarial assumptions applied in the determination of such amounts. These actuarial assumptions include the following: discount rates, expected long-term rate of return on plan assets, future compensation increases, employee turnover, healthcare cost trend rates, expected retirement age, optional form of benefit and mortality. We review these assumptions for changes annually with our independent actuaries. We consider our discount rate and expected long-term rate of return on plan assets to be our most critical assumptions.
The discount rate is used to value, on a present value basis, our pension and other postretirement benefit obligations as of the balance sheet date. The same rate is also used in the interest cost component of the pension and postretirement benefit cost determination for the following year. The measurement date used in the selection of our discount rate is the balance sheet date. Our discount rate assumption is determined annually with assistance from our actuaries based on the pattern of expected future benefit payments and the prevailing rates available on long-term, high quality corporate bonds that approximate the benefit obligation. In making this determination we consider, among other things, the yields on the Citigroup Pension Discount Curve, the Citigroup Above-Median Pension Curve, the general movement of interest rates and the changes in those rates from one period to the next. This rate can change from year-to-year based on market conditions that affect corporate bond yields. Our discount rate was 5.75% at year-end 2009, and 6.50% at year-end 2008 and 2007.
The expected long-term rate of return on plan assets is applied in the determination of periodic pension and postretirement benefit cost as a reduction in the computation of the expense. In developing the expected long-term rate of return assumption, we considered published surveys of expected market returns, 10 and 20 year actual returns of various major indices, and our own historical 5-year, 10-year and 20-year investment returns. The expected long-term rate of return on plan assets is based on an asset allocation assumption of 35% to 55% in fixed income securities, 35% to 55% in equity securities and 5% to 15% in alternative investments. We review our asset allocation at least annually and make changes when considered appropriate. Our pension asset investment allocation decisions are made by the Retirement Investment & Administration Committee (RIAC), a committee comprised of members of management, pursuant to a delegation of authority by the Retirement Plan Committee of the Board of Directors. The RIAC is responsible for reporting its actions to the Retirement Plan Committee. Asset allocation decisions take into account expected market return assumptions of various asset classes as well as expected pension benefit payment streams. When analyzing anticipated benefit payments, management considers both the absolute amount of the payments as well as the timing of such payments. In 2009, we changed our expected long-term rate of return on plan assets to 8.00% from the 8.25% used in 2008. For 2010, we will assume a rate of return of 8.00%. Our pension plan assets are valued at fair value as of the measurement date. The measurement date used to determine pension and other postretirement benefit measures for the pension plan and the postretirement benefit plan is December 31.
Pension Benefits
The following tables set forth the pension plan’s projected benefit obligations and fair values of plan assets as of December 31, 2009 and 2008 and the components of net periodic benefit cost for the years ended December 31, 2009, 2008 and 2007:
($ in thousands) | | 2009 | | | 2008 | |
| | | | | | | |
| Change in projected benefit obligation | | | | | | |
| Projected benefit obligation at beginning of year | | $ | 831,687 | | | $ | 820,404 | |
| Service cost | | | 6,098 | | | | 6,005 | |
| Interest cost | | | 52,127 | | | | 52,851 | |
| Actuarial loss/(gain) | | | 69,861 | | | | 20,230 | |
| Benefits paid | | | (71,373 | ) | | | (69,465 | ) |
| Plan change | | | 609 | | | | - | |
| Special termination benefits | | | 1,567 | | | | 1,662 | |
| Projected benefit obligation at end of year | | $ | 890,576 | | | $ | 831,687 | |
| | | | | | | | | |
| Change in plan assets | | | | | | | | |
| Fair value of plan assets at beginning of year | | $ | 589,776 | | | $ | 822,165 | |
| Actual return on plan assets | | | 90,222 | | | | (162,924 | ) |
| Benefits paid | | | (71,373 | ) | | | (69,465 | ) |
| Fair value of plan assets at end of year | | $ | 608,625 | | | $ | 589,776 | |
| | | | | | | | | |
| Funded status | | $ | (281,951 | ) | | $ | (241,911 | ) |
| | | | | | | | | |
| Amounts recognized in the consolidated balance sheet | | | | | | | | |
| Other long-term liabilities | | $ | (281,951 | ) | | $ | (241,911 | ) |
| Accumulated other comprehensive income | | $ | 374,157 | | | $ | 376,086 | |
| | | | | | | | | |
| | | Expected | | | | | | | | | | |
| ($ in thousands) | | 2010 | | | 2009 | | | 2008 | | | 2007 | |
| | | | | | | | | | | | | |
| Components of net periodic benefit cost | | | | | | | | | | | | |
| Service cost | | | | | $ | 6,098 | | | $ | 6,005 | | | $ | 9,175 | |
| Interest cost on projected benefit obligation | | | | | | 52,127 | | | | 52,851 | | | | 50,948 | |
| Expected return on plan assets | | | | | | (44,712 | ) | | | (65,256 | ) | | | (67,467 | ) |
| Amortization of prior service cost/(credit) | | | (199 | ) | | | (255 | ) | | | (255 | ) | | | (255 | ) |
| Amortization of unrecognized loss | | | 26,984 | | | | 27,144 | | | | 6,855 | | | | 7,313 | |
| Net periodic benefit cost/(income) | | | | | | | 40,402 | | | | 200 | | | | (286 | ) |
| Plan curtailment gain | | | | | | | - | | | | - | | | | (14,379 | ) |
| Special termination charge | | | | | | | 1,567 | | | | 1,662 | | | | 467 | |
| Total periodic benefit cost/(income) | | | | | | $ | 41,969 | | | $ | 1,862 | | | $ | (14,198 | ) |
| | | | | | | | | | | | | | | | | |
We capitalized $7.5 million, $0.0 million and $0.1 million of pension expense into the cost of our capital expenditures during the years ended December 31, 2009, 2008 and 2007, respectively, as the costs that relate to our engineering and plant construction activities.
Effective December 30, 2007, the CTE Employees’ Pension Plan was frozen for all non-union Commonwealth employees. No additional benefit accruals for service rendered subsequent to December 30, 2007 will occur for those participants. As a result of this plan change and in accordance with ASC Topic 715 (formerly SFAS No. 88, “Employers’ Accounting for Settlements and Curtailments of Defined Benefit Pension Plans and for Termination Benefits,”) a gain on pension curtailment of $14.4 million was recorded in 2007 and included in Other operating expenses in the consolidated statement of operations. Also, effective December 31, 2007, the CTE Employees’ Pension Plan was merged into the Frontier Pension Plan.
The plan’s weighted average asset allocations at December 31, 2009 and 2008 by asset category are as follows:
| | | 2009 | | | 2008 | |
Asset category: | | | | | | |
Equity securities | | | 38% | | | | 42% | |
Debt securities | | | 51% | | | | 48% | |
Alternative investments | | | 10% | | | | 9% | |
Cash and other | | | 1% | | | | 1% | |
Total | | | 100% | | | | 100% | |
The plan’s expected benefit payments over the next 10 years are as follows:
($ in thousands) | |
| | | | | |
| Year | | | Amount | |
| 2010 | | | $ | 60,820 | |
| 2011 | | | | 62,558 | |
| 2012 | | | | 64,929 | |
| 2013 | | | | 66,619 | |
| 2014 | | | | 67,179 | |
| | 2015 - 2019 | | | | 344,565 | |
| Total | | | $ | 666,670 | |
| | | | | | | |
No contributions were made to the plan during 2007, 2008 and 2009. We expect that we will make a $10.0 million cash contribution to our pension plan in 2010.
The accumulated benefit obligation for the plan was $876.5 million and $818.9 million at December 31, 2009 and 2008, respectively.
Assumptions used in the computation of annual pension costs and valuation of the year-end obligations were as follows:
| | | 2009 | | | 2008 | | | 2007 | |
| Discount rate - used at year end to value obligation | | | 5.75% | | | | 6.50% | | | | 6.50% | |
| Discount rate - used to compute annual cost | | | 6.50% | | | | 6.50% | | | | 6.00% | |
| Expected long-term rate of return on plan assets | | | 8.00% | | | | 8.25% | | | | 8.25% | |
| Rate of increase in compensation levels | | | 3.00% | | | | 3.00% | | | | 3.50% | |
Postretirement Benefits Other Than Pensions—“OPEB”
The following tables set forth the OPEB plan’s benefit obligations, fair values of plan assets and the postretirement benefit liability recognized on our consolidated balance sheets at December 31, 2009 and 2008 and the components of net periodic postretirement benefit costs for the years ended December 31, 2009, 2008 and 2007.
| | | | | | | |
| ($ in thousands) | | 2009 | | | 2008 | |
| | | | | | | |
| Change in benefit obligation | | | | | | |
| Benefit obligation at beginning of year | | $ | 178,615 | | | $ | 174,602 | |
| Service cost | | | 361 | | | | 444 | |
| Interest cost | | | 11,017 | | | | 11,255 | |
| Plan participants' contributions | | | 4,086 | | | | 3,753 | |
| Actuarial loss | | | 11,378 | | | | 3,917 | |
| Benefits paid | | | (16,167 | ) | | | (15,261 | ) |
| Plan change | | | - | | | | (95 | ) |
| Benefit obligation at end of year | | $ | 189,290 | | | $ | 178,615 | |
| | | | | | | | | |
| Change in plan assets | | | | | | | | |
| Fair value of plan assets at beginning of year | | $ | 8,137 | | | $ | 9,369 | |
| Actual return on plan assets | | | 1,018 | | | | 388 | |
| Plan participants' contributions | | | 4,086 | | | | 3,753 | |
| Employer contribution | | | 10,954 | | | | 9,888 | |
| Benefits paid | | | (16,167 | ) | | | (15,261 | ) |
| Fair value of plan assets at end of year | | $ | 8,028 | | | $ | 8,137 | |
| | | | | | | | | |
| Funded status | | $ | (181,262 | ) | | $ | (170,478 | ) |
| | | | | | | | | |
| Amounts recognized in the consolidated balance sheet | | | | | | | | |
| Current liabilities | | $ | (9,052 | ) | | $ | (8,916 | ) |
| Other long-term liabilities | | $ | (172,210 | ) | | $ | (161,562 | ) |
| Accumulated other comprehensive income | | $ | 21,554 | | | $ | 8,045 | |
| | | | | | | | | |
| ($ in thousands) | | Expected | | | | |
| | | 2010 | | | 2009 | | | 2008 | | | 2007 | |
| | | | | | | | | | | | | |
| Components of net periodic postretirement benefit cost | | | | | | | | | | | | |
| Service cost | | | | | $ | 361 | | | $ | 444 | | | $ | 533 | |
| Interest cost on projected benefit obligation | | | | | | 11,017 | | | | 11,255 | | | | 10,241 | |
| Expected return on plan assets | | | | | | (439 | ) | | | (514 | ) | | | (578 | ) |
| Amortization of prior service cost/(credit) | | | (7,716 | ) | | | (7,751 | ) | | | (7,751 | ) | | | (7,735 | ) |
| Amortization of unrecognized loss | | | 6,324 | | | | 5,041 | | | | 5,946 | | | | 6,099 | |
| Net periodic postretirement benefit cost | | | | | | $ | 8,229 | | | $ | 9,380 | | | $ | 8,560 | |
| | | | | | | | | | | | | | | | | |
| | | | | | | | | | | | | | | | | |
Assumptions used in the computation of annual OPEB costs and valuation of the year-end OPEB obligations were as follows:
| | | 2009 | | | 2008 | | | 2007 | |
| Discount rate - used at year end to value obligation | | | 5.75% | | | | 6.50% | | | | 6.50% | |
| Discount rate - used to compute annual cost | | | 6.50% | | | | 6.50% | | | | 6.00% | |
| Expected long-term rate of return on plan assets | | | 6.00% | | | | 6.00% | | | | 6.00% | |
The plan’s weighted average asset allocations at December 31, 2009 and 2008 by asset category are as follows:
| | | | |
| | 2009 | | 2008 |
| Asset category: | | | |
| Equity securities | 0% | | 0% |
| Debt securities | 100% | | 100% |
| Cash and other | 0% | | 0% |
| Total | 100% | | 100% |
| | | | |
The plan’s expected benefit payments over the next 10 years are as follows:
| | | | | | | | | | | |
| ($ in thousands) | | | | | | | |
| | | | Gross | | | Medicare Part D | | | | |
| Year | | | Benefits | | | Subsidy | | | Total | |
| 2010 | | | $ | 13,266 | | | $ | 461 | | | $ | 12,805 | |
| 2011 | | | | 13,798 | | | | 529 | | | | 13,269 | |
| 2012 | | | | 13,961 | | | | 642 | | | | 13,319 | |
| 2013 | | | | 14,300 | | | | 742 | | | | 13,558 | |
| 2014 | | | | 14,510 | | | | 850 | | | | 13,660 | |
| | 2015 - 2019 | | | | 75,185 | | | | 5,786 | | | | 69,399 | |
| Total | | | $ | 145,020 | | | $ | 9,010 | | | $ | 136,010 | |
| | | | | | | | | | | | | | | |
Our expected contribution to the plan in 2010 is $12.8 million.
For purposes of measuring year-end benefit obligations, we used, depending on medical plan coverage for different retiree groups, a 8.5% annual rate of increase in the per-capita cost of covered medical benefits, gradually decreasing to 5% in the year 2017 and remaining at that level thereafter. The effect of a 1% increase in the assumed medical cost trend rates for each future year on the aggregate of the service and interest cost components of the total postretirement benefit cost would be $0.7 million and the effect on the accumulated postretirement benefit obligation for health benefits would be $12.3 million. The effect of a 1% decrease in the assumed medical cost trend rates for each future year on the aggregate of the service and interest cost components of the total postretirement benefit cost would be $(0.6) million and the effect on the accumulated postretirement benefit obligation for health benefits would be $(10.7) million.
In December 2003, the Medicare Prescription Drug Improvement and Modernization Act of 2003 (the Act) became law. The Act introduced a prescription drug benefit under Medicare. It includes a federal subsidy to sponsors of retiree health care benefit plans that provide a benefit that is at least actuarially equivalent to the Medicare Part D benefit. The amount of the federal subsidy is based on 28% of an individual beneficiary’s annual eligible prescription drug costs ranging between $250 and $5,000. We have determined that the Company-sponsored postretirement healthcare plans that provide prescription drug benefits are actuarially equivalent to the Medicare Prescription Drug benefit. The impact of the federal subsidy has been incorporated into the calculation.
The amounts in accumulated other comprehensive income that have not yet been recognized as components of net periodic benefit cost at December 31, 2009 and 2008 are as follows:
| ($ in thousands) | | Pension Plan | | | OPEB | |
| | | 2009 | | | 2008 | | | 2009 | | | 2008 | |
| Net actuarial loss | | $ | 374,390 | | | $ | 377,183 | | | $ | 53,010 | | | $ | 47,252 | |
| Prior service cost/(credit) | | | (233 | ) | | | (1,097 | ) | | | (31,456 | ) | | | (39,207 | ) |
| Total | | $ | 374,157 | | | $ | 376,086 | | | $ | 21,554 | | | $ | 8,045 | |
| | | | | | | | | | | | | | | | | |
The amounts recognized as a component of accumulated comprehensive income for the years ended December 31, 2009 and 2008 are as follows:
| | | Pension Plan | | | OPEB | |
| ($ in thousands) | | 2009 | | | 2008 | | | 2009 | | | 2008 | |
| | | | | | | | | | | | | |
| Accumulated other comprehensive income at | | | | | | | | | | | | |
| beginning of year | | $ | 376,086 | | | $ | 134,276 | | | $ | 8,045 | | | $ | 2,292 | |
| Net actuarial gain (loss) recognized during year | | | (27,144 | ) | | | (6,855 | ) | | | (5,041 | ) | | | (5,946 | ) |
| Prior service (cost)/credit recognized during year | | | 255 | | | | 255 | | | | 7,751 | | | | 7,751 | |
| Net actuarial loss (gain) occurring during year | | | 24,351 | | | | 248,410 | | | | 10,799 | | | | 4,043 | |
| Prior service cost (credit) occurring during year | | | 609 | | | | - | | | | - | | | | (95 | ) |
| Net amount recognized in comprehensive income | | | | | | | | | | | | | | | | |
| for the year | | | (1,929 | ) | | | 241,810 | | | | 13,509 | | | | 5,753 | |
| Accumulated other comprehensive income at end | | | | | | | | | | | | | | | | |
| of year | | $ | 374,157 | | | $ | 376,086 | | | $ | 21,554 | | | $ | 8,045 | |
| | | | | | | | | | | | | | | | | |
401(k) Savings Plans
We sponsor employee retirement savings plans under section 401(k) of the Internal Revenue Code. The plans cover substantially all full-time employees. Under the plans, we provide matching contributions and also provide certain profit-sharing contributions to certain employees upon the attainment of pre-established financial criteria. Employer contributions were $4.4 million, $5.0 million and $4.9 million for 2009, 2008 and 2007, respectively. The amount for 2007 includes employer contributions of $0.4 million for CTE employees under a separate Commonwealth plan. Also, effective December 31, 2007, the Commonwealth Builder 401(k) Plan was merged into the Frontier 401(k) Savings Plan.
| (20) | Fair Value of Financial Instruments: |
In September 2006, the FASB issued ASC Topic 820 (formerly SFAS No. 157, “Fair Value Measurements”), which establishes a framework for measuring fair value in accordance with generally accepted accounting principles in the United States and expands disclosure requirements about fair value measurements. ASC Topic 820 was effective for financial statements issued for fiscal years beginning after November 15, 2007. We adopted ASC Topic 820 effective January 1, 2008, for all financial assets and financial liabilities, as required.
Fair value is defined under ASC Topic 820 as the exit price associated with the sale of an asset or transfer of a liability in an orderly transaction between market participants at the measurement date. Valuation techniques used to measure fair value under ASC Topic 820 must maximize the use of observable inputs and minimize the use of unobservable inputs. In addition, ASC Topic 820 establishes a three-tier fair value hierarchy, which prioritizes the inputs used in measuring fair value.
FRONTIER COMMUNICATIONS CORPORATION AND SUBSIDIARIES
Notes to Consolidated Financial Statements
The following table represents the Company’s pension plan assets measured at fair value on a recurring basis:
| | Fair Value Measurements at December 31, 2009 | |
| | | | | | Quoted | | | Significant | | | | |
| | | | | | Prices in Active | | | Other | | | Significant | |
| | | | | | Markets for | | | Observable | | | Unobservable | |
| | | | | | Identical Assets | | | Inputs | | | Inputs | |
| | | Total | | | (Level 1) | | | (Level 2) | | | (Level 3) | |
Cash and Cash Equivalents | | $ | 23,202 | | | $ | - | | | $ | 23,202 | | | $ | - | |
U.S. Government Obligations | | | 85,255 | | | | - | | | | 85,255 | | | | - | |
Corporate and Other Obligations | | | 200,671 | | | | - | | | | 200,671 | | | | - | |
Common Stock | | | 67,571 | | | | 67,571 | | | | - | | | | - | |
Commingled Funds | | | 36,120 | | | | - | | | | 22,198 | | | | 13,922 | |
Common/Collective Trust Funds | | | 29,799 | | | | - | | | | 29,799 | | | | - | |
Interest in Registered Investment Companies | | | 139,929 | | | | 59,564 | | | | 80,365 | | | | - | |
Interest in Limited Partnerships | | | 29,727 | | | | - | | | | - | | | | 29,727 | |
Insurance Contracts | | | 900 | | | | - | | | | 900 | | | | - | |
Other | | | (75 | ) | | | - | | | | (75 | ) | | | - | |
Total investments, at fair value | | $ | 613,099 | | | $ | 127,135 | | | $ | 442,315 | | | $ | 43,649 | |
Interest and Dividends Receivable | | | 1,872 | | | | | | | | | | | | | |
Due from Broker for Securities Sold | | | 36,715 | | | | | | | | | | | | | |
Receivable Associated with Insurance Contract | | | 6,284 | | | | | | | | | | | | | |
Due to Broker for Securities Purchased | | | (49,345 | ) | | | | | | | | | | | | |
Total Plan Assets, at Fair Value | | $ | 608,625 | | | | | | | | | | | | | |
The table below sets forth a summary of changes in the fair value of the Plan’s Level 3 assets:
| | | For the year ended December 31, 2009 |
| | | Interest in | | | | |
| | | Limited | | | Commingled | |
| | | Partnerships | | | Funds | |
Balance, beginning of year | | $ | 28,924 | | | $ | 12,515 | |
Realized gains/(losses) | | | (2,475 | ) | | | - | |
Unrealized gains | | | 3,786 | | | | 1,407 | |
Purchases and (sales), net | | | (508 | ) | | | - | |
Balance, end of year | | $ | 29,727 | | | $ | 13,922 | |
| | | | | | | | | |
The fair value of our OPEB plan assets, which are measured using Level 1 inputs, was $8.0 million as of December 31, 2009.
FRONTIER COMMUNICATIONS CORPORATION AND SUBSIDIARIES
Notes to Consolidated Financial Statements
The following table summarizes the carrying amounts and estimated fair values for certain of our financial instruments at December 31, 2009 and 2008. For the other financial instruments, representing cash, accounts receivables, long-term debt due within one year, accounts payable and other accrued liabilities, the carrying amounts approximate fair value due to the relatively short maturities of those instruments. Other equity method investments for which market values are not readily available are carried at cost, which approximates fair value.
| ($ in thousands) | | 2009 | | | 2008 | |
| | | Carrying | | | | | | Carrying | | | | |
| | | Amount | | | Fair Value | | | Amount | | | Fair Value | |
| Long-term debt | | $ | 4,794,129 | | | $ | 4,628,132 | | | $ | 4,721,685 | | | $ | 3,651,924 | |
| | | | | | | | | | | | | | | | | |
| (21) | Commitments and Contingencies: |
On June 24, 2004, one of our subsidiaries, Frontier Subsidiary Telco, Inc., received a “Notice of Indemnity Claim” from Citibank, N.A., that was related to a case pending against Citibank and others in the U.S. Bankruptcy Court for the Southern District of New York as part of the Global Crossing bankruptcy proceeding. The case against Citibank and others has been settled with no contribution from the Company and no further indemnification claims are expected.
We are party to various other legal proceedings arising in the normal course of our business. The outcome of individual matters is not predictable. However, we believe that the ultimate resolution of all such matters, after considering insurance coverage, will not have a material adverse effect on our financial position, results of operations, or our cash flows.
We anticipate capital expenditures related to our currently owned properties of approximately $220.0 million to $240.0 million for 2010. Although we from time to time make short-term purchasing commitments to vendors with respect to these expenditures, we generally do not enter into firm, written contracts for such activities.
In connection with the Verizon Transaction, the Company has commenced activities to obtain the necessary regulatory approvals, plan and implement systems conversions and other initiatives necessary to effectuate the closing, which is expected to occur during the second quarter of 2010, and enable the Company to implement its “go to market” strategy at closing. While the Company continues to evaluate certain other expenses, the Company currently expects to incur operating expenses and capital expenditures of approximately $100.0 million and $75.0 million, respectively, in 2010 related to these integration initiatives. The Company incurred $28.3 million of acquisition and integration costs and $25.0 million in capital expenditures related to the integration of Verizon activities during 2009.
We conduct certain of our operations in leased premises and also lease certain equipment and other assets pursuant to operating leases. The lease arrangements have terms ranging from 1 to 99 years and several contain rent escalation clauses providing for increases in monthly rent at specific intervals. When rent escalation clauses exist, we record annual rental expense based on the total expected rent payments on a straight-line basis over the lease term. Certain leases also have renewal options. Renewal options that are reasonably assured are included in determining the lease term. Future minimum rental commitments for all long-term noncancelable operating leases as of December 31, 2009 are as follows:
| ($ in thousands) | | Operating | |
| | | Leases | |
| | | | |
| Year ending December 31: | | | |
| 2010 | | $ | 24,417 | |
| 2011 | | | 11,627 | |
| 2012 | | | 8,407 | |
| 2013 | | | 7,107 | |
| 2014 | | | 5,796 | |
| Thereafter | | | 6,934 | |
| Total minimum lease payments | | $ | 64,288 | |
| | | | | |
Total rental expense included in our consolidated statements of operations for the years ended December 31, 2009, 2008 and 2007 was $25.9 million, $24.3 million and $23.6 million, respectively.
We are a party to contracts with several unrelated long distance carriers. The contracts provide fees based on traffic they carry for us subject to minimum monthly fees.
At December 31, 2009, the estimated future payments for obligations under our noncancelable long distance contracts and service agreements are as follows:
($ in thousands) | |
| | | | |
| Year | | Amount | |
| 2010 | | $ | 11,026 | |
| 2011 | | | 6,407 | |
| 2012 | | | 4,421 | |
| 2013 | | | 4,125 | |
| 2014 | | | 4,125 | |
| Thereafter | | | 165 | |
| Total | | $ | 30,269 | |
| | | | | |
We sold all of our utility businesses as of April 1, 2004. However, we have retained a potential payment obligation associated with our previous electric utility activities in the State of Vermont. The Vermont Joint Owners (VJO), a consortium of 14 Vermont utilities, including us, entered into a purchase power agreement with Hydro-Quebec in 1987. The agreement contains “step-up” provisions that state that if any VJO member defaults on its purchase obligation under the contract to purchase power from Hydro-Quebec, then the other VJO participants will assume responsibility for the defaulting party’s share on a pro-rata basis. Our pro-rata share of the purchase power obligation is 10%. If any member of the VJO defaults on its obligations under the Hydro-Quebec agreement, then the remaining members of the VJO, including us, may be required to pay for a substantially larger share of the VJO’s total power purchase obligation for the remainder of the agreement (which runs through 2015). U.S. GAAP rules require that we disclose “the maximum potential amount of future payments (undiscounted) the guarantor could be required to make under the guarantee.” U.S. GAAP rules also state that we must make such disclosure “… even if the likelihood of the guarantor’s having to make any payments under the guarantee is remote…” As noted above, our obligation only arises as a result of default by another VJO member, such as upon bankruptcy. Therefore, to satisfy the “maximum potential amount” disclosure requirement we must assume that all members of the VJO simultaneously default, a highly unlikely scenario given that the two members of the VJO that have the largest potential payment obligations are publicly traded with credit ratings equal to or superior to ours, and that all VJO members are regulated utility providers with regulated cost recovery. Despite the remote chance that such an event could occur, or that the State of Vermont could or would allow such an event, assuming that all the members of the VJO defaulted on January 1, 2010 and remained in default for the duration of the contract (another 6 years), we estimate that our undiscounted purchase obligation for 2010 through 2015 would be approximately $0.6 billion. In such a scenario the Company would then own the power and could seek to recover its costs. We would do this by seeking to recover our costs from the defaulting members and/or reselling the power to other utility providers or the northeast power grid. There is an active market for the sale of power. We could potentially lose money if we were unable to sell the power at cost. We caution that we cannot predict with any degree of certainty any potential outcome.
At December 31, 2009, we have outstanding performance letters of credit as follows:
($ in thousands) | | | |
| | | | |
CNA | | $ | 26,618 | |
State of New York | | | 1,042 | |
Total | | $ | 27,660 | |
| | | | | |
CNA serves as our agent with respect to general liability claims (auto, workers compensation and other insured perils of the Company). As our agent, they administer all claims and make payments for claims on our behalf. We reimburse CNA for such services upon presentation of their invoice. To serve as our agent and make payments on our behalf, CNA requires that we establish a letter of credit in their favor. CNA could potentially draw against this letter of credit if we failed to reimburse CNA in accordance with the terms of our agreement. The value of the letter of credit is reviewed annually and adjusted based on claims history.
None of the above letters of credit restrict our cash balances.