
Investor Update
First Quarter 2011
May 5, 2011

2
Safe Harbor Statement
Forward-Looking Language
This document contains forward-looking statements that are subject to risks and uncertainties that could cause actual results to differ materially from those expressed or implied in
the financial statements. Statements that are not historical facts are forward-looking statements made pursuant to the safe harbor provisions of the Private Securities Litigation
Reform Act of 1995. Words such as “believe,” “anticipate,” “expect” and similar expressions are intended to identify forward-looking statements. Forward-looking statements
(including oral representations) are only predictions or statements of current plans, which we review continuously. Forward-looking statements may differ from actual future results
due to, but not limited to, and our future results may be materially affected by, potential risks or uncertainties. You should understand that it is not possible to predict or identify all
potential risks or uncertainties. We note the following as a partial list: our ability to successfully integrate the operations of the acquired business into Frontier’s existing operations;
the risk that the growth opportunities and cost synergies from the transaction may not be fully realized or may take longer to realize than expected; our indemnity obligation to
Verizon for taxes which may be imposed upon them as a result of changes in ownership of our stock may discourage, delay or prevent a third party from acquiring control of us
during the two-year period ending July 2012 in a Transaction that stockholders might consider favorable; the effects of increased expenses incurred due to activities related to the
transaction and the integration of the Acquired Business; our ability to maintain relationships with customers, employees or suppliers; the effects of greater than anticipated
competition requiring new pricing, marketing strategies or new product or service offerings and the risk that we will not respond on a timely or profitable basis; reductions in the
number of our access lines that cannot be offset by increases in HSI subscribers and sales of other products and services; the effects of ongoing changes in the regulation of the
communications industry as a result of federal and state legislation and regulation, or changes in the enforcement or interpretation of such legislation and regulation; the effects of
changes in the availability of federal and state universal funding to us and our competitors; the effects of competition from cable, wireless and other wireline carriers; our ability to
adjust successfully to changes in the communications industry and to implement strategies for growth; adverse changes in the credit markets or in the ratings given to our debt
securities by nationally accredited ratings organizations, which could limit or restrict the availability, or increase the cost, of financing; continued reductions in switched access
revenues as a result of regulation, competition or technology substitutions; our ability to effectively manage service quality in our territories and meet mandated service quality
metrics; our ability to successfully introduce new product offerings, including our ability to offer bundled service packages on terms that are both profitable to us and attractive to
customers; changes in accounting policies or practices adopted voluntarily or as required by generally accepted accounting principles or regulations; our ability to effectively
manage our operations, operating expenses and capital expenditures, and to repay, reduce or refinance our debt; the effects of changes in both general and local economic
conditions on the markets that we serve, which can affect demand for our products and services, customer purchasing decisions, collectability of revenues and required levels of
capital expenditures related to new construction of residences and businesses; the effects of customer bankruptcies and home foreclosures, which could result in difficulty in
collection of revenues and loss of customers; the effects of technological changes and competition on our capital expenditures and product and service offerings, including the lack
of assurance that our network improvements will be sufficient to meet or exceed the capabilities and quality of competing networks; the effects of increased medical, retiree and
pension expenses and related funding requirements; changes in income tax rates, tax laws, regulations or rulings, or federal or state tax assessments; the effects of state
regulatory cash management practices that could limit our ability to transfer cash among our subsidiaries or dividend funds up to the parent company; our ability to successfully
renegotiate union contracts expiring in 2011 and thereafter; declines in the value of our pension plan assets, which would require us to make increased contributions to the pension
plan in 2011 and beyond; limitations on the amount of capital stock that we can issue to make acquisitions or to raise additional capital until July 2012; our ability to pay dividends
on our common shares, which may be affected by our cash flow from operations, amount of capital expenditures, debt service requirements, cash paid for income taxes and
liquidity; the effects of any unfavorable outcome with respect to any current or future legal, governmental or regulatory proceedings, audits or disputes; and the effects of severe
weather events such as hurricanes, tornados, ice storms or other natural or man-made disasters. These and other uncertainties related to our business are described in greater
detail in our filings with the Securities and Exchange Commission, including our reports on Forms 10-K and 10-Q, and the foregoing information should be read in conjunction with
these filings. We undertake no obligation to publicly update or revise any forward-looking statements or to make any other forward-looking statement, whether as a result of new
information, future events or otherwise unless required to do so by securities laws.

3
Non-GAAP Financial Measures
The Company uses certain non-GAAP financial measures in evaluating its performance. These include free cash flow, EBITDA or “operating cash flow”, which
we define as operating income plus depreciation and amortization (“EBITDA”), and Adjusted EBITDA; a reconciliation of the differences between EBITDA and
free cash flow and the most comparable financial measures calculated and presented in accordance with GAAP is included in the appendix. The non-GAAP
financial measures are by definition not measures of financial performance under generally accepted accounting principles and are not alternatives to operating
income or net income reflected in the statement of operations or to cash flow as reflected in the statement of cash flows and are not necessarily indicative of
cash available to fund all cash flow needs. The non-GAAP financial measures used by the Company may not be comparable to similarly titled measures of
other companies.
The Company believes that the presentation of non-GAAP financial measures provides useful information to investors regarding the Company’s financial
condition and results of operations because these measures, when used in conjunction with related GAAP financial measures, (i) together provide a more
comprehensive view of the Company’s core operations and ability to generate cash flow, (ii) provide investors with the financial analytical framework upon
which management bases financial, operational, compensation and planning decisions and (iii) presents measurements that investors and rating agencies
have indicated to management are useful to them in assessing the Company and its results of operations. Management uses these non-GAAP financial
measures to plan and measure the performance of its core operations, and its divisions measure performance and report to management based upon these
measures. In addition, the Company believes that free cash flow and EBITDA, as the Company defines them, can assist in comparing performance from period
to period, without taking into account factors affecting cash flow reflected in the statement of cash flows, including changes in working capital and the timing of
purchases and payments.
The Company has shown adjustments to its financial presentations to exclude $13.2 million, $10.4 million, $78.5 million and $11.3 million of acquisition and
integration costs in the quarters ended March 31, 2011 and 2010, September 30, 2010 and December 31, 2010, respectively, $11.3 million, $7.3 million, $12.1
million and $15.8 million of non-cash pension and other postretirement benefit costs in the quarters ended March 31, 2011 and 2010, September 30, 2010 and
December 31, 2010, respectively, and $0.1 million, $0.1 million, $6.9 million and $2.7 million of severance and early retirement costs in the quarters ended
March 31, 2011 and 2010, September 30,2010 and December 31, 2010, respectively, because investors have indicated to management that such adjustments
are useful to them in assessing the Company and its results of operations.
Management uses these non-GAAP financial measures to (i) assist in analyzing the Company’s underlying financial performance from period to period, (ii)
evaluate the financial performance of its business units, (iii) analyze and evaluate strategic and operational decisions, (iv) establish criteria for compensation
decisions, and (v) assist management in understanding the Company’s ability to generate cash flow and, as a result, to plan for future capital and operational
decisions. Management uses these non-GAAP financial measures in conjunction with related GAAP financial measures. These non-GAAP financial measures
have certain shortcomings. In particular, free cash flow does not represent the residual cash flow available for discretionary expenditures, since items such as
debt repayments and dividends are not deducted in determining such measure. EBITDA has similar shortcomings as interest, income taxes, capital
expenditures, debt repayments and dividends are not deducted in determining this measure. Management compensates for the shortcomings of these
measures by utilizing them in conjunction with their comparable GAAP financial measures. The information in this document should be read in conjunction with
the financial statements and footnotes contained in our documents filed with the U.S. Securities and Exchange Commission.

4
2011 First Quarter Summary
● Increased broadband availability to 83,000 new homes
● Increased broadband availability to 83,000 new homes
● Ramped broadband net additions to 10,500 despite a net
loss of 5,000 FiOS data subscribers
loss of 5,000 FiOS data subscribers
● Ramped broadband net additions to 10,500 despite a net
loss of 5,000 FiOS data subscribers
loss of 5,000 FiOS data subscribers
● Quarterly revenue loss rate stabilizing, with positive
sequential commercial growth
sequential commercial growth
● Quarterly revenue loss rate stabilizing, with positive
sequential commercial growth
sequential commercial growth
● Reduced operating expenses by $16M sequentially;
adjusted EBITDA margin expanded 70 bps to 46.5%
adjusted EBITDA margin expanded 70 bps to 46.5%
● Reduced operating expenses by $16M sequentially;
adjusted EBITDA margin expanded 70 bps to 46.5%
adjusted EBITDA margin expanded 70 bps to 46.5%
● Balanced stakeholder commitments: dividend payout
ratio 74%, net leverage ratio 3.0x
ratio 74%, net leverage ratio 3.0x
● Balanced stakeholder commitments: dividend payout
ratio 74%, net leverage ratio 3.0x
ratio 74%, net leverage ratio 3.0x

5
Quarterly Snapshot
Notes: 1) Total revenues including Switched Access & Subsidy. 2) Customer revenue is defined as total revenue less access services. Access services include switched
network access and subsidies. 3) Represents Operating Cash Flow (EBITDA), as adjusted. 4) Capital expenditures exclude integration capital expenditures related to the
Acquired Properties. 5) Free cash flow as defined by Frontier, and excluding acquisition and integration costs and capex. 6) Pro forma. Please see Non-GAAP
Reconciliations in Appendix.

6
Business Update
● Improving our network, customer engagement,
products & services, revenues, and cost structure
products & services, revenues, and cost structure
● Improving our network, customer engagement,
products & services, revenues, and cost structure
products & services, revenues, and cost structure
● Commercial revenues +2.1% sequentially in 1Q11 on
high-capacity data sales to enterprise clients and
expanded equipment sales. Doubled the size of our
Small/Mid salesforce to continue commercial traction
high-capacity data sales to enterprise clients and
expanded equipment sales. Doubled the size of our
Small/Mid salesforce to continue commercial traction
● Promos are working. Call center performance
metrics in the Acquired Properties have improved
significantly. We’re focused on first call resolution
and selling value-added products.
metrics in the Acquired Properties have improved
significantly. We’re focused on first call resolution
and selling value-added products.
● On track for next 4 state conversions in early 4Q
representing 33% of the acquired lines
representing 33% of the acquired lines
● On track for next 4 state conversions in early 4Q
representing 33% of the acquired lines
representing 33% of the acquired lines
Execution
Execution
Commercial
Commercial
Residential
Residential
Integration
Integration
7
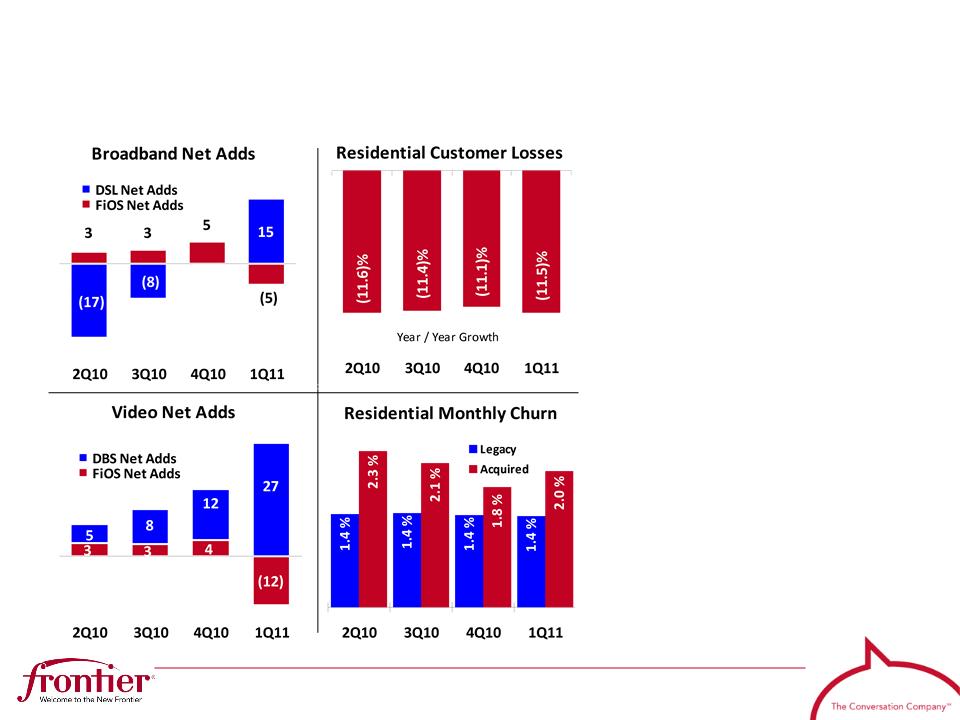
Key Metrics
● Strong turnaround in
broadband net adds
broadband net adds
● Strong turnaround in
broadband net adds
broadband net adds
● Video driving higher
bundles
bundles
● Video driving higher
bundles
bundles
● Customer losses
expected to improve
on expanded
broadband and lower
FiOS churn
expected to improve
on expanded
broadband and lower
FiOS churn
● Customer losses
expected to improve
on expanded
broadband and lower
FiOS churn
expected to improve
on expanded
broadband and lower
FiOS churn
● FiOS caused churn to
increase to 2.0% in
acquired properties;
churn in Legacy down
to 1.35%
increase to 2.0% in
acquired properties;
churn in Legacy down
to 1.35%
● FiOS caused churn to
increase to 2.0% in
acquired properties;
churn in Legacy down
to 1.35%
increase to 2.0% in
acquired properties;
churn in Legacy down
to 1.35%
Notes: Comparisons to amounts prior to 7/1/10 are pro forma for the Acquired Properties. Subscriber units in 000s
Notes: Comparisons to amounts prior to 7/1/10 are pro forma for the Acquired Properties. Subscriber units in 000s
8
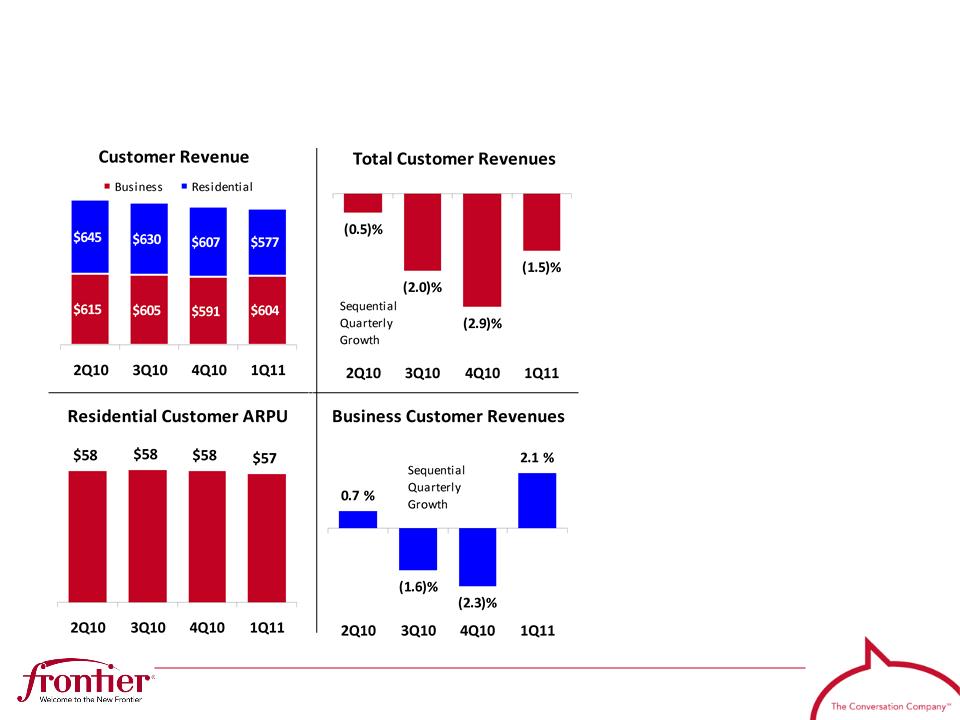
Revenues
● Business &
Broadband = 64% of
Q1 customer revenue
Broadband = 64% of
Q1 customer revenue
● Business &
Broadband = 64% of
Q1 customer revenue
Broadband = 64% of
Q1 customer revenue
● Stable ARPU should
improve on expanding
products per
customer
improve on expanding
products per
customer
● Stable ARPU should
improve on expanding
products per
customer
improve on expanding
products per
customer
● Revenue impacted by
promotions and
increased penetration
of unlimited LD
packages
promotions and
increased penetration
of unlimited LD
packages
● Revenue impacted by
promotions and
increased penetration
of unlimited LD
packages
promotions and
increased penetration
of unlimited LD
packages
● Regulatory revenue
only 10% of total 1
only 10% of total 1
● Regulatory revenue
only 10% of total 1
only 10% of total 1
Notes: $ Millions; 1) Regulatory revenue excludes Surcharges, which are passed on to customers.
Notes: $ Millions; 1) Regulatory revenue excludes Surcharges, which are passed on to customers.

9
Cash Operating Expenses
Notes: $ Millions; 2Q10 data is pro forma and reflects the cost structure prior to FTR’s acquisition on 7/1/10.
Please see Non-GAAP reconciliations in Appendix.
Please see Non-GAAP reconciliations in Appendix.
Notes: $ Millions; 2Q10 data is pro forma and reflects the cost structure prior to FTR’s acquisition on 7/1/10.
Please see Non-GAAP reconciliations in Appendix.
Please see Non-GAAP reconciliations in Appendix.

10
Operating Expenses
● $16M incremental
synergies in 1Q11
synergies in 1Q11
● $16M incremental
synergies in 1Q11
synergies in 1Q11
● $92M synergies for
1Q11, or $368M
annualized
1Q11, or $368M
annualized
● $92M synergies for
1Q11, or $368M
annualized
1Q11, or $368M
annualized
● Full confidence in
$550M target at end of
2012 fiscal year
$550M target at end of
2012 fiscal year
● Full confidence in
$550M target at end of
2012 fiscal year
$550M target at end of
2012 fiscal year
● Continued focus and
discipline on synergy
list and other areas of
cost control
discipline on synergy
list and other areas of
cost control
● Continued focus and
discipline on synergy
list and other areas of
cost control
discipline on synergy
list and other areas of
cost control
Notes: $ Millions; 2Q10 data is pro forma and reflects the cost structure prior to FTR’s acquisition on 7/1/10.
Notes: $ Millions; 2Q10 data is pro forma and reflects the cost structure prior to FTR’s acquisition on 7/1/10.

11
Cash Flow
● Adjusted EBITDA
margins expanded 70
bps to 46.5%
margins expanded 70
bps to 46.5%
● Adjusted EBITDA
margins expanded 70
bps to 46.5%
margins expanded 70
bps to 46.5%
● Dividend payout ratio
is higher as expected
on aggressive 2011
capital deployment
for broadband
is higher as expected
on aggressive 2011
capital deployment
for broadband
● Dividend payout ratio
is higher as expected
on aggressive 2011
capital deployment
for broadband
is higher as expected
on aggressive 2011
capital deployment
for broadband
● 1Q11 FCF improved
on lower expenses
and capex
on lower expenses
and capex
● 1Q11 FCF improved
on lower expenses
and capex
on lower expenses
and capex
Notes: $ Millions; 2Q10 pro forma for the 7/1/10 acquisition; (1) See Appendix for calculation of Adjusted
FCF and operating cash flow (EBITDA).
FCF and operating cash flow (EBITDA).
Notes: $ Millions; 2Q10 pro forma for the 7/1/10 acquisition; (1) See Appendix for calculation of Adjusted
FCF and operating cash flow (EBITDA).
FCF and operating cash flow (EBITDA).

12
Capital Expenditures
● Expanded network to
reach 323,000 homes
since closing on
7/1/2010 1
reach 323,000 homes
since closing on
7/1/2010 1
● Expanded network to
reach 323,000 homes
since closing on
7/1/2010 1
reach 323,000 homes
since closing on
7/1/2010 1
● Broadband expansion
and magnitude of
capex on schedule
and budget
and magnitude of
capex on schedule
and budget
● Broadband expansion
and magnitude of
capex on schedule
and budget
and magnitude of
capex on schedule
and budget
● By 2013, expect capex
to fall to
approximately 11% of
revenues
to fall to
approximately 11% of
revenues
● By 2013, expect capex
to fall to
approximately 11% of
revenues
to fall to
approximately 11% of
revenues
Notes: $ Millions; 2Q10 pro forma for the 7/1/10 acquisition; (1) Network built to approximately 30k and
210k new homes in 3Q10 and 4Q10, respectively.
210k new homes in 3Q10 and 4Q10, respectively.
Notes: $ Millions; 2Q10 pro forma for the 7/1/10 acquisition; (1) Network built to approximately 30k and
210k new homes in 3Q10 and 4Q10, respectively.
210k new homes in 3Q10 and 4Q10, respectively.

13
Credit & Liquidity
● Over $1B of liquidity
● Over $1B of liquidity
● Deleveraged almost a
full point; 2.5x target
full point; 2.5x target
● Deleveraged almost a
full point; 2.5x target
full point; 2.5x target
● Manageable 2011
maturities of $279M
maturities of $279M
● Manageable 2011
maturities of $279M
maturities of $279M
● Stable interest
expense with
weighted average
cost 8.0%; fixed rate
debt is 97% of total,
no swaps
expense with
weighted average
cost 8.0%; fixed rate
debt is 97% of total,
no swaps
● Stable interest
expense with
weighted average
cost 8.0%; fixed rate
debt is 97% of total,
no swaps
expense with
weighted average
cost 8.0%; fixed rate
debt is 97% of total,
no swaps
Notes: $ Millions; 1Q10 pro forma for the 7/1/10 acquisition; (1) Excludes $72.4M of escrow cash.
Notes: $ Millions; 1Q10 pro forma for the 7/1/10 acquisition; (1) Excludes $72.4M of escrow cash.
14
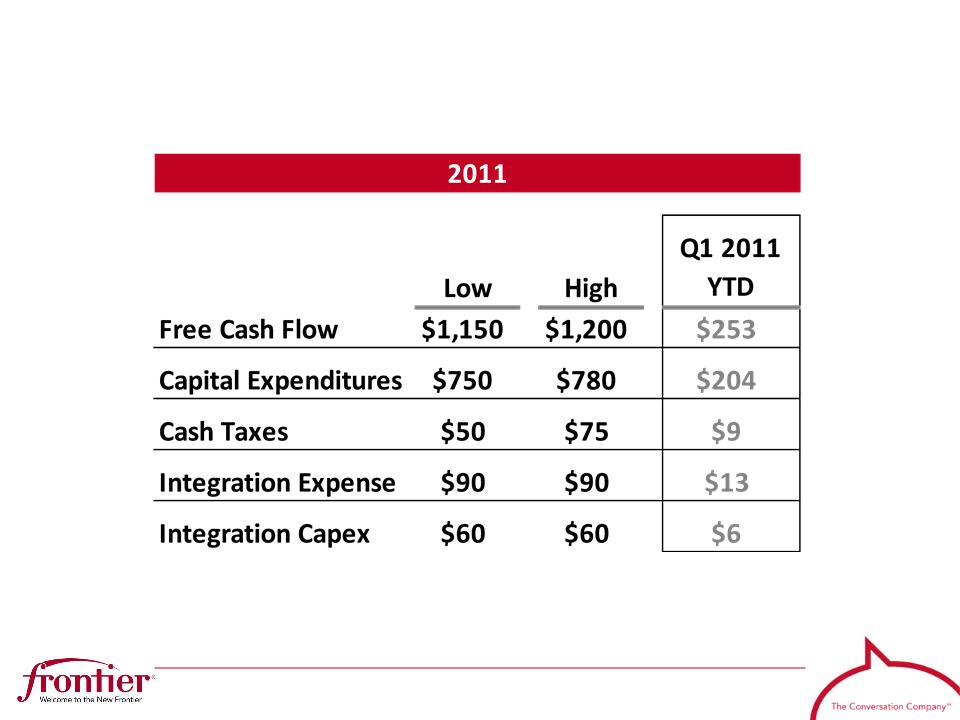
Guidance
Notes: $ Millions. See Appendix for calculation of Adjusted Free Cash Flow.
Notes: $ Millions. See Appendix for calculation of Adjusted Free Cash Flow.

15
Appendix

16
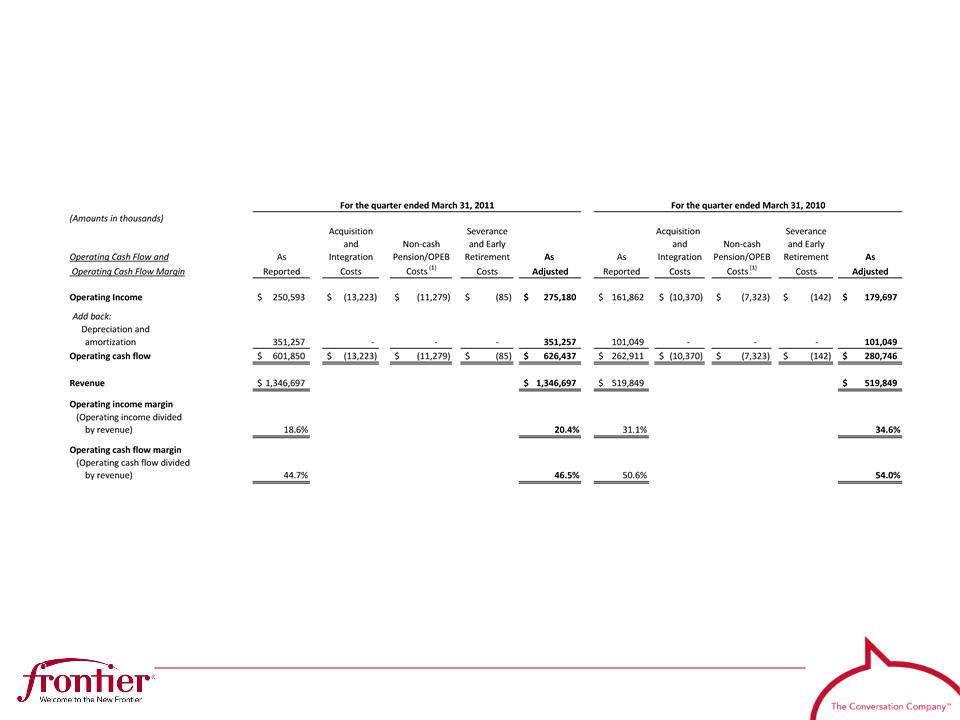
Reconciliation of Non-GAAP Financial Measures
1) Includes pension and other
postretirement benefit (OPEB)
expense, net of capitalized amounts,
of $15.9 million and $9.6 million for
the quarters ended March 31, 2011
and 2010, respectively, less cash
pension contributions and certain
OPEB costs of $4.6 million and $2.3
million for the quarters ended
March 31, 2011 and 2010,
respectively.
2) Excludes capital expenditures for
integration activities.
integration activities.
2) Excludes capital expenditures for
integration activities.
integration activities.
17
Reconciliation of Non-GAAP Financial Measures
1) Includes pension and other postretirement benefit (OPEB) expense, net of capitalized amounts, of $15.9 million and $9.6 million for the quarters
ended March 31, 2011 and 2010, respectively, less cash pension contributions and certain OPEB costs of $4.6 million and $2.3 million for the quarters
ended March 31, 2011 and 2010, respectively.
ended March 31, 2011 and 2010, respectively, less cash pension contributions and certain OPEB costs of $4.6 million and $2.3 million for the quarters
ended March 31, 2011 and 2010, respectively.
18
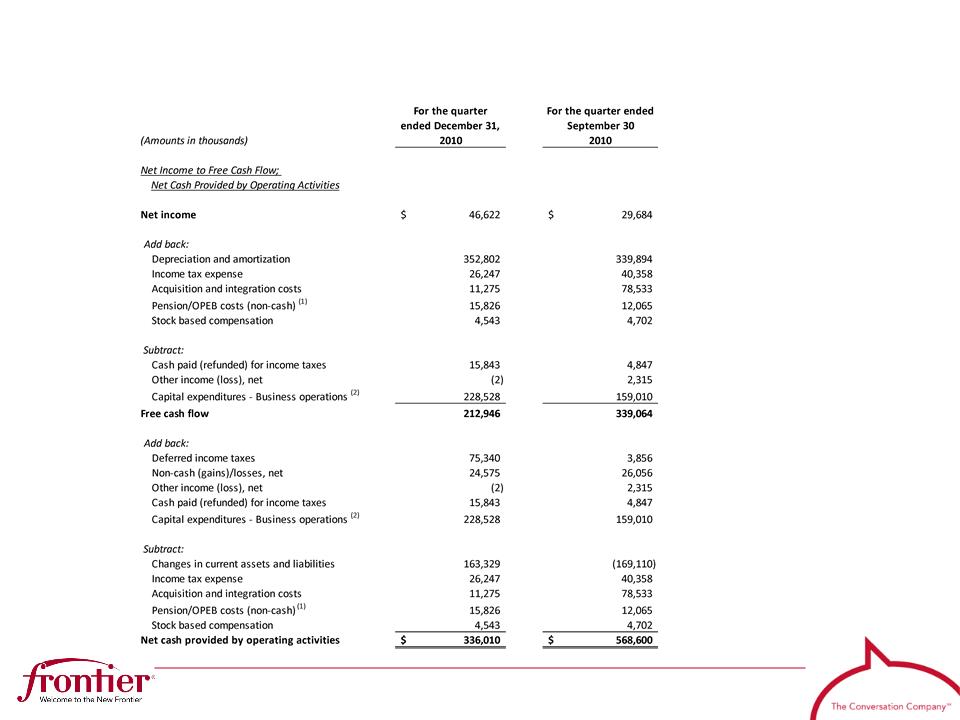
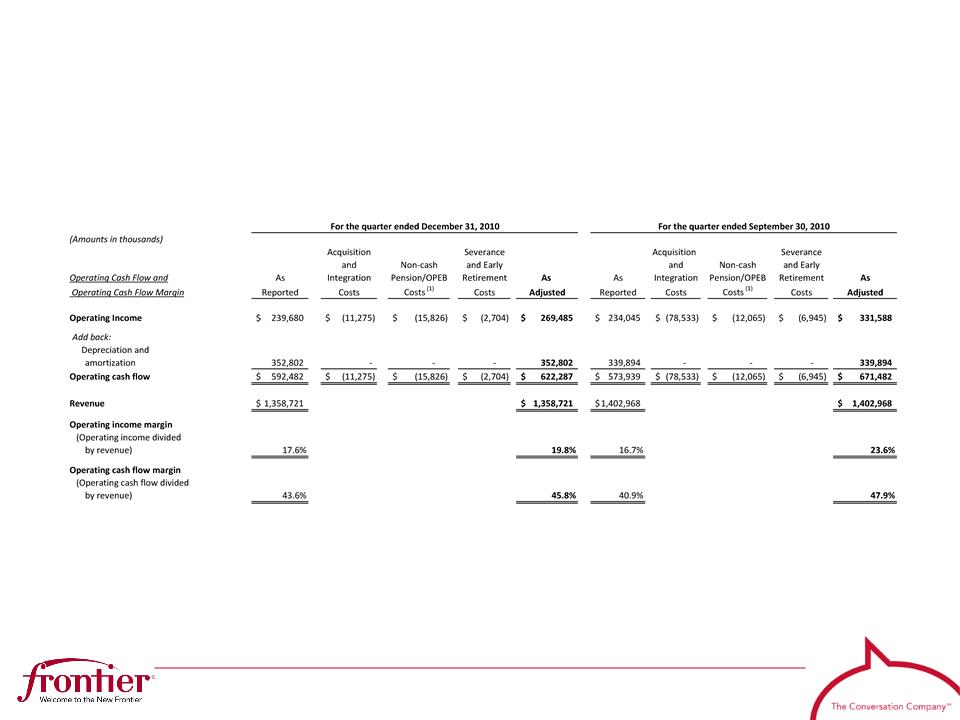
Reconciliation of Non-GAAP Financial Measures
1) Includes pension and other
postretirement benefit (OPEB)
expense, net of capitalized amounts,
of $20.9 million and $20.0 million for
the quarters ended September 30,
2010 and December 31, 2010,
respectively, less cash pension
contributions and certain OPEB costs
of $8.8 million and $4.2 million for
the quarters ended September 30,
2010 and December 31, 2010,
respectively.
2) Excludes capital expenditures for
integration activities.
integration activities.
2) Excludes capital expenditures for
integration activities.
integration activities.
19
Reconciliation of Non-GAAP Financial Measures
1) Includes pension and other postretirement benefit (OPEB) expense, net of capitalized amounts, of $20.9 million and $20.0 million for the quarters
ended September 30, 2010 and December 31, 2010, respectively, less cash pension contributions and certain OPEB costs of $8.8 million and $4.2
million for the quarters ended September 30, 2010 and December 31, 2010 respectively.
ended September 30, 2010 and December 31, 2010, respectively, less cash pension contributions and certain OPEB costs of $8.8 million and $4.2
million for the quarters ended September 30, 2010 and December 31, 2010 respectively.

Frontier Communications Corp.
(NYSE: FTR)
Investor Relations
Investor Relations
Frontier Communications Corp.
Frontier Communications Corp.
3 High Ridge Park
3 High Ridge Park
Stamford, CT 06905
Stamford, CT 06905
203.614.4606
203.614.4606
IR@FTR.com
IR@FTR.com