Free signup for more
- Track your favorite companies
- Receive email alerts for new filings
- Personalized dashboard of news and more
- Access all data and search results
Filing tables
Filing exhibits
Related financial report
FYBR similar filings
- 23 Nov 11 Frontier Communications Corporation to Participate in Investor Conference
- 14 Nov 11 Regulation FD Disclosure
- 9 Nov 11 Frontier Communications Corporation to Participate in Investor Conference
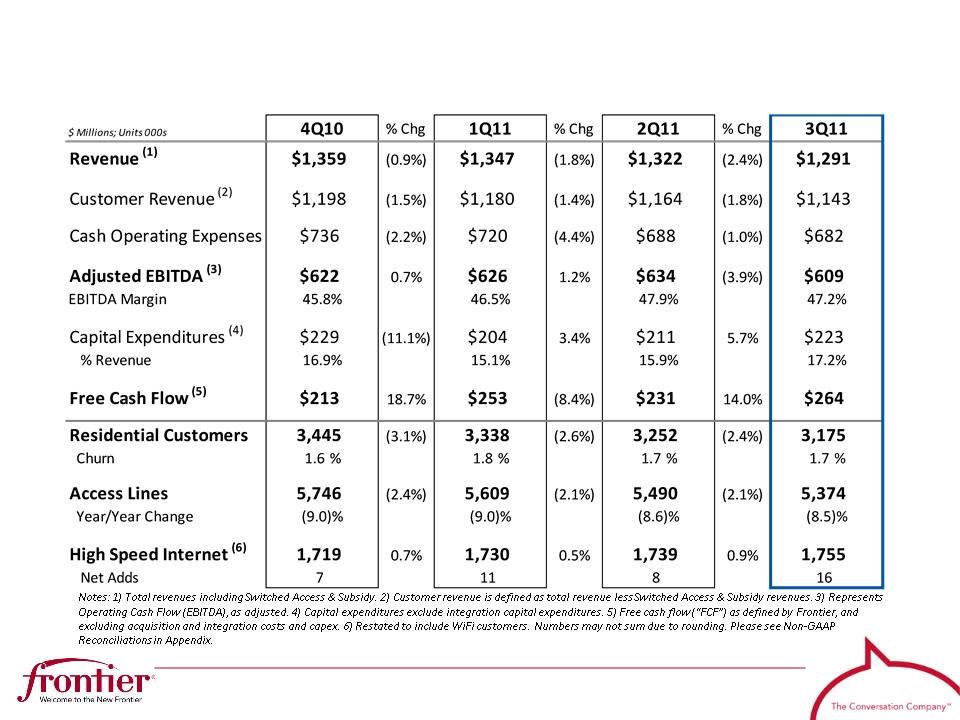
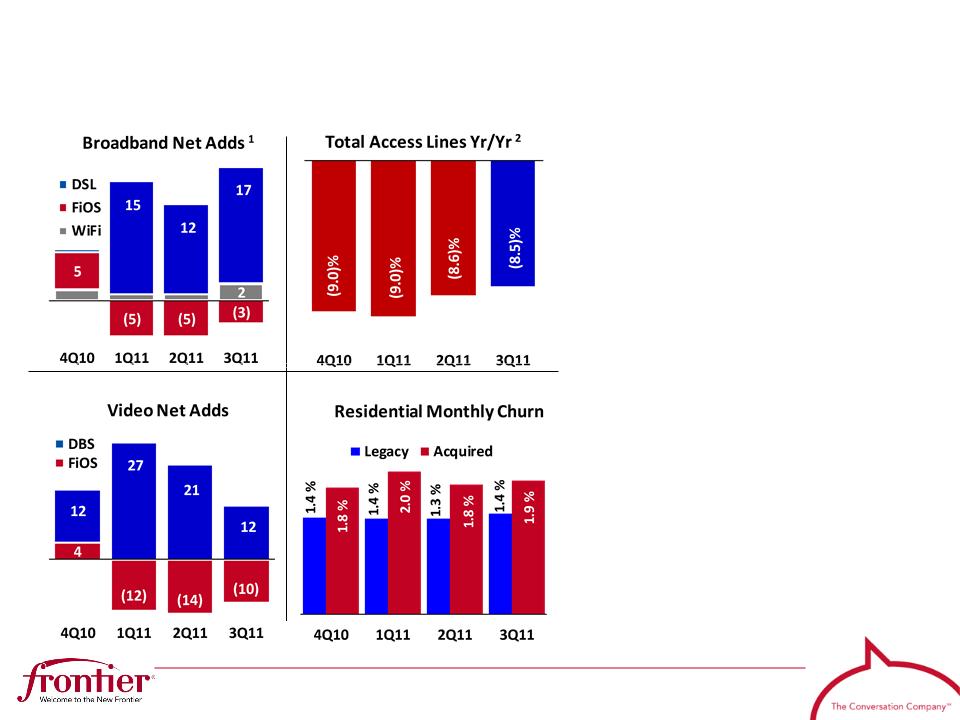
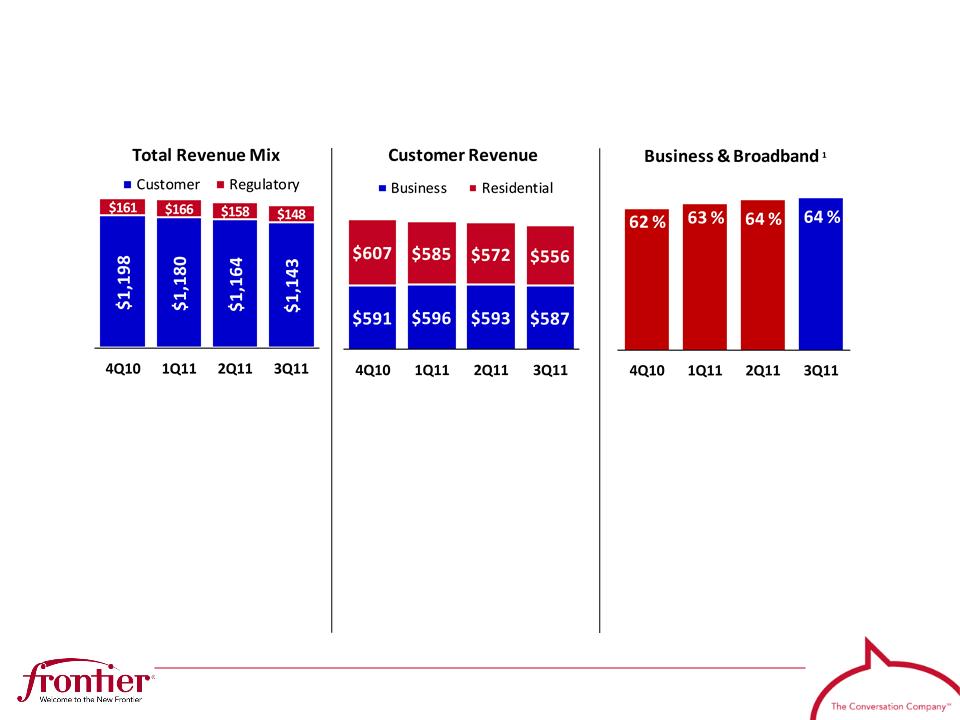
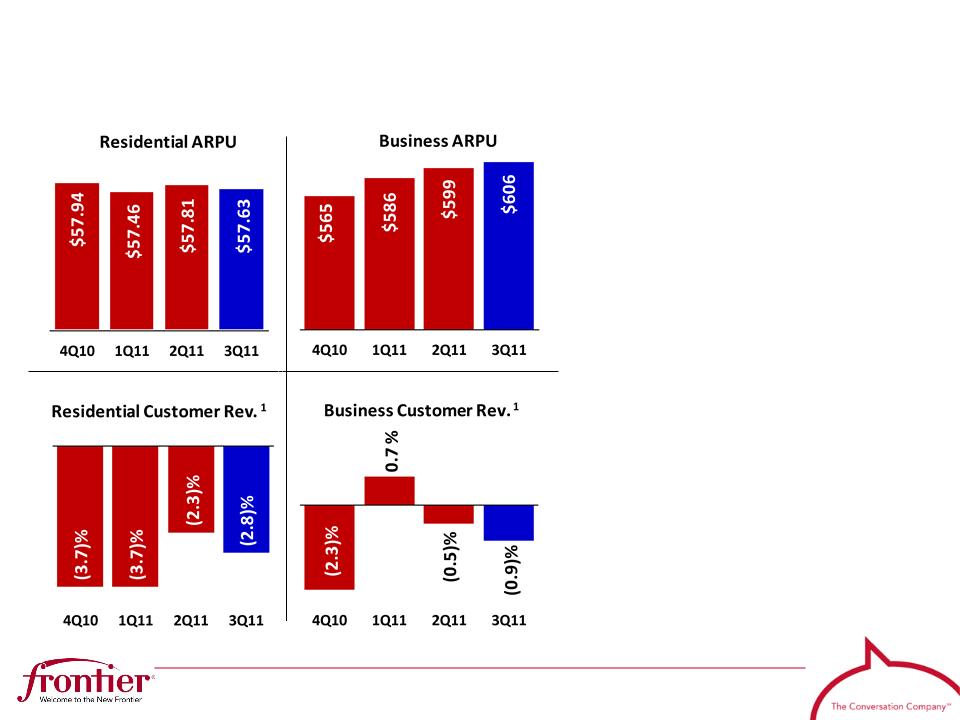
- 3 Nov 11 Frontier Communications Reports 2011 Third Quarter Results
- 2 Nov 11 Frontier Communications Corporation Declares Fourth-Quarter Dividend
- 17 Oct 11 Frontier Communications Completes $575 million Bank Financing
- 4 Oct 11 Frontier Communications Board of Directors Affirms Annual Dividend Policy
Filing view
External links