Investor Update
Second Quarter 2012
July 31, 2012
Safe Harbor Statement
2
Forward-Looking Language
This document contains forward-looking statements that are subject to risks and uncertainties that could cause actual results to differ materially from those
expressed or implied in the financial statements. Statements that are not historical facts are forward-looking statements made pursuant to the safe harbor
provisions of The Private Securities Litigation Reform Act of 1995. Words such as “believe,” “anticipate,” “expect” and similar expressions are intended to
identify forward-looking statements. Forward-looking statements (including oral representations) are only predictions or statements of current plans, which we
review continuously. Forward-looking statements may differ from actual future results due to, but not limited to, and our future results may be materially
affected by, potential risks or uncertainties. You should understand that it is not possible to predict or identify all potential risks or uncertainties. We note the
following as a partial list: the risk that the growth opportunities from the Transaction may not be fully realized or may take longer to realize than expected; the
effects of greater than anticipated competition requiring new pricing, marketing strategies or new product or service offerings and the risk that we will not
respond on a timely or profitable basis; reductions in the number of our access lines that cannot be offset by increases in broadband subscribers and sales of
other products and services; the effects of competition from cable, wireless and other wireline carriers; our ability to maintain relationships with customers,
employees or suppliers; the effects of ongoing changes in the regulation of the communications industry as a result of federal and state legislation and
regulation, or changes in the enforcement or interpretation of such legislation and regulation; the effects of any unfavorable outcome with respect to any
current or future legal, governmental or regulatory proceedings, audits or disputes; the effects of changes in the availability of federal and state universal
funding to us and our competitors; our ability to adjust successfully to changes in the communications industry and to implement strategies for growth;
continued reductions in switched access revenues as a result of regulation, competition or technology substitutions; our ability to effectively manage service
quality in our territories and meet mandated service quality metrics; our ability to successfully introduce new product offerings, including our ability to offer
bundled service packages on terms that are both profitable to us and attractive to customers; changes in accounting policies or practices adopted voluntarily or
as required by generally accepted accounting principles or regulations; our ability to effectively manage our operations, operating expenses and capital
expenditures, and to repay, reduce or refinance our debt; the effects of changes in both general and local economic conditions on the markets that we serve,
which can affect demand for our products and services, customer purchasing decisions, collectability of revenues and required levels of capital expenditures
related to new construction of residences and businesses; the effects of technological changes and competition on our capital expenditures and product and
service offerings, including the lack of assurance that our network improvements will be sufficient to meet or exceed the capabilities and quality of competing
networks; the effects of increased medical, pension, and postemployment expenses and related funding requirements; changes in income tax rates, tax laws,
regulations or rulings, or federal or state tax assessments; the effects of state regulatory cash management practices that could limit our ability to transfer cash
among our subsidiaries or dividend funds up to the parent company; our ability to successfully renegotiate union contracts in 2012 and thereafter; changes in
pension plan assumptions and/or the value of our pension plan assets, which would require us to make increased contributions to the pension plan in 2013
and beyond; the effects of customer bankruptcies and home foreclosures, which could result in difficulty in collection of revenues and loss of customers;
adverse changes in the credit markets or in the ratings given to our debt securities by nationally accredited ratings organizations, which could limit or restrict
the availability, or increase the cost, of financing; our ability to pay dividends on our common shares, which may be affected by our cash flow from operations,
amount of capital expenditures, debt service requirements, cash paid for income taxes and liquidity; and the effects of severe weather events such as
hurricanes, tornadoes, ice storms or other natural or man-made disasters. These and other uncertainties related to our business are described in greater
detail in our filings with the Securities and Exchange Commission, including our reports on Forms 10-K and 10-Q, and the foregoing information should be
read in conjunction with these filings. We undertake no obligation to publicly update or revise any forward-looking statements or to make any other forward-
looking statement, whether as a result of new information, future events or otherwise unless required to do so by securities laws.
Non-GAAP Financial Measures
3
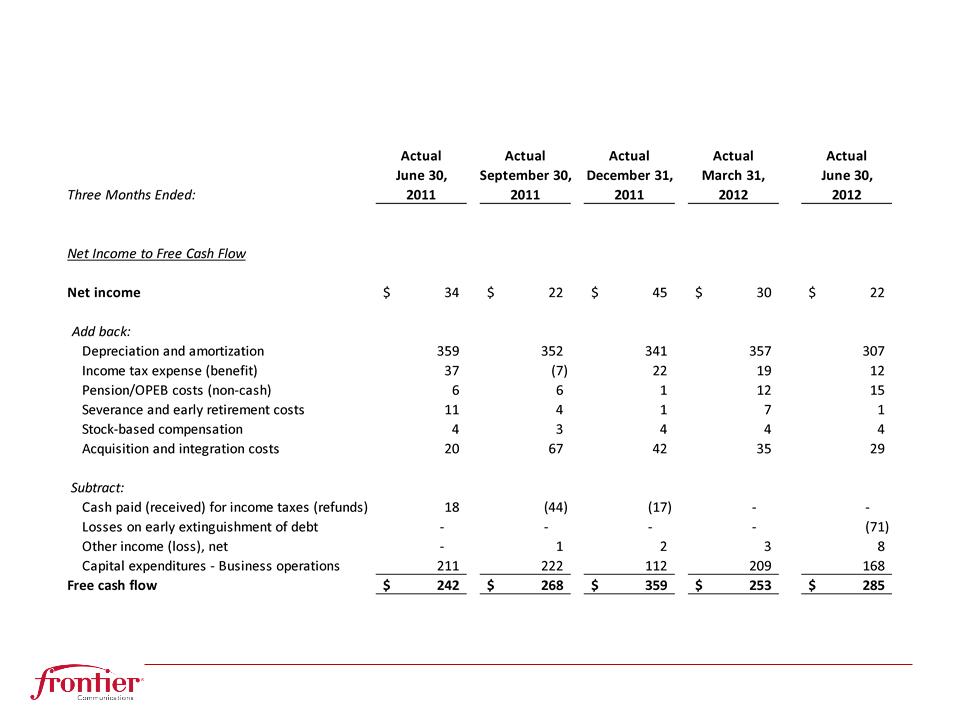
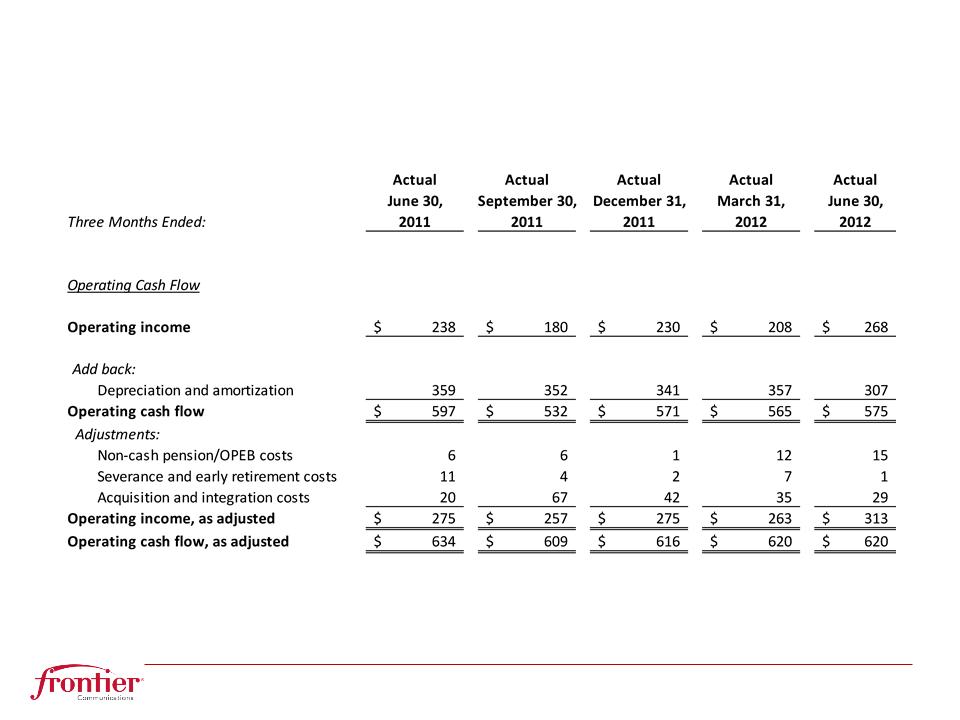
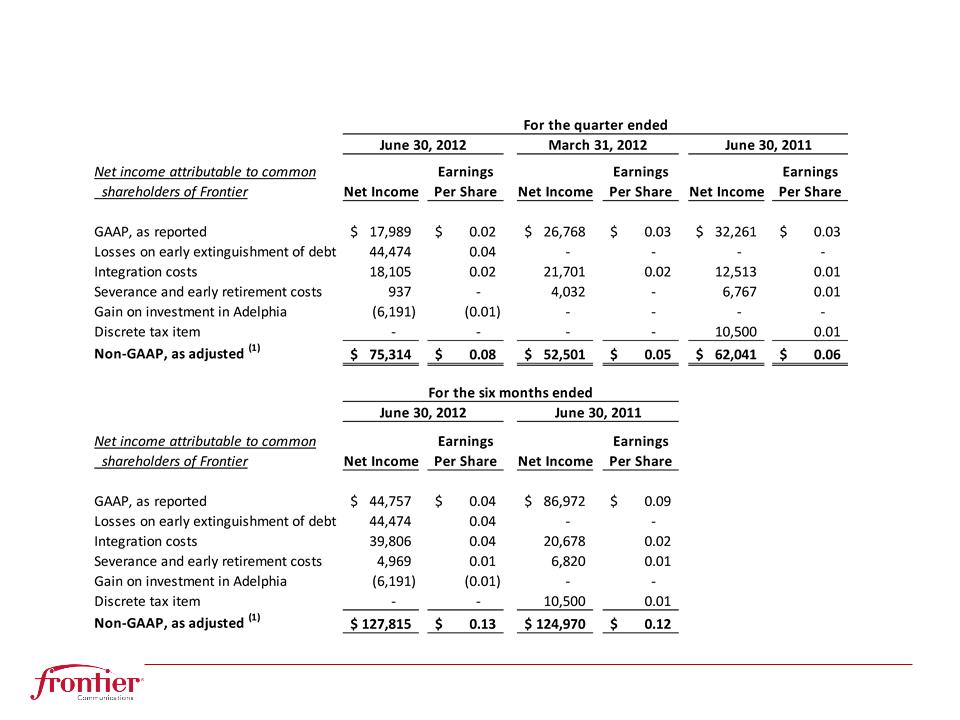
The Company uses certain non-GAAP financial measures in evaluating its performance. These include non-GAAP net income attributable to common
shareholders of Frontier, free cash flow, EBITDA or “operating cash flow,” which we define as operating income plus depreciation and amortization (“EBITDA”),
and Adjusted EBITDA; a reconciliation of the differences between EBITDA and free cash flow and the most comparable financial measures calculated and
presented in accordance with GAAP is included in the appendix. The non-GAAP financial measures are by definition not measures of financial performance
under GAAP and are not alternatives to operating income or net income reflected in the statement of operations or to cash flow as reflected in the statement of
cash flows and are not necessarily indicative of cash available to fund all cash flow needs. The non-GAAP financial measures used by the Company may not
be comparable to similarly titled measures of other companies.
The Company believes that the presentation of non-GAAP financial measures provides useful information to investors regarding the Company’s financial
condition and results of operations because these measures, when used in conjunction with related GAAP financial measures, (i) together provide a more
comprehensive view of the Company’s core operations and ability to generate cash flow, (ii) provide investors with the financial analytical framework upon
which management bases financial, operational, compensation and planning decisions and (iii) presents measurements that investors and rating agencies
have indicated to management are useful to them in assessing the Company and its results of operations. In addition, the Company believes that free cash
flow and EBITDA, as the Company defines them, can assist in comparing performance from period to period, without taking into account factors affecting cash
flow reflected in the statement of cash flows, including changes in working capital and the timing of purchases and payments.
The Company has shown adjustments to its financial presentations to exclude certain costs because investors have indicated to management that such
adjustments are useful to them in assessing the Company and its results of operations. These adjustments are detailed in the Appendix for the reconciliation
of free cash flow and operating cash flow.
adjustments are useful to them in assessing the Company and its results of operations. These adjustments are detailed in the Appendix for the reconciliation
of free cash flow and operating cash flow.
Management uses these non-GAAP financial measures to (i) assist in analyzing the Company’s underlying financial performance from period to period, (ii)
evaluate the financial performance of its business units, (iii) analyze and evaluate strategic and operational decisions, (iv) establish criteria for compensation
decisions, and (v) assist management in understanding the Company’s ability to generate cash flow and, as a result, to plan for future capital and operational
decisions. Management uses these non-GAAP financial measures in conjunction with related GAAP financial measures. These non-GAAP financial
measures have certain shortcomings. In particular, free cash flow does not represent the residual cash flow available for discretionary expenditures, since
items such as debt repayments and dividends are not deducted in determining such measure. EBITDA has similar shortcomings as interest, income taxes,
capital expenditures, debt repayments and dividends are not deducted in determining this measure. Management compensates for the shortcomings of these
measures by utilizing them in conjunction with their comparable GAAP financial measures. The information in this document should be read in conjunction
with the financial statements and footnotes contained in our documents filed with the U.S. Securities and Exchange Commission.
Quarterly Snapshot
4
Notes: 1) Total revenues including Switched Access & Subsidy. 2) Customer revenue is defined as total revenue less access services. Access services include switched network access and
subsidies. 3) Represents Operating Cash Flow (EBITDA), as adjusted. 4) Capital expenditures exclude integration capital expenditures. 5) Free cash flow as defined by Frontier, and excluding
acquisition and integration costs and capex. Please see Non-GAAP Reconciliations in Appendix.
subsidies. 3) Represents Operating Cash Flow (EBITDA), as adjusted. 4) Capital expenditures exclude integration capital expenditures. 5) Free cash flow as defined by Frontier, and excluding
acquisition and integration costs and capex. Please see Non-GAAP Reconciliations in Appendix.
Summary
5
• Total revenue declined $9M sequentially, 4.8% yr/yr, lowest loss
rate to date since the closing of the acquisition on July 1, 2010
• Access line losses of 7.6% yr/yr are the lowest since closing
• Broadband net additions of 5,442
• Expanded broadband penetration to 60,000 additional homes;
plan additional 92,876 with $71.9M from Connect America Fund
• Broadband partnership with Hughes to reach unserved and
underserved homes with satellite broadband from 5-15Mbps
• Significant network speed enhancement planned by year-end
2012 with 20Mbps service available to 42% of homes
• Simplified and flexible pricing structure introduced in July
Leading with Broadband
6
• Simplified data tiers with pricing customized per market
• Available as stand-alone “Simply Broadband”
• Discounts with Bundles ($5 Double, $10 Triple)
Financial Highlights
7
• Cash operating expenses down 7.3% yr/yr
• $9M synergies realized, annualized total synergies now $640M
• Adjusted EBITDA stable sequentially at $620M. Margin of 49%
is strongest since acquisition closing
• Expect $100M of organic cost savings per annum in 2013,
including greater labor efficiencies
• Free Cash Flow (FCF) of $285M on track to achieve $900M-
$1.0B guidance
$1.0B guidance
• Dividend payout 35% of FCF
• Leverage flat at 3.17x
Network Roadmap
8
• Benefits from
completion of
systems conversion
and middle mile
upgrade
completion of
systems conversion
and middle mile
upgrade
• ADSL2+ Bonding and
VDSL2 technology
are the drivers
VDSL2 technology
are the drivers
• Also expanding
Ethernet and VoIP
Ethernet and VoIP
• Within current capex
guidance
guidance
• Meets FCC
transaction approval
commitments
transaction approval
commitments
Conversion Impacts
9
• Total Acquired line
loss has been
reduced, as planned,
by 3 points
loss has been
reduced, as planned,
by 3 points
• West Virginia,
converted July 1,
2010, continues to
outperform
converted July 1,
2010, continues to
outperform
Notes: Broadband availability for 2Q10 updated for current market data and methodology
Key Metrics
10
• Broadband net adds
5,442
5,442
• Lowest access line
loss to date;
Acquired is down 3
points since closing
loss to date;
Acquired is down 3
points since closing
• Video growth driven
by satellite and DISH
Hopper
by satellite and DISH
Hopper
• Churn up slightly on
conversion activities
Notes: Subscriber units in 000s
Revenues
11
• Lowest Customer
Rev decline
(4.5%) since
closing
Rev decline
(4.5%) since
closing
• Regulatory 9.4%
of total,
excluding
surcharges
of total,
excluding
surcharges
• Dedicated internet,
offset by small
business,
wholesale & CPE
offset by small
business,
wholesale & CPE
• Customer Rev flat
growth vs. 2-3%
historical quarterly
losses
growth vs. 2-3%
historical quarterly
losses
• Revenues
continue shifting
away from voice
continue shifting
away from voice
• Broadband
speed upgrades
should increase
trend
speed upgrades
should increase
trend
Notes: (1) As a % of Total Customer Revenue. $ Millions. Numbers may not sum due to rounding.
Residential & Business
12
• Higher residential
bundle penetration
bundle penetration
• Business mix shift
from low-ARPU Small
customer loss, gains
in higher ARPU
Medium/Enterprise
from low-ARPU Small
customer loss, gains
in higher ARPU
Medium/Enterprise
Notes: (1) Sequential quarterly change
Cash Operating Expenses
13
• $10M cash opex
reduction from 1Q12;
$9M of which were
synergies
reduction from 1Q12;
$9M of which were
synergies
• Lower network costs,
fewer contractors,
and other headcount
related costs
fewer contractors,
and other headcount
related costs
• Expect ongoing
organic cost
reductions
organic cost
reductions
Notes: $ Millions. Please see Non-GAAP reconciliation in Appendix
Cost Savings
14
• $9M synergies;
annualized run rate
now $640M
annualized run rate
now $640M
• $94M annual software
fee to Verizon now
fully eliminated
fee to Verizon now
fully eliminated
• Future synergies
from further network
integration and real
estate
from further network
integration and real
estate
Notes: $ Millions. Numbers may not sum due to rounding
Capital Expenditures
15
Notes: $ Millions. Numbers may not sum due to rounding
Cash Flow
16
• 2Q12 Adjusted
EBITDA margin
49.3%
EBITDA margin
49.3%
• 2Q12 FCF dividend
payout ratio 35.1%
payout ratio 35.1%
• Trailing FCF exceeds
annualized dividend
by $765 million
annualized dividend
by $765 million
Notes: $ Millions. See Appendix for calculation of Free Cash Flow (FCF)
Credit & Liquidity
17
• Leverage (Net Debt /
Adj EBITDA)
stabilized in 2Q12
Adj EBITDA)
stabilized in 2Q12
• $1.3B of current
liquidity
liquidity
Notes: (1) Includes restricted cash; (2) calculation excludes $48M of escrow cash
Debt Profile
• $740M annualized 2Q12 FCF after dividends
• 7.9% Weighted Average Cost of Debt
• Issued $500M 9.25% notes due 2021; proceeds repaid $400M
8.25% due 2014 (10.9% effective interest rate) and $49M 7.875%
due 2015 (7.7% effective interest rate)
8.25% due 2014 (10.9% effective interest rate) and $49M 7.875%
due 2015 (7.7% effective interest rate)
• Repurchased $58M of 6.25% 2013 notes during 2Q12
Guidance
19
• Remaining integration opex and capex of $16M and $12M,
respectively
respectively
• 2013 capex stepdown reflects completion of geographic
expansion and shifting of capital to speed enhancement
• Expect higher cash taxes in 2013 as U.S. bonus depreciation
expires
expires
Notes: $ Millions. See Appendix for calculation of Free Cash Flow (FCF)
Appendix
20
Access Lines by State
21
Non-GAAP Reconciliation
22
Notes: $ Millions. Numbers may not sum due to rounding
Non-GAAP Reconciliation
23
Notes: $ Millions. Numbers may not sum due to rounding
Non-GAAP Reconciliation
24
Notes: $ 000’s except Per Share amounts. (1) Numbers may not sum due to rounding
25
Frontier Communications Corp.
(NASDAQ: FTR)
Investor Relations
Frontier Communications Corp.
3 High Ridge Park
Stamford, CT 06905
203.614.4606
IR@FTR.com