Exhibit 99.2
1 MAY 6, 2022 FRONTIER FIRST QUARTER 2022 RESULTS
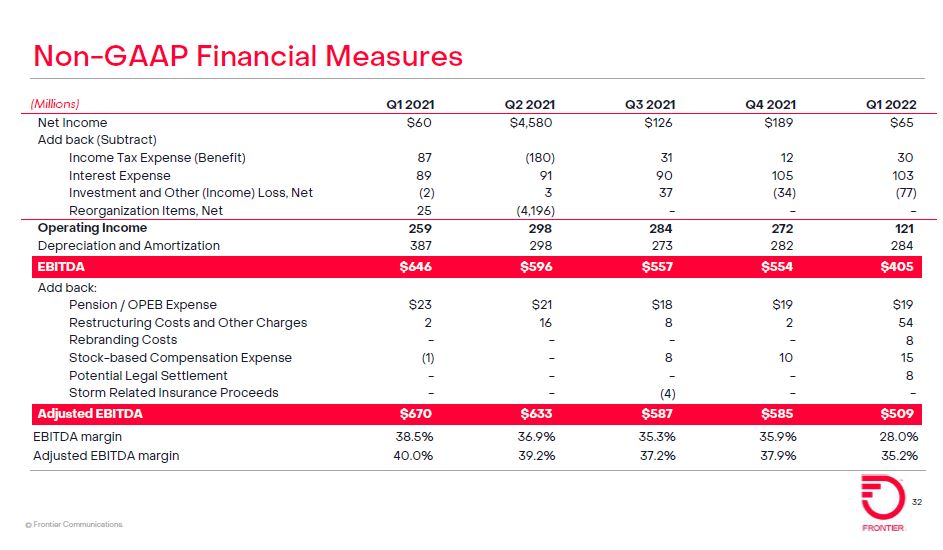
2 Safe Harbor Statement Forward-Looking Statements This release contains "forward-looking statements" related to future events. Forward-looking statements address our expectations or beliefs concerning future events, including, without limitation, our outlook with respect to future operating and financial performance, expected results from our implementation of strategic and cost savings initiatives, and our ability to comply with the covenants in the agreements governing our indebtedness and other matters. These statements are made on the basis of management’s views and assumptions, as of the time the statements are made, regarding future events and performance and contain words such as “expect,” “anticipate,” “intend,” “plan,” “believe,” “seek,” “see,” “may,” “will,” “would,” or “target.” Forward-looking statements by their nature address matters that are, to different degrees, uncertain. A wide range of factors could materially affect future developments and performance, including but not limited to: our significant indebtedness, our ability to incur substantially more debt in the future, and covenants in the agreements governing our current indebtedness that may reduce our operating and financial flexibility; declines in Adjusted EBITDA relative to historical levels that we are unable to offset; our ability to successfully implement strategic initiatives, including our fiber buildout and other initiatives to enhance revenue and realize productivity and service improvements; our ability to secure necessary construction resources, materials and permits for our fiber buildout initiative in a timely and cost effective manner; potential disruptions in our supply chain and the effects of inflation resulting from the COVID-19 pandemic, the global microchip shortage, or otherwise, which could adversely impact our business and hinder our fiber expansion plans; our ability to effectively manage our operations, operating expenses, capital expenditures, debt service requirement and cash paid for income taxes and liquidity; competition from cable, wireless and wireline carriers, satellite, fiber “overbuilders” and OTT companies, and the risk that we will not respond on a timely or profitable basis; our ability to successfully adjust to changes in the communications industry, including the effects of technological changes and competition on our capital expenditures, products and service offerings; risks related to disruption in our networks, infrastructure and information technology that result in customer loss and/or incurrence of additional expenses; the impact of potential information technology or data security breaches or other cyber-attacks or other disruptions; our ability to retain or attract new customers and to maintain relationships with customers; our reliance on a limited number of key supplies and vendors; declines in revenue from our voice services, switched and nonswitched access and video and data services that we cannot stabilize or offset with increases in revenue from other products and services; our ability to secure, continue to use or renew intellectual property and other licenses used in our business; our ability to hire or retain key personnel; our ability to dispose of certain assets or asset groups or to make acquisition of certain assets on terms that are attractive to us, or at all; the effects of changes in the availability of federal and state universal service funding or other subsidies to us and our competitors and our ability to obtain future subsidies, including participation in the proposed RDOF program; our ability to comply with the applicable CAF II and RDOF requirements and the risk of penalties or obligations to return certain CAF II and RDOF funds; our ability to defend against litigation and potentially unfavorable results from current pending and future litigation; our ability to comply with applicable federal and state consumer protection requirements; the effects of governmental legislation and regulation on our business, including costs, disruptions, possible limitations on operating flexibility and changes to the competitive landscape resulting from such legislation or regulation; the impact of regulatory, investigative and legal proceedings and legal compliance risks; our ability to effectively manage service quality in the states in which we operate and meet mandated service quality metrics; the effects of changes in income tax rates, tax laws, regulations or rulings, or federal or state tax assessments; the effects of changes in accounting policies or practices; our ability to successfully renegotiate union contracts; the effects of increased medical expenses and pension and postemployment expenses; changes in pension plan assumptions, interest rates, discount rates, regulatory rules and/or the value of our pension plan assets; the likelihood that our historical financial information may no longer be indicative of our future performance and our implementation of fresh start accounting; the impact of adverse changes in economic, political and market conditions in the areas that we serve, the U.S. and globally, including, but not limited to, disruption in our supply chain, inflation in pricing for key materials or labor, or other adverse changes resulting from epidemics, pandemics and outbreaks of contagious diseases, including the COVID-19 pandemic, natural disasters, economic or political instability or other adverse public health developments; potential adverse impacts of the COVID-19 pandemic on our business and operations, including potential disruptions to the work of our employees arising from health and safety measures such as social distancing, working remotely and recent applicable federal, state, and local mandates, and prohibitions, our ability to effectively manage increased demand on our network, our ability to maintain relationships with our current or prospective customers and vendors as well as their abilities to perform under current or proposed arrangements with us; risks associated with our emergence from the Chapter 11 Cases, including, but not limited to, the continuing effects of the Chapter 11 Cases on us and our relationships with our suppliers, customers, service providers or employees and changes in the composition of our board of directors and senior management; volatility in the trading price of our common stock, which has a limited trading history; substantial market overhang from the common stock issued in the Chapter 11 reorganization; certain provisions of Delaware law and our certificate of incorporation that may prevent efforts by our stockholders to change the direction or management of our Company; and certain other factors set forth in our other filings with the SEC. This list of factors that may affect future performance and the accuracy of forward-looking statements is illustrative and is not intended to be exhaustive. You should consider these important factors, as well as the risks and other factors contained in Frontier’s filings with the U.S. Securities and Exchange Commission, including our most recent reports on Form 10-K and Form 10-Q. These risks and uncertainties may cause actual future results to be materially different than those expressed in such forward-looking statements. We do not intend, nor do we undertake any duty, to update any forward-looking statements. Non-GAAP Financial Measures Certain financial measures included herein, including Adjusted EBITDA, Adjusted EBITDA Margin, Adjusted Operating Expenses and Operating Free Cash Flow, are not made in accordance with U.S. GAAP, and use of such terms varies from others in the same industry. Non-GAAP financial measures should not be considered as alternatives to net income (loss), net income margin or any other performance measures derived in accordance with U.S. GAAP as measures of operating performance or cash flows as measures of liquidity. Non-GAAP financial measures have important limitations as analytical tools, and you should not consider them in isolation or as substitutes for results as reported under U.S. GAAP. This presentation includes a reconciliation of certain non-GAAP financial measures to the most directly comparable financial measures calculated in accordance with U.S. GAAP. Projected GAAP financial measures and reconciliations of projected non-GAAP financial measures are not provided herein because such GAAP financial measures are not available on a forward-looking basis and such reconciliations could not be derived without unreasonable effort. This presentation uses the term “Implied Enterprise Value”, “Implied EV” and other similar terms, which is calculated using a trend line implied by our peers and certain assumed levels of broadband penetration. This term does not necessarily represent our actual enterprise value.
3 JOHN STRATTON Executive Chairman of the Board
4 Frontier today: Company overview Frontier Footprint $6.2B Revenue1 2.8M Broadband Customers2 $2.3B Adjusted EBITDA1 $1.1B Adjusted EBITDA from Fiber1 400k Businesses within 250 feet of Frontier fiber 23k Towers within 1 mile of Frontier fiber Key Operational & Financial Metrics 1. All metrics reflect Last Twelve Months’ as of 03/31/22, and have been normalized to reflect the impact of fresh start accounting. EBITDA and Adjusted EBITDA are non-GAAP measures. See Appendix slides for reconciliations to the closest GAAP measure. See Frontier’s supplemental trending schedules, available at www.frontier.com/ir, for information regarding certain GAAP and non-GAAP measures, including the impact of fresh start accounting. 2. Including consumer and business broadband subscribers
5 FTTH: Next opportunity for US infrastructure investment Combines North America Mobile Network Traffic & Consumer Internet Traffic, Credit Suisse Report 2021 Explosive 3x growth in data consumption by 2025 Data Usage1 (GB / Mo) Fiber is the best product to meet the demand Faster symmetrical speeds Attractive returns supported by: Favorable industry structure High operating leverage Dependable, long-term growth Low-cost path to 10+ Gig speeds Powerful economics as data consumption scales 1990s: Macro Towers 2000s: Data Centers 2010s: Enterprise Fiber 2020s: Fiber-to-the-Home 2020A 2025E 23% CAGR
$3,000-4,000 / Fiber passing2 6 Frontier is the largest pure play fiber provider Wall Street research Benchmarks calculated using publicly available data for ISPs as of March 2022 Largest announced fiber build at 6.0M passings from 2022-20251 2nd 90%+ of enterprise value driven by fiber by 2025 $300-600 / Copper passing2 …and our fiber build plan would create significant value for stakeholders $16-23B $32-43B+ Implied Enterprise Value Implied Enterprise Value 4M 11M 10M+ 5M Fiber passings Copper passings Today 2025+ Poised to benefit from government broadband stimulus spending Early mover head-start Incumbent position provides significant speed and cost advantages to building fiber Frontier has unique advantages…
Transparent path to achieving our goals, with clear catalysts on the horizon Wave 2 Steady State 10M+ Fiber passings 4.5M+ Fiber customers $4B+ Adjusted EBITDA Mid-to-High 40s Adjusted EBITDA margin Seven Key Inflection Points 2023 Total broadband net adds turn positive Sequential EBITDA Growth Year-over-year Revenue and EBITDA Growth Consumer fiber broadband customer base > consumer copper broadband customer base Fiber EBITDA > copper EBITDA Scale fiber broadband net add production 3Q21 3Q21 3Q21 4Q21 4Q22 Achieved Catalyst Further accelerate the fiber build 2Q22 / 3Q22
8 Building Gigabit AmericaTM Fiber Deployment Fiber Penetration Operational Efficiency Accelerate our fiber build Customer Experience Win customers in our fiber footprint Simplify and digitize operations Deliver an exceptional end-to-end customer journey 1 2 3 4 We are making rapid progress on our four levers of value creation
9 nick Jeffery President & Chief Executive Officer
10 We continued to build on our operating momentum with several key milestones in Q1 Built a record 211,000 new fiber locations Reinvented brand in April 2022 Significant improvement in employee engagement Gaining momentum in Business and Wholesale, with key inflection point in SMB performance Added a record 54k fiber broadband customer net additions, ~20% higher than prior record set in Q4 2021 Added a record 20k total broadband customer additions, ~2x higher than prior record set in Q4 2021
11 Fiber deployment: Our build scaled to another record quarter of new fiber passings in Q1 1. Consumer and business locations with less than 5 units per location included in expansion passings. Quarterly Fiber Expansion Passings1Thousand passings Projected Fiber Passings1Million passings Wave 2: 10M+ fiber passings by end of 2025 Wave 1: ~4M fiber passings at end of 2021 1M+ expected in 2022 4Q21 3Q20 1Q21 4Q20 1Q20 2Q20 2Q21 3Q21 1Q22 2021 2020 2025 2023 2022 2024
12 Consumer fiber penetration: We have achieved three straight quarters of record consumer fiber broadband growth Consumer Fiber Broadband Net Adds‘000 customers Consumer Fiber Broadband Customers‘000 customers …driving fiber broadband customer growth of 11% in the past 12 months We added a record number of fiber broadband customers, roughly 4X the previous Q1… 3Q21 2Q21 2Q20 1Q21 3Q20 1Q20 4Q20 4Q21 1Q22 +11% 3Q21 1Q20 3Q20 2Q20 4Q20 1Q21 2Q21 4Q21 1Q22 ~4X growth
13 Fiber penetration: Base fiber penetration improved to 42.4%; expansion fiber penetration is exceeding targets Base Fiber Penetration% of passings Expansion Fiber Penetration % of passings Expansion fiber penetration exceeding targets Base fiber penetration improved 110bps year-over-year to 42.4% 2021 Build Cohort 2020 Build Cohort 40.8% 3Q21 1Q22 1Q20 41.2% 41.9% 42.4% 2Q21 4Q20 4Q21 1Q21 3Q20 40.7% 41.0% 2Q20 41.5% 41.2% 41.3% +110bps 12-month 24-month 12-month
14 Customer experience: Our Fiber NPS continues to rise, and our churn continues to improve Fiber NPS up sequentially from December 2021, and continued to increase >30 points year-over-year 90-day Fiber churn down 16% since March 2021 Call center volumes down 20% since March 2021 Customer care call volumes down 23% since March 2021 Fiber and copper churn both continue to fall to record lows Fiber 1Q22 1Q21 -22 pts 1Q21 Copper 1Q22 -9 pts Key Success Indicators Consumer Broadband Churn, %
SMB Fiber Success IndicatorsMarch ‘22 compared to September ‘21 1 5 3 2 4 SMB momentum building Acquisition Base management 15 SMB: We reached a turning point in SMB this quarter Key SMB Improvements Gross Adds Net Adds Fiber ARPU Strengthened product with 2G offering and RingCentral partnership Robust demand generation and lead identification tactics 4X channel capacity with best-in-class D2D and outbound vendors Analytically-driven retention efforts Account management team focused on cross/up-sell 2X 7X 2%
16 The Frontier Way Key Changes in First Year Communication Training Performance Management Company-wide “Listen Live” with CEO and Executive team every 2-3 weeks Agile and Digital training Frontier Leadership Academy Employee engagement Creating a pay-for-performance culture; implemented objective setting and performance review process Frontier 20 program identified $50M+ of cost savings Eliminating “Dumb Policies” Patent incentive program We have rapidly introduced “The Frontier Way”…
17 1. Survey conducted by independent 3rd party 2021 2022 2022 2021 2021 2022 Overall Positive Employee Sentiment “My work gives me a sense of personal accomplishment” “I can see a clear link between my work and Frontier’s objectives” Survey of all 15,000+ employees (60%+ participation rate)1. …and we made significant progress in rebuilding employee engagement and morale in the first year
Internal & External Research Findings Quantitative & qualitative across footprint 12,000+ customers Deep dive ethnographies 20+ customers Positioning / creative / copy / visual ID testing 4,000+ customers Culture / community exploration 50+ stakeholders Growing, positive equity in Frontier name (Fiber and expansion markets) Strongest customer sentiment among new Fiber customers High employee affinity and loyalty We have taken a methodical approach to inform our brand development
We’ve been focused on changing what we do… …which has translated into improved metrics Product improvement Service delivery Customer value Customer care Accelerated penetration Improved loyalty Record NPS We believe “a brand is what a brand does,” so we have focused on changing what we do
We are keeping the Frontier name and reinventing the brand
21 Scott Beasley Chief Financial Officer
22 Financial Highlights Q1 2022 $1.45B Revenue, including higher sequential data revenue but lower voice, video, and subsidy revenue $65M Net Income $509M of Adjusted EBITDA, modestly higher sequentially across Fiber and Copper (excluding subsidies) $274M of Adjusted EBITDA from Fiber Products, up sequentially as higher Consumer Fiber performance offset lower voice and other $528M of Net Cash from Operations, driven by healthy operating performance and continued focus on working capital management
Revenue from Fiber1, $M 1. Excluding subsidy and other revenue. See the supplemental trending schedules, available at www.frontier.com/ir, for information regarding certain GAAP and non-GAAP financial measures, including the impact of fresh start accounting. Revenue Commentary Consumer Fiber broadband revenue grew 12% year-over-year, leading to overall consumer fiber revenue growth Video and Voice Fiber revenue declined in line with expectations Business and Wholesale Fiber revenue declined ~1% year-over-year Revenue from copper products declined 10% year-over-year, driven by declines across consumer, business and wholesale Copper consumer broadband revenue declined 4% year-over-year, while voice and video declines were more significant Q1 2021 Q1 2022 Q4 2021 672 675 675 Business and Wholesale Consumer Q1 2021 Q4 2021 770 784 Q1 2022 857 Revenue from Copper1, $M Fiber broadband revenue growth remained strong, offsetting voice and video declines
Fiber represents the majority of Adjusted EBITDA, and should continue growing as we expand our fiber network 1. EBITDA and Adjusted EBITDA are non-GAAP financial measures. See the supplemental trending schedules, available at www.frontier.com/ir, and the Appendix hereto for information regarding Adjusted EBITDA from Fiber and Copper products. Adjusted EBITDA from Fiber products grew 2% year-over-year, as strong consumer broadband growth and margin improvements were offset by declines in voice and other revenue Adjusted EBITDA from Fiber products represents 54% of total EBITDA, up from 48% in Q1 2021 Adjusted EBITDA from Copper products was in-line with our expectations, and we expect year-over-year declines to moderate over the next several quarters Fiber Products Copper Products Q1 2022 Adjusted EBITDA, $M Adjusted EBITDA Commentary
Business simplification We exited >20 office locations in the quarter; impairment of $44M with reduction in annual cost structure “Fit for the Future” cost program has realized $139M of gross annualized cost savings, and remains on track to exceed $250M savings goal by 2023 Strong cash flow generation We generated $528M of net cash from operating activities in the first quarter Disciplined balance sheet management Committed to disciplined balance sheet management, with net leverage in “mid-threes” We are rigorously focused on simplifying our business and improving our return on capital Rigorous capital allocation decision-making Fiber build will be primary focus of capital allocation; dynamic model to target highest IRR opportunities for revenue growth and cost reduction
26 We have $2.7B of liquidity to fund fiber build, with no significant debt maturities before 2027 Liquidity $M, as of March 31, 2022 2022 2029 2028 2025 2024 2031 2023 2026 2027 2030 Maturity Profile1 $M, as of March 31, 2022 2.5x2 1Q22 Leverage Ratio 5.7% Weighted Average Cost of Debt 7.4 Years Weighted Average Life of Debt 1. Excludes amortization payments of ~$15 million per year on Term Loan. 2. Leverage ratio is a non-GAAP measure. See supplemental trending schedules available at www.frontier.com/ir. Wave 2 Build Available Revolver Capacity 2,692 Cash & Short-term Investments 81% Share of Debt at Fixed Interest Rates
Products that are critical for connecting to the digital society Cost structure to endure inflationary environment Balance sheet insulated from rising interest rates We are well positioned to withstand a range of macroeconomic scenarios 81% of debt is at fixed interest rates (as of 03/31/22) No significant maturities until 2027 100 basis point increase in interest rates results in incremental annual cash interest expense of ~$15M Expanded pool of suppliers for both labor and materials Multi-year agreements in place with key material and labor partners Fit for the Future cost reduction program ahead of plan, will help offset inflationary pressures Provide a wide range of products and services with un-matched value Bringing more value to customers is at the core of everything we do
28 Reiterating 2022 Financial Guidance Note: Projected GAAP financial measures and reconciliations of projected non-GAAP financial measures are not provided herein because such GAAP financial measures are not available on a forward-looking basis and such reconciliations could not be derived without unreasonable effort. Adjusted EBITDA is a non-GAAP Financial measure. $2.40-2.50B Capital Expenditures 1m Locations, Fiber Build $2.00-2.15B Adjusted EBITDA
29 Frontier Investment Thesis Strong & growing demand Superior product Favorable market structure Clear strategy & purpose Ample liquidity & access to capital Strong & experienced leadership team
30 Q & A
31 appendix
Non-GAAP Financial Measures EBITDA margin 38.5% 36.9% 35.3% 35.9% 28.0% Adjusted EBITDA margin 40.0% 39.2% 37.2% 37.9% 35.2% (Millions) Q1 2021 Q2 2021 Q3 2021 Q4 2021 Q1 2022 Net Income $60 $4,580 $126 $189 $65 Add back (Subtract) Income Tax Expense (Benefit) 87 (180) 31 12 30 Interest Expense 89 91 90 105 103 Investment and Other (Income) Loss, Net (2) 3 37 (34) (77) Reorganization Items, Net 25 (4,196) - - - Operating Income 259 298 284 272 121 Depreciation and Amortization 387 298 273 282 284 EBITDA $646 $596 $557 $554 $405 Add back: Pension / OPEB Expense $23 $21 $18 $19 $19 Restructuring Costs and Other Charges 2 16 8 2 54 Rebranding Costs - - - - 8 Stock-based Compensation Expense (1) - 8 10 15 Potential Legal Settlement - - - - 8 Storm Related Insurance Proceeds - - (4) - - Adjusted EBITDA $670 $633 $587 $585 $509
© Frontier Communications.