 Citizens Communications Donald R. Shassian Chief Financial Officer January, 2008 Exhibit 99.1 |
 2 Safe Harbor Statement This presentation contains forward-looking statements that are made pursuant to the safe harbor provisions of The Private Securities Litigation Reform Act of 1995. These statements are made on the basis of management's views and assumptions regarding future events and business performance. Words such as “believe,” “anticipate,” “expect,” and similar expressions are intended to identify forward-looking statements. Forward-looking statements (including oral representations) involve risks and uncertainties that may cause actual results to differ materially from any future results, performance or achievements expressed or implied by such statements. These risks and uncertainties are based on a number of factors, including but not limited to: Reductions in the number of our access lines and high-speed internet subscribers; The effects of competition from cable, wireless and other wireline carriers (through voice over internet protocol (VOIP) or otherwise); The effects of greater than anticipated competition requiring new pricing, marketing strategies or new product offerings and the risk that we will not respond on a timely or profitable basis; The effects of general and local economic and employment conditions on our revenues; Our ability to effectively manage service quality; Our ability to successfully introduce new product offerings, including our ability to offer bundled service packages on terms that are both profitable to us and attractive to our customers; Our ability to sell enhanced and data services in order to offset ongoing declines in revenue from local services, switched access services and subsidies; Changes in accounting policies or practices adopted voluntarily or as required by generally accepted accounting principles or regulators; The effects of ongoing changes in the regulation of the communications industry as a result of federal and state legislation and regulation, including potential changes in state rate of return limitations on our earnings, access charges and subsidy payments, and regulatory network upgrade and reliability requirements; Our ability to effectively manage our operations, operating expenses and capital expenditures, to pay dividends and to reduce or refinance our debt; Adverse changes in the ratings given to our debt securities by nationally accredited ratings organizations, which could limit or restrict the availability and/or increase the cost of financing; The effects of bankruptcies in the telecommunications industry, which could result in potential bad debts; The effects of technological changes and competition on our capital expenditures and product and service offerings, including the lack of assurance that our ongoing network improvements will be sufficient to meet or exceed the capabilities and quality of competing networks; The effects of increased medical, retiree and pension expenses and related funding requirements; Changes in income tax rates, tax laws, regulations or rulings, and/or federal or state tax assessments; The effects of state regulatory cash management policies on our ability to transfer cash among our subsidiaries and to the parent company; Our ability to successfully renegotiate union contracts expiring in 2008 and thereafter; Our ability to pay a $1.00 per common share dividend annually may be affected by our cash flow from operations, amount of capital expenditures, debt service requirements, cash paid for income taxes (which will increase in the future) and our liquidity; The effects of utilizing our Federal and state net operating loss carry forwards and AMT tax credit carry forwards which has significantly increased our cash taxes in 2007 and will continue to do so in 2008 and 2009; The effects of any future liabilities or compliance costs in connection with worker health and safety matters; The effects of any unfavorable outcome with respect to any of our current or future legal, governmental, or regulatory proceedings, audits or disputes; and The effects of more general factors, including changes in economic, business and industry conditions. These and other uncertainties related to our business are described in greater detail in our filings with the Securities and Exchange Commission, including our reports on Forms 10-K and 10-Q. We undertake no obligation to publicly update or revise any forward-looking statement or to make any other forward-looking statements, whether as a result of new information, future events or otherwise unless required to do so by securities laws |
 3 Non-GAAP Financial Measures The Company uses certain non-GAAP financial measures in evaluating its performance. These include free cash flow and EBITDA or “operating cash flow” which we define as operating income plus depreciation and amortization. A reconciliation of the differences between EBITDA and free cash flow and the most comparable financial measures calculated and presented in accordance with GAAP is included in the tables that follow. The non-GAAP financial measures are by definition not measures of financial performance under generally accepted accounting principles and are not alternatives to operating income or net income reflected in the statement of operations or to cash flow as reflected in the statement of cash flows and are not necessarily indicative of cash available to fund all cash flow needs. The non-GAAP financial measures used by the Company may not be comparable to similarly titled measures of other companies. The Company believes that presentation of non-GAAP financial measures provides useful information to investors regarding the Company’s financial condition and results of operations because these measures, when used in conjunction with related GAAP financial measures, (i) together provide a more comprehensive view of the Company’s core operations and ability to generate cash flow, (ii) provide investors with the financial analytical framework upon which management bases financial, operational, compensation and planning decisions, and (iii) presents measurements that investors and rating agencies have indicated to management are useful to them in assessing the Company and its results of operations. Management uses these non-GAAP financial measures to plan and measure the performance of its core operations, and its divisions measure performance and report to management based upon these measures. In addition, the Company believes that free cash flow and EBITDA, as the Company defines them, can assist in comparing performance from period to period, without taking into account factors affecting cash flow reflected in the statement of cash flows, including changes in working capital and the timing of purchases and payments. The Company has shown adjustments to its financial presentations to exclude severance and early retirement costs in 2004, 2005, 2006 and 2007 and management succession and strategic alternatives expenses in 2004 because the Company believes that the magnitude of such costs incurred in any one period materially exceeds that which has been incurred by the Company in any other period during 2004 through 2007. Management uses these non-GAAP financial measures to (i) assist in analyzing the Company’s underlying financial performance from period to period, (ii) evaluate the financial performance of its business units, (iii) analyze and evaluate strategic and operational decisions, (iv) establish criteria for compensation decisions, and (v) assist management in understanding the Company’s ability to generate cash flow and, as a result, to plan for future capital and operational decisions. Management uses these non-GAAP financial measures in conjunction with related GAAP financial measures. The Company believes that the non-GAAP financial measures are meaningful and useful for the reasons outlined above. While the Company utilizes these non-GAAP financial measures in managing and analyzing its business and financial condition and believes they are useful to management and to investors for the reasons described above, these non-GAAP financial measures have certain shortcomings. In particular, free cash flow does not represent the residual cash flow available for discretionary expenditures, since items such as debt repayments and dividends are not deducted in determining such measure. EBITDA has similar shortcomings as interest, income taxes, capital expenditures, debt repayments and dividends are not deducted in determining this measure. Management compensates for the shortcomings of these measures by utilizing them in conjunction with their comparable GAAP financial measures. The information in this presentation should be read in conjunction with the financial statements and footnotes contained in our documents filed with the U.S. Securities and Exchange Commission. |
 Our Values: Frontier 3 Ps People Product Profit Our Mission: |
 5 Our Management Team Position: Officer: Sr. Vice President, General Manager - New Business Operations 10/2007 Melinda White Sr. Vice President, Human Resources 02/2006 Cecilia K. McKenney Sr. Vice President, General Counsel, Secretary 07/2005 Hilary E. Glassman Exec. Vice President - Sales, Marketing and Business Development 02/2005 Peter B. Hayes Chief Operating Officer, Executive Vice President 01/2002 Daniel J. McCarthy Chief Financial Officer 04/2006 Donald R. Shassian Chairman of the Board, Chief Executive Officer, President 11/2004 Maggie Wilderotter |
 6 What You Can Expect From Us Provide a Unique Customer Experience Annual Growth in Customer Revenue Innovative Marketing New Products Consistently Strong EBITDA Margins Efficient Execution of Our Operating Strategy “Competitively Fit” – Lean & Flexible Shareholder Friendly Actions Sustainable, Consistent Dividend Share Repurchases |
 7 Keys to Success Great Assets Unique Customer Experience Proven Ability to Integrate New Properties Consistent Delivery of “Best in Class” Results Focus on Shareholder Friendly Actions |
 8 Great Assets Diverse Geographic Mix Rural Footprint (17 Lines / Sq Mile) Mature Cable VOIP Competition (57% of Our Footprint) Diverse Revenue Base (24 States / 282 counties) Limited Exposure to Overheated Housing Markets Reliable, Robust Networks Diverse, High Capacity Data Backbone 12,060 Route Miles / Avg. 65% Utilized Extensive HSI Availability 89% Availability (1Mb-89% / 3Mb-72% / 6Mb-48% / 20Mb-15%) |
 9 Great Assets Efficient Operating Structure Centralized Common Support Functions Consolidation of Billing Systems Standardized Field Organizations Flexible Work Rules Dedicated and Experienced Workforce Hiring and Retaining “Great Athletes” Motivated, Results Oriented Culture Innovative Solutions to Increase Workforce Efficiency Work-at-Home Program |
 10 A Unique Customer Experience Big Company Advantages, Small Company Feel Local Manager Structure Cultivates Local Relationships “Peace of Mind” Experience Full HSI Installations PC Data Back up and Restore PC Assistance and 24 hour Technical Support PC Tune up / Disk Service Cleanup Wireless Network Diagnostic and Repair Printer Setup and Troubleshooting MP3 / iPod setup and training Security/Virus Scans and Clean up Exceptional Service Levels 24 hour Customer Service and Unique Welcome Process Technician / Customer Interface Broad Spectrum of Products & Services CRM Launched; Additional Initiatives Underway |
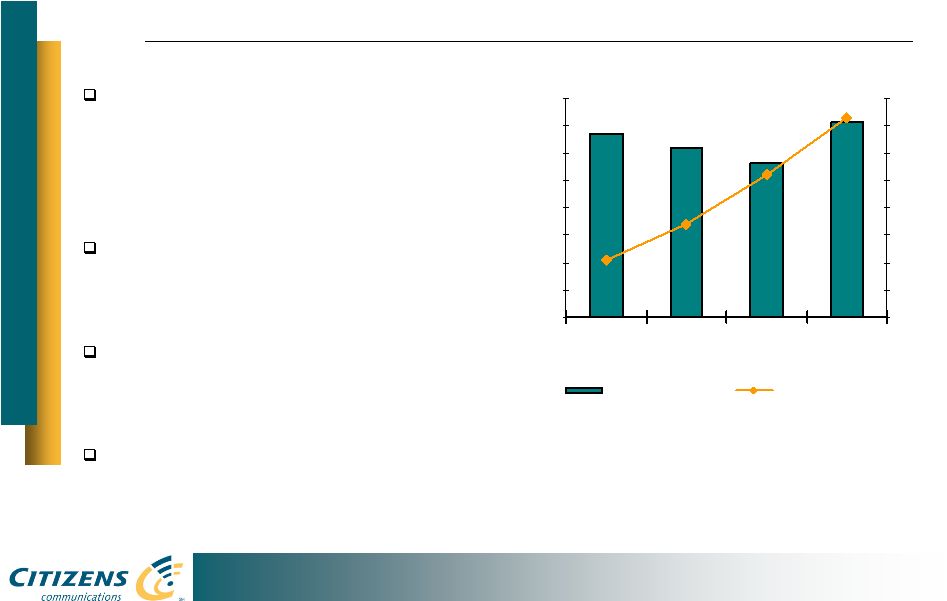 11 A Unique Customer Experience Maintaining Stable Base of Secure Customers in Light of Increasing Competitive Pressures 6% Compounded Annual Growth in Customer ARPU (’04-’07) $100M in Revenue from New Products¹ (’05–’07) 69% of Residential HSI on PPP 1,000 1,200 1,400 1,600 1,800 2,000 2,200 2,400 2,600 2004 2005 2006 2007 $50.00 $52.00 $54.00 $56.00 $58.00 $60.00 $62.00 $64.00 $66.00 Access Lines (in 000s) Customer ARPU (a) (a) Excludes Commonwealth Telephone 1 New product revenues are primarily made up of High Speed Internet, Unlimited Statewide & Nationwide Long Distance Plans, Feature Bundles, Video, Internet Portal, and Wireless Data. |
 12 Integrating New Properties Clearly Established Acquisition Criteria Commonwealth Telephone Global Valley Networks Proven Integration Process Provides Confidence in Achieving Synergy Targets Commonwealth Integration 7% Growth in Average Revenue Per Line 36% Growth in HSI Subscribers >95% of New HSI Adds on Price Protection Plans Revised Expense Synergy Target of $40M $21M in Annual Synergies Realized as of 9/30/07 |
 13 ���Best – In – Class” Results Consistent Ability to Grow Customer Revenue 22 New Products Rolled Out in past 3 years $100 Million in New Revenue Industry Leading EBITDA Margins 55.2% (1) - For the Nine Months Ending September, 2007 Strong, Stable Free Cash Flow Generation Exceptional Customer Satisfaction (1) EBITDA, as adjusted, excludes severance and early retirement costs, and management succession and strategic alternatives expenses. For a detailed definition of EBITDA, refer to page 17. |
 14 Focus on Shareholder Value Shareholder Friendly Actions Consistent, Sustainable Dividend Annual Share Buybacks Stable Ratings Outlook Solid Balance Sheet Investment Grade Debt Covenants No Debt Refinancing Needed Until 2011 |
 15 Selected Financial Metrics $1,711 $2,025 $2,017 $2,022 Revenue 9 Months $423 $561 $543 $503 Free Cash Flow (4) $203 $269 $259 $264 CAPEX $1,345 $1,597 $1,584 $1,564 Customer Revenue (1) - % of Revenue - % of Revenue EBITDA Margin % (3) HSI Penetration - %-age Growth (2) ($ in Millions) 24.7% 27.7% 26.9% 24.9% 11.9% 13.3% 12.8% 13.1% 55.2% 55.7% 55.3% 54.5% 20.2% 18.5% 14.2% 9.4% 0.8% 0.8% 1.3% 1.5% 2007 2006 2005 2004 (1) Customer revenue is defined as total revenue less access services. Access services include switched network access and subsidies. (2) % Growth for the 9 Months of 2007 excludes $135.5M of revenue from Commonwealth in 2007 and is calculated versus the same period for 2006 (3) EBITDA, as adjusted, excludes severance and early retirement costs, and management succession and strategic alternatives expenses. For a detailed definition of EBITDA, refer to page 17. (4) Free cash flow for all years includes ELI. For a detailed definition of free cash flow, refer to page 18. |
 16 Appendix Reconciliation of Non-GAAP financial measures |
 17 Reconciliation of Non-GAAP Financial Measures ($ in 000's) 2004 2005 2006 2007 EBITDA (Operating Cash Flow) Operating Income 460,301 $ 588,968 $ 644,490 $ 530,525 $ Add back: Depreciation and amortization 549,381 520,204 476,487 400,700 EBITDA (Operating Cash Flow), as reported 1,009,682 $ 1,109,172 $ 1,120,977 $ 931,225 $ Add back: Severance and early retirement costs 1,182 6,981 7,193 13,874 Management succession and strategic alternatives expenses 90,632 - - - EBITDA (Operating Cash Flow), as adjusted 1,101,496 $ 1,116,153 $ 1,128,170 $ 945,099 $ Revenue 2,022,378 $ 2,017,041 $ 2,025,367 $ 1,710,787 $ EBITDA (Operating Cash Flow), as adjusted as % of Revenue 54.5% 55.3% 55.7% 55.2% For the nine months ended September 30, For the years ended December 31, |
 18 Reconciliation of Non-GAAP Financial Measures For the nine months ended September 30, ($ in 000's) 2004 2005 2006 2007 Net Income Available to Common Shareholders to Free Cash Flow Net income available to common shareholders 72,150 $ 202,375 $ 344,555 $ 155,641 $ Add back: Depreciation and amortization 549,381 520,204 476,487 400,700 Income tax expense 4,247 75,270 136,479 97,785 Management succession and strategic alternatives expenses 90,632 - - - Stock based compensation 10,963 8,427 10,340 7,809 Subtract: Cash paid (refunded) for income taxes (4,901) 4,711 5,365 53,670 Investment and other income (loss), net of interest income (34,242) (2,111) 60,872 (17,088) (a) Capital expenditures 263,949 259,448 268,806 202,641 Gain on sale of discontinued operations - 1,167 71,635 - Free cash flow 502,567 $ 543,061 $ 561,183 $ 422,712 $ Revenue 2,022,378 $ 2,017,041 $ 2,025,367 $ 1,710,787 $ Free cash flow as % of Revenue 24.9% 26.9% 27.7% 24.7% For the years ended December 31, (a) Includes premium paid on debt repurchase in second quarter. |