 Frontier Communications Donald R. Shassian – EVP & Chief Financial Officer January 2009 Exhibit 99.1 |
 2 Safe Harbor Statement This presentation contains forward-looking statements that are made pursuant to the safe harbor provisions of The Private Securities Litigation Reform Act of 1995. These statements are made on the basis of management's views and assumptions regarding future events and business performance. Words such as “believe,” “anticipate,” “expect” and similar expressions are intended to identify forward-looking statements. Forward-looking statements (including oral representations) involve risks and uncertainties that may cause actual results to differ materially from any future results, performance or achievements expressed or implied by such statements. These risks and uncertainties are based on a number of factors, including but not limited to: reductions in the number of our access lines and high-speed internet subscribers; the effects of competition from cable, wireless and other wireline carriers (through voice over internet protocol (VOIP) or otherwise); the effects of greater than anticipated competition requiring new pricing, marketing strategies or new product offerings and the risk that we will not respond on a timely or profitable basis; the effects of changes in both general and local economic conditions on the markets we serve, which can impact demand for our products and services, customer purchasing decisions, collectibility of revenue and required levels of capital expenditures related to new construction of residences and businesses; our ability to effectively manage service quality; our ability to successfully introduce new product offerings, including our ability to offer bundled service packages on terms that are both profitable to us and attractive to our customers; our ability to sell enhanced and data services in order to offset ongoing declines in revenue from local services, switched access services and subsidies; changes in accounting policies or practices adopted voluntarily or as required by generally accepted accounting principles or regulators; the effects of ongoing changes in the regulation of the communications industry as a result of federal and state legislation and regulation, including potential changes in state rate of return limitations on our earnings, access charges and subsidy payments, and regulatory network upgrade and reliability requirements; our ability to effectively manage our operations, operating expenses and capital expenditures, to pay dividends and to reduce or refinance our debt; adverse changes in the credit markets and/or in the ratings given to our debt securities by nationally accredited ratings organizations, which could limit or restrict the availability and/or increase the cost of financing; the effects of bankruptcies in the telecommunications industry, which could result in potential bad debts; the effects of technological changes and competition on our capital expenditures and product and service offerings, including the lack of assurance that our ongoing network improvements will be sufficient to meet or exceed the capabilities and quality of competing networks; the effects of increased medical, retiree and pension expenses and related funding requirements; changes in income tax rates, tax laws, regulations or rulings, and/or federal or state tax assessments; further declines in the value of our pension plan assets, which could require us to make contributions to the pension plan in 2009; the effects of state regulatory cash management policies on our ability to transfer cash among our subsidiaries and to the parent company; our ability to successfully renegotiate union contracts expiring in 2009 and thereafter; our ability to pay a $1.00 per common share dividend annually, which may be affected by our cash flow from operations, amount of capital expenditures, debt service requirements, cash paid for income taxes (which will increase in 2009) and our liquidity; the effects of significantly increased cash taxes in 2009 and future years; the effects of any unfavorable outcome with respect to any of our current or future legal, governmental, or regulatory proceedings, audits or disputes; and the possible impact of adverse changes in political or other external factors over which we have no control, including hurricanes or other severe weather. These and other uncertainties related to our business are described in greater detail in our filings with the Securities and Exchange Commission, including our reports on Forms 10-K and 10-Q. We undertake no obligation to publicly update or revise any forward-looking statement or to make any other forward-looking statements, whether as a result of new information, future events or otherwise unless required to do so by securities laws |
 3 Non-GAAP Financial Measures The Company uses certain non-GAAP financial measures in evaluating its performance. These include free cash flow and EBITDA or “operating cash flow” which we define as operating income plus depreciation and amortization. A reconciliation of the differences between EBITDA and free cash flow and the most comparable financial measures calculated and presented in accordance with GAAP is included in the tables that follow. The non-GAAP financial measures are by definition not measures of financial performance under generally accepted accounting principles and are not alternatives to operating income or net income reflected in the statement of operations or to cash flow as reflected in the statement of cash flows and are not necessarily indicative of cash available to fund all cash flow needs. The non-GAAP financial measures used by the Company may not be comparable to similarly titled measures of other companies. The Company believes that presentation of non-GAAP financial measures provides useful information to investors regarding the Company’s financial condition and results of operations because these measures, when used in conjunction with related GAAP financial measures, (i) together provide a more comprehensive view of the Company’s core operations and ability to generate cash flow, (ii) provide investors with the financial analytical framework upon which management bases financial, operational, compensation and planning decisions, and (iii) presents measurements that investors and rating agencies have indicated to management are useful to them in assessing the Company and its results of operations. Management uses these non-GAAP financial measures to plan and measure the performance of its core operations, and its divisions measure performance and report to management based upon these measures. In addition, the Company believes that free cash flow and EBITDA, as the Company defines them, can assist in comparing performance from period to period, without taking into account factors affecting cash flow reflected in the statement of cash flows, including changes in working capital and the timing of purchases and payments. The Company has shown adjustments to its financial presentations to exclude severance and early retirement costs in 2004, 2005, 2006, 2007 and year to date September 30, 2008, a pension curtailment gain in 2007 and management succession and strategic alternatives expenses in 2004 because the Company believes that the magnitude of such costs incurred in any one period materially exceeds that which has been incurred by the Company in any other period during 2004 through 2008. Management uses these non-GAAP financial measures to (i) assist in analyzing the Company’s underlying financial performance from period to period, (ii) evaluate the financial performance of its business units, (iii) analyze and evaluate strategic and operational decisions, (iv) establish criteria for compensation decisions, and (v) assist management in understanding the Company’s ability to generate cash flow and, as a result, to plan for future capital and operational decisions. Management uses these non-GAAP financial measures in conjunction with related GAAP financial measures. The Company believes that the non-GAAP financial measures are meaningful and useful for the reasons outlined above. While the Company utilizes these non-GAAP financial measures in managing and analyzing its business and financial condition and believes they are useful to management and to investors for the reasons described above, these non-GAAP financial measures have certain shortcomings. In particular, free cash flow does not represent the residual cash flow available for discretionary expenditures, since items such as debt repayments and dividends are not deducted in determining such measure. EBITDA has similar shortcomings as interest, income taxes, capital expenditures, debt repayments and dividends are not deducted in determining this measure. Management compensates for the shortcomings of these measures by utilizing them in conjunction with their comparable GAAP financial measures. The information in this presentation should be read in conjunction with the financial statements and footnotes contained in our documents filed with the U.S. Securities and Exchange Commission. |
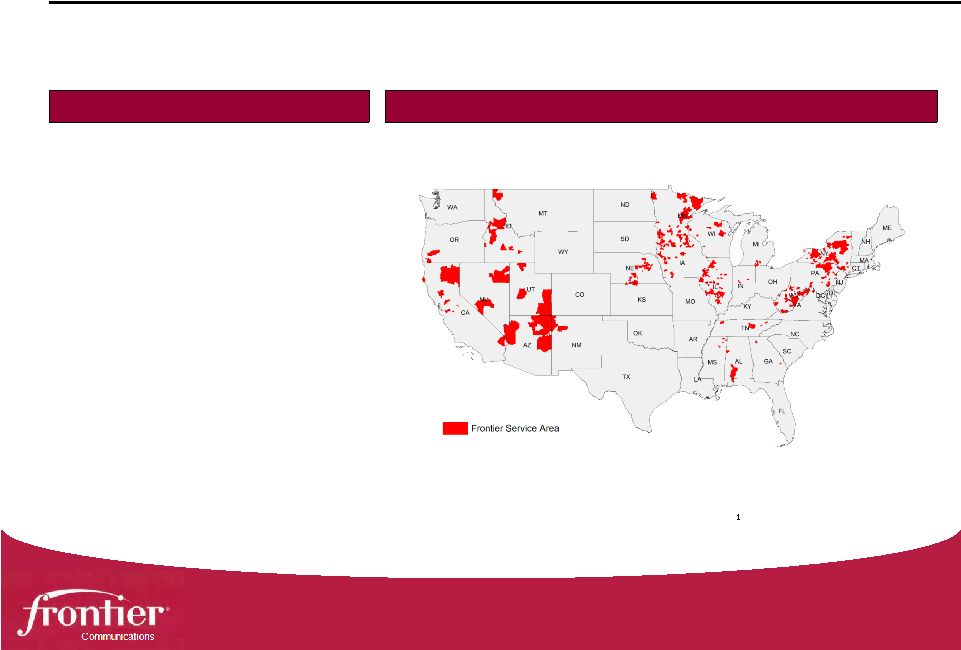 4 Frontier Communications is …… Frontier Communications Corporation (NYSE: FTR) is one of the nation's largest rural local exchange carriers, offering local and long-distance telephone service, Internet access, wireless Internet access, DISH satellite TV and more….. $384,118 YTD Free Cash Flow ($ in 000s) $917,106 YTD EBITDA ($ in 000s) $1,689,626 YTD Revenue ($ in 000s) 571,946 High Speed Internet Subscribers 2,296,460 Access Lines 24 States Key Metrics 1 1. Metrics are year to date as of September 30, 2008 • Geographic Highlights • Rural Footprint (13 Households / Sq Mile) • 24 States; 285 counties; 70 Local Market Clusters • Mature Cable VOIP Competition (65% of Our Footprint ) Geographic Footprint |
 5 Key Value Drivers 1. Unique Customer Experience 2. Robust Local & National Network 3. Consistent Execution of Operational Goals 4. Consistent Execution of Financial Goals 5. Disciplined Growth Strategy |
 6 Customer Value Added Services Full High Speed Installation Price Protection / Auto Renewal Web Content and Services Personalized Portal Wireless Modems Peace of Mind Services Integrated Product Offers Frontier Connections Digital Phone, HSI, Video, Wireless Data: Enhancement Upgrades Business Offers: Unlimited Long Distance Metro Ethernet Expanded Distribution Channels Alternate Channels In-Bound Call Centers Internet Sales Localized Offerings “Aspirational” Gifts Localized Messaging Seasonal Promotions & Targeted Incentives Community Involvement Local Presence Events, Organization Membership Educational Support One-to-One Marketing Anniversary Program Loyalty Program Retention Plans Segmentation Win Back Customer Service 24/7 Local Technician Service Customer Service – 7 days/week Internet Help Desk – 24/7 2 Hour Appointment Windows Electronic Bill Payment Online Information and Ordering 1. Unique Customer Experience Goals: Retain Customers Increase Customer Spending Acquire New Customers Win Back Lost Customers • Frontier’s Local “Go – To – Market” Strategy |
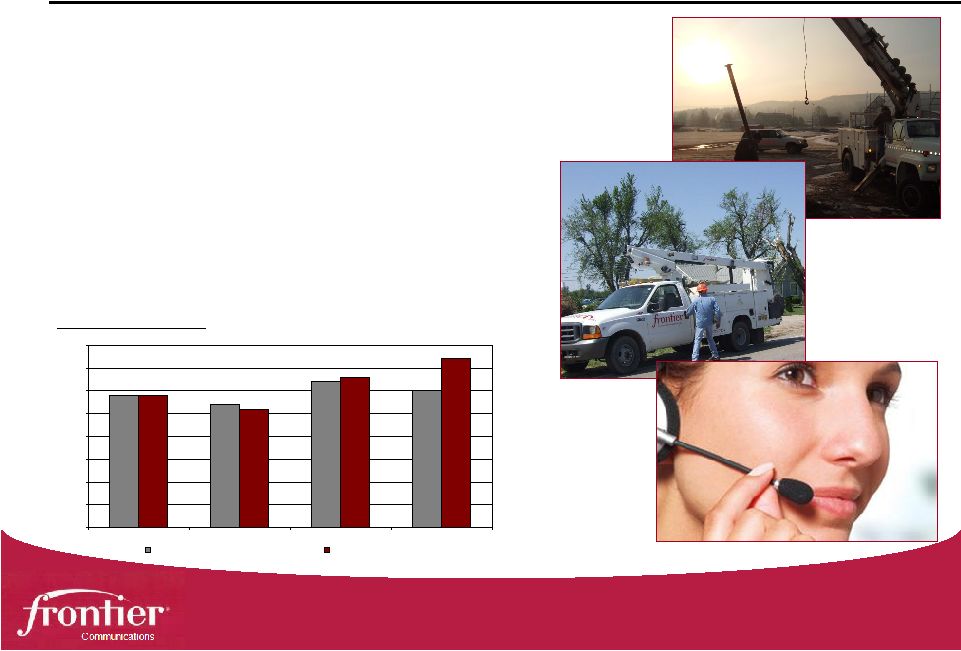 7 1. Unique Customer Experience (continued) • Delivering A “Peace of Mind” Experience • Big Company Advantages, Small Company Feel • Local Manager Structure • Unique Welcome Process • Exceptional Service Levels • 2 Hour Appointment Windows Secure Customer Index 0% 5% 10% 15% 20% 25% 30% 35% 40% Q4 '07 Q1 '08 Q2 '08 Q3 '08 Residential Business |
 8 1. Unique Customer Experience (continued) • Broad Spectrum of Products & Services • Simple Double Play & Triple Play Bundles • Good, Better, Best Choices for Voice, Video, Data • Peace of Mind Product Suite • Directory Advertising • Wireless Data |
 9 1. Unique Customer Experience (continued) • Innovative Marketing Programs • Multi-Year Price Protection Plans • Loyalty Programs • Aspirational Gifts • Community Connections • Take The Lead Referrals |
 10 2. Robust Local & National Network •Robust Local Networks • 1,007 ILEC Exchanges • 1,024 Central Offices • Migration To VOIP In 5 Major Markets • Fiber To Home In All Greenfield Builds • Approximately 40% Of Frontier Local Networks Can Provide 20mps 1 Service 5 - 10k ft. 22% 10 - 15k ft. 7% 15 - 18k ft. 14% + 18k ft. 18% <5k ft. 39% • Flexible network architecture allows delivery of advanced services to residential and business customers Notes 1. Based on Network Capability View as of 9/30/08 Frontier Average Loop Lengths ¹ |
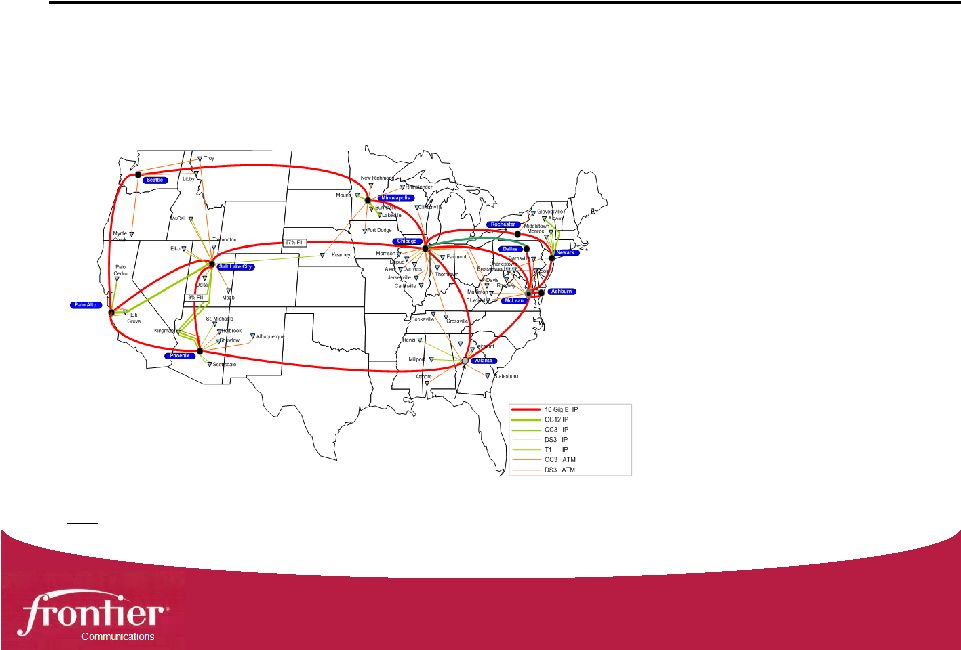 11 2. Robust Local & National Network (continued) • Diverse, High Capacity 10 Gig Data Backbone 1 • 12,060 Route Miles / Avg. 30% Utilized 1 Notes 1.Assumes the completion of the National Data Backbone upgrade from 2.5 Gig to 10 Gig, which is anticipated to be completed by 03/31/09 • Quality Enabled Network That Provides Priority To Voice And Data • Complete Redundancy In Both Network Equipment And Routes • 250 Bilateral Peering Agreements To Reduce Cost • Deep Packet Inspection Technology Implemented |
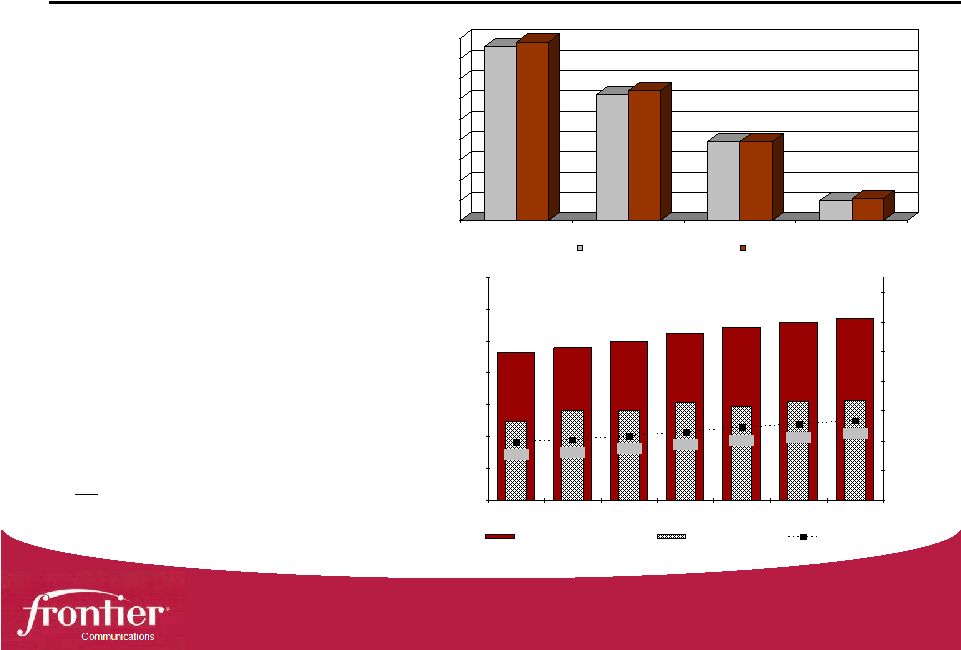 12 2. Robust Local & National Network (continued) • Extensive HSI Availability • 88% Availability • Well Positioned to Support Continued Growth of High Speed Subscribers and Non- Switched Revenue Notes 1. Based on Product Availability View as of 9/30/08 464 479 497 524 543 559 572 $53 $61 $61 $66 $63 $66 $67 24.9% 23.9% 22.7% 21.5% 20.2% 19.1% 18.3% - 100 200 300 400 500 600 700 Q1 '07 Q2 '07 Q3 '07 Q4 '07 Q1 '08 Q2 '08 Q3 '08 $ $20 $40 $60 $100 $120 $140 High Speed Internet Subscribers Non Switched Revenue HSI Penetration 86% 88% 62% 64% 39% 39% 10% 11% 0% 10% 20% 30% 40% 50% 60% 70% 80% 90% 1 Mbps 3 Mbps 6 Mbps 20 Mbps June '08 September '08 1 |
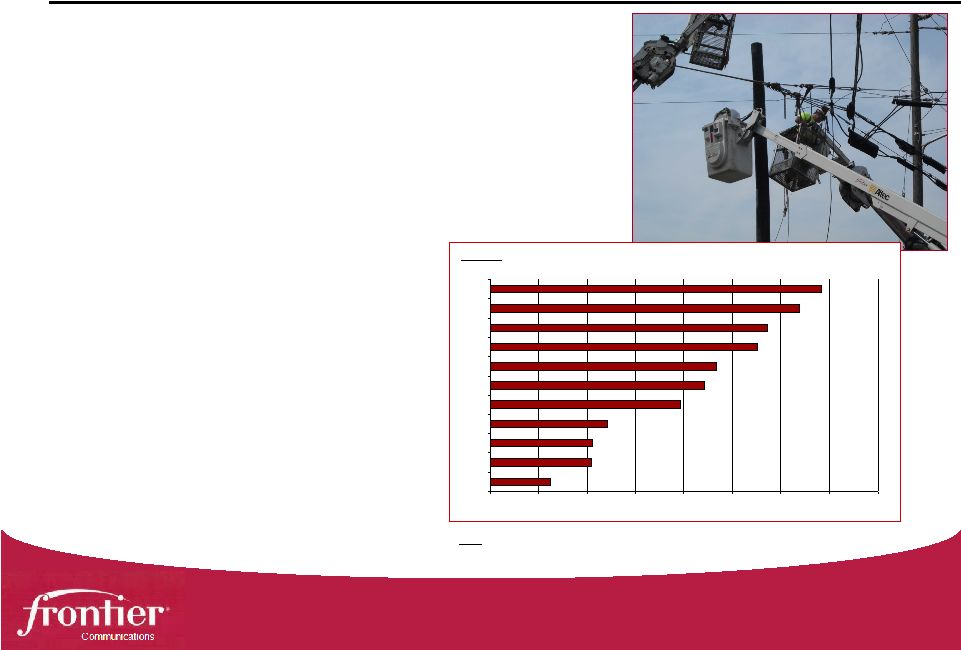 13 3. Consistent Execution of Operational Goals •Building a Culture that Drives Results • Hiring and Retaining “Great Athletes” • Ensuring Employees Have the Tools They Need to Be Successful • Innovative Solutions to Increase Workforce Efficiency • Standardized Field Processes • Cultivating Strong Relationships with our Labor Unions and Regulatory Agencies Notes 1. For the three months ended 9/30/08 EBITDA % 1 26.3% 30.5% 30.6% 32.1% 39.6% 42.1% 43.3% 47.5% 48.5% 51.9% 54.1% 20.0% 25.0% 30.0% 35.0% 40.0% 45.0% 50.0% 55.0% 60.0% FRP ALSK SURW Q CNSL DECC EQ CTL IWA WIN FTR |
 14 3. Consistent Execution of Operational Goals (continued) • Customers Have Demonstrated a Willingness to Pay for Quality • Development and Delivery of New Products and Services Provides Diversity for Our Revenue Stream $222 $249 $248 $240 $241 $240 $239 1,350 1,400 1,450 1,500 1,550 1,600 1,650 1,700 1,750 Q1 '07 Q2 '07 Q3 '07 Q4 '07 Q1 '08 Q2 '08 Q3 '08 $205 $210 $215 $220 $225 $230 $235 $240 $245 $250 $255 Residential Lines Residential Revenues • Frontier Provides Our Business Customers Multiple Options for Their Communications Needs • Today’s Business Customers Continue to Require Greater Bandwidth For Their Operations $195 $217 $215 $223 $220 $222 $220 790 800 810 820 830 840 850 860 Q1 '07 Q2 '07 Q3 '07 Q4 '07 Q1 '08 Q2 '08 Q3 '08 $180 $185 $190 $195 $200 $205 $210 $215 $220 $225 $230 Business Lines Business Revenues |
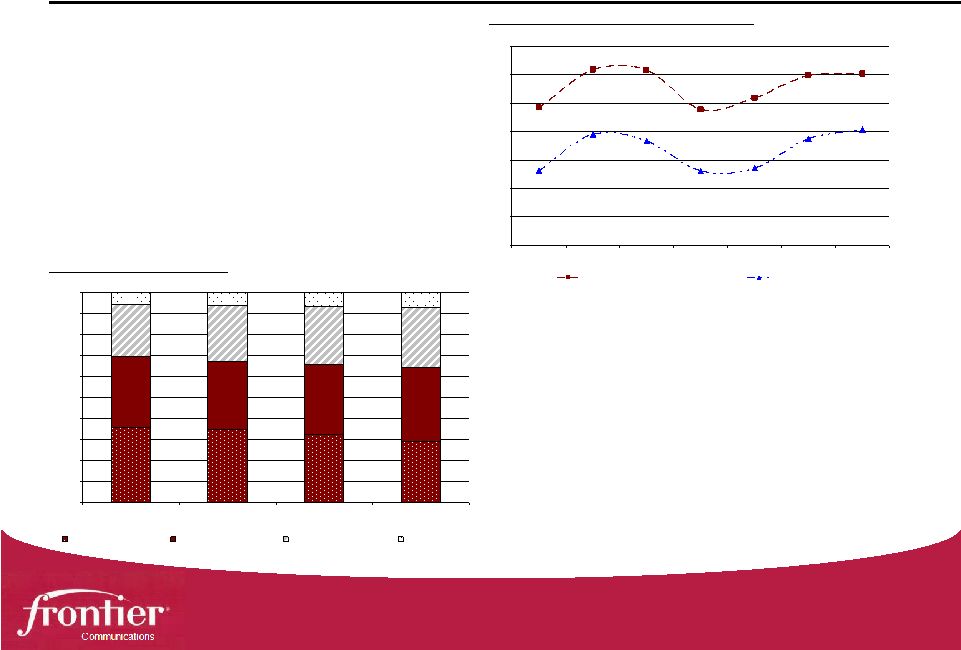 15 3. Consistent Execution of Operational Goals (continued) 36% 35% 33% 29% 34% 33% 33% 35% 25% 26% 28% 29% 6% 6% 7% 7% 0.0% 10.0% 20.0% 30.0% 40.0% 50.0% 60.0% 70.0% 80.0% 90.0% 100.0% Q4 '07 Q1 '08 Q2 '08 Q3 '08 Unbundled Single Play Double Play Triple Play Customer Segmentation • Providing Our Employees With The Tools Needed To Help Our Customers Understand Our Value Proposition • Delivering Value Added Products And Services To Our Customers Enables Us To Capture Increased Wallet Share 0.5% 0.7% 0.9% 1.1% 1.3% 1.5% 1.7% 1.9% Q1 '07 Q2 '07 Q3 '07 Q4 '07 Q1 '08 Q2 '08 Q3 '08 Double Triple Churn Levels For Customer Bundles |
 16 4. Consistent Execution of Financial Goals (continued) • Strong, Stable Free Cash Flow Generation • Maintaining Stable Revenues • Delivering Quality Products and Services our Customers Want • Driving Customer Revenues 1 • Industry Leading EBITDA Margins $222 $195 $139 $249 $217 $113 $248 $215 $113 $240 $223 $114 $241 $220 $108 $240 $222 $101 $239 $220 $100 - $100 $200 $300 $400 $500 $600 Q1 '07 Q2 '07 Q3 '07 Q4 '07 Q1 '08 Q2 '08 Q3 '08 Residential Revenues Business Revenues Regulatory Revenues $222 $249 $248 $240 $241 $240 $239 $195 $217 $215 $223 $220 $222 $220 $63.37 $61.53 $62.14 $63.11 $63.88 $65.07 $65.89 $40.00 $45.00 $50.00 $55.00 $60.00 $65.00 $70.00 Q1 '07 Q2 '07 Q3 '07 Q4 '07 Q1 '08 Q2 '08 Q3 '08 $ $100 $200 $300 $400 $500 $600 Residential Revenues Business Revenues Avg. Mthly Cust. Rev / Avg. Access Line Notes 1. Customer revenue is defined as total revenue less access services. Access services include switched network access and subsidies. 2. The reduction in Average monthly Customer Revenue / Average access line between Q1 ’07 and Q2 ’07 was due in part to the acquisition of Commonwealth Telephone 2 |
 17 4. Consistent Execution of Financial Goals (continued) • Solid Balance Sheet • Investment Grade Debt Covenants • No Debt Refinancing Needed Until 2011 • Effective Q4 2008, Utilizing Residual Free Cash Flow to De-Lever $0 $200 $400 $600 $800 $1,000 $1,200 2008 2009 2010 2011 2012 2013 2014-19 2020-24 2025-29 2030-34 2035-39 2040+ Senior Notes / Debentures Industrial Revenue Bonds Rural Utilities Service Loan Contacts Subsidiary Senior Notes CoBank Facility (fully-drawn) Revolving Credit Facility (availability) |
 18 5. Disciplined Growth Strategy • Well Positioned for Continued Industry Consolidation • Clearly Established Acquisition Criteria • Proven Integration Process Provides Confidence in Achieving Synergy Targets ~ 6.5x EBITDA Purchase Price ~ $15MM Revenue ~ 14,000 Access Lines ~ 7.0x EBITDA Purchase Price $45MM or ~ 29% of Cash OPEX Revised Synergy Estimates Global Valley Networks Target $30MM or ~ 20% of Cash OPEX Anticipated Synergies at Close ~ 435,000 Access Lines ~ $327MM Revenue Commonwealth Telephone Target Strategic Accomplishments |
 19 What You Can Expect From Us • Provide a Unique Customer Experience • Annual Growth in Customer Revenue • New Products and Innovative Marketing • Consistently Strong EBITDA Margins • Continuous Achievement of Cost Reduction Initiatives • Efficient Execution of Our Operating Strategy • “Competitively Fit” – Lean & Flexible • Shareholder Friendly Actions • Sustainable Consistent Dividend • Smart Utilization of Residual Free Cash Flow • Historically – Share Repurchases • Effective Q4 2008 – Focus on De-leveraging |
 Questions |
 Appendix |
 22 Selected Financial Metrics 23.1% $528 13.8% $316 54.7% 21.5% 0.9% 2 $1,809 $2,288 2007 22.7% $384 12.1% $204 54.3% 24.9% (0.4%) 3 $1,381 $1,690 YTD-9’08 $2,025 $2,017 $2,022 Revenue $562 $544 $503 Free Cash Flow 5 $269 $259 $264 CAPEX $1,597 $1,586 $1,565 Customer Revenue 1 - % of Revenue - % of Revenue EBITDA Margin % 4 HSI Penetration - % Growth ($ in Millions) 27.7% 27.0% 24.9% 13.3% 12.8% 13.1% 55.7% 55.3% 54.5% 18.5% 14.2% 9.4% 0.7% 1.3% 1.5% 2006 2005 2004 Notes 1. Customer revenue is defined as total revenue less access services. Access services include switched network access and subsidies. 2. % Growth for 2007 excludes $196.4M of revenue from acquisitions in 2007. 3. % Growth for YTD Q2 2008 compares YTD Q2 2008 results versus YTD Q2 2007 results ProForma for an additional 2.25 months of CTE, the acquisition of GVN and the sale of the CTE Equipment Co. 4. For a detailed definition please refer to page 24. 5. Free cash flow includes ELI for all years prior to its sale in July of 2006. For a detailed definition of free cash flow, refer to page 24. |
 23 Reconciliation of Non-GAAP Financial Measures YTD ($ in 000's) 2004 2005 2006 2007 Q3 2008 EBITDA (Operating Cash Flow) Operating Income 460,301 $ 588,968 $ 644,490 $ 705,416 $ 490,522 $ Add back: Depreciation and amortization 549,381 520,204 476,487 545,856 422,986 EBITDA (Operating Cash Flow), as reported 1,009,682 $ 1,109,172 $ 1,120,977 $ 1,251,272 $ 913,508 $ Add back: Severance and early retirement costs 1,182 6,981 7,193 13,874 3,598 Pension Curtailment Gain (Non Cash) - - - (14,379) - Management succession and strategic alternatives expenses 90,632 - - - - EBITDA (Operating Cash Flow), as adjusted 1,101,496 $ 1,116,153 $ 1,128,170 $ 1,250,767 $ 917,106 $ Revenue 2,022,378 $ 2,017,041 $ 2,025,367 $ 2,288,015 $ 1,689,626 $ EBITDA (Operating Cash Flow), as adjusted as % of Revenue 54.5% 55.3% 55.7% 54.7% 54.3% For the years ended December 31, |
 24 Reconciliation of Non-GAAP Financial Measures Notes 1. Includes premium paid on debt repurchase in second quarter. YTD ($ in 000's) 2004 2005 2006 2007 Q3 2008 Net Income Available to Common Shareholders to Free Cash Flow Net income available to common shareholders 72,150 $ 202,375 $ 344,555 $ 214,654 $ 148,362 $ Add back: Depreciation and amortization 549,381 520,204 476,487 545,856 422,986 Income tax expense 4,247 75,270 136,479 128,014 76,717 Management succession and strategic alternatives expenses 90,632 - - - - Stock based compensation 10,963 8,427 10,340 9,022 9,211 Subtract: Cash paid (refunded) for income taxes (4,901) 4,711 5,365 54,407 70,174 Pension Curtailment Gain (Non-Cash) - - - 14,379 - Other income (loss), net (34,242) (2,843) 60,271 (15,038) (1) (1,215) Capital expenditures 263,949 259,448 268,806 315,793 204,199 Gain on sale of discontinued operations - 1,167 71,635 - - Free cash flow 502,567 $ 543,793 $ 561,784 $ 528,005 $ 384,118 $ Revenue 2,022,378 $ 2,017,041 $ 2,025,367 $ 2,288,015 $ 1,689,626 $ Free cash flow as % of Revenue 24.9% 27.0% 27.7% 23.1% 22.7% For the years ended December 31, |
 Frontier Communications |