UNITED STATES SECURITIES AND EXCHANGE COMMISSION
Washington, D.C. 20549
FORM 10-K
x ANNUAL REPORT PURSUANT TO SECTION 13 OR 15(d) OF THE SECURITIES EXCHANGE ACT OF 1934
For the fiscal year ended December 31, 2024
or
¨ TRANSITION REPORT PURSUANT TO SECTION 13 OR 15(d) OF THE SECURITIES EXCHANGE ACT OF 1934
For the transition period from _________ to ___________
Commission file number 001-11001

FRONTIER COMMUNICATIONS PARENT, INC.
(Exact name of registrant as specified in its charter)
|
|
|
Delaware |
| 86-2359749 |
(State or other jurisdiction of |
| (I.R.S. Employer Identification No.) |
incorporation or organization) |
|
|
|
|
|
1919 McKinney Avenue |
|
|
Dallas, Texas |
| 75201 |
(Address of principal executive offices) |
| (Zip Code) |
|
|
|
Registrant's telephone number, including area code: (972) 445-0042
Securities registered pursuant to Section 12(b) of the Act:
Title of each class |
| Trading Symbol |
| Name of each exchange on which registered |
Common Stock, par value $0.01 per share |
| FYBR |
| The NASDAQ Stock Market LLC |
Indicate by check mark if the registrant is a well-known seasoned issuer, as defined in Rule 405 of the Securities Act. Yes __ No _X_
Indicate by check mark if the registrant is not required to file reports pursuant to Section 13 or 15(d) of the Act. Yes __ No X
Indicate by check mark whether the registrant (1) has filed all reports required to be filed by Section 13 or 15(d) of the Securities Exchange Act of 1934 during the preceding 12 months (or for such shorter period that the registrant was required to file such reports), and (2) has been subject to such filing requirements for the past 90 days. Yes X No __
Indicate by check mark whether the registrant has submitted electronically and posted on its corporate Website, if any, every Interactive Data File required to be submitted and posted pursuant to Rule 405 of Regulation S-T during the preceding 12 months (or for such shorter period that the registrant was required to submit and post such files). Yes X No __
Indicate by check mark whether the registrant is a large accelerated filer, an accelerated filer, a non-accelerated filer, a smaller reporting company, or an emerging growth company. See definition of “large accelerated filer”, “accelerated filer,” “smaller reporting company”, and “emerging growth company” in Rule 12b-2 of the Exchange Act. (Check one):
Large Accelerated Filer x Accelerated Filer o Non-Accelerated Filer o
Smaller Reporting Company o Emerging Growth Company o
If an emerging growth company, indicate by check mark if the registrant has elected not to use the extended transition period for complying with any new or revised financial accounting standards provided pursuant to Section 13(a) of the Exchange Act. o
Indicate by check mark whether the registrant has filed a report on and attestation to its management’s assessment of the effectiveness of its internal control over financial reporting under Section 404(b) of the Sarbanes-Oxley Act (15 U.S.C. 7262(b)) by the registered public accounting firm that prepared or issued its audit report. x
If securities are registered pursuant to Section 12(b) of the Act, indicate by check mark whether the financial statements of the registrant included in the filing reflect the correction of an error to previously issued financial statements. o
Indicate by check mark whether any of those error corrections are restatements that required a recovery analysis of incentive-based compensation received by any of the registrant’s executive officers during the relevant recovery period pursuant to §240.10D-1(b). o
Indicate by check mark whether the registrant is a shell company (as defined in Rule 12b-2 of the Exchange Act). Yes __ No X
The aggregate market value of common stock held by non-affiliates of the registrant on June 30, 2024, based on the closing price per share on such date was $6.4 billion. The number of shares outstanding of the registrant's common stock as of February 17, 2025 was 249,701,000.
DOCUMENT INCORPORATED BY REFERENCE
Portions of the proxy statement for the Registrant’s 2024 Annual Meeting of Stockholders are incorporated by reference in Part III of this Annual Report on Form 10-K.
PART I
Unless the context indicates otherwise, the use of the terms the "Company,” “Frontier”, “we,” “us” or “our” shall refer to Frontier Communications Parent, Inc.
Overview
Frontier is a leading communications and technology provider offering broadband services to 3.1 million broadband customers in 25 states as of December 31, 2024. We are building critical infrastructure across the country with our fiber-optic network and cloud-based solutions, enabling secure high-speed connections. Driven by our purpose of Building Gigabit AmericaTM, we are focused on supporting a digital society, closing the digital divide, and working toward a more sustainable environment.
Our investment strategy is underpinned by the rapid growth in demand for high-speed broadband, with data usage per household expected to grow significantly through over-the-top video consumption, more connected devices per household, and increased demand for upstream data (e.g., videoconferencing and gaming). We believe that our ability to provide symmetrical high-speed connectivity through our fiber-optic technology provides competitive advantages, and that we are well positioned to meet this growing demand with faster upload and download speeds, and lower latency than our competition.
In August 2021, we announced our plan to pass 10 million total locations with fiber. We prioritize our activities to locations that we believe will provide the highest investment returns. As we implement our fiber expansion plan, we expect our business mix will shift significantly, with a larger percentage of revenue coming from fiber.
On September 4, 2024 we entered into a merger agreement (the “Merger Agreement”) with Verizon Communications Inc. (“Verizon”), pursuant to which, subject to certain terms and conditions therein, Verizon will acquire Frontier for $38.50 per share in cash (the “Merger”), representing a premium of 43.7% to Frontier’s 90-Day volume-weighted average share price (VWAP) on September 3, 2024, the last full trading day prior to published market speculation regarding a potential sale of Frontier. Subject to receipt of certain required regulatory approvals and other customary conditions specified in the Merger Agreement, we currently expect the Merger to close by the first quarter of 2026. See Note 2 - ‘‘Merger Agreement’’ to the Consolidated Financial Statements included in Part II of this Annual Report for more detail.
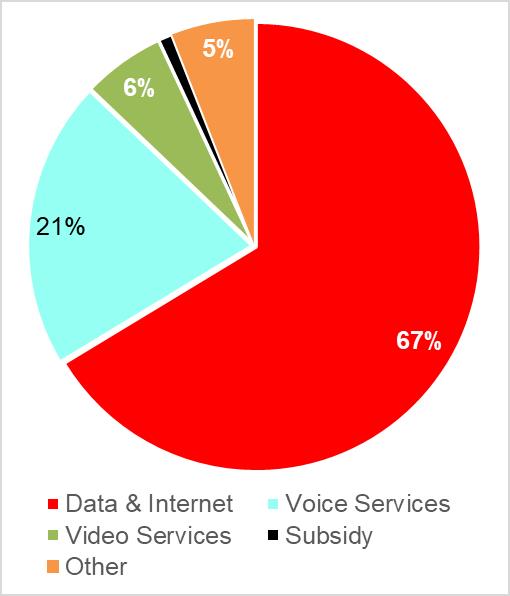
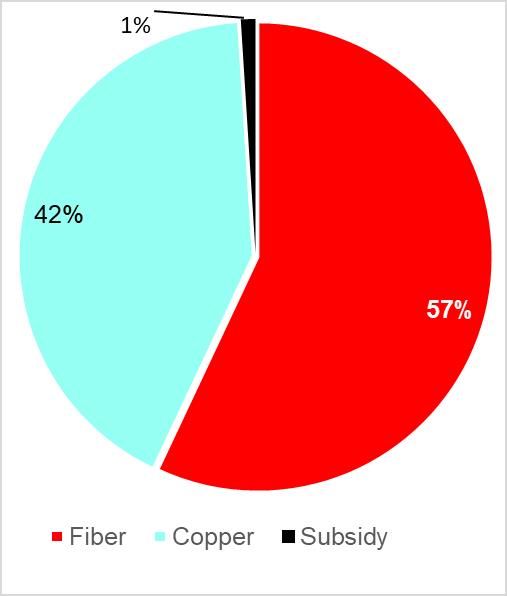
We generated revenue of approximately $5.9 billion for the year ended December 31, 2024 with approximately 57% of our revenue attributable to our fiber-optic products and 42% of our revenue related to our copper products. Over time, we expect our business mix will shift significantly, with a larger percentage of revenue coming from fiber as we implement our expansion plan.
|
|
|
|
|
Revenue by Product |
| Revenue by Customer |
| Revenue by Technology |
|
|
|
|
|
|
| 
|
| 
|
|
|
|
|
|
In 2024, we advanced our purpose of Building Gigabit America and made substantial progress in executing on our four key strategic priorities: fiber deployment, fiber penetration, improving the customer experience, and operational efficiency.
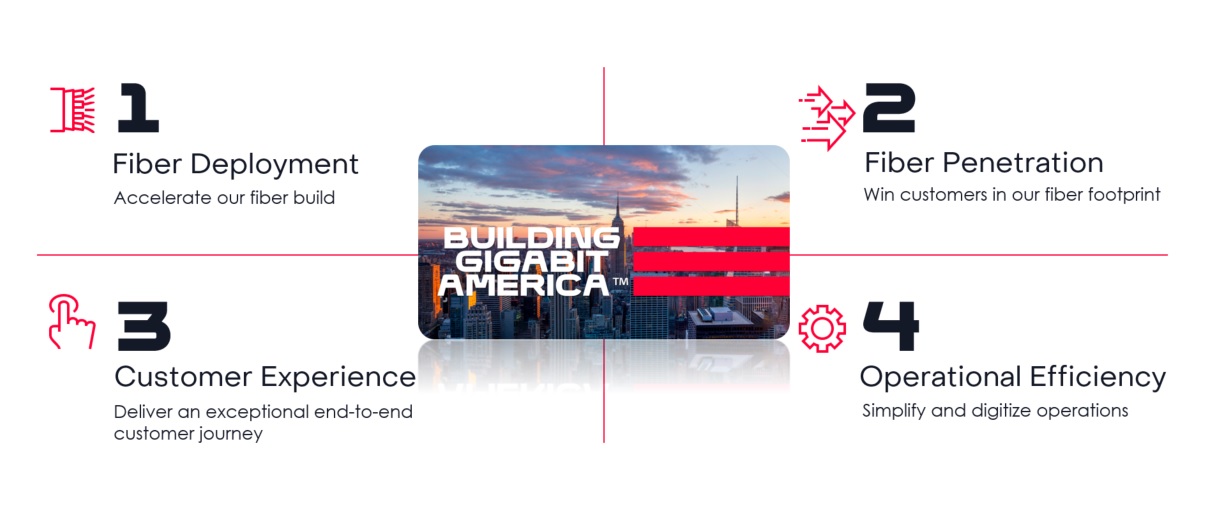
Key milestone accomplishments against these four strategic priorities in 2024 include:
Fiber Deployment: We met our 2024 build plan, adding approximately 1.3 million new fiber locations. As of December 31, 2024, we had approximately 7.8 million total locations passed with fiber, more than doubling our fiber footprint since we started our build in 2020. Our build plan is solidified by multi-year agreements with key labor and equipment partners.
The following table shows our fiber passings as of December 31, 2024, 2023, 2022, 2021 and 2020:
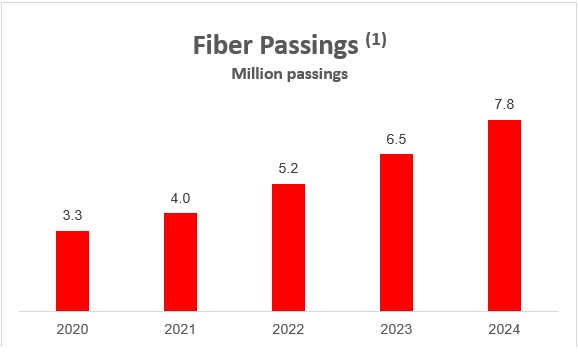
(1)Fiber passings represent our estimate of the number of locations, such as single-family units, apartment and condominium units, and small and medium businesses passed by our fiber distribution network in areas where we offer service and that are open to Frontier sales efforts.
Fiber Penetration: We strive to deliver new best-in-market products to meet customer demands and increase penetration across our fiber footprint. We are targeting terminal penetration of 45% or higher in markets we have passed with fiber.
In 2024, we added a record 385,000 fiber broadband customer net additions, resulting in fiber broadband customer growth of 19% as compared to 2023. Fiber broadband customer net additions continued to outpace copper broadband customer net losses, resulting in 151,000 total broadband customer net additions in 2024.
These record fiber broadband net additions resulted in rising fiber broadband customer penetration across our footprint.
oIn our base fiber footprint, which consists of the 3.2 million locations that we passed with fiber at the end of 2019, penetration increased to 46.2% at the end of 2024, up from 44.5% at the end of 2023.
oIn our expansion fiber footprint, which consists of the new locations that we passed with fiber since the beginning of 2020, penetration increased to 19.6% at the end of 2024, up from 17.5% at the end of 2023.
Customer Experience: In 2024, we continued to focus on improving our customer service by systematically removing reasons why customers needed to call us and introducing new digital self-service tools. Among other results:
oFiber broadband churn remained low at 1.36% in 2024.
oWe reduced customer contacts into call centers by 1 million from 2023 to 2024.
Operational Efficiency: Across the company, we have identified opportunities to simplify and digitize our operations. We achieved our annualized gross run rate cost savings target of $500 million in 2023 – double our initial target of $250 million. As of December 31, 2024, we had realized $597 million of gross annualized cost savings.
Customers
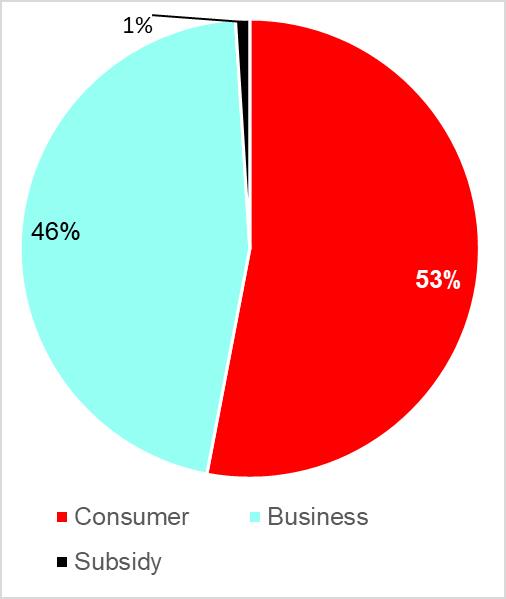
We deliver communications and technology services to consumer and business customers.
Consumer
Our consumer customers include customers in single or multi-family units. We provide broadband, video, voice and other value-added services and products to our consumer customers over both fiber and copper-based networks.
Business
Our business customers include larger enterprise customers, small and medium businesses (“SMB”), and wholesale customers.
oLarger Enterprise: These customers consist of Fortune 1000 companies, companies with multiple locations, large government entities, educational institutions, and non-profits.
oSmall and Medium Business: These customers consist of single location and smaller multi-location companies, as well as mid-sized government entities, educational institutions, and non-profits.
oWholesale: These customers are often referred to as carriers or service providers and use our network facilities to provide services to their customers. Our wholesale customers include local, long distance, wireless, cable and other carriers. These companies need Frontier’s network to access locations within our footprint to offer their services. Wholesale customers buy both voice and data services to supplement their own network infrastructure.
Services
We offer a broad portfolio of communications and technology services for consumer and business customers. These services are offered on either a standalone basis or in a bundled package based on individual customer needs.
Data and Internet Services: We offer a comprehensive range of broadband and networking services. The principal consumer and SMB services we provide are broadband internet and related value-added services. Larger enterprise business services include a complete portfolio of ethernet services, dedicated Internet, software defined wide area network (“SDWAN”), managed Wi-Fi, traditional circuit-based data services, and optical transport services. These services are all supported by 24/7 technical support and an advanced network operations center. We also provide wireless broadband services (via unlicensed spectrum) in select markets utilizing networks that we own or operate.
Voice Services: We offer voice services, including data-based voice over internet protocol (“VoIP”) and unified communications as a service (“UCaaS”), long-distance and voice messaging services, to consumer and business customers in all our markets. These services are billed monthly in advance. Long-distance service to and from points outside our operating properties are provided by interconnection with the facilities of other carriers. Our long-distance services are billed in advance for unlimited use service and billed in arrears for usage-based services.
Video Services: We provide video services under the Frontier TV brand in some of our markets, including portions of California, Indiana, Texas, Florida, and Connecticut. We also offer satellite TV video service to our customers under various agency relationships with satellite providers and Over the Top (“OTT”) video through partnerships with OTT video providers.
Access Services: We offer a range of access services. Our switched access services allow other carriers to use our facilities to originate and terminate their local and long-distance voice traffic. These services are generally offered on a month-to-month basis, and the service is billed primarily on a minutes-of-use basis. Switched access charges are based on access rates filed with the Federal Communications Commission (“FCC”) for interstate services, and with the respective state regulatory agency for intrastate services. See “Regulatory Environment” below.
Advanced Hardware and Network Solutions: We offer our SMB and larger enterprise customers various hardware and network solutions utilizing cloud functionality, including end-to-end solutions like cloud managed services and Managed Wireless LAN. We offer third-party communications equipment tailored to their specific business needs through partnering with other providers.
Bundles: We also provide packages of services. These packages permit customers to bundle their products and services, including voice service, video, and broadband services, as well as other value-added services and product offerings.
Network Architecture and Technology
Our local exchange carrier networks consist of host central office and remote sites, primarily equipped with digital and Internet Protocol switches. The outside plant consists of transport and distribution delivery networks connecting our host central office with remote central offices, and ultimately, with our customers. We own fiber optic and copper cable, which have been deployed in our networks and are the primary transport technologies between our host and remote central offices, and interconnection points with other communication carriers.
We have expanded and enhanced our fiber-optic and copper transport systems to support increasing demand for high bandwidth transport services. Our core fiber network is currently being upgraded to support up to 400 Gbps and in the future we believe will be capable of 800 Gbps and higher with limited additional investment. We routinely enhance our networks and upgrade with Internet protocol transport and routing equipment, reconfigurable optical add/drop multiplexer transport systems, passive optical networks, ultra-high speed digital subscriber line broadband equipment, and VoIP switches. These systems support advanced services such as ethernet, dedicated Internet, VoIP, and SDWAN.
We connect to households and business locations in our service territory using fiber-optic, copper, or fixed wireless technologies. In some cases, we provide direct fiber into a residence (fiber-to-the-home) or business premise. In other cases, a location is served with a combination of fiber and copper. We provide data, video, and voice services to customers over both architectures. Additionally, we provide service using fixed wireless broadband and which is deployed for some business ethernet services.
Competition
Competition within the wireline communications industry is intense. Technological advances as well as regulatory and legislative changes have enabled a wide range of historically non-traditional communications service providers to compete with traditional providers such as Frontier. More market participants are now competing to meet the communications needs of the same customer base, thus increasing competitive pressures.
We face competition from cable operators, wireless carriers, satellite providers, wireline carriers, fiber “overbuilders,” and OTT video providers:
-Cable Operators: Cable operators offer high speed internet, video, and voice services, and compete with us aggressively for consumer and business customers on speed and price, primarily by marketing with significant promotional period pricing.
-Wireless Carriers: Wireless carriers offer broadband, video and voice services and compete with us for consumer and business customers by offering increasingly larger data packages that utilize the latest 5G technology to mobile customers.
-Satellite Providers: Satellite providers offer broadband and video services and compete with us for consumer and business customers.
-Wireline Carriers / Fiber Overbuilders: The demand for high-speed data is continuing to attract new entrants into markets, including Frontier’s markets. These new entrants offer broadband, video and voice services and compete directly for Frontier’s customers.
-OTT Video Providers: Many consumers are opting for OTT video services rather than traditional, multi-channel video services. We have made investments in our network to deliver OTT video content to consumers who might not opt for traditional video services. Additionally, we have developed partnerships with leading OTT providers to offer their services to our customers.
Many of our competitors are larger, have stronger brand recognition, have more service offerings, and have greater financial resources than we currently do. All these factors create potential downward pressure on the demand for and pricing of our services. Further, many of our competitors are not subject to the same regulations as traditional communications providers such as Frontier and have lower cost structures than we do. The industry has also experienced substantial consolidation in recent years, leading to competitors with significant scale.
However, for the majority of our locations passed, we currently face competition from no more than one wireline competitor. In addition, we operate in many dense, urban markets with favorable demographic characteristics that correlate to higher broadband
usage. As an example, we have a strong presence in Texas and Florida, the two states in the U.S. with the highest population gains from 2010 to 2021. Given our footprint, we believe we are well positioned to capitalize on attractive demographic trends.
Competition for consumer customers is based on price, bandwidth, quality, and speed of service, including promotions as well as bundling of service offerings. Our focus is to improve our customer experience by efficiently responding to their specific needs. We believe this will improve overall service quality and encourage migration to higher speed Internet services.
Competition for business customers is also based on price, bandwidth, quality, and speed of service, including pricing and promotions and bundled offerings. As compared to our consumer customers, business customers often require more sophisticated and more data-centered solutions (e.g., IP PBX, ethernet and SIP trunking). To differentiate ourselves from other service providers, Frontier delivers end-to-end solutions such as cloud managed services and managed wireless LAN.
As customers continue to migrate to OTT video models, broadband is a core growth component for attracting and retaining consumer customers as well as our smaller business customers. We are committed to growing our customer base through providing higher broadband speeds and capacities that we believe will enable us to reach new markets, target new customers, and grow our business while maximizing our full geographic footprint.
In addition to the focus on our broadband capabilities, we continue to evolve our other product offerings to meet the changing needs of the market, provide strong customer service and support, invest in our network to enable capacity and capabilities, and package our offerings at attractive prices. We are continuing to execute on our initiatives to build out and invest in our fiber network, drive operational performance, increasingly win more customers in our footprint, deliver an exceptional customer journey, and simplify our operations.
Regulatory Environment
Some of our operations are subject to regulation by the FCC and various state regulatory agencies, often called public service or utility commissions. We expect federal and state lawmakers, the FCC, and the state regulatory agencies to continue to revise and enforce the statutes and regulations governing communications services.
Regulation of Our Business
We are subject to federal, state, and local regulation and we have various regulatory authorizations for our regulated service offerings. At the federal level, the FCC generally exercises jurisdiction over information services, interstate, or international telecommunications services and over facilities to the extent they are used to provide, originate, or terminate interstate or international services. State regulatory commissions generally exercise jurisdiction over intrastate telecommunications services and the facilities used to provide, originate, or terminate those services. Most of our local exchange companies operate as incumbent carriers in the states in which they operate and are certified in those states to provide local telecommunications services. Certain federal and state agencies, including attorneys general, monitor and exercise oversight related to consumer protection issues, including marketing, sales, provision of services, and service charges. In addition, local governments often regulate the public rights-of-way necessary to install and operate networks and may require service providers to locate and work around other utility facilities and obtain licenses or franchises to use public rights-of-way. Municipalities and other local government agencies also may regulate other aspects of our business, by requiring us to obtain licenses and construction permits and to abide by applicable regulations and requirements.
Some state regulatory agencies have substantial oversight over incumbent telephone companies, and their interconnection with competitive providers and provision of non-discriminatory network access to certain network elements to them. Under the Federal Telecommunications Act of 1996, state regulatory commissions have jurisdiction to set certain rates, arbitrate, and review interconnection disputes and agreements between incumbent telephone companies and CLECs, in accordance with rules set by the FCC. The FCC and some state regulatory commissions also impose fees on providers of telecommunications services to support the federal and state universal service programs. Many of the states in which we operate require prior approvals or notifications for certain acquisitions, transfers or encumbrances of assets, customers, or ownership of regulated entities. The FCC and certain states also require certain approvals or notifications to discontinue the use of certain telecommunications facilities and the provision of some services.
Additionally, in some states we are subject to operating restrictions and minimum service quality standards. Failure to meet either may result in penalties or other obligations, including subjecting the Company to additional reporting and compliance obligations. In some of our markets, the Company has also agreed to and been required by certain states to comply with additional service quality, expenditures, reporting, and other requirements. We also are required to report certain financial information. At the federal level and in a number of the states in which we operate, we are subject to price cap or incentive regulation plans under which prices for regulated services are capped. Some of these plans have limited terms and, as they expire, we may need to renegotiate with various states. These negotiations could impact rates, service quality, and/or infrastructure requirements, which could also impact our earnings and capital expenditures. In other states, we are subject to regulation that limits levels of earnings and returns on investments. We continue to advocate for competitive neutral policies and no or reduced regulation in all states. In some of the states where we operate in, we have already been successful in reducing or eliminating price regulation on end-user services.
Frontier, along with all telecommunications providers, is subject to federal and state rules governing certain of our operations and services, including the privacy of specified customer information. Among other things, these privacy-related rules obligate carriers to implement procedures to: protect specified customer information from inappropriate disclosure; obtain customer permission to
use specified information in marketing; authenticate customers before disclosing account information; and periodically certify compliance with certain rules. Although most of these regulations are generally consistent with our business plans, they may restrict our flexibility in operating our business.
Some regulations are, or could in the future be, the subject of judicial proceedings, legislative hearings and administrative proposals or challenges that could change the manner in which the entire industry operates or the way we provide services. Neither the outcome of any of these developments, nor their potential impact on us, can be predicted at this time. Regulatory oversight and requirements can change rapidly in the communications industry, and such changes may have an adverse effect on us.
The current status of material regulatory initiatives is as follows:
Connect America Fund (“CAF”)/ Rural Digital Opportunity Fund (“RDOF”):
In 2015, Frontier accepted the FCC’s CAF Phase II offer, which provided $313 million in annual support through 2021 in return for the Company’s commitment to make broadband available to households within the CAF II areas in our existing 25 states. The Company was required to complete the CAF II deployment by December 31, 2021. Thereafter, USAC and the FCC have been reviewing carriers’ CAF II program completion data, and should USAC or the FCC determine that the Company did not satisfy certain applicable CAF Phase II requirements, Frontier could be required to return a portion of the funds previously received and may be subject to certain other fines, requirements and obligations.
On January 30, 2020, the FCC adopted an order establishing the RDOF competitive reverse auction to provide support to serve high-cost areas. Frontier was awarded approximately $371 million over ten years to build gigabit-capable broadband over a fiber-to-the-premises network to approximately 127,000 locations in eight states (California, Connecticut, Florida, Illinois, New York, Pennsylvania, Texas, and West Virginia). We began receiving RDOF funding in the second quarter of 2022 and we will be required to complete the buildout to the awarded locations by December 31, 2028, with interim target milestones over this period. To the extent that Frontier is unable to fulfill the RDOF requirements, meet the milestones or construct to all locations by the required deadlines, funding provided to us can be discontinued and Frontier could be required to return a portion of funds previously received and may be subject to certain fines, requirements and obligations. Fines and penalties could also be assessed to the extent Frontier were ever to decide to surrender RDOF locations previously awarded.
Federal Funding Initiatives: The Federal government has undertaken several measures to facilitate enhanced access to high-speed broadband, including through several new funding programs. As these large amounts of federal funding flow through the broadband ecosystem, we will evaluate and pursue funding opportunities that make sense for our business. Frontier does not know what funding it may receive the impact these programs may have, or changes that may be made to these programs, if any, in the future.
In November 2021, Congress passed the Infrastructure Investment and Jobs Act (“IIJA”). The IIJA funds several programs dedicated to broadband expansion and upgrades, including a $2 billion tribal broadband program, a $60 million Digital Equity fund, a $2 billion Rural Utilities Service loan and grants program, and a $1 billion middle mile grants program, in addition to other smaller amounts or amounts less directly related to deployment and adoption.
The IIJA also provides $65 billion to fund broadband connectivity programs, including broadband deployment to unserved and underserved locations. The National Telecommunications and Information Administration (NTIA) is administering the principal last mile infrastructure funding program in the amount of $42.5 billion, the Broadband Equity, Access & Deployment Program (BEAD), and will distribute funding through direct grants to states, who will then award the funds based on competitive grant programs. The NTIA has allocated approximately $25.5 billion to states in Frontier’s footprint. The requirements and funding under these programs is subject to change. We are closely tracking implementation of the BEAD program, including state determinations regarding subsidy award criteria. We are actively pursuing awards of these stimulus funds, however, we continue to evaluate our opportunities as the process is complex and any awards that we ultimately receive under the IIJA may require significant up-front capital expenditures or other costs.
Privacy
Our businesses are subject to federal and state laws and regulations that impose various restrictions and obligations related to privacy and the handling of customers’ personal information. Privacy-related legislation has been adopted in a number of states in which we operate. Certain state requirements give consumers increased rights including the right to know what personal information is being collected about them and obtain a copy of such information, opt-out of the sale of personal information or sharing of personal information for purposes of certain targeted advertising, and to request the correction or deletion of this information. Complying with such laws, as well as other legislative and regulatory action related to privacy, could result in increased costs of compliance, claims against the Company or investigations related to compliance, and increased uncertainty in the use and availability of certain consumer data.
Video Programming
Federal, state, and local governments extensively regulate the video services industry. Our linear video services are subject to, among other things: subscriber privacy regulations; requirements that we carry a local broadcast station or obtain consent to carry a local or distant broadcast station; rules for franchise renewals and transfers; the manner in which program packages are marketed to subscribers; and program access requirements.
We provide video programming in some of our markets including California, Connecticut, Florida, Indiana, and Texas pursuant to franchises, permits and similar authorizations issued by state and local franchising authorities. Most franchises require payment of a franchise fee as a requirement to the granting of authority.
Many franchises establish facilities and service requirements, as well as specific customer service standards and monetary penalties for non-compliance. Franchises are generally granted for fixed terms and must be periodically renewed.
Environmental Regulation
The local exchange carrier subsidiaries we operate are subject to federal, state, and local laws, and regulations governing the use, storage, disposal of, and exposure to hazardous materials, the release of pollutants into the environment and the remediation of contamination. As an owner and former owner of property, we are subject to environmental laws that could impose liability for the entire cost of cleanup at contaminated sites, including sites formerly owned by us or our predecessors, regardless of fault or the lawfulness of the activity that resulted in contamination. We believe that our operations are in substantial compliance with applicable environmental laws and regulations.
Segment Information
Our operations are managed and reported to our CEO, our chief operating decision maker (“CODM”), on a consolidated basis. The CEO assesses performance and allocates resources based on the consolidated results of operations. Under this organizational and reporting structure, we have one reportable segment.
Intellectual Property
We own or have licenses to various trademarks, trade names and intellectual property rights that are necessary for the operation of our business.
We own or have the rights to use various trademarks, service marks and trade names referred to in this report. Solely for convenience, we refer to certain trademarks, service marks and trade names in this report without the ™, SM and ® symbols. Such references are not intended to indicate, in any way, that we will not assert, to the fullest extent permitted by law, our rights to our trademarks, service marks and trade names. Other trademarks, trade names or service marks appearing in this report are the property of their respective owners.
Human Capital Management
We are building a high-performing and diverse workforce committed to our purpose of Building Gigabit AmericaTM. As of December 31, 2024, we had approximately 13,000 employees.
Our Board of Directors and executive leadership team oversee the execution of our fiber-first strategy: build fiber, sell fiber, improve the customer experience, and simplify operations. Motivated by a belief that Frontier’s success depends on our employees’ success, we strive to provide the skills they need to thrive by creating an inclusive culture that rewards them with competitive compensation and benefits, makes safety paramount, and nurtures professional and personal development.
Talent Engagement and Development
We continue to invest in making Frontier a great place to work, where people develop through support, challenge, respect, and reward. When we create a culture that allows our people to be themselves, we find that they become their best selves. And that makes us a better company.
In 2024, we continued to advance our culture through:
Employee Forums: Our leadership team hosts regular all-hands meetings to share progress on priorities and solicit feedback from employees. For example, our CEO’s monthly “Listen Live” events are open to all employees. During these calls, we discuss new products and programs, recognize individuals who go above and beyond, and answer our employees’ questions live.
Performance Management: Our end-to-end performance management program for non-union teammates reinforces goal setting, alignment to our strategic priorities, development planning, performance coaching and feedback enhancing our pay-for-performance culture.
Employee Development: We launched a new professional development program, Frontier Forward. Through the program, we are offering every leader and employee opportunities to learn, grow and develop in their career. This year, we also offered a range of mentoring opportunities and development workshops response to employee feedback.
Frontline Training: We added new programs to further develop our customer-facing teammates including training on our products, services and technology. Our Door-to-Door sales teams received individualized training to increase their sales potential through AI generated insights on their performance.
Recognition: We continued our Changemaker program, recognizing the most outstanding builders of Gigabit America. Every quarter we award winners, one of whom becomes Changemaker of the Year. We also launched a new program called Frontier Heroes that recognizes teammates who have performed courageous acts.
Community Engagement: Through our Broadband for Good program, our employees helped strengthen the communities we serve by donating fiber internet and critical resources to 50% more non-profits this year.
Health and Safety
The health and safety of our employees is our top priority, and 2024 was our safest year yet. We set new safety records for our company — building on our 2023 results with year-over-year improvements on key safety measures.
Our people made a collective effort to build a safer work environment, and we prioritized policies and habits that encompassed both industry best practices and the lessons employees learned on the job. We’re proud of how far we’ve come in building a safer work environment, and we’re constantly looking for ways to do better.
To continue to strengthen our safety culture, we use monthly scorecards to track and review our performance at every level of the organization– from EVPs to the frontline supervisors. We compare our performance against the Bureau of Labor Statistics for our industry category as well as research data and practices in similar industries to help with our assessments and, along with team-member feedback, to make improvements.
Across Frontier, senior leaders have embraced the importance of safety and promoting it across the organization. And out on the road, we are using telematics in our fleet to help reinforce our safety practices to ensure safety is part of our everyday working life in all corners of the company.
Our commitment to safety is guided by our Occupational Safety & Health Program and reinforced by our Environmental Health and Safety Methods and Procedures. Together, they provide a framework for identifying, controlling and reducing risks.
As a standard practice, we maintain environmental, health, and safety compliance programs, including ongoing safety training for our field technicians.
Our Workforce
Our employee base decreased by approximately 2% from approximately 13,300 employees as of December 31, 2023 to approximately 13,000 as of December 31, 2024. Approximately 66% of our total employees are represented by unions and are subject to collective bargaining agreements. The term of our collective bargaining agreements is typically three years and at any point in time we generally have several agreements under negotiation and on extension. Approximately 43% of our unionized employees are covered by collective agreements that are scheduled to expire in 2025. We consider our relations with our employees to be good.
In addition, our workforce is currently supplemented by approximately 126 contract workers, primarily in construction planning. We are a federal contractor and follow the rules set forth by the Department of Labor, Office of Federal Contract Compliance Programs (OFCCP), including those applicable to recruiting, hiring and diversity.
Available Information
We make available, free of charge on our website, our Annual Report on Form 10-K, Quarterly Reports on Form 10-Q, Current Reports on Form 8-K and amendments to these reports filed or furnished pursuant to Section 13(a) or 15(d) of the Securities Exchange Act of 1934, as amended (the “Exchange Act”), as soon as practicable after we electronically file these documents with, or furnish them to, the SEC. These documents may be accessed through our website at www.frontier.com under “Investors.” The information posted or linked on our website is not part of, or incorporated by reference into, this report. We also make our Annual Report available in printed form upon request at no charge.
We make available on our website, as noted above, or in printed form upon request, free of charge, our Corporate Governance Guidelines, Code of Business Conduct and Ethics, Specific Code of Business Conduct and Ethics Provisions for Certain Officers, and the charters for the Audit, Compensation and Human Capital, and Nominating and Corporate Governance Committees of the Board of Directors. Stockholders may request printed copies of these materials by writing to: 1919 McKinney Avenue, Dallas, Texas 75201 Attention: Corporate Secretary.
Forward-Looking Statements
This Annual Report on Form 10-K contains "forward-looking statements," related to future events. Forward-looking statements address our expectations or beliefs concerning future events, including, without limitation, the proposed Merger with Verizon, our future operating and financial performance, our ability to implement strategic initiatives, such as our fiber build and fiber penetration and our ability to realize cost savings initiatives, our ability to comply with the covenants in the agreements governing our indebtedness, our capital expenditures, and other matters. These statements are made based on management’s views and assumptions, as of the time the statements are made, regarding future events and performance and contain words such as “expect,” “anticipate,” “intend,” “plan,” “believe,” “seek,” “see,” “may,” “will,” “would,” or “target.” Forward-looking statements by their nature address matters that are, to different degrees, uncertain. We do not intend, nor do we undertake any duty, to update any forward-looking statements, except as required by law.
A wide range of factors could materially affect future developments and performance, including but not limited to:
the risk that the Merger may not be completed in a timely manner or at all;
the possibility that any or all of the various conditions to the consummation of the Merger may not be satisfied or waived, including the failure to receive any required regulatory approvals from any applicable governmental entities (or any conditions, limitations or restrictions placed on such approvals);
the possibility that competing offers or acquisition proposals for the Company will be made;
the occurrence of any event, change or other circumstance that could give rise to the termination of the Merger Agreement relating to the Merger, including in circumstances which would require the Company to pay a termination fee;
the effect of the pendency of the Merger on our ability to attract, motivate or retain key executives and employees, our ability to maintain relationships with our customers, suppliers and other business counterparties, or our operating results and business generally;
risks related to the Merger diverting management’s attention from the Company’s ongoing business operations;
the risk that the Company’s stock price may decline significantly if the Merger is not consummated;
our significant indebtedness, our ability to incur substantially more debt in the future, and covenants in the agreements governing our current indebtedness that may reduce our operating and financial flexibility;
declines in Adjusted EBITDA and revenue relative to historical levels that we are unable to offset;
economic uncertainty, volatility in financial markets, and rising interest rates could limit our ability to access capital or increase the cost of capital needed to fund business operations, including our fiber expansion plans;
our ability to successfully implement strategic initiatives, including our fiber buildout and other initiatives to enhance revenue and realize productivity improvements;
our ability to secure necessary construction resources, materials and permits for our fiber buildout initiative in a timely and cost-effective manner;
inflationary pressures on costs, including tight labor markets, increased fuel and electricity costs, and potential disruptions in our supply chain, which could adversely impact our financial condition or results of operations and hinder our fiber expansion plans;
our ability to effectively manage our operations, operating expenses, capital expenditures, debt service requirements and cash paid for income taxes and liquidity;
the impact of potential information technology or data security breaches or other cyber-attacks or other disruptions;
the impact of laws and regulations relating to the handling of privacy and data protection;
competition from cable, wireless carriers, satellite providers, wireline carriers, fiber “overbuilders” and Over-the-Top video providers, and the risk that we will not respond on a timely or profitable basis;
our ability to successfully adjust to changes in the communications industry, including the effects of technological changes and competition on our capital expenditures, products, and service offerings;
our ability to retain or attract new customers and to maintain relationships with existing customers, including wholesale customers;
our reliance on a limited number of key supplies and vendors;
declines in revenue from our voice services, switched and nonswitched access and video and data services that we cannot stabilize or offset with increases in revenue from other products and services;
our ability to secure, continue to use or renew intellectual property and other licenses used in our business;
our ability to dispose of certain assets or asset groups or to make acquisition of certain assets on terms that are attractive to us, or at all;
the effects of changes in the availability of and requirements for receiving federal and state universal service funding, grants or other subsidies to us and our competitors and our ability to obtain future subsidies;
our ability to comply with the applicable CAF II and RDOF requirements and the risk of discontinuance of funding, penalties, or obligations to return certain CAF II and RDOF funds;
our ability to defend against litigation or government investigations and potentially unfavorable results from current pending and future litigation or investigations;
our ability to comply with applicable federal and state consumer protection requirements;
the effects of governmental legislation and regulation on our business, including costs, disruptions, possible limitations on operating flexibility and changes to the competitive landscape resulting from such legislation or regulation;
the impact of regulatory, investigative, and legal proceedings and legal compliance risks;
our ability to effectively manage service quality in the states in which we operate and meet mandated service quality metrics or regulatory requirements;
the effects of changes in income tax rates, tax laws, regulations, or rulings, or federal or state tax assessments, including the risk that such changes may benefit our competitors more than us, as well as potential future decreases in the value of our deferred tax assets;
the effects of changes in accounting policies or practices;
our ability to successfully renegotiate union contracts;
the effects of increased medical expenses and pension and postemployment expenses;
changes in pension plan assumptions, interest rates, discount rates, regulatory rules, and/or the value of our pension plan assets;
the impact of adverse changes in economic, political and market conditions in the areas that we serve, the U.S. and globally, including but not limited to, disruption in our supply chain, inflation in pricing for key materials or labor, the imposition of trade tariffs or other adverse changes resulting from epidemics, pandemics, and outbreaks of contagious diseases, natural disasters, economic or political instability, terrorist attacks and wars, including the ongoing war in Ukraine and the Israel-Hamas war, or other adverse widespread developments;
potential adverse impacts of climate change and increasingly stringent environmental laws, rules and regulations, and customer expectations and other environmental liabilities;
potential adverse impacts from natural disasters, wildfires and other severe weather events impacting our network operations and customer base in certain markets;
market overhang due to substantial common stock holdings by our former creditors;
certain provisions of Delaware law and our certificate of incorporation that may prevent efforts by our stockholders to change the direction or management of our company; and
certain other factors set forth in our other filings with the SEC.
This list of factors that may affect future performance and the accuracy of forward-looking statements is illustrative and is not intended to be exhaustive. Any of the foregoing events, or other events, could cause our results to vary from management’s forward-looking statements included in this report. You should consider these important factors, as well as the risks set forth under Item 1A. “Risk Factors,” in evaluating any statement in this report or otherwise made by us or on our behalf.
ITEM 1A. Risk Factors
Before you make an investment decision with respect to any of our securities, you should carefully consider all the information we have included in this Annual Report on Form 10-K and our subsequent filings with the SEC. In particular, you should carefully consider the risk factors described below and the risks and uncertainties related to “Forward-Looking Statements,” any of which could materially adversely affect our business, operating results, financial condition, and the actual outcome of matters as to which forward-looking statements are made in this annual report. The risks and uncertainties described below are not the only ones facing Frontier.
Additional risks and uncertainties that are not presently known to us or that we currently deem immaterial or that are not specific to us, may also adversely affect our business and operations. The following risk factors should be read in conjunction with the balance of this annual report, including the consolidated financial statements and related notes included in this report.
Risks Related to the Proposed Merger with Verizon
The Merger may not be completed on the terms or timeline currently contemplated or at all, which could adversely affect our stock price, business, financial condition and results of operations.
On September 4, 2024, the Company entered into the Merger Agreement with Verizon, which provides that the consummation of the Merger is subject to certain conditions, including (i) the Company Stockholder Approval; (ii) the expiration or early termination of the applicable waiting period under the Hart-Scott-Rodino Antitrust Improvements Act of 1976, as amended (the “HSR waiting period”); (iii) the receipt of certain required consents or approvals from the FCC and certain specified state public utility commissions and local franchise authorities; (iv) the absence of legal restraints prohibiting the Merger; and (v) other customary conditions specified in the Merger Agreement. The Company Stockholder Approval was obtained on November 13, 2024 and the applicable HSR waiting period expired on February 14, 2025. While it is currently anticipated that the Merger will be consummated by the first quarter of 2026, there can be no assurance that the foregoing conditions will be satisfied in a timely manner or at all, or that an effect, event, development, or change will not transpire that could delay or prevent these conditions from being satisfied.
If the Merger is not consummated for any reason, the trading price of our common stock may decline to the extent that the market price of the common stock reflects positive market assumptions that the Merger will be consummated, and the related benefits will be realized. We may also be subject to additional risks if the Merger is not completed, including:
the requirement in the Merger Agreement that, under certain circumstances, we pay Verizon a termination fee of $320 million in cash;
incurring substantial costs related to the Merger, such as financial advisory, legal, accounting, and other professional services fees that have already been incurred or will continue to be incurred until closing;
limitations on our ability to retain and hire key personnel;
the imposition of additional regulatory and operational requirements on our business;
reputational harm including relationships with investors, customers, and business partners due to the adverse perception of any failure to successfully complete the Merger; and
potential disruption to our business and distraction of our workforce and management team to pursue other opportunities that could be beneficial to us, in each case without realizing any of the benefits of having the Merger completed.
The pendency of the Merger could negatively impact our business, financial conditions, and results of operations.
The pendency of the Merger could adversely affect our business, financial condition and results of operations and may result in our inability to hire or the departure of key personnel. In connection with the Merger, some of our customers and business partners may delay or defer decisions or may end their relationships with us, which could negatively affect our revenues, earnings and cash flows, regardless of whether the Merger is completed. Similarly, our current and prospective employees may experience uncertainty about their future roles with us following the Merger, which may materially adversely affect our ability to attract and retain key personnel during the pendency of the Merger.
Until the completion of the Merger or the termination of the Merger Agreement in accordance with its terms, we are prohibited from entering into certain transactions and taking certain actions that might otherwise be beneficial to the Company and its stockholders.
From and after the date of the Merger Agreement and prior to completion of the Merger, the Merger Agreement restricts us from taking specified actions without the consent of Verizon and requires that the business of our Company and its subsidiaries
be conducted in the ordinary course in all material respects. These restrictions may prevent us from making changes to our business or organizational structure or from pursuing business opportunities that may arise prior to the completion of the Merger. Adverse effects arising from these restrictions during the pendency of the Merger could be exacerbated by any delays in the consummation of the Merger or the termination of the Merger Agreement.
We have incurred, and will continue to incur, direct and indirect costs as a result of the Merger.
We have incurred, and will continue to incur, significant costs and expenses, including regulatory costs, fees for professional services and other transaction costs in connection with the Merger, for which we have received little or no benefit if the Merger is not completed. There are a number of factors beyond our control that could affect the total amount or the timing of these costs and expenses. Many of these fees and costs will be payable by us even if the Merger is not completed and may relate to activities that we would not have undertaken other than to complete the Merger.
Litigation challenging the Merger Agreement may prevent the Merger from being consummated within the expected timeframe or at all.
Lawsuits have been filed (see Note 20 - “Commitments and Contingencies” to the Consolidated Financial Statements included in Part I of this Annual Report for further discussion), and additional lawsuits may be filed in the future, against us, our Board of Directors or other parties to the Merger Agreement, challenging the adequacy of the proxy disclosures or making other claims in connection with the Merger. Such lawsuits have been brought by purported stockholders, and additional lawsuits may be brought by purported stockholders or other interested parties, seeking, among other things, to enjoin consummation of the Merger. One of the conditions to the consummation of the Merger is that the consummation of the Merger is not restrained, made illegal, enjoined or prohibited by any order or legal or regulatory restraint or prohibition of a court of competent jurisdiction or any governmental entity. As such, if the plaintiffs in such current or potential lawsuits are successful in obtaining an injunction prohibiting the defendants from completing the Merger on the agreed upon terms, then such injunction may prevent the Merger from becoming effective within the expected timeframe or at all.
Risks Related to Our Indebtedness
We have a significant amount of indebtedness, and we may incur substantially more debt in the future. Such debt and debt service obligations may adversely affect us.
As of December 31, 2024, we had indebtedness of approximately $11.6 billion of which approximately $11 billion was secured. We may also be able to incur substantial additional indebtedness in the future. Although the terms of the agreements currently governing our existing indebtedness restrict our restricted subsidiaries’ ability to incur additional indebtedness and liens, such restrictions are subject to several exceptions and qualifications, and the indebtedness and/or liens incurred in compliance with such restrictions may be substantial. Also, these restrictions do not prevent us or our restricted subsidiaries from incurring obligations that do not constitute indebtedness. In addition, to the extent other new debt is added to our subsidiaries’ current debt levels, the substantial leverage risks described below would increase.
The potential significant negative consequences on our financial condition and results of operations that could result from our substantial debt include:
limitations on our ability to obtain additional debt or equity financing on favorable terms or at all;
instances in which we are unable to comply with the covenants contained in our indentures and credit agreements or to generate cash sufficient to make required debt payments, which circumstances have the potential of accelerating the maturity of some or all of our outstanding indebtedness;
the allocation of a substantial portion of our cash flow from operations to service our debt, thus reducing the amount of our cash flows available for other purposes, including capital expenditures that would otherwise improve our competitive position, results of operations or stock price;
requiring us to sell debt or equity securities or to sell some of our core assets, possibly on unfavorable terms, to meet payment obligations;
compromising our flexibility to plan for, or react to, competitive challenges in our business and the telecommunications industries;
increasing our vulnerability to general adverse economic and industry conditions, including increases in interest rates, particularly given a portion of our indebtedness bears interest at variable rates, as well as to catastrophic events; and
the possibility of being put at a competitive disadvantage with competitors who, relative to their size, do not have as much debt as we do, and competitors who may be in a more favorable position to access additional capital resources.
In addition, our First Lien Notes and Second Lien Notes, as well as a portion of our subsidiary indebtedness (other than a portion of the securitized Class A and Class B notes), are rated below “investment grade” by independent rating agencies. This has resulted in higher borrowing costs for us. These rating agencies may lower our debt ratings further, if in the rating agencies’ judgment such an action is appropriate. A further lowering of a rating would likely increase our future borrowing costs and reduce our access to capital. Our negotiations with vendors, customers and business partners could also be negatively impacted if they deem us a credit risk as a result of our credit rating.
Economic uncertainty and volatility in the U.S. and global financial markets could limit our ability to access capital or increase the cost of capital needed to fund business operations, including our fiber expansion plans.
As of December 31, 2024, economic uncertainty, inflationary pressures, the ongoing war in Ukraine, the Israel-Hamas war, rising interest rates and the expectations around the terminal target rate of the Federal Reserve continue to produce volatility in the debt and equity markets. Such volatility may affect our ability to access capital markets, which could lead to higher borrowing costs or other unattractive financing terms or, in some cases, the inability to fund ongoing operations. Adverse changes or continued volatility in the financial markets could render us either unable to access additional financing or able to access these markets only at higher costs and with restrictive financial or other conditions, which could severely affect our business operations and hinder our fiber expansion plans.
The agreements governing our current indebtedness contain various covenants that impose restrictions on us and certain of our subsidiaries that may reduce our operating and financial flexibility and we may not be able to satisfy our obligations under these or other, future debt arrangements.
The agreements governing our existing indebtedness contain covenants that, among other things, limit our ability and the ability of certain of our subsidiaries to:
incur additional debt and issue preferred stock;
incur or create liens;
redeem and/or prepay certain debt;
pay dividends on our stock or repurchase stock;
make certain investments;
engage in specified sales of assets;
enter into transactions with affiliates; and
engage in consolidation, mergers, and acquisitions.
In addition, our credit facilities require us to comply with specified financial ratios, including a maximum first lien coverage ratio. Any future indebtedness may also require us to comply with similar or other covenants.
These restrictions on our ability to operate our business could seriously harm our business by, among other things, limiting our ability to take advantage of financings, mergers, acquisitions, and other corporate opportunities. Various risks, uncertainties and events beyond our control could affect our ability to comply with these covenants. Failure to comply with any of the covenants in our financing agreements could result in a default under those agreements and under other agreements containing cross-default provisions. A default would permit lenders to accelerate the maturity for the debt under these agreements and to foreclose upon any collateral securing the debt. Under these circumstances, we might not have sufficient funds or other resources to satisfy all of our obligations. In addition, the limitations imposed by financing agreements on our ability to incur additional debt and to take other actions might significantly impair our ability to obtain other financing. This could have serious consequences to our financial condition and results of operations.
Frontier is primarily a holding company and, as a result, we rely on the receipt of funds from our subsidiaries in order to meet our cash needs and service our indebtedness, including the notes.
Frontier is primarily a holding company, and its principal assets consist of the shares of capital stock or other equity instruments of its subsidiaries. As a holding company, we depend on distributions, transfers, and other intracompany payments from our subsidiaries to fund our obligations. The operating results of our subsidiaries at any given time may not be sufficient to make distributions, transfers, or other payments to us in order to allow us to make payments on our indebtedness. In addition, the payment of these distributions, transfers, and other payments, as well as other transfers of assets, between our subsidiaries and from our subsidiaries to us may be subject to legal, regulatory, or contractual restrictions. Some state regulators have imposed, and others may consider imposing on regulated companies, including us, cash management practices that could limit the ability of such regulated companies to transfer cash between subsidiaries or to the parent company. While none of the existing state regulations materially affect our cash management, any changes to the existing regulations or imposition of new regulations or restrictions may materially adversely affect our ability to transfer cash within our consolidated companies.
We expect to make contributions to our pension plan in future years, the amount of which will be impacted by volatility in asset values related to Frontier’s pension plan and changes in pension plan assumptions.
Under Internal Revenue Service (“IRS”) regulations, we are required to make minimum contributions to our pension plan annually, based upon, among other factors, the value of plan assets relative to the funding target. We made contributions of $133
million and $134 million to our pension plan in 2024 and 2023, respectively. Our required contributions for plan years 2024 and 2023, calculated as of January 1 of the relevant year, were approximately $130 million and $126 million, respectively. In 2021, we received an IRS waiver of the minimum funding standard under Section 412(c) of the Internal Revenue Code, and Section 302(c) of the Employee Retirement Income Security Act of 1974 for the plan year 2020 minimum required distribution. With this waiver, we are spreading the 2020 minimum required contribution over the five subsequent plan years, in addition to the minimum contributions owed for those plan years. There was a modification to the funding waiver in January 2024 which, due to Section 412(c) of the Internal Revenue Code and Frontier’s intention to adopt amendments that increased benefit liabilities, accelerated the final 2025 plan year waiver amortization installment into the 2024 minimum required contribution, thereby increasing the required contributions attributable to the 2024 plan year.
We expect to make contributions to our pension plan in future years and the amount of required contributions for future years could be significant. Volatility in our asset values, liability calculations, or returns may impact the costs of maintaining our pension plan and our future funding requirements. Any future contribution to our pension plan could be material and could have a material adverse effect on our liquidity by reducing cash flows.
Significant changes in discount rates, rates of return on pension assets, mortality tables and other factors could adversely affect our earnings and equity and increase our pension funding requirements.
Pension costs and obligations are determined using actual results as well as actuarial valuations that involve several assumptions. The most critical assumptions are the discount rate, the long-term expected return on assets and lump sum conversion interest rates. Other assumptions include salary increases, mortality, and retirement age. Some of these assumptions, such as the discount rate and return on pension assets, are reflective of economic conditions and impacted by factors such as inflationary pressures that are largely out of our control. Changes in the pension assumptions could have a material impact on pension costs and obligations, and could in turn have a material adverse effect on our earnings, equity, and funding requirements.
Risks Related to Our Business
If our fiber expansion plan or other initiatives to increase our revenues, customer trends, profitability and cash flows are unsuccessful, our financial position and results of operations will be negatively and adversely impacted.
We must produce adequate revenues and operating cash flows that, when combined with cash on hand and borrowing under our revolving credit facility and other financings, will be sufficient to service our debt, fund our capital expenditures, taxes, pension and other employee benefit obligations and other operating expenses. We may experience revenue declines as compared to prior years. We have undertaken, and expect to continue to undertake, programs and initiatives with the objective of improving revenues, customer trends, profitability, and cash flows by enhancing our operations and customer service and support processes. In particular, under our fiber expansion plan we intend to grow our fiber network and optimize our existing copper network at attractive internal rates of return (IRRs) in order to increase our revenues and customer trends, and in turn increase our profitability and cash flows. We have historically experienced significant challenges in achieving such improvements. In addition, these programs and initiatives require significant investment and other resources and may divert attention from ongoing operations and other strategic initiatives.
There can be no assurance that our current and future initiatives and programs will be successful, or that the actual returns from these programs and initiatives will not be lower than anticipated or take longer to realize than we anticipate. For example, we may not reach our targets to expand and penetrate our existing fiber network on the timelines we anticipate, or at all. If current and future programs and initiatives are unsuccessful, result in lower returns than we anticipate, or take longer than we anticipate, it could have a material adverse effect on our financial position and our results of operations.
The communications industry is very competitive, and some of our competitors have superior resources which may place us at a disadvantage.
We face competition in every aspect of our business. Through mergers and various service expansion strategies, service providers are striving to provide integrated solutions both within and across geographic markets. Our competitors include cable operators, wireless carriers, satellite providers, wireline carriers, fiber “overbuilders” and OTT video providers, many of which are subject to less regulation than we are. These entities may provide services that are competitive with the services that we offer or intend to introduce. For example, our competitors may seek to introduce networks in our primarily copper-based markets that are competitive with or superior to our copper-based networks. Several competitors were successful bidders in the RDOF auction and have or may be successful in securing funding through BEAD and other federal state grant programs in areas within Frontier’s service footprint and we expect these competitors will deploy expanded services in these areas that will compete with our services. We also believe that wireless, cable, and other providers have increased their penetration of various services in our markets. We expect that competition will remain robust. Our revenue and cash flow will be adversely impacted if we cannot reverse our customer losses or continue to provide high-quality services.
Some of our competitors have market presence, engineering, technical, marketing, and financial capabilities which are substantially greater than ours. In addition, some of these competitors have less debt and are able to raise capital at a lower cost than we are able to. Consequently, some of these competitors may be able to develop and expand their communications and network infrastructures more quickly, adapt more swiftly to new or emerging technologies and changes in customer preferences, including leading edge technologies such as artificial intelligence (“AI”), machine learning and various types of data science, as
well as take advantage of acquisition and other opportunities more readily and devote greater resources to the marketing and sale of their products and services than we will be able to. New developments in areas such as AI, machine learning, cloud computing and software as a service provider could in turn make it easier for our competition to lower up-front technology costs. In addition, we may not be able to maintain our existing systems or replace or introduce new technologies and systems as quickly as our competition or in a cost-effective manner. Further, the greater brand name recognition of some competitors may require us to price our services at lower levels in order to retain or obtain customers. Finally, the cost advantages and greater financial resources of some of these competitors may give them the ability to reduce their prices for an extended period of time if they so choose. Our business and results of operations may be materially adversely impacted if we are not able to effectively compete.
We cannot predict which of the many possible future technologies, products or services will be important to maintain our competitive position or what expenditures will be required to develop and provide these technologies, products, or services. Our ability to compete successfully will depend on the effectiveness of capital expenditure investments in infrastructure, products and services, our marketing efforts, our ability to deliver high quality customer service, our ability to anticipate and respond to various competitive factors affecting the industry, including a changing regulatory environment that may affect our business and that of our competitors differently, new services that may be introduced, changes in consumer preferences, or habits, demographic trends, economic conditions and pricing strategies by competitors. Increasing competition may reduce our revenues and increase our marketing and other costs as well as require us to increase our capital expenditures and thereby decrease our cash flows.
We rely on network and information systems and other technology, and a breach, disruption or failure of such networks, systems or technology as a result of cyber-attacks, malware, misappropriation of data or other malfeasance, as well as outages, accidental releases of information or similar events, may disrupt our business and materially impact our results of operations, financial condition and cash flows.
Our business involves the receipt, storage, and transmission of confidential information about our customers and others, including sensitive personal, account and payment card information, confidential information about our employees and suppliers, and other sensitive information about our company, such as our business plans, transactions, financial information, and intellectual property. Cyber-attacks against companies like ours have increased in frequency and potential harm over time, and the methods used to gain unauthorized access constantly evolve, making it increasingly difficult to anticipate, prevent, and/or detect incidents successfully in every instance. Likewise, our information technology, networks, and infrastructure may be subject to damage, disruptions, or shutdowns due to cyber-attacks, malware, including ransomware or other information security breaches, employee or third-party error or malfeasance, power outages, communication or utility failures, systems failures, natural disasters, or other catastrophic events.
Further, our network and information systems are subject to various risks related to our vendors, third parties and other parties we may not fully control. We use encryption and authentication technology licensed from third parties to provide secure transmission of confidential information, including our business data and customer information. Similarly, we rely on employees in our network operations centers, data centers and call centers to follow our procedures when handling sensitive information. Use of vendors and third-party technologies could also expose us to supply chain cybersecurity risks, and we may not have accurate or complete information about the risks that third-party service providers face or the security of their systems. While we select our employees and third-party business partners carefully, our ability to monitor these third parties is limited, which could expose us to cyber-security and other risks. In addition, our customers using our network to access the Internet may become victim to malicious and abusive internet activities, such as unsolicited mass advertising (or spam), peer-to-peer file sharing, distribution of viruses, worms and other destructive or disruptive software; these activities could adversely affect our network, result in excessive call volume at our call centers and damage our or our customers’ equipment and data.
We have experienced criminal cyber-attacks and are vulnerable to disruption, data loss and other security breaches, whether directly or indirectly through third parties whose products and services we rely on in operating our business.
While we maintain security measures, disaster recovery plans and business continuity plans and work to upgrade our existing technology systems and provide employee training around the cyber risks we face, these risks are constantly evolving and are challenging to mitigate. Like many companies, we and our third-party service providers are the subject of increasingly frequent cyber-attacks. Security incidents result from the actions of a wide variety of actors with a wide range of motives and expertise, such as traditional hackers, personnel or the personnel of third parties, sophisticated nation-states and nation-state-supported actors.
On April 14, 2024, we detected that a third party had gained unauthorized access to portions of our information technology environment. Based on our investigation, we determined that the third party was likely a cybercrime group, which gained access to, among other information, personally identifiable information. Upon detection, we immediately activated our incident response plan, took action to contain the incident, launched an investigation with the assistance of leading cybersecurity experts, and notified law enforcement and applicable regulatory authorities. While the incident did not have a material impact on our financial condition or results of operations, the containment measures, which included shutting down certain of the Company’s systems, resulted in an operational disruption.
We are required to expend significant resources in an effort to protect against security incidents and may be required or choose to spend additional resources or modify our business activities, particularly where required by applicable data privacy and security laws or regulations or industry standards. While we have developed systems and processes designed to protect the
integrity, confidentiality and security of the confidential and personal information under our control, we cannot assure you that any security measures that we or our third-party service providers implement will be effective in preventing security incidents, disruptions, cyber-attacks, or other similar events. Any unauthorized access, computer viruses, ransomware attacks, accidental or intentional release of confidential information or other disruptions could result in misappropriation of our or our customers’ sensitive information; financial loss; reputational harm; increased costs, such as those relating to remediation or future protection; customer dissatisfaction, which could lead to a decline in customers and revenue; changes to insurance premiums or coverage; government investigations and legal claims or proceedings, fines and other liabilities. There can be no assurance that the impact of such incidents would not be material to our results of operations, financial condition, or cash flows.
Our business is sensitive to continued relationships with our wholesale customers.
We have substantial business relationships with other communications carriers for which we provide service. While we seek to maintain and grow our business with these customers, we face significant competition for this wholesale business. In addition, many of our wholesale customers are migrating away from the time division multiplexing (TDM) service we have historically provided to IP based services. If we fail to maintain our grow this business, our revenues and results of operations could be materially and adversely affected.
Inflationary pressures on costs and disruptions in our supply chain, including potential trade tariffs, may adversely impact our financial condition or results of operations, including our fiber expansion plans.
During fiscal 2024, we continued to experience the impact of inflation, including upward pressure on the cost of materials, labor, fuel and electricity, and other items that are critical to our business. We continue to monitor these impacts closely. In addition, we are monitoring the potential imposition of trade tariffs which could adversely impact our business. If our costs continue to rise, we may experience losses and diminished margins. While we may seek to recoup or offset increased costs in whole or in part through customer price increases or by implementing offsetting cost reductions, we may be unable to do so.
Through December 31, 2024, we had not experienced any significant disruptions in our supply chain. We cannot assure you that we will not experience significant shortages or delays in our supply chain relating to materials, labor, trade tariffs and other inputs necessary to our fiber expansion plans. Any such shortages or delays may adversely impact our ability to reach our fiber expansion targets on budget and on time.
We may be unable to meet the technological needs or expectations of our customers and may lose customers as a result.
The communications industry is subject to significant changes in technology and replacing or upgrading our infrastructure to keep pace with such technological changes could result in significant capital expenditures. If we do not replace or upgrade technology and equipment and manage broadband speeds and capacity as necessary, we may be unable to compete effectively because we will not be able to meet the needs or expectations of our customers.
Many of these technological changes may displace or reduce demand for certain of our services, enable the development of competitive products or services, enable customers to reduce or bypass use of our networks or reduce our profit margins. For example, as service providers continue to invest in 5G and low earth orbit satellite networks and services, their 5G services could reduce demand for our network services. Such enhancements to competitors’ product offerings may influence our customers to consider other service providers, such as cable operators, CLECs, OTT or wireless providers. We may be unable to attract new or retain existing customers from cable companies due to their deployment of enhanced broadband and VoIP technology. In addition, new capacity services for broadband technologies may permit our competitors to offer broadband data services to our customers throughout most or all of our service areas. Any resulting inability to attract new or retain existing customers could adversely impact our business and results of operations in a material manner.
Laws and regulations relating to the handling of privacy and data protection may result in increased costs, legal claims, fines against us, or reputational damage.
We process, store, and transmit large amounts of data, including the personal information of our customers. Ongoing increases in the potential for misuse of personal information, the public’s awareness of the importance of safeguarding personal information, and the volume of legislation and regulations that have been adopted or is being considered regarding the protection, privacy, and security of personal information have resulted in increases to our information-related risks. Many states and local authorities have enacted or considered legislative or other actions that would impose restrictions on our ability to collect, use and disclose certain consumer information, particularly with regard to our broadband Internet business. These new privacy laws and others that we expect to be developed and enacted going forward will impose additional data protection obligations and potential liability on companies such as ours doing business in those states.
We have incurred and will continue to incur significant implementation costs to ensure compliance with Federal and state privacy laws and their related regulations, including managing the complexity of laws that vary from state to state. Both federal and state governments are considering additional privacy laws and regulations, which, if passed, could further impact our business, strategies, offerings, and initiatives and cause us to incur further costs. Any actual or perceived failure to comply with data privacy laws or regulations, or related contractual or other obligations, or any perceived privacy rights violation, could lead to investigations,
claims, and proceedings by governmental entities and private parties, damages for contract breaches, and other significant costs, penalties, and other liabilities, as well as harm to our reputation and market position.
A significant portion of our workforce is represented by labor unions.
As of December 31, 2024, approximately 66% of our total employees were represented by unions and were subject to collective bargaining agreements. The term of our collective bargaining agreements is typically three years and at any point in time we generally have several agreements under negotiation and extension. Approximately 43% of our unionized employees are covered by collective bargaining agreements that are scheduled to expire in 2025.
We cannot predict the outcome of negotiations of the collective bargaining agreements covering our employees. If we are unable to reach new agreements or renew existing agreements, employees subject to collective bargaining agreements may engage in strikes, work slowdowns or other labor actions, which could materially disrupt our ability to provide services. New labor agreements or the renewal of existing agreements may impose significant additional costs on us, which could adversely affect our financial condition and results of operations in the future.
The impacts of climate change, including severe weather in the areas in which we operate, and increasingly stringent environmental laws, rules and regulations, customer expectations and other environmental liabilities, could adversely affect our business.
There is a heightened public focus on climate change, sustainability, and environmental issues and customer, regulatory and shareholder expectations are evolving rapidly, with a focus on companies’ climate change readiness, response, and mitigation strategies. This has led to increased government regulation and caused certain of our partners and vendors to incorporate environmental standards into our business with them. We expect that the trend of increasing environmental awareness will continue, which will result in higher costs of operations. We are committed to incorporating environmentally sustainable practices into our business, including those focused on reducing our carbon footprint and emissions, managing energy use and efficiency, and enhancing our use of renewable energy and device recycling, which may result in increases in our costs of operations relative to our competitors.
The potential impact of climate change on our operations and our customers remains uncertain. The primary risk that climate change poses to our business is the potential for increases in severe weather in the areas in which we operate. Increasing frequency and intensity of rainfall and severe storms, flooding, wildfires, mudslides, sustained high wind events and freezing conditions, including related power outages, could impair our ability to build and maintain our network and lead to disruptions in our services, workforce, and supply chain. For example, we provide service to customers and maintain equipment in areas impacted by the January 2025 wildfires in Southern California. These changes could be severe and could negatively impact our operations, including damaging our network infrastructure, which could result in increased costs and loss of revenue. We may incur significant costs to prepare for, respond to, and mitigate the impact of climate change on our infrastructure and operations. In addition, governmental initiatives to address climate change could, if adopted, restrict our operations, require us to make capital expenditures to comply with these initiatives, and increase our costs, all of which could impact our ability to compete. Our inability to timely respond to the risks posed by climate change and the costs of compliance with climate change laws and regulations could have a material adverse impact on us.
In addition, the local exchange carrier subsidiaries we operate are subject to federal, state, and local laws and regulations governing the use, storage, disposal of, and exposure to hazardous materials, the release of pollutants into the environment and the remediation of contamination. As an owner and former owner of property, we are subject to environmental laws that could impose liability for the entire cost of cleanup at contaminated sites, including sites formerly owned or operated by us or our predecessors, regardless of fault or the lawfulness of the activity that resulted in contamination. As a result, we may become responsible for the investigation and remediation of property that we own or operate (or previously owned or operated), or that has been adversely affected by infrastructure we own or operate (or previously owned or operated), including land or waterways potentially impacted by the release of contaminants from lead-sheathing with respect to certain legacy copper cabling. We cannot assure you that we will not be subject to significant legal proceedings, governmental investigations or costly remediation obligations in connection with any environmental impacts associated with aging infrastructure that we now control or formerly controlled, which could have a material adverse impact on us.
Negotiations with the providers of content for our video systems may not be successful, potentially resulting in our inability to carry certain programming channels on our video systems, which could result in the loss of subscribers. Alternatively, because of the bargaining power of some content providers, we may be forced to pay an increasing amount for some content, resulting in higher expenses and lower profitability.
We continue to execute on our video strategy of achieving savings by renegotiating contracts to lower content costs or dropping channels entirely. The content owners of the programming that we carry on our multichannel video systems are the exclusive provider of the channels they offer. If we are unable to reach a mutually-agreed contract with a content owner, including pricing and carriage provisions, our existing agreements to carry this content may not be renewed, resulting in the blackout of these channels. The loss of content could result in loss of customers who place a high value on the particular content that is lost. In addition, many content providers own multiple channels. As a result, we typically have to negotiate the pricing for multiple channels rather than one and carry and pay for content that customers do not value, in order to have access to other content that customers do value. Some of our competitors have materially larger scale than we do, and may, as a result, be better positioned
than we are in such negotiations. As a result of these factors, the cost of content acquisition may continue to increase faster than corresponding revenues which could result in lower profitability.
We are subject to a significant amount of litigation, which could require us to pay significant damages or settlements.
We are party to various legal proceedings, including, from time to time, individual actions, class and putative class actions, and governmental investigations, covering a wide range of matters and types of claims including, but not limited to, general contract disputes, billing disputes, rights of access, taxes and surcharges, consumer protection and privacy, advertising, sales and the provision of services, trademark and patent infringement, employment, regulatory, tort, claims of competitors and disputes with carriers.
In addition, we may be subject to litigation in connection with our Merger Agreement with Verizon. See “Risks Related to the Proposed Merger with Verizon - Litigation challenging the Merger Agreement may prevent the Merger from being consummated within the expected timeframe or at all.”
Litigation is subject to uncertainty and the outcome of individual matters is not predictable. We may incur significant expenses in defending these lawsuits. In addition, we may be required to pay significant awards or enter into settlements with governmental or other entities which impose significant financial and business remediation measures.
We rely on a limited number of key suppliers and vendors.
We depend on a limited number of suppliers and vendors for equipment and services relating to our network infrastructure, including network elements such as digital and Internet protocol switching and routing equipment, optical and copper transmission equipment, broadband connectivity equipment, various forms of customer premise equipment, optical fiber, wireless equipment, as well as the software that is used throughout our network to manage traffic, network elements, and other functions critical to our operations. If any of our major suppliers were to experience disruption, supply-chain interruptions, financial difficulties, or other unforeseen problems delivering, maintaining, or servicing these network components on a timely basis, our operations could suffer significantly. Our suppliers and vendors may also continue to experience increased costs for their materials, labor, and other significant items due to factors including new or increased regulation, inflation and trade tariffs, which they could seek to pass along to us and their other customers. In addition, due to changes in the communications industry, the suppliers of many of these products and services have been consolidating. In the event it were to become necessary to seek alternative suppliers and vendors, we may be unable to obtain satisfactory replacement supplies, services, or utilities on economically-attractive terms, on a timely basis, or at all, which could increase costs or cause disruptions in our services.
Risks Related to Regulation and Oversight
Changes in federal or state regulations may reduce subsidy and other revenues we receive.
A portion of Frontier’s total revenues ($64 million, or 1%, in 2024 and $75 million, or 1%, in 2023) are derived from federal and state subsidies for rural and high-cost support including RDOF.
We participated in the FCC’s RDOF Phase I auction and were awarded approximately $371 million over ten years to build gigabit-capable broadband over a fiber-to-the-premises network to approximately 127,000 locations in eight states (California, Connecticut, Florida, Illinois, New York, Pennsylvania, Texas, and West Virginia). We began receiving RDOF funding early in 2022. Changes in the requirements or funding available for RDOF could impact the ongoing funding we receive.
The RDOF program is less favorable to us than the CAF Phase II program was and resulted in a material reduction in our annual FCC funding, from approximately $313 million in annual support under CAF II in 2021 to approximately $37 million in annual support under RDOF beginning in early 2022. This has resulted in a material reduction in our revenue and operating income and could have a material adverse effect on our business, financial condition, and results of operations. In addition, the FCC is reviewing CAF II carriers’ completion data and if the FCC determines that we did not satisfy our CAF II requirements we could be required to return a portion of the funds received and may be subject to certain other fines, requirements and obligations, which could have an adverse impact on our financial condition.
In November 2021, Congress passed the IIJA which provides $65 billion to fund broadband connectivity programs, including broadband deployment to unserved and underserved locations. The National Telecommunications and Information Administration (“NTIA”) is administering the principal last mile infrastructure funding program in the amount of $42.5 billion, the Broadband Equity, Access & Deployment Program (“BEAD”), and will distribute funding through direct grants to states, who will then award the funds based on competitive grant programs. The NTIA has allocated approximately $25.5 billion to states in Frontier’s footprint. We are closely tracking implementation of the BEAD program, including state determinations regarding subsidy award criteria. We are actively pursuing awards of these stimulus funds, however, we continue to evaluate our opportunities as the process is complex and any awards that we ultimately receive under the IIJA may require significant up-front capital expenditures or other costs.
A portion of our total revenues are derived from switched access charges paid by other carriers for services we provide in originating intrastate and interstate long-distance traffic. The rates we can charge for switched access are regulated by the FCC and state regulatory agencies and could be further reduced in the future.
Certain states also have their own open proceedings to address reform to originating intrastate access charges, other intercarrier compensation, and state universal service funds. We cannot predict when or how these matters will be decided or the effect on our subsidy or switched access revenues. However, future reductions in our subsidy or switched access revenues may directly affect our profitability and cash flows as those regulatory revenues do not have an equal level of associated variable expenses.
We are also required to contribute to the Universal Service Fund (“USF”) and the FCC allows us to recover these contributions through a USF surcharge on customers’ bills. If we are unable to recover USF contributions, it could have a material adverse effect on our business or results of operations.
On January 27, 2025, the federal Office of Management and Budget (“OMB”) issued a memorandum to the heads of all executive departments and agencies directing them to pause the disbursement of certain federal financial assistance. On January 28, 2025, the United States District Court for the District of Columbia issued a temporary stay of the OMB directive, which the OMB subsequently rescinded. It is uncertain if the OMB will seek to further pause or otherwise limit future federal disbursements, or if any such changes will impact the funding Frontier receives under federal programs, including USF, RDOF and other federal broadband grants including BEAD. We are closely tracking developments in this area. Significant decreases in available funding, or the imposition of significant requirements on the receipt of such funding, could have a material adverse effect on our business and results of operations.
While we are implementing a number of operational initiatives in order to realize certain cost savings, our ability to achieve such cost savings on a timely basis, or at all, is subject to various risks and assumptions by our management, which may or may not be realized. Even if we do realize some or all of such cost savings, they may be insufficient to offset any reductions in subsidies we receive, or our inability to recover USF contributions.
Frontier and our industry are expected to remain highly regulated, and we could incur substantial compliance costs that could constrain our ability to compete in our target markets.
As an incumbent local exchange carrier, some of the services we offer are subject to significant regulation from federal, state, and local authorities. This regulation could impact our ability to change our rates, especially on our basic voice services and our access rates and could impose substantial compliance costs on us. In some jurisdictions, regulation may restrict our ability to expand our service offerings and we may be required to undertake investments and/or other actions to ensure service quality, network reliability, or continued availability of service or face penalties and other obligations. In addition, changes to the regulations that govern our business, including more robust regulation of currently lightly regulated internet access services, may have an adverse effect on our business by reducing the allowable fees that we may charge, imposing additional compliance costs, reducing the amount of subsidies, or otherwise changing the nature of our operations and the competition in our industry. At this time, it is unknown how these regulations, regulatory oversight, or changes to these regulations will affect our operations or ability to compete in the future.
We are subject to the oversight of certain federal and state agencies that may investigate or pursue enforcement actions against us relating to consumer protection matters.
Certain federal and state agencies, including state attorneys general, monitor and exercise oversight related to consumer protection matters, including those affecting the communications industry. Such agencies have in the past, and may in the future, choose to launch an inquiry or investigation of our business practices in response to customer complaints or other publicized customer service issues or disruptions, including regarding the failure to meet technological needs or expectations of our customers or related to public safety services. Such inquiries or investigations could result in reputational harm, enforcement actions, litigation, fines, settlements, and/or operational and financial conditions being placed on the Company, any of which could materially and adversely affect our business.
We are subject to the oversight of certain federal and state regulatory agencies regarding commitments that were made by or imposed on the Company by the regulatory agencies in association with securing federal and state regulatory approval for the Restructuring and the ongoing operation of our business.
The Company has made several affirmative commitments to federal and certain state regulators to secure approval for the Restructuring, and the ongoing operation of our business, including specific investment, broadband service deployment, service quality improvements, reporting, and compliance commitments. Regulators will monitor and may launch compliance inquiries or investigations and if the Company is found to have failed to comply with its obligations it could result in reputational harm, enforcement actions, litigation, penalties, fines, settlements and/or operational and financial conditions being placed on the Company, any of which could materially and adversely affect our business.
Issues related to the development and use of artificial intelligence could give rise to legal or regulatory actions, damage our reputation or otherwise materially harm our business.
We currently incorporate AI technology in certain of our products and services and in our business operations. AI is currently being developed in a highly competitive and rapidly evolving environment by a wide variety of companies, many of which are dedicating substantially more resources than we are to research and development initiatives. Due to the complexity of its design and algorithms, AI presents various risks and challenges, and its use could have unintended adverse consequences. We may be unsuccessful in identifying or resolving ethical and legal issues. The Company's use of AI may give rise to risks related to harmful content, inaccurate output, bias, intellectual property infringement or misappropriation, defamation, privacy incidents, and cybersecurity vulnerabilities, among others. The United States and other governmental bodies have taken initial steps to regulate AI, which could ultimately increase AI’s legal risks or decrease its usefulness. For all these reasons, we cannot assure you that our use of AI will not harm our business, operations or reputation.
Tax legislation may adversely affect our business and financial condition.
The determination of the benefit from (or provision for) income taxes requires complex estimations and significant judgments concerning the applicable tax laws. If in the future any element of tax legislation changes the tax code for income taxes, it could affect our income tax position and we may need to adjust the benefit from (or provision for) income taxes accordingly.
Risks Related to Our Common Stock
The price of our common stock may be volatile or may decline, which could result in substantial losses for purchasers of our common stock.
Volatility in the market price of our common stock may prevent you from being able to sell your shares at or above the price you paid for them. Many factors, which may be outside our control, may cause the market price of our common stock to fluctuate significantly. As described under “Risks Related to the Proposed Merger”, if the Merger is not consummated for any reason, the trading price of our common stock may decline to the extent that the market price of the common stock reflects positive market assumptions that the Merger will be consummated, and the related benefits will be realized. Other factors include those described elsewhere in the “Risk Factors” section, as well as the following:
variations in our operating and financial performance and prospects from period to period;
our quarterly or annual earnings or those of other companies in our industry compared to market expectations;
the public’s reaction to our press releases, other public announcements, and filings with the SEC;
market overhang due to substantial holdings by former creditors that may wish to dispose of our common stock;
coverage by or changes in financial estimates by securities analysts or failure to meet their expectations;
market and industry perception of our success, or lack thereof, in pursuing our fiber expansion strategy;
strategic actions by us or our competitors, such as acquisitions or restructurings;
changes in laws or regulations which adversely affect our industry or us;
changes in accounting standards, policies, guidance, interpretations, or principles;
changes in senior management or key personnel;
issuances, exchanges, or sales, or expected issuances, exchanges, or sales of our capital stock;
adverse resolution of new or pending litigation against us; and
changes in general market, economic and political conditions in the United States and global economies or financial markets, including those resulting from natural disasters, terrorist attacks, acts of war and responses to such events.
These broad market and industry factors may materially reduce the market price of our common stock, regardless of our operating performance. In addition, price volatility may be greater if the public float and trading volume of our common stock is low. As a result, you may suffer a loss on your investment.
If there are substantial sales of shares of our common stock, the price of our common stock could decline.
The market price of the shares of our common stock could decline as a result of the sale of a substantial number of our shares of common stock in the public market, by us or significant stockholders, or the perception in the market that such sales could occur.
We do not intend to pay dividends on our common stock for the foreseeable future.
We currently have no intention to pay dividends on our common stock at any time in the foreseeable future. Any decision to declare and pay dividends in the future will be made at the discretion of our Board of Directors and will depend on, among other things, our results of operations, financial condition, cash requirements, contractual restrictions, and other factors that our Board of Directors may deem relevant. In addition, certain of our debt instruments contain covenants that restrict the ability of our subsidiaries to pay dividends to us.
Delaware law and certain provisions in our certificate of incorporation may prevent efforts by our stockholders to change the direction or management of our Company.
Our certificate of incorporation and our by-laws contain provisions that may make the acquisition of our Company more difficult without the approval of our Board of Directors, including, but not limited to, the following: action by stockholders may only be taken at an annual or special meeting duly called by or at the direction of our Board of Directors; and advance notice for all stockholder proposals is required. The proposed Merger was approved by our Board of Directors and approved by action of our stockholders at a special meeting duly held on November 13, 2024.
These and other provisions in our certificate of incorporation, bylaws and Delaware law could make it more difficult for stockholders or potential acquirers to initiate actions that are opposed by our Board of Directors, including actions to delay or impede a merger, tender offer or proxy contest involving our Company. The existence of these provisions could negatively affect the price of our common stock and limit opportunities for you to realize value in a corporate transaction.
If securities or industry analysts do not publish or cease publishing research or reports, or publish unfavorable research or reports, about us, our business, or our industry, or if they adversely change their recommendations regarding our stock, our stock price and trading volume could decline.
The trading market for our common stock is influenced by the research and reports that industry or securities analysts may publish about us, our business, our industry, or our competitors. If we do not maintain adequate research coverage or if any of the analysts who may cover us downgrade our stock, publish inaccurate or unfavorable research about our business or provide relatively more favorable recommendations about our competitors, our stock price could decline. If any analyst who may cover us were to cease coverage of our Company or fail to regularly publish reports about us, we could lose visibility in the financial markets, which in turn could cause our stock price or trading volume to decline.
General Risk Factors
The ability to attract and retain key personnel is critical to the success of our business.
Our success depends in part upon key personnel. Qualified individuals are in high demand, and we may incur significant costs to attract them, particularly in light of the uncertainty created by the pendency of the Merger, as described above. The loss of key employees or unexpected changes in the composition of our senior management team could materially and adversely affect our ability to execute our strategy and implement operational initiatives which could have a material and adverse effect on our financial condition, liquidity, and results of operations. We cannot guarantee that our key personnel will not leave or compete with us. If executives, managers, or other key personnel resign, retire, or are terminated, or their service is otherwise interrupted, we may not be able to replace them in a timely manner. The loss, incapacity, or unavailability for any reason of key members of our management team could have a material adverse impact on our business. The risks to attracting and retaining key personnel may be exacerbated by inflationary pressures on employee wages and benefits.
Item 1B. Unresolved Staff Comments
None.
Item 1C. Cybersecurity
Risk management and strategy
We have established processes designed to identify, assess and manage material risks associated with cybersecurity threats. Our information technology, networks, and infrastructure have been and may in the future be subject to damage, disruptions, or shutdowns due to cyber-attacks, malware, employee or third-party error or malfeasance, power outages, communication or utility failures, systems failures, natural disasters or other catastrophic events. These risks include, among other things, operational risks, intellectual property theft, fraud, extortion, harm to employees or customers, violation of privacy or security laws and other litigation and legal risks, and reputational risks.
Cybersecurity risk management is embedded in the annual enterprise risk management (“ERM”) process, which is jointly administered by the Chief Financial Officer and head of Internal Audit and overseen by the Board of Directors, primarily through the Audit Committee. As part of the ERM process, senior management annually, or more frequently as necessary, identifies, assesses and evaluates enterprise level risks using a range of tools and services.
In order to manage identified cybersecurity risks, we evaluate a range of remediation options and determine the appropriate course of action for effective monitoring, mitigation and treatment. Areas that have a higher level of likelihood and potentially higher level of impact are prioritized. Periodic monitoring, self-assessment and reporting to the Audit Committee are performed by senior management to evaluate, among other things, the effectiveness of mitigation strategies in minimizing or managing identified risks. In addition to critical risk management, we conduct regular exercises and simulations to review and continuously improve our incident response protocols, we work to upgrade our existing technology systems to enhance our overall security posture and we provide ongoing employee training around cyber risks. For example, employees are required to complete cybersecurity training and receive ongoing education which includes simulated phishing attacks and communications for recognizing evolving threats.
Our processes also address cybersecurity risks associated with our use of third-party service providers and other external parties and circumstances. External risks to our network and information systems may arise from third parties and other parties we may not fully control. For example, we use vendors for encryption and authentication technology and cloud storage, and have adopted controls around, among other things, vendor risk assessment, access and acceptable use and backup and recovery. We engage outside providers to monitor our network and conduct periodic internal and external security testing and to assist in the ongoing evaluation and enhancement of our cyber security preparedness and protocols. We use the NIST Cybersecurity Framework to audit our cybersecurity controls.
As of the date of this report, we have not experienced any cybersecurity incidents that [we have determined] have materially affected or are reasonably likely to materially affect the Company, including our business strategy, results of operations or financial condition. We describe whether and how risks from identified cybersecurity threats, including as a result of previous cybersecurity incidents, have materially affected or are reasonably likely to materially affect us, including our business strategy, results of operations, or financial condition, in our risk factor disclosures under the heading “We rely on network and information systems and other technology, and a disruption or failure of such networks, systems or technology as a result of cyber-attacks, malware, misappropriation of data or other malfeasance, as well as outages, accidental releases of information or similar events, may disrupt our business and materially impact our results of operations, financial condition and cash flows” in Item 1A of this Annual Report on Form 10-K.
Governance
Frontier’s management is primarily responsible for governing and overseeing cybersecurity risks. Operational responsibility for ensuring the adequacy and effectiveness of the Company’s cybersecurity risk management, control and governance processes is assigned to the SVP, Cyber Security (CISO). Our CISO has over 20 years of experience in IT, cyber security and data privacy and data management and reports directly to the EVP, Chief Digital and Information Officer (CDIO). Our CDIO has over 25 years of experience, having previously held senior leadership positions in technology, IT and operations at large public companies prior to joining Frontier.
To assist with management oversight, the CDIO chairs a security council which supports risk management by providing input into cyber security strategy and helps prioritize monitoring, mitigation and remediation across operational groups. This security council is comprised of senior leaders from a cross-functional group of departments including Legal and Regulatory, Corporate Security, Network Engineering, Internal Audit, Finance & Accounting and Risk and IT Infrastructure. In addition, we have established processes and response teams that are responsible for monitoring and making determinations regarding the materiality of cybersecurity incidents. The members of these teams have extensive expertise in evaluating the potential impact and materiality of events in the context of Frontier’s business and financial position, reputational and industry risk, and legal and regulatory environment, and there are procedures in place to escalate potentially material incidents for consideration by the Audit Committee. For example, the Audit Committee was actively involved in the review, disclosure and mitigation of the reported April 2024 cyber-attack. See Item 1A “Risk Factors” for a further discussion of cybersecurity risks.
While material risks are generally overseen by the full Board of Directors, the Audit Committee has a key role in cybersecurity risk monitoring and oversight as set forth in its charter. In establishing Audit Committee membership, the Nominating & Corporate Governance Committee identifies directors with relevant IT, network and cyber expertise to serve on the Committee. The CDIO and CISO provide periodic reports to the Audit Committee on the Company’s data privacy and information and infrastructure
security programs, including cybersecurity risks. In addition, senior management reports to the Board of Directors at least annually on cybersecurity risks.
Item 2. Properties
Our owned property consists primarily of land and buildings, office and warehouse facilities, central office equipment, software, outside communications plant, and related equipment. Outside communications plant includes aerial and underground cable, conduit, poles, and wires. Central office equipment includes digital switches and peripheral equipment. In addition, we lease certain property, including primarily office facilities. All of our property is considered to be in good working condition and suitable for its intended purpose.
Our gross investment in property, by category, as of December 31, 2024, was as follows:
|
|
|
|
|
|
|
|
|
|
| ($ in millions) |
|
|
|
|
|
|
|
|
| Land | $ | 241 |
|
| Buildings and leasehold improvements |
| 1,250 |
|
| General support |
| 591 |
|
| Central office/electronic circuit equipment |
| 3,226 |
|
| Poles |
| 1,074 |
|
| Cable, fiber, and wire |
| 9,921 |
|
| Conduit |
| 1,429 |
|
| Materials and supplies |
| 431 |
|
| Construction work in progress |
| 1,155 |
|
| Total | $ | 19,318 |
|
|
|
|
|
|
In connection with our ongoing operational and cost savings initiatives, we have undertaken a review of our real estate portfolio, including leased facilities, and are seeking to consolidate our footprint and reduce our property portfolio where economically and operationally beneficial.
Item 3. Legal Proceedings
We are party to various legal proceedings (including individual, class and putative class actions as well as federal and state governmental investigations) arising in the normal course of our business covering a wide range of matters and types of claims including, but not limited to, general contracts, billing disputes, rights of access, taxes and surcharges, consumer protection and privacy, trademark, copyright and patent infringement, employment, regulatory, tort, claims of competitors and disputes with other carriers. Such matters are subject to uncertainty and the outcome of individual matters is not predictable. However, we believe that the ultimate resolution of these matters, after considering insurance coverage or other indemnities to which we are entitled, will not have a material adverse effect on our financial position, results of operations, or cash flows. For more information regarding pending and threatened legal actions and proceedings see Note 20 - ‘‘Commitments, Contingencies, and Guarantees’’ to the consolidated financial statements in Part II, Item 8 of this Annual Report on Form 10-K.
Item 4. Mine Safety Disclosures
Not applicable.
Information About Our Executive Officers
The table below presents the names, ages, and positions of our current executive officers as of February 20, 2025:
|
|
|
Name | Age | Current Position and Officer |
Scott Beasley | 44 | Executive Vice President, Chief Financial Officer |
Veronica Bloodworth | 54 | Executive Vice President, Chief Network Officer |
Ettienne Brandt | 48 | Executive Vice President, Business |
Vishal Dixit | 45 | Executive Vice President, Strategy & Wholesale |
Alan Gardner | 65 | Executive Vice President, Chief People Officer |
John Harrobin | 57 | Executive Vice President, Consumer |
Nick Jeffery | 57 | President & Chief Executive Officer |
Erin Kurtz | 46 | Executive Vice President, Chief Communications Officer |
William McGloin | 54 | Chief Accounting Officer & Controller |
Charlon McIntosh | 50 | Executive Vice President, Chief Customer Operations Officer |
Mark D. Nielsen | 60 | Executive Vice President, Chief Legal and Regulatory Officer |
Melissa Pint | 50 | Executive Vice President, Chief Digital Information Officer |
John Stratton | 64 | Executive Chairman |
There is no family relationship between the directors or executive officers. The term of office of each of the foregoing officers of Frontier is annual and will continue until a successor (if any) has been elected and qualified.
SCOTT BEASLEY joined Frontier in 2021 and is Executive Vice President and Chief Financial Officer. Prior to joining Frontier, he was Chief Financial Officer of Arcosa, Inc., a North American provider of infrastructure products and solutions, and helped lead its successful public spinoff in 2018. Under his financial leadership, Arcosa debuted on public equity and debt markets, developed a new shareholder base, implemented a disciplined capital allocation program, and published its inaugural ESG Sustainability Report. Arcosa executed 13 acquisitions in a 3-year period to reposition its portfolio around growth-oriented infrastructure products. From 2017 until Arcosa’s spin-off, Mr. Beasley was Group Chief Financial Officer of Trinity Industries, having served as Trinity’s Vice President of Corporate Strategic Planning since 2014. Prior to joining Trinity, Mr. Beasley was an Associate Partner at McKinsey & Company, where he led operational and organizational transformations across asset-intensive industries and started his career as an Operations Manager at McMaster Carr Supply Company. Mr. Beasley received an AB in Economics from Duke University and an MBA in Finance and Accounting from Northwestern University’s Kellogg School of Management.
VERONICA BLOODWORTH joined Frontier in 2021 as Executive Vice President and Chief Network Officer. Prior to joining Frontier, she was Senior Vice President of Construction and Engineering for AT&T, where she led the planning, design, construction and capital maintenance of the wireline and wireless network infrastructure across a national footprint. Previously as Senior Vice President, Corporate Strategy, AT&T Services, Ms. Bloodworth led the Velocity IP program, which laid the groundwork to transform the Company to an all IP/Wireless/Cloud business. Her 23-year career at AT&T included numerous leadership and management positions in Network and Finance, including various roles in Operations, Finance and Business Development within Cingular Wireless and BellSouth Mobility. She began her career at MCI. She is a Certified Public Accountant and has a bachelor’s degree from the University of Alabama and an MBA from Georgia State University.
ETTIENNE BRANDT joined Frontier in 2022 as Executive Vice President, Business. Mr. Brandt has over 20 years of experience in the telecommunications industry across cable, fiber, and wireless providers. He served as Managing Director, Commercial for the Consumer Division of BT Group plc., a British multi-national telecommunications company, as a key member of the leadership team responsible for returning the BT brand to growth. Previously, he served in a variety of roles at EE Ltd, a British national mobile operator and internet service provider, prior to its acquisition by BT, including leading the Enterprise P&L as Marketing and Commercial Director. He began his telecommunications career at NTL Incorporated (now Virgin Media), the largest UK cable provider, and also worked in South Africa and the USA. Mr. Brandt holds a Bachelor of Commerce from Stellenbosch University and is a member of the Chartered Institute of Management Accountants.
VISHAL DIXIT jointed Frontier in 2022 as Executive Vice President, Strategy & Wholesale. Mr. Dixit has over 20 years of experience leading strategy and commercial execution in international telecommunications and technology. He oversees all aspects of corporate strategy, M&A, and the operation of our wholesale business. Most recently, he was a member of Vodafone UK’s executive committee where he developed the company’s successful challenger growth strategy, transformed its wholesale business, and created industry-leading fiber partnerships. Prior to this, as a management consultant at McKinsey & Company, Mr. Dixit served global companies in technology and telecommunications. He began his career with Intel Corporation in New Zealand developing software switches, and holds an MBA from the London Business School, U.K., and a B.E. in Electrical and Electronics Engineering from the University of Auckland, New Zealand.
ALAN GARDNER joined Frontier in 2021 and is Executive Vice President and Chief People Officer. Prior to joining Frontier, he was Senior Vice President, Human Resources of Verizon Communications, leading HR centers of all-encompassing expertise for employees around the globe. Prior to this, he was Senior Vice President, Human Resources, of Verizon Wireless, the $87 billion US-based joint venture between Verizon Communications and Vodafone. He held other executive roles of increasing responsibility within Verizon. Previously, Mr. Gardner was Director of Compensation and served in other roles at GTE Corporation. He began his career at American Express, UCCEL Corporation, and General Dynamics. He received a BS in computer science from the University of North Texas, a management certificate from the Management Institute for Engineers, Computer Professionals and Scientists at the University of Texas at Austin, and an MBA from the Cox School of Business at Southern Methodist University.
JOHN HARROBIN joined Frontier in 2021 and is Executive Vice President, Consumer. Prior to joining Frontier, he was Chief Marketing Officer at Audible, where he led the growth turnaround, brand repositioning, and content marketing capabilities of this multi-billion-dollar global content technology and entertainment subsidiary of Amazon. Under his leadership, Audible’s customer base doubled within 33 months as he expanded new, emerging channels, including mobile, social, and SEO. He began his marketing career in 1997 as a Senior Product Manager at Verizon Wireless. During his 18-year tenure at the company, he served in progressively senior roles, ultimately becoming Chief Marketing Officer. As leader of national marketing for Verizon Wireless, Mr. Harrobin led the launch of new products and businesses focused on mobile advertising, mobile content, and large-scale content rights and sponsorship negotiations with all major broadcast and cable networks, music labels, celebrity talent, and sport leagues including the NHL and NFL. Mr. Harrobin sits on the Executive Board of Villanova University’s Center for Marketing & Customer Insights. He has been recognized as an Outstanding Mentor by Advertising Women of New York, a top LGBT+ Global Ally by InVolve, and a top CMO by Forbes. He holds a BS from Villanova University and an MBA from Northwestern University’s Kellogg School of Management.
NICK JEFFERY joined Frontier in 2021 and is President and Chief Executive Officer. Mr. Jeffery has nearly 30 years of expertise and leadership in the telecommunications industry. Most recently, he was a member of the Vodafone Group Executive Board, a world-leading wireless and wireline operator and, as CEO, led the turn-around of Vodafone UK, the company’s home market. Mr. Jeffery founded and grew Vodafone’s Internet of Things business to become a world leader. Mr. Jeffery was additionally a Trustee of The Vodafone Foundation. Prior to joining Vodafone, Mr. Jeffery also spent more than a decade at Cable & Wireless, one of the world’s largest wireline companies, where he was CEO from 2012-2013. He was Head of Worldwide Sales and European EVP at Ciena Inc. from 2002 until 2004. In 2020 Mr. Jeffery was named CEO of the Year at the Mobile Industry Awards and in 2019. Mr. Jeffery is a graduate of the University of Warwick, U.K. with a B.S. in Economics, and a graduate of both INSEAD-Europe and Wharton U.S. Management Development programs.
ERIN KURTZ joined Frontier in 2021 and is Executive Vice President and Chief Communications Officer. Ms. Kurtz is a strategic communications leader with two decades of experience across a wide range of industries, including media, technology, logistics, and financial services. Most recently, she was Senior Vice President of XPO Logistics, where she set the global communications agenda for one of the fastest growing companies in the Fortune 500. In this role, she built and led an integrated communications strategy across public relations, reputation management, digital and social media, employee communications, brand marketing and government affairs. Prior to joining XPO in 2016, Ms. Kurtz co-founded Hunt & Gather, a high-touch marketing and communications agency, and held senior communications roles at Joele Frank, AOL, and Thomson Reuters. She started her career in Washington, DC at the American Hospital Association. Ms. Kurtz graduated from Syracuse University with a B.S. in Communications and Political Science.
WILLIAM MCGLOIN was appointed Chief Accounting Officer and Controller in June 2022. Mr. McGloin has served at Frontier for over nine years, most recently as Frontier’s Vice President, Controller, since 2018 and as Vice President, Assistant Controller since 2014. Prior to joining Frontier, he spent 17 years at KPMG’s audit practice where he completed a three-year rotation in the Department of Professional Practice (DPP) in the National Office. While at DPP, his principal responsibilities included researching technical accounting and SEC reporting inquiries received from engagement teams throughout the globe as well as developing firm auditing and accounting guidance and publications. While at KPMG’s audit practice he provided financial statement and internal control audits to both Fortune 500 SEC registrants and other large SEC clients with a concentration in the consumer products, manufacturing, software, retail, chemical and telecommunications industries. Mr. McGloin graduated from Florida Atlantic University with a B.A. in Accounting and is also a Certified Public Accountant.
CHARLON MCINTOSH joined Frontier in 2021 and is Executive Vice President and Chief Customer Operations Officer. Prior to joining Frontier, she was Humana’s Senior Vice President of Group Military Specialty Service and Business Operations, responsible for all customer support and operations for the Employer Group, Military and Specialty lines of business. She was also Head of the Customer Experience, developing and enabling Humana’s customer strategy. Ms. McIntosh held numerous leadership positions in customer operations and strategy during a nearly 20-year career with Humana, Charter Communications and Time Warner Cable. She began her career at Comcast. She earned an MBA from New York University and graduated with high honors from the University of California, Berkeley. She is a graduate of the NAMIC Executive Leadership Development Program and is a Women in Cable Television Betsy Magness Leadership Institute Fellow.
MARK D. NIELSEN has been with Frontier since 2014 and is Executive Vice President, Chief Legal and Regulatory Officer. Prior to joining Frontier, he was Associate General Counsel and Chief Compliance Officer for Praxair Inc. and Vice President and Assistant General Counsel of Raytheon Company. Before that, Mr. Nielsen served as Chief Legal Counsel, and then Chief of Staff, to Massachusetts Governor Mitt Romney from 2004 to 2007. Mr. Nielsen is a member of the Adjunct Faculty at Columbia Law School. He earned a B.A. from Harvard College and a J.D. from Harvard Law School with Honors.
MELISSA PINT joined Frontier in 2021 and is Executive Vice President, Chief Digital Information Officer. Prior to joining Frontier, she was Senior Vice President and Head of Technology at JCPenney, implementing a digital optimization strategy and customer-focused solutions for JCP.com, the JCP mobile app, all store and supply chain systems, business intelligence, analytics, marketing, and back-end merchandising. Ms. Pint has held leadership positions in technology, IT, and operations over a 25-year career with JCPenney, Target, and Cargill. She earned an MBA from the University of Minnesota and her undergraduate degree from the University of St. Thomas in Minnesota.
JOHN STRATTON was selected to serve as Executive Chairman in April 2021 after serving as a Board Observer since May 2020. He retired from Verizon Communications at the end of 2018, capping a 25-year career. In his most recent role, as Executive Vice President and President of Global Operations, he had full P&L responsibility for all of Verizon’s established businesses, employing 140,000 employees globally, generating more than $120 billion in annual revenue, and serving more than 120 million customers worldwide. In this role, he also led Verizon’s corporate marketing group and its consumer and business product management organizations. Prior to taking responsibility for all of Verizon’s network businesses, Mr. Stratton led several different divisions as Chief Operating Officer of Verizon Wireless, then as President of its global Enterprise Solutions group, and as head of all the company’s wireline divisions. He served as Verizon’s Chief Marketing Officer, and in 2009 was named as the No. 2 global “power player” by Ad Age magazine. Mr. Stratton is a member of the board of directors of Abbott Laboratories, a global healthcare leader, and of General Dynamics, a global aerospace and defense company. He also is a member of the board of directors of SubCom, LLC.
PART II
Item 5. Market for Registrant's Common Equity; Related Stockholder Matters, and Issuer Purchases of Equity Securities
Common Stock Information
Our common stock is currently traded on the Nasdaq Global Select Market under the symbol “FYBR”. We paid no cash dividends to common shareholders in either of 2024 and 2023.
As of February 3, 2025, the approximate number of security holders of record of our common stock was 408. We estimate the total number of stockholders to be higher as a number of our shares are held by brokers or dealers for their customers in street name.
Stock Performance Graph
The following chart provides a comparison of the cumulative total return of our common stock to the S&P MidCap 400 Index and the S&P 500 Telecom Services Index for the period from May 4, 2021, the day our common stock was listed and began trading on the Nasdaq, through December 31, 2024. The graph assumes $100 was invested at the open of market on May 4, 2021 in our common stock. Such returns are based on historical results and are not intended to suggest future performance. The S&P MidCap 400 Index and the S&P 500 Telecom Services Index assume reinvestment of any dividends.
Indexed Monthly Stock Price Close
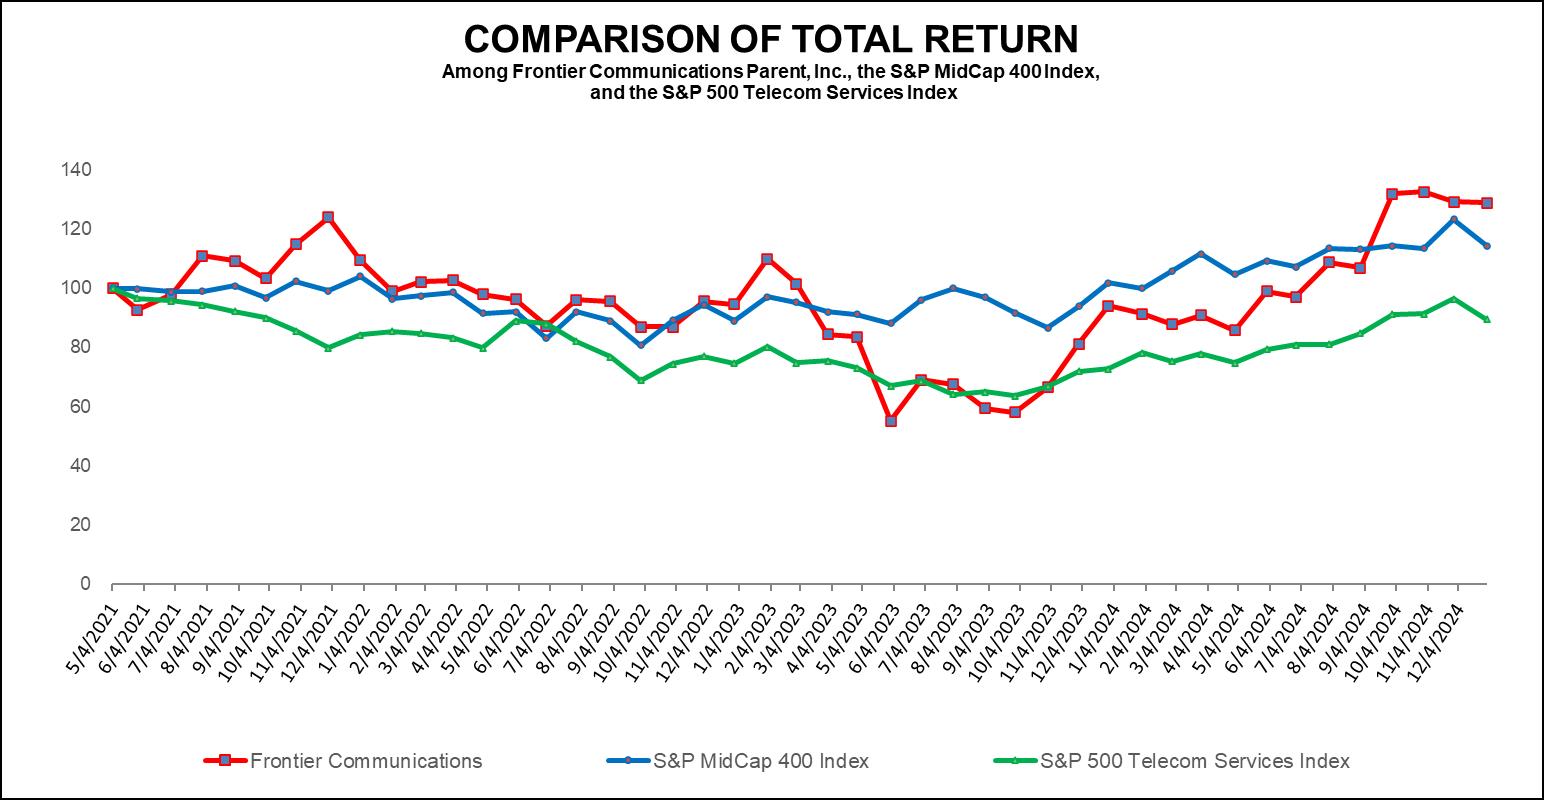
Source: FactSet
|
|
|
|
|
|
|
|
|
|
|
|
|
|
| INDEXED |
|
| Base |
| RETURN |
|
|
| Date | Year Ending |
| Company / Index | 5/21 |
| 12/24 |
|
| Frontier Communications Parent, Inc. | 100 |
| 128.76 |
|
| S&P Midcap 400 Index | 100 |
| 114.28 |
|
| S&P 500 Telecom Services Index | 100 |
| 89.57 |
|
|
|
|
|
|
|
The stock performance depicted in the graph above is not to be relied upon as indicative of future performance. The stock performance graph shall not be deemed to be incorporated by reference into any of our filings under the Securities Act of 1933, as amended or the Exchange Act, except to the extent that we specifically incorporate the same by reference, nor shall it be deemed to be ‘‘soliciting material’’ or to be ‘‘filed’’ with the SEC or subject to Regulations 14A or 14C or to the liabilities of Section 18 of the Exchange Act.
Item 6. [Reserved]
Item 7. Management’s Discussion and Analysis of Financial Condition and Results of Operations Introduction
The following discussion should be read in conjunction with the audited consolidated financial statements and the related notes in Part II, Item 8, of this Annual Report on Form 10-K. In addition to historical information, the following discussion also contains forward-looking statements that include risks and uncertainties. Our actual results may differ materially from those anticipated in these forward-looking statements as a result of certain factors, including those set forth under the heading ‘‘Risk Factors’’ in Part I, Item 1A of this Annual Report on Form 10-K. This section generally discusses the results of our operations for the year ended December 31, 2024, compared to the year ended December 31, 2023. For a discussion of the year ended December 31, 2023, compared to the year ended December 31, 2022, please refer to Part II, Item 7, “Management’s Discussion and Analysis of Financial Condition and Results of Operations” in our Annual Report on Form 10-K for the year ended December 31, 2023.
Business Overview
Frontier Communications Parent, Inc. is a leading communications and technology provider offering broadband services to approximately 3.1 million broadband customers, with approximately 13,000 employees, operating in 25 states as of December 31, 2024. We are building critical infrastructure across the country with our fiber-optic network and cloud-based solutions, enabling secure high-speed connections. Driven by our purpose of Building Gigabit AmericaTM, we are focused on supporting a digital society, closing the digital divide, and working toward a more sustainable environment.
In 2020, we began the expansion and transformation of our fiber network to meet the rapidly increasing demand for data from our consumer and business customers. We believe that a fiber network has competitive advantages to be able to meet this growing demand, including faster download speeds, faster upload speeds, and lower latency levels than alternative broadband services.
In August 2021, we announced our plan to pass 10 million total locations with fiber. We are prioritizing our activities to locations that we believe will provide the highest investment returns. Over time, we expect our business mix will shift significantly, with a larger percentage of revenue coming from fiber as we implement our expansion plan.
Our strategy focuses on four strategic priorities: fiber deployment, fiber penetration, operational efficiency, and improving the customer experience. We accomplished the following objectives in 2024:
We added approximately 1.3 million fiber passings. As of December 31, 2024, we had approximately 7.8 million total locations passed with fiber.
We added 385,000 fiber broadband customer net additions, resulting in fiber broadband customer growth of 19% as compared to the prior year. In our base fiber footprint of 3.2 million locations, we reached broadband penetration of 46.2%.
Fiber broadband customer net additions continued to outpace copper broadband customer net losses, resulting in 151,000 total broadband customer net additions.
Revenue growth of 3% year-over-year, as fiber revenue growth of 14% offset copper revenue declines of 8%.
We improved our liquidity and cost of capital through the issuance of $750 million low-cost fiber securitization notes, the addition of a $1.5 billion delayed draw term loan facility, and the refinancing and repricing of our $1.02 billion term loan. These transactions reduced the ongoing cost of funding our fiber upgrade program.
We achieved our annualized gross run rate cost savings target of $500 million at the end of 2023 – double our initial goal of $250 million. As of December 31, 2024, we had realized $597 million of gross annualized cost savings since 2021.
On September 4, 2024 we entered into the Merger Agreement with Verizon, pursuant to which, subject to certain terms and conditions therein, Verizon will acquire Frontier for $38.50 per share in cash, representing a premium of 43.7% to Frontier’s 90-Day volume-weighted average share price (VWAP) on September 3, 2024, the last full trading day prior to published market speculation regarding a potential sale of Frontier. Subject to receipt of certain required regulatory approvals and other customary conditions specified in the Merger Agreement, we currently expect the Merger to close by the first quarter of 2026. See Note 2 - ‘‘Merger Agreement’’ to the Consolidated Financial Statements included in Part II of this Annual Report for more detail.
Our fiber build plans include significant expenditures which could be adversely impacted by supply chain delays, actual or perceived inflation, tight labor markets, increased fuel and electricity costs, increases in the cost of borrowing, and other risks. In addition to higher costs, the availability of building materials and other supply chain risks could negatively impact our ability to achieve the fiber build plans we are executing against. We continue to closely monitor and evaluate the impact these and other factors may have on our business, including demand for our products and services, our ability to execute on our strategic priorities and our financial condition and results of operations.
Financial Overview – Operating Income
We reported operating income of $353 million and $492 million, for the years ended December 31, 2024 and 2023, respectively, a decrease of $139 million.
Operating income decreased primarily due to decreases in revenue from voice and video services and increases in selling, general and administrative expenses, and in depreciation and amortization expense. These factors were partially offset by an increase in data and internet services revenue, as well as decreases in cost of service as compared to 2023.
Presentation of Results of Operations
The sections below include tables that present customer counts, average monthly consumer revenue per customer (“ARPC”), average monthly revenue per unit (“ARPU”), and consumer customer churn. We define churn as the number of consumer customer deactivations during the month divided by the number of consumer customers at the beginning of the month and utilize the average of each monthly churn in the period. Management believes that consumer customer counts, ARPC, ARPU, and consumer customer churn are important factors in evaluating our consumer customer trends. Among the key services we provide to consumer customers are voice service, data service and video service. We continue to explore the potential to provide additional services to our customer base, with the objective of meeting our customers’ communications needs.
(a) Results of Operations
Customer Trends
|
|
|
|
|
|
|
|
|
|
|
|
|
|
|
|
|
|
|
|
|
|
|
|
|
|
| As of or for the year ended December 31, |
|
| (Customer, Subscriber, and Employee Metrics in thousands) |
| 2024 |
| 2023 |
| % Change |
|
|
|
|
|
|
|
|
|
|
|
|
|
| Broadband Customer Metrics |
|
|
|
|
|
|
|
|
|
|
| Fiber Broadband |
|
|
|
|
|
|
|
|
|
|
| Consumer customers |
|
| 2,249 |
|
| 1,878 |
| 20 | % |
|
| Business and wholesale customers |
|
| 143 |
|
| 129 |
| 11 | % |
|
| Consumer net customer additions |
|
| 371 |
|
| 303 |
| 22 | % |
|
| Consumer customer churn |
|
| 1.36% |
|
| 1.32% |
| 3 | % |
|
| Consumer customer ARPU |
| $ | 65.54 |
| $ | 63.39 |
| 3 | % |
|
| Copper Broadband |
|
|
|
|
|
|
|
|
|
|
| Consumer customers |
|
| 612 |
|
| 822 |
| (26) | % |
|
| Business and wholesale customers |
|
| 90 |
|
| 114 |
| (21) | % |
|
| Consumer net customer losses |
|
| (210) |
|
| (221) |
| (5) | % |
|
| Consumer customer churn |
|
| 2.22% |
|
| 1.90% |
| 17 | % |
|
| Consumer customer ARPU |
| $ | 58.96 |
| $ | 52.43 |
| 12 | % |
|
|
|
|
|
|
|
|
|
|
|
|
|
| Consumer Customer Metrics |
|
|
|
|
|
|
|
|
|
|
| Customers |
|
| 3,193 |
|
| 3,129 |
| 2 | % |
|
| Net customer additions / (losses) |
|
| 64 |
|
| (4) |
| (1,700) | % |
|
| ARPC |
| $ | 83.53 |
| $ | 82.53 |
| 1 | % |
|
| Customer Churn |
|
| 1.65% |
|
| 1.52% |
| 8 | % |
|
|
|
|
|
|
|
|
|
|
|
|
|
| Other Metrics |
|
|
|
|
|
|
|
|
|
|
| Employees |
|
| 13,025 |
|
| 13,297 |
| (2) | % |
|
|
|
|
|
|
|
|
|
|
|
|
|
We provide service and product options in our consumer and business offerings in each of our markets.
Fiber Broadband Customers
Our investment strategy is focused on expanding our fiber network. In conjunction with this strategy, we are also working to improve our product positioning in both existing and new fiber markets.
For the year ended December 31, 2024, we added approximately 371,000 consumer fiber broadband customers compared to approximately 303,000 in 2023. Customers who migrated from our copper base constituted a minor portion of these consumer fiber broadband customer net additions in 2024.
For the year ended December 31, 2024, we added approximately 14,000 business and wholesale fiber broadband customers compared to approximately 15,000 in 2023.
Our focus on expanding and improving our fiber network has contributed to healthy customer retention. Our average monthly consumer fiber broadband churn was 1.36% for the year ended December 31, 2024, compared to 1.32% in 2023. These consistent results were driven by our continued focus on key customer touchpoints such as installation and first bill and reflect retention activities associated with inflation-related pricing actions and the end of certain promotion pricing periods.
oThe average monthly consumer fiber broadband revenue per customer (“consumer ARPU”) increased $2.15, or 3%, to
$65.54 in 2024, compared to $63.39 in 2023.
oThe increase in consumer ARPU for the year ended December 31, 2024 was due to higher intake pricing, customer shifts
to higher broadband speeds, customers rolling off promotional pricing, and lower gift card redemptions, all partially offset by increased retention activity and autopay take rates.
Copper Broadband Customers
For the year ended December 31, 2024, we lost approximately 210,000 consumer copper broadband customers compared to a loss of approximately 221,000 in 2023.
For the year ended December 31, 2024, we lost approximately 24,000 business and wholesale copper broadband customers compared to a loss of approximately 22,000 in 2023.
Our average monthly consumer copper broadband churn was 2.22% for the year ended December 31, 2024, compared to 1.90% in 2023. The increase in consumer copper broadband churn was driven by the impact of inflationary price increases and changes to our copper broadband go to market approach which impacted gross add volume.
Consumer Customers
We experienced an increase in consumer customers of 2% as of December 31, 2024, as compared to December 31, 2023.
Consumer customer gains were driven by net additions of fiber broadband customers, partially offset by reductions in our copper broadband and stand-alone voice customers. Customer preferences as well as our fiber investment initiatives resulted in an increase in the number of our consumer broadband customers and a migration of our copper customers to fiber.
We gained approximately 64,000 consumer customers for the year ended December 31, 2024, compared to a loss of approximately 4,000 consumer customers for the year ended December 31, 2023, driven by growth in fiber broadband customers and partially offset by losses in copper broadband, voice and video customers.
For the year ended December 31, 2024, we experienced a net gain of consumer broadband customers of approximately 161,000 as compared to a net gain of approximately 82,000 for the year ended December 31, 2023.
oThe average monthly consumer revenue per customer (“consumer ARPC”) increased $1.00, or 1%, to $83.53 for the year ended December 31, 2024, compared to the prior year period. The slight increase was driven primarily by growth in fiber data and value-added services along with price increases, partially offset by declines in voice and video services. We have de-emphasized the sale of low margin video products, which has historically been a material part of the overall ARPC. Going forward, we expect moderate movements in ARPC as our customer mix becomes more weighted towards broadband services.
Financial Results
|
|
|
|
|
|
|
|
|
|
|
|
|
|
|
|
|
|
|
|
|
|
|
| For the year ended |
|
| For the year ended |
|
|
|
|
| December 31, |
|
| December 31, |
|
|
| ($ in millions) |
| 2024 |
|
| 2023 |
|
|
|
|
|
|
|
|
|
|
|
|
|
| Data and Internet services |
| $ | 3,963 |
|
| $ | 3,534 |
|
|
| Voice services |
|
| 1,231 |
|
|
| 1,373 |
|
|
| Video services |
|
| 344 |
|
|
| 430 |
|
|
| Other |
|
| 335 |
|
|
| 339 |
|
|
| Revenue from contracts with customers |
|
| 5,873 |
|
|
| 5,676 |
|
|
| Subsidy and other revenue |
|
| 64 |
|
|
| 75 |
|
|
| Revenue |
|
| 5,937 |
|
|
| 5,751 |
|
|
|
|
|
|
|
|
|
|
|
|
|
| Operating expenses: |
|
|
|
|
|
|
|
|
|
| Cost of service |
|
| 2,110 |
|
|
| 2,125 |
|
|
| Selling, general and administrative expenses |
|
| 1,725 |
|
|
| 1,646 |
|
|
| Depreciation and amortization |
|
| 1,625 |
|
|
| 1,415 |
|
|
| Restructuring costs and other charges |
|
| 124 |
|
|
| 73 |
|
|
| Total operating expenses |
| $ | 5,584 |
|
| $ | 5,259 |
|
|
|
|
|
|
|
|
|
|
|
|
|
| Operating income |
|
| 353 |
|
|
| 492 |
|
|
|
|
|
|
|
|
|
|
|
|
|
| Consumer |
|
| 3,163 |
|
|
| 3,097 |
|
|
| Business and wholesale |
|
| 2,710 |
|
|
| 2,579 |
|
|
| Revenue from contracts with customers |
| $ | 5,873 |
|
| $ | 5,676 |
|
|
|
|
|
|
|
|
|
|
|
|
|
| Fiber revenue |
|
| 3,402 |
|
|
| 2,997 |
|
|
| Copper revenue |
|
| 2,471 |
|
|
| 2,679 |
|
|
| Revenue from contracts with customers |
| $ | 5,873 |
|
| $ | 5,676 |
|
|
|
|
|
|
|
|
|
|
|
|
|
REVENUE
The table below presents our revenue by technology for the periods indicated:
|
|
|
|
|
|
|
|
|
|
|
|
|
|
|
|
|
|
|
|
|
|
|
|
|
|
|
|
|
|
|
|
|
|
| For the year ended |
| For the year ended |
|
|
|
|
|
|
|
|
|
|
| December 31, |
| December 31, |
| $ Increase |
| % Increase |
|
|
| ($ in millions) |
| 2024 |
| 2023 |
| (Decrease) |
| (Decrease) |
|
|
|
|
|
|
|
|
|
|
|
|
|
|
|
|
|
|
| Fiber |
| $ | 3,402 |
| $ | 2,997 |
| $ | 405 |
| 14 | % |
|
|
| Copper |
|
| 2,471 |
|
| 2,679 |
|
| (208) |
| (8) | % |
|
|
| Revenue from contracts with customers (1) |
|
| 5,873 |
|
| 5,676 |
|
| 197 |
| 3 | % |
|
|
| Subsidy revenue |
|
| 64 |
|
| 75 |
|
| (11) |
| (15) | % |
|
|
| Total revenue |
| $ | 5,937 |
| $ | 5,751 |
| $ | 186 |
| 3 | % |
|
|
|
|
|
|
|
|
|
|
|
|
|
|
|
|
|
|
(1)Includes $52 million and $62 million of lease revenue for the years ended December 31, 2024 and 2023, respectively.
Our revenue streams are primarily a result of recurring data, voice, and video services delivered over our fiber and copper network. Revenues are considered fiber or copper based on the “last-mile” technology used to connect the customer location. With our investment strategy to expand and improve our fiber network and the corresponding fiber focus of our sales and marketing efforts, we are experiencing growth in fiber broadband revenue and a decline in copper revenue. We expect this trend to continue and accelerate due to strong fiber demand and the migration of customers from copper to fiber as we expand our fiber network.
The table below presents our revenue for our consumer and business and wholesale customers for the periods indicated:
|
|
|
|
|
|
|
|
|
|
|
|
|
|
|
|
|
|
|
|
|
|
|
|
|
|
|
|
|
|
|
|
|
|
| For the year ended |
| For the year ended |
|
|
|
|
|
|
|
|
|
|
| December 31, |
| December 31, |
| $ Increase |
| % Increase |
|
|
| ($ in millions) |
| 2024 |
| 2023 |
| (Decrease) |
| (Decrease) |
|
|
|
|
|
|
|
|
|
|
|
|
|
|
|
|
|
|
| Consumer |
| $ | 3,163 |
| $ | 3,097 |
| $ | 66 |
| 2 | % |
|
|
| Business and wholesale |
|
| 2,710 |
|
| 2,579 |
|
| 131 |
| 5 | % |
|
|
| Revenue from contracts with customers (1) |
|
| 5,873 |
|
| 5,676 |
|
| 197 |
| 3 | % |
|
|
| Subsidy revenue |
|
| 64 |
|
| 75 |
|
| (11) |
| (15) | % |
|
|
| Total revenue |
| $ | 5,937 |
| $ | 5,751 |
| $ | 186 |
| 3 | % |
|
|
|
|
|
|
|
|
|
|
|
|
|
|
|
|
|
|
(1)Includes $52 million and $62 million of lease revenue for the years ended December 31, 2024 and 2023, respectively.
We conduct business with a range of consumer, business, and wholesale customers, and we generate both recurring and non-recurring revenues. Recurring revenues are primarily billed at fixed recurring rates, with some services billed based on usage. Revenue recognition is not dependent upon significant judgments by management, with the exception of a determination of the provision for expected credit losses.
Consumer
For the year ended December 31, 2024, compared to the year ended December 31, 2023:
Consumer revenues increased approximately 2% for the year ended December 31, 2024, as compared to the year ended December 31, 2023. The revenue growth was the result of growth in fiber data and value added service revenues along with inflationary price increases, offset by declines in voice, video, and copper broadband.
oWe experienced a 23% improvement in consumer fiber broadband revenues for the year ended December 31, 2024, as compared to the year ended December 31, 2023.
oThis improvement is a result of higher consumer fiber broadband ARPU as well as increase net adds of consumer fiber broadband customers due to our expanded fiber footprint and continued focus on product positioning in both new and existing markets.
We experienced a decline of approximately 13% in consumer copper broadband revenues for the year ended December 31, 2024, as compared to the year ended December 31, 2023. As our copper footprint transitions to fiber, we expect fewer copper sales opportunities, and will proactively migrate certain existing broadband customers from copper to fiber, both of which will reduce our copper net adds.
Business and Wholesale
For the year ended December 31, 2024, our business and wholesale revenues increased 5%, as compared to the prior year. This increase was driven by increases in fiber broadband and network access services, partially offset by decreases in voice revenue predominantly in business. The increase in fiber broadband was due to continued growth of our customer base, and a shift towards higher broadband speeds. The increase in network access services is due primarily to price adjustments as well as install and upgrade activity.
The table below presents our revenue by product and service type for the periods indicated:
|
|
|
|
|
|
|
|
|
|
|
|
|
|
|
|
|
| For the year ended |
| For the year ended |
|
|
|
|
|
|
|
|
|
| December 31, |
| December 31, |
| $ Increase |
| % Increase |
|
| ($ in millions) |
| 2024 |
| 2023 |
| (Decrease) |
| (Decrease) |
|
|
|
|
|
|
|
|
|
|
|
|
|
|
|
|
| Data and Internet services |
| $ | 3,963 |
| $ | 3,534 |
| $ | 429 |
| 12 | % |
|
| Voice services |
|
| 1,231 |
|
| 1,373 |
|
| (142) |
| (10) | % |
|
| Video services |
|
| 344 |
|
| 430 |
|
| (86) |
| (20) | % |
|
| Other |
|
| 335 |
|
| 339 |
|
| (4) |
| (1) | % |
|
| Revenue from contracts with customers (1) |
|
| 5,873 |
|
| 5,676 |
|
| 197 |
| 3 | % |
|
| Subsidy revenue |
|
| 64 |
|
| 75 |
|
| (11) |
| (15) | % |
|
| Total revenue |
| $ | 5,937 |
| $ | 5,751 |
| $ | 186 |
| 3 | % |
|
|
|
|
|
|
|
|
|
|
|
|
|
|
|
|
(1)Includes $52 million and $62 million of lease revenue for the years ended December 31, 2024 and 2023, respectively.
We categorize our products, services, and other revenues into the following five categories:
Data and Internet Services
We provide data and Internet services to our consumer, business, and wholesale customers. Data and Internet services consist of fiber broadband services, copper broadband services, and network access revenues (data transmission services and dedicated high-capacity circuits including data services to wireless providers commonly called wireless backhaul). Network access services are provided primarily to our business and wholesale customers, while fiber and copper broadband are provided to all customer segments.
Our fiber expansion strategy is expected to positively impact data and Internet services. This network expansion is designed to provide faster, symmetrical broadband speeds and provide customer and revenue growth opportunities for fiber broadband and certain network access products like ethernet. We believe this initiative will create opportunities for us to provide more fiber-based services to our customers.
|
|
|
|
|
| ($ in millions) |
|
|
|
|
|
|
| Data and Internet services revenue, December 31, 2023 | $ | 3,534 |
|
| Change in fiber broadband revenue |
| 320 |
|
| Change in copper broadband revenue |
| (89) |
|
| Change in other data and internet services |
| 198 |
|
| Data and Internet services revenue, December 31, 2024 | $ | 3,963 |
|
|
|
|
|
|
Data and internet services revenue increased $429 million, or 12%, to $3,963 million for the year ended December 31, 2024, as compared to the prior year. The increase was driven by growth in the fiber broadband and network access revenues, partly offset by declines in copper broadband revenue.
Voice services
We provide voice services consisting of traditional local and long-distance service and voice over Internet protocol (VoIP) service provided over our fiber and copper broadband products. It also includes enhanced features such as call waiting, caller identification, and voice messaging services.
Voice services revenue declined $142 million, or 10%, to $1,231 million, for the year ended December 31, 2024, as compared to the prior year. The decline was primarily due to net losses in business and consumer customers in addition to fewer customers bundling voice services with broadband as compared to the prior year period, all partially offset by higher voice services ARPU.
Video services
Video services include revenues generated from traditional television (TV) services provided directly to consumer customers as well as satellite TV services provided through various satellite providers. Video services also includes pay-per-view revenues, video on demand, equipment rentals, and video advertising. We have made the strategic decision to limit sales of new traditional TV services, focusing on our broadband products and OTT video options. We are partnering with OTT video providers and expect this to grow as OTT options are offered with our broadband products.
Video services revenue declined $86 million, or 20%, to $344 million, for the year ended December 31, 2024, as compared to the prior year. The decline was primarily driven by traditional video customer losses, partially offset by price increases as compared to the prior year.
Other
Other customer revenue includes non-recurring equipment sales, network facility rental income, ancillary customer fees, directory listing services and switched access revenue. Switched access revenue includes revenue derived from allowing other carriers to use our network to originate and/or terminate their local and long-distance voice traffic. These switched access services are primarily billed on a minutes-of-use basis applying tariffed rates filed with the FCC or state agencies.
Other customer revenue decreased $4 million, or 1%, to $335 million for the year ended December 31, 2024, as compared to the prior year period driven by decreases in rent, switched access and equipment sales, partially offset by higher other fees.
Subsidy and other revenue
Subsidy and other revenue decreased $11 million, or 15%, to $64 million for the year ended December 31, 2024, compared to the prior year, primarily due to decreases in federal and state subsidies.
OPERATING EXPENSES
The table below presents our operating expenses for the periods indicated:
|
|
|
|
|
|
|
|
|
|
|
|
|
|
|
|
|
|
|
|
|
| For the year ended |
| For the year ended |
|
|
|
|
| ($ in millions) | December 31, |
| December 31, |
| Variance |
|
|
| 2024 |
| 2023 |
| % |
|
| Operating expenses: |
|
|
|
|
|
|
|
|
|
| Cost of Service | $ | 2,110 |
| $ | 2,125 |
| (1) | % |
|
| Selling, general and administrative expenses |
| 1,725 |
|
| 1,646 |
| 5 | % |
|
| Depreciation and amortization |
| 1,625 |
|
| 1,415 |
| 15 | % |
|
| Restructuring costs and other charges |
| 124 |
|
| 73 |
| 70 | % |
|
| Total operating expenses | $ | 5,584 |
| $ | 5,259 |
| 6 | % |
|
|
|
|
|
|
|
|
|
|
|
|
Cost of Service
Cost of service expenses include access charges and other third-party costs directly attributable to connecting customer locations to our network and video content costs. Such access charges and other third-party costs exclude depreciation and amortization, and employee related expenses.
Cost of service decreased $15 million for the year ended December 31, 2024, as compared to the prior year. The decrease in cost of service expense was driven by lower video content costs as a result of declines in video customers, non-renewal of certain content agreements, and decreased CPE costs. These decreases more than offset higher energy and outside service rate increases resulting from higher inflation.
Selling, General, and Administrative Expenses
Selling, general, and administrative expenses (“SG&A expenses”) include the salaries, wages and related benefits and costs of corporate and sales personnel, travel, insurance, non-network related rent, advertising, and other administrative expenses.
SG&A expenses increased by $79 million for the year ended December 31, 2024, as compared to the prior year. This increase was primarily a result of increases in marketing costs, third party commissions, property taxes, and a settled dispute with the Chief Executive Officer of Frontier’s predecessor company, partially offset by lower compensation and other fees.
Pension and Other post-employment benefits (“OPEB”) costs
We allocate certain pension/OPEB expense to cost of service and SG&A expenses. Total pension and OPEB service costs were as follows:
|
|
|
|
|
|
|
|
|
|
|
|
|
|
|
|
|
|
|
|
| For the year ended |
| For the year ended |
|
|
|
| December 31, |
| December 31, |
|
| ($ in millions) |
| 2024 |
| 2023 |
|
|
|
|
|
|
|
|
|
|
| Total pension/OPEB expenses |
| $ | 54 |
| $ | 59 |
|
| Less: costs capitalized into capital expenditures |
|
| (18) |
|
| (18) |
|
| Net pension/OPEB expense |
| $ | 36 |
| $ | 41 |
|
|
|
|
|
|
|
|
|
|
Depreciation and Amortization
For the year ended December 31, 2024, the increased depreciation and amortization expense was driven by higher depreciation expense as a result of higher property, plant and equipment in service.
Restructuring costs and other charges
Restructuring costs and other charges consist of consulting and advisory fees, workforce reductions, transformation initiatives, and other restructuring expenses.
For the year ended December 31, 2024, restructuring costs and other charges increased $51 million, as compared to the year ended December 31, 2023, primarily due to higher pension/OPEB special termination benefit enhancement costs related to a voluntary severance program, costs associated with the Verizon merger and other restructuring activities, slightly offset by lower severance and employee costs.
OTHER NON-OPERATING INCOME AND EXPENSE
|
|
|
|
|
|
|
|
|
|
|
|
|
|
| For the year ended |
| For the year ended |
|
|
|
|
| ($ in millions) |
| December 31, |
| December 31, |
| % Increase |
|
|
|
| 2024 |
| 2023 |
| (Decrease) |
|
|
|
|
|
|
|
|
|
|
|
|
|
| Investment and other income, net |
| $ | 105 |
| $ | 278 |
| (62) | % |
|
| Interest expense |
| $ | (804) |
| $ | (653) |
| 23 | % |
|
| Income tax expense (benefit) |
| $ | (24) |
| $ | 88 |
| (127) | % |
|
|
|
|
|
|
|
|
|
|
|
|
|
Investment and other income, net
Investment and other income, net decreased by $173 million for the year ended December 31, 2024, as compared to the year ended December 31, 2023. This decrease was primarily driven by a remeasurement loss to our pension plan of $45 million for the year ended December 31, 2024, compared to a remeasurement gain of $202 million for the year ended December 31, 2023, partially offset by a remeasurement gain to our postretirement benefit plan of $35 million, for the year ended December 31, 2024, compared to a remeasurement loss of $3 million, for the year ended December 31, 2023.
Interest expense
For the year ended December 31, 2024, interest expense increased $151 million, as compared to 2023. The increase in interest expense was primarily driven by a higher debt balance.
Income tax expense (benefit)
During the year ended December 31, 2024, we recorded an income tax benefit of $24 million on pre-tax loss of $346 million. Our effective tax rate for the year ended December 31, 2024 was 7.0%.
(b) Liquidity and Capital Resources
As of December 31, 2024, we had liquidity of approximately $2,910 million, comprised of cash and cash equivalents of $750 million, the available capacity on our delayed draw term loan facility of $1,500 million and undrawn revolving credit facility of $660 million.
On December 31, 2024, our subsidiaries Frontier Tampa Bay FL Fiber 1 LLC (“Borrower”) and Frontier SPE FL Guarantor LLC (“Guarantor”) entered into a credit agreement (the “Warehouse Credit Agreement”) with certain lenders that established and governs certain credit facilities (the “Warehouse Facilities”) including (i) a delayed draw term loan facility (the “DDTL Facility”) of $1.5 billion, less commitments reserved for letters of credit, and (ii) an incremental term loan facility under which the subsidiary borrower has the right to increase the commitments under the DDTL Facility by up to $750 million.
In connection with the establishment of the DDTL Facility, Frontier Issuer LLC canceled its agreement relating to the potential issuance of a $500 million Secured Fiber Network Revenue Variable Funding Notes, Series 2023-2, Class A-1 facility.
On July 1, 2024, Frontier Issuer LLC amended its Secured Fiber Network Revenue Variable Funding Notes, Series 2023-2, Class A-1 facility (the “VFN Amendment”) to reduce the available Variable Funding Notes commitment amount to $0, with the ability to increase the commitment amount up to $500 million in the future upon the satisfaction of certain conditions, and to extend the maturity date to June 2028.
Analysis of Cash Flows
As of December 31, 2024, we had unrestricted cash and cash equivalents aggregating $750 million. For the year ended December 31, 2024, we used cash flow from operations, cash on hand, and cash from borrowings principally to fund our cash investing and financing activities, which were primarily capital expenditures.
As of December 31, 2024, we had a working capital deficit of $1,029 million compared to a $506 million surplus at December 31, 2023. The primary drivers for the change to the working capital deficit at December 31, 2024 were a decrease in short-term investments of $1,075 million, a decrease of $375 million in cash and cash equivalents, a decrease to vendor financing payables of $247 million and a decrease in accounts receivable of $67 million, partially offset by an increase of $82 million in other current liabilities as compared to the period ended December 31, 2023.
Cash Flows provided from Operating Activities
Cash flows provided from operating activities increased $277 million to $1,621 million for the year ended December 31, 2024, as compared to 2023. The overall increase in operating cash flows was primarily the result of changes in working capital.
We received $10 million in net cash taxes during the year ended December 31, 2024, and we paid less than $1 million in net cash taxes during the year ended December 31, 2023.
Cash Flows used by Investing Activities
Cash flows used by investing activities were $1,681 million for the year ended December 31, 2024, compared to cash flows used by investing activities of $2,556 million in 2023, due to a decrease of $428 million in capital expenditures and an increase from the activity of purchases and sales of short-term investments as compared to the prior year period.
Capital Expenditures
For the years ended December 31, 2024 and 2023, our capital expenditures were $2,783 million and $3,211 million, respectively. The decrease in capital expenditures is due to a greater proportion of capital payments classified as a financing activity in the cash flows for vendor financing in 2024 when compared to the prior year period.
Cash Flows used by Financing Activities
Cash flows used by financing activities decreased $2,397 million to $268 million for the year ended December 31, 2024, as compared to the year ended December 31, 2023. The decrease in financing activities was primarily driven by the decrease in net proceeds from long-term debt borrowings, an increase in long-term debt principal payments and an increase in vendor financing payments in 2024.
Capital Resources
Our primary anticipated uses of liquidity are to fund the costs of operations, working capital and capital expenditures and to fund interest payments on our long-term debt. Our primary sources of liquidity are cash flows from operations, cash on hand and borrowing capacity under our $1,500 million DDTL Facility and $925 million Revolving Facility (as reduced by $265 million of revolver Letters of Credit).
We have negotiated payment terms with certain of our vendors, (referred to as vendor financing), which are excluded from capital expenditures and reported as financing activities. As of December 31, 2024 and December 31, 2023 we had $16 million and $263 million, respectively, of vendor financing liabilities included in “Other current liabilities” on our consolidated balance sheet. Capital expenditures for the year ended December 31, 2024 were $2,783 million, and when including $463 million cash paid for vendor financing, capital investment was $3,246 million.
We have assessed our current and expected funding requirements and our current and expected sources of liquidity, and have determined, based on our forecasted financial results and financial condition as of December 31, 2024, that our operating cash flows, existing cash balances and capacity under our DDTL and Revolving Credit Facilities, will be adequate to finance our working capital requirements, fund capital expenditures, make required debt interest and principal payments, pay taxes and make other payments over the next twelve months. A number of factors, including, but not limited to, loss of customers, pricing pressure from increased competition, lower subsidy and switched access revenues, and the impact of economic conditions, may negatively affect our cash generated from operations.
Credit Facilities and Term Loans
Revolving Facility
On May 22, 2024, Frontier Communications Holdings, LLC, a subsidiary of Frontier (“Frontier Holdings”), entered into an amendment (the “2024 Credit Agreement Amendment”) to its existing credit agreement that governs its senior secured credit facility with certain revolving credit lenders (the “Revolving Facility”) which, among other things, (i) increased the aggregate amount of certain additional obligations permitted to be outstanding, including first lien debt, and securitization and receivables facilities, and non-loan party debt, from $2,500 million to $5,500 million; provided that at least 40% of the net available cash from the first $1,915 million in securitization and receivables facilities received after May 22, 2024 (excluding net available cash received from drawings with respect to $500 million of commitments of Variable Funding Notes) is applied to prepay Frontier Holdings’ existing term loans and other applicable indebtedness, and 100% of the net available cash from securitization and receivables facilities in excess thereof (up to the cap of $5,500 million) shall be applied to prepay Frontier Holdings’ existing term loans and other applicable indebtedness; (ii) limited future securitizations and receivables facilities to assets located in Texas and/or Florida; and (iii) amended the financial maintenance covenant for the benefit of the Revolving Facility by, commencing with the period ending June 30, 2024, (a) including outstanding securitization and receivables facilities in the calculation of indebtedness and (b) increasing the maximum financial maintenance covenant leverage ratio thereunder to 5.25:1.00, with a step-down to 4.75:1.00 commencing with the period ending March 31, 2027, and continuing thereafter. The 2024 Credit Agreement Amendment became effective on July 1, 2024, when $402 million of net available cash from the securitization closing on such date was applied to prepay existing term loans.
On July 30, 2024, Frontier Holdings entered into a further amendment to its existing credit agreement that governs its Revolving Facility, pursuant to which $50 million of revolving credit commitments of a terminating lender were replaced by $75 million of commitments from a new lender, increasing overall capacity from $900 million to $925 million. The maturity date of the Revolving Facility will be the earliest of (a) April 30, 2028, (b) 91 days prior to the maturity of the term loan facility, (c) unless such notes have been repaid and/or redeemed in full, the date that is 91 days prior to the stated maturity date of our 5.875% First Lien Notes due
2027, and (d) unless such notes have been repaid and/or redeemed in full, the date that is 91 days prior to the stated maturity date of our 5.000% First Lien Notes due 2028.
Term Loan Facility
On January 14, 2025, Frontier Holdings entered into an amendment to its existing Term Loan Facility, which, among other things, (x) further lowered the margin over adjusted Term SOFR with respect to the Term Loan from 3.50% to 2.50% and (y) further lowered the margin over the alternative base rate with respect to the Term loan from 2.50% to 1.50%. On July 1, 2024, Frontier Holdings entered into an amendment to the Term Loan Facility which, among other things, extended the maturity date of $1.025 billion of the Term Loan to July 1, 2031 and eliminated the credit spread adjustment previously applicable to the Term Loan.
Fiber Network Revenue Term Notes
On July 1, 2024, Frontier Issuer LLC (“Frontier Issuer”), the Company’s limited-purpose, bankruptcy remote, subsidiary completed the issuance of $750 million aggregate principal amount of secured fiber network revenue term notes consisting of $530 million 6.19% Series 2024-1, Class A-2 term notes, $73 million 7.02% Series 2024-1, Class B term notes and $147 million 11.16% Series 2024-1, Class C term notes, each with an anticipated repayment term of seven years (collectively, the “Fiber Term Notes”). The Fiber Term Notes have a weighted average yield of approximately 7.4%. The Fiber Term Notes are secured by certain of Frontier’s fiber assets and associated customer contracts in the North Texas Area, in addition to those in the Dallas Metropolitan Area contributed in the Series 2023-1 Notes offering.
Warehouse Facilities
On December 31, 2024 (the “Warehouse Effective Date”), Frontier Tampa Bay FL Fiber 1 LLC (the “Warehouse Borrower”) and Frontier SPE FL Guarantor LLC, as guarantor (the “Warehouse Guarantor”), each a subsidiary of the Company, entered into a credit agreement (the “Warehouse Credit Agreement”) with certain lenders that establishes and governs certain credit facilities (the “Warehouse Facilities”). The Warehouse Facilities include:
A delayed draw term loan facility (the “DDTL Facility”) of $1.5 billion, less commitments reserved for letters of credit (the “Maximum DDTL Amount”). The DDTL Facility is available from the Warehouse Effective Date until the earlier of the full draw of the Maximum DDTL Amount or the third anniversary of the Warehouse Effective Date (such earlier date, the “DDTL Commitment Expiration Date”). To draw amounts under the DDTL Facility, the Warehouse Borrower must comply with a total leverage ratio of no more than 6.75:1.00 and a debt service coverage ratio of at least 2.00:1.00. Additionally, no defaults or other specified conditions may be continuing, and all conditions precedent for each extension of credit must be satisfied. The Warehouse Borrower must repay all outstanding amounts under the DDTL Facility due on the fifth anniversary of the Warehouse Effective Date. The interest rate for the DDTL Facility is either, at the sole discretion of the Warehouse Borrower, for Base Rate Loans, (a) the highest of (i) the “U.S. Prime Lending Rate” published by the Wall Street Journal, (ii) the Federal Funds Effective Rate (as agreed to in good faith by the parties to the Warehouse Credit Agreement) plus 0.50%, and (iii) one-month Term SOFR plus 1.00% per annum, plus (b) 0.75%, with step-ups from and after the third anniversary, or, for SOFR Loans, Term SOFR plus 1.75%, with step-ups from and after the third anniversary. Optional prepayments are allowed without fees or penalties, subject to notice requirements. A portion of the DDTL Facility, up to $200 million, is reserved as a letter of credit sublimit.
An incremental term loan facility (the “Incremental Term Loan”) under which the Warehouse Borrower has the right to increase the commitments under the DDTL Facility by up to $750 million after the DDTL Commitment Expiration Date. No lender is required to increase its commitment. The Warehouse Borrower must comply with all representations and warranties, and the terms of any Incremental Term Loan must be identical to those of the DDTL Facilities, including maturity, priority of liens, prepayment terms, and pricing.
In the event of default, an additional 2.00% per annum will be applied to overdue amounts. Fees include commitment fees on undrawn portions, letter of credit fees, and fronting fees. The Warehouse Facilities are secured by first-priority pledges of equity interests and security interests in substantially all owned tangible and intangible assets of the Warehouse Borrower and its guarantors, which consist of the Warehouse Borrower’s fiber network assets and associated customer contracts in certain neighborhoods in the Tampa, Florida area.
Debt Covenants and Borrowing Capacity
Credit Agreement
Our Amended and Restated Credit Agreement includes usual and customary negative covenants for loan agreements of this type, including covenants limiting us and our restricted subsidiaries’ (other than certain covenants therein which are limited to subsidiary guarantors) ability to, among other things, incur additional indebtedness, create liens on assets, make investments, loans or advances, engage in mergers, consolidations, sales of assets and acquisitions, pay dividends and distributions and make payments in respect of certain material subordinated indebtedness, in each case subject to customary exceptions for loan agreements of this type.
Our Amended and Restated Credit Agreement also contains a “financial covenant” which provides that, commencing with the period ending June 30, 2024, our financial maintenance covenant leverage ratio shall not exceed as of the last day of each fiscal quarter 5.25:1.00, with a step-down to 4.75:1.00 commencing with the period ending March 31, 2027, and continuing thereafter.
This financial covenant is only applicable for the benefit of the Revolving Lenders (as defined in the Amended and Restated Credit Agreement) thereunder and failure to comply with the financial covenant would not cause an Event of Default with respect to any loans pursuant to our term loan facility unless and until the Required Revolving Lenders (as defined in the Amended and Restated Credit Agreement) have declared all amounts outstanding under the revolving facility to be immediately due and payable and all outstanding commitments under the revolving facility to be immediately terminated.
First Lien Notes and Second Lien Notes
The indentures governing our First Lien Notes and Second Lien Notes also include usual and customary negative covenants for debt securities of this type, including covenants limiting us and our restricted subsidiaries’ (other than certain covenants therein which are limited to subsidiary guarantors) ability to, among other things, incur additional indebtedness, create liens on assets, make investments, loans or advances, engage in mergers, consolidations, sales of assets and acquisitions, pay dividends and distributions and make payments in respect of certain material subordinated indebtedness, in each case subject to customary exceptions for debt securities of this type.
The indentures governing the outstanding subsidiary debentures include covenants that limit such subsidiary’s ability to create liens and/or merge or consolidate with other companies. These covenants are subject to important exceptions and qualifications.
Fiber Term Notes
The indenture governing Frontier Issuer’s Fiber Term Notes includes covenants and restrictions customary for transactions of this type. These covenants and restrictions include the maintenance of a liquidity reserve account to be used to make required payments in respect of the Fiber Term Notes, provisions relating to prepayments, required indemnification payments in certain circumstances. The Fiber Term Notes are also subject to rapid amortization in the event of a failure to maintain a stated debt service coverage ratio. A rapid amortization may be cured if the debt service coverage ratio exceeds a certain threshold for a certain period of time, upon which cure, regular amortization, if any, will resume. The Fiber Term Notes are also subject to certain customary events of default, including events relating to non-payment of required interest, principal or other amounts due on or with respect to the Fiber Term Notes, failure to comply with covenants within certain time frames, certain bankruptcy events, breaches of specified representations and warranties, failure of security interests to be effective and certain judgments.
The Fiber Term Notes are subject to covenants and restrictions customary for transactions of this type, including (i) that the Issuer maintains specified reserve accounts to be used to make required payments in respect of the Fiber Term Notes and pay certain reserved fixed costs of the fiber networks, (ii) provisions relating to optional and mandatory prepayments of the Fiber Term Notes and the related payment of specified amounts, including specified make-whole payments in the case of prepayments of the Fiber Term Notes under certain circumstances, (iii) certain indemnification payments in the event, among other things, the assets pledged as collateral for the Fiber Term Notes are in stated ways defective or ineffective, and (iv) covenants relating to recordkeeping, access to information and similar matters. In addition, the terms of the indenture governing the Fiber Term Notes provide that a larger portion of Frontier Issuer’s available funds will be used towards the repayment of the Fiber Term Notes during a cash sweep period, which period would result from, among other things, the failure to maintain a certain debt service coverage ratio or a certain minimum penetration rate in the markets that were securitized at closing. The Fiber Term Notes are also subject to customary rapid amortization events provided for in the Indenture, including events tied to failure to maintain stated debt service coverage ratios, the acceleration of the maturity of the Fiber Term Notes following the occurrence of an event of default and the failure to repay or refinance on the applicable Anticipated Repayment Date (“ARD”).
The customary events of default to which the Fiber Term Notes are subject include events relating to non-payment of required interest, principal or other amounts due on or with respect to the Fiber Term Notes, failure to comply with covenants within certain time frames, certain bankruptcy events, breaches of specified representations and warranties, failure of security interests to be effective and certain judgments. In addition, the Indenture and the related management agreement contain various covenants that limit the ability of the Company’s securitized subsidiaries to engage in specified types of transactions, subject to certain exceptions, including, for example, to incur or guarantee additional indebtedness, sell certain assets, create or incur liens on certain assets to secure indebtedness or consolidate, merge, sell or otherwise dispose of all or substantially all of their assets.
As of December 31, 2024, we were in compliance with all of the covenants under our existing indentures and the Amended and Restated Credit Agreement.
Warehouse Facilities
The Warehouse Credit Agreement includes covenants and restrictions customary for transactions of this type. The DDTL Facility contains a financial covenant which provides that the subsidiary borrower must comply with a total leverage ratio of no more than 6:75:1.00 and a debt service coverage ratio of at least 2:00:1:00, in addition to other customary conditions.
Off-Balance Sheet Arrangements
We do not maintain any off-balance sheet arrangements, transactions, obligations or other relationships with unconsolidated entities that would be expected to have a material current or future effect upon our financial statements.
Future Contractual Obligations and Commitments
A summary of our future contractual obligations and commercial commitments as of December 31, 2024 is as follows:
|
|
|
|
|
|
|
|
|
|
|
|
|
|
|
|
|
|
|
|
|
|
|
|
|
|
|
|
|
|
|
|
|
|
|
|
|
|
|
|
|
|
|
|
|
|
|
|
|
|
|
|
|
| Payments due by period |
|
| ($ in millions) |
| Total |
| 2025 |
| 2026 |
| 2027 |
| 2028 |
| 2029 |
| Thereafter |
|
|
|
|
|
|
|
|
|
|
|
|
|
|
|
|
|
|
|
|
|
|
|
|
|
| Long-term debt obligations, excluding interest |
| $ | 11,569 |
| $ | 10 |
| $ | 10 |
| $ | 1,360 |
| $ | 3,646 |
| $ | 1,810 |
| $ | 4,733 |
|
| Interest on long-term debt |
|
| 3,748 |
|
| 785 |
|
| 786 |
|
| 779 |
|
| 597 |
|
| 436 |
|
| 365 |
|
| Lease obligations |
|
| 554 |
|
| 95 |
|
| 89 |
|
| 80 |
|
| 71 |
|
| 51 |
|
| 168 |
|
| Purchase obligations |
|
| 116 |
|
| 95 |
|
| 16 |
|
| 5 |
|
| - |
|
| - |
|
| - |
|
| Total |
| $ | 15,987 |
| $ | 985 |
| $ | 901 |
| $ | 2,224 |
| $ | 4,314 |
| $ | 2,297 |
| $ | 5,266 |
|
|
|
|
|
|
|
|
|
|
|
|
|
|
|
|
|
|
|
|
|
|
|
|
|
Our outstanding performance letters of credit increased from $181 million to $185 million during the year ended December 31, 2024.
Future Commitments
See “Regulatory Developments” immediately below for information regarding Frontier’s known and potential future commitments related to our participation in the FCC’s CAF Phase II program, NTIA BEAD program, and RDOF Phase I auction.
Regulatory Developments
Connect America Fund (“CAF”)/ Rural Digital Opportunity Fund (“RDOF”): In 2015, Frontier accepted the FCC’s CAF Phase II offer, which provided $313 million in annual support through 2021 in return for the Company’s commitment to make broadband available to households within the CAF II areas in our existing 25 states. The Company was required to complete the CAF II deployment by December 31, 2021. Thereafter, USAC and the FCC have been reviewing carriers’ CAF II program completion data, and should USAC or the FCC determine that the Company did not satisfy certain applicable CAF Phase II requirements, Frontier could be required to return a portion of the funds previously received and may be subject to certain other fines, requirements and obligations.
On January 30, 2020, the FCC adopted an order establishing the RDOF competitive reverse auction to provide support to serve high-cost areas. Frontier was awarded approximately $371 million over ten years to build gigabit-capable broadband over a fiber-to-the-premises network to approximately 127,000 locations in eight states (California, Connecticut, Florida, Illinois, New York, Pennsylvania, Texas, and West Virginia). We began receiving RDOF funding in the second quarter of 2022 and we will be required to complete the buildout to the awarded locations by December 31, 2028, with interim target milestones over this period. To the extent that Frontier is unable to fulfill the RDOF requirements, meet the milestones or construct to all locations by the required deadlines, funding to us could be discontinued and Frontier could be required to return a portion of funds previously received and may be subject to certain fines, requirements and obligations. Fines and penalties could also be assessed to the extent Frontier were ever to decide to surrender RDOF locations previously awarded.
In November 2021, Congress passed the IIJA which provides $65 billion to fund broadband connectivity programs, including broadband deployment to unserved and underserved locations. The National Telecommunications and Information Administration (NTIA) is administering the principal last mile infrastructure funding program in the amount of $42.5 billion, the Broadband Equity, Access & Deployment Program (BEAD), and will distribute funding through direct grants to states, who will then award the funds based on competitive grant programs. The NTIA has allocated approximately $25.5 billion to states in Frontier’s footprint. We are closely tracking implementation of the BEAD program, including state determinations regarding subsidy award criteria. We are actively pursuing awards of these stimulus funds, however, we continue to evaluate our opportunities as the process is complex and any awards that we ultimately receive under the IIJA may require significant up-front capital expenditures or other costs.
On January 27, 2025, the federal Office of Management and Budget (“OMB”) issued a memorandum to the heads of all executive departments and agencies directing them to pause the disbursement of certain federal financial assistance. On January 28, 2025, the United States District Court for the District of Columbia issued a temporary stay of the OMB directive and which the OMB subsequently rescinded. It is uncertain if the OMB will seek to further pause or otherwise limit future federal disbursements, or if any such changes would impact the funding Frontier receives under federal programs, including USF, RDOF and other federal broadband grants including BEAD. We are closely tracking developments in this area. Significant decreases in available funding, or the imposition of significant requirements on the receipt of such funding, could have a material adverse effect on our business and results of operations.
Privacy: Our businesses are subject to federal and state laws and regulations that impose various restrictions and obligations related to privacy and the handling of customers’ personal information. Privacy-related legislation has been adopted in a number of states in which we operate. Certain state requirements give consumers increased rights including the right to know what personal information is being collected about them and obtain a copy of such information, opt-out of the sale of personal information or sharing of personal information for purposes of certain targeted advertising, and to request the correction or deletion of this information. Complying with such laws, as well as other legislative and regulatory action related to privacy, could result in increased costs of compliance, claims
against the Company or investigations related to compliance, and increased uncertainty in the use and availability of certain consumer data.
Video Programming: Federal, state, and local governments extensively regulate the video services industry. Our linear video services are subject to, among other things: subscriber privacy regulations; requirements that we carry a local broadcast station or obtain consent to carry a local or distant broadcast station; rules for franchise renewals and transfers; the manner in which program packages are marketed to subscribers; and program access requirements.
We provide video programming in some of our markets including California, Connecticut, Florida, Indiana, and Texas pursuant to franchises, permits and similar authorizations issued by state and local franchising authorities. Most franchises require payment of a franchise fee as a requirement to the granting of authority.
Many franchises establish facilities and service requirements, as well as specific customer service standards and monetary penalties for non-compliance. We believe that we are meeting all material standards and requirements. Franchises are generally granted for fixed terms and must be periodically renewed.
Environmental Regulation: The local exchange carrier subsidiaries we operate are subject to federal, state, and local laws, and regulations governing the use, storage, disposal of, and exposure to hazardous materials, the release of pollutants into the environment and the remediation of contamination. As an owner and former owner of property, we are subject to environmental laws that could impose liability for the entire cost of cleanup at contaminated sites, including sites formerly owned by us or our predecessors, regardless of fault or the lawfulness of the activity that resulted in contamination. We believe that our operations are in substantial compliance with applicable environmental laws and regulations.
Critical Accounting Policies and Estimates
The preparation of our financial statements requires management to make estimates and assumptions. There are inherent uncertainties with respect to such estimates and assumptions; accordingly, it is possible that actual results could differ from those estimates and changes to estimates could occur in the near term. These critical accounting estimates have been reviewed with the Audit Committee of our Board of Directors. For a discussion of these and other accounting policies, see Note 1 of the Notes to Consolidated Financial Statements.
Allowance for Doubtful Accounts
We maintain an allowance for doubtful accounts based on our estimate of our ability to collect accounts receivable. Our estimates are based on assumptions and other considerations, including payment history, customer financial performance, carrier billing disputes and aging analysis. Our estimation process includes general and specific reserves and varies by customer category. In 2024 and 2023, we had no “critical estimates” related to bankruptcies of communications companies or any other significant customers. See Notes 1 and 6 of the Notes to Consolidated Financial Statements for additional information.
Depreciation
The calculation of depreciation expense is based upon the estimated useful lives of the underlying property, plant and equipment. Depreciation expense is principally based on the composite group method for substantially all of our property, plant, and equipment assets. The estimates for remaining lives of the various asset categories are determined annually, based on an independent study. Among other considerations, these studies include models that consider actual usage, replacement history and assumptions about technology evolution for each category of asset. The latest study was completed in the fourth quarter of 2024 and did not result in any significant changes in remaining lives for any of our asset categories. A one-year decrease in the estimated useful lives of our property, plant, and equipment would result in an increase of approximately $156 million to depreciation expense.
See Note 6 of the Notes to Consolidated Financial Statements for additional information.
Asset Impairments
We review long-lived assets to be held and used, including customer lists, finite-lived intangible assets, and long-lived assets to be disposed of for impairment whenever events or changes in circumstances indicate that the carrying amount of such assets may not be recoverable. When triggering events are identified, recoverability of assets to be held and used is measured by comparing the carrying amount of the asset to the future undiscounted net cash flows expected to be generated by the asset. Recoverability of assets held for sale is measured by comparing the carrying amount of the assets to their estimated fair market value. If any assets are considered to be impaired, the impairment is measured by the amount by which the carrying amount of the assets exceeds the estimated fair value. Also, we periodically reassess the useful lives of our tangible and intangible assets to determine whether any changes are required.
We considered whether the carrying values of finite-lived intangible assets, and property plant and equipment may not be recoverable or whether the carrying value of certain finite-lived intangible assets were impaired, noting no impairment was present as of or for the year ended December 31, 2024.
Pension and Other Postretirement Benefits
We sponsor a defined benefit pension plan covering a significant number of our current and former employees as well as other postretirement benefit plans that provide medical, dental, life insurance and other benefits for covered retired employees and their beneficiaries and covered dependents. As of December 31, 2024, the unfunded benefit obligation for these plans recorded on our consolidated balance sheet was $630 million. During 2024, we contributed $171 million to these plans in cash and recorded $54
million of operating expense before capitalization, and $13 million of net non-operating income. Pension and other postretirement benefit costs and obligations are dependent upon various actuarial assumptions, the most significant of which are the discount rate and the expected long-term rate of return on plan assets.
Our discount rate assumption is determined annually with assistance from our actuaries based on the pattern of expected future benefit payments and the prevailing rates available on long-term, high quality corporate bonds with durations approximate to that of our benefit obligation. As of December 31, 2024, and 2023, we utilized an estimation technique that is based upon a settlement model (Bond:Link) that permits us to closely match cash flows to the expected payments to participants. This rate can change from year-to-year based on market conditions that affect corporate bond yields.
We are utilizing a discount rate of 5.60% as of December 31, 2024, for our qualified pension plan, compared to rates of 5.20% and 5.50% in 2023 and 2022, respectively. The discount rate for postretirement plans as of December 31, 2024, was 5.70% compared to 5.20% in 2023 and 5.50% in 2022.
In the following table, we show the estimated sensitivity of our pension and other postretirement benefit plan liabilities to a 25 basis point change in the discount rate as of December 31, 2024:
|
|
|
|
|
|
|
|
|
| ($ in millions) |
| Increase in Discount Rate of 25 bps |
| Decrease in Discount Rate of 25 bps |
|
| |
|
|
|
|
|
|
|
| Pension plans |
|
|
|
|
|
|
|
| Projected benefit obligation |
| $ | (47) |
| $ | 49 |
|
|
|
|
|
|
|
|
|
|
| Other postretirement plans |
|
|
|
|
|
|
|
| Accumulated postretirement benefit obligation |
| $ | (11) |
| $ | 12 |
|
|
|
|
|
|
|
|
|
|
In developing the expected long-term rate of return assumption, we considered published surveys of expected market returns, 10 and 20 year actual returns of various major indices, and our own historical 5-year, 10-year and 20-year investment returns. The expected long-term rate of return on plan assets is based on an asset allocation assumption of 65% in long-duration fixed income securities, and 35% in equity securities and other investments. We review our asset allocation at least annually and make changes when considered appropriate. Our asset return assumption is made at the beginning of our fiscal year. In 2023 and 2022, our expected long-term rate of return on plan assets was 7.50%. For the period January 1, 2024 – September 30, 2024, our expected long-term rate of return on plan assets was 7.50%. For the period October 1, 2024 to December 31, 2024, our expected long-term rate of return on plan assets was 6.65%. Our actual return on plan assets for the year ended December 31, 2024, was a gain of 5%, for the year ended December 31, 2023, was a gain of 15% and for the year ended December 31, 2022, was a loss of 20%. For 2025, we expect to assume a rate of return of 6.65%. Our pension plan assets are valued at fair value as of the measurement date.
For additional information regarding our pension and other postretirement benefits (see Note 18 to the Notes to Consolidated Financial Statements).
Income Taxes
We file a consolidated federal income tax return. We utilize the asset and liability method of accounting for income taxes. Under the asset and liability method, deferred income taxes are recorded for the tax effect of temporary differences between the financial statement basis and the tax basis of assets and liabilities using tax rates expected to be in effect when the temporary differences are expected to reverse. Actual income taxes could vary from these estimates due to future changes in governing law or review by taxing authorities.
We recognize deferred tax assets to the extent that we believe that these assets are more likely than not to be realized. In making such a determination, we consider all available positive and negative evidence, including future reversals of existing taxable temporary differences, tax-planning strategies, and results of recent operations. If we determine that we are not able to realize a portion of our net deferred tax assets in the future, we would make an adjustment to the deferred tax asset valuation allowance, which would increase the provision for income taxes.
The tax effect of a change in tax law or rates included in income tax expense from continuing operations includes effect of changes in deferred tax assets and liabilities initially recognized through a charge or credit to other comprehensive income. The residual tax effects typically are released when the item giving rise to the tax effect is disposed of, liquidated, or terminated.
Recent Accounting Pronouncements
For additional information regarding FASB Accounting Standards Updates (‘‘ASU’’s) that have been issued but not yet adopted and that may impact the Company, refer to Note 3 – ‘‘Recent Accounting Pronouncements’’ to the audited consolidated financial statements in Part II, Item 8 of this annual Report on form 10-K.
Item 7A. Quantitative and Qualitative Disclosures about Market Risk
We are exposed to market risk in the normal course of our business operations due to ongoing investing and funding activities, including those associated with our pension plan assets. Market risk refers to the potential change in fair value of a financial instrument as a result of fluctuations in interest rates and equity prices. We do not hold or issue derivative instruments, derivative commodity instruments or other financial instruments for trading purposes. As a result, we do not undertake any specific actions to cover our exposure to market risks, and we are not party to any market risk management agreements other than in the normal course of business. Our primary market risk exposures from interest rate risk and equity price risk are as follows:
Interest Rate Exposure
Our exposure to market risk for changes in interest rates relates primarily to the interest-bearing portion of our pension investment portfolio and the related actuarial liability for pension obligations, as well as our floating rate indebtedness. As of December 31, 2024, 91% of our total debt had fixed interest rates. We had no interest rate swap agreements in effect at December 31, 2024. We believe that our currently outstanding obligation exposure to interest rate changes is minimal.
Our objectives in managing our interest rate risk are to limit the impact of interest rate changes on earnings and cash flows and to lower our overall borrowing costs. To achieve these objectives, only our $1.0 billion term loan facility has a floating rate at December 31, 2024. The annual impact of 100 basis points increase in the SOFR would result in approximately $10 million of additional interest expense, provided that the SOFR rate exceeds the SOFR floor. An adverse change in interest rates would increase the amount that we pay on our variable rate obligations and could result in fluctuations in the fair value of our fixed rate obligations. Based upon our overall interest rate exposure, a near-term change in interest rates would not materially affect our consolidated financial position, results of operations or cash flows.
Our discount rate assumption for our pension benefit obligation is determined at least annually, or whenever required, with assistance from our actuaries. The discount rate is based on the pattern of expected future benefit payments and the prevailing rates available on long-term, high quality corporate bonds with durations approximate to that of our benefit obligation. As of December 31, 2024, and 2023, the discount rate utilized in calculating our benefit plan obligation was 5.60% and 5.20%, respectively.
The discount rate assumption for our OPEB obligation is determined in a similar manner to the pension plan. As of December 31, 2024, and 2023, our discount rate utilized in calculating our benefit plan obligation was 5.70% and 5.20%, respectively.
At December 31, 2024, the fair value of our debt was estimated to be approximately $11.7 billion, based on quoted market prices, our overall weighted average borrowing rate was 6.996% and our overall weighted average maturity was approximately 4.5 years, which decreased from approximately 5.5 years as of December 31, 2023.
Equity Price Exposure
Our exposure to market risks for changes in equity security prices as of December 31, 2024 is primarily limited to our pension plan assets. We have no other security investments of any significant amount.
The value of our pension plan assets increased $60 million from $2,268 million at December 31, 2023 to $2,328 million at December 31, 2024. This increase was primarily a result of changes in the market value of investments of $114 million, net of plan expenses, and contributions of $133 million, offset by benefit payments of $187 million.
Item 8. Financial Statements and Supplementary Data
The following documents are filed as part of this Report:
1) Financial Statements – See Index on page F-1.
Item 9.Changes in and Disagreements with Accountants on Accounting and Financial Disclosure
None.
Item 9A.Controls and Procedures
(i)Evaluation of Disclosure Controls and Procedures
We carried out an evaluation, under the supervision and with the participation of our management, including our principal executive officer and principal financial officer, regarding the effectiveness of our disclosure controls and procedures (as defined in Rules 13a-15(e) and 15d-15(e) under the Securities Exchange Act of 1934, as amended). Based upon this evaluation, our principal executive officer and principal financial officer concluded, as of the end of the period covered by this report, December 31, 2024, that our disclosure controls and procedures were effective.
(ii)Internal Control Over Financial Reporting
a.Management’s annual report on internal control over financial reporting
Our management report on internal control over financial reporting appears on page F-2.
b.Report of registered public accounting firm
The report of KPMG LLP, our independent registered public accounting firm, on internal control over financial reporting appears on page F-4.
c.Changes in internal control over financial reporting
There have been no changes to our internal control over financial reporting (as defined in Rule 13a-15(f) and 15d-15(f) under the Securities Exchange Act of 1934, as amended) identified in an evaluation thereof that occurred during the fiscal year of 2023 that materially affected, or are reasonably likely to materially affect, our internal control over financial reporting.
Item 9B.Other Information
None.
Item 9C.Disclosure Regarding Foreign Jurisdictions that Prevent Inspections
None.
PART III
Item 10. Directors, Executive Officers and Corporate Governance
Information regarding executive officers required by Item 401 of Regulation S-K is furnished in a separate disclosure at the end of Part I of this report entitled “Information about our Executive Officers.”
In accordance with General Instruction G(3) to Form 10-K, certain of the information required by this Item is incorporated by reference from the proxy statement for our 2025 Annual Meeting of shareholders to be filed with the SEC within 120 days after December 31, 2024.
Item 11. Executive Compensation
In accordance with General Instruction G(3) to Form 10-K, the information required by this Item is incorporated by reference from the proxy statement for our 2025 Annual Meeting of shareholders to be filed with the SEC within 120 days after December 31, 2024.
Item 12. Security Ownership of Certain Beneficial Owners and Management and Related Stockholder Matters
In accordance with General Instruction G(3) to Form 10-K, the information required by this Item is incorporated by reference from the proxy statement for our 2025 Annual Meeting of shareholders to be filed with the SEC within 120 days after December 31, 2024.
Item 13. Certain Relationships and Related Transactions, and Director Independence
In accordance with General Instruction G(3) to Form 10-K, the information required by this Item is incorporated by reference from the proxy statement for our 2025 Annual Meeting of shareholders to be filed with the SEC within 120 days after December 31, 2024.
Item 14. Principal Accountant Fees and Services
In accordance with General Instruction G(3) to Form 10-K, the information required by this Item is incorporated by reference from the proxy statement for our 2025 Annual Meeting of shareholders to be filed with the SEC within 120 days after December 31, 2024.
PART IV
Item 15. Exhibits and Financial Statement Schedules
List of Documents Filed as a Part of This Report:
(1)Index to Consolidated Financial Statements:
Management’s Report on Internal Control Over Financial Reporting
Reports of Independent Registered Public Accounting Firm (KPMG LLP, Dallas, TX, Auditor Firm ID: 185)
Consolidated Balance Sheets as of December 31, 2024 and 2023
Consolidated Statements of Operations for the years ended December 31, 2024, 2023, and 2022
Consolidated Statements of Comprehensive (Loss) Income for the years ended December 31, 2024, 2023, and 2022
Consolidated Statements of Equity for the years ended December 31, 2024, 2023, and 2022
Consolidated Statements of Cash Flows for the years ended December 31, 2024, 2023, and 2022
Notes to Consolidated Financial Statements
All other schedules have been omitted because the required information is included in the consolidated financial statements or the notes thereto or is not applicable or not required.
(2)Index to Exhibits:
|
|
Exhibit No. | Description |
2.1 | Agreement and Plan of Merger, dated as of September 4, 2024, by and among Verizon Communications Inc., France Merger Sub Inc. and Frontier Communications Parent, Inc. (filed as Exhibit 2.1 to Frontier’s Current Report on Form 8-K filed on September 5, 2024.) |
2.2 | Order Confirming the Fifth Amended Joint Plan of Reorganization of Frontier Communications Corporation and its Debtor Affiliates Pursuant to Chapter 11 of the Bankruptcy Code (filed as Exhibit 2.1 to Frontier’s Current Report on Form 8-K filed on August 27, 2020.) |
3.1 | Amended and Restated Certificate of Incorporation of Frontier Communications Parent, Inc. (filed as Exhibit 3.1 to Frontier’s Current Report on Form 8-K filed on April 30, 2021.) |
3.2 | Amended and Restated Bylaws of Frontier Communications Parent, Inc. (filed as Exhibit 3.1 to Frontier’s Current Report on Form 8-K filed on November 14, 2022.) |
4.1 | Indenture, dated as of October 8, 2020, by and among Frontier Communications Corporation, the guarantors party thereto, the collateral grantor party thereto, and Wilmington Trust, National Association, a national banking association, as trustee and as collateral agent, with respect to the 5.875% First Lien Secured Notes due 2027 (filed as Exhibit 4.1 to Frontier’s Current Report on Form 8-K filed on October 14, 2020.) |
4.2 | Form of 5.875% First Lien Secured Note due 2027 (included in Exhibit 4.1 hereto.) |
4.3 | Indenture, dated as of November 25, 2020, by and among Frontier Communications Corporation, the guarantors party thereto, the collateral grantor party thereto, JPMorgan Chase Bank N.A., as collateral agent and Wilmington Trust, National Association, a national banking association, as trustee, with respect to the 5.000% First Lien Secured Notes due 2028 (filed as Exhibit 4.1 to Frontier’s Current Report on Form 8-K filed on December 2, 2020.) |
4.4 | Form of 5.000% First Lien Secured Notes due 2028 (included in Exhibit 4.3 hereto.) |
4.5 | Indenture, dated as of November 25, 2020, by and among Frontier Communications Corporation, the guarantors party thereto, the collateral grantor party thereto and Wilmington Trust, National Association, a national banking association, as trustee and as collateral agent, with respect to the 6.750% Second Lien Secured Notes due 2029 (filed as Exhibit 4.2 to Frontier’s Current Report on Form 8-K filed on December 2, 2020.) |
4.6 | Form of 6.750% Second Lien Secured Notes due 2029 (included in Exhibit 4.5 hereto.) |
4.7 | Indenture, dated as of April 30, 2021, by and among Frontier Communications Holdings, LLC, the guarantors party thereto, the collateral grantor party thereto and Wilmington Trust, National Association, as trustee and collateral agent (filed as Exhibit 4.1 to Frontier’s Current Report on Form 8-K filed on April 30,2021.) |
4.8 | Form of 5.875% Second Lien Secured Notes due 2029 (included in Exhibit 4.7 hereto.) |
4.9 | Supplemental Indenture, dated as of April 30, 2021, by and among Frontier Communications Holdings, LLC and Wilmington Trust, National Association, as trustee, with respect to the First Lien Notes due October 2027(filed as Exhibit 4.3 to Frontier’s Current Report on Form 8-K filed on April 30, 2021.) |
4.10 | Supplemental Indenture, dated as of April 30, 2021, by and among Frontier Communications Holdings, LLC and Wilmington Trust, National Association, as trustee, with respect to the First Lien Notes due May 2028 (filed as Exhibit 4.4 to Frontier’s Current Report on Form 8-K filed on April 30,2021.) |
4.11 | Supplemental Indenture, dated as of April 30, 2021, by and among Frontier Communications Holdings, LLC and Wilmington Trust, National Association, as trustee, with respect to the Second Lien Notes (filed as Exhibit 4.5 to Frontier’s Current Report on Form 8-K filed on April 30,2021.) |
4.12 | Indenture, dated as of October 13, 2021, by and among Frontier Communications Holdings, LLC, the guarantors party thereto, the collateral grantor party thereto and Wilmington Trust, National Association, a national banking association, as trustee and as collateral agent (filed as Exhibit 4.1 to Frontier’s Current Report on Form 8-K filed on October 14, 2021.) |
4.13 | Form of 6.000% Second Lien Secured Notes due 2030 (included in Exhibit 4.12 hereto.) |
4.14 | Indenture, dated as of May 12, 2022, by and among Frontier Communications Holdings, LLC, the guarantors party thereto, the collateral grantor party thereto, Wilmington Trust, National Association, as trustee and JPMorgan Chase Bank, N.A., as collateral agent (filed as Exhibit 4.1 to Frontier’s Current Report on Form 8-K filed on May 16, 2022.) |
4.15 | Form of 8.750% First Lien Secured Notes due 2030 (included in Exhibit 4.14 hereto.) |
4.16 | Indenture, dated as of March 8, 2023, by and among Frontier Communications Holdings, LLC, the guarantors party thereto, the collateral grantor party thereto, Wilmington Trust, National Association, as trustee and JPMorgan Chase Bank, N.A., as collateral agent (filed as Exhibit 4.1 to Frontier’s Current Report on Form 8-K filed on March 8, 2023.) |
4.17 | Form of 8.625% First Lien Secured Notes due 2031 (included in Exhibit 4.16 hereto.) |
4.18 | Base Indenture, dated as of August 8, 2023, by and among Frontier Issuer LLC, Frontier Dallas TX Fiber 1 LLC, and Citibank N.A. (filed as Exhibit 4.1 to Frontier’s Current Report on Form 8-K filed on August 10, 2023.) |
4.19 | Series 2023-1 Supplement, dated as of August 8, 2023, by and among Frontier Issuer LLC, Frontier Dallas TX Fiber 1 LLC, and Citibank N.A. (filed as Exhibit 4.2 to Frontier’s Current Report on Form 8-K filed on August 10, 2023.) |
4.20 | Series 2023-2 Supplement, dated as of August 24, 2023, by and among Frontier Issuer LLC, Frontier Dallas TX Fiber 1 LLC, and Citibank N.A. (filed as Exhibit 4.1 to Frontier’s Current Report on Form 8-K filed on August 25, 2023.) |
4.21 | Supplement No. 1 to Base Indenture, dated as of July 1, 2024, by and among Frontier Issuer LLC, Frontier Dallas TX Fiber 1 LLC, and Citibank N.A. (filed as Exhibit 4.1 to Frontier’s Current Report on Form 8-K filed on July 1, 2024.) |
4.22 | Series 2024-1 Supplement, dated as of July 1, 2024, by and among Frontier Issuer LLC, Frontier Dallas TX Fiber 1 LLC, and Citibank N.A. (filed as Exhibit 4.2 to Frontier’s Current Report on Form 8-K filed on July 1, 2024.) |
4.23 | Indenture, dated as of January 1, 1994, between Frontier North Inc. (formerly GTE North Incorporated) and Bank of New York Mellon (as successor to The First National Bank of Chicago), as Trustee (the “Frontier North Indenture”) (filed as Exhibit 4.1 to Frontier’s Quarterly Report on Form 10-Q for the fiscal quarter ended June 30, 2010). |
4.24 | First Supplemental Indenture to the Frontier North Indenture, dated as of May 1, 1996, between Frontier North Inc. (formerly GTE North Incorporated) and Bank of New York Mellon (as successor to The First National Bank of Chicago), as Trustee (filed as Exhibit 4.2 to Frontier’s Quarterly Report on Form 10-Q for the fiscal quarter ended June 30, 2010.) |
4.25 | Form of Debenture under the Frontier North Indenture (filed as Exhibit 4.24 to Frontier’s Annual Report on Form 10-K for the year ended December 31, 2011.) |
4.26 | Indenture, dated as of December 1, 1993, between GTE California Incorporated and Bank of America National Trust and Savings Association, as trustee (the “California Indenture”) (filed as Exhibit 4.2 to the June 30, 2016 10-Q.) |
4.27 | First Supplemental Indenture to the California Indenture dated as of April 15, 1996, between GTE California Incorporated and First Trust of California, National Association, as trustee (filed as Exhibit 4.3 to the June 30, 2016 10-Q.) |
4.28 | Indenture, dated as of November 1, 1993, between GTE Florida Incorporated and Nations Bank of Georgia, National Association, as trustee (the “Florida Indenture”) (filed as Exhibit 4.4 to the June 30, 2016 10-Q.) |
4.29 | First Supplemental Indenture to the Florida Indenture dated as of January 1, 1998, between GTE Florida Incorporated and the Bank of New York, as trustee (filed as Exhibit 4.5 to the June 30, 2016 10-Q.) |
4.30 | Description of Frontier’s Securities Registered Pursuant to Section 12 of the Securities Exchange Act of 1934 (filed as Exhibit 4.25 to Frontier’s Annual Report on Form 10-K for the year ended December 31, 2021.) |
10.1 | Amended and Restated Credit Agreement dated as of April 30, 2021, by and among Frontier Communications Holdings, LLC, as borrower, JPMorgan Chase Bank, N.A., as administrative agent and collateral agent, Goldman Sachs Bank USA, as revolver agent, and the lenders from time to time party thereto. (filed as Exhibit 10.1 to Frontier’s Current Report on Form 8-K filed on April 30,2021.) |
10.2 | Amendment No. 1 to Amended and Restated Credit Agreement, dated as of October 13, 2021, by and among Frontier Communications Holdings, LLC, as borrower, JPMorgan Chase Bank, N.A., as administrative agent, Goldman Sachs Bank USA, as revolver agent, and the lenders party thereto (filed as Exhibit 10.1 to Frontier’s Current Report on Form 8-K filed on October 14, 2021.) |
10.3 | Amendment No. 2 to Amended and Restated Credit Agreement, dated as of May 12, 2022, by and among Frontier Communications Holdings, LLC, as borrower, JPMorgan Chase Bank, N.A., as administrative agent, Goldman Sachs Bank USA, as revolver agent, and the lenders party thereto (filed as Exhibit 10.1 to Frontier’s Current Report on Form 8-K filed on May 16, 2022.) |
10.4 | Amendment No. 3 to Amended and Restated Credit Agreement, dated as of May 12, 2022, by and among Frontier Communications Holdings, LLC, as borrower, JPMorgan Chase Bank, N.A., as administrative agent, Goldman Sachs Bank USA, as revolver agent, and the lenders party thereto (filed as Exhibit 10.1 to Frontier’s Current Report on Form 8-K filed on March 8, 2023.) |
10.5 | Amendment No. 4 to Amended and Restated Credit Agreement, dated as of June 21, 2023, executed and delivered by JPMorgan Chase Bank, N.A. as administrative agent and collateral agent (filed as Exhibit 10.3 to Frontier’s Quarterly Report on Form 10-Q filed on August 2, 2024.) |
10.6 | Amendment No. 5 to Amended and Restated Credit Agreement, dated as of May 22, 2024, by and among Frontier Communications Holdings, LLC, as borrower, JPMorgan Chase Bank, N.A., as administrative agent, Goldman Sachs Bank USA, as revolver agent, and the lenders party thereto (filed as Exhibit 10.1 to Frontier’s Current Report on Form 8-K filed on May 23, 2024.) |
10.7 | Amendment No. 6 to Amended and Restated Credit Agreement, dated as of July 1, 2024, by and among Frontier Communications Holdings, LLC, as borrower, JPMorgan Chase Bank, N.A., as administrative agent, Goldman Sachs Bank USA, as revolver agent, and the lenders party thereto (filed as Exhibit 10.1 to Frontier’s Current Report on Form 8-K filed on July 1, 2024.) |
10.8 | Amendment No. 7 to Amended and Restated Credit Agreement, dated as of July 30, 2024, by and among Frontier Communications Holdings, LLC, as borrower, JPMorgan Chase Bank, N.A., as administrative agent, Goldman Sachs Bank USA, as revolver agent, and the lenders party thereto.* |
10.9 | Amendment No. 8 to Amended and Restated Credit Agreement, dated as of January 14, 2025, by and among Frontier Communications Holdings, LLC, as borrower, JPMorgan Chase Bank, N.A., as administrative agent, Goldman Sachs Bank USA, as revolver agent, and the lenders party thereto (filed as Exhibit 10.1 to Frontier’s Current Report on Form 8-K filed on January 14, 2025.) |
10.10 | Class A-1 Note Purchase Agreement, dated as of August 24, 2023, among Frontier Issuer LLC, Frontier Dallas TX Fiber 1 LLC, Frontier Communications Holdings, LLC, certain conduit investors, financial institutions and funding agents, and Barclays Bank plc. (filed as Exhibit 10.1 to Frontier’s Current Report on Form 8-K filed on August 25, 2023.) |
10.11 | Amendment No. 1 to Class A-1 Note Purchase Agreement, dated as of July 1, 2024, among Frontier Issuer LLC, Frontier Dallas TX Fiber 1 LLC, Frontier Communications Holdings, LLC, certain conduit investors, financial institutions and funding agents, and Barclays Bank plc. (filed as Exhibit 10.4 to Frontier’s Quarterly Report on Form 10-Q filed on August 2, 2024.) |
10.12 | Loan and Security Agreement, dated as of December 31, 2024, by and among Frontier Tampa Bay FL Fiber 1 LLC, as borrower, Frontier SPE FL Guarantor LLC, as guarantor, the lenders party thereto, the additional guarantors from time to time party thereto, Barclays Bank PLC, as administrative agent, and Citibank, N.A., as collateral agent (filed as Exhibit 10.1 to Frontier’s Current Report on Form 8-K filed on January 2 2025.) |
10.13 | Agreement, dated April 2, 2023, between the Company and Ares Management LLC, ACOF Investment Management LLC, ASOF Investment Management LLC and ASSF Operating Manager IV,L.P., on behalf of themselves and certain of their affiliates specified in the Agreement (filed as Exhibit 10.6 to Frontier’s Annual Report on Form 10-K for the year ended December 31, 2023). |
10.14 | Form of Director and Officer Indemnification Agreement (filed as Exhibit 10.3 to Frontier’s Current Report on Form 8-K filed on April 30,2021.) |
10.15 | Frontier Communications Parent, Inc. 2024 Management Incentive Plan (filed as Exhibit 99.1 to Frontier’s Current Report on Form 8-K filed on May 20, 2024.) |
10.16 | Form of Frontier Communications Parent, Inc. 2021 Management Incentive Plan (filed as Exhibit 10.4 to Frontier’s Current Report on Form 8-K filed on April 30,2021.) |
10.17 | Employment Agreement, dated December 7, 2021, between the Company and Nick Jeffery (filed as Exhibit 10.5 to Frontier’s Annual Report on Form 10-K for the year ended December 31, 2020.) |
10.18 | Employment Agreement between the Company and Scott C. Beasley, dated as of May 25, 2021 (filed as Exhibit 10.1 to Frontier’s Current Report on Form 8-K filed on June 2, 2021.) |
10.19 | Employment Agreement between the Company and Alan Gardner, dated as of May 31, 2021 (filed as Exhibit 10.6 to Frontier’s Quarterly Report on Form 10-Q for the quarter ended June 30, 2021.) |
10.20 | Employment Agreement between the Company and John Harrobin, dated as of May 8, 2021 (filed as Exhibit 10.7 to Frontier’s Quarterly Report on Form 10-Q for the quarter ended June 30, 2021.) |
10.21 | Employment Agreement between the Company and Veronica Bloodworth, dated as of March 29, 2021 (filed as Exhibit 10.8 to Frontier’s Quarterly Report on Form 10-Q for the quarter ended June 30, 2021.) |
10.22 | Form of Executive Chairman Agreement between the Company and John Stratton (included as Exhibit 99.1 to Frontier’s Current Report on Form 8-K filed on February 18, 2021.) |
10.23 | Offer of Employment Letter, dated January 15, 2014, between Frontier and Mark D. Nielsen (filed as Exhibit 10.2 to the June 30, 2014 10-Q.) |
10.24 | Form of Restricted Stock Unit Award Agreement (filed as Exhibit 10.19 to Frontier’s Annual Report on Form 10-K for the year ended December 31, 2021.) |
10.25 | Form of Performance Stock Unit Award Agreement (filed as Exhibit 10.20 to Frontier’s Annual Report on Form 10-K for the year ended December 31, 2021.) |
10.26 | Form of Restricted Stock Unit Award Agreement for Executive Chairman (filed as Exhibit 10.21 to Frontier’s Annual Report on Form 10-K for the year ended December 31, 2021.) |
10.27 | Form of Performance Stock Unit Award for Executive Chairman (filed as Exhibit 10.22 to Frontier’s Annual Report on Form 10-K for the year ended December 31, 2021.) |
10.29 | Tax Sharing Agreement, dated as of May 13, 2009, by and among Verizon Communications Inc. (“Verizon”), New Communications Holdings Inc. (“Spinco”) and Frontier, (filed as Exhibit 10.3 to Frontier’s Current Report on Form 8-K filed on May 15, 2009.) |
19 | Insider Trading Policy.* |
21 | Subsidiaries of the Registrant.* |
23 | Consent of Independent Registered Public Accounting Firm.* |
31.1 | Certification of Principal Executive Officer pursuant to Rule 13a-14(a) under the Securities Exchange Act of 1934 (the “1934 Act”).* |
31.2 | Certification of Principal Financial Officer pursuant to Rule 13a-14(a) under the 1934 Act.* |
32 | Certifications of Chief Executive Officer and Chief Financial Officer pursuant to 18 U.S.C. Section 1350, as adopted pursuant to Section 906 of the Sarbanes-Oxley Act of 2002.* |
97 | Form of Clawback Policy (filed as Exhibit 97 to Frontier’s Annual Report on Form 10-K for the year ended December 31, 2023).* |
101 | The following materials from Frontier’s Annual Report on Form 10-K for the fiscal year ended December 31, 2024, formatted in iXBRL (inline eXtensible Business Reporting Language): (i) the Consolidated Balance Sheets; (ii) the Consolidated Statements of Operations; (iii) the Consolidated Statements of Comprehensive Income; (iv) the Consolidated Statements of Equity; (v) the Consolidated Statements of Cash Flows; and (vi) Notes to Consolidated Financial Statements. |
104 | Cover Page from Frontier’s Annual Report on Form 10-K for the fiscal year ended December 31, 2024, formatted in iXBRL and contained in Exhibit 101. |
|
|
|
|
Exhibits 10.14 through 10.27 are management contracts or compensatory plans or arrangements. |
|
|
* Filed herewith.
Item 16. Form 10-K Summary
None.
|
|
SIGNATURES
Pursuant to the requirements of Section 13 or 15(d) of the Securities Exchange Act of 1934, the Registrant has duly caused this report to be signed on its behalf by the undersigned, thereunto duly authorized.
|
|
| FRONTIER COMMUNICATIONS PARENT, INC. |
| (Registrant) |
|
|
|
|
| By: /s/ Nick Jeffery |
| Nick Jeffery |
| President and Chief Executive Officer |
|
|
February 20, 2025 |
|
Pursuant to the requirements of the Securities Exchange Act of 1934, this report has been signed below by the following persons on behalf of the registrant and in the capacities indicated on the 20th day of February 2025.
|
|
|
Signature |
| Title |
|
|
|
|
|
|
/s/ Scott Beasley |
| Executive Vice President, Chief Financial Officer |
(Scott Beasley) |
| (Principal Financial Officer) |
|
|
|
/s/ Kevin L. Beebe |
| Director |
(Kevin L. Beebe) |
|
|
|
|
|
/s/ Lisa Chang |
| Director |
(Lisa Chang) |
|
|
|
|
|
/s/ Pamela Coe |
| Director |
(Pamela Coe) |
|
|
|
|
|
/s/ Nick Jeffery |
| President & Chief Executive Officer |
(Nick Jeffery) |
| (Principal Executive Officer) |
|
|
|
/s/ William McGloin |
| Chief Accounting Officer & Controller |
(William McGloin) |
| (Principal Accounting Officer) |
|
|
|
/s/ Stephen Pusey |
| Director |
(Stephen Pusey) |
|
|
|
|
|
/s/ Margaret Smyth |
| Director |
(Margaret Smyth) |
|
|
|
|
|
/s/ John Stratton |
| Director |
(John Stratton) |
|
|
|
|
|
/s/ Maryann Turcke |
| Director |
(Maryann Turcke) |
|
|
|
|
|
/s/ Prat Vemana |
| Director |
(Prat Vemana) |
|
|
|
|
|
/s/ Woody Young |
| Director |
(Woody Young) |
|
|
|
|
|
|
|
|
FRONTIER COMMUNICATIONS PARENT, INC., AND SUBSIDIARIES
Index to Consolidated Financial Statements
|
|
Item | Page |
|
|
Management’s Report on Internal Control Over Financial Reporting | F-2 |
|
|
Reports of Independent Registered Public Accounting Firm (KPMG LLP, Dallas, TX, Auditor Firm ID: 185) | F-3 |
|
|
Consolidated Balance Sheets as of December 31, 2024 and 2023 | F-6 |
|
|
Consolidated Statements of Operations for the years ended December 31, 2024, 2023, and | F-7 |
|
|
Consolidated Statements of Comprehensive (Loss) Income for the years ended December 31, 2024, 2023, and 2022 | F-7 |
|
|
Consolidated Statements of Equity | F-8 |
|
|
Consolidated Statements of Cash Flows | F-9 |
|
|
Notes to Consolidated Financial Statements | F-10 |
|
|
Management’s Report On Internal Control Over Financial Reporting
The Board of Directors and Shareholders
Frontier Communications Parent, Inc.:
The management of Frontier Communications Parent, Inc. and subsidiaries is responsible for establishing and maintaining adequate internal control over financial reporting, as such term is defined in Exchange Act Rules 13a-15(f) and 15d-15(f).
Under the supervision and with the participation of our management, we conducted an evaluation of the effectiveness of our internal control over financial reporting based on the framework in Internal Control-Integrated Framework (2013) issued by the Committee of Sponsoring Organizations of the Treadway Commission (COSO). Based on our evaluation, our management concluded that our internal control over financial reporting was effective as of December 31, 2024.
Our independent registered public accounting firm, KPMG LLP, has audited the consolidated financial statements included in this report and, as part of their audit, has issued their report, included herein, on the effectiveness of our internal control over financial reporting.
|
|
|
/s/ Nick Jeffery |
| /s/ Scott Beasley |
Nick Jeffery |
| Scott Beasley |
President and Chief Executive Officer |
| Executive Vice President, Chief Financial Officer |
Dallas, Texas
February 20, 2025
Report of Independent Registered Public Accounting Firm
To the Board of Directors and Shareholders
Frontier Communications Parent, Inc.:
Opinion on the Consolidated Financial Statements
We have audited the accompanying consolidated balance sheets of Frontier Communications Parent, Inc. and subsidiaries (the Company) as of December 31, 2024 and 2023, the related consolidated statements of operations, comprehensive (loss) income, equity, and cash flows for each of the years in the three-year period ended December 31, 2024, and the related notes (collectively, the consolidated financial statements). In our opinion, the consolidated financial statements present fairly, in all material respects, the financial position of the Company as of December 31, 2024 and 2023, and the results of its operations and its cash flows for each of the years in the three-year period ended December 31, 2024, in conformity with U.S. generally accepted accounting principles.
We also have audited, in accordance with the standards of the Public Company Accounting Oversight Board (United States) (PCAOB), the Company’s internal control over financial reporting as of December 31, 2024, based on criteria established in Internal Control – Integrated Framework (2013) issued by the Committee of Sponsoring Organizations of the Treadway Commission, and our report dated February 20, 2025 expressed an unqualified opinion on the effectiveness of the Company’s internal control over financial reporting.
Basis for Opinion
These consolidated financial statements are the responsibility of the Company’s management. Our responsibility is to express an opinion on these consolidated financial statements based on our audits. We are a public accounting firm registered with the PCAOB and are required to be independent with respect to the Company in accordance with the U.S. federal securities laws and the applicable rules and regulations of the Securities and Exchange Commission and the PCAOB.
We conducted our audits in accordance with the standards of the PCAOB. Those standards require that we plan and perform the audit to obtain reasonable assurance about whether the consolidated financial statements are free of material misstatement, whether due to error or fraud. Our audits included performing procedures to assess the risks of material misstatement of the consolidated financial statements, whether due to error or fraud, and performing procedures that respond to those risks. Such procedures included examining, on a test basis, evidence regarding the amounts and disclosures in the consolidated financial statements. Our audits also included evaluating the accounting principles used and significant estimates made by management, as well as evaluating the overall presentation of the consolidated financial statements. We believe that our audits provide a reasonable basis for our opinion.
Critical Audit Matter
The critical audit matter communicated below is a matter arising from the current period audit of the consolidated financial statements that was communicated or required to be communicated to the audit committee and that: (1) relates to accounts or disclosures that are material to the consolidated financial statements and (2) involved our especially challenging, subjective, or complex judgments. The communication of a critical audit matter does not alter in any way our opinion on the consolidated financial statements, taken as a whole, and we are not, by communicating the critical audit matter below, providing a separate opinion on the critical audit matter or on the accounts or disclosures to which it relates.
Evaluation of Revenue
As discussed in Note 4 to the consolidated financial statements, the Company had $5.9 billion in revenues for the year ended December 31, 2024.
We identified the evaluation of certain revenue streams as a critical audit matter. Obtaining an understanding of processes, systems and databases used in the Company’s revenue recognition process involved especially challenging auditor judgment and required specialized knowledge related to IT applications. Specifically, evaluating the processes and the related internal controls for revenue streams associated with data and internet services, voice services and video services, including the related IT applications, configurations and interfaces, required significant auditor effort.
The following are the primary procedures we performed to address this critical audit matter. We applied auditor judgment to determine the nature and extent of procedures to be performed over data and internet services, voice services and video services revenue. We evaluated the design and tested the operating effectiveness of certain internal controls related to the evaluation of revenue, including general IT controls and IT application controls. We involved IT professionals with specialized skills and knowledge, who assisted in testing certain IT applications that are used by the Company in its revenue recognition process. We performed a software-assisted data analysis to test relationships among certain revenue transactions. Additionally, we tested the deferred revenue balance related to advanced billings as of December 31, 2024. We evaluated the sufficiency of audit evidence obtained by assessing the results of procedures performed, including the appropriateness of the nature and extent of such evidence.
|
|
| /s/ KPMG LLP |
|
|
We have served as the Company’s auditor since 1936.
|
|
|
|
|
|
Dallas, Texas February 20, 2025 |
|
Report of Independent Registered Public Accounting Firm
To the Board of Directors and Shareholders
Frontier Communications Parent, Inc.:
Opinion on Internal Control Over Financial Reporting
We have audited Frontier Communications Parent, Inc. and subsidiaries' (the Company) internal control over financial reporting as of December 31, 2024, based on criteria established in Internal Control – Integrated Framework (2013) issued by the Committee of Sponsoring Organizations of the Treadway Commission. In our opinion, the Company maintained, in all material respects, effective internal control over financial reporting as of December 31, 2024, based on criteria established in Internal Control – Integrated Framework (2013) issued by the Committee of Sponsoring Organizations of the Treadway Commission.
We also have audited, in accordance with the standards of the Public Company Accounting Oversight Board (United States) (PCAOB), the consolidated balance sheets of the Company as of December 31, 2024 and 2023, the related consolidated statements of operations, comprehensive (loss) income, equity, and cash flows for each of the years in the three-year period ended December 31, 2024, and the related notes (collectively, the consolidated financial statements), and our report dated February 20, 2025 expressed an unqualified opinion on those consolidated financial statements.
Basis for Opinion
The Company’s management is responsible for maintaining effective internal control over financial reporting and for its assessment of the effectiveness of internal control over financial reporting, included in the accompanying Management's Report On Internal Control Over Financial Reporting. Our responsibility is to express an opinion on the Company’s internal control over financial reporting based on our audit. We are a public accounting firm registered with the PCAOB and are required to be independent with respect to the Company in accordance with the U.S. federal securities laws and the applicable rules and regulations of the Securities and Exchange Commission and the PCAOB.
We conducted our audit in accordance with the standards of the PCAOB. Those standards require that we plan and perform the audit to obtain reasonable assurance about whether effective internal control over financial reporting was maintained in all material respects. Our audit of internal control over financial reporting included obtaining an understanding of internal control over financial reporting, assessing the risk that a material weakness exists, and testing and evaluating the design and operating effectiveness of internal control based on the assessed risk. Our audit also included performing such other procedures as we considered necessary in the circumstances. We believe that our audit provides a reasonable basis for our opinion.
Definition and Limitations of Internal Control Over Financial Reporting
A company’s internal control over financial reporting is a process designed to provide reasonable assurance regarding the reliability of financial reporting and the preparation of financial statements for external purposes in accordance with generally accepted accounting principles. A company’s internal control over financial reporting includes those policies and procedures that (1) pertain to the maintenance of records that, in reasonable detail, accurately and fairly reflect the transactions and dispositions of the assets of the company; (2) provide reasonable assurance that transactions are recorded as necessary to permit preparation of financial statements in accordance with generally accepted accounting principles, and that receipts and expenditures of the company are being made only in accordance with authorizations of management and directors of the company; and (3) provide reasonable assurance regarding prevention or timely detection of unauthorized acquisition, use, or disposition of the company’s assets that could have a material effect on the financial statements.
Because of its inherent limitations, internal control over financial reporting may not prevent or detect misstatements. Also, projections of any evaluation of effectiveness to future periods are subject to the risk that controls may become inadequate because of changes in conditions, or that the degree of compliance with the policies or procedures may deteriorate.
|
|
|
|
|
|
|
|
Dallas, Texas |
|
February 20, 2025 |
|
|
|
FRONTIER COMMUNICATIONS PARENT, INC., AND SUBSIDIARIES
CONSOLIDATED BALANCE SHEETS
AS OF DECEMBER 31, 2024 AND 2023
($ in millions and shares in thousands, except for per-share amounts)
|
|
|
|
|
|
|
|
|
|
|
|
| 2024 |
|
| 2023 |
|
| ASSETS |
|
|
|
|
|
|
|
|
| Current assets: |
|
|
|
|
|
|
|
|
| Cash and cash equivalents |
| $ | 750 |
|
| $ | 1,125 |
|
| Short-term investments |
|
| - |
|
|
| 1,075 |
|
| Accounts receivable, less allowances of $66 and $53, respectively |
|
| 379 |
|
|
| 446 |
|
| Prepaid expenses |
|
| 67 |
|
|
| 67 |
|
| Income taxes and other current assets |
|
| 64 |
|
|
| 68 |
|
| Total current assets |
|
| 1,260 |
|
|
| 2,781 |
|
|
|
|
|
|
|
|
|
|
|
| Property, plant and equipment, net |
|
| 15,678 |
|
|
| 13,933 |
|
| Intangibles, net |
|
| 3,264 |
|
|
| 3,585 |
|
| Other assets |
|
| 412 |
|
|
| 394 |
|
| Total assets |
| $ | 20,614 |
|
| $ | 20,693 |
|
|
|
|
|
|
|
|
|
|
|
| LIABILITIES AND EQUITY |
|
|
|
|
|
|
|
|
| Current liabilities: |
|
|
|
|
|
|
|
|
| Long-term debt due within one year |
| $ | 10 |
|
| $ | 15 |
|
| Accounts payable and accrued liabilities |
|
| 1,033 |
|
|
| 1,103 |
|
| Advanced billings |
|
| 180 |
|
|
| 182 |
|
| Accrued other taxes |
|
| 124 |
|
|
| 118 |
|
| Accrued interest |
|
| 128 |
|
|
| 126 |
|
| Pension and other postretirement benefits |
|
| 39 |
|
|
| 38 |
|
| Other current liabilities |
|
| 775 |
|
|
| 693 |
|
| Total current liabilities |
|
| 2,289 |
|
|
| 2,275 |
|
|
|
|
|
|
|
|
|
|
|
| Deferred income taxes |
|
| 609 |
|
|
| 643 |
|
| Pension and other postretirement benefits |
|
| 591 |
|
|
| 697 |
|
| Other liabilities |
|
| 633 |
|
|
| 553 |
|
| Long-term debt |
|
| 11,551 |
|
|
| 11,246 |
|
| Total liabilities |
|
| 15,673 |
|
|
| 15,414 |
|
|
|
|
|
|
|
|
|
|
|
| Equity: |
|
|
|
|
|
|
|
|
| Common stock, $0.01 par value per share (1,750,000 authorized shares, |
|
|
|
|
|
|
|
|
| 249,695 and 245,813 issued and outstanding at December 31, 2024 |
|
|
|
|
|
|
|
|
| and 2023, respectively) |
|
| 3 |
|
|
| 2 |
|
| Additional paid-in capital |
|
| 4,299 |
|
|
| 4,297 |
|
| Retained earnings |
|
| 562 |
|
|
| 884 |
|
| Accumulated other comprehensive income, net of tax |
|
| 77 |
|
|
| 96 |
|
| Total equity |
|
| 4,941 |
|
|
| 5,279 |
|
| Total liabilities and equity |
| $ | 20,614 |
|
| $ | 20,693 |
|
|
|
|
|
|
|
|
|
|
|
The accompanying Notes are an integral part of these Consolidated Financial Statements.
FRONTIER COMMUNICATIONS PARENT, INC., AND SUBSIDIARIES
CONSOLIDATED STATEMENTS OF OPERATIONS
FOR THE PERIODS ENDED DECEMBER 31, 2024, 2023, AND 2022
($ in millions and shares in thousands, except for per-share amounts)
|
|
|
|
|
|
|
|
|
|
|
|
|
|
| For the year ended |
| For the year ended |
| For the year ended |
|
|
|
| December 31, |
| December 31, |
| December 31, |
|
|
|
| 2024 |
| 2023 |
| 2022 |
|
|
|
|
|
|
|
|
|
|
|
|
|
| Revenue |
| $ | 5,937 |
| $ | 5,751 |
| $ | 5,787 |
|
|
|
|
|
|
|
|
|
|
|
|
|
| Operating expenses: |
|
|
|
|
|
|
|
|
|
|
| Cost of service |
|
| 2,110 |
|
| 2,125 |
|
| 2,169 |
|
| Selling, general, and administrative expenses |
|
| 1,725 |
|
| 1,646 |
|
| 1,745 |
|
| Depreciation and amortization |
|
| 1,625 |
|
| 1,415 |
|
| 1,182 |
|
| Restructuring costs and other charges |
|
| 124 |
|
| 73 |
|
| 99 |
|
| Total operating expenses |
|
| 5,584 |
|
| 5,259 |
|
| 5,195 |
|
|
|
|
|
|
|
|
|
|
|
|
|
| Operating income |
|
| 353 |
|
| 492 |
|
| 592 |
|
|
|
|
|
|
|
|
|
|
|
|
|
| Investment and other income, net (See Note 11) |
|
| 105 |
|
| 278 |
|
| 554 |
|
| Pension settlement costs |
|
| - |
|
| - |
|
| (55) |
|
| Interest expense (See Note 8) |
|
| (804) |
|
| (653) |
|
| (492) |
|
|
|
|
|
|
|
|
|
|
|
|
|
| (Loss) income before income taxes |
|
| (346) |
|
| 117 |
|
| 599 |
|
| Income tax expense (benefit) |
|
| (24) |
|
| 88 |
|
| 158 |
|
|
|
|
|
|
|
|
|
|
|
|
|
| Net (loss) income |
| $ | (322) |
| $ | 29 |
| $ | 441 |
|
|
|
|
|
|
|
|
|
|
|
|
|
| Basic net (loss) earnings per share |
|
|
|
|
|
|
|
|
|
|
| attributable to Frontier common shareholders |
| $ | (1.30) |
| $ | 0.12 |
| $ | 1.80 |
|
| Diluted net (loss) earnings per share |
|
|
|
|
|
|
|
|
|
|
| attributable to Frontier common shareholders |
| $ | (1.30) |
| $ | 0.12 |
| $ | 1.80 |
|
|
|
|
|
|
|
|
|
|
|
|
|
| Total weighted average shares outstanding - basic |
|
| 248,184 |
|
| 245,517 |
|
| 244,781 |
|
|
|
|
|
|
|
|
|
|
|
|
|
| Total weighted average shares outstanding - diluted |
|
| 248,184 |
|
| 248,459 |
|
| 245,280 |
|
|
|
|
|
|
|
|
|
|
|
|
|
CONSOLIDATED STATEMENTS OF COMPREHENSIVE (LOSS) INCOME
FOR THE PERIODS ENDED DECEMBER 31, 2024, 2023, AND 2022
($ in millions)
|
|
|
|
|
|
|
|
|
|
|
|
|
|
| For the year ended |
| For the year ended |
| For the year ended |
|
|
|
| December 31, |
| December 31, |
| December 31, |
|
|
|
| 2024 |
| 2023 |
| 2022 |
|
|
|
|
|
|
|
|
|
|
|
|
|
| Net (loss) income |
| $ | (322) |
| $ | 29 |
| $ | 441 |
|
| Other comprehensive (loss) income, net of tax |
|
| (19) |
|
| 17 |
|
| 19 |
|
|
|
|
|
|
|
|
|
|
|
|
|
| Comprehensive (loss) income |
| $ | (341) |
| $ | 46 |
| $ | 460 |
|
|
|
|
|
|
|
|
|
|
|
|
|
The accompanying Notes are an integral part of these Consolidated Financial Statements.
FRONTIER COMMUNICATIONS PARENT, INC., AND SUBSIDIARIES
CONSOLIDATED STATEMENTS OF EQUITY
FOR THE PERIODS ENDED DECEMBER 31, 2024, 2023, AND 2022
($ in millions and shares in thousands)
|
|
|
|
|
|
|
|
|
|
|
|
|
|
|
|
|
|
|
|
|
|
|
|
|
|
|
|
|
|
|
|
|
|
|
|
|
|
|
|
|
|
|
|
|
|
|
|
|
| Accumulated |
|
|
|
|
|
|
|
|
|
|
| Additional |
|
|
| Other |
|
|
|
|
| Common Stock |
| Paid-In |
| Retained |
| Comprehensive |
| Total |
|
|
| Shares |
| Amount |
| Capital |
| Earnings |
| Income |
| Equity |
|
| Balance at December 31, 2021 | 244,416 |
| $ | 2 |
| $ | 4,124 |
| $ | 414 |
| $ | 60 |
| $ | 4,600 |
|
| Stock plans, net | 605 |
|
| - |
|
| 74 |
|
| - |
|
| - |
|
| 74 |
|
| Net income | - |
|
| - |
|
| - |
|
| 441 |
|
| - |
|
| 441 |
|
| Other comprehensive |
|
|
|
|
|
|
|
|
|
|
|
|
|
|
|
|
|
| income, net of tax | - |
|
| - |
|
| - |
|
| - |
|
| 19 |
|
| 19 |
|
| Balance at December 31, 2022 | 245,021 |
| $ | 2 |
| $ | 4,198 |
| $ | 855 |
| $ | 79 |
| $ | 5,134 |
|
| Stock plans, net | 792 |
|
| - |
|
| 99 |
|
| - |
|
| - |
|
| 99 |
|
| Net income | - |
|
| - |
|
| - |
|
| 29 |
|
| - |
|
| 29 |
|
| Other comprehensive |
|
|
|
|
|
|
|
|
|
|
|
|
|
|
|
|
|
| income, net of tax | - |
|
| - |
|
| - |
|
| - |
|
| 17 |
|
| 17 |
|
| Balance at December 31, 2023 | 245,813 |
| $ | 2 |
| $ | 4,297 |
| $ | 884 |
| $ | 96 |
| $ | 5,279 |
|
| Stock plans, net | 3,882 |
|
| 1 |
|
| 2 |
|
| - |
|
| - |
|
| 3 |
|
| Net loss | - |
|
| - |
|
| - |
|
| (322) |
|
| - |
|
| (322) |
|
| Other comprehensive |
|
|
|
|
|
|
|
|
|
|
|
|
|
|
|
|
|
| loss, net of tax | - |
|
| - |
|
| - |
|
| - |
|
| (19) |
|
| (19) |
|
| Balance at December 31, 2024 | 249,695 |
| $ | 3 |
| $ | 4,299 |
| $ | 562 |
| $ | 77 |
| $ | 4,941 |
|
|
|
|
|
|
|
|
|
|
|
|
|
|
|
|
|
|
|
|
The accompanying Notes are an integral part of these Consolidated Financial Statements.
FRONTIER COMMUNICATIONS PARENT, INC., AND SUBSIDIARIES
CONSOLIDATED STATEMENTS OF CASH FLOWS
FOR THE PERIODS ENDED DECEMBER 31, 2024, 2023, AND 2022
($ in millions)
|
|
|
|
|
|
|
|
|
|
|
|
|
|
| For the year ended |
| For the year ended |
| For the year ended |
|
|
|
| December 31, |
| December 31, |
| December 31, |
|
|
|
| 2024 |
| 2023 |
| 2022 |
|
| Cash flows provided from (used by) operating activities: |
|
|
|
|
|
|
|
|
|
|
| Net (loss) income |
| $ | (322) |
| $ | 29 |
| $ | 441 |
|
| Adjustments to reconcile net loss to net cash provided |
|
|
|
|
|
|
|
|
|
|
| from (used by) operating activities: |
|
|
|
|
|
|
|
|
|
|
| Depreciation and amortization |
|
| 1,625 |
|
| 1,415 |
|
| 1,182 |
|
| Pension settlement costs |
|
| - |
|
| - |
|
| 55 |
|
| Pension/OPEB special termination benefit enhancements |
|
| 12 |
|
| - |
|
| - |
|
| Stock-based compensation expense |
|
| 68 |
|
| 108 |
|
| 82 |
|
| Amortization of (premium) discount |
|
| (20) |
|
| (25) |
|
| (28) |
|
| Lease Impairment |
|
| - |
|
| - |
|
| 44 |
|
| Bad debt expense |
|
| 39 |
|
| 35 |
|
| 26 |
|
| Other adjustments |
|
| 10 |
|
| 12 |
|
| - |
|
| Deferred income taxes |
|
| (27) |
|
| 78 |
|
| 164 |
|
| Change in accounts receivable |
|
| 28 |
|
| (43) |
|
| (7) |
|
| Change in long-term pension and other post-retirement liabilities |
|
| (142) |
|
| (325) |
|
| (656) |
|
| Change in accounts payable and other liabilities |
|
| 301 |
|
| 55 |
|
| 51 |
|
| Change in prepaid expenses, income taxes, and other assets |
|
| 49 |
|
| 5 |
|
| 47 |
|
| Net cash provided from operating activities |
|
| 1,621 |
|
| 1,344 |
|
| 1,401 |
|
|
|
|
|
|
|
|
|
|
|
|
|
| Cash flows provided from (used by) investing activities: |
|
|
|
|
|
|
|
|
|
|
| Capital expenditures |
|
| (2,783) |
|
| (3,211) |
|
| (2,738) |
|
| Purchase of short-term investments |
|
| - |
|
| (2,275) |
|
| (4,350) |
|
| Sale of short-term investments |
|
| 1,075 |
|
| 2,950 |
|
| 2,600 |
|
| Purchase of long-term investments |
|
| - |
|
| (62) |
|
| - |
|
| Proceeds on sale of assets |
|
| 20 |
|
| 36 |
|
| 13 |
|
| Other |
|
| 7 |
|
| 6 |
|
| 7 |
|
| Net cash used by investing activities |
|
| (1,681) |
|
| (2,556) |
|
| (4,468) |
|
|
|
|
|
|
|
|
|
|
|
|
|
| Cash flows provided from (used by) financing activities: |
|
|
|
|
|
|
|
|
|
|
| Long-term debt principal payments |
|
| (412) |
|
| (68) |
|
| (14) |
|
| Proceeds from long-term debt borrowings |
|
| 750 |
|
| 2,278 |
|
| 1,200 |
|
| Payments of vendor financing |
|
| (463) |
|
| (5) |
|
| - |
|
| Premium paid to retire debt |
|
| - |
|
| (10) |
|
| - |
|
| Financing costs paid |
|
| (31) |
|
| (62) |
|
| (17) |
|
| Finance lease obligation payments |
|
| (31) |
|
| (25) |
|
| (19) |
|
| Proceeds from financing lease transactions |
|
| - |
|
| 30 |
|
| 70 |
|
| Taxes paid on behalf of employees for shares withheld |
|
| (65) |
|
| (9) |
|
| (8) |
|
| Other |
|
| (16) |
|
| - |
|
| (1) |
|
| Net cash provided from (used by) financing activities |
|
| (268) |
|
| 2,129 |
|
| 1,211 |
|
|
|
|
|
|
|
|
|
|
|
|
|
| Increase (Decrease) in cash, cash equivalents, and restricted cash |
|
| (328) |
|
| 917 |
|
| (1,856) |
|
| Cash, cash equivalents and restricted cash |
|
|
|
|
|
|
|
|
|
|
| at the beginning of the period |
|
| 1,239 |
|
| 322 |
|
| 2,178 |
|
| Cash, cash equivalents, and restricted cash at the end of the period |
| $ | 911 |
| $ | 1,239 |
| $ | 322 |
|
|
|
|
|
|
|
|
|
|
|
|
|
| Supplemental cash flow information: |
|
|
|
|
|
|
|
|
|
|
| Cash paid during the period for: |
|
|
|
|
|
|
|
|
|
|
| Interest |
| $ | 835 |
| $ | 711 |
| $ | 512 |
|
| Income tax payments (refunds), net |
| $ | (10) |
| $ | - |
| $ | 8 |
|
|
|
|
|
|
|
|
|
|
|
|
|
| Non-cash investing activities: |
|
|
|
|
|
|
|
|
|
|
| Decrease in capital expenditures due to |
|
|
|
|
|
|
|
|
|
|
| changes in accounts payable and accrued expenses |
| $ | (40) |
| $ | (326) |
| $ | 797 |
|
| Increase (Decrease) in capital expenditures due to |
|
|
|
|
|
|
|
|
|
|
| changes in vendor financing |
| $ | (239) |
| $ | 255 |
| $ | - |
|
The accompanying Notes are an integral part of these Consolidated Financial Statements.
(1) Description of Business and Summary of Significant Accounting Policies:
(a)Description of Business:
Frontier Communications Parent, Inc. is a provider of communications services in the United States, with approximately 3.1 million broadband subscribers and approximately 13,000 employees, operating in 25 states. We were incorporated in 1935, originally under the name of Citizens Utilities Company and was known as Citizens Communications Company until July 31, 2008. Frontier and its subsidiaries are referred to as “we,” “us,” “our,” “Frontier,” or the “Company” in this report.
(b)Basis of Presentation and Use of Estimates:
Our consolidated financial statements have been prepared in accordance with accounting principles generally accepted in the United States of America (GAAP). The consolidated financial statements include the accounts of Frontier Communications Parent, Inc., all consolidated subsidiaries and variable interest entities of which the Company is the primary beneficiary. All significant intercompany balances and transactions have been eliminated in consolidation.
For our financial statements as of and for the period ended December 31, 2024, we evaluated subsequent events and transactions for potential recognition or disclosure through the date that we filed this Form 10-K with the Securities and Exchange Commission (SEC).
The preparation of our financial statements in conformity with GAAP requires management to make estimates and assumptions that affect (i) the reported amounts of assets and liabilities at the date of the financial statements, (ii) the disclosure of contingent assets and liabilities, and (iii) the reported amounts of revenue and expenses during the reporting period. Actual results may differ from those estimates. Estimates and judgments are used when accounting for the application of allowance for credit losses, asset impairments, indefinite-lived intangibles, depreciation and amortization, income taxes, and pension and other postretirement benefits, among others.
(c) Going Concern:
In accordance with the requirements of Accounting Standards Update (“ASU”) 2014-15, “Presentation of Financial Statements Going Concern (ASU 2014-15)”, and ASC 205, “Presentation of Financial Statements”, we have the responsibility to evaluate at each reporting period, including interim periods, whether conditions and/or events raise substantial doubt about the Company’s ability to meet its future financial obligations. In its evaluation for this report, management considered our current financial condition and liquidity sources, including current funds available, forecasted future cash flows and our conditional and unconditional obligations due within one year following the date of issuance of this Annual Report on Form 10-K.
Accordingly, the accompanying consolidated financial statements have been prepared assuming that we will continue as a going concern and contemplate the realization of assets and the satisfaction of liabilities in the normal course business.
(d)Cash Equivalents and Restricted Cash:
We consider all liquid investments with an original maturity of three months or less to be cash equivalents. Restricted cash amounts represent cash collateral required for certain Letter of Credit obligations and utility vendors and collateral for debt arrangements.
At December 31, 2024 and December 31, 2023, the Company had $161 million and $114 million, respectively, in restricted cash, and is included in “Other assets” on our consolidated balance sheet. Pursuant to the terms of the Company’s securitized financing facility and secured fiber network revenue term notes, as described in Note 8, restricted cash is held in securitization escrow accounts. As of December 31, 2024, and 2023 approximately $56 million and $42 million, respectively, is current restricted cash, included in “Income taxes and other current assets” on our consolidated balance sheet, held for the purpose of paying interest and certain fees. In addition, as of December 31, 2024, and 2023 approximately $105 million and $72 million, respectively, is noncurrent restricted cash held for the purpose of satisfying the required liquidity reserve amount.
(e) Short-Term Investments:
Given the long-term nature of our fiber build, we have invested cash into short-term investments to improve interest income while preserving funding flexibility.
As of December 31, 2024, the Company had no short-term investments. As of December 31, 2023, the Company had short-term investments of $1,075 million.
Other Investments
In connection with the closing of the securitization transaction, approximately $63 million in the form of U.S. Treasuries was deposited in an escrow account established with a trustee, for the purpose of paying interest and principal on $47 million in remaining debt of our subsidiary Frontier Southwest Incorporated. As of December 31, 2024 and December 31, 2023, this balance was approximately $57 million and $62 million, respectively, and is included in “Other assets” on our consolidated balance sheets. See Note 11 for further details.
(f)Revenue Recognition:
Revenue for data and Internet services, voice services, video services and switched and non-switched access services is recognized as services are provided to customers. Services that are billed in advance include monthly recurring network access services (including data services), special access services, and monthly recurring voice, video, and related charges. Revenue is recognized by measuring progress toward the complete satisfaction of our performance obligations. The unearned portion of these fees is deferred as a component of “Advanced billings” on our consolidated balance sheet and recognized as revenue over the period that the services are provided. Services that are billed in arrears include non-recurring network access services (including data services), switched access services, and non-recurring voice and video services. The earned but unbilled portion of these fees is recognized as revenue in our consolidated statements of operations and accrued in “Accounts receivable” on our consolidated balance sheet in the period that services are provided. Excise taxes are recognized as a liability when billed.
Satisfaction of Performance Obligations
We satisfy our obligations to customers by transferring goods and services in exchange for consideration received from the customer. The timing of our satisfaction of the performance obligation may differ from the timing of the customer’s payment.
Bundled Service and Allocation of Discounts
When customers purchase more than one service, revenue for each is determined by allocating the total transaction price based upon the relative stand-alone selling price of each service. We frequently offer service discounts as an incentive to customers, which reduce the total transaction price. Any incentives which are considered cash equivalents (e.g. gift cards) that are granted will similarly result in a reduction of the total transaction price. Cash equivalent incentives are accounted for on a portfolio basis and are recognized in the month they are awarded to customers.
Customer Incentives
In the process of acquiring and/or retaining customers, we may issue a variety of incentives aside from service discounts or cash equivalent incentives. Those incentives that have stand-alone value (e.g. gift cards not considered cash equivalents or free goods/services) are considered separate performance obligations. While these incentives are free to the customer, a portion of the consideration received from the customer is ascribed to them based upon their relative stand-alone selling price. These types of incentives are accounted for on a portfolio basis with both revenue and expense recognized in the month they are awarded to the customer. The earned revenue associated with these incentives is reflected in “Other” revenue while the associated costs are reflected in “Cost of Services”.
Upfront Fees
All non-refundable upfront fees assessed to our customers provide them with a material right to renew; therefore, they are deferred by creating a contract liability and amortized into “Data and Internet service revenue” for fees charged to our wholesale customers and “Other revenue” for fees charged to all other customers over the average customer life using a portfolio approach.
Customer Acquisition Costs
Sales commission expenses are recognized as incurred. According to ASC 606, incremental costs in obtaining a contract with a customer are deferred and recorded as a contract asset if the period of benefit is expected to be greater than one year. For our retail customers, this period of benefit has been determined to be less than one year. As such, we applied the practical expedient that allows such costs to be expensed as incurred.
Taxes, Surcharges and Subsidies
We collect various taxes, Universal Service Funds (USF) surcharges (primarily federal USF), and certain other surcharges from our customers and subsequently remits these taxes to governmental authorities.
In June 2015, we accepted the FCC offer of support to price cap carriers under the Connect America Fund (“CAF”) Phase II program, which was intended to provide long-term support for broadband build commitments in high cost unserved or underserved areas. The seven-year funding term ended on December 31, 2021. The Universal Service Administrative Company (“USAC”) and the FCC are reviewing carriers’ CAF II program completion data, and if USAC or the FCC
determines that we did not satisfy certain applicable CAF Phase II requirements, we could be required to return a portion of the funds previously received and may be subject to certain other penalties, requirements and obligations.
In May 2022, we accepted the FCC offer under the Rural Digital Opportunity Fund (“RDOF”) Phase I program, which provides funding over a ten-year period to support the construction of broadband networks in rural communities across the country. We accepted $37 million in annual support through 2032 in return for our commitment to make broadband available to households within the RDOF eligible areas. We will recognize the FCC’s RDOF Phase I subsidies into revenue on a straight-line basis over the ten-year funding term which will end March 31, 2032. We are required to complete the RDOF deployment by December 31, 2028. Thereafter, USAC and the FCC will review carriers’ RDOF program completion data, and if USAC or the FCC determines that we did not satisfy applicable FCC RDOF requirements, funding provided to us can be discontinued and we could be required to return a portion of the funds previously received and may be subject to certain other penalties, requirements and obligations. Fines and penalties could also be assessed to the extent Frontier were ever to decide to surrender RDOF locations previously awarded. We accrue for any potential shortfall in the household build commitment that we deem to be probable and reasonably estimated.
On July 24, 2024, the U.S. Court of Appeals for the Fifth Circuit held that certain delegations of authority in the USF contribution system are unconstitutional. The court remanded the case to the FCC. The Fifth Circuit subsequently stayed the decision to allow the FCC to file a petition with, the U.S. Supreme Court seeking review. The stay allows for the continued collection of USF contributions while the Supreme Court considers the case. The precise impact of the case is unclear at this time, including the extent to which the decision applies to parties other than the petitioner. We cannot predict how this or future court decisions will impact the company’s ability to receive federal universal service funds in the future.
(g)Property, Plant and Equipment:
Property, plant and equipment are stated at original cost, including capitalized interest. Maintenance and repairs are charged to operating expenses as incurred. The gross book value of routine property, plant and equipment retired is charged against accumulated depreciation.
(h)Definite and Indefinite Lived Intangible Assets:
Intangible assets are initially recorded at estimated fair value. Customer relationship intangibles were established for business and wholesale customers. These intangibles are amortized on a straight-line basis over their assigned useful lives of between 11 and 16 years. Additionally, trademark and tradename assets established are amortized on a straight-line basis over 5 years. We review such intangible assets annually, or more often if indicators of impairment arise, to determine whether there is evidence that indicates an impairment condition may exist that would necessitate a change in useful life and a different amortization period.
(i)Impairment of Long-Lived Assets and Long-Lived Assets to Be Disposed Of:
We review long-lived assets to be held and used, including customer lists and property, plant and equipment, and long-lived assets to be disposed of for impairment whenever events or changes in circumstances indicate that the carrying amount of such assets may not be recoverable. Recoverability of assets to be held and used is measured by comparing the carrying amount of the asset to the future undiscounted net cash flows expected to be generated by the asset. Recoverability of assets held for sale is measured by comparing the carrying amount of the assets to their estimated fair market value. If any assets are considered to be impaired, the impairment is measured by the amount by which the carrying amount of the assets exceeds the estimated fair value. Also, we periodically reassess the useful lives of our long-lived assets to determine whether any changes are required.
(j)Lease Accounting:
We determine if an arrangement contains a lease at inception. Right-of-use (ROU) assets represent our right to use an underlying asset for the lease term and lease liabilities represent our obligation to make lease payments arising from the lease. Operating and Finance lease ROU assets and liabilities are recognized at commencement date based on the present value of lease payments over the lease term. As most of our leases do not provide an implicit rate, we use our incremental borrowing rate based on the information available at commencement date in determining the present value of lease payments. The operating and finance lease ROU asset also includes any lease payments made and excludes lease incentives. Our lease terms used in accounting for leases may reflect options to extend or terminate the lease when it is reasonably certain that we will exercise that option. Lease expense for operating leases is recognized on a straight-line basis over the lease term. ROU assets for operating leases are recorded to “Other Assets”, and the related liabilities recorded to “Other current liabilities”, and “Other liabilities” on our consolidated balance sheets. Assets subject to finance leases are included in “Property, Plant & Equipment”, with corresponding liabilities recorded to “Other current liabilities”, and “Other liabilities” on our consolidated balance sheets.
We assess potential impairments to our leases annually, or as indicators exist, if indicators of impairment arise to determine whether there is evidence that indicate an impairment condition may exist. We continue to review our real estate portfolio and, during the first quarter of 2022, determined to either terminate or market for sublease certain facilities leases, which triggered an impairment of $44 million for our finance and operating lease assets recorded as restructuring charges and other costs. See Note 10 for further details.
(k)Income Taxes and Deferred Income Taxes:
We file a consolidated federal income tax return. We utilize the asset and liability method of accounting for income taxes. Under the asset and liability method, deferred income taxes are recorded for the tax effect of temporary differences between the financial statement basis and the tax basis of assets and liabilities using tax rates expected to be in effect when the temporary differences are expected to reverse.
We recognize deferred tax assets to the extent that we believe that these assets are more likely than not to be realized. In making such a determination, we consider all available positive and negative evidence, including future reversals of existing taxable temporary differences, tax-planning strategies, and results of recent operations. If we determine that we are not able to realize a portion of our net deferred tax assets in the future, we would make an adjustment to the deferred tax asset valuation allowance, which would increase the provision for income taxes.
The tax effect of a change in tax law or rates included in income tax expense from continuing operations includes effect of changes in deferred tax assets and liabilities initially recognized through a charge or credit to other comprehensive income (loss). The residual tax effects typically are released when the item giving rise to the tax effect is disposed of, liquidated, or terminated.
(l) Stock Plans:
We have one stock-based compensation plan under which grants are made and awards remain outstanding. Awards under this plan may be made to employees, directors or consultants of the Company or its affiliates, as determined by the Compensation and Human Capital Committee of the Board. Awards may be made in the form of restricted stock, restricted stock units, incentive stock options, non-qualified stock options, stock appreciation rights or other stock-based awards, including awards with performance, market, and time-vesting conditions.
The compensation cost recognized is based on awards ultimately expected to vest. GAAP requires forfeitures to be estimated and revised, if necessary, in subsequent periods if actual forfeitures differ from those estimates.
(2) Merger Agreement:
On September 4, 2024, we entered into an Agreement and Plan of Merger (the “Merger Agreement”) with Verizon Communications Inc., a Delaware corporation (“Verizon”), and France Merger Sub Inc., a Delaware corporation and a wholly owned subsidiary of Verizon (“Merger Sub”), pursuant to which, subject to the satisfaction or waiver (to the extent permitted by law) of specified conditions, Merger Sub will be merged with and into the Company (the “Merger”), with the Company surviving the Merger as a wholly owned subsidiary of Verizon.
Subject to such terms and conditions of the Merger Agreement, which has been unanimously approved by the Board, at the effective time of the Merger (the “Effective Time”), each share of common stock, par value $0.01 per share, of the Company issued and outstanding immediately prior to the Effective Time (subject to certain exceptions set forth in the Merger Agreement) shall be converted into the right to receive $38.50 in cash, without interest (the “Merger Consideration”).
At the Effective Time, other than as set forth below, each outstanding RSU (as defined below) and PSU (as defined below) will vest and be canceled and the holder thereof will be entitled to receive an amount in cash equal to the number of shares of Company Common Stock underlying such award (in the case of PSUs, based on attainment of all applicable performance goals at the greater of target and actual level of performance measured at the Effective Time) multiplied by the Merger Consideration. At the Effective Time, a portion of the outstanding RSUs and PSUs granted following the date of the Merger Agreement (determined by proration of any such grant based on the time remaining between the Effective Time and the end of the relevant vesting period) shall be automatically converted into a number of unvested restricted stock units of Verizon (“Verizon RSUs”) equal to the number of such RSUs and PSUs multiplied by an exchange ratio equal to the Merger Consideration divided by the five day volume weighted average price of Verizon common stock ending with the second complete trading day immediately prior to the closing date. Such conversion of PSUs shall be based on attainment of all applicable performance goals at the greater of target and actual level of performance measured at the Effective Time. The Verizon RSUs shall be subject to the same terms and conditions as applied to the RSUs and PSUs of the Company (including time-based vesting conditions but excluding performance-based vesting conditions) prior to the Effective Time.
The consummation of the Merger is subject to certain closing conditions, including, among other things: (i) the approval of the holders of a majority of the voting power represented by the outstanding shares of Company Common Stock entitled to vote thereon (the “Company Stockholder Approval”); (ii) the expiration or early termination of the applicable waiting period under the Hart-Scott-Rodino Antitrust Improvements Act of 1976, as amended (the “HSR waiting period”); (iii) the receipt of certain required consents or approvals from the FCC and certain specified state regulatory authorities; (iv) the absence of legal restraints prohibiting the Merger; and (v) other customary conditions specified in the Merger Agreement. The transaction is not subject to a financing condition. The Company Stockholder Approval was obtained on November 13, 2024 and the applicable HSR waiting period expired on February 14, 2025. Subject to the remaining conditions, the Company expects to consummate the merger by the first quarter of 2026.
The Merger Agreement contains certain termination rights for the Company and Verizon, including, among others, the right of either party to terminate the Merger Agreement if the Merger is not consummated by March 4, 2026 (subject to two automatic three-month extensions if certain closing conditions have not been satisfied).
Upon termination of the Merger Agreement under specified circumstances, the Company will be required to pay Verizon a termination fee equal to $320 million. Additionally, upon termination of the Merger Agreement under specified circumstances relating to the failure to obtain certain specified antitrust or other regulatory approvals, Verizon will be required to pay the Company a termination fee equal to $590 million.
The Company has incurred and will incur certain costs relating to the proposed Merger, such as financial advisory, legal, accounting and other professional services fees.
(3) Recent Accounting Pronouncements:
Financial Accounting Standards Adopted During 2024
During the year ended December 31, 2024, we adopted, the Financial Accounting Standards Board’s (FASB) Accounting Standards Update ASU No. 2023-07 – Segment Reporting (Topic 280): Improvements to reportable segment disclosures. The amendments in this update improve financial reporting by requiring disclosure of incremental segment information on an annual and interim basis for all public entities to enable investors to develop more decision-useful financial analyses. Currently, Topic 280 requires that a public entity disclose certain information about its reportable segments. For example, a public entity is required to report a measure of segment profit or loss that our chief operating decision maker (“CODM”) uses to assess segment performance and make decisions about allocating resources. Topic 280 also requires other specified segment items and amounts, such as depreciation, amortization, and depletion expense, to be disclosed under certain circumstances. The amendments in this update do not change or remove those disclosure requirements. The amendments in this update also do not change how a public entity identifies its operating segments, aggregates those operating segments, or applies the quantitative thresholds to determine its reportable segments. Refer to Note 17 for further details.
Financial Accounting Standards Not Yet Adopted
ASU No. 2024-03 – Income Statement – Reporting Comprehensive Income (Topic 220): Expense Disaggregation Disclosures. This update requires public business entities to provide detailed disclosures in the notes to financial statements, disaggregating specific expense categories within relevant income statement captions. The required categories include purchases of inventory, employee compensation, depreciation, intangible asset amortization, and depreciation, intangible asset amortization, and depletion. The standard is effective for annual reporting periods beginning after December 15, 2026, and for interim periods within annual reporting periods beginning after December 15, 2027, with early adoption permitted. The Company is currently evaluating the impact of this standard on its consolidated financial statements and related disclosures.
ASU No. 2023-09 – Income Taxes (Topic 740): Improvements to Income Tax Disclosures. The amendments in this Update require that public business entities on an annual basis (1) disclose specific categories in the rate reconciliation and (2) provide additional information for reconciling items that meet a quantitative threshold (if the effect of those reconciling items is equal to or greater than 5 percent of the amount computed by multiplying pretax income [or loss] by the applicable statutory income tax rate). For public business entities, the amendments in this Update are effective for annual periods beginning after December 15, 2024. The Company is currently evaluating the impact of this standard on its consolidated financial statements and related disclosures.
(4) Revenue Recognition:
We categorize our products, services, and other revenues into the following categories:
Data and Internet services include broadband services for consumer and business customers. We provide data transmission services to high volume business customers and other carriers with dedicated high capacity circuits (“nonswitched access”) including services to wireless providers (“wireless backhaul”);
Voice services include traditional local and long-distance wireline services, Voice over Internet Protocol (VoIP) services, as well as a number of unified messaging services offered to our consumer and business customers. Voice services also include the long-distance voice origination and termination services that we provide to our business customers and other carriers;
Video services include revenues generated from services provided directly to consumer customers as linear terrestrial television services, through various satellite providers, and through partnerships with over-the-top (OTT) video providers. Video services also includes pay-per-view revenues, video on demand, equipment rentals, and video advertising. We have made the strategic decision to limit sales of new traditional TV services focusing on our broadband products and OTT video options;
Other customer revenue includes switched access revenue, rents collected for collocation services, and revenue from other services and fees. Switched access revenue includes revenues derived from allowing other carriers to use our network to originate and/or terminate their local and long-distance voice traffic (switched access). These services are primarily billed on a minutes-of-use basis applying tariffed rates filed with the FCC or state agencies; and
Subsidy and other regulatory revenue includes revenues generated from cost subsidies from state and federal authorities, including the CAF II and RDOF.
The following tables provide a summary of revenues, by category.
|
|
|
|
|
|
|
|
|
|
|
|
| For the year ended |
| For the year ended |
| For the year ended |
|
|
| December 31, |
| December 31, |
| December 31, |
|
($ in millions) |
| 2024 |
| 2023 |
| 2022 |
|
Data and Internet services |
| $ | 3,963 |
| $ | 3,534 |
| $ | 3,390 |
|
Voice services |
|
| 1,231 |
|
| 1,373 |
|
| 1,498 |
|
Video services |
|
| 344 |
|
| 430 |
|
| 520 |
|
Other |
|
| 335 |
|
| 339 |
|
| 325 |
|
Revenue from contracts |
|
|
|
|
|
|
|
|
|
|
with customers (1) |
|
| 5,873 |
|
| 5,676 |
|
| 5,733 |
|
Subsidy and other regulatory revenue |
|
| 64 |
|
| 75 |
|
| 54 |
|
Total revenue |
| $ | 5,937 |
| $ | 5,751 |
| $ | 5,787 |
|
|
|
|
|
|
|
|
|
|
|
|
|
|
|
|
|
|
|
|
|
|
|
|
| For the year ended |
| For the year ended |
| For the year ended |
|
|
| December 31, |
| December 31, |
| December 31, |
|
($ in millions) |
| 2024 |
| 2023 |
| 2022 |
|
Consumer |
| $ | 3,163 |
| $ | 3,097 |
| $ | 3,116 |
|
Business and Wholesale |
|
| 2,710 |
|
| 2,579 |
|
| 2,617 |
|
Revenue from contracts |
|
|
|
|
|
|
|
|
|
|
with customers (1) |
|
| 5,873 |
|
| 5,676 |
|
| 5,733 |
|
Subsidy and other regulatory revenue |
|
| 64 |
|
| 75 |
|
| 54 |
|
Total revenue |
| $ | 5,937 |
| $ | 5,751 |
| $ | 5,787 |
|
|
|
|
|
|
|
|
|
|
|
|
(1)Includes $52 million, $62 million and $63 million of lease revenue for the years ended December 31, 2024, 2023 and 2022, respectively.
The following is a summary of the changes in the contract liabilities:
|
|
|
|
|
|
|
|
|
|
|
|
|
|
|
|
|
|
|
|
| Contract Liabilities |
|
| ($ in millions) |
| Current |
| Noncurrent |
|
|
|
|
|
|
|
|
|
|
| Balance at January 1, 2024 |
| $ | 33 |
| $ | 16 |
|
| Revenue recognized included |
|
|
|
|
|
|
|
| in opening contract balance |
|
| (34) |
|
| (19) |
|
| Credits granted, excluding amounts |
|
|
|
|
|
|
|
| recognized as revenue |
|
| 36 |
|
| 16 |
|
| Reclassified between current |
|
|
|
|
|
|
|
| and noncurrent |
|
| (1) |
|
| 1 |
|
| Balance at December 31, 2024 |
| $ | 34 |
| $ | 14 |
|
|
|
|
|
|
|
|
|
|
| Balance at January 1, 2023 |
| $ | 28 |
| $ | 17 |
|
| Revenue recognized included |
|
|
|
|
|
|
|
| in opening contract balance |
|
| (37) |
|
| (14) |
|
| Credits granted, excluding amounts |
|
|
|
|
|
|
|
| recognized as revenue |
|
| 37 |
|
| 18 |
|
| Reclassified between current |
|
|
|
|
|
|
|
| and noncurrent |
|
| 5 |
|
| (5) |
|
| Balance at December 31, 2023 |
| $ | 33 |
| $ | 16 |
|
|
|
|
|
|
|
|
|
|
The unsatisfied obligations for retail customers consist of amounts in advance billings, which are expected to be earned within the following monthly billing cycle. Unsatisfied obligations for wholesale customers are based on a point-in-time calculation and determined by the number of circuits provided and the contractual price. These wholesale customer obligations change from period to period based on new circuits added as well as circuits that are terminated.
The following table includes estimated revenue expected to be recognized in the future related to performance obligations that are unsatisfied (or partially unsatisfied) at the end of the reporting period.
|
|
|
|
|
|
|
|
|
|
|
|
| ($ in millions) |
| Revenue from contracts with customers |
|
|
|
|
|
|
|
| 2025 |
| $ | 463 |
|
| 2026 |
|
| 187 |
|
| 2027 |
|
| 162 |
|
| 2028 |
|
| 30 |
|
| 2029 |
|
| 76 |
|
| Thereafter |
|
| 44 |
|
| Total |
| $ | 962 |
|
|
|
|
|
|
|
(5) Accounts Receivable:
The components of accounts receivable, net at December 31, 2024 and 2023 are as follows:
|
|
|
|
|
|
|
|
|
|
|
|
|
|
|
|
|
|
|
|
|
|
|
|
|
| ($ in millions) |
| December 31, 2024 |
| December 31, 2023 |
|
| |
|
|
|
|
|
|
|
| Retail and Wholesale |
| $ | 388 |
| $ | 438 |
|
| Other |
|
| 57 |
|
| 61 |
|
| Less: Allowance for doubtful accounts |
|
| (66) |
|
| (53) |
|
| Accounts receivable, net |
| $ | 379 |
| $ | 446 |
|
|
|
|
|
|
|
|
|
|
An analysis of the activity in the allowance for credit losses is as follows:
|
|
|
|
|
|
|
|
|
|
|
|
|
|
| For the year ended |
| For the year ended |
| For the year ended |
|
| ($ in millions) |
| December 31, |
| December 31, |
| December 31, |
|
|
|
| 2024 |
| 2023 |
| 2022 |
|
| Balance at beginning of the Period: |
| $ | 53 |
| $ | 47 |
| $ | 57 |
|
| Increases: Provision for bad debt charged to expense |
|
| 39 |
|
| 35 |
|
| 26 |
|
| Increases: Provision for bad debt charged to revenue |
|
| 80 |
|
| 23 |
|
| 30 |
|
| Write-offs charged against allowance, net of recoveries |
|
| (106) |
|
| (52) |
|
| (66) |
|
| Balance at end of Period: |
| $ | 66 |
| $ | 53 |
| $ | 47 |
|
|
|
|
|
|
|
|
|
|
|
|
|
We maintain an allowance for credit losses based on the estimated ability to collect accounts receivable. The allowance for credit losses is increased by recording an expense for the provision for bad debts for retail customers, and through decreases to revenue at the time of billing for wholesale customers. The allowance is decreased when customer accounts are written off, or when customers are given credits.
The provision for bad debts charged to expense was $39 million, $35 million and $26 million for the year ended December 31, 2024, 2023 and 2022, respectively.
Approximately $440 million and $143 million of credits related to customers are included in other current liabilities on our consolidated balance sheets as of December 31, 2024, and December 31, 2023, respectively.
In accordance with ASC 326, we performed calculations to estimate expected credit losses, utilizing rates that are consistent with our write offs (net of recoveries) because such events affect the entity’s loss given default experience.
(6) Property, Plant, and Equipment:
Property, plant, and equipment, net at December 31, 2024 and 2023 are as follows:
|
|
|
|
|
|
|
|
|
|
|
|
|
|
|
|
|
|
|
|
|
|
|
|
|
|
|
|
|
|
|
|
|
|
| Estimated |
| December 31, |
| December 31, |
|
| ($ in millions) |
| Useful Lives |
| 2024 |
| 2023 |
|
| |
|
|
|
|
|
|
|
|
|
| Land |
| N/A |
| $ | 241 |
| $ | 243 |
|
| Buildings and leasehold improvements |
| 40 years |
|
| 1,250 |
|
| 1,221 |
|
| General support |
| 5 to 15 years |
|
| 591 |
|
| 427 |
|
| Central office/electronic circuit equipment |
| 5 to 8 years |
|
| 3,226 |
|
| 2,467 |
|
| Poles |
| 30 years |
|
| 1,074 |
|
| 915 |
|
| Cable, fiber, and wire |
| 15 to 27 years |
|
| 9,921 |
|
| 7,718 |
|
| Conduit |
| 50 years |
|
| 1,429 |
|
| 1,416 |
|
| Materials and supplies |
|
|
|
| 431 |
|
| 594 |
|
| Construction work in progress |
|
|
|
| 1,155 |
|
| 1,323 |
|
| Property, plant, and equipment |
|
|
|
| 19,318 |
|
| 16,324 |
|
| Less: Accumulated depreciation |
|
|
|
| (3,640) |
|
| (2,391) |
|
| Property, plant, and equipment, net |
|
|
| $ | 15,678 |
| $ | 13,933 |
|
|
|
|
|
|
|
|
|
|
|
|
Property, plant, and equipment includes approximately $246 million and $179 million of fixed assets recognized under finance leases as of December 31, 2024 and 2023, respectively.
As of December 31, 2024, our materials and supplies were $431 million, as compared to $594 million as of December 31, 2023. Components of this include fiber, network electronics, and customer premises equipment.
Beginning in the second half of 2023, Frontier negotiated payment terms with certain of our vendors, (referred to as vendor financing), which are excluded from capital expenditures and reported as financing activities on the statement of cash flows. As of December 31, 2024, our capital expenditures were $2,783 million. For the year ended December 31, 2024, our vendor financing payments were $463 million. As of December 31, 2024, there was $585 million, $8 million, and $24 million in “Accounts payable and accrued liabilities”, “Other current liabilities” and “Other liabilities”, respectively, for payables associated with capital expenditures, and $16 million included in “Other current liabilities” for vendor financing payables associated with capital expenditures. For the year ended December 31, 2024, we had capitalized interest of $49 million.
In 2024, we sold certain properties consisting of land and buildings for approximately $18 million. The aggregate carrying value of the properties was approximately $11 million, resulting in a gain on sale of $7 million.
In 2023, we had asset sales and transactions of $63 million, including approximately $47 million in net proceeds related to certain wireless towers. Approximately $19 million of the proceeds related to wireless towers that qualified as sales, included in investing cash flows, and the remaining $28 million in proceeds related to wireless towers that were subject to sale-leaseback agreements and included in financing cash flows. After taking these sales and transactions into account, along with our capital expenditures, our net capital activity was $3,148 million for the year ended December 31, 2023.
During 2022, we sold a property that was subject to leaseback, generating approximately $70 million in proceeds.
Depreciation expense is principally based on the composite group method. Depreciation expense was as follows:
|
|
|
|
|
|
|
|
|
|
|
|
|
|
|
|
|
|
|
|
|
|
|
|
|
|
|
|
|
|
|
|
|
|
|
| For the year ended |
| For the year ended |
| For the year ended |
|
|
| December 31, |
| December 31, |
| December 31, |
| ($ in millions) |
| 2024 |
| 2023 |
| 2022 |
|
|
|
|
|
|
|
|
|
|
|
| Depreciation expense |
| $ | 1,304 |
| $ | 1,094 |
| $ | 861 |
|
|
|
|
|
|
|
|
|
|
|
We adopted revised estimated remaining useful lives for certain plant assets as of October 1, 2024, as a result of an annual independent study of the estimated remaining useful lives of our plant assets, with an insignificant impact to depreciation expense.
(7) Intangibles:
We consider whether the carrying values of finite-lived intangible assets and property plant and equipment may not be recoverable or whether the carrying value of certain indefinite-lived intangible assets were impaired. No impairment was present for either intangibles or property plant and equipment as of December 31, 2024, 2023, and 2022.
The balances of these assets are as follows:
|
|
|
|
|
|
|
|
|
|
|
|
|
|
|
|
|
|
|
|
|
|
|
| December 31, 2024 |
| December 31, 2023 |
|
|
|
| Gross Carrying |
| Accumulated |
| Net Carrying |
| Gross Carrying |
| Accumulated |
| Net Carrying |
|
| ($ in millions) |
| Amount |
| Amortization |
| Amount |
| Amount |
| Amortization |
| Amount |
|
| |
|
|
|
|
|
|
|
|
|
|
|
|
|
|
|
|
|
|
|
| Intangibles: |
|
|
|
|
|
|
|
|
|
|
|
|
|
|
|
|
|
|
|
| Customer Relationships - Business |
| $ | 800 |
| $ | (267) |
| $ | 533 |
| $ | 800 |
| $ | (194) |
| $ | 606 |
|
| Customer Relationships - Wholesale |
|
| 3,491 |
|
| (800) |
|
| 2,691 |
|
| 3,491 |
|
| (582) |
|
| 2,909 |
|
| Trademarks & Tradenames |
|
| 150 |
|
| (110) |
|
| 40 |
|
| 150 |
|
| (80) |
|
| 70 |
|
| Total other intangibles |
| $ | 4,441 |
| $ | (1,177) |
| $ | 3,264 |
| $ | 4,441 |
| $ | (856) |
| $ | 3,585 |
|
|
|
|
|
|
|
|
|
|
|
|
|
|
|
|
|
|
|
|
|
|
Amortization expense was as follows:
|
|
|
|
|
|
|
|
|
| For the year ended |
| For the year ended |
| For the year ended |
| December 31, |
| December 31, |
| December 31, |
($ in millions) | 2023 |
| 2022 |
| 2021 |
|
|
|
|
|
|
|
|
|
Amortization expense | $ | 321 |
| $ | 321 |
| $ | 321 |
|
|
|
|
|
|
|
|
|
We amortize our intangible assets on a straight line basis, over the assigned useful lives of 16 years for our wholesale customer relationships, 11 years for our business customer relationships, and five years for our trademarks and tradenames. Amortization expense based on our current estimate of useful lives, is estimated to be approximately $321 million in 2025, $301 million in 2026, and $291 million in 2027, 2028 and 2029.
.
(8) Long-Term Debt:
The activity in long-term debt is summarized as follows:
|
|
|
|
|
|
|
|
|
|
|
|
|
|
|
|
|
|
|
|
|
|
|
|
|
|
|
|
|
|
|
|
|
|
|
|
| For the year ended December 31, 2024 |
|
|
|
|
|
|
|
|
|
| Principal |
|
|
|
|
|
|
|
|
|
|
| January 1, |
| Payments |
| New |
| December 31, |
| Interest Rate at |
| ($ in millions) |
| 2024 |
| and Retirements |
| Borrowings |
| 2024 |
| December 31, 2024 (2) |
| |
|
|
|
|
|
|
|
|
|
|
|
|
|
|
| Secured debt issued by Frontier |
| $ | 8,848 |
| $ | (412) |
| $ | - |
| $ | 8,436 |
| 6.837% |
| Secured debt issued by subsidiaries |
|
| 1,633 |
|
| - |
|
| 750 |
|
| 2,383 |
| 7.592% |
| Unsecured debt issued by subsidiaries |
|
| 750 |
|
| - |
|
| - |
|
| 750 |
| 6.899% |
| Principal outstanding |
| $ | 11,231 |
| $ | (412) |
| $ | 750 |
| $ | 11,569 |
| 6.996% |
| |
| | |
|
|
|
|
|
| | | |
|
|
| Less: Debt issuance costs |
|
| (71) |
|
|
|
|
|
|
|
| (89) |
|
|
| Less: Current portion |
|
| (15) |
|
|
|
|
|
| |
| (10) |
|
|
| Less: Debt premium / (discount) |
|
| (64) |
|
|
|
|
|
| |
| (44) |
|
|
| Plus: Unamortized fair value adjustments (1) |
|
| 165 |
|
|
|
|
|
|
|
| 125 |
|
|
| Total Long-term debt |
| $ | 11,246 |
|
|
|
|
|
| | $ | 11,551 |
|
|
|
|
|
|
|
|
|
|
|
|
|
|
|
|
|
|
(1) Upon emergence, we adjusted the carrying value of our debt to fair value. The adjustment consisted of the elimination of the existing unamortized debt issuance costs and unamortized discounts and recording a balance of $236 million as a fair value adjustment. The fair value accounting adjustment is being amortized into interest expense using the effective interest method.
(2) The interest rates at December 31, 2024 represent a weighted average of multiple issuances. The Anticipated Repayment Date (“ARD”) of July 2028 is used for the Series 2023-1 Revenue Term Notes, classes A-2, B, and C, and the ARD of May 2031 is used for the Series 2024-1 Revenue Term Notes, classes A-2, B, and C, when calculating the weighted average.
Additional information regarding our senior unsecured debt, senior secured debt, and subsidiary debt at December 31, 2024 and 2023 is as follows:
|
|
|
|
|
|
|
|
|
|
|
|
|
|
|
|
|
|
|
|
|
|
|
|
|
|
|
|
|
|
|
|
| December 31, 2024 |
|
|
|
| December 31, 2023 |
|
|
|
| Principal |
| Interest |
|
|
|
| Principal |
| Interest |
|
| ($ in millions) |
| Outstanding |
| Rate |
|
|
|
| Outstanding |
| Rate |
|
|
|
|
|
|
|
|
|
|
|
|
|
|
|
|
| Secured debt issued by Frontier |
|
|
|
|
|
|
|
|
|
|
|
|
|
| Term loan due 10/8/2027 |
| $ | - |
| - |
|
|
| $ | 1,435 |
| 9.220% (Variable) |
|
| Term loan due 7/1/2031 |
|
| 1,023 |
| 8.763% (Variable) |
|
|
|
| - |
| - |
|
| First lien notes due 10/15/2027 |
|
| 1,150 |
| 5.875% |
|
|
|
| 1,150 |
| 5.875% |
|
| First lien notes due 5/1/2028 |
|
| 1,550 |
| 5.000% |
|
|
|
| 1,550 |
| 5.000% |
|
| First lien notes due 5/15/2030 |
|
| 1,200 |
| 8.750% |
|
|
|
| 1,200 |
| 8.750% |
|
| First lien notes due 3/15/2031 |
|
| 750 |
| 8.625% |
|
|
|
| 750 |
| 8.625% |
|
| Second lien notes due 5/1/2029 |
|
| 1,000 |
| 6.750% |
|
|
|
| 1,000 |
| 6.750% |
|
| Second lien notes due 11/1/2029 |
|
| 750 |
| 5.875% |
|
|
|
| 750 |
| 5.875% |
|
| Second lien notes due 1/15/2030 |
|
| 1,000 |
| 6.000% |
|
|
|
| 1,000 |
| 6.000% |
|
| IDRB due 5/1/2030 |
|
| 13 |
| 6.200% |
|
|
|
| 13 |
| 6.200% |
|
| Total secured debt issued by Frontier |
|
| 8,436 |
|
|
|
|
|
| 8,848 |
|
|
|
|
|
|
|
|
|
|
|
|
|
|
|
|
|
|
| Secured debt issued by subsidiaries |
|
|
|
|
|
|
|
|
|
|
|
|
|
| Debentures due 11/15/2031 (2) |
|
| 47 |
| 8.500% |
|
|
|
| 47 |
| 8.500% |
|
| Series 2023-1 revenue term notes Class A-2 due 7/20/2028 |
|
| 1,119 |
| 6.600% |
|
|
|
| 1,119 |
| 6.600% |
|
| Series 2023-1 revenue term notes Class B due 7/20/2028 |
|
| 155 |
| 8.300% |
|
|
|
| 155 |
| 8.300% |
|
| Series 2023-1 revenue term notes class C due 7/20/2028 |
|
| 312 |
| 11.500% |
|
|
|
| 312 |
| 11.500% |
|
| Series 2024-1 revenue term notes Class A-2 due 5/20/2031 |
|
| 530 |
| 6.190% |
|
|
|
| - |
| - |
|
| Series 2024-1 revenue term notes Class B due 5/30/2031 |
|
| 73 |
| 7.020% |
|
|
|
| - |
| - |
|
| Series 2024-1 revenue term notes Class C due 5/20/2031 |
|
| 147 |
| 11.160% |
|
|
|
| - |
| - |
|
| Total secured debt issued by subsidiaries |
|
| 2,383 |
|
|
|
|
|
| 1,633 |
|
|
|
|
|
|
|
|
|
|
|
|
|
|
|
|
|
|
| Unsecured debt issued by subsidiaries |
|
|
|
|
|
|
|
|
|
|
|
|
|
| Debentures due 5/15/2027 |
|
| 200 |
| 6.750% |
|
|
|
| 200 |
| 6.750% |
|
| Debentures due 2/1/2028 |
|
| 300 |
| 6.860% |
|
|
|
| 300 |
| 6.860% |
|
| Debentures due 2/15/2028 |
|
| 200 |
| 6.730% |
|
|
|
| 200 |
| 6.730% |
|
| Debentures due 10/15/2029 |
|
| 50 |
| 8.400% |
|
|
|
| 50 |
| 8.400% |
|
| Total unsecured debt issued by subsidiaries |
|
| 750 |
|
|
|
|
|
| 750 |
|
|
|
|
|
|
|
|
|
|
|
|
|
|
|
|
|
|
| Principal outstanding |
| $ | 11,569 |
| 6.996% (1) |
|
|
| $ | 11,231 |
| 7.103% (1) |
|
|
|
|
|
|
|
|
|
|
|
|
|
|
|
|
(1) Interest rate represents a weighted average of the stated interest rates of multiple issuances. The ARD of July 2028 is used for the
Series 2023-1 Revenue Term Notes, classes A-2 B, and C, and the ARD of May 2031 is used for the Series 2024-1 Revenue Term
Notes, classes A-2, B, and C, when calculating the weighted average.
(2) $47 million principal amount in remaining debt of our subsidiary Frontier Southwest Incorporated, which was defeased, in
connection with the closing of the August 2023 securitization transaction.
As of December 31, 2024, the aggregate maturities of long-term debt for each of the next five years and thereafter as follows:
|
|
|
|
|
|
|
|
|
|
|
|
|
|
| Principal |
|
| ($ in millions) |
| Payments |
|
| |
|
|
|
|
| 2025 |
| $ | 10 |
|
| 2026 |
| $ | 10 |
|
| 2027 |
| $ | 1,360 |
|
| 2028 |
| $ | 3,646 |
|
| 2029 |
| $ | 1,810 |
|
| Thereafter |
| $ | 4,733 |
|
|
|
|
|
|
|
Credit Facilities and Term Loans
Revolving Facility
Subject to customary exceptions and thresholds, the security package under the Revolving Facility includes pledges of the equity interests in certain of our subsidiaries, which is currently limited to certain specified pledged entities and substantially all personal property of Frontier Video, which same assets also secure our First Lien Notes. The Revolving Facility is guaranteed by the same subsidiaries that guarantee the First Lien Notes. After giving effect to approximately $265 million of letters of credit outstanding, we had $660 million of available borrowing capacity under the Revolving Facility as of December 31, 2024.
The Revolving Facility includes customary negative covenants for loan agreements of this type, including covenants limiting Frontier and our restricted subsidiaries’ (other than certain covenants therein which are limited to subsidiary guarantors) ability to, among other things, incur additional indebtedness, create liens on assets, make investments, loans or advances, engage in mergers, consolidations, sales of assets and acquisitions, pay dividends and distributions and make payments in respect of certain material payment subordinated indebtedness, in each case subject to customary exceptions for loan agreements of this type.
The Revolving Facility also includes certain customary representations and warranties, affirmative covenants, and events of default, including, but not limited to, payment defaults, breaches of representations and warranties, covenant defaults, certain events under ERISA, change of control or damage to a material portion of the collateral.
On May 22, 2024, Frontier Communications Holdings, LLC, a subsidiary of Frontier (“Frontier Holdings”), entered into an amendment (the “2024 Credit Agreement Amendment”) to its existing credit agreement that governs its Revolving Facility which, among other things, (i) increased the aggregate amount of certain additional obligations permitted to be outstanding, including first lien debt, and securitization and receivables facilities, and non-loan party debt, from $2,500 million to $5,500 million; provided that at least 40% of the net available cash from the first $1,915 million in securitization and receivables facilities received after May 22, 2024 (excluding net available cash received from drawings with respect to $500 million of commitments of variable funding notes) is applied to prepay the Borrower’s existing term loans and other applicable indebtedness, and 100% of the net available cash from securitization and receivables facilities in excess thereof (up to the cap of $5,500 million) shall be applied to prepay the Borrower’s existing term loans and other applicable indebtedness; (ii) limited future securitizations and receivables facilities to assets located in Texas and/or Florida; and (iii) amended the financial maintenance covenant for the benefit of the Revolving Facility by, commencing with the period ending June 30, 2024, (a) including outstanding securitization and receivables facilities in the calculation of indebtedness and (b) increasing the maximum financial maintenance covenant leverage ratio thereunder to 5.25:1.00, with a step-down to 4.75:1.00 commencing with the period ending March 31, 2027, and continuing thereafter. The 2024 Credit Agreement Amendment became effective on July 1, 2024, when $402 million of net available cash from the securitization closing on such date was applied to prepay existing term loans.
On July 30, 2024, Frontier Holdings entered into a further amendment to its existing credit agreement that governs its Revolving Facility, pursuant to which $50 million of revolving credit commitments of a terminating lender were replaced by $75 million of commitments from a new lender, increasing overall capacity from $900 million to $925 million. The maturity date of the Revolving Facility will be the earliest of (a) April 30, 2028, (b) 91 days prior to the maturity of the term loan facility, (c) unless such notes have been repaid and/or redeemed in full, the date that is 91 days prior to the stated maturity date of our 5.875% First Lien Notes due 2027, and (d) unless such notes have been repaid and/or redeemed in full, the date that is 91 days prior to the stated maturity date of our 5.000% First Lien Notes due 2028.
Term Loan Facility
On January 14, 2025, Frontier Holdings entered into an amendment to its existing Term Loan Facility, which, among other things, (x) further lowered the margin over adjusted Term SOFR with respect to the Term Loan from 3.50% to 2.50% and (y) further lowered the margin over the alternative base rate with respect to the Term loan from 2.50% to 1.50%. On July 1, 2024, Frontier Holdings entered into an amendment to the Term Loan Facility which, among other things, extended the maturity date of $1.025 billion of the Term Loan to July 1, 2031 and eliminated the credit spread adjustment previously applicable to the Term Loan.
Subject to certain exceptions and thresholds, the security package under the Term Loan Facility includes pledges of the equity interests in certain of our subsidiaries, which as of the issue date is limited to certain specified pledged entities and substantially all personal property of Frontier Video Services Inc., a Delaware corporation (“Frontier Video”), which same assets also secure the First Lien Notes (as defined below). The Term Loan Facility is guaranteed by the same subsidiaries that guarantee the First Lien Notes.
The Term Loan Facility includes customary negative covenants for loan agreements of this type, including covenants limiting Frontier and our restricted subsidiaries’ (other than certain covenants therein which are limited to subsidiary guarantors) ability to, among other things, incur additional indebtedness, create liens on assets, make investments, loans or advances, engage in mergers, consolidations, sales of assets and acquisitions, pay dividends and distributions and make payments in respect of certain material payment subordinated indebtedness, in each case subject to customary exceptions for loan agreements of this type.
The Term Loan Facility also includes certain customary representations and warranties, affirmative covenants and events of default, including, but not limited to, payment defaults, breaches of representations and warranties, covenant defaults, certain events under ERISA, upon the conversion date, unstayed judgments in favor of a third-party involving an aggregate liability in excess of a certain threshold, change of control, upon the conversion date, specified governmental actions having a material adverse effect or condemnation or damage to a material portion of the collateral.
Warehouse Facilities
On December 31, 2024 (the “Warehouse Effective Date”), Frontier Tampa Bay FL Fiber 1 LLC (the “Borrower”) and Frontier SPE FL Guarantor LLC, as guarantor (the “Warehouse Guarantor”), each a subsidiary of Frontier Communications Parent, Inc. (the “Parent”), entered into a credit agreement (the “Warehouse Credit Agreement”) with certain lenders that establishes and governs certain credit facilities (the “Warehouse Facilities”). The Warehouse Facilities include:
A delayed draw term loan facility (the “DDTL Facility”) of $1.5 billion, less commitments reserved for letters of credit (the “Maximum DDTL Amount”). The DDTL Facility is available from the Warehouse Effective Date until the earlier of the full draw of the Maximum DDTL Amount or the third anniversary of the Warehouse Effective Date (such earlier date, the “DDTL Commitment Expiration Date”). To draw amounts under the DDTL Facility, the Borrower must comply with a total leverage ratio of no more than 6.75:1.00 and a debt service coverage ratio of at least 2.00:1.00. Additionally, no defaults or other specified conditions may be continuing, and all conditions precedent for each extension of credit must be satisfied. The Borrower must repay all outstanding amounts under the DDTL Facility due on the fifth anniversary of the Warehouse Effective Date. The interest rate for the DDTL Facility is either, at the sole discretion of the Warehouse Borrower, for Base Rate Loans, (a) the highest of (i) the “U.S. Prime Lending Rate” published by the Wall Street Journal, (ii) the Federal Funds Effective Rate (as agreed to in good faith by the parties to the Warehouse Credit Agreement) plus 0.50%, and (iii) one-month Term SOFR plus 1.00% per annum, plus (b) 0.75%, with step-ups from and after the third anniversary, or, for SOFR Loans, Term SOFR plus 1.75%, with step-ups from and after the third anniversary. Optional prepayments are allowed without fees or penalties, subject to notice requirements. A portion of the DDTL Facility, up to $200 million, is reserved as a letter of credit sublimit.
An incremental term loan facility (the “Incremental Term Loan”) under which the Warehouse Borrower has the right to increase the commitments under the DDTL Facility by up to $750 million after the DDTL Commitment Expiration Date. No lender is required to increase its commitment. The Warehouse Borrower must comply with all representations and warranties, and the terms of any Incremental Term Loan must be identical to those of the DDTL Facilities, including maturity, priority of liens, prepayment terms, and pricing.
In the event of default, an additional 2.00% per annum will be applied to overdue amounts. Fees include commitment fees on undrawn portions, letter of credit fees, and fronting fees. The Warehouse Facilities are secured by first-priority pledges of equity interests and security interests in substantially all owned tangible and intangible assets of the Warehouse Borrower and its guarantors, which consist of the Warehouse Borrower’s fiber network assets and associated customer contracts in certain neighborhoods in the Tampa, Florida area.
Fiber Network Revenue Term Notes
On July 1, 2024, Frontier Issuer LLC (“Frontier Issuer”), the Company’s limited-purpose, bankruptcy remote, subsidiary completed the issuance of $750 million aggregate principal amount of secured fiber network revenue term notes consisting of $530 million 6.19% Series 2024-1, Class A-2 term notes, $73 million 7.02% Series 2024-1, Class B term notes and $147 million 11.16% Series 2024-1, Class C term notes, each with an anticipated repayment term of seven years (collectively, the “Fiber Term Notes”). Collectively, the Fiber Term Notes have a weighted average yield of approximately 7.4%. The Fiber Term Notes are secured by certain of Frontier’s fiber assets and associated customer contracts in the North Texas area, in addition to those in the Dallas Metropolitan area contributed in the Series 2023-1 Notes offering. The assets of Frontier Issuer, AssetCo and the other securitization entities are available to satisfy only the obligations owed under the Fiber Term Notes and are not available to any other creditors of the Company or its affiliates. The Fiber Term Notes were issued pursuant to an indenture, dated as of August 8, 2023 (the “Base Indenture”), as supplemented by the Series 2023-1 Supplement thereto, dated as of August 8, 2023 (the “Series 2023-1 Supplement”), in each case entered into by and among the Issuer, Frontier Dallas TX Fiber 1 LLC (“AssetCo”) and Citibank, N.A. as the indenture trustee (the “Trustee”).
The table below sets forth the material terms of Fiber Term Notes as of December 31, 2024:
|
|
|
|
|
|
|
|
|
|
|
|
Security | Issue Date |
| Amount Outstanding |
| Interest Rate (1) |
| Anticipated Repayment Date |
| Final Maturity Date |
|
Series 2023-1, Class A-2 term notes | August 8, 2023 |
| $ | 1,119,000,000 |
| 6.60% |
| July 20, 2028 |
| August 20, 2053 |
|
Series 2023-1, Class B term notes | August 8, 2023 |
| $ | 155,000,000 |
| 8.30% |
| July 20, 2028 |
| August 20, 2053 |
|
Series 2023-1, Class C term notes | August 8, 2023 |
| $ | 312,000,000 |
| 11.50% |
| July 20, 2028 |
| August 20, 2053 |
|
Series 2024-1, Class A-2 term notes | July 1, 2024 |
| $ | 530,000,000 |
| 6.19% |
| May 20, 2031 |
| June 20, 2054 |
|
Series 2024-1, Class B term notes | July 1, 2024 |
| $ | 73,000,000 |
| 7.02% |
| May 20, 2031 |
| June 20, 2054 |
|
Series 2024-1, Class C term notes | July 1, 2024 |
| $ | 147,000,000 |
| 11.16% |
| May 20, 2031 |
| June 20, 2054 |
|
(1) If Frontier Issuer has not repaid or refinanced any Class of Notes of a Series of Fiber Term Notes prior to the ARD, additional interest will accrue thereon in an amount equal to the greater of (i) 5.00% per annum and (ii) the excess amount, if any, by which the sum of the following exceeds the interest rate for such note: (A) the yield to maturity (adjusted to a “mortgage-equivalent basis” pursuant to the standards and practices of the Securities Industry and Financial Markets Association) on the ARD for such note of the United States Treasury Security having a remaining term closest to 10 years plus (B) 5.00% plus (C) the post-ARD note spread applicable to such Note.
While the Fiber Term Notes are outstanding, scheduled payments of interest are required to be made on the Notes on a monthly basis. From and after the ARD, principal payments will also be required to be made on the Notes on a monthly basis. No principal payments will be due on the Fiber Term Notes prior to the ARD, unless certain rapid amortization or acceleration triggers are activated.
The Fiber Term Notes are subject to a series of covenants and restrictions customary for transactions of this type. These covenants and restrictions include (i) that Frontier Issuer maintains a liquidity reserve account to be used to make required payments in respect of the Notes, (ii) provisions relating to optional and mandatory prepayments, including specified make-whole payments in the case of certain optional prepayments of the Fiber Term Notes prior to the monthly payment date in July 2026, (iii) certain indemnification payments in the event, among other things, that the transfers of the assets pledged as collateral for the Fiber Term Notes are in stated ways defective or ineffective and (iv) covenants relating to recordkeeping, access to information and similar matters. As provided in the Base Indenture, the Fiber Term Notes are also subject to rapid amortization in the event of a failure to maintain a stated debt service coverage ratio. A rapid amortization may be cured if the debt service coverage ratio exceeds a certain threshold for a certain period of time, upon which cure, regular amortization, if any, will resume. The Fiber Term Notes are also subject to certain customary events of default, including events relating to non-payment of required interest, principal or other amounts due on or with respect to the Fiber Term Notes, failure to comply with covenants within certain time frames, certain bankruptcy events, breaches of specified representations and warranties, failure of security interests to be effective and certain judgments.
Secured Fiber Network Revenue Variable Funding Notes
On July 1, 2024, Frontier Holdings amended its Secured Fiber Network Revenue Variable Funding Notes, Series 2023-2, Class A-1 facility (the “VFN Amendment”) to reduce the available Variable Funding Notes commitment amount to $0, with the ability to increase the commitment amount up to $500 million in the future upon the satisfaction of certain conditions, and to extend the maturity date to June 2028.
In connection with entering into the DDTL Facility, the Company permanently reduced the Series 2023-2 Class A-1 Notes Maximum Principal Amount to $0, correspondingly reduced the Variable Funding Notes commitment amount to $0 and terminated the Series 2023-2 Class A-1 Note Purchase Agreement, in each case effective as of December 31, 2024.
Defeasance of Notes
During 2023, the Company extinguished $53 million of notes issued by its subsidiary Frontier Southwest Incorporated and transferred assets to an escrow account to pay the future interest and principal on the remaining $47 million of notes, which remain on the Company’s balance sheet as outstanding debt and restricted assets.
Senior Secured Notes
First Lien Notes due 2031
On March 8, 2023, our consolidated subsidiary Frontier Communications Holdings, LLC (“Frontier Holdings”) issued $750 million aggregate principal amount of 8.625% first lien secured notes due 2031 (the “First Lien Notes due 2031”) in an offering pursuant to exemptions from the registration requirements of the Securities Act of 1933, as amended (the “Securities Act”). We intend to use the net proceeds of the offering to fund capital investments and operating costs arising from our fiber build and expansion of our fiber customer base, and for general corporate purposes.
The First Lien Notes due 2031 are secured by a first-priority lien, subject to permitted liens, by all the assets that secure the issuer’s obligations under its senior secured credit facilities and existing senior secured notes. The First Lien Notes due 2031 were issued pursuant to an indenture, dated as of March 8, 2023, by and among Frontier Holdings, the guarantors party thereto, the grantor party thereto, Wilmington Trust, National Association, as trustee and JPMorgan Chase Bank, N.A., as collateral agent.
First Lien Notes due 2030
On May 12, 2022, our consolidated subsidiary Frontier Communications Holdings, LLC (“Frontier Holdings”) issued $1.2 billion aggregate principal amount of 8.750% First Lien Secured Notes due 2030 (the “First Lien Notes due 2030”) in an offering pursuant to exemptions from the registration requirements of the Securities Act. We intend to use the net proceeds of this offering to fund capital investments and operating costs arising from our fiber build and expansion of our fiber customer base, and for general corporate purposes.
The First Lien Notes due 2030 are secured by a first-priority lien, subject to permitted liens, by all the assets that secure the issuer’s obligations under its senior secured credit facilities and existing senior secured notes. The First Lien Notes due 2030 were issued pursuant to an indenture, dated as of May 12, 2022, by and among Frontier Holdings, the guarantors party thereto, the grantor party thereto, Wilmington Trust, National Association, as trustee and JPMorgan Chase Bank, N.A., as collateral agent.
Second Lien Notes due 2030
On October 13, 2021, New Frontier Issuer issued $1.0 billion aggregate principal amount of 6.000% Second Lien Secured Notes due 2030 (the “Second Lien Notes due 2030”) in an offering pursuant to exemptions from the registration requirements of the Securities Act of 1933, as amended. We intend to use the net proceeds of this offering to fund capital investments and operating costs arising from our fiber build and expansion of our fiber customer base, and for general corporate purposes.
The Second Lien Notes due 2030 were issued pursuant to an indenture, dated as of October 13, 2021 (the “Second Lien 2030 Indenture”), by and among the Issuer, the guarantors party thereto, the grantor party thereto and Wilmington Trust, National Association, as trustee and as collateral agent.
Second Lien Notes due May 2029
In connection with the DIP financing, on November 25, 2020, Old Frontier issued $1.0 billion aggregate principal amount of 6.750% Second Lien Secured Notes due May 1, 2029 (the “Second Lien Notes due May 2029”).
The Second Lien Notes due May 2029 were issued pursuant to an indenture, dated as of November 25, 2020 (the “Second Lien May 2029 Indenture”), by and among Old Frontier, the guarantors party thereto, the grantor party thereto and Wilmington Trust, National Association, as trustee and as collateral agent.
On the Effective Date, in accordance with the Second Lien May 2029 Indenture and the Plan, New Frontier Issuer entered into a supplemental indenture with Wilmington Trust, National Association, as trustee, and assumed the obligations under the Second Lien Notes due May 2029 and the Second Lien May 2029 Indenture.
Second Lien Notes due November 2029 or “Takeback Notes”
On April 30, 2021, New Frontier Issuer issued $750 million aggregate principal amount of 5.875% Second Lien Secured Notes due November 2029 (the “Second Lien Notes due November 2029” or the “Takeback Notes”) pursuant to an indenture, dated as of April 30, 2021 (the “Takeback Notes Indenture”), by and among New Frontier Issuer, the guarantors party thereto, the grantor party thereto and Wilmington Trust, National Association, as trustee and as collateral agent. At Old Frontier’s direction, the Takeback Notes were issued to holders of claims arising under, derived from, based on, or related to the unsecured notes issued by Old Frontier in partial satisfaction of such claims.
The Second Lien Notes due 2030, the Second Lien Notes due May 2029 and the Takeback Notes are collectively referred to as the Second Lien Notes. The Second Lien 2030 Indenture, the Second Lien May 2029 Indenture and the Takeback Notes Indenture are collectively referred to as the Second Lien Notes Indentures. The Second Lien Notes and the First Lien Notes (as defined below) are referred to herein collectively as the “Notes”.
The Second Lien Notes are secured by a second-priority lien, subject to permitted liens, by all the assets that secure New Frontier Issuer’s obligations under the Term Loan Facility, the Revolving Facility, and the First Lien Notes (as defined below).
The Second Lien Notes Indentures contain customary negative covenants, subject to a number of important exceptions and qualifications, including, without limitation, covenants related to incurring additional debt and issuing preferred stock; incurring or creating liens; redeeming and/or prepaying certain debt; paying dividends on stock or repurchasing stock; making certain investments; engaging in specified sales of assets; entering into transactions with affiliates; and engaging in consolidation, mergers and acquisitions. Certain of these covenants will be suspended during such time, if any, that the Second Lien Notes have investment grade ratings by at least two of Moody’s, S&P or Fitch. The Second Lien Notes Indentures also provides
for customary events of default which, if any of them occurs, would permit, or require the principal of and accrued interest on the Second Lien Notes to become or to be declared due and payable.
First Lien Notes
In connection with the DIP financing, (a) on October 8, 2020, Old Frontier issued $1,150 million aggregate principal amount of 5.875% First Lien Secured Notes due October 15, 2027 (the “First Lien Notes due 2027”) and (b) on November 25, 2020, Old Frontier issued $1,550 million aggregate principal amount of 5.000% First Lien Secured Notes due May 1, 2028 (the “First Lien Notes due 2028” and, together with the First Lien Notes due 2027, the “First Lien Notes”).
The First Lien Notes due 2027 were issued pursuant to an indenture, dated as of October 8, 2020 (the “2027 First Lien Indenture”), by and among Old Frontier, the guarantors party thereto, the grantor party thereto, JPMorgan Chase Bank N.A., as collateral agent, and Wilmington Trust, National Association, as trustee. The First Lien Notes due 2028 were issued pursuant to an indenture, dated as of November 25, 2020 (the “2028 First Lien Indenture” and, together with the 2027 First Lien Indenture, the “First Lien Indentures”), by and among Old Frontier, the guarantors party thereto, the grantor party thereto, JPMorgan Chase Bank N.A., as collateral agent and Wilmington Trust, National Association, as trustee.
On the Effective Date, in accordance with the Indentures and the Plan, New Frontier Issuer entered into supplemental indentures to the First Lien Indentures with Wilmington Trust, National Association, as trustee, and assumed the obligations under each series of the First Lien Notes and each of the First Lien Indentures.
The First Lien Notes are secured on a first-priority basis and pari passu with its senior secured credit facilities, subject to permitted liens and certain exceptions, by all the assets that secure our obligations under the Term Loan Facility and the Revolving Facility.
The First Lien Indentures contain customary negative covenants, subject to a number of important exceptions and qualifications, including, without limitation, covenants related to incurring additional debt and issuing preferred stock; incurring or creating liens; redeeming and/or prepaying certain debt; paying dividends on our stock or repurchasing stock; making certain investments; engaging in specified sales of assets; entering into transactions with affiliates; and engaging in consolidation, mergers and acquisitions. Certain of these covenants will be suspended during such time, if any, that the First Lien Notes have investment grade ratings by at least two of Moody’s, S&P or Fitch. The First Lien Notes Indentures also provides for customary events of default which, if any of them occurs, would permit, or require the principal of and accrued interest on the First Lien Notes to become or to be declared due and payable.
Other Obligations
During 2018, we contributed real estate properties with an aggregate fair value of $37 million for the purpose of funding a portion of our contribution obligations to our qualified defined benefit pension plan. The pension plan obtained independent appraisals of the property and, based on these appraisals, the pension plan recorded the contributions at aggregate fair value of $37 million for 2019. We entered into a lease for the contributed properties. The properties are managed on behalf of the pension plan by an independent fiduciary, and the terms of the lease were negotiated with the fiduciary on an arm’s-length basis.
For properties contributed in 2018, leases have initial terms of 20 years at a combined average aggregate annual rent of approximately $5 million.
The contribution and leaseback of the properties were treated as financing transactions and, accordingly, we continue to depreciate the carrying value of the property in our financial statements and no gain or loss was recognized. An obligation of $52 million is included in our consolidated balance sheet within “Other liabilities” as of December 31, 2024 and the liability is reduced annually by a portion of the lease payments made to the pension plan. Under the new lease standard, liabilities for these finance transactions are included in our financing lease liabilities. Refer to Note 10 for additional details.
(9) Restructuring and Other Charges:
Restructuring and other charges consists of severance and employee costs related to workforce reductions.
During 2024, we incurred $124 million in restructuring charges and other costs consisting of $31 million of severance and employee costs resulting from workforce reductions, $12 million in pension/OPEB special termination benefit enhancements related to a voluntary separation program, and $81 million of costs associated with the Verizon merger and other restructuring activities.
During 2023, we incurred $73 million in restructuring charges and other costs consisting of $65 million of severance and employee costs resulting from workforce reductions, and $8 million of costs related to other restructuring activities.
During 2022, we incurred $99 million in restructuring charges and other costs consisting of $44 million of lease impairment costs from the strategic exit of certain facilities, $44 million of severance and employee costs resulting from workforce reductions, and $11 million of costs related to other restructuring activities.
The following is a summary of the changes in the liabilities established for restructuring and related programs:
|
|
|
|
|
|
| ($ in millions) |
|
|
|
|
|
|
|
|
|
|
| Balance at December 31, 2022 |
| $ | 9 |
|
| Severance expense |
|
| 65 |
|
| Other costs |
|
| 8 |
|
| Cash payments during the period |
|
| (72) |
|
| Balance at December 31, 2023 |
| $ | 10 |
|
| Severance expense |
|
| 31 |
|
| Pension / OPEB special termination benefit enhancements |
|
| 12 |
|
| Other costs |
|
| 81 |
|
| Cash payments during the period |
|
| (125) |
|
| Balance at December 31, 2024 |
| $ | 9 |
|
|
|
|
|
|
|
((
(10) Leases:
We have operating and finance leases for certain facilities and equipment used in our operations. Some of our real estate operating leases contain renewal options that may be exercised, and some of our leases include options to terminate the leases within one year.
We have recognized a right-of-use asset for both operating and finance leases, and a corresponding lease liability that represents the present value of our obligation to make payments over the lease term.
The components of lease cost are as follows:
|
|
|
|
|
|
|
|
|
|
|
|
| For the year ended |
| For the year ended |
| For the year ended |
|
|
| December 31, |
| December 31, |
| December 31, |
| ($ in millions) |
| 2024 |
| 2023 |
| 2022 |
|
|
|
|
|
|
|
|
|
|
| Lease cost: |
|
|
|
|
|
|
|
|
| Finance lease cost: |
|
|
|
|
|
|
|
|
| Amortization of right-of-use assets | $ | 30 |
| $ | 25 |
| $ | 19 |
| Interest on lease liabilities |
| 23 |
|
| 16 |
|
| 9 |
| Finance lease cost |
| 53 |
|
| 41 |
|
| 28 |
| Operating lease cost (1) |
| 57 |
|
| 61 |
|
| 62 |
| Sublease income |
| (10) |
|
| (15) |
|
| (12) |
| Total lease cost | $ | 100 |
| $ | 87 |
| $ | 78 |
|
|
|
|
|
|
|
|
|
|
(1)Includes short-term lease costs of $2 million, $2 million and $3 million for the year ended December 31, 2024, 2023 and 2022, respectively. Includes variable lease costs of $3 million, $5 million and $5 million for the year ended December 31, 2024, 2023 and 2022, respectively.
Supplemental balance sheet information related to leases is as follows:
|
|
|
|
|
|
|
|
|
|
|
|
|
|
|
|
|
|
|
|
| ($ in millions) | December 31, 2024 |
| December 31, 2023 |
|
|
|
|
|
|
|
|
|
|
|
| Operating right-of-use assets | $ | 194 | (1) |
| $ | 181 | (1) |
|
| Finance right-of-use assets | $ | 246 | (2) |
| $ | 179 | (2) |
|
|
|
|
|
|
|
|
|
|
|
| Operating lease liabilities | $ | 204 | (3) |
| $ | 195 | (3) |
|
| Finance lease liabilities | $ | 269 | (4) |
| $ | 209 | (4) |
|
|
|
|
|
|
|
|
|
|
|
| Operating leases: |
|
|
|
|
|
|
|
|
| Weighted-average remaining lease term |
| 7.43 | years |
|
| 7.72 | years |
|
| Weighted-average discount rate |
| 5.96 | % |
|
| 5.92 | % |
|
|
|
|
|
|
|
|
|
|
|
| Finance leases: |
|
|
|
|
|
|
|
|
| Weighted-average remaining lease term |
| 8.87 | years |
|
| 10.72 | years |
|
| Weighted-average discount rate |
| 6.99 | % |
|
| 7.18 | % |
|
|
|
|
|
|
|
|
|
|
|
(1)Operating ROU assets are included in Other assets on our consolidated balance sheet.
(2)Finance ROU assets are included in Property, plant, and equipment on our consolidated balance sheets.
(3)This amount represents $43 million and $161 million, and $41 million and $154 million, included in other current liabilities and other liabilities, respectively, on our December 31, 2024 and 2023 consolidated balance sheets.
(4)This amount represents $46 million and $223 million, and $28 million and $181 million, included in other current liabilities and other liabilities, respectively, on our December 31, 2024 and 2023 consolidated balance sheets.
Supplemental cash flow information related to leases is as follows:
|
|
|
|
|
|
|
|
|
|
|
|
| For the year ended |
| For the year ended |
| For the year ended |
|
|
| December 31, |
| December 31, |
| December 31, |
|
| ($ in millions) | 2024 |
| 2023 |
| 2022 |
|
|
|
|
|
|
|
|
|
|
|
|
| Cash paid for amount included in the measurement of lease liabilities, net of amounts received as revenue: |
|
|
|
|
|
|
|
|
|
| Operating cash flows provided by operating leases | $ | 52 |
| $ | 62 |
| $ | 63 |
|
| Operating cash flows used by operating leases | $ | (57) |
| $ | (61) |
| $ | (62) |
|
| Operating cash flows used by finance leases | $ | (23) |
| $ | (15) |
| $ | (9) |
|
| Financing cash flows used by finance leases | $ | (31) |
| $ | (25) |
| $ | (19) |
|
|
|
|
|
|
|
|
|
|
|
|
| Right-of-use assets obtained in exchange for lease liabilities: |
|
|
|
|
|
|
|
|
|
| Operating leases | $ | 45 |
| $ | 36 |
| $ | 44 |
|
| Finance leases | $ | 89 |
| $ | 60 |
| $ | 4 |
|
|
|
|
|
|
|
|
|
|
|
|
Lessee
For lessee agreements, we elected to apply the short-term lease recognition exemption for all leases that qualify and as such, does not recognize assets or liabilities for leases with terms of less than twelve months, including existing leases at transition. We elected not to separate lease and non-lease components.
We have operating and finance leases for administrative and network properties, vehicles, and certain equipment. Our leases have remaining lease terms of 1 year to 83 years, some of which include options to extend the leases, and some of which include options to terminate the leases within 1 year.
The following represents a maturity analysis for our operating and finance lease liabilities as of December 31, 2024:
|
|
|
|
|
|
|
|
|
|
|
|
|
|
|
|
|
|
| Operating |
|
| Finance |
|
| ($ in millions) |
| Leases |
|
| Leases |
|
| Future maturities: |
|
|
|
|
|
|
| 2025 | $ | 42 |
| $ | 53 |
|
| 2026 |
| 38 |
|
| 51 |
|
| 2027 |
| 34 |
|
| 46 |
|
| 2028 |
| 31 |
|
| 40 |
|
| 2029 |
| 25 |
|
| 26 |
|
| Thereafter |
| 62 |
|
| 106 |
|
| Total lease payments |
| 232 |
|
| 322 |
|
| Less: imputed interest |
| (28) |
|
| (53) |
|
| Present value of lease liabilities | $ | 204 |
| $ | 269 |
|
|
|
|
|
|
|
|
|
Lessor
We are the lessor for operating leases of towers, datacenters, corporate offices, and certain equipment. Our leases have remaining lease terms of 1 year to 62 years, some of which include options to extend the leases, and some of which include options to terminate the leases within 1 year. None of these leases include options for our lessees to purchase the underlying asset.
A significant number of our service contracts with our customers include equipment rentals. We have elected to apply the practical expedient to account for those associated equipment rentals and services as a single, combined component. We have evaluated the service component to be ‘predominant’ in these contracts and have accounted for the combined component as a single performance obligation under ASC 606.
We, as a lessor, recognized revenue of $52 million, $62 million and $63 million for the year ended December 31, 2024, 2023 and 2022, respectively.
The following represents a maturity analysis for our future operating lease payments from customers as of December 31, 2024:
|
|
|
|
|
|
|
|
|
|
|
| Operating |
|
| ($ in millions) | Lease Payments |
|
| Future maturities of lease payments from customers: |
|
|
|
| 2025 | $ | 10 |
|
| 2026 |
| 10 |
|
| 2027 |
| 10 |
|
| 2028 |
| 9 |
|
| 2029 |
| 7 |
|
| Thereafter |
| 1 |
|
| Total lease payments from customers | $ | 47 |
|
|
|
|
|
|
(11) Investment and Other Income, Net:
The components of investment and other income, net are as follows:
|
|
|
|
|
|
|
|
|
|
|
|
|
|
|
|
|
|
|
|
|
|
|
|
| For the year ended |
| For the year ended |
| For the year ended |
|
|
| December 31, |
| December 31, |
| December 31, |
| ($ in millions) |
| 2024 |
| 2023 |
| 2022 |
|
|
|
|
|
|
|
|
|
|
|
| Interest and dividend income |
| $ | 80 |
| $ | 87 |
| $ | 42 |
| Pension benefit |
|
| 38 |
|
| 19 |
|
| 75 |
| OPEB costs |
|
| (3) |
|
| (9) |
|
| (18) |
| OPEB remeasurement (loss) gain |
|
| 35 |
|
| (3) |
|
| 248 |
| Pension remeasurement (loss) gain |
|
| (45) |
|
| 202 |
|
| 218 |
| All other, net |
|
| - |
|
| (18) |
|
| (11) |
| Total investment and other income, net |
| $ | 105 |
| $ | 278 |
| $ | 554 |
|
|
|
|
|
|
|
|
|
|
|
During 2024, Frontier remeasured its pension plan and postretirement benefit plan obligations, resulting in remeasurement loss of $45 million and a remeasurement gain of $35 million, respectively, for the year ended December 31, 2024. The
pension remeasurement loss was primarily a result of the demographic updates, interest rate related assumptions and the actual return on assets, offset by the discount rate change. The OPEB remeasurement gain was primarily a result of the discount rate change. Refer to Note 18 for further details.
During 2023, we amended the medical coverage for certain postretirement benefit plans, which resulted in remeasurement loses of $3 million, primarily due to discount rate changes. For the pension plan, we had a remeasurement gain of $202 million, primarily due to strong investment performance during 2023.
During 2022, we recorded an actuarial gain of $248 million as a result of remeasurements due to amendments in the medical coverage for certain postretirement benefit plans, discount rate changes, as well as regular period end remeasurements. As a result of pension settlement charges incurred during 2023, we had a remeasurement gain of $218 million, which included period end remeasurement.
Pension and OPEB benefit (cost) consists of interest costs, expected return on plan assets, amortization of prior service (costs) and recognition of actuarial (gain) loss. Service cost components of pension and OPEB benefit costs are included in “Selling, general, and administrative expenses” on our consolidated statements of operations.
(12) Capital Stock:
Our authorized capital stock consists of 1,750 million shares of common stock, par value $0.01 per share and 50 million shares of preferred stock, par value $0.01 per share. As of December 31, 2024, approximately 250 million shares of common stock were issued and outstanding and no shares of preferred stock were issued and outstanding.
(13) Stock Plans:
Frontier Communications Parent, Inc. has one active long-term incentive plan, the 2024 Management Incentive Plan (the “2024 Incentive Plan”), under which grants are made and awards remain outstanding. The plan was approved by shareholders at the Annual Meeting on May 15, 2024, with 8,765,000 shares available for awards. The 2024 Incentive Plan permits stock-based awards to be made to employees, directors, or consultants of the Company or its affiliates, as determined by the Compensation and Human Capital Committee of the Board. Available shares under the previous plan of 1,151,334 were rolled into the new 2024 plan for a total of 9,916,334 shares reserved for issuance. Equity awards have been issued in the form of time-based restricted stock units (RSUs) and performance-based stock units (PSUs). As of December 31, 2024, there were 10,130,566 shares available to grant.
In connection with the Merger, our Named Executive Officers (“NEOs”) may become entitled to payments and benefits that may be treated as “excess parachute payments”. To mitigate the potential impact of certain applicable tax provisions on the Company and certain NEOs, on December 19, 2024, in accordance with the terms of the Merger Agreement, the Committee approved the acceleration into December 2024 of the vesting and payments of target annual cash incentive bonuses, time-based RSUs and PSUs that would otherwise have been payable to the NEOs in the ordinary course in the first quarter of fiscal year 2025. These actions are intended to benefit the Company by preserving compensation-related corporate income tax deductions for the Company that otherwise might be disallowed by such tax provisions and to mitigate or eliminate the amount of excise tax that may be payable by the NEOs pursuant to such tax provisions.
Restricted Stock Units
The following summary presents information regarding unvested restricted stock under the 2024 Incentive Plan:
|
|
|
|
|
|
|
|
|
|
|
| 2021 Incentive Plan |
|
|
|
|
|
| Weighted |
|
|
|
|
|
|
|
|
| Average |
|
|
|
|
|
|
| Number of |
| Grant Date |
| Aggregate |
|
|
|
| Shares |
| Fair Value |
| Fair Value |
|
|
|
| (in thousands) |
| (per share) |
| (in millions) |
|
| Balance at January 1, 2022 |
| 2,483 |
| $ | 28.67 |
| $ | 72 |
|
| Restricted stock granted |
| 1,104 |
| $ | 25.80 |
| $ | 28 |
|
| Restricted stock vested |
| (892) |
| $ | 25.81 |
| $ | (23) |
|
| Restricted stock forfeited |
| (181) |
| $ | 25.88 |
|
|
|
|
| Balance at December 31, 2022 |
| 2,514 |
| $ | 25.78 |
| $ | 64 |
|
| Restricted stock granted |
| 1,373 |
| $ | 23.11 |
| $ | 35 |
|
| Restricted stock vested |
| (1,225) |
| $ | 25.77 |
| $ | (31) |
|
| Restricted stock forfeited |
| (194) |
| $ | 24.97 |
|
|
|
|
| Balance at December 31, 2023 |
| 2,468 |
| $ | 24.37 |
| $ | 63 |
|
|
|
|
|
|
|
|
|
|
|
|
| 2024 Incentive Plan |
|
|
|
|
|
| Weighted |
|
|
|
|
|
|
|
|
| Average |
|
|
|
|
|
|
| Number of |
| Grant Date |
| Aggregate |
|
|
|
| Shares |
| Fair Value |
| Fair Value |
|
|
|
| (in thousands) |
| (per share) |
| (in millions) |
|
| Balance at January 1, 2024 |
| 2,468 |
| $ | 24.37 |
| $ | 63 |
|
| Restricted stock granted |
| 1,370 |
| $ | 23.49 |
| $ | 48 |
|
| Restricted stock vested |
| (1,686) |
| $ | 25.70 |
| $ | (59) |
|
| Restricted stock forfeited |
| (94) |
| $ | 23.71 |
|
|
|
|
| Balance at December 31, 2024 |
| 2,058 |
| $ | 24.45 |
| $ | 71 |
|
|
|
|
|
|
|
|
|
|
|
|
For purposes of determining compensation expense, the fair value of each restricted stock grant is estimated based on the closing price of our common stock on the date of grant. The non-vested restricted stock units granted in 2022, 2023, and 2024 generally vest, and are expensed, on a ratable basis over three years from the grant date of the award. Total remaining unrecognized compensation cost associated with unvested restricted stock awards that is deferred at December 31, 2024 was $33 million and the weighted average vesting period over which this cost is expected to be recognized is approximately 2 years.
None of the restricted stock awards may be sold, assigned, pledged, or otherwise transferred, voluntarily or involuntarily, by the employees until the restrictions lapse, subject to limited exceptions. The restrictions are time-based. Compensation expense, recognized in “Selling, general, and administrative expenses”, of $34 million, $38 million and $34 million for the years ended
December 31, 2024, 2023 and 2022, respectively, has been recorded in connection with restricted stock.
Performance Stock Units
We currently have outstanding performance stock units (“PSU”) that were granted in 2022, 2023 and 2024. Under these awards, a target number of PSUs are granted to each participant with respect to a three-year performance period (“The Measurement Period”). For the 2024 PSU awards, for example, the Measurement Period is from January 1, 2024, through December 31, 2026.
The performance metrics under the 2024 PSU awards consist of (1) Adjusted Fiber EBITDA, (2) Fiber Revenue and (3) Relative Total Shareholder Return (“TSR”). Relative TSR is based on our total return to stockholders over the Measurement Period relative to the S&P 400 Mid Cap Index. Each performance metric is weighted 33.3%, the goals for the relative TSR metric have been fully set.
The performance metrics under the 2022 and 2023 PSU awards are (1) Adjusted Fiber EBITDA, (2) Fiber Locations Constructed and (3) Expansion Fiber Penetration with an overall relative TSR modifier. Each performance metric is weighted 33.3% and goals for each metric have been set for the full Measurement Period.
Achievement of the metrics for outstanding PSUs will be measured separately, and the number of awards earned will be determined based on actual performance relative to the targets of each performance metric. Achievement is measured on a cumulative basis for each performance metric individually at the end of the three-year Measurement Period with a TSR modifier for the 2022 and 2023 plans. The payout of the 2022, 2023 and 2024 PSUs can range from 0% to a maximum award payout of 200% of the target units.
The number of PSUs earned at the end of the Measurement Period may be more or less than the number of target PSUs granted as a result of performance. An executive must maintain a satisfactory performance rating during the Measurement Period and, except for limited circumstances, must be employed by Frontier on the determination date in order for the award to vest. The Compensation and Human Capital Committee will determine the number of shares earned for the Measurement Period in the first quarter of the year following the end of the Measurement Period. PSUs awards, to the extent earned, will be paid out in the form of common stock on a one-for-one basis.
Under ASC 718, Stock Based Compensation Expense, a grant date, and the fair value of a performance award are determined once the targets are finalized. For the 2022 and 2023 PSU awards, targets for all of the metrics have been fully set for each performance period and the related expense will be amortized over the appropriate performance period. For the 2024 PSU awards, the targets related to two of the three performance metrics have not been set. As a result, as of December 31, 2024, we have recognized associated expense with respect to 1/3 of the aggregate outstanding 2024 PSU awards.
The performance metrics under the 2024 PSU plan consist of (1) Adjusted Fiber EBITDA, (2) Fiber Revenue and (3) Relative Total Shareholder Return (“TSR”). Relative TSR is based on our total return to stockholders over the Measurement Period relative to the S&P 400 Mid Cap Index. The metrics under the 2022 and 2023 plans are (1) Adjusted Fiber EBITDA, (2) Fiber Locations Constructed and (3) Expansion Fiber Penetration with an overall relative TSR modifier. For 2022 and 2023 outstanding plans, each performance metric is weighted 33.3% and goals for each metric have been set for the full Measurement Period. For the 2024 outstanding plan, each performance metric is weighted 33.3%, the goals for the relative TSR metric have been fully set, and the goals for the remaining metrics have been set for the first portion of the Measurement Period. Achievement of the metrics will be measured separately, and the number of awards earned will be determined based on actual performance relative to the targets of each performance metric. Achievement is measured on a cumulative basis for each performance metric individually at the end of the three-year Measurement Period with a TSR modifier for the 2022 and 2023 plans. The payout of the 2022, 2023 and 2024 PSUs can range from 0% to a maximum award payout of 200% of the target units. 2021 PSU awards paid out at 126% of target on March 1, 2024.
The following summary presents information regarding performance shares and changes during the period with regard to performance shares awarded under the 2024 Incentive Plan:
|
|
|
|
|
|
|
|
| 2021 Incentive Plan |
|
|
|
|
|
|
| Weighted Average |
|
|
|
| Number of |
|
| Award Date |
|
|
|
| Shares |
|
| Fair Value |
|
|
|
| (in thousands) |
|
| (per share) (1) |
|
| Balance at January 1, 2022 |
| 3,144 |
| $ | 25.62 |
|
| Target performance shares awarded, net |
| 388 |
| $ | 25.66 (2) |
|
| Target performance shares forfeited |
| (47) |
|
|
|
|
| Balance at December 31, 2022 |
| 3,485 |
| $ | 25.62 |
|
| Target performance shares awarded, net |
| 1,040 |
| $ | 24.36 |
|
| Target performance shares forfeited |
| (38) |
|
|
|
|
| Balance at December 31, 2023 |
| 4,487 |
| $ | 25.33 |
|
|
|
|
|
|
|
|
|
| (1) Represents the weighted average of the closing price of our stock on the date of the awards. |
|
| (2) Approximately 0.2 million shares included in this award were granted in 2022 with a grant date fair value of $26.81 per share. Approximately 0.2 million shares have been granted as of December 31, 2023 with a grant date fair value of $23.95 per share. |
|
|
|
|
|
|
|
|
|
| 2024 Incentive Plan |
|
|
|
|
|
|
| Weighted Average |
|
|
|
| Number of |
|
| Award Date |
|
|
|
| Shares |
|
| Fair Value |
|
|
|
| (in thousands) |
|
| (per share) (1) |
|
| Balance at January 1, 2024 |
| 4,487 |
| $ | 25.33 |
|
| Target performance shares awarded, net (2) |
| 1,769 |
| $ | 24.35 |
|
| Target performance shares vested or converted (3) |
| (4,692) |
| $ | 25.76 |
|
| Target performance shares forfeited |
| (12) |
| $ | 25.12 |
|
| Balance at December 31, 2024 |
| 1,552 |
| $ | 24.58 |
|
|
|
|
|
|
|
|
|
| (1) Represents the weighted average of the closing price of our stock on the date of the awards. |
|
| (2) Approximately 0.3 million shares included in this award were granted in 2024 with a grant date fair value of $33.35 per share. Approximately 0.6 million shares in this award relate to performance measures that have not been set and therefore do not yet have a grant date fair value. |
|
| (3) Includes approximately 501,000 PSU's converting our CEO’s 2023-2025 PSUs into performance-based restricted stock subject to identical performance and service vesting conditions. No impact to accounting treatment. |
|
For purposes of determining compensation expense, the fair value of each performance share grant is estimated based on the closing price of a share of our common stock on the date of the grant, adjusted to reflect the fair value of the relative TSR modifier. In 2024, 2023 and 2022, we recognized net compensation expense, reflected in “Selling, general, and administrative expenses,” of $32 million, $69 million and $47 million, respectively related PSU awards.
Non-Employee Director Equity Compensation
Non-employee directors receive $250,000 of annual core compensation which includes $150,000 of RSUs granted annually. In each of 2024, 2023 and 2022, we recognized $1 million in stock-based compensation expense related to non-employee director units.
(14) Income Taxes:
The following is a reconciliation of the provision for income taxes computed at the federal statutory rate to income taxes computed at the effective rates:
|
|
|
|
|
|
|
|
|
|
|
|
|
|
|
|
|
|
|
|
|
|
|
|
|
|
| For the year ended |
| For the year ended |
| For the year ended |
|
|
|
| ended December 31, |
| December 31, |
| December 31, |
|
|
|
| 2024 |
| 2023 |
| 2022 |
|
|
|
|
|
|
|
|
|
|
|
|
|
| Consolidated tax provision at federal statutory rate |
| 21.0 | % |
| 21.0 | % |
| 21.0 | % |
|
| State income tax provisions, net of federal income tax benefit |
| (10.5) |
|
| 13.7 |
|
| 4.8 |
|
|
| Tax reserve adjustment |
| - |
|
| - |
|
| 0.6 |
|
|
| Changes in certain deferred tax balances |
| 0.4 |
|
| 23.4 |
|
| (0.5) |
|
|
| Nondeductible transaction costs |
| (1.5) |
|
| - |
|
| - |
|
|
| Nondeductible Executive Compensation under Sec. 162(m) |
| (2.6) |
|
| 12.2 |
|
| 2.0 |
|
|
| Sec. 162(f) nondeductible penalties |
| (0.3) |
|
| 3.1 |
|
| 0.3 |
|
|
| All other, net |
| 0.5 |
|
| 1.9 |
|
| (1.8) |
|
|
| Effective tax rate |
| 7.0 | % |
| 75.3 | % |
| 26.4 | % |
|
|
|
|
|
|
|
|
|
|
|
|
|
Other Tax Items
In 2024, we had net federal and state income tax refunds totaling $10 million. In 2023, we paid net zero federal and state income tax. In 2022, we paid net federal and state income tax totaling $8 million.
The components of the net deferred income tax liability (asset) are as follows:
|
|
|
|
|
|
|
|
|
|
|
|
|
|
|
|
|
|
|
|
|
| December 31, |
|
| December 31, |
|
| ($ in millions) |
|
| 2024 |
|
| 2023 |
|
|
|
|
|
|
|
|
|
|
| Deferred income tax liabilities: |
|
|
|
|
|
|
|
| Property, plant, and equipment basis differences |
| $ | 1,753 |
| $ | 1,342 |
|
| Intangibles |
|
| 94 |
|
| 184 |
|
| Deferred revenue/expense |
|
| (7) |
|
| (8) |
|
| Other, net |
|
| 48 |
|
| 45 |
|
|
|
| $ | 1,888 |
| $ | 1,563 |
|
|
|
|
|
|
|
|
|
|
| Deferred income tax assets: |
|
|
|
|
|
|
|
| Pension liability |
| $ | 26 |
| $ | 48 |
|
| Tax operating loss carryforward |
|
| 705 |
|
| 476 |
|
| Employee benefits |
|
| 75 |
|
| 83 |
|
| Interest expense deduction |
|
|
|
|
|
|
|
| limitation carryforward |
|
| 468 |
|
| 260 |
|
| Accrued expenses |
|
| 84 |
|
| 80 |
|
| Lease obligations |
|
| 131 |
|
| 111 |
|
| Tax credit |
|
| 45 |
|
| 32 |
|
| Allowance for doubtful accounts |
|
| 16 |
|
| 11 |
|
| Other, net |
|
| (28) |
|
| (1) |
|
|
|
|
| 1,522 |
|
| 1,100 |
|
| Less: Valuation allowance |
|
| (243) |
|
| (180) |
|
| Net deferred income tax asset |
|
| 1,279 |
|
| 920 |
|
| Net deferred income tax liability |
| $ | 609 |
| $ | 643 |
|
|
|
|
|
|
|
|
|
|
Our federal net operating loss carryforward as of December 31, 2024, is estimated at $2.1 billion gross (tax effected $443 million). Some of the federal loss carryforward will begin to expire between 2036 and 2037, with $1,768 million gross (tax effected $371 million) carrying forward indefinitely, unless otherwise used.
Our state tax operating loss carryforward as of December 31, 2024, is estimated at $4.4 billion. A portion of our state loss carryforward will continue to expire annually through 2042, unless otherwise used.
Our federal research and development credit as of December 31, 2024, is estimated at $14 million. The federal research and development credit will begin to expire after 2041, unless otherwise used.
Our various state credits as of December 31, 2024, are estimated at $48 million. The state credits will begin to expire after 2024, unless otherwise used.
We considered positive and negative evidence in regard to evaluating certain deferred tax assets during 2024, including the development of recent years of pre-tax book losses. On the basis of this evaluation, a valuation allowance of $308 million tax effected ($243 million net of federal benefit) was recorded as of December 31, 2024.
This valuation allowance is related to state net operating losses, state tax credits, and the state impact from the federal limitation on interest expense deduction. In evaluating our ability to realize our deferred tax assets, management considers whether it is more likely than not that some or all of the deferred tax assets will not be realized. Management also considered the projected reversal of deferred tax liabilities in making this assessment. Based upon this assessment, management believes it is more likely than not we will realize the benefits of these deductible differences, net of valuation allowance.
The provision (benefit) for federal and state income taxes, as well as the taxes charged or credited to equity of Frontier, includes amounts both payable currently and deferred for payment in future periods as indicated below:
|
|
|
|
|
|
|
|
|
|
|
|
|
|
|
|
|
|
|
|
|
|
|
| For the year ended |
| For the year ended |
| For the year ended |
|
|
| December 31, |
| December 31, |
| December 31, |
|
| ($ in millions) | 2024 |
| 2023 |
| 2022 |
|
|
|
|
|
|
|
|
|
|
|
|
| Income tax expense (benefit): |
|
|
|
|
|
|
|
|
|
| Current: |
|
|
|
|
|
|
|
|
|
| Federal | $ | - |
| $ | - |
| $ | - |
|
| State |
| 4 |
|
| 10 |
|
| (7) |
|
| Total Current |
| 4 |
|
| 10 |
|
| (7) |
|
|
|
|
|
|
|
|
|
|
|
|
| Deferred: |
|
|
|
|
|
|
|
|
|
| Federal |
| (69) |
|
| 58 |
|
| 125 |
|
| State |
| 41 |
|
| 20 |
|
| 40 |
|
| Total Deferred |
| (28) |
|
| 78 |
|
| 165 |
|
| Total income tax expense (benefit) |
| (24) |
|
| 88 |
|
| 158 |
|
|
|
|
|
|
|
|
|
|
|
|
| Income taxes charged (credited) to equity of Frontier: |
|
|
|
|
|
|
|
|
|
| Deferred income taxes (benefits) arising from the recognition of additional pension/OPEB liability |
| (6) |
|
| 6 |
|
| 8 |
|
|
|
|
|
|
|
|
|
|
|
|
| Total income taxes charged (credited) to equity of Frontier |
| - |
|
| - |
|
| - |
|
| Total income tax expense (benefit) | $ | (30) |
| $ | 94 |
| $ | 166 |
|
|
|
|
|
|
|
|
|
|
|
|
U.S. GAAP requires applying a “more likely than not” threshold to the recognition and derecognition of uncertain tax positions either taken or expected to be taken in our income tax returns. The total amount of our gross tax liability for tax positions that may not be sustained under a “more likely than not” threshold amounts to $7 million as of December 31, 2024, including immaterial interest. The amount of our uncertain tax positions, for which it is reasonably possible that the total amounts of unrecognized tax benefits will significantly increase or decrease during the next twelve months, would not have a material impact on our effective tax rate as of December 31, 2024.
Our policy regarding the classification of interest and penalties is to include these amounts as a component of income tax expense. This treatment of interest and penalties is consistent with prior periods. We are subject to income tax examinations generally for the years 2019 forward for federal and 2016 forward for state filing jurisdictions. We also maintain uncertain tax positions in various state jurisdictions.
The following table sets forth the changes in our balance of unrecognized tax benefits:
|
|
|
|
|
|
|
|
|
|
|
|
|
|
|
|
|
|
|
|
|
|
| ($ in millions) |
| December 31, |
| December 31, |
| December 31, |
|
|
| 2024 |
| 2023 |
| 2022 |
| |
|
|
|
|
|
|
|
|
|
| Unrecognized tax benefits - beginning of period |
| $ | 5 |
| $ | 5 |
| $ | 1 |
| Gross decreases - prior period tax positions |
|
| - |
|
| (1) |
|
| - |
| Gross increases (decrease) - current period tax positions |
|
| 2 |
|
| 1 |
|
| 4 |
| Unrecognized tax benefits - end of period |
| $ | 7 |
| $ | 5 |
| $ | 5 |
|
|
|
|
|
|
|
|
|
|
|
(15) Net (Loss) Income Per Common Share:
The reconciliation of the net (loss) income per common share calculation is as follows:
|
|
|
|
|
|
|
|
|
|
|
|
|
|
|
|
|
|
|
|
|
|
|
|
|
| For the year ended |
| For the year ended |
| For the year ended |
|
| ($ in millions and shares in thousands, |
| December 31, |
| December 31, |
| December 31, |
|
| except per share amounts) |
| 2024 |
| 2023 |
| 2022 |
|
| Net (loss) income used for |
|
|
|
|
|
|
|
|
|
|
| basic and diluted earnings per share: |
|
|
|
|
|
|
|
|
|
|
| Net (loss) income attributable to Frontier common shareholders |
| $ | (322) |
| $ | 29 |
| $ | 441 |
|
| Less: Dividends paid on unvested restricted stock awards |
|
| - |
|
| - |
|
| - |
|
| Total basic net income attributable to |
|
|
|
|
|
|
|
|
|
|
| Frontier common shareholders |
| $ | (322) |
| $ | 29 |
| $ | 441 |
|
|
|
|
|
|
|
|
|
|
|
|
|
| Effect of loss related to dilutive stock units |
|
| - |
|
| - |
|
| - |
|
| Total diluted net (loss) income attributable to |
|
|
|
|
|
|
|
|
|
|
| Frontier common shareholders |
| $ | (322) |
| $ | 29 |
| $ | 441 |
|
|
|
|
|
|
|
|
|
|
|
|
|
| Basic earnings per share: |
|
|
|
|
|
|
|
|
|
|
| Total weighted average shares and |
|
|
|
|
|
|
|
|
|
|
| unvested restricted stock awards outstanding - basic |
|
| 248,184 |
|
| 245,517 |
|
| 244,781 |
|
| Less: Weighted average unvested restricted stock awards |
|
| - |
|
| - |
|
| - |
|
| Total weighted average shares outstanding - basic |
|
| 248,184 |
|
| 245,517 |
|
| 244,781 |
|
|
|
|
|
|
|
|
|
|
|
|
|
| Basic net (loss) income per share attributable |
|
|
|
|
|
|
|
|
|
|
| to Frontier common shareholders |
| $ | (1.30) |
| $ | 0.12 |
| $ | 1.80 |
|
|
|
|
|
|
|
|
|
|
|
|
|
| Diluted earnings per share: |
|
|
|
|
|
|
|
|
|
|
| Total weighted average shares outstanding - basic |
|
| 248,184 |
|
| 245,517 |
|
| 244,781 |
|
| Effect of dilutive units |
|
| - |
|
| 2,330 |
|
| - |
|
| Effect of dilutive restricted stock awards |
|
| - |
|
| 612 |
|
| 499 |
|
| Effect of dilutive performance stock awards |
|
| - |
|
| - |
|
| - |
|
| Total weighted average shares outstanding - diluted |
|
| 248,184 |
|
| 248,459 |
|
| 245,280 |
|
|
|
|
|
|
|
|
|
|
|
|
|
| Diluted net (loss) income per share attributable to Frontier common shareholders |
| $ | (1.30) |
| $ | 0.12 |
| $ | 1.80 |
|
|
|
|
|
|
|
|
|
|
|
|
|
In calculating diluted net loss common share for the years ended December 31, 2024, the effect of certain outstanding RSUs and PSUs has been excluded from the computation as the effect would be antidilutive. For the year ended December 31, 2024, RSUs of approximately 1,255,000 and PSUs including those converted to performance-based restricted stock of approximately 326,000, respectively have been excluded.
In calculating diluted net income per common share for the years ended December 31, 2023, and 2022, the effect of certain PSUs is excluded from the computation as the respective performance metrics have not been satisfied.
(16) Comprehensive Income:
Comprehensive income consists of net income and other gains and losses affecting shareholders’ equity and pension/postretirement benefit (OPEB) liabilities that, under GAAP, are excluded from net income (loss).
The components of accumulated other comprehensive income, net of tax, are as follows:
|
|
|
|
|
|
|
|
|
|
| ($ in millions) |
| OPEB Costs |
| Balance at December 31, 2021 (1) |
| $ | 60 |
| Other comprehensive income |
|
|
|
| before reclassifications |
|
| 30 |
| Amounts reclassified from accumulated other |
|
|
|
| comprehensive income to net income |
|
| (11) |
| Net current-period other comprehensive |
|
|
|
| income |
|
| 19 |
| Balance at December 31, 2022 (1) |
| $ | 79 |
| Other comprehensive income |
|
|
|
| before reclassifications |
|
| 34 |
| Amounts reclassified from accumulated other |
|
|
|
| comprehensive income to net income |
|
| (17) |
| Net current-period other comprehensive |
|
|
|
| income |
|
| 17 |
| Balance at December 31, 2023 (1) |
| $ | 96 |
| Other comprehensive income |
|
|
|
| before reclassifications |
|
| - |
| Amounts reclassified from accumulated other |
|
|
|
| comprehensive income to net income |
|
| (19) |
| Net current-period other comprehensive |
|
|
|
| income |
|
| (19) |
| Balance at December 31, 2024 (1) |
| $ | 77 |
|
|
|
|
|
(1)OPEB amounts are net of deferred tax balances of $23 million, $29 million, $23 million, and $15 million, as of December 31, 2024, 2023, 2022, and 2021, respectively.
The significant items reclassified from each component of accumulated other comprehensive loss are as follows:
|
|
|
|
|
|
|
|
|
|
|
|
|
|
|
|
|
|
|
|
|
|
|
|
|
|
|
|
|
|
| Amount Reclassified from Accumulated Other Comprehensive Loss (1) |
|
|
|
|
|
|
|
|
|
|
|
|
|
|
|
| Details about Accumulated Other |
| For the year ended |
| For the year ended |
| For the year ended |
| Affected line item in the |
|
| Comprehensive Loss Components |
| December 31, |
| December 31, |
| December 31, |
| statement where net |
|
| ($ in millions) |
| 2024 |
| 2023 |
| 2022 |
| income (loss) is presented |
|
| Amortization of OPEB Cost Items(2) |
|
|
|
|
|
|
|
|
|
|
|
|
| Prior-service credits (costs) |
| $ | 25 |
| $ | 22 |
| $ | 13 |
|
|
|
| Actuarial gains (losses) |
|
| - |
|
| - |
|
| - |
|
|
|
| Reclassifications, pretax |
|
| 25 |
|
| 22 |
|
| 13 |
| Income before income taxes |
|
| Tax impact |
|
| (6) |
|
| (5) |
|
| (2) |
| Income tax expense |
|
| Reclassifications, net of tax |
| $ | 19 |
| $ | 17 |
| $ | 11 |
| Net gain |
|
|
|
|
|
|
|
|
|
|
|
|
|
|
|
(1)Amounts in parentheses indicate losses.
(2)These accumulated other comprehensive loss components are included in the computation of net periodic pension and OPEB costs (see Note 18 - Retirement Plans for additional details).
(17) Segment Information:
Our operations are assessed and managed by our CEO, our chief operating decision maker, on a consolidated basis. The CEO assesses performance and allocates resources based on the consolidated results of operations. Under this organizational and reporting structure, the Company operates in a single operating segment and reports its financial results in accordance with ASU 2023-07, Segment Reporting (Topic 280), Improvements to Reportable Segment Disclosures. The Company has organized its expenses into the following categories to enhance transparency and align with the internal management review process:
Revenue generating departments – Includes costs directly associated with revenue producing activities, such as sales, commissions, video content costs, marketing, and production.
Operating departments – reflects expenses related to the core operations of the Company, including network operations, facility management, logistics, and service delivery.
Support departments – comprises general and administrative costs, including human resources, IT, finance, restructuring, and other back-office functions that support overall operations. Also includes transaction expenses related to the Verizon acquisition.
Depreciation and amortization – reflect the systematic allocation of the cost of tangible and intangible assets over their useful lives. This category includes depreciation of property, plant, and equipment as well as amortization of intangible assets, providing insight into the Company’s ongoing capital investments and asset utilization.
Investment and other income (expense) – includes interest income on cash and cash equivalents, realized and unrealized gains or losses on investments and other miscellaneous income or expenses.
Pension Settlement Costs – Includes non-recurring expenses related to the settlement of pension obligations, typically arising from lump-sum payments or annuity purchases made to reduce pension liabilities. These costs reflect the financial impact of actions taken to manage the Company's retirement benefit obligation.
Interest expense – represents costs associated with the Company’s financing arrangements, including interest on debt.
Income taxes – reflects the Company’s provision for income taxes in accordance with applicable tax regulations.
|
|
|
|
|
|
|
|
|
|
|
|
|
|
| For the year ended December 31, |
|
| ($ in millions) |
|
| 2024 |
|
| 2023 |
|
| 2022 |
|
|
|
|
|
|
|
|
|
|
|
|
|
| Revenue |
| $ | 5,937 |
| $ | 5,751 |
| $ | 5,787 |
|
| Less: |
|
|
|
|
|
|
|
|
|
|
| Revenue generating departments |
|
| 1,062 |
|
| 989 |
|
| 1,045 |
|
| Operating departments |
|
| 2,147 |
|
| 2,224 |
|
| 2,310 |
|
| Support departments |
|
| 750 |
|
| 631 |
|
| 658 |
|
| Depreciation and amortization |
|
| 1,625 |
|
| 1,415 |
|
| 1,182 |
|
| Investment and other income |
|
| 105 |
|
| 278 |
|
| 554 |
|
| Pension Settlement Costs |
|
| - |
|
| - |
|
| (55) |
|
| Interest expense |
|
| (804) |
|
| (653) |
|
| (492) |
|
| Income tax expense (benefit) |
|
| (24) |
|
| 88 |
|
| 158 |
|
| Net (loss) income |
| $ | (322) |
| $ | 29 |
| $ | 441 |
|
|
|
|
|
|
|
|
|
|
|
|
|
(18) Retirement Plans:
We sponsor a noncontributory defined benefit pension plan covering a significant number of our former and current employees and other postretirement benefit plans that provide medical, dental, life insurance and other benefits for covered retired employees and their beneficiaries and covered dependents. The pension plan and postretirement benefit plans are closed to the majority of our newly hired employees. The benefits are based on years of service and final average pay or career average pay. Contributions are made in amounts sufficient to meet ERISA funding requirements while considering tax deductibility. Plan assets are invested in a diversified portfolio of equity and fixed-income securities and alternative investments.
The accounting results for pension and other postretirement benefit costs and obligations are dependent upon various actuarial assumptions applied in the determination of such amounts. These actuarial assumptions include the following: discount rates, expected long-term rate of return on plan assets, future compensation increases, employee turnover, healthcare cost trend rates, expected retirement age, optional form of benefit and mortality. We review these assumptions for changes on an interim and annual basis with our independent actuaries. We consider our discount rate and expected long-term rate of return on plan assets to be our most critical assumptions.
The discount rate is used to value, on a present value basis, our pension and other postretirement benefit obligations as of the balance sheet date. The same rate is also used in the interest cost component of the pension and postretirement benefit cost determination for the following year. The measurement date used in the selection of our discount rate is the balance sheet date. Our discount rate assumption is determined annually with assistance from our independent actuaries based on the pattern of expected future benefit payments and the prevailing rates available on long-term, high quality corporate bonds that approximate the benefit obligation.
As of December 31, 2024, 2023 and 2022, we utilized an estimation technique that is based upon a settlement model (Bond:Link) that permits us to closely match cash flows to the expected payments to participants. This rate can change from year-to-year based on market conditions that affect corporate bond yields.
As a result of the technique described above, we are utilizing a discount rate of 5.60% as of December 31, 2024 for our qualified pension plan, compared to rates of 5.20% and 5.50% in 2023 and 2022, respectively. The discount rate for postretirement plans as of December 31, 2024 was 5.70% compared to 5.20% in 2023 and 5.50% in 2022.
The expected long-term rate of return on plan assets is applied in the determination of periodic pension and postretirement benefit cost as a reduction in the computation of the expense. In developing the expected long-term rate of return assumption, we considered published surveys of expected market returns, 10 and 20 year actual returns of various major indices, and our own historical 5 year, 10 year and 20 year investment returns. The expected long-term rate of return on plan assets is based on an asset allocation assumption of 65% in long-duration fixed income securities, and 35% in equity securities and other investments. We review our asset allocation at least annually and make changes when considered appropriate. Our pension asset investment allocation decisions are made by the Retirement Investment & Administration Committee (RIAC), a committee comprised of members of management, pursuant to a delegation of authority by the Board of Directors. Asset allocation decisions take into account expected market return assumptions of various asset classes as well as expected pension benefit payment streams. When analyzing anticipated benefit payments, management considers both the absolute amount of the payments as well as the timing of such payments. Our expected long-term rate of return on plan assets was 7.50% in 2023 and 2022. For the period January 1, 2024 – September 30, 2024, our expected long-term rate of return on plan assets was 7.50%. For the period October 1, 2024 to December 31, 2024, our expected long-term rate of return on plan assets was 6.65%. Our actual return on plan assets for the year ended December 31, 2024, was a gain of 5%, for the year ended December 31, 2023, was a gain of 15% and for the year ended December 31, 2022, was a loss of 20%. For 2025, we expect to assume a rate of return of 6.65%. Our pension plan assets are valued at fair value as of the measurement date.
During 2024, we capitalized $18 million of pension and OPEB expense into the cost of our capital expenditures as the costs relate to our engineering and plant construction activities. During 2023, and 2022, we capitalized $18 million and $21 million of pension and OPEB expense into the cost of our capital expenditures, respectively.
Pension Benefits
The following tables set forth the pension plan’s projected benefit obligations, fair values of plan assets and the pension benefit liability recognized on our consolidated balance sheets at the end of each period, and the components of total pension benefit cost for each period:
|
|
|
|
|
|
|
|
|
|
|
|
|
|
|
|
|
|
|
|
| For the year ended |
| For the year ended |
|
|
|
| December 31, |
| December 31, |
|
| ($ in millions) |
| 2024 |
| 2023 |
|
|
|
|
|
|
|
|
|
|
| Change in projected benefit obligation (PBO) |
|
|
|
|
|
|
|
| PBO at the beginning of the period |
| $ | 2,442 |
| $ | 2,510 |
|
| Service cost |
|
| 47 |
|
| 51 |
|
| Interest cost |
|
| 126 |
|
| 129 |
|
| Actuarial gain |
|
| (5) |
|
| (44) |
|
| Benefits paid |
|
| (187) |
|
| (204) |
|
| Special/contractual termination benefits |
|
| 12 |
|
| - |
|
| PBO at the end of the period |
| $ | 2,435 |
| $ | 2,442 |
|
|
|
|
|
|
|
|
|
|
| Change in plan assets |
|
|
|
|
|
|
|
| Fair value of plan assets at the beginning of the period |
| $ | 2,268 |
| $ | 2,033 |
|
| Actual return on plan assets, net of expenses |
|
| 114 |
|
| 305 |
|
| Employer contributions |
|
| 133 |
|
| 134 |
|
| Benefits paid |
|
| (187) |
|
| (204) |
|
| Fair value of plan assets at the end of the period |
| $ | 2,328 |
| $ | 2,268 |
|
|
|
|
|
|
|
|
|
|
| Funded status |
| $ | (107) |
| $ | (174) |
|
|
|
|
|
|
|
|
|
|
| Amounts recognized in the consolidated balance sheet |
|
|
|
|
|
|
|
| Pension and other postretirement benefits - current |
| $ | - |
| $ | - |
|
| Pension and other postretirement benefits - noncurrent |
| $ | (107) |
| $ | (174) |
|
| Accumulated other comprehensive loss |
| $ | - |
| $ | - |
|
|
|
|
|
|
|
|
|
|
|
|
|
|
|
|
|
|
|
|
|
|
|
|
|
|
|
|
|
|
|
|
|
|
| For the year ended |
| For the year ended |
| For the year ended |
|
|
| December 31, |
| December 31, |
| December 31, |
| ($ in millions) |
| 2024 |
| 2023 |
| 2022 |
|
|
|
|
|
|
|
|
|
|
|
| Components of total pension benefit cost (income) |
|
|
|
|
|
|
|
|
|
| Service cost |
| $ | 47 |
| $ | 51 |
| $ | 69 |
| Interest cost on projected benefit obligation |
|
| 126 |
|
| 129 |
|
| 106 |
| Expected return on plan assets |
|
| (164) |
|
| (148) |
|
| (181) |
| (Gain) / Loss recognized |
|
| 45 |
|
| (202) |
|
| (218) |
| Net periodic pension benefit cost (income) |
|
| 54 |
|
| (170) |
|
| (224) |
| Pension settlement costs |
|
| - |
|
| - |
|
| 55 |
| Special/contractual termination benefits |
|
| 12 |
|
| - |
|
| - |
| Total pension benefit cost (income) |
| $ | 66 |
| $ | (170) |
| $ | (169) |
|
|
|
|
|
|
|
|
|
|
|
The pension plan contains provisions that provide certain employees with the option of receiving a lump sum payment upon retirement. These payments are recorded as a settlement only if, in the aggregate, they exceed the sum of the annual service and interest costs for the Pension Plan’s net periodic pension benefit cost.
During 2024, lump sum pension payments to terminated or retired individuals amounted to $108 million. As we did not exceed the settlement threshold of $173 million, we did not recognize any non-cash settlement charges for 2024. As of December 31, 2024, the pension plan was funded at 96%.
As a result of special termination benefit enhancements related to a voluntary separation plan, Frontier remeasured its pension plan obligations, resulting in a remeasurement loss of $45 million, of which $38 million relates to special termination benefits, for the year ended December 31, 2024. The Company’s accounting policy is to recognize actuarial gains and losses in the period in which they occur. As such, this loss was recorded in “Investment and other income, net” on our consolidated statements of operations.
During 2023, lump sum pension payments to terminated or retired individuals amounted to $129 million. As we did not exceed the settlement threshold of $180 million, we did not recognize any non-cash settlement charges for 2023.
During 2023, we had actuarial gains of $44 million, driven by favorable lump sum conversion interest rates and cash balance interest crediting rates and updated census data to January 1, 2023, offset by a decrease of 30 basis points in the discount rate. The Company’s accounting policy is to recognize actuarial gains and losses in the period in which they occur. As such, this gain was recorded in “Investment and other income, net” on our consolidated statements of operations.
During 2022, lump sum pension settlement payments to terminated or retired individuals amounted to $200 million, which exceeded the settlement threshold of $175 million, and as a result, we recognized non-cash settlement charges totaling $55 million during the period. During 2022, we had actuarial gains of $867 million, driven by an increase of 260 basis points in the discount rate, favorable lump sum annuity conversion interest rates and cash balance interest crediting rates, and updated census data to January 1, 2022. The Company’s accounting policy is to recognize actuarial gains and losses in the period in which they occur. As such, this gain was recorded in “Investment and other income, net” on our consolidated statements of operations.
The plan’s weighted average asset allocations at December 31, 2024 and 2023 by asset category are as follows:
|
|
|
|
|
|
|
|
|
|
|
|
|
|
|
|
|
|
|
|
| 2024 |
| 2023 |
|
| Asset category: |
|
|
|
|
|
|
|
| Equity securities |
| 26 | % |
| 49 | % |
|
| Debt securities |
| 62 | % |
| 40 | % |
|
| Alternative and other investments |
| 12 | % |
| 11 | % |
|
| Total |
| 100 | % |
| 100 | % |
|
|
|
|
|
|
|
|
|
|
The plan’s expected benefit payments over the next 10 years are as follows:
|
|
|
|
|
|
|
|
|
|
|
|
| ($ in millions) |
| Amount |
|
| |
|
|
|
|
| 2025 |
| $ | 256 |
|
| 2026 |
|
| 245 |
|
| 2027 |
|
| 240 |
|
| 2028 |
|
| 238 |
|
| 2029 |
|
| 233 |
|
| 2030-2034 |
|
| 1,074 |
|
| Total |
| $ | 2,286 |
|
|
|
|
|
|
|
We made pension plan contributions of $133 million and $134 million, in 2024 and 2023, respectively.
Assumptions used in the computation of annual pension costs and valuation of the beginning/end of period obligations were as follows:
|
|
|
|
|
|
|
|
|
|
|
|
|
|
|
|
|
|
|
|
|
|
|
|
| 12/31/2024 |
| 12/31/2023 |
| 12/31/2022 |
| Discount rate - used at period end to value obligation |
| 5.60 | % |
| 5.20 | % |
| 5.50 | % |
| Discount rate - used to compute annual cost |
| 5.00 - 5.80 | % |
| 5.50 | % |
| 2.90 - 5.60 | % |
| Expected long-term rate of return on plan assets |
| 7.50 - 6.65 | % |
| 7.50 | % |
| 7.50 | % |
| Rate of increase in compensation levels |
| 3.00 | % |
| 3.00 | % |
| 3.00 | % |
|
|
|
|
|
|
|
|
|
|
|
Postretirement Benefits Other Than Pensions - “OPEB”
The following tables set forth the OPEB plans’ benefit obligations, fair values of plan assets and the postretirement benefit liability recognized on our consolidated balance sheets as of December 31, 2024 and 2023 and the components of total postretirement benefit cost for the years ended December 31, 2024, 2023 and 2022.
|
|
|
|
|
|
|
|
|
|
|
|
|
|
|
|
|
|
|
|
| For the year ended |
| For the year ended |
|
|
|
| December 31, |
| December 31, |
|
| ($ in millions) |
| 2024 |
| 2023 |
|
|
|
|
|
|
|
|
|
|
| Change in benefit obligation |
|
|
|
|
|
|
|
| Benefit obligation at the beginning of the period |
| $ | 561 |
| $ | 606 |
|
| Service cost |
|
| 7 |
|
| 8 |
|
| Interest cost |
|
| 28 |
|
| 31 |
|
| Plan amendments |
|
| - |
|
| (45) |
|
| Plan participants' contributions |
|
| 10 |
|
| 11 |
|
| Actuarial (gain) loss |
|
| (35) |
|
| 3 |
|
| Benefits paid |
|
| (48) |
|
| (53) |
|
| Benefit obligation at the end of the period |
| $ | 523 |
| $ | 561 |
|
|
|
|
|
|
|
|
|
|
| Change in plan assets |
|
|
|
|
|
|
|
| Fair value of plan assets at the beginning of the period |
| $ | - |
| $ | - |
|
| Plan participants' contributions |
|
| 10 |
|
| 11 |
|
| Employer contribution |
|
| 38 |
|
| 42 |
|
| Benefits paid |
|
| (48) |
|
| (53) |
|
| Fair value of the plan assets at end of the period |
| $ | - |
| $ | - |
|
|
|
|
|
|
|
|
|
|
| Funded status |
| $ | (523) |
| $ | (561) |
|
|
|
|
|
|
|
|
|
|
| Amounts recognized in the consolidated balance sheet |
|
|
|
|
|
|
|
| Pension and other postretirement benefits - current |
| $ | (39) |
| $ | (38) |
|
| Pension and other postretirement benefits - noncurrent |
| $ | (484) |
| $ | (523) |
|
| Accumulated other comprehensive gain |
| $ | (100) |
| $ | (125) |
|
|
|
|
|
|
|
|
|
|
|
|
|
|
|
|
|
|
|
|
|
|
|
|
|
|
|
|
|
|
|
|
|
|
|
|
| For the year ended |
| For the year ended |
| For the year ended |
|
|
|
| December 31, |
| December 31, |
| December 31, |
|
| ($ in millions) |
| 2024 |
| 2023 |
| 2022 |
|
|
|
|
|
|
|
|
|
|
|
|
|
| Components of total postretirement benefit cost / (income) |
|
|
|
|
|
|
|
|
|
|
| Service cost |
| $ | 7 |
| $ | 8 |
| $ | 13 |
|
| Interest cost on projected benefit obligation |
|
| 28 |
|
| 31 |
|
| 31 |
|
| Amortization of prior service credit |
|
| (25) |
|
| (22) |
|
| (13) |
|
| (Gain) loss recognized |
|
| (35) |
|
| 3 |
|
| (248) |
|
| Total postretirement benefit cost / (income) |
| $ | (25) |
| $ | 20 |
| $ | (217) |
|
|
|
|
|
|
|
|
|
|
|
|
|
As a result of special termination benefit enhancements related to a voluntary separation plan, Frontier remeasured its postretirement benefit plan, resulting in a remeasurement gain of $35 million year ended December 31, 2024.
During 2023, we amended the medical coverage for certain postretirement benefit plans, which necessitated remeasurements of our OPEB obligations. These remeasurements along with the period end remeasurement resulted in the recognition of a net actuarial loss of $3 million, which was driven primarily from a higher assumed discount rate relative to the previous measurement dates, offset by updated census data to January 1, 2023. The Company’s accounting policy is to recognize actuarial gains and losses in the period in which they occur. As such, this loss was recorded in “Investment and other income, net” on our consolidated statements of operations. The remeasurements of our OPEB obligations during 2023 due to the amendments to the medical coverage for certain postretirement benefit plans also resulted in remeasurement of prior service credits of $45 million which were deferred in Accumulated comprehensive income as December 31, 2023.
During 2022, we amended the medical coverage for certain postretirement benefit plans, which necessitated remeasurements of our OPEB obligations. These remeasurements along with the period end remeasurement resulted in the recognition of a net actuarial gain of $248 million, which was driven primarily from a higher assumed discount rate relative to the previous measurement dates. The Company’s accounting policy is to recognize actuarial gains and losses in the period in which they occur. As such, this gain was recorded in “Investment and other income, net” on our consolidated statements of operations. The remeasurements of our OPEB obligations during 2022 due to the amendments to the medical coverage for certain postretirement benefit plans also resulted in remeasurement of prior service credits of $40 million which were deferred in Accumulated comprehensive income as December 31, 2022.
Assumptions used in the computation of annual OPEB costs and valuation of the beginning/end of period OPEB obligations were as follows:
|
|
|
|
|
|
|
|
|
|
|
|
|
|
|
|
|
|
| 12/31/2024 |
| 12/31/2023 |
| 12/31/2022 |
| Discount rate - used at period end to value obligation |
| 5.70% |
| 5.20% |
| 5.50% |
| Discount rate - used to compute annual cost |
| 5.00% - 5.80% |
| 5.00% - 6.40% |
| 3.00% - 5.60% |
|
|
|
|
|
|
|
|
The OPEB plan’s expected benefit payments over the next 10 years are as follows:
|
|
|
|
|
|
|
|
|
|
|
|
|
|
|
|
|
|
|
|
|
|
|
|
| ($ in millions) |
| Gross Benefit |
| Medicare Part D Subsidy |
| Total |
|
| |
|
|
|
|
|
|
|
|
|
|
| 2025 |
| $ | 40 |
| $ | - |
| $ | 40 |
|
| 2026 |
|
| 41 |
|
| - |
|
| 41 |
|
| 2027 |
|
| 42 |
|
| - |
|
| 42 |
|
| 2028 |
|
| 44 |
|
| - |
|
| 44 |
|
| 2029 |
|
| 45 |
|
| - |
|
| 45 |
|
| 2030-2034 |
|
| 235 |
|
| - |
|
| 235 |
|
| Total |
| $ | 447 |
| $ | - |
| $ | 447 |
|
|
|
|
|
|
|
|
|
|
|
|
|
For purposes of measuring year-end benefit obligations, we used, depending on medical plan coverage for different retiree groups, a 6.75% annual rate of increase in the per-capita cost of covered medical benefits, gradually decreasing to 4.75% in the year 2032 and remaining at that level thereafter.
The amounts in accumulated other comprehensive (income) loss before tax that have not yet been recognized as components of net periodic benefit cost at December 31, 2024 and 2023 are as follows:
|
|
|
|
|
|
|
|
|
|
|
|
|
|
|
|
|
|
|
|
| OPEB |
|
| ($ in millions) |
| 2024 |
| 2023 |
|
| Prior service cost (credit) |
| $ | (100) |
| $ | (125) |
|
|
|
|
|
|
|
|
|
|
The amounts recognized as a component of accumulated other comprehensive loss for the years ended December 31, 2024 and 2023 are as follows:
|
|
|
|
|
|
|
|
|
|
|
|
|
|
|
|
|
|
|
|
| For the year ended |
| For the year ended |
|
| OPEB |
| December 31, |
| December 31, |
|
| ($ in millions) |
| 2024 |
| 2023 |
|
|
|
|
|
|
|
|
|
|
| Accumulated other comprehensive loss (gain) at |
|
|
|
|
|
|
|
| the beginning of the period |
| $ | (125) |
| $ | (102) |
|
|
|
|
|
|
|
|
|
|
| Prior service (cost) credit amortized during the period |
|
| 25 |
|
| 22 |
|
| Prior service cost (credit) occurring during the period |
|
| - |
|
| (45) |
|
| Net amount recognized in comprehensive |
|
|
|
|
|
|
|
| loss for the period |
|
| 25 |
|
| (23) |
|
| Accumulated other comprehensive loss (gain) at |
|
|
|
|
|
|
|
| end of the period |
| $ | (100) |
| $ | (125) |
|
|
|
|
|
|
|
|
|
|
401(k) Savings Plans
We sponsor employee retirement savings plans under section 401(k) of the Internal Revenue Code. The plans cover substantially all full-time employees. Under certain plans, we provide matching contributions. Employer contributions were $38 million, $37 million and $38 million in 2024, 2023 and 2022, respectively.
(19) Fair Value of Financial Instruments:
Fair value is defined under GAAP as the exit price associated with the sale of an asset or transfer of a liability in an orderly transaction between market participants at the measurement date. Valuation techniques used to measure fair value under GAAP must maximize the use of observable inputs and minimize the use of unobservable inputs. In addition, GAAP establishes a three-tier fair value hierarchy, which prioritizes the inputs used in measuring fair value.
The three input levels in the hierarchy of fair value measurements are defined by the FASB generally as follows:
Input Level Description of Input
Level 1 Observable inputs such as quoted prices in active markets for identical assets.
Level 2 Inputs other than quoted prices in active markets that are either directly or indirectly observable.
Level 3 Unobservable inputs in which little or no market data exists.
The following tables represent our pension plan assets measured at fair value on a recurring basis as of December 31, 2024 and 2023:
|
|
|
|
|
|
|
|
|
|
|
|
|
|
|
|
|
|
|
|
|
|
|
|
|
|
|
|
|
|
|
|
| Fair Value Measurements at December 31, 2024 |
|
| ($ in millions) |
| Total |
| Level 1 |
| Level 2 |
| Level 3 |
|
| Cash and Cash Equivalents |
| $ | 127 |
| $ | 127 |
| $ | - |
| $ | - |
|
| Government Obligations |
|
| 394 |
|
| - |
|
| 394 |
|
| - |
|
| Equities |
|
| 2 |
|
| 2 |
|
| - |
|
| - |
|
| Interest in Limited Partnerships and |
|
|
|
|
|
|
|
|
|
|
|
|
|
| Limited Liability Companies |
|
| 161 |
|
| - |
|
| - |
|
| 161 |
|
| Commingled Funds |
|
| 1,596 |
|
| - |
|
| 1,596 |
|
| - |
|
| Total investments at fair value |
| $ | 2,280 |
| $ | 129 |
| $ | 1,990 |
| $ | 161 |
|
| Interest in Registered Investment Companies (1) |
|
| - |
|
|
|
|
|
|
|
|
|
|
| Interest in Limited Partnerships and |
|
|
|
|
|
|
|
|
|
|
|
|
|
| Limited Liability Companies (1) |
|
| 65 |
|
|
|
|
|
|
|
|
|
|
| Interest and Dividend Receivable |
|
| 2 |
|
|
|
|
|
|
|
|
|
|
| Due from Broker for Securities Sold |
|
| 14 |
|
|
|
|
|
|
|
|
|
|
| Value of Funds Held in Insurance Co. |
|
| 4 |
|
|
|
|
|
|
|
|
|
|
| Due to Broker for Securities Purchased |
|
| (37) |
|
|
|
|
|
|
|
|
|
|
| Total Plan Assets, at Fair Value |
| $ | 2,328 |
|
|
|
|
|
|
|
|
|
|
|
|
|
|
|
|
|
|
|
|
|
|
|
|
|
|
|
|
|
|
|
|
|
|
|
|
|
|
|
|
|
|
|
|
|
|
|
|
|
|
|
|
|
|
|
|
|
| Fair Value Measurements at December 31, 2023 |
|
| ($ in millions) |
| Total |
| Level 1 |
| Level 2 |
| Level 3 |
|
| Cash and Cash Equivalents |
| $ | 128 |
| $ | 128 |
| $ | - |
| $ | - |
|
| Government Obligations |
|
| 300 |
|
| - |
|
| 300 |
|
| - |
|
| Corporate and Other Obligations |
|
| 160 |
|
| - |
|
| 160 |
|
| - |
|
| Equities |
|
| 90 |
|
| 90 |
|
| - |
|
| - |
|
| Interest in Limited Partnerships and |
|
|
|
|
|
|
|
|
|
|
|
|
|
| Limited Liability Companies |
|
| 162 |
|
| - |
|
| - |
|
| 162 |
|
| Commingled Funds |
|
| 1,310 |
|
| - |
|
| 1,310 |
|
| - |
|
| Total investments at fair value |
| $ | 2,150 |
| $ | 218 |
| $ | 1,770 |
| $ | 162 |
|
| Interest in Registered Investment Companies (1) |
|
| 54 |
|
|
|
|
|
|
|
|
|
|
| Interest in Limited Partnerships and |
|
|
|
|
|
|
|
|
|
|
|
|
|
| Limited Liability Companies (1) |
|
| 81 |
|
|
|
|
|
|
|
|
|
|
| Interest and Dividend Receivable |
|
| 5 |
|
|
|
|
|
|
|
|
|
|
| Due from Broker for Securities Sold |
|
| 11 |
|
|
|
|
|
|
|
|
|
|
| Value of Funds Held in Insurance Co. |
|
| 5 |
|
|
|
|
|
|
|
|
|
|
| Due to Broker for Securities Purchased |
|
| (38) |
|
|
|
|
|
|
|
|
|
|
| Total Plan Assets, at Fair Value |
| $ | 2,268 |
|
|
|
|
|
|
|
|
|
|
(1)In accordance with Subtopic 820-10, certain investments that are measured at fair value using the net asset value per share (or its equivalent) practical expedient have not been classified in the fair value hierarchy. These balances are intended to permit reconciliation of the fair value hierarchy to the plan asset amounts presented in Note 18 - Retirement Plans.
The tables below set forth a summary of changes in the fair value of the Plan’s Level 3 assets for the years ended December 31, 2024 and 2023:
|
|
|
|
|
|
|
|
|
|
|
|
|
|
|
|
|
|
|
|
| Interest in Limited Partnerships and Limited Liability Companies |
|
| ($ in millions) |
| 2024 |
| 2023 |
|
| Balance at beginning of year |
| $ | 162 |
| $ | 156 |
|
| Realized gains |
|
| 15 |
|
| 13 |
|
| Unrealized (loss) gain |
|
| (1) |
|
| 6 |
|
| Purchases |
|
| - |
|
| - |
|
| Sales and distributions |
|
| (15) |
|
| (13) |
|
| Balance at end of year |
| $ | 161 |
| $ | 162 |
|
|
|
|
|
|
|
|
|
|
The following table provides further information regarding the redemption of the Plan’s Level 3 investments as well as information related to significant unobservable inputs and the range of values for those inputs for the Plan’s interest in certain limited partnerships and limited liability companies as of December 31, 2024:
|
|
|
|
|
|
|
|
|
|
|
|
|
|
|
|
|
|
|
|
|
|
|
|
|
|
|
|
|
|
|
|
|
|
| Liquidation |
| Capitalization |
|
| ($ in millions) |
| Fair Value |
| Period |
| Rate |
|
| Interest in Limited Partnerships and Limited Liability Companies (2) |
|
|
|
|
|
|
|
|
|
|
|
|
|
|
|
|
|
|
|
|
|
|
| 426 E. Casino Road, LLC (1) |
| $ | 19 |
|
| N/A |
|
| 6.75% |
|
| 100 Comm Drive, LLC (1) |
|
| 10 |
|
| N/A |
|
| 8.25% |
|
| 100 CTE Drive, LLC (1) |
|
| 13 |
|
| N/A |
|
| 10.00% |
|
| 6430 Oakbrook Parkway, LLC (1) |
|
| 27 |
|
| N/A |
|
| 8.50% |
|
| 8001 West Jefferson, LLC (1) |
|
| 22 |
|
| N/A |
|
| 9.50% |
|
| 1500 MacCorkle Ave SE, LLC (1) |
|
| 11 |
|
| N/A |
|
| 10.00% |
|
| 400 S. Pike Road West, LLC (1) |
|
| 1 |
|
| N/A |
|
| 9.00% |
|
| 601 N. US 131, LLC (1) |
|
| 1 |
|
| N/A |
|
| 9.25% |
|
| 9260 E. Stockton Blvd., LLC (1) |
|
| 7 |
|
| N/A |
|
| 7.75% |
|
| 120 E. Lime Street, LLC (1) |
|
| 11 |
|
| N/A |
|
| 8.50% |
|
| 610 N. Morgan Street, LLC (1) |
|
| 39 |
|
| N/A |
|
| 8.25% |
|
| Total Interest in Limited Partnerships and Limited Liability Companies |
| $ | 161 |
|
|
|
|
|
|
|
|
|
|
|
|
|
|
|
|
|
|
|
(1)The entity invests in commercial real estate properties that are leased to Frontier, with the exception of the E. Casino Road property which is leased to a third party. The leases are triple net, whereby we are responsible for all expenses, including but not limited to, insurance, repairs and maintenance and payment of property taxes.
(2)All Level 3 investments have the same redemption frequency (through the liquidation of underlying investments) and redemption notice period (none). The fair value of these properties is based on independent appraisals.
The following table summarizes the carrying amounts and estimated fair values for long-term debt at December 31, 2024 and 2023. For the other financial instruments including cash, short-term investments, accounts receivable, restricted cash, accounts payable and other current liabilities, the carrying amounts approximate fair value due to the relatively short maturities of those instruments.
The fair value of our long-term debt is estimated based upon quoted market prices at the reporting date for those financial instruments.
|
|
|
|
|
|
|
|
|
|
|
|
|
|
|
|
|
|
|
|
|
|
|
|
| 2024 |
| 2023 |
|
|
|
|
| Carrying |
|
|
|
|
| Carrying |
|
|
|
|
| ($ in millions) |
|
| Amount |
|
| Fair Value |
|
| Amount |
|
| Fair Value |
|
|
|
|
|
|
|
|
|
|
|
|
|
|
|
|
| Total debt |
| $ | 11,569 |
| $ | 11,749 |
| $ | 11,231 |
| $ | 10,712 |
|
|
|
|
|
|
|
|
|
|
|
|
|
|
|
|
(20) Commitments and Contingencies:
We are party to various legal proceedings (including individual actions, class and putative class actions, and governmental investigations) arising in the normal course of our business covering a wide range of matters and types of claims including, but not limited to, general contract disputes, billing disputes, rights of access, taxes and surcharges, consumer protection, advertising, sales and the provision of services, intellectual property, including, trademark, copyright, and patent infringement, employment, regulatory, environmental, tort, claims of competitors and disputes with other carriers. Litigation is subject to uncertainty and the outcome of individual matters is not predictable. However, we believe that the ultimate resolution of all such matters, after considering insurance coverage or other indemnities to which we are entitled, will not have a material adverse effect on our financial position, results of operations, or cash flows.
Frontier has been named as a defendant in various intellectual property disputes. In each case, we have denied the allegations and are mounting a vigorous defense. We have accrued an amount for potential damages that we deem probable and reasonably estimable. We do not expect that any potential damages, if ultimately incurred, will be material.
On October 22 and October 23, 2024, two complaints were filed in the Supreme Court of the State of New York, County of New York by purported Company stockholders against the Company, the Board, Verizon and Merger Sub in connection with the Merger. The complaints assert claims of negligent misrepresentation and concealment and negligence under New York common law. Among other remedies, the complaints seek an order enjoining the defendants from proceeding with the Merger
unless and until the defendants disclose certain allegedly material information that was allegedly omitted from the proxy statements, rescinding the Merger to the extent already consummated or granting rescissory damages, awarding the plaintiffs costs and disbursements of the action, including reasonable attorneys’ and expert fees and expenses, and granting such other and further relief as the court may deem just and proper. Additional lawsuits arising out of the proposed Merger may also be filed in the future. Furthermore, the Company has received demand letters from purported Company stockholders alleging disclosure deficiencies in the preliminary proxy statement and/or definitive proxy statement and demanding that the Company and the Board of Directors promptly issue corrective disclosures to cure the proxy statement prior to the anticipated stockholder vote on the proposed Merger. The Company believes that the allegations contained in the complaints and demands have no merit. We do not at this time consider there to be any reasonably possible material loss arising from the demands. There can be no assurance regarding the likelihood that the Company’s defense of any actions will be successful.
During the second quarter of 2024, Frontier reached a settlement with a net financial impact of $25 million resolving a dispute with the Chief Executive Officer of Frontier’s predecessor company, who left his position with the company in 2004, concerning split-dollar life insurance benefits granted during his employment.
In November 2021, Congress passed the IIJA which provides $65 billion to fund broadband connectivity programs, including broadband deployment to unserved and underserved locations. The National Telecommunications and Information Administration (NTIA) is administering the principal last mile infrastructure funding program in the amount of $42.5 billion, the Broadband Equity, Access & Deployment Program (BEAD), and will distribute funding through direct grants to states, who will then award the funds based on competitive grant programs. The NTIA has allocated approximately $25.5 billion to states in Frontier’s footprint. We are closely tracking implementation of the BEAD program, including participating in state address challenge and pre-application processes. The requirements and funding under these programs is subject to change. We are actively pursuing awards of these stimulus funds; however, we continue to evaluate our opportunities as the process is complex and any awards that we ultimately receive under the IIJA may require significant up-front capital expenditures or other costs.
On January 27, 2025, the federal Office of Management and Budget (“OMB”) issued a memorandum to the heads of all executive departments and agencies directing them to pause the disbursement of certain federal financial assistance. On January 28, 2025, the United States District Court for the District of Columbia issued a temporary stay of the OMB directive, which the OMB subsequently rescinded. It is uncertain if the OMB will seek to further pause or otherwise limit future federal disbursements, or if any such changes will impact the funding Frontier receives under federal programs, including USF, RDOF and other federal broadband grants including BEAD. We are closely tracking developments in this area. Significant decreases in available funding, or the imposition of significant requirements on the receipt of such funding, could have a material adverse effect on our business and results of operations.
On April 14, 2024, we detected that a third party had gained unauthorized access to portions of our information technology environment. Upon detection, the Company immediately activated its incident response plan, took action to contain the incident, launched an investigation with the assistance of leading cybersecurity experts, and notified law enforcement and applicable regulatory authorities. We worked with a leading e-discovery firm to undertake a thorough review of the impacted data to identify and provide notice to individuals whose information was impacted. Since the incident, the Company has also taken steps to further strengthen its information technology security. While the incident did not have a material impact on our financial condition or results of operations, the containment measures, which included shutting down certain of the Company’s systems, resulted in an operational disruption.
In October 2013, the California Attorney General’s Office notified certain Verizon companies, including one of the subsidiaries that we acquired in the CTF transaction, of potential violations of California state hazardous waste statutes primarily arising from the disposal of electronic components, batteries, and aerosol cans at certain California facilities. We have reached a settlement with the California Attorney General’s Office, pending court approval, and have accrued an amount for the settlement penalty.
We accrue an expense for pending litigation when we determine that an unfavorable outcome is probable, and the amount of the loss can be reasonably estimated. Legal defense costs are expensed as incurred. None of our existing accruals for pending matters, after considering insurance coverage, is material. We monitor our pending litigation for the purpose of adjusting our accruals and revising our disclosures accordingly, when required. Litigation is, however, subject to uncertainty, and the outcome of any particular matter is not predictable. We will vigorously defend our interests in pending litigation, and as of this date, we believe that the ultimate resolution of all such matters, after considering insurance coverage or other indemnities to which we are entitled, will not have a material adverse effect on our consolidated financial position, results of operations, or our cash flows.
In 2015, Frontier accepted the FCC’s CAF Phase II offer, which provided $313 million in annual support through 2021 in our current 25 states in return for the Company’s commitment to make broadband available to households within the CAF II
eligible areas. The Company was required to complete the CAF II deployment by December 31, 2021. Thereafter, the FCC has been reviewing carriers’ CAF II program completion data, and if the FCC determines that the Company did not satisfy applicable FCC CAF Phase II requirements, Frontier could be required to return a portion of the funds previously received and may be subject to certain fines, requirements and obligations.
On January 30, 2020, the FCC adopted an order establishing the RDOF competitive reverse auction to provide support to serve high-cost areas. Under the FCCs RDOF Phase I auction, we were awarded approximately $371 million over ten years to build gigabit-capable broadband over a fiber-to-the-premises network to approximately 127,000 locations in eight states (California, Connecticut, Florida, Illinois, New York, Pennsylvania, Texas, and West Virginia). We began receiving RDOF funding in the second quarter of 2022 and we will be required to complete the buildout to the awarded locations by December 31, 2028, with interim target milestones over this period. To the extent Frontier is unable to fulfill the RDOF requirements, meet the milestones or construct to all locations by the required deadlines, funding to us could be discontinued and Frontier could be required to return a portion of funds previously received and may be subject to certain fines, requirements and obligations.
On July 24, 2024, the U.S. Court of Appeals for the Fifth Circuit held that certain delegations of authority in the USF contribution system are unconstitutional. The court remanded the case to the FCC. The Fifth Circuit subsequently stayed the decision to allow the FCC to file a petition with the U.S. Supreme Court seeking review. The stay allows the continued collection of USF contributions while the Supreme Court considers the case. The precise impact of the case is unclear at this time, including the extent to which the decision applies to parties other than the petitioner. We cannot predict how this or future court decisions will impact the company’s ability to receive federal universal service funds in the future.
We conduct certain of our operations in leased premises and lease certain equipment and other assets pursuant to operating leases. The lease arrangements have terms ranging from 1 to 99 years and several contain rent escalation clauses providing for increases in monthly rent at specific intervals. When rent escalation clauses exist, we record annual rental expense based on the total expected rent payments on a straight-line basis over the lease term. Certain leases also have renewal options. Renewal options that are reasonably assured are included in determining the lease term.
As of December 31, 2024, we had total “Accounts payable and accrued liabilities” of $1.0 billion, of which $758 million was related to accounts payable. As of December 31, 2023, we had total “Accounts payable and accrued liabilities” of $1.1 billion, of which $857 million was related to accounts payable.
Although from time to time we make short-term purchasing commitments to vendors with respect to capital expenditures, we generally do not enter into firm, written contracts for such activities. In connection with the fiber expansion build, we have prioritized diversifying our vendor base and solidifying partnership agreements with vendors for relevant labor and materials, to enable our build growth and customer expansion. Some of these key supplier agreements have multi-year terms and purchase commitments as we deem advisable in order to strengthen future supply. In addition, we have negotiated favorable payment terms with some of our vendors that allow for a longer payment period than our normal customary terms (referred to as vendor financing), which are excluded from capital expenditures and reported as financing activities on the statement of cash flows. As of December 31, 2024 and December 31, 2023, we had $16 million and $263 million, respectively, of contractual vendor financing liabilities included in “Other current liabilities” on our consolidated balance sheets. For the year ended December 31, 2024 we made $331 million in contractual vendor financing payments related to capital expenditures.
The following table summarizes the roll forward of the vendor financing liabilities for the fiscal year ended December 31, 2024:
|
|
|
|
|
|
|
|
|
| ($ in millions) |
| 2024 |
| 2023 |
|
| Confirmed obligations outstanding at January 1 |
| $ | 263 |
| $ | - |
|
| Invoices confirmed during the year |
|
| 84 |
|
| 268 |
|
| Confirmed invoices paid during the year |
|
| (331) |
|
| (5) |
|
| Confirmed obligations outstanding at December 31 |
| $ | 16 |
| $ | 263 |
|
|
|
|
|
|
|
|
|
|
In addition, we have certain arrangements that are non-contractual but have extended payment terms. We made payments of $132 million related to these arrangements, bringing total capital vendor financing payments to $463 million for the year ended December 31, 2024.
We are party to contracts with several unrelated long-distance carriers. The contracts provide fees based on traffic they carry for us subject to minimum monthly fees.
At December 31, 2024, the estimated future payments for obligations under our noncancelable long-distance contracts and joint pole and communications service agreements are as follows:
|
|
|
|
|
|
|
|
|
|
|
|
| ($ in millions) |
| Amount |
|
| |
|
|
|
|
| Year ending December 31: |
|
|
|
|
| 2025 |
| $ | 95 |
|
| 2026 |
|
| 16 |
|
| 2027 |
|
| 5 |
|
| 2028 |
|
| - |
|
| 2029 |
|
| - |
|
| Thereafter |
|
| - |
|
| Total |
| $ | 116 |
|
|
|
|
|
|
|
At December 31, 2024, we have outstanding performance letters of credit as follows:
|
|
|
|
|
|
|
|
|
|
|
|
| ($ in millions) |
| Amount |
|
| |
|
|
|
|
| CNA Financial Corporation (CNA) |
| $ | 24 |
|
| AIG Insurance |
|
| 28 |
|
| Zurich |
|
| 133 |
|
| Total (1) |
| $ | 185 |
|
|
|
|
|
|
|
(1)At December 31, 2024, we had total letters of credit outstanding of $265 million, of which, $74 million was used for various Federal
Communications Commission (FCC) rural deployment programs in which the Universal Service Administrative Company (USAC) provides funds to Frontier to support the construction of rural broadband connectivity, and $6 million was used for rent obligations under our administrative office lease terms.
CNA serves as our insurance carrier with respect to casualty claims (auto liability, general liability, and workers’ compensation) with dates of loss prior to June 1, 2017 (except for those claims which arise out of the operations acquired from CTF that have dates of loss prior to April 1, 2016). As our insurance carrier, they administer the casualty claims and make claim payments on our behalf. We reimburse CNA for such services upon presentation of their invoice. To serve as our carrier and make payments on our behalf, CNA requires that we establish a letter of credit in their favor. CNA could potentially draw against this if we failed to reimburse CNA in accordance with the terms of our agreement. The amount of the letter of credit is reviewed annually and adjusted based on claims history.
Zurich serves as our insurance carrier with respect to casualty claims (auto liability, general liability, and workers’ compensation) with dates of loss from June 1, 2017 and going forward. As our insurance carrier, they administer the casualty claims and make claim payments on our behalf. We reimburse Zurich for such services upon presentation of their invoice. To serve as our carrier and make payments on our behalf, Zurich requires that we establish letters of credit in their favor. Zurich could potentially draw against these letters of credit if we failed to reimburse Zurich in accordance with the terms of our agreement. The amount of the letters of credit is reviewed annually and adjusted based on claims history.
AIG Insurance serves as our insurance carrier with respect to casualty claims (auto liability, general liability, and workers’ compensation) that were acquired from CTF, as well as new claims which arise out of the operations acquired from CTF that have dates of loss prior to April 1, 2016. Sedgwick, a third-party claims administrator, administers the casualty claims and makes claim payments on our behalf. We reimburse Sedgwick for such services upon presentation of their invoice. However, to serve as our insurance carrier, AIG Insurance requires that we establish a letter of credit in their favor. AIG Insurance could potentially draw against this letter of credit if we failed to meet the insurance-related and claims-related obligations we assumed in accordance with the terms of our agreement. The amount of the letter of credit is reviewed annually and adjusted based on claims history.
(21) Subsequent Events:
In January 2025, wildfires in California have impacted certain regions where the Company operates, potentially affecting network infrastructure, service continuity, and maintenance costs. The Company is actively assessing any financial or operational impact and implementing necessary mitigation efforts to ensure network stability and compliance with regulatory requirements. The impact to our financial statements, if any, cannot be estimated at this time.