
FEDERATIVE REPUBLIC OF BRAZIL
This description of the Federative Republic of Brazil is dated as of June 30, 2005 and appears as Exhibit D to the Federative Republic of Brazil’s Annual Report on Form 18-K to the U.S. Securities and Exchange Commission for the fiscal year ended December 31, 2004.
Until the introduction of the real in July 1994, Brazil had experienced high rates of inflation. A variety of indices exist for measuring inflation in Brazil. This document uses the General Price Index-Domestic Supply (Índice Geral de Preços-Disponibilidade Interna, or “IGP-DI”), a national price index based on a weighting of three other indices, the Wholesale Price Index-Domestic Supply (Índice de Preços por Atacado-Disponibilidade Interna, or “IPA-DI”) (60%), the Consumer Price Index (Índice de Preços ao Consumidor, or “IPC”) (30%), and the National Index of Building Costs (Índice Nacional de Custos de Construção, or “INCC”) (10%). The IGP-DI, one of the most widely used inflation indices, is calculated by the Getúlio Vargas Foundation, an independent research organization. See “The Brazilian Economy—Prices”. As measured by the IGP-DI, the annual rate of inflation in Brazil was 9.8% in 2000, 10.4% in 2001, 26.4% in 2002, 7.7% in 2003, 12.1% in 2004. Such levels of inflation, together with the devaluation of the Brazilian currency in relation to the U.S. dollar, should be considered by the readers of all financial and statistical information contained herein.
The following table sets forth certain exchange rate information for the selling of U.S. dollars, expressed in nominal reais, for the periods indicated. The Federal Reserve Bank of New York does not report a noon buying rate for the real.
Table No. 1
Commercial Exchange Rates (Selling Side)
R$/$1.00
| | | | | | | |
Year
| | Average for Period(1)
| | End of Period
| | Percentage Change (End of Period)
| |
2000 | | 1.8295 | | 1.9554 | | 9.3 | |
2001 | | 2.3522 | | 2.3204 | | 18.7 | |
2002 | | 2.9309 | | 3.5333 | | 52.3 | |
2003 | | 3.0715 | | 2.8892 | | (18.2 | ) |
2004 | | 2.9257 | | 2.6544 | | (8.1 | ) |
| (1) | | Weighted average of the exchange rates on business days during the period. |
Source: Central Bank
In January 1999, the Central Bank abandoned its exchange band mechanism, which encouraged small exchange devaluations within a specified range and which had been in effect since March 1995, and permitted the value of the real to float freely against that of the dollar. On December 31, 2004, the real-U.S. dollar exchange rate (sell side) in the commercial exchange market, as published by the Central Bank, was R$2.6544 to $1.00. See “Balance of Payments and Foreign Trade—Foreign Exchange Rates and Exchange Controls”. In this report, references to “dollars”, “U.S. dollars”, “U.S.$” and “$” are to United States dollars, and references to “real”, “reais” and “R$” are to Brazilian reais.
The fiscal year of the federal Government of Brazil (the “Government”) ends December 31. The fiscal year ended December 31, 2004 is referred to herein as “2004”, and other years are referred to in a similar manner. Tables herein may not add due to rounding.
D-1
MAP OF BRAZIL
D-2
INTRODUCTION
Brazil is the fifth largest country in the world and occupies nearly half the land area of South America. Brazil shares a border with every country in South America except Chile and Ecuador. The capital of Brazil is Brasília, and the official language is Portuguese. On December 31, 2004, Brazil’s estimated population was 182.7 million.
Following two decades of military governments, in 1985 Brazil made a successful transition to civilian authority and democratic government. A new Brazilian Constitution (the “Constitution”) was adopted in 1988. In 1989, direct presidential elections were held for the first time in 29 years. After winning a runoff election with 61% of the vote on October 27, 2002, Luiz Inácio Lula da Silva assumed the presidency of Brazil on January 1, 2003. As President, Mr. da Silva has initiated a series of social programs, including a “Zero Hunger” campaign, which is intended to eradicate famine and address poverty in the country, a “Bolsa Família” program that provides assistance to impoverished families and a “First Job” program aimed at facilitating young persons’ entry into the labor market. He has also secured reforms of the tax, pension and judicial systems, instituted a framework for public-private partnerships, introduced a regulatory framework for investment in, among others, the electricity sector and secured amendments to the country’s bankruptcy law. Finally, the da Silva administration’s economic policy has been characterized by fiscal discipline, a floating exchange rate and inflation targeting. Among the da Silva administration’s first initiatives was an increase in the consolidated public sector primary surplus target from 3.75% of real gross domestic product (“GDP”) in 2002 to 4.25% of GDP in each of 2003, 2004 and 2005. On September 22, 2004, the Government announced that it had raised its primary surplus target for 2004 to 4.5% of GDP from 4.25% of GDP due to better than expected fiscal revenues. The Government has maintained its 2005 primary surplus target of 4.25% of GDP.
Mr. da Silva is a member of the Workers’ Party (Partido dos Trabalhadores, or PT). Following the October 2002 elections, Mr. da Silva’s party held 17.5% of the seats in the Chamber of Deputies and 12.3% of the seats in the Senate. Mr. da Silva was elected as part of a broad coalition consisting of the Liberal Party and five smaller parties, including the Brazilian Socialist Party (PSB) and the Brazilian Workers Party (PTB). In 2003 and 2004, the PT formed new alliances with the Brazilian Democratic Movement Party (PMDB) and the Brazilian Progressive Party (PP) and with other, small parties. As a result of these alliances, Mr. da Silva’s coalition grew to 73% of the members of the Chamber of Deputies and to 57% of the members of the Senate. However, on December 12, 2004, the Brazilian Democratic Movement Party (PMDB) voted to leave President da Silva’s coalition and to support its own candidate for Brazil’s 2006 presidential election. Certain pro-government members of the PMDB—including two members of President da Silva’s cabinet and 19 of the party’s 22 senators—have said that they would ignore the party’s decision to leave the coalition. The PMDB’s move followed a decision by the smaller Popular Socialist Party (PPS) on December 11, 2004 to leave President da Silva’s coalition.
The success of Mr. da Silva’s initiatives will be influenced by public opinion toward the reforms and the strength of any opposition to the reforms by affected interest groups. Whereas ordinary legislation requires only a simple majority of both houses of Congress, amendments to the Constitution require three-fifths of the votes of the respective members of each house of Congress in two separate rounds. See “The Federative Republic of Brazil—Form of Government and Political Parties”.
Mr. da Silva succeeded in enacting certain pension reforms during his first two years in office. These reforms, which Brazil’s Chamber of Deputies and Senate approved on December 19, 2003 as Constitutional Amendment No. 41, included: (i) an increase in the minimum retirement age for civil servants from 48 to 55 years for women and from 53 to 60 years for men; (ii) a reduction of 30% in pensions paid for widows and orphans of civil servants in excess of R$2,400 per month; (iii) a contribution to the social security system by retired civil servants of 11% of the amount by which the retired employee’s pension exceeds R$1,440 per month in the case of federal retirees and R$1,200 per month in the case of all other retired civil servants; (iv) a uniform contribution level for municipal, State and federal workers consisting of at least 11% of the amount of the
D-3
employee’s salary; and (v) the institution of a complementary regime for the new civil servants, which will require the passage of ordinary legislation. For the private sector pension system, the cap on social security pensions paid to private sector retirees was raised from R$1,561.56 to R$2,400 per month. See “The Brazilian Economy—Constitutional Reform” and “—Social Security”.
Mr. da Silva was also able to enact certain tax reforms during his first two years in office. On December 19, 2003, the Chamber of Deputies and the Senate approved an amended tax reform bill in the form of Constitutional Amendment No. 42. Constitutional Amendment No. 42 provides for, among other things: (i) the extension to 2007 of the provisional financial contribution transaction levy (“CPMF”) and the Delinking of Central Government Revenues (“DRU”), which permits the reallocation of 20% of certain tax revenues that the federal Government would otherwise be required to devote to specific program areas under the Constitution; (ii) the exempting of exports from the tax on the circulation of goods and services (“ICMS”) and the establishment of a fund to compensate States for lost ICMS revenue resulting from that exemption; (iii) the imposition of the contribution for the financing of social security (COFINS) only at the final stage of the production process, rather than at each stage of that process; (iv) a reduction of the tax on industrial products (IPI) on imports of capital goods; and (v) a requirement that the federal Government transfer to States and municipalities 25% of the revenues from the federal contribution on fuel (CIDE). The Chamber of Deputies is also to consider a proposed Constitutional amendment authorizing the Senate to introduce legislation to create a new national value-added tax to replace certain federal and State taxes, including ICMS and the IPI. If the Chamber of Deputies approves the proposed amendment, the Senate will be authorized to propose a further Constitutional amendment providing for the creation of the new value-added tax. This further amendment would have to be approved by an absolute three-fifths majority in two rounds of voting in each of the Chamber of Deputies and the Senate to become effective.
During his second year in office, Mr. da Silva was able to enact certain judicial reforms. In November 2004, Congress approved Constitutional Amendment No. 45 dated December 8, 2004, a set of reforms intended to improve the efficiency of the judicial system. Constitutional Amendment No. 45, among other things, amends Articles 102 and 105 of Brazil’s Constitution to provide that the Superior Court of Justice, and not the Federal Supreme Court, is to determine whether foreign judgments and foreign arbitral awards are enforceable in Brazil. The enforcement by a Brazilian court of a foreign arbitral award is subject to the recognition of such award by the Superior Court of Justice. The Superior Court of Justice will recognize such an award if all of the required formalities are observed and the award does not contravene Brazilian national sovereignty, public policy and “good morals”.
Other reforms introduced by Constitutional Amendment No. 45 include: (i) the right of all parties to a judicial process of reasonable duration and to the means necessary to attain it; (ii) the submission by Brazil to the jurisdiction of the International Criminal Court, the governing statute of which was ratified by Brazil in June 2002; (iii) a provision barring a retired or removed judge from practicing, for a period of three years, before the court in which he or she sat; (iv) a rule providing that decisions of the Federal Supreme Court on the merits of lawsuits challenging the constitutionality of certain acts (ações diretas de inconstitucionalidade and ações declaratórias de constitucionalidade) constitute binding precedents for the lower courts and the direct and indirect administration; (v) a rule providing that the Federal Supreme Court may issue summary legal principles (súmulas) that are binding on the lower courts and the direct and indirect administration; (vi) the establishment of a fifteen-member National Council of Justice (Conselho Nacional de Justiça) to oversee the administrative and fiscal management of the judiciary; and (vii) the establishment of a fourteen-member National Council of the Public Ministry (Conselho Nacional do Ministério Público) to oversee the administrative and fiscal management of the public prosecution service.
Changes have also been made to improve the investment climate. On December 30, 2004, President da Silva sanctioned Law No. 11,079, which provides for the formation of two types of “public-private partnerships” or “PPPs”: (i) contracts for concessions of public works or utility services under which private party concessionaires receive payments from a public sector entity in addition to tariffs charged to end-users and
D-4
(ii) contracts for rendering of services under which a public sector entity is the end-user. PPP contracts must be worth at least R$20 million and provide for a service period of between five and thirty-five years, including extensions of the term. All such contracts can only be awarded through a public bidding process. Because the concessionaires will only begin to receive payments when the services under the PPP contract are provided, the private parties will have to obtain private financing for the construction of the facility that is to provide the services under the contract. Law No. 11,079 permits payments from the public sector entity to be made directly to the contractor’s creditors, thereby reducing the creditors’ overall credit risk. The federal PPP program is to be overseen by a management committee appointed by the Ministry of Planning, Budget and Management, the Ministry of Finance and the Office of the Chief of Staff (Casa Civil da Presidência da República). The management committee is charged with selecting the projects for and regulating the federal PPP program. Law No. 11,079 further permits the federal Government to allocate up to R$6 billion to a PPP Guarantee Fund (Fundo Garantidor de Parcerias Público-Privadas, or FGP). On May 30, 2005, the Planning, Budget and Management Ministry announced that it had prepared a list of ten projects to be presented to the private sector as possible PPPs. The Government expects to announce the first six projects, which are all related to the transportation infrastructure, by November 30, 2005.
On February 9, 2005, President da Silva sanctioned a bankruptcy law that had been under consideration by the Congress for ten years, as well as changes to the tax code. The new bankruptcy law, Law No. 11,101, among other things, (i) places a cap equal to 150 times the minimum monthly salary on claims in bankruptcy proceedings by employees for such items as unpaid wages, unused vacation time and the 40% penalty for unjust dismissals; (ii) gives secured credits (such as those held by banks) priority over tax claims in bankruptcy proceedings; and (iii) ends a “succession” doctrine that makes a purchaser of assets from a bankrupt company or from a company under judicial reorganization responsible for certain of the insolvent company’s tax and social security obligations as a consequence of the acquisition, and, in the case of a company under bankruptcy proceedings, the debtor’s labor claims. The Government expects the measure to reduce interest rates charged by financial institutions for domestic loans.
In February 2005, Severino José Cavalcanti Ferreira, a Deputy in the Progressive Party (PP), defeated the Workers Party’s candidate in an election for president of the Chamber of Deputies. Although the PP is a member of President da Silva’s coalition, Mr. Cavalcanti has in the past criticized certain elements of the Government’s economic and social agenda. The leadership change in the Chamber of Deputies might, therefore, make it more difficult for the Government to obtain legislative approval of certain other proposed reforms.
On February 13, 2004, the Government fired Waldomiro Diniz, an aide to President da Silva’s former Cabinet Chief, José Dirceu, after a weekly news magazine posted a video on its website that allegedly showed Mr. Diniz in 2002, while Mr. Diniz was the head of the State of Rio de Janeiro’s lottery company, soliciting campaign contributions for two Workers Party candidates and offering political favors in return. The leaders of Brazil’s opposition parties called for a congressional investigation of the Diniz matter and demanded the resignation of Mr. Dirceu. On February 18, 2004, the Government announced that it would conduct an internal investigation of the Diniz matter and announced on March 23, 2004 that Mr. Dirceu had been cleared of any wrongdoing. The Government maintained that Mr. Diniz’s alleged misconduct occurred before President da Silva’s inauguration and was not connected to the current administration. On June 22, 2005, the Supreme Court ruled that the President of the Brazilian Senate was required to form a parliamentary commission of inquiry to investigate the country’s bingo industry.
In addition, in July 2004, a weekly news magazine in Brazil reported that Henrique Meirelles and Luiz Augusto Candiota, the Central Bank’s president and director of monetary policy, respectively, were being investigated by the public prosecutor’s office for tax evasion and other fiscal infractions and that their names had been mentioned at a congressional commission of inquiry (CPI) investigating capital flight through Banco do Estado do Paraná S.A. (Banestado), then the bank of the State of Paraná. According to the report, Mr. Meirelles had failed to file a tax return for 2001 on the grounds that he had been living abroad, although he had claimed that he was a resident of the State of Goiás during that period to run for Congress as a candidate of the Brazilian
D-5
Social Democratic Party (PSDB). Mr. Candiota, according to the report, had failed to report transfers of funds through MTB Bank in New York. Both individuals have denied any wrongdoing. Mr. Candiota resigned from his position, saying that he wished to avoid harm to the Central Bank. The public prosecutor’s office subsequently confirmed that it was conducting these investigations. Law No. 11,036 dated December 22, 2004, elevated the Governor of the Central Bank to ministerial status. As a result of such ministerial status, the Governor of the Central Bank can only be tried by the Federal Supreme Court.
On May 25, 2005, a joint session of the National Congress approved the formation of a parliamentary commission of inquiry (CPI) to examine charges of corruption in the postal service. The vote to form the CPI came after the release by a news magazine of a video recording of the former head of the postal service’s procurement and inventories management department appearing to accept a bribe and stating that he represented a government-allied political party, later identified as the Brazilian Workers Party (PTB). A weekly news magazine also reported that the president of the Brazilian Reinsurance Institute (IRB) had been recorded stating that the IRB was required to transfer R$400,000 per month to the PTB.
On June 6, 2005, a daily newspaper in São Paulo reported that Roberto Jefferson, the head of the PTB had alleged that the Workers Party had paid certain Congressmen $12,000 per month for their support in Congress. Mr. Jefferson further alleged the payments had continued, even after he had informed Cabinet Chief José Dirceu and Finance Minister Antônio Palocci. According to Mr. Jefferson, the payments stopped only after he had informed President da Silva of such payments. Mr. Jefferson stated that President da Silva had been previously unaware of such payments but alleged that certain senior officials of the Workers Party had overseen such payments. The Workers Party has denied the allegations. Testifying before the Congressional ethics committee on June 14, 2005, Mr. Jefferson admitted that he had no evidence to support any of his accusations. Mr. Jefferson and certain members of his party are the focus of the CPI investigation on corruption in the postal service and the Brazilian Reinsurance Institute. On June 14, 2005, the President of the National Congress received a formal request signed by 205 Deputies and 41 Senators for the installation of a parliamentary commission of inquiry (CPI) to examine the accusations made by Mr. Jefferson. On June 16, 2005, Mr. Dirceu resigned from his position as Cabinet Chief.
Prior to the introduction of the real as Brazil’s official currency in July 1994 pursuant to the Plano Real, Brazil’s economic performance had been characterized by macroeconomic instability, including extremely high rates of inflation and significant and sudden currency devaluations. Pre-Plano Real stabilization efforts, which included wage and price controls, failed to contain inflation for any extended period. See “The Brazilian Economy—Historical Background”. The Plano Real, which the Government announced in December 1993 and fully implemented in July 1994, succeeded in lowering inflation from an annual rate of 2,708.6% in 1993 and 909.6% in 1994 to 14.8% in 1995, 9.3% in 1996, 7.5% in 1997 and 1.7% in 1998, as measured by the IGP-DI. The inflation rate increased to 20.0% in 1999, however, following the decision of the Central Bank in January 1999 to permit the value of the real to float against that of the dollar. The inflation rate subsequently declined as a consequence of the implementation of the inflation targeting regime by the Central Bank in June 1999, registering 9.8% in 2000 and 10.4% in 2001. See “The Brazilian Economy—Prices”.
In addition, the value of the real has at times fluctuated significantly against the U.S. dollar. The second half of 2002 and the first quarter of 2003 posed several challenges for Brazil, for example, which arose in large part from the effects of Argentina’s financial crisis, a weak global economy, uncertainties about the country’s national elections held in October 2002 and concerns about terrorism and tensions in the Middle East. Through much of the period from July through October 2002, the real declined against the U.S. dollar. The real-U.S. dollar exchange rate (sell side), as published by the Central Bank, declined from R$2.8444 to $1.00 on June 28, 2002 to R$3.8949 to $1.00 on September 30, 2002 before reaching a low of R$3.9552 to $1.00 on October 22, 2002. Following the October 2002 elections, the real began to recover against the U.S. dollar, reaching R$3.5333 to $1.00 on December 31, 2002, R$2.8892 to $1.00 on December 31, 2003 and R$2.6544 on December 31, 2004. On May 31, 2005, the real-U.S. dollar exchange rate (sell side), as published by the Central Bank, was R$2.4038 to $1.00. See “Balance of Payments and Foreign Trade—Foreign Exchange Rates and Exchange Controls”.
Largely as a result of a depreciation in the value of the real, increases in administered prices (prices subject to Government regulation, such as rates for telephone calls and prices for gasoline and other petroleum derivatives, and prices governed by contracts with vendors, such as fares charged for certain public
D-6
transportation) and rising oil prices in the world markets, the inflation rate began to rise in Brazil during the fourth quarter of 2002. The inflation rate, as measured by IGP-DI, began to accelerate in October 2002, increasing 4.2% in October 2002 and 5.8% in November 2002. Although the inflation rate subsequently subsided, it reached 26.4% for 2002 and 7.7% in 2003 and 12.1% in 2004. For the 12 months ending May 31, 2005, the inflation rate, as measured by IGP-DI, was 8.4%. See “The Brazilian Economy—Prices” and “Balance of Payments and Foreign Trade—Foreign Exchange Rates and Exchange Controls”.
To address rising inflation during the last quarter of 2002, the Central Bank increased its overnight Over/Selic interest rate target from 18% to 21% on October 14, 2002, 22% on November 20, 2002, 25% on December 18, 2002, 25.5% on January 22, 2003 and 26.5% on February 19, 2003. The International Monetary Fund (“IMF”) also announced on September 6, 2002, in response to Brazil’s economic situation, that it had approved Brazil’s request for a 15-month standby facility of 22.8 billion in special drawing rights (SDR) (approximately $32.4 billion as of June 13, 2003) to support the country’s economic and financial program through December 2003. The standby facility was extended for another fifteen months in December 2003. In addition, in December 2003, the IMF extended by one year repurchases of SDR 4 billion (approximately $5.8 billion) that Brazil would otherwise have been required to make in each of 2005 and 2006. On March 22, 2005, the IMF announced that it had completed its tenth and final review of Brazil’s performance under the standby facility, and on March 28, 2005, the Brazilian government announced that it had decided not to request IMF support under a successor arrangement. The standby facility expired on March 31, 2005. See “The Brazilian Economy—Recent Economic Events and Policies” and “Public Debt—External Debt”.
Noting that the inflation rate as measured by the IPCA was likely to meet its target of 5.5% for 2004 and 4.5% for 2005 (with tolerance levels of plus or minus 2.5 percentage points), the Central Bank reduced its Over/Selic interest rate target from 26.5% on May 21, 2003 to 16% on April 14, 2004. However, in an effort to manage inflationary expections, the Central Bank increased its Over/Selic rate target from 16% to 16.25% on September 15, 2004, 16.75% on October 20, 2004, 17.25% on November 17, 2004, 17.75% on December 15, 2004, 18.25% on January 19, 2005, 18.75% on February 16, 2005, 19.25% on March 16, 2005, 19.5% on April 20, 2005 and 19.75% on May 18, 2005. These higher interest rates have increased the Republic’s financing costs as the Republic has been forced to issue debt at higher interest rates.
Brazil’s GDP rose 4.4% in 2000, 1.3% in 2001, 1.9% in 2002, 0.5% in 2003 and 4.9% in 2004. Growth in the agricultural sector, industrial sector and services sector rose in 2004 5.3%, 6.2% and 3.3%, respectively. Household consumption rose 4.1% in 2004 relative to 2003, and investments in manufacturing plants, machinery and capital equipment (formação bruta de capital fixo, or FBCF) rose by 10.9% in 2004 relative to 2003.
The current account recorded deficits from 1993 to 2002. Brazil’s current account deficit declined from $25.3 billion in 1999 to $24.2 billion and $23.2 billion in 2000 and 2001, respectively. The current account deficit fell to $7.6 billion in 2002 largely as a result of an improvement in the trade balance that year; Brazil registered a trade surplus of approximately $13.1 billion in 2002, versus a trade surplus of approximately $2.7 billion in the previous year. However, net foreign direct investment fell to $16.6 billion in 2002 from $22.5 billion in 2001, resulting in a balance of payments surplus of approximately $302 million in 2002, compared with a $3.3 billion balance of payments surplus in 2001. In 2003, Brazil registered a current account surplus of approximately $4.1 billion as the trade balance continued to improve. Net foreign direct investment continued to fall, totaling $10.1 billion in 2003. In 2004, the current account surplus reached a record high of $11.7 billion, driven in large part by a trade surplus of approximately $33.7 billion. The accumulated balance of payments surplus was approximately $2.2 billion, compared with an accumulated $8.5 billion balance of payments surplus in 2003. During the first five months of 2005, Brazil registered an accumulated trade surplus of approximately $15.6 billion, versus an accumulated trade surplus of approximately $11.2 billion for the corresponding period in 2004. The improvement in the trade balance during the first five months of 2005 resulted in an accumulated current account surplus of approximately $4.1 billion, compared to an accumulated surplus of approximately $2.3 billion for the corresponding period in 2004. See “Balance of Payments and Foreign Trade—Foreign Trade” and “—Balance of Payments.”
D-7
The Republic has generally financed most of its current account deficit each year through direct foreign investment. However, the Republic’s recurring current account deficits and the need to finance them have left the Republic vulnerable at times to external shocks and reductions in direct foreign investment. This volatility has declined, however, and in 2003 and 2004 Brazil registered a current account surplus for the first time since 1992, thereby reducing its external financing needs. See “The Brazilian Economy—Recent Economic Events and Policies”.
Since 1994, debt management policy has aimed at lengthening the maturity of domestic public debt, as well as consolidating a domestic yield curve by means of selling fixed income government securities. In December 2003, the average maturity of Brazil’s domestic debt securities was 31.3 months, down from 35.0 months in December 2001 and 33.2 months in December 2002. In December 2004, the average tenor of Brazil’s domestic debt securities was 28.1 months. A portion of the federal Government’s federal domestic securities debt is indexed to inflation indices or foreign currencies. On December 31, 2004, Brazil’s floating rate domestic securities debt totaled approximately R$625.5 billion (77.2% of all federal debt securities). A significant percentage of this debt was indexed to the U.S. dollar; the percentage of Brazil’s domestic debt securities that was indexed to the U.S. dollar was 22.3% in December 2000, 28.6% in December 2001, 22.4% in December 2002, 10.8% in December 2003 and 5.2% in December 2004. On April 30, 2005, Brazil’s U.S. dollar-indexed domestic securities debt totaled approximately R$34.5 billion (4.0% of all federal debt securities). By contrast, the aggregate principal amount of the federal debt securities indexed to the Over/Selic rate rose from R$449.0 billion (61.4% of all federal debt securities) on December 31, 2003 to R$463.0 billion (57.1% of all federal debt securities) on December 31, 2004 and R$517.0 billion (59.2% of all federal debt securities on April 30, 2005, while fixed rate federal debt securities increased from R$104.6 billion (14.3% of all federal debt securities) on December 31, 2003 to R$184.8 billion (22.8% of all federal debt securities) on December 31, 2004 and R$199.1 billion (22.8% of all federal debt securities) on April 30, 2005.
The large stock of floating rate domestic debt securities makes the Republic’s finances susceptible to significant interest rate movements, mostly because the debt is accounted for on an accrual basis. Persistent high debt servicing costs and the recognition of certain liabilities as obligations of Brazil have led to sustained high levels of net public sector debt as well as to nominal deficits. The consolidated public sector primary balance (which is the financial balance less net borrowing costs of the public sector) registered surpluses of 3.5% of GDP in 2000, 3.7% of GDP in 2001, 4.0% of GDP in 2002, 4.3% of GDP in 2003 and 4.6% of GDP in 2004.
The consolidated public sector nominal balance (the difference between the level of consolidated public sector debt in one period and the level of such debt in the previous period, excluding the effects of the Government’s privatization program and the effect of exchange rate fluctuations on the debt levels between periods), by contrast, showed deficits of 3.6% of GDP in 2000, 3.5% of GDP in 2001, 4.3% of GDP in 2002, 5.1% in 2003 and 2.7% in 2004. The interest expense in respect of Brazil’s public sector debt represented 8.6% of GDP in 2002, up from 7.2% of GDP in 2001. In 2003, the nominal deficit rose to 5.1% of GDP, as Brazil’s interest expense rose to 9.3% of GDP. In 2004, the interest expense was reduced to 7.3% of GDP and the nominal deficit represented 2.7% of GDP. The accumulated nominal balance for the five-month period ended May 31, 2005 declined to 1.9% of GDP, while interest expense rose to 8.5% of GDP.
Net public sector debt in Brazil, composed of the internal and external debt of the federal Government, State and local governments and public sector enterprises, amounted to $288.0 billion, or 48.7% of GDP, on December 31, 2000. Net public sector debt reached 54.8% of GDP in September 2001 as the real depreciated in value against the U.S. dollar, but ended the year at $284.7 billion on December 31, 2001, or 52.6% of GDP, as a result of the appreciation of the real during the fourth quarter of 2001. Brazil’s net public sector debt fell to $249.4 billion (or 55.5% of GDP) on December 31, 2002 but rose to $316.1 billion (or 58.7% of GDP) on December 31, 2003 as a result of higher Over/Selic rates. Brazil’s net public sector debt reached $360.6 billion (51.8% of GDP) in December 2004 and was at $398.4 billion (50.3% of GDP) in May 2005. See “Public Debt”.
During the period from 1982 until the implementation of Brazil’s external debt restructuring in 1994, Brazil failed to make payments on certain of its external indebtedness from commercial banks as originally scheduled, and in February 1987 declared a moratorium on principal and interest payments on external indebtedness to commercial banks. Brazil’s external indebtedness to commercial banks was restructured in a Brady Plan restructuring in April 1994. See “Public Debt—Debt Crisis and Restructuring”. Throughout the debt restructuring process, from 1982 to 1994, the Republic continued to make principal and interest payments on its external bonded indebtedness in accordance with the terms of such indebtedness. See “Public Debt—Debt Record”.
D-8
SELECTED BRAZILIAN ECONOMIC INDICATORS
| | | | | | | | | | | | | | | | | | | | |
| | | 2000
| | | 2001
| | | 2002
| | | 2003
| | | 2004
| |
The Economy | | | | | | | | | | | | | | | | | | | | |
Gross Domestic Product (“GDP”): | | | | | | | | | | | | | | | | | | | | |
(in billions of constant 2004 reais) | | R$ | 1,621.5 | | | R$ | 1,642.7 | | | R$ | 1,674.4 | | | R$ | 1,683.5 | | | R$ | 1,766.6 | |
(GDP at current prices in U.S.$ billions)(1) | | U.S.$ | 602.2 | | | U.S.$ | 509.8 | | | U.S.$ | 459.4 | | | U.S.$ | 506.8 | | | U.S.$ | 604.0 | |
Real GDP Growth (decline)(2) | | | 4.4 | % | | | 1.3 | % | | | 1.9 | % | | | 0.5 | % | | | 4.9 | % |
Population (millions) | | | 169.6 | | | | 175.1 | | | | 177.6 | | | | 180.2 | | | | 182.7 | |
GDP Per Capita(3) | | U.S.$ | 3,515.9 | | | U.S.$ | 2,932.9 | | | U.S.$ | 2,604.3 | | | U.S.$ | 2,831.4 | | | U.S.$ | 3,326.1 | |
Unemployment Rate(4) | | | 7.1 | % | | | 6.2 | % | | | 7.1 | % | | | 12.3 | % | | | 11.5 | % |
IGP-DI (rate of change)(5) | | | 9.8 | % | | | 10.4 | % | | | 26.4 | % | | | 7.7 | % | | | 12.1 | % |
Nominal Devaluation Rate(6) | | | 9.3 | % | | | 18.7 | % | | | 52.3 | % | | | (18.2) | | | | (8.1) | |
Domestic Real Interest Rate(7) | | | 7.0 | % | | | 6.3 | % | | | (5.7) | % | | | 14.6 | % | | | 3.7 | % |
Balance of Payments (in U.S.$ billions) | | | | | | | | | | | | | | | | | | | | |
Exports | | | 55.1 | | | | 58.2 | | | | 60.4 | | | | 73.1 | | | | 96.5 | |
Imports | | | 55.8 | | | | 55.6 | | | | 47.2 | | | | 48.3 | | | | 62.8 | |
Current Account | | | (24.2) | | | | (23.2) | | | | (7.6) | | | | 4.2 | | | | 11.7 | |
Capital and Financial Account (net) | | | 19.3 | | | | 27.1 | | | | 8.0 | | | | 5.1 | | | | (7.3) | |
Change in Total Reserves | | | (2.3) | | | | 3.3 | | | | 0.3 | | | | 8.5 | | | | 2.2 | |
Total Official Reserves | | | 33.0 | | | | 35.9 | | | | 37.8 | | | | 49.3 | | | | 52.9 | |
Public Finance | | | | | | | | | | | | | | | | | | | | |
Financial Surplus (Deficit) as % of GDP(8) | | | (3.6) | % | | | (3.5) | % | | | (4.3) | % | | | (5.1) | % | | | (2.7) | % |
Primary Surplus (Deficit) as % of GDP(9) | | | 3.5 | | | | 3.7 | | | | 4.0 | | | | 4.3 | | | | 4.6 | |
Public Debt (in billions) | | | | | | | | | | | | | | | | | | | | |
Gross Internal Debt (Nominal)(10) | | U.S.$ | 322.7 | | | U.S.$ | 319.9 | | | U.S.$ | 256.0 | | | U.S.$ | 347.1 | | | U.S.$ | 418.8 | |
Gross External Debt (Nominal)(11) | | | 86.7 | | | | 82.9 | | | | 80.9 | | | | 84.8 | | | | 83.1 | |
Public Debt as % of Nominal GDP | | | | | | | | | | | | | | | | | | | | |
Net Internal Debt | | | 39.1 | % | | | 42.2 | % | | | 41.2 | % | | | 46.7 | % | | | 44.3 | % |
Net External Debt(12) | | | 9.6 | | | | 10.4 | | | | 14.3 | | | | 12.0 | | | | 7.5 | |
Total Public Debt (Nominal)(13) | | U.S.$ | 409.4 | | | U.S.$ | 402.8 | | | U.S.$ | 336.9 | | | U.S.$ | 431.9 | | | U.S.$ | 501.9 | |
| (1) | | Converted into dollars based on the weighted average exchange rate for each year. |
| (2) | | Calculated based upon constant average 2004 reais. |
| (3) | | Not adjusted for purchasing power parity. |
| (4) | | Average annual unemployment rate of the metropolitan regions of Belo Horizonte, Porto Alegre, Recife, Rio de Janeiro, Salvador and São Paulo. The methodology used by IBGE to determine the average unemployment rate was changed in 2003. The average unemployment rates shown for 2000 through 2002 were determined using the methodology in effect prior to 2003. If the new methodology had been in effect in 2002, the average unemployment rate that year would have been 11.7%. See “The Brazilian Economy—Employment”. |
| (5) | | IGP-DI is one indicator of inflation. While many inflation indicators are used in Brazil, the IGP-DI, calculated by the Getúlio Vargas Foundation, an independent research organization, is one of the most widely utilized indices. |
| (6) | | Year-on-year percentage appreciation of the dollar against the real (sell side). |
| (7) | | Brazilian federal treasury securities deflated by the IGP-DI and adjusted at each month-end to denote real annual yield. |
| (8) | | Financial results represent the difference between the consolidated public sector debt in one period and the consolidated public sector debt in the previous period, excluding the effects of the Government’s privatization program and the effect of exchange rate fluctuations on the debt levels between periods. |
| (9) | | Primary results represent Government revenues less Government expenditures, excluding interest expenditures on public debt. |
D-9
| (10) | | Presents debt on a consolidated basis, which is calculated as the gross internal debt less credits between governmental entities. |
| (11) | | Not including external private debt. Consolidated external private debt as of December 31, 2004 was $60.1 billion. |
| (12) | | Gross external debt less total reserves. |
| (13) | | Consolidated gross public sector debt. |
Sources: Fundação Instituto Brasileiro de Geografia e Estatística (“IBGE”); Getúlio Vargas Foundation; Central Bank
D-10
THE FEDERATIVE REPUBLIC OF BRAZIL
Area and Population
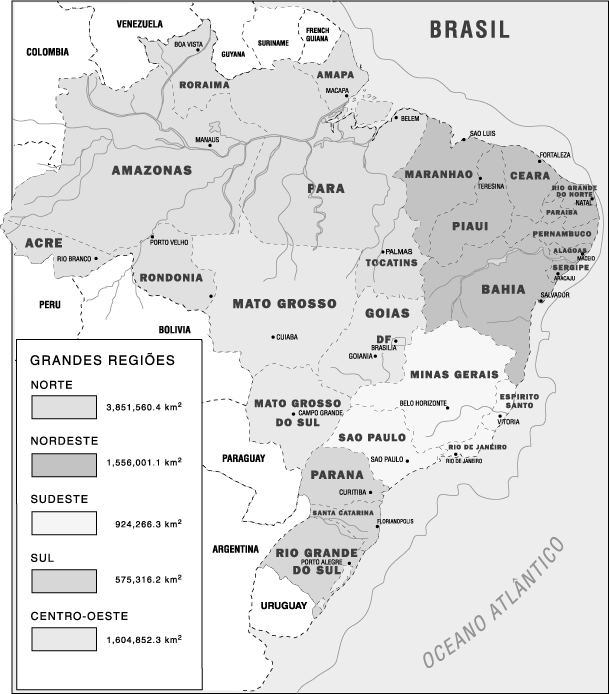
Brazil is the fifth largest country in the world and occupies nearly half the land area of South America. Brazil is officially divided into five regions consisting of 26 States and the Federal District, where the Republic’s capital, Brasília, is located.
Brazil has one of the most extensive river systems in the world. The dense equatorial forests and semi-arid plains of the North are drained by the Amazon River and the fertile grasslands of the South by the Paraná, Paraguay and Uruguay Rivers. Other river systems drain the central plains of Mato Grosso and the hills of Minas Gerais and Bahia. Most of the country lies between the Equator and the Tropic of Capricorn, and the climate varies from tropical to temperate. More than half of the total terrain of Brazil consists of rolling highlands varying from 650 to 3,000 feet in altitude.
According to the demographic census conducted by the Brazilian Institute of Geography and Statistics (“IBGE”) in 2000, Brazil had an estimated population of 169.8 million that year. IBGE also estimates that the population is currently growing at a rate of 1.6% per year. Approximately 138.0 million people, or 81.2% of the population, live in urban areas; the urban population has been increasing at a greater rate than the population as a whole. The largest cities in Brazil were São Paulo and Rio de Janeiro, with estimated populations of 10.4 million and 5.9 million, respectively, according to the 2000 census. Other cities with populations in excess of one million were Brasília, Belém, Belo Horizonte, Curitiba, Fortaleza, Goiânia, Manaus, Porto Alegre, Recife and Salvador. The States with the largest GDP in Brazil, São Paulo, Rio de Janeiro and Minas Gerais, had populations in excess of 37.0 million, 14.4 million and 17.9 million, respectively, on December 31, 2000.
There were approximately 136.9 million persons of working age (10 or more years of age) in Brazil in 2000. In 2001, the active labor force was composed of 75.5 million persons, of whom approximately 39.3% worked in retail and other services, approximately 20.6% in agriculture and related areas, approximately 13.5% in industry, approximately 6.5% in civil construction and approximately 18.4% in public administration.
Although social welfare indicators in Brazil such as per capita income, life expectancy, and infant mortality do not compare favorably to those of certain of Brazil’s neighboring countries, Statistics in the Human Development Report for 2004, published by the United Nations Development Program, show that Brazil has made significant progress in improving social welfare over the past three decades. During that period, life expectancy in Brazil increased by approximately 14.3% (from 59.5 years in 1970-1975 to 68 years in 2002) and the infant mortality rate decreased 68.4% (from 95 per 1,000 live births in 1970 to 30 per 1,000 live births in 2002). Adjusted for purchasing power parity by the United Nations, real GDP per capita rose 0.8% annually from 1975 to 2002. In addition, the reduction in inflation under the Plano Real and the consequent diminution of the erosion of purchasing power have improved the social welfare of large numbers of lower-income Brazilians.
D-11
The following table sets forth comparative GDP per capita figures and selected other comparative social indicators for 2002:
Table No. 2
Social Indicators, 2002
| | | | | | | | | | | | | | | | | | | | | | | | | | | | | | | | |
| | | Brazil
| | | Argentina
| | | Chile
| | | Ecuador
| | | Mexico
| | | Peru
| | | U.S.
| | | Venezuela
| |
Real GDP per capita(1) | | $ | 7,770 | | | $ | 10,880 | | | $ | 9,820 | | | $ | 3,580 | | | $ | 8,970 | | | $ | 5,010 | | | $ | 35,750 | | | $ | 5,380 | |
Life expectancy at birth (years) | | | 68.0 | | | | 74.1 | | | | 76.0 | | | | 70.7 | | | | 73.3 | | | | 69.7 | | | | 77.0 | | | | 73.6 | |
Infant mortality rate (per 1,000 births) | | | 30.0 | | | | 16.0 | | | | 10.0 | | | | 25.0 | | | | 24.0 | | | | 30.0 | | | | 7.0 | | | | 19.0 | |
Adult literacy rate | | | 86.4 | % | | | 97.0 | % | | | 95.7 | % | | | 91.0 | % | | | 90.5 | % | | | 85.0 | % | | | — | (2) | | | 93.1 | % |
| (1) | | Based on 2002 figures, adjusted for purchasing power parity by the United Nations. Per capita GDP amounts in this chart therefore differ from the amounts for per capita annual income set forth in “Summary Economic Information”. |
| (2) | | For purposes of calculating its “Human Development Index”, the United Nations Development Program applied a rate of 99.0%. |
Source: United Nations Development Program, Human Development Report 2004
Form of Government and Political Parties
Brazil was discovered by the Portuguese navigator Pedro Álvares Cabral in the year 1500 and remained a Portuguese colony for more than 300 years. The colonial government, first established in Salvador in the Northeast, was transferred to Rio de Janeiro in 1763. During the Napoleonic wars the Portuguese court moved from Lisbon to Rio de Janeiro, where it remained until 1821. In the following year Brazil declared its independence from Portugal, and the Prince Regent Dom Pedro I became Emperor of Brazil. His successor, Dom Pedro II, ruled Brazil for 49 years, until the proclamation of the Republic on November 15, 1889. From 1889 to 1930, the presidency of the Republic generally alternated between officeholders from the dominant States of Minas Gerais and São Paulo. This period, known as the First Republic, ended in 1930, when Getúlio Dorneles Vargas took power. Vargas governed Brazil for the next fifteen years, first as chief of a provisional government (1930-1934), then as a constitutional president elected by Congress (1934-1937) and finally as dictator (1937-1945) of a government that he termed the New State (Estado Novo). During the period from 1945 to 1961, Brazil held direct elections for the presidency. The resignation of President Jânio da Silva Quadros in 1961 after less than seven months in office and the resistance to the succession to the presidency of Vice President João Goulart created a political crisis that culminated in the establishment of a parliamentary system of government. The new system of government lasted approximately 16 months. In January 1963, after a plebiscite, Brazil returned to a presidential government, which was overthrown by the military in March 1964. Military governments ruled Brazil from 1964 until 1985, when a civilian president was elected by means of an electoral college composed of Senators and Deputies.
Thereafter, a series of political reforms was enacted, including the reestablishment of direct elections for the President and the calling of a Constitutional Assembly which, in October 1988, adopted a new Brazilian Constitution. In December 1989, Fernando Collor de Mello was elected President of Brazil for a five-year term in the first direct presidential election since 1960. Since October 1994, Brazil’s Presidents have been elected to serve four-year terms. In October 2002, Luiz Inácio Lula da Silva of the Workers’ Party (Partido dos Trabalhadores, or PT) was elected President of Brazil; he assumed the presidency on January 1, 2003.
Brazil is a federative republic with broad powers granted to the federal Government. The Constitution provides for three independent branches of government: an executive branch headed by the President; a legislative branch consisting of the bicameral National Congress, composed of the Chamber of Deputies and the
D-12
Senate; and a judicial branch consisting of the Federal Supreme Court and lower federal and State courts. The Constitution provided for a mandatory constitutional review that began in October 1993 and ended on May 31, 1994. The review resulted in the adoption of six amendments, which included the reduction of the presidential term of office from five to four years. The Constitution also provided for a plebiscite in April 1993 in which voters were permitted to consider alternative systems of government, including a return to the monarchy; in that plebiscite, the Brazilian electorate voted overwhelmingly to maintain the presidential system of government.
Under the Constitution, the President is elected by direct vote. A constitutional amendment adopted in June 1997 permits the re-election for a second term of the President and certain other elected officials. The President’s powers include the right to appoint ministers and key executives in selected administrative posts. The President may issue provisional measures (medidas provisórias) with the same scope and effect as legislation enacted by the National Congress. However, Constitutional Amendment No. 32, which became effective on September 12, 2001, prohibits the issuance of provisional measures for, among other things, the implementation of multi-year plans and budgets, the seizure of financial or other assets, and the regulation of matters which the Federal Constitution specifically requires the National Congress to regulate through complementary law. Under Constitutional Amendment No. 32, provisional measures are enforceable for up to 60 days, extendable for a single additional period of 60 days. If a provisional measure is rejected or if it is not voted by the National Congress within the enforcement period, the provisional measure becomes invalid as of the date it was issued. The amendment expressly prohibits the re-issuance of provisional measures not voted by the National Congress within the enforcement period.
The legislative branch of government consists of a bicameral National Congress composed of the Senate and the Chamber of Deputies. Ordinary legislation requires a simple majority vote in both houses of the National Congress for adoption. Amendments to the Constitution require an absolute three-fifths majority vote, in each of two rounds of voting, in both houses of the legislature. A matter addressed in a proposed amendment that is rejected cannot be reproposed during the same legislative session. The Senate is composed of 81 Senators, elected for staggered eight-year terms, and the Chamber of Deputies has 513 Deputies, elected for concurrent four-year terms. Each State and the Federal District is entitled to three Senators. The number of Deputies is based on a proportional representation system weighted in favor of the less populated States which, as the population increases in the larger States, assures the smaller States an important role in the National Congress.
D-13
The following table sets forth by the number and party affiliations of Senators and Deputies in the National Congress as of June 11, 2005.
Table No. 3
Distribution of National Congressional Seats by Party
| | | | |
| | | Senate
| | Chamber of Deputies
|
Partido dos Trabalhadores (PT) | | 13 | | 91 |
Partido da Frente Liberal (PFL) | | 16 | | 59 |
Partido do Movimento Democrático Brasileiro (PMDB) | | 22 | | 85 |
Partido da Social Democracia Brasileira (PSDB) | | 12 | | 49 |
Partido Trabalhista Brasileiro (PTB) | | 3 | | 47 |
Partido Progressista Brasileiro (PP) | | 1 | | 54 |
Partido Liberal (PL) | | 3 | | 54 |
Partido Socialista Brasileiro (PSB) | | 3 | | 17 |
Partido Popular Socialista (PPS) | | 1 | | 17 |
Partido Democrático Trabalhista (PDT) | | 4 | | 14 |
Others | | 3 | | 26 |
| | |
| |
|
Total | | 81 | | 513 |
Sources: Official Websites of the Offices of the Chamber of Deputies and of the Senate and Central Bank
The judicial power is exercised by the Federal Supreme Court (composed of 11 Justices), the Superior Court of Justice (composed of 33 Justices), the Federal Regional Courts (appeals courts), military courts, labor courts, electoral courts and the several lower federal courts. The Federal Supreme Court, whose members are appointed for life by the President, has ultimate appellate jurisdiction over decisions rendered by lower federal and State courts on Constitutional matters.
Brazil is divided administratively into 26 States and the Federal District. The States are designated as autonomous entities within the federative union and have all powers that the Constitution does not preclude the States from exercising. The Constitution reserves to the Republic the exclusive power to legislate in certain areas, including, among others, monetary systems, foreign affairs and trade, social security and national defense. The States may exercise legislative power in matters not reserved exclusively to the Republic and have, concurrently with the Republic, certain powers of taxation. At the State level, executive power is exercised by governors elected for four-year terms and legislative power by State deputies also elected for four-year terms. Judicial power at the State level is vested in the State courts, and appeals of State court judgments may be taken to the Superior Court of Justice and the Federal Supreme Court.
Federal, State and Local Elections
National general elections were held in October 2002. The offices of the President and State Governors, two-thirds of the Senate and all the seats in the Federal Chamber of Deputies, as well as seats in the State legislatures, were determined pursuant to the election. After winning a runoff election with 61% of the vote on October 27, 2002, Luiz Inácio Lula da Silva assumed the presidency of Brazil on January 1, 2003. Mr. da Silva is a member of the Workers’ Party (Partido dos Trabalhadores, or PT). Following the October 2002 elections, Mr. da Silva’s party held 17.5% of the seats in the Chamber of Deputies and 12.3% of the seats in the Senate. Mr. da Silva was elected as part of a broad coalition consisting of the Liberal Party and five smaller parties, including the Brazilian Socialist Party (PSB) and the Brazilian Workers Party (PTB).
Brazil last held local elections on October 3, 2004. Brazil’s next general elections are slated to be held in October 2006.
D-14
External Affairs and Membership in International Organizations
Brazil maintains diplomatic and trade relations with almost every nation in the world. It has been a member of the United Nations since 1945. The Republic participates in the organizations under the control of the United Nations Secretariat, as well as others of a voluntary character, such as the International Fund for Agriculture and Development.
Brazil is an original member of the International Monetary Fund and the World Bank, as well as three affiliates of the World Bank, the International Finance Corporation, the International Development Association and the Multilateral Investment Guaranty Agency. Brazil was an original member of the General Agreement on Tariffs and Trade (“GATT”) and is a charter member of the World Trade Organization. In addition, Brazil is an original member of the Inter-American Development Bank (“IDB”), the Inter-American Investment Corporation, the African Development Bank Group and the International Fund for Agricultural Development.
At the regional level, Brazil participates in the Organization of American States (the “OAS”) and in several sub-regional organizations under the OAS, as well as in the Latin American Economic System, the Latin American Integration Association, the Andean Development Corporation and the Financial Fund for the Development of the River Plate Basin.
In March 1991, Brazil, Argentina, Paraguay and Uruguay entered into the Treaty of Asunción, formally establishing the Mercado Comum do Sul (“Mercosul”), a common market organization composed of the signatory nations. In December 1994, the four member countries signed an agreement establishing the date of January 1, 1995 for the implementation of a Common External Tariff (“CET”) intended to transform the region into a customs union. However, under Decision No. 31 dated December 15, 2003 of the Common Market Council (Conselho do Mercado Comun, or CMC), each member country (other than Paraguay and Uruguay) is permitted a list of 100 items as exceptions to the CET through December 31, 2005, while Paraguay and Uruguay are permitted a list of up to 150 items and 125 items, respectively, until 2010. Because of these exceptions to the CET, the full implementation of a customs union has not yet been achieved.
Mercosul has six associate members: Bolivia, Chile, Colombia, Ecuador, Peru and Venezuela. Associate members are included in free trade treaties but have no voting rights within Merscosul.
Mercosul has attempted to form trading relations with other countries. Brazilian Presidential Decree No. 4,458 dated November 5, 2002 ratified an automobile accord between Mercosul and Mexico that is intended to increase trade in automotive products between the two parties. In December 2004, Mercosul also concluded preferential trade accords with India and the Southern African Customs Union (SACU).
At the first Summit of the Americas in Miami, Florida, in December 1994, Brazil joined 33 other countries in the Western Hemisphere in negotiations for the establishment of a Free Trade Area of the Americas (“FTAA”). In December 1995, Mercosul and the European Union signed a framework agreement for the development of free trade between them. In 1996, Mercosul signed agreements with Chile and Bolivia, effective October 1996 and February 1997, respectively, for the development of free trade among them; these agreements were approved by the Brazilian National Congress in September 1996 and April 1997, respectively. Mercosul also signed an agreement with Chile, approved by Brazilian Presidential Decree No. 4,404 dated October 3, 2002, that provides for the reduction of tariffs for certain automotive, chemical and agricultural products in trade between Brazil and Chile.
On October 29, 1999, Brazil and Argentina signed a protocol under the Treaty of Asunción to give effect to a memorandum of understanding between institutions in the two countries responsible for the certification of products that harmonizes the two countries’ standards for certification of certain products. The agreement covers a variety of products, including shoes, home appliances and toys.
D-15
THE BRAZILIAN ECONOMY
Historical Background
From the late 1960s through 1982, Brazil followed an import-substitution, high-growth development strategy financed, in large part, by heavy recourse to foreign borrowings. Foreign debt grew at an accelerated pace in response to the oil shocks of the 1970s and, when international interest rates rose sharply in 1979-80, the resulting accumulated external debt became one of Brazil’s most pressing problems in the decade that followed. See “Public Debt—Debt Crisis and Restructuring”. The debt crisis of the 1980s and high inflation substantially depressed real growth of Brazil’s GDP, which averaged 2.3% per year from 1981 to 1989. The public sector’s role in the economy also expanded markedly, with many key economic sectors subject to Government monopoly or subsidized participation, and significant structural distortions were introduced through high tariffs and the creation of subsidies and tax credit incentives. Significant increases in the money supply to finance a large and growing fiscal deficit further fueled inflationary pressures.
Efforts to address these problems during the late 1980s and early 1990s were largely unsuccessful. High inflation and the recurrent threat of hyperinflation during this period prompted the Government to pursue a series of stabilization plans, but these plans were undermined by a variety of factors. Stabilization measures implemented at that time relied on mechanisms, such as price and wage freezes and/or unilateral modifications of the terms of financial contracts, that were not supported by fiscal and monetary reforms. A central problem during this period was the public sector, which ran operational deficits averaging more than 5% of GDP during the five-year period from 1985 to 1989, while monetary policy was compromised by the short-term refinancing of public sector debt. These problems were aggravated by the 1988 Constitution, which limited the ability of the federal Government to dismiss public sector employees and reallocated public resources, in particular tax revenues, from the federal Government to the States and municipalities without a proportional shift of responsibilities to them, thereby further constraining the effectiveness of federal Government fiscal policy. The practice of inflation indexation in the economy, which made prices downwardly rigid, also helped to undermine stabilization measures. See “—Relationship between the Federal and Local Governments”, “—Employment” and “Public Finance—Taxation and Revenue Sharing Systems”.
In December 1993, the Government announced a stabilization program, known as the Plano Real, aimed at curtailing inflation and building a foundation for sustained economic growth. The Plano Real was designed to address persistent deficits in the Government’s accounts, expansive credit policies and widespread, backward-looking indexation.
The Plano Real had three stages. The first stage included a fiscal adjustment proposal for 1994, consisting of a combination of spending cuts and an increase in tax rates and collections intended to eliminate a budget deficit originally projected at $22.0 billion. Elements of the proposal included (i) cuts in current expenditures and investment through the transfer of some activities from the federal Government to the States and municipalities, (ii) the establishment of an Emergency Social Fund (“ESF”), financed by reductions in constitutionally mandated transfers of federal Government revenues to the States and municipalities, to ensure financing of social welfare spending by the federal Government, (iii) a prohibition on sales of public bonds by the Government, except to refinance existing debt and for certain specified expenditures and investments, (iv) new taxes, including a new levy on financial transactions, and (v) the collection of mandatory Social Security contributions (“COFINS”) in order to finance health care and welfare programs, following the November 1993 confirmation by the Federal Supreme Court that such contributions were permissible under the Constitution.
The second stage of the Plano Real, initiated on March 1, 1994, began the process of reform of the Brazilian monetary system. Brazil’s long history of high inflation had led to the continuous and systematic deterioration of the domestic currency, which no longer served as a store of value and had lost its utility as a unit of account. Because inflation had reduced dramatically the information content of prices quoted in local currency, economic agents had included in their contracts a number of mechanisms for indexation (providing for the adjustment of the amounts payable thereunder by an agreed-upon inflation or tax rate to preserve the economic value of such
D-16
contracts) and the denomination of obligations in indexed units of account. The process of rehabilitation of the national currency began with the creation and dissemination of the Unidade Real de Valor (the Unit of Real Value, or “URV”) as a unit of account. The second stage of the Plano Real was designed to eliminate the indexation of prices to prior inflation and to link indexation to the URV instead.
The third stage of the Plano Real began on July 1, 1994, with the introduction of the real as Brazil’s currency. All contracts denominated in URVs were automatically converted into reais at a conversion rate of one to one, and the URV, together with the cruzeiro real, ceased to exist (although the cruzeiro real was generally accepted until August 31, 1994). The real initially appreciated against the U.S. dollar, with the rate in the commercial market (sell side) moving from R$1.00/dollar, when the real was introduced, to R$0.829/dollar on October 14, 1994. In March 1995, the Central Bank formalized an exchange band system pursuant to which the real would be permitted to float against the U.S. dollar within bands established by the Central Bank. Thereafter, the real gradually declined in value against the dollar, reaching R$1.1164 per dollar on December 31, 1997 and declining further to R$1.2087 per dollar on December 31, 1998. As described more fully below, however, the Central Bank was forced in January 1999 to abandon its exchange band mechanism, which encouraged small exchange devaluations within a specified range, and permit the value of the real to float freely against that of the U.S. dollar.
Largely as a result of the measures under the Plano Real, the average monthly rate of inflation dropped significantly from 43.2% during the first half of 1994 to 2.65% during the second half of that year. The annual rate of inflation for 1994 was 909.6%, down from 2,708.6% in 1993. The public sector operational balance also showed a surplus of 1.3% of GDP in 1994, versus a 0.2% of GDP public sector operational surplus in 1993. However, the external accounts showed a higher current account deficit in 1994 as a result of an increase in imports and a reduction in net capital account surplus.
In January 1999, Brazil’s international reserves came under significant pressure as a result of a series of events that month. On January 6, 1999, the newly inaugurated governor of the State of Minas Gerais announced that the State would suspend for 90 days payments in respect of the State’s approximately R$18.3 billion debt to the Government. A week later, on January 13, 1999, Gustavo H.B. Franco, the president of the Central Bank and one of the architects of the Plano Real, resigned and was replaced by Francisco Lopes, who attempted a controlled devaluation of the real by widening the band within which the real was permitted to trade. Subsequent Central Bank intervention failed to keep the real-U.S. dollar exchange rate within the new band, however, and on January 15, 1999, the Central Bank announced that the real would be permitted to float, with Central Bank intervention to be made only in times of extreme volatility.
On February 2, 1999, the Government designated Armínio Fraga Neto to replace Francisco Lopes as president of the Central Bank. Following Mr. Fraga’s confirmation on March 3, 1999, the Central Bank eliminated two widely used overnight rates, the Central Bank Basic Rate (“TBC”) and the Central Bank Assistance Rate (“TBAN”), giving primacy to the Over/Selic rate; because the Central Bank could influence the Over/Selic rate on a daily basis through its participation in auctions, repurchase transactions and reverse repurchase transactions, the Over/Selic rate permitted the Central Bank to react more quickly to changes in market conditions.
Following its decision to permit the real to float, the Government formally adopted inflation targeting as its monetary policy framework. See “The Financial System—Monetary Policy and Money Supply”. The Government also began negotiations with the IMF on adjustments to the 1999-2001 economic program agreed in November 1998 and new economic targets in light of the new foreign exchange regime introduced in January 1999. On March 5, 1999, Brazil and the IMF announced that they had reached agreement on the adjustments. Under the agreement, Brazil undertook to adopt measures designed to achieve primary surpluses, excluding debt payments, of at least 3.1% of GDP in 1999, 3.25% of GDP in 2000 and 3.35% of GDP in 2001, substantially greater than the 2.6%, 2.8% and 3.0% of GDP surpluses for 1999, 2000, and 2001, respectively, under the November 13, 1998 agreement with the IMF.
D-17
Recent Economic Events and Policies
During the second half of 2000, uncertainties about the U.S economy, concerns about Argentina and rising oil prices caused the real to decline in value against the U.S. dollar. The real-U.S. dollar exchange rate (sell side) in the commercial exchange market, as published by the Central Bank, declined 7.5% from R$1.8234 to $1.00 on August 31, 2000 to R$1.9596 to $1.00 on November 30, 2000. Brazil’s continued compliance with a $41.8 billion IMF-led support program agreed on November 13, 1998, as established by the IMF’s sixth review on November 28, 2000, and an improvement in the external environment resulting from interest rate reductions in the United States, reduced the downward pressure on the exchange rate, which ended the year at R$1.9554 to $1.00. The improved conditions also permitted the Central Bank to lower its Over/Selic rate target to 15.75% on December 20, 2000 and 15.25% on January 17, 2001.
During the first five months of 2001, however, renewed concerns about Argentina, together with nervousness about the political impact of the alleged misconduct of certain public officials, put further downward pressure on the real. The real fell from R$1.9711 to $1.00 on January 31, 2001, to R$2.1847 to $1.00 on April 30, 2001. In May 2001, the Government announced its intention to reduce energy consumption through rationing and other measures in response to a severe power shortage. In addition, Argentina announced its intention to link its currency to both the U.S. dollar and the euro and, on June 15, 2001, announced the introduction of a special exchange rate for exporters in that country that permitted such exporters to exchange U.S. dollars for pesos for the combined average value of a U.S. dollar and a euro. Concerns about the impact of the Government’s energy measures and a possible Argentine devaluation of the peso drove the real to new lows against the U.S. dollar. The real-U.S. dollar exchange rate (sell side) in the commercial exchange market, as published by the Central Bank of Brazil, reached R$2.5517 to $1.00 on August 31, 2001.
Citing an increase in core inflation, the uncertainties related to the effects of exchange rate depreciation and the accelerating pace of economic activity, the Central Bank raised the Over/Selic rate target to 15.75% on March 21, 2001, 16.25% on April 18, 2001 and 16.75% on May 24, 2001. After the real dropped to R$2.4748 to $1.00 on June 20, 2001, the Central Bank raised its Over/Selic rate target by 1.50% to 18.25%. The Central Bank also announced on June 21, 2001 that it had intervened in the foreign exchange market by selling U.S. dollars and buying reais and that the Government would raise $10.8 billion in additional funds to increase its international reserves and to finance future interventions to support the real. Brazil planned to raise the funds by purchasing $2 billion under its IMF facility, postponing a $1.8 billion repayment under that facility, borrowing $1.8 billion from international financial institutions, issuing an additional $1 billion in new bonds in the international capital markets and selling shares of privatized companies for $3.8 billion. The $10.8 billion amount also included $400 million in proceeds of a bond issuance by Brazil’s National Bank for Economic and Social Development, or BNDES, completed earlier in the year. Approximately $6.2 billion of the funds were to be used to increase the level of Brazil’s foreign reserves, while the remaining $4.6 billion were to be available for use for further interventions in the foreign exchange markets.
After recovering briefly to R$2.2923 to $1.00 on June 28, 2001, the real declined to a low of R$2.5979 to $1.00 on July 16, 2001. The real recovered slightly to R$2.4247 to $1.00 on July 24, 2001 following the Central Bank’s decision on July 18, 2001 to raise its Over/Selic rate target to 19.00% from 18.25%. The Government also announced during the week of July 23, 2001 that it intended to negotiate an extension of its facility with the IMF and that it would seek to reduce 2001 spending by R$1 billion.
On September 14, 2001, the IMF announced that its Executive Board had approved a new standby facility for Brazil in the amount of SDR 12.14 billion (approximately $15.6 billion) in support of the Government’s economic and financial program through December 2002. Approximately $4.7 billion was available immediately, and Brazil made purchases totaling approximately $4.7 billion at the time the facility was established. The remainder was to be made available in five installments, subject to the satisfaction of certain performance criteria set forth in the Memorandum of Economic Policies accompanying Brazil’s letter of intent dated August 23, 2001. These performance criteria included targets for the primary surplus of 3.35% of GDP for 2001 and 3.5% of GDP for 2002 (an increase from the 3.0% target for both years under Brazil’s December 1998 IMF facility) and a net
D-18
international reserves floor of $20 billion (a $5 billion reduction from the floor under Brazil’s December 1998 IMF facility). The standby facility replaced the previous three-year standby arrangement approved in December 1998.
Following terrorist attacks on the World Trade Center and the Pentagon in the United States on September 11, 2001, the real-U.S. dollar rate moved to a new low, reaching R$2.8007 to $1.00 on September 21, 2001. The real began to recover after October 11, 2001, reaching R$2.5287 to $1.00 on November 30, 2001 and R$2.3204 to $1.00 on December 31, 2001. After giving effect to purchases under the IMF standby facility and a repurchase by the Republic of Poland for $2.5 billion of certain Paris Club credits owing to Brazil on November 13, 2001, Brazil’s international reserves stood at $35.9 billion on December 31, 2001.
The Republic of Argentina’s announcement in December 2001 and January 2002 that it would suspend payments in respect of certain of its public external debt and modify its exchange rate system, together with lower than expected trade flows, caused the real to fall approximately 4.2% during January 2002 to close at R$2.4183 to $1.00 on January 31, 2002. The real subsequently recovered, however, as a result of improving economic conditions in Brazil resulting from the end of energy rationing on March 1, 2002 and two reductions in the Central Bank’s Over/Selic rate target to 18.75% on February 20, 2002 and 18.50% on March 20, 2002. The real was also helped by the IMF’s announcements on January 23, 2002 and March 26, 2002 that it had completed reviews of Brazil’s performance under the IMF standby facility and that, based on those reviews, Brazil would be permitted to draw, if necessary, installments of SDR 358.6 million (approximately $448 million) and SDR 3.7 billion (approximately $5 billion). The real rose against the U.S. dollar, reaching R$2.3625 to $1.00 on April 30, 2002.
The real began to depreciate again in May 2002 amid renewed concerns about the potential contagion effect of Argentina’s problems and uncertainty about the October 2002 elections in Brazil. The value of the real declined to R$2.5220 to $1.00 on May 31, 2002 and R$2.7486 to $1.00 on June 12, 2002 before recovering to R$2.6700 to $1.00 on June 18, 2002. On June 13, 2002, the Government announced a new set of economic measures that included, among other things, (i) an increase in the 2002 target for the primary surplus to 3.75% of GDP from 3.5% of GDP, (ii) a purchase of an additional $10 billion under the IMF standby facility, (iii) a reduction of the minimum net international reserve requirement under that facility to $15 billion from $20 billion, (iv) repurchases from time to time of up to $3 billion aggregate principal amount of Brazil’s outstanding external debt securities, with an emphasis on those maturing in 2003 and 2004, (v) periodic interventions by the Central Bank in the foreign exchange market, (vi) rollovers of long-term Brazilian Treasury floating rate and U.S. dollar-indexed securities with shorter term securities and (vii) repurchases from time to time by the Brazilian Treasury of its domestic debt securities. In addition, the World Bank announced that day that it had approved three loans totaling $1.0 billion. The loans included a $400 million loan intended to provide continued support to the comprehensive financial sector reform being pursued by the Government, a $450 million loan to support reforms in the energy sector and a $160 million loan to finance the School Improvement Program Fund.
The IMF also announced on June 18, 2002 that it had completed its third review under the standby arrangement approved on September 14, 2001. In its press release, the IMF stated that Brazil’s performance under the facility remained strong. The IMF added “over the medium term, the authorities needed to continue to work to reduce Brazil’s large external borrowing requirement and the borrowing requirements of the public sector, as well as to reduce the large share of the public debt that is contracted at floating rates or linked to the exchange rate. Further progress in these areas, as well as on remaining elements of the structural reform agenda, will contribute to a further strengthening in Brazil’s position in the years ahead”. Based on the third review, the IMF made an additional SDR 3.7 billion (or approximately $4.8 billion) available for purchase under the standby facility, bringing the total amount available to be drawn to SDR 7.7 billion (or approximately $10 billion). Brazil withdrew the entire amount available on June 21, 2002.
From July through October 2002, the real continued to decline against the U.S. dollar. In addition to Argentina’s financial crisis and uncertainty about the October general elections, the decline was also attributable
D-19
to concerns about terrorism and tensions in the Middle East. The real-U.S. dollar exchange rate (sell side), as published by the Central Bank, declined from R$2.8444 to $1.00 on June 28, 2002 to R$3.4285 to $1.00 on July 31, 2002 and to R$3.8949 to $1.00 on September 30, 2002 before reaching a low of R$3.9552 to $1.00 on October 22, 2002. Following the October 2002 elections, the real began to recover against the U.S. dollar, reaching R$3.5333 to $1.00 on December 31, 2002 and R$2.8892 to $1.00 on December 31, 2003.
Largely as a result of a depreciation in the value of the real, increases in administered prices (prices subject to Government regulation, such as rates for telephone calls and prices for gasoline and other petroleum derivatives, and prices governed by contracts with vendors, such as fares charged for certain public transportation) and rising oil prices in the world markets, the inflation rate began to rise in Brazil during the fourth quarter of 2002. The broad consumer rate index (IPCA), which the Central Bank uses for inflation-targeting purposes, began to accelerate in October 2002, increasing 1.3% in October 2002, 3.02% in November 2002, 2.1% in December 2002 and 2.3% in January 2003. As a result, the inflation rate, as measured by IPCA, increased from 7.7% for the 12 months ending June 30, 2002 to 12.5% for the 12 months ending December 31, 2002; it continued to rise to 17.2% for the 12 months ending May 31, 2003. The Central Bank responded by increasing its overnight Over/Selic interest rate target from 18% to 21% on October 14, 2002, to 22% on November 20, 2002, to 25% on December 18, 2002, to 25.5% on January 22, 2003 and to 26.5% on February 19, 2003. Following these increases, the inflation rate, as measured by IPCA, declined to 9.3% for 2003.
The IMF announced on September 6, 2002, in response to Brazil’s economic situation, that it had approved Brazil’s request for a new 15-month standby facility of SDR 22.8 billion (approximately $32.4 billion as of May 31, 2003) to support the country’s economic and financial program through December 2003. The standby credit represented the largest granted by the IMF in SDR terms. In its Memorandum of Economic Policies relating to the facility, the Government stated that that it had set a consolidated public sector primary surplus target of 3.75% of GDP for 2003 and that it intended to pursue a three-pronged debt management strategy consisting of (i) reducing foreign exchange securities and floating-rate securities as a percentage of the Government’s domestic securities debt, (ii) lengthening the average maturity of new debt issuances to reduce further the level of short-term debt and (iii) progressively limiting the foreign exchange exposure of the Government (including the Central Bank). In addition, the Technical Memorandum of Understanding relating to the facility set forth certain performance criteria relating to, among other things, the primary balance of the consolidated public sector, the net debt of the consolidated public sector, the publicly guaranteed external debt of the private sector, the nonfinancial public sector short-term external debt and net international reserves. This new standby facility replaced the 15-month standby facility that had been approved by the IMF on September 14, 2001.
In its February 28, 2003 letter of intent, the first by President da Silva’s economic team, the Government advised the IMF that the Government was raising its consolidated public sector primary surplus target for 2003 to 4.25% of GDP and described proposed reforms to the pension and tax systems. The Government also underscored its commitment to implement its Zero Hunger program and other similar initiatives. In a subsequent letter of intent dated May 28, 2003, the Government further advised the IMF of, among other things, its continuing efforts to reduce inflationary pressure on the real, and a proposed bankruptcy law to be submitted to the National Congress.
As the Government continued to pursue an economic policy emphasizing fiscal discipline, a floating exchange rate and inflation targeting, Brazil was able to regain access to the international capital markets. Brazil completed offerings of $5.8 billion aggregate principal amount of global bonds on May 6, 2003, June 17, 2003, August 7, 2003, September 18, 2003 and October 22, 2003. These issues differed from Brazil’s other global bond issues in that the new bonds included provisions known as “collective action clauses”, which permit Brazil to amend certain key terms of the bonds, including the maturity date, interest rate and other payment terms, with the consent of the holders of not less than 85% of the aggregate principal amount of the outstanding bonds. See “Public Debt—External Debt”. In addition, the real began to appreciate against the U.S. dollar, ending 2003 at R$2.8892 to $1.00.
D-20
On December 15, 2003, the IMF announced that its Executive Board had approved a fifteen-month extension of Brazil’s existing standby facility. A total of SDR 10.1 billion (approximately $14.8 billion) was available under the facility, composed of SDR 5.6 billion (approximately $8.2 billion) in unused amounts under the existing facility and SDR 4.5 billion (approximately $6.6 billion) in additional funds. In addition, the IMF extended by one year repurchases of SDR 4 billion (approximately $5.8 billion) that Brazil would otherwise have been required to make in each of 2005 and 2006. In its Letter of Intent relating to the extended and augmented facility, Brazil stated that the maintenance of sound fiscal and monetary policies lay at the core of its program for 2004, including a primary surplus target of 4.25% of GDP for 2004.
On June 18, 2004, the IMF announced that it had completed the seventh review of Brazil’s performance under the standby facility. The IMF stated that Brazil had satisfied all performance criteria under the facility. The Government had advised the IMF that it considered the arrangement precautionary and did not draw on the most recent installment under the facility. The standby agreement with the IMF was last reviewed on March 21, 2005. On March 28, 2005, the Government announced that Brazil would not renew the agreement with the IMF because of improvement and a reduction in external and fiscal vulnerability since the last renewal on September 2003.
The Brazilian economy recovered in 2004 as GDP rose 4.9% relative to 2003 and the formal labor market increased by 1.5 million jobs. Production in the industrial, agricultural and services sectors rose 6.2%, 5.3% and 3.3%, respectively, in 2004 relative to 2003. Brazil’s consolidated public sector primary surplus for 2004 was R$81.1 billion, or 4.6% of GDP. The improved consolidated public sector primary surplus led to a reduction in the consolidated public sector nominal deficit, to 2.7% of GDP in 2004 from 5.1% of GDP in 2003. In addition, the inflation rate, as measured by IPCA, was 7.6%, within the range established by the National Monetary Council for 2004.
Market concerns about the timing and magnitude of interest rate increases in the U.S. and an increase in oil prices led to the concerns in the market, causing the real to depreciate against the U.S. dollar. The real recovered in September 2004, however, because of the performance of Brazil’s external sector. In 2004, the current account surplus reached a record high of $11.7 billion, driven in large part by a trade surplus of approximately $33.7 billion. The balance of payments also recorded a surplus of $2.2 billion, reducing the need for external financing. The real ended the year at R$2.6544 to $1.00, up from R$2.8892 to $1.00 in 2003.
On February 22, 2005, the Government announced a pilot program for selected investments endorsed by the International Monetary Fund, or IMF. The program contemplates the expenditure of approximately R$2.8 billion per year over three years (2005-2007) for infrastructure and other public projects that have the potential to provide macroeconomic and fiscal benefits in the medium term. During 2005, the Government intends to spend approximately R$2.1 billion on the construction and maintenance of roads as part of this pilot project.
Relationship between the Federal and Local Governments
The 1988 Constitution reallocated public resources from the federal Government to the States and municipalities without a corresponding shift of the responsibility to provide certain essential public services, which remained with the federal Government. The imbalance of resources and responsibilities was exacerbated by State and local borrowing, particularly during State election campaigns.
The realignment of spending responsibilities is particularly important for a sustainable solution to Brazil’s fiscal problems. Uncommitted revenue of the Government currently does not exceed 20.0% of total revenues and is insufficient to meet the Government’s funding needs with respect to personnel, procurement, investment and debt service. Unless constitutionally mandated transfers to States and municipalities are modified, a portion of any increases in revenue may be automatically translated into new expenditures. See “Public Finance—Taxation and Revenue Sharing Systems”.
D-21
In addition, supervision of the State banks has intensified as part of the effort to curtail abuses in State and local borrowing. Because of the measures taken to reduce liquidity in the domestic market, certain State-owned and privately owned banks that were dependent on readily available overnight interbank funds have faced liquidity difficulties. On December 30, 1994, authorities from the Central Bank assumed responsibility for the operation of two large State-owned banks, Banco do Estado do São Paulo S.A. (“BANESPA”) and Banco do Estado do Rio de Janeiro S.A. (“BANERJ”). Banco Itaú S.A. purchased two State banks—BANERJ on June 26, 1997 for R$331.0 million and Banco do Estado de Minas Gerais (“BEMGE”) on September 14, 1998 for R$583.0 million—and control of BANESPA passed to the federal Government on December 31, 1997 in connection with the restructuring of the State of São Paulo’s R$16.8 billion debt to BANESPA. The Government subsequently sold 60% of the outstanding common (voting) shares and 30% of the outstanding preferred (nonvoting) shares of BANESPA to Banco Santander Central Hispano of Spain for R$7.05 billion on November 20, 2000. In addition, Banco do Estado de Pernambuco S.A.(“BANDEPE”) was sold to Banco ABN AMRO on November 17, 1998 for R$182.9 million, and Banco Baneb, a bank controlled by the State of Bahia, was sold in June 1999 to Banco Bradesco S.A. for R$260.0 million. Other significant dispositions include the sale by the State of Paraná of a controlling interest in Banco do Estado do Paraná S.A. (“Banestado”) to Banco Itaú S.A. for R$1.625 billion on October 17, 2000, the sale by the federal Government of a controlling interest in Banco do Estado do Amazonas S.A. (“BEA”) to Banco Bradesco S.A. for R$182.9 million on January 29, 2002 and the sale by the federal Government of a controlling interest in Banco do Estado do Maranhão (“BEM”) to Banco Bradesco S.A. for R$78 million on February 10, 2004. The Republic is in the process of liquidating or has liquidated certain other State financial institutions such as the State banks of Acre, Alagoas, Amapá, Mato Grosso, Rio Grande do Norte and Rondônia. As of December 31, 2004, four State financial institutions were under liquidation within the scope of the Support Program for the Reduction of the State Public Sector in Banking Activity (“PROES”). See “The Financial System—General” and “—Public Sector Financial Institutions”.
In an effort to correct imbalances in the finances of State and local governments, the Government has introduced initiatives in recent years that have included the rescheduling of State and local debt and the imposition of limits on the incurrence of new debt.
In 1995, for example, the Government implemented the Support Program for the Restructuring and Fiscal Adjustment of States, which was aimed at correcting chronic imbalances in the finances of the State and local governments. Under this program, State and local governments were required to comply with targets relating to fiscal balance as a condition for receiving Government financing. The fiscal adjustments to be implemented by the States included the following: (i) reduction and control of personnel costs, (ii) compliance with privatization programs for State enterprises and certain public services in cooperation with BNDES and the appropriate federal ministries, (iii) reform of tax collection systems and implementation of financial controls and budgetary limitations at the State level, (iv) reduction of high levels of State-level indebtedness through restructuring facilities with the National Treasury and (v) the commitment to meet certain minimum fiscal targets (including satisfactory debt/net revenue ratios) as a step towards the balancing of State budgets. Nineteen State governments signed agreements undertaking to implement required policy changes as a condition of receiving specified financial assistance. The total amount of financing disbursed under this program was approximately R$3.3 billion.
In 1996, the Government issued two measures relating to the restructuring of State debt. Provisional Measure No. 1,560 (subsequently enacted as Law No. 9,496 of September 11, 1997) authorized the federal Government to assist in the refinancing of (i) the public securities debt of the States, (ii) loans made by CEF to the States under various federal measures authorizing temporary financial assistance to the States and (iii) the debt of the States owed to banks controlled by such States. The debt eligible to be refinanced under Law No. 9,496 included debt previously refinanced under the Support Program for the Restructuring and Fiscal Adjustment of States. Each refinancing arrangement was to be subject to the previous approval of both the federal Senate and the respective State Assembly. In addition to specific targets for each State or the Federal District, the refinancing contracts were to require: (i) improvements in the primary fiscal results, (ii) reductions
D-22
in the expenditures pertaining to civil servants, (iii) achievement of a specific “financial debt/actual net revenue” ratio, (iv) improvement in the collection of State revenues, (v) adoption of privatization programs, concession of public services and administrative reform and (vi) limitation of the ratio of investment expenditure to actual net revenue. All of the States except the State of Tocantins signed agreements with the Government, covering approximately R$115 billion in debt.
Provisional Measure No. 1,514 dated August 7, 1996 (subsequently superseded by Provisional Measure No. 2,192 dated August 24, 2001) established a program to facilitate the restructuring of Brazil’s State banks. This provisional measure permitted the Republic, in its sole discretion, to (i) acquire control of a financial institution, exclusively for its privatization or dissolution, (ii) finance the closure of the financial institution or its transformation into a non-financial institution or (iii) finance the prior arrangements necessary for the privatization of the financial institution or to guarantee any credit by the Central Bank for the same end, in accordance with rules to be promulgated by the National Monetary Council. The Republic could also acquire contractual debts owed by a controlling shareholder to the financial institution and refinance the debts so acquired. As of December 31, 2004, forty-five State banks had been restructured at a cost to the National Treasury of R$21.9 billion.
The efforts to control State finances culminated in the passage of the Fiscal Responsibility Law and the related Fiscal Crimes Law. See “Public Finance—Fiscal Responsibility Law and Fiscal Crime Law”.
On January 6, 1999, the newly inaugurated governor of the State of Minas Gerais announced that the State would suspend for 90 days payments on its approximately R$18.3 billion debt to the Government. The governor of the State of Rio Grande do Sul subsequently sought and obtained an injunction permitting that State to make payments into an escrow account, pending the resolution of the request of seven States to renegotiate refinancing agreements reached with the Government under Law No. 9,496 of September 11, 1997. The Government responded by withholding Constitutionally mandated transfers payable to the State of Minas Gerais and, on February 10, 1999, paid half of an approximately $85 million due in respect of the State’s Eurobonds that matured on that date to ease investor concerns about the risk of default by State governments. The Government also notified certain international financial institutions that it would no longer guarantee these States’ obligations to these financial institutions, leading the World Bank to suspend loans to the States of Minas Gerais and Rio Grande do Sul. The State of Rio Grande do Sul resumed debt payments to the National Treasury during the first half of 1999, and the State of Minas Gerais announced in January 2000 that it would resume payments on its debts.
On June 2, 1999, the Central Bank declared the State of Pernambuco in default after the State announced that it would not honor approximately R$260 million aggregate principal amount of the State’s bonds. As a result of the default, the State was precluded from borrowing in the local markets. On December 29, 1999, the National Treasury refinanced Pernambuco’s debt issued in the market after 1995, which amounted to R$859 million, under the same conditions applicable to the refinancing of the other States’ debts. Following that refinancing, the State of Pernambuco was again permitted to raise funds in the local markets, subject to the conditions in the refinancing agreement with the National Treasury.
Gross Domestic Product
Brazil’s economic growth has fluctuated greatly in recent years. In 2000, Brazil’s GDP grew by 4.4%. The GDP growth was driven largely by a 4.8% increase in industrial sector production. The services sector also grew by 3.8% and the agricultural sector by 2.2%. Brazil’s GDP growth slowed to 1.3% during 2001; the services and agricultural sectors increased by 1.8% and 5.8%, respectively, while the industrial sector declined by 0.5%. A number of factors depressed industrial output. First, high interest rates reduced demand for consumer durable goods. Second, the institution of electricity rationing in June 2001 to address power shortages arising from low rainfall caused many industrial companies to reduce output and, in some cases, close production lines.
D-23
Brazil’s GDP grew by 1.9% in 2002. A large part of the GDP increase was attributable to the agricultural sector (which grew by 5.5%), as well as to strong growth in the mining, oil and gas sector and the communications sector (which grew by 6.7% and 9.8%, respectively). The industrial and services sectors experienced a growth of 2.6% and 1.6%, respectively.
Brazil’s GDP growth increased 0.5% during 2003. Growth in 2003 was greatest in the agricultural sector, which rose 4.5%. Production in the services sector rose 0.6%, while the industrial sector was flat. The construction industry experienced the largest decline, falling 5.2% in 2003, followed by retail sales, which dropped 1.9% during the same period.
GDP growth in 2004 reached 4.9% relative to 2003, the highest annual growth level recorded since 1994. Production in the industrial, agricultural and services sectors rose 6.2%, 5.3% and 3.3%, respectively, in 2004 relative to 2003. Household consumption rose 4.1% in 2004 relative to 2003, and investments in manufacturing plants, machinery and capital equipment (formação bruta de capital fixo, or FBCF) rose by 10.9% in 2004 relative to 2003.
Brazil’s GDP grew 2.9% in the first quarter of 2005 compared to the same period in 2004. Agricultural, industrial and services sectors increased 4.2%, 3.1% and 2.0%, respectively, in the first quarter of 2005 compared to the first quarter 2004. Household consumption rose 3.1% during the first quarter of 2005 relative to the corresponding period of the previous year, and investments in manufacturing plants, machinery and capital equipment rose (FBCF) by 2.3% during the first quarter of 2005 relative to the corresponding period of 2004.
The following table sets forth Brazil’s GDP at current prices and expenditures for each of the years indicated.
Table No. 4
Gross Domestic Product at Current Prices—In Billions of Reais (R$)
| | | | | | | | | | | | | | | | | | | | |
| | | 2000
| | 2001
| | 2002
| | 2003
| | 2004
|
| | | R$
| | %
| | R$
| | %
| | R$
| | %
| | R$
| | %
| | R$
| | %
|
Final Consumption | | 880.7 | | 80.0 | | 956.5 | | 79.8 | | 1,052.1 | | 78.2 | | 1,192.6 | | 76.6 | | 1,307.6 | | 74.0 |
Gross Capital Formation | | 237.3 | | 21.5 | | 254.1 | | 21.2 | | 266.0 | | 19.8 | | 307.5 | | 19.8 | | 376.6 | | 21.3 |
Gross Fixed Capital Formation | | 212.4 | | 19.3 | | 233.4 | | 19.5 | | 246.6 | | 18.3 | | 276.7 | | 17.8 | | 346.3 | | 19.6 |
Changes in Inventories | | 24.9 | | 2.3 | | 20.8 | | 1.7 | | 19.3 | | 1.4 | | 30.7 | | 2.0 | | 30.2 | | 1.7 |
Exports of Goods and Services | | 117.4 | | 10.7 | | 158.5 | | 13.2 | | 208.5 | | 15.5 | | 254.8 | | 16.4 | | 318.4 | | 18.0 |
Less: Imports of Goods and Services | | 134.1 | | 12.2 | | 170.4 | | 14.2 | | 180.6 | | 13.4 | | 198.8 | | 12.8 | | 235.9 | | 13.3 |
Gross Domestic Product | | 1,101.3 | | 100.0 | | 1,198.7 | | 100.0 | | 1,346.0 | | 100.0 | | 1,556.2 | | 100.0 | | 1,766.6 | | 100.0 |
Source: IBGE
D-24
The following tables set forth the participation of classes and activities in value added at basic prices and real growth at basic prices by sector for each of the years indicated.
Table No. 5
Participation of Classes and Activities in Value Added at Basic Prices
| | | | | | | | | | | | | | | |
| | | 2000
| | | 2001
| | | 2002
| | | 2003
| | | 2004
| |
Agriculture | | 8.0 | % | | 8.4 | % | | 8.7 | % | | 9.9 | % | | 10.1 | % |
Industry | | 37.5 | | | 37.6 | | | 38.3 | | | 38.8 | | | 38.9 | |
Mining, Oil and Gas | | 2.6 | | | 2.9 | | | 3.4 | | | 3.9 | | | 4.2 | |
Manufacturing | | 22.4 | | | 22.6 | | | 23.4 | | | 24.2 | | | 24.1 | |
Construction | | 9.1 | | | 8.5 | | | 8.0 | | | 7.2 | | | 7.3 | |
Public Utilities | | 3.5 | | | 3.6 | | | 3.6 | | | 3.4 | | | 3.4 | |
Services | | 58.5 | | | 59.1 | | | 59.2 | | | 56.7 | | | 55.6 | |
Retail Services | | 7.4 | | | 7.5 | | | 7.7 | | | 7.7 | | | 7.8 | |
Transportation | | 2.7 | | | 2.7 | | | 2.6 | | | 2.4 | | | 2.2 | |
Communications | | 2.7 | | | 3.0 | | | 2.7 | | | 3.2 | | | 3.0 | |
Financial Services(1) | | 5.4 | | | 6.6 | | | 7.7 | | | 7.0 | | | 6.6 | |
Government | | 16.3 | | | 16.3 | | | 16.3 | | | 15.8 | | | 16.1 | |
Rental Services | | 12.7 | | | 12.0 | | | 11.3 | | | 10.2 | | | 9.4 | |
Other Services | | 11.3 | | | 11.3 | | | 10.9 | | | 10.4 | | | 10.5 | |
Total | | 104.0 | | | 105.1 | | | 106.3 | | | 105.3 | | | 104.6 | |
| | |
|
| |
|
| |
|
| |
|
| |
|
|
Adjustment(2) | | 4.0 | | | 5.1 | | | 6.3 | | | 5.3 | | | 4.6 | |
Value Added at Basic Prices | | 100.0 | | | 100.0 | | | 100.0 | | | 100.0 | | | 100.0 | |
| (1) | | Does not include financial intermediation services. |
| (2) | | Adjustment for double counting arising from the inability to allocate debt service among the classes and activities set forth in this table. |
Sources: IBGE and Central Bank
Table No. 6
Real Growth (Decline) at Basic Prices by Sector
| | | | | | | | | | | | | | | |
| | | 2000
| | | 2001
| | | 2002
| | | 2003
| | | 2004
| |
Real GDP | | 4.4 | % | | 1.3 | % | | 1.9 | % | | 0.5 | % | | 4.9 | % |
Agriculture and Livestock | | 2.2 | | | 5.8 | | | 5.5 | | | 4.5 | | | 5.3 | |
Industry | | 4.8 | | | (0.5 | ) | | 2.6 | | | 0.1 | | | 6.2 | |
Mining, Oil and Gas | | 10.4 | | | 3.7 | | | 6.7 | | | 2.9 | | | (0.7 | ) |
Manufacturing | | 5.5 | | | 0.7 | | | 3.6 | | | 1.1 | | | 7.7 | |
Construction | | 2.6 | | | (2.7 | ) | | (1.8 | ) | | (5.2 | ) | | 5.7 | |
Public Utilities | | 4.2 | | | (5.6 | ) | | 3.0 | | | 2.7 | | | 4.6 | |
Services | | 3.8 | | | 1.8 | | | 1.6 | | | 0.6 | | | 3.3 | |
Retail Services | | 4.5 | | | 0.5 | | | (0.2 | ) | | (1.9 | ) | | 7.9 | |
Transport | | 3.1 | | | 1.7 | | | 3.4 | | | 1.4 | | | 4.9 | |
Communications | | 15.6 | | | 10.5 | | | 9.8 | | | 1.8 | | | (1.4 | ) |
Government | | 1.5 | | | 0.9 | | | 1.7 | | | 1.0 | | | 0.9 | |
Financial Institutions | | 4.1 | | | 0.8 | | | 2.1 | | | 0.6 | | | 4.2 | |
Rental Services | | 2.6 | | | 2.1 | | | 0.6 | | | 1.3 | | | 1.8 | |
Other Services | | 5.6 | | | 1.8 | | | 1.1 | | | 0.5 | | | 5.6 | |
Sources: IBGE
D-25
Principal Sectors of the Economy
Until the 1950s, natural resources and agriculture were the major sectors in the Brazilian economy. Beginning in the mid-1950s and during the 1960s and 1970s, however, emphasis was placed on industrial development, financed in part by external debt. As a result, the contribution of manufactured goods to Brazilian export revenues has increased significantly, reaching 15.0% in 1970, 44.8% in 1980, 55.0% in 1995 and 54.8% in 2004.
Services. In 2000, overall growth in the service sector reached 3.8%, largely as a result of increases in communications (15.6%), retail services (4.5%) and transportation (3.1%). In 2001, overall growth in the service sector was 1.8% as a result of growth in all subsectors, including a 10.5% growth in communications. In 2002, the service sector grew by 1.6%, including an increase of 9.8% in the communications sector. The only subsector that declined was retail services (0.2%). In 2003, the service sector increased 0.6%, with growth in all subsectors except retail services, which declined by 1.9%. In 2004, the services sector grew by 3.3%, including a 7.9% increase in retail services. The only subsector that declined was communications, which declined by 1.4%.
Brazil’s road network is comprised of approximately 1.8 million kilometers, of which approximately 10% is paved. Most paved roads are maintained by federal and State authorities, while the vast majority of unpaved roads are the responsibility of local authorities. Brazil’s railway system consists of approximately 30,500 kilometers, of which 7% is electrified. The principal Brazilian cities are served by both domestic and international airlines, and many smaller communities benefit from scheduled service by domestic airlines. Brazil has major ports in Rio de Janeiro, Santos, Paranaguá, São Sebastião and Rio Grande. Brazil also enjoys an extensive coastline and navigable rivers, but the potential of river and maritime shipping has not been fully exploited. The Government has taken initiatives to improve highway, railway and shipping infrastructure, which had deteriorated extensively during the 1980s and 1990s. Further, the process of privatization of the operation and maintenance of certain highways has begun and private companies have been permitted to install toll booths on thousands of kilometers of the country’s roads.
As of December 31, 2003, Brazil had approximately 49.8 million fixed telephone lines and 46.4 million cellular telephones. As of December 31, 2004, Brazil had approximately 65.6 million cellular phones. Until its privatization in 1998, the network was run by concessionaires in each State that were subsidiaries of Telebrás. Since the late 1980s, considerable investment has been made in the expansion of the services of Telebrás, including the establishment of cellular telephone systems in all of the States and the first fiber optic communications connection between the cities of Rio de Janeiro and São Paulo, which largely accounts for the recent significant growth in the communications sector. Law No. 9,295, dated July 19, 1996, permits the Government to auction to private sector companies licenses to build and operate cellular telephone systems. Pursuant to that law, the Government completed the auctioning of “Band B” cellular telecommunications licenses and “Band D” and “Band E” mobile phone concessions to private operators. In addition, on July 29, 1998, the Government sold its interest in Telebrás for approximately $19.0 billion. See “—State-Controlled Enterprises—Privatization Program”.
On June 30, 2004, the Supreme Judicial Court, an appellate court in Brazil, overturned a lower court ruling that had required that the IPCA inflation index be used for purposes of the annual inflaction adjustment for fixed line telephone service in 2003. The appellate court affirmed the decision of the National Telecommunications Agency (Agência Nacional de Telecommunicações or ANATEL) to use the contractually prescribed IGP-DI index for purposes of the annual adjustment for 2003. This decision would have permitted fixed-line telecommunication service providers to increase 2004 rates by as much as ten or eleven percentage points above the 6.89% adjustment approved by ANATEL for 2004. The amount of the increase to reflect the appellate court’s decision was subject to negotiations between ANATEL and the various fixed-line telecommunications service providers. On August 13, 2004, the Government announced that it would permit fixed-line telecommunications service providers to increase their 2004 rates by up to 8.7% in two installments, in September 2004 and November 2004.
D-26
The Government-mandated rationing of energy in 2001 forced consumers to reduce energy consumption by 20%, which adversely affected the energy sector. Moreover, the depreciation of the real in 2002 affected the energy sector, which was not able to pass through all of its foreign exchange-related costs to consumers because of the Government’s regulation of energy tariffs. As a result of the depreciation of the real, (i) energy purchased by Brazilian power distributors from Itaipú, the large hydroelectric generation project jointly run by Brazil and Paraguay, became more expensive because such energy is priced in U.S. dollars, and (ii) debt service in respect of foreign exchange-denominated loans increased. Power distribution companies were unable to pass all of these increased expenses to consumers, which, together with reduced demand arising from mandated power rationing in 2001 and first half of 2002, resulted in substantial losses to the energy sector in 2002. To assist power distributors experiencing losses because of the Government’s decision to defer until 2004 a full adjustment of energy tariffs to reflect these increased costs, the Government agreed to lend the affected distributors up to R$1.9 billion. On May 29, 2003, the Government announced that BNDES would loan up to a total of R$1.15 billion to power distributors in Brazil. The R$1.15 billion credit is part of the R$1.9 billion in loans that the Government agreed to make available to power distributors in Brazil.
BNDES announced on September 16, 2003 a Capitalization Support Program for Electricity Distribution Companies. This program, which replaces previously announced lending programs for electricity distributors, envisages BNDES support, initially set at up to R$3 billion, in the period up to December 31, 2004, for electricity distributors. Under the program, the BNDES support is to be made available on a case-by-case basis to companies:
| | • | | that secure an extension of the maturity of between 30% and 50% of their short-term debt to private creditors for a weighted average of three years or more; |
| | • | | whose controlling shareholders commit to convert their outstanding loans into equity; and |
| | • | | that commit to meet BOVESPA Level 2 corporate governance or Novo Mercado listing criteria within 42 months of their agreement to participate in the program. |
The program provides for, among other things, support in the form of 10-year convertible debentures to be purchased by BNDES in an amount equal to the short-term debt rolled over. In addition, BNDES is to convert one-third of its new debenture holdings into equity if the electricity distributor meets its obligations with respect to BOVESPA listing within 36 months following the issuance of such debentures and if the weighted average trading price of the distributor’s shares during the 90 trading days following that listing is higher than the conversion price in the debentures.
On December 29, 2003, BNDES announced an agreement for the restructuring of approximately $1.2 billion owed by AES Corporation to BNDES. Under the terms of the accord, BNDES and AES is to form a new holding company, Brasiliana Energia S.A., that will have three subsidiaries: AES Eletropaulo, AES Uruguaiana and AES Tietê. AES is to contribute the shares of the three subsidiaries to the new holding company, and BNDES is to exchange $690 million of the debt for shares of the holding company. AES and its subsidiaries are also to contribute $90 million in connection with the restructuring. AES is to repay the remaining $510 million over a period of eleven years. BNDES will hold slightly less than half of the common (voting) shares and all of the preferred (nonvoting) shares of the holding company, while AES is to hold the remaining common shares. After giving effect to the restructuring, BNDES is to have 53.85% of the total capital of Brasiliana Energia S.A., while AES is to hold the remaining 46.15%. Another utility, AES Sul, will be contributed to the holding company when the restructuring is completed. AES incurred the original $1.2 billion debt in connection with the privatization of AES Eletropaulo (formerly known as Eletropaulo Metropolitana). The restructuring is subject to the approval of the National Energy Agency (Agência Nacional de Energia, or ANEEL) and the Central Bank.
The amounts restructured under the December 29, 2003 agreement between AES and BNDES did not include a loan by BNDES to the consortium that owns Southern Electric Brazil, a company that in 1997 acquired a 33.0% interest in Companhia Energética de Minas Gerais (CEMIG). The consortium consists of two U.S.
D-27
companies, AES and Mirant Corporation, and a fund managed by Brazilian Banco Opportunity. The loan, for approximately R$2 billion, was also in default as of December 29, 2003.
On December 12, 2003, President da Silva issued Provisional Measures No. 144 and 145, which alter the regulatory framework for Brazil’s electricity sector. Provisional Measure No. 144 (which, following its approval by the Chamber of Deputies on March 11, 2004, became Law No. 10,848 dated March 15, 2004) establishes two markets for electricity purchases—a regulated market and a second, free market. It also creates a new Electricity Trade Chamber (Câmara de Comercialização de Energia Elétrica, or CCEE) to replace the wholesale energy market administrator (Mercado Atacadista de Energia, or MAE). Finally, Provisional Measure No. 144 changes the electricity system operator agency (Operador Nacional do Sistema Elétrico, or ONS) from one dominated by industry representatives whose decisions could be vetoed by the Government to an agency composed of five directors, three of whom are to be designated by the Government and two by industry representatives. Additional legislation is expected to be drafted to regulate the functioning of the regulatory scheme under Provisional Measure No. 144.
Provisional Measure No. 145 (which, following its approval by the Chamber of Deputies on March 11, 2004, became Law No. 10,847 dated March 15, 2004) establishes an Energy Research Company (Empresa de Pesquisa Energética, or EPE), which is to be responsible for research studies on the energy sector (including oil, gas and electricity). The EPE is to prepare a list of proposed generation projects for the Mines and Energy Minister’s consideration. The EPE will also be authorized to obtain preliminary environmental licenses (licença prévia) for transfer to successful bidders in competitive bidding procedures for electricity generation projects and transmission lines, thereby making such projects more attractive to potential bidders.
In December 2004, the Electrical Energy Commercialization Chamber (CCEE) conducted an auction of electricity from existing generation plants which raised R$72 billion. The second auction of 92.9 million megawatt-hours (MWh) of electricity from existing generation plants in April 2005 raised R$7.7 billion in expected revenues under supply contracts starting in 2008. The Ministry of Mines and Energy intends to conduct three more auctions during the fourth quarter of 2005, two of which will be for electricity from existing generation plants and one for electricity from new energy generation projects.
D-28
Industrial Production. Industrial production grew 6.6% in 2000 and 1.6% in 2001. In 2002, it grew 2.7%, and remained at the same level in 2003. In 2004, the industrial production grew by 8.3%. The following table sets forth growth in real terms in the principal areas of industrial production for the periods indicated:
Table No. 7
Annual Changes in Industry Production
Mining and Manufacturing
| | | | | | | | | | | | | | | |
| | | 2000
| | | 2001
| | | 2002
| | | 2003
| | | 2004
| |
Mining, Oil and Gas | | 11.8 | | | 3.4 | | | 19.0 | | | 4.7 | | | 4.3 | |
Manufacturing Industry | | 6.1 | | | 1.4 | | | 0.5 | | | (0.2 | ) | | 8.5 | |
By Segment | | | | | | | | | | | | | | | |
Nonmetallic Minerals | | 1.7 | | | (2.3 | ) | | (1.0 | ) | | (3.6 | ) | | 4.9 | |
Metallurgy | | 9.2 | | | 0.2 | | | 3.6 | | | 6.0 | | | 3.4 | |
Machinery and Equipment | | 18.9 | | | 4.2 | | | 2.8 | | | 5.3 | | | 16.1 | |
Electronic and Communications Equipment | | 32.7 | | | (2.8 | ) | | (11.1 | ) | | 0.5 | | | 17.8 | |
Transportation Equipment | | 21.4 | | | 24.2 | | | 21.8 | | | 9.2 | | | 10.3 | |
Wood | | 3.1 | | | (0.3 | ) | | 4.4 | | | 5.3 | | | 7.7 | |
Furniture | | 8.1 | | | 0.0 | | | (1.9 | ) | | (9.2 | ) | | 6.9 | |
Paper and Cardboard | | 4.1 | | | 0.1 | | | 3.3 | | | 6.3 | | | 7.9 | |
Rubber and Plastics | | 4.1 | | | (4.5 | ) | | 0.1 | | | (3.5 | ) | | 7.8 | |
Shoes and Leather | | 0.5 | | | (4.0 | ) | | (1.5 | ) | | (9.6 | ) | | 2.3 | |
Chemicals | | 6.0 | | | (8.3 | ) | | (4.2 | ) | | 3.0 | | | 7.0 | |
Pharmaceutical Products | | (2.0 | ) | | (1.0 | ) | | 16.3 | | | (7.6 | ) | | 1.0 | |
Perfumes, Soaps and Cleaning Products | | 2.7 | | | (1.2 | ) | | 1.9 | | | 0.9 | | | 11.9 | |
Textiles | | 6.1 | | | (5.4 | ) | | 0.2 | | | (4.5 | ) | | 10.1 | |
Clothing | | 8.8 | | | (9.6 | ) | | 5.6 | | | (12.2 | ) | | 1.5 | |
Food Products | | (2.1 | ) | | 4.9 | | | 3.0 | | | (1.4 | ) | | 4.1 | |
Beverages | | 4.0 | | | 0.3 | | | (12.2 | ) | | (4.1 | ) | | 5.8 | |
Tobacco | | (7.8 | ) | | (4.7 | ) | | (40.0 | ) | | (6.4 | ) | | 18.9 | |
Publishing, Printing and Typesetting | | . | | | . | | | . | | | 0.7 | | | (2.4 | ) |
Petroleum and Alcohol | | (1.8 | ) | | 4.0 | | | (2.6 | ) | | (2.2 | ) | | 2.3 | |
Metal Products, Excluding Machinery and Equipment | | 2.2 | | | 2.3 | | | 2.7 | | | (5.5 | ) | | 10.0 | |
Office Machines and Computer Equipment | | . | | | . | | | . | | | 8.0 | | | 33.5 | |
Electric Machines and Materials | | 10.5 | | | 20.3 | | | (0.9 | ) | | 1.8 | | | 7.1 | |
Medical, Optical, and Hospital Equipment | | . | | | . | | | . | | | (3.0 | ) | | 8.3 | |
Automobiles | | 18.5 | | | 0.0 | | | (2.1 | ) | | 4.3 | | | 29.9 | |
Other | | . | | | . | | | . | | | (1.7 | ) | | 10.8 | |
Total Annual Change in Production of Mining, Oil and Gas and Manufacturing Industry | | 6.6 | | | 1.6 | | | 2.7 | | | 0.0 | | | 8.3 | |
By Category of Use | | | | | | | | | | | | | | | |
Capital Goods | | 13.1 | | | 13.5 | | | (5.8 | ) | | 2.2 | | | 19.7 | |
Intermediate Goods | | 6.8 | | | (0.1 | ) | | 4.2 | | | 2.0 | | | 7.4 | |
Consumer Goods | | 3.5 | | | 1.2 | | | 1.5 | | | (2.7 | ) | | 7.3 | |
Durable Goods | | 20.8 | | | (0.6 | ) | | 4.7 | | | 3.0 | | | 21.8 | |
Nondurable Goods | | (0.4 | ) | | 1.6 | | | 1.1 | | | (3.9 | ) | | 4.0 | |
Sources: IBGE and Central Bank
As the economy recovered in 2000, the manufacturing industry grew by 6.1%, with durable consumer goods and capital goods production rising 20.8% and 13.1%, respectively. In 2001, growth in the manufacturing
D-29
industry was 1.4%, with an increase in capital goods (by 13.5%) and reductions in intermediate goods (by 0.1%) and durable consumer goods (by 0.6%). The manufacturing industry grew by 0.5% in 2002, with increases in all categories of use except capital goods, which declined by 5.8%. In 2003, the manufacturing industry sector fell 0.2%, with increases of 2.2% and of 2.0% in capital and intermediate goods production, respectively, offset by a fall of 2.7% in consumer goods production. The manufacturing industry grew by 8.5% in 2004, with increases in capital goods and durable goods, production of 19.7% and 21.8%, respectively.
Construction sector activity rose by 2.6% in 2000 as economic conditions improved before declining again by 2.7% in 2001, 1.8% in 2002 and 5.2% in 2003. As the economy recovered in 2004, construction sector activity rose by 5.7%. The number of housing starts in a given year has depended heavily upon the availability of public funds and the ability of the Housing Finance System, currently under the direction of the Federal Savings Bank (Caixa Econômica Federal or “CEF”), to devote resources to new building activities. On December 31, 2004, the credit operations of CEF related to the housing and sewage sector reached approximately R$5.9 billion and R$2.4 billion, respectively.
Brazil’s proven mineral resources are extensive and have generally remained constant or expanded in recent years due to continuing exploration activity. Large iron ore and manganese reserves provide important sources of industrial raw materials and export earnings. Deposits of nickel, tin, chromite, bauxite, beryllium, copper, lead, tungsten, zinc and gold, as well as lesser known minerals, continue to be mined. Oil production also has increased considerably in recent years. In 2000, the mining, oil and gas industry grew 10.4%. In 2001, growth in the industry slowed to 3.7%, but recovered to 6.7% in 2002, before slowing again to 2.9% in 2003. Mining, oil and gas industry output decreased by 0.7% in 2004.
Agriculture. Brazil has a well-diversified agricultural sector. According to the World Horticultural Trade and U.S. Export Opportunities, Brazil is the world’s largest producer of orange juice, accounting for 50 percent of world production in 2002. Brazil is also the world’s largest producer of sugar; approximately 70% of Brazil’s sugar crop is processed into alcohol for automotive fuel. Brazil’s largest single export crop is soya (beans, bran and oil), with 2002, 2003 and 2004 exports totaling approximately $6 billion, $8 billion and $10 billion, respectively. In addition, Brazil has been the world’s largest producer of coffee for more than a century. Coffee exports in 2002, 2003 and 2004 totaled $1.4 billion, $1.5 billion and $2.0 billion, respectively, while orange juice exports totaled $0.9 billion, $0.9 billion and $0.8 billion, respectively, and sugar exports totaled $2.1 billion, $2.1 billion and $2.6 billion, respectively. In addition, meat and meat by-product exports totaled $3.1 billion, $4.1 billion and $6.2 billion in 2002, 2003 and 2004, respectively.
The output of the agricultural sector increased by 2.2% in 2000, 5.8% in 2001, 5.5% in 2002, 4.5% in 2003 and 5.3% in 2004.
State-Controlled Enterprises
In Brazil there are two types of state enterprises: public companies and mixed-ownership companies. Public companies are corporations wholly owned by the States or the Republic, created by special law to carry on economic activities in any of the corporate forms provided for by law. Examples of federal public companies are BNDES, CEF, the Brazilian Post Office and Telegraph Corporation (Empresa Brasileira de Correios e Telégrafos) and the Mineral Resources Exploration Company (Companhia de Pesquisa de Recursos Minerais or “CPRM”). Mixed-ownership companies are in corporate form and are majority-owned by the federal Government. Unless otherwise provided by the law authorizing the creation of a mixed-ownership company, the rights of the Government are those conferred by Brazilian corporate law on majority shareholders generally.
Brazil also has autonomous institutions and public foundations. Autonomous institutions are entities established to carry out public functions which require decentralized financial and operating management, such as the Central Bank, the National Securities Commission (Comissão de Valores Mobiliários or “CVM”), the Brazilian Institute of Forest Development, the National Institute of Industrial Property, the National Highway Department and the National Department of Mineral Production.
D-30
Public foundations are non-profit public law entities created to carry out activities not performed by public companies. Public foundations have administrative autonomy and manage their own assets, but their expenses are defrayed by the Government and other sources. Examples of public foundations are IBGE, Instituto de Pesquisa Econômica Aplicada (“IPEA”) and Conselho Nacional de Desenvolvimento Científico e Tecnológico (“CNPq”).
Under Brazilian law, private parties may only participate in activities considered to be public services if they are authorized to do so by the federal Government. The areas formerly reserved to the Republic under the Constitution include broadcasting and telecommunications, electric power service and facilities, hydroelectric power generation, certain interstate and international navigational services, interstate and international highway passenger transportation services and the operation of ports. The mining and processing of nuclear mineral ores and minerals and their by-products also remain under Government monopoly.
Privatization Program. The objectives of the Government’s privatization program were to (i) reduce the role of the state in the economy and allocate more resources to social investment, (ii) reduce public sector debt, (iii) encourage increased competition and thereby raise the standards and efficiency of Brazilian industry and (iv) strengthen the capital markets and promote wider share ownership.
The Privatization Council (Conselho Nacional de Desestatização—“CND”), a body directly subordinate to the President, is responsible for administering the privatization program. The privatizations had, for the most part, been effected through share auctions conducted on Brazil’s stock exchanges. As set forth in the table below, through December 31, 2004, a total of 72 state enterprises or divisions thereof had been privatized, and several minority interests held by government companies had been sold, for consideration totaling $59.3 billion. Federal and State privatization revenues totaled $2.2 billion for the 2002 fiscal year. There were no privatizations in 2003.
On February 10, 2004, Banco Bradesco S.A. acquired a controlling interest in Banco do Estado do Maranhão (BEM), the State bank of Maranhão, in a public auction conducted by the Central Bank. Banco Bradesco offered R$78 million for BEM, a slight premium over the R$77.2 million minimum price in the auction. The sale was the first privatization under President da Silva’s administration.
D-31
Table No. 8
Brazilian Privatization Program
| | | | | |
| | | Month of Auction
| | Purchase Price(1)
|
| | | | | (in millions of dollars) |
| | |
Usinas Siderúrgicas de Minas Gerais S.A.—Usiminas | | October 1991 | | $ | 1,941.2 |
Companhia Eletromecânica—Celma | | November 1991 | | | 91.1 |
Material Ferroviário S.A.—Mafersa | | November 1991 | | | 48.8 |
Companhia Siderúrgica do Nordeste—Cosinor | | November 1991 | | | 15.0 |
Serviço de Navegação da Bacia do Prata—SNBP | | January 1992 | | | 12.0 |
Indag S.A. | | January 1992 | | | 6.8 |
Aços Finos Piratini S.A. | | February 1992 | | | 106.6 |
Petroflex-Indústria e Comércio S.A. | | April 1992 | | | 234.1 |
Companhia Petroquímica do Sul—Copesul | | May 1992 | | | 861.5 |
Companhia Nacional de Alcalis—Can | | July 1992 | | | 81.4 |
Companhia Siderúrgica de Tubarão | | July 1992 | | | 353.6 |
Nitriflex S/A Indústria e Comércio | | August 1992 | | | 26.2 |
Fertilizantes Fosfatados S/A | | August 1992 | | | 182.0 |
Polisul Petroquímica S/A | | September 1992 | | | 56.8 |
Companhia Ind. de Polipropileno S/A | | September 1992 | | | 59.4 |
Goiás Fertilizantes S.A-Goiasfertil | | October 1992 | | | 13.1 |
Companhia de Aços Especiais Itabira—Acesita | | October 1992 | | | 465.4 |
Companhia Brasileira de Estireno—CBE | | December 1992 | | | 10.9 |
Poliolefinas S.A. | | March 1993 | | | 87.1 |
Companhia Siderúrgica Nacional—CSN | | April 1993 | | | 1,495.3 |
Ultrafértil S.A. Ind. e Comércio de Fertilizantes | | June 1993 | | | 205.6 |
Companhia Siderúrgica Paulista—Cosipa | | August 1993 | | | 585.7 |
Aços Minas Gerais S.A.—Açominas | | September 1993 | | | 598.5 |
Oxiteno S.A. Indústria e Comércio | | September 1993 | | | 53.9 |
Petroquímica União S.A.—PQU | | January 1994 | | | 287.5 |
Arafértil S.A. | | April 1994 | | | 10.8 |
Mineração Caraíba S.A. | | July 1994 | | | 5.8 |
Acrilonitrita do Nordeste S.A.—Acrinor | | August 1994 | | | 12.1 |
Companhia Pernambucana de Borracha Sintética-Coperbo | | August 1994 | | | 25.9 |
Polialden Petroquímica S.A. | | August 1994 | | | 16.7 |
Ciquine Companhia Petroquímica | | August 1994 | | | 23.7 |
Politeno Indústria e Comércio S.A. | | August 1994 | | | 44.9 |
Empresa Brasileira de Aeronáutica S.A.—Embraer | | December 1994 | | | 192.2 |
Sale of minority interests held by government companies | | Nov.-Dec. 1994 | | | 395.5 |
Centrais Elétricas do Espírito Santo S.A.—Escelsa | | July 1995 | | | 519.3 |
Companhia Industrial de Polipropileno S.A.—Copene | | August 1995 | | | 270.4 |
Companhia Petroquímica de Camaçari—CPC | | September 1995 | | | 99.7 |
Salgema Indústrias Químicas S.A. | | October 1995 | | | 139.2 |
Companhia Química do Recôncavo—CQR | | October 1995 | | | 1.7 |
Nitrocarbono S.A. | | December 1995 | | | 29.6 |
Pronor Petroquímica S.A. | | December 1995 | | | 63.5 |
Companhia Brasileira de Poliuretano—CBP | | December 1995 | | | 0.04 |
Polipropileno S.A. | | February 1996 | | | 81.2 |
Koppol Filmes S.A. | | February 1996 | | | 3.1 |
Rede Ferroviária Federal S.A.—Malha Oeste | | March 1996 | | | 63.4 |
D-32
| | | | | |
| | | Month of Auction
| | Purchase Price(1)
|
| | | | | (in millions of dollars) |
| | |
Light Serviços de Eletricidade S.A. | | May 1996 | | | 2,508.5 |
Deten Química S.A. | | May 1996 | | | 12.0 |
Rede Ferroviária Federal S.A.—Malha Centro-Leste | | June 1996 | | | 316.0 |
Polibrasil S.A. Indústria e Comércio | | August 1996 | | | 99.4 |
Rede Ferroviária Federal S.A.—Malha Sudeste | | September 1996 | | | 870.6 |
Estireno do Nordeste S.A. | | September 1996 | | | 16.6 |
Rede Ferroviária Federal S.A.—Malha Tereza Cristina | | November 1996 | | | 17.9 |
Rede Ferroviária Federal S.A.—Malha Sul | | December 1996 | | | 208.5 |
Sale of minority interests held by government companies | | December 1996 | | | 33.4 |
Companhia Vale do Rio Doce—CVRD | | May 1997 | | | 3,298.9 |
Rede Ferroviária Federal S.A.—Malha Nordeste | | July 1997 | | | 14.6 |
TECOM 1–Porto de Santos | | September 1997 | | | 251.0 |
Banco Meridional | | December 1997 | | | 240.1 |
Sale of minority interests held by government companies | | Feb.-July 1997 | | | 189.6 |
“Band B” cellular telecommunications licenses | | October 1998 | | | 7,613.0 |
Telecomunicações Brasileiras S.A.—Telebrás | | July 1998 | | | 19,237.0 |
Sale of minority interests held by government companies | | Apr.-Dec. 1998 | | | 421.4 |
Companhia Docas do Espírito Santo-Cais de Capuaba | | May 1998 | | | 26.2 |
Companhia Docas do Espírito Santo-Cais de Paul | | May 1998 | | | 9.4 |
Tecon 1—Porto de Sepetiba | | September 1998 | | | 79.0 |
Centrais Geradoras do Sul do Brasil S.A.—Gerasul | | September 1998 | | | 880.6 |
Porto do Rio (Terminal Roll-on Roll-off) | | November 1998 | | | 26.5 |
Porto de Angra dos Reis | | November 1998 | | | 7.9 |
Rede Ferroviária Federal S.A.-Malha Paulista | | November 1998 | | | 205.8 |
Datamec | | June 1999 | | | 49.6 |
Porto de Salvador | | December 1999 | | | 20.9 |
“Mirror” companies for Telebrás | | 1999 | | | 128.0 |
Sale of minority interests held by government companies | | December 1999 | | | 61.7 |
Petróleo Brasileiro S.A.—Petrobrás | | July-Aug. 2000 | | | 4,032.1 |
Banco do Estado de São Paulo S.A.—Banespa | | November 2000 | | | 3,604.3 |
Sale of minority interests held by government companies | | December 2000 | | | 33.8 |
Sale of “Band D” mobile phones concessions | | February 2001 | | | 1,333.5 |
Sale of “Band E” mobile phones concessions | | March 2001 | | | 481.7 |
Sale of Petrobrás preferred shares | | July 2001 | | | 808.3 |
Banco do Estado de Goiás—BEG | | December 2001 | | | 269.5 |
Sale of minority interests held by government companies | | April-November 2001 | | | 12.5 |
Banco do Estado do Amazonas—BEA | | January 2002 | | | 76.8 |
Global offering of CVRD preferred shares | | March 2002 | | | 1,896.6 |
Sale of minority interests held by government companies | | April 2002 | | | 1.7 |
Banco do Estado do Maranhão—BEM | | February 2004 | | | 35.6 |
| | | | |
|
|
Total | | | | $ | 59,308.2 |
| (1) | | The purchase price does not reflect actual dollars received. In most cases, the purchase price was paid in the form of Brazilian currency or various debt obligations of the Republic, its agencies or state-controlled enterprises redeemed at face value for purposes of these sales. Values in Brazilian currency were converted to U.S. dollars at the commercial selling rate on the closing date following the relevant auction. |
Source: BNDES
The legal measures establishing the Plano Real provide that Government-held shareholdings in public companies not included in the national privatization program be transferred to the custody of an entity called the
D-33
Public Debt Amortization Fund to the extent that such shareholdings are not needed to maintain Government monopolies or national control of such companies. Proceeds from the sale of these shares are to be applied directly to the repayment of domestic debt of the National Treasury.
In addition to the privatization program, the Government has sought to reduce the regulation of economic activity generally. Important developments in this regard include the establishment of a free foreign exchange market, the reduction of tariffs and elimination of most non-tariff trade barriers and the termination of most price controls. The Government has also acted to deregulate certain segments of the economy, including fuel and oil derivatives, airlines, shipping and steel, and is considering the introduction of additional measures designed to increase competition in areas such as steel, highway maintenance and transportation, areas which were previously controlled, in most cases, by government enterprises.
Effective January 1, 2002, the Government deregulated the oil sector. The Government, among other things, eliminated price controls for gasoline, diesel oil and bottled gas, as well as certain subsidies for these products. The Government also instituted the Contribution on the Intervention in the Economic Domain (Contribuição de Intervenção no Domínio Econômico or “CIDE”), a tax on the import and sale of petroleum, natural gas, ethyl alcohol and certain derivative products. CIDE revenues are to be used for the financing of environmental projects in the oil and gas industry, the financing of transport infrastructure projects and certain subsidies in the oil and gas sector.
Privatization of State-Owned Enterprises. The process of privatization in the various States was begun in 1996. Recent significant privatizations of State-owned assets include (i) the sale of Baneb, the State-owned bank of Bahia, to Banco Bradesco S.A. for R$260 million on June 22, 1999, (ii) the sale of Paranapanema, an electricity generation company owned by the State of São Paulo, to Duke Energy on July 28, 1999 for R$682 million, a 90% premium over the minimum price set by the State, (iii) the sale of Cesp-Tietê to AES Corporation for $472 million (representing a premium of approximately 30% over the minimum price set by the State of São Paulo) on October 27, 1999, (iv) the sale of Gas Noroeste to a consortium led by Gás Brasiliano (“ENI”) for $143 million (representing a premium of 149.4% over the minimum price) on November 9, 1999, (v) the sale of Companhia Energetica de Pernambuco (“Celpe”) to a consortium led by Iberdrola S.A., the Spanish energy group, for $1 billion on February 17, 2000, (vi) the sale of Gás Sul to Gas Natural of Spain for $290 million on April 26, 2000, (vii) the sale of Companhia Energética do Maranhão (“Cemar”) to Pennsylvania Power & Light for $289 million on June 15, 2000, (viii) the sale of Manaus Saneamento to Lyonnaise des Eaux for $106 million on June 29, 2000 (representing a premium of 5% over the minimum price set by the State of Manaus), (ix) the sale of a controlling interest in Banestado to Banco Itaú S.A. for approximately $869 million on October 17, 2000 (representing a 302.8% premium over the minimum price set by the State of Paraná), (x) the sale of Sociedade Anônima de Eletrificação da Paraíba (“Saelpa”) to Companhia Força e Luz Cataguases (“Leopoldina”) for $185 million on November 30, 2000 (xi) the sale of Banco do Estado de Paraíba S.A. (“Paraiban”) for $29 million (representing a 52.5% premium over the minimum sale price) to ABN Amro on November 8, 2001, (xii) the sale of minority interests in the Sao Paulo water and sewage utility SABESP for $247 million in November 2004, and (xiii) the sale of Nossa Caixa Seguros e Previdencia for $92.9 million on May 24, 2005. State privatization revenues from the inception of the State privatization programs through May 31, 2005 totaled $35.0 billion, which includes $3.8 billion in revenues arising from the sale by States of minority interests in government companies.
Prices
��
Until 1994, Brazil experienced high and chronic inflation, which hindered investment and economic growth and contributed to income inequality. Inflation and certain Government measures taken to combat inflation have had significant negative effects on the Brazilian economy generally and on the fiscal accounts of the Government and its ability to service its external debt. See “—Historical Background”.
D-34
The following table sets forth two principal price indices for the periods indicated.
Table No. 9
General Price Index—Domestic Supply (IGP-DI)(1)
Wholesale Price Index—Domestic Supply (IPA-DI)
| | | | | | | | | | |
| | | | | IGP-DI
| | IPA-DI
|
Period
| | | | Monthly
| | Trailing 12 Months
| | Monthly
| | Trailing 12 Months
|
1993 | | December | | | | 2,708.6 | | | | 2,639.3 |
1994 | | December | | | | 909.6 | | | | 857.8 |
1995 | | December | | | | 14.8 | | | | 6.4 |
1996 | | December | | | | 9.3 | | | | 8.1 |
1997 | | December | | | | 7.5 | | | | 7.8 |
1998 | | December | | | | 1.7 | | | | 1.5 |
1999 | | December | | | | 20.0 | | | | 28.9 |
2000 | | December | | | | 9.8 | | | | 12.1 |
2001 | | December | | | | 10.4 | | | | 11.9 |
2002 | | December | | | | 26.4 | | | | 35.4 |
2003 | | December | | | | 7.7 | | | | 6.3 |
2004 | | December | | | | 12.1 | | | | 14.7 |
2005 | | January | | 0.3 | | 11.6 | | 0.1 | | 13.9 |
| | | February | | 0.4 | | 10.9 | | 0.4 | | 12.8 |
| | | March | | 1.0 | | 10.9 | | 1.1 | | 12.8 |
| (1) | | IGP-DI is an index based on a weighting of three other indices: the Wholesale Price Index-Domestic Supply (Índice de Preços por Atacado-Disponibilidade Interna, or “IPA-DI”) (60%), the Consumer Price Index (Índice de Preços ao Consumidor, or “IPC”) (30%), and the National Index of Building Costs (Índice Nacional de Custos de Contrução, or “INCC”) (10%). The IGP-DI, one of the most widely used inflation indices, is calculated by the Getúlio Vargas Foundation, an independent research organization. |
Sources: Getúlio Vargas Foundation, Central Bank and Institute of Applied Econimic Research (IPEA)
Chronic inflation in Brazil led to the emergence of a comprehensive system of indexation. Indexation mechanisms were first introduced in 1964, when the monetary correction of certain financial assets was instituted by law. Later, these indexation mechanisms were gradually adopted by all sectors of the economy. Various price indices were developed, each one with its own methodology, based on different baskets of goods or services, such as salaries, rents, taxes and financial instruments. The practice of widespread indexation in Brazil diminished the distorting impact of inflation on relative prices but also served to sustain and fuel inflationary expectations.
Throughout the 1980s and early 1990s, Brazil experienced periods of severe inflation. With the onset of the external debt crisis in 1982 and the resulting decrease in the availability of foreign capital, the Government was obliged to monetize large and growing public sector deficits, thereby further stimulating inflation. See “Public Debt—Debt Crisis and Restructuring”.
With the implementation of the third phase of the Plano Real, including the introduction of the real in July 1994, the rate of inflation decreased significantly, reaching 9.3% in 1996, 7.5% in 1997 and 1.7% in 1998. The inflation rate (as measured by IGP-DI) rose to 20.0% in 1999, following the decision of the Central Bank to permit the value of the real to float against that of the dollar. The increase was largely the result of a 28.9% increase in the wholesale price index (the IPA-DI), a component of the IGP-DI. After the implementation of the inflation targeting regime in mid-1999, the inflation rate (as measured by IGP-DI) registered 9.8% in 2000, and 10.4% in 2001. Largely as a result of a depreciation in the value of the real, increases in administered prices and
D-35
rising oil prices in the world markets, the inflation rate began to rise in Brazil during the fourth quarter of 2002, registering 26.4% at end of 2002. The inflation rate (as measured by IGP-DI) increased 7.7% in 2003 and 12.1% in 2004.
Following the decision in January 1999 to permit the real to float freely, the Government announced that it intended to pursue a monetary policy based on inflation targeting. In June 1999, the Government announced inflation targets of 8% in 1999, 6% in 2000 and 4% in 2001, as measured by the IPCA, with tolerance intervals of 2 percentage points. Brazil’s inflation rate, as measured by the IPCA, was 6.0% in 2000, 7.7% in 2001, 12.5% in 2002, 9.3% in 2003 and 7.6% in 2004. During the 12 months ended May 31, 2005, the inflation rate, as measured by IPCA, rose 8.1%. For 2005 and 2006, the inflation targets are 5.1% and 4.5%, respectively, with a tolerance interval of plus or minus 2.5 percenage points for 2005 and 2.0 percentage points for 2006. See “—Recent Economic Events and Policies”.
Salaries and Wages
According to the Employment Monthly Survey conducted by IBGE in six major metropolitan regions of Brazil (Rio de Janeiro, São Paulo, Belo Horizonte, Porto Alegre, Recife and Salvador), the real average wages of all workers increased by 0.9% in 2000 but declined by 3.8% in 2001, 3.0% in 2002 and 9.5% in 2003. Real wages increased by 4.0% in 2004.
In 2000, real average wages in São Paulo’s industrial sector and overall real wages recovered, increasing by 2.7% and 3.8%, respectively. In 2001 and 2002, real average wages in São Paulo’s industrial sector increased by 6.3% and 5.5%, respectively, while overall real wages rose 6.4% and 3.2%, in the same period. In 2003, industrial real wages increased by 0.3%, while overall real wages decreased by 0.6%. In 2004, both industrial real wages and overall real wages saw significant gains, increasing by 7.1% and 9.5%, respectively. For the 12-month period ending February 28, 2005, industrial real average wages were up 6.6%, while overall real wages rose by 10.1%.
On April 20, 2005, President da Silva issued Provisional Measure No. 248, which raised the minimum monthly wage by 15.4% to R$300 from R$260, effective May 1, 2005. The increase was 8.5% in real terms. The following table sets forth certain data on industrial wages in the State of São Paulo and on the national minimum wage for the periods indicated.
D-36
Table No. 10
Industrial Wages—State of São Paulo(1)
and
National Minimum Wage
| | | | | | | | | | | | | | | | |
December 31,
| | Real Average Wages Index(2)(3)
| | Trailing 12 months(4)
| | Real Overall Wages Index(2)(3)
| | Trailing 12 Months(4)
| | | Dollar Equivalent Minimum Wage (monthly)
| | Dollar Equivalent Minimum Wage Index(3)
| | Trailing 12 Months(4)
| |
2000 | | 95.98 | | 2.7 | | 99.18 | | 3.8 | | | 76.91 | | 99.91 | | 8.5 | |
2001 | | 99.65 | | 6.3 | | 100.96 | | 6.4 | | | 76.18 | | 98.97 | | (8.3 | ) |
2002 | | 101.91 | | 5.5 | | 101.69 | | 3.2 | | | 55.16 | | 71.65 | | (7.1 | ) |
2003 | | 107.95 | | 0.3 | | 106.69 | | (0.6 | ) | | 82.04 | | 106.58 | | 10.2 | |
2004 | | 112.91 | | 7.1 | | 117.49 | | 9.5 | | | 95.65 | | 124.25 | | 14.7 | |
| (1) | | Information is provided for the State of São Paulo because it represents approximately 47.4% of the industrial production of Brazil. |
| (2) | | Deflated by CPI-FIPE. |
| (4) | | Average percentage growth in last 12 months compared to previous 12-month period. |
Sources: Federação das Indústrias do Estado de São Paulo (“FIESP”), Ministry of Finance and Central Bank
Employment
The Ministry of Labor customarily reports Brazilian employment statistics in terms of formal employment. Formal employment comprises employment duly registered with the Ministry of Labor and subject to social security contributions by employers. Informal employment is not registered or subject to employment contributions. The Ministry of Labor’s General File of Employed and Unemployed showed that formal employment rose 3.1% (or 657,596 jobs) in 2000, 2.7% (or 591,079 jobs) in 2001, 3.6% (or 762,414 jobs) in 2002, 2.9% (or 645,433 jobs) in 2003 and 6.5% (or 1,523,276 jobs) in 2004.
The table below sets forth employment levels by sector for the periods indicated.
Table No. 11
Level of Employment by Sector(1)
| | | | | | | | | | |
| | | December 31,
|
Sector
| | 2000
| | 2001
| | 2002
| | 2003
| | 2004
|
Manufacturing | | 84.81 | | 86.54 | | 89.24 | | 91.46 | | 100.00 |
Public Utility/Industrial Services(2) | | 95.23 | | 95.73 | | 97.43 | | 98.47 | | 100.00 |
Commerce | | 79.40 | | 83.18 | | 88.58 | | 92.76 | | 100.00 |
Services | | 86.33 | | 89.46 | | 92.51 | | 95.18 | | 100.00 |
Construction | | 104.49 | | 101.71 | | 99.52 | | 95.50 | | 100.00 |
Government Service | | 96.54 | | 97.54 | | 98.66 | | 100.02 | | 100.00 |
Total | | 85.81 | | 88.12 | | 91.26 | | 93.89 | | 100.00 |
| (1) | | December 31, 2004 = 100. |
| (2) | | Including water, electricity, telephone and gas services. |
Sources: Ministry of Labor and Central Bank
The Government currently has no comprehensive national unemployment statistic because of the difficulties of measuring the informal employment sector. The Government instead measures unemployment using the
D-37
average annual rate of unemployment in six major metropolitan areas (Rio de Janeiro, São Paulo, Belo Horizonte, Porto Alegre, Salvador and Recife). According to that measure, the unemployment rate was 11.7% in 2002, 12.3% in 2003, 11.5% in 2004 and 10.2% in May 2005.
The Federal Senate passed a bill on January 21, 1998 permitting employers to offer labor contracts to temporary workers for periods of up to 24 months, providing employers with greater flexibility in dealing with their labor needs. The cost of temporary employees is significantly lower than the cost of permanent employees, who are often entitled to extensive social security, unemployment and severance benefits.
Law No. 7,998, which was enacted on January 11, 1990, established the Workers’ Support Fund (Fundo de Amparo ao Trabalhador or “FAT”) to finance unemployment security programs and professional training programs that are expected to benefit about 4.2 million workers between 1994 and 1998. To be eligible for the unemployment benefits under FAT, a dismissed employee, among other things, (i) must have been involuntarily dismissed, (ii) must have been employed and receiving a salary during the six-month period prior to being dismissed, (iii) must have been employed at least six months during the three years prior to being dismissed, (iv) must not be receiving any other social security or unemployment benefits and (v) must not have sufficient income to support herself or her family. Unemployment benefits under FAT are limited to five months in each sixteen-month period following a dismissal.
FAT received funding of R$7.5 billion and R$6.0 billion in 1998 and 1999, respectively, from monthly federal contributions to certain other social programs, including unemployment programs (known by their acronym, “PIS/PASEP”). In accordance with the Constitution, 40% of the funds provided for FAT is allocated to finance economic growth programs managed by BNDES. For the years 2000, 2001, 2002, 2003, and 2004, FAT received funding of R$7.8 billion, R$8.8 billion, R$10.1 billion, R$13.1 billion and R$15.1 billion, respectively.
On August 31, 2000, the Federal Supreme Court of Brazil decided three lawsuits against the Time-in-Service Guarantee Fund (“FGTS”), a fund established to make severance payments to terminated private sector employees in proportion to their time of service and amounts deposited, and its administrator, Caixa Econômica Federal, a multiple service bank owned by the federal Government. The plaintiffs in these cases sought damages for losses resulting from monetary corrections made to individual account balances using inflation indices under five economic stabilization programs implemented by the Government between 1987 and 1992. The Federal Supreme Court ruled that the plaintiffs were eligible for damages with respect to two of the five economic plans. The case was remanded to a lower court for a determination of damages. On September 22, 2000, the Government announced that it would compensate workers for losses arising from the two economic plans. Complementary Law No. 110 dated June 29, 2001 provides for amounts to be credited to individual FGTS accounts to compensate workers for such losses. The amounts are to be funded through an increase (to 50% from 40%) in the employee dismissal penalty payable by employers and the imposition of an additional 0.5% over the 8% that employers pay to FGTS in respect of an employee’s wage. Employees seeking adjustments to their FGTS accounts under Complementary Law No. 110 are required to abide by the terms of a settlement agreement (termo de adesão), pursuant to which they (a) waive their rights to file lawsuits seeking further adjustments to their accounts under the five economic stabilization programs and (b) agree to a progressive discount over time of the amount to which they are entitled. The legislation is the result of an agreement among the Government, labor unions, employees associations and the fund.
D-38
The table below sets forth recent industrial employment indices for the State of São Paulo, national employment indices and unemployment rates for the six major metropolitan regions for the periods indicated.
Table No. 12
Employment and Unemployment(1)
| | | | | | | | | | |
| | | Industrial Employment in São Paulo(2)
| | % Growth in Year(3)
| | National Employment(4)
| | % Growth in Year(5)
| | Average Unemployment Rate (IBGE)(6)(7)
|
2000 | | 103.5 | | 3.5 | | 103.1 | | 3.1 | | 7.1 |
2001 | | 105.1 | | 1.6 | | 105.9 | | 2.7 | | 6.2 |
2002 | | 106.4 | | 1.2 | | 109.7 | | 3.6 | | 7.1 |
2003 | | 108.6 | | 2.1 | | 112.8 | | 2.9 | | 12.3 |
2004 | | 116.9 | | 7.7 | | 120.2 | | 6.5 | | 11.5 |
| (1) | | Through end of period. |
| (2) | | Source: FIESP. The index measures employment in the industrial sector in the State of São Paulo, at the end of the relevant period. December 31, 1999=100. Figures are provided for the State of São Paulo because it represents 47.4% of the industrial production of Brazil. |
| (3) | | Source: Central Bank. This column sets forth the growth of industrial employment in São Paulo. |
| (4) | | Source: Ministry of Labor. This index measures nationwide employment of workers whose employment is governed by the Consolidated Labor Laws, at the end of the relevant period, based on data on employment changes required by law to be reported by employers. December 31, 1999=100. |
| (5) | | Source: Central Bank. This column sets forth the growth of national employment. |
| (6) | | Source: IBGE. Annual averages of the average monthly rates for the period from 2000 to 2004 and average rates over the relevant period for the metropolitan areas of Rio de Janeiro, São Paulo, Belo Horizonte, Porto Alegre, Salvador and Recife. |
| (7) | | The methodology used by IBGE to determine the average unemployment rate was changed in 2003. The average unemployment rates shown for 2000 through 2002 were determined using the methodology in effect prior to 2003. If the new methodology had been in effect in 2002, the average unemployment rate that year would have been 11.7%. |
Unions and Labor Protection
Under the Constitution, professional or union associations may be freely organized. There are no Government formalities for the organization of a union, other than registration at the appropriate agency, and public authorities are prohibited from intervening in or interfering with unions. No more than one union may be created to represent the same professional or economic group in the same geographic area.
Under Brazilian law, the principal function of a union is to represent the general interests of its members as a group or individually. It may also enter into collective labor agreements and promote conciliation in collective labor disputes. The union must provide free legal assistance for its members. A union may not be affiliated with any international organization other than the International Labor Organization unless authorized by the President of the Republic. Union representatives are also protected under Brazilian labor laws. A candidate for a union leadership position or job-safety monitor may not be dismissed after registering his or her candidacy and, if elected, may not be dismissed until one year after his or her term expires.
The Constitution introduced a number of significant labor reforms, such as a reduction in the workweek from 48 hours to 44 hours and a six-hour limit on the duration of an uninterrupted work shift. In addition, pregnant workers may not be dismissed for taking maternity leave of up to four months.
D-39
Unions in certain sectors of the economy, including the petroleum, metalworking and automobile industries, have staged strikes periodically primarily in an attempt to obtain higher wages. In May 1995, employees at Petrobrás, the largest corporation in Brazil, struck for approximately one month to obtain higher wages and in general opposition to the Government’s privatization plans. Although labor actions have had some disruptive effects on certain industries, they have not impaired the implementation of Plano Real policies.
On January 12, 2000, the National Congress enacted Law Nos. 9,957 and 9,958, which authorize labor court judges to issue final decisions in suits relating to labor disputes involving amounts in dispute not exceeding forty times the national minimum wage. The new laws do not apply to labor suits brought by Federal, State and municipal civil servants. Under Law No. 9,957, labor suits filed after March 14, 2000 against private and public corporations must be heard within fifteen days, and the judge has up to thirty days to render a decision. The average time for labor cases to be decided was five to seven years at the time the law was enacted. If one of the parties challenges the labor judge’s decision on the ground of insufficient evidence, a new hearing must be held within thirty days. Appeals of any decision may be made by employers or employees within eight days following the issuance of the decision. There is no time limit for higher labor courts to decide an appeal. In addition, Law No. 9,958 provides that companies can organize employers’ and employees’ commissions to resolve labor disputes before they are presented to the labor judge.
Social Security
Under Brazil’s state-operated social security and pension system, employers are generally required to contribute 20% of each employee’s wages to the system on a monthly basis (except for employers of domestic servants, who contribute 12% of wages), while employees generally contribute between 7.65% and 11% of their monthly wages for retirement benefits (paid in connection with retirements due to old age, illness or length of service), workers’ compensation, death benefits, maternity leave, sick leave, disability and other social services. The contributions and benefits are readjusted yearly during the month of June, by a consumer index.
In November 1999, the National Congress enacted Law No. 9,876 of November 26, 1999, which changed the rules for retirement for private sector employees. The law introduced a social security factor that is used to calculate benefits for retirees. This factor takes into account not only age and years of contributions to the National Social Security Institute (Instituto Nacional do Seguro Social or “INSS”), but also life expectancy. The law also changed the base for calculating the INSS benefit of any retiree to the arithmetic mean of the monthly salaries of that retiree during 80% of the monthly periods since July 1994 when that monthly salary was highest, rather than the average monthly salary of that retiree during the last 36 months before retirement. The new social security factor was phased in over a five-year period. Certain private sector employees challenged the law on constitutional grounds. On March 15, 2000, the Federal Supreme Court denied their claim and upheld the constitutionality of the law.
On May 29, 2001, the Government enacted two complementary laws regulating pension funds. Complementary Law No. 108, which applies to pension funds maintained by the federal Government, the States and municipalities, as well as by entities controlled directly or indirectly by them, limits the amount of an employer’s contributions with respect to any specific employee to the amount contributed by that employee and prohibits any bonuses or other amounts to be added to an employee’s benefits under the pension plan. Complementary Law No. 109, which relates to private pension funds, permits amounts to be transferred between funds in connection with a change in employment.
On December 19, 2003, the rules related to retirement and social security for civil servants were further modified by Constitutional Amendment No. 41. The adjustments include: (i) an increase in the minimum retirement age for civil servants from 48 to 55 years for women and from 53 to 60 years for men; (ii) a reduction of 30% in pensions paid for widows and orphans of civil servants in excess of R$2,400 per month; (iii) a contribution to the social security system by retired civil servants of 11% of the amount by which the retired employee’s pension exceeds R$1,440 per month in the case of federal retirees and R$1,200 per month in the case
D-40
of all other retired civil servants; (iv) a uniform contribution level for municipal, State and federal workers consisting of at least 11% of the amount of the employee’s salary; and (v) the institution of a complementary regime for new civil servants, which will require the passage of ordinary legislation. For the private sector pension system, the cap on social security pensions paid to private sector retirees was raised from R$1,561.56 to R$2,400 per month. The changes to the social security system under Constitutional Amendment No. 41 were intended to reduce the consolidated deficit in the pension system, which reached 5.2% of GDP in 2001 and 5.5% of GDP in 2002.
On August 18, 2004, the Brazilian Federal Supreme Court upheld the constitutionality of the 11% tax on retired civil servants’ pensions. However, the Supreme Court raised the level above which all pensions would be taxed to R$2,508 (which is the ceiling for retirement payments under the general social security system) per month from R$1,505 per month in the case of federal retirees and R$1,254 per month in the case of State and municipal retirees. The new threshold amount will continue to be indexed to the minimum wage. The tax was among the pension reform measures adopted in December 2003 by Constitutional Amendment No. 41 dated December 19, 2003.
Certain amendments to the Government’s social security reform bill were approved by the Senate in a separate, parallel bill. The parallel bill was sent to the Chamber of Deputies for its approval. The parallel bill includes:
| | • | | provisions to restore parity between the salaries of pensioners and working civil servants having a tenure of at least 20 years, but only with respect to persons employed as civil servants at the time the reforms are enacted; |
| | • | | transition rules for civil servants with at least 30 years (in the case of women) or 35 years (in the case of men) of service; and |
| | • | | provisions permitting State governors to enact State laws to address imbalances resulting from the pension and salary caps under Constitutional Amendment No. 41. |
On March 18, 2005, the Chamber of Deputies approved in a second round of voting the amended parallel bill relating to social security reform. The original version of this bill had been approved by the Senate in December 2003. The Senate’s version of the bill was amended to provide, among other things, that benefits payable to retired civil servants are to increase at the same rate as the salaries paid to active civil servants and that the contribution payable by disabled retired civil servants is to be 11% of the amount by which the civil servant’s pension exceeds R$4,800 per month, effective December 31, 2003. To become effective, the amended bill will need to be approved by the Senate in two rounds of voting.
Poverty and Income Distribution
Despite GDP growth in recent years, Brazil has experienced significant disparities in the distribution of wealth and income. Although these disparities, as determined by the Gini index (which measures, using a scale of 0 (perfect equality) to 100 (perfect inequality), the extent to which the distribution of income (or consumption) among individuals or households in a country deviates from a perfectly equal distribution), have declined from 60.0 in 1993 to 55.5 in 2003, they remain high.
D-41
The following table sets forth the data obtained from the National Household Sample Survey (PNAD) for 2003, published by IBGE.
Table No. 13
Income Distribution of the Economically Active Population—2003(1)
| | | |
Income Group
| | % of National Income
| |
Bottom 50% | | 14.8 | % |
Top 50% | | 85.2 | |
| | |
|
|
Total | | 100.0 | % |
Lowest 20% | | 3.1 | |
Top 10% | | 46.1 | |
Top 1% | | 13.2 | |
| (1) | | People ages 10 and above. |
Source: IBGE, PNAD 2003.
The da Silva administration has committed itself to addressing the problems of poverty in Brazil. The centerpiece of the da Silva administration’s attack on poverty is the Zero Hunger (Fome Zero) program, managed by the Ministry of Regional Development and Hunger Alleviation. The Zero Hunger program includes measures related to food and income distribution and the elimination of child labor. The Government intends to assist 44 million persons through that program through December 31, 2008.
The “Bolsa Família” initiative, created by the Law No. 10,836, of January 9, 2004, consolidated the National Program of Minimum Income Linked to Education (“Bolsa Escola”), the National Program of Access to Food (“PNAA”), the National Program of Minimum Income Linked to Health (“Bolsa Alimentação”) and the Gas-Aid Program. The Bolsa Família program provides basic benefits to families in extreme poverty and supplemental benefits to impoverished families whose members include pregnant or nursing women or children under 15 years of age.
Environment
The Ministry of the Environment (Ministério do Meio Ambiente, dos Recursos Hidricos e da Amazônia Legal) is the federal body responsible for formulating and implementing environmental policies. The National Council on the Environment (“CONAMA”) prepares environmental regulations, and the Brazilian Institute of the Environment and Renewable Resources (“IBAMA”) is charged with supervising and overseeing the application of those regulations.
The Constitution contains a chapter on environmental protection, providing for the right to a clean environment and imposing upon the federal Government, the States, the Federal District and municipalities the duty to protect the environment, take measures against pollution and protect fauna and flora. In addition, legislation enacted in 1981 and 1985 provides that any individual or entity directly or indirectly causing environmental damage shall be held strictly liable and shall indemnify the damaged parties for any resulting losses. Various federal Governmental agencies have the power to enforce environmental laws by imposing fines, ordering the shutdown of polluting facilities or denying or withholding tax and other benefits. Criminal sanctions, including imprisonment, may also be imposed upon violators. Despite constitutional and legislative protections for the environment, many areas of Brazil, and large urban areas in particular, suffer significant air, water and soil pollution.
Environmental problems in Brazil include industrial and urban pollution, deforestation and soil pollution and erosion arising from industrialization, rapid urbanization and poverty. In recent years, the federal Government has, through modern environmental legislation, established broad ambient quality standards,
D-42
introduced procedures and requirements for environmental licenses, set aside areas for the preservation of critical ecosystems and intervened whenever State environmental agencies were not carrying out their responsibilities. In addition, federal, State and local government entities have, with the assistance of multilateral lenders such as the World Bank and the IDB, undertaken several projects in recent years that are intended to address existing environmental problems in certain large metropolitan areas.
Large-scale projects have been undertaken to build or improve water treatment facilities and to clean up water supplies that are heavily polluted with urban and industrial waste. For example, a $400 million program was initiated in 1999 to clean up the Tietê River in the State of São Paulo. The Tietê River program aims to improve waste collection and treatment through the construction or expansion of sewers, pumping stations and treatment plants, to initiate studies regarding the strategic development of São Paulo’s basic sanitation sector and to mount an education program designed to raise the awareness of São Paulo’s residents to the importance of proper waste disposal. Other initiatives in recent years have included a project (approved in 2000 and funded by a $260 million loan from the IDB and local sources) to expand the Federal District’s water supply and sanitation infrastructure as well as to improve storm drainage and erosion control; a program (approved in July 2002 and funded by a $95.2 million loan from the IDB and local sources) in the State of Goiânia to improve the potable water supply and the sewage system through, among other things, the construction of an impoundment dam; and a $225 million program (approved in December 2002 and funded by a loan from the IDB) to modernize the water sanitation system and to increase flood protection for the residents of the State of Ceará.
The Social Action Sanitation Program, established in October 2001, seeks to improve water supply and basic sanitation services for low-income users in small urban communities by improving or constructing new potable water and sanitation systems. The program also aims to provide hygienic and environmental education to beneficiary communities, financing for sector studies, training for State environmental control agencies and funding to promote self-sustainability for water management service providers. The $200 million program is funded by a $100 million loan from the IDB and a loan in the same amount from local sources.
Air pollution, an environmental problem in Brazil’s largest cities, has also been the focus of certain recent environmental initiatives. For example, in the municipality of São Paulo, where the large number of vehicles contributes to dangerously high levels of air pollution in the city during the winter, efforts to reduce emissions have resulted in programs to reduce vehicular traffic and to increase inspections of the buses and trucks that drive through the city.
The rapid growth of slums (favelas) in certain municipalities such as Rio de Janeiro and São Paulo has left many parts of such municipalities without adequate infrastructure. Many such favelas lack sewage and adequate storm drainage systems, and often do not receive such city services as garbage collection and rodent control. In April 2003, the World Bank approved Brazil’s most recent initiative to combat such poor conditions in the favelas of Recife, located in the State of Pernambuco. The $84 million project, funded in part by a $46 million loan from the World Bank, will focus on developing, among other things, basic infrastructure works in water, sanitation and resettlement housing, and on financing investments in water treatment and landfill management facilities.
Efforts are also being made to address rural poverty and the environmental problems that accompany it. Such efforts include the Natural Resources Management and Poverty Reduction Project for Santa Catarina, which aims to reduce rural poverty while improving natural resources management. The program, slated to last six years, will focus on the provision of environmental education to farmers and fishermen, as well as the identification and funding of rural investments aimed at land management, improvement of basic sanitation conditions and other environmental management initiatives. The total cost of the project, established in April 2002, is $107.5 million, of which $62.8 million in loans has been provided by the World Bank.
There have been significant recent initiatives to conserve Brazil’s threatened rain forest and biological diversity. Among these is the Pilot Program to Conserve the Brazilian Rain Forest, a G-7 initiative coordinated through the Rain Forest Trust Fund, a trust fund administered by the World Bank; as of March 2002, the Program
D-43
had received approximately $346 million worth of funding from bilateral lenders such as Germany, and from the federal Government. The Brazilian Ministry of the Environment has also implemented a National Biodiversity Program, which is aimed at studying and protecting Brazil’s biological diversity. Although Brazil occupies nearly half of South America and contains the world’s largest standing tropical rain forest, the largest inland wetland, large expanses of semi-arid scrubland and vast tree and shrub woodlands, much of the country’s biological diversity remains poorly understood. In September 2002, the first phase of the Amazon Region Protected Areas Program (ARPA) was launched with financial commitments from the World Bank, the United States, the Global Environment Facility, the World Wildlife Fund, the German bilateral agency Kreditanstalt für Wiederaufbau as well as the federal Government. The program, estimated to cost $395 million over the course of ten years, aims to triple the current amount of Amazon rainforest under federal protection, by designating new strict use protected areas (such as national parks and reserves) and new sustainable development areas based on conservation priorites established by the National Biodiversity Program. Under ARPA, a fiduciary fund, whose income will guarantee the future maintenance of such protected areas, will also be established.
In December 2000, the Ministry of the Environment obtained funding for a sustainable development program for the Pantanal, the world’s largest wetlands, the first phase of which is financed by an $82.5 million loan from the IDB and a loan in the same amount from local sources. In addition to supporting the monitoring and management of water pollution, soil erosion, population pressures and unregulated tourism, the program will also fund research and implementation of environmentally sound land use and other economic activities in the region. In 2002, a sustainable development program was initiated in the State of Acre (financed by loans amounting to $64.8 million and $43.2 million from the IDB and local sources, respectively); another was established in the Zona da Mata, located in the State of Pernambuco (and which was financed by a $90 million loan from the IDB).
Education
In 2003, enrollment in Brazil’s 1,859 universities and post-graduate institutions totaled 3,887,022. According to the Basic Education Census conducted by the Ministry of Education there were 56,851,090 students enrolled in Brazil in 2004, of which 12.1% were in preschool, 59.8% were in elementary school, 17.3% were in high school, 0.7% were in special needs schools and 10.1% were in supletivo, an accelerated basic program for adults.
Effective January 1, 1998, the Government established a Fund for the Maintenance and Development of Basic Education and Teacher Training (Fundo de Manutenção e Desenvolvimento do Ensino Fundamental e Valorização de Magistério or “FUNDEF”) pursuant to Constitutional Amendment No. 14 dated September 12, 1996, as regulated by Law No. 9,424 of 1996. FUNDEF, which is intended to increase overall funding for education, is to be funded through collections of the tax on circulation of goods and services (“ICMS”) and other taxes; 15% of such collections are to be allocated to FUNDEF.
Federal Government expenditure on education in 2002, 2003, and 2004 was R$13.2 billion, R$14.2 billion and R$14.5 billion, respectively; the amount budgeted for education in 2005 is approximately R$17.3 billion.
Among the challenges facing Brazil is the provision of basic education to poor children between the ages of six and eighteen and higher education to young adults. According to the IBGE, 97.7% of children between the ages of 7 and 14 years old were enrolled in school in 2002, largely as a result of the policies intended to broaden access to basic education. However, the illiteracy rate for persons over 15 years old was 11.8% in 2002. In addition, education levels among persons over 15 years old tended to vary considerably by region of the country and by level of per capita family income.
Competition Law
In June 1994, the National Congress enacted an antitrust law designed to promote free competition, to prevent excessive concentrations of economic power contrary to the public interest and to avoid excessive price
D-44
increases. The law sets forth general criteria for determining anti-competitive behavior, such as tying, refusing to deal, price fixing, predatory pricing, exclusive dealing arrangements and resale price maintenance.
In addition, the law requires that all documents relating to any merger, acquisition or asset sale that may limit or otherwise restrain open competition be filed within fifteen days of such transaction with the Economic Defense Secretariat (Secretaria de Defesa Econômica or “SDE”) of the Finance Ministry and the Administrative Council for Economic Defense (Conselho Administrativo de Defesa Econômica or “CADE”) if such transaction would result in a 20% or greater market share for a company or group of companies or in which any of the participants has reported in its most recent balance sheets annual gross income equal to or greater than R$400 million. The SDE has the option of initiating administrative proceedings before the CADE to challenge any such transaction. In any administrative proceeding before it, the CADE has the power to impose fines or to grant equitable relief as well as to determine that the transaction be partially or totally reversed. In addition, a private party aggrieved by anti-competitive behavior has standing to sue in federal court on behalf of itself and similarly situated parties and may seek both equitable relief and monetary damages.
Incentives for Private Investment
In March 2004, the Government announced several measures that were intended to reduce costs and increase the competitiveness of Brazilian products in international markets. These measures included the provision of financing for the acquisition of machinery and equipment, the reduction of taxes on machinery, equipment and exports, and the simplification of procedures for incorporating companies and clearing customs. For example, the Modernization Program of the National Industry (MODERMAQ) instituted by Central Bank Resolution No. 3,227 on May 8, 2005 provides financing for the acquisition of machinery and new equipment produced in Brazil.
In addition, in April 2004, the Government proposed legislation providing for the organization of agencies for the regulation of the oil and natural gas, telecommunications and transportation sectors. The draft legislation defines the regulatory and surveillance powers of the regulatory agencies and includes the power to grant concessions. The heads of the agencies are to have four-year terms; to ensure the agencies’ autonomy, these terms are not to coincide with that of the President. The legislation also requires the agencies to issue annual reports, hold public hearings and appoint an ombudsman to ensure accountability.
On December 30, 2004, President da Silva sanctioned Law No. 11,079, which provides for the formation of two types of “public-private partnerships” or “PPPs”: (i) contracts for concessions of public works or utility services under which private party concessionaires receive payments from a public sector entity in addition to tariffs charged to end-users and (ii) contracts for rendering of services under which a public sector entity is the end-user. PPP contracts must be worth at least R$20 million and provide for a service period of between five and thirty-five years, including extensions of the term. All such contracts can only be awarded through a public bidding process. Because the concessionaires will only begin to receive payments when the services under the PPP contract are provided, the private parties will have to obtain private financing for the construction of the facility that is to provide the services under the contract. Law No. 11,079 permits payments from the public sector entity to be made directly to the contractor’s creditors, thereby reducing the creditors’ overall credit risk. The federal PPP program is to be overseen by a management committee appointed by the Ministry of Planning, Budget and Management, the Ministry of Finance and the Office of the Chief of Staff (Casa Civil da Presidência da República). The management committee is charged with selecting the projects for and regulating the federal PPP program. Law No. 11,079 further permits the federal Government to allocate up to R$6 billion to a PPP Guarantee Fund (Fundo Garantidor de Parcerias Público-Privadas, or FGP). On May 30, 2005, the Planning, Budget and Management Ministry announced that it had prepared a list of ten projects to be presented to the private sector as possible PPPs. The Government expects to announce the first six projects, which are all related to the transportation infrastructure, by November 30, 2005.
D-45
BALANCE OF PAYMENTS AND FOREIGN TRADE
Balance of Payments
Following the Central Bank’s decision in January 1999 to permit the real to float, Brazil’s balance of payments came under pressure as net capital and financial outflows reached $5.1 billion at the end of the first quarter of 1999, the result of $7.0 billion in net foreign portfolio outflows that quarter. The trend in net capital flows reversed itself during the second quarter of 1999, with net capital and financial inflows totaling $10.5 billion for the six months ended June 30, 1999. Brazil ended the year with net capital and financial inflows of $17.3 billion and a current account deficit of $25.3 billion, a 24.2% reduction from 1998.
In 1999, Brazil’s balance of payments deficit remained virtually constant at $7.8 billion, net capital and financial inflows totaled $17.3 billion, a 41.7% reduction from 1998. Much of the decline in net capital inflows was attributable to a drop in net foreign portfolio investments (from $18.6 billion in 1998 to $3.5 billion in 1999, an 80.9% decrease) and a reversal in the direction of net long-term trade credit flows.
In 2000, a reduced current account deficit, resulting from an improved trade balance and lower net income outflows, as well as an increase in net capital and financial inflows, led to a $5.6 billion reduction in the balance of payments deficit, which totaled $2.3 billion. Improvement in the trade balance and a reduction of net income outflows led to a 4.4% reduction in the current account deficit in 2000. The current account deficit totaled $24.2 billion, down from $25.3 billion in 1999. Net capital and financial inflows increased by approximately $2.0 billion to $19.3 billion, with a 14.7% increase in net foreign direct investment inflows (to $32.8 billion) and a 144.2% increase in net foreign portfolio investment inflows (to $8.7 billion), that more than offset a $4.6 billion increase in net outflow in other investments.
In 2001, Brazil registered a $3.3 billion surplus in its balance of payments largely as a result of improved trade figures. A reversal in net trade flows led to further improvements in the current account. The current account deficit decreased 4.2% to $23.2 billion from $24.2 billion in 2000. Net capital and financial account inflows increased 40.0%, despite a 31.5% decrease in foreign direct investment and an 89.9% decrease in portfolio investment. The increase in net capital and financial inflows was attributable in part to a reversal in net trade-related credit flows, from net outflows of $6.4 billion in 2000 to inflows of $5.1 billion in 2001.
Brazil registered a trade surplus of approximately $13.1 billion in 2002, versus a trade surplus of approximately $2.7 billion in the previous year. The improvement in the trade balance in 2002 resulted, in large part, from a 3.7% growth in exports and a 15.0% decline in imports caused by the depreciation of the real. The increase in the trade balance was sufficient to reduce the current account deficit to approximately $7.6 billion (1.7% of GDP) in 2002. In 2002, net capital and financial inflows dropped to $8.0 billion, reflecting a 70.4% decrease. This decline was due primarily to a 42.9% decrease in direct investments (from net inflows of $22.5 billion in 2001 to $16.6 billion in 2002), and reversals in the direction of portfolio investment flows (from net inflows of $872 million in 2001 to net outflows of $4.8 billion in 2002) and other investment flows (from net inflows of $2.8 billion in 2001 to net outflows of $1.1 billion in 2002), resulting in a balance of payments surplus of approximately $302 million.
In 2003, Brazil registered a current account surplus of approximately $4.2 billion. The current account surplus was due largely to a trade surplus of approximately $24.8 billion in 2003, which was primarily the result of a 21.1% growth in exports. Net capital and financial inflows totaled approximately $5.1 billion, a 36.5% reduction from 2002. Much of the decline in net capital inflows was attributable to a drop in other investment flows (from net outflows of $1.1 billion in 2002 to net outflows of $10.4 billion in 2003) and net foreign direct investment that fell to $10.1 billion in 2003 from $16.6 billion in 2002. There was a reversal in the direction of net foreign portfolio investment flows (from net outflows of $5.1 billion in 2002 to net inflows of $5.3 billion in 2003). Brazil registered a $8.5 billion surplus in its balance of payments in 2003.
Brazil’s current account surplus was $11.7 billion (1.93% of GDP) in 2004, the highest ever recorded both in nominal terms and as a percentage of GDP. The current account surplus was largely due to a trade surplus of
D-46
approximately $33.7 billion in 2004. Exports totaled $96.5 billion in 2004, a 32.0% increase over 2003 and the highest ever recorded, while imports totaled $62.8 billion, a 30.0% increase over 2003. The current account surplus was achieved despite a reversal in 2004 in the direction of net capital and financial account flows (from net inflows of $5.1 billion in 2003 to net outflows of $7.3 billion in 2004). The decline in the net capital and financial accounts was primarily due to a reversal in the direction of portfolio investment flows (from net inflows of $5.3 billion in 2003 to net outflows of $4.8 billion in 2004) and to an increase in other investments outflows (from net outflows of $10.4 billion to net outflows of $11.3 billion). However, net direct foreign investment inflows totaled approximately $18.2 billion in 2004, an increase of 79.1% over 2003, which resulted in a balance of payments surplus of approximately $2.2 billion in 2004.
The following table sets forth information regarding Brazil’s balance of payments for each of the periods indicated.
Table No. 14
Balance of Payments(1)
(in millions of dollars)
| | | | | | | | | | | | | | | |
| | | 2000
| | | 2001
| | | 2002
| | | 2003
| | | 2004(2)
| |
Current Account | | (24,225 | ) | | (23,215 | ) | | (7,637 | ) | | 4,177 | | | 11,669 | |
Trade Balance (fob) | | (698 | ) | | 2,650 | | | 13,121 | | | 24,794 | | | 33,693 | |
Exports | | 55,086 | | | 58,223 | | | 60,362 | | | 73,084 | | | 96,475 | |
Imports | | 55,783 | | | 55,572 | | | 47,240 | | | 48,290 | | | 62,782 | |
Services and Income Balance | | (25,048 | ) | | (27,503 | ) | | (23,148 | ) | | (23,483 | ) | | (25,292 | ) |
Credit | | 13,119 | | | 12,601 | | | 12,847 | | | 13,785 | | | 15,641 | |
Debit | | 38,167 | | | 40,104 | | | 35,994 | | | 37,269 | | | 40,934 | |
Current Transfers (net) | | 1,521 | | | 1,638 | | | 2,390 | | | 2,867 | | | 3,268 | |
Capital and Financial Account | | 19,326 | | | 27,052 | | | 8,004 | | | 5,111 | | | (7,310 | ) |
Capital Account(3) | | 273 | | | (36 | ) | | 433 | | | 498 | | | 339 | |
Financial Account | | 19,053 | | | 27,088 | | | 7,571 | | | 4,613 | | | (7,702 | ) |
Direct Investment | | 30,498 | | | 24,715 | | | 14,108 | | | 9,894 | | | 8,695 | |
Abroad | | (2,282 | ) | | 2,258 | | | (2,482 | ) | | (249 | ) | | (9,471 | ) |
In Brazil | | 32,779 | | | 22,457 | | | 16,590 | | | 10,144 | | | 18,166 | |
Portfolio Investments | | 6,955 | | | 77 | | | (5,119 | ) | | 5,308 | | | (4,750 | ) |
Assets | | (1,696 | ) | | (795 | ) | | (321 | ) | | 179 | | | (755 | ) |
Liabilities | | 8,651 | | | 872 | | | (4,797 | ) | | 5,129 | | | (3,996 | ) |
Derivatives | | (197 | ) | | (471 | ) | | (356 | ) | | (151 | ) | | (677 | ) |
Other Investments(4) | | (18,202 | ) | | 2,767 | | | (1,062 | ) | | (10,438 | ) | | (10,969 | ) |
Assets | | (2,989 | ) | | (6,586 | ) | | (3,211 | ) | | (9,752 | ) | | (2,196 | ) |
Liabilities | | (15,213 | ) | | 9,353 | | | 2,150 | | | (686 | ) | | (8,773 | ) |
Errors and Omissions | | 2,637 | | | (531 | ) | | (66 | ) | | (793 | ) | | (2,039 | ) |
Overall Balance | | (2,262 | ) | | 3,307 | | | 302 | | | 8,496 | | | 2,244 | |
Financing | | 2,262 | | | (3,307 | ) | | (302 | ) | | (8,496 | ) | | (2,244 | ) |
Change in Reserves | | 2,262 | | | (3,307 | ) | | (302 | ) | | (8,496 | ) | | (2,244 | ) |
Gold | | 330 | | | 394 | | | 53 | | | 43 | | | 14 | |
SDR | | 8 | | | (6 | ) | | (244 | ) | | 261 | | | (3 | ) |
Foreign Currency | | 1,897 | | | (3,721 | ) | | (120 | ) | | (8,776 | ) | | (2,283 | ) |
Other | | 28 | | | 26 | | | 9 | | | (24 | ) | | 28 | |
Memo: | | | | | | | | | | | | | | | |
Support Package | | | | | | | | | | | | | | | |
Loans from the IMF(5) | | (6,876 | ) | | 6,758 | | | 11,480 | | | 4,769 | | | (4,363 | ) |
Other | | (3,446 | ) | | — | | | — | | | — | | | — | |
| (1) | | These figures were calculated in accordance with the methodology set forth in the IMF Balance of Payments Manual, Fifth Edition. |
| (3) | | Includes migrant transfers. |
D-47
| (4) | | Includes installments and a partial payment under a $41.8 billion IMF-led support package. See “The Brazilian Economy—Recent Economic Events and Policies”. |
| (5) | | Includes IMF loans other than support package. |
Source: Central Bank
Foreign Trade
Overall trade flows totaled $110.9 billion in 2000. Imports rose 13.3% to $55.8 billion, while exports rose 14.7% to $55.1 billion. Brazil ended 2000 with a trade deficit of approximately $698 million.
Brazil’s overall trade flows rose slightly in 2001, totaling $113.8 billion. Exports grew 5.7% to $58.2 billion, while imports fell 0.5% to $55.6 billion. The result was a trade surplus of approximately $2.7 billion in 2001, the first since 1994.
Brazil registered a trade surplus of approximately $13.1 billion in 2002. The improvement in the trade balance in 2002 resulted from a 3.7% growth in exports and a 15.0% decline in imports caused by the depreciation of the real.
In 2003, Brazil registered a trade surplus of approximately $24.8 billion. Exports totaled $73.1 billion, an increase of 21.1% compared to 2002, and imports totaled $48.3 billion, an increase of 2.2% compared to 2002.
In 2004, Brazil registered a trade surplus of approximately $33.7 billion. Exports totaled $96.5 billion, the highest ever recorded and a 32.0% increase over 2003, while imports totaled $62.8 billion, a 30.0% increase over 2003. The improvement in the 2004 trade balance resulted in a current account surplus of approximately $11.7 billion, compared to a current account surplus of approximately $4.2 billion in 2003.
During the first five months of 2005, Brazil registered an accumulated trade surplus of approximately $15.6 billion versus an accumulated trade surplus of approximately $11.2 billion for the corresponding period in 2004. Exports for the first five months of 2005 totaled $43.5 billion, a 27.9% increase over the corresponding period in 2004, while imports totaled $27.8 billion, a 22.2% increase from the $22.8 billion recorded in the corresponding period in 2004. The improvement in the trade balance during the first five months of 2005 resulted in an accumulated current account surplus of approximately $4.1 billion, compared to an accumulated surplus of approximately $2.3 billion for the corresponding period in 2004. The accumulated balance of payments surplus was approximately $10.1 billion for the first five months of 2005 compared to an accumulated surplus of approximately $2.2 billion for the corresponding period in 2004.
Exports. In 2000, exports rose 14.7% to $55.1 billion. Transport equipment as a proportion of Brazilian exports increased from 11.4% in 1999 to 14.6% in 2000, while machinery, appliances and electrical equipment as a proportion of Brazilian exports grew from 12.0% in 1999 to 13.2% in 2000. For 2001, exports rose 5.7% to $58.2 billion. As a proportion of exports, the categories of vegetable, animals and animal products; food, beverage and tobacco; and mineral products all grew, reaching 14.8%, 13.1% and 9.4%, respectively. The trend continued in 2002, with an increase in exports of 3.7% to $60.4 billion. The sectors of vegetable, animals and animal products; food, beverage and tobacco; mineral products and metals grew, as a proportion of Brazilian exports in 2002, to 15.4%, 13%, 10.7% and 10.1%, respectively. Exports totaled $73.1 billion in 2003 and $96.5 billion in 2004, a record high. According to preliminary estimates, exports for the first five months of 2005 totaled approximately $43.5 billion, a 27.9% increase over the corresponding period of the previous year. Exports of manufactured, semi-manufactured and basic goods registered $24.5 billion, $6.4 billion and $11.7 billion, respectively, during the first five months of 2005.
The largest market for Brazilian products has been the European Union, although the European Union’s share of Brazilian exports has been declining. In 2000, 2001, 2002, 2003 and 2004, exports to the European Union amounted to approximately $14.8 billion (or 26.8%), $14.9 billion (or 25.5%), $15.1 billion (or 25.0%), $18.1 billion (or 24.8%) and $24.2 billion (or 25.0%), respectively, of all Brazilian exports. Exports to the
D-48
European Union amounted to approximately $10.4 billion in the first five months of 2005, an increase of 17.5% over 2004. Exports to the United States have grown, reaching $14.4 billion in 2001, $15.5 billion in 2002, $16.9 billion in 2003 and $20.3 billion in 2004 (or 24.7%, 25.7%, 23.1% and 21.1%, respectively, of all Brazilian exports). Exports to the United States amounted to approximately $9.0 billion in the first five months of 2005, amounting to an increase of 28.8% over 2004. Exports to other Mercosul countries, however, fell from $7.7 billion (or 14.0%) in 2000 to $6.4 billion (or 10.9%) in 2001 and $3.3 billion (or 5.5%) in 2002 of all Brazilian exports, largely because of Argentina’s severe recession. With Argentina’s economic recovery in 2003, exports to Mercosul increased to $5.7 billion in that year and $8.9 billion in 2004 (7.8% and 9.2%, respectively). Exports to Mercosul countries amounted to $4.4 billion in the first five months of 2005, an increase of 36.3% over the corresponding time period in 2004.
These trends have been influenced by Government initiatives to promote exports. The Government’s export financing program, PROEX replaced the predecessor FINEX program in 1991. In April 1997, PROEX was broadened to apply to both pre-shipment and post-shipment operations, and the list of eligible products thereunder, which was limited to certain capital goods, was extended to certain consumer products. The list of eligible products was further expanded on January 13, 1998, for purposes of both rate equalization and financing. In addition, on September 13, 1996, the Government approved the elimination of the State value-added tax (“ICMS”) on exports of primary and semifinished goods and on the acquisition of certain fixed assets in an effort to liberalize the export sector and stimulate growth. The Government intends to reimburse States, for periods ranging from 6 to 10 years, for the loss of revenues resulting from the elimination of the ICMS. States experiencing revenue losses of up to 10% will be eligible for reimbursement for six years. The reimbursement period is extended by one year for each additional two percentage points of revenue losses above 10%, up to a maximum reimbursement period of ten years. Aggregate reimbursement to the States totaled R$3.8 billion in 2000, R$3.6 billion in 2001, R$3.9 billion in 2002, R$3.8 billion in 2003 and R$3.3 billion in 2004.
In September 2000, BNDES established credit lines that permitted entities to receive advance payments by promising to increase their export volumes within the following year. Because advances under the credit lines were linked to a domestic interest index (the Long-Term Interest Rate, or “TJLP”) rather than Libor, the entities were protected against indirect foreign exchange risk. The Government also established the Exports Program on November 17, 2000, which is intended to reduce exporting costs, foster the formulation of export strategies and promote the development of an exporter culture. The program, among other things, seeks to enhance export credit insurance, increase the capital of the Exports Guarantee Fund and expedite applications for export credit insurance.
In 2002, the Government undertook several initiatives to stimulate exports. Law No. 10,637, dated December 30, 2002 provided for, among other things, (a) an exemption from the PIS/PASEP tax for all income derived from the export of goods or services abroad, and (b) an exemption from the payment of the excise tax (“IPI”) to companies whose export revenues comprise more than 80% of their total revenues. Decree No. 4,418, dated October 11, 2002, amended BNDES bylaws to permit the creation of a line of credit accessible to Brazilian companies in order to stimulate their globalization and consequently to increase exports. Other initiatives included the creation of short-term credit lines in order to replace external credit lines that were interrupted due to cutbacks of foreign bank exposure in emerging countries. Provisional Measure 59, dated August 15, 2002 (subsequently enacted as Law No. 10,595 dated December 11, 2002), provided for the release of R$2 billion from FAT resources to allow BNDES to finance short-term operations. Concurrently, through Circulars Nos. 3,145 dated August 21, 2002, and 3,146 dated August 31, 2002, the Central Bank implemented rules that regulate the bidding for international reserves associated with the concession of advances for exchange currency agreements negotiated before and after the shipment of the merchandise. During 2002, $1.4 billion worth of such agreements were sold in such bids. Circular No. 3,158, dated October 25, 2002, reactivated the Reciprocal Credit Accord (CCR) with Argentina, increasing to $200,000 the amount of payment to be directed through CCR in connection with imports of Argentinean merchandise; Circular No. 3,160 dated October 30, 2002 allowed among all members of CCR, after December 10, 2002, transactions with terms longer than 360 days to be directed through CCR.
D-49
Pursuant to Law No. 10,833 dated December 29, 2003, the Contribution to Finance the Social Security (Contribuição para o Financiamento da Seguridade Social—COFINS) rate was increased from 3% to 7.6%. However, the assessment was also made non-cumulative. The contribution is applied on the monthly income of companies, excluding the credits related to the COFINS paid on the acquisition of raw materials and fixed assets from companies located in Brazil. Other expenses and costs, such as rents, energy and interest may be deducted from the COFINS. Revenues from exports continue to be exempt from COFINS payments. The Government expected non-cumulative assessment of the COFINS to be most beneficial to the exports of high-value added products, which involve more extensive production chains.
On January 26, 2001, Camex was given new powers and made more independent. As a result of this reform, Camex became responsible for fixing tariff rates, a responsibility that was formerly vested in the Ministry of Finance. Decree No. 4,732 dated June 11, 2003 further defined Camex’s powers and changed its organizational structure. Pursuant to Decree No. 4,732, Camex is composed of an Executive Management Committee (Comitê Executivo de Gestão—Gecex), an Executive Secretariat and a Private Sector Consultant Council (Conselho Consultivo do Setor Privado—Conex). Gecex is in charge of evaluating, surveying and streamlining procedures applicable to international trade and tourism, including those related to the transit of people or goods. Conex, which has twenty representatives from the private sector, provides support for proposals to improve the development of international trade policies.
In addition, on January 22, 2003, the National Agency for the Promotion of Exports (Agência de Promoção de Exportações—Apex) became an autonomous entity and was renamed Apex-Brasil. The change was intended to provide Apex-Brasil with greater flexibility and resources to promote trade.
On March 4, 2005, the National Monetary Council of Brazil approved Resolution No. 3,266, which, among other things, extended to 210 days from 180 days the period of time that exporters may maintain in accounts outside of Brazil the proceeds of exports of goods and services. See “—Foreign Exchange Rates and Exchange Controls”. Resolution No. 3,266 is intended to reduce the costs of Brazilian exports.
Imports. In 2000, imports rose 13.3% to $55.8 billion. The growth in imports in 2000 was largely attributable to increases in imports of machinery and electrical equipment ($18.2 billion, versus $16.6 billion in 1999), fuel and lubricants ($8.3 billion, versus $5.4 billion in 1999) and chemical products ($8.1 billion, versus $7.9 billion in 1999).
In 2001, imports fell 0.5% to $55.6 billion. Imports fell or remained at the same level in nearly every major commodity category, except precision instruments ($2.2 billion versus $2.0 billion in 2000), chemical products ($8.3 billion versus $8.1 billion in 2000), steel and cast iron ($1.1 billion versus $1.0 billion in 2000), and machinery and electrical equipment ($19.3 billion versus $18.2 billion in 2000).
In 2002, total imports continued to fall to $47.2 billion, or 15.0%. Imports of every category fell (with the exception of fertilizers, which saw a slight increase of 0.7%). Imports from the European Union, the United States and Mercosul members amounted to $13.1 billion (or 27.8% of all Brazilian imports), $10.4 billion (or 22.1% of all Brazilian imports) and $5.6 billion (or 11.9% of all Brazilian imports), respectively.
Imports recovered slightly in 2003, increasing 2.2% to $48.3 billion. Much of the increase is attributable to imports of cereals, fertilizers, chemical products and fuels and lubricants. Imports from the European Union, the United States and Mercosul members amounted to $12.7 billion, (or 26.2% of all Brazilian imports), $9.7 billion (or 20.2% of all Brazilian imports) and $5.7 billion (or 11.8% of all Brazilian imports), respectively.
In 2004, total imports continued to rise, increasing 30.0% to $62.8 billion. Imports from the European Union, the United States and Mercosul members amounted to $15.9 billion (or 25.4% of all Brazilian imports), $11.5 billion (or 18.3% of all Brazilian imports) and $6.4 billion (or 10.2% of all Brazilian imports), respectively.
D-50
According to preliminary estimates, imports for the first five months of 2005 totaled approximately $27.8 billion, a 22.2% increase over the corresponding period in 2004. Imports from the European Union, the United States and Mercosul members in the first five months of 2005 totalled $7.3 billion (or 26.3% of all Brazilian imports), $5.0 billion (or 17.9% of all Brazilian imports) and $2.8 billion (or 10.0% of all Brazilian imports), respectively, representing growth in imports over 2004 in all three regions (23.5%, 12.3% and 16.1%, respectively).
Brazil has reduced its import tariffs in recent years. In 1991, the Government announced a schedule for tariff reductions for a three-year period ending in January 1994, aimed at attaining rates varying from 0% to 40%, with an average tariff of 14.2%. The Government subsequently accelerated certain scheduled adjustments and implemented the last set of tariff reductions on July 1, 1993, when the average duty and the maximum tariff were reduced to 14.4% and 40%, respectively. In an effort to contain inflation, the Government also implemented in September and October 1994 significant new tariff reductions, covering over 5,000 products and reducing the average tariff to 11.32%. From November 30, 1997 to December 31, 1999, the average tariff was 13.8%. The average tariff dropped to 13.0% as of January 1, 2001 as a result of Decree No. 3,704 dated December 27, 2000, and the maximum tariff reached 35% as of that date.
Average tariffs were also reduced as a result of Brazil’s implementation of a schedule of preferences applicable to imports from Mercosul countries. Mercosul members enjoyed a 75% discount from otherwise applicable rates during the second half of 1993 and 82% during the first half of 1994. This discount was raised to 89% beginning July 1, 1994 and to 100% beginning January 1, 1995, although certain products were excepted from this discount. In December 1994, the four member countries of Mercosul established January 1, 1995 as the date for the implementation of the CET, intended to transform the region into a customs union. The CET ranges from 0.0% to a maximum of 20.0%, but each member country was allowed a certain number of exceptions to the CET. The products on each country’s list of exceptions have tariffs varying from the CET, but such tariffs were scheduled to be reduced automatically each year until December 31, 2002, at which time such tariffs were to be equal to the CET rates, as established by Mercosur Decision CMC No. 68, dated December 14, 2000.
Secex Rule No. 17 dated December 2, 2003 consolidated the rules of the International Trade Secretariat (Secretaria de Comércio Exterior—Secex) and of the Department of International Trade Operations (Departamento de Operações de Comércio Exterior—Decex) relating to imports. The rule incorporates certain procedures established by the WTO, revoking or simplifying 87 rules.
Brazil is a signatory to the Final Act of the GATT Uruguay Round, pursuant to which it has committed to staged reductions in tariffs beginning in 1995 over five years with respect to industrial products and over ten years with respect to agricultural products.
D-51
The following table sets forth certain details regarding Brazil’s foreign trade for the years indicated.
Table No. 15
Principal Foreign Trade Indicators
| | | | | | | | | | | | | | | | | | | | |
| | | 2000
| | | 2001
| | | 2002
| | | 2003
| | | 2004(1)
| |
Exports as % of GDP | | | 9.1 | % | | | 11.4 | % | | | 13.1 | % | | | 14.4 | % | | | 16.0 | % |
Imports as % of GDP | | | 9.3 | | | | 10.9 | | | | 10.3 | | | | 9.5 | | | | 10.4 | |
Trade Balance as % of GDP | | | (0.1 | ) | | | 0.5 | | | | 2.9 | | | | 4.9 | | | | 5.6 | |
Growth (Decline) in foreign trade(2) | | | 14.0 | | | | 2.6 | | | | (5.4 | ) | | | 12.8 | | | | 31.2 | |
Exports—% Increase (Decrease)(3) | | | 14.7 | | | | 5.7 | | | | 3.7 | | | | 21.1 | | | | 32.0 | |
Imports—% Increase (Decrease)(3) | | | 13.3 | | | | (0.5 | ) | | | (15.0 | ) | | | 2.2 | | | | 30.0 | |
Exports/Imports(4) | | | 0.99 | | | | 1.05 | | | | 1.28 | | | | 1.51 | | | | 1.54 | |
Exports | | | | | | | | | | | | | | | | | | | | |
$ in millions | | $ | 55,086 | | | $ | 58,223 | | | $ | 60,362 | | | $ | 73,084 | | | $ | 96,475 | |
1,000 tons | | | 244,626 | | | | 272,619 | | | | 295,563 | | | | 321,103 | | | | 383,120 | |
% change from prior period(5) | | | 7.0 | | | | 11.4 | | | | 8.4 | | | | 8.6 | | | | 19.3 | |
Imports | | | | | | | | | | | | | | | | | | | | |
$ in millions | | $ | 55,839 | | | $ | 55,572 | | | $ | 47,237 | | | $ | 48,290 | | | $ | 62,781 | |
1,000 tons | | | 92,786 | | | | 92,792 | | | | 90,460 | | | | 93,123 | | | | 102,810 | |
% change from prior period(5) | | | 8.5 | | | | 0.0 | | | | (2.5 | ) | | | 2.9 | | | | 10.4 | |
Trade Balance ($ in millions) | | $ | (698 | ) | | $ | 2,650 | | | $ | 13,121 | | | $ | 24,794 | | | $ | 33,693 | |
| (2) | | Percentage change in exports and imports from previous year. |
| (3) | | Percentage change from previous year. |
| (4) | | Exports divided by imports. |
| (5) | | Percentage change in volume, by weight. |
Source: Central Bank and Ministry of Development, Industry and Foreign Trade
The following tables set forth certain information regarding exports and imports by major commodity groups for the periods indicated.
Table No. 16
Exports (FOB Brazil) by Major Commodity Groups
| | | | | | | | | | | | | | | | | | | | | | | | | | | | | | |
| | | 2000
| | | 2001
| | | 2002
| | | 2003
| | | 2004(1)
| |
Item
| | in $millions
| | % of total
| | | in $millions
| | % of total
| | | in $millions
| | % of total
| | | in $millions
| | % of total
| | | in $millions
| | % of total
| |
Vegetable, Animals and Animal Products | | $ | 6,764 | | 12.3 | % | | $ | 8,608 | | 14.8 | % | | $ | 9,270 | | 15.4 | % | | $ | 12,420 | | 17.0 | % | | $ | 16,745 | | 17.4 | % |
Food, Beverage and Tobacco | | | 6,213 | | 11.3 | | | | 7,649 | | 13.1 | | | | 7,845 | | 13.0 | | | | 8,841 | | 12.1 | | | | 10,937 | | 11.3 | |
Mineral Products | | | 4,450 | | 8.1 | | | | 5,488 | | 9.4 | | | | 6,432 | | 10.7 | | | | 7,849 | | 10.7 | | | | 10,135 | | 10.5 | |
Chemical Products | | | 3,123 | | 5.7 | | | | 2,799 | | 4.8 | | | | 3,024 | | 5.0 | | | | 3,661 | | 5.0 | | | | 4,497 | | 4.7 | |
Rubber and Plastics | | | 1,731 | | 3.1 | | | | 1,564 | | 2.7 | | | | 1,588 | | 2.6 | | | | 2,127 | | 2.9 | | | | 2,599 | | 2.7 | |
Leather and Shoes | | | 2,449 | | 4.4 | | | | 2,643 | | 4.5 | | | | 2,591 | | 4.3 | | | | 2,807 | | 3.8 | | | | 3,341 | | 3.5 | |
Wood and Furniture | | | 1,479 | | 2.7 | | | | 1,492 | | 2.6 | | | | 1,767 | | 2.9 | | | | 2,083 | | 2.9 | | | | 3,046 | | 3.2 | |
Paper and Paper Products | | | 969 | | 1.8 | | | | 969 | | 1.7 | | | | 923 | | 1.5 | | | | 1,125 | | 1.5 | | | | 1,234 | | 1.3 | |
Textiles and Clothing | | | 1,222 | | 2.2 | | | | 1,306 | | 2.2 | | | | 1,185 | | 2.0 | | | | 1,656 | | 2.3 | | | | 2,079 | | 2.2 | |
Metals | | | 6,171 | | 11.2 | | | | 5,296 | | 9.1 | | | | 6,120 | | 10.1 | | | | 7,693 | | 10.5 | | | | 10,724 | | 11.1 | |
Machinery, Appliances and Electrical Equipment | | | 7,244 | | 13.2 | | | | 7,438 | | 12.8 | | | | 7,320 | | 12.1 | | | | 8,785 | | 12.0 | | | | 11,090 | | 11.5 | |
Transportation Equipment | | | 8,057 | | 14.6 | | | | 8,063 | | 13.8 | | | | 7,326 | | 12.1 | | | | 8,150 | | 11.2 | | | | 13,077 | | 13.6 | |
Other | | | 5,212 | | 9.5 | | | | 4,907 | | 8.4 | | | | 4,970 | | 8.2 | | | | 5,887 | | 8.1 | | | | 6,970 | | 7.2 | |
| | |
|
| |
|
| |
|
| |
|
| |
|
| |
|
| |
|
| |
|
| |
|
| |
|
|
Total | | $ | 55,086 | | 100.0 | | | $ | 58,223 | | 100.0 | | | $ | 60,362 | | 100.0 | | | $ | 73,084 | | 100.0 | | | $ | 96,475 | | 100.0 | |
| | |
|
| |
|
| |
|
| |
|
| |
|
| |
|
| |
|
| |
|
| |
|
| |
|
|
Growth Rate of Exports(%) | | | | | 14.7 | | | | | | 5.7 | | | | | | 3.7 | | | | | | 21.1 | | | | | | 32.0 | |
| | | | | |
|
| | | | |
|
| | | | |
|
| | | | |
|
| | | | |
|
|
Sources: Ministry of Development, Industry and Foreign Trade
D-52
Table No. 17
Imports (FOB Country of Origin) by Major Commodity Groups
| | | | | | | | | | | | | | | | | | | | | | | | | | | | | | |
| | | 2000
| | | 2001
| | | 2002
| | | 2003
| | | 2004(1)
| |
Item
| | in $millions
| | % of total
| | | in $millions
| | % of total
| | | in $millions
| | % of total
| | | in $millions
| | % of total
| | | in $millions
| | % of total
| |
Food | | $ | 1,915 | | 3.4 | % | | $ | 1,605 | | 2.9 | % | | $ | 1,580 | | 3.3 | % | | $ | 1,406 | | 2.9 | % | | $ | 1,533 | | 2.4 | % |
Clothing | | | 668 | | 1.2 | | | | 655 | | 1.2 | | | | 509 | | 1.1 | | | | 499 | | 1.0 | | | | 648 | | 1.0 | |
Precision Instruments | | | 1,969 | | 3.5 | | | | 2,244 | | 4.0 | | | | 1,937 | | 4.1 | | | | 1,887 | | 3.9 | | | | 2,455 | | 3.9 | |
Cereals | | | 1,447 | | 2.6 | | | | 1,347 | | 2.4 | | | | 1,263 | | 2.7 | | | | 1,617 | | 3.3 | | | | 1,270 | | 2.0 | |
Fertilizers | | | 1,273 | | 2.3 | | | | 1,219 | | 2.2 | | | | 1,228 | | 2.6 | | | | 1,711 | | 3.5 | | | | 2,585 | | 4.1 | |
Chemical Products | | | 8,070 | | 14.5 | | | | 8,259 | | 14.9 | | | | 7,655 | | 16.2 | | | | 8,034 | | 16.6 | | | | 10,267 | | 16.3 | |
Wood Paste, Cellulose & Derived Products | | | 1,190 | | 2.1 | | | | 967 | | 1.7 | | | | 721 | | 1.5 | | | | 649 | | 1.3 | | | | 841 | | 1.3 | |
Rubber and Plastic Products | | | 2,856 | | 5.1 | | | | 2,770 | | 5.0 | | | | 2,663 | | 5.6 | | | | 2,789 | | 5.8 | | | | 3,579 | | 5.7 | |
Steel and Cast Iron | | | 1,013 | | 1.8 | | | | 1,128 | | 2.0 | | | | 928 | | 2.0 | | | | 990 | | 2.1 | | | | 1,340 | | 2.1 | |
Non-ferrous Metals | | | 1,056 | | 1.9 | | | | 1,034 | | 1.9 | | | | 839 | | 1.8 | | | | 1,005 | | 2.1 | | | | 1,461 | | 2.3 | |
Fuel and Lubricants | | | 8,291 | | 14.8 | | | | 7,726 | | 13.9 | | | | 6,981 | | 14.8 | | | | 7,439 | | 15.4 | | | | 11,452 | | 18.2 | |
Transportation Equipment | | | 4,936 | | 8.8 | | | | 4,750 | | 8.5 | | | | 3,471 | | 7.3 | | | | 3,265 | | 6.8 | | | | 4,205 | | 6.7 | |
Machinery and Electrical Equipment | | | 18,154 | | 32.5 | | | | 19,314 | | 34.8 | | | | 15,197 | | 32.2 | | | | 14,561 | | 30.2 | | | | 18,028 | | 28.7 | |
Other | | | 3,000 | | 5.4 | | | | 2,555 | | 4.6 | | | | 2,266 | | 4.8 | | | | 2,439 | | 5.1 | | | | 3,142 | | 5.0 | |
| | |
|
| |
|
| |
|
| |
|
| |
|
| |
|
| |
|
| |
|
| |
|
| |
|
|
Total | | $ | 55,839 | | 100.0 | | | $ | 55,572 | | 100.0 | | | $ | 47,237 | | 100.0 | | | $ | 48,291 | | 100.0 | | | $ | 62,806 | | 100.0 | |
| | |
|
| |
|
| |
|
| |
|
| |
|
| |
|
| |
|
| |
|
| |
|
| |
|
|
Growth Rate of Imports(%) | | | | | 13.3 | | | | | | (0.5 | ) | | | | | (15.0 | ) | | | | | 2.2 | | | | | | 30.1 | |
| | | | | |
|
| | | | |
|
| | | | |
|
| | | | |
|
| | | | |
|
|
Sources: Ministry of Development, Industry and Foreign Trade
The following tables set forth certain information regarding the destination of Brazil’s exports and the sources of its imports for the periods indicated.
Table No. 18
Exports (FOB Brazil) by Region
| | | | | | | | | | | | | | | | | | | | | | | | | | | | | | |
| | | 2000
| | | 2001
| | | 2002
| | | 2003
| | | 2004(6)
| |
Item
| | in $millions
| | % of total
| | | In $millions
| | % of total
| | | in $millions
| | % of total
| | | in $millions
| | % of total
| | | in $millions
| | % of total
| |
EFTA(1) | | $ | 756 | | 1.4 | % | | $ | 629 | | 1.1 | % | | $ | 618 | | 1.0 | % | | $ | 617 | | 0.8 | % | | $ | 679 | | 0.7 | % |
LAIA(2) | | | 12,151 | | 22.1 | | | | 11,132 | | 19.1 | | | | 9,070 | | 15.0 | | | | 12,314 | | 16.8 | | | | 18,235 | | 18.9 | |
Canada | | | 566 | | 1.0 | | | | 555 | | 1.0 | | | | 782 | | 1.3 | | | | 978 | | 1.3 | | | | 1,199 | | 1.2 | |
EEC(3) | | | 14,784 | | 26.8 | | | | 14,865 | | 25.5 | | | | 15,113 | | 25.0 | | | | 18,102 | | 24.8 | | | | 24,160 | | 25.0 | |
Eastern Europe | | | 972 | | 1.8 | | | | 1,699 | | 2.9 | | | | 1,755 | | 2.9 | | | | 2,271 | | 3.1 | | | | 2,488 | | 2.6 | |
USA(4) | | | 13,366 | | 24.3 | | | | 14,378 | | 24.7 | | | | 15,535 | | 25.7 | | | | 16,900 | | 23.1 | | | | 20,341 | | 21.1 | |
Japan | | | 2,472 | | 4.5 | | | | 1,986 | | 3.4 | | | | 2,098 | | 3.5 | | | | 2,311 | | 3.2 | | | | 2,768 | | 2.9 | |
OPEC(5) | | | 2,324 | | 4.2 | | | | 3,354 | | 5.8 | | | | 3,536 | | 5.9 | | | | 3,844 | | 5.3 | | | | 5,714 | | 5.9 | |
Other | | | 7,695 | | 14.0 | | | | 9,623 | | 16.5 | | | | 11,855 | | 19.6 | | | | 15,748 | | 21.5 | | | | 20,891 | | 21.7 | |
| | |
|
| |
|
| |
|
| |
|
| |
|
| |
|
| |
|
| |
|
| |
|
| |
|
|
Total excluding OPEC | | $ | 52,762 | | 95.8 | % | | $ | 54,868 | | 94.2 | % | | $ | 56,826 | | 94.1 | % | | $ | 69,240 | | 94.7 | % | | $ | 90,761 | | 94.1 | % |
| | |
|
| |
|
| |
|
| |
|
| |
|
| |
|
| |
|
| |
|
| |
|
| |
|
|
Total | | $ | 55,086 | | 100.0 | % | | $ | 58,223 | | 100.0 | % | | $ | 60,362 | | 100 | % | | $ | 73,084 | | 100 | % | | $ | 96,475 | | 100 | % |
| | |
|
| |
|
| |
|
| |
|
| |
|
| |
|
| |
|
| |
|
| |
|
| |
|
|
Mercosul | | $ | 7,733 | | 14.0 | % | | $ | 6,364 | | 10.9 | % | | $ | 3,311 | | 5.5 | % | | $ | 5,672 | | 7.8 | % | | $ | 8,912 | | 9.2 | % |
Argentina | | | 6,233 | | 11.3 | | | | 5,002 | | 8.6 | | | | 2,342 | | 3.9 | | | | 4,561 | | 6.2 | | | | 7,373 | | 7.6 | |
Paraguay | | | 832 | | 1.5 | | | | 720 | | 1.2 | | | | 558 | | 0.9 | | | | 707 | | 1.0 | | | | 872 | | 0.9 | |
Uruguay | | | 669 | | 1.2 | | | | 641 | | 1.1 | | | | 410 | | 0.7 | | | | 404 | | 0.6 | | | | 667 | | 0.7 | |
| (1) | | European Free Trade Association. |
| (2) | | Latin American Integration Association; excludes Venezuela for the entire period. |
| (3) | | European Economic Community, now the European Union. Amounts for 2004 reflect the inclusion of Cyprus, the Czech Republic, Estonia, Hungary, Latvia, Lithuania, Malta, Poland, Slovakia and Slovenia in the European Union from May 1, 2004. |
D-53
| (4) | | Includes Puerto Rico. |
| (5) | | Organization of Petroleum Exporting Countries, including Venezuela. |
Source: Ministry of Development, Industry and Foreign Trade
Table No. 19
Imports (FOB Country of Origin) by Region
| | | | | | | | | | | | | | | | | | | | | | | | | | | | | | |
| | | 2000
| | | 2001
| | | 2002
| | | 2003
| | | 2004(6)
| |
Item
| | in $millions
| | % of total
| | | in $millions
| | % of total
| | | in $millions
| | % of total
| | | in $millions
| | % of total
| | | in $millions
| | % of total
| |
EFTA(1) | | $ | 1,040 | | 1.9 | % | | $ | 1,227 | | 2.2 | % | | $ | 1,118 | | 2.4 | % | | $ | 1,209 | | 2.5 | % | | $ | 1,423 | | 2.3 | % |
LAIA(2) | | | 10,325 | | 18.5 | | | | 9,254 | | 16.7 | | | | 7,591 | | 16.1 | | | | 7,934 | | 16.4 | | | | 9,821 | | 15.6 | |
Canada | | | 1,087 | | 1.9 | | | | 927 | | 1.7 | | | | 740 | | 1.6 | | | | 750 | | 1.6 | | | | 866 | | 1.4 | |
EEC(3) | | | 14,070 | | 25.2 | | | | 14,822 | | 26.7 | | | | 13,134 | | 27.8 | | | | 12,669 | | 26.2 | | | | 15,922 | | 25.4 | |
Eastern Europe | | | 1,161 | | 2.1 | | | | 1,113 | | 2.0 | | | | 919 | | 1.9 | | | | 1,165 | | 2.4 | | | | 1,324 | | 2.1 | |
USA(4) | | | 13,033 | | 23.3 | | | | 13,043 | | 23.5 | | | | 10,436 | | 22.1 | | | | 9,726 | | 20.1 | | | | 11,513 | | 18.3 | |
Japan | | | 2,961 | | 5.3 | | | | 3,064 | | 5.5 | | | | 2,348 | | 5.0 | | | | 2,520 | | 5.2 | | | | 2,869 | | 4.6 | |
OPEC(5) | | | 4,983 | | 8.9 | | | | 4,464 | | 8.0 | | | | 4,132 | | 8.7 | | | | 4,533 | | 9.4 | | | | 7,869 | | 12.5 | |
Other | | | 7,179 | | 12.9 | | | | 7,658 | | 13.8 | | | | 6,819 | | 14.4 | | | | 7,786 | | 16.1 | | | | 11,198 | | 17.8 | |
| | |
|
| |
|
| |
|
| |
|
| |
|
| |
|
| |
|
| |
|
| |
|
| |
|
|
Total excluding OPEC | | $ | 50,856 | | 91.1 | % | | $ | 51,108 | | 92.0 | % | | $ | 43,105 | | 91.3 | % | | $ | 43,758 | | 90.6 | % | | $ | 54,936 | | 87.5 | % |
| | |
|
| |
|
| |
|
| |
|
| |
|
| |
|
| |
|
| |
|
| |
|
| |
|
|
Total | | $ | 55,839 | | 100.0 | % | | $ | 55,572 | | 100.0 | % | | $ | 47,237 | | 100.0 | % | | $ | 48,291 | | 100.0 | % | | $ | 62,806 | | 100.0 | % |
| | |
|
| |
|
| |
|
| |
|
| |
|
| |
|
| |
|
| |
|
| |
|
| |
|
|
Mercosul | | $ | 7,795 | | 14.0 | % | | $ | 7,009 | | 12.6 | % | | $ | 5,611 | | 11.9 | % | | $ | 5,685 | | 11.8 | % | | $ | 6,393 | | 10.2 | % |
Argentina | | | 6,842 | | 12.3 | | | | 6,206 | | 11.2 | | | | 4,743 | | 10.0 | | | | 4,672 | | 9.7 | | | | 5,572 | | 8.9 | |
Paraguay | | | 351 | | 0.6 | | | | 300 | | 0.5 | | | | 383 | | 0.8 | | | | 475 | | 1.0 | | | | 298 | | 0.5 | |
Uruguay | | | 602 | | 1.1 | | | | 503 | | 0.9 | | | | 485 | | 1.0 | | | | 538 | | 1.1 | | | | 523 | | 0.8 | |
| (1) | | European Free Trade Association. |
| (2) | | Latin American Integration Association; excludes Venezuela for the entire period. |
| (3) | | European Economic Community, now the European Union. Amounts for 2004 reflect the inclusion of Cyprus, the Czech Republic, Estonia, Hungary, Latvia, Lithuania, Malta, Poland, Slovakia and Slovenia in the European Union from May 1, 2004. |
| (4) | | Includes Puerto Rico. |
| (5) | | Organization of Petroleum Exporting Countries, including Venezuela. |
Source: Ministry of Development, Industry and Foreign Trade
NOTE: Imports are categorized according to the country of origin and not from the country where the product was acquired.
Foreign Investment
Foreign direct and portfolio investment amounted to $41.4 billion in 2000, a 29.0% increase over the previous year. Net foreign portfolio investment rose 144.2% to $8.7 billion in 2000, while net foreign direct investment grew by 14.7% to $32.8 billion, an historic high.
Foreign direct and portfolio investment amounted to $872 million in 2001, approximately 10% of that registered in 2000. Net foreign direct investment inflows decreased by 31.5% to $22.5 million in 2001, as a result of the reduction in inflows for privatization revenues.
Net foreign direct investment declined during 2002 because of Argentina’s continuing financial crisis, a weak global economy, uncertainty about Brazil’s national elections and concerns about terrorism and tensions in the Middle East. At year-end, net foreign direct investment reached $16.6 billion, reflecting a 26.1% decrease from 2001. Net foreign portfolio investment reflected an outflow of $5.0 billion, down from an inflow of
D-54
$872 million in 2001. As a result, net inflows totaled $11.8 billion in 2002, a decrease of 49.4% from 2001. In 2003, net foreign direct investment inflows decreased by 38.9% to $10.1 billion, as a result of the reduction in outflows from developed countries to Latin America and the reduced economic activity level.
Foreign direct investment and net portfolio investment inflows increased 29.5% in 2003. Net foreign portfolio inflows amounted to $5.1 billion, against outflows of $5.0 billion in 2002. However, net direct inflows declined further in 2003 to $10.1 billion, a 38.9% reduction from 2002.
In 2004, net foreign direct investment totaled approximately $18.2 billion, compared to approximately $10.1 billion of such investment registered in 2003, an increase of 79.1% for the year. Net foreign portfolio inflows, on the other hand, declined from net inflows of $5.1 billion in 2003 to net outflows of $4.0 billion in 2004. According to preliminary estimates, net foreign investment in the first five months of 2005 totaled approximately $7.2 billion compared with approximately $3.3 billion of such investment registered during the corresponding period in 2004.
External financing needs, defined as the difference of the current account deficit minus net foreign direct investment, have been negative since January 2002. External financing needs totaled negative $14.3 billion on December 31, 2003 and negative $29.8 billion on December 31, 2004. Thus, Brazil received more through net foreign direct investment than it needed to finance the current account deficit during 2002, 2003 and 2004.
The following table sets forth information regarding foreign direct and portfolio investment in Brazil for each of the years indicated.
Table No. 20
Foreign Direct and Portfolio Investment in Brazil
| | | | | | | | | | | | | | | | | | | |
| | | Inflows
| | Outflows
| | Net Inflows
|
| | | Portfolio(1)
| | Direct(2)
| | Total
| | Portfolio(1)
| | Direct(2)
| | Total
| | Portfolio
| | | Direct
| | Total
|
| | | (in millions of dollars) |
2000 | | 38,816 | | 40,290 | | 79,106 | | 30,165 | | 7,511 | | 37,676 | | 8,651 | | | 32,779 | | 41,430 |
2001 | | 29,497 | | 30,017 | | 59,514 | | 28,625 | | 7,559 | | 36,184 | | 872 | | | 22,457 | | 23,329 |
2002 | | 18,352 | | 26,460 | | 44,812 | | 23,352 | | 9,870 | | 33,019 | | (5,000 | ) | | 16,590 | | 11,793 |
2003 | | 27,347 | | 19,238 | | 46,585 | | 22,218 | | 9,094 | | 31,312 | | 5,129 | | | 10,144 | | 15,272 |
2004(3) | | 30,614 | | 25,758 | | 56,372 | | 34,610 | | 7,592 | | 42,202 | | (3,996 | ) | | 18,166 | | 14,170 |
| (1) | | Includes equity securities, bonds, commercial paper and notes, except those related to external debt restructurings. |
| (2) | | Includes reinvested earnings and excludes intercompany debt transactions |
Source: Central Bank
D-55
The following table sets forth information on net direct foreign investments by activity as of December 31, 2001, 2002 and 2003.
Table No. 21
Direct Investments by Activity(1)
| | | | | | | | | | | | | | | | | | |
| | | 2002
| | | 2003
| | | 2004
| |
| | | Flow
| | %
| | | Flow
| | %
| | | Flow
| | %
| |
| | | (in millions of dollars) | |
Agriculture, cattle breeding and mineral extraction | | $ | 638 | | 3.4 | % | | $ | 1,482 | | 11.5 | % | | $ | 1,070 | | 5.3 | % |
Petroleum extraction and related services | | | 508 | | 2.7 | | | | 365 | | 2.8 | | | | 285 | | 1.4 | |
Metallic mineral extraction | | | 35 | | 0.2 | | | | 918 | | 7.1 | | | | 507 | | 2.5 | |
Other | | | 95 | | 0.5 | | | | 199 | | 1.5 | | | | 278 | | 1.4 | |
Industry and Manufacturing | | $ | 7,617 | | 40.6 | % | | $ | 4,480 | | 34.7 | % | | $ | 10,698 | | 52.8 | % |
Basic metallurgy(2) | | | 139 | | 0.7 | | | | 351 | | 2.7 | | | | 817 | | 4.0 | |
Manufacture of chemical products | | | 1,573 | | 8.4 | | | | 916 | | 7.1 | | | | 1,363 | | 6.7 | |
Manufacture and assembly of motor vehicles, trailers, vehicle bodies and other transportation equipment(3) | | | 1,819 | | 9.7 | | | | 966 | | 7.5 | | | | 1,315 | | 6.5 | |
Manufacture of electrical machines, apparatus and materials | | | 372 | | 2.0 | | | | 189 | | 1.5 | | | | 243 | | 1.2 | |
Manufacture of food and beverages | | | 1,873 | | 10.0 | | | | 409 | | 3.2 | | | | 5,346 | | 26.4 | |
Manufacture of machines and equipment | | | 391 | | 2.1 | | | | 256 | | 2.0 | | | | 313 | | 1.5 | |
Manufacture of electronic materials and communication apparatus | | | 544 | | 2.9 | | | | 328 | | 2.5 | | | | 266 | | 1.3 | |
Manufacture of non-metallic mineral products | | | 124 | | 0.7 | | | | 49 | | 0.4 | | | | 219 | | 1.1 | |
Manufacture of rubber and plastic articles | | | 183 | | 1.0 | | | | 205 | | 1.6 | | | | 134 | | 0.7 | |
Manufacture of metal products | | | 91 | | 0.5 | | | | 107 | | 0.8 | | | | 90 | | 0.4 | |
Manufacture of cellulose, paper and paper products | | | 11 | | 0.1 | | | | 348 | | 2.7 | | | | 177 | | 0.9 | |
Manufacture of textiles | | | 98 | | 0.5 | | | | 34 | | 0.3 | | | | 58 | | 0.3 | |
Publishing, printing and reproduction of recordings | | | 44 | | 0.2 | | | | 145 | | 1.1 | | | | 131 | | 0.7 | |
Manufacture of wood products | | | 16 | | 0.1 | | | | 31 | | 0.2 | | | | 61 | | 0.3 | |
Manufacture of office machines and data processing equipment | | | 95 | | 0.5 | | | | 8 | | 0.1 | | | | 11 | | 0.1 | |
Other | | | 247 | | 1.3 | | | | 139 | | 1.1 | | | | 154 | | 0.8 | |
Services | | $ | 10,523 | | 56.0 | % | | $ | 6,940 | | 53.8 | % | | $ | 8,494 | | 41.9 | % |
Electricity, gas and hot water | | | 1,534 | | 8.2 | | | | 651 | | 5.0 | | | | 1,191 | | 5.9 | |
Wholesale and commerce intermediation, retail and repair of articles | | | 1,504 | | 8.0 | | | | 860 | | 6.7 | | | | 1,252 | | 6.2 | |
Mail and communications | | | 4,190 | | 22.3 | | | | 2,810 | | 21.8 | | | | 2,970 | | 14.7 | |
Services rendered to companies | | | 791 | | 4.2 | | | | 775 | | 6.0 | | | | 872 | | 4.3 | |
Financial intermediation and ancillary activities | | | 1,206 | | 6.4 | | | | 706 | | 5.5 | | | | 940 | | 4.6 | |
Accommodation and food | | | 126 | | 0.7 | | | | 172 | | 1.3 | | | | 74 | | 0.4 | |
Data processing and related activities(4) | | | 225 | | 1.2 | | | | 155 | | 1.2 | | | | 80 | | 0.4 | |
Real estate activities | | | 197 | | 1.0 | | | | 188 | | 1.5 | | | | 145 | | 0.7 | |
Transportation, ancillary activities and travel agencies | | | 124 | | 0.7 | | | | 189 | | 1.5 | | | | 252 | | 1.2 | |
Insurance and private pension plans | | | 216 | | 1.1 | | | | 128 | | 1.0 | | | | 126 | | 0.6 | |
Construction(5) | | | 148 | | 0.8 | | | | 177 | | 1.4 | | | | 324 | | 1.6 | |
Collection, treatment and distribution of water | | | 94 | | 0.5 | | | | 50 | | 0.4 | | | | 3 | | 0.0 | |
Other | | | 169 | | 0.9 | | | | 79 | | 0.6 | | | | 265 | | 1.3 | |
Total | | $ | 18,778 | | 100.0 | % | | $ | 12,902 | | 100.0 | % | | $ | 20,262 | | 100.0 | % |
| (1) | | Does not include investments in goods and real estate. |
| (2) | | Includes steel manufacturing. |
| (3) | | Includes the manufacture of spare parts for the automotive sector. |
| (5) | | Includes infrastructure projects related to the energy and telecommunications sectors. |
Source: Central Bank
The Government has periodically taken measures to control the inflow of foreign capital in order to facilitate the conduct of monetary policy and to regulate the level of Brazil’s international reserves. The Government frequently adjusts details of fiscal policy in order to promote or restrict the flow of foreign capital into Brazil. Measures taken by the Government for these purposes include: raising or lowering tax rates on
D-56
financial transactions; establishing restrictions on investments in fixed income assets; authorizing or prohibiting settlement of foreign loans and financings in advance; and raising or lowering the net amount of foreign reserves a bank may hold without depositing such reserves in the Central Bank.
The National Monetary Council of Brazil adopted two resolutions in 2000 that are intended to simplify the procedures for registering foreign investments in Brazil. Resolution No. 2,689 of January 26, 2000, aims at simplifying the procedures for registering foreign investments in the domestic capital markets with the Central Bank by, among other things, eliminating the so-called “Annex I”, “Annex II”, “Annex IV” and “Annex VI” investment vehicles established under National Monetary Council Resolution No. 1,289 of March 20, 1987. The changes introduced by Resolution No. 2,689 became effective March 31, 2000. Resolution No. 2,770 dated August 30, 2000 of the National Monetary Council of Brazil further modified and consolidated rules relating to foreign credit transactions. See “—Foreign Exchange Rates and Exchange Controls”.
On June 12, 2002, the Government enacted Constitutional Amendment No. 37 (as further regulated by Decree No. 4,296 dated July 10, 2002), which exempts from the provisional financial contribution transaction levy (“CPMF”) fund remittances made to and from Brazil by foreign investors, as long as the funds are exclusively used in connection with trading on stock exchanges or in over-the-counter markets, or in contracts relating to stocks or stock indexes involving mercantile or futures exchanges.
International Reserves
Brazil’s international reserves rose from $36.3 billion on December 31, 1999 to $39.2 billion on March 31, 2000, but subsequently declined to $28.7 billion on April 30, 2000 as a result of a $10.3 billion prepayment of emergency credit lines under an IMF-led support program. See “The Brazilian Economy—Recent Economic Events and Policies”. International reserves rose again to $31.4 billion on August 31, 2000 following the placement of additional bond issues by the Republic in July 2000 and the completion of a global offering of shares of Petrobrás owned by the Government. See “The Brazilian Economy—State-Controlled Enterprises—Privatization Program”. Brazil’s international reserves rose to $32.5 billion in November 2000, following the privatization of BANESPA. In December 2000, the Central Bank sold reais in the market that it agreed to repurchase in January 2001 in order to provide liquidity to the market at year-end. Brazil ended the year with approximately $33.0 billion in international reserves.
The placement of new bond issues during January 2001 contributed to a rise in the level of Brazil’s international reserves to $35.6 billion at the end of that month. In March 2001, however, principal and interest payments in respect of external debt caused Brazil’s international reserves to fall to $34.4 billion on March 31, 2001. Additional debt offerings in the international markets in April 2001 and May 2001 resulted in a slight increase in international reserves. After giving effect to principal and interest payments during that period, Brazil’s international reserves stood at $35.4 billion on May 31, 2001.
Concerns about the impact of the Government’s energy conservation measures and a possible Argentine devaluation or default drove the real to new lows against the U.S. dollar. After the real dropped to R$2.4748 to $1.00 on June 20, 2001, the Central Bank raised its Over/Selic rate target by 1.50% to 18.25%. The Central Bank also announced on June 21, 2001 that it had intervened in the foreign exchange market by selling U.S. dollars and buying reais and that the Government would raise $10.8 billion in additional funds to increase its international reserves and to finance future interventions to support the real. Brazil planned to raise the funds by purchasing $2 billion under its IMF facility, postponing a $1.8 billion repayment under that facility, borrowing $1.8 billion from international financial institutions, issuing an additional $1 billion in new bonds in the international capital markets and selling shares of privatized companies for $3.8 billion. The $10.8 billion amount also included $400 million in proceeds of a bond issuance by BNDES completed earlier in the year. After giving effect to subsequent borrowing from the IMF and the World Bank in an aggregate amount of approximately $3.2 billion, debt service and foreign exchange interventions, Brazil’s international reserves totaled at approximately $35.5 billion on July 31, 2001.
D-57
On September 14, 2001, the IMF announced that its Executive Board had approved a new standby facility for Brazil in the amount of SDR 12.14 billion (approximately $15.6 billion) in support of the Government’s economic and financial program through December 2002. Approximately $4.7 billion was available immediately, and Brazil made purchases under the facility totaling approximately $4.7 billion at the time the facility was established. The remainder was to be made available in five installments, subject to the satisfaction of certain performance criteria set forth in the Memorandum of Economic Policies accompanying Brazil’s letter of intent dated August 23, 2001. These performance criteria included targets for the primary surplus of 3.35% of GDP for 2001 and 3.5% of GDP for 2002 (an increase from the 3.0% target for both years under Brazil’s December 1998 IMF facility) and a net international reserves floor of $20 billion (a $5 billion reduction from the floor under Brazil’s December 1998 IMF facility). The new standby facility replaced the three-year standby arrangement approved in December 1998. See “The Brazilian Economy—Recent Economic Events and Policies”. After giving effect to purchases totaling $4.7 billion under the IMF standby facility and a repurchase by the Republic of Poland for $2.5 billion of certain Paris Club credits owing to Brazil on November 13, 2001, Brazil’s international reserves stood at $35.9 billion on December 31, 2001.
The second half of 2002 and the first quarter of 2003 posed several challenges for Brazil, which arose in large part from the effects of Argentina’s financial crisis, a weak global economy, uncertainties about the country’s national elections held in October 2002 and concerns about terrorism and tensions in the Middle East. From July through October 2002, the real declined against the U.S. dollar reaching a low of R$3.9552 to $1.00 on October 22, 2002. Net foreign investment also declined significantly, with net foreign direct investment falling to $16.6 billion in 2002, a 26.1% decrease from 2001, and net foreign portfolio outflows reaching $4.8 billion. Other investment flows were also negative in 2002, totaling $231 million. The Republic returned to the IMF, which announced on September 6, 2002, in response to Brazil’s economic situation, that it had approved Brazil’s request for a 15-month standby facility of SDR 22.8 billion (approximately $31.4 billion) to support the country’s economic and financial program through December 2003. The new standby facility replaced the 15-month standby facility that had been approved by the IMF on September 14, 2001. After giving effect to purchases totaling approximately $6.3 billion under the facility on September 11, 2002 and December 23, 2002, Brazil’s international reserves stood at $37.8 billion on December 31, 2002.
As the Government continued to pursue an economic policy emphasizing fiscal discipline, a floating exchange rate and inflation targeting, Brazil was able to regain access to the international capital markets in 2003. Brazil completed offerings of $5.8 billion aggregate principal amount of global bonds on May 6, 2003, June 17, 2003, August 7, 2003, September 18, 2003 and October 22, 2003. In addition, the real began to appreciate against the U.S. dollar, ending 2003 at R$2.8892 to $1.00. Brazil’s international reserves stood at $49.3 billion on December 31, 2003.
During 2003, the National Treasury was permitted to purchase U.S. dollars in the foreign currency markets in Brazil. The U.S. dollars so purchased were used to make payments in respect of Brazil’s external debt. Although the proceeds were reserved for external debt payments, these purchases had the effect of keeping Brazil’s international reserves at levels higher than they would otherwise have been, because they replaced withdrawals that would otherwise have been made. To promote transparency in the Republic’s accounts, the Minister of Finance and the President of the Central Bank agreed in January 2004 to have the National Treasury purchase from the Central Bank all foreign currency that Brazil needed to make payments in respect of its external debt. The Central Bank may either provide the National Treasury with foreign currency from Brazil’s international reserves or purchase such foreign currency in the foreign currency markets in Brazil. In January and February 2004, the Central Bank purchased a total of approximately $2.6 billion in the foreign currency markets to increase its reserves.
In 2004, Brazil’s international reserves rose 7.4% over 2003 levels to $52.9 billion, aided by record exports in 2004, the Central Bank’s net purchases of an aggregate of $5.3 billion in U.S. dollars in the domestic foreign exchange market and seven offerings of Brazil’s debt securities in the international capital markets totaling $5.7 billion. The 7.4% growth in international reserves was net of debt service payments totaling $11.4 billion, of which $4.4 billion were made to the IMF.
D-58
Brazil’s international reserves totaled $60.7 billion as of May 31, 2005. The increase in reserves during the first five months of 2005 is attributable in part to net purchases during that period by the Central Bank of an aggregate of $10.2 billion in U.S. dollars in the domestic foreign exchange market to increase international reserves and to the completion by Brazil of four bond offerings in the international markets during the first five months of 2005 totaling $3.4 billion. See “—Public Debt” below.
The following table sets forth certain information regarding Brazil’s international reserves at the dates indicated.
Table No. 22
International Reserves
| | | | | | | | | | | | | | | |
| | | As of December 31,
|
| | | 2000
| | 2001
| | 2002
| | 2003
| | 2004
|
| | | (in millions of dollars) |
Gold(1) | | $ | 523 | | $ | 127 | | $ | 154 | | $ | 186 | | $ | 195 |
Foreign Exchange | | | 32,488 | | | 35,728 | | | 37,409 | | | 49,108 | | | 52,736 |
Total Gold and Foreign Exchange | | | 33,011 | | | 35,855 | | | 37,562 | | | 49,294 | | | 52,931 |
Special Drawing Rights | | | 0 | | | 10.6 | | | 261.2 | | | 2.3 | | | 4.1 |
Total Official Reserves | | $ | 33,011 | | $ | 35,866 | | $ | 37,823 | | $ | 49,296 | | $ | 52,935 |
| (1) | | Dollar values were determined using the London Gold PM Fixing price quoted at the end of the period. |
Source: Central Bank
Foreign Exchange Rates and Exchange Controls
The Brazilian foreign exchange system has been structured to enable the Government, through the Central Bank, to regulate and control foreign exchange transactions carried out in Brazil.
Resolution No. 2,110 of the National Monetary Council, a Plano Real initiative, provides that the Central Bank had an obligation to sell U.S. dollars in the foreign exchange market whenever the real reached parity with the U.S. dollar. In response to deterioration in Brazil’s current account, on March 6, 1995 the Central Bank formalized an exchange band system, pursuant to which the real was permitted to float against the U.S. dollar within bands established by the Central Bank. Under the exchange band system, the Central Bank was committed to intervene in the market whenever rates approached the upper and lower limits of the band. This commitment did not eliminate the possibility of the Central Bank intervening when necessary to avoid extreme oscillations in the exchange rate.
On January 13, 1999, Gustavo H.B. Franco, the president of the Central Bank and one of the architects of the Plano Real, resigned and was replaced by Francisco Lopes, who attempted a controlled devaluation of the real by widening the band within which the real was permitted to trade. Subsequent Central Bank intervention failed to keep the real-U.S. dollar exchange rate within the new band, however, and on January 15, 1999, the Central Bank announced that the real would be permitted to float, with Central Bank intervention to be made only in times of extreme volatility. Following that announcement, the value of the real against the U.S. dollar declined approximately 21% from its level on January 12, 1999. See “The Brazilian Economy—Recent Economic Events and Policies”.
Prior to March 14, 2005, there were two foreign exchange markets in Brazil: the commercial exchange market, on which most trade and financial transactions were conducted and for which Central Bank approval was generally required, and a floating exchange market (known as the “tourism dollar” market) for which Central Bank approval was not required. The Government’s adoption of a floating foreign exchange rate regime in early 1999 produced the unification, as of February 1, 1999, of exchange positions of the Brazilian financial
D-59
institutions in the commercial exchange market and the floating exchange market, leading to a convergence in the pricing and liquidity of both markets. Two National Monetary Council resolutions issued on March 4, 2005, Nos. 3,265 and 3,266, introduced several key reforms, including (i) the merger of the commercial and floating rate foreign exchange markets into a single foreign currency market, (ii) provisions permitting foreign currency transfers to be made directly through the foreign exchange market rather than exclusively through accounts of foreign financial institutions in Brazil (CC5 accounts), and (iii) an extension to 210 days from 180 days in the period of time that exporters may maintain in accounts outside of Brazil the proceeds of exports of goods and services.
The first half of 2000 was characterized by improved foreign exchange flows and relative stability in the exchange rate, largely as a result of signs of economic recovery. The real rose against the U.S. dollar, reaching R$1.7473 to $1.00 on March 31, 2000. However, rising oil prices and uncertainties about U.S. interest rates put pressure on the real, pushing the real-U.S. dollar exchange rate to R$1.8537 to $1.00 on May 23, 2000. The real subsequently rose against the U.S. dollar, largely as a result of continued economic recovery, an improvement in external conditions and the return of foreign investment inflows. During the second half of the year, uncertainties about the U.S economy, concerns about Argentina and rising oil prices caused the real to decline in value against the U.S. dollar. The real-U.S. dollar exchange rate (sell side) in the commercial exchange market, as published by the Central Bank, was R$1.8234 to $1.00 on August 31, 2000, R$1.8437 to $1.00 on September 29, 2000, R$1.9090 to $1.00 on October 31, 2000 and R$1.9596 to $1.00 on November 30, 2000. Brazil’s continued compliance with the IMF-led support program, as established by the IMF’s sixth review on November 28, 2000, and an improvement in the external environment resulting from interest rate reductions in the United States, reduced the downward pressure on the exchange rate, which ended the year at R$1.9554 to $1.00.
During the first six months of 2001, however, renewed concerns about Argentina, together with nervousness about the political impact of the alleged misconduct of certain public officials, put further downward pressure on the real. The real reached R$2.1847 to $1.00 on April 30, 2001. In May 2001, the Government also announced its intention to reduce energy consumption through rationing and other measures in response to a severe power shortage. In addition, Argentina announced its intention to link its currency to both the U.S. dollar and the euro and, on June 15, 2001, announced the introduction of a special exchange rate for exporters in that country that permitted such exporters to exchange U.S. dollars for pesos for the combined average value of a U.S. dollar and a euro. Concerns about the impact of the Government’s energy measures and a possible Argentine devaluation of the peso drove the real to new lows against the U.S. dollar. The real-U.S. dollar exchange rate (sell side) in the commercial exchange market, as published by the Central Bank of Brazil, fell to R$2.3600 to $1.00 on May 31, 2001.
After the real dropped to R$2.4748 to $1.00 on June 20, 2001, the Central Bank raised its Over/Selic rate target by 1.50% to 18.25%. The Central Bank also announced on June 21, 2001 that it had intervened in the foreign exchange market by selling U.S. dollars and buying reais and that the Government would raise $10.8 billion in additional funds to increase its international reserves and to finance future interventions to support the real. Brazil planned to raise the funds by purchasing $2 billion under its IMF facility, postponing a $1.8 billion repayment under that facility, borrowing $1.8 billion from international financial institutions, issuing an additional $1 billion in new bonds in the international capital markets and selling shares of privatized companies for $3.8 billion. The $10.8 billion amount also included $400 million in proceeds of a bond issuance by BNDES completed earlier in the year. Approximately $6.2 billion of the funds were to be used to increase the level of Brazil’s foreign reserves, while the remaining $4.6 billion were to be available for use for further interventions in the foreign exchange markets.
After recovering briefly to R$2.2923 to $1.00 on June 28, 2001, the real declined to R$2.5979 to $1.00 on July 16, 2001. The real recovered slightly to R$2.4247 to $1.00 on July 24, 2001 following the Central Bank’s decision on July 18, 2001 to raise its Over/Selic rate target to 19.00% from 18.25% and interventions by the Central Bank in the foreign exchange market.
D-60
Following terrorist attacks on the World Trade Center and the Pentagon in the United States on September 11, 2001, the real-U.S. dollar rate moved to R$2.8007 to $1.00 on September 21, 2001. The real began to recover after October 11, 2001, reaching R$2.5287 to $1.00 on November 30, 2001 and R$2.3204 to $1.00 on December 31, 2001.
The Republic of Argentina announced in December 2001 and January 2002 that it would be suspending payments in respect of certain of its public external debt and modifying its exchange rate system. The announcement, together with lower than expected Brazilian trade flows, caused the real to fall approximately 4.2% during January 2002 to close at R$2.4183 to $1.00 on January 31, 2002. The real subsequently recovered as a result of trade surpluses in the first four months of 2002 and improving economic conditions in Brazil resulting from the end of energy rationing on March 1, 2002, two reductions in the Central Bank’s Over/Selic rate target to 18.75% on February 20, 2002 and 18.50% on March 20, 2002 and certain other factors, such as the perception of investors that Brazil would not be significantly affected by Argentina’s problems. The real was also helped by the IMF’s announcements on January 23, 2002 and March 26, 2002 that it had completed reviews of Brazil’s performance under the IMF standby facility and that, based on those reviews, Brazil would be permitted to draw, if necessary, installments of SDR 358.6 million (approximately $448 million) and SDR 3.7 billion (approximately $5 billion). The real rose against the U.S. dollar, reaching R$2.3482 on February 28, 2002, R$2.3236 to $1.00 on March 28, 2002 and R$2.3625 to $1.00 on April 30, 2002.
However, amid renewed concerns about the potential contagion effect of Argentina’s financial crisis, uncertainty about the October 2002 elections in Brazil, a weak global economy and concerns about terrorism and tensions in the Middle East, the real began to depreciate again in the second half of 2002. The value of the real declined to R$2.5220 to $1.00 on May 31, 2002, R$2.8444 to $1.00 on June 28, 2002, R$3.4285 to $1.00 on July 31, 2002 and R$3.8949 to $1.00 on September 30, 2002 before reaching a low of R$3.9552 to $1.00 on October 22, 2002. Following the October 27 runoff elections, the real began to recover against the U.S. dollar, reaching R$3.5333 to $1.00 on December 31, 2002.
The real continued its recovery during 2003. As published by Central Bank, the real-U.S. dollar exchange rate (sell side) as R$2.9655 to $1.00 on July 31, 2003 and R$2.8892 to $1.00 on December 31, 2003. Largely as a result of concerns about a potential increase in short-term U.S. interest rates, the real began to decline in value against the U.S. dollar in April 2004, reaching R$3.1291 to $1.00 on May 31, 2004. Then the real again recovered in late 2004 and this trend has continued with the real-U.S. dollar exchange rate reaching R$2.6544 to $1.00 on December 31, 2004 and R$2.4038 to $1.00 on May 31, 2005.
D-61
The following table sets forth average exchange rates recorded in the commercial exchange market (sell side) on the last day of the periods indicated.
Table No. 23
Commercial Exchange Rates (sell side)
| | | | |
| | | Spot Rate(1)
| | Foreign Currency Basket(2)
|
| | | (reais per dollar) | | |
1994—December | | 0.8460 | | 74.8 |
1995—December | | 0.9275 | | 84.1 |
1996—December | | 1.0394 | | 82.6 |
1997—December | | 1.1164 | | 77.9 |
1998—December | | 1.2087 | | 82.6 |
1999—December | | 1.7890 | | 96.9 |
2000—December | | 1.9554 | | 91.7 |
2001—December | | 2.3204 | | 97.9 |
2002—December | | 3.5333 | | 114.0 |
2003—December | | 2.8892 | | 99.2 |
2004—January | | 2.9409 | | 100.3 |
February | | 2.9138 | | 102.6 |
March | | 2.9086 | | 100.4 |
April | | 2.9447 | | 99.4 |
May | | 3.1291 | | 104.5 |
June | | 3.1075 | | 104.8 |
July | | 3.0268 | | 101.3 |
August | | 2.9338 | | 98.9 |
September | | 2.8586 | | 95.0 |
October | | 2.8565 | | 95.1 |
November | | 2.7307 | | 93.4 |
December | | 2.6544 | | 91.4 |
| (1) | | The average rate on the last day of the month in the commercial exchange market. |
| (2) | | An index of the real exchange rate of a basket of fifteen currencies weighted by the share of the total Brazilian exports to all fifteen countries involved represented by Brazilian exports to each such country. The national currency used was the average exchange selling rate and the deflator was IPA-DI (Wholesale Prices). For other countries the deflator was also a wholesale price index or a comparable indicator (June 1994 = 100). |
Source: Central Bank
On November 24, 2004, the Central Bank announced that the Brazilian Treasury intended to purchase up to $3 billion in the foreign exchange market through June 2005 for payments in respect of the Government’s external debt.
On February 2, 2005, the Central Bank began to offer swaps that were the reverse of those that the Central Bank had previously been offering. Under the new inverted swaps, the Central Bank is to make taxa Over/Selic payments in exchange for U.S. dollar payments. Between February 2, 2005 and February 16, 2005, the Central Bank sold approximately US$2.4 billion in notional amount of such swaps. The Central Bank has not sold such swaps since March 9, 2005.
D-62
Brazilian law provides that, whenever there is a serious imbalance in Brazil’s balance of payments or serious reasons to foresee such an imbalance, the Government may, for a limited period of time, impose restrictions on the remittance to foreign investors of the proceeds of their investments in Brazil, as it did for approximately six months in 1989 and early 1990, and on the conversion of Brazilian currency into foreign currencies. See “Public Debt—Debt Crisis and Restructuring”.
Resolution No. 2,770 dated August 30, 2000 of the National Monetary Council of Brazil and Circular No. 3,027 dated February 14, 2001 of the Central Bank are intended to simplify the rules for the registration of foreign credit transactions. The new rules eliminate the need to obtain the prior authorization of the Central Bank with respect to foreign credit transactions, including bond issuances, for private sector borrowers or issuers. The new rules require only that such transactions be registered at the time the exchange contract for the entry of the funds into the country is signed. In addition, the Central Bank introduced a system for the electronic registration of foreign credit transactions called the Registro de Operações Financieras (Registration of Financial Transactions, or “ROF”). The new rules further require funds raised abroad to be deposited in real in a local bank in Brazil, but permit financial institutions and leasing companies to retain funds outside Brazil in connection with credit transactions tied to export operations.
D-63
THE FINANCIAL SYSTEM
General
On July 1, 1994, the real (plural “reais”) replaced the cruzeiro real as the lawful currency of Brazil, with each real exchangeable for 2,750.00 cruzeiros reais. The cruzeiro real had replaced the cruzeiro as the lawful currency of Brazil on August 1, 1993, with each cruzeiro real exchangeable for 1,000 cruzeiros. The cruzeiro had replaced the cruzado novo as the lawful currency of Brazil under the Collor Plan of March 15, 1990, with each cruzeiro exchangeable for one cruzado novo. The cruzado novo had replaced the cruzado as the lawful currency of Brazil under the Summer Plan of January 16, 1989, with each cruzado novo exchangeable for 1,000 cruzados. The cruzado had replaced the cruzeiro as the lawful currency of Brazil under the Cruzado Plan of February 28, 1986, with each cruzado exchangeable for 1,000 cruzeiros.
The Brazilian financial system is composed of several types of public and private sector financial institutions. On December 31, 2004, it included 139 multiple service banks, 24 commercial banks, 21 investment banks, and numerous savings and loan, brokerage, leasing and financial institutions. The average leverage level in 2004 for the Brazilian banking system as a whole was approximately 2.5 times shareholders’ equity, and Brazilian private sector financial institutions were generally well capitalized.
Public sector banking institutions play an important role in the banking industry. Public sector banks accounted for 40.7% of the banking system’s total demand deposits and 35.2% of total assets on June 30, 2004. A significant portion of the activities of federal and State banks involves the lending of government funds to industry and agriculture. See “—Public Sector Financial Institutions”.
The critical importance of financial management skills under conditions of high inflation, and the availability of profits from financial intermediation activities, led to the proliferation of financial institutions during the 1980s and early 1990s. The subsequent reduction of Brazil’s inflation rate brought about by the Plano Real curtailed the profits Brazilian banks had previously earned from investing deposits at inflated interest rates and made it more difficult for certain financial institutions to survive. From the implementation of the Plano Real through December 31, 2004, 155 financial institutions were the subject of Central Bank intervention. In order to assist distressed banks and strengthen the financial system, the Government instituted on November 3, 1995 the Program of Incentives for Restructuring and Strengthening of the National Financial System (“PROER”). Among other measures, PROER created special lines of credit for financial institutions and provided incentives for institutions to merge and reorganize by permitting the amortization of goodwill and the write-off of non-performing loans. Under PROER, institutions receiving support were required to pledge collateral to the Central Bank having a value of at least 120% of the amount of the disbursement received. The collateral pledged by institutions participating in PROER generally consisted of Government debt instruments such as Par Bonds and obligations of the Housing Compensation Fund for Salary Fluctuation (Fundo de Compensação de Variações Salariais or “FCVS”). See “Public Debt—Housing Compensation Fund for Salary Fluctuation (Fundo de Compensação de Variações Salariais)”. Debt instruments so pledged were valued at their full face amount. Equity securities could also be pledged; such securities were valued based on several criteria, including liquidity. Interest accrued on the disbursements at a rate of 2% over the rate of interest on the underlying collateral and is payable at the same time interest is payable on the underlying collateral.
From the introduction of PROER in November 1995 to December 31, 2001, the Central Bank made gross disbursements of approximately R$21.1 billion, primarily for the restructuring of Banco Nacional S.A., Banco Econômico S.A. and Banco Bamerindus S.A. The Government has not provided any financing under PROER since September 1998 and has since terminated the PROER program. Through December 31, 2001, the institutions receiving support under PROER had made reimbursements of PROER reserves in the aggregate of approximately R$18.4 billion to the Central Bank. Pursuant to Portaria No. 237 dated June 27, 2001 of the Ministry of Finance, the National Treasury issued R$9.0 billion aggregate principal amount of domestic debt securities (“NTNs”) to the Central Bank in payment of the outstanding PROER balance.
D-64
On February 28, 1997, the National Monetary Council adopted Resolution No. 2,365, establishing the Support Program for the Reduction of the State Public Sector in Banking Activity (Programa de Incentivo à Redução do Setor Público Estadual na Atividade Bancária or “PROES”). PROES provides for three special lines of financial assistance. The first line releases resources backed by collateral consisting of securities or rights related to operations under the administration of the National Treasury or of agencies of the federal Government. The second line allows State financial institutions to restructure their portfolio of assets and/or their respective liabilities. The third line involves the assumption by federal financial institutions of State financial institutions’ liabilities to the public. The first two lines were implemented by Central Bank Circulars Nos. 2,743 and 2,744, both dated February 28, 1997, and the third line was implemented by Central Bank Circular No. 2,745 dated March 18, 1997, as amended by Circular 2,871 dated March 4, 1999.
As of December 31, 2004, 45 State financial institutions had sought PROES assistance, with a majority electing to be privatized or converted into development agencies; 16 financial institutions chose to obtain PROES assistance under the second line. In December 1998, an institution controlled by the State of Rio Grande do Sul commenced operations as the first such converted development agency.
In addition to establishing PROER and PROES, the Government instituted a deposit insurance system on November 16, 1995 and issued Provisional Measure No. 1,514 in August 1996 establishing a program to restructure Brazil’s State banks. See “The Brazilian Economy—Relationship between the Federal and Local Governments” and “—Regulation by Central Bank”. The Government also enacted Law No. 9,447 of March 14, 1997, relating to the liability of controlling shareholders, accounting firms and independent auditors for the intervention, extrajudicial liquidation or establishment of a provisional administrative regime for financial institutions. Under Law No. 9,447, controlling shareholders may be held jointly liable for wrongful acts involving the financial institutions they control, independent of claims based on negligence or fraud. Independent auditors can also be held liable for their fraudulent actions or omissions while rendering services to financial institutions, and the assets of such auditors may be subject to attachment if liability is found. On March 27, 2003, the National Monetary Council issued Resolution No. 3,069, which provides for the mandatory periodic replacement of independent auditors of financial institutions.
Institutional Framework
The basic framework for the Brazilian financial system was established in 1964 pursuant to Law No. 4,595 (the “Banking Reform Law”), which created the National Monetary Council (the “CMN”), the senior body responsible for currency and credit policies.
The legal measures that introduced the real as the new legal currency of Brazil modified the composition of the CMN, reducing it to three members: the Minister of Finance, the Head of the Secretariat of Planning, Budget and Coordination and the President of the Central Bank.
The Central Bank is an autonomous government entity, administered by a board of directors, all of whom are appointed by the President of the Republic, subject to confirmation by the Senate. The main role of the Central Bank is to implement the currency and credit policies established by the CMN. The Governor of the Central Bank has ministerial status and as a result can only be tried by the Federal Supreme Court.
On May 29, 2003, the Brazilian National Congress adopted Constitutional Amendment No. 40. The amendment, among other things, permits regulatory changes in the Brazilian financial system to be made through multiple legislative initiatives rather than a single comprehensive measure. The amendment makes possible the granting of autonomy to the Central Bank by means of the passage of complementary legislation adopted by an absolute majority of the members in each house of the National Congress. The Commission of Economic Affairs of the Senate is currently reviewing Complementary Law No. 73/2005, which establishes the operational autonomy of the Central Bank.
D-65
The Brazilian Securities Commission (Comissão de Valores Mobiliários or “CVM”) is responsible for regulating the country’s stock exchanges, protecting investors and shareholders against fraud or manipulation with respect to securities traded on such exchanges and promulgating accounting and reporting rules to ensure the availability to the public of information on securities and their issuers.
Monetary Policy and Money Supply
On July 1, 1999, Brazil formally adopted inflation targeting as its monetary policy framework. Decree No. 3,088 of June 21, 1999 provides, among other things, that: (i) inflation targets are to be established on the basis of variations of a widely known price index; (ii) the inflation targets, as well as the tolerance intervals, were to be set by the National Monetary Council based on proposals by the Finance Minister; (iii) inflation targets for the years 1999, 2000 and 2001 were to be set no later than June 30, 1999; (iv) the inflation target for the year 2002 and subsequent years is to be set no later than June 30 of the second year prior to the year for which the target is being set; (v) the Central Bank is responsible for implementing the policies necessary to achieve the targets; (vi) the price index adopted for the purposes of the inflation targeting framework is to be chosen by the National Monetary Council based on a proposal by the Finance Minister; (vii) the targets will be considered to have been met whenever the observed accumulated inflation during each calendar year (measured on the basis of variations in the price index adopted for these purposes) falls within specified tolerance levels; (viii) if any target is not met, the Central Bank’s Governor must issue an open letter addressed to the Finance Minister explaining why the target was not met, the measures to be adopted to ensure that inflation returns to the tolerance levels and the period of time that will be needed for these measures to have an effect; and (ix) the Central Bank is to issue a quarterly inflation report that will provide information on the performance of the inflation targeting framework, the results of the monetary policy actions, and the perspectives regarding inflation.
On June 30, 1999, the National Monetary Council issued Resolution No. 2,615, which specified that the Broad Consumer Price Index (“IPCA”) reported by the National Bureau of Geography and Statistics (“IBGE”) would be used for the purpose of gauging inflation targets and which set the inflation targets at 8% for 1999, 6% for 2000 and 4% for 2001. Resolution No. 2,615 also established tolerance levels at plus or minus 2 percentage points for each year. On June 28, 2000, the National Monetary Council issued Resolution No. 2,744, which set the inflation target (as measured by IPCA) at 3.5% and the tolerance levels at plus or minus 2 percentage points for 2002. The inflation targets for 2003 and 2004 were set at 4.0% and 3.75%, respectively, with the tolerance levels at plus or minus 2.5 percentage points. On June 25, 2003, the National Monetary Council issued Resolution No. 3,018, which revised the inflation targets (as measured by IPCA) for 2004 and 2005 to 5.5% and 4.5%, respectively, with a tolerance level of plus or minus 2.5 percentage points. On June 30, 2004, the National Monetary Council established an inflation target of 4.5% in 2006 through Resolution No. 3,210, with a tolerance level of plus or minus 2.0 percentage points. In September 2004, the Central Bank raised the inflation target for 2005 to 5.1% to account for the continuing effects of accelerated inflation in 2004.
The Central Bank uses monetary policy instruments, principally the Over/Selic rate (a market-determined overnight rate for operations with federal bonds which determines the interest rate on debt issued by the Central Bank and the Government in a manner similar to the U.S. federal funds rate), in order to achieve the inflation targets. The performance of monetary policy under the inflation targeting framework is measured by IPCA, which rose 6.0% in 2000, 7.7% in 2001, 12.5% in 2002, 9.3% in 2003 and 7.6% in 2004.
On March 3, 1999, the Central Bank eliminated the Central Bank Basic Rate (“TBC”) and the Central Bank Assistance Rate (“TBAN”), which had applied to discount window operations and had performed signaling functions for the markets as to the Central Bank’s policy intentions, and increased the Over/Selic rate target to 45% from 39%. The Central Bank subsequently reduced the Over/Selic rate target to 42% on March 25, 1999, 39.5% on April 6, 1999, 34% on April 15, 1999, 32% on April 29, 1999, 29.5% on May 10, 1999, 27% on May 13, 1999, 23.5% on May 20, 1999, 22% on June 9, 1999 and 21% on June 24, 1999, citing lower-than-expected inflation and improved expectations for the economy. The Over/Selic rate target was further reduced to 19.5% on July 28, 1999, 19% on September 22, 1999, 18.5% on March 29, 2000, 17.5% on June 21, 2000, 17% on July 10, 2000, 16.5% on July 20, 2000, 15.75% on December 20, 2000 and 15.25% on January 17, 2001.
D-66
However, citing an increase in core inflation, the uncertainties related to the effects of exchange rate depreciation and the accelerating pace of economic activity, the Central Bank raised the Over/Selic rate target to 15.75% on March 21, 2001, 16.25% on April 18, 2001, 16.75% on May 24, 2001, 18.25% on June 21, 2001 and 19% on July 18, 2001.
On February 20, 2002, the Central Bank reduced the Over/Selic rate target to 18.75% from 19%. The Central Bank further reduced the Over/Selic target from 18.75% to 18.50% on March 20, 2002 and to 18% on July 17, 2002, citing improved economic conditions. However, in the second half of 2002 and the first quarter of 2003, the depreciation in the value of the real, increases in administered prices (prices subject to government regulation, such as rates for telephone calls and prices for gasoline and other petroleum derivatives, and prices governed by contracts with vendors, such as fares charged for certain public transportation) and rising oil prices in the world markets resulted in the rise of inflation in Brazil. The Central Bank responded by increasing the Over/Selic rate target to 21% on October 14, 2002, 22% on November 20, 2002, 25% on December 18, 2002, 25.5% on January 22, 2003 and 26.5% on February 19, 2003.
Between February 19, 2003 and April 14, 2004, the Central Bank reduced its Over/Selic rate target from 26.5% to 16%. In an effort to manage inflationary expectations, the Central Bank increased its Over/Selic rate target from 16% to 16.25% on September 15, 2004, 16.75% on October 20, 2004, 17.25% on November 17, 2004, 17.75% on December 15, 2004, 18.25% on January 19, 2005, 18.75% on February 16, 2005, 19.25% on March 16, 2005, 19.50% on April 20, 2005 and 19.75% on May 18, 2005.
The Central Bank periodically intervenes in the overnight funds market to maintain liquidity in that market and to keep the Over/Selic rate close to its target rate. The Central Bank intervened in the overnight funds market in December 2001, for example, to address shortages arising from, among other things, nonscheduled placements of U.S. dollar-indexed securities to meet increased demands for a currency hedge following the events of September 11, 2001 and seasonal demands for holiday cash in December 2001.
As the real depreciated against the U.S. dollar during the second half of 2002, the Central Bank intervened in the foreign exchange markets to provide liquidity to those markets. The intervention took three forms: (i) direct intervention in the spot market totaling $5.8 billion during the period from July to October 2002; (ii) the provision of short-term U.S. dollar credit lines to banks, which had no accounting impact on Brazil’s international reserves; and (iii) the provision of credit lines to exporters in the amount of $1.5 billion during the period from August to October 2002, in order to compensate for a reduction of credit lines provided by foreign banks.
Since 1999, the Central Bank has been attempting to reduce interest rates charged by financial institutions for domestic loans. Such interest rates had declined from 1999 to the beginning of 2001 but then began an upward trend again as a result of concerns about Argentina, energy rationing in Brazil and the slowing U.S. and global economies. The average preset interest rate in Brazil for domestic loans reached 65.8% in October 2001, a spread of 42.7% over the Over/Selic rate. Rates dropped to 59.1% in April 2002 (a spread of 40.6% over the Over/Selic rate) before rising again to 70.1% (a spread of 42.5% over the Over/Selic rate) by December 2002, and declined to 57.3% (a spread of 41.5% over the Over/Selic rate) in December 2003 and 53.7% in December 2004.
On February 9, 2005, President da Silva sanctioned a bankruptcy law that had been under consideration by the Congress for ten years, as well as changes to the tax code. The new bankruptcy law, Law No. 11,101, among other things, (i) places a cap equal to 150 times the minimum monthly salary on claims in bankruptcy proceedings by employees for such items as unpaid wages, unused vacation time and the 40% penalty for unjust dismissals; (ii) gives secured credits (such as those held by banks) priority over tax claims in bankruptcy proceedings; and (iii) ends a “succession” doctrine that makes a purchaser of assets from a bankrupt company or from a company under judicial reorganization responsible for certain of the insolvent company’s tax and social security obligations as a consequence of the acquisition, and, in the case of a company under bankruptcy
D-67
proceedings, the debtor’s labor claims. The Government expects the measure to reduce interest rates charged by financial institutions for domestic loans.
The Government has implemented several measures to reduce spreads on domestic bank loans and to increase the demand for credit. Such measures can be broadly grouped into three categories: (i) measures to strengthen guarantees and the enforcement of contracts; (ii) measures to increase competition among lenders; and (iii) measures to ease the tax burden and the effects of banking regulations. Specific measures include the approval of amendments to the bankruptcy law and civil code, the dissemination of detailed information on market interest rates on Central Bank’s website; the reduction of the IOF (Tax on Financial Operations—Imposto sobre Operações Financeiras) rate for loans and other advances of credit to individuals, and modifications to the rules relating to the classification of loans and related provisions.
Time Deposits. Beginning in September 1996, there was a gradual reduction in the percentage of reserves required to be invested in government securities, and the cash component of the reserve requirement has been increased in the same proportion. The requirement to hold government securities was eliminated in February 1997, and the cash reserve requirement was reduced to zero on October 22, 1999. However, Central Bank Circular No. 3,062 of September 21, 2001 reinstated reserve requirements for time deposits and other liabilities of financial institutions. Since September 28, 2001, Circular No. 3,062 has required each financial institution to maintain on deposit with the Central Bank federal bonds having an aggregate principal amount equal to at least 10% of the average daily balance in excess of R$30 million for the preceding week of that institution’s time deposits, exchange rate acceptance funds, debenture-backed securities, securities that it has issued and debt assumption agreements linked to operations outside Brazil. On November 19, 2004, Circular No. 3,262 raised the floor for reserve requirements from R$30 million to R$300 million.
Formerly, the Brazilian monetary authorities relied on short-term National Treasury Bonds (Bônus do Tesouro Nacional) as the principal instrument for indexation. As that instrument was phased out, the Taxa Referencial (“TR”) was created for purposes of indicating the prevailing interest rate. The TR is calculated by the authorities periodically, based on the average daily rate for bank certificates of deposit. Based on current rates rather than historical rates, the TR was intended to reduce the influence of past inflation and more accurately reflect future inflation than predecessor indices. In January 1994 and October 1997, the Government revised the methodology for the calculation of the TR in order to increase the incentive to deposit money in savings accounts. The TR is currently derived from the Basic Financial Rate (Taxa Básica Financeira or “TBF”), which is calculated by the Central Bank from the weighted average of the rates offered by financial institutions on their certificates of deposit. The TBF so calculated is adjusted by a reduction factor in determining the TR. The reduction factor may occasionally be modified as a consequence of the changes in the real interest rate and the tax rate on the gross earnings of the certificates of deposit.
Reserve Requirements. All depositary institutions, commercial banks, multiple service banks, investment banks, development banks, savings and loans and financial institutions are required to satisfy reserve requirements set by the Central Bank. These reserve requirements are applied to a wide range of banking activities and transactions, such as demand deposits, savings deposits, time deposits, debt assumption transactions, automatic reinvestment deposits, funding transactions, repurchase agreements and export notes. As a result of Circular No. 3,177, dated February 19, 2003, banks are now generally required to deposit in a non-interest-bearing account at the Central Bank: (i) 60% of the average daily balance of demand deposits in excess of R$2 million; and (ii) 80% of the average daily balance of bank drafts, collections of receivables, collections of tax receipts and proceeds from the realization of guarantees granted to financial institutions in excess of R$44 million. In addition, banks are required to deposit in an interest-bearing account at the Central Bank, on a weekly basis, an amount in cash equal to 15% of the average daily balance of savings accounts, calculated on a weekly basis. Finally, financial institutions are required to maintain on deposit with the Central Bank federal bonds having an aggregate principal amount at least equal to 10% of the average daily balance during the preceding week of that institution’s time deposits, exchange rate acceptance funds, debenture-backed securities, securities that it has issued and debt assumption agreements linked to operations outside Brazil.
D-68
During the second half of 1999, the Government announced a set of measures intended to reduce the cost of financial intermediation and thereby stimulate the growth of credit to the private sector. The measures included, among other things, a reduction in the reserve requirement for demand deposits to 55% of the average daily balance thereof effective April 2000. The reserve requirement for demand deposits was further reduced to 45% in June 2000.
On several occasions in 2002, the Central Bank changed its reserve requirements to control liquidity in the overnight market. During the first quarter of 2003, the Central Bank continued to adjust its reserve requirements, raising its reserve requirement for demand deposits to 60% from 45% on February 19, 2003, and then reducing it again to 45% on August 8, 2003. Circular No. 3,274, dated February 10, 2005, superseded Circular No. 3,177 and, among other things consolidated the rules for reserve requirements on demand deposits.
The following table sets forth selected information regarding percentage changes in the monetary base and money supply for the periods indicated.
Table No. 24
Percentage Increases in Monetary Base and Money Supply
| | | | | | | | | | | | |
| | | Year Ended December 31,
|
| | | 2000
| | | 2001
| | 2002
| | 2003
| | | 2004
|
Monetary Base(1) | | (1.5 | ) | | 11.7 | | 37.6 | | (0.1 | ) | | 21.2 |
M1(2) | | 18.5 | | | 12.6 | | 28.8 | | 1.5 | | | 16.7 |
M2(3) | | 3.3 | | | 13.3 | | 23.6 | | 3.8 | | | 19.5 |
| (1) | | Monetary base represents Central Bank liabilities, including currency and deposits held by commercial banks. |
| (2) | | M1 is currency plus demand deposits. |
| (3) | | M2 is M1 plus savings accounts and private securities, bank certificates of deposit (“CDBs”), mortgage bills (letras hipotecárias), real estate bills (letras imobiliárias), bills of exchange (letras de câmbio), and foreign exchange and acceptances (recursos e aceites cambiais). |
Source: Central Bank
Limitation of Public Sector Debt
Since May 1990, the CMN has taken various measures to limit expansion of credit in the public sector. In July 1993, the CMN mandated the creation by the Central Bank of a Public Sector Operations Registration System designed to improve credit controls. The CMN has also limited the ability of public sector financial entities to issue additional public indebtedness.
On June 29, 1998, the National Monetary Council of Brazil issued Resolution No. 2,515, which establishes certain conditions that must be observed with respect to the external credit operations of States, the Federal District, municipalities, and their respective agencies, foundations and companies. Resolution No. 2,515 requires, among other things, that (i) the proceeds of such external credit operations be used to refinance outstanding domestic financial obligations of the issuer, with preference given to those domestic obligations having a higher cost or shorter term than the external debt and, pending such application, remain on deposit in an escrow account in a form specified by the Central Bank; (ii) the total amount of the contractual obligation be subject to monthly deposits in an escrow account in a form specified by the Central Bank, with each monthly deposit to be equal to the total debt service obligation (including principal and interest), divided by the number of months that the obligation is to be outstanding; (iii) the foreign creditor (or underwriter, in case of securities issue) be a financial institution that traditionally maintains relationship with Brazil or that has a risk rating equal or higher than “BBB”, according to the international rating agencies; and (iv) the contracts relating to such operations contain a
D-69
clause expressly providing that the borrower’s obligations are not guaranteed by the federal Government and that the creditors acknowledge that they will not be entitled to receive any funds from the federal Government for such operations.
The Fiscal Responsibility Law severely restricts personnel expenditures and extensions of credit at all levels of government in Brazil and provides for ceilings for public sector debt. See “Public Finance—Fiscal Responsibility Law and Fiscal Crime Law”.
Public Sector Financial Institutions
Brazil’s principal public sector financial institutions are Banco do Brasil, BNDES and CEF, all federal institutions, together with a number of state institutions.
Banco do Brasil. Banco do Brasil, the main lender to the rural sector, is one of Brazil’s largest multiple service banks. It is organized as a mixed-capital company, with the federal Government holding a majority of its voting shares, and is subject to legislation applicable to private sector entities, including all labor and tax legislation. Banco do Brasil functions as a private multiple service bank, although it does engage in some lending programs which implement certain policies established by the CMN. In March 1996, Banco do Brasil announced a significant restructuring of the bank following a 1995 loss in excess of R$4 billion and a 1996 first half loss of R$7.8 billion. On March 20, 1996, the Government enacted Provisional Measure No. 1,367, authorizing the National Treasury to increase the capital of Banco do Brasil by up to R$8 billion. This amount was funded by issuance of National Treasury Notes (R$6.5 billion) and by investments made in Banco do Brasil by PREVI (R$1 billion) and BNDESpar (R$500 million). On December 31, 2004, Banco do Brasil had assets of approximately R$239.0 billion and a net worth of approximately R$14.1 billion.
BNDES. BNDES, the federal Government-controlled development bank, is primarily engaged in the provision of medium- and long-term financing to the Brazilian private sector, particularly to industry, either directly or indirectly through other public and private sector financial institutions. BNDES was also responsible for administering the federal Government’s privatization program. On December 31, 2004, BNDES had assets of approximately R$164.0 billion and a net worth of approximately R$14.1 billion.
CEF. CEF, a savings bank controlled by the federal Government, is the principal agent of the Housing Finance System. CEF is involved principally in deposit-taking and the provision of financing for housing and related infrastructure. Its assets on December 31, 2004 were approximately R$147.8 billion, and its net worth stood at approximately R$6.7 billion.
Between June 2001 and December 2001, the Government capitalized four federal banks (Banco do Brasil, Banco da Amazônia, Banco do Nordeste do Brasil and Caixa Econômica Federal), principally through the acquisition of certain impaired assets in exchange for public debt securities. The capitalization transactions increased Brazil’s net public sector debt by R$12.6 billion.
Others. Other federal financial institutions include Banco da Amazônia and Banco do Nordeste do Brasil; Banco Meridional was purchased on December 4, 1997 by Bozano Simonsen for R$265.7 million. Several State banks, including BANESPA and BANERJ, were put under the administrative control of the Central Bank in December 1994. Banco Itaú S.A. purchased two State banks—BANERJ on June 26, 1997 for R$331.0 million and BEMGE on September 14, 1998 for R$583.0 million—and control of BANESPA passed to the federal Government on December 31, 1997 in connection with the restructuring of the State of São Paulo’s R$16.8 billion debt to BANESPA. The Government subsequently sold 60% of the outstanding common (voting) shares and 30% of the outstanding preferred (nonvoting) shares of BANESPA to Banco Santander Central Hispano of Spain for R$7.05 billion on November 20, 2000. In addition, BANDEPE was sold to Banco ABN AMRO on November 17, 1998 for R$182.9 million, and Banco Baneb, a bank controlled by the State of Bahia, was sold in June 1999 to Banco Bradesco S.A. for R$260.0 million. On October 17, 2000, the State of Paraná also sold a
D-70
controlling interest in Banestado to Banco Itaú S.A. for R$1.625 billion. In January 2002, BEA was sold to Banco Bradesco S.A. for R$182.9 million. In February 2004, the Central Bank sold the shares of Banco do Estado do Maranhão—BEM, a former State bank, to Banco Brasdesco S.A. for R$78 million. See “—General” and “The Brazilian Economy—Relationship between the Federal and Local Governments”.
State-owned or - -controlled banks were sometimes used by State governments to finance the economic and political activities of State governments; such practices resulted in the making of loans that might not otherwise have been made on strictly commercial criteria. Some Brazilian State-owned or State-controlled banks have at times required the direct or indirect financial assistance of the Central Bank. See “—General”. With the introduction of a number of reforms by the Central Bank in 1993, in particular regulations involving State-owned or State-controlled bank lending practices, those institutions were restricted from granting credits to their controlling entities.
In August 1996, the federal Government issued Provisional Measure No. 1,514 dated August 7, 1996 (subsequently superseded by Provisional Measure Nos. 1,556–6, 1,590–15, 1,654-24, 1,702-27, 1,702-30, 1,773-32 and 1,900-91) which established a program to facilitate the restructuring of Brazil’s State banks. This provisional measure, among other things, permitted the Republic, in its sole discretion, to (i) acquire control of a financial institution, exclusively for its privatization or dissolution, (ii) finance the closure of the financial institution or its transformation into a non-financial institution or development agency or (iii) finance the prior arrangements necessary for the privatization of the financial institution or to guarantee any credit by the Central Bank for the same end, in accordance with rules to be promulgated by the National Monetary Council. See “The Brazilian Economy—Relationship between the Federal and Local Governments”.
In conjunction with efforts of the federal Government to assist the States under the Support Program for the Restructuring and Fiscal Adjustment of States and the assistance provided by the federal Government to the States in refinancing certain State debt, several State banks have come under the supervision of the Central Bank under nonjudicial liquidation by the Central Bank (like Banco do Estado do Amapá S.A. and Banco de Desenvolvimento Rio Grande do Norte S.A.) and judicial liquidation (like Banco do Estado de Rondônia S.A., Banco do Estado do Alagoas S.A. and Banco do Estado de Mato Grosso S.A.). As of December 31, 2004, four State financial institutions were under liquidation within the scope of the Support Program for the Reduction of the State Public Sector in Banking Activity (“PROES”).
Private Sector Financial Institutions
Effective September 21, 1988, Brazil permitted the establishment of multiple service banks. Multiple service banks are licensed to provide a full range of commercial banking, investment banking (including securities underwriting and trading), consumer financing and other services, including fund management and real estate finance. As of December 31, 2004, there were 139 private multiple service banks operating in Brazil.
Private sector financial institutions include commercial banks, investment banks, multiple service banks and other financial institutions. Brazil’s 24 private sector commercial banks and 139 private multiple service banks with commercial portfolios are engaged in wholesale and retail banking. They are particularly active in taking demand deposits and lending for short-term working capital purposes. Brazil’s 21 investment banks are engaged primarily in collecting time deposits, specialized lending and underwriting securities. As of December 31, 2004, the consolidated net worth of the private sector banking institutions in Brazil was R$130.0 billion.
Regulation by Central Bank
The Central Bank is authorized to implement the currency and credit policies prescribed by the CMN and to supervise all financial institutions. Any amendment to a financial institution’s by-laws, increase in its capital or establishment or transfer of its principal place of business or any branch (whether in Brazil or abroad) must be approved by the Central Bank, which is also responsible for determining the minimum capital requirements for
D-71
financial institutions. The Central Bank is responsible for ensuring that the accounting and statistical requirements established by the CMN are observed. Financial institutions must submit semiannual financial statements reviewed by each institution’s independent auditors and a formal audit opinion, as well as monthly unaudited financial statements prepared in accordance with the standard accounting rules promulgated by the Central Bank. As part of the Central Bank’s supervision of their activities, financial institutions are required to make full disclosure of credit transactions, foreign exchange transactions, the use of proceeds raised from export and import transactions, and any other related economic activity. Such data are usually supplied to the Central Bank on a daily basis through computer systems, reports and statements. The Central Bank also supervises the operations of consumer credit companies, securities dealers, stock brokerage companies, leasing companies, savings and loan associations and real-estate credit companies. See “—General” and “The Brazilian Economy—Relationship between the Federal and Local Governments”.
Central Bank regulations impose capital adequacy, liquidity, savings deposit insurance, and loan loss reserve requirements on regulated financial institutions.
Capital Adequacy, Liquidity and Concentration Limits. Since January 1, 1995, Brazilian financial institutions have been required to comply with the Basle Accord on risk-based capital adequacy, modified as described below by Resolution No. 2,099, dated August 17, 1994.
In general, the Basle Accord requires banks to maintain a ratio of capital to assets and certain off-balance sheet items, determined on a risk-weighted basis, of at least 11% for risk-weighted assets and 20% for swap transactions. Tier 1, or core, capital includes equity capital (i.e., common shares and non-cumulative permanent preferred shares), share premium, retained earnings and certain disclosed reserves less goodwill. Tier 2, or supplementary, capital includes “hidden” reserves, asset revaluation reserves, general loan loss reserves, subordinated debt and other quasi-equity capital instruments (such as cumulative preferred shares, long-term preferred shares and mandatory convertible debt instruments). Tier 2 capital is limited to the total of a bank’s Tier 1 capital. There are also limitations on the maximum amount of certain Tier 2 capital items. To assess the capital adequacy of banks under the risk-based capital adequacy guidelines, a bank’s capital is evaluated on the basis of the aggregate amount of its assets, liabilities and off-balance sheet exposure. The risk-based capital adequacy guidelines also establish credit conversion formulae for determining the credit risk of off-balance sheet items, such as financial guarantees, letters of credit and foreign currency and interest rate contracts.
Under Brazilian modifications to the Basle requirements (a) only Tier 1 capital (as modified with respect to revaluation reserves) may be counted towards the 11% minimum capital requirement, and (b) the risk weights assigned to certain assets and credit conversion amounts differ to a minor extent. In addition, pursuant to Resolution No. 2,692 dated February 24, 2000 of the National Monetary Council of Brazil, financial institutions are required to include interest rate risk arising from fixed-rate instruments in their determination of capital adequacy. Brazilian financial institutions may elect to calculate their capital requirements on either a consolidated or unconsolidated basis. Resolution No. 2,891 dated September 26, 2001 of the National Monetary Council of Brazil increased the percentage of capital requirement to cover exchange rate risk to 50% from 33% while reducing the exemption limit for this requirement to 5% of net worth from 20%. These changes had the effect of requiring financial institutions to increase their capital to cover exchange rate risk.
In June 2004, the central bank governors and heads of bank supervisory authorities in the Group of Ten (G-10) countries endorsed a new capital adequacy framework known as Basle II. Basle II builds on the structure of the 1988 Basle requirements by aligning the minimum capital requirements more closely to the bank’s actual risk of economic loss. Basle II, among other things, requires higher levels of capital for borrowers that are thought to present higher levels of risk and establishes a new capital charge for exposures to risk of losses caused by operational failures or external events, such as natural disasters. The Central Bank, through Communication No. 12,746 of December 9, 2004, establishes guidelines for the implementation of the Basle II requirements. Communication No. 12,746 states, among other things, that the Central Bank will not rely on ratings published by external rating agencies and will seek instead to refine existing standards for measuring capital adequacy. Communication No. 12,746 also establishes a timetable for the implementation of Basle II through 2011.
D-72
Under Circular 3,156, dated October 11, 2002, the exposure of financial institutions, determined on a consolidated basis, to gold and assets and liabilities indexed to exchange variations cannot exceed 30% of that group’s adjusted net worth.
The Central Bank originally prohibited Brazilian multiple-service banks from holding, on a consolidated basis, permanent assets in excess of 90% of their adjusted stockholders’ equity. The 90% threshold was reduced to 80% effective June 30, 1998, 70% as of June 30, 2000, 60% as of June 30, 2002 and 50% as of December 31, 2002. Permanent assets include investments in subsidiaries as well as premises, equipment and intangible assets.
Financial institutions are also prohibited under Resolution No. 2,844 dated June 29, 2001 from extending credit to a single borrower that, in the aggregate, exceed 25% of that institution’s shareholder’s equity. Extensions of credit include, among other things, loans, advances, leasing operations and guarantees. Resolution No. 2,844 also limits the aggregate amount of “concentrated exposure”, defined as extensions of credit to any customer that, in the aggregate, represent 10% or more of an institution’s shareholder’s equity; under Resolution No. 2,844 an institution’s aggregate concentrated exposure is not permitted to exceed 600% of its shareholder’s equity.
National Monetary Council of Brazil Resolution No. 2,836 dated May 30, 2001 provides for the assignment of loans and certain other extensions of credit, with or without recourse, except for assignments by entities that are not part of the National Financial System, for which assignments with recourse are not permitted. Resolution No. 2,836 eliminated the need to obtain specific authorization from the Central Bank for transfers to nonfinancial institutions, except for transfers to related entities that are part of the same financial group.
National Monetary Council Resolution No. 3,081 dated May 29, 2003, as amended by National Monetary Council Resolution No. 3,170 dated January 30, 2004, required each financial institution with net equity greater than or equal to R$1 billion to establish an audit committee not later than March 31, 2004. Each such committee is required to be composed of at least three members having terms of not more than five years. Among the duties of these committees are the appointment of external auditors, evaluation of the effectiveness of the external and internal audits and verification of compliance by the management with the auditors’ recommendations.
Derivatives and Investment Securities. The Central Bank has issued two regulations—Circular No. 3,082 dated January 30, 2002 and Circular No. 3,068 dated November 8, 2001—to enhance the transparency of financial reporting by financial institutions. Circular No. 3,082 sets forth hedge accounting rules applicable to financial institutions. It requires, among other things, that all derivatives (including hedging transactions) be marked to market at least monthly. In addition, derivative transactions that are used for hedging purposes are required to be classified according to the risk that is being hedged—market risk or cash flow—and must be with an unrelated third-party and not another company that is part of the consolidated group. Disclosure of, among other things, the strategy behind these derivative transactions and gains and losses arising from such transactions during the reporting period are also required in the notes to the financial statements. Circular No. 3,068 requires that securities held by financial institutions be classified as securities for sale, securities for trading or securities to be held to maturity. Securities for sale or trading are required to be marked to market. The classification also determines the accounting treatment for such securities, including the recognition of any gain or loss for revenue recognition purposes.
On February 8, 2002, the Central Bank issued Communication No. 9,253, which authorizes financial institutions to enter into swap operations, forward contracts and non-standardized options linked to federal public securities. The Communication complements Resolution No. 2,873 dated July 26, 2001 of the National Monetary Council of Brazil, which specified the types of derivative transactions that financial institutions were authorized to do and the types of assets to which derivative instruments could be linked.
Circular No. 3,086 dated February 15, 2002 applies to investment funds and regulates the accounting for securities held in a fund’s portfolio. It also requires that the securities be classified as securities for trading or securities to be held to maturity. Securities for trading are required to be marked to market daily. To qualify as
D-73
securities to be held to maturity, (a) the fund must have the financial capacity to hold such securities until maturity and (b) the fund must have a single investor (which, if that investor is another fund, must be a fund that itself has a single investor) that has the financial capacity to hold such securities to maturity. Normative Instruction No. 365 dated May 29, 2002, issued by the Brazilian Securities Commission (“CVM”), imposes additional requirements: (a) fund holders must have the intent to keep the investment volume compatible with the maintenance of such assets in the fund’s portfolio until maturity; (b) the fund must be held by a single investor, investors belonging to the same conglomerate or financial group, or qualified investors (as defined by CVM rules concerning securities portfolio investment funds); and (c) all fund holders must be in favor of the fund’s qualification for classification as securities to be held to maturity. Normative Instruction No. 375 dated August 14, 2002 provides that securities held by funds which do not qualify under the requirements of Normative Instruction No. 365 may nonetheless qualify as securities to be held to maturity as long as the fund has the requisite financial capacity and satisfies the following conditions: securities held by the fund have (a) a maturity limited to 365 days and (b) a fixed rate of return determined at maturity and based on the Over/Selic rate or the interbank deposit rate.
Deposit Insurance. On November 16, 1995, the Government implemented a deposit insurance system in Brazil, by creating the FGC to protect certain creditors in cases of (1) intervention, nonjudicial liquidation or bankruptcy of an institution or (2) the Central Bank’s recognition of a state of insolvency at an institution that, according to current law, is not subject to one of the mechanisms listed in (1) above. Such insurance became effective in February 1996.
The participants in the FGC are all financial institutions and savings and loan associations, with the exception of credit cooperatives and the credit sections of cooperatives. The participating institutions make a monthly contribution of 0.025% of the total reported value of covered liabilities.
The following liabilities are covered by the guaranty provided by the FGC: demand deposits or those that may be withdrawn through prior notification; savings deposits; time deposits, in both book entry and certificated form; bills of exchange; real estate bonds; and mortgage bonds.
The following liabilities are not covered by the guarantee: liabilities in the name of other institutions that are members of the National Financial System; deposits, loans or any other resources contracted or raised abroad; and credits in the name of certain persons affiliated with an institution, generally managers and other members of the consolidated group of which such institution is a member.
The FGC is a nonprofit, civil association governed by private law, its bylaws and applicable legal and regulatory provisions. The FGC is headquartered in, and subject to the jurisdiction of, the municipality of São Paulo and its duration is unlimited.
The FGC guarantee covers up to R$20,000 per person of covered claims against a single institution or against all the institutions of a single financial conglomerate. Since February 1996, Brazilian banks have made monthly contributions to the FGC, which totaled R$7.5 billion in December 2004.
Loan Loss Reserves. Resolution No. 2,682 dated December 21, 1999 and Resolution No. 2,697 dated February 24, 2000 of the National Monetary Council of Brazil introduced a nine-category classification system in March 2000 under which loans and other extensions of credit are assigned ratings ranging from AA to H according to perceived credit risk of the borrower or guarantor and the nature of credit. The ratings are assigned initially when the extension of credit is made and thereafter are reevaluated on a monthly basis; a rating assigned to any credit is subject to change if there are amounts payable in respect of that credit that are in arrears. Loan-loss provisions vary according to the rating assigned to a particular credit and range from 0% (in the case of any credit that is not in arrears) to 100% (in the case of any credit that is more than 180 days in arrears). Banks began using the classification system for all loans over R$50,000 in March 2000 and for all loans in June 2000. As of December 2004, 90% of the outstanding credit balance of financial institutions operating in Brazil were classified AA to C (less than 60 days in arrears).
D-74
Foreign Currency Loans. Financial institutions in Brazil are permitted to borrow foreign currency-denominated funds in the international markets (either through direct loans or through the issuance of debt securities). Pursuant to Resolution No. 2,683 dated December 29, 1999 of the National Monetary Council of Brazil, financial institutions have been authorized since January 3, 2000 to borrow foreign currency-denominated funds in the international markets for the purpose of investment in domestic market, without regard to minimum periods of amortization and retention of the funds in Brazil. Fiscal procedures replaced the various rules that had limited the short-term capital flow because of the Financial Operations Tax (“IOF”).
Payment Settlement System. In April 2002, the Central Bank instituted changes to the settlement system for payments that were intended to minimize the systemic and credit risks that had been borne largely by the Central Bank. Prior to these changes, the Central Bank had accurate information on the balances held by financial institutions in their reserve accounts only at the end of each day. This permitted overdrafts to be created in the system without the provision of adequate collateral or other guarantees and left the settlement system vulnerable to failures by individual institutions. Because of concerns about the risks to the payment system, the Central Bank did not unwind the transactions that had created the overdrafts but instead intervened to prevent settlement failures from adversely affecting the payment system. The Central Bank therefore stood as the ultimate guarantor of each payment in the system. Under the revised payment system, payment orders in the Reserves Transfer System cannot be processed unless there is a sufficient balance in the paying institution’s reserve account. If the reserve balance is insufficient for the payment order to be processed, the order is queued until the reserve balance is sufficient to make the payment or is rejected. To avoid payment interruptions, the Central Bank plans to introduce an intra-day credit line backed by Brazilian Treasury and Central Bank securities. There is no financial cost for this line, as long as repayment is made the same day; payments not so made are treated as overnight loans for which a penalty rate is charged to the institution with the overdraft. This real-time gross settlement system is intended to prevent intra-day overdrafts from being created in the payment system.
Independent Accountants. Financial institutions are required to replace their independent accountants no later than every fourth fiscal year. A former independent accountant of a financial institution can be re-hired only after three complete fiscal years have elapsed from its prior engagement by such financial institution. Independent accountants are required to prepare the following reports: (i) a report on the examined audited financial statements with respect to compliance with accounting principles as well as the relevant rules issued by the CMN and the Central Bank; (ii) a report evaluating the quality and adequacy of internal control procedures, including risk assessment criteria and data processing systems; and (iii) a report on the compliance with applicable operational laws and regulations.
Each independent accountant is required to communicate immediately to the Central Bank any event that may materially adversely affect the relevant financial institution’s status. Financial institutions are required to appoint an executive officer to a supervisory role in the area of accounting in order to ensure compliance with auditing and accounting rules and the rendering of accurate information.
Pursuant to National Monetary Council Resolution No. 3,198, dated May 27, 2004, as modified by National Monetary Council Resolution No. 3,271, dated March 24, 2005, independent auditors of financial institutions will be required to be qualified by the Federal Accounting Council (Conselho Federal de Contabilidade, or CFC) and the Institute of the Independent Auditors of Brazil (Instituto dos Auditores Independentes do Brasil, or IBRACON). Such qualification must be obtained before June 30, 2006.
Foreign Banks and Insurance Companies. Under current law, foreign banks duly authorized to operate in Brazil through a branch or a subsidiary are subject to the same rules, regulations and requirements applied to any other Brazilian financial institution. On December 31, 2004, there were 62 foreign-controlled or foreign-affiliated banks and 11 banks in which there was significant foreign participation operating in Brazil. In accordance with the Constitution, authorization for the establishment of new foreign financial institutions in Brazil is to be regulated by the Congress although to date no law has yet been enacted. Until the adoption of the law, the establishment in Brazil of new agencies, subsidiaries or branches of foreign financial institutions and any increase in a foreigner’s
D-75
percentage participation in existing institutions in the Brazilian financial system was prohibited, except when it resulted from international agreements or an express Presidential finding of public interest.
In January 1997, the National Monetary Council initiated several measures aimed at liberalizing foreign investment in the financial sector and permitting foreign stock ownership and control of banks in Brazil. In 1998, foreign banks acquired control of 42 financial institutions in Brazil, including 15 banks. Between December 1996 and December 2004, foreign bank participation in the Brazilian financial system’s total assets increased to 22.4% from 9.8%, and foreign bank participation in the Brazilian financial system’s net worth increased to 27.9% from 10.3%.
Securities Markets
The CVM implements the policies of the CMN relating to the organization and operation of the securities industry. The CVM is responsible for regulating the country’s stock exchanges, protecting investors and shareholders against fraud or manipulation with respect to any securities traded on the stock exchanges and promulgating accounting and reporting rules to ensure the availability to the public of information on the securities being traded and the companies issuing them. The Central Bank has licensing authority over brokerage firms and dealers and controls foreign investment and foreign exchange transactions.
Brazil has nine stock exchanges—São Paulo, Rio de Janeiro, Minas-Espírito Santo-Brasilia, Extreme South, Santos, Bahia-Sergipe-Alagoas, Pernambuco and Paraíba, Paraná and Regional Stock. Of these stock exchanges, the São Paulo Stock Exchange (Bolsa de Valores de São Paulo, or “BOVESPA”) and the Rio de Janeiro Stock Exchange (Bolsa de Valores do Rio de Janeiro, or “BVRJ”) are the most significant, accounting together in 1998 for approximately 98% of the daily trading activity.
In March 2000, all nine stock exchanges signed agreements designed to integrate the exchanges. The BOVESPA handles stock transactions, while the BVRJ is responsible for transactions involving government securities. The other regional stock exchanges focus on market development and providing services in their respective regions.
In response to volatility in the Brazilian stock markets during the latter half of October 1997, BOVESPA and the Rio de Janeiro Stock Exchange implemented circuit breakers designed to halt trading when their respective stock indices fall by more than 10%. Such circuit breakers were triggered three times in 1997, five times in 1998 and twice in 1999.
A company that is qualified to trade on one Brazilian stock exchange may qualify for trading on any other Brazilian stock exchange. On December 31, 2004, there were 358 companies listed on BOVESPA, the largest stock exchange in Brazil by average daily trading volume, and the aggregate market capitalization of all listed companies was approximately $340.9 billion. As of December 31, 2004, the aggregate trading volume on BOVESPA was approximately $104.5 billion, and three of the twenty companies with the largest capitalization listed on the stock exchanges in Brazil were controlled by the Government. Trades in securities listed on the Brazilian stock exchanges may be effected off the exchanges in certain circumstances, although the volume of such trading is limited. The table below sets forth some indicators of market activity on BOVESPA in the five years ended December 31, 2004:
Table No. 25
Market Activity on BOVESPA
| | | | | | | | | | |
| | | 2000
| | 2001
| | 2002
| | 2003
| | 2004
|
Number of Listed Companies | | 459 | | 428 | | 399 | | 369 | | 358 |
Market Capitalization(1) | | 225,528 | | 185,443 | | 124,042 | | 234,219 | | 340,921 |
Market Volume(1) | | 101,730 | | 65,261 | | 49,276 | | 67,972 | | 104,511 |
| (1) | | In millions of U.S. dollars. |
Source: BOVESPA
D-76
In December 2000, BOVESPA announced the creation of the New Market (Novo Mercado), a special listing segment reserved for the securities of companies that voluntarily undertook to adopt certain corporate governance practices and provide disclosure beyond that required under Brazilian law then in effect. The listing rules (regulamento de listagem), among other things, (i) prohibit the issuance by the listed company of preferred (nonvoting) shares, (ii) require that shares representing not less than 25% of the capital of the listed company remain in circulation and be owned by persons other than the controlling shareholder of the listed company, (iii) require the listed company to offer shares to the public in ways that promote a broad dissemination of the shares, (iv) require the listed company to provide “tag-along” rights to minority shareholders that would permit them to sell their shares for the same terms and conditions as those for the sale by a shareholder of controlling interest of the listed company, (v) require the listed company to provide to holders annual financial statements that have been prepared in accordance with generally accepted accounting principles of the United States or International Accounting Standards Committee, (vi) provide for enhanced quarterly reporting, and (vii) require the listed company to permit its minority shareholders to appoint a majority of the members of the listed company’s audit committee. BOVESPA can sanction listed companies that violate the listing rules; the sanctions include the imposition of fines, the suspension of trading in the offending company and the exclusion of the offending company from the New Market. The listing rules also require that disputes between a listed company and its shareholders be settled by arbitration through BOVESPA’s Market Arbitration Chamber. The New Market is intended to foster the overall growth of the Brazilian stock market by offering better treatment to minority shareholders and reducing their concerns regarding the purchase of shares of publicly traded companies. The listed company benefits from improved access to the capital markets (and, thereby, lower financing costs), because the shareholder-friendly corporate governance provisions and enhanced disclosure requirements are likely to be attractive to potential investors. An additional incentive for companies to list their shares in the New Market is provided by BNDES’ Program for the Support of New Corporations, through which BNDES offers advantageous conditions for obtaining and repaying lines of credit to companies participating in the New Market.
BOVESPA also issued at the same time a regulation for special practices of corporate administration that divides companies into two levels. The regulation applies to companies that were not listed in the New Market but that had nevertheless agreed to adopt certain corporate governance practices that went beyond the requirements of the Brazilian corporate law then in effect. Level 1 companies under the regulation are those that agreed to improve the disclosure provided to investors and to take steps to maintain the liquidity of their securities. Level 2 companies are those that agreed to additional reforms, including arbitration as a means of settling disputes with investors. Level 1 and Level 2 companies are also eligible for financing at advantageous terms through BNDES’ Program for the Support of New Corporations.
On October 31, 2001, the Government enacted Law No. 10,303 (“Law No. 10,303”), which amends the Brazilian Corporation Law and the law relating to the CVM. Law No. 10,303 imposes, among other things, restrictions on the issuance of preferred (nonvoting) shares; under the law, a non-publicly traded company is prohibited from issuing preferred shares in an aggregate amount that exceeds 50% of that company’s capital stock, while publicly traded companies on the date that the law was enacted were permitted to continue issuing preferred shares in an aggregate amount that is not in excess of 2/3 of capital stock. In addition, under Law No. 10,303, preferred shares are required to be accorded one of the following minimum preferences: (a) priority in receipt of dividends in an amount up to 3% of the book value per share; (b) dividends in an amount greater than those paid in respect of the common (voting) shares; or (c) a “tag-along” right that would permit minority shareholders to receive at least 80% of the price per share paid to the controlling shareholder upon any transfer of control of the company. Law No. 10,303 also gives minority shareholders the right to elect (x) two directors if such shareholders hold common shares that represent at least 15% of the voting shares or 10% of the total capital stock or (y) one director if such shareholders hold common or preferred shares that represent at least 10% of the total capital stock. The directors so elected by the minority shareholders were given veto rights in the appointment of an independent auditor. Finally, to convert a publicly held corporation into a close corporation, the purchaser is required to offer to purchase the remaining outstanding shares at their fair value (determined in accordance with the guidelines of the CVM). Companies were given one year to amend their bylaws to make these changes, although the 50% limitation on the issuance of preferred shares was made effective immediately.
D-77
Law No. 10,303 also amends the Brazilian Securities Commission Law to make market manipulation, insider trading and improper use of one’s position, profession, activity or function crimes punishable by imprisonment and fines. Law No. 10,303 is intended to promote investment in the domestic capital markets by affording additional protections to minority shareholders.
Significant securities-related legislation enacted in 2002 included Constitutional Amendment No. 37, dated June 12, 2002, which exempts stock exchange transactions from the provisional financial contribution transaction levy rate (“CPMF”).
The Brazilian equity market is one of Latin America’s largest in terms of market capitalization. The value of average daily trading volume fell from $569 million in 1998 to $348 million in 1999, but rose to $410 million in 2000 and $265 million in 2001, before falling again in 2002 to $198 million. The average daily trading volume rose to $272 million in 2003 and $420 million in 2004. Trading on Brazilian stock exchanges by non-residents of Brazil is subject to specific rules under Brazilian foreign investment legislation. See “Balance of Payments and Foreign Trade—Foreign Investment”.
The Brazilian equity market is characterized by significant short-term price volatility. The closing levels (U.S. dollar adjusted) for the IBOVESPA, an index maintained by BOVESPA, were 407 on December 31, 1990, 1,581 on December 31, 1991, 1,523 on December 31, 1992, 3,217 on December 31, 1993, 5,134 on December 31, 1994, 4,420 on December 31, 1995, 6,773 on December 31, 1996, 9,133 on December 31, 1997, 5,613 on December 31, 1998, 9,553 on December 31, 1999, 7,804 on December 29, 2000, 5,822 on December 31, 2001, 3,189 on December 31, 2002, 7,696 on December 31, 2003 and 9,869 on December 31, 2004. The following chart sets forth the level of the IBOVESPA at the close of each of the months indicated since January 2000.
Price Graph for IBOVESPA—BOVESPA Stock Index (in dollars)
Range 1/1/00—12/31/04
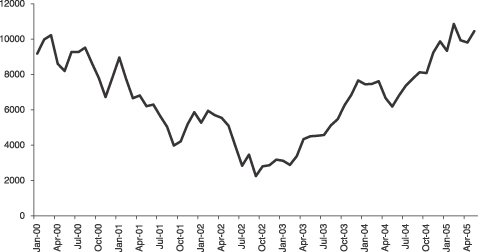
Source: BOVESPA
D-78
PUBLIC FINANCE
Consolidated Public Sector Fiscal Performance
The consolidated public sector account is comprised of the accounts of the federal Government, public sector enterprises, and State and local governments. In turn, the federal Government account consolidates the accounts of the National Treasury, the social security system, and the income and loss statement of the Central Bank, but does not include the proceeds of privatizations. With the adoption of several important structural reforms in recent years, the Government has established as its objective a substantial improvement in the fiscal performance of the consolidated public sector as measured by the primary balance.
Brazil reports its fiscal balance using three principal measures, all of which are calculated according to the official statistical guidelines of the IMF:
| | • | | Financial Balance, or Nominal Balance, which when in deficit is referred to as the Public Sector Borrowing Requirement (“PSBR”), is calculated as the difference between the level of consolidated public sector debt in one period and the level of such debt in the previous period, excluding the effects of the Government’s privatization program and the effect of exchange rate fluctuations on the debt levels between periods; |
| | • | | Primary Balance, which is the financial balance less net borrowing costs of the Government; and |
| | • | | Operational Balance, which excludes the inflationary component of interest payments on domestic debt of the non-financial public sector. This measure is calculated by adding to the primary balance accrued real interest on external and domestic debt. The operational balance is used to correct the distortions which affect the measurement of public finances in an inflationary environment. |
The PSBR totaled 3.6% of GDP in 2000. In 2000, the nominal deficit of the federal Government amounted to 2.3% of GDP, while the nominal deficit of the States and local governments fell to 2.1% of GDP. During that period, public sector enterprises registered a nominal surplus of 0.7% of GDP. The nominal deficit of the federal Government declined to 2.0% of GDP in 2001, and that of the State and local governments declined to 2.0% of GDP. Public sector enterprises showed a nominal surplus of 0.5% of GDP. The PSBR totaled 3.5% of GDP in 2001.
The nominal deficit of the federal Government declined to 0.7% of GDP in 2002, but that of the State and local governments increased to 3.6% of GDP. The public sector enterprises showed a nominal surplus of 0.1% of GDP. The PSBR totaled 4.3% of GDP. In 2003, the PSBR rose to 5.1% of GDP. A large part of this increase was attributable to the increases in the Over/Selic interest rate targets in 2002, which resulted in higher interest payments in respect of outstanding federal debt securities. See “The Brazilian Economy—Recent Economic Events and Policies”. Largely as a result of the increases in the Over/Selic rate, the nominal deficit of the federal Government rose from 0.7% of GDP in 2002 to 4.0% of GDP in 2003. The nominal deficit of State and local governments, by contrast, fell to 1.7% of GDP in 2003 from 3.6% of GDP in 2002. The nominal balance of public sector enterprises also improved, to a nominal surplus of 0.7% of GDP in 2003 from a nominal deficit of 0.1% of GDP in 2002. The PSBR declined from 5.1% of GDP in 2003 to 2.7% of GDP in 2004. The nominal deficit of the federal Government declined sharply from 4.0% of GDP in 2003 to 1.5% of GDP in 2004 due largely to an 0.5% increase in the primary result and a 2.4% decrease in accrued interest as compared to 2003. The nominal deficit of the States and local governments rose slightly to 1.9% of GDP in 2004. The nominal result of the state-owned companies also rose slightly, registering a surplus of 0.8% of GDP.
In 2000, the consolidated primary result improved to a surplus of 3.5% of GDP from 3.3% in 1999. The improvement in the consolidated primary balance was attributable to the primary result of the State and local governments and public sector enterprises, which rose to 0.6% and 1.1% of GDP, respectively. The federal Government registered a primary surplus of 1.9% of GDP. The consolidated operational deficit in 2000 was 1.2% of GDP. The operational deficits of the federal Government and the State and local governments were 1.3% and 0.7% of GDP, respectively. Public sector enterprises registered an operational surplus of 0.8% of GDP.
D-79
In 2001, the consolidated primary result improved slightly to a surplus of 3.7% of GDP. The primary surpluses of the federal Government, the State and local governments and the public sector enterprises, as a percentage of GDP, were 1.9%, 0.9% and 0.9%, respectively. The consolidated operational deficit in 2001 was 1.0% of GDP, with the federal Government and the State and local governments, registering operational deficits of 1.0% and 0.5% of GDP, respectively. The operational surplus of the public sector enterprises declined slightly to 0.5% of GDP. Real interest expense remained constant in 2001, totaling 4.7% of GDP.
In 2002, the consolidated primary result moved to a surplus of 4.0% of GDP. The primary surpluses of the federal Government, the State and local governments and the public sector enterprises, as a percentage of GDP, were 2.5%, 0.8% and 0.7%, respectively. The consolidated operational surplus in 2002 was 2.5% of GDP, with the federal Government and the State and local governments, registering operational surpluses of 2.2% and 0.3% of GDP, respectively. The public sector enterprises recorded an operational deficit of 0.1% of GDP. Real interest expense decreased in 2002 to 1.5% of GDP.
In 2003, the public sector had a primary surplus of R$66.2 billion, or 4.3% of GDP, which exceeded the 4.25% target set for that year. The primary surpluses of the federal Government, States and municipalities and public sector enterprises, as a percentage of GDP, were 2.5%, 0.9% and 0.9%, respectively. The operational deficit reached 2.8% of GDP, as a result of a rise of real interest rates in 2002. The real interest expense for 2003 rose to 7.3% of GDP.
In early 2003, the Government announced that it had raised its consolidated primary surplus target from 3.75% of GDP to 4.25% of GDP for each of 2003, 2004 and 2005. On September 22, 2004, the Government announced that it had raised its primary surplus target for 2004 to 4.5% of GDP from 4.25% of GDP due to better than expected fiscal revenues. The Government has maintained its 2005 primary surplus target of 4.25% of GDP.
Brazil’s consolidated public sector primary surplus for 2004 was R$81.1 billion (4.6% of GDP), exceeding its target of 4.5%. The primary results of the federal Government, States and municipalities and public Sector enterprises, as a percentage of GDP, were 3.0%, 1.0% and 0.6%, respectively. The consolidated public sector nominal deficit for 2004 was R$47.1 billion (2.7% of GDP), which compared favorably to the R$79.0 billion (5.1% of GDP) accumulated consolidated public sector nominal deficit in 2003. The operational result in 2004 was 1.5% of GDP, compared to 2.8% of GDP in 2003. Nominal interest payments totaled R$128.3 billion (or 7.3% of GDP) in 2004.
On February 22, 2005, the Government announced a pilot program for selected investments endorsed by the International Monetary Fund, or IMF. The program contemplates the expenditure of approximately R$2.8 billion per year over three years (2005-2007) for infrastructure and other public projects that have the potential to provide macroeconomic and fiscal benefits in the medium term. During 2005, the Government intends to spend approximately R$2.1 billion on the construction and maintenance of roads as part of this pilot project.
D-80
Set forth below are the public sector borrowing requirements since 2000. In addition to the cash balance of the National Treasury, the public sector borrowing requirements include the borrowing requirements of public sector enterprises, the social security system, the Central Bank, States and municipalities and certain public funds.
Table No. 26
Public Sector Borrowing Requirements Historical Summary(1)
| | | | | | | | | | | | | | | |
| | | 2000
| | | 2001
| | | 2002
| | | 2003
| | | 2004
| |
Selected Economic Indicators(2) | | | | | | | | | | | | | | | |
Real GDP Growth (Decline) | | 4.4 | % | | 1.3 | % | | 1.9 | % | | 0.5 | % | | 4.9 | % |
Monetary Base (end of period) change | | (1.5 | ) | | 11.7 | | | 37.6 | | | (0.1 | ) | | 21.2 | |
Real interest rate(3) | | 6.9 | | | 6.3 | | | (5.7 | ) | | 14.6 | | | 3.7 | |
Implicit interest rate(4) | | 6.7 | | | 4.7 | | | (6.9 | ) | | 11.0 | | | 8.0 | |
Public Finance(5) | | | | | | | | | | | | | | | |
Financial result | | (3.6 | )% | | (3.5 | )% | | (4.3 | )% | | (5.1 | )% | | (2.7 | )% |
Primary result | | 3.5 | | | 3.7 | | | 4.0 | | | 4.3 | | | 4.6 | |
Real interest | | (4.7 | ) | | (4.7 | ) | | (1.5 | ) | | (7.1 | ) | | (3.2 | ) |
Domestic | | (3.8 | ) | | (3.5 | ) | | (0.2 | ) | | (5.9 | ) | | (2.2 | ) |
External | | (0.9 | ) | | (1.2 | ) | | (1.3 | ) | | (1.2 | ) | | (1.0 | ) |
Operational result | | (1.2 | ) | | (1.0 | ) | | 2.5 | | | (2.8 | ) | | 1.5 | |
Domestic financing | | (1.3 | ) | | (0.7 | ) | | 5.8 | | | (3.8 | ) | | (0.9 | ) |
External financing | | 0.0 | | | (1.2 | ) | | (1.8 | ) | | 1.0 | | | 2.4 | |
Issue of money | | 0.1 | | | (0.5 | ) | | (1.5 | ) | | 0.0 | | | 0.0 | |
| (2) | | Accumulated change from prior period. |
| (3) | | Accumulated change in the fiscal year, deflated by the IGP-DI. |
| (4) | | Implicit real interest rate on public sector internal debt of the fiscal year. |
| (5) | | All figures expressed as a percentage of GDP. |
Source: Central Bank
D-81
The table below shows the contributions of the federal Government, the State and local governments and public sector enterprises with regard to the PSBR.
Table No. 27
Public Sector Borrowing Requirements(1)(2) by Sector
| | | | | | | | | | | | | | | |
| | | % of
GDP
| | | % of
GDP
| | | % of
GDP
| | | % of
GDP
| | | % of
GDP
| |
Item
| | 2000(3)
| | | 2001(3)
| | | 2002(3)
| | | 2003(3)
| | | 2004(3)
| |
Total | | | | | | | | | | | | | | | |
Financial | | (3.6 | )% | | (3.5 | )% | | (4.3 | )% | | (5.1 | )% | | (2.7 | )% |
Primary | | 3.5 | | | 3.7 | | | 4.0 | | | 4.3 | | | 4.6 | |
Operational | | (1.2 | ) | | (1.0 | ) | | 2.5 | | | (2.8 | ) | | 1.5 | |
Federal Government | | | | | | | | | | | | | | | |
Financial | | (2.3 | ) | | (2.0 | ) | | (0.7 | ) | | (4.0 | ) | | (1.5 | ) |
Primary | | 1.9 | | | 1.9 | | | 2.5 | | | 2.5 | | | 3.0 | |
Operational | | (1.3 | ) | | (1.0 | ) | | 2.2 | | | (3.4 | ) | | 2.3 | |
State and Local Government | | | | | | | | | | | | | | | |
Financial | | (2.1 | ) | | (2.0 | ) | | (3.6 | ) | | (1.7 | ) | | (1.9 | ) |
Primary | | 0.6 | | | 0.9 | | | 0.8 | | | 0.9 | | | 1.0 | |
Operational | | (0.7 | ) | | (0.5 | ) | | 0.3 | | | (0.6 | ) | | 0.0 | |
Public Sector Enterprises | | | | | | | | | | | | | | | |
Financial | | 0.7 | | | 0.5 | | | (0.1 | ) | | 0.7 | | | 0.8 | |
Primary | | 1.1 | | | 0.9 | | | 0.7 | | | 0.9 | | | 0.6 | |
Operational | | 0.8 | | | 0.5 | | | (0.1 | ) | | 0.7 | | | 0.8 | |
| (1) | | Amounts calculated using the IGP-DI adjusted as of month-end. The figures for financial and operational results include the effect of the exchange rate on the stock of the securitized debt. |
| (3) | | Reflects the ratio of flows to GDP, both valued for the last month of the period, using IGP-DI. |
Source: Central Bank
Budget Process
The Government’s fiscal year is the calendar year. Responsibility for preparation of the federal budget rests with the executive branch, although the National Congress plays a major role in budget determinations. Based on discussions among representatives from the National Treasury of the Ministry of Finance and the Secretariat of Planning, Budget and Coordination (“Seplan”), Seplan prepares a budget proposal. After discussions among representatives of Seplan, the Treasury and each other Ministry, Seplan submits a formal proposal for the budget directives law (Lei de Diretrizes Orçamentárias or “LDO”) for the succeeding fiscal year to the President of the Republic. The President, in turn, submits the LDO proposal, with any revisions, to the National Congress. The LDO proposal with respect to the succeeding year must be submitted to Congress by April 15.
Congress may revise the LDO proposed by the President. Congress is charged by law to submit to the President the LDO as revised by June 30 and may not begin its winter recess until it does so. The LDO becomes effective immediately if Congress approves the presidential proposal without revision. If Congress alters any item of the proposal, the President may veto any provision of the revised LDO. All provisions that are not vetoed become effective upon presidential signature. Congress may override the veto by a two-thirds majority vote. If the veto is overridden, the provision becomes effective upon the override.
The executive branch is charged with submitting to Congress a detailed budget for the succeeding fiscal year that is consistent with the broad contours set forth in the LDO. Each ministry proposes a detailed budget
D-82
with respect to its operations, and Seplan meets with each ministry to discuss its proposal. Seplan finalizes a federal budget proposal, which it submits to the President, who may revise the proposal. The President is then required to submit the budget, as revised, to Congress by August 31.
Congress may revise some items in the President’s proposed budget. Congress may not, however, alter the items regarding payments on any external debt that the Republic has incurred. By December 15, Congress must submit to the President the budget, as revised, for the succeeding year.
The President is granted fifteen days to review and sign the budget. If the President signs the budget or a veto is overridden prior to the end of the year, the provisions that are not vetoed or for which the veto has been overridden become effective as of January 1 of the next year. After presidential signature, implementing decrees authorizing expenditures are generally issued within five to ten days, but certain expenditures are permitted to be made immediately.
The budgets for certain years, including years 1990 through 2000, have not been finally approved prior to January 1 of the year. In order to avoid a shutdown of the Government, the LDO typically authorizes the Government to use each month an amount equivalent to one-twelfth of the proposed annual expenditure included in the Government’s proposed budget pending before Congress. Constitutional Amendment No. 32, which became effective on September 12, 2001, prohibits, among other things, the issuance of provisional measures for, among other things, the implementation of multi-year plans and budgets. See “The Federative Republic of Brazil—Form of Government and Political Parties”.
2005 Budget
The 2005 budget bill was approved by the National Congress and signed by the President on January 25, 2005. However, the Planning Minister announced on February 25, 2005 that the Government would reduce budgeted 2005 expenditures by R$15.9 billion because of a projected R$10.8 billion shortfall in budgeted revenues.
The budget forecasts a primary surplus of R$45.3 billion (2.45% of GDP) based on estimated revenues and expenditures of R$457.4 billion and R$412.1 billion, respectively. The 2005 budget assumes an inflation rate of 5.9%.
The principal assumptions underlying the 2005 budget estimates are set forth below.
Table No. 28
Principal 2005 Budget Assumptions
| | | | |
| | | Year Ended December 31, 2005
| |
Gross Domestic Product | | | | |
Nominal GDP (billions of reais) | | R$ | 1,930 | |
Real GDP Growth | | | 4.3 | % |
Inflation | | | | |
Domestic Inflation (IPCA) | | | 5.9 | % |
Source: SEPLAN/Federal Budget Secretariat (SOF)
D-83
The following table sets forth revenues and expenditures of the Government in 2003 and 2004 and as projected in the 2005 budget.
Table No. 29
Primary Balance of the Central Government and 2005 Budget(1)
| | | | | | | | | | | | |
| | | Year Ended December 31
| | | 2005
Budget
| |
| | | 2003
| | | 2004
| | |
| | | (in billions of reais) | |
1—Total Revenues | | R$ | 357.9 | | | R$ | 422.5 | | | R$ | 457.4 | |
1.1—Treasury revenue | | | 277.2 | | | | 328.7 | | | | 349.7 | |
1.1.1—Administrative revenue | | | 289.7 | | | | 342.4 | | | | 302.3 | |
1.1.2—Refunds | | | (12.4 | ) | | | (13.7 | ) | | | N/A | |
1.1.3—Direct taxes | | | 0 | | | | 0 | | | | N/A | |
1.1.4—Other revenues | | | 0 | | | | 0 | | | | 47.7 | |
1.1.5—Fiscal incentives | | | (0.2 | ) | | | 0 | | | | (0.3 | ) |
1.2—Social security receipts | | | 80.7 | | | | 93.8 | | | | 107.7 | |
2—Total Expenditures | | | 318.0 | | | | 372.8 | | | | 412.1 | |
2.1—Treasury expenditures(2) | | | 210.9 | | | | 247.0 | | | | 274.5 | |
2.1.1—Transfers to States and municipalities | | | 60.2 | | | | 67.6 | | | | 69.9 | |
2.1.2—Expenditures of the Federal Administration(3) | | | 145.0 | | | | 173.8 | | | | 204.6 | |
2.1.3—Subsidies and subventions | | | 5.7 | | | | 5.6 | | | | N/A | |
2.2—Social security benefits | | | 107.1 | | | | 125.8 | | | | 137.6 | |
3—Primary Balance(4) | | | 39.9 | | | | 49.4 | | | | 45.3 | |
3.1—Federal Government result (1-2) | | | 39.8 | | | | 49.7 | | | | 45.3 | |
3.1.1—National Treasury (1.1-2.1) | | | 66.3 | | | | 81.7 | | | | 75.2 | |
3.1.2—Social security (1.2-2.2) | | | (26.4 | ) | | | (32.0 | ) | | | (29.9 | ) |
3.2—Central Bank result | | | (0.2 | ) | | | (0.3 | ) | | | N/A | |
4—Financing Requirement(5) | | | (38.7 | ) | | | (52.4 | ) | | | N/A | |
5—Errors and Omissions(5) | | | (1.0 | ) | | | N/A | | | | N/A | |
| (1) | | Consolidated accounts of the National Treasury, Social Security and the Central Bank. |
| (2) | | Calculated as the sum of transfers to States and municipalities, personnel costs and other expenditures. |
| (3) | | Calculated as the sum of personnel costs and other expenditures, minus subsidies and subventions. |
| (4) | | Above the line. Surplus/(deficit). |
| (5) | | (Surplus)/deficit below the line. |
Source: Ministry of Finance/National Treasury Secretariat and Central Bank
D-84
The following table sets forth the expenditures of the Government in the years indicated, by function. The figures in this table are not directly comparable with those set forth in the table above entitled “Primary Balance of the Central Government and 2005 Budget”, because the expenditures set forth in the table above were calculated in accordance with the IMF concept therefor, which does not include, among other things, debt service expenditures and certain financial investments.
Table No. 30
Expenditures of the National Treasury by Function
(in millions of dollars)(1)
| | | | | | | | | | | | | | | | | | |
| | | 2000
| | 2001
| | 2002
| | 2003
| | 2004
| | 2005(3)
Budget
|
Legislative | | $ | 961 | | $ | 892 | | $ | 1,031 | | $ | 1,010 | | $ | 1,208 | | $ | 1,602 |
Judiciary | | | 3,913 | | | 3,206 | | | 3,846 | | | 3,452 | | | 4,626 | | | 5,403 |
Administration and Planning | | | 3,602 | | | 3,075 | | | 3,429 | | | 3,069 | | | 3,054 | | | 4,526 |
Agriculture | | | 2,779 | | | 2,320 | | | 2,292 | | | 3,103 | | | 2,609 | | | 4,418 |
Communications | | | 220 | | | 193 | | | 236 | | | 348 | | | 169 | | | 366 |
National Defense and Public Security | | | 7,012 | | | 6,134 | | | 6,175 | | | 5,310 | | | 5,585 | | | 6,767 |
Regional Development | | | 0 | | | 0 | | | — | | | — | | | — | | | — |
Education, Culture and Citizenship Rights | | | 6,158 | | | 5,289 | | | 5,781 | | | 5,321 | | | 5,266 | | | 7,135 |
Energy and Mineral Resources | | | 287 | | | 307 | | | 3,258 | | | 737 | | | 135 | | | 288 |
Housing and Urban Planning | | | 983 | | | 359 | | | 256 | | | 417 | | | 574 | | | 1,280 |
Industry, Commerce and Services | | | 1,196 | | | 1,379 | | | 937 | | | 1,223 | | | 1,241 | | | 2,020 |
Foreign Affairs | | | 409 | | | 392 | | | 553 | | | 326 | | | 448 | | | 541 |
Health and Sanitation | | | 11,172 | | | 10,100 | | | 10,638 | | | 9,657 | | | 11,296 | | | 13,894 |
Labor | | | 3,416 | | | 3,149 | | | 3,533 | | | 2,833 | | | 3,659 | | | 4,577 |
Assistance and Social Security | | | 53,508 | | | 47,750 | | | 54,055 | | | 48,469 | | | 61,309 | | | 73,940 |
Transportation | | | 1,799 | | | 1,677 | | | 2,143 | | | 1,820 | | | 1,248 | | | 3,084 |
Environmental Management | | | 623 | | | 804 | | | 527 | | | 802 | | | 407 | | | 449 |
Science and Technology | | | 681 | | | 674 | | | 628 | | | 722 | | | 891 | | | 1,456 |
Agricultural Organization | | | 598 | | | 563 | | | 575 | | | 551 | | | 894 | | | 1,516 |
Sports and Leisure | | | 95 | | | 126 | | | 110 | | | 123 | | | 92 | | | 237 |
Special Charges | | | 237,649 | | | 166,960 | | | 181,219 | | | 260,890 | | | 205,993 | | | 463,033 |
Intergovernment Transfers | | | — | | | — | | | — | | | — | | | — | | | — |
Contingency Reserve | | | — | | | — | | | — | | | 7,076 | | | 0 | | | 8,144 |
| | |
|
| |
|
| |
|
| |
|
| |
|
| |
|
|
Total(2) | | $ | 337,060 | | $ | 255,347 | | $ | 281,220 | | $ | 357,261 | | $ | 310,413 | | $ | 604,688 |
| | |
|
| |
|
| |
|
| |
|
| |
|
| |
|
|
| (1) | | Converted to U.S. dollars using the annual average commercial exchange rate (sell side). |
| (2) | | Total expenditures in this table are those reflected in the accounts of the Ministry of Finance, which treats certain expenditures as having been incurred when committed even though the corresponding amounts are disbursed in a later year. |
| (3) | | Estimates. Source: General Budget of the Republic—Secretariat of Budget and Finance. |
Source: Federal General Balance Sheet—Ministry of Finance
Taxation and Revenue Sharing Systems
The Constitution authorizes the levying and collection of taxes by the taxing authorities of federal, State and municipal governments, and mandates that the federal Government share a portion of its tax revenues with the States, municipalities and other institutions. The federal Government collects taxes on personal and corporate income, IPI, a rural property tax (“ITR”), IOF, certain mandatory contributions to the social security system from
D-85
legal entities, employers and employees, and import and export tariffs. Municipalities and the Federal District collect taxes on urban property, transfers of property rights and services.
Income Taxation. For corporate and other legal entities: (i) the basic tax is 15%, while the surtax on taxable net income exceeding R$240,000 is 10%; (ii) the tax related to social welfare levied on net profit is 8% with respect to enterprises in general, and 18% in the case of financial institutions; (iii) the deductions related to benefits granted to employees are prohibited in the calculation of taxable net income; (iv) only operating expenses directly related to the business of the enterprise are allowed to be deducted; (v) with respect to profits earned by foreigners, the tax levied on passive investment income is 15%; (vi) taxes on capital gains and loan interest is 15%; (vii) profits from operations and dividends are exempt from taxation as are gains attributable to the increase in market value of traded securities, consistent with rules applicable to Brazilian citizens; (viii) income earned by Brazilian enterprises abroad must be included in the calculation of taxable income of the enterprise in Brazil, and taxes paid abroad may be credited toward the tax paid in Brazil; and (ix) the tax levied on the nominal yield from financial investments in fixed income is 15%, while variable income is taxed at the rate of 10%.
The tax rate for interest payments remitted abroad in respect of loans is 15%. The tax rate for equity proceeds is 20%, and there is a tax of 1% on day trading operations executed in the country’s stock market.
For individual taxpayers, income tax rates range from 0% for persons making R$12,696 or less per year to 27.5% for persons making more than R$25,380 per year. For individuals making from R$12,696 to R$25,380 per year, the income tax rate is 15%. Deductions are allowed for certain contributions to private social security (but payments therefrom are considered income), medical, dental and educational expenses, in addition to a fixed amount of R$1,272 per dependent. Income from the Brazilian Government or its instrumentalities is subject to taxation.
On August 6, 2004, President da Silva issued Provisional Measure No. 206 (subsequently enacted as Law No. 11,033 dated December 21, 2004), which is intended to promote long-term domestic savings. The provisional measure introduced a sliding scale, effective January 1, 2005, for taxation of capital gains from fixed-income investments ranging from 22.5% for those held up to six months to 15% for those held for more than two years. The legislation also reduces the capital gains tax on equity investments to 15% from 20%.
On August 29, 2004, President da Silva issued Provisional Measure No. 209 (which was subsequently enacted as Law No. 11,053 dated December 29, 2004), also intended to promote long-term domestic savings. The provisional measure introduces, as of January 1, 2005, a set of graduated tax rates for certain pension fund, life insurance and other pre-funded investment schemes based on the length of time the investor holds such investments. The tax rates vary from 35% for investments held for less than two years to 10% for investments held for more than ten years. By holding such investments for more than ten years, an investor would be able to reduce the taxation on the earnings received in respect of such investments, i.e., at rates below the 15% to 27.5% rates assessed on ordinary income.
Value Added and Other Taxes. The federal value added tax on manufactured products is levied at scheduled rates at each stage of the production and distribution process. Import and export tariffs are based on published tariff schedules. See “The Brazilian Economy—Historical Background”.
Under Decree No. 4,494 dated December 3, 2002, the IOF tax applies to foreign currency conversion transactions at a rate of (i) 2% when the converted funds are destined to the payment of obligations due by credit card companies or banks, as credit card issuers, in connection with the acquisition of goods and services performed by their clients abroad (except if the client is the federal Government, States, municipalities, Federal District or any of their foundations or autonomous government entities, in which case the rate is 0%); (ii) 5% for loans having a tenor of 90 days or less; and (iii) 0% in all other foreign currency conversion transactions.
D-86
The IOF tax is also levied on domestic financial market transactions, including loans, gold, securities transactions and insurance payments. In addition, gains on certain financial transactions are also subject to taxation when the gain is realized and withdrawn from the financial system. Such gains are included as taxable income for annual reporting purposes, and the transactions must be disclosed on the taxpayer’s annual tax return.
On September 13, 1996, in a further effort to liberalize the export sector and to stimulate growth, the federal Government approved the elimination of the ICMS on exports of primary and semi-finished goods and on the acquisition of certain fixed assets. The federal Government intends to reimburse States for loss of ICMS revenues for periods ranging from 6 to 10 years. See “Balance of Payments and Foreign Trade—Foreign Trade”.
To promote greater fixed investment, on August 6, 2004, President da Silva issued Decree No. 5,173, which reduced the industrialized products tax (IPI) on capital goods from 3.5% to 2% and increased the number of goods exempt from the tax. On August 6, 2004, President da Silva also issued Decree No. 5,172, which will gradually reduce and eventually eliminate the 7% tax on health and personal insurance plans.
Social Contributions. Business entities are required to make three “contributions” to social welfare funds. First, corporations (including financial institutions) must make a social contribution of 9% of monthly net profits (known as the Contribução sobre Lucro Liquido or CSLL). Second, corporations must contribute 7.6% of monthly corporate billings to COFINS, while financial institutions must contribute 4.0%. Third, corporations must contribute 1.65% of billings to finance other social programs, including unemployment programs (known by their acronym, “PIS/PASEP”). Financial institutions must contribute 0.65% of gross operating revenue to PIS/PASEP. Other sources of funding for social programs include progressively graduated social security taxes that are shared by employers and their employees.
Law No. 10,637 dated December 30, 2002, Law No. 10,833 dated December 29, 2003 and Law No. 10,865 dated April 30, 2004 related to contributions produced important consequences for federal revenues in 2004. See “The Brazilian Economy—Constitutional Reform”. These changes generally require contributions only at the final stage of the production process, rather than at each stage. The changes also increase the percentages imposed on specific sectors and require contributions for goods and services imports. This set of measures raised federal revenues in 2004 by approximately 17% of GDP. The contribution with the largest growth was COFINS, whose revenues grew 28.6% in 2004. Revenues from PIS/PASEP increased 11.8% in 2004 compared to 2003.
Revenue Sharing. The Constitution mandates the distribution to, or sharing with, the States, municipalities and regions of certain types of taxes collected by the federal Government. The municipalities are entitled to: (i) funds derived from withholding tax levied on payments made, in any way, by the municipalities, including autonomous entities and foundations thereof, (ii) 50.0% of the revenues from automobile property taxes, (iii) 25.0% of the ICMS, and (iv) 50.0% of the tax on rural property. The States are entitled to funds derived from withholding tax levied on payments made, in any way, by the States, including autonomous entities and foundations thereof.
The federal Government is required to transfer 47.0% of the proceeds from the IPI and the income tax as follows: (i) 21.5% to the States and Federal District Participation Funds, (ii) 22.5% to the Municipality Participation Fund and (iii) 3% to the financing programs for the productive sector in the North, Northeast and Central West Regions. The federal Government must transfer another 10.0% of the proceeds of the IPI to the States and Federal District ratably in proportion to their respective exports of manufactured products; the States must transfer 25.0% of these amounts to the municipalities. In addition, the federal Government must transfer to States and municipalities 25% of the revenues from the federal contribution on fuel (CIDE).
All of the revenues derived from IOF levied on transactions in gold as a financial asset are distributed with 70.0% allocated to the municipalities and 30.0% allocated to the States, Federal District or federal territory of origin.
D-87
The federal Government must dedicate at least 18.0% of annual tax revenues to education, and the municipalities, States and Federal District must invest at least 25.0% of their annual revenues in this area.
Under Constitutional Amendment No. 27 of March 21, 2000, which became effective on March 22, 2000, the Government is permitted to reallocate through 2003 20% of certain tax revenues that the Government would otherwise be required to devote to specific program areas under the Constitution. The amendment created the Delinking of Central Government Revenues (“DRU”), which applies to social security contributions made by employees in the private sector. Constitutional Amendment No. 42 dated December 19, 2003 extended the DRU until 2007.
Fiscal Responsibility Law and Fiscal Crime Law
On May 4, 2000 the Government enacted the Fiscal Responsibility Law, which introduces a modern financial-oriented approach designed to replace the inflationary financing and debt accumulation that had prevailed in the past. The law sets forth fundamental principles and directives of public finances and establishes a comprehensive framework intended to eliminate fiscal imbalances. The law applies to each level of government, as well as to government-controlled funds, semi-autonomous entities and public sector companies.
The Fiscal Responsibility Law provides for, among other things:
| | • | | Limitations on personnel expenditures as a percentage of net current revenues to 50% for the federal Government, 60% for the States, and 60% for municipalities. Total personnel expenditures include expenditures for active and retired civil servants and military personnel, pensioners, elected officials, appointed members, commissioned or employed staff, administration members receiving any remuneration, such as a salary, fixed and variable supplemental payments, subsidies, retirement, reform and pension payments, including additional gratuities, overtime payments and personal supplemental payments of any kind, social security contributions and contributions to pension entities. |
| | • | | Ceilings for public sector debt for the federal Government, States and municipalities, which are to be verified every four months. The law requires the President to submit to the National Congress, within 90 days of the law’s enactment, proposals for global limits for the consolidated debt at each level of government. The proposals are required to include (a) an explanation demonstrating that the global limits and conditions comply with provisions of the Fiscal Responsibility Law and with fiscal policy objectives, (b) estimates of the impact of the limits on the three levels of government, (c) the reasons for any proposal of different ceilings for each level of government and (d) the methodologies for calculating primary and nominal fiscal results. Payments in respect of judicial awards (precatórios) not made during the budget execution are required to be included as consolidated debt. |
| | • | | Regulation of the “golden rule”, which establishes that the volume of credit operations cannot exceed capital expenditures. Tax concessions have to be accompanied by estimates of their budget and financial impact in the budget year and in the two following years and included in the budget directives law (“LDO”). The proposing entity must also indicate that compensatory revenues exist. Increases in expenditures have to be accompanied by estimates of their budgetary and financial impact in the year in which they are first incurred and in the two following years, and by a declaration from the proposing entity stating that such increases are in compliance with multi-year plan (“PPA”), LDO and annual budget. |
| | • | | Strengthening of the budgetary process as a planning instrument, with bi-monthly evaluations of fiscal targets for five key variables: revenues, expenditures, nominal and primary fiscal results and public sector debt. Non-compliance with bi-monthly targets for nominal and primary results will trigger automatic cuts in expenditure authorizations and in financial transactions separately at each level of government. |
| | • | | Imposes strict rules for controlling revenue anticipation loans; concession of guarantees; and remnant payments. New loan operations will not be authorized if ceilings on public sector debt are exceeded, |
D-88
| | except for refinancings of existing debt. Ceilings on personnel expenditures are to be verified every four months and, if exceeded, expenditure reduction measures will be triggered automatically. If such ceilings are exceeded by 95% or more, pay raises, new hiring and personnel related expenditures will be suspended. Courts specialized in the review of public accounts are to advise administrations of actual and potential noncompliance with the Fiscal Responsibility Law. |
| | • | | A requirement that periodic evaluations reported in the fiscal risks annex contain information on financial and actuarial status of social security and Workers Support Fund (“FAT”), other public funds and programs of an actuarial nature, and overall contingent liabilities and other risks associated to public finances. The federal Government is also required to present projections for key economic variables and the targets for inflation. |
| | • | | The tightening of compliance requirements for outgoing officeholders. Debt renegotiations and rollovers are strictly forbidden during an incumbent’s final year in office. |
| | • | | A prohibition against the Central Bank issuing its own securities. The Central Bank’s debt securities are also included in the limits for federal Government debt. The Fiscal Responsibility Law contains provisions that are intended to make Central Bank’s operations more transparent, which include the obligation to present detailed reports. Sanctions for irresponsible behavior and mismanagement are to be established along with civil and criminal penalties in the Fiscal Crime Law. |
Exceptions under the Fiscal Responsibility Law are severely limited. Limits on public sector debt and on credit operations will be revised upon request by the President in the case of economic instability and monetary and foreign exchange shocks. Deadlines to reestablish equilibrium will be extended in the case of lackluster economic growth. In case of an officially recognized state of emergency, the limits will be temporarily suspended. Fiscal target annexes will be required to account for sources, and funds obtained from sale of public assets will be prohibited from being used to finance current expenditures, except expenditures related to social security.
In December 2001, in accordance with the Fiscal Responsibility Law, Senate Resolution No. 40 dated December 20, 2001 defined the global limits for the consolidated net indebtedness of States and municipalities. Under Senate Resolution No. 40, a State’s debt cannot be higher than 200% of its net current revenue and a municipality’s debt cannot exceed 120% of its net current revenue. Senate Resolution No. 40 also establishes mechanisms for annual reductions of indebtedness exceeding such limits.
On October 11, 2000, the Brazilian Senate approved legislation known as the Fiscal Crime Law. The legislation amends Brazil’s Penal Code (Decree Law No. 2,848 of December 7, 1940) and certain other laws to provide penalties for, among other things, the execution of credit operations in excess of authorized limits, the ordering of expenditures not authorized by law and administrative infractions of public finance laws. The legislation, which was approved by the Chamber of Deputies on May 17, 2000, was enacted on October 19, 2000. The Fiscal Crime Law is a complement to the Fiscal Responsibility Law.
D-89
PUBLIC DEBT
General
Public sector debt in Brazil consists of the internal and external debt of the federal Government (including the Central Bank), State and local governments and public sector enterprises. Pursuant to the Constitution, the Brazilian Senate is vested with powers to establish, at the request of the President, (i) global limits for the consolidated debt of the federal Government, States and municipalities, (ii) the terms and conditions of the internal and external financial transactions of the Government, including public sector enterprises, at all levels of government, and (iii) the terms and conditions for guarantees of the federal Government of any internal or external financial transaction. In addition, all external financial transactions entered into at any level of government must be authorized by the Senate.
The aggregate amount of consolidated gross public sector debt was $409.4 billion in 2000 but dropped to $402.8 billion in 2001 and $336.9 billion in 2002. The consolidated gross public sector debt rose to $431.9 billion in 2003 and $501.9 billion in 2004. The consolidated gross public sector debt as a percentage of GDP was 80.3% in 2003 and 72.1% in 2004. The consolidated net public sector debt declined from $288.0 billion in 2000 to $284.7 billion in 2001 and $249.4 billion in 2002 before rising to $316.1 billion in 2003 and to $360.6 billion in 2004. Consolidated net public sector debt as a percentage of GDP rose from 48.7% in 2000 to 52.6% in 2001, 55.5% in 2002 and 58.7% in 2003 before falling to 51.8% in 2004.
The gross debt of the federal Government was $370.2 (or 62.7% of GDP) in 2000. In 2001 and 2002, gross debt of the federal Government declined to $367.1 billion and $307.4 billion respectively, but, as a percentage of GDP, rose to 67.8% and 68.4%, respectively. In 2003, gross debt of the federal Government rose again to $397.9 (or 73.9% of GDP) and reached $487.4 billion in 2004 (or 70.0% of GDP). The gross debt of State and local governments fell from $112.1 billion (or 19% of GDP) in 2000 to $110.7 billion (or 20.4% of GDP) in 2001 and $90.3 billion (or 20.1% of GDP) in 2002 before rising to $118.3 (or 22.0% of GDP) in 2003 and $142.6 billion (or 20.5% of GDP) in 2004. The gross debt of public sector enterprises rose $25.8 billion (or 4.4% of GDP) in 2000 to $33.1 billion (or 6.1% of GDP) in 2001. The gross debt of public sector enterprises dropped to $21.8 billion (or 4.9% of GDP) in 2002 but rose again to $25.7 billion (or 4.8% of GDP) in 2003 and $33.3 billion (or 4.8% of GDP) in 2004.
Since December 31, 1993, the debt profile of the Republic has been substantially altered due to the Brady Plan restructuring of Brazil’s external debt in April 1994. Following that restructuring, the maturity profile of Brazil’s public sector external debt was substantially lengthened, from an average of 6.9 years on December 31, 1993 to an average of 8.8 years on December 31, 1996. The average maturity of Brazil’s public sector external debt was 9.8 years on December 31, 2000 and 8.9 years on December 31, 2001. The average maturity fell to 7.7 years on December 31, 2002 and 7.3 years on December 31, 2003 and rose to 7.5 years in 2004. In 2001, 2002, 2003 and 2004, consolidated public sector registered external debt stood at $103.4 billion (or 20.5% of GDP), $121.1 billion (or 27.4% of GDP), $131.4 billion (or 26.6% of GDP) and $125.3 billion (or 20.7% of GDP), respectively. Interest and principal payments in respect of that debt amounted to approximately $16.8 billion, or 28.8% of exports, in 2001, approximately $20.7 billion, or 34.2% of exports, in 2002, approximately $33.8 billion, or 46.2% of exports, in 2003 and approximately $26.3 billion, or 27.3% of exports, in 2004. On December 31, 2004, consolidated net public sector external debt was $52.4 billion.
D-90
The following table sets forth the consolidated gross and net debt of the public sector for each of the periods indicated.
Table No. 31
Public Sector Debt
| | | | | | | | | | | | | | | | | | | | | | | | | | | | | | | | | | | |
| | | 2000
| | | As a % of GDP
| | | 2001
| | | As a % of GDP
| | | 2002
| | | As a % of GDP
| | | 2003
| | | As a % of GDP
| | | 2004
| | | As a % of GDP
| |
| | | (in millions of dollars, except percentages) | |
Consolidated Gross Public Sector Debt* | | $ | 409,399 | | | 69.3 | | | $ | 402,770 | | | 74.4 | | | $ | 336,909 | | | 75.0 | | | $ | 431,928 | | | 80.3 | | | $ | 501,869 | | | 72.1 | |
Internal(1) | | | 322,684 | | | 54.6 | | | | 319,905 | | | 59.1 | | | | 255,964 | | | 57.0 | | | | 347,124 | | | 64.5 | | | | 418.770 | | | 60.1 | |
External(2) | | | 86,715 | | | 14.7 | | | | 82,865 | | | 15.3 | | | | 80,945 | | | 18.0 | | | | 84,804 | | | 15.8 | | | | 83,099 | | | 11.9 | |
By Sector | | | | | | | | | | | | | | | | | | | | | | | | | | | | | | | | | | | |
Federal Government and Central Bank Gross Debt | | | 370,163 | | | 62.7 | | | | 367,129 | | | 67.8 | | | | 307,367 | | | 68.4 | | | | 397,935 | | | 73.9 | | | | 487,354 | | | 70.0 | |
Internal | | | 296,710 | | | 50.2 | | | | 296,159 | | | 54.7 | | | | 234,690 | | | 52.2 | | | | 322,195 | | | 59.9 | | | | 385,881 | | | 55.4 | |
Securities Debt | | | 250,286 | | | 42.4 | | | | 256,634 | | | 47.4 | | | | 191,679 | | | 42.6 | | | | 268,570 | | | 49.9 | | | | 317,039 | | | 45.5 | |
Other debt(3) | | | 46,424 | | | 7.9 | | | | 39,526 | | | 7.3 | | | | 43,011 | | | 9.6 | | | | 53,625 | | | 10.0 | | | | 68,842 | | | 9.9 | |
External | | | 73,453 | | | 12.4 | | | | 70,970 | | | 13.1 | | | | 72,677 | | | 16.2 | | | | 75,740 | | | 14.1 | | | | 101,473 | | | 14.6 | |
Credits | | | (189,580 | ) | | (32.1 | ) | | | (189,611 | ) | | (35.0 | ) | | | (148,605 | ) | | (33.1 | ) | | | (197,565 | ) | | (36.7 | ) | | | (282,938 | ) | | (40.6 | ) |
Internal | | | (159,816 | ) | | (27.1 | ) | | | (163,154 | ) | | (30.1 | ) | | | (131,863 | ) | | (29.3 | ) | | | (177,315 | ) | | (32.9 | ) | | | (228,616 | ) | | (32.8 | ) |
Public Sector(4) | | | (85,662 | ) | | (14.5 | ) | | | (95,011 | ) | | (17.6 | ) | | | (77,643 | ) | | (17.3 | ) | | | (101,116 | ) | | (18.8 | ) | | | (141,167 | ) | | (20.3 | ) |
Other(5)(6) | | | (74,154 | ) | | (12.6 | ) | | | (68,143 | ) | | (12.6 | ) | | | (54,220 | ) | | (12.1 | ) | | | (76,199 | ) | | (14.2 | ) | | | (87,448 | ) | | (12.6 | ) |
External(7) | | | (29,764 | ) | | (5.0 | ) | | | (26,457 | ) | | (4.9 | ) | | | (16,742 | ) | | (3.7 | ) | | | (20,250 | ) | | (3.8 | ) | | | (54,322 | ) | | (7.8 | ) |
State and Local Government Gross Debt | | | 112,095 | | | 19.0 | | | | 110,677 | | | 20.4 | | | | 90,284 | | | 20.1 | | | | 118,343 | | | 22.0 | | | | 142,641 | | | 20.5 | |
Internal | | | 106,437 | | | 18.0 | | | | 105,057 | | | 19.4 | | | | 84,252 | | | 18.7 | | | | 111,753 | | | 20.8 | | | | 135,620 | | | 19.5 | |
External | | | 5,658 | | | 1.0 | | | | 5,620 | | | 1.0 | | | | 6,032 | | | 1.3 | | | | 6,590 | | | 1.2 | | | | 7,021 | | | 1.0 | |
Credits | | | (17,256 | ) | | (2.9 | ) | | | (11,709 | ) | | (2.2 | ) | | | (7,346 | ) | | (1.6 | ) | | | (8,691 | ) | | (1.6 | ) | | | (10,345 | ) | | (1.5 | ) |
Internal | | | (17,256 | ) | | (2.9 | ) | | | (11,709 | ) | | (2.2 | ) | | | (7,346 | ) | | (1.6 | ) | | | (8,691 | ) | | (1.6 | ) | | | (10,345 | ) | | (1.5 | ) |
Public Sector(8)(9) | | | 0 | | | 0.0 | | | | 0 | | | 0.0 | | | | 0 | | | 0.0 | | | | 0 | | | 0.0 | | | | 0 | | | 0.0 | |
Other(6) | | | (17,256 | ) | | (2.9 | ) | | | (11,709 | ) | | (2.2 | ) | | | (7,346 | ) | | (1.6 | ) | | | (8,691 | ) | | (1.6 | ) | | | (10,345 | ) | | (1.5 | ) |
External(7) | | | 0 | | | 0.0 | | | | 0 | | | 0.0 | | | | 0 | | | 0.0 | | | | 0 | | | 0.0 | | | | 0 | | | 0.0 | |
Public Sector Enterprises Gross Debt | | | 25,829 | | | 4.4 | | | | 33,080 | | | 6.1 | | | | 21,806 | | | 4.9 | | | | 25,735 | | | 4.8 | | | | 33,311 | | | 4.8 | |
Internal | | | 18,225 | | | 3.1 | | | | 26,805 | | | 5.0 | | | | 19,570 | | | 4.4 | | | | 23,261 | | | 4.3 | | | | 24,341 | | | 3.5 | |
External | | | 7,604 | | | 1.3 | | | | 6,275 | | | 1.2 | | | | 2,236 | | | 0.5 | | | | 2,474 | | | 0.5 | | | | 8,969 | | | 1.3 | |
Credits | | | (13,301 | ) | | (2.3 | ) | | | (24,824 | ) | | (4.6 | ) | | | (14,077 | ) | | (3.1 | ) | | | (19,615 | ) | | (3.6 | ) | | | (31,630 | ) | | (4.5 | ) |
Internal | | | (13,301 | ) | | (2.3 | ) | | | (24,824 | ) | | (4.6 | ) | | | (14,077 | ) | | (3.1 | ) | | | (19,615 | ) | | (3.6 | ) | | | (20,845 | ) | | (3.0 | ) |
Public Sector(10) | | | (13,026 | ) | | (2.2 | ) | | | (13,105 | ) | | (2.4 | ) | | | (4,905 | ) | | (1.1 | ) | | | (8,969 | ) | | (1.7 | ) | | | (7,679 | ) | | (1.1 | ) |
Others(6)(11) | | | (275 | ) | | 0.0 | | | | (11,719 | ) | | (2.2 | ) | | | (9,172 | ) | | (2.0 | ) | | | (10,646 | ) | | (2.0 | ) | | | (13,166 | ) | | (1.9 | ) |
External(12) | | | 0 | | | 0.0 | | | | 0 | | | 0.0 | | | | 0 | | | 0.0 | | | | 0 | | | 0.0 | | | | (10,785 | ) | | (1.5 | ) |
Net Public Sector Debt(13) | | | 287,950 | | | 48.7 | | | | 284,742 | | | 52.6 | | | | 249,429 | | | 55.5 | | | | 316,142 | | | 58.7 | | | | 360,640 | | | 51.8 | |
Internal | | | 230,999 | | | 39.1 | | | | 228,333 | | | 42.2 | | | | 185,226 | | | 41.2 | | | | 251,588 | | | 46.7 | | | | 308,285 | | | 44.3 | |
External | | | 56,951 | | | 9.6 | | | | 56,408 | | | 10.4 | | | | 64,203 | | | 14.3 | | | | 64,554 | | | 12.0 | | | | 52,355 | | | 7.5 | |
| * | | Consolidated gross public sector debt, as presented in this table, does not consolidate debts between public sector entities. This table does not include liabilities related to the FCVS program. See “—Housing Compensation Fund for Salary Fluctuation (Fundo de Compensação de Variações Salariais)”. |
| (1) | | Total domestic debt of federal, State and local government less public sector internal credits. |
| (2) | | Total external debt of the federal, State and local government, including short-term debt obligations. |
| (3) | | Includes monetary base, other deposits of the financial system with the Central Bank and federal securities that can be used in the national privatization program. See “—Domestic Privatization Currencies”. |
| (4) | | Debt securities issued by State and local governments, debt of States and municipalities issued under Resolution 8,727 of 1993 and credits from the Central Bank to State banks. |
D-91
| (5) | | Monetary reserves invested in overnight deposits, net banking debt, taxes receivable, social security, other accounts, FAT-BNDES and credits from the Central Bank to financial institutions. |
| (6) | | Other internal credits consist primarily of deposits at private sector financial institutions. |
| (7) | | External credits are equivalent to the federal Government’s international reserves. The external credits of the federal Government and the Central Bank do not include collateral acquired in connection with the April 1994 debt restructuring. |
| (8) | | Internal public sector credits owed by other public sector entities. These amounts are consolidated into the consolidated gross public sector debt amounts above. |
| (9) | | Taxes receivable and demand deposits. |
| (10) | | Investments in public securities and short-term investments in public enterprises. |
| (12) | | External credit available. |
| (13) | | Net public sector debt is consolidated gross public sector debt less aggregate credits of the federal Government and the Central Bank, State and local governments and public sector enterprises (excluding internal public sector credits that have been excluded from the calculation of consolidated gross public sector debt). |
Source: Central Bank
Federal Domestic Securities Debt
The following table shows the outstanding consolidated federal internal debt in the form of government bills and notes for the periods indicated.
Table No. 32
Consolidated Federal Internal Securities Debt(1)
| | | | | | | | | |
| | | National
Treasury
Liabilities
| | Central Bank
Liabilities
| | Total
| | Real Change
For Period(2)
| |
| | | (in millions of dollars) | |
2000 | | 221,029 | | 42,914 | | 263,943 | | 13.6 | |
2001 | | 212,437 | | 52,596 | | 265,033 | | 8.1 | |
2002 | | 180,006 | | 18,898 | | 198,904 | | (10.5 | ) |
2003 | | 265,493 | | 10,611 | | 276,104 | | 5.4 | |
2004 | | 322,558 | | 5,072 | | 327,630 | | (2.5 | ) |
| (1) | | Securities issued by the federal Government to finance its current deficits and by the Central Bank for its open market operations. Data are for end of period and include securitized debt and securitizations under the FCVS program. See “—Housing Compensation Fund for Salary Fluctuation (Fundo de Compensação de Variações Salariais)”. |
| (2) | | Deflated by IGP-DI centered at the end of the month. |
Source: Central Bank
The aggregate amount of the federal domestic securities debt held outside the Central Bank rose from $198.9 billion on December 31, 2002 to $276.1 billion on December 31, 2003 and to $327.6 billion on December 31, 2004, representing 43.2% of GDP, 54.5% of GDP and 54.2% of GDP, respectively.
A portion of the federal Government’s federal domestic securities debt is indexed to inflation indices or foreign currencies. On December 31, 2004, Brazil’s floating rate domestic securities debt totaled approximately R$625.5 billion (77.2% of all federal debt securities). A significant percentage of this debt was indexed to the U.S. dollar; the percentage of Brazil’s domestic debt securities that was indexed to the U.S. dollar was 22.3% in December 2000, 28.6% in December 2001, 22.4% in December 2002, 10.8% in December 2003 and 5.2% in December 2004. On April 30, 2005, Brazil’s U.S. dollar-indexed domestic securities debt totaled approximately
D-92
R$34.5 billion (4.0% of all federal debt securities). By contrast, the aggregate principal amount of the federal debt securities indexed to the Over/Selic rate rose from R$449.0 billion (61.4% of all federal debt securities) on December 31, 2003 to R$463.0 billion (57.1% of all federal debt securities) on December 31, 2004 and R$517.0 billion (59.2% of all federal debt securities) on April 30, 2005, while fixed rate federal debt securities increased from R$104.6 billion (14.3% of all federal debt securities) on December 31, 2003 to R$184.8 billion (22.8% of all federal debt securities) on December 31, 2004 and R$199.1 billion (22.8% of all federal debt securities) on April 30, 2005.
In April 2005, the average tenor of Brazil’s domestic debt securities was 27.9 months, a reduction from the average tenor of 33.2 months in December 2002 and 31.3 months in December 2003. In 2003 and 2004, Brazil’s effort to reduce its vulnerability to external shocks by increasing its issuance of fixed-rate debt securities contributed to a further reduction of the average maturity of the Republic’s domestic debt securities, because Brazil’s fixed-rate debt securities tend to be short-term securities. Of the R$873.8 billion in domestic debt securities outstanding on April 30, 2005, 42.9% were scheduled to mature on or before April 30, 2006.
On November 4, 1999, the Government announced a set of measures intended to simplify Brazil’s domestic securities market and to increase the liquidity of public sector debt securities. The proposed reforms include, among other things, a reduction in the number of maturities of government securities in the market, a reduction in the frequency of public offerings, an increase in the size of issues of long-term fixed-rate securities, the issuance by the Government of zero-coupon dollar-indexed securities and arrangements for the separate trading of the principal and interest components of such securities having a maturity of less than five years and the issuance of government debt securities in the SELIC book-entry system, with settlement of trades on the business day following the trade date.
Domestic Privatization Currencies
In addition to federal domestic securities debt in the form of bills and notes issued by the National Treasury or the Central Bank, the federal Government from time to time has issued securities that may be redeemed at face value in connection with the privatization of Government assets (“Privatization Currencies”). Privatization Currencies include, among others, Siderbrás debentures, Eletrobrás securitized credits and various credits extended to the agricultural sector. The aggregate amount of Privatization Currencies outstanding and not yet utilized for privatization purchases as of December 31, 2002 was R$23.2 billion. In addition, the FCVS securities proposed to be issued under Provisional Measure No. 1,520 are eligible for use as a domestic privatization currency. See “—Housing Compensation Fund for Salary Fluctuation (Fundo de Compensação de Variações Salariais)”. However, the Government has not permitted the use of Privatization Currencies in recent privatizations.
Housing Compensation Fund for Salary Fluctuation (Fundo de Compensação de Variações Salariais)
Beginning in 1967, the Brazilian Government introduced a series of measures designed to provide subsidies to homeowners to address the effects of high inflation on mortgage rates. These subsidies were implemented in the form of the so-called Fundo de Compensação de Variações Salariais (“FCVS”), which was used to provide mortgage lenders in Brazil with a credit in an amount equal to the difference between the lender’s actual cost of funds and the amounts that the mortgagor/borrower was legally obligated to pay under the terms of his mortgage. Under the FCVS program, the mortgagor/borrower was absolved of the responsibility to pay the amount guaranteed by the Government, and the lending institution recorded as an asset the amount of the FCVS subsidy receivable. The FCVS program has not covered any mortgages entered into after March 1990. The aggregate amount of the FCVS subsidy constitutes a liability of the Government; the FCVS subsidy is not accounted for as borrowed money and, therefore, is not reflected in the amount of the Republic’s outstanding domestic public indebtedness. Although the macroeconomic effects of the FCVS subsidies (among others, the expansion of credit in the housing market and the continued growth of the housing sector) were largely absorbed by the Brazilian economy during the periods of high inflation during which the FCVS subsidy accumulated, a number of Brazilian financial institutions now hold large, illiquid stocks of FCVS assets (which, in turn, represent a liability of the Government on account of the subsidy).
D-93
In furtherance of the Plano Real’s goals of restructuring the monetary and fiscal policies of the Government to ensure long-term economic stability and growth, the Government announced, in September 1996, a plan to issue securities in exchange for the accumulated liability attributable to the FCVS subsidy. This measure is intended to provide financial institutions holding FCVS assets with an opportunity to exchange such assets for newly issued, liquid, government securities.
The liability of the Government for the FCVS subsidy falls into two categories: (i) FCVS liabilities that relate to mortgages on which no further contractual payments are outstanding and which, therefore, are determinate as to principal amount (“determinate FCVS liabilities”); and (ii) potential FCVS liabilities that relate to mortgages on which additional contractual payments are due and under which additional FCVS liabilities may continue to accrue (“potential FCVS liabilities”). As of December 31, 2001, the Government had estimated that the aggregate amount of determinate FCVS liabilities would not exceed R$62.6 billion (of which R$46.1 billion is claimed as due and payable by the financial institutions receiving such credits and R$20.3 billion is claimed as payable but not yet due). The amount of the additional potential FCVS liabilities on outstanding mortgages is the subject of a Government audit and cannot be reliably estimated before such audit is substantially complete. Under the original FCVS program, the amounts payable thereunder accrued interest at an average rate of approximately TR+9.5% per annum. The Government plans to implement measures which are designed to reduce its FCVS liabilities generally by instituting auditing and verification procedures to ensure compliance with FCVS program requirements. In addition, the Government’s proposal includes steps intended to reduce significantly its exposure for potential FCVS liabilities by offering incentives to homeowners to prepay FCVS loans, and by reducing the rate of interest payable on FCVS obligations.
The Government’s FCVS initiative, as set forth in Law No. 10,150 of December 21, 2000, provides that all properly audited FCVS claims can be exchanged for one of two new 30-year Government debt securities denominated in reais, one paying interest at a rate of TR+3.12% per annum and exchangeable for FCVS credits funded by housing finance institutions with resources made available through another Government program, the Time-in-Service Guarantee Fund (FGTS), and the second paying interest at a rate of TR+6.17% per annum and exchangeable for FCVS credits funded by financial institutions with savings deposits. The interest rates on the two new types of securities reflect the interest rates payable by financial institutions on FGTS funds and on savings deposits, respectively. The average rate of interest on such new securities would be approximately TR+5.1%, representing a significant reduction from the average rate of interest applicable to the existing FCVS liabilities. The new securities provide for an eight-year grace period on interest payments and a twelve-year grace period on payments of principal. The securities will be usable as domestic Privatization Currencies for purchases in privatization transactions. As of April 1, 2005, the Government had issued R$43.3 billion aggregate principal amount in debt securities in exchange for audited FCVS claims. Because the amount of the new FCVS securities ultimately issued will depend in part on the results of the Government’s auditing process and on concluding satisfactory exchange agreements with the current holders of FCVS credits, it is not currently possible to predict the fiscal impact of the issuance of such new securities over the next few years. Although the issuance of securities in exchange for FCVS liabilities could, over time, require the recognition of domestic public sector debt, the Government believes that effective implementation of the auditing and verification procedures required by the new measure should result in a reduction in the aggregate amount of FCVS liabilities eligible for exchange for new securities.
External Debt
On December 31, 2004, Brazil’s consolidated public sector external debt totaled $125.3 billion, or 20.7% of GDP. Approximately $11.2 billion of this debt was owed to commercial banks, $7.2 billion to foreign governments, $44.6 billion to international financial institutions, $60.9 billion to bondholders and $1.4 billion to suppliers and other creditors. The average maturity of Brazil’s public sector external debt was 9.8 years on December 31, 2000, 8.9 years on December 31, 2001, 7.7 years on December 31, 2002, 7.3 years on December 31, 2003 and 7.5 years on December 31, 2004.
D-94
International capital market issues by the Republic during 2004 and 2005 (prior to the date of this report) included:
| | • | | an offering of $1.5 billion aggregate principal amount of Brazil´s 8.25% Global Bonds due 2034 on January 20, 2004; |
| | • | | an offering of $750 million aggregate principal amount of Floating Rate Notes due 2009 on June 28, 2004; |
| | • | | an offering of $750 million aggregate principal amount of its 10.5% Global Bonds due 2014 on July 14, 2004; |
| | • | | an offering of €750 million aggregate principal amount of its 8.50% Notes due 2012 on September 24, 2004; |
| | • | | an offering of an additional €250 million aggregate principal amount of its 8.50% Notes due 2012 on September 30, 2004; |
| | • | | an offering of $1 billion aggregate principal amount of its 8.875% Global Bonds due 2019 on October 14, 2004; |
| | • | | an offering of $500 million aggregate principal amount of its 10.5% Global Bonds due 2014 on December 8, 2004; |
| | • | | an offering of €500 million aggregate principal amount of its 7.375% Global Bonds due 2015 on February 3, 2005; |
| | • | | an offering of $1.25 billion aggregate principal amount of its 8.75% Global Bonds due 2025 on February 4, 2005; |
| | • | | an offering of $1 billion aggregate principal amount of its 7.875% Global Bonds due 2015 on March 7, 2005; |
| | • | | an offering of an additional $500 million aggregate principal amount of its 8.875% Global Bonds due 2019 on May 17, 2005; |
| | • | | an offering of an additional $500 million aggregate principal amount of its 8.25% Global Bonds due 2034 on June 2, 2005; and |
| | • | | an offering of an additional $600 million aggregate principal amount of its 7.875% Global Bonds due 2015 on June 27, 2005. |
Brazil amended its fiscal agency agreement with JPMorgan Chase Bank as of March 30, 2004 to provide for the issuance in the future of global bonds that permit Brazil to amend certain key terms of the bonds, including the maturity date, interest rate and other payment terms, with the consent of the holders of not less than 75% of the aggregate principal amount of the outstanding bonds.
D-95
The following table sets forth details of Brazil’s public sector external debt by type of borrower at the end of the periods indicated.
Table No. 33
Public Sector External Debt by Type of Borrower
| | | | | | | | | | | | | | | | | | | | |
| | | As of December 31,
| |
| | | 2000
| | | 2001
| | | 2002
| | | 2003
| | | 2004
| |
| | | (in millons of dollars, except percentages) | |
Central Government | | $ | 72,592 | | | $ | 71,191 | | | $ | 75,323 | | | $ | 76,729 | | | $ | 75,346 | |
Public Entities(1) | | | 26,916 | | | | 32,259 | | | | 45,799 | | | | 54,692 | | | | 49,946 | |
Guaranteed | | | 12,577 | | | | 18,599 | | | | 32,256 | | | | 40,982 | | | | 37,666 | |
Non-Guaranteed | | | 14,339 | | | | 13,660 | | | | 13,542 | | | | 13,710 | | | | 12,280 | |
Total(2) | | $ | 99,508 | | | $ | 103,449 | | | $ | 121,122 | | | $ | 131,421 | | | $ | 125,291 | |
External Debt/GDP (%) | | | 16.9 | % | | | 20.5 | % | | | 27.4 | % | | | 26.6 | % | | | 20.7 | % |
| (1) | | Includes indebtedness of the Central Bank, public enterprises, mixed-ownership enterprises, semi-autonomous entities, States and municipalities. |
| (2) | | Private sector external debt (i.e., debt with an original maturity of one year or more) totaled $115.9 billion in 2000, $89.3 billion in 2001, $74.5 billion in 2002, $65.2 billion in 2003 and $60.1 billion in 2004. |
Source: Central Bank
The following table sets forth Brazil’s public sector external debt by type of creditor at the end of the periods indicated.
Table No. 34
Public Sector External Debt by Type of Creditor(1)
| | | | | | | | | | | | | | | |
| | | As of December 31,
|
| | | 2000
| | 2001
| | 2002
| | 2003
| | 2004
|
| | | (in millions of dollars) |
Commercial Banks | | $ | 11,807 | | $ | 11,908 | | $ | 11,725 | | $ | 10,580 | | $ | 11,245 |
Foreign Governments | | | 10,981 | | | 8,690 | | | 9,034 | | | 8,448 | | | 7,146 |
Multilateral Organizations | | | 20,732 | | | 28,339 | | | 42,539 | | | 49,166 | | | 44,588 |
Bondholders | | | 54,631 | | | 54,014 | | | 57,305 | | | 59,837 | | | 60,930 |
Suppliers | | | 569 | | | 479 | | | 509 | | | 630 | | | 502 |
Other | | | 788 | | | 19 | | | 11 | | | 844 | | | 880 |
Total | | $ | 99,508 | | $ | 103,449 | | $ | 121,122 | | $ | 129,505 | | $ | 125,291 |
| (1) | | Debt with an original maturity of one year or more. Includes indebtedness of the Central Bank, public enterprises, mixed-ownership enterprises, semi-autonomous entities, States and municipalities. Private sector external debt (i.e., debt with an original maturity of one year or more) totaled $115.9 billion in 2000, $89.3 billion in 2001, $74.5 billion in 2002, $65.2 billion in 2003 and $60.1 billion in 2004. |
Source: Central Bank
D-96
The following table sets forth Brazil’s public sector external debt by currency at the end of the periods indicated.
Table No. 35
Public Sector External Debt by Type of Currency(1)
| | | | | | | | | | | | | | | | | | | | | | | | | |
| | | As of December 31, 2000
| | As of December 31, 2001
| | As of December 31, 2002
| | As of December 31, 2003
| | As of December 31, 2004
|
| | | (in millions) | | (%) | | (in millions) | | (%) | | (in millions) | | (%) | | (in millions) | | (%) | | (in millions) | | (%) |
U.S. Dollars | | $ | 56,827 | | 57.1 | | $ | 53,091 | | 51.3 | | $ | 55,498 | | 45.8 | | $ | 59,405 | | 45.2 | | $ | 76,507 | | 61.1 |
Japanese Yen | | | 7,987 | | 8.0 | | | 9,438 | | 9.1 | | | 10,397 | | 8.6 | | | 9,278 | | 7.1 | | | 8,307 | | 6.6 |
Due to World Bank(2) | | | 7,334 | | 7.4 | | | 7,911 | | 7.6 | | | 8,542 | | 7.1 | | | 8,555 | | 6.5 | | | | | |
Deutsche Marks | | | 3,954 | | 4.0 | | | 2,680 | | 2.6 | | | 2,856 | | 2.4 | | | 3,029 | | 2.3 | | | 2,842 | | 2.3 |
French Francs | | | 1,814 | | 1.8 | | | 1,418 | | 1.4 | | | 1,231 | | 1.0 | | | 1,140 | | 0.9 | | | 875 | | 0.7 |
Due to IDB(2) | | | 11,273 | | 11.3 | | | 11,760 | | 11.4 | | | 12,727 | | 10.5 | | | 11,772 | | 9.0 | | | | | |
Pounds Sterling | | | 899 | | 0.9 | | | 764 | | 0.7 | | | 751 | | 0.6 | | | 714 | | 0.5 | | | 627 | | 0.5 |
Swiss Francs | | | 378 | | 0.4 | | | 240 | | 0.2 | | | 291 | | 0.2 | | | 292 | | 0.2 | | | 265 | | 0.2 |
Canadian Dollars | | | 140 | | 0.1 | | | 92 | | 0.1 | | | 93 | | 0.1 | | | 90 | | 0.1 | | | 68 | | 0.1 |
Special Drawing Rights | | | 1,787 | | 1.8 | | | 8,361 | | 8.1 | | | 20,807 | | 17.2 | | | 28,269 | | 21.5 | | | 25,009 | | 20.0 |
European Currency Units | | | 5,751 | | 5.8 | | | 6,788 | | 6.6 | | | 7,484 | | 6.2 | | | 8,346 | | 6.4 | | | 10,343 | | 8.3 |
Others | | | 1,364 | | 1.4 | | | 907 | | 0.9 | | | 444 | | 0.4 | | | 531 | | 0.4 | | | 448 | | 0.4 |
| | |
|
| |
| |
|
| |
| |
|
| |
| |
|
| |
| |
|
| |
|
Total | | $ | 99,508 | | 100.0 | | $ | 103,449 | | 100.0 | | $ | 121,122 | | 100.0 | | $ | 131,421 | | 100.0 | | $ | 125,291 | | 100.0 |
| | |
|
| |
| |
|
| |
| |
|
| |
| |
|
| |
| |
|
| |
|
| (1) | | Total registered external debt. Includes indebtedness of the Central Bank, public enterprises, mixed-ownership enterprises, semi-autonomous entities, States and municipalities. Private sector external debt (i.e., debt with an original maturity of one year or more) totaled $115.9 billion in 2000, $89.3 billion in 2001, $74.5 billion in 2002, $65.2 billion in 2003 and $60.1 billion in 2004. |
| (2) | | Consists primarily of Dollars, Yen, Swiss Francs and Deutsche Marks. Beginning in 2004, external debt with multilateral institutions is registered among the currencies based on the percentage that each currency composes of the given basket. |
Source: Central Bank
The following table sets forth the amortization schedule of Brazil’s public sector external debt by creditor.
Table No. 36
Public Sector External Debt Amortization Schedule by Creditor(1)
| | | | | | | | | | | | | | | | | | | | | | | | | | | | | | |
| | | Outstanding as of December 31,
|
| | | 2004
| | 2005
| | 2006
| | 2007
| | 2008
| | 2009
| | 2010
| | 2011
| | 2012
| | 2013 and thereafter
|
| | | (in millions of dollars) |
Multilateral Organizations | | $ | 44,588 | | $ | 9,157 | | $ | 10,345 | | $ | 10,671 | | $ | 1,525 | | $ | 1,599 | | $ | 1,448 | | $ | 1,551 | | $ | 2,467 | | $ | 5,825 |
Commercial Banks | | | 11,245 | | | 3,669 | | | 1,236 | | | 1,817 | | | 1,806 | | | 382 | | | 493 | | | 409 | | | 337 | | | 1,096 |
Foreign Governments | | | 7,146 | | | 2,114 | | | 2,285 | | | 347 | | | 360 | | | 307 | | | 392 | | | 224 | | | 216 | �� | | 901 |
Bondholders | | | 60,930 | | | 5,093 | | | 4,667 | | | 6,686 | | | 4,419 | | | 4,678 | | | 4,618 | | | 3,709 | | | 3,488 | | | 23,572 |
Suppliers | | | 502 | | | 92 | | | 83 | | | 75 | | | 65 | | | 61 | | | 55 | | | 48 | | | 17 | | | 6 |
Other | | | 880 | | | 1 | | | 1 | | | 841 | | | 1 | | | 0 | | | 0 | | | 0 | | | 0 | | | 36 |
| | |
|
| |
|
| |
|
| |
|
| |
|
| |
|
| |
|
| |
|
| |
|
| |
|
|
Total | | $ | 125,291 | | $ | 20,125 | | $ | 19,494 | | $ | 19,596 | | $ | 8,176 | | $ | 7,028 | | $ | 7,006 | | $ | 5,941 | | $ | 6,525 | | $ | 31,400 |
| | |
|
| |
|
| |
|
| |
|
| |
|
| |
|
| |
|
| |
|
| |
|
| |
|
|
| (1) | | This table includes debt with an original maturity of one year or more. Amortization figures in this table include only scheduled payments on outstanding debt as of December 31, 2004. This table excludes debt past due for 120 days or more, installment debt with three or more installments past due for 120 days or more and intercompany loans. |
Source: Central Bank
D-97
On November 16, 2004, the Brazilian Senate adopted Senate Resolution No. 20 dated November 16, 2004, which consolidates Senate Resolution Nos. 57 dated November 10, 1995, as amended (relating to new issuances of bonds), and Senate Resolution No. 69 dated September 12, 1996 (relating to liability management transactions). Resolution No. 20 authorizes, among other things, (i) the issuance abroad of debt securities denominated in reais or a foreign currency and (ii) liability management through repurchases, exchanges and other transactions, including financial derivatives, in each case pursuant to the National Treasury’s Program of Securities Issuance and Management of Liabilities Abroad. The National Treasury is permitted to issue up to an aggregate of $75 billion under this program, subject to subsequent renewals by the Senate. The proceeds of the sale of securities under this program are required to be applied to the payment of the National Treasury’s federal public debt.
On December 15, 2003, the IMF announced that its Executive Board had approved a fifteen-month extension of Brazil’s existing standby facility. A total of SDR 10.1 billion (approximately $14.8 billion) was available under the facility, composed of SDR 5.6 billion (approximately $8.2 billion) in unused amounts under the existing facility and SDR 4.5 billion (approximately $6.6 billion) in additional funds. In addition, the IMF extended by one year repurchases of SDR 4 billion (approximately $5.8 billion) that Brazil would otherwise have been required to make in each of 2005 and 2006. On March 22, 2005, the IMF announced that it had completed its tenth and final review of Brazil’s performance under the standby facility and on March 28, 2005, the Brazilian government announced that it had decided not to request IMF support under a successor arrangement. The standby facility expired on March 31, 2005.
Debt Crisis and Restructuring
With the inception of the Latin American debt crisis in 1982, voluntary lending to Brazil by commercial banks ceased. There followed several rounds of reschedulings, which culminated in Brazil’s Brady Plan restructuring pursuant to its 1992 Financing Plan.
On July 9, 1992, Brazil and the Bank Advisory Committee, consisting of nineteen of Brazil’s largest commercial bank creditors, reached an agreement-in-principle on the restructuring of Brazil’s medium- and long-term public sector indebtedness owed to commercial banks, as well as on a parallel arrangement for interest arrears accrued in respect of such indebtedness since January 1, 1991. Pursuant to that agreement, on April 15, 1994, Brazil issued approximately $43.1 billion principal amount of bonds to holders of certain medium- and long-term public sector debt (“Eligible Debt”) of Brazil or guaranteed by Brazil owed to commercial banks and certain other private sector creditors in consideration for the tender by such holders of their Eligible Debt and interest arrears accrued in respect thereof since January 1, 1991 (“Eligible Interest”). The bonds were issued pursuant to exchange agreements implementing the República Federativa do Brasil 1992 Financing Plan (the “1992 Financing Plan”), which provided for the restructuring of approximately $41.6 billion of Eligible Debt and arrangements for approximately $5.5 billion of Eligible Interest. Brazil’s Financing Plan was a “Brady Plan” restructuring, the term coined for debt restructuring based on the policy articulated by U.S. Treasury Secretary Nicholas Brady in a speech before the Third World Debt Conference in March 1989. The Brady Plan advocated restructurings which would, among other things, (i) exchange debt for freely transferable bonds, (ii) result in significant reductions in the level of debt and the rate of interest payable thereon, and (iii) collateralize some types of new bonds with the pledge of U.S. Treasury zero-coupon obligations.
Holders of Eligible Debt exchanged their Eligible Debt for the following types of bonds: (i) Par Bonds (“Par Bonds”), (ii) Discount Bonds (“Discount Bonds”), (iii) Front-Loaded Interest Reduction Bonds (“FLIRBs”), (iv) Front-Loaded Interest Reduction with Capitalization Bonds (“C-Bonds”), and (v) a combination of New Money Bonds (“New Money Bonds”) and Debt Conversion Bonds (“Debt Conversion Bonds”). Eligible Interest was exchanged (after giving effect to certain interest rate adjustments and cash interest payments made by Brazil pursuant to the 1992 Financing Plan) for EI Bonds (the “EI Bonds”). The Par Bonds, Discount Bonds, FLIRBs, C-Bonds, New Money Bonds, Debt Conversion Bonds and EI Bonds are referred to herein collectively as the “Brady Bonds”. Subject to their respective terms, each of the Brady Bonds is eligible for use as currency in the Brazilian privatization program.
D-98
The 1992 Financing Plan produced a reduction of approximately $4 billion in the stock of Eligible Debt; the $11.2 billion of Eligible Debt tendered for Discount Bonds resulted in the issuance of $7.3 billion of such bonds. In addition, the Government estimates that the 1992 Financing Plan will generate another $4 billion in interest savings over the 30-year repayment period. After giving effect to the completion of the phased delivery of collateral in October 1995, Brazil had approximately $17.8 billion of its external debt in the form of Par Bonds and Discount Bonds. The total cost of collateral to the Republic was approximately $3.8 billion.
At the Republic’s option, the Brady Bonds may be redeemed at par in whole or in part prior to their maturity. The EI Bonds and New Money Bonds also include a mandatory redemption provision under which the Republic is required to redeem the EI Bonds and New Money Bonds at par if the Republic prepays certain obligations.
D-99
The following table sets forth certain summary information with respect to each series of Brady Bonds outstanding on December 31, 2004.
Table No. 37
Debt Securities Created by Brady Plan
| | | | | | | | | |
Bond Type
| | Annual Interest Rate
| | Principal Repayment
| | Total Principal Amount of Bonds outstanding on December 31, 2004 (in millions of dollars)
| | % of Total
|
Par Bonds | | Fixed rates stepping up from 4% to 6% in year 6 and subsequent years | | 4/15/24 | | $ | 1,534 | | 10.8 |
| | | | |
Discount Bonds | | Six-month LIBOR + 13/16% | | 4/15/24 | | | 1,310 | | 9.2 |
| | | | |
FLIRBs | | Various fixed rates stepping up from 4% to 5% in year 6; thereafter six-month LIBOR + 13/16% | | in 13 consecutive equal semi-annual installments beginning 4/15/03 | | | 420 | | 3.0 |
| | | | |
C-Bonds | | 8%(1) | | in 21 consecutive equal semi-annual installments beginning 4/15/04(2) | | | 5,917 | | 41.8 |
| | | | |
New Money Bonds | | Six-month LIBOR + 7/8% | | in 17 consecutive equal semi-annual installments beginning 4/15/01 | | | 937 | | 6.6 |
| | | | |
Debt Conversion Bonds | | Six-month LIBOR + 7/8% | | in 17 consecutive equal semi-annual installments beginning 4/15/04 | | | 3,312 | | 23.4 |
| | | | |
EI Bonds | | Six-month LIBOR + 13/16% | | in 19 consecutive semi-annual installments beginning 4/15/97 | | | 740 | | 5.2 |
| | | | |
Total | | | | | | $ | 14,170 | | 100.0 |
| | | | | | |
|
| |
|
| (1) | | A portion of the interest payable under C-Bonds during the first six years from the April 15, 1994 exchange date has been capitalized as principal. |
| (2) | | Principal to be repaid under the C-Bonds includes capitalized interest. |
Source: National Treasury Secretariat and Central Bank
Debt Record
The Republic has defaulted on and rescheduled loans from commercial banks and official creditors. See “—Debt Crisis and Restructuring”. Throughout the debt restructuring process from 1982 to 1994, the Republic continued to make principal and interest payments on its external bonded indebtedness in accordance with the terms of such indebtedness. Prior to 1994, a very small percentage of Brazil’s external indebtedness was represented by bonds; however, this percentage has increased significantly as a result of the Brady Plan-type restructuring described above and subsequent debt offerings by the Republic in the international capital markets.
D-100
TABLES AND SUPPLEMENTARY INFORMATION
Table No. 38
External Direct Debt of the Federal Government
| | | | | | | | | | | | | | | |
| | | Interest
| | | Issue Date
| | Final Maturity
| | Currencies
| | Amount Disbursed
| | Principal Amount(1) Outstanding At December 31, 2004
|
| | | | | | | | | | | | (in millions of dollars) |
Multilateral Organizations | | | | | | | | | | | | | | | |
World Bank | | Various | | | Various | | Various | | Various | | $ | 10,381.0 | | $ | 5,713.0 |
Inter-American Development Bank (IDB) | | Various | | | Various | | Various | | Various | | | 8,605.0 | | | 2,707.0 |
Others | | Various | | | Various | | Various | | Various | | | 91.0 | | | 9.0 |
| | | | | | | | | | | |
|
| |
|
|
Total (Multilateral Organizations) | | | | | | | | | | | $ | 19,077.0 | | $ | 8,429.0 |
Foreign Governments | | | | | | | | | | | | | | | |
Foreign Governmental Agencies | | | | | | | | | | | | | | | |
Original Loans | | Various | | | Various | | Various | | Various | | $ | 1,739.0 | | $ | 956.0 |
Paris Club Phase IV | | Various | | | 26-Feb-92 | | 31-Dec-06 | | Various | | | 10,293.0 | | | 3,653.0 |
| | | | | | | | | | | |
|
| |
|
|
Total (Foreign Governments) | | | | | | | | | | | $ | 12,032.0 | | $ | 4,609.0 |
Bonds (BRADIES) | | | | | | | | | | | | | | | |
1994 Eligible Interest Bond (EI Bond)(2) | | Floating | | | 15-Apr-94 | | 15-Apr-06 | | $ | | $ | 3,084.0 | | $ | 740.0 |
1994 Front-Loaded Interest Reduction Bond (FLIRB) | | Various | | | 15-Apr-94 | | 15-Apr-09 | | $ | | | 607.0 | | | 420.0 |
1994 New Money Bond | | Floating | | | 15-Apr-94 | | 15-Apr-09 | | $ | | | 1,771.0 | | | 938.0 |
1994 Debt Conversion Bond | �� | Floating | | | 15-Apr-94 | | 15-Apr-12 | | $ | | | 3,755.0 | | | 3,313.0 |
1994 Front-Loaded Interest Reduction with Capitalization Bond (“C” Bond) | | Various | | | 15-Apr-94 | | 15-Apr-14 | | $ | | | 5,311.0 | | | 5,917.0 |
1994 Discount Bond | | Floating | | | 15-Apr-94 | | 15-Apr-24 | | $ | | | 1,312.0 | | | 1,312.0 |
1994 Par Bond | | Various | | | 15-Apr-94 | | 15-Apr-24 | | $ | | | 1,534.0 | | | 1,534.0 |
| | | | | | | | | | | |
|
| |
|
|
Total (“Bradies”) | | | | | | | | | | | $ | 17,374.0 | | $ | 14,174.0 |
Bonds (GLOBAL) | | | | | | | | | | | | | | | |
2001 Global Bond BR 05 | | 9.625 | % | | 17-May-01 | | 17-Jul-2005 | | $ | | | 1,000.0 | | | 1,000.0 |
2001 Global Bond BR 06 | | 10.250 | % | | 11-Jan-01 | | 11-Jan-06 | | $ | | | 1,500.0 | | | 1,500.0 |
2003 Global Bond NBR 07 | | 10.000 | % | | 06-May-03 | | 16-Jan-07 | | $ | | | 1,000.0 | | | 1,000.0 |
2000 Global Bond BR 07 | | 11.250 | % | | 26-Jul-00 | | 26-Jul-07 | | $ | | | 1,500.0 | | | 1,500.0 |
1998 Global Bond BR 08 | | 9.375 | % | | 07-Apr-98 | | 07-Apr-08 | | $ | | | 1,250.0 | | | 1,250.0 |
2002 Global Bond NBR 08 | | 11.500 | % | | 12-Mar-02 | | 12-Mar-08 | | $ | | | 1,250.0 | | | 1,250.0 |
1999 Global Bond BR 09 | | 14.500 | % | | 25-Oct-99 | | 15-Oct-09 | | $ | | | 2,000.0 | | | 2,000.0 |
2004 Global Bond BR 09—Floating | | Floating | | | 28-Jun-04 | | 29-Jun-09 | | $ | | | 750.0 | | | 750.0 |
2002 Global Bond BR 10 | | 12.000 | % | | 16-Apr-02 | | 15-Apr-10 | | $ | | | 1,000.0 | | | 1,000.0 |
2003 Global Bond NBR 10 | | 9.250 | % | | 22-Oct-03 | | 22-Oct-10 | | $ | | | 1,500.0 | | | 1,500.0 |
2003 Global Bond BR 11 | | 10.000 | % | | 07-Aug-03 | | 07-Aug-11 | | $ | | | 500.0 | | | 500.0 |
2003 Global Bond BR 11 | | 10.000 | % | | 18-Sept-03 | | 07-Aug-11 | | $ | | | 750.0 | | | 750.0 |
2002 Global Bond BR 12 | | 11.000 | % | | 11-Jan-02 | | 11-Jan-12 | | $ | | | 1,250.0 | | | 1,250.0 |
2003 Global Bond BR 13 | | 10.250 | % | | 17-Jun-03 | | 17-Jun-13 | | $ | | | 1,250.0 | | | 1,250.0 |
2004 Global Bond BR 14 | | 10.500 | % | | 14-Jul-04 | | 14-Jul-14 | | $ | | | 750.0 | | | 750.0 |
2004 Global Bond BR 14—Reopening | | 10.500 | % | | 08-Dec-04 | | 14-Jul-14 | | $ | | | 500.0 | | | 500.0 |
2005 Global Bond BR 15 | | 7.875 | % | | 07-Mar-05 | | 07-Mar-15 | | $ | | | 1,000.0 | | | 1,000.0 |
2004 Global Bond BR 19 | | 8.875 | % | | 14-Oct-04 | | 14-Oct-19 | | $ | | | 1,000.0 | | | 1,000.0 |
2005 Global Bond BR 19 | | 8.875 | % | | 17-May-05 | | 14-May-19 | | $ | | | 500.0 | | | 500.0 |
2000 Global Bond BR 20 | | 12.750 | % | | 26-Jan-00 | | 15-Jan-20 | | $ | | | 1,000.0 | | | 1,000.0 |
2001 Global Bond BR 24 | | 8.875 | % | | 22-Mar-01 | | 15-Apr-24 | | $ | | | 2,150.0 | | | 2,150.0 |
2003 Global Bond BR 24b | | 8.875 | % | | 07-Aug-03 | | 15-Apr-24 | | $ | | | 824.7 | | | 824.7 |
2005 Global Bond BR 25 | | 8.750 | % | | 04-Feb-05 | | 04-Feb-25 | | $ | | | 1,250.0 | | | 1,250.0 |
1997 Global Bond BR 27 | | 10.125 | % | | 09-Jun-97 | | 15-May-27 | | $ | | | 3,000.0 | | | 3,000.0 |
1998 Global Bond BR 27 | | 10.125 | % | | 27-Mar-98 | | 15-May-27 | | $ | | | 500.0 | | | 500.0 |
2000 Global Bond BR 30 | | 12.250 | % | | 06-Mar-00 | | 06-Mar-30 | | $ | | | 1,600.0 | | | 1,600.0 |
2004 Global Bond BR 34 | | 8.250 | % | | 20-Jan-04 | | 20-Jan-34 | | $ | | | 1,500.0 | | | 1,500.0 |
2005 Global Bond BR 34 | | 8.250 | % | | 2-Jun-05 | | 20-Jan-34 | | $ | | | 500.0 | | | 500.0 |
2000 Global Bond BR 40 | | 11.000 | % | | 17-Aug-00 | | 17-Aug-40 | | $ | | | 5,157.3 | | | 5,157.3 |
| | | | | | | | | | | |
|
| |
|
|
Total (“Globals”) | | | | | | | | | | | $ | 37,732.0 | | $ | 37,732.0 |
D-101
| | | | | | | | | | | | | | | |
| | | Interest
| | | Issue Date
| | Final Maturity
| | Currencies
| | Amount Disbursed
| | Principal Amount(1) Outstanding At December 31, 2004
|
| | | | | | | | | | | | (in millions of dollars) |
Bonds (EUROS e Outros) | | | | | | | | | | | | | | | |
2000 Euro—05 | | 9.000 | % | | 05-Jul-00 | | 05-Jul-05 | | EUR | | | 1,703.0 | | | 1,688.0 |
1999 Euro Bond | | 12.000 | % | | 17-Nov-99 | | 17-Nov-06 | | EUR | | | 953.0 | | | 938.0 |
2000 Samurai—06 | | 4.750 | % | | 22-Dec-00 | | 22-Mar-06 | | YEN | | | 585.0 | | | 585.0 |
1997 DEM Eurobond | | 8.000 | % | | 26-Feb-97 | | 26-Feb-07 | | DEM | | | 696.0 | | | 696.0 |
2001 Samurai 07 | | 4.750 | % | | 10-Apr-01 | | 10-Apr-07 | | YEN | | | 780.0 | | | 780.0 |
1997 Euro GPB Bond | | 10.000 | % | | 30-July-97 | | 30-Jul-07 | | GPB | | | 290.0 | | | 290.0 |
2000 Euro—07 | | 9.500 | % | | 05-Oct-00 | | 05-Oct-07 | | EUR | | | 1,024.0 | | | 1,024.0 |
1998 DEM Bond | | 10.000 | % | | 23-Apr-98 | | 23-Apr-08 | | DM | | | 522.0 | | | 522.0 |
2000 Euro—10 | | 11.000 | % | | 04-Feb-00 | | 04-Feb-10 | | EUR | | | 1,023.0 | | | 1,023.0 |
2004 Euro—12 | | 8.500 | % | | 24-Sep-04 | | 24-Sep-12 | | EUR | | | 1,363.0 | | | 1,363.0 |
2002 Euro—09 | | 11.500 | % | | 01-Apr-02 | | 01-Apr-09 | | EUR | | | 682.0 | | | 682.0 |
1997 Eurolira Bond | | 11.000 | % | | 26-Jun-97 | | 26-Jun-17 | | ITL | | | 528.0 | | | 528.0 |
2002 Euro—11 | | 9.500 | % | | 24-Jan-01 | | 24-Jan-11 | | EUR | | | 1,364.0 | | | 1,364.0 |
2005 Euro—15 | | 7.375 | % | | 03-Feb-05 | | 03-Feb-15 | | EUR | | | 675.0 | | | 675.0 |
| | | | | | | | | | | |
|
| |
|
|
Total (“Euros”) | | | | | | | | | | | $ | 12,188.0 | | $ | 12,158.0 |
Bonds (Others) | | | | | | | | | | | | | | | |
Brazil Investment Bond BIB | | 6.000 | % | | 31-Aug-89 | | 15-Jul-13 | | $ | | $ | 465.0 | | $ | 279.0 |
| | | | | | | | | | | |
|
| |
|
|
Total (“Bonds”) | | | | | | | | | | | $ | 67,759.0 | | $ | 64,343.1 |
Commercial Banks | | | | | | | | | | | | | | | |
Import Financing Credits with Guarantee of Foreign Governments | | Various | | | Various | | Various | | Various | | $ | 0 | | $ | 0 |
Import Financing Credits without Guarantee of Foreign Governments | | Various | | | Various | | Various | | Various | | | 2,177.0 | | | 1,351.0 |
Loans | | Various | | | Various | | Various | | Various | | | 167.0 | | | 134.0 |
| | | | | | | | | | | |
|
| |
|
|
Total (Commercial Banks) | | | | | | | | | | | $ | 2,344.0 | | $ | 1,485.0 |
Others | | | | | | | | | | | | | | | |
Import Financing Credits with Guarantee of Foreign Governments | | Various | | | Various | | Various | | Various | | $ | 0 | | $ | 0 |
Import Financing Credits without Guarantee of Foreign Governments | | Various | | | Various | | Various | | Various | | | 1,150.0 | | | 406.0 |
Total (Others) | | | | | | | | | | | $ | 1,150.0 | | $ | 406.0 |
| | | | | | | | | | | |
|
| |
|
|
Total | | | | | | | | | | | $ | 102,362.0 | | $ | 79,272.1 |
| | | | | | | | | | | |
|
| |
|
|
| (1) | | Currencies other than U.S. dollars are translated into U.S. dollars by the exchange rate (selling) at December 31, 2004. |
| (2) | | Capitalized interest. |
Source: Central Bank and National Treasury
D-102
Table No. 39
External Debt Guaranteed by the Federal Government
| | | | | | | | | | | | |
| | | Interest
| | Issue
Date
| | Final
Maturity
| | Currencies
| | Amount
Disbursed
| | Principal
Amount(1)
Outstanding
At
December
31, 2004
|
| | | | | | | | | | | (in millions of dollars) |
I. To Public Entities | | | | | | | | | | | | |
Multilateral Organizations | | | | | | | | | | | | |
International Monetary Fund (IMF) | | Floating | | Various | | Various | | SDR | | 27,733 | | 24,996 |
World Bank | | Various | | Various | | Various | | Various | | 10,381 | | 2,161 |
Inter-American Development Bank | | Various | | Various | | Various | | Various | | 7,902 | | 7,649 |
Others | | Various | | Various | | Various | | Various | | 300 | | 293 |
| | | | | | | | | | | | |
|
Total (Multilateral Organizations) | | | | | | | | | | | | 35,099 |
| | | | | | |
Foreign Governments | | | | | | | | | | | | |
Foreign Governmental Agencies Original Loans | | Various | | Various | | Various | | Various | | 3,231 | | 1,728 |
| | | | | | |
Commercial Banks | | | | | | | | | | | | |
Import Financing Credits with Guarantee of Foreign Governments | | Various | | Various | | Various | | Various | | 60 | | 56 |
Import Financing Credits without Guarantee of Foreign Governments | | Various | | Various | | Various | | Various | | 509 | | 231 |
Loans | | Various | | Various | | Various | | U.S.$ | | 443 | | 398 |
| | | | | | | | | | | | |
|
Total (Commercial Banks) | | | | | | | | | | | | 685 |
| | | | | | |
Other | | | | | | | | | | | | |
Loans | | Various | | Various | | Various | | Various | | 163 | | 3 |
Total (Other) | | Various | | Various | | Various | | U.S.$ | | | | 3 |
| | | | | | | | | | | | |
|
Total for Public Entities | | | | | | | | | | | | 37,515 |
| | | | | | |
II. To Private Companies | | | | | | | | | | | | |
(Including Privatized Companies) | | Various | | Various | | Various | | Various | | 278 | | 90 |
| | | | | | | | | | | | |
|
Total | | | | | | | | | | | | 37,605 |
| | | | | | | | | | | | |
|
| (1) | | Currencies other than U.S. dollars are translated into U.S. dollars by the exchange rate (sell side) at December 31, 2004. |
Source: Central Bank
D-103
Table No. 40
Internal Securities Debt of the Republic
Outstanding on December 31, 2004
| | | | | | | | | | |
Name
| | Index(1)
| | Interest
Rate
| | Issuance Date
| | Final Maturity
| | Outstanding
Amount(3) (millions of $)
|
National Treasury Letters (NTL) | | — | | — (2) | | Various (Aug 2003–Dec 2004) | | Various (Jan 2005–July 2006) | | $60,218 |
National Treasury Notes (NTN) | | | | | | | | | | |
A Series | | $ | | 6.00% | | (Dec 1997–Nov 2000) | | Various (Sep 2013–Apr 2024) | | $4,550 |
B Series | | IPCA | | 6.00% | | Various (Nov 2001–Dec 2004) | | (Aug 2006–May 2045) | | $9.910 |
C Series | | IGP-M | | 6% and 12% | | Various (Dec 1999–Dec 2004) | | (July 2005–Jan 2031) | | $29,664 |
D Series | | $ | | 6% and 12% | | Various (Jan 2001–Jun 2003) | | Various (Jan 2005–July 2008) | | $4,435 |
F Series | | — | | -(2) | | Dec 2003–Dec 2004 | | Jan 2008 | | $1,066 |
I Series | | $ | | 0% and 12% | | Various (May 1995–Apr 2001) | | Various (Jan 2005–Jan 2021) | | $589 |
M Series | | $ | | Libor + 7/8% | | Various (Apr 1994–Sep 1994) | | Various (Apr 2005–Apr 2009) | | $161 |
P Series | | TR | | 6.00% | | Various (May 1994–Jan 2004) | | Various (Mar 2007–Jan 2020) | | $1,068 |
National Treasury Bonds | | TR | | 6.00% | | Various (Dec 1989–Nov 1990) | | Various (Mar 2005–Sep 2014) | | $18 |
Financial Treasury Letters (FTL) | | Overnight | | — | | Various (Aug 1998–Dec 2004) | | Various (Jan 2005–Jan 2017) | | $169,047 |
A Series | | Overnight | | 0.0245% (4) | | Various (Dec 1997–Jul 2000) | | Various (Dec 2012–Jul 2015) | | $1,425 |
B Series | | Overnight | | — | | Various (Dec 1997–May 2004) | | Various (Jan 2005–Oct 2015) | | $2,007 |
National Treasury Certificate (CTN) | | IGP-M | | 12% | | Various (May 1998–Aug 2004) | | Various (May 2018–Aug 2024) | | $873 |
Financial Treasury Certificate (CFT) | | | | | | | | | | |
A Series | | IGP-DI | | 6% and 12% | | Various (Sep 1998–Jun 2003) | | Various (Jan 2005–Jul 2030) | | $4,324 |
B Series | | TR | | 6.00% | | Various (Jan 1997–Jan 2004) | | Various (May 2013–Jan 2034) | | $7 |
D Series | | $ | | 0% and 6% | | Various (Feb 2000–Apr 2002) | | Various (Feb 2005–May 2031) | | $947 |
E Series | | IGP-M | | Various | | Various (Jan 2000–Jan 2004) | | Various (Mar 2011–Jan 2034) | | $382 |
Securitized Credits | | IGP-DI | | Various | | Various (Jul 1994–Apr 2000) | | (Feb 2005–Jan 2023) | | $1,271 |
| | | INPC | | Various | | (Jun 1998) | | (Jul 2015) | | $9 |
| | | Overnight | | Various | | Various (Oct 1998–Jun 1999) | | Various (Oct 2006–Jun 2007) | | $527 |
| | | TJLP | | Various | | (Jun 1998) | | (Jul 2006) | | $7 |
| | | TR | | Various | | Various (Jan 1997–Jun 1998) | | Various (Sep 2007–Jan 2027) | | $6,136 |
Agrarian Debt | | TR | | Various | | (Nov 1995) | | Various (Oct 2005) | | $184 |
| | | Overnight | | Various | | (Oct 1995) | | Various (Oct 2005–Oct 2008) | | $1,444 |
| | | Others | | Various | | (Nov 1995) | | Various (Oct 2005) | | $9 |
Public Debt Certificate (CDP) | | TR | | Various | | (Mar 1993-Mar 2002) | | Various (Mar 2028–Mar 2032) | | $0 |
Agrarian Debt Securities (TDA) | | TR | | Various | | Various | | Various(Jan 2005–Jan 2025) | | $908 |
Central Bank Notes | | | | | | | | | | |
E Series | | $ | | Various | | (Mar 2000-Oct 2000) | | Various (Apr 2005–Nov 2006) | | $5,117 |
Total | | | | | | | | | | |
| (1) | | Securities indexed to each indicated rate/index: |
Overnight = Central Bank’s overnight rate
IGPM = General Price Index (market based)
$ = U.S. dollar exchange rate
TR = Index based on average daily rate of certificates of deposit issued by certain major Brazilian banks
TJLP = Long-term interest rate index
| (2) | | Zero-coupon securities issued at a discount from their face amount. |
| (3) | | Exchange rate (selling rate) at end of December 31, 2004 (R$2.6544=$1.00). |
| (4) | | Monthly interest rate. |
Source: National Treasury Secretariat
D-104