Exhibit D

FEDERATIVE REPUBLIC OF BRAZIL
This description of the Federative Republic of Brazil (“Brazil” or the “Republic”) is dated as of September 30, 2011 and appears as Exhibit D to the Republic’s Annual Report on Form 18-K to the U.S. Securities and Exchange Commission for the fiscal year ended December 31, 2010. In this report, references to “dollars”, “U.S. dollars”, “U.S.$” and “$” are to United States dollars, and references to “real”, “reais” and “R$” are to Brazilian reais. The fiscal year of the federal Government of Brazil (the “Federal Government”) ends December 31 of each year. The fiscal year ended December 31, 2010 is referred to herein as “2010”, and other years are referred to in a similar manner. Tables herein may not add due to rounding.
The following table sets forth certain exchange rate information reported by the Central Bank for the selling of U.S. dollars, expressed in nominal reais, for the periods indicated. The Federal Reserve Bank of New York does not report a noon buying rate for the real.
Commercial Exchange Rates (Selling Side)
R$/$1.00
| | | | | | | | | | | | |
Year | | Average for
Period(1) | | | End of
Period | | | Percentage
Change
(End of
Period) | |
2006 | | | 2.1771 | | | | 2.1380 | | | | (8.7 | ) |
2007 | | | 1.9483 | | | | 1.7713 | | | | (17.2 | ) |
2008 | | | 1.8375 | | | | 2.3370 | | | | 31.9 | |
2009 | | | 1.9935 | | | | 1.7412 | | | | (25.5 | ) |
2010 | | | 1.7593 | | | | 1.6662 | | | | (4.3 | ) |
| (1) | Weighted average of the exchange rates on business days during the period. |
Source: Central Bank.
D-1
Table of Contents
| | | | |
INTRODUCTION | | | D-4 | |
| |
THE FEDERATIVE REPUBLIC OF BRAZIL | | | D-9 | |
| |
THE BRAZILIAN ECONOMY | | | D-14 | |
| |
BALANCE OF PAYMENTS AND FOREIGN TRADE | | | D-33 | |
| |
THE FINANCIAL SYSTEM | | | D-48 | |
| |
PUBLIC FINANCE | | | D-60 | |
| |
PUBLIC DEBT | | | D-69 | |
| |
TABLES AND SUPPLEMENTARY INFORMATION | | | D-80 | |
D-2
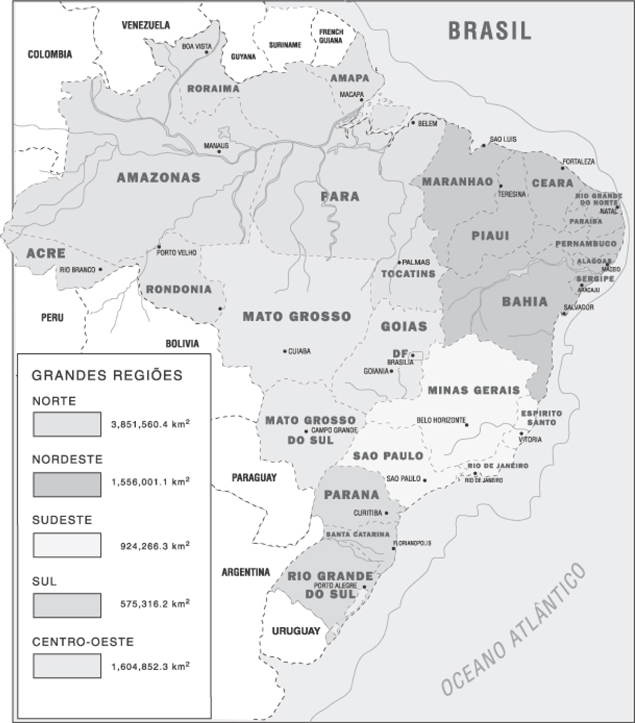
MAP OF BRAZIL
D-3
INTRODUCTION
General
Brazil is the fifth largest country in the world and occupies nearly half the land area of South America. Brazil shares a border with every country in South America except Chile and Ecuador. The capital of Brazil is Brasília, and the official language is Portuguese. On December 31, 2010, Brazil’s estimated population was 193.3 million.
Following two decades of military governments, in 1985 Brazil made a successful transition to civilian authority and democratic government. A new Brazilian Constitution (the Constituição da República Federativa do Brasil, or “Constitution”) was adopted in 1988. In 1989, direct presidential elections were held for the first time in 29 years. In October 2010, the Workers’ Party (Partido dos Trabalhadores, or “PT”) candidate, Dilma Vana Rousseff, was elected as Brazil’s first female president. She took office on January 1, 2011, replacing outgoing president Luiz Inácio Lula da Silva. See “The Federative Republic of Brazil—Federal, State and Local Elections”. In December 2010, President Rousseff announced that her administration would be based on democratic principles, would continue the goal of eradicating poverty with the “Plano Brasil Sem Miséria” (Brazil Without Poverty Plan), and would follow the economic agenda implemented by previous administrations, with a focus on controlling inflation and creating an environment of sustainable growth.
The real was introduced as Brazil’s official currency in July 1994, pursuant to the Plano Real, in order to address economic problems in Brazil that were related to high rates of inflation. Pre-Plano Real stabilization efforts, which included wage and price controls, failed to contain inflation for any extended period. See “The Brazilian Economy—Historical Background”. The Plano Real, which the Federal Government announced in December 1993 and fully implemented in July 1994, succeeded in lowering inflation from an annual rate of 2,477.2% in 1993 and 916.4% in 1994 to 22.4% in 1995, 9.6% in 1996, 5.2% in 1997 and 1.7% in 1998, as measured by the Extended National Consumer Price Index (Indice National de Precos ao Consumidor—Amplo, or “IPCA”). The inflation rate increased to 8.9% in 1999, however, following the decision of the Central Bank in January 1999 to permit the value of the real to float against that of the dollar. The inflation rate subsequently declined as a consequence of the implementation of the inflation targeting regime by the Central Bank in June 1999, registering 6.0% in 2000 and 7.7% in 2001. See “The Brazilian Economy—Inflation”.
Economy
Brazil’s economy largely recovered from the effects of the 2008 global financial crisis in 2010, the year when most of the measures implemented to counteract the crisis were phased out. Brazil’s gross domestic product, or GDP, reversed the 0.6% contraction recorded in 2009 and expanded 7.5% in 2010. This was Brazil’s strongest economic performance since the 1980s.
In 2010, Brazil registered a trade surplus of approximately $20.2 billion, compared to a surplus of approximately $25.3 billion in 2009. Exports in 2010 totaled $201.9 billion, a 32.0% increase over 2009, while imports totaled $181.7 billion, a 42.3% increase over 2009. Despite the trade surplus in 2010, Brazil ran a deficit in its current account of approximately $47.4 billion, compared to a deficit of approximately $24.3 billion in 2009. The balance of payments surplus was approximately $49.1 billion in 2010, compared to a surplus of approximately $46.7 billion in 2009. Brazil’s international reserves (which include gold and foreign exchange holdings) totaled $288.6 billion on December 31, 2010 compared with $238.5 billion on December 31, 2009.
The inflation rate (as measured by IPCA) was 5.9% in 2010, compared to 4.3% in 2009. The Brazilian real-U.S. dollar exchange rate (sell side), as published by the Central Bank, was, R$1.6662 to U.S.$1.00 on December 31, 2010 compared with R$1.7412 to $1.00 on December 31, 2009.
In 2010, Brazil’s consolidated public sector primary surplus was R$101.7 billion (2.8% of GDP), compared to R$64.8 billion (2.0% of GDP) registered in 2009. The consolidated public sector nominal deficit in 2010 was R$93.7 billion (2.6% of GDP), compared with the R$106.2 billion (3.3% of GDP) consolidated public sector nominal deficit in 2009.
Brazil’s net public sector debt stood at $886.2 billion (or 40.2% of GDP) on December 31, 2010 compared with $783.0 billion (42.8% of GDP) on December 31, 2009.
On December 3, 2010, Brazil’s National Monetary Council (“CMN”) and the Board of Governors of the Central Bank adopted a set of macroeconomic prudential measures. The initiatives were aimed at continuing the process of gradually
D-4
withdrawing the incentives that were introduced to minimize the effects of the 2008 global financial crisis on the economy. See “The Brazilian Economy—Economic Events and Policies”.
Domestic Initiatives
Over the last decade Brazil has initiated reforms of the pension and judicial systems. On December 19, 2003, regulations related to retirement and social security for civil servants were modified by Constitutional Amendment No. 41. On July 5, 2005, the national congress of Brazil (the “National Congress”) approved Constitutional Amendment No. 47, which modifies Constitutional Amendment No. 41 as it applies to civil servants. See “The Brazilian Economy—Social Security”.
In November 2004, the National Congress approved Constitutional Amendment No. 45, dated December 8, 2004, a set of reforms intended to improve the efficiency of the judicial system. Constitutional Amendment No. 45, among other things, amends Articles 102 and 105 of the Constitution providing that the Superior Court of Justice (Superior Tribunal de Justiça, or “STJ”) and not the Federal Supreme Court (Supremo Tribunal Federal, or “STF”), has jurisdiction to determine whether foreign judgments and foreign arbitral awards are enforceable in Brazil. The enforcement by a Brazilian court of a foreign arbitral award is subject to the recognition of such award by the STJ. The STJ will recognize such an award if all of the required formalities are met and the award does not contravene Brazilian national sovereignty, public policy and “good morals”. Other reforms introduced by Constitutional Amendment No. 45 include: (i) the submission by Brazil to the jurisdiction of the International Criminal Court, the governing statute of which was ratified by Brazil in June 2002; (ii) a rule providing that decisions of the STF on the merits of lawsuits challenging the constitutionality of certain acts (ações diretas de inconstitucionalidade and ações declaratórias de constitucionalidade) constitute binding precedents for the lower courts, government bodies directly linked to federal, state or municipal powers and entities created to perform government activities in a decentralized manner; (iii) a rule providing that the STF may issue summary legal principles (súmulas) that are binding on the lower courts and the direct and indirect administration; (iv) the establishment of a fifteen-member National Council of Justice (Conselho Nacional de Justiça) to oversee the administrative and fiscal management of the judiciary; and (vii) the establishment of a fourteen-member National Council of the Public Ministry (Conselho Nacional do Ministério Público) to oversee the administrative and fiscal management of the public prosecution service.
Law No. 11,187 dated October 19, 2005, introduced further reforms by amending Brazil’s Civil Procedure Code to limit interlocutory appeals (agravos). In June 2006, the Law of Civil Execution (Law No. 11,232 dated December 22, 2005) was enacted. This law defined new procedures to expedite the issuance of judgments in debt collection cases. In December 2006, Law No. 11,417 approved the binding clause—a mechanism obligating lower court judges to follow decisions adopted by the STF, resulting in a reduction in the amount of appeals as well as expediting court decisions. In addition, two other laws regarding court reform were approved during the same period in 2006: Law No 11,418 dated December 19, 2006, which limits the analysis of appeals by STF to general questions considered relevant to society as a whole and Law No. 11,419 dated December 19, 2006, which provides for the digitization of the court records, thereby allowing judges in all of Brazil to work with electronic documents in an effort to expedite judicial procedings. Law No. 11,382, approved in December 2006, relates to the execution of extra-judiciary bank certificates execution and expedites the issuance of judgments in collection cases and is designed to reduce loan spreads and increase the availability of credit.
On December 19, 2003, a tax reform was approved by the National Congress. Constitutional Amendment No. 42 provides, among other things, that the required contribution to social security (Contribuição para o Fianciamento da Seguridade Social, or “COFINS”) be made at the final stage of the production process, rather than at each stage of production. On December 12, 2007, the National Congress did not extend the provisional financial contribution levy (Contribuição Provisória sobre a Movimentação Financeira, or “CPMF”) and, as result, the tax expired on December 31, 2007.
Changes have also been made to improve the investment climate. On December 30, 2004, Law No. 11,079 was approved, which provided for formation of “public-private partnerships” (Parcerias Público Privadas or “PPI”). A new bankruptcy law (Law No. 11,101), as well as changes to the tax code entered into force on February 9, 2005. In November 2005, the Federal Government simplified the process for the registration of securities with the Brazilian Securities Commission (Comissão de Valores Mobiliários or “CVM”) and of the issuance of the Brazilian Federal Tax Number (Cadastro Nacional de Pessoa Jurídica), two necessary steps to allow foreign investors to operate in the domestic markets. On January 22, 2007, the Federal Government unveiled the Growth Acceleration Program 2007-2010 (or “PAC”), a set of measures that seeks to: (i) create incentives for private investment; (ii) increase public investment in infrastructure; and (iii) remove bureaucratic, statutory and regulatory obstacles to growth. The measures are grouped under five broad headings: infrastructure investment, stimulus to credit and financing, improvement in the investment climate, tax exemptions and improvements in the tax system, and long-term fiscal measures. The Federal Government presented, on March 29, 2010, the
D-5
second phase of the Growth Acceleration Program (“PAC 2”). See “The Brazilian Economy—Incentives for Private Investment”.
In order to stimulate economic activity and increase liquidity to minimize the effects of the global economic crisis, in September 2008, the Federal Government implemented expansionary fiscal and monetary policies, among other measures. The instruments used included: a package of tax reductions, increases in PAC resources, creation of a housing program (“Minha casa, Minha Vida”, or “My House, My Life”), creation of a credit line for agriculture, reduction of reserve requirements for Brazilian banks, a series of reductions of the Brazilian prime interest-rate (“Selic rate”), sales of foreign exchange swaps, financial support for certain banks by the Central Bank and currency swap operations with central banks of other countries.
D-6
Table No. 2
SELECTED BRAZILIAN ECONOMIC INDICATORS
| | | | | | | | | | | | | | | | | | | | |
| | | 2006 | | | 2007 | | | 2008 | | | 2009 | | | 2010 | |
The Economy | | | | | | | | | | | | | | | | | | | | |
Gross Domestic Product: | | | | | | | | | | | | | | | | | | | | |
(in billions of constant 2010 reais) | | R$ | 3,084.3 | | | R$ | 3,272.2 | | | R$ | 3,441.1 | | | R$ | 3,418.9 | | | R$ | 3,675.0 | |
(GDP at current prices in $ billions)(1) | | $ | 1,088.8 | | | $ | 1,366.5 | | | $ | 1,650.7 | | | $ | 1,598.4 | | | $ | 2,089.8 | |
Real GDP Growth (decline)(2) | | | 4.0 | % | | | 6.1 | % | | | 5.2 | % | | | (0.6 | )% | | | 7.5 | % |
Population (millions) | | | 185.6 | | | | 187.6 | | | | 189.61 | | | | 191.5 | | | | 193.3 | |
GDP Per Capita(3) | | $ | 5,867.3 | | | $ | 7,282.7 | | | $ | 8,705.7 | | | $ | 8,347.6 | | | $ | 10,814.0 | |
Unemployment Rate(4) | | | 8.4 | % | | | 7.4 | % | | | 6.8 | % | | | 6.8 | % | | | 5.3 | % |
IGP-DI (rate of change)(5) | | | 3.8 | % | | | 7.9 | % | | | 9.1 | % | | | (1.4 | )% | | | 11.3 | % |
IPCA (rate of change)(6) | | | 3.1 | % | | | 4.5 | % | | | 5.9 | % | | | 4.3 | % | | | 5.9 | % |
Nominal Devaluation Rate(7) | | | (8.7 | )% | | | (17.1 | )% | | | 31.9 | % | | | (25.5 | )% | | | (4.3 | )% |
Domestic Real Interest Rate(8) | | | 10.9 | % | | | 3.7 | % | | | 3.1 | % | | | 11.5 | % | | | (1.4 | )% |
Balance of Payments (in $ billions) | | | | | | | | | | | | | | | | | | | | |
Exports | | | 137.8 | | | | 160.7 | | | | 197.9 | | | | 153.0 | | | | 201.9 | |
Imports | | | (91.4 | ) | | | (120.6 | ) | | | (173.1 | ) | | | (127.7 | ) | | | (181.7 | ) |
Current Account | | | 13.6 | | | | 1.6 | | | | (28.2 | ) | | | (24.3 | ) | | | (47.4 | ) |
Capital and Financial Account (net) | | | 16.3 | | | | 89.1 | | | | 29.4 | | | | 71.3 | | | | 99.7 | |
Change in Total Reserves | | | 30.6 | | | | 87.5 | | | | 3.0 | | | | 46.7 | | | | 49.1 | |
Total Official Reserves | | | 85.8 | | | | 180.3 | | | | 193.8 | | | | 238.5 | | | | 288.6 | |
Public Finance | | | | | | | | | | | | | | | | | | | | |
Financial Surplus (Deficit) as % of GDP(9) | | | (3.6 | )% | | | (2.8 | )% | | | (2.0 | )% | | | (3.3 | )% | | | (2.6 | )% |
Primary Surplus (Deficit) as % of GDP(10) | | | 3.2 | | | | 3.3 | | | | 3.4 | | | | 2.0 | | | | 2.8 | |
Public Debt (in billions) | | | | | | | | | | | | | | | | | | | | |
Gross Internal Debt (Nominal)(11) | | $ | 681.8 | | | $ | 984.2 | | | $ | 800.9 | | | $ | 1,241.5 | | | $ | 1,497.6 | |
Gross External Debt (Nominal)(12) | | | 72.8 | | | | 68.3 | | | | 64.5 | | | | 71.0 | | | | 72.8 | |
Public Debt as % of Nominal GDP | | | 68.1 | % | | | 70.0 | % | | | 66.7 | % | | | 71.7 | % | | | 71.2 | % |
Gross Internal Debt | | | 61.5 | | | | 65.5 | | | | 61.7 | | | | 67.8 | | | | 67.9 | |
Gross External Debt(13) | | | 6.6 | | | | 4.5 | | | | 5.0 | | | | 3.9 | | | | 3.3 | |
Total Public Debt (Nominal)(14) | | $ | 754.6 | | | $ | 1,052.5 | | | $ | 865.4 | | | $ | 1,312.4 | | | $ | 1,570.4 | |
| (1) | Converted into dollars based on the weighted average exchange rate for each year. |
| (2) | Calculated based upon constant average 2010 reais. |
| (3) | Not adjusted for purchasing power parity. |
| (4) | Unemployment in the metropolitan areas of Rio de Janeiro, São Paulo, Belo Horizonte, Porto Alegre, Salvador and Recife at the end of the relevant period. |
| (5) | IGP-DI is one indicator of inflation. While many inflation indicators are used in Brazil, the IGP-DI, calculated by the Getúlio Vargas Foundation, an independent research organization, is one of the most widely utilized indices. |
| (6) | IPCA as reported by the Brazilian Institute of Geography and Statistics (Fundação Instituto Brasileiro de Geografia e Estatística, or “IBGE”). |
| (7) | Year-on-year percentage appreciation of the dollar against the real (sell side). |
D-7
| (8) | Brazilian federal treasury securities deflated by the IGP-DI and adjusted at each month-end to denote real annual yield. |
| (9) | Financial results represent the difference between the consolidated public sector debt in one period and the consolidated public sector debt in the previous period, excluding the effects of the Federal Government’s privatization program and the effect of exchange rate fluctuations on the debt levels between periods. |
| (10) | Primary results represent Federal Government revenues less Federal Government expenditures, excluding interest expenditures on public debt. |
| (11) | Presents debt on a consolidated basis, which is calculated as the gross internal debt less credits between governmental entities. |
| (12) | Not including external private debt. Consolidated external private debt as of December 31, 2010 was $123.5 billion. |
| (13) | Gross external debt less total reserves. |
| (14) | Consolidated gross public sector debt. |
Sources: IBGE; Getúlio Vargas Foundation; Central Bank.
D-8
THE FEDERATIVE REPUBLIC OF BRAZIL
Area and Population
Brazil is the fifth largest country in the world and occupies nearly half the land area of South America. Brazil is officially divided into five regions consisting of 26 States and the Federal District, where the Republic’s capital, Brasília, is located.
Brazil has one of the most extensive river systems in the world. The dense equatorial forests and semi-arid plains of the North are drained by the Amazon River and the fertile grasslands of the South by the Paraná, Paraguay and Uruguay Rivers. Other river systems drain the central plains of Mato Grosso and the hills of Minas Gerais and Bahia. Most of the country lies between the Equator and the Tropic of Capricorn, and the climate varies from tropical to temperate. More than half of the total terrain of Brazil consists of rolling highlands varying from 650 to 3,000 feet in altitude.
According to the demographic census conducted by the IBGE in 2010, Brazil had an estimated population of 190.7 million that year. IBGE also estimates that the population is currently growing at a rate of 1.17% per year. Approximately 160.9 million people, or 84.4% of the population, live in urban areas. The largest cities in Brazil were São Paulo and Rio de Janeiro, with estimated populations of 11.2 million and 6.3 million, respectively, according to the 2010 census. Other cities with populations in excess of one million were Brasília, Belém, Belo Horizonte, Curitiba, Fortaleza, Goiânia, Manaus, Porto Alegre, Recife and Salvador. The States with the largest GDP in Brazil, São Paulo, Rio de Janeiro and Minas Gerais, had populations in excess of 41.2 million, 15.9 million and 19.5 million, respectively.
The Human Development Report for 2010, published by the United Nations Development Program, shows that Brazil has made significant progress in improving social welfare over the past four decades. During that period, life expectancy in Brazil increased by approximately 22.5% (from 59.5 years in 1970-1975 to 72.9 years in 2010) and the infant mortality rate decreased 77.9% (from 95 per 1,000 live births in 1970 to 21 per 1,000 live births in 2009). Adjusted for purchasing power parity by the International Monetary Fund, real GDP per capita rose 184% from 1980 ($3,741) to 2008 ($10,607). In addition, the reduction in inflation under the Plano Real (see “The Brazilian Economy—Historical Background”) and the consequent diminution of the erosion of purchasing power have improved the social welfare of large numbers of lower-income Brazilians.
The following table sets forth comparative GDP per capita figures and selected other comparative social indicators for 2010.
Table No. 3
Social Indicators, 2010
| | | | | | | | | | | | | | | | | | | | | | | | | | | | | | | | |
| | | Brazil | | | Argentina | | | Chile | | | Ecuador | | | Mexico | | | Peru | | | U.S. | | | Venezuela | |
Real GDP per capita(1) | | $ | 10,607 | | | $ | 14,603 | | | $ | 13,561 | | | $ | 7,931 | | | $ | 13,971 | | | $ | 8,424 | | | $ | 47,094 | | | $ | 11,846 | |
Life expectancy at birth (years) | | | 72.9 | | | | 75.7 | | | | 78.8 | | | | 75.4 | | | | 76.7 | | | | 73.7 | | | | 79.6 | | | | 74.2 | |
Under-5 mortality rate (per 1,000 births)(2) | | | 21.0 | | | | 14.0 | | | | 9.0 | | | | 24.0 | | | | 17.0 | | | | 21.0 | | | | 8.0 | | | | 18.0 | |
Adult literacy rate(3) | | | 90.0 | % | | | 97.7 | % | | | 98.6 | % | | | 84.2 | % | | | 92.9 | % | | | 89.6 | % | | | n/a | (2) | | | 95.2 | % |
| (1) | GDP per capita estimates are derived from purchasing power parity (“PPP”) calculations. Data is from 2008, since 2010 data is not yet available. |
| (2) | Data is from 2009 since 2010 data is not yet available. |
| (3) | Data refer to the most recent year available during 2005-2008. |
Source: United Nations Development Program, Human Development Report 2010.
D-9
Form of Government and Political Parties
Brazil was discovered by the Portuguese navigator Pedro Álvares Cabral in the year 1500 and remained a Portuguese colony for more than 300 years. The colonial government, first established in Salvador in the Northeast, was transferred to Rio de Janeiro in 1763. During the Napoleonic wars the Portuguese court moved from Lisbon to Rio de Janeiro, where it remained until 1821. In the following year Brazil declared its independence from Portugal, and the Prince Regent Dom Pedro I became Emperor of Brazil. His successor, Dom Pedro II, ruled Brazil for 49 years, until the proclamation of the Republic on November 15, 1889. From 1889 to 1930, the presidency of the Republic generally alternated between officeholders from the dominant States of Minas Gerais and São Paulo. This period, known as the First Republic, ended in 1930, when Getúlio Dorneles Vargas took power. Vargas governed Brazil for the next fifteen years, first as chief of a provisional government (1930-1934), then as a constitutional president elected by the National Congress (1934-1937) and finally as dictator (1937-1945) of a government that he termed the New State (Estado Novo). During the period from 1945 to 1961, Brazil held direct elections for the presidency. The resignation of President Jânio da Silva Quadros in 1961 after less than seven months in office and the resistance to the succession to the presidency of Vice President João Goulart created a political crisis that culminated in the establishment of a parliamentary system of government. The new system of government lasted approximately 16 months. In January 1963, after a plebiscite, Brazil returned to a presidential government, which was overthrown by the military in March 1964. Military governments ruled Brazil from 1964 until 1985, when a civilian president was elected by means of an electoral college composed of Senators and Deputies.
Thereafter, a series of political reforms were enacted, including the reestablishment of direct elections for the President and the calling of a Constitutional Assembly which, in October 1988, adopted a new Brazilian Constitution. In December 1989, Fernando Collor de Mello was elected President of Brazil for a five-year term in the first direct presidential election since 1960.
Brazil is a federative republic with broad powers granted to the Federal Government. The Constitution provides for three independent branches of government: an executive branch headed by the President; a legislative branch consisting of the bicameral National Congress, composed of the Chamber of Deputies and the Senate; and a judicial branch consisting of the Federal Supreme Court and lower federal and State courts. The Constitution provided for a mandatory constitutional review that began in October 1993 and ended on May 31, 1994. The review resulted in the adoption of six amendments, which included the reduction of the presidential term of office from five to four years. Since October 1994, Brazil’s Presidents have been elected to serve four-year terms, with a limit of two consecutive terms. The Constitution also provided for a plebiscite in April 1993 in which voters were permitted to consider alternative systems of government, including a return to the monarchy; in that plebiscite, the Brazilian electorate voted overwhelmingly to maintain the presidential system of government.
Under the Constitution, the President is elected by direct vote. A constitutional amendment adopted in June 1997 permits the re-election for a second term of the President and certain other elected officials. The President’s powers include the right to appoint ministers and key executives in selected administrative posts. The President may issue provisional measures (medidas provisórias) with the same scope and effect as legislation enacted by the National Congress. However, Constitutional Amendment No. 32, which became effective on September 12, 2001, prohibits the issuance of provisional measures for, among other things, the implementation of multi-year plans and budgets, the seizure of financial or other assets, and the regulation of matters which the Constitution specifically requires the National Congress to regulate through complementary law. Under Constitutional Amendment No. 32, provisional measures are enforceable for up to 60 days, extendable for a single additional period of 60 days. If a provisional measure is rejected or if it is not voted by the National Congress within the enforcement period, the provisional measure becomes invalid as of the date it was issued. The amendment expressly prohibits the re-issuance of provisional measures if the measure is not voted on by the National Congress within the enforcement period.
The legislative branch of the Federal Government consists of a bicameral National Congress composed of the Senate and the Chamber of Deputies. Ordinary legislation requires a simple majority vote in both houses of the National Congress for adoption. Amendments to the Constitution require an absolute three-fifths majority vote, in each of two rounds of voting, in both houses of the legislature. A matter addressed in a proposed amendment that is rejected cannot be reproposed during the same legislative session. The Senate is composed of 81 Senators, elected for staggered eight-year terms, and the Chamber of Deputies has 513 Deputies, elected for concurrent four-year terms. Each State and the Federal District is entitled to three Senators. The number of Deputies is based on a proportional representation system weighted in favor of the less populated States which, as the population increases in the larger States, assures the smaller States an important role in the National Congress.
The judicial power is exercised by the Federal Supreme Court (composed of 11 Justices), the Superior Court of Justice (composed of 33 Justices), the Federal Regional Courts (appeals courts), military courts, labor courts, electoral courts and
D-10
several lower federal courts. The Federal Supreme Court, whose members are appointed for life by the President (with mandatory retirement at 70 years of age), has ultimate appellate jurisdiction over decisions rendered by lower federal and State courts on Constitutional matters.
Brazil is divided administratively into 26 States and the Federal District. The States are designated as autonomous entities within the federative union and have all powers that the Constitution does not preclude the States from exercising. The Constitution reserves to the Federal Government the exclusive power to legislate in certain areas, including, among others, monetary systems, foreign affairs and trade, social security and national defense. The States may exercise legislative power in matters not reserved exclusively to the Federal Government and have, concurrently with the Federal Government, certain powers of taxation. At the State level, executive power is exercised by governors elected for four-year terms and legislative power by State deputies also elected for four-year terms. Judicial power at the State level is vested in the State courts, and appeals of State court judgments may be taken to the Superior Court of Justice and the Federal Supreme Court.
Federal, State and Local Elections
National general elections were held in October 2010. The offices of the President and State Governors, two-third of the Senate and all the seats in the Federal Chamber of Deputies, as well as seats in the State legislatures, were determined pursuant to the election. After winning a runoff election with 55.43% of the votes in the second-round of voting on October 31, 2010, Dilma Vana Rousseff was elected the first woman president of Brazil. Mrs. Rousseff assumed the presidency of Brazil on January 1, 2011, succeeding Luis Inácio Lula da Silva. Mrs. Rousseff is a member of the PT. In the October 2010 general elections, 513 federal deputies and 54 of 81 senators were elected and took office on February 1, 2011. In this general election, the coalition of political parties supporting President Rousseff obtained 59% (304/513) of the seats in the Chamber of Deputies and 62% (50/81) of the seats in the Senate. On February 1, 2011, José Sarney and Marco Maia, a senator and representative allied to President Rousseff, were elected presidents of the Senate and of the Chamber of Deputies, respectively.
On August 16, 2011, the Republic Party (Partido da República) announced that it was leaving the coalition supporting President Rousseff and declared itself independent. With the departure of the Republic Party, President Rousseff’s coalition in Congress possesses approximately 52% (266/513) of the seats in the Chamber of Deputies and 56% (45/81) of the seats in the Senate.
External Affairs and Membership in International Organizations
Brazil maintains diplomatic and trade relations with almost every nation in the world. It has been a member of the United Nations since 1945. The Republic participates in the organizations under the control of the United Nations Secretariat, as well as others of a voluntary character, such as the International Fund for Agriculture and Development.
Brazil is an original member of the International Monetary Fund (“IMF”) and the World Bank, as well as three affiliates of the World Bank, the International Finance Corporation, the International Development Association and the Multilateral Investment Guaranty Agency. Brazil was an original member of the General Agreement on Tariffs and Trade (“GATT”) and is a charter member of the World Trade Organization. In addition, Brazil is an original member of the Inter-American Development Bank (“IDB”), the Inter-American Investment Corporation, the African Development Bank Group and the International Fund for Agricultural Development.
At the regional level, Brazil participates in the Organization of American States (“OAS”) and in several sub-regional organizations under the OAS, as well as in the Latin American Economic System, the Latin American Integration Association, the Andean Development Corporation and the Financial Fund for the Development of the River Plate Basin.
In March 1991, Brazil, Argentina, Paraguay and Uruguay signed the Treaty of Asuncion, formally establishing the Southern Common Market (Mercado Comum do Sul, or “Mercosul”), a common market organization composed of the signatory nations. In December 1994, the four member countries signed an agreement establishing the date of January 1, 1995 for the implementation of a Common External Tariff (“CET”) intended to transform the region into a customs union. However, under Decision No. 59 of the Common Market Council (Conselho do Mercado Comun) dated December 17, 2007, Paraguay and Uruguay are permitted a list of excepted items of up to 649 items and 225 items, respectively, to be eliminated completely by 2015. Because of these exceptions to the CET, the full implementation of a customs union has not yet been achieved.
D-11
Mercosul has six associate members: Bolivia, Chile, Colombia, Ecuador, Peru and Venezuela. Associate members are included in free trade treaties but have no voting rights within Merscosul. On July 4, 2006, Venezuela signed in Córdoba, Argentina, the adhesion protocol to Mercosul, officially declaring its intention of becoming the fifth integrant country of the block. As of August 2011, Venezuela’s status as a full member is still pending and the free trade process between Venezuela and the four remaining partners will not be completed until January 2014.
Mercosul has attempted to form trading relations with other countries. Brazilian Presidential Decree No. 4,458 dated November 5, 2002, ratified an automobile accord between Mercosul and Mexico that is intended to increase trade in automotive products between the two parties. In December 2004, Mercosul concluded preferential trade accords with India and the Southern African Customs Union. In December 2007, Mercosul also established a free trade agreement with the State of Israel.
At the first Summit of the Americas in Miami, Florida, in December 1994, Brazil joined 33 other countries in the Western Hemisphere in negotiations for the establishment of a Free Trade Area of the Americas. In December 1995, Mercosul and the European Union signed a framework agreement for the development of free trade between the parties. In 1996, Mercosul signed agreements with Chile and Bolivia, effective October 1996 and February 1997, respectively, for the development of free trade among the parties. These agreements were approved by the National Congress in September 1996 and April 1997, respectively. Mercosul also signed an agreement with Chile, approved by Brazilian Presidential Decree No. 4,404 dated October 3, 2002, that provides for the reduction of tariffs for certain automotive, chemical and agricultural products in trade between Brazil and Chile.
On December 9, 2007, the presidents of Brazil, Argentina, Paraguay, Uruguay, Bolivia, Equator and Venezuela signed an accord that created the Bank of the South (Banco do Sul). The institution aims at being an alternative to multilateral institutions such as the IMF and the World Bank for the funding of development projects in the region. The Covenant Establishing the Banco do Sul was signed by the seven countries in September 2009 in Venezuela.
On May 23, 2008, the Union of South American Nations (“UNASUR”)—an intergovernmental union integrating twelve countries—was created as part of a continuing process of South American integration. The UNASUR member countries are: Brazil, Argentina, Paraguay, Uruguay, Bolivia, Colombia, Ecuador, Peru, Chile, Venezuela, Guyana and Suriname. One of the initiatives of UNASUR is the creation of a single market, beginning with the elimination of tariffs for non-sensitive products by 2014, and for sensitive products (products that are particularly susceptible to competition from imports from another country) by 2019. The treaty establishing UNASUR entered into force on March 11, 2011 with ten countries having deposited their instruments of ratification (Argentina, Brazil, Bolivia, Chile, Ecuador, Guyana, Peru, Suriname, Uruguay and Venezuela).
On April 3, 2009, the Customs Union of Southern Africa (“SACU”), a block that consists of five African countries (South Africa, Botswana, Lesotho, Namíbia and Swaziland), signed an agreement with Mercosur that provides for a reduction in the trade tariffs between the two economic blocks. This is the third agreement that Mercosur has signed beyond its region. The previous agreements were signed with India in 2005 and Israel in 2007. Decree No. 7,159 dated April 27, 2010 sets forth the Free Trade Agreement between Mercosur and Israel. With this decree, the Free Trade Agreement became effective in Brazil and created a free trade area that removes most tariff barriers for the trade of goods between the two countries.
On June 10, 2009, the Minister of Finance, Guido Mantega, announced that Brazil would lend $10 billion to the IMF, which is approximately the amount of Brazil’s quota in the IMF. This decision was a result of the G-20 meeting held in London on April 2, 2009, in which former President da Silva stated that Brazil wished to contribute to the IMF. The IMF issued bonds to Brazil in exchange for the $10 billion loan. The closing of this loan was conditioned upon the issuance of such bonds by the IMF and also on the end of the revision process of the New Agreement to Borrow (“NAB”). The NAB was signed between Brazil and the IMF on January 22, 2010.
On December 9, 2009, the Bank for International Settlements (“BIS”) formalized the entry of Brazil to the Committee on the Global Financial System and Markets. The committee’s major function is to monitor the development of financial markets for major Central Banks.
The Final Protocol of the São Paulo Round of the Global System of Trade Preferences among Developing Countries (“GSTP”) was signed on December 15, 2010. This agreement reduces tariffs on 70% of products imported by signatory countries by 20%. The agreement was signed by eleven developing nations that play a major part in international trade—the Mercosur countries (Brazil, Argentina, Paraguay and Uruguay) plus Cuba, Egypt, India, Indonesia, Malaysia, Morocco and the Republic of Korea.
D-12
In March 2011, ten bilateral agreements were signed between Brazil and the United States. The ten agreements address several strategic areas of bilateral cooperation, including trade and economic cooperation (setting up a high-level commission on economic and commercial cooperation), air transportation, peaceful use of outer space, support for large sports events (the World Soccer Cup and the Olympic Games), research in biodiversity, development of a biofuel for aviation and technical cooperation with other countries. The parties have established the Brazil-United States Commission on Economic and Trade Relations, with the objective of promoting bilateral economic and trade cooperation.
The last Brazil-Russia-India-China-South Africa (BRICS) summit took place in China, on April 14, 2011. The event is the third since BRICS was formed in 2009. At the summit, BRICS unveiled a Declaration and Action Plan which provides for greater coordination among the member countries on a range of issues including the fight against terrorism, challenges to food energy and food security and cooperation on finance, agriculture and sports.
D-13
THE BRAZILIAN ECONOMY
Historical Background
From the late 1960s through 1982, Brazil followed an import-substitution, high-growth development strategy financed, in large part, by heavy recourse to foreign borrowing. Foreign debt grew at an accelerated pace in response to the oil shocks of the 1970s and, when international interest rates rose sharply in 1979-80, the resulting accumulated external debt became one of Brazil’s most pressing problems in the decade that followed. See “Public Debt—Debt Restructuring and Debt Record”. The debt crisis of the 1980s and high inflation substantially depressed real growth of Brazil’s GDP, which averaged 2.3% per year from 1981 to 1989. The public sector’s role in the economy also expanded markedly, with many key economic sectors subject to Federal Government monopoly or subsidized participation.
Efforts to address these problems during the late 1980s and early 1990s were largely unsuccessful. High inflation and the recurrent threat of hyperinflation during this period prompted the Federal Government to pursue a series of stabilization plans, but these plans were mostly ineffective because they lacked important supporting mechanisms. Stabilization measures implemented at that time relied on mechanisms, such as price and wage freezes and/or unilateral modifications of the terms of financial contracts, that were not supported by fiscal and monetary reforms. A central problem during this period was the public sector, which ran operational deficits averaging more than 5% of GDP during the five-year period from 1985 to 1989, while monetary policy was compromised by the short-term refinancing of public sector debt. These problems were aggravated by the 1988 Constitution, which limited the ability of the Federal Government to dismiss public sector employees and reallocated public resources, in particular tax revenues, from the Federal Government to the States and municipalities without a proportional shift of responsibilities to them, thereby further constraining the effectiveness of Federal Government fiscal policy. The practice of inflation indexation in the economy, which made prices downwardly rigid, also helped to undermine stabilization measures. See “—Relationship between the Federal and Local Governments”, “—Employment” and “Public Finance—Taxation and Revenue Sharing Systems”.
In December 1993, the Federal Government announced a stabilization program, known as the Plano Real, aimed at curtailing inflation and building a foundation for sustained economic growth. The Plano Real was designed to address persistent deficits in the Federal Government’s accounts, expansive credit policies and widespread, backward-looking indexation.
Largely as a result of the measures under the Plano Real, the average monthly rate of inflation dropped significantly from 43.1% during the first half of 1994 to 2.9% during the second half of that year. The annual rate of inflation for 1994 was 916.4%, down from 2,477.2% in 1993. The public sector operational balance also showed a surplus of 1.3% of GDP in 1994, versus a 0.2% of GDP public sector operational surplus in 1993. However, the external accounts showed a higher current account deficit in 1994 as a result of an increase in imports and a reduction in net capital account surplus.
Following its decision to permit the real to float, the Federal Government formally adopted inflation targeting as its monetary policy framework. See “The Financial System—Monetary Policy and Money Supply”. The Federal Government also began negotiations with the IMF on adjustments to the 1999-2001 economic program agreed in November 1998 and new economic targets in light of the new foreign exchange regime introduced in January 1999.
During the second half of 2000, uncertainties about the U.S. economy, concerns about Argentina and rising oil prices caused the real to decline in value against the U.S. dollar. Brazil’s continued compliance with a $41.8 billion IMF-led support program agreed on November 13, 1998, as established by the IMF’s sixth review on November 28, 2000, and an improvement in the external environment resulting from interest rate reductions in the United States, reduced the downward pressure on the exchange rate. From 2001 to 2002 the real suffered from multiple external and domestic pressures that ultimately led to the depreciation of the currency. Key external factors included Argentina’s financial crisis, misgivings about Argentine exchange rate policies, uncertainties about the U.S. economy, rising oil prices and the September 11th attacks. Domestic pressures included severe power shortages and election uncertainties.
To avoid further depreciation of the real, the Central Bank intervened in the foreign exchange market by selling U.S. dollars and buying reais. The Central Bank also raised its Over/Selic rate target to limit increases in core inflation, uncertainties related to the effects of exchange rate depreciation and the accelerating pace of economic activity. In addition, the Federal Government sought to contain currency depreciation by increasing its international reserves available for financing future interventions to support the real.
D-14
The real was also helped by the IMF’s approval of standby facilities for Brazil. On September 14, 2001, the IMF announced that its Executive Board had approved a new standby facility for Brazil in the amount of Special Drawing Rights (“SDR”) 12.14 billion (approximately $15.6 billion) in support of the Federal Government’s economic and financial program through December 2002.
On December 15, 2003, the IMF announced that its Executive Board had approved a fifteen-month extension of Brazil’s existing standby facility. A total of SDR 10.1 billion (approximately $14.8 billion) was available under the facility, consisting of SDR 5.6 billion (approximately $8.2 billion) in unused amounts under the existing facility and SDR 4.5 billion (approximately $6.6 billion) in additional funds. In addition, the IMF extended by one year repurchases of SDR 4 billion (approximately $5.8 billion) that Brazil would otherwise have been required to make in each of 2005 and 2006. In its Letter of Intent relating to the extended and augmented facility, Brazil stated that the maintenance of sound fiscal and monetary policies lay at the core of its program for 2004, including a primary surplus target of 4.25% of GDP for 2004.
On June 18, 2004, the IMF announced that it had completed the seventh review of Brazil’s performance under the standby facility. The IMF stated that Brazil had satisfied all performance criteria under the facility. The Federal Government had advised the IMF that it considered the arrangement precautionary and did not draw on the most recent installment under the facility. The standby agreement with the IMF was last reviewed on March 21, 2005. On March 28, 2005, the Federal Government announced that Brazil would not renew the agreement with the IMF because of improvement and a reduction in external and fiscal vulnerability since the last renewal on September 2003. The standby facility expired on March 31, 2005.
On July 13, 2005, the Central Bank announced that the Federal Government had decided to prepay $4.9 billion in obligations owed to the IMF. Brazil made this prepayment on July 22, 2005. On December 27, 2005, Brazil prepaid the $10.8 billion in SDRs (equivalent to approximately $15.5 billion) that remained outstanding under the IMF standby facility. Under the original schedule, the final repayment of the amounts due to the IMF would have occurred in 2007.
The IMF approved on October 29, 2008, the “Short-Term Liquidity Facility”, a tool to address short-term external liquidity to its member countries as a result of a liquidity shortage in the international interbank system. Brazil can draw the equivalent of 500% of its quota in the IMF for a period of three months, renewable for another two periods of three months. Every twelve months, the member country will be entitled to make a maximum of three successive withdrawals. The borrower country must declare in a letter to the IMF Managing Director its commitment to maintain sound macroeconomic policies.
On April 9, 2009, the Ministry of Finance announced Brazil’s participation in the Financial Transaction Plan (“TFP”), which makes Brazil part of the group of creditors and not debtors of the IMF. On June 10, 2009, the Ministry of Finance announced a $10.0 billion contribution to the TFP, which will help the IMF make loans to emerging countries that are suffering from problems resulting from the current global economic crisis. As compensation, Brazil will obtain from the IMF a special drawing right in a value equal to the Brazilian contribution.
Economic Events and Policies
On September 24, 2010, Petrobrás raised approximately R$120 billion in the largest stock issuance ever, providing it with the cash needed to realize its offshore development plan. The company intends to use the proceeds of the R$120 billion offering to finance the company’s business plan to develop pre-salt fields off Brazil’s Atlantic coast, as the country seeks to tap deeper deposits and join the world’s top oil producers. As a result of Petrobrás’ capitalization, the Federal Government had a record primary surplus in September 2010, primarily due to the Federal Government receipt of R$74.8 billion from Petrobrás in return for 5 billion barrels of ultradeepwater oil reserves. This made it possible for the consolidated public sector to end the year near its primary surplus target for 2010. See “Public Finance—Budget Process”.
On October 5, 2010, through Decree No. 7,323, the Federal Government increased the Tax on Financial Transactions (Imposto sobre Operações Financeiras, or “IOF”) on foreign portfolio investment in fixed-income instruments from 2% to 4%. The Federal Government’s intention was to avoid overvaluation of the real, which had negatively impacted the trade balance and increased the current account deficit. With the same objective, the CMN approved Resolution No. 3,911 on October 5, 2010, widening the window for purchasing currency on the foreign exchange market for debt payments to 1,500 days from 750 days. This measure applies to both private borrowers and to the National Treasury. With this measure, the Federal Government can increase its purchases of dollars in the local currency market to pay off foreign debt obligations. On October 18, 2010, through Decree No. 7,330, the Federal Government announced an additional increase in the IOF tax, from 4% to 6%, and a separate increase in the IOF tax, from 0.38% to 6%, on margin operations with respect to the futures market in Brazil.
D-15
On December 3, 2010, the CMN and the Board of Governors of the Central Bank adopted a set of macroeconomic prudential measures in order to improve the existing regulatory tools, maintain the stability of the National Financial System and allow the continuity of the sustainable credit market development. The initiatives are also aimed at continuing the process of gradual withdrawal of the incentives introduced to minimize the effects of the 2008 international financial crisis. As part of the initiatives, the additional reserve requirement over demand and time deposits was increased from 8% to 12% and the reserve requirement over time deposits was increased from 15% to 20%. In addition, the time period for the reduction of the Industrialized Products Tax (“IPI”) was extended until December 2011 under Decree No. 7,394 dated December 15, 2010, and then extended again until December 2014 under Decree No. 7,542 dated August 2, 2011.
In accordance with Decree No. 6,867, Petrobrás, the state-controlled oil company that had historically accounted for approximately 0.5% of the primary surplus of the federal budget in nominal terms, was removed from the calculation of the primary surplus beginning in 2009. In accordance with Law No. 12,377 of December 30, 2010, Eletrobrás, the state-controlled electricity holding company that historically had accounted for approximately 0.2% of the primary surplus of the federal budget in nominal terms, was also removed from the calculation of the primary surplus beginning in 2010.
Dilma Vana Rousseff was elected president of Brazil in October 2010 and took office on January 1, 2011, replacing president Luiz Inácio Lula da Silva. On February 1, 2011, José Sarney and Marco Maia, a senator and representative allied to President Rousseff, were elected presidents of the Senate and of the Chamber of Deputies, respectively.
President Rousseff’s administration has continued adopting measures in order to avoid the appreciation of the real against other foreign currencies in the exchange market. As a part of these measures, on September 17, 2010, the Government authorized the managers of Brazil’s Sovereign Fund to purchase dollars on the foreign exchange market and enter into derivative contracts . In addition, on January 6, 2011, Central Bank Circular No. 3,520 created a mandatory deposit (which came into force on April 4, 2011) to be made by all banks authorized to deal in foreign exchange in Brazil, at the rate of 60% over the result of their daily selling exchange position exceeding $3 billion or their respective equity reference value, whichever is lesser. The mandatory deposit requirements were later altered by Central Bank Circular No. 3,548. See “Balance of Payments and Foreign Trade—Foreign Exchange Rates and Exchange Controls”.
On February 9, 2011, President Rousseff signed the Annual Budget Law No. 12,381 (Lei Orçamentária Anual , or “LOA”) for 2011. The consolidated public sector primary surplus target for 2011 was set at R$117.9 billion, an amount that may be reduced by up to R$55.9 billion of expenses from PAC.
President Rousseff has aimed to curb spending in order to achieve the consolidated public sector primary surplus target for 2011. As a result, on February 9, 2011, the Federal Government announced a reduction in budgeted expenses for 2011 by approximately R$50.0 billion. On March 21, 2011, the reduction was increased to R$50.7 billion. This was formalized by Measure No. 39 issued by the Ministry of Planning, Budget and Management on March 25, 2011. Even though total budgeted expenditures were reduced, spending for social programs and infrastructure investments was maintained. In addition, President Rousseff suspended for an indefinite period of time competitive examinations for the hiring of personnel to positions in the Federal Government.
In February 2011, the National Congress passed a law establishing a minimum wage of R$545, R$35 higher than the minimum wage established for 2010, and setting guidelines for future minimum wage adjustments until the year 2015 which will be based on inflation and GDP growth.
By means of Decree No. 7,456 dated March 28, 2011, the Government set an IOF tax of 6% on external loans and bonds with durations shorter than 360 days, which duration was extended to 720 days by Decree No. 7,457 dated April 6, 2011. These measures are intended to reduce short-term capital flows; loans with duration of more than 720 days and foreign direct investment remain exempt.
On April 9, 2011, pursuant to Decree No. 7,458, the IOF tax on consumer loans was raised from 1.5% to 3.0% per year. The higher tax will be levied on all consumer loans, except mortgages and loans for legal entities. The IOF increase is a macro-prudential measure aimed at slowing credit growth, consumption and inflation. The IOF rate on credit card purchases abroad was increased on March 25, 2011, pursuant to Decree No. 7.454, from 2.38% to 6.38%.
On April 28, 2011, the Government issued Decree No. 7,468, cancelling approximately R$9.8 billion of restos a pagar from 2007, 2008, and 2009, as another measure to limit spending. As these restos a pagar relate to budgeted activities that were never initiated, the Republic has the option to cancel them.
D-16
Relationship between the Federal and Local Governments
Resolution No. 33 dated 2006 allows the States, the Federal District and municipalities to transfer credits from consolidated active debt to private banks; such credits are to be against companies or individuals for unpaid debts with a term greater than 12 months, in exchange for receiving up to 30% of the amounts due from such companies or individuals.
Law No. 11,457 dated March 16, 2007 (with specifications given by Decree No. 6.166 dated July 24, 2007) allows for installment payments by States and the Federal District of amounts owed as social contributions to Social Security in up to 240 monthly payments, with a discount of 50% of the deferred payment interest and application of interest only if there is no payment. For the workers’ discounted contributions that have not been sent to Brazil’s Federal Revenue (“RFB”), the amendment allows installment payments for up to 60 months. If the installment is not paid, the National Treasury can keep resources of the States Participation Fund as collateral for the difference, and charge interest based on the Over/Selic rate. The monthly installment should be at least 1.5% of the average of the net current revenue of the State as stated in the Fiscal Responsibility Law. See “Public Finance—Fiscal Responsibility Law and Fiscal Crime Law”. The installment payment option will not be available if there is a lack of payment of three consecutive installments or six alternating installments, or an absence of payment of the contributions due after the installment payments end.
Constitutional Amendment No. 55/2007, published by the National Congress on September 20, 2007, raises the financial resources of the Municipalities Participation Fund from 22.5% to 23.5%, which is funded by proceeds from Income Tax and from the Brazilian federal sales tax (the Imposto Sobre Produtos Industrializados, or “IPI”).
Through Provisional Measure No. 457 dated February 10, 2009 (subsequently enacted as Law No. 11,960 dated June 29, 2009), the Federal Government decided to allow all the municipalities to re-negotiate their debts with the National Social Security Institute (Instituto Nacional do Seguro Social, or “INSS”). The outstanding debts with maturity dates prior to January 31, 2009 were scheduled to be repaid in installments of up to 240 months.
Constitutional Amendment No. 62 dated December 9, 2009 limited the payment of judicial debts (precatório) of States and municipalities. The amendment established that States must commit between 1.5% and 2% of their net current revenues to pay their judicial debts, while for municipalities this percentage is between 1% and 1.5%.
On July 16, 2010, the RFB and the Procuradoria-Geral da Fazenda Nacional (“PGFN”) released the Joint Administrative Norm PGFN/RFB No. 14, allowing municipalities to cure their past due installments up to July 30, 2010. The Norm also provides that the municipalities concerned will allow the Federal Government to withhold the Municipalities Participation Fund for the payment of the monthly installment. The Municipalities Participation Fund is a constitutionally required transfer of resources from the Federal Government to municipalities based on the number of inhabitants in the municipality.
On March 31, 2011, the CMN approved an increase in the loan limit for States and municipalities for their paving and sanitation projects under PAC 2, which limit is now at R$6.3 billion. Of the total loan limit of R$6. 3 billion, R$3.9 billion will be earmarked for environmental sanitation activities and R$2.4 billion for road works and qualification of urban roads.
On April 28, 2011, the CMN extended the deadline for all States and the Federal District to make use of credit lines available through the National Bank for Economic and Social Development (“BNDES”) to December 31, 2011. The credit lines, known as PEF I and PEF II (Emergency Program for Financial Aid to the States) are allotted to carry out capital spending as investments. The first credit line of R$4.0 billion expired on June 30, 2010. The second credit line of R$6.0 billion expired on June 30, 2011. Of the R$10.0 billion originally available of the combined credit lines, approximately R$1.3 billion had not yet been used as of April 2011.
Gross Domestic Product
Brazil’s GDP increased by 7.5% in 2010 relative to 2009. The industrial and agricultural sectors increased by 10.1%, and 6.5%, respectively, in 2010 relative to 2009, while the service sector increased 5.4% in 2010 relative to 2009. With respect to demand, gross fixed capital formation increased 21.8 % in 2010 relative to 2009. Household consumption increased by 7.0%, while public administration consumption grew by 3.3% in 2010 relative to 2009.
The following table sets forth Brazil’s GDP at current prices and expenditures for each of the years indicated.
D-17
Table No. 4
Gross Domestic Product at Current Prices(1)—In Billions of Reais (R$)
| | | | | | | | | | | | | | | | | | | | | | | | | | | | | | | | | | | | | | | | |
| | | 2006 | | | 2007 | | | 2008 | | | 2009 | | | 2010 | |
| | | R$ | | | % | | | R$ | | | % | | | R$ | | | % | | | R$ | | | % | | | R$ | | | % | |
Final Consumption | | | 1,903.7 | | | | 80.3 | | | | 2,133.1 | | | | 80.2 | | | | 2,398.9 | | | | 79.1 | | | | 2,661.1 | | | | 83.5 | | | | 3,004.1 | | | | 81.7 | |
Gross Capital Formation | | | 397.0 | | | | 16.8 | | | | 487.8 | | | | 18.3 | | | | 627.2 | | | | 20.7 | | | | 525.8 | | | | 16.5 | | | | 707.4 | | | | 19.2 | |
Gross Fixed Capital Formation | | | 389.3 | | | | 16.4 | | | | 464.1 | | | | 17.4 | | | | 579.5 | | | | 19.1 | | | | 539.8 | | | | 16.9 | | | | 677.9 | | | | 18.4 | |
Changes in Inventories | | | 7.7 | | | | 0.3 | | | | 23.6 | | | | 0.9 | | | | 47.6 | | | | 1.6 | | | | (13.9 | ) | | | (0.4 | ) | | | 29.6 | | | | 0.8 | |
Exports of Goods and Services | | | 340.5 | | | | 14.4 | | | | 355.7 | | | | 13.4 | | | | 414.3 | | | | 13.7 | | | | 354.2 | | | | 11.1 | | | | 409.9 | | | | 11.2 | |
Less: Imports of Goods and Services | | | 271.7 | | | | 11.5 | | | | 315.2 | | | | 11.8 | | | | 408.5 | | | | 13.5 | | | | 356.0 | | | | 11.2 | | | | 446.4 | | | | 12.1 | |
Gross Domestic Product | | | 2,369.5 | | | | 100.0 | | | | 2,661.3 | | | | 100.0 | | | | 3,031.9 | | | | 100.0 | | | | 3,185.1 | | | | 100.0 | | | | 3,675.0 | | | | 100.0 | |
| (1) | Figures stated in accordance with revised methodology. In March 2007, IBGE revised its methodology for calculating GDP and restated its historic GDP data dating back to 1995. Under the new methodology, a broader range of sources of information is used to provide a more accurate measure of Brazil’s GDP. Sources such as IBGE’s annual survey of economic segments, tax receipts information and household surveys are utilized to calculate GDP. As a result, activities that were previously estimated under the prior methodology, such as government consumption and financial intermediation, are now actually measured. In addition, the relative weights of economic activities were adjusted to give greater importance to services such as telecommunications and transportation. |
Source: IBGE.
D-18
The following tables set forth the participation of classes and activities in value added at basic prices and real growth at basic prices by sector for each of the years indicated.
Table No. 5
Participation of Classes and Activities in Value Added at Basic Prices
| | | | | | | | | | | | | | | | | | | | |
| | | 2006 | | | 2007 | | | 2008 | | | 2009 | | | 2010 | |
Agriculture | | | 5.5 | % | | | 5.6 | % | | | 5.9 | % | | | 6.1 | % | | | 5.8 | % |
Industry | | | 28.8 | % | | | 27.8 | % | | | 27.9 | % | | | 25.4 | % | | | 26.8 | % |
Mining, Oil and Gas | | | 2.9 | % | | | 2.3 | % | | | 3.2 | % | | | 1.3 | % | | | 2.5 | % |
Manufacturing | | | 17.4 | % | | | 17.0 | % | | | 16.6 | % | | | 15.8 | % | | | 15.8 | % |
Construction | | | 4.7 | % | | | 4.9 | % | | | 4.9 | % | | | 4.9 | % | | | 5.3 | % |
Public Utilities | | | 3.8 | % | | | 3.6 | % | | | 3.1 | % | | | 3.4 | % | | | 3.3 | % |
Services | | | 65.8 | % | | | 66.6 | % | | | 66.2 | % | | | 68.5 | % | | | 67.4 | % |
Retail Services | | | 11.5 | % | | | 12.1 | % | | | 12.5 | % | | | 11.8 | % | | | 11.9 | % |
Transportation | | | 4.8 | % | | | 4.8 | % | | | 5.0 | % | | | 5.1 | % | | | 5.3 | % |
Communications | | | 3.8 | % | | | 3.8 | % | | | 3.8 | % | | | 3.7 | % | | | 3.4 | % |
Financial Services(1) | | | 7.2 | % | | | 7.7 | % | | | 6.8 | % | | | 7.3 | % | | | 7.7 | % |
Government(2) | | | 15.3 | % | | | 15.5 | % | | | 15.8 | % | | | 17.0 | % | | | 16.5 | % |
Rental Services | | | 8.7 | % | | | 8.5 | % | | | 8.2 | % | | | 8.4 | % | | | 7.9 | % |
Other Services | | | 14.5 | % | | | 14.2 | % | | | 14.1 | % | | | 15.1 | % | | | 14.7 | % |
| | | | | | | | | | | | | | | | | | | | |
Value Added at Basic Prices | | | 100.0 | | | | 100.0 | | | | 100.0 | | | | 100.0 | | | | 100.0 | |
| (1) | Financial intermediation, complementary social security and related services. |
| (2) | Includes Public Education, Health and Administration. |
Sources: IBGE.
Table No. 6
Real Growth (Decline) at Basic Prices by Sector
| | | | | | | | | | | | | | | | | | | | |
| | | 2006 | | | 2007 | | | 2008 | | | 2009 | | | 2010 | |
Real GDP | | | 4.0 | % | | | 6.1 | % | | | 5.2 | % | | | (0.6 | )% | | | 7.5 | % |
Agriculture and Livestock | | | 4.5 | % | | | 4.8 | % | | | 6.1 | % | | | (4.6 | )% | | | 6.5 | % |
Industry | | | 2.3 | % | | | 5.3 | % | | | 4.1 | % | | | (6.4 | )% | | | 10.1 | % |
Mining, Oil and Gas | | | 4.4 | % | | | 3.7 | % | | | 3.5 | % | | | (1.1 | )% | | | 15.7 | % |
Manufacturing | | | 1.1 | % | | | 5.6 | % | | | 3.0 | % | | | (8.2 | )% | | | 9.7 | % |
Construction | | | 4.7 | % | | | 4.9 | % | | | 7.9 | % | | | (6.3 | )% | | | 11.6 | % |
Public Utilities | | | 3.5 | % | | | 5.4 | % | | | 4.5 | % | | | (2.6 | )% | | | 7.8 | % |
Services | | | 4.2 | % | | | 6.1 | % | | | 4.9 | % | | | 2.2 | % | | | 5.4 | % |
Retail Services | | | 5.9 | % | | | 8.4 | % | | | 6.1 | % | | | (1.8 | )% | | | 10.7 | % |
Transport | | | 3.2 | % | | | 5.0 | % | | | 7.0 | % | | | (2.5 | )% | | | 8.9 | % |
Communications | | | 1.6 | % | | | 7.4 | % | | | 8.8 | % | | | 3.8 | % | | | 3.8 | % |
Government | | | 3.3 | % | | | 2.3 | % | | | 0.9 | % | | | 3.3 | % | | | 2.3 | % |
Financial Institutions | | | 8.4 | % | | | 15.1 | % | | | 12.6 | % | | | 7.1 | % | | | 10.7 | % |
Rental Services | | | 3.0 | % | | | 4.9 | % | | | 1.8 | % | | | 1.9 | % | | | 1.7 | % |
Other Services | | | 4.0 | % | | | 4.8 | % | | | 4.3 | % | | | 3.5 | % | | | 3.6 | % |
Source: IBGE.
D-19
Principal Sectors of the Economy
Until the 1950s, natural resources and agriculture were the major sectors in the Brazilian economy. Beginning in the mid-1950s and during the 1960s and 1970s, however, emphasis was placed on industrial development, financed in part by external debt. As a result, the contribution of manufactured goods to Brazilian export revenues has increased significantly, reaching 15.0% in 1970, 44.8% in 1980, 55.0% in 1995. However, the contribution of manufactured goods to Brazilian export revenues has decreased in the last few years to 52.3% in 2007, 46.8% in 2008, 44.02% in 2009 and 39.4% in 2010. In 2010, there was an increase of 18.1% in terms of price and no variation in terms of volume of exports of manufactured goods in relation to 2009.
Services. The service sector grew by 4.2% in 2006 (a 5.9% rise in retail services and an 8.4% rise in financial institutions); 6.1% in 2007 (a 7.4% rise in communications and a 15.1% rise in financial institutions); 4.9% in 2008 (an 8.8% rise in communications and a 12.6% rise in financial institutions); 2.2% in 2009 (a 3.8% rise in communications and a 7.1% rise in financial institutions). In 2010, the service sector grew by 5.4%, including a rise in retail services and financial institutions sectors by 10.7% and 10.7%, respectively. Participation of services in value added (at basic prices) was 67.4% in 2010.
Transport. Brazil’s road network is comprised of approximately 1.71 million kilometers, of which approximately 12.4% is paved. Most paved roads are maintained by federal and State authorities, while the vast majority of unpaved roads are the responsibility of local authorities. Brazil’s railway system consists of approximately 29,600 kilometers. Between 2001 and 2009, the freight on railways in Brazil increased from 162.2 billion Revenue Tonne Kilometre (“RTK”) to 245.3 billion RTK, a growth of 51.2%.
The Federal Government has taken initiatives to improve highway, railway and shipping infrastructure. Further, the process of privatization of the operation and maintenance of certain highways has begun and private companies have been permitted to install toll booths on thousands of kilometers of the country’s roads. On October 9, 2007, the National Land Transportation Agency conducted an auction of 25-year concession contracts for 2,600 kilometers.
On November 5, 2010, the Federal Government issued Provisional Measure No. 511, which subsequently became Law No. 12,404, to create the High Speed Train Company (ETAV) to oversee the building and running of the high speed train linking Campinas City, São Paulo City and Rio de Janeiro City and to authorize the Republic to offer a loan guarantee of up to R$20 billion by the BNDES to a consortium selected to build the high speed train. The reference studies indicate an estimated cost of R$33.1 billion for the building of the 510.8 km route. The rules regarding the selection of the companies that will build the first part of the high speed train project are expected to be announced during the fourth quarter of 2011.
The main Brazilian cities are served by both domestic and international airlines, and many smaller communities benefit from scheduled service by domestic airlines. In 2010, there were 155.4 million passenger aircraft boardings in the 67 airports managed by Infraero (the public company that manages airports in Brazil). On April 26, 2011, the Federal Government announced a plan to hand over the country’s five largest airports to the private sector through concession agreements.
Brazil’s main ports are in Rio de Janeiro, Santos, Paranaguá, Rio Grande and São Sebastião. The Brazilian port system consists of 37 public ports: 34 sea ports, and 3 fluvial ports.
Telecommunications. As of December 31, 2010, Brazil had approximately 42.1 million fixed telephone lines and 202.9 million cellular phones. Until its privatization in 1998, the network was run by concessionaires in each State that were subsidiaries of Telecomunicações Brasileiras S.A. (“Telebrás”). Since the late 1980s, considerable investment had been made in the expansion of the services of Telebrás, including the establishment of cellular telephone systems in all of the States and the first fiber optic communications connection between the cities of Rio de Janeiro and São Paulo, which largely accounts for the recent significant growth in the communications sector. Law No. 9,295 dated July 19, 1996, permits the Federal Government to auction, to private sector companies, licenses to build and operate cellular telephone systems. Pursuant to that law, the Federal Government completed the auctioning of “Band B” cellular telecommunications licenses and “Band D” and “Band E” mobile phone concessions to private operators. In addition, on July 29, 1998, the Federal Government sold its interest in Telebrás for approximately $19.0 billion. See “—State-Controlled Enterprises—Privatization Program”. In December 2007, the Federal Government completed the auctioning of “Band F”, “Band G”, “Band I” and “Band J” of mobile networks to private operators and on December 14, 2010, the Federal Government auctioned “Band H” of mobile networks to private operators.
D-20
Public Utilities. In 2002, in order to evaluate a proposed electricity sector model, the Revitalization Committee of the Electricity Sector Model was instituted. During 2003 and 2004, the Federal Government launched benchmarks for a new model for the Brazilian Electricity Sector, pursuant to Law Nos. 10,847 and 10,848 dated 2004 and by Decree No. 5163 dated 2004. Institutionally, the new model created (i) the Enterprise for Energetic Research (Empresa de Pesquisa Energética, or “EPE”), which is responsible for the long range planning of the electricity sector, (ii) the Electricity Sector Monitoring Committee, the objective of which is to permanently evaluate the security of the electric energy supply and (iii) the Chamber for the Electric Energy Trade (Câmara de Comercialização de Energia Elétrica or “CCEE”), in order to commercialize electric energy in the Interconnected System (Sistema Interligado Nacional, or “SIN”).
The Brazilian Electricity Regulatory Agency (Agência Nacional de Energia Elétrica) is responsible for the regulation of contract bids for regulated electrical energy and for holding auctions directly or at the request of the CCEE. The lowest tariff criterion determines the auction winner, i.e., the winners of the auction are those who can offer electric energy at the lowest megawatts (MW) per hour (“MWh”) price for the distributors’ projected demand. Total electricity generation in 2009 was 434.9 million MWh, a fall of 2.4% in relation to the total electricity generation of 2008. Given the hydrothermic configuration of SIN, the plants in CCEE are registered in two classifications: hydroelectric and thermal (coal, gas, oil, asphalt residual, nuclear and other). In 2010, hydroelectric generation represented approximately 87% of all energy produced in Brazil, and thermal generation represented approximately 13% of all energy produced in Brazil.
On December 10, 2007, the Brazilian Electricity Regulatory Agency successfully auctioned an energy concession for the Santo Antônio hydroelectric plant, located in the Madeira River Complex, with an installed capacity of 3,150.4 MW. The total investment is valued at R$9.5 billion. On May 19, 2008, the Brazilian Electricity Regulatory Agency also successfully auctioned an energy concession for the Jirau hydroelectric plant, also in the Madeira River Complex, with an installed capacity of 3,300 MW. The total investment is valued at R$8.7 billion. On April 20, 2010, an auction was held for the Belo Monte Hydroelectric Plant, which will have the capacity to generate 11,233.1 MW of energy. The estimated construction cost is R$19 billion and Belo Monte should begin production on February 2015.
Mining, Oil and Gas. Oil production showed an average increase of 5.3% per year from 2000 to 2010, with production reaching 750.0 million barrels in 2010. In 1997, Law No. 9,478 ended the company Petrobrás S.A.’s monopoly of the oil industry in Brazil and defined for the Republic the role of regulation and fiscalization of the sector. The National Oil Agency (Agência Nacional do Petróleo, or “ANP”), an agency linked to the Ministry of Mines and Energy, was created to regulate the oil industry in Brazil. One of ANP’s tasks is to promote tenders of oil exploitation and natural gas areas or blocks concessions. Since 1999, 10 tenders have been held, which has resulted in the exploitation of block concessions to Petrobrás and to various international firms.
On November 8, 2007, Petrobrás announced the discovery of new areas of oil extraction in the offshore Tupi field, located in the Santos basin, which could significantly increase the country’s oil and natural gas reserves (currently estimated at 14 billion barrels). On January 21, 2008, Petrobrás announced the discovery of a new gas reserve close to the Tupi field. The extraction of oil from the Campo de Tupi started on May 1, 2009. The first definitive production system was installed in the Tupi area on October 28, 2010.
Sugar and alcohol production costs in Brazil’s most efficient plants are competitive to European beetroot sugar plants or to American corn alcohol plants. Brazilian production of ethylic alcohol (hydrated and anidre) reached 26.1 billion cubic meters in 2009, representing a 3.8% decrease compared to 2008 when the country produced 27.1 billion cubic meters. With the issuance of Provisional Measure No. 532 dated April 28, 2011, ANP began to regulate the production of ethanol in Brazil.
The Federal Government has promoted biodiesel production implementation and its sustainable use—technically and economically—through the National Program for the Production and Use of Biodiesel (Programa Nacional de Produção e Uso do Biodiesel). Biodiesel fuel can be produced from animal fat or vegetable oil, and dozens of vegetables in Brazil are suitable as a biodiesel energy source.
Biodiesel reduces amounts expended on diesel oil and petrol imports. Biodiesel production was 69.0 thousand cubic meters in 2006, 404.3 thousand cubic meters in 2007, 1,167.1 thousand cubic meters in 2008, 1,608.4 thousand cubic meters in 2009 and 2,397.3 thousand cubic meters in 2010.
Law No. 11,097 dated January 13, 2005 mandates the addition of a minimum ratio of biodiesel to consumer traded diesel oil throughout the Republic. Since January 1, 2010, all diesel oil traded in Brazil contains 5% biodiesel in its composition.
D-21
Industrial Production. Industrial production grew 2.3% in 2006, 5.3% in 2007, 4.4% in 2008. It decreased 6.4% in 2009 but increased 10.1% in 2010. The manufacturing industry grew by 1.1% in 2006, 5.6% in 2007 and 3.0% in 2008. It decreased by 8.2% in 2009 but increased by 9.7% in 2010. Capital goods and durable consumer goods production increased, respectively, 5.7% and 5.8% in 2006; 19.5% and 9.1% in 2007; 14.3% and 3.8% in 2008; decreased 17.4% and 6.4% in 2009; and increased 20.8% and 10.3% in 2010. Participation of industry in value added at basic prices was 26.8% in 2010. All percentages given are with respect to the previous year.
Construction. Construction sector activity grew by 4.7% in 2006, 4.9% in 2007 and 7.9% in 2008; construction activity declined 6.3% in 2009 and surged 11.6% in 2010. The number of housing starts in a given year has depended heavily upon the availability of public funds and the ability of the Housing Finance System, currently under the direction of the Caixa Economica Federal (“CEF”), to devote resources to new building activities. In 2010, CEF’s credit operations ascribed to house financing reached approximately R$77.8 billion, roughly equivalent to 4% of Brazil’s GDP for 2010; a lower percentage of the GDP than in comparable countries. The credit operations related to housing is also responsible for the difference between the ratio of credit to GDP between Brazil and other countries. In 2010, the credit operations of the CEF related to sanitation and infrastructure reached approximately R$15.2 billion.
Mineral Resources. Brazil’s proven mineral resources are extensive and have generally remained constant or expanded in recent years due to continuing exploration activity. Large iron ore and manganese reserves provide important sources of industrial raw materials and export earnings. Deposits of nickel, tin, chromite, bauxite, beryllium, copper, lead, tungsten, zinc and gold, as well as lesser known minerals, continue to be mined.
Table No. 7
Annual Changes in Industry Production
Mining and Manufacturing
| | | | | | | | | | | | | | | | | | | | |
| | | 2006 | | | 2007 | | | 2008 | | | 2009 | | | 2010 | |
Annual Change in Production of Mining, Oil and Gas and Manufacturing Industry | | | | | | | | | | | | | | | | | | | | |
By Category of Use | | | | | | | | | | | | | | | | | | | | |
Capital Goods | | | 5.7 | | | | 19.5 | | | | 14.3 | | | | (17.4 | ) | | | 20.8 | |
Intermediate Goods | | | 2.1 | | | | 4.8 | | | | 1.5 | | | | (8.8 | ) | | | 11.4 | |
Consumer Goods | | | 3.3 | | | | 4.7 | | | | 1.9 | | | | (2.7 | ) | | | 6.4 | |
Durable Goods | | | 5.8 | | | | 9.1 | | | | 3.8 | | | | (6.4 | ) | | | 10.3 | |
Nondurable Goods | | | 2.7 | | | | 3.3 | | | | 1.3 | | | | (1.5 | ) | | | 5.2 | |
Source: IBGE.
Agriculture. Brazil has a well-diversified agricultural sector. Brazil’s largest single export crop is soya (beans, bran and oil), with 2006, 2007, 2008, 2009 and 2010 exports totaling approximately $9.3 billion, $11.4 billion, $18.0 billion, $17.3 billion and $17.1 billion, respectively. In addition, Brazil has been the world’s largest producer of coffee for more than a century. Coffee exports in 2006, 2007, 2008, 2009 and 2010 totaled $3.3 billion, $3.8 billion, $4.7 billion, $4.3 billion and $5.7 billion, respectively. Orange juice exports totaled $1.0 billion in 2006, $1.5 billion in 2007, $1.9 billion in 2008, $1.6 billion in 2009 and $1.8 billion in 2010. Sugar exports totaled $6.2 billion in 2006, $5.1 billion in 2007, $5.5 billion in 2008, $8.4 billion in 2009 and $12.8 billion in 2010. In addition, meat and meat by-product exports totaled $8.5 billion, $11.1 billion, $14.3 billion, $11.5 billion and $13.3 billion in 2006, 2007, 2008, 2009 and 2010, respectively.
State-Controlled Enterprises
In Brazil there are two types of State enterprises: public companies and mixed-ownership companies. Public companies are corporations wholly-owned by the States or the Republic, created by special law to carry on economic activities in any of the corporate forms provided for by law. Examples of federal public companies are the BNDES, the CEF, the Brazilian Post Office and Telegraph Corporation (Empresa Brasileira de Correios e Telégrafos) and the Mineral Resources Exploration Company (Companhia de Pesquisa de Recursos Minerais). Mixed-ownership companies are in corporate form and are
D-22
majority-owned by the Federal Government or by a state government. Unless otherwise provided by the law authorizing the creation of a mixed-ownership company, the rights of the Government are those conferred by Brazilian corporate law on majority shareholders generally.
Brazil also has autonomous institutions and public foundations. Autonomous institutions are entities established to carry out public functions which require decentralized financial and operating management, such as the Central Bank, CVM, the Brazilian Institute of Forest Development, the National Institute of Industrial Property, the National Highway Department and the National Department of Mineral Production.
Public foundations are non-profit public law entities created to carry out activities not performed by public companies. Public foundations have administrative autonomy and manage their own assets, but their expenses are defrayed by the Federal Government and other sources. Examples of public foundations are the IBGE, the Applied Economics Research Institute (Instituto de Pesquisa Econômica Aplicada) and the National Counsel of Technological and Scientific Development (Conselho Nacional de Desenvolvimento Científico e Tecnológico).
Under Brazilian law, private parties may only participate in activities considered to be public services if they are authorized to do so by the Federal Government. The areas formerly reserved to the Republic under the Constitution include broadcasting and telecommunications, electric power service and facilities, hydroelectric power generation, certain interstate and international navigational services, interstate and international highway passenger transportation services and the operation of ports. The mining and processing of nuclear mineral ores and minerals and their by-products remain under Federal Government monopoly.
Inflation
Since the adoption of the Plano Real in July 1994, Brazil has been successful at reducing inflation from the high levels reached during the early 1990s. The implementation of the inflation targeting regime by the Central Bank in June 1999 also contributed to a relatively stable rate of inflation since that time.
The following table sets forth principal price indices for the periods indicated.
Table No. 8
Extended National Consumer Price Index (IPCA)
| | | | | | |
| | | | | IPCA | |
Period | | | | Trailing
12 Months | |
1993 | | December | | | 2,477.2 | |
1994 | | December | | | 916.4 | |
1995 | | December | | | 22.4 | |
1996 | | December | | | 9.6 | |
1997 | | December | | | 5.2 | |
1998 | | December | | | 1.7 | |
1999 | | December | | | 8.9 | |
2000 | | December | | | 6.0 | |
2001 | | December | | | 7.7 | |
2002 | | December | | | 12.5 | |
2003 | | December | | | 9.3 | |
2004 | | December | | | 7.6 | |
2005 | | December | | | 5.7 | |
2006 | | December | | | 3.1 | |
2007 | | December | | | 4.5 | |
2008 | | December | | | 5.9 | |
2009 | | December | | | 4.3 | |
2010 | | December | | | 5.9 | |
D-23
| | | | | | |
| | | | | IPCA | |
Period | | | | Trailing
12 Months | |
| 2011 | | August | | | 7.2 | |
| (1) | IPCA is the official price index adopted to verify results under Brazil’s inflation target regime. The index is released by IBGE. |
Sources: IBGE.
Throughout the 1980s and early 1990s, Brazil experienced periods of severe inflation. With the onset of the external debt crisis in 1982 and the resulting decrease in the availability of foreign capital, the Federal Government was obliged to monetize large and growing public sector deficits, thereby further stimulating inflation.
With the introduction of the real in July 1994, the rate of inflation decreased significantly, reaching 9.6% in 1996, 5.2% in 1997 and 1.7% in 1998. The inflation rate (as measured by IPCA) rose to 8.9% in 1999, following the decision of the Central Bank to permit the value of the real to float against that of the dollar. After the implementation of the inflation targeting regime in mid-1999, the inflation rate (as measured by IPCA) registered 6.0% in 2000, and 7.7% in 2001. Largely as a result of a depreciation in the value of the real, increases in administered prices and rising oil prices in the world markets, the inflation rate began to rise in Brazil during the fourth quarter of 2002, registering 12.5% at the end of 2002. The inflation rate (as measured by IPCA) was 9.3% in 2003, 7.6% in 2004, 5.7% in 2005, 3.1% in 2006, 4.5% in 2007, 5.9% in 2008, 4.3% in 2009, 5.9% in 2010 and 6.7% in the last twelve months ending July 2011.
Following the decision in January 1999 to permit the real to float freely, the Federal Government announced that it intended to pursue a monetary policy based on inflation targeting. For 2012 and 2013, the inflation target is 4.5%, with a tolerance interval of plus or minus 2.0 percentage points.
Salaries and Wages
According to the Employment Monthly Survey conducted by IBGE in six major metropolitan regions of Brazil (Rio Janeiro, São Paulo, Belo Horizonte, Porto Alegre, Recife and Salvador), the real average wages of all workers increased by 4.5% in 2006, 2.3% in 2007, 3.6% in 2008, 0.7% in 2009 and 5.9% in 2010.
In 2006, both industrial real average wages and overall real wages saw significant gains, increasing by 13.7% and 7.7%, respectively, while in 2007, industrial real average wages decreased 0.4% and overall real wages increased by 4.2%. In 2008, industrial real average wages and overall real wages increased 0.6% and 5.2%, respectively, while in 2009 industrial real average wages increased 2.9% and the overall real wages decreased 1.1%. In 2010, real average wages and real overall wages increased by 0.4% and 5.6, respectively.
Law No. 12,382, signed by President Rousseff on February 25, 2011, set a minimum wage of R$545 and also establishes guidelines for minimum wage adjustments until the year 2015 based on inflation and GDP growth. The following table sets forth certain data on industrial wages in the State of São Paulo and on the national minimum wage for the periods indicated.
D-24
Table No. 9
Industrial Wages—State of São Paulo(1)
and
National Minimum Wage
| | | | | | | | | | | | | | | | | | | | | | | | | | | | |
December 31, | | Real
Average
Wages
Index(2)(3) | | | Trailing 12
months(4) | | | Real
Overall
Wages
Index(2)(3) | | | Trailing 12
Months(4) | | | Dollar
Equivalent
Minimum
Wage
(monthly) | | | Dollar
Equivalent
Minimum
Wage
Index(3) | | | Trailing 12
Months(4) | |
2006 | | | 133.4 | | | | 13.7 | | | | 141.1 | | | | 7.7 | | | | 162.80 | | | | 123.40 | | | | 30.8 | |
2007 | | | 110.0 | | | | (0.4 | ) | | | 122.0 | | | | 4.2 | | | | 212.77 | | | | 161.27 | | | | 23.9 | |
2008 | | | 114.0 | | | | 0.6 | | | | 128.2 | | | | 5.2 | | | | 173.32 | | | | 131.37 | | | | 18.1 | |
2009 | | | 113.7 | | | | 2.9 | | | | 125.5 | | | | (1.1 | ) | | | 265.61 | | | | 201.32 | | | | 3.0 | |
2010 | | | 107.9 | | | | 0.4 | | | | 126.3 | | | | 5.6 | | | | 301.17 | | | | 228.27 | | | | 24.0 | |
| (1) | Information is provided for the State of São Paulo because it represents approximately 40.0% of the industrial production of Brazil. |
| (4) | Average percentage growth in last 12 months compared to previous 12-month period. |
Sources: Federação das Indústrias do Estado de São Paulo (“FIESP”), Ministry of Finance and Central Bank; Applied Economics Research Institute (“IPEA”).
Employment
The Ministry of Labor customarily reports Brazilian employment statistics in terms of formal employment. Formal employment comprises employment duly registered with the Ministry of Labor and subject to social security contributions by employers. Informal employment is not registered or subject to employment contributions. The Ministry of Labor’s General File of Employed and Unemployed shows that formal employment rose 4.7% in 2006 (or 1,228,686 jobs), 5.9% in 2007 (or 1,617,392 jobs), 5.0% in 2008 (or 1,452,204 jobs), 3.1% in 2009 (or 995,110 jobs) and 7.7% in 2010 (or 2,555,421 jobs).
The table below sets forth employment levels by sector for the periods indicated.
Table No. 10
Level of Employment by Sector(1)
| | | | | | | | | | | | | | | | | | | | |
| | | December 31, | |
Sector | | 2006 | | | 2007 | | | 2008 | | | 2009 | | | 2010 | |
Manufacturing | | | 91.7 | | | | 97.3 | | | | 99.8 | | | | 100.0 | | | | 106.5 | |
Public Utility/Industrial Services(2) | | | 94.1 | | | | 96.4 | | | | 98.6 | | | | 100.0 | | | | 105.1 | |
Commerce | | | 85.1 | | | | 90.7 | | | | 96.0 | | | | 100.0 | | | | 107.0 | |
Services | | | 86.5 | | | | 91.1 | | | | 96.3 | | | | 100.0 | | | | 106.6 | |
Construction | | | 71.9 | | | | 81.2 | | | | 91.7 | | | | 100.0 | | | | 111.2 | |
Government Service | | | 93.6 | | | | 95.8 | | | | 97.7 | | | | 100.0 | | | | 100.8 | |
Total | | | 87.3 | | | | 92.4 | | | | 97.0 | | | | 100.0 | | | | 106.5 | |
| (1) | December 31, 2009= 100. |
| (2) | Including water, electricity, telephone and gas services. |
Source: Central Bank.
The Federal Government measures unemployment using the average annual rate of unemployment in six major metropolitan areas (Rio de Janeiro, São Paulo, Belo Horizonte, Porto Alegre, Salvador and Recife). According to that measure, the unemployment rate was 8.4% in 2006, 7.4% in 2007, 6.8% in 2008, 6.8% in 2009 and 5.3% in 2010.
D-25
Law No. 7,998, which was enacted on January 11, 1990, established a worker support fund (Fundo de Amparo ao Trabalhador, or “FAT”) to finance unemployment security programs and professional training programs. To be eligible for the unemployment benefits under FAT, a dismissed employee, among other things, (i) must have been involuntarily dismissed, (ii) must have been employed and receiving a salary during the six-month period prior to being dismissed, (iii) must have been employed at least six months during the three years prior to being dismissed, (iv) must not be receiving any other social security or unemployment benefits and (v) must not have sufficient income to support herself or her family. Unemployment benefits under FAT are limited to five months in each sixteen-month period following a dismissal.
FAT receives funding from monthly federal contributions to certain other social programs, including unemployment programs (known by their acronym, “PIS/PASEP”). In accordance with the Constitution, 40% of the funds provided for FAT is allocated to finance economic growth programs managed by BNDES. As of December 31, 2010, FAT had a positive balance of R$169.5 billion.
Unions and Labor Protection
Under the Constitution, professional or union associations may be freely organized. There are no Federal Government formalities for the organization of a union other than registration at the appropriate agency, and public authorities are prohibited from intervening in or interfering with unions. No more than one union may be created to represent the same professional or economic group in the same geographic area. Law No. 11,648 dated March 31, 2008, acknowledges that central unions (nationally organized associations of several local unions) can act as a representative group for workers.
Under Brazilian law, the principal function of a union is to represent the general interests of its members as a group or individually. It may also enter into collective labor agreements and promote conciliation in collective labor disputes. The union must provide free legal assistance for its members. A union may not be affiliated with any international organization other than the International Labor Organization unless authorized by the President of the Republic. Union representatives are also protected under Brazilian labor laws. A candidate for a union leadership position or job-safety monitor may not be dismissed after registering his or her candidacy and, if elected, may not be dismissed until one year after his or her term expires.
The Constitution introduced a number of significant labor reforms, such as a reduction in the work week from 48 hours to 44 hours and a six-hour limit on the duration of an uninterrupted work shift. In addition, pregnant workers may not be dismissed for taking maternity leave of up to four months. With Law No. 11,770 dated September 9, 2008, the Federal Government established the Citizen Company Program which extends by 60 days the length of maternity leave for employees of a legal entity joining the program.
On January 12, 2000, the National Congress enacted Law Nos. 9,957 and 9,958, which authorized labor court judges to issue final decisions in suits relating to labor disputes involving amounts in dispute not exceeding forty times the national minimum wage. The new laws do not apply to labor suits brought by Federal, State and municipal civil servants. Under Law No. 9,957, labor suits filed after March 14, 2000 against private and public corporations must be heard within fifteen days, and the judge has up to thirty days to render a decision. At the time the law was enacted, the average time for labor cases to be decided was five to seven years. If one of the parties challenges the labor judge’s decision on the ground of insufficient evidence, a new hearing must be held within thirty days. Appeals of any decision may be made by employers or employees within eight days following the issuance of the decision. There is no time limit for higher labor courts to decide an appeal. In addition, Law No. 9,958 provides that companies can organize employers’ and employees’ commissions to resolve labor disputes before they are presented to the labor judge.
In an attempt to prevent an increase in unemployment due to the 2008 financial crisis, the Federal Government collects from companies a social security contribution on the payment of the compensated indemnified notice (equivalent to the value of a wage) in the event of a layoff, thus increasing even more the costs associated with layoffs of the companies—this collection had not occurred since 1999. The collections started on January 12, 2009, with the publication of Decree No. 6,727. For companies, the effective tax rate is 20% of each employee’s wage. Employees are required to pay 8% to 11% of their monthly wages based on the wage range, with a maximum limit of R$406.1.
Social Security
Under Brazil’s state-operated social security and pension system, employers are generally required to contribute 20% of each employee’s wages to the system on a monthly basis (except for employers of domestic servants, who contribute 12% of wages, and for employers of financial market employees, who contribute 22.5% of wages), while employees generally
D-26
contribute between 8% and 11% of their monthly wages for retirement benefits (paid in connection with retirements due to old age, illness or length of service), workers’ compensation, death benefits, maternity leave, sick leave, disability and other social services. The contributions and benefits above minimum wage were readjusted by 6.47%, effective January 1, 2011. The cap on social security pensions paid to private sector retirees was raised to R$3,691.74 per month in 2011.
In November 1999, the National Congress enacted Law No. 9,876 dated November 26, 1999, which changed the rules for retirement for private sector employees. The law introduced a social security factor that is used to calculate benefits for retirees. This factor takes into account not only age and years of contributions to the INSS, but also life expectancy. The law also changed the base for calculating the INSS benefit of any retiree from the average monthly salary of that retiree during the last 36 months prior to retirement to the arithmetic mean of the monthly salaries of that retiree during 80% of the monthly periods since July 1994 when that monthly salary was highest. The new social security factor was phased in over a five-year period. Certain private sector employees challenged the law on constitutional grounds. On March 15, 2000, the Federal Supreme Court denied their claim and upheld the constitutionality of the law.
On May 29, 2001, the Federal Government enacted two complementary laws regulating pension funds. Complementary Law No. 108 applies to pension funds maintained by the Federal Government, the States and municipalities, as well as by entities controlled directly or indirectly by them. It limits the amount of an employer’s contributions with respect to any specific employee to the amount contributed by that employee and prohibits any bonuses or other amounts from being added to an employee’s benefits under the pension plan. Complementary Law No. 109, which relates to private pension funds, permits amounts to be transferred between funds in connection with a change in employment.
On December 19, 2003, the rules related to retirement and social security for civil servants were further modified by Constitutional Amendment No. 41. The adjustments included (i) an increase in the minimum retirement age for civil servants from 48 to 55 years for women and from 53 to 60 years for men; (ii) a reduction of 30.0% in pensions paid for widows and orphans of civil servants in excess of the per month ceiling for retirement payments under the general social security system; (iii) a contribution to the social security system by retired civil servants of 11.0% of the amount by which the retired employee’s pension exceeds 60.0% of the above-mentioned ceiling in the case of federal retirees and 50.0% of the above-mentioned ceiling in the case of all other retired civil servants; (iv) a uniform contribution level for municipal, State and federal workers consisting of at least 11.0% of the amount of the employee’s salary; and (v) the institution of a complementary regime for new civil servants, which will require the passage of ordinary legislation. The changes to the social security system under Constitutional Amendment No. 41 were intended to reduce the consolidated deficit in the pension system, which reached R$79.0 billion (2.8% of GDP) in 2006, R$81.8 billion (2.7% of GDP) in 2007, R$80.9 billion (2.6% of GDP) in 2008, R$92.3 billion (2.9% of GDP) in 2009 and R$95.7 billion (2.6% of GDP) in 2010.
On August 18, 2004, the Federal Supreme Court upheld the constitutionality of the 11% tax on retired civil servants’ pensions. However, the Supreme Court raised the level above which all pensions would be taxed to the per month ceiling for retirement payments under the general social security system. The new threshold amount will continue to be indexed to the minimum wage. The tax was among the pension reform measures adopted through Constitutional Amendment No. 41 dated December 19, 2003.
Provisional Measure No. 529 dated April 7, 2011, reduced the tax burden of the Micro Individual entrepreneur, by changing the contribution rate for social security from 11% to 5%. The objective of the reduction is to expand the incentives for the formalization of these entrepreneurs and their inclusion into the social security system.
Poverty and Income Distribution
Brazil’s disparities in the distribution of wealth and income, as measured by the Gini index, have declined from 60.0 in 1993 to 52.4 in 2009. The Gini index measures, using a scale of 0 (perfect equality) to 100 (perfect inequality), the extent to which the distribution of income (or consumption) among individuals or households in a country deviates from a perfectly equal distribution).
The following table sets forth the data obtained from the National Household Sample Survey (Pesquisa Nacional por Amostra de Domicílios, or “PNAD”) for 2009, published by IBGE.
D-27
Table No. 11
Income Distribution of the Economically Active Population—2009(1)(2)
| | | | |
Income Group | | % of
National Income | |
Bottom 50% | | | 17.5 | % |
Top 50% | | | 82.5 | % |
| | | | |
Total | | | 100.0 | % |
Lowest 20% | | | 3.8 | % |
Top 10% | | | 43.0 | % |
Top 1% | | | 12.6 | % |
| (1) | People ages 10 and above. |
| (2) | Rural areas of Rondônia, Acre, Amazon, Roraima, Pará and Amapá not included. |
Source: IBGE, PNAD2009.
The Federal Government has tried to reduce poverty in Brazil. The Bolsa Família initiative, created by the Law No. 10,836 dated January 9, 2004, consolidated the National Program of Minimum Income Linked to Education (Bolsa Escola), the National Program of Access to Food (Programa Nacional de Acesso à Alimentação), the National Program of Minimum Income Linked to Health (Bolsa Alimentação) and the Gas-Aid Program. The Bolsa Família program provides basic benefits to families in extreme poverty and supplemental benefits to impoverished families whose members include pregnant or nursing women or children under 17 years of age.
Environment
The Ministry of the Environment (Ministério do Meio Ambiente, dos Recursos Hídricos e da Amazônia Legal) is the federal body responsible for formulating and implementing environmental policies. The National Council on the Environment (Conselho Nacional do Meio Ambiente) prepares environmental regulations, and the Brazilian Institute of the Environment and Renewable Resources (Instituto Brasileiro do Meio Ambiente e dos Recursos Naturais Renováveis) is charged with supervising and overseeing the application of those regulations. Provisional Measure No. 366 dated April 26, 2007 (subsequently enacted as Law No. 11,516 dated August 28, 2007), created the Chico Mendes Institute of Biodiversity Preservation (Instituto Chico Mendes de Conservação da Biodiversidade, or “ICMBIO”), vested with responsibility for the execution of national policies of environmental preservation.
The Constitution contains a chapter on environmental protection, providing for the right to a clean environment and imposing upon the Federal Government, the States, the Federal District and municipalities duties to protect the environment, take measures against pollution and protect fauna and flora.
Law No. 11,132/2005 was enacted on July 4, 2005, and established the National System of Nature Conservation Units, giving the public power to impose provisional limitations to activities and enterprises causing ambient degradation. Exceptions are made for farming activities and other economic activities.
Law No. 11,284, enacted on March 2, 2006, permits sustainable exploration of public forests by private companies through grants of concessions for a period of up to 40 years. Law No. 11,284 also creates the Forest Development National Fund to support sustainable development activities and new technologies for the sector. The fund is to be administered by the Brazilian Forest Service, an agency under the Ministry of the Environment.
On November 14, 2007, the Brazilian Forestal Service launched the first public bidding for a concession of management of a public forest, the Jamari National Forest in the State of Rondônia. The concession period is for 40 years, during which the concessionaire must preserve the area and use sustainable techniques of exploration of natural resources. Revenues obtained from the exploration are allocated to the Brazilian Forestal Service, the ICMBIO, the Forest Development National Fund, the State of Rondônia and the municipalities located within the forest area, and must be applied to forest preservation.
On May 8, 2008, the Federal Government announced the Sustainable Amazon Plan (Plano Amazônia Sustentável). The Plan is comprised of five main areas (sustainable production with innovation and competitiveness; environmental management and territorial planning; social inclusion and citizenship; infrastructure; and new funding patterns), and 16 guidelines to be followed by the Federal Government regarding the region. The actions to be taken include developing the infrastructure of the region, setting up a tax regime benefiting those using sustainable practices; establishing a legal framework for transferring parts of the forest from public to community control; increasing the officially protected zone to three million hectares and seeking ways to allow the international community to participate in forest preservation.
D-28
On August 1, 2008, Decree No. 6,527, established the Amazon Fund which authorizes BNDES to obtain private resources through domestic or foreign voluntary donations to invest in monitoring and deforestation prevention. On September 16, 2008, BNDES received the first donation to the fund in the amount of $20 million from the government of Norway. Law No. 11,828 dated November 20, 2008, created a fiscal incentive for companies that make donations toward such prevention items as well as for the promotion of conservation and sustainable use of the Brazilian forests. If these donations are given to federal financial institutions, they will be exempt from PIS/COFINS.
Decree No. 6,660 dated November 21, 2008, regulates instruments of Law No. 11,428 dated December 22, 2006, which concerns the use and protection of native vegetation of the Atlantic Forest Biome (Bioma Mata Atlântica). The opportunity to explore native raw material for trading, such as firewood, will depend on the authorization of the environmental agencies.
On December 1, 2008, the Federal Government launched the National Plan on Climate Change (Plano Nacional de Mudanças Climáticas), which establishes a target to reduce carbon emission in Brazil. The main target is the phased reduction of 72.0% of deforestation of the Amazon by 2017. The National Plan on Climate Change also establishes other measures to be taken in the areas of electric energy, alcohol, biodiesel and coal production.
The President of the Republic signed, on February 10, 2009, Provisional Measure No. 458 (subsequently enacted as Law No. 11,952 dated June 25, 2009) which was designed to accelerate agrarian preservation in the Amazon. Besides public rural lands of the Republic, the measure aims to preserve, in the next three years, 296 thousand rural possessions in the Amazon, in an area of 67.4 million hectares. The enactment of environmental legislation will be required, with the goal of preserving 80.0% of the Amazon.
Law No. 12,114 dated December 9, 2009, created the National Fund on Climate Change, which will be funded by, among other sources, 10% of the revenues from the petroleum industry. The fund’s resources will be used for the National Policy on Climate Change, established on December 29, 2009 by Law 12,187.
Education
In 2009, enrollment in Brazil’s 2,314 universities and post-graduate institutions totaled 5,115,896. There were 52,580,452 students enrolled in Brazil in non-university levels of education in 2009, of which 12.9% were in preschool, 60.3% were in elementary school, 15.9% were in high school, 0.5% were in special needs schools, 1.6% were in professional training programs and 8.9% were in supletivo, an educational program for adults.
In December 2006, the Federal Government established a Fund for the Maintenance and Development of Basic Education and of Valuation of the Professionals of Education (Fundo da Educação Básica, or “FUNDEB”). The FUNDEB is to be funded through collections of the tax on the circulation of goods and services (Impostos Sobre Circulação de Mercadorias e Prestação de Serviços, or “ICMS”) and other taxes by the States, Federal District and cities. The FUNDEB is a Fund of accountable nature, instituted by Constitutional Amendment No. 53 dated December 19, 2006 and regulated by Provisional Remedy No. 339 dated December 29, 2006.
On July 10, 2008, Law No. 11,738 was enacted providing basic education teachers on a national basis a minimum wage level of R$950 per month. On February 24, 2011, the minimum wage level was adjusted to R$1,187.97 per month.
On April 28, 2011, President Rousseff launched the National Access Program to Technical Education and Employment (“PRONATEC”). PRONATEC aims to expand and democratize the provision of technical and vocational courses in high school, and of initial and continuing training courses for workers. The program’s resources will come from the budget of the Ministry of Education, FAT, contributions to professional categories (S System) and BNDES. University for All Program or “PROUNI” and Fund for Financing Higher Learning Students or “FIES” are also actions of the Development Plan for Education—PDE of the Federal Government.
Federal Government expenditures on education in 2006, 2007, 2008, 2009 and 2010 were R$16.2 billion, R$17.3 billion, R$18.9 billion, R$21.9 billion, R$28.4 billion and R$38.3 billion, respectively.
Among the challenges facing Brazil is the provision of basic education to poor children between the ages of six and eighteen and higher education to young adults. According to the IBGE, 97.6% of children between the ages of six and 14 years old were enrolled in school in 2009, largely as a result of the policies intended to broaden access to basic education.
D-29
Competition Law
In June 1994, the National Congress enacted an antitrust law (Law No. 8.884 dated June 11, 1994) designed to promote free competition, to prevent excessive concentrations of economic power contrary to the public interest and to avoid excessive price increases. The law sets forth general criteria for determining anti-competitive behavior, such as tying, refusing to deal, price fixing, predatory pricing, exclusive dealing arrangements and resale price maintenance.
In addition, the law requires that all documents relating to any merger, acquisition or asset sale that may limit or otherwise restrain open competition be filed within fifteen days of such transaction with the Economic Defense Secretariat (Secretaria de Defesa Econômica or “SDE”) of the Finance Ministry and Brazil’s Council for Economic Defense (“CADE”) if such transaction would result in a 20% or greater market share for a company or group of companies or if any of the participants has reported on its most recent balance sheet annual gross income equal to or greater than R$400 million. The SDE has the option of initiating administrative proceedings before the CADE to challenge any such transaction. In any administrative proceeding before it, the CADE has the power to impose fines or to grant equitable relief as well as to determine that the transaction be partially or totally reversed. In addition, a private party aggrieved by anti-competitive behavior has standing to sue in federal court on behalf of itself and similarly situated parties and may seek both equitable relief and monetary damages. Recent amendments to the antitrust law require a CADE antitrust analysis prior to the closing of a merger, acquisition or asset sale, rather than verification after the transaction.
Incentives for Private Investment
On December 30, 2004, Law No. 11,079 was enacted, which provides for the formation of two types of public-private partnerships: (i) contracts for concessions of public works or utility services under which private party concessionaires receive payments from a public sector entity in addition to tariffs charged to end-users and (ii) contracts for rendering services under which a public sector entity is the end-user. Public-private partnership contracts must be worth at least R$20 million and provide for a service period of between five and thirty-five years, including extensions of the term. All such contracts can only be awarded through a public bidding process. Law No. 11,196 dated November 21, 2005 instituted tax exemptions (PIS and COFINS) for export companies, tax incentives for investment in technology and tax exemptions for specific real estate transactions. Law No. 11,196 also increased the limit on the amount of gross revenues a company can earn and still be considered a micro or small company.
In August 2006, National Treasury Executive Order No. 614 was published. It establishes general norms to be applied to public-private partnership contracts. In accordance with the Executive Order, the public-private partnership contracts in which the Federal Government assumes more than 40% of the entrepreneurship risk will be accounted for as public assets.
Regarding regional development, the Federal Government sanctioned in January 2007 Complementary Law Nos. 124 and 125, which reestablished the Superintendency for the Development of the Amazon (Superintendência de Desenvolvimento da Amazônia, or “SUDAM”) and the Superintendent for the Development of the Northeast (Superintendência do Desenvolvimento do Nordeste, or “SUDENE”). SUDAM will replace the Agency for the Development of the Amazon (Agência de Desenvolvimento da Amazônia) and SUDENE will replace the Agency for Development of the Northeast (Agencia de Desenvolvimento do Nordeste, or “ADENE”). SUDAM will cover nine federal states: Acre, Amapá, Amazonas, Mato Grosso, Rondônia, Roraima, Tocantins, Pará and Maranhão. SUDENE will cover federal states in the Northeast, north Minas Gerais and the Espirito Santo semi-arid area to obtain monetary assistance to finance their projects. Complementary Law No. 129/08 dated January 8, 2009 recreated the Superintendency for the Sustainable Development of the Central West (Superintendência do Desenvolvimento do Centro-Oeste, or “SUDECO”). The operating area of the SUDECO includes the States of Mato Grosso, Mato Grosso of the South, Goiás and the Federal District.
In January 2007, the Federal Government sanctioned Law No. 11,445/07 (the “Sanitation Law”), which establishes directorates for basic sanitation federal policy and institutes the National System of Basic Sanitation Information (Sistema Nacional de Informações em Saneamento Básico). Sanitation services include water provision, sewage systems, urban rain water drainage, urban cleaning and solid residue management. The Federal Government expects that investments in those services will equal R$220 billion through 2024.
On January 22, 2007, the Federal Government unveiled the PAC, whose objective is to increase Brazil’s economic growth rate. PAC is a set of measures seeking to (i) create incentives for private investment; (ii) increase public investment in infrastructure; and (iii) remove bureaucratic, administrative, normative, legal and legislative obstacles to growth. PAC measures are grouped under five broad headings: infrastructure investment, stimulus to credit and financing, improvement in the investment climate, tax exemptions and improvements in the tax system, and long-term fiscal measures.
D-30
On March 29, 2010, the Federal Government presented PAC 2. The preliminary estimate of investments under PAC 2 is approximately R$1.6 trillion, of which around R$220 billion will come from the general budget of the Republic. The remaining funds will come from financing provided through BNDES and from state enterprises resources. PAC 2 includes new investment projects for the periods 2011 to 2014 and post-2014. It also includes projects initiated during PAC 1 with activities that will conclude after 2010. For the period following 2014, investments under PAC 2 are estimated at $346.4 billion (R$631.6 billion). Similar to the first phase of the program, PAC 2 focuses on investments in the areas of logistics, energy and social development, organized under six major initiatives: Better Cities (urban infrastructure); Bringing Citizenship to the Community (safety and social inclusion); My House, My Life (housing); Water and Light for All (sanitation and access to electricity); Energy (renewable energy, oil and gas); and Transportation (highways, railways, airports).
In February 2007, Decree No. 6047 was passed, creating the National Policy for Regional Development (Política Nacional de Desenvolvimento Regional, or “PNDR”) to provide guidelines and programming in order to reduce regional inequalities. PNDR’s main source of financing, in addition to the General Budget of the Federal Government, will be regional development funds. PNDR will be monitored by the National Information System for Regional Development—also created by the Decree—and coordinated by the Ministry for National Integration.
On July 20, 2007, Law No. 11,508 was passed, modifying Decree-Law No. 2,452/1988, which created the Exports Processing Zones (Zona de Processamento de Exportações or “ZPE”) in Brazil. Law No. 11,508 had some of its articles modified by Law No. 11,732 dated June 30, 2008, and was regulated by Decree No. 6.814 dated April 6, 2009. The term of the incentives predicted for a business in a ZPE is up to 20 years, renewable for an equal period. Up to 20% of the production of a ZPE can be for the domestic market, but the tax exemption will not available for such domestic production.
On June 12, 2007, the Federal Government announced a set of measures to stimulate the competitiveness of selected industrial sectors affected by the real’s appreciation against the U.S. dollar. Law No. 11,529 dated October 22, 2007 defined tax reductions for the purchase of capital goods and production inputs, as well as special loans up to R$12.0 billion for some exporting sectors, such as textiles, wood furniture and shoes.
On December 28, 2007, Law No. 11,638 was enacted, which harmonizes Brazilian accounting legislation with international standards in order to facilitate the operation of foreign companies in Brazil. This law also makes mandatory the disclosure of corporate balance sheets from large closely held companies and the evaluation of assets and liabilities of share companies by market value. Publicly-traded companies must also release regularly cash flows and added value statements.
Law No. 11,598 dated December 3, 2007, introduced simplified procedures for registering new companies and is intended to encourage the use of corporate formalities. Decree No. 6,620 dated October 29, 2008, governs the development of maritime port activities, including the construction and operation of new ports utilized to transport shipments. Contracts for new ports will have a term of 25 years that can be extended for an additional 25 years. Private enterprises that will obtain the right to build and explore new ports will be selected through public auctions.
Provisional Measure No. 450 dated December 9, 2008 (subsequently enacted as Law No. 11,943 dated May 28, 2009), authorized the creation of the Guarantee Fund for Electric Energy (Fundo Garantidor do Setor Elétrico, or “FGEE”) to be administered by a federal bank. The FGEE will guarantee repayment to banks that finance the construction of hydroelectric stations and transmission lines of energy, provided that the projects are part of PAC.
Law No. 11,909 dated March 4, 2009, established new rules for the transport, exploration, storage, processing and marketing of natural gas. The main approved change is that the transport of gas for consumption by the enterprise itself, purchased straight from the producer, does not need to be conceded, although such practice is still authorized and supervised by the regulatory bodies of the energy sector.
The Federal Government announced, on May 13, 2009, the creation of the FGC (defined below, see “The Financial System—Monetary Policy & Money Supply”) to benefit small and middle market companies and anticipates that such program will reduce the spread in credit operations for small and medium companies. The deposits will be made by public banks—Banco do Brasil and BNDES. Provisional Measure No. 464 dated June 9, 2009 (subsequently enacted as Law No. 12,087 dated November 11, 2009), authorized the Republic to participate in these deposits up to the overall limit of R$4 billion. The deposits made by the Federal Government could generate up to 12 times its value in credit—that is, up to R$48 billion. The increase in volume of resources of the Naval Industry Deposit Guarantee from R$1 billion to R$5 billion, with resources of the National Treasury, was also announced on May 13, 2009.
D-31
The Federal Government created the Special Incentives Regime for the Development of Infrastructure Petroleum Industry in the North, Northeast and Midwest (“REPENEC”) for projects approved before December 31, 2010, with the Provisional Measure No.472 dated December 15, 2009 (subsequently enacted as Law No. 12,249 dates June 11, 2010). The Special Incentives Regime suspends the collection of IPI, PIS and COFINS on goods and services in the petroleum refining and petrochemical industry in these regions.
The Investment Support Program (“ISP”) allows the Republic to subsidize the interest rate of loans from BNDES to purchase capital goods and support export and technological innovation. The ISP, launched by Provisional Measure No. 465, dated June 29, 2009 (subsequently enacted as Law No. 12,096 dated November 24, 2009 and amended by Law No. 12.423), established the maximum value of R$208 billion in assistance to subsidize the interest rates of financing transactions contracted up to December 31, 2011. Investments to be made under the ISP program will amount to R$75 billion in 2011.
In order to promote the completion of the works of infrastructure in host cities for the Soccer World Cup 2014, Summer Olympic Games in 2016 and Paralympic Games in 2016, two provisional measures were issued in July 2010. The Provisional Measure No. 496 (subsequently enacted as Law 12,348 dated December 15, 2010), creates special conditions for host municipalities of the Soccer World Cup to take new loans for works related to this tournament. Provisional Measure No. 497 (subsequently enacted as Law 12,350 dated December 20, 2010), grants tax exemption for construction, expansion or upgrading of stadiums in hosting cities of the games. These works will be included in the special tax regime called “Recopa”, which gives exemption from taxes levied on materials and services for companies with projects approved by December 31, 2012 by the Sports Ministry.
On December 15, 2010, the Federal Government announced measures to encourage long-term private financing. Some of these measures depend on resolution of the CMN, others require a presidential decree or provisional measure. The measures are aimed at giving relief to entities that provide private financing to infrastructure projects, development of long-term private bond market, stimulating the recovery of rural credit and personal credit and encouraging securitization of mortgages.
Law No. 12,351 dated December 22, 2010 established new rules for oil exploration in the pre-salt layer. The law changes the model of oil exploration in the pre-salt layer to include a concession for sharing. According to the law, companies will be hired to explore the blocks and will have to split the profits with the Republic. The companies will be chosen by the Federal Government for oil exploration according to greatest share of production offered to the Federal Government.
D-32
BALANCE OF PAYMENTS AND FOREIGN TRADE
Balance of Payments
Brazil’s current account surplus was $13.6 billion in 2006 and $1.6 billion in 2007. After five years of surpluses, from 2003 to 2007, Brazil had a current account deficit of $28.2 billion in 2008, $24.3 billion in 2009 and $47.4 billion in 2010. Brazil’s current account deficit in 2008, 2009 and 2010 were due to the decrease of the trade balance, the increase in the number of Brazilians residing abroad and the increase of remittances of profits outside of Brazil by companies located in Brazil.
From 2006 to 2009, Brazil’s balance of payments registered surpluses of $30.6 billion, $87.5 billion, $3.0 billion and $46.7 billion, respectively. In 2010, the balance of payments registered a surplus of $49.1 billion. The current account deficit in 2010 was at $47.3 billion, totaling 2.1% of GDP, compared to a deficit of $24.3 billion, totaling 1.5% of GDP, in 2009. Exports totaled $201.9 billion in 2010, a 32.0% increase from 2009, while imports totaled $181.7 billion, a 42.2% increase from 2009. Brazil’s net capital and financial account surplus was $99.7 billion in 2010, which is an increase from the surplus of $71.3 billion in 2009. Foreign direct investment net inflows totaled $48.4 billion in 2010, an increase of 86.7% from 2009, and net portfolio investment inflows totaled $63.0 billion in 2010 versus a net inflow of $50.3 billion in 2009.
As of August 31, 2011, the current account deficit accumulated over the previous 12 months was approximately $49.7 billion, compared to an accumulated deficit of approximately $46.1 billion for the same period in 2010. As of August 31, 2011, the services and income account accumulated over the previous 12 months showed a deficit of $81.1 billion and the current unilateral transfers account accumulated over the previous 12 months showed a surplus of $2.8 billion. The balance of payments surplus accumulated over the previous 12 months was approximately $82.0 billion in August 2011, compared to an accumulated surplus of approximately $45.3 billion in August 2010.
The following table sets forth information regarding Brazil’s balance of payments for each of the periods indicated.
D-33
Table No. 12
Balance of Payments(1)
(in millions of dollars)
| | | | | | | | | | | | | | | | | | | | |
| | | 2006 | | | 2007 | | | 2008 | | | 2009 | | | 2010(2) | |
Current Account | | $ | 13,643 | | | $ | 1,551 | | | $ | (28,192 | ) | | $ | (24,302 | ) | | $ | (47,365 | ) |
Trade Balance (fob) | | | 46,457 | | | | 40,032 | | | | 24,836 | | | | 25,290 | | | | 20,221 | |
Exports | | | 137,807 | | | | 160,649 | | | | 197,942 | | | | 152,995 | | | | 201,915 | |
Imports | | | (91,351 | ) | | | (120,617 | ) | | | (173,107 | ) | | | (127,705 | ) | | | (181,694 | ) |
Services and Income Balance | | | (37,120 | ) | | | (42,510 | ) | | | (57,252 | ) | | | (52,930 | ) | | | (70,373 | ) |
Credit | | | 25,937 | | | | 35,447 | | | | 42,961 | | | | 36,554 | | | | 39,174 | |
Debit | | | (63,058 | ) | | | (77,957 | ) | | | (100,213 | ) | | | (89,484 | ) | | | (109,547 | ) |
Current Transfers (net) | | | 4,306 | | | | 4,029 | | | | 4,224 | | | | 3,338 | | | | 2,788 | |
Capital and Financial Account | | | 16,299 | | | | 89,086 | | | | 29,352 | | | | 71,301 | | | | 99,662 | |
Capital Account(3) | | | 869 | | | | 756 | | | | 1,055 | | | | 1,129 | | | | 1,119 | |
Financial Account | | | 15,430 | | | | 88,330 | | | | 28,297 | | | | 70,172 | | | | 98,543 | |
Direct Investment | | | (9,380 | ) | | | 27,518 | | | | 24,601 | | | | 36,033 | | | | 36,919 | |
Abroad | | | (28,202 | ) | | | (7,067 | ) | | | (20,457 | ) | | | 10,084 | | | | (11,519 | ) |
In Brazil | | | 18,822 | | | | 34,585 | | | | 45,058 | | | | 25,949 | | | | 48,438 | |
Portfolio Investments | | | 9,081 | | | | 48,390 | | | | 1,133 | | | | 50,283 | | | | 63,011 | |
Assets | | | 6 | | | | 286 | | | | 1,900 | | | | 4,125 | | | | (4,784 | ) |
Liabilities | | | 9,076 | | | | 48,104 | | | | (767 | ) | | | 46,159 | | | | 67,795 | |
Derivatives | | | 41 | | | | (710 | ) | | | (312 | ) | | | 156 | | | | (112 | ) |
Other Investments(4) | | | 15,688 | | | | 13,131 | | | | 2,875 | | | | (16,300 | ) | | | (1,274 | ) |
Assets | | | (8,416 | ) | | | (18,552 | ) | | | (5,269 | ) | | | (30,376 | ) | | | (42,575 | ) |
Liabilities | | | 24,104 | | | | 31,683 | | | | 8,143 | | | | 14,076 | | | | 41,301 | |
Errors and Omissions | | | 628 | | | | (3,152 | ) | | | 1,809 | | | | (347 | ) | | | (3,197 | ) |
Overall Balance (Change in reserves) | | | 30,569 | | | | 87,484 | | | | 2,969 | | | | 46,651 | | | | 49,101 | |
| | | | | | | | | | | | | | | | | | | | |
| | | | | | | | | | | | | | | | | | | | |
| | | | | | | | | | | | | | | | | | | | |
| | | | | | | | | | | | | | | | | | | | |
| | | | | | | | | | | | | | | | | | | | |
| (1) | These figures were calculated in accordance with the methodology set forth in the IMF Balance of Payments Manual, Fifth Edition. |
| (3) | Includes migrant transfers. |
| (4) | Includes installments and a partial payment under a $41.8 billion IMF-led support package. See “The Brazilian Economy— Economic Events and Policies”. |
Source: Central Bank.
Foreign Trade
From 2006 to 2009, Brazil registered surpluses of $46.5 billion, $40.0 billion, $24.8 billion and $25.3 billion respectively.
In 2010, Brazil registered a trade surplus of approximately $20.2 billion. Exports totaled $201.9 billion, a 32.0% increase from 2009, while imports totaled $181.7 billion, a 42.2% increase over 2009. In 2010, a service and income balance deficit of $70.4 billion resulted in an account deficit of approximately $47.3 billion, compared to an account deficit of approximately $24.3 billion in 2009.
D-34
In August 2011, the trade surplus accumulated over the previous 12 months was approximately $28.6 billion versus an accumulated 12 month trade surplus of approximately $17.0 billion recorded in August 2010.
Exports
From 2006 to 2008, exports totaled $137.8 billion, $160.6 billion and $197.9 billion, respectively. In 2009, exports totaled $153.0 billion.
In 2010, exports totaled $201.9 billion. The largest market for Brazilian products in 2010 was Asia, with exports amounting to approximately $56.3 billion (27.9% of total exports), followed by the European Union with exports totaling approximately $43.1 billion (21.4% of total exports). Exports to the United States increased from $15.7 billion in 2009 (or 10.3% of all Brazilian exports) to $19.5 billion (or 9.6% of total Brazilian exports) in 2010. Exports to Mercosur countries have increased from $15.8 billion (or 10.3% of total exports) in 2009 to $22.6 billion (or 11.2% of total exports) in 2010. In August 2011, exports accumulated over the previous 12 months totaled $242.5 billion, a 33.9% increase from the $181.2 billion recorded in August 2010.
These trends have been influenced by Federal Government initiatives to promote exports. The Program for Export Financing (Programa de Financiamento às Exportações, or “PROEX”) is an instrument through which the Federal Government endeavors to offer to Brazilian exporters the same financial conditions encountered in the international markets. On September 13, 1996, the Federal Government approved the elimination of the ICMS on exports of primary and semi-finished goods and on the acquisition of certain fixed assets in an effort to liberalize the export sector and stimulate growth. The Federal Government reimburses States, for periods ranging from 6 to 10 years, for the loss of revenues resulting from the elimination of the ICMS. States experiencing revenue losses of up to 10% are eligible for reimbursement for six years. The reimbursement period is extended by one year for each additional two percentage points of revenue loss above 10%, up to a maximum reimbursement period of ten years. Aggregate reimbursement to the States totaled R$5.2 billion in 2005 and R$3.9 billion in both 2006 and 2007. In 2008, 2009, and 2010, aggregate reimbursement to the States totaled R$5.7 billion, R$3.9 billion and R$3.9 billion, respectively.
BNDES has been participating in the effort of maintaining a market-based, competitive environment for Brazilian exporters. BNDES-Exim, the export arm of BNDES, provides Brazilian producers of goods and services with a source of financing for their commercial transactions with the rest of the world, especially with South American countries, in response to their strategy of strengthening commercial and financial ties to the continent. The goal of supporting the development of the export sector also meets the objective of strengthening the domestic market, operating as an instrument for Brazilian enterprises to increase productivity and improve the quality of their goods and services. BNDES-Exim’s support of Brazilian exporting companies aims at achieving long-term, sustainable development by offering financial instruments for Brazilian businesses abroad. In an effort to increase the competitiveness of Brazilian exports, BNDES created a new type of financing, the Exim-Automatic, which offers credit at competitive rates for international trade of domestic goods and services.
In addition, the National Agency for the Promotion of Exports (Agência de Promoção de Exportações, or “APEX-Brasil”) was restructured in 2003. APEX-Brasil has the goal of boosting Brazilian exports by helping small and medium-sized companies that plan to become exporters compete to gain a share of the domestic market.
On August 4, 2006, CMN approved Resolution No. 3,389 which regulates receipts from Brazilian exports and the internalization of the foreign currency resulting from such receipts. Initially, Resolution No. 3,389, article No. 1, established a cap of 30% of export receipts as the maximum amount permitted to be maintained abroad by exporters. Thereafter, CMN Resolution No. 3,548 dated March 12, 2008 (replaced by CMN Resolution No. 3,719 dated April 30, 2009) abolished that limit, allowing the exporters to maintain the integrality of the receipts from their exports abroad. See “—Foreign Exchange Rates and Exchange Controls”.
On May 5, 2010, the Federal Government announced a set of measures aimed at improving the country’s trade balance. The main measures with respect to exports are: accelerating the payment of tax credits to exporters, allowing companies to use net export revenues to qualify for inclusion in the simplified tax management system or “SIMPLES”, introducing an improved drawback system, establishing a state-owned insurance company to provide insurance for long-term export financing, establishing an export-import bank to finance exports, and offering a R$7 billion credit line to finance exports of consumer goods. Another measure is a new rule whereby the Federal Government will exercise a preference towards buying domestic products (the Federal Government will be allowed to buy imported products only if the Brazilian substitute is 25% more expensive).
D-35
Imports
From 2006 to 2008, imports totaled $91.4 billion, $120.6 billion and $173.0 billion, respectively. In 2009, imports totaled $127.7 billion.
Imports totaled $181.6 billion in 2010. Imports from the European Union were $39.1 billion in 2010 (or 21.5% of all Brazilian imports), while imports from the United States were $27.2 billion in 2010 (or 15.0% of all Brazilian imports). Imports from Asia increased from $22.9 billion in 2006 (or 25.1% of all Brazilian imports) to $56.1 billion in 2010 (or 30.9% of all Brazilian imports). In August 2011, imports accumulated over the previous 12 months totaled $214.0 billion, a 30.4% increase from the $164.1billion recorded in August 2010 for the same period.
Brazil has reduced its import tariffs in the past. In 1991, the Federal Government announced a schedule for tariff reductions for a three-year period ending in January 1994, aimed at attaining rates varying from 0% to 40%, with an average tariff of 14.2%. The Federal Government subsequently accelerated certain scheduled adjustments and implemented the last set of tariff reductions on July 1, 1993, when the average duty and the maximum tariff were reduced to 14.4% and 40%, respectively. In an effort to contain inflation, the Federal Government also implemented in September and October 1994 significant new tariff reductions, covering over 5,000 products and reducing the average tariff to 11.32%. From November 30, 1997 to December 31, 1999, the average tariff was 13.8%. The average tariff dropped to 13.0% as of January 1, 2001 as a result of Decree No. 3,704 dated December 27, 2000 (Decree No. 4,088 dated January 15, 2002, revoked Decree No. 3,704 dated December 27, 2000); the maximum tariff was 55% as of that date. In 2010, the average tariff reached 11.98%, and the maximum tariff was 35.0%.
Average tariffs were also reduced as a result of Brazil’s implementation of a schedule of preferences applicable to imports from Mercosur countries. Mercosur members enjoyed a 75% discount from otherwise applicable rates during the second half of 1993 and 82% during the first half of 1994. This discount was raised to 89% beginning July 1, 1994 and to 100% beginning January 1, 1995, although certain products were excepted from this discount. In December 1994, the four member countries of Mercosur established January 1, 1995 as the date for the implementation of the CET, intended to transform the region into a customs union. The CET ranges from 0.0% to a maximum of 20.0%, but each member country is allowed a certain number of exceptions to the CET. The products on each country’s list of exceptions have tariffs varying from the CET. On December 7, 2009, Mercosur members decided to extend the expiration deadline of the list of exceptions to the common external tariff for Brazil and Argentina until December 31, 2011. Paraguay and Uruguay will be able to maintain their list of exceptions until December 31, 2015.
Brazil was a signatory to the Final Act of the GATT Uruguay Round, pursuant to which it committed to staged reductions in tariffs beginning in 1995 over five years with respect to industrial products and over ten years with respect to agricultural products.
The following table sets forth certain details regarding Brazil’s foreign trade for the years indicated.
Table No. 13
Principal Foreign Trade Indicators
| | | | | | | | | | | | | | | | | | | | |
| | | 2006 | | | 2007 | | | 2008 | | | 2009 | | | 2010(1) | |
Exports as % of GDP | | | 12.7 | % | | | 11.8 | % | | | 12.0 | % | | | 9.6 | % | | | 9.7 | % |
Imports as % of GDP | | | 8.4 | % | | | 8.8 | % | | | 10.5 | % | | | 8.0 | % | | | 8.7 | % |
Trade Balance as % of GDP | | | 4.3 | % | | | 2.9 | % | | | 1.5 | % | | | 1.6 | % | | | 1.0 | % |
Growth (Decline) in foreign trade(2) | | | 19.4 | % | | | 22.7 | % | | | 31.9 | % | | | (24.3 | )% | | | 36.7 | % |
Exports—% Increase (Decrease)(3) | | | 16.5 | % | | | 16.6 | % | | | 23.2 | % | | | (22.7 | )% | | | 32.0 | % |
Imports—% Increase (Decrease)(3) | | | 24.1 | % | | | 32.0 | % | | | 43.5 | % | | | (26.2 | )% | | | 42.3 | % |
Exports/Imports(4) | | | 1.51 | | | | 1.33 | | | | 1.14 | | | | 1.20 | | | | 1.11 | |
Exports | | | | | | | | | | | | | | | | | | | | |
$ in millions | | $ | 137,808 | | | $ | 160,649 | | | $ | 197,942 | | | $ | 152,995 | | | $ | 201,915 | |
1,000 tons | | | 424,389 | | | | 461,655 | | | | 468,942 | | | | 455,452 | | | | 520,117 | |
D-36
| | | | | | | | | | | | | | | | | | | | |
% change from prior period(5) | | | 6.9 | % | | | 8.8 | % | | | 1.6 | % | | | (2.9 | )% | | | 14.2 | % |
Imports | | | | | | | | | | | | | | | | | | | | |
$ in millions | | $ | 91,351 | | | $ | 120,617 | | | $ | 173,107 | | | $ | 127,705 | | | $ | 181,694 | |
1,000 tons | | | 102,272 | | | | 118,950 | | | | 124,494 | | | | 103,897 | | | | 138,194 | |
% change from prior period(5) | | | 9.3 | % | | | 16.3 | % | | | 4.7 | % | | | (16.5 | )% | | | 33.0 | % |
Trade Balance ($ in millions) | | $ | 46,457 | | | $ | 40,032 | | | $ | 24,836 | | | $ | 25,290 | | | $ | 20,221 | |
| (2) | Percentage change in exports and imports from previous year. |
| (3) | Percentage change from previous year. |
| (4) | Exports divided by imports. |
| (5) | Percentage change in volume, by weight. |
Source: Central Bank and Ministry of Development, Industry and Foreign Trade.
D-37
The following tables set forth certain information regarding exports and imports by major commodity groups for the periods indicated.
Table No. 14
Exports (FOB Brazil)(1)
| | | | | | | | | | | | | | | | | | | | | | | | | | | | | | | | | | | | | | | | |
| | | 2006 | | | 2007 | | | 2008 | | | 2009 | | | 2010(2) | |
Item | | in
$millions | | | % of
total | | | in
$millions | | | % of
total | | | in
$millions | | | % of
total | | | in
$millions | | | % of
total | | | in
$millions | | | % of
total | |
Livestock and animal products | | $ | 8,162 | | | | 5.9 | | | $ | 10,802 | | | | 6.7 | | | $ | 13,974 | | | | 7.1 | | | $ | 11,225 | | | | 7.3 | | | $ | 13,526 | | | | 6.7 | |
Vegetable products | | | 10,329 | | | | 7.5 | | | | 13,574 | | | | 8.4 | | | | 18,563 | | | | 9.4 | | | | 18,198 | | | | 11.9 | | | | 20,250 | | | | 10.0 | |
Oils, fat and waxes of animals and plants | | | 1,396 | | | | 1.0 | | | | 1,936 | | | | 1.2 | | | | 2,992 | | | | 1.5 | | | | 1,471 | | | | 1.0 | | | | 1,661 | | | | 0.8 | |
Food, beverage and tobacco | | | 16,391 | | | | 11.9 | | | | 17,720 | | | | 11.0 | | | | 21,741 | | | | 11.0 | | | | 22,854 | | | | 14.9 | | | | 27,057 | | | | 13.4 | |
Mineral products | | | 20,993 | | | | 15.2 | | | | 26,057 | | | | 16.2 | | | | 38,185 | | | | 19.3 | | | | 28,709 | | | | 18.8 | | | | 51,401 | | | | 25.5 | |
Chemical products | | | 6,574 | | | | 4.8 | | | | 8,000 | | | | 5.0 | | | | 9,481 | | | | 4.8 | | | | 8,107 | | | | 5.3 | | | | 10,273 | | | | 5.1 | |
Plastic, rubber and derivative products | | | 4,183 | | | | 3.0 | | | | 4,954 | | | | 3.1 | | | | 4,961 | | | | 2.5 | | | | 4,452 | | | | 2.9 | | | | 5,342 | | | | 2.6 | |
Fur, leather and derivative products | | | 2,040 | | | | 1.5 | | | | 2,353 | | | | 1.5 | | | | 2,039 | | | | 1.0 | | | | 1,287 | | | | 0.8 | | | | 1,866 | | | | 0.9 | |
Wood, wood charcoal and products, etc. | | | 3,163 | | | | 2.3 | | | | 3,341 | | | | 2.1 | | | | 2,762 | | | | 1.4 | | | | 1,681 | | | | 1.1 | | | | 1,920 | | | | 1.0 | |
Paste of wood, paper and derivative products, etc. | | | 4,075 | | | | 3.0 | | | | 4,793 | | | | 3.0 | | | | 5,898 | | | | 3.0 | | | | 5,046 | | | | 3.3 | | | | 6,820 | | | | 3.4 | |
Textile materials and derivative products | | | 2,109 | | | | 1.5 | | | | 2,364 | | | | 1.5 | | | | 2,425 | | | | 1.2 | | | | 1,896 | | | | 1.2 | | | | 2,265 | | | | 1.1 | |
Shoes, hats, etc. | | | 1,972 | | | | 1.4 | | | | 2,046 | | | | 1.3 | | | | 2,032 | | | | 1.0 | | | | 1,481 | | | | 1.0 | | | | 1,653 | | | | 0.8 | |
Articles of stone, ceramic, glass, etc. | | | 1,979 | | | | 1.4 | | | | 2,091 | | | | 1.3 | | | | 1,897 | | | | 1.0 | | | | 1,406 | | | | 0.9 | | | | 1,685 | | | | 0.8 | |
Natural pearls, precious stones etc. | | | 1,081 | | | | 0.8 | | | | 1,243 | | | | 0.8 | | | | 1,544 | | | | 0.8 | | | | 1,737 | | | | 1.1 | | | | 2,270 | | | | 1.1 | |
Common metals and derivative products | | | 15,313 | | | | 11.1 | | | | 16,852 | | | | 10.5 | | | | 20,359 | | | | 10.3 | | | | 12,259 | | | | 8.0 | | | | 14,412 | | | | 7.1 | |
Machinery and equipment, electric materials, etc. | | | 17,331 | | | | 12.6 | | | | 17,761 | | | | 11.1 | | | | 19,441 | | | | 9.8 | | | | 13,326 | | | | 8.7 | | | | 16,217 | | | | 8.0 | |
Transport materials | | | 16,063 | | | | 11.7 | | | | 19,452 | | | | 12.1 | | | | 22,385 | | | | 11.3 | | | | 13,003 | | | | 8.5 | | | | 17,273 | | | | 8.6 | |
Scientific instruments and equipment | | | 665 | | | | 0.5 | | | | 742 | | | | 0.5 | | | | 831 | | | | 0.4 | | | | 694 | | | | 0.5 | | | | 829 | | | | 0.4 | |
Weapons and ammunition | | | 134 | | | | 0.1 | | | | 201 | | | | 0.1 | | | | 260 | | | | 0.1 | | | | 338 | | | | 0.2 | | | | 322 | | | | 0.2 | |
Goods and diverse products | | | 1,229 | | | | 0.9 | | | | 1,361 | | | | 0.8 | | | | 1,333 | | | | 0.7 | | | | 997 | | | | 0.7 | | | | 1,078 | | | | 0.5 | |
Objects of art, collection and antiques | | | 11 | | | | 0.0 | | | | 9 | | | | 0.0 | | | | 19 | | | | 0.0 | | | | 34 | | | | 0.0 | | | | 20 | | | | 0.0 | |
Special transactions | | | 2,614 | | | | 1.9 | | | | 2,996 | | | | 1.9 | | | | 4,821 | | | | 2.4 | | | | 2,796 | | | | 1.8 | | | | 3,775 | | | | 1.9 | |
| | | | | | | | | | | | | | | | | | | | | | | | | | | | | | | | | | | | | | | | |
Total | | | 137,807 | | | | 100.0 | | | | 160,649 | | | | 100.0 | | | | 197,942 | | | | 100.0 | | | | 152,995 | | | | 100.0 | | | | 201,915 | | | | 100.0 | |
| | | | | | | | | | | | | | | | | | | | | | | | | | | | | | | | | | | | | | | | |
D-38
| (1) | According to the NCM: Nomenclatura Comum do MERCOSUR (Common Nomenclature of MERCOSUR). |
Source: Ministry of Development, Industry and Foreign Trade.
D-39
Table No. 15
Imports (FOB Country of Origin)(1)
| | | | | | | | | | | | | | | | | | | | | | | | | | | | | | | | | | | | | | | | |
| | | 2006 | | | 2007 | | | 2008 | | | 2009 | | | 2010(2) | |
Item | | in
$millions | | | % of
total | | | in
$millions | | | % of
total | | | in
$millions | | | % of
total | | | in
$millions | | | % of
total | | | in
$millions | | | % of
total | |
Livestock and animal products | | $ | 760 | | | | 0.8 | | | $ | 949 | | | | 0.8 | | | $ | 1,240 | | | | 0.7 | | | $ | 1,294 | | | | 1.0 | | | $ | 1,675 | | | | 0.9 | |
Vegetable products | | | 2,203 | | | | 2.4 | | | | 3,117 | | | | 2.6 | | | | 4,377 | | | | 2.5 | | | | 3,578 | | | | 2.8 | | | | 4,329 | | | | 2.4 | |
Oils, fat and waxes of animals and plants | | | 297 | | | | 0.3 | | | | 460 | | | | 0.4 | | | | 743 | | | | 0.4 | | | | 599 | | | | 0.5 | | | | 746 | | | | 0.4 | |
Food, beverage and tobacco | | | 1,012 | | | | 1.1 | | | | 1,250 | | | | 1.0 | | | | 1,511 | | | | 0.9 | | | | 1,569 | | | | 1.2 | | | | 2,014 | | | | 1.1 | |
Mineral products | | | 18,921 | | | | 20.7 | | | | 24,330 | | | | 20.2 | | | | 37,180 | | | | 21.6 | | | | 20,121 | | | | 15.8 | | | | 31,935 | | | | 17.6 | |
Chemical products and derivative products | | | 13,936 | | | | 15.3 | | | | 19,723 | | | | 16.4 | | | | 29,466 | | | | 17.0 | | | | 21,577 | | | | 16.9 | | | | 27,217 | | | | 15.0 | |
Plastic, rubber and derivative products | | | 5,244 | | | | 5.7 | | | | 6,597 | | | | 5.5 | | | | 9,100 | | | | 5.3 | | | | 7,084 | | | | 5.5 | | | | 10,511 | | | | 5.8 | |
Fur, leather and derivative products | | | 278 | | | | 0.3 | | | | 337 | | | | 0.3 | | | | 427 | | | | 0.2 | | | | 338 | | | | 0.3 | | | | 476 | | | | 0.3 | |
Wood, wood charcoal and derivative products. | | | 122 | | | | 0.1 | | | | 149 | | | | 0.1 | | | | 189 | | | | 0.1 | | | | 123 | | | | 0.1 | | | | 149 | | | | 0.1 | |
Paste of wood, paper and derivative products. | | | 1,256 | | | | 1.4 | | | | 1,493 | | | | 1.2 | | | | 1,906 | | | | 1.1 | | | | 1,511 | | | | 1.2 | | | | 2,102 | | | | 1.2 | |
Textile materials and derivative products | | | 2,142 | | | | 2.3 | | | | 3,010 | | | | 2.5 | | | | 3,833 | | | | 2.2 | | | | 3,481 | | | | 2.7 | | | | 5,038 | | | | 2.8 | |
Shoes, hats, etc. | | | 183 | | | | 0.2 | | | | 276 | | | | 0.2 | | | | 410 | | | | 0.2 | | | | 421 | | | | 0.3 | | | | 494 | | | | 0.3 | |
Articles of stone, ceramic, glass, etc. | | | 584 | | | | 0.6 | | | | 781 | | | | 0.6 | | | | 1,097 | | | | 0.6 | | | | 866 | | | | 0.7 | | | | 1,334 | | | | 0.7 | |
Natural pearls, precious stones, etc. | | | 326 | | | | 0.4 | | | | 433 | | | | 0.4 | | | | 545 | | | | 0.3 | | | | 369 | | | | 0.3 | | | | 557 | | | | 0.3 | |
Common metals and derivative products | | | 5,970 | | | | 6.5 | | | | 8,302 | | | | 6.9 | | | | 11,480 | | | | 6.6 | | | | 7,783 | | | | 6.1 | | | | 13,366 | | | | 7.4 | |
Machinery and equipment, electric materials, etc. | | | 26,644 | | | | 29.2 | | | | 33,298 | | | | 27.6 | | | | 45,624 | | | | 26.3 | | | | 36,611 | | | | 28.7 | | | | 50,783 | | | | 28.0 | |
Transport materials | | | 7,212 | | | | 7.9 | | | | 10,458 | | | | 8.7 | | | | 16,351 | | | | 9.4 | | | | 14,189 | | | | 11.1 | | | | 20,901 | | | | 11.5 | |
Scientific instruments and equipment | | | 3,650 | | | | 4.0 | | | | 4,760 | | | | 3.9 | | | | 6,248 | | | | 3.6 | | | | 5,091 | | | | 4.0 | | | | 6,418 | | | | 3.5 | |
Weapons and ammunition | | | 13 | | | | 0.0 | | | | 9 | | | | 0.0 | | | | 21 | | | | 0.0 | | | | 28 | | | | 0.0 | | | | 70 | | | | 0.0 | |
Goods and diverse products | | | 591 | | | | 0.6 | | | | 869 | | | | 0.7 | | | | 1,210 | | | | 0.7 | | | | 1,025 | | | | 0.8 | | | | 1,527 | | | | 0.8 | |
Objects of art, collection and antiques | | | 5 | | | | 0.0 | | | | 15 | | | | 0.0 | | | | 23 | | | | 0.0 | | | | 5 | | | | 0.0 | | | | 7 | | | | 0.0 | |
Special transactions | | | 0 | | | | 0.0 | | | | 0 | | | | 0.0 | | | | 0 | | | | 0.0 | | | | 0 | | | | 0.0 | | | | 0 | | | | 0.0 | |
| | | | | | | | | | | | | | | | | | | | | | | | | | | | | | | | | | | | | | | | |
Total | | | 91,351 | | | | 100.0 | | | | 120,618 | | | | 100.0 | | | | 172,985 | | | | 100.0 | | | | 127,722 | | | | 100.0 | | | | 181,649 | | | | 100.0 | |
| | | | | | | | | | | | | | | | | | | | | | | | | | | | | | | | | | | | | | | | |
| (1) | According to the NCM: Nomenclatura Comum do MERCOSUL (Common Nomenclature of MERCOSUR). |
Source: Ministry of Development, Industry and Foreign Trade.
D-40
The following tables set forth certain information regarding the destination of Brazil’s exports and the sources of its imports for the periods indicated.
Table No. 16
Exports (FOB Brazil) by Region
| | | | | | | | | | | | | | | | | | | | | | | | | | | | | | | | | | | | | | | | | | | | | | |
| | | 2006 | | | 2007 | | | 2008 | | | 2009 | | | 2010(5) | |
Item | | in
$millions | | | % of
total | | | in
$millions | | | % of
total | | in
$millions | | | % of
total | | in
$millions | | | % of
total | | in
$millions | | | % of
total | |
LAIA(1) | | $ | 31,495 | | | | 22.85 | | | $ | 36,426 | | | | 22.67 | | $ | 43,095 | | | | 21.77 | | $ | 29,897 | | | | 19.54 | | | | | $ | 41,202 | | | | 20.41 | |
MERCOSUR | | | 13,986 | | | | 10.15 | | | | 17,354 | | | | 10.80 | | | 21,737 | | | | 10.98 | | | 15,829 | | | | 10.35 | | | 22,602 | | | | 11.19 | |
LAIA ex-MERCOSUR | | | 17,510 | | | | 12.71 | | | | 19,072 | | | | 11.87 | | | 21,357 | | | | 10.79 | | | 14,068 | | | | 9.19 | | | 18,601 | | | | 9.21 | |
USA(2) | | | 24,773 | | | | 17.98 | | | | 25,314 | | | | 15.76 | | | 27,648 | | | | 13.97 | | | 15,740 | | | | 10.29 | | | 19,462 | | | | 9.64 | |
CARICOM(3) | | | 2,354 | | | | 1.71 | | | | 2,447 | | | | 1.52 | | | 4,812 | | | | 2.43 | | | 3,180 | | | | 2.08 | | | 3,707 | | | | 1.84 | |
Canada | | | 2,281 | | | | 1.66 | | | | 2,362 | | | | 1.47 | | | 1,866 | | | | 0.94 | | | | | | 1,712 | | | | 1.12 | | | 2,321 | | | | 1.15 | |
Others America | | | 2,678 | | | | 1.94 | | | | 3,006 | | | | 1.87 | | | 3,371 | | | | 1.70 | | | 2,648 | | | | 1.73 | | | 3,199 | | | | 1.58 | |
EU | | | 31,045 | | | | 22.53 | | | | 40,428 | | | | 25.17 | | | 46,395 | | | | 23.44 | | | 34,037 | | | | 22.25 | | | 43,135 | | | | 21.36 | |
EFTA(4) | | | 1,434 | | | | 1.04 | | | | 1,808 | | | | 1.13 | | | 2,339 | | | | 1.18 | | | 1,852 | | | | 1.74 | | | 2,464 | | | | 1.22 | |
Eastern Europe | | | 3,892 | | | | 2.82 | | | | 4,309 | | | | 2.68 | | | 5,580 | | | | 2.82 | | | 3,383 | | | | 2.21 | | | 4,788 | | | | 2.37 | |
Other Western European Countries | | | 753 | | | | 0.55 | | | | 935 | | | | 0.58 | | | | | | 1,182 | | | | 0.60 | | | 892 | | | | 0.58 | | | 1,345 | | | | 0.67 | |
Asia (ex-Middle Eastern) | | | 20,816 | | | | 15.11 | | | | 25,086 | | | | 15.62 | | | 37,442 | | | | 18.92 | | | 40,239 | | | | 25.77 | | | 56,273 | | | | 27.87 | |
Middle Eastern | | | 5,749 | | | | 4.17 | | | | 6,399 | | | | 3.98 | | | 8,055 | | | | 4.07 | | | 7,552 | | | | 4.94 | | | 10,525 | | | | 5.21 | |
Africa | | | 7,456 | | | | 5.41 | | | | 8,578 | | | | 5.34 | | | 10,170 | | | | 5.14 | | | 8,692 | | | | 5.68 | | | 9,262 | | | | 4.59 | |
Oceania | | | 598 | | | | 0.43 | | | | 702 | | | | 0.44 | | | 1,356 | | | | 0.69 | | | 558 | | | | 0.36 | | | 662 | | | | 0.33 | |
Others | | | 2,482 | | | | 1.80 | | | | 2,848 | | | | 1.77 | | | 4,631 | | | | 2.34 | | | 2,614 | | | | 1.71 | | | 3,570 | | | | 1.77 | |
| | | | | | | | | | | | | | | | | | | | | | | | | | | | | | | | | | | | | | | | | | | | | | |
Total | | | 137,807 | | | | 100.00 | | | | 160,649 | | | | 100.00 | | | 197,942 | | | | 100.00 | | | 152,995 | | | | 100.00 | | | 201,915 | | | | 100.00 | |
| | | | | | | | | | | | | | | | | | | | | | | | | | | | | | | | | | | | | | | | | | | | | | |
| (1) | Latin American Integration Association. |
| (3) | Caribbean Community and Common Market. |
| (4) | European Free Trade Association. |
Source: Ministry of Development, Industry and Foreign Trade.
D-41
The following tables set forth imports by region:
Table No. 17
Imports (FOB Country of Origin) by Region
| | | | | | | | | | | | | | | | | | | | | | | | | | | | | | | | | | | | | | | | |
| | | 2006 | | | 2007 | | | 2008 | | | 2009 | | | 2010(5) | |
Item | | in
$millions | | | % of
total | | | in
$millions | | | % of
total | | | in
$millions | | | % of
total | | | in
$millions | | | % of
total | | | in
$millions | | | % of
total | |
LAIA(1) | | $ | 16,282 | | | | 17.82 | | | $ | 20,563 | | | | 17.05 | | | $ | 27,281 | | | | 15.77 | | | $ | 21,944 | | | | 17.18 | | | $ | 29,744 | | | | 16.37 | |
MERCOSUR | | | 8,967 | | | | 9.82 | | | | 11,625 | | | | 9.64 | | | | 14,934 | | | | 8.63 | | | | 13,107 | | | | 10.26 | �� | | | 16,612 | | | | 9.15 | |
LAIA ex-MERCOSUR | | | 7,314 | | | | 8.01 | | | | 8,938 | | | | 7.41 | | | | 12,347 | | | | 7.14 | | | | 8,837 | | | | 6.92 | | | | 13,132 | | | | 7.23 | |
USA(2) | | | 14,817 | | | | 16.22 | | | | 18,888 | | | | 15.66 | | | | 25,811 | | | | 14.92 | | | | 20,187 | | | | 15.81 | | | | 27,249 | | | | 15.00 | |
CARICOM(3) | | | 149 | | | | 0.16 | | | | 175 | | | | 0.14 | | | | 378 | | | | 0.22 | | | | 196 | | | | 0.15 | | | | 529 | | | | 0.29 | |
Canada | | | 1,194 | | | | 1.31 | | | | 1,709 | | | | 1.42 | | | | 3,210 | | | | 1.86 | | | | 1,602 | | | | 1.25 | | | | 2,714 | | | | 1.49 | |
Others America | | | 419 | | | | 0.46 | | | | 659 | | | | 0.55 | | | | 826 | | | | 0.48 | | | | 614 | | | | 0.48 | | | | 547 | | | | 0.30 | |
EU | | | 20,203 | | | | 22.12 | | | | 26,734 | | | | 22.16 | | | | 36,179 | | | | 20.91 | | | | 29,224 | | | | 22.88 | | | | 39,121 | | | | 21.54 | |
EFTA(4) | | | 1,677 | | | | 1.84 | | | | 2,731 | | | | 2.26 | | | | 2,901 | | | | 1.68 | | | | 2,564 | | | | 2.01 | | | | 3,583 | | | | 1.97 | |
Eastern Europe | | | 1,434 | | | | 1.57 | | | | 2,767 | | | | 2.29 | | | | 5,338 | | | | 3.09 | | | | 2,105 | | | | 1.65 | | | | 3,024 | | | | 1.66 | |
Others Europe | | | 168 | | | | 0.18 | | | | 234 | | | | 0.19 | | | | 382 | | | | 0.22 | | | | 434 | | | | 0.34 | | | | 824 | | | | 0.45 | |
Asia (ex-Middle Eastern) | | | 22,888 | | | | 25.06 | | | | 30,723 | | | | 25.47 | | | | 47,131 | | | | 27.25 | | | | 36,141 | | | | 28.30 | | | | 56,142 | | | | 30.91 | |
Middle Eastern | | | 3,165 | | | | 3.46 | | | | 3,205 | | | | 2.66 | | | | 6,231 | | | | 3.60 | | | | 3,142 | | | | 2.46 | | | | 4,680 | | | | 2.58 | |
Africa | | | 8,111 | | | | 8.88 | | | | 11,347 | | | | 9.41 | | | | 15,761 | | | | 9.11 | | | | 8,466 | | | | 6.63 | | | | 11,302 | | | | 6.22 | |
Oceania | | | 766 | | | | 0.84 | | | | 807 | | | | 0.67 | | | | 1,310 | | | | 0.76 | | | | 899 | | | | 0.70 | | | | 1,400 | | | | 0.77 | |
Others | | | 78 | | | | 0.09 | | | | 78 | | | | 0.06 | | | | 247 | | | | 0.14 | | | | 205 | | | | 0.16 | | | | 790 | | | | 0.43 | |
| | | | | | | | | | | | | | | | | | | | | | | | | | | | | | | | | | | | | | | | |
Total | | | 91,351 | | | | 100.00 | | | | 120,617 | | | | 100.00 | | | | 172,985 | | | | 100.00 | | | | 127,722 | | | | 100.00 | | | | 181,649 | | | | 100.00 | |
| (1) | Latin American Integration Association. |
| (3) | Caribbean Community and Common Market. |
| (4) | European Free Trade Association. |
Source: Ministry of Development, Industry and Foreign Trade.
Foreign Investment
Net foreign direct investment inflows totaled $18.8 billion in 2006, $34.6 billion in 2007, $45.1 billion in 2008, $25.9 billion in 2009, and $48.4 billion in 2010. Net foreign portfolio investment registered an inflow of approximately $9.1 billion in 2006 and $48.1 billion in 2007. Net foreign portfolio investment registered an outflow of approximately $767 million in 2008, but registered an inflow of approximately $46.2 billion in 2009 and $67.8 billion in 2010.
External financing needs, defined as the difference of the current account deficit minus net foreign direct investment, have been negative since January 2002 when they totaled $9.0 billion. In 2010, Brazilian external financing needs were negative $1.1 billion. Brazil received more through net foreign direct investment than it needed to finance its current account from 2002 to 2010.
The following table sets forth information regarding foreign direct and portfolio investment in Brazil for each of the years indicated.
D-42
Table No. 18
Foreign Direct and Portfolio Investment in Brazil
| | | | | | | | | | | | | | | | | | | | | | | | | | | | | | | | | | | | |
| | | Inflows | | | Outflows | | | Total | |
| | | Portfolio(1) | | | Direct(2) | | | Total | | | Portfolio(1) | | | Direct(2) | | | Total | | | Portfolio | | | Direct | | | Total | |
| | | (in millions of dollars) | |
2006 | | | 99,367 | | | | 32,399 | | | | 131,766 | | | | 90,291 | | | | 13,577 | | | | 103,868 | | | | 9,076 | | | | 18,8222 | | | | 27,898 | |
2007 | | | 209,927 | | | | 50,233 | | | | 260,160 | | | | 161,823 | | | | 15,648 | | | | 177,470 | | | | 48,104 | | | | 34,5855 | | | | 82,689 | |
2008 | | | 266,460 | | | | 71,836 | | | | 338,296 | | | | 267,227 | | | | 26,778 | | | | 294,005 | | | | (767 | ) | | | 45,0588 | | | | 44,291 | |
2009(3) | | | 194,451 | | | | 53,507 | | | | 247,958 | | | | 148,292 | | | | 27,558 | | | | 175,851 | | | | 46,159 | | | | 25,949 | | | | 72,107 | |
2010(3) | | | 181,235 | | | | 78,644 | | | | 259,878 | | | | 113,440 | | | | 30,206 | | | | 143,646 | | | | 67,795 | | | | 48,438 | | | | 116,233 | |
| (1) | Includes equity securities, bonds, commercial paper and notes, except those related to external debt restructurings. |
| (2) | Includes reinvested earnings and excludes intercompany debt transactions. |
Source: Central Bank.
Since January of 1999, when the floating regime was adopted, Brazil’s economy has experienced growth in the export value of goods (from $48.0 billion in 1999 to $201.9 billion in 2010), an increase in gross external debt (from $225.6 billion in 1999 to $256.8 billion in 2010), especially with regards to the public sector, and a recovery of international reserve levels (from $36.3 billion in 1999 to $288.6 billion in 2010). In addition to the positive impact contributed by these variables, Brazilian real economy had an average growth of 3.4% from 1999 to 2010, primarily due to the improvement of Brazil’s external sector vulnerability economic indicators, such as: (i) debt service to exports ratio (126.5% to 23.0%); (ii) debt service to GDP ratio (11.3% to 2.2%); (iii) external debt to GDP ratio (42.0% to 12.3%); (iv) international reserves to total external debt ratio (16.1% to 112.4%); (vi) total external debt to exports ratio (4.7% to 1.3%); and (vii) net total external debt to exports ratio (3.6% to negative 0.3%).
International Reserves
The second half of 2002 and the first quarter of 2003 posed several challenges for Brazilian foreign trade, which arose in large part from the effects of Argentina’s financial crisis, a weak global economy, uncertainties about the country’s national elections held in October 2002 and concerns about terrorism and tensions in the Middle East. From July through October 2002, the real declined against the U.S. dollar reaching a low of R$3.9552 to $1.00 on October 22, 2002. Net foreign investment also declined significantly, with net foreign direct investment falling to $16.6 billion in 2002, a 26.1% decrease from 2001, and net foreign portfolio outflows reaching $4.8 billion. Other investment flows were also negative in 2002, totaling $231 million. In 2002, Brazil requested and was granted a 15-month standby facility by the IMF of SDR 22.8 billion (approximately $31.4 billion) to support the country’s economic and financial program through December 2003.
As the Federal Government continued to pursue an economic policy emphasizing fiscal discipline, a floating exchange rate and inflation targeting, Brazil was able to regain access to the international capital markets in 2003. In addition, the real began to appreciate against the U.S. dollar, ending at a ratio of R$2.8892 to $1.00 in 2003. Brazil’s international reserves stood at $49.3 billion on December 31, 2003.
During 2003, the National Treasury was permitted to purchase U.S. dollars in the foreign currency markets in Brazil. The U.S. dollars so purchased were used to make payments in respect of Brazil’s external debt. Although the proceeds were reserved for external debt payments, these purchases had the effect of keeping Brazil’s international reserves at levels higher than they would otherwise have been, because they replaced withdrawals that would otherwise have been made. To promote transparency in the Republic’s accounts, the Minister of Finance and the President of the Central Bank agreed in January 2004 to have the National Treasury purchase from the Central Bank all foreign currency that Brazil needed to make payments in respect of its external debt. The Central Bank may either provide the National Treasury with foreign currency from Brazil’s international reserves or purchase such foreign currency in the foreign currency markets in Brazil.
D-43
Brazil’s international reserves totaled $85.8 billion in 2006, $180.3 billion in 2007, $193.8 billion in 2008, $238.5 billion in 2009 and $288.6 billion in 2010. Brazil’s international reserves totaled $350.5 billion on September 27, 2011.
The following table sets forth certain information regarding Brazil’s international reserves at the dates indicated.
Table No. 19
International Reserves
| | | | | | | | | | | | | | | | | | | | |
| | | As of December 31, | |
| | | 2006 | | | 2007 | | | 2008 | | | 2009 | | | 2010 | |
Total Gold and Foreign Exchange | | | 85,146 | | | | 164,427 | | | | 191,869 | | | | 229,819 | | | | 277,667 | |
Gold(1) | | | 683 | | | | 901 | | | | 940 | | | | 1,175 | | | | 1 519 | |
Foreign Exchange | | | 84,463 | | | | 163,526 | | | | 190,929 | | | | 228,644 | | | | 276,148 | |
Special Drawing Rights | | | 8 | | | | 2 | | | | 1 | | | | 4,510 | | | | 4,450 | |
Other reserve assets(2) | | | 685 | | | | 15,905 | | | | 1,913 | | | | 3,244 | | | | 4,422 | |
Total Official Reserves | | $ | 85,839 | | | $ | 180,334 | | | $ | 193,783 | | | $ | 238,520 | | | $ | 288,575 | |
| | | | | | | | | | | | | | | | | | | | |
| (1) | Includes available stock of financial gold plus time deposits. |
| (2) | Includes financial derivatives, loans to nonbank nonresidents (includes export credit), reverse repo (securities borrowed with other securities used as collateral) and others. |
Source: Central Bank.
Foreign Exchange Rates and Exchange Controls
The Brazilian foreign exchange system has been structured to enable the Federal Government, through the Central Bank, to regulate and control foreign exchange transactions carried out in Brazil.
CMN Resolution No. 2,110, a Plano Real initiative, provides that the Central Bank has an obligation to sell U.S. dollars in the foreign exchange market whenever the real reaches parity with the U.S. dollar. In response to deterioration in Brazil’s current account, on March 6, 1995 the Central Bank formalized an exchange band system, pursuant to which the real was permitted to float against the U.S. dollar within bands established by the Central Bank. Under the exchange band system, the Central Bank was committed to intervene in the market whenever rates approached the upper and lower limits of the band. This commitment did not eliminate the possibility of the Central Bank intervening when necessary to avoid extreme oscillations in the exchange rate.
On January 13, 1999, Gustavo H.B. Franco, the president of the Central Bank and one of the architects of the Plano Real, resigned and was replaced by Francisco Lopes, who attempted a controlled devaluation of the real by widening the band within which the real was permitted to trade. Subsequent Central Bank intervention failed to keep the real-U.S. dollar exchange rate within the new band; however, on January 15, 1999, the Central Bank announced that the real would be permitted to float, with Central Bank intervention to be made only in times of extreme volatility. See “The Brazilian Economy—Economic Events and Policies”.
The Federal Government has periodically taken measures to control the inflow of foreign capital in order to facilitate the conduct of monetary policy and to regulate the level of Brazil’s international reserves. The Federal Government frequently adjusts details of fiscal policy in order to promote or restrict the flow of foreign capital into Brazil. Measures taken by the Federal Government for these purposes include: raising or lowering tax rates on financial transactions; establishing restrictions on investments in fixed income assets; authorizing or prohibiting settlement of foreign loans and financings in advance; and raising or lowering the net amount of foreign reserves a bank may hold without depositing such reserves in the Central Bank.
D-44
The real ended the year with a rate of R$1.666 to $1.00 on December 31, 2010. One important source of real appreciation in relation to the previous year is the continued strength in foreign exchange inflow, which was $24.4 billion in 2010 compared with $28.7 billion in 2009.
The appreciation of the real was also due in part to the financial segment, which reported a liquid entry of $26.0 billion in 2010 against liquid exits of $18.8 billion in 2009. Moreover, there was a liquid entry in the commercial segment which had a deficit of $1.7 billion in 2010.
The Brazilian real-U.S. dollar exchange rate on the sell side was R$1.6287 to $1.00 on March 31, 2011. To prevent overvaluation of the real, which has hindered the trade balance in the past by showing an increased current account deficit, the Federal Government passed Decree No. 7,323 (later replaced by Decree No. 7,412), which increased the IOF tax on foreign portfolio investments on fixed-income instruments from 2% to 4%, effective October 5, 2010. The CMN approved Resolution No. 3,911 on October 5, 2010, widening the window for purchasing currency on the foreign exchange market for debt payments from 750 days to 1,500 days, also to prevent overvaluation of the real. This measure, applying to both private borrowers and to the National Treasury, permits the Federal Government to increase its purchases of dollars in the local currency market to pay off foreign debt obligations. On October 18, 2010, through Decree No. 7,330, the Federal Government announced an additional increase in the IOF tax, from 4% to 6%, and a separate increase in the IOF tax on margin operations with respect to the futures market in Brazil, from 0.38% to 6%. Under these measures, the managers of Brazil’s Sovereign Fund (Fundo Soberano Brasileiro, or “FSB”) were authorized to purchase dollars on September 17, 2010.
President Rousseff’s administration has continued adopting measures in order to avoid the appreciation of the real against other foreign currencies in the exchange market. As a part of these measures, on September 17, 2010, the Government authorized the managers of Brazil’s Sovereign Fund to purchase dollars on the foreign exchange market and enter into derivative contracts . In addition, on January 6, 2011, Central Bank Circular No. 3,520 (later replaced by Central Bank Circular No. 3,548) created a mandatory deposit which came into force on April 4, 2011 to be made by all banks authorized to deal in foreign exchange in Brazil, at the rate of 60% over the result of their daily selling exchange position exceeding $3 billion or their respective equity reference value, whichever is lesser. By means of Decree No 7,456 dated March 28, 2011, the Federal Government set an IOF tax of 6% on external loans and bonds with durations shorter than 360 days , which duration was extended to 720 days by Decree No. 7,457 dated April 6, 2011. The measure aims at reducing short-term capital flows; loans with duration of more than 720 days and foreign direct investment remain exempt.
CMN Resolution No. 2,770 dated August 30, 2000 and Central Bank Circular No. 3,027 dated February 14, 2001, are intended to simplify the rules for the registration of foreign credit transactions. The new rules eliminate the need to obtain the prior authorization of the Central Bank with respect to foreign credit transactions, including bond issuances, for private sector borrowers or issuers. The new rules require only that such transactions be registered at the time the exchange contract for the entry of the funds into the country is signed. In addition, the Central Bank introduced a system for the electronic registration of foreign credit transactions called the Registration of Financial Transactions (Registro de Operações Financeiras). The new rules further require funds raised abroad to be deposited in real in a local bank in Brazil, but permit financial institutions and leasing companies to retain funds outside Brazil in connection with credit transactions tied to export operations.
On February 2, 2005, the Central Bank began offering swaps that were the reverse of those it had previously been offering. Under the new inverted swaps, the Central Bank is to make taxa Over/Selic payments in exchange for U.S. dollar payments. These swaps are intended to hedge foreign exchange risk. The Central Bank sold a net market value of approximately R$11.2 billion of swaps in 2006; R$13.4 billion in 2007; R$67.4 billion in 2008; and R$27.8 billion in 2009. The Central Bank did not sell inverted swaps in 2010.
On January 2, 2006, pursuant to Circular No. 3,307 dated December 30, 2005, the Central Bank eliminated its restrictions on the amount of long positions in foreign exchange that banks could keep. Prior to that date, financial institutions were prohibited from maintaining long positions exceeding $6 million in the aggregate.
CMN Resolution No. 3,389 dated August 4, 2006, modified by Resolution No. 3,548 dated March 14, 2008 (replaced by Resolution No. 3,719 dated April 30, 2009), establishes that exporters can maintain abroad up to 100% of their export revenues. CMN Resolution No. 3,568 dated May 29, 2008, simplifies a series of procedures in foreign exchange transactions: (i) banks (with respect to Development Banks, only for special operations authorized by the Central Bank) and CEF are authorized to conduct all foreign exchange transactions; (ii) financial foreign exchange export and import transactions and transfers to and from Brazil up to $50,000 can be made through simplified exchange contracts; (iii) agents authorized to
D-45
operate in the Exchange Rate Market, foreigners living temporarily in Brazil and Brazilians residing abroad are allowed to keep banking accounts in foreign currencies in the banks authorized to operate in the foreign exchange market; (iv) exchange transactions of reais to foreign currencies between financial institutions in Brazil and abroad are allowed; (v) the requirement to present documentation for purchase and sale of foreign currencies in amounts of up to $3,000 is dismissed, provided the remitter and beneficiary are identified; (vi) the Central Bank is authorized to use a simplified register of foreign exchange operations for up to $3,000; and (vii) the limit is raised from $20,000 to $50,000 for simplified export and import foreign exchange operations when conducted by non-banking financial institutions. CMN approved Resolution No. 3,911 on October 5, 2010, widening the window for purchasing currency on the foreign exchange market for debt payments from 750 days to 1,500 days.
Central Bank Circular No. 3,325 dated August 24, 2006, which regulates CMN Resolution No. 3,389 dated August 4, 2006 (replaced by Resolution No. 3,719 dated April 30, 2009), extended the term of export foreign exchange contracts to 360 days from 210 days, while it maintained the maximum term of 360 days between the date of the agreement and the satisfaction of the contract in import foreign exchange operations. Also, this Circular (i) allows the use of amounts deposited in overseas banks for external payments in the name of the account owner, with a few exceptions provided by Law No. 11,371; (ii) eliminates restrictions for simplified foreign exchange import and export contracts when conducted through financial institutions; and (iii) defines the proceedings for simultaneous agreement of simplified export contracts in foreign currencies intending to include amounts held outside Brazil and eliminates the need to tie short term export and import foreign exchange contracts to respective registries in the Integrated System of External Trade (Sistema Integrado de Comércio Exterior).
On March 30, 2007, CVM published Resolution No. 450 which allows local Brazilian mutual funds to invest abroad 10% to 20% of their assets, depending on the type of fund. This measure is seen as another step in the path towards an eventual convertible Brazilian currency. According to Central Bank data, the size of the local Brazilian mutual fund industry was approximately R$1,521.2 billion as of December 2010. For the CVM resolution to take effect, it will be necessary for the National Congress to change the current foreign exchange legislation. CVM is working with the Central Bank to implement the necessary regulatory changes.
Decree No. 6,345 dated January 4, 2008 (replaced by Decree No. 7,412 dated December 30, 2010), determined that for interbank foreign exchange operations among institutions of the national financial system, and between these institutions and foreign banks, the IOF will equal zero. Decree No. 6,391 dated March 12, 2008 (replaced by Decree No. 7,412 dated December 30, 2010) eliminated the IOF on exports and CMN Resolution No. 3,548 dated March 12, 2008 (replaced by Resolution No. 3,719 dated April 30, 2009) reduced the foreign exchange cover from 70% to 0% (exporters are no longer required to bring proceeds from exports to the country).
CMN Resolution No. 3,568 dated May 29, 2008, established the Brazilian exchange rate market, its operations, the agents authorized to operate in the market by the Central Bank and the preconditions to obtaining authorization to operate in the market. The Resolution also sets forth that the exchange rate transactions may have a maximum period for liquidation of 750 days, beginning on the date of transaction—this maximum period for liquidation has been changed to 1,500 days by CMN Resolution No. 3,911 dated October 05, 2010.
The external sector adjustment accounted for since 2003 and the consequent inflow of foreign currency both contributed to the flexibility of foreign exchange market norms, causing a reduction in export company costs and efficiency gains for the Republic as a whole. Provisional Measure No. 315 dated August 3, 2006 (subsequently enacted into Law No. 11,371 issued on November 28, 2006) addresses juridical safety and the simplification of foreign exchange market procedures. The most important modifications implemented by Law No. 11,371 were: (i) permitting exchange rate exposure on export operations, and allowing foreign currency to be deposited in financial institutions overseas, observing the limits imposed by the CMN (previously, such exporters were required to repatriate 100% of their export earnings); (ii) holding the Central Bank responsible for maintaining the registrations of foreign exchange market operations and supplying the Federal Revenue Secretariat (Secretaria da Receita Federal, or “SRF”) with information concerning export proceeds (pursuant to Joint Administrative Act SRF/BACEN No. 1,064 dated October 26, 2006); (iii) permitting the use of foreign exchange contracts (as regulated by the Central Bank) in operations up to $3,000 (or the equivalent amount in other currencies); (iv) as of June 30, 2007, updating the registry in the Central Bank of external capital accounted for in resident companies as of December 31, 2005 that are not yet registered and not subject to other forms of registry in the Central Bank (such change is regulated by Central Bank Circular No. 3,344 dated March 7, 2007); (v) abolishing fines on Brazilian import operations for payment delays or for not forming an agreement for the relevant foreign exchange operation; and (vi) allowing the use of reais in duty free stores authorized to operate in international ports and airports.
D-46
According to Law No. 11,803 dated November 5, 2008, the Central Bank is authorized to maintain accounts of deposit in reais for foreign central banks and institutions or residents with offices abroad that provide clearing, settlement and custody in the international market. Article No. 8 establishes that the banks allowed to operate a foreign exchange market in the country could comply with the orders of payment in reais received abroad, through the use of resources in real kept in the deposit accounts for banks headquartered or located abroad. CMN approved Circular No. 3,430, on January 16, 2009, regulating international payment orders in reais. Central Bank Circular No. 3,401 dated August 15, 2008, altered the Regulation of the Exchange Market and International Capital. The changes aimed to reduce the transaction costs, simplify and remove the bureaucracy from the rules of the exchange market. The main alterations were: (i) removal of the limit on positions bought in exchange by the non-bank financial institutions—the maximum limit of positions bought was of $500 thousand (the non-bank financial institutions are still prevented from having positions sold in exchange); (ii) removal of the restriction to use a credit card issued abroad for payment of services provided by individuals or legal entities outside the Brazilian territory; (iii) elimination of the obligation to inform the Central Bank at least 30 days in advance of the early payment of commitments of a financial nature abroad registered in this exchange; (iv) increase from 720 to 750 days the maximum term for the liquidation of the interbank, arbitrage and term operations; and (v) permission to use the simplified foreign exchange payment slip for all spot exchange operations.
Law No. 11,882 dated December 23, 2008 established criteria and conditions for loans in foreign currency for Brazilian enterprises and allowed banks with liabilities in foreign currency to obtain resources from financial institutions that do not participate in 10% or more of the capital of other institutions.
CMN approved Resolution No. 3,844 dated March 23, 2010, consolidating the general provisions relating to foreign capital. Resolution No. 3,844 deals exclusively with the record of direct investment flows, foreign credits, royalties, technology transfers and foreign leases. Circular No. 3,491 dated March 24, 2010 regulated this matter, addressing operational aspects and simplifying the registration of operations. Circular No. 3,493 dated March 24, 2010 updated the Regulation of Foreign Exchange Market and International Capital (Mercado de Câmbio e Capitais Internacionais, or “RMCCI”), continuing the improvement of the Brazilian exchange market that has been conducted by the Central Bank in recent years.
Brazilian law provides that whenever there is a serious imbalance in Brazil’s balance of payments or serious reasons to foresee such an imbalance, the Federal Government may, for a limited period of time, impose restrictions on the remittance to foreign investors of the proceeds of their investments in Brazil, as it did for approximately six months in 1989 and early 1990, and on the conversion of Brazilian currency into foreign currencies. See “Public Debt—Debt Restructuring and Debt Record”.
D-47
THE FINANCIAL SYSTEM
General
The Brazilian financial system is composed of several types of public and private sector financial institutions. On December 31, 2010, it included 137 multi-service banks, 19 commercial banks, 15 investment banks, and numerous savings and loan, brokerage, leasing and financial institutions. The average leverage level in 2010 for the Brazilian banking system as a whole was approximately 2.5 times shareholders’ equity, and Brazilian private sector financial institutions were generally well capitalized.
Public sector banking institutions play an important role in the banking industry. Public sector banks accounted for 48.2% of the banking system’s total demand deposits and 28.1% of total assets in December 2010. A significant portion of the activities of federal and State banks involves the lending of Federal Government funds to industry and agriculture. See “—Public Sector Financial Institutions”.
The critical importance of financial management skills under conditions of high inflation, and the availability of profits from financial intermediation activities, led to the proliferation of financial institutions during the 1980s and early 1990s. The subsequent reduction of Brazil’s inflation rate brought about by the Plano Real curtailed the profits Brazilian banks had previously earned from investing deposits at inflated interest rates and made it more difficult for certain financial institutions to survive. From the implementation of the Plano Real through December 31, 2010, 162 financial institutions were the subject of Central Bank intervention. To assist distressed banks and strengthen the financial system, the Federal Government instituted on November 3, 1995 the Program of Incentives for Restructuring and Strengthening of the National Financial System (Programa de Estímulo à Reestruturação e ao Fortalecimento do Sistema Financeiro Nacional, or “PROER”). Among other measures, PROER created special lines of credit for financial institutions and provided incentives for institutions to merge and reorganize by permitting the amortization of goodwill and the write-off of non-performing loans. From the introduction of PROER in November 1995 to December 31, 2001, the Central Bank made gross disbursements of approximately R$21.1 billion, primarily for the restructuring of Banco Nacional S.A., Banco Econômico S.A. and Banco Bamerindus S.A. The Federal Government has not provided any financing under PROER since September 1998 and has since terminated the PROER program.
On February 28, 1997, the CMN adopted Resolution No. 2,365, establishing the Support Program for the Reduction of the State Public Sector in Banking Activity (Programa de Incentivo à Redução do Setor Público Estadual na Atividade Bancária, or “PROES”). PROES provides for three special lines of financial assistance. The first line releases resources backed by collateral consisting of securities or rights related to operations under the administration of the National Treasury or of agencies of the Federal Government. The second line allows State financial institutions to restructure their portfolio of assets and/or their respective liabilities. The third line involves the assumption by federal financial institutions of State financial institutions’ liabilities to the public. As of December 31, 2010, 45 State financial institutions had sought PROES assistance, and a majority elected to be privatized or converted into development agencies; 16 financial institutions chose to obtain PROES assistance under the second line. In December 1998, an institution controlled by the State of Rio Grande do Sul commenced operations as the first such converted development agency.
In addition to establishing PROER and PROES, the Federal Government instituted a deposit insurance system on November 16, 1995 and issued Provisional Measure No. 1,514 in August 1996 establishing a program to restructure Brazil’s State banks. See “The Brazilian Economy—Relationship between the Federal and Local Governments” and “—Regulation by Central Bank”. The Federal Government also enacted Law No. 9,447 dated March 14, 1997, relating to the liability of controlling shareholders, accounting firms and independent auditors for the intervention, extrajudicial liquidation or establishment of a provisional administrative regime for financial institutions. Under Law No. 9,447, controlling shareholders may be held jointly liable for wrongful acts involving the financial institutions they control, independent of claims based on negligence or fraud. Independent auditors can also be held liable for their fraudulent actions or omissions while rendering services to financial institutions, and the assets of such auditors may be subject to attachment if liability is found. On March 27, 2003, the CMN issued Resolution No. 3,069, which provides for the mandatory periodic replacement of independent auditors of financial institutions. This resolution was replaced by Resolution No. 3,198 dated May 27, 2004, amending and consolidating the rules governing the provision of independent audit services to financial institutions, clearing houses and other institutions that are authorized to operate by the Central Bank.
D-48
Institutional Framework
The basic framework for the Brazilian financial system was established in 1964 pursuant to Law No. 4,595 (the Banking Reform Law), which created the CMN, the senior institution responsible for currency and credit policies. The CMN is currently composed of three members: the Minister of Finance, the Minister of Planning and Budget and the President of the Central Bank.
The CMN is the deliberative body of the National Financial System. The CMN is responsible for, among other things, (i) establishing general guidelines for the implementation of monetary, exchange and credit policies; (ii) regulating the conditions of operation, supervision and constitution of financial institutions; and (iii) regulating the instruments used to implement monetary and exchange rate policies.
The Central Bank is administered by a board of directors. Each director is appointed by the President of the Republic, subject to confirmation by the Senate. The main role of the Central Bank is to implement the currency and credit policies established by the CMN. On May 29, 2003, the National Congress adopted Constitutional Amendment No. 40 that, among other things, permits regulatory changes in the Brazilian financial system to be made through multiple legislative initiatives rather than a single comprehensive measure. The amendment makes possible the granting of operational autonomy to the Central Bank by means of the passage of complementary legislation adopted by an absolute majority of the members in each house of the National Congress.
The CVM is responsible for regulating the country’s stock exchanges, protecting investors and shareholders against fraud or manipulation with respect to securities traded on such exchanges and promulgating accounting and reporting rules to ensure the availability to the public of information on securities and their issuers.
Monetary Policy and Money Supply
On July 1, 1999, Brazil formally adopted inflation targeting as its monetary policy framework. Decree No. 3,088 dated June 21, 1999, provides, among other things, that: (i) inflation targets are to be established on the basis of variations of a widely known price index; (ii) the inflation targets, as well as the tolerance intervals, were to be set by the CMN based on proposals by the Finance Minister; (iii) inflation targets are to be set no later than June 30 of the second year prior to the year for which the target is being set; (iv) the Central Bank is responsible for implementing the policies necessary to achieve the targets; (v) the price index adopted for the purposes of the inflation targeting framework is to be chosen by the CMN based on a proposal by the Finance Minister; (vi) the targets will be considered to have been met whenever the observed accumulated inflation during each calendar year (measured on the basis of variations in the price index adopted for these purposes) falls within specified tolerance levels; (vii) if any target is not met, the Central Bank’s Governor must issue an open letter addressed to the Finance Minister explaining why the target was not met, the measures to be adopted to ensure that inflation returns to the tolerance levels and the period of time that will be needed for these measures to have an effect; and (viii) the Central Bank is to issue a quarterly inflation report that will provide information on the performance of the inflation targeting framework, the results of the monetary policy actions, and the perspectives regarding inflation.
On June 30, 1999, the CMN issued Resolution No. 2,615, which specified that the IPCA reported by the IBGE would be used for the purpose of gauging inflation targets. Resolution No. 2,615 also established tolerance levels at plus or minus 2 percentage points for each year. Since 2006, CMN has established an inflation target of 4.5%, with a tolerance level of plus or minus 2.0 percentage points and this target has also been established for 2011 and 2012.
The Central Bank uses monetary policy instruments, principally the Over/Selic rate (a market-determined overnight rate for operations with federal bonds that determines the interest rate on debt issued by the Central Bank and the Federal Government in a manner similar to the U.S. federal funds rate), to achieve the inflation targets. The performance of monetary policy under the inflation targeting framework is measured by IPCA, which rose 3.1% in 2006, 4.5% in 2007, 5.9% in 2008, 4.3% in 2009 and 5.9% in 2010. During the 12 months ended March 2011, the inflation rate, as measured by IPCA, rose to 6.3%.
Between February 19, 2003 and April 14, 2004, the Central Bank reduced its Over/Selic rate target from 26.5% to 16%. In an effort to manage inflationary expectations, the Central Bank increased its Over/Selic rate target to 19.75% between September 15, 2004 and May 18, 2005. The Central Bank reduced its Over/Selic target to 11.25% between September 14, 2005 and September 5, 2007. On April 16, 2008, June 4, 2008, July 23, 2008 and September 10, 2008, the Central Bank increased its Over/Selic target to 11.75%, 12.25%, 13.00% and 13.75% respectively. Due to several economic factors influencing the Brazilian economy, the Central Bank of Brazil started an expansionary monetary policy to counteract the effects of the 2008 international financial crisis. This monetary policy, which began in January 2009, reduced the Over/Selic
D-49
rate target to 12.75% on January 21, 2009, then to 11.25% on March 11, 2009 followed by another reduction on April 29, 2009 to 10.25%. On June 10, 2009, it reduced the Over/Selic rate target to 9.25%; the last reduction was on July 22, 2009, when the Over/Selic rate was reduced to 8.75%. However, the Over/Selic was increased to 9.50% on April 28, 2010, to 10.25% on June 9, 2010, to 10.75% on July 21, 2010, to 11.25% on January 19, 2011, to 11.75% on March 2, 2011 and to 12.50% on July 20, 2011. On August 31, 2011, the Central Bank decided to decrease the Over/Selic rate to 12.00%.
The Central Bank periodically intervenes in the overnight funds market to maintain liquidity in that market and keep the Over/Selic rate close to its target rate. To control the level of liquidity in the economy, among other instruments, the Central Bank also sells securities with repurchase agreements or purchases securities with resale agreements for a future date (Circular No. 3,107 dated April 10, 2002). Such open market operations are known as “operações compromissadas,” which are indexed to the Selic rate and totaled R$288.7 billion (or 7.9% of GDP) through December 31, 2010. As the real depreciated against the U.S. dollar during the second half of 2008, the Central Bank intervened in the foreign exchange markets to provide liquidity to the market. The intervention took three forms: (i) direct intervention in the spot market; (ii) the provision of short-term U.S. dollar credit lines to banks, which had no accounting impact on Brazil’s international reserves; and (iii) the provision of credit lines to exporters to compensate for a reduction of credit lines provided by foreign banks.
Since 1999, the Central Bank has continuously attempted to reduce interest rates charged by financial institutions for domestic loans. The spread over the Over/Selic rate was 43.2% in December 1999 and decreased to 27.9% in December 2010. In August 2011, the spread over the Over/Selic rate was 32.8%. The Federal Government has also implemented several measures to reduce spreads on domestic bank loans and to increase the demand for credit. Such measures can be broadly grouped into three categories: (i) measures to strengthen guarantees and the enforcement of contracts; (ii) measures to increase competition among lenders; and (iii) measures to ease the tax burden and the effects of banking regulations. Specific measures include the approval of amendments to the bankruptcy law and civil code, the dissemination of detailed information on market interest rates on the Central Bank’s website; the reduction of the IOF rate for loans and other advances of credit to individuals, and modifications to the rules relating to the classification of loans and related provisions.
On September 5, 2006, the Federal Government implemented the following set of measures to increase competition among banks in respect of individual accounts: (i) creation of the salary account, which will allow an individual to transfer salary proceeds between banks without paying tariffs and taxes (IOF, CPMF); (ii) credit portability: the possibility to transfer open bank loans to another financial institution that offers lower interest rates, without paying IOF and CPMF; (iii) register portability: financial institutions, if authorized, will supply directly to third parties information regarding the registration of and historical information about the customer’s relationship; (iv) positive register (Cadastro Positivo): a list available to financial institutions of debtors that have honored their payments in the past and that, in theory, offer a lower credit risk and are eligible for lower interest rates on loans; (v) Central Bank measures to progressively register credit operations of lower value (from R$5,000 to R$1,000 at the end of 2007) to provide financial institutions with a greater amount of credit information, thus reducing the costs of risk evaluation; and (iv) CMN reductions in the rate of the deposit insurance system (Fundo Garantidor de Crédito, or “FGC”), a measure with a direct impact on bank credit costs, from 0.025% to 0.0125%. The regulation of the positive register (Cadastro Positivo), a database containing those that pay their bills, was established with the issue of Provisional Measure No. 518 dated December 30, 2010 (subsequently enacted as Law No. 12,414 dated June 9, 2011).
Provisional Measure No. 472 dated December 15, 2009 (subsequently enacted as Law No. 12,249 dated June 11, 2010), permitted the issuance of Financial Bills (Letras Financeiras) by financial institutions. According to Resolution No. 3,836 dated February 25, 2010, the Financial Bills cannot be issued with a face value of under R$300,000. The Federal Government’s intention is to provide financial institutions with a better instrument for raising medium and long term funds.
Time Deposits. Since March 1, 2002, Circular No. 3,091 (which has replaced Circular No. 3,062) has required each financial institution to maintain on deposit with the Central Bank federal bonds having an aggregate principal amount equal to at least 20% of the average daily balance (modified by Central Bank Circular No. 3,513 dated December 3, 2010) in excess of R$30 million for the preceding week of that institution’s time deposits, exchange rate acceptance funds, debenture-backed securities, securities that it has issued and debt assumption agreements linked to operations outside Brazil. According to Circular No. 3,485 dated February 24, 2010, financial institutions with a reserve requirement for time deposits calculated to be R$500,000 or less are exempt from the reserve requirement obligation.
Formerly, the Brazilian monetary authorities relied on short-term National Treasury Bonds (Bônus do Tesouro Nacional) as the principal instrument for indexation. As that instrument was phased out, the Referencial Rate (Taxa Referêncial de Juros, or “TR”) was created for purposes of indicating the prevailing interest rate. The TR is calculated by the
D-50
authorities periodically, based on the average daily rate for bank certificates of deposit. Based on current rates rather than historical rates, the TR was intended to reduce the influence of past inflation and more accurately reflect future inflation than predecessor indices. In January 1994 and October 1997, the Federal Government revised the methodology for the calculation of the TR in order to increase the incentive to deposit money in savings accounts. The TR is currently derived from the Basic Financial Rate (Taxa Básica Financeira, or “TBF”), which is calculated by the Central Bank from the weighted average of the rates offered by financial institutions on their certificates of deposit. The TBF so calculated is adjusted by a reduction factor in determining the TR. The reduction factor may occasionally be modified as a consequence of the changes in the real interest rate and the tax rate on the gross earnings of the certificates of deposit.
Reserve Requirements. All depositary institutions, commercial banks, multi-service banks, investment banks, development banks, savings and loans and financial institutions are required to satisfy reserve requirements set by the Central Bank. These reserve requirements are applied to a wide range of banking activities and transactions, such as demand deposits, savings deposits, time deposits, debt assumption transactions, automatic reinvestment deposits, funding transactions, repurchase agreements and export notes. Circular No. 3,274 dated February 10, 200, and No. 3,497 dated June 24, 2010, provide that banks are generally required to deposit 43% of the average daily balance of demand deposits in excess of R$44 million in a non-interest-bearing account at the Central Bank. However, as of July 2012 banks will be required to deposit 44% of the average daily balance of demand deposits and 45% as of July 2014. Financial institutions with a reserve requirement for cash deposits that are calculated to be R$10,000 or less are exempt from the reserve requirement obligation.
The following table sets forth selected information regarding percentage changes in the monetary base and money supply for the periods indicated.
Table No. 20
Percentage Increases in Monetary Base and Money Supply
| | | | | | | | | | | | | | | | | | | | |
| | | Year Ended December 31, | |
| | | 2006 | | | 2007 | | | 2008 | | | 2009 | | | 2010 | |
Monetary Base(1) | | | 19.6 | | | | 21.1 | | | | 0.6 | | | | 12.6 | | | | 24.6 | |
M1(2) | | | 20.4 | | | | 32.7 | | | | (3.5 | ) | | | 12.0 | | | | 12.0 | |
M2(3) | | | 13.6 | | | | 18.1 | | | | 37.3 | | | | 8.8 | | | | 14.7 | |
| (1) | Monetary base represents Central Bank liabilities, including currency and deposits held by commercial banks. |
| (2) | M1 is currency plus demand deposits. |
| (3) | M2 is M1 plus savings accounts and private securities, bank certificates of deposit (Certificados de Depósitos Bancários), mortgage bills (letras hipotecárias), real estate bills (letras imobiliárias), bills of exchange (letras de câmbio), and foreign exchange and acceptances (recursos e aceites cambiais). |
Source: Central Bank.
Limitation of Public Sector Debt
Since May 1990, CMN has taken various measures to limit expansion of credit in the public sector. In July 1993, the CMN mandated the creation by the Central Bank of a Public Sector Operations Registration System designed to improve credit controls. The CMN has also limited the ability of public sector financial entities to issue additional public indebtedness.
On June 29, 1998, CMN issued Resolution No. 2,515, which establishes certain conditions that must be observed with respect to the external credit operations of States, the Federal District, municipalities, and their respective agencies, foundations and companies. Resolution No. 2,515 requires, among other things, that (i) the proceeds of such external credit operations must be used to refinance outstanding domestic financial obligations of the issuer, with preference given to those domestic obligations having a higher cost or shorter term than the external debt and, pending such application, remain on deposit in an escrow account in a form specified by the Central Bank; (ii) the total amount of the contractual obligation are required to be subject to monthly deposits in an escrow account in a form specified by the Central Bank, with each monthly deposit to be equal to the total debt service obligation (including principal and interest), divided by the number of months that the obligation is to be outstanding; (iii) the foreign creditor (or underwriter, in case of securities issue) must be a financial
D-51
institution that traditionally maintains a relationship with Brazil or that has a risk rating equal or higher than “BBB”, according to the international rating agencies; and (iv) the contracts relating to such operations are required to contain a clause expressly providing that the borrower’s obligations are not guaranteed by the Federal Government and that the creditors acknowledge that they will not be entitled to receive any funds from the Federal Government for such operations.
Resolution 3,756 dated July 1, 2009 changed Art. 3 of Resolution No. 2,515 to reflect that before a state bank can raise funds abroad, it must first have a rating equivalent to investment grade or a rating at least similar to the Republic given by one or more well known international rating agencies.
The Fiscal Responsibility Law severely restricts personnel expenditures and extensions of credit at all levels of government in Brazil and provides for ceilings for public sector debt. See “Public Finance—Fiscal Responsibility Law and Fiscal Crime Law”.
Public Sector Financial Institutions
Brazil’s principal public sector financial institutions are Banco do Brasil, BNDES and CEF, all federal institutions, together with a number of state institutions.
Banco do Brasil. Banco do Brasil, the main lender to the rural sector, is one of Brazil’s largest multi-service banks. It is organized as a mixed-capital company, with the Federal Government holding a majority of its voting shares, and is subject to legislation applicable to private sector entities, including all labor and tax legislation. Banco do Brasil functions as a private multiple service bank, although it does engage in some lending programs that implement certain policies established by the CMN. In March 1996, Banco do Brasil announced a significant restructuring of the bank following a 1995 loss in excess of R$4 billion and a 1996 first half loss of R$7.8 billion. On January 9, 2009, Banco do Brasil purchased 49.9% of the total capital of Banco Votorantim; on April 18, 2009 and on April 21, 2010 it purchased Banco Patagonia S.A., a mid-sized Argentine bank. On December 31, 2010, Banco do Brasil had assets of R$779.3 billion and shareholders’ equity of R$50.5 billion.
BNDES. BNDES, the Federal Government-controlled development bank, is primarily engaged in the provision of medium- and long-term financing to the Brazilian private sector, particularly to industry, either directly or indirectly through other public and private sector financial institutions. BNDES was also responsible for administering the Federal Government’s privatization program. On December 31, 2010, BNDES and entities under its control had assets of approximately R$549.0 billion and shareholders’ equity of approximately R$65.9 billion.
As part of the measures taken to combat the impact of the financial crisis, the Federal Government decided to grant a R$100.0 billion loan to BNDES in January 2009 through transfers of National Treasury bonds. The objective of the operation was to reinforce the flow of business credits, making projects feasible and ensuring continued investment in the Republic. The loan, authorized by Law No. 11,948/09, was based on transfers of National Treasury bonds in six installments over the course of 2009 and such securities were issued with maturity dates ranging from the years 2009 to 2045, with periodic amortizations and interest rates defined in each contract. The first operation took place in March 2009, with an issuance of securities worth R$13.0 billion. The next issuance occurred in June 2009 in the amount of R$26.0 billion, and the third in July 2009 in the amount of R$25.0 billion. The remaining operations occurred in August 2009 in the amount of R$36.0 billion. In light of the adverse economic effects caused by the international financial crisis, the Federal Government had managed to mitigate financial fragilities by increasing BNDES resources. Provisional Measure No. 472, dated December 15, 2009, increased the BNDES credit limit to R$180.0 billion. The last issuance of securities from the National Treasury to BNDES in the amount of R$80.0 billion occurred on May 4, 2010.
The National Treasury lent R$30 billion to BNDES in June 2011 and may lend an additional R$25 billion to BNDES prior to the end of 2011 to ensure that companies have access to funding for long-term investment. BNDES received R$80 billion from the National Treasury in 2010 and R$100 billion in 2009 (these transfers to BNDES did not have a significant impact on Brazil’s public debt statistics).
The “TJLP” or long-term interest rate is used on BNDES’s businesses. The CMN reviews the TJLP rate every three months. On March 30, 2011, the CMN established that the Brazilian TJLP will remain at 6% per year from April 1 to June 30, 2011, the same rate first set in third quarter of 2009.
D-52
CEF. CEF, a savings bank controlled by the Federal Government, is the principal agent of the Housing Finance System. CEF is involved principally in deposit-taking and the provision of financing for housing and related infrastructure. Its assets on December 31, 2010 were approximately R$401.4 billion, and its shareholders’ equity stood at approximately R$15.4 billion.
Between June 2001 and December 2001, the Federal Government capitalized four federal banks (Banco do Brasil, Banco da Amazônia, Banco do Nordeste do Brasil and CEF), principally through the acquisition of certain impaired assets in exchange for public debt securities. The capitalization transactions increased Brazil’s net public sector debt by R$12.6 billion.
Other Financial Institutions. Other federal financial institutions include Banco da Amazônia and Banco do Nordeste do Brasil. From 1997 to 2005 several State banks were sold to private banks, including Banco do Estado do Rio de Janeiro S.A. (BANERJ), which was purchased by Banco Itaú S.A. on June 26, 1997 for R$331.0 million, and BEC, which was sold to Banco Bradesco S.A. in December 2005 for R$700 million. Banco do Estado de Santa Catarina (“BESC”) and Banco do Estado do Paiuí (“BEP”) were withdrawn from the privatization program through Decree No. 6,380, dated February 20, 2008, and Decree No. 6,502, dated July 3, 2008, respectively, and were acquired by Banco do Brasil on October 1 and November 3, 2008, respectively. Banco do Brasil also bought Nossa Caixa on November 20, 2008. See “—General” and “The Brazilian Economy—Relationship between the Federal and Local Governments”.
Private Sector Financial Institutions
Effective since September 21, 1988, Brazil permitted the establishment of multi-service banks which are licensed to provide a full range of commercial banking, investment banking (including securities underwriting and trading), consumer financing and other services, including fund management and real estate finance. As of December 31, 2010, there were 130 private multi-service banks operating in Brazil.
Private sector financial institutions include commercial banks, investment banks, multi-service banks and other financial institutions. Brazil’s 18 private sector commercial banks and 98 private multi-service banks with commercial portfolios are engaged in wholesale and retail banking. They are particularly active in taking demand deposits and lending for short-term working capital purposes. Brazil’s 15 investment banks are engaged primarily in collecting time deposits, specialized lending and underwriting securities. As of December 31, 2010, the consolidated shareholders’ equity of the private sector banking institutions in Brazil was R$460.0 billion.
Regulation by Central Bank
The Central Bank is authorized to implement the currency and credit policies prescribed by the CMN and to supervise all financial institutions. Any amendment to a financial institution’s by-laws, increase in its capital or establishment or transfer of its principal place of business or any branch (whether in Brazil or abroad) must be approved by the Central Bank, which is also responsible for determining the minimum capital requirements for financial institutions. The Central Bank is responsible for ensuring that the accounting and statistical requirements established by the CMN are observed. Financial institutions must submit semiannual financial statements reviewed by each institution’s independent auditors and a formal audit opinion, as well as monthly unaudited financial statements prepared in accordance with the standard accounting rules promulgated by the Central Bank. As part of the Central Bank’s supervision of their activities, financial institutions are required to make full disclosure of credit transactions, foreign exchange transactions, the use of proceeds raised from export and import transactions, and any other related economic activity. Such data is usually supplied to the Central Bank on a daily basis through computer systems, reports and statements. The Central Bank also supervises the operations of consumer credit companies, securities dealers, stock brokerage companies, leasing companies, savings and loan associations and real-estate credit companies. See “—General” and “The Brazilian Economy—Relationship between the Federal and Local Governments”.
Central Bank regulations impose capital adequacy, liquidity, savings deposit insurance, and loan loss reserve requirements on regulated financial institutions.
Capital Adequacy, Liquidity and Concentration Limits. Since January 1, 1995, Brazilian financial institutions have been required to comply with the Basel Accord on risk-based capital adequacy, modified as described below by Resolution No. 2,099 dated August 17, 1994.
In general, the Basel Accord requires banks to maintain a ratio of capital to assets and certain off-balance sheet items, determined on a risk-weighted basis, of at least 11% for risk-weighted assets and 20% for swap transactions. Tier 1, or core, capital includes equity capital (i.e., common shares and non-cumulative permanent preferred shares), share premium, retained earnings and certain disclosed reserves less goodwill. Tier 2, or supplementary, capital includes “hidden” reserves, asset
D-53
revaluation reserves, general loan loss reserves, subordinated debt and other quasi-equity capital instruments (such as cumulative preferred shares, long-term preferred shares and mandatory convertible debt instruments). Tier 2 capital is limited to the total of a bank’s Tier 1 capital. There are also limitations on the maximum amount of certain Tier 2 capital items. To assess the capital adequacy of banks under the risk-based capital adequacy guidelines, a bank’s capital is evaluated on the basis of the aggregate amount of its assets, liabilities and off-balance sheet exposure. The risk-based capital adequacy guidelines also establish credit conversion formulae for determining the credit risk of off-balance sheet items, such as financial guarantees, letters of credit and foreign currency and interest rate contracts. Under Brazilian modifications to the Basel requirements (a) only Tier 1 capital (as modified with respect to revaluation reserves) may be counted towards the 11% minimum capital requirement, and (b) the risk weights assigned to certain assets and credit conversion amounts differ to a minor extent.
Circular No. 3,086 dated February 15, 2002 applies to investment funds and regulates the accounting for securities held in a fund’s portfolio. It also requires that the securities must be classified as securities for trading or securities to be held to maturity. Securities for trading are required to be marked to market daily. To qualify as securities to be held to maturity, (a) the fund must have the financial capacity to hold such securities until maturity and (b) the fund must have a single investor (which, if that investor is another fund, must be a fund that itself has a single investor) that has the financial capacity to hold such securities to maturity. Circular No. 3,096 dated March, 6, 2002 requires that funds in which the single investor is an institution under Central Bank supervision or a pension fund, must comply with Circular No. 3,068, Circular No. 3,082 and Resolution No. 4 dated January 30, 2002, issued by Pension Management Council (Conselho de Gestão da Previdência Complementar). Normative Instruction No. 365 dated May 29, 2002, issued by the CVM, imposes additional requirements: (a) fund holders must have the intent to keep the investment volume compatible with the maintenance of such assets in the fund’s portfolio until maturity; (b) the fund must be held by a single investor, investors belonging to the same conglomerate or financial group, or qualified investors (as defined by CVM rules concerning securities portfolio investment funds); and (c) all fund holders must be in favor of the fund’s qualification for classification as securities to be held to maturity. Normative Instruction No. 375 dated August 14, 2002 provides that securities held by funds which do not qualify under the requirements of Normative Instruction No. 365 may nonetheless qualify as securities to be held to maturity as long as the fund has the requisite financial capacity and satisfies the following conditions: securities held by the fund have (a) a maturity limited to 365 days and (b) a fixed rate of return determined at maturity and based on the Over/Selic rate or the interbank deposit rate.
In June 2004, the Central Bank governors and heads of bank supervisory authorities in the Group of Ten (G-10) countries endorsed a new capital adequacy framework known as Basel II. Basel II builds on the structure of the 1988 Basel requirements by aligning the minimum capital requirements more closely to the bank’s actual risk of economic loss. Basel II, among other things, requires higher levels of capital for borrowers that are thought to present higher levels of risk and establishes a new capital charge for exposures to risk of losses caused by operational failures or external events, including natural disasters. The Central Bank establishes guidelines for the implementation of the Basel II through Communication No. 12,746 of December 9, 2004, which requires, among other things, that the Central Bank not rely on ratings published by external rating agencies and will seek instead to refine existing standards for measuring capital adequacy. Communication No. 16,137 dated September 27, 2007, establishes a timetable for the implementation of Basel II through 2012.
On February 17, 2011, the Central Bank issued Communication No. 20,615 with preliminary guidelines and timetable for the implementation in Brazil of the most recent recommendations of the Basel Committee on Banking Supervision. Known as Basel III, these recommendations aim to improve prudential regulations on capital and liquidity of financial institutions, as pledged by member countries of the G-20 in November 2010. The detailed recommendations of Basel III will be subject to specific regulations, expected to begin in 2011, providing new definitions of capital, and ending in 2017, providing the final definitions of leverage.
The Central Bank originally prohibited Brazilian multi-service banks from holding, on a consolidated basis, permanent assets in excess of 90% of their adjusted stockholders’ equity. The 90% threshold was gradually reduced and fell to 50% in 2002 in accordance with Resolution No. 2,669 dated November 25, 1999. Permanent assets include investments in subsidiaries as well as premises, equipment and intangible assets.
Financial institutions are also prohibited under Resolution No. 2,844 dated June 29, 2001 from extending credit to a single borrower that, in the aggregate, exceeds 25% of that institution’s shareholders’ equity. Extensions of credit include, among other things, loans, advances, leasing operations and guarantees. This Resolution also limits the aggregate amount of “concentrated exposure”, defined as extensions of credit to any customer that, in the aggregate, represent 10% or more of an
D-54
institution’s shareholders’ equity; and prohibits an institution’s aggregate concentrated exposure from exceeding 600% of its shareholders’ equity.
CMN Resolution No. 2,836 dated May 30, 2001 provides for the assignment of loans and certain other extensions of credit, with or without recourse, except for assignments by entities that are not part of the National Financial System, for which assignments with recourse are not permitted. It also eliminated the need to obtain specific authorization from the Central Bank for transfers to nonfinancial institutions, except for transfers to related entities that are part of the same financial group.
According to Resolution No. 3,490 dated August 29, 2007, financial institutions and other institutions authorized to operate by the Central Bank must maintain, permanently, an amount of Reference Net Worth (Patrimônio de Referencia, or “PR”) compatible with the risks of their activities. The value of PR must be above the Required Reference Net Worth (“PRE”). The calculation of the PRE should include the exposure of branches abroad. Financial institutions should also maintain sufficient PR to deal with the interest rate risk of operations not included in the trading book. Circular No. 3,389 dated June 25, 2008, established new procedures for calculating the quota of the Required Reference Net Worth regarding the risk of exposures to gold, foreign currency, and in assets and liabilities that are subject to exchange rate changes.
Resolution No 3,658 dated December 17, 2008, modified and consolidated the legislation relating to the provision of information on credit operations to the Central Bank. The procedure that came into force on March 1, 2009, extended the data set and the required institutions that have to provide the information to the Central Bank for inclusion in the Credit Information System (SCR). The inclusion of explanatory notes with qualitative and quantitative information on all financial instruments, as well as a table prepared with a demonstration of sensitivity analysis for each type of market risk became mandatory in the balance sheet of the publicly-traded companies, with Instruction No. 475 of the CVM, published on December 17, 2008. The sensitivity analysis should show three possible stress scenarios: one where the selected risk variable is considered likely; another projecting a variation of at least 25% and another of at least 50%.
Derivatives and Investment Securities. The Central Bank has issued two regulations—Circular No. 3,082 dated January 30, 2002 and Circular No. 3,068 dated November 8, 2001—to enhance the transparency of financial reporting by financial institutions. Circular No. 3,082 sets forth hedge accounting rules applicable to financial institutions. It requires, among other things, that all derivatives (including hedging transactions) must be marked to market at least monthly. In addition, derivative transactions that are used for hedging purposes are required to be classified according to the risk that is being hedged—market risk or cash flow—and must be with an unrelated third-party and not another company that is part of the consolidated group. Disclosure of, among other things, the strategy behind these derivative transactions and gains and losses arising from such transactions during the reporting period are also required in the notes to the financial statements. Circular No. 3,068 requires that securities held by financial institutions be classified as securities for sale, securities for trading or securities to be held to maturity. Securities for sale or trading are required to be marked to market. The classification also determines the accounting treatment for such securities, including the recognition of any gain or loss for revenue recognition purposes.
On February 8, 2002, the Central Bank issued Communication No. 9,253, which authorizes financial institutions to enter into swap operations, forward contracts and non-standardized options linked to federal public securities. Resolution No. 3,505 dated October 26, 2007 of the CMN authorizes financial institutions to enter into all kinds of options in the over-the-counter market (not only non-standardized options) as long as the derivative is registered in the over-the-counter market or in a system organized by authorized institutions.
Deposit Insurance. Since 1996, the Federal Government has in place a deposit insurance system in Brazil, by creating the FGC to protect certain creditors in cases of (1) intervention, nonjudicial liquidation or bankruptcy of an institution or (2) the Central Bank’s recognition of a state of insolvency at an institution that, according to current law, is not subject to one of the mechanisms listed in (1) above. The participants in the FGC are all financial institutions and savings and loan associations, with the exception of credit cooperatives and the credit sections of cooperatives. The participating institutions make a monthly contribution of 0.0125% of the total reported value of covered liabilities.
The following liabilities are covered by the guaranty provided by the FGC: demand deposits or those that may be withdrawn through prior notification; savings deposits; time deposits, in both book entry and certificated form; bills of exchange; real estate bonds; and mortgage bonds. The following liabilities are not covered by the guarantee: liabilities in the name of other institutions that are members of the National Financial System; deposits, loans or any other resources contracted or raised abroad; and credits in the name of certain persons affiliated with an institution, generally managers and other members of the consolidated group of which such institution is a member.
D-55
The FGC is a nonprofit, civil association governed by private law and headquartered in the municipality of São Paulo. The FGC is subject to the jurisdiction of the municipality of São Paulo and its duration is unlimited. The FGC guarantee covers up to R$70,000 per person of covered claims against a single institution or against all the institutions of a single financial conglomerate. On December 31, 2010, the net equity value of the FGC was R$23.7 billion. On November 2010, Banco Panamericano requested, for its capital restructuring, a contribution of $2.5 billion from FGC.
The CMN approved Resolution No 3.656 dated December 17, 2008, establishing a limit of 50% of shareholders equity of the FGC for the acquisition of credit rights of financial institutions and of leasing companies and for time deposits investments in leasing securities and bills of exchange of associates acceptance collateral on credit rights. The previous limit applies only to the acquisition of credit rights, established at 20% of the shareholders’ equity. The alteration allows the use of FGC for the expansion of the credit portfolios of small and medium-sized banks—those most affected by the international financial crisis.
On March 26, 2009, CMN Resolution No. 3,692 authorized the FGC to provide additional guarantees for investments in CBD’s (time deposits issued by banks) up to the maximum value of R$20 million per account. The investments will be known as “time deposits with special security of FGC” and should have a minimum period of 12 months and a maximum period of 60 months. Each institution may receive up to R$5 billion. The contribution for such guarantee will be 0.0833% monthly on the balance of deposits received under the new system, equivalent to 1% a year.
Loan Loss Reserves. CMN Resolution No. 2,682 dated December 21, 1999 and Resolution No. 2,697 dated February 24, 2000 introduced a nine-category classification system in March 2000 under which loans and other extensions of credit are assigned ratings ranging from AA to H according to perceived credit risk of the borrower or guarantor and the nature of credit. The ratings are assigned initially when the extension of credit is made and thereafter are reevaluated on a monthly basis; a rating assigned to any credit is subject to change if there are amounts payable in respect of that credit that are in arrears. Loan-loss provisions vary according to the rating assigned to a particular credit and range from 0% (in the case of any credit that is not in arrears) to 100% (in the case of any credit that is more than 180 days in arrears). As of December 2010, 92.7% of the outstanding loans and other extensions of credit of financial institutions operating in Brazil were classified as AA to C (less than 60 days in arrears).
Foreign Currency Loans. Financial institutions in Brazil are permitted to borrow foreign currency-denominated funds in the international markets (either through direct loans or through the issuance of debt securities). Pursuant to CMN Resolution No. 2,683 dated December 29, 1999, financial institutions have been authorized since January 3, 2000 to borrow foreign currency-denominated funds in the international markets for the purpose of investment in the domestic market, without regard to minimum periods of amortization and retention of the funds in Brazil. Fiscal procedures replaced the various rules that had limited the short-term capital flow because of the IOF. Resolution No. 2,770 dated August 30, 2000, consolidated the rules of foreign currency loans between Brazilian or foreign residents.
CMN adopted Resolution No. 3,833 dated January 28, 2010 requiring the registration of hedge transactions conducted with foreign financial institutions or on a foreign stock exchange.
Payment Settlement System. In April 2002, the Central Bank instituted changes to the settlement system for payments that were intended to minimize the systemic and credit risks that had been borne largely by the Central Bank. Under the revised payment system, payment orders in the Reserves Transfer System cannot be processed unless there is a sufficient balance in the paying institution’s reserve account. If the reserve balance is insufficient for the payment order to be processed, the order is queued until the reserve balance is sufficient to make the payment or is rejected. To avoid payment interruptions, the Central Bank introduced an intra-day credit line backed by Brazilian Treasury securities. There is no financial cost for this line, as long as repayment is made the same day; payments not made are treated as overnight loans for which a penalty rate is charged to the institution with the overdraft. This real-time gross settlement system is intended to prevent intra-day overdrafts from being created in the payment system.
Independent Accountants. Financial institutions are required to replace their independent accountants no later than every fourth fiscal year. A former independent accountant of a financial institution can be re-hired only after three complete fiscal years have elapsed from its prior engagement by such financial institution. Independent accountants are required to prepare the following reports: (i) a report on the examined audited financial statements with respect to compliance with accounting principles as well as the relevant rules issued by the CMN and the Central Bank; (ii) a report evaluating the quality and
D-56
adequacy of internal control procedures, including risk assessment criteria and data processing systems; and (iii) a report on the compliance with applicable operational laws and regulations.
Each independent accountant is required to communicate immediately to the Central Bank any event that may materially adversely affect the relevant financial institution’s status. Financial institutions are required to appoint an executive officer to a supervisory role in the area of accounting in order to ensure compliance with auditing and accounting rules and the rendering of accurate information.
Foreign Banks and Insurance Companies. Under current law, foreign banks duly authorized to operate in Brazil through a branch or a subsidiary are subject to the same rules, regulations and requirements applied to any other Brazilian financial institution. On December 31, 2010, there were 60 foreign-controlled or foreign-affiliated banks and 13 banks in which there was significant foreign participation operating in Brazil. Under the Constitution, the National Congress has the authority to regulate the establishment of new foreign financial institutions in Brazil. However, since the issuance of Ministry of Finance Consideration No. 311 in August 1995, the President has permitted foreign ownerships of banks in Brazil by decree, based on national interest.
In January 1997, the CMN initiated several measures aimed at liberalizing foreign investment in the financial sector and permitting foreign stock ownership and control of banks in Brazil. In 1998, foreign banks acquired control of 42 financial institutions in Brazil, including 15 banks. Between December 1996 and December 2010, foreign bank participation in the Brazilian financial system’s total assets increased to 14.1% from 9.8%, and foreign bank participation in the Brazilian financial system’s net worth increased to 14.2% from 10.3%.
Securities Markets
The CVM implements the policies of the CMN relating to the organization and operation of the securities industry. The CVM is responsible for regulating the country’s stock exchanges, protecting investors and shareholders against fraud or manipulation with respect to any securities traded on the stock exchanges and promulgating accounting and reporting rules to ensure the availability to the public of information on the securities being traded and the companies issuing them. The Central Bank has licensing authority over brokerage firms and dealers and controls foreign investment and foreign exchange transactions.
In 2008, the Brazilian Mercantile & Futures Exchange (Bolsa de Mercadorias & Futuros, or “BM&F”) and the São Paulo Stock Exchange (Bolsa de Valores de São Paulo, or “BOVESPA”) merged, creating the Securities, Commodities and Futures Exchange (“BM&FBOVESPA S.A.”). BM&FBOVESPA S.A. is one of the largest exchanges in the world in terms of market value, the second largest in the Americas, and a leading exchange in Latin America.
On December 31, 2010, there were 471 companies listed on BM&FBOVESPA S.A. and the aggregate market capitalization of all listed companies was approximately $1,542.1 billion. As of December��31, 2010, the aggregate trading volume on BM&FBOVESPA S.A. was approximately $911.0 billion, and three of the twenty companies with the largest capitalization listed on the stock exchanges in Brazil were controlled by the Federal Government. Trades in securities listed on the Brazilian stock exchanges may be effected off the exchanges in certain circumstances, although the volume of such trading is limited. The table below sets forth some indicators of market activity on BOVESPA in the five years ended December 31, 2010.
Table No. 21
Market Activity on BOVESPA
| | | | | | | | | | | | | | | | | | | | |
| | | 2006 | | | 2007 | | | 2008 | | | 2009 | | | 2010 | |
Number of Listed Companies(1) | | | 394 | | | | 448 | | | | 439 | | | | 434 | | | | 471 | |
Market Capitalization(2) | | | 722,610 | | | | 1,398,720 | | | | 588,470 | | | | 1,340,900 | | | | 1,542,080 | |
Market Volume(2) | | | 275,082 | | | | 615,566 | | | | 748,761 | | | | 652,399 | | | | 910,985 | |
| (1) | Under the CVM Instruction No. 480/09, since January 1, 2010, approximately 39 companies with authority to negotiate fixed-income securities started to be counted as stock exchange companies. |
D-57
| (2) | In millions of U.S. dollars. |
Source: BM&FBOVESPA.
In December 2000, BOVESPA announced the creation of the New Market (Novo Mercado), a special listing segment reserved for the securities of companies that voluntarily undertook to adopt certain corporate governance practices and provide disclosure beyond that required under Brazilian law then in effect. The listing rules (regulamento de listagem), among other things, (i) prohibit the issuance by the listed company of preferred (nonvoting) shares, (ii) require that shares representing not less than 25% of the capital of the listed company remain in circulation and be owned by persons other than the controlling shareholder of the listed company, (iii) require the listed company to offer shares to the public in ways that promote a broad dissemination of the shares, (iv) require the listed company to provide “tag-along” rights to minority shareholders that would permit them to sell their shares for the same terms and conditions as those for the sale by a shareholder of controlling interest of the listed company, (v) require the listed company to provide to holders annual financial statements that have been prepared in accordance with generally accepted accounting principles of the United States or International Accounting Standards Committee, (vi) provide for enhanced quarterly reporting, and (vii) require the listed company to permit its minority shareholders to appoint a majority of the members of the listed company’s audit committee. BOVESPA can sanction listed companies that violate the listing rules; the sanctions include the imposition of fines, the suspension of trading in the offending company and the exclusion of the offending company from the New Market. The listing rules also require that disputes between a listed company and its shareholders be settled by arbitration through BOVESPA’s Market Arbitration Chamber. The New Market is intended to foster the overall growth of the Brazilian stock market by offering better treatment to minority shareholders and reducing their concerns regarding the purchase of shares of publicly traded companies. The listed company benefits from improved access to the capital markets (and, thereby, lower financing costs), because the shareholder-friendly corporate governance provisions and enhanced disclosure requirements are likely to be attractive to potential investors. An additional incentive for companies to list their shares in the New Market is provided by BNDES’s Program for the Support of New Corporations, through which BNDES offers advantageous conditions for obtaining and repaying lines of credit to companies participating in the New Market.
BOVESPA also issued at the same time a regulation for special practices of corporate administration that divides companies into two levels. The regulation applies to companies that were not listed in the New Market but that had nevertheless agreed to adopt certain corporate governance practices that went beyond the requirements of the Brazilian corporate law then in effect. Level 1 companies under the regulation are those that agreed to improve the disclosure provided to investors and to take steps to maintain the liquidity of their securities. Level 2 companies are those that agreed to additional reforms, including arbitration as a means of settling disputes with investors. Level 1 and Level 2 companies are also eligible for financing at advantageous terms through BNDES’s Program for the Support of New Corporations. In order to continue the process of integration, the BM&FBOVESPA created a new model for access to their markets, which enables the former participants and those that want to join the segments of BOVESPA and BM&F, to have greater flexibility of choice. The new access conditions, rules and procedures were established with Circular No. 78/2008-DP dated November 4, 2008.
On October 31, 2001, the Federal Government enacted Law No. 10,303, which amends the Brazilian Corporation Law and the law relating to the CVM. Law No. 10,303 imposes, among other things, restrictions on the issuance of preferred (nonvoting) shares; under the law, a non-publicly traded company is prohibited from issuing preferred shares in an aggregate amount that exceeds 50% of that company’s capital stock, while publicly traded companies on the date that the law was enacted were permitted to continue issuing preferred shares in an aggregate amount that is not in excess of 2/3 of capital stock. In addition, under Law No. 10,303, preferred shares are required to be accorded one of the following minimum preferences: (a) priority in receipt of dividends in an amount up to 3% of the book value per share; (b) dividends in an amount greater than those paid in respect of the common (voting) shares; or (c) a “tag-along” right that would permit minority shareholders to receive at least 80% of the price per share paid to the controlling shareholder upon any transfer of control of the company. Law No. 10,303 also gives minority shareholders the right to elect (x) two directors if such shareholders hold common shares that represent at least 15% of the voting shares or 10% of the total capital stock or (y) one director if such shareholders hold common or preferred shares that represent at least 10% of the total capital stock. The directors so elected by the minority shareholders were given veto rights in the appointment of an independent auditor. Finally, to convert a publicly held corporation into a close corporation, the purchaser is required to offer to purchase the remaining outstanding shares at their fair value (determined in accordance with the guidelines of the CVM). Companies were given one year to amend their bylaws to make these changes, although the 50% limitation on the issuance of preferred shares was made effective immediately. Law No. 10,303 also amends the Brazilian Securities Commission Law to make market manipulation, insider trading and improper use of one’s position, profession, activity or function crimes punishable by imprisonment and fines. Law No. 10,303 is
D-58
intended to promote investment in the domestic capital markets by affording additional protections to minority shareholders. On February 15, 2006, Provisional Measure No. 281 was issued (subsequently enacted as Law No. 11,312 on June 27, 2006), exempting foreign investors from a withholding tax on trading in Brazilian government bonds. The exemption is limited to investment funds that have at least 98% of their assets invested in Brazilian government bonds and in which all of the investors are nonresidents of Brazil. The exemption does not apply to repurchase transactions or to investors that are resident in countries that have no capital gains taxes or that impose such a tax at a rate lower than 20%. The exemption is intended to increase the demand for Brazilian government bonds and, by doing so, reduce Brazil’s borrowing costs.
The Brazilian equity market is one of Latin America’s largest in terms of market capitalization. The average daily trading volume rose to $1.1 billion in 2006, $2.6 billion in 2007, $3.1 billion in 2008, $2.7 billion in 2009, and $3.7 billion in 2010. Trading on Brazilian stock exchanges by non-residents of Brazil is subject to specific rules under Brazilian foreign investment legislation.
The Brazilian equity market is characterized by significant short-term price volatility. The closing levels (U.S. dollar adjusted) for the IBOVESPA, an index maintained by BM&FBOVESPA, were 20,801 on December 31, 2006, 36,067 on December 31, 2007, 16,068 on December 31, 2008, 39,391 on December 31, 2009 and 41,592 on December 31, 2010.
D-59
PUBLIC FINANCE
Consolidated Public Sector Fiscal Performance
The consolidated public sector account is comprised of the accounts of the Federal Government, public enterprises, and State and local governments. In turn, the Federal Government account consolidates the accounts of the National Treasury, the social security system, and the income and loss statement of the Central Bank, but does not include the proceeds of privatizations. With the adoption of several important structural reforms in recent years, the Federal Government has established as its objective a substantial improvement in the fiscal performance of the consolidated public sector as measured by the primary balance.
Fiscal balance in Brazil is measured by the financial balance or nominal balance, and the primary balance, each of which are calculated according to the official statistical guidelines of the IMF:
| | • | | Financial Balance or Nominal Balance, which when in deficit is referred to as the Public Sector Borrowing Requirement (“PSBR”), is calculated as the difference between the level of consolidated public sector debt in one period and the level of such debt in the previous period, excluding the effects of the Federal Government’s privatization program and the effect of exchange rate fluctuations on the debt levels between periods; |
| | • | | Primary Balance, is the financial balance (or nominal balance) less net borrowing costs of the Federal Government. |
The PSBR was 3.6% of GDP in 2006, declined over the next two years falling to 2.8% in 2007 and 2.0% of GDP in 2008, increased again to 3.3% of GDP in 2009, but declined to 2.6% of GDP in 2010.
Brazil’s consolidated public sector primary surplus was R$75.9 billion (3.2% of GDP) in 2006, R$88.1 billion (3.3% of GDP) in 2007, and R$103.6 billion (3.4% of GDP) in 2008. The consolidated public sector primary surplus in 2009 was R$64.8 billion, or 2.0% of GDP, falling by an amount equal to 1.4% of GDP as compared to the surplus registered in 2008. The consolidated public sector primary surplus for 2010 was R$101.7 billion, or 2.8% of GDP. The Federal Government achieved the primary surplus target for 2010 of 3.1% of GDP after deducting spending under PAC of 0.3% of GDP.
Since 2011, the primary surplus targets have been fixed in nominal terms. The budget directives law (Lei de Diretrizes Orçamentárias, or “LDO”) for 2011 (Law No. 12,309 dated August 9, 2010) established as a target for 2011 a consolidated public sector primary surplus of R$117.9 billion (in nominal terms), and allows the deduction of up to R$32.0 billion of public expenses from PAC (see “—2011 Budget”).
Real interest payments totaled 5.4% of GDP in 2006, 2.7% of GDP in 2007, 1.9% of GDP in 2008, 5.7% of GDP in 2009 and 0.8% of GDP in 2010.
Set forth below are the public sector borrowing requirements for the five year period ending December 31, 2010. In addition to the cash balance of the National Treasury, the public sector borrowing requirements include the borrowing requirements of public enterprises, the social security system, the Central Bank, States and municipalities and certain public funds.
D-60
Table No. 22
Public Sector Borrowing Requirements Historical Summary(1)
| | | | | | | | | | | | | | | | | | | | |
| | | 2006 | | | 2007 | | | 2008 | | | 2009 | | | 2010 | |
Selected Economic Indicators(2) | | | | | | | | | | | | | | | | | | | | |
Real GDP Growth (Decline) | | | 4.0 | % | | | 6.1 | % | | | 5.2 | % | | | (0.6 | )% | | | 7.5 | % |
Monetary Base (end of period) change | | | 4.0 | | | | 21.1 | | | | 0.6 | | | | 12.6 | | | | 24.6 | |
Real interest rate(3) | | | 10.9 | | | | 3.7 | | | | 3.1 | | | | 11.5 | | | | (1.4 | ) |
Implicit interest rate(4) | | | 12.1 | | | | 5.6 | | | | 3.2 | | | | 13.0 | | | | 0.5 | |
Public Finance(5) | | | | | | | | | | | | | | | | | | | | |
Financial Balance | | | (3.6 | ) | | | (2.8 | ) | | | (2.0 | ) | | | (3.3 | ) | | | (2.6 | ) |
Primary Balance | | | 3.2 | | | | 3.3 | | | | 3.4 | | | | 2.0 | | | | 2.8 | |
Real interest | | | 5.4 | | | | 2.7 | | | | 1.9 | | | | 5.7 | | | | 0.8 | |
Domestic | | | 5.0 | | | | 2.7 | | | | 2.0 | | | | 5.7 | | | | 0.7 | |
External | | | 0.4 | | | | 0.0 | | | | (0.1 | ) | | | (0.0 | ) | | | (0.0 | ) |
Operational result | | | (2.1 | ) | | | 0.6 | | | | 1.5 | | | | (3.7 | ) | | | n.a. | |
Domestic financing | | | (6.6 | ) | | | (7.1 | ) | | | 0.3 | | | | (5.9 | ) | | | n.a. | |
External financing | | | 4.0 | | | | 7.2 | | | | 0.9 | | | | 1.7 | | | | 2.3 | |
Issue of money | | | 0.5 | | | | 0.5 | | | | 0.4 | | | | 0.5 | | | | 0.5 | |
| (2) | Accumulated change from prior period. |
| (3) | Accumulated change in the fiscal year, deflated by the IGP-DI. |
| (4) | Implicit real interest rate on public sector internal debt of the fiscal year. |
| (5) | All figures expressed as a percentage of GDP. |
Source: Central Bank.
The table below shows the contributions of the Federal Government, the State and local governments and public sector enterprises with regard to the PSBR.
D-61
Table No. 23
Public Sector Borrowing Requirements(1)(2)(4) by Sector
| | | | | | | | | | | | | | | | | | | | |
| | | % of
GDP | | | % of
GDP | | | % of
GDP | | | % of
GDP | | | % of
GDP | |
Item | | 2006(3) | | | 2007(3) | | | 2008(3) | | | 2009(3) | | | 2010(3) | |
Total (4) | | | | | | | | | | | | | | | | | | | | |
Financial | | | (3.6 | ) | | | (2.8 | ) | | | (2.0 | ) | | | (3.3 | ) | | | (2.6 | ) |
Primary | | | 3.2 | | | | 3.3 | | | | 3.4 | | | | 2.0 | | | | 2.8 | |
Operational | | | (2.1 | ) | | | 0.6 | | | | 1.5 | | | | (3.7 | ) | | | n.a. | |
Federal Government | | | | | | | | | | | | | | | | | | | | |
Financial | | | (3.1 | ) | | | (2.2 | ) | | | (0.8 | ) | | | (3.4 | ) | | | (1.3 | ) |
Primary | | | 2.2 | | | | 2.2 | | | | 2.4 | | | | 1.3 | | | | 2.1 | |
Operational | | | (2.2 | ) | | | 0.2 | | | | 1.7 | | | | (3.6 | ) | | | n.a. | |
State and Local Government | | | | | | | | | | | | | | | | | | | | |
Financial | | | (0.7 | ) | | | (0.5 | ) | | | (1.2 | ) | | | 0.1 | | | | (1.3 | ) |
Primary | | | 0.8 | | | | 1.1 | | | | 1.0 | | | | 0.7 | | | | 0.6 | |
Operational | | | (0.2 | ) | | | 0.5 | | | | (0.2 | ) | | | 0.0 | | | | n.a. | |
Public Sector Enterprises | | | | | | | | | | | | | | | | | | | | |
Financial | | | 0.2 | | | | (0.1 | ) | | | (0.1 | ) | | | 0.0 | | | | 0.0 | |
Primary | | | 0.2 | | | | (0.1 | ) | | | 0.1 | | | | 0.0 | | | | 0.1 | |
Operational | | | 0.2 | | | | (0.1 | ) | | | (0.1 | ) | | | 0.0 | | | | n.a. | |
| (1) | Amounts calculated using the IGP-DI adjusted as of month-end. The figures for financial and operational results include the effect of the exchange rate on the stock of the securitized debt. |
| (3) | Reflects the ratio of flows to GDP, both valued for the last month of the period, using IGP-DI. |
| (4) | Statistics on debt and public sector borrowing requirements currently exclude companies linked to Petrobrás Group, in accordance with Decree No. 6,867 dated May 29, 2009, which deals with financial planning and fiscal targeting in the context of the Federal Government. |
Source: Central Bank.
Budget Process
The Federal Government’s fiscal year is the calendar year. Responsibility for preparation of the federal budget rests with the executive branch, although the National Congress plays a major role in budget determinations. The budget proposal is prepared based upon discussions among representatives from the National Treasury of the Ministry of Finance and the Federal Budget Secretariat (Secretaria de Orçamento Federal, or “SOF”), jointly with the Planning and Strategic Investments Secretariat. After discussions among representatives of SOF, the National Treasury and each other Ministry, SOF submits a formal proposal for LDO for the succeeding fiscal year to the President of the Republic. The President, in turn, submits the LDO proposal, with any revisions, to the National Congress. The LDO proposal with respect to the succeeding year must be submitted to the National Congress by April 15.
The National Congress may revise the LDO proposed by the President. The National Congress is charged by law to submit to the President the LDO as revised by July 17 and may not begin its winter recess until it does so. The LDO becomes effective immediately if the National Congress approves the presidential proposal without revision. If the National Congress alters any item of the proposal, the President may veto any provision of the revised LDO. All provisions that are not vetoed become effective upon presidential signature. The National Congress may override the veto by a two-thirds majority vote. If the veto is overridden, the provision becomes effective upon the override.
The executive branch is charged with submitting to the National Congress a detailed budget for the succeeding fiscal year (Proposta de Lei Orçamentária) that is consistent with the broad contours set forth in the LDO. Each ministry proposes a detailed budget with respect to its operations, and SOF meets with each ministry to discuss its proposal. SOF finalizes a
D-62
federal budget proposal, which it submits to the President, who may revise the proposal. The President is then required to submit the budget, as revised, to the National Congress by August 31.
The National Congress may revise some items in the President’s proposed budget. The National Congress may not, however, alter the items regarding payments on any external debt that the Republic has incurred. By December 22, the National Congress must submit to the President the budget, as revised, for the succeeding year.
The President is granted 15 days to review and sign the budget. If the President signs the budget or a veto is overridden prior to the end of the year, the provisions that are not vetoed or for which the veto has been overridden become effective as of January 1 of the following year as the LOA. After presidential signature, implementing decrees authorizing expenditures are generally issued within five to ten days, but certain expenditures are permitted to be immediately executed.
Within 30 days after the end of each two-month period, the Federal Government publishes a summary report of the budget execution, as required by the Federal Constitution. At the end of a two-month period, if the Federal Government finds that the budgeted amounts may prevent achievement of the primary surplus target, it will limit expenditures and financial transactions in order to achieve such surplus target.
Constitutional Amendment No. 32, effective since September 12, 2001, prohibits, among other things, the issuance of provisional measures for the implementation of multi-year plans and budgets. See “The Federative Republic of Brazil—Form of Government and Political Parties”.
The target set for public enterprises changed in 2009 primarily due to the withdrawal of the Petrobrás Group companies from such group. The Federal Government is giving special treatment to the Petrobrás Group by removing it from the calculation of the fiscal result of the public sector, resulting in the withdrawal of assets and liabilities of the company from the calculation of the Net Public Sector Debt (“DLSP”) with future flows of transactions of the company ceasing to affect DLSP and the financing needs of the Public Sector. Likewise, Eletrobrás—the state-controlled electricity holding company—was removed from the accounting procedures for the country’s primary surplus in 2010. Hence, the consolidated public sector primary surplus target for 2010 changed from 3.3% to 3.1% of GDP.
2011 Budget
The LDO for 2011 (Law No. 12,309 dated August 9, 2010) established as a target for 2011 a consolidated public sector primary surplus of R$117.9 billion, and allowed the deduction of up to R$32.0 billion of public expenses from PAC.
The 2011 budget bill was approved by the National Congress and signed by President Rousseff on February 9, 2011 (Law No. 12,381). The 2011 budget established, as a target for the Federal Government, a primary surplus of 2.15% of GDP. The budget of the Federal Government forecast a primary surplus of R$81.8 billion based on estimated revenues of R$990.5 billion and fixed expenditures of R$908.7 billion. The 2011 budget assumed an inflation rate of 4.5%.
The principal assumptions underlying the 2011 budget estimates are set forth below.
Table No. 24
Principal 2011 Budget Assumptions
| | | | |
| | | Year Ended
December 31, 2011 | |
Gross Domestic Product | | | | |
Nominal GDP (billions of reais) | | R$ | 3,927.1 | |
Real GDP Growth | | | 5.5 | % |
Inflation | | | | |
Domestic Inflation (IPCA) | | | 4. 5 | % |
Source: SEPLAN/ SOF.
D-63
The following table sets forth revenues and expenditures of the Federal Government in 2009 and 2010, and as projected in the 2011 budget.
Table No. 25
Primary Balance of the Federal Government and 2011 Budget(1)
| | | | | | | | | | | | |
| | | Year Ended
December 31 | | | 2011
Budget | |
| | | 2009 | | | 2010 | | |
| | | (in billions of reais) | |
1—Total Revenues | | R$ | 739.3 | | | R$ | 919.8 | | | R$ | 990.5 | |
1.1—Treasury revenue | | | 555.1 | | | | 705.3 | | | | 750.4 | |
1.1.1—Administrative revenue | | | 470.7 | | | | 546.3 | | | | 642.0 | |
1.1.2—Refunds | | | (14.7 | ) | | | (14.1 | ) | | | n.a . | |
1.1.3—Direct taxes | | | 0 | | | | 0.0 | | | | n.a . | |
1.1.4—Other revenues | | | 99.2 | | | | 173.2 | | | | 108.5 | |
1.1.5—Fiscal incentives | | | (0.1 | ) | | | (0.1 | ) | | | n.a . | |
1.2—Social security receipts | | | 182.0 | | | | 212.0 | | | | 240.1 | |
1.3—Central Bank receipts | | | 2.2 | | | | 2.5 | | | | n.a . | |
2—Total Expenditures | | | 699.9 | | | | 840.8 | | | | 908.7 | |
2.1—Treasury expenditures(2) | | | 472.1 | | | | 583.0 | | | | 633.6 | |
2.1.1—Transfers to States and municipalities | | | 127.7 | | | | 140.7 | | | | 163.1 | |
2.1.2—Expenditures of the Federal Administration(3) | | | 338.1 | | | | 433.2 | | | | 463.5 | |
2.1.3—Subsidies and subventions | | | 5.2 | | | | 7.9 | | | | 6.9 | |
2.1.4—Transfers to Central Bank | | | 1.2 | | | | 1.2 | | | | n.a . | |
2.2—Social security benefits | | | 224.9 | | | | 254.9 | | | | 275.1 | |
2.3—Central Bank expenditures | | | 2.9 | | | | 3.0 | | | | n.a . | |
3—Primary Balance(4) | | | 39.4 | | | | 78.9 | | | | 81.8 | |
3.1—Federal Government result (1-2) | | | 40.1 | | | | 79.5 | | | | 81.8 | |
3.1.1—National Treasury (1.1-2.1) | | | 82.9 | | | | 122.3 | | | | 116.8 | |
3.1.2—Social security (1.2-2.2) | | | (42.9 | ) | | | (42.9 | ) | | | (35.1 | ) |
3.2—Central Bank result (1.3-2.3) | | | (0.6 | ) | | | (0.5 | ) | | | n.a . | |
4—Financing Requirement(5) | | | (40.8 | ) | | | (80.3 | ) | | | (81.8 | ) |
5—Errors and Omissions(5) | | | 1.4 | | | | 1.4 | | | | 0.0 | |
| (1) | Consolidated accounts of the National Treasury, Social Security and the Central Bank, according to Law No. 12,381 dated February 9, 2011. |
| (2) | Calculated as the sum of transfers to States and municipalities, personnel costs and other expenditures. |
| (3) | Calculated as the sum of personnel costs and other expenditures, minus subsidies and subventions. |
| (4) | Above the line. Surplus/(deficit). |
| (5) | (Surplus)/deficit below the line. |
Source: Ministry of Finance/National Treasury Secretariat and Central Bank
Every two months, the Federal Government revises revenues, expenditures, fiscal results and macroeconomic parameters as required by the LDO, usually changing the public budget figures as a result. In accordance with the first two-month period revision for 2011, real GDP growth rate changed to 5.0%, domestic inflation (IPCA) was set at 5.0% and the reduction of budget expenditures was up to R$50.7 billion. See “Public Finance—Fiscal Responsibility Law and Fiscal Crime Law”.
Under Constitutional Amendment No. 27 dated March 21, 2000, which became effective on March 22, 2000, the Federal Government was permitted to reallocate through 2003, 20.0% of certain tax revenues that the Federal Government would
D-64
otherwise have been required to devote to specific program areas under the Constitution. The amendment created the Desvinculação de Recursos da União, or DRU, which applied to social security contributions made by employees in the private sector. On December 20, 2007, the National Congress approved Constitutional Amendment No. 56, which extended the DRU until 2011.
However, the Federal Government has proposed a change in the LDO for 2011 in order to extend, from R$32 billion to R$55.9 billion, the amount of deductions that could be made in order to achieve consolidated the public sector primary surplus target. The additional R$ 23.9 billion is from the PAC limit that was not deducted from the primary surplus in 2010 in order to achieve the 2010 target.
On August 29, 2011, the Minister of Finance announced the Government’s intention to increase the primary surplus target for 2011 by R$10.0 billion, from R$117.9 billion to R$127.9 billion. The Government intends to achieve the additional fiscal effort through an increase in the Central Government’s primary result, without considering the deductions allowed for PAC investments.
The following table sets forth the expenditures of the Federal Government in the years indicated, by function. The figures in this table are not directly comparable with those set forth in the table above entitled “Primary Balance of the Federal Government and 2011 Budget”, because the expenditures set forth in the table above were calculated in accordance with the IMF, which does not include, among other things, debt service expenditures and certain financial investments.
Table No. 26
Expenditures of the National Treasury by Function
(in millions of dollars)(1)
| | | | | | | | | | | | | | | | | | | | |
| | | 2007 | | | 2008 | | | 2009 | | | 2010 | | | 2011
Budget(3) | |
Legislative | | $ | 2,055 | | | $ | 2,314 | | | $ | 2,110 | | | $ | 2,645 | | | $ | 3,795 | |
Judiciary | | | 8,214 | | | | 10,480 | | | | 10,372 | | | | 12,966 | | | | 15,958 | |
Administration and Planning | | | 5,571 | | | | 6,316 | | | | 6,680 | | | | 9,064 | | | | 15,257 | |
Agriculture | | | 4,007 | | | | 4,175 | | | | 5,480 | | | | 5,032 | | | | 11,237 | |
Communications | | | 240 | | | | 204 | | | | 183 | | | | 283 | | | | 750 | |
National Defense and Public Security | | | 10,964 | | | | 13,544 | | | | 14,411 | | | | 19,888 | | | | 22,915 | |
Regional Development | | | — | | | | — | | | | — | | | | — | | | | — | |
Education, Culture and Citizenship Rights | | | 10,233 | | | | 12,746 | | | | 15,118 | | | | 23,014 | | | | 34,891 | |
Energy and Mineral Resources | | | 209 | | | | 234 | | | | 302 | | | | 277 | | | | 562 | |
Housing and Urban Planning | | | 435 | | | | 673 | | | | 874 | | | | 1,064 | | | | 4,492 | |
Industry, Commerce and Services | | | 2,168 | | | | 1,857 | | | | 1,332 | | | | 1,642 | | | | 5,164 | |
Foreign Affairs | | | 717 | | | | 995 | | | | 718 | | | | 994 | | | | 1,101 | |
Health and Sanitation | | | 20,265 | | | | 24,056 | | | | 24,794 | | | | 31,295 | | | | 41,803 | |
Labor | | | 9,938 | | | | 11,899 | | | | 14,234 | | | | 17,547 | | | | 18,670 | |
Assistance and Social Security | | | 132,377 | | | | 155,813 | | | | 161,547 | | | | 206,859 | | | | 224,603 | |
Transportation | | | 2,932 | | | | 2,606 | | | | 4,119 | | | | 6,727 | | | | 13,481 | |
Environmental Management | | | 654 | | | | 749 | | | | 772 | | | | 1,103 | | | | 2,607 | |
Science and Technology | | | 1,647 | | | | 2,155 | | | | 2,414 | | | | 3,035 | | | | 4,508 | |
Agricultural Organization | | | 1,789 | | | | 1,330 | | | | 1,218 | | | | 1,263 | | | | 2,666 | |
Sports and Leisure | | | 387 | | | | 110 | | | | 75 | | | | 144 | | | | 1,374 | |
Special Charges | | | 383,531 | | | | 399,543 | | | | 401,413 | | | | 460,912 | | | | 682,373 | |
Intergovernment Transfers | | | — | | | | — | | | | — | | | | — | | | | — | |
Contingency Reserve | | | — | | | | — | | | | — | | | | | | | | 15,231 | |
Total(2) | | $ | 598,333 | | | $ | 651,799 | | | $ | 668,166 | | | $ | 805,753 | | | $ | 1,123,438 | |
| | | | | | | | | | | | | | | | | | | | |
| (1) | Converted to U.S. dollars using the annual average commercial exchange rate (sell side). |
D-65
| (2) | Total expenditures in this table are those reflected in the accounts of the Ministry of Finance, which treats certain expenditures as having been incurred when committed even though the corresponding amounts are disbursed in a later year. |
| (3) | Estimates. Source: Federal Budget Secretariat. |
Source: Federal General Balance Sheet—Ministry of Finance.
Taxation and Revenue Sharing Systems
The Brazilian taxation system is very extensive. The Constitution authorizes the levying and collection of taxes by the taxing authorities of federal, State and municipal governments, and mandates that the Federal Government share a portion of its tax revenues with the States, municipalities and other institutions. The Federal Government collects taxes on personal and corporate income, IPI, a rural property tax (Imposto sobre a Propriedade Territorial Rural, or “ITR”), the IOF, certain mandatory contributions to the social security system from legal entities, employers and employees, and import and export tariffs. Municipalities and the Federal District collect taxes on urban property, transfers of property rights and services.
The tax burden in 2009 was 33.6% of the GDP, as compared to 34.4% of the GDP in 2008. The decrease in the tax burden occurred mainly because of the 2008 international financial crisis and tax cuts implemented in order to stimulate economic activity. The total amount of tax revenue collected in 2009, corresponding to 73 existing taxes (federal, States and municipalities), was R$1,055.4 billion. From this amount, 69.8% was collected by the Federal Government, 25.6% by the states and 4.6% by municipalities. The taxes in 2009 were collected mainly by: the ICMS (20.7%); the Federal Income Tax (17.8%); Social Security (16.8%); and by the COFINS (10.7%).
The IOF tax, IPI, and PIS/CONFINS have been used as instruments to encourage certain activities, through the application of a reduction or exemption. For example, the IPI for research and development and information technology can be reduced or exempted until 2019. In addition, projects in infrastructure sectors such as transportation, ports, energy and basic sanitation were exempt from PIS/COFINS. These benefits are available for any purchases of machine, equipment, construction materials and acquired services in Brazil and abroad.
Micro or small companies are eligible to contribute to a simplified tax collection system known as “Simples Nacional,” which enables these companies to pay a single unified tax based on their level of gross revenues, rather than paying several different taxes. The Simples Nacional, established by Complementary Law No. 123 dated December 14, 2006, became effective on July 1, 2007. This law replaced the “Simples Federal” Law No. 9,317 dated December 5, 1996, merging six different federal taxes (Income Tax for Corporates, IPI, CSLL, COFINS, PIS and employers contribution to social security), the ICMS at the state level and the Imposto Sobre Serviço at the municipal level. Under this system, taxes for micro and small companies will range from 4.0% to 17.4%, depending on each company’s business activity.
Income Taxation. For corporate and other legal entities: (i) the basic tax is 15.0%, while the surtax on taxable net income exceeding R$20,000 multiplied by the number of months of period recorded is 10.0%; (ii) the tax related to social welfare levied on net profit is 8.0% with respect to enterprises in general, and 18.0% in the case of financial institutions; (iii) with respect to profits earned by foreigners, the tax levied on passive investment income is 15.0%; (iv) taxes on capital gains and loan interest is 15.0%; and (v) the tax levied on the nominal yield from financial investments in fixed income is 15.0%, while variable income is taxed at the rate of 10.0%.
The tax rate for interest payments remitted abroad in respect of loans is 15.0%. However if the remittance favors a resident or a person domiciled in a tax haven, then such tax rate is 25.0%. The tax rate for equity proceeds is 20.0%.
Brazil’s individual income tax rates for 2011 are progressive, in the following amounts: 0%, 7.5%, 15%, 22.5% and 27.5%. The minimum taxable monthly income is currently R$1,566.61. Anything below that rate is excluded from income taxes. Tax deductions in Brazil are available only in a restricted number of cases.
Value Added and Other Taxes. The federal value added tax on manufactured products is levied at scheduled rates at each stage of the production and distribution process. Import and export tariffs are based on published tariff schedules. See “The Brazilian Economy—Historical Background”.
The ICMS (the value added tax in Brazil) is a tax based on the movement of goods and services through interstate and inter-municipal transportation and communication. It is a tax that each State and the Federal District may establish, as determined by the 1988 Federal Constitution. The ICMS is a non cumulative tax, compensating the value due in each
D-66
transaction or service with the amount previously charged. Since September 13, 1996, exports of primary and semi-finished goods and the acquisition of certain fixed assets (Complementary Law No. 87 or “Kandir Law”) have been exempt from paying the ICMS. See “Balance of Payments and Foreign Trade—Exports”.
The IOF was created by Law No. 5,143 dated October 20, 1966 and is a tax levied on transactions related to credit, foreign exchange, insurance, securities and gold (as a financial asset). CMN is responsible for the changes in the IOF.
Social Contributions. Business entities are required to make three contributions to social welfare funds. First, corporations (including banks) must make a social contribution of 15.0% of quarterly real profits (“CSLL”) and some financial institutions (including stock exchanges and credit companies) must make a social contribution of 9.0% of CSLL, according to Law No. 11,727 dated June 23, 2008. Second, corporations must contribute 7.6% of monthly corporate billings to COFINS (Law No. 10,833/2003), while financial institutions must contribute 4.0% (Law No. 10,684/2003). Third, corporations must contribute 1.65% of billings to finance other social programs (Programa de Formação do Patrimônio do Servidor Público, or “PASEP”, and together with PIS, “PIS/PASEP”) (Law No. 10,637/2002)). Financial institutions must contribute 0.65% of gross operating revenue to PIS/PASEP. Other sources of funding for social programs include progressively graduated social security taxes that are shared by employers and their employees.
Revenue Sharing. The Constitution mandates the distribution to, or sharing with, the States, municipalities and regions of certain types of taxes collected by the Federal Government. The municipalities are entitled to: (i) funds derived from withholding tax levied on payments made, in any way, by the municipalities, including autonomous entities and foundations thereof, (ii) 50.0% of the revenues from automobile property taxes, (iii) 25.0% of the ICMS and (iv) ITR revenues if such municipalities monitor and collect the tax. The States are entitled to funds derived from withholding tax levied on payments made by the States, including autonomous entities and foundations thereof.
The Federal Government is required to transfer 48.0% of the proceeds from the IPI and the income tax as follows: (i) 21.5% to the States and Federal District Participation Funds, (ii) 23.5% to the Municipalities Participation Fund and (iii) 3.0% to the financing programs for the productive sectors in the North, Northeast and Central West Regions. The Federal Government must transfer another 10.0% of the proceeds of the IPI to the States and Federal District ratably in proportion to their respective exports of manufactured products; the States must transfer 25.0% of these amounts to the municipalities. In addition, the Federal Government must transfer to States and municipalities 29.0% of the revenues from the CIDE and the States must transfer 25.0% of these amounts to the municipalities.
All of the revenues derived from IOF levied on transactions in gold as a financial asset are distributed with 70.0% allocated to the municipalities and 30.0% allocated to the States, Federal District or federal territory of origin.
The Federal Government must dedicate at least 18.0% of annual tax revenues to education, and the municipalities, States and Federal District must invest at least 25.0% of their annual revenues in this area.
Sovereign Fund
Law No. 11,887 dated December 24, 2008, created the FSB, an anti-cyclical mechanism that aims to promote investments in assets in Brazil and abroad, create public savings, minimize the effects of the economic and financial crises, as well as promote projects of strategic interest to Brazil. Provisional Measure No. 513 dated November 26, 2010 (subsequently enacted as Law No. 12,409) authorized Brazil to issue treasury bonds to bolster the FSB. On December 31, 2010, the FSB was valued at R$18.8 billion, or approximately 0.5% of GDP.
Fiscal Responsibility Law and Fiscal Crime Law
On May 4, 2000, the Federal Government enacted the Fiscal Responsibility Law, which introduced a financial-oriented approach designed to replace the inflationary financing and debt accumulation that had prevailed in the past. The law sets forth fundamental principles and directives of public finances and establishes a comprehensive framework intended to eliminate fiscal imbalances. The law applies to each level of government, as well as to government-controlled funds, semi-autonomous entities and public enterprises.
The Fiscal Responsibility Law provides for, among other things:
| | • | | Limitations on personnel expenditures as a percentage of net current revenues to 50.0% for the Federal Government, 60.0% for the States, and 60.0% for municipalities. |
D-67
| | • | | Ceilings for public sector debt for the Federal Government, States and municipalities, which are to be verified every four months. |
| | • | | Regulation of the “golden rule”, which establishes that the volume of credit operations cannot exceed capital expenditures. Tax concessions have to be accompanied by estimates of their budget and financial impact in the budget year and in the two following years and included in the LDO. The proposing entity must also indicate that compensatory revenues exist. Increases in expenditures have to be accompanied by estimates of their budgetary and financial impact in the year in which they are first incurred and in the two following years, and by a declaration from the proposing entity stating that such increases are in compliance with multi-year plan (Plano Plurianual), LDO and annual budget. |
| | • | | Strengthening of the budgetary process as a planning instrument, with bi-monthly evaluations of fiscal targets for five key variables: revenues, expenditures, nominal and primary fiscal results and public sector debt. Non-compliance with bi-monthly targets for nominal and primary results will trigger automatic cuts in expenditure authorizations and in financial transactions separately at each level of government. |
| | • | | Strict rules for controlling revenue anticipation loans, concession of guarantees, and accrued expenses. New loan operations will not be authorized if ceilings on public sector debt are exceeded, except for refinancings of existing debt. Ceilings on personnel expenditures are to be verified every four months and, if exceeded, expenditure reduction measures will be triggered automatically. If such ceilings are exceeded by 95.0% or more, pay raises, new hiring and personnel related expenditures will be suspended. Courts specialized in the review of public accounts are to advise administrations of actual and potential noncompliance with the Fiscal Responsibility Law, described below. |
| | • | | A requirement that periodic evaluations reported in the fiscal risks annex contain information on financial and actuarial status of social security and FAT, other public funds and programs of an actuarial nature, overall contingent liabilities and other risks associated with public finances. The Federal Government is also required to present projections for key economic variables and the targets for inflation. |
| | • | | Debt renegotiations and rollovers are strictly forbidden during an incumbent’s final year in office. |
| | • | | A prohibition against the Central Bank issuing its own securities. The Central Bank’s debt securities are also included in the limits for Federal Government debt. The Fiscal Responsibility Law contains provisions that are intended to make the Central Bank’s operations more transparent, which include the obligation to present detailed reports. Sanctions for irresponsible behavior and mismanagement are to be established along with civil and criminal penalties in the Fiscal Crime Law, described below. |
Exceptions under the Fiscal Responsibility Law are severely limited. Limits on public sector debt and on credit operations will be revised upon request by the President in the case of economic instability and monetary and foreign exchange shocks. Deadlines to reestablish equilibrium will be extended in the case of lackluster economic growth. In case of an officially recognized state of emergency, the limits will be temporarily suspended. Fiscal target annexes will be required to account for sources, and funds obtained from sale of public assets will be prohibited from being used to finance current expenditures, except expenditures related to social security.
In December 2001, in accordance with the Fiscal Responsibility Law, Senate Resolution No. 40 dated December 20, 2001, defined the global limits for the consolidated net indebtedness of States and municipalities, and determined that a State’s debt cannot be higher than 200% of its net current revenue and a municipality’s debt cannot exceed 120% of its net current revenue. It also established mechanisms for annual reductions of indebtedness exceeding such limits.
On October 11, 2000, the Brazilian Senate approved legislation known as the Fiscal Crime Law. The legislation amends Brazil’s Penal Code (Decree Law No. 2,848 dated December 7, 1940) and certain other laws to provide penalties for, among other things, the execution of credit operations in excess of authorized limits, the ordering of expenditures not authorized by law and administrative infractions of public finance laws. The legislation, which was approved by the Chamber of Deputies on May 17, 2000, was enacted on October 19, 2000. The Fiscal Crime Law is a complement to the Fiscal Responsibility Law.
D-68
PUBLIC DEBT
General
Public sector debt in Brazil consists of the internal and external debt of the Federal Government (including the Central Bank), State and local governments and non-financial public enterprises. Pursuant to the Constitution, the Brazilian Senate is vested with powers to establish, at the request of the President, (i) global limits for the consolidated debt of the Federal Government, States and municipalities, (ii) the terms and conditions of the internal and external financial transactions of the Federal Government, including public sector enterprises, at all levels of government, and (iii) the terms and conditions for guarantees by the Federal Government of any internal or external financial transaction. In addition, all external financial transactions entered into at any level of government must be authorized by the Senate.
The aggregate amount of consolidated gross public sector debt increased from $754.6 billion in 2006 to $1,570.4 billion in 2010. The consolidated gross public sector debt as a percentage of GDP was 68.1% in 2006, 70.0% in 2007, 66.7% in 2008, 71.7% in 2009 and 71.2% in 2010. The consolidated net public sector debt increased from $524.1 billion in 2006 to $886.2 billion in 2010. Consolidated net public sector debt as a percentage of GDP decreased every year from 47.3% in 2006, to 45.5% in 2007, to 38.5% in 2008, to 42.8% in 2009 and 40.2% in 2010. The gross debt of the Federal Government was $708.1 billion (or 63.9% of GDP) in 2006, $998.3 billion (or 66.4% of GDP) in 2007, $822.7 billion in 2008 (or 63.4% of GDP), $1,256.9 billion in 2009 (or 68.7% of GDP) and $1,507.6 billion in 2010 (or 68.3% of GDP).
The debt profile of the Republic was substantially altered due to the Brady Plan restructuring of Brazil’s external debt in April 1994. Following that restructuring, the maturity profile of Brazil’s public sector external debt was substantially lengthened, from an average of 6.9 years on December 31, 1993 to an average of 8.8 years on December 31, 1996. The average maturity of Brazil’s public sector external debt was 10.3 years in 2010. Consolidated public sector registered external debt of $72.8 billion (or 6.6% of GDP) in 2006, $68.3 billion (or 4.5% of GDP) in 2007, $64.5 billion (or 5.0% of GDP) in 2008, $71.0 billion (or 3.9% of GDP) in 2009 and $72.8 billion (or 3.3% of GDP) in 2010. Interest and principal payments for that debt amounted to approximately $33.3 billion or 24.2% of exports in 2006, $22.6 billion or 14.6% of exports, in 2007, $11.6 billion or 5.9% of exports in 2008, $14.2 billion or 9.3% of exports in 2009 and $15.7 billion or 7.8% of exports in 2010. On December 31, 2010, consolidated net public sector external debt was negative $216.0 billion (or negative 9.8% of GDP).
D-69
The following table sets forth the consolidated gross and net debt of the public sector for each of the periods indicated.
Table No. 27
Public Sector Debt
| | | | | | | | | | | | | | | | | | | | | | | | | | | | | | | | | | | | | | | | |
| | | 2006 | | | As a %
of GDP | | | 2007 | | | As a %
of GDP | | | 2008 | | | As a %
of GDP | | | 2009 | | | As a %
of GDP | | | 2010 | | | As a %
of GDP | |
| (in millions of dollars, except percentages) | |
Consolidated Gross Public Sector Debt* | | $ | 754,626 | | | | 68.1 | | | $ | 1.052,485 | | | | 70.0 | | | $ | 865,428 | | | | 66.7 | | | $ | 1,312,448 | | | | 71.7 | | | $ | 1,570,444 | | | | 71.2 | |
Internal(1) | | | 681,802 | | | | 61.5 | | | | 984,206 | | | | 65.5 | | | | 800,921 | | | | 61.7 | | | | 1,241,477 | | | | 67.8 | | | | 1,497,601 | | | | 67.9 | |
External(2) | | | 72,824 | | | | 6.6 | | | | 68,279 | | | | 4.5 | | | | 64,507 | | | | 5.0 | | | | 70,971 | | | | 3.9 | | | | 72,843 | | | | 3.3 | |
By Sector | | | | | | | | | | | | | | | | | | | | | | | | | | | | | | | | | | | | | | | | |
Federal Government and Central Bank Gross Debt | | | 708,070 | | | | 63.9 | | | | 998,263 | | | | 66.4 | | | | 822,672 | | | | 63.4 | | | | 1,256,931 | | | | 68.7 | | | | 1,507,618 | | | | 68.3 | |
Internal | | | 644,224 | | | | 58.1 | | | | 939,260 | | | | 62.5 | | | | 768,530 | | | | 59.2 | | | | 1,197,833 | | | | 65.5 | | | | 1,450,807 | | | | 65.7 | |
Securities Debt | | | 536,943 | | | | 48.4 | | | | 783,197 | | | | 52.1 | | | | 672,094 | | | | 51.8 | | | | 1,055,246 | | | | 57.7 | | | | 1,126,895 | | | | 51.1 | |
Other debt(3) | | | 107,281 | | | | 9.7 | | | | 156,063 | | | | 10.4 | | | | 96,436 | | | | 7.4 | | | | 142,587 | | | | 7.8 | | | | 323,912 | | | | 14.7 | |
External | | | 63,846 | | | | 5.8 | | | | 59,003 | | | | 3.9 | | | | 54,142 | | | | 4.2 | | | | 59,098 | | | | 3.2 | | | | 56,811 | | | | 2.6 | |
Credits | | | (363,787 | ) | | | (32.8 | ) | | | (536,992 | ) | | | (35.7 | ) | | | (510,915 | ) | | | (39.4 | ) | | | (721,114 | ) | | | (39.4 | ) | | | (906,491 | ) | | | (41.1 | ) |
Internal | | | (277,948 | ) | | | (25.1 | ) | | | (356,677 | ) | | | (23.7 | ) | | | (304,109 | ) | | | (23.4 | ) | | | (482,060 | ) | | | (26.3 | ) | | | (617,669 | ) | | | (28.0 | ) |
Public Sector(4) | | | (159,418 | ) | | | (14.4 | ) | | | (202,965 | ) | | | (13.5 | ) | | | (171,797 | ) | | | (13.2 | ) | | | (225,644 | ) | | | (12.3 | ) | | | (258,407 | ) | | | (11.7 | ) |
Other(5)(6) | | | (118,530 | ) | | | (10.7 | ) | | | (153,712 | ) | | | (10.2 | ) | | | (132,312 | ) | | | (10.2 | ) | | | (256,417 | ) | | | (14.0 | ) | | | (359,262 | ) | | | (16.3 | ) |
External(7) | | | (85,839 | ) | | | (7.7 | ) | | | (180,315 | ) | | | (12.0 | ) | | | (206,806 | ) | | | (15.9 | ) | | | (239,054 | ) | | | (13.1 | ) | | | (288,822 | ) | | | (13.1 | ) |
State and Local Government Gross Debt | | | 183,546 | | | | 16.6 | | | | 230,545 | | | | 15.3 | | | | 195,189 | | | | 15.0 | | | | 258,140 | | | | 14.1 | | | | 298,839 | | | | 13.5 | |
Internal | | | 176,771 | | | | 15.9 | | | | 223,580 | | | | 14.9 | | | | 187,247 | | | | 14.4 | | | | 248,690 | | | | 13.6 | | | | 285,693 | | | | 12.9 | |
External | | | 6,775 | | | | 0.6 | | | | 6,965 | | | | 0.5 | | | | 7,942 | | | | 0.6 | | | | 9,450 | | | | 0.5 | | | | 13,146 | | | | 0.6 | |
Credits | | | (13,259 | ) | | | (1.2 | ) | | | (19,687 | ) | | | (1.3 | ) | | | (17,570 | ) | | | (1.4 | ) | | | (24,628 | ) | | | (1.3 | ) | | | (28,173 | ) | | | (1.3 | ) |
Internal | | | (13,259 | ) | | | (1.2 | ) | | | (19,687 | ) | | | (1.3 | ) | | | (17,570 | ) | | | (1.4 | ) | | | (24,628 | ) | | | (1.3 | ) | | | (28,173 | ) | | | (1.3 | ) |
Public Sector(8)(9) | | | 0.0 | | | | 0.0 | | | | 0.0 | | | | 0.0 | | | | 0.0 | | | | 0.0 | | | | 0,0 | | | | 0.0 | | | | 0,0 | | | | 0.0 | |
Other(6) | | | (13,259 | ) | | | (1.2 | ) | | | (19,687 | ) | | | (1.3 | ) | | | (17,570 | ) | | | (1.4 | ) | | | (24,628 | ) | | | (1.3 | ) | | | (28,173 | ) | | | (1.3 | ) |
External(7) | | | 0 | | | | 0 | | | | 0 | | | | 0.0 | | | | 0.0 | | | | 0.0 | | | | 0.0 | | | | 0.0 | | | | 0,0 | | | | 0.0 | |
Public Enterprises Gross Debt | | | 25,292 | | | | 2.3 | | | | 29,910 | | | | 2.0 | | | | 22,703 | | | | 1.7 | | | | 27,173 | | | | 1.5 | | | | 27,102 | | | | 1.2 | |
Internal | | | 23,089 | | | | 2.1 | | | | 27,599 | | | | 1.8 | | | | 20,280 | | | | 1.6 | | | | 24,750 | | | | 1.4 | | | | 24,216 | | | | 1.1 | |
External(10) | | | 2,203 | | | | 0.2 | | | | 2,311 | | | | 0.2 | | | | 2,423 | | | | 0.2 | | | | 2,423 | | | | 0.1 | | | | 2,886 | | | | 0.1 | |
Credits | | | (15,786 | ) | | | (1.4 | ) | | | (17,621 | ) | | | (1.2 | ) | | | (12,020 | ) | | | (0.9 | ) | | | (13,515 | ) | | | (0.7 | ) | | | (12,729 | ) | | | (0.6 | ) |
Internal | | | (15,786 | ) | | | (1.4 | ) | | | (17,621 | ) | | | (1.2 | ) | | | (12,020 | ) | | | (0.9 | ) | | | (13,515 | ) | | | (0.7 | ) | | | (12,729 | ) | | | (0.6 | ) |
Public Sector(11) | | | (2,864 | ) | | | (0.3 | ) | | | (3,268 | ) | | | (0.2 | ) | | | (3,339 | ) | | | (0.3 | ) | | | (4,153 | ) | | | (0.2 | ) | | | (4,707 | ) | | | (0.2 | ) |
D-70
| | | | | | | | | | | | | | | | | | | | | | | | | | | | | | | | | | | | | | | | |
Others(6)(12) | | | (12,922 | ) | | | (1.2 | ) | | | (14,353 | ) | | | (1.0 | ) | | | (8,681 | ) | | | (0.7 | ) | | | (9,362 | ) | | | (0.5 | ) | | | (8,021 | ) | | | (0.4 | ) |
Net Public Sector Debt(13) | | | 524,075 | | | | 47.3 | | | | 684,418 | | | | 45.5 | | | | 500,059 | | | | 38.5 | | | | 782,987 | | | | 42.8 | | | | 886,166 | | | | 40.2 | |
Internal | | | 537,090 | | | | 48.4 | | | | 796,454 | | | | 53.0 | | | | 642,358 | | | | 49.5 | | | | 951,070 | | | | 52.0 | | | | 1,102,145 | | | | 49.9 | |
External | | | (13,015 | ) | | | (1.2 | ) | | | (112,036 | ) | | | (7.5 | ) | | | (142,299 | ) | | | (11.0 | ) | | | (168,083 | ) | | | (9.2 | ) | | | (215,979 | ) | | | (9.8 | ) |
| * | Consolidated gross public sector debt, as presented in this table, does not consolidate debts between public sector entities. This table does not include liabilities related to the FCVS program. See “—Housing Compensation Fund for Salary Fluctuation (Fundo de Compensação de Variações Salariais)”. |
| (1) | Total domestic debt of federal, State and local government less public sector internal credits. |
| (2) | Total external debt of the federal, State and local government, including short-term debt obligations. |
| (3) | Includes monetary base, other deposits of the financial system with the Central Bank and federal securities that can be used in the national privatization program. |
| (4) | Debt securities issued by State and local governments, debt of States and municipalities issued under Resolution 8,727 dated 1993, Resolution 9,496 dated 1997 and credits from the Central Bank to State banks. |
| (5) | Monetary reserves invested in overnight deposits, net banking debt, taxes receivable, social security, other accounts, FAT-BNDES and credits from the Central Bank to financial institutions. |
| (6) | Other internal credits consist primarily of deposits at private sector financial institutions. |
| (7) | External credits are equivalent to the Federal Government’s international reserves. The external credits of the Federal Government and the Central Bank do not include collateral acquired in connection with the April 1994 debt restructuring. |
| (8) | Internal public sector credits owed by other public sector entities. These amounts are consolidated into the consolidated gross public sector debt amounts above. |
| (9) | Taxes receivable and demand deposits. |
| (11) | Investments in public securities and short-term investments in public enterprises. |
| (13) | Net public sector debt is consolidated gross public sector debt less aggregate credits of the Federal Government and the Central Bank, State and local governments and public sector enterprises (excluding internal public sector credits that have been excluded from the calculation of consolidated gross public sector debt). |
| (14) | As of January 2010, the comparison of the Public Sector Net Debt and General Government Gross Debt to the GDP will be based on the current GDP—following an international standard replacing the GDP valued by the IGP-DI. With the objective of enabling the comparability of the current GDP debt in relation to previous periods, the calculation went back to December 2001. |
Source: Central Bank.
D-71
The aggregate amount of the federal domestic securities debt in Central Bank portfolio rose from R$297.8 billion on December 31, 2006 to R$637.8 billion on December 31, 2009, to R$703.2 billion on December 31, 2010.
Brazil’s net public sector debt stood at R$1,542.2 billion (39.7% of GDP) on June 30, 2011, compared with R$1,475.8 billion (or 40.2% of GDP) on December 31, 2010.
Brazil’s federal public debt (“FPD”) stood at R$1,236.9 billion in 2006, R$1,333.8 billion in 2007, R$1,397.3 billion in 2008, R$1,497.4 billion in 2009 and R$1,694.0 billion in 2010.
Brazil’s domestic federal public debt (“DFPD”) stood at R$1,093.5 billion in 2006, R$1,224.9 billion in 2007, R$1,264.8 billion in 2008, R$1,398.4 billion in 2009 and R$1,603.9. billion in 2010.
At July 31, 2011, Brazil’s FPD stood at R$1,734.4 billion, while Brazil’s DFPD totaled R$1,659.8 billion. The share of floating rate debt in FPD increased to R$565.6 billion (32.6% of FPD) from R$535.1 billion (31.6%) on December 31, 2010, while the share of fixed rate debt in FPD decreased to R$598.2 billion (34.5% of FPD) from R$620.6 billion (36.6%) on December 31, 2010.
The average maturity of Brazil’s federal public debt was 2.96 years in December 2006, 3.27 years in December 2007, 3.50 years in December 2008, 3.53 years in December 2009 and 3.51 years in December 2010. In August 2011, the average maturity of Brazil’s federal public debt was 3.71years. The average life of Brazil’s FPD was 4.95 years in December 2006, 5.31 years in December 2007, 5.60 years in December 2008, 5.53 years in December 2009 and 5.51 years in December 2010. In August 2011, the average life of Brazil’s federal public debt was 5.73 years.
Law No. 11,312 dated June 27, 2006, exempted non-resident investors from withholding taxes on buying Brazilian domestic government bonds. The exemption does not apply to investors that are resident in countries that have no capital gains taxes or that impose such a tax at a rate lower than 20%. The exemption is intended to increase the demand for Brazilian government bonds and reduce Brazil’s borrowing costs.
Table No. 28
Federal Public Debt(1) Indicators
| | | | | | | | | | | | | | | | | | | | |
| | | As of December 31, | |
| | | 2006 | | | 2007 | | | 2008 | | | 2009 | | | 2010 | |
Stock of FPD held by public (R$ billion) | | | 1,236.9 | | | | 1,333.8 | | | | 1,397.3 | | | | 1,497.4 | | | | 1,694.0 | |
FPD profile (%): | | | | | | | | | | | | | | | | | | | | |
Fixed rate | | | 32.5 | | | | 35.1 | | | | 29.9 | | | | 32.2 | | | | 36.6 | |
Inflation linked | | | 19.9 | | | | 24.1 | | | | 26.6 | | | | 26.7 | | | | 26.6 | |
Floating rate | | | 35.4 | | | | 32.6 | | | | 33.9 | | | | 34.5 | | | | 31.6 | |
Exchange rate | | | 12.2 | | | | 8.2 | | | | 9.7 | | | | 6.6 | | | | 5.1 | |
Others | | | 0.0 | | | | 0.0 | | | | 0.0 | | | | 0.0 | | | | 0.0 | |
FPD maturity structure: | | | | | | | | | | | | | | | | | | | | |
Average maturity (years) | | | 3.0 | | | | 3.3 | | | | 3.5 | | | | 3.5 | | | | 3.5 | |
Average life (years) | | | 5.0 | | | | 5.3 | | | | 5.6 | | | | 5.5 | | | | 5.5 | |
Percentage maturing in 12 months (%) | | | 32.4 | | | | 28.2 | | | | 25.4 | | | | 23.6 | | | | 23.9 | |
| (1) | It includes the domestic debt and the external debt under the National Treasury responsibility. |
Source: National Treasury.
D-72
Since 1994, debt management policies have been has aimed at lengthening the maturity of DFPD, as well as consolidating a domestic yield curve by means of selling fixed income government securities. A portion of the Federal Government’s domestic debt is linked to the Brazilian prime interest-rate (Selic rate). This portion of debt has been falling and there is an ongoing effort to substitute it for fixed-rate and inflation-linked securities. Furthermore, in 2003 the Federal Government decided to reduce its domestic debt linked to the exchange-rate, and as of August 31, 2011 it accounts for 0.52% of the total domestic debt.
The Brazilian Annual Borrowing Plan first launched in 2001 has achieved several results, including the lengthening of average FPD maturities and smoothing of its maturity profile. As a result, the average maturity of FPD was 3.51 years in 2010, an increase from the average maturity of 2.96 years in December 2006. Since 2002, the Federal Government has been improving the profile of the federal public debt, reducing its market and refinancing risks. The FPD linked to the exchange-rate was R$150.9 billion (12.2% of total FPD) in December 2006, compared with R$87 billion (5.14% of total FPD) in December 2010. The FPD linked to the floating-rate was R$437.9 billion (35.4% of total FPD) in December 2006, compared with R$535.1 billion (31.6% of total FPD) in December 2010. Of the R$1,694.0 billion in FPD outstanding on December 31, 2010, 23.9% was scheduled to mature within 12 months. According to the Annual Borrowing Plan (Plano Anual de Financiamento), a yearly publication of the National Treasury that shows the financing guidelines for FPD management, the financing requirement for 2011 through FPD is R$422.9 billion.
Securitized Debt
In addition to regular federal domestic securities debt issuances in the form of bills and notes issued by the National Treasury, the Federal Government promoted the assumption and restructuring of liabilities resulting from the sale and closure of State enterprises, subsidies, and adjustments prior to the privatization process, and the creation and division of States. Such liabilities have been restructured to coordinate the maturities and the liability with the payment capacity of the National Treasury, as well as to lengthen the maturity of the public debt and to make transactions more transparent. The aggregate amount of securitized debt as of December 31, 2010 was R$9.1 billion, of which R$8.5 billion is Fundo de Compensação de Variações Salariais, or “FCVS”. See “—Housing Compensation Fund for Salary Fluctuation (Fundo de Compensação de Variações Salariais)”. As of January 31, 2011, the Federal Government estimates the amount yet to be securitized as R$106.0 billion, of which approximately 81.4% is FCVS.
Housing Compensation Fund for Salary Fluctuation (Fundo de Compensação de Variações Salariais)
Beginning in 1967, the Federal Government introduced a series of measures designed to provide subsidies to homeowners to address the effects of high inflation on mortgage rates. These subsidies were implemented in the form of the FCVS, which provided mortgage lenders in Brazil with a credit in an amount equal to the difference between the lender’s actual cost of funds and the amounts that the borrower was legally obligated to pay under the terms of his mortgage. Under the FCVS program, the borrower was absolved of the responsibility to pay the amount guaranteed by the Federal Government, and the lending institution recorded as an asset the amount of the FCVS subsidy receivable. The FCVS program has not covered any mortgages entered into after March 1990. The aggregate amount of the FCVS subsidy constitutes a liability of the Federal Government; the FCVS subsidy is not accounted for as borrowed money and, therefore, is not reflected in the amount of the Republic’s outstanding domestic public indebtedness unless subject to securitization.
In furtherance of the Plano Real’s goals of restructuring the monetary and fiscal policies of the Federal Government to ensure long-term economic stability and growth, the Federal Government announced, in September 1996, a plan to issue securities in exchange for the accumulated liability attributable to the FCVS subsidy. This measure was intended to provide financial institutions holding FCVS assets with an opportunity to exchange such assets for newly issued, liquid, government securities. The liability of the Federal Government for the FCVS subsidy falls into two categories: (i) FCVS liabilities that relate to mortgages on which no further contractual payments are outstanding and which, therefore, are determinate as to principal amount (“determinate FCVS liabilities”); and (ii) potential FCVS liabilities that relate to mortgages on which additional contractual payments are due and under which additional FCVS liabilities may continue to accrue (“potential FCVS liabilities”). As of December 31, 2001, the Federal Government estimated that the aggregate amount of determinate FCVS liabilities would not exceed R$62.6 billion (of which R$46.1 billion was claimed as due and payable by the financial institutions receiving such credits and R$20.3 billion was claimed as payable but not yet due). The amount of the additional potential FCVS liabilities on outstanding mortgages is constantly estimated and revised by the Federal Government, as it is not possible to determine the additional contractual payments. The Federal Government implemented measures designed to reduce its FCVS liabilities generally by instituting auditing and verification procedures to ensure compliance with FCVS program requirements. In addition, the Federal Government’s proposal intended to reduce significantly its exposure for potential FCVS liabilities by offering incentives to homeowners to prepay FCVS loans, and by reducing the rate of interest payable on FCVS obligations.
The Federal Government’s FCVS initiative, as set forth in Law No. 10,150 of December 21, 2000, provides that all properly audited FCVS claims can be exchanged for 30-year Federal Government debt securities denominated in reais. The average rate of interest on such new securities represents a significant reduction from the average rate of interest applicable to the existing FCVS liabilities. The new securities provide for an eight-year grace period on interest payments and a twelve-year grace period on payments of principal. As of December 31, 2010, the Federal Government had issued R$94.4 billion aggregate principal amount in debt
D-73
securities in exchange for audited FCVS claims, and estimated that FCVS liabilities would amount to R$88.3 billion. Although the issuance of securities in exchange for FCVS liabilities could, over time, require the recognition of domestic public sector debt, the Federal Government believes that effective implementation of the auditing and verification procedures required by the new measure should result in a reduction in the aggregate amount of FCVS liabilities eligible for exchange for new securities.
External Debt
On December 31, 2010, Brazil’s consolidated public sector external debt totaled $101.0 billion, or 4.8% of GDP. Approximately $14.9 billion of this debt was owed to commercial banks, $10.9 billion to foreign governments, $34.1 billion to international financial institutions, $41.0 billion to bondholders and $0.1 billion to suppliers and other creditors. The average maturity of Brazil’s public sector external debt was 10.7 years on December 31, 2006, 10.4 years in 2007, 9.9 years in 2008, 10.3 years in 2009 and 10.3 years in 2010.
The following table sets forth details of Brazil’s public sector external debt by type of borrower at the end of the periods indicated.
Table No. 29
Public Sector External Debt by Type of Borrower
| | | | | | | | | | | | | | | | | | | | |
| | | As of December 31, | |
| | | 2006 | | | 2007 | | | 2008 | | | 2009 | | | 2010 | |
| | | (in millions of dollars, except percentages) | |
Central Government | | $ | 63,942 | | | $ | 58,991 | | | $ | 54,373 | | | $ | 54,779 | | | $ | 51,888 | |
Public Entities(1) | | | 21,592 | | | | 21,775 | | | | 25,347 | | | | 25,831 | | | | 49,111 | |
Guaranteed | | | 12,551 | | | | 13,094 | | | | 14,373 | | | | 20,905 | | | | 25,520 | |
Non-Guaranteed | | | 9,041 | | | | 8,661 | | | | 10,973 | | | | 4,926 | | | | 23,590 | |
Total(2) | | $ | 85,533 | | | $ | 80,746 | | | $ | 79,720 | | | $ | 91,222 | | | $ | 100,999 | |
External Debt/GDP (%) | | | 7.9 | % | | | 5.9 | % | | | 4.9 | % | | | 5.8 | % | | | 4.8 | % |
| (1) | Includes indebtedness of the Central Bank, public enterprises, mixed-ownership enterprises, semi-autonomous entities, States and municipalities. |
| (2) | Excludes private sector external debt (i.e., debt with an original maturity of one year or more) totaling $70.5 billion in 2006, $84.9 billion in 2007, $90.4 billion in 2008, $85.0 billion in 2009 and $123.5 billion in 2010. |
Source: Central Bank.
The following table sets forth Brazil’s public sector external debt by type of creditor at the end of the periods indicated.
Table No. 30
Public Sector External Debt by Type of Creditor(1)
| | | | | | | | | | | | | | | | | | | | |
| | | As of December 31, | |
| | | 2006 | | | 2007 | | | 2008 | | | 2009 | | | 2010 | |
| | | (in millions of dollars) | |
Commercial Banks | | $ | 9,111 | | | $ | 8,884 | | | $ | 10,485 | | | $ | 15,253 | | | $ | 14,860 | |
Foreign Governments | | | 3,192 | | | | 3,078 | | | | 3,280 | | | | 3,192 | | | | 10,889 | |
Multilateral Organizations | | | 22,096 | | | | 22,421 | | | | 24,116 | | | | 28,824 | | | | 34,097 | |
Bondholders | | | 50,741 | | | | 46,070 | | | | 41,562 | | | | 43,773 | | | | 41,042 | |
Suppliers | | | 393 | | | | 291 | | | | 277 | | | | 180 | | | | 111 | |
Other | | | 1 | | | | 2 | | | | — | | | | — | | | | — | |
Total | | $ | 85,533 | | | $ | 80,746 | | | $ | 79,720 | | | $ | 91,222 | | | $ | 100,999 | |
| (1) | Debt with an original maturity of one year or more. Includes indebtedness of the Central Bank, public enterprises, mixed-ownership enterprises, semi-autonomous entities, States and municipalities. Excludes private sector external debt (i.e., debt with |
D-74
| | an original maturity of one year or more) totaling $70.5 billion in 2006, $84.9 billion in 2007, $90.4 billion in 2008, $85.0 billion in 2009 and $123.5 billion in 2010. |
Source: Central Bank.
The following table sets forth details of Brazil’s public sector external debt by type of currency at the end of the periods indicated.
Table No. 31
Public Sector External Debt by Type of Currency(1)
| | | | | | | | | | | | | | | | | | | | | | | | | | | | | | | | | | | | | | | | |
| | | As of
December 31,
2006 | | | As of
December 31,
2007 | | | As of
December 31,
2008 | | | As of
December 31,
2009 | | | As of
December 31,
2010 | |
| | | (in
millions) | | | (%) | | | (in
millions) | | | (%) | | | (in
millions) | | | (%) | | | (in
millions) | | | (%) | | | (in
millions) | | | (%) | |
U.S. Dollars | | $ | 47,002 | | | | 55.0 | | | $ | 41,062 | | | | 50.9 | | | $ | 40,452 | | | | 50.7 | | | $ | 46,352 | | | | 50.8 | | | $ | 50,368 | | | | 49.9 | |
Japanese Yen | | | 5,184 | | | | 6.1 | | | | 3,882 | | | | 4.8 | | | | 4,630 | | | | 5.8 | | | | 4,314 | | | | 4.7 | | | | 4,811 | | | | 4.8 | |
Due to World Bank(2) | | | 9,608 | | | | 11.2 | | | | 9,427 | | | | 11.7 | | | | 10,231 | | | | 12.8 | | | | 9,673 | | | | 10.6 | | | | 13,274 | | | | 13.1 | |
Deutsche Marks | | | 1,648 | | | | 1.9 | | | | 769 | | | | 1.0 | | | | 200 | | | | 0.3 | | | | 142 | | | | 0.2 | | | | 90 | | | | 0.1 | |
Due to IDB(2) | | | 12,179 | | | | 14.2 | | | | 12,767 | | | | 15.8 | | | | 13,024 | | | | 16.3 | | | | 13.739 | | | | 15.1 | | | | 14,904 | | | | 14.8 | |
Pounds Sterling | | | 282 | | | | 0.3 | | | | 112 | | | | 0.1 | | | | 139 | | | | 0.2 | | | | 119 | | | | 0.1 | | | | 160 | | | | 0.2 | |
Swiss Francs | | | 5.0 | | | | 0.0 | | | | 4.0 | | | | 0.0 | | | | 3.0 | | | | 0.0 | | | | 2.0 | | | | 0.0 | | | | 0.0 | | | | 0.0 | |
Special Drawing Rights | | | 10 | | | | 0.0 | | | | 9.0 | | | | 0.0 | | | | 7.0 | | | | 0.0 | | | | 4,516 | | | | 5.0 | | | | 4,451 | | | | 4.4 | |
European Currency Units | | | 6,239 | | | | 7.3 | | | | 6,288 | | | | 7.8 | | | | 6,122 | | | | 7.7 | | | | 5,860 | | | | 6.4 | | | | 5,790 | | | | 5.7 | |
Others | | | 3,375 | | | | 3.9 | | | | 6,425 | | | | 8.0 | | | | 4,911 | | | | 6.2 | | | | 6,504 | | | | 7.1 | | | | 7,150 | | | | 7.1 | |
| | | | | | | | | | | | | | | | | | | | | | | | | | | | | | | | | | | | | | | | |
Total | | $ | 85,533 | | | | 100.0 | | | $ | 80,746 | | | | 100.0 | | | $ | 79,720 | | | | 100.0 | | | $ | 91,222 | | | | 100.0 | | | $ | 100,999 | | | | 100.0 | |
| | | | | | | | | | | | | | | | | | | | | | | | | | | | | | | | | | | | | | | | |
| (1) | Total registered external debt. Includes indebtedness of the Central Bank, public enterprises, mixed-ownership enterprises, semi-autonomous entities, States and municipalities. Excludes private sector external debt (i.e., debt with an original maturity of one year or more) totaling $70.5 billion in 2006, $84.9 billion in 2007, $90.4 billion in 2008, $85.0 billion in 2009 and $123.5 billion in 2010. |
| (2) | Consists primarily of Dollars, Yen, Swiss Francs and Deutsche Marks. Beginning in 2004, external debt with multilateral institutions is registered among the currencies based on the percentage that each currency composes of the given basket. |
Source: Central Bank.
D-75
The following table sets forth the amortization schedule of Brazil’s public sector external debt by creditor.
Table No. 32
Public Sector External Debt Amortization Schedule by Creditor(1)
| | | | | | | | | | | | | | | | | | | | | | | | | | | | | | | | | | | | | | | | | | | | |
| | | Outstanding as of December 31, | |
| | | 2010 | | | 2011 | | | 2012 | | | 2013 | | | 2014 | | | 2015 | | | 2016 | | | 2017 | | | 2018 | | | 2019 | | | 2020 and
thereafter | |
| | | (in millions of dollars) | |
Multilateral Organizations | | | 34,097 | | | | 2,389 | | | | 2,882 | | | | 2,251 | | | | 2,061 | | | | 2,217 | | | | 2,018 | | | | 1,861 | | | | 1,625 | | | | 1,502 | | | | 15,290 | |
Commercial Banks | | | 14,860 | | | | 3,700 | | | | 419 | | | | 1,354 | | | | 266 | | | | 1,329 | | | | 331 | | | | 1,158 | | | | 1,129 | | | | 2,119 | | | | 3,056 | |
Foreign Governments | | | 10,889 | | | | 498 | | | | 527 | | | | 497 | | | | 436 | | | | 1,794 | | | | 1,724 | | | | 1,650 | | | | 1,615 | | | | 1,588 | | | | 559 | |
Bondholders | | | 41,042 | | | | 1,863 | | | | 2,144 | | | | 1,083 | | | | 880 | | | | 2,867 | | | | 2,300 | | | | 3,244 | | | | 126 | | | | 3,401 | | | | 23,133 | |
Suppliers | | | 111 | | | | 49 | | | | 29 | | | | 15 | | | | 6 | | | | 5 | | | | 3 | | | | 2 | | | | 1 | | | | — | | | | 0 | |
Other | | | | | | | | | | | | | | | | | | | | | | | | | | | | | | | | | | | | | | | | | | | | |
| | | | | | | | | | | | | | | | | | | | | | | | | | | | | | | | | | | | | | | | | | | | |
Total | | | 100,999 | | | | 8,500 | | | | 6,002 | | | | 5,199 | | | | 3,650 | | | | 8,212 | | | | 6,376 | | | | 7,915 | | | | 4,495 | | | | 8,610 | | | | 42,039 | |
| | | | | | | | | | | | | | | | | | | | | | | | | | | | | | | | | | | | | | | | | | | | |
| (1) | This table includes debt with an original maturity of one year or more. Amortization figures in this table include only scheduled payments on outstanding debt as of December 31, 2010. This table excludes debt past due for 120 days or more, installment debt with three or more installments past due for 120 days or more and intercompany loans. |
Source: Central Bank.
Brazil’s EFPD stood at R$143.5 billion in December 2006 (of which R$112.9 billion were in bonds and R$30.5 billion were in contractual debt), compared with R$90.1 billion in December 2010 (of which R$69.4 billion were in bonds and R$20.7 billion were in contractual debt).
D-76
The following table sets forth details of Brazil’s external public debt by type of bond.
Table No. 33
External Federal Public Debt (R$ billions)
| | | | | | | | | | | | | | | | | | | | |
| | | 2006 | | | 2007 | | | 2008 | | | 2009 | | | 2010 | |
External Federal Public Debt(1) | | | 143.5 | | | | 108.9 | | | | 132.5 | | | | 99.0 | | | | 90.1 | |
Securities | | | 112.9 | | | | 84.6 | | | | 100.9 | | | | 78.9 | | | | 69.4 | |
Global $ | | | 88.1 | | | | 61.8 | | | | 76.4 | | | | 58.7 | | | | 50.4 | |
Global BRL | | | 15.9 | | | | 11.7 | | | | 13.4 | | | | 9.4 | | | | 6.6 | |
Euro | | | 6.7 | | | | 10.8 | | | | 10.8 | | | | 10.6 | | | | 12.2 | |
Bradies(2) | | | 0.5 | | | | 0.3 | | | | 0.4 | | | | 0.2 | | | | 0.2 | |
Other | | | 1.7 | | | | — | | | | — | | | | — | | | | — | |
Contractual | | | 30.5 | | | | 24.3 | | | | 31.6 | | | | 20.1 | | | | 20.7 | |
Multilateral Organisms | | | 24.7 | | | | 20.3 | | | | 26.5 | | | | 16.9 | | | | 16.9 | |
Private Banks/Gov. Agencies | | | 5.9 | | | | 4.0 | | | | 5.1 | | | | 3.2 | | | | 3.8 | |
| (1) | All EFPD values converted to US dollars and then, converted to reais at the spot FX-rate as of the month’s last day. |
| (2) | Refers to the pre-Brady bond (“BIB”), which does not have an embedded call option. |
Source: National Treasury.
Brazil issued $550,000,000 aggregate principal amount of its 4.875% Global Bonds due 2021 on July 14, 2011.
On November 16, 2004, the Brazilian Senate adopted Senate Resolution No. 20, which authorizes, among other things, (i) the issuance abroad of debt securities denominated in reais or a foreign currency and (ii) liability management through repurchases, exchanges and other transactions, including financial derivatives, in each case pursuant to the National Treasury’s Program of Securities Issuance and Management of Liabilities Abroad. The National Treasury is permitted to issue up to an aggregate of $75 billion under this program, subject to subsequent renewals by the Senate. The proceeds of the sale of securities under this program are required to be applied to the payment of the National Treasury’s federal public debt.
In recent years, the National Treasury has concentrated its efforts on fostering issuances and reopenings of securities with benchmark maturities (10 and 30 years) on the global market, with the objective of developing the Brazilian government bonds yield curve. This strategy is designed to ensure enhanced liquidity to Brazilian government securities, favorable in the secondary bond market, which increases trading efficiency and lowers spreads between purchase and sale prices. Along with fostering issuances and reopenings of securities, the National Treasury has conducted liability management operations in order to: a) increase efficiency on the yield curve and reduce refinancing risk at specific points on the yield curve; b) obtain net gains at current value (NPV savings); c) cancel or substitute government securities that were issued during periods of unfavorable market conditions and that paid high coupons. These operations are effected through tender-offers, exchange-offers, buyback operations, or take place in conjunction with new issuances.
There were three segments of liability management operations carried out in the last two decades. The first was the restructuring of the external debt, concluded in 1994 under the Brady Plan’s framework. See “—Debt Restructuring and Debt Record”. Then, in August 2005, the National Tresury held an auction to exchange approximately 80% of C-Bonds, or $4.5 billion, for A-Bonds. In October 2005, the remaining stock of C-Bonds estimated at $1.1 billion was redeemed. On April 18, 2006, the Federal Government redeemed all of its outstanding Brady Bonds (approximately $6.6 billion).
In June 2006, Brazil completed an offer to purchase EFPD securities denominated in dollars and euros consisting of 20 bonds scheduled to mature between 2007 and 2030, with a face-value amount of approximately $1.3 billion. In August 2006, Brazil completed an exchange offer of external debt securities denominated in dollars and maturing in 2020, 2024, 2027 and 2030 for securities maturing in 2037. Approximately $500 million in securities at face value were exchanged.
Also in 2006, Brazil announced a program to repurchase EFPD, which initially covered securities maturing up to 2010, including global bonds, euro bonds, Samurai bonds and Brady Bonds but was later expanded to cover maturities up to 2012. In 2006,
D-77
Brazil repurchased $7.1 billion in market value ($6.1 billion at face value) of EFPD, or approximately one-third of the stock of Brazil’s global bonds and 15% of Brazil’s euro-denominated securities maturing between 2007 and 2012. In 2009, Brazil repurchased approximately $19.7 billion (at face value) of EFPD. In 2010, $2.8 billion in bonds denominated in dollars and €300 million denominated in euro ($4.3 billion) were repurchased.
In 2006, the National Treasury followed the example of the Central Bank, which had prepaid its obligations with the IMF in the previous year, and took steps to improve the profile of the Federal External Contractual Public Debt (“EFPCD”). As a result of external debt renegotiation agreements formalized between 1983 and 1992, the National Treasury prepaid Brazil’s commitments assumed with the Paris Club. Over the course of 2009, the National Treasury carried out two other operations of this type: change of characteristics of part of the debt with multilateral organizations (World Bank and the IDB) in July of 2009 and prepayment of part of the Federal Government debt with the World Bank in December of 2009. Both the World Bank and the IDB allowed amendments to the contracts to convert the interest rates to fixed interest rates, and conversion of principal debt into United States dollars for certain IDB contracts. Considered together, the renegotiation of all the loans generated an interest savings estimated at $77.56 million. The contracts with the IBRD selected for prepayment, totaling approximately $870 million, generated positive financial results at prepayment and had shorter average maturities, lengthening public debt maturity and reducing refinancing risk. Prepayment of part of the debt with the World Bank not only reduced refinancing risk (since the newer bonds were issued with longer average maturities than the prepaid securities), but also represented savings of $16.3 million in interest payments. The various debt exchange operations resulted in reductions in interest rates and greater predictability in the indexing factors applied to EFPCD.
The repurchase program, the prepayment of EFPCD, the prepayments made to the IMF by the Central Bank, as well as the liability management operations conducted by Brazil resulted in a reduction of $37.1 billion in the outstanding Brazilian external debt.
In September 2005, when the fixed rate security with the longest maturity issued on the domestic market was seven years (NTN-F 2012), the National Treasury issued the Global BRL 2016 bond on the international market as the first security based on the yield curve in reais on the external market, in order to take advantage of the enhanced synergy between internal and external debt management. Global BRL 2022 and 2028 were issued in 2006 and 2007, respectively. From December 2004 through July 2005, private issuances denominated in reais averaged approximately R$180 million and were restricted to the banking sector. From September 2005 to July 2007, these operations reached an average volume of approximately R$364 million and included the participation of companies from other sectors of the economy, including Companhia Energética de São Paulo, Companhia de Bebidas das Américas and Rede Brasil Sul.
In 2009, the National Treasury acquired approximately $5.6 billion of foreign currency, enough to pay approximately 73% of the entire external debt due to mature in 2010. The National Treasury acquires the volume of foreign currency required to make all external debt payments forecast for a given year with the aim of avoiding the volatilityin the foreign exchange market.
Debt Management
The National Treasury adopted a series of measures in 2006 aimed at improving FPD management. In the case of the DFPD, the National Treasury took steps to streamline domestic market operations and consolidate the process of opening the market to nonresident investors. To further this change, Law No. 11,312/06 was approved, granting nonresidents an income tax exemption on gains on investments in public domestic debt bonds. This measure aligned Brazil with international practices, particularly among emerging countries. Simultaneously, similar to the impact on other countries, the measure fostered cost reductions and lengthening of debt maturities as a result of greater demand on the part of nonresident investors for longer-term fixed rate and inflation-linked securities. Further, Brazil opted for qualitative alterations in the debt structure, including the Early Redemption Program involving external federal public debt (“EFPD”) bonds, in order to smooth the maturity profile of the short-term debt, as well as tender offers as part of the previously mentioned repurchase program and an offering of 2037 Bonds as part of a privately negotiated exchange offer transaction which occurred in 2006. The overall objective in this case was to improve Brazil’s external debt profile while lengthening average maturity terms. Other measures included exercising the call option of Brady Bonds, thereby eliminating all of these bonds which were related to the debt renegotiation process that marked the early 1990s, together with anticipated payments of liabilities to the Paris Club, generated by renegotiation agreements formalized between 1983 and 1992.
Measures adopted in 2007 which aim to improve DPF management include the creation of the Secondary Securities Market Work Group. Coordinated by the National Association of Financial Market Institutions (Associação Nacional das Instituições do Mercado Financeiro) and the Brazilian Association of Closed Pension Fund Entities (Associação Brasileira das Entidades Fechadas de Previdência Complementar), the working group is composed of representatives of the Central Bank, National Treasury, Brazilian Securities Commission and Government Pension Fund Secretariat. The task of the working group is to strengthen the capital markets segment, deepen debates on the role of institutional investors in the secondary market and increase the liquidity levels of fixed rate securities in Brazil. Also, in order to increase transparency in the negotiations of federal public bonds in the secondary market, the
D-78
Brazilian National Treasury and the Central Bank, through the Joint Normative Act No. 15 dated January 14, 2008, raised the disclosure standards that financial institutions classified as dealers must meet in order to access the National Treasury’s special operations. Specifically, specialist dealers must now post daily, in two turns, bid and ask proposals for each bond that is its object of negotiation. The daily opening spread (the disclosure of bid and ask bond prices) will only be considered in the evaluation criteria if the average yield of the proposals is better or equal to the average yield on each occasion. This measure will allow market participants to have greater knowledge of the prices of the offered bonds, providing more transparency and improving the pricing of the bonds in the primary and secondary markets.
In 2007, the National Treasury issued 10-year fixed rate bonds on the domestic market for the first time, called NTN-F 2017’s. These bonds became the longest term fixed rate domestic debt security, supplanting the NTN-F 2014, which was previously considered the longest term security. The bonds reached R$13.2 billion at the end of the year, confirming its position as a benchmark at that point of the bond yield-curve.
In February 2008, the Central Bank introduced conceptual alterations in the calculation of the General Gross Government Debt (“GGGD”), to be initially applied to the January 2008 data. The alterations include: (i) National Treasury securities in the Central Bank’s portfolio and (ii) repo operations for which the monetary authority is liable. The modifications take into consideration the entire securities debt held by the market since the Treasury securities in the Central Bank’s portfolio are a new monetary policy management industry and do not represent effective fiscal debt. According to the new methodology, GGGD reached 57.4% of GDP on December 31, 2007 (compared to 63.8% as calculated by the old methodology). The new calculation does not affect the net debt to GDP ratio. On December 31, 2010, the General Gross Government Debt declined to 54.7% of GDP from 62.0% of GDP on December 31, 2009.
In 2010, the National Treasury introduced changes into the schedule of auctions and improvements into the dealers system aiming at fostering smooth operation of the public securities market and thereby guaranteeing more efficient FPD financing. The changes adopted in the auctions were made for purposes of stimulating development of the secondary public bond market based on a lesser number of issuer interventions. In this sense, the number of exchange auctions involving fixed-rate bonds and floating-rate bonds (“LFTs”) was reduced, as were auctions utilizing the system of two-stage issuance for inflation-linked bonds (“NTN-B”). Regarding exchanges of fixed-rate bonds and LFT, auctions were scheduled at quarterly intervals instead of the previously scheduled monthly intervals. In the case of NTN-B, the two-stage system started to be used in only one of the monthly auctions.
Debt Restructuring and Debt Record
On July 9, 1992, Brazil and the Bank Advisory Committee, which consisted of nineteen of Brazil’s largest commercial bank creditors, reached an agreement on the restructuring of Brazil’s medium- and long-term public sector indebtedness owed to commercial banks, as well as a parallel arrangement for interest arrears accrued in respect of such indebtedness since January 1, 1991. Pursuant to that agreement, on April 15, 1994, Brazil issued approximately $43.1 billion principal amount of bonds (“Brady Bonds”) to holders of certain medium- and long-term public sector debt (“Eligible Debt”) of Brazil, or guaranteed by Brazil, owed to commercial banks and certain other private sector creditors in consideration for the tender by such holders of their Eligible Debt and interest arrears accrued in respect thereof since January 1, 1991 (“Eligible Interest”). The bonds were issued pursuant to exchange agreements implementing the República Federativa do Brasil 1992 Financing Plan (the “1992 Financing Plan”), which provided for the restructuring of approximately $41.6 billion of Eligible Debt and arrangements for approximately $5.5 billion of Eligible Interest. Brazil’s Financing Plan was a “Brady Plan” restructuring, the term coined for debt restructuring based on the policy articulated by U.S. Treasury Secretary Nicholas Brady in a speech before the Third World Debt Conference in March 1989. The “Brady Plan” provided, among other things, (i) an exchange of debt for freely transferable bonds, (ii) significant reductions in the level of debt and the rate of interest payable thereon, and (iii) collateralized some types of new bonds with the pledge of U.S. Treasury zero-coupon obligations.
On April 18, 2006, the Federal Government redeemed all of its outstanding Brady Bonds. A total of $6.6 billion aggregate principal amount of bonds were redeemed by Brazil on that date.
Since the Brady restructuring in 1992, Brazil has timely serviced its external debt without default.
D-79
TABLES AND SUPPLEMENTARY INFORMATION
Table No. 34
External Direct Debt of the Federal Government
| | | | | | | | | | | | | | | | | | | | | | | | |
| | | | | | | | | | | | | | | Principal Amount(2) | |
Discrimination | | Interest | | | Issue
Date(1) | | | Final Maturity | | | Currencies | | | Amount
Disbursed | | | Outstanding
at
Dec 31, 2010 | |
| | | | | | | | | | | | | | | (in millions of dollars) | |
Multilateral Organizations | | | | | | | | | | | | | | | | | | | | | | | | |
World Bank | | | Various | | | | Various | | | | Various | | | | Various | | | | 8,864 | | | | 6,596 | |
IADB | | | Various | | | | Various | | | | Various | | | | Various | | | | 4,451 | | | | 3,304 | |
Others | | | Various | | | | Various | | | | Various | | | | Various | | | | 21 | | | | 9 | |
| | | Total (Multilateral Organizations) | | | | 13,335 | | | | 9,908 | |
| | | | | | |
Foreign Governments | | | Various | | | | Various | | | | Various | | | | Various | | | | 1,019 | | | | 464 | |
| | | Total (Foreign Governments) | | | | 1,019 | | | | 464 | |
| | | | | | |
Bonds (GLOBAL) | | | | | | | | | | | | | | | | | | | | | | | | |
Global Bond (2011) | | | 10.000 | % | | | 7-aug-03 | | | | 4-aug-11 | | | | USD | | | | 1,250 | | | | 440 | |
Global Bond (2012) | | | 11.000 | % | | | 11-jan-02 | | | | 11-jan-12 | | | | USD | | | | 1,250 | | | | 736 | |
Global Bond (2013) | | | 10.250 | % | | | 17-jun-03 | | | | 17-jun-13 | | | | USD | | | | 1,250 | | | | 792 | |
Global Bond (2014) | | | 10.500 | % | | | 14-jul-04 | | | | 11-jul-14 | | | | USD | | | | 1,250 | | | | 621 | |
Global Bond (2015) | | | 7.875 | % | | | 7-mar-15 | | | | 7-mar-15 | | | | USD | | | | 2,100 | | | | 1,602 | |
Global Bond (2016) | | | 12.500 | % | | | 26-sep-05 | | | | 5-jan-16 | | | | BRL | | | | 2,041 | | | | 2,041 | |
Global Bond (2017) | | | 6.000 | % | | | 14-nov-06 | | | | 13-jan-17 | | | | USD | | | | 2,550 | | | | 2,506 | |
A Bond (2018) | | | 8.000 | % | | | 1-aug-05 | | | | 20-jan-18 | | | | USD | | | | 4,508 | | | | 1,943 | |
Global Bond (2019-N) | | | 5,875 | % | | | 6-jan-09 | | | | 15-jan-19 | | | | USD | | | | 2,300 | | | | 2,300 | |
Global Bond (2019) | | | 8.875 | % | | | 14-oct-04 | | | | 14-oct-19 | | | | USD | | | | 1,500 | | | | 1,101 | |
Global Bond (2020) | | | 12.250 | % | | | 26-jan-00 | | | | 14-jan-20 | | | | USD | | | | 1,000 | | | | 383 | |
Global Bond (2021) | | | 4.875 | % | | | 22-apr-10 | | | | 22-jan-21 | | | | USD | | | | 1,613 | | | | 1,613 | |
Global Bond (2022) | | | 12.500 | % | | | 13-sep-06 | | | | 5-jan-22 | | | | BRL | | | | 1,801 | | | | 1,801 | |
Global Bond (2024) | | | 6.600 | % | | | 16-mar-01 | | | | 14-apr-24 | | | | USD | | | | 2,150 | | | | 1,751 | |
Global Bond (2024-B) | | | 8.875 | % | | | 16-apr-03 | | | | 14- apr-24 | | | | USD | | | | 824 | | | | 664 | |
Global Bond (2025) | | | 8.750 | % | | | 4-feb-05 | | | | 4-feb-25 | | | | USD | | | | 2,250 | | | | 1,648 | |
Global Bond (2027) | | | 10.125 | % | | | 9-jun-97 | | | | 15-may-27 | | | | USD | | | | 3,500 | | | | 2,539 | |
Global Bond (2028) | | | 10.250 | % | | | 14-feb-07 | | | | 10-jan-28 | | | | BRL | | | | 2,933 | | | | 2,860 | |
Global Bond (2030) | | | 12.250 | % | | | 29-mar-00 | | | | 5-mar-30 | | | | USD | | | | 1,600 | | | | 623 | |
Global Bond (2034) | | | 8.250 | % | | | 20-jan-04 | | | | 19-jan-34 | | | | USD | | | | 2,698 | | | | 2,174 | |
Global Bond (2037) | | | 7.125 | % | | | 18-jan-06 | | | | 20-jan-37 | | | | USD | | | | 3,013 | | | | 3,013 | |
Global Bond (2040) | | | 11.000 | % | | | 17-aug-00 | | | | 17-aug-40 | | | | USD | | | | 5,157 | | | | 2,241 | |
Global Bond (2041) | | | 5,625 | % | | | 7-oct-09 | | | | 7-jan-41 | | | | USD | | | | 1,825 | | | | 1,825 | |
| | | Total (“Global”) | | | | 50,362 | | | | 37,214 | |
| | | | | | |
Bonds (EUROS) | | | | | | | | | | | | | | | | | | | | | | | | |
2001 Euro Bond (2011) | | | 9.500 | % | | | 24-jan-01 | | | | 24-jan-11 | | | | EUR | | | | 1,440 | | | | 1,133 | |
2004 Euro Bond (2012) | | | 8.500 | % | | | 24-sep-04 | | | | 24-sep-12 | | | | EUR | | | | 1,440 | | | | 1,118 | |
2005 Euro Bond (2015) | | | 7.375 | % | | | 3-feb-05 | | | | 3-feb-15 | | | | EUR | | | | 1,152 | | | | 1,006 | |
1997 Euro Bond (2017) | | | 11.000 | % | | | 26-jun-97 | | | | 26-jun-17 | | | | ITL | | | | 558 | | | | 478 | |
| | | Total (“Euros”) | | | | 4,589 | | | | 3,735 | |
| | | | | | |
Bonds (Others) | | | | | | | | | | | | | | | | | | | | | | | | |
1989 BIB | | | 6.000 | % | | | 31-08-1989 | | | | 15-09-2013 | | | | USD | | | | 1,050 | | | | 93 | |
TOTAL BONDS | | | Total (Bonds) | | | | 56,002 | | | | 41,042 | |
D-80
| | | | | | | | | | | | | | | | | | | | | | | | |
| | | | | | | | | | | | | | | Principal Amount(2) | |
Discrimination | | Interest | | | Issue
Date(1) | | | Final Maturity | | | Currencies | | | Amount
Disbursed | | | Outstanding
at
Dec 31, 2010 | |
| | | | | | | | | | | | | | | (in millions of dollars) | |
| Commercial Banks | | | | | | | | | | | | | | | | | | | | | | | | |
Import Financing Credits with Guarantee of Foreign Governments | | | Various | | | | Various | | | | Various | | | | Various | | | | 422 | | | | 149 | |
Import Financing Credits without Guarantee of Foreign Governments | | | Various | | | | Various | | | | Various | | | | Various | | | | 504 | | | | 251 | |
Loans | | | Various | | | | Various | | | | Various | | | | Various | | | | 0 | | | | 0 | |
| | | | | | | Total (Commercial Banks) | | | | 927 | | | | 400 | |
| | | | | | |
Others | | | | | | | | | | | | | | | | | | | | | | | | |
Import Financing Credits with Guarantee of Foreign Governments | | | Various | | | | Various | | | | Various | | | | Various | | | | 6 | | | | 2 | |
Import Financing Credits without Guarantee of Foreign Governments | | | Various | | | | Various | | | | Various | | | | Various | | | | 347 | | | | 72 | |
| | | | | | | Total (Others) | | | | 353 | | | | 74 | |
TOTAL | | | | | | | Total Amount | | | | 71,636 | | | | 51,888 | |
| | | | | | | | | | | | | | | | | | | | | | | | |
| (1) | In the case of multiple tranches, the date refers to the first issuance of the security. |
| (2) | Currencies other than U.S. dollars are translated into U.S. dollars by the exchange rate (selling) at December 31, 2010. |
Source: Central Bank.
D-81
Table No. 35
External Debt Guaranteed by the Federal Government
| | | | | | | | | | | | | | | | | | | | | | | | |
| | | Interest | | | Issue Date | | | Final Maturity | | | Currencies | | | Amount
Disbursed | | | Principal
Amount(1)
Outstanding
at
December 31,
2010 | |
| | | | | | | | | | | | | | | (in millions of dollars) | |
I. To Public Entities | | | | | | | | | | | | | | | | | | | | | | | | |
Multilateral Organizations | | | | | | | | | | | | | | | | | | | | | | | | |
World Bank | | | Various | | | | Various | | | | Various | | | | Various | | | | 7,910 | | | | 6,454 | |
Inter-American Development Bank | | | Various | | | | Various | | | | Various | | | | Various | | | | 13,367 | | | | 11,182 | |
International Monetary Fund (IMF) | | | Various | | | | Various | | | | Various | | | | Various | | | | 4,446 | | | | 4,446 | |
Others | | | Various | | | | Various | | | | Various | | | | Various | | | | 330 | | | | 259 | |
| | | | | | | | | | | | | | | | | | | | | | | | |
| | | | | | | Total (Multilateral Organizations) | | | | | | | | 22,341 | |
| | | | | | |
Foreign Governments | | | | | | | | | | | | | | | | | | | | | | | | |
Import Financing Credits | | | Various | | | | Various | | | | Various | | | | Various | | | | 1,025 | | | | 454 | |
Original Loans | | | Various | | | | Various | | | | Various | | | | Various | | | | 1,816 | | | | 1,047 | |
| | | | | | | | | | | | | | | | | | | | | | | | |
| | | | | | | Total (Foreign Governments) | | | | | | | | 1,501 | |
| | | | | | |
Commercial Banks | | | | | | | | | | | | | | | | | | | | | | | | |
Import Financing Credits with Guarantee of Foreign Governments | | | Various | | | | Various | | | | Various | | | | Various | | | | 100 | | | | 35 | |
Import Financing Credits without Guarantee of Foreign Governments | | | Various | | | | Various | | | | Various | | | | Various | | | | 531 | | | | 294 | |
Loans | | | Various | | | | Various | | | | Various | | | $ | | | | | 1,328 | | | | 1,000 | |
| | | | | | | | | | | | | | | | | | | | | | | | |
| | | | | | | Total (Commercial Banks) | | | | | | | | 1,330 | |
| | | | | | |
Other | | | | | | | | | | | | | | | | | | | | | | | | |
Loans | | | Various | | | | Various | | | | Various | | | | Various | | | | | | | | | |
Total (Other) | | | | | | | | | | | | | | | | | | | | | | | | |
| | | | | | | Total for Public Entities | | | | | | | | 25,172 | |
| | | | | | |
II. To Private Companies | | | | | | | | | | | | | | | | | | | | | | | | |
(Including Privatized Companies) | | | Various | | | | Various | | | | Various | | | | Various | | | | 1,106 | | | | 454 | |
III. Intercompany Loans | | | | | | | | | | | | | | | | | | | | | | | | |
| | | Various | | | | Various | | | | Various | | | | Various | | | | 190 | | | | 10 | |
| | | | | | | Total for Private Entities | | | | | | | | 464 | |
| | | | | | | | | | | | | | | | | | | | | | | | |
| | | Total for Public and Private Entities | | | | | | | | 25,636 | |
| | | | | | | | | | | | | | | | | | | | | | | | |
| (1) | Currencies other than U.S. dollars are translated into U.S. dollars by the exchange rate (sell side) at December 31, 2010. |
Source: Central Bank.
D-82
Table No. 36
Internal Securities Debt of the Republic
Outstanding on December 31, 2010
| | | | | | | | | | | | |
Name | | Index(1) | | Interest
Rate | | Issuance Date | | Final Maturity | | Outstanding
Amount(3)
(millions of $) | |
National Treasury Letters (NTL) | | Fixed | | (2)% | | Various (Oct 2008– Dec 2010) | | Various (Jan 2011– Apr 2013) | | $ | 212,882 | |
National Treasury Notes (NTN) | | | | | | | | | | | | |
A Series | | $ | | 6% | | Various (Dec 1997– Nov 2000) | | Various (Sep 2013– Apr 2024) | | $ | 4,237 | |
B Series | | IPCA | | 6% | | Various (Mar 2002– Dec 2010) | | Various (May 2011– Aug 2050) | | $ | 230,769 | |
C Series | | IGP-M | | 6% and 12% | | Various (Jan 2001– Dec 2006) | | Various (Mar 2011– Jan 2031) | | $ | 39,773 | |
D Series | | $ | | 6% and 12% | | Various (Jan 2001– Jun 2003) | | Various (Feb 2006– Jul 2008) | | $ | 0 | |
F Series | | Fixed | | 10% | | Various (Jun 2005– Dec 2010) | | Various (Jan 2011– Jan 2021) | | $ | 154,740 | |
I Series | | $ | | 0% and 12% | | Various (Mar 1997– Apr 2001) | | Various (Jan 2011– Sep 2023) | | $ | 680 | |
P Series | | TR | | 6% | | Various (Jan 1997– Jan 2009) | | Various (Jun 2011– Jan 2025) | | $ | 452 | |
National Treasury Bonds | | TR | | 6% | | Mar 2002 | | Various (Mar 2011– Sep 2013) | | $ | 10 | |
Financial Treasury Letters (FTL) | | Overnight | | — | | Various (Dec 2002– Dec 2010) | | Various (Mar 2011– Mar 2017) | | $ | 311,411 | |
A Series | | Overnight | | 0.0245%(4) | | Various (May 1998– Jun 2000) | | Various (May 2013– Jun 2015) | | $ | 1,528 | |
B Series | | Overnight | | — | | Various (Set 2000– Dec 2010) | | Various (Jan 2011– Sep 2015) | | $ | 186 | |
National Treasury Certificate (CTN) | | IGP-M | | 12% | | Various (May 1998– Aug 2004) | | Various (May 2018– Aug 2024) | | $ | 3,659 | |
Financial Treasury Certificate (CFT) | | | | | | | | | | | | |
A Series | | IGP-DI | | 6% and 12% | | Various (Sep 1998– Set 2005) | | Various (Jan 2011– Sep 2028) | | $ | 2,639 | |
B Series | | TR | | 6% | | Various (Jan 1997– Jan 2006) | | Various (Jan 2027– Jan 2036) | | $ | 10 | |
D Series | | $ | | 0% and 6% | | Various (Apr 2000– Apr 2002) | | Jan 2016–May 2031 | | $ | 677 | |
E Series | | IGP-M | | Various | | Various (Dec 2000– Jan 2010) | | Various (Mar 2011– Jan 2040) | | $ | 902 | |
Securitized Credits | | IGP-DI | | Various | | Various (Jun 1998– Jan 1999) | | (Jan 2011–Jan 2023) | | $ | 345 | |
| | INPC | | Various | | Jun 1998 | | (Jul 2015) | | $ | 6 | |
| | TR | | Various | | Jan 1997–Jun 1998 | | Various (Jan 2011– Jan 2027) | | $ | 5,108 | |
Public Debt Certificate (CDP) | | TR | | Various | | (Mar 1998-Mar 2002) | | Various (Mar 2028– Mar 2032) | | $ | 0 | |
Agrarian Debt Securities (TDA) | | TR | | Various | | Various | | Various (Jan 2006– | | $ | 2,476 | |
D-83
| | | | | | | | | | | | |
Name | | Index(1) | | Interest
Rate | | Issuance Date | | Final Maturity | | Outstanding
Amount(3)
(millions of $) | |
| Total | | | | | | | | Dec 2025) | | $ | 972,490 | |
| | | | | | | | | | | | |
| (1) | Securities indexed to each indicated rate/index: |
Overnight = Central Bank’s overnight rate
IGPM = General Price Index (market based)
$ = U.S. dollar exchange rate
TR = Index based on average daily rate of certificates of deposit issued by certain major Brazilian banks
TJLP = Long-term interest rate index
| (2) | Zero-coupon securities issued at a discount from their face amount. |
| (3) | Exchange rate (selling rate) at December 31, 2010 (R$1.6662=$1.00). |
| (4) | Monthly interest rate. |
Source: National Treasury Secretariat (STN).
D-84

September 30, 2011
VIA EDGAR
Securities and Exchange Commission
Office of Filings and Information Services
100 F Street, NE
Washington, DC 20549
| | |
| Re: | | Federative Republic of Brazil |
| | Annual Report on Form 18-K |
Ladies and Gentlemen:
On behalf of the Federative Republic of Brazil (“Brazil”), we enclose for filing under the Securities Exchange Act of 1934, as amended, in accordance with the no-action letter dated May 15, 1997 issued by the Staff to Brazil, Brazil’s Annual Report on Form 18-K for the year ended December 31, 2010 (the “Annual Report”). Please note that Exhibit C to the Annual Report, Brazil’s 2011 Annual Budget, was filed on September 29, 2011 as a paper format exhibit under cover of Form SE, in accordance with Rule 306(c) of Regulation S-T under the Securities Act of 1933, as amended.
If you have any questions or comments with regards to this filing, please call the undersigned at (202) 942-5000.
|
| Very truly yours, |
|
/s/ Gregory Harrington |
Gregory Harrington |
D-85