Exhibit D
TABLE OF CONTENTS
| | | | |
INTRODUCTION | | | D-1 | |
| |
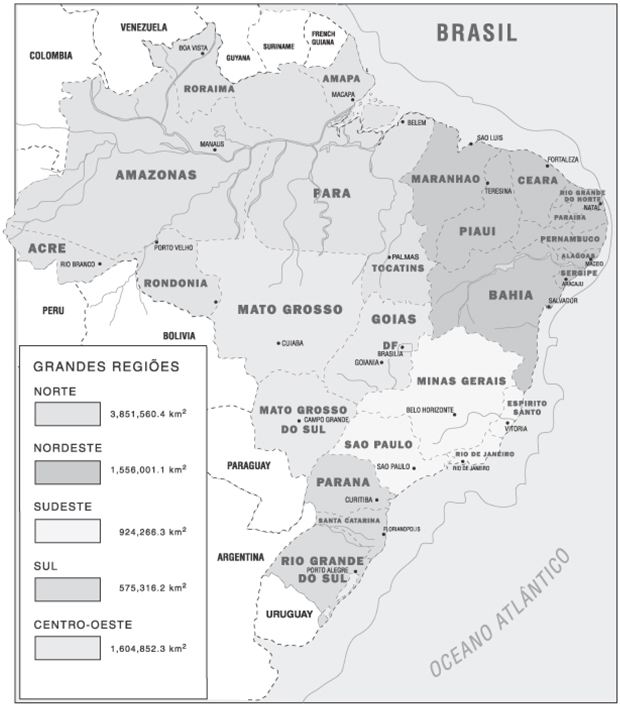
MAP OF BRAZIL | | | D-2 | |
| |
SUMMARY | | | D-3 | |
| |
THE FEDERATIVE REPUBLIC OF BRAZIL | | | D-5 | |
Area, Population and Society | | | D-5 | |
Form of Government and Political Parties | | | D-7 | |
Foreign Affairs and Membership in International Organizations | | | D-8 | |
| |
THE BRAZILIAN ECONOMY | | | D-10 | |
Historical Background | | | D-10 | |
The 2012-2015 Multi-Year Plan | | | D-10 | |
The Brazilian Economy in 2012 | | | D-12 | |
Gross Domestic Product | | | D-13 | |
Prices and Wages | | | D-15 | |
Employment and Labor | | | D-17 | |
State-Controlled Enterprises | | | D-18 | |
Environment | | | D-19 | |
Education | | | D-20 | |
Wealth and Income Distribution | | | D-21 | |
Antitrust Law | | | D-21 | |
Incentives for Private Investment | | | D-22 | |
| |
PRINCIPAL SECTORS OF THE ECONOMY | | | D-25 | |
Industry | | | D-25 | |
Services | | | D-26 | |
Agriculture and Livestock | | | D-29 | |
| |
BALANCE OF PAYMENTS AND FOREIGN TRADE | | | D-31 | |
Balance of Payments | | | D-31 | |
Foreign Trade | | | D-32 | |
Foreign Investment | | | D-38 | |
International Reserves | | | D-39 | |
Foreign Exchange Rates and Exchange Controls | | | D-40 | |
Swap Transactions | | | D-41 | |
| |
THE FINANCIAL SYSTEM | | | D-43 | |
General | | | D-43 | |
Institutional Framework | | | D-43 | |
Monetary Policy and Money Supply | | | D-44 | |
Limitation of Public Sector Debt | | | D-46 | |
Public Sector Financial Institutions | | | D-46 | |
Private Sector Financial Institutions | | | D-47 | |
Regulation by Central Bank | | | D-47 | |
| | | | |
Securities Markets | | | D-51 | |
| |
PUBLIC FINANCE | | | D-53 | |
Consolidated Public Sector Fiscal Performance | | | D-53 | |
Budget Process | | | D-55 | |
2013 Budget | | | D-56 | |
Taxation and Revenue Sharing Systems | | | D-59 | |
Sovereign Fund | | | D-60 | |
Fiscal Responsibility Law and Fiscal Crime Law | | | D-61 | |
| |
PUBLIC DEBT | | | D-63 | |
General | | | D-63 | |
Legal Aspects: Public Debt Regulation and Taxation | | | D-68 | |
Contingent Liabilities | | | D-70 | |
Public Sector External Debt | | | D-70 | |
External Federal Public Debt | | | D-72 | |
Advances in External Debt Management | | | D-75 | |
Advances in Domestic Debt Management | | | D-75 | |
External Debt Restructuring and Debt Record | | | D-77 | |
| |
TABLES AND SUPPLEMENTARY INFORMATION | | | D-78 | |
INTRODUCTION
This description of the Federative Republic of Brazil (“Brazil” or the “Republic”) is dated as of August 27, 2013 and appears as Exhibit D to the Republic’s Annual Report on Form 18-K to the U.S. Securities and Exchange Commission for the fiscal year ended December 31, 2012. In this report, references to “dollars”, “U.S. dollars”, “U.S.$” and “$” are to United States dollars, and references to “real”, “reais” and “R$” are to Brazilian reais. The fiscal year of the federal government of Brazil (the “Federal Government”) ends December 31 of each year. The fiscal year ended December 31, 2012 is referred to herein as “2012”, and other years are referred to in a similar manner. Tables herein may not add due to rounding.
The following table sets forth certain exchange rate information reported by the Central Bank for the sale of U.S. dollars, expressed in nominal reais, for the periods indicated. The Federal Reserve Bank of New York does not report a noon buying rate for the real.
Table No. 1
Commercial Exchange Rates (Sell Side)
R$/$1.00
| | | | | | | | | | | | |
Year | | Average for
Period(1) | | | End of
Period | | | Percentage
Change
(End of
Period) | |
| | | |
2008 | | | 1.8375 | | | | 2.337 | | | | 31.9 | |
2009 | | | 1.9935 | | | | 1.7412 | | | | –25.5 | |
2010 | | | 1.7593 | | | | 1.6662 | | | | –4.3 | |
2011 | | | 1.6746 | | | | 1.8758 | | | | 12.6 | |
2012 | | | 1.955 | | | | 2.0435 | | | | 8.9 | |
| (1) | Weighted average of the exchange rates on business days during the period. |
Source: BCB.
The Brazilian real-U.S. dollar exchange rate (sell side), as published by the Central Bank of Brazil was R$ 2.4457 to U.S.$1.00 on August 22, 2013.
D-1
MAP OF BRAZIL
D-2
SUMMARY
The following summary does not purport to be complete and is qualified in its entirety by the more detailed information appearing elsewhere herein.
Table No. 2
SELECTED BRAZILIAN ECONOMIC INDICATORS
| | | | | | | | | | | | | | | | | | | | |
| | | 2008 | | | 2009 | | | 2010 | | | 2011 | | | 2012 | |
The Economy | | | | | | | | | | | | | | | | | | | | |
| | | | | |
Gross Domestic Product (“GDP”): | | | | | | | | | | | | | | | | | | | | |
(in billions of current Brazilian reais) | | R$ | 3,032.20 | | | R$ | 3,239.40 | | | R$ | 3,770.08 | | | R$ | 4,143.01 | | | R$ | 4,402.54 | |
(in U.S.$ billions current prices)(1) | | $ | 1,650.9 | | | $ | 1,625.6 | | | $ | 2,143.9 | | | $ | 2,475.1 | | | $ | 2,252.6 | |
Real GDP Growth (decline)(2) | | | 5.2 | % | | | (0.3 | )% | | | 7.5 | % | | | 2.7 | % | | | 0.9 | % |
Population (millions) | | | 189.6 | | | | 191.5 | | | | 193.3 | | | | 194.9 | | | | 196.5 | |
| | | | | |
GDP Per Capita(3) | | U.S.$ | 8,706,68 | | | U.S.$ | 8,489,82 | | | U.S.$ | 11,093,88 | | | U.S.$ | 12,696,1 | | | U.S.$ | 11,462,22 | |
Unemployment Rate(4) | | | 6.8 | % | | | 6.8 | % | | | 5.3 | % | | | 4.7 | % | | | 4.6 | % |
IPCA (rate of change)(5) | | | 5.9 | % | | | 4.3 | % | | | 5.9 | % | | | 6.5 | % | | | 5.8 | % |
IGP-DI (rate of change)(6) | | | 9.1 | % | | | (1.4 | )% | | | 11.3 | % | | | 5.0 | % | | | 8.1 | % |
Nominal Devaluation Rate(7) | | | 31.9 | % | | | (25.5 | )% | | | (4.3 | )% | | | 12.6 | % | | | 8.9 | % |
Domestic Real Interest Rate(8) | | | 6.20 | % | | | 5.38 | % | | | 3.66 | % | | | 4.80 | % | | | 2.50 | % |
| | | | | |
Balance of Payments (in U.S.$ billions) | | | | | | | | | | | | | | | | | | | | |
Exports | | | 197.9 | | | | 153.0 | | | | 201.9 | | | | 256.0 | | | | 242.6 | |
Imports | | | (173.1 | ) | | | (127.7 | ) | | | (181.8 | ) | | | (226.2 | ) | | | (223.2 | ) |
Current Account | | | (28.2 | ) | | | (24.3 | ) | | | (47.3 | ) | | | (52.5 | ) | | | (54.2 | ) |
Capital and Financial Account (net) | | | 29.4 | | | | 71.3 | | | | 99.9 | | | | 112.4 | | | | 70.2 | |
Overall Balance (Change in Reserves) | | | 3.0 | | | | 46.7 | | | | 49.1 | | | | 58.6 | | | | 18.9 | |
Total Official Reserves | | | 193.8 | | | | 238.5 | | | | 288.58 | | | | 352.01 | | | | 378.61 | |
| | | | | |
Public Finance (% of GDP) | | | | | | | | | | | | | | | | | | | | |
Central Government Primary Balance(9) | | | 2.4 | % | | | 1.3 | % | | | 2.1 | % | | | 2.3 | % | | | 2.0 | % |
Consolidated Public Sector Primary Balance(10) | | | 3.4 | % | | | 2.0 | % | | | 2.7 | % | | | 3.1 | % | | | 2.4 | % |
| | | | | |
Federal Public Debt (in R$ billions) | | | | | | | | | | | | | | | | | | | | |
Domestic Federal Public Debt (DFPD or DPMFi) | | R$ | 1,264.82 | | | R$ | 1,398.42 | | | R$ | 1,603.94 | | | R$ | 1,783.06 | | | R$ | 1,916.71 | |
External Federal Public Debt (EFPD or DPFe) | | R$ | 132.51 | | | R$ | 98.97 | | | R$ | 90.10 | | | R$ | 83.29 | | | R$ | 91.28 | |
Federal Public Debt as % of Nominal GDP | | | 46.1 | % | | | 46.2 | % | | | 44.9 | % | | | 45.0 | % | | | 45.6 | % |
Total Federal Public Debt (in R$ billions)(11) | | R$ | 1,397.34 | | | R$ | 1,497.39 | | | R$ | 1,694.00 | | | R$ | 1,866.35 | | | R$ | 2,007.98 | |
General Government Gross Debt (GGGD or DBGG) (in R$ billions)(12) | | R$ | 1,740.88 | | | R$ | 1,973.42 | | | R$ | 2,011.52 | | | R$ | 2,243.60 | | | R$ | 2,583.95 | |
DBGG as % of GDP | | | 57.4 | % | | | 60.9 | % | | | 53.4 | % | | | 54.2 | % | | | 58.7 | % |
| | | | | |
Public Sector Net Debt (NPSD or DLSP) (in R$ billions)(13) (14) | | R$ | 1,168.24 | | | R$ | 1,362.71 | | | R$ | 1,475.82 | | | R$ | 1,508.55 | | | R$ | 1,550.08 | |
DLSP as % of GDP | | | 38.5 | % | | | 42.1 | % | | | 39.2 | % | | | 36.4 | % | | | 35.2 | % |
| (1) | Converted into U.S. dollars based on the weighted average exchange rate for each year. |
| (2) | Calculated based upon current Brazilian reais. |
| (3) | Not adjusted for purchasing power parity. |
| (4) | Unemployment in the metropolitan areas of Rio de Janeiro, São Paulo, Belo Horizonte, Porto Alegre, Salvador and Recife at the end of the relevant period. |
D-3
| (5) | The Extended National Consumer Price Index (Índice de Preços ao Consumidor Amplo or “IPCA”) as reported by the National Bureau of Geography and Statistics (Fundação Instituto Brasileiro de Geografia e Estatística or “IBGE”). |
| (6) | The General Price Index-Domestic Supply (Índice Geral de Preços-Disponibilidade Interna or “IGP-DI”) is one indicator of inflation. While many inflation indicators are used in Brazil, the IGP-DI, calculated by the Getúlio Vargas Foundation, an independent research organization, is one of the most widely utilized indices. |
| (7) | Year-over-year percentage appreciation of the U.S. dollar against the Brazilian real (sell side). |
| (8) | Brazilian federal treasury securities deflated by the IPCA and adjusted at each month-end to denote real annual yield. |
| (9) | The Central Government consists of the National Treasury Secretariat, the Social Security System (“RGPS”) and the Central Bank. The Consolidated Public Sector consists of the Central Government, Regional Governments and Public Enterprises, except Petrobras and Eletrobras. |
| (10) | Primary results represent Government revenues less Government expenditures, excluding interest expenditures on public debt. |
| (11) | Total Federal Public Debt announced by the National Treasury Secretariat. |
| (12) | The General Government Gross Debt (“GGGD”) pertains to that of the federal, State and municipal governments, both with the private sector and the public financial sector. However, debts that are the responsibility of state-owned companies (at the three levels of government) are not covered by the GGGD category. Although the Central Bank is not an entity whose liabilities figure in this indicator, its open-market operations committed to the financial sector are classified as general government debt. |
| (13) | The Net Public Sector Debt (“NPSD”) refers to the total obligations of the non-financial public sector deducted from its financial assets held by non-financial private agents as well as public and private financial agents. For Brazil, unlike for many other countries, net debt includes Central Bank assets and liabilities including, among other items, international reserves (assets) and the monetary base (liabilities). |
| (14) | NPSD is the main indebtedness indicator used by the Brazilian government when making economic policy decisions and, as compared to GGGD, more adequately reflects the dynamics of public liabilities and the government’s fiscal efforts, which are shown by the consolidated primary balance at all levels. For example, in its fiscal reports, the federal government generally focuses on the NPSD/GDP ratio, and includes in its Budgetary Guidelines Law (“LDO”) an annual estimate of this indicator’s evolution for the current year and three subsequent years, based on its expectations about real interest rates, economic growth and primary surplus targets for the whole public sector. |
Sources: IBGE; Getúlio Vargas Foundation; Central Bank; National Treasury Secretariat
D-4

THE FEDERATIVE REPUBLIC OF BRAZIL
Area, Population and Society
Brazil is the fifth largest country in the world and occupies nearly half the land area of South America, sharing borders with every country in South America except Chile and Ecuador. Brazil is officially divided into five regions consisting of 26 States and the Federal District, where the Republic’s capital, Brasília, is located. The official language of Brazil is Portuguese.
Brazil has one of the most extensive river systems in the world. The dense equatorial forests and semi-arid plains of the North are drained by the Amazon River and the fertile grasslands of the South by the Paraná, Paraguay and Uruguay Rivers. Other river systems drain the central plains of Mato Grosso and the hills of Minas Gerais and Bahia. Most of the country lies between the Equator and the Tropic of Capricorn, and the climate varies from tropical to temperate. More than half of the total terrain of Brazil consists of rolling highlands varying from 650 to 3,000 feet in altitude.
According to the demographic census conducted by the IBGE in 2010, Brazil had an estimated population of 193.3 million that year. The IBGE estimated that Brazil’s population as of December 31, 2012 was 196.5 million. The average age of the Brazilian population, as reported by IBGE in its 2010 Population Census, was 32.1 years. The following table sets forth the age distribution of the Brazilian population as of 2010:
Brazilian Population Distribution by Sex, According to Age Groups
| | | | | | | | | | | | | | | | |
Age | | Number of
Men | | | Percentage of
Men | | | Number of
Women | | | Percentage of
Women | |
0 - 4 years | | | 7,016,987 | | | | 3.7 | % | | | 6,779,172 | | | | 3.6 | % |
5 - 9 years | | | 7,624,144 | | | | 4.0 | % | | | 7,345,231 | | | | 3.9 | % |
10 - 14 years | | | 8,725,413 | | | | 4.6 | % | | | 8,441,348 | | | | 4.4 | % |
15 - 19 years | | | 8,558,868 | | | | 4.5 | % | | | 8,432,002 | | | | 4.4 | % |
20 - 24 years | | | 8,630,227 | | | | 4.5 | % | | | 8,614,963 | | | | 4.5 | % |
25 - 29 years | | | 8,460,995 | | | | 4.4 | % | | | 8,643,418 | | | | 4.5 | % |
30 - 34 years | | | 7,717,657 | | | | 4.0 | % | | | 8,026,855 | | | | 4.2 | % |
35 - 39 years | | | 6,766,665 | | | | 3.5 | % | | | 7,121,916 | | | | 3.7 | % |
40 - 44 years | | | 6,320,570 | | | | 3.3 | % | | | 6,688,797 | | | | 3.5 | % |
45 - 49 years | | | 5,692,013 | | | | 3.0 | % | | | 6,141,338 | | | | 3.2 | % |
50 - 54 years | | | 4,834,995 | | | | 2.5 | % | | | 5,305,407 | | | | 2.8 | % |
55 - 59 years | | | 3,902,344 | | | | 2.0 | % | | | 4,373,875 | | | | 2.3 | % |
60 - 64 years | | | 3,041,034 | | | | 1.6 | % | | | 3,468,085 | | | | 1.8 | % |
65 - 69 years | | | 2,224,065 | | | | 1.2 | % | | | 2,616,745 | | | | 1.4 | % |
70 - 74 years | | | 1,667,373 | | | | 0.9 | % | | | 2,074,264 | | | | 1.1 | % |
75 - 79 years | | | 1,090,518 | | | | 0.6 | % | | | 1,472,930 | | | | 0.8 | % |
80 - 84 years | | | 668,623 | | | | 0.4 | % | | | 998,349 | | | | 0.5 | % |
85 - 89 years | | | 310,759 | | | | 0.2 | % | | | 508,724 | | | | 0.3 | % |
90 - 94 years | | | 114,964 | | | | 0.1 | % | | | 211,595 | | | | 0.1 | % |
95 - 99 years | | | 31,529 | | | | 0.0 | % | | | 66,806 | | | | 0.0 | % |
Over 100 years | | | 7,247 | | | | 0.0 | % | | | 16,989 | | | | 0.0 | % |
Source: IBGE
D-5
IBGE also estimated that, as of 2010, the population was growing at a rate of 1.17% per year. Approximately 160.9 million people, or 84.4% of the population, live in urban areas. According to the 2010 Census, the largest cities in Brazil were São Paulo and Rio de Janeiro, with estimated populations of 11.2 million and 6.3 million, respectively. Other cities with populations in excess of one million were Brasília, Belém, Belo Horizonte, Curitiba, Fortaleza, Goiânia, Manaus, Porto Alegre, Recife and Salvador. The States with the largest GDP in Brazil, São Paulo, Rio de Janeiro and Minas Gerais, had populations in excess of 41.2 million, 15.9 million and 19.5 million, respectively.
According to the United Nations’ Human Development Report Office, Brazil has made significant progress in improving social welfare over the past three decades. During that period, life expectancy in Brazil increased by 18.1% (from 62.5 years in 1980 to 73.8 years in 2012) and the infant mortality rate decreased 67.8% (from 59 per 1,000 live births in 1990 to 19 per 1,000 live births in 2010). Adjusted for purchasing power parity by the International Monetary Fund, real GDP per capita rose 200.87% from 1980 ($3,760.62) to 2010 ($11,314.41). In addition, the reduction in inflation under the Plano Real and the consequent diminution of the erosion of purchasing power have improved the social welfare of large numbers of lower-income Brazilians.
The following table sets forth comparative GDP per capita figures and other selected comparative social indicators for 2011.
Table No. 3
Social Indicators
| | | | | | | | | | | | | | | | | | | | |
| | | Brazil | | | Chile | | | Colombia | | | Mexico | | | U.S. | |
Real GDP per capita(1) | | $ | 11,634.1 | | | $ | 21,000.6 | | | $ | 10,076.3 | | | $ | 16,012.8 | | | $ | 48,112.6 | |
Life expectancy at birth (years)(2) | | | 73.4 | | | | 79.0 | | | | 73.6 | | | | 76.9 | | | | 78.6 | |
Infant mortality rate (per 1,000 births)(2) | | | 13.9 | | | | 7.7 | | | | 15.4 | | | | 13.4 | | | | 6.4 | |
Adult literacy rate(3) | | | 90.3 | % | | | 98.6 | % | | | 93.4 | % | | | 93.1 | % | | | n.a. | |
| (1) | GDP per capita estimates here are derived from purchasing power parity (PPP) calculations with current international $. Data presented is for 2011. |
| (2) | Data presented is for the most recent year available (2011). |
| (3) | Data presented is for the most recent year available (2009 for Brazil and Chile, 2010 for Colombia and Mexico). |
Source: World Bank.
D-6
Form of Government and Political Parties
Brazil is a democratic state with a civilian led government. The current Brazilian Constitution (Constituição da República Federativa do Brasil or the “Constitution”) was adopted in 1988. Brazil is a federative republic with broad powers granted to the Federal Government. The Constitution provides for three independent branches of government: an executive branch headed by the President; a legislative branch consisting of the bicameral National Congress of Brazil (Congresso Nacional do Brasil or the “National Congress”), composed of the Chamber of Deputies and the Senate; and a judicial branch consisting of the Federal Supreme Court (Supremo Tribunal Federal) and lower federal and State courts.
Under the Constitution, the President is elected by direct vote, and the President and certain other elected officials may be re-elected for a second term. The President’s powers include the right to appoint ministers and key executives in selected administrative posts. The President may issue provisional measures (medidas provisórias) with the same scope and effect as legislation enacted by the National Congress. However, the Constitution prohibits the issuance of provisional measures for, among other things, the implementation of multi-year plans and budgets, the seizure of financial or other assets, and the regulation of matters that the Constitution specifically requires the National Congress to regulate through complementary law. Provisional measures are enforceable for up to 60 days and are extendable for a single additional period of 60 days. If a provisional measure is rejected or if it is not approved by the National Congress within the enforcement period, the provisional measure becomes invalid as of the date it was issued. The Constitution expressly prohibits the re-issuance of provisional measures not approved by the National Congress within the enforcement period.
In October 2010, the Workers’ Party (Partido dos Trabalhadores or “PT”) candidate, Dilma Vana Rousseff, was elected as Brazil’s first female president. She took office on January 1, 2011, replacing outgoing president Luiz Inácio Lula da Silva. In December 2010, President Rousseff announced that her administration would be based on democratic principles and would continue the goal of eradicating poverty with the Brazil Without Poverty Plan (Plano Brasil Sem Miséria).
The legislative branch of the Federal Government consists of a bicameral National Congress composed of the Senate and the Chamber of Deputies. The Senate has 81 senators, elected for staggered eight-year terms, and the Chamber of Deputies has 513 deputies, elected for concurrent four-year terms. Each State and the Federal District is entitled to three senators. The number of deputies from each State is generally proportional to the size of its population. However, each State, regardless of size, is entitled to have a minimum of 8 deputies and a maximum of 70 deputies. This quasi-proportional system assures smaller States (whether by size or population) an important role in the National Congress.
During the October 2010 elections, 513 federal deputies and 54 of 81 senators were elected, taking office on February 1, 2011. Following the October 2010 elections, the coalition of political parties supporting President Rousseff obtained 59% (304/513) of the seats in the Chamber of Deputies and 62% (50/81) of the seats in the Senate. As of July 31, 2013, 70% (359/513) of the seats in the Chamber of Deputies and 77% (62/81) of the seats in the Senate were held by parties that support President Rousseff. Senator Renan Calheiros and Deputy Henrique Eduardo Alves, both allied to President Rousseff, are the current presidents of the Senate and of the Chamber of Deputies, respectively.
Judicial power is exercised by the Federal Supreme Court (composed of 11 justices), the Superior Court of Justice (composed of 33 justices), the Federal Regional Courts (appeals courts), military courts, labor courts, electoral courts and several lower federal courts. The Federal Supreme Court, whose members are appointed for life by the President (with mandatory retirement at 70 years of age), has ultimate appellate jurisdiction over decisions rendered by lower federal and State courts on Constitutional matters.
Brazil is divided administratively into 26 States and the Federal District. The States are designated as autonomous entities within the federative union and have all powers that the Constitution does not preclude the States from exercising. The Constitution reserves to the Federal Government the exclusive power to legislate in certain areas, including, among others, monetary systems, foreign affairs and trade, social security and national defense. The States may exercise legislative power in matters not reserved exclusively to the Federal Government and have, concurrently with the Federal Government, certain powers of taxation. At the State level, executive power is exercised by governors elected for four-year terms and legislative power by State deputies, also elected for four-year terms. Judicial power at the State level is vested in State courts, and appeals of State court judgments may be taken to the Superior Court of Justice and the Federal Supreme Court.
Brazil has recently experienced a wave of mass demonstrations against various levels of government. The protests began in early June 2013 in response to an increase in bus fares in the city of São Paulo, and reached a peak in late June 2013, with simultaneous protests in many urban centers. According to newspaper reports, up to 1 million people demonstrated in more than 100 Brazilian cities on June 20, 2013, protesting in support of political and tax reform and improved public services (including health, education and transportation). While the wave of demonstrations has abated, smaller, sporadic protests continue in major cities.
D-7
As a result of these protests, President Rousseff initially proposed a constitutional assembly to review Brazil’s political system, which proposal was later withdrawn. President Rousseff has instead proposed a national plebiscite on how Brazilians would like to change the political system, including with respect to public financing of campaigns, the abolition of secret ballots in Congress and the rules that govern political alliances. The President also proposed a R$50 billion urban transportation spending plan and increased spending on health and education, while at the same time committing the Government to fiscal responsibility. Following the protests, the Government’s public approval rating fell.
The protests are likely to have a negative impact on Brazilian economic and financial conditions in the short term. The magnitude of this impact is still unknown. In the long term, protests may contribute to strengthening Brazilian democracy and producing more efficient controls and accountability over public services.
Foreign Affairs and Membership in International Organizations
Brazil maintains diplomatic and trade relations with almost every nation in the world. It has been a member of the United Nations since 1945. The Republic participates in the organizations under the control of the United Nations Secretariat, as well as others of a voluntary character, such as the Food and Agriculture Organization.
Brazil is an original member of the International Monetary Fund (“IMF”) and the World Bank, as well as three affiliates of the World Bank: the International Finance Corporation, the International Development Association and the Multilateral Investment Guaranty Agency. Brazil was an original member of the General Agreement on Tariffs and Trade (“GATT”) and is a charter member of the World Trade Organization. In addition, Brazil is an original member of the Inter-American Development Bank (“IDB”), the Inter-American Investment Corporation, the African Development Bank Group and the International Fund for Agricultural Development.
Brazil is an active member of the Group of Twenty, or G-20, which is the premier forum for international cooperation on the most important aspects of international economic and financial issues. It brings together the world’s major advanced and emerging economies.
Brazil is also a member of the Brazil-Russia-India-China-South Africa (“BRICS”) group. The last BRICS summit took place in South Africa, on March 27, 2013, with an overarching theme of “BRICS and Africa: Partnership for Development, Integration and Industrialisation.” This event was the fifth since the BRICS group was formed in 2009.
At the regional level, Brazil participates in the Organization of American States (“OAS”) and in several sub-regional organizations under the OAS, as well as in the Latin American Economic System, the Latin American Integration Association, the Andean Development Corporation, the Financial Fund for the Development of the River Plate Basin and the Southern Common Market (Mercado Comum do Sul or “Mercosul”). Brazil is also a member state of the Union of South American Nations (União das Nações Sul-Americanas or “UNASUR”).
In March 1991, Brazil, Argentina, Paraguay and Uruguay signed the Treaty of Asunción, formally establishing Mercosul. In December 1994, the four member countries signed an agreement establishing the date of January 1, 1995 for the implementation of a Common External Tariff (“CET”) intended to transform the region into a customs union. On June 29, 2012, Paraguay was suspended from Mercosul following the impeachment of Paraguay’s president by the Paraguayan Senate. The suspension resolution provided that Paraguay’s suspension would be lifted once its democratic government had been restored. After the Paraguayan national elections were held on April 21, 2013, the Mercosul Secretariat released a communiqué on April 23, 2013, stating that “through democratic election of its public officials, in full recognition of the rule of law and under the observance of all constitutional guarantees, the Republic of Paraguay moves towards its reintegration into Mercosul.” Paraguay’s suspension from Mercosur was lifted on August 15, 2013, upon the inauguration of a new constitutional government in Paraguay. However, Paraguayan officials have expressed reservations about reincorporating into Mercosul, citing concerns about the propriety of Paraguay’s suspension in 2012 and the admission of Venezuela as a full member of Mercosul during Paraguay’s suspension. On July 31, 2012, Venezuela was admitted to Mercosul as its fifth full member. If Paraguay had not been suspended at the time, Paraguay could have consented to, or vetoed, the admission of Venezuela as a full member of Mercosul.
D-8
On December 7, 2012, Bolivia signed a Mercosur incorporation protocol to become a full member of Mercosul. The protocol sets forth the requirements that Bolivia must meet to attain full membership, which may only take place after the legislatures of the full members in good standing ratify the protocol. In addition to the full member countries, Mercosul has four associate members: Chile, Colombia, Ecuador and Peru. Associate members are included in free trade treaties but have no voting rights within Mercosul.
At the London G-20 meeting on April 2, 2009, former President da Silva announced Brazil’s intention to assist international efforts to confront the global financial crisis by contributing substantial funding to the IMF. On June 10, 2009, the Minister of Finance, Guido Mantega, announced that Brazil would lend $10 billion to the IMF, which is approximately the amount of Brazil’s quota in the IMF. The closing of this loan was conditioned upon the issuance of notes by the IMF and final negotiation of the related New Agreement to Borrow (“NAB”). The NAB was signed between Brazil and the IMF on January 22, 2010, and the IMF issued notes to Brazil in exchange for the $10 billion loan.
In March 2011, ten bilateral agreements were signed between Brazil and the United States. The ten agreements address several strategic areas of bilateral cooperation, including trade and economic cooperation (establishing the Brazil-United States Commission on Economic and Trade Relations, with the objective of promoting bilateral economic and trade cooperation), air transportation, peaceful use of outer space, support for large sports events (the FIFA World Cup and the Olympic Games), research in biodiversity, development of a biofuel for aviation and technical cooperation with other countries.
On March 26, 2013, Brazil and China signed a Memorandum of Understanding on Bilateral Cooperation on Macroeconomic, Fiscal and Financial Policies. The memorandum aims to strengthen macroeconomic, fiscal, financial, monetary and supervisory cooperation between Brazil and China, through both bilateral and multilateral initiatives. The Central Bank of Brazil and the People’s Bank of China announced the establishment of a bilateral currency swap of R$60 billion, or CNY190 billion, for an initial period of three years. This program seeks to facilitate bilateral trade between the two countries.
D-9
THE BRAZILIAN ECONOMY
Historical Background
The Brazilian economy experienced high inflation during the late 1980s and early 1990s. This prompted the Federal Government to pursue a series of stabilization plans, which were mostly ineffective. In December 1993, the Federal Government announced a new stabilization program, known as the Plano Real, which proved to be effective in terms of curtailing inflation and building a foundation for sustained economic growth. The Plano Real was also designed to address persistent deficits in the Federal Government’s accounts, expansive credit policies and widespread, backward-looking indexation.
The Plano Real was very successful in reducing Brazilian inflation from hyperinflation, fighting indexation and adopting monetary austerity. Largely as a result of the measures implemented under the Plano Real, the average monthly rate of inflation dropped significantly; the annual rate of inflation for 1994 fell to 916.5%, down from 2,477.1% in 1993. The public sector operational balance also showed a surplus of 1.3% of GDP in 1994, versus a surplus of 0.2% of GDP in 1993.
However, after only a few years, in 1998, the fixed exchange rate was threatened by an adverse global economic environment and a fragile fiscal policy. In early 1999, due to market pressures, the Federal Government announced that the real would float. In July 1999, the Federal Government formally adopted inflation targeting as its monetary policy framework. After a successful start in 1999 and 2000, the Republic was unable to meet inflation targets between 2001 and 2003. In each year since 2005, the Central Bank has kept annual inflation within the limits determined by the National Monetary Council (“CMN”), a target of 4.5%, with a tolerance interval of plus or minus two percentage points.
To stabilize its foreign exchange market, in 1999 Brazil renegotiated a standby loan facility with the IMF. With the facility, Brazil was able to reduce its balance of payments funding needs while the exchange market stabilized. In 2005, Brazil decided not to renew its credit facility and paid all outstanding amounts to the IMF. As a result, Brazil is no longer a debtor of the IMF. Indeed following its April 9, 2009 G-20 London summit announcement, Brazil has become a lender and net provider of resources to the IMF.
Maintenance of a Fiscal Primary Balance surplus has contributed to the success of Brazil’s monetary policy. In each year from 2000 through 2012, the Federal Government achieved its Fiscal Primary Balance target, which is set in Brazil’s annual budget and adjusted by amendment as circumstances require. In 2009 and 2010, during the international financial crisis, the Federal Government met the adjusted targets of 1.93% and 2.5% of GDP, respectively. In 2012, due to a drop in tax revenue collections, increased tax exemptions and the inability of Brazil’s regional governments to meet their fiscal targets, the Federal Government adjusted its Fiscal Primary Balance target to 2.4% of GDP.
The 2012-2015 Multi-Year Plan
The 2012-2015 Multi-Year Plan (the 2012-2015 Plano Plurianual or “PPA”), called the More Brazil Plan (Plano Mais Brasil), outlines anticipated challenges and prospects for the Republic over the four year period. Specifically, the More Brazil Plan discusses development initiatives, the creation of jobs and income, the mass consumption market, public investments (particularly in infrastructure) and Brazil’s growing strength in international affairs.
In the 2012-2015 PPA, the following 11 macro challenges were defined to guide Federal Government policies embodied in government programs.
1. National Development Project: give continuity to the National Development Project, which aims at reducing regional inequalities, rural and urban disparities, and continue the transition to more sustainable productivity, leading to job creation and income distribution. The Federal Government’s agenda includes improvement of programs like Brazil without Poverty (Brasil Sem Miséria), Family Grant (Bolsa Família), the Education Development Plan (Plano de Desenvolvimento da Educação) and the Growth Acceleration Program (“PAC”). For additional information on the Education Development Plan, please see “—Education” below.
2. Extreme Poverty Eradication: overcome extreme poverty and continue to reduce social inequality. Since 2004, Brazil has been experiencing an unprecedented cycle of development, by combining economic growth with a reduction of inequality.
D-10
As a result, 28 million people no longer live in absolute poverty, and 36 million have ascended to the middle class. However, there are still 16 million people living in extreme poverty. To change that, the Brazil without Poverty Plan was created, promoting social and productive inclusion of the share of the population classified as extremely poor.
3. Science, Technology and Innovation: consolidate science, technology and innovation as a framework for Brazilian economic development. This challenge can be divided into four main goals: minimize technological disparity; assist Brazil’s international inclusion; stimulate the development of the green and creative economy; aid the eradication of poverty and reduce social inequality.
4. Knowledge, Education and Culture: provide access to education, knowledge, culture and sports, ensuring quality and equity, and valuing diversity. The National Education Plan, which will last until 2020, includes several goals, such as raising enrollment and attendance rates in several stages and types of education; improving the quality of the basic levels of education; training and enhancing the skills of more teachers and professors; encouraging full-time education; increasing literacy; and increasing public investment in education. The 2012-2015 Multi-Year Plan will serve as a stepping stone to achieve the National Education Plan’s goals, building a systemic view of the educational policies and commitments.
5. Health Care, Social Security and Social Assistance: facilitate universal access to health care, social security and social assistance, to achieve equity and an improved quality of life. Advancements in this area will be crucial to improving social welfare by 2015.
6. Civic engagement and belonging: increase civic engagement and a sense of belonging, promoting gender and ethnic equality, respecting the diversity of human relations, and improving the quality of public services, as well as expanding access to them.
7. Infrastructure: expand and improve the quality of productive, urban and social infrastructures to achieve integration within Brazil and with South America. The election of Brazil as the host for the 2014 FIFA World Cup, and Rio de Janeiro as the host for the 2016 Olympic and Paralympic Games will also stimulate the development of the country’s logistics infrastructure. The ports and airports sectors will benefit directly from the expansion and recovery of their infrastructure. Both public and private investments in the ports and airports that will cater to both events will benefit the country not only during those events: their legacy will be of great importance to the country’s development.
8. Democracy and Social Engagement: strengthen democracy, stimulate social participation and increase the transparency of public actions. This challenge represents the strong commitment of the Federal Government to social participation, by creating conditions to guarantee equal opportunities to every citizen.
9. National Integrity and Sovereignty: preserve constitutional powers, territorial integrity and national sovereignty; actively participate in the promotion and defense of human rights, peace and global development.
10. Public Security: promote citizen safety and integrity by tackling violence and developing a culture of peace. One of the main challenges is dealing with more troubled urban spaces, typical of larger cities. The PPA places particular emphaisis on border security, given that the borders constitute a major gateway for organized crime, drugs, weapons and smuggling. The major sporting events Brazil will host in coming years are another concern, due to the large number of people that will be expected to attend. For those events, the Federal Government must focus efforts, specifically on special training, police intelligence and the infrastructure of public security institutions.
11. Public Management: improve the tools for public management, endorsing ethics in the public service and improving the quality of services provided for citizens.
Governmental planning for the four years included in the Multi-Year Plan 2012-2015, presented in the “Programs, Objectives, Targets and Initiatives” section, suggests an investment of over R$5.4 trillion. The resources to finance the 2012-2015 Multi-Year Plan come from the Annual Budget, the State-Owned Companies Investment Budget and Extra Budget Funds (tax waivers, State-Owned Companies global expenditures plans, Government Credit Agencies and Public Private Partnerships).
Of the resources allotted for social policies, R$1.4 trillion will be directed to the Social Security Program and, in the four year period of the Multi-Year Plan, 57% of the resources for Themed Programs will be designated for Social Themed Programs. One of them is the Brazil without Poverty Program, with a budget of around R$20 billion a year to benefit several programs, such as the Family Grant (Bolsa Família), which will extend the benefits already granted to 13 million families to another 800,000 families in a situation of extreme poverty.
D-11
In the area of infrastructure, Brazil is making investments in its geological Pre-Salt layer, which should place it among the five countries with the largest oil reserves by 2020. Taking into account only the Pre-Salt areas under concession, it is estimated that the country will add between 35 and 40 billion barrels in oil reserves. Other noteworthy investments are to reach the production rate of 3.1 million barrels of oil per day; build two million houses with the My House, My Life Program (Minha Casa, Minha Vida); provide electric power for 495,000 rural homes, through the Light For All Program (Luz para Todos); build and adapt 14,700 km of roads and 4,500 km of railroads; dredge and improve waterway access in 17 ports; and adapt airport infrastructure in order to double the annual passenger handling capacity and reach 305 million per year.
The main goals of the Federal Government’s productive agenda are to increase investment, raise the aggregate value of Brazil’s domestic industry, raise the share of GDP attributable to high and medium-high technology industries, and increase Brazil’s domestic industry share in energy markets. In the area of environmental development, the budget provides for environmental applications associated with the preservation of the remaining native vegetation in various biomes, as well as the consolidation of already deforested areas into productive areas.
The Brazilian Economy in 2012
During 2012, public sector management analysts concluded that the ongoing international financial crisis would have a dampening impact on global inflation. At the same time, Brazil’s current inflation showed signs of a downward trend, making it possible for Brazil to continue employing a flexible monetary policy. Domestic economic indicators released in the first quarter of the year demonstrated that a slow global economy had an impact on Brazil’s economy through several channels, as exemplified by deteriorations in trade, investment and credit flows. Of particular importance were uncertainties related to the solvency of countries in the Euro Zone and economic recovery in the United States. Fragile political and economic conditions surrounding these issues produced a highly restrictive economic environment in the early months of 2012. Despite some progress in coping with financial difficulties, particularly European Central Bank (“ECB”) liquidity operations, concerns that economic woes would spread to advanced economies in the Euro Zone persisted and contributed to deepening perceptions of risk in the second quarter of the year. Although no major market ruptures occurred, the first half of the year was characterized by intense volatility.
In March 2012, Brazil’s 2011 GDP result was announced, leading to perceptions that monetary policy would have to be more expansionary than previously thought. As a result, the Monetary Policy Committee (“COPOM”) continued with its trend of deploying an expansionary monetary policy by adopting interest rate (Selic) reductions of 50 basis points and 75 basis points at its January and March meetings, respectively. After these reductions, the basic interest rate (Selic) was 9.75% per year.
As part of its efforts to meet the primary balance target, the Federal Government set aside a total of R$55 billion for debt reduction in its 2012 budget. Despite this, the extension of tax reductions, designed to stimulate the economy, partially offset the Federal Government’s efforts to meet the target. The overall objective of these measures was to produce a favorable interest rate and inflationary environment, while still reducing public debt.
In addition, concerns about global liquidity persisted in early 2012 as a result of the more flexible monetary policies adopted by foreign economies important to Brazil. To limit the impact of these economic pressures, the Federal Government adopted a new foreign exchange policy, coupled with additional measures designed to maintain a balanced budget.
At the start of the second quarter of 2012, the Federal Government announced new incentive policies, including a payroll tax reduction for labor-intensive industrial sectors and changes to the rules governing savings account earnings. These changes removed an important institutional barrier to further interest rate reductions, as the earnings of saving accounts (which are fixed and tax-free) compete to attract funds important to monetary policy and Brazil’s financial system.
In the second quarter, as economic indicators suggested that the Brazilian economy was unable to maintain consistent growth, the Federal Government continued adopting policies to bolster the automotive sector and the capital goods industry, segments that otherwise would be directly impacted by a deepening international economic crisis. In conjunction with these measures, tepid economic activity in Brazil resulted in lower government revenues, making it more difficult for the Federal
D-12
Government to meet the 2012 primary surplus target. External macroeconomic indicators, coupled with the balance of inflationary risks and the still uncertain pace of domestic economic activity led COPOM to again reduce the basic interest rate (Selic) by 75 basis points and 50 basis points at its April and May meetings, respectively. After these reductions, the Selic rate was 8.50% per year.
At the end of the third quarter of 2012, the Brazilian economy showed signs of recovery, including: (i) an increase in consumption levels; (ii) improvements in both the labor and credit markets; and (iii) both leading and coincident indicators that suggested Brazil’s third quarter GDP would expand at a rate of 4% year-over-year. Still, the pace of investment growth in Brazil raised concerns. There was a growing perception that COPOM’s cycle of greater monetary policy flexibility was nearing its end, particularly in light of concerns about inflation. The basic interest rate (Selic) at the end of the third quarter was 7.50% per year, following COPOM’s decision to reduce the rate by 50 basis points at each of its July and August meetings.
Fiscally, forecasts that the primary balance would fall short of the budgeted target did not result in expectations that the Federal Government would fail to reduce the overall public debt. As a result the Federal Government continued enacting costly structural changes, including: (i) authorizing reductions in electricity rates for families and industries; (ii) granting fiscally sound States permission to increase their indebtedness, mainly to encourage investments in infrastructure; and (iii) broadening the list of sectors considered eligible for payroll tax reductions, as a way of reducing labor costs and making Brazilian companies more competitive.
In October 2012, COPOM decided to reduce the Selic rate by 25 basis points to 7.25% per year, thus ending the monetary loosening cycle, which had resulted in aggregate reductions of 525 basis points since August 2011. In reducing the Selic rate, COPOM stressed its view that keeping monetary conditions stable for a prolonged period was the most effective means of ensuring that inflation would converge to its target. Viewed as a whole, both leading and coincident indicators of domestic activity affirmed that the Brazilian economy was responding appropriately to the monetary and fiscal incentive measures adopted in 2012.
However, in light of the fiscal challenges faced by the Federal Government, the Ministry of Finance decided to deduct PAC expenses, as permitted by the LDO, to make the 2012 primary balance target more attainable. Lower than expected tax revenue throughout 2012 was the principal factor in the Ministry of Finance’s decision.
A key economic policy change in 2012 involved a shift in Brazil’s foreign exchange policy. As the global economy worsened, excessively flexible monetary policies adopted around the world exacerbated a rise in international market liquidity and intensified potentially destabilizing financial flows into economies like Brazil. In light of this trend, the Ministry of Finance and the Central Bank were concerned about excess risk and volatility entering the Brazilian economy, and they adopted specific measures through taxation and spot or futures market operations. These measures resulted in depreciation of the exchange rate from R$1.70 to $1.00 in the first quarter to an exchange rate of between R$2.00 to $1.00 and R$2.10 to $1.00 in the final quarter of 2012.
Despite a slowdown in Brazil’s domestic economic activity, foreign direct investment continued flowing into its economy during 2012. This was the principal source of financing for Brazil’s current account deficit, continuing the trend observed in recent years. Brazil’s international reserves reached the highest level in history in 2012, surpassing U.S.$370 billion, which is more than Brazil’s total public and private external debt.
Finally, in light of the obstacles to economic growth in Brazil throughout 2012, the Federal Government adopted a series of measures designed to bolster investment and productivity. The measures were not only anti-cyclical in nature, but also structural and designed for the long-term, capable of generating positive impacts on Brazil’s economy for years to come. In 2012, the Federal Government continued to prioritize the expansion of investment which it believes, when taken together with other factors (lower real interest rates, more competitive exchange rates and tax reductions), will strengthen the Brazilian economy through a period of international economic uncertainty.
Gross Domestic Product
Brazil’s GDP increased 0.9% in 2012, relative to 2011, as a result of increases in value added at basic prices (0.8%) and net taxes on products (1.6%). The services sector increased by 1.7% in 2012, relative to the previous year, while the industrial
D-13
and agricultural sectors decreased by 0.8% and 2.3%, respectively, in 2012 relative to 2011. Gross Fixed Capital Formation (investments in manufacturing plants, machinery and capital equipment) decreased by 4.0%; household consumption rose by 3.1%; and general government consumption expenditure rose 3.2% in 2012 relative to 2011. Brazil’s GDP for the first quarter of 2013 increased 0.6% relative to the fourth quarter of 2012 and 1.9% relative to the first quarter of 2012,
On March 14, 2013, the Federal Government launched a program know as the Inova Empresa Plan (“IEP”). Through IEP, the Federal Government will invest an estimated R$32.9 billion to boost productivity and competitiveness in various sectors of the economy through technological innovation. The funds, to be used in 2013 and 2014, will benefit companies of all sizes in the industrial, agricultural and service sectors. The agencies administering the program are the National Bank of Economic and Social Development (“BNDES”) and the Studies and Projects Financing Agency (“FINEP”), which is linked to Brazil’s Ministry of Science, Technology and Innovation. Of the total amount to be invested, R$23.5 billion is earmarked for seven strategic areas: Agriculture and Agribusiness; Energy; Oil and Gas; Health; Defense; Information and Communication Technology; and Environmental Sustainability. Another R$5 billion will be invested in comparable activities for companies operating in non-strategic sectors and small businesses. The funds will finance research and development activities towards incremental innovation and product and process engineering, including research, development and innovation infrastructure projects. The remaining R$4.4 billion will come from the National Petroleum Agency (Agência Nacional do Petróleo or “ANP”), the National Electricity Agency (Agência Nacional de Energia Elétrica or “ANEEL”) and the Brazilian Service for Support for Micro and Small Enterprises (Serviço Brasileiro de Apoio às Micro e Pequenas Empresas or “SEBRAE”). The funds will finance innovations in the oil and gas and renewable energy industries and will support micro and small businesses.
The following table sets forth Brazil’s GDP at current prices and expenditures for each of the years indicated.
Table No. 4
Gross Domestic Product at Current Prices(1)—In Billions of Reais (R$)
| | | | | | | | | | | | | | | | | | | | | | | | | | | | | | | | | | | | | | | | |
Gross Domestic Product at Current Prices (1) — In Billions of Reais (R$) | |
| | | 2008 | | | 2009 | | | 2010 | | | 2011 | | | 2012 | |
| | | R$ | | | % | | | R$ | | | % | | | R$ | | | % | | | R$ | | | % | | | R$ | | | % | |
Final Consumption | | | 2,398.9 | | | | 79.1 | | | | 2,666.8 | | | | 82.3 | | | | 3,046.0 | | | | 80.8 | | | | 3,356.1 | | | | 81.0 | | | | 3,689.0 | | | | 83.8 | |
Gross Capital Formation | | | 627.5 | | | | 20.7 | | | | 577.8 | | | | 17.8 | | | | 763.0 | | | | 20.2 | | | | 817.3 | | | | 19.7 | | | | 776.5 | | | | 17.6 | |
Gross Fixed Capital Formation | | | 579.5 | | | | 19.1 | | | | 585.3 | | | | 18.1 | | | | 733.7 | | | | 19.5 | | | | 798.7 | | | | 19.3 | | | | 798.7 | | | | 18.1 | |
Changes in Inventories | | | 48.0 | | | | 1.6 | | | | (7.5 | ) | | | (0.2 | ) | | | 29.3 | | | | 0.8 | | | | 18.5 | | | | 0.4 | | | | (22.2 | ) | | | (0.5 | ) |
Exports of Goods and Services | | | 414.3 | | | | 13.7 | | | | 355.7 | | | | 11.0 | | | | 409.9 | | | | 10.9 | | | | 492.6 | | | | 11.9 | | | | 552.8 | | | | 12.6 | |
Less: Imports of Goods and Services | | | 408.5 | | | | 13.5 | | | | 360.8 | | | | 11.1 | | | | 448.8 | | | | 11.9 | | | | 523.0 | | | | 12.6 | | | | 615.8 | | | | 14.0 | |
Gross Domestic Product | | | 3,032.2 | | | | 100.0 | | | | 3,239.4 | | | | 100.0 | | | | 3,770.1 | | | | 100.0 | | | | 4,143.0 | | | | 100.0 | | | | 4,402.5 | | | | 100.0 | |
| (1) | Figures stated in accordance with revised methodology. In March 2007, IBGE revised its methodology for calculating GDP and restated its historic GDP data dating back to 1995. Under the new methodology, a broader range of sources of information is used to provide a more accurate measure of Brazil’s GDP. Sources such as IBGE’s annual survey of economic segments, tax receipts information and household surveys are utilized to calculate GDP. As a result, activities that were previously estimated under the prior methodology, such as government consumption and financial intermediation, are now actually measured. In addition, the relative weights of economic activities were adjusted to give greater importance to services such as telecommunications and transportation. |
Source: IBGE
D-14
The following tables set forth the share of GDP by sector at current prices and real growth at current prices by sector for each of the years indicated.
Table No. 5
Share of GDP by Sector at Current Prices
| | | | | | | | | | | | | | | | | | | | |
| | | 2008 | | | 2009 | | | 2010 | | | 2011 | | | 2012 | |
Agriculture | | | 5.9 | % | | | 5.6 | % | | | 5.3 | % | | | 5.5 | % | | | 5.2 | % |
Industry | | | 27.9 | % | | | 26.8 | % | | | 28.1 | % | | | 27.5 | % | | | 26.3 | % |
Mining, Oil and Gas | | | 3.2 | % | | | 1.8 | % | | | 3.0 | % | | | 4.1 | % | | | 4.3 | % |
Manufacturing | | | 16.6 | % | | | 16.6 | % | | | 16.2 | % | | | 14.6 | % | | | 13.3 | % |
Construction | | | 4.9 | % | | | 5.3 | % | | | 5.7 | % | | | 5.8 | % | | | 5.7 | % |
Public Utilities | | | 3.1 | % | | | 3.1 | % | | | 3.2 | % | | | 3.1 | % | | | 3.1 | % |
Services | | | 66.2 | % | | | 67.5 | % | | | 66.6 | % | | | 67.0 | % | | | 68.5 | % |
Retail Services | | | 12.5 | % | | | 12.5 | % | | | 12.5 | % | | | 12.6 | % | | | 12.7 | % |
Transportation | | | 5.0 | % | | | 4.8 | % | | | 5.0 | % | | | 5.1 | % | | | 5.3 | % |
Communications | | | 3.8 | % | | | 3.6 | % | | | 3.2 | % | | | 3.0 | % | | | 2.9 | % |
Financial Services(1) | | | 6.8 | % | | | 7.2 | % | | | 7.5 | % | | | 7.4 | % | | | 7.0 | % |
Government(2) | | | 15.8 | % | | | 16.3 | % | | | 16.2 | % | | | 16.3 | % | | | 16.9 | % |
Rental Services | | | 8.2 | % | | | 8.4 | % | | | 7.8 | % | | | 7.9 | % | | | 8.2 | % |
Other Services | | | 14.1 | % | | | 14.7 | % | | | 14.3 | % | | | 14.5 | % | | | 15.5 | % |
Value Added at Basic Prices | | | 100,0 | % | | | 100,0 | % | | | 100,0 | % | | | 100,0 | % | | | 100,0 | % |
Taxes | | | 17.5 | % | | | 15.9 | % | | | 16.8 | % | | | 17.3 | % | | | 17.7 | % |
GDP | | | 117.5 | % | | | 115.9 | % | | | 116.8 | % | | | 117.3 | % | | | 117.7 | % |
| (1) | Financial intermediation. complementary social security and related services |
| (2) | Includes Public Education, Health and Administration |
Source: IBGE
Table No. 6
Real Growth (Decline) at Current Prices by Sector
| | | | | | | | | | | | | | | | | | | | |
| | | 2008 | | | 2009 | | | 2010 | | | 2011 | | | 2012 | |
Real GDP | | | 5.2 | % | | – | 0.3 | % | | | 7.5 | % | | | 2.7 | % | | | 0.9 | % |
Agriculture and Livestock | | | 6.3 | % | | – | 3.1 | % | | | 6.3 | % | | | 3.9 | % | | – | 2.3 | % |
Industry | | | 4.1 | % | | – | 5.6 | % | | | 10.4 | % | | | 1.6 | % | | – | 0.8 | % |
Mining, Oil and Gas | | | 3.5 | % | | – | 3.2 | % | | | 13.6 | % | | | 3.2 | % | | – | 1.1 | % |
Manufacturing | | | 3.0 | % | | – | 8.7 | % | | | 10.1 | % | | | 0.1 | % | | – | 2.5 | % |
Construction | | | 7.9 | % | | – | 0.7 | % | | | 11.6 | % | | | 3.6 | % | | | 1.4 | % |
Public Utilities | | | 4.5 | % | | | 0.9 | % | | | 8.1 | % | | | 3.8 | % | | | 3.6 | % |
Services | | | 4.9 | % | | | 2.1 | % | | | 5.5 | % | | | 2.7 | % | | | 1.7 | % |
Retail Services | | | 6.1 | % | | – | 1.0 | % | | | 10.9 | % | | | 3.4 | % | | | 1.0 | % |
Transport | | | 7.0 | % | | – | 3.6 | % | | | 9.2 | % | | | 2.8 | % | | | 0.5 | % |
Communications | | | 8.8 | % | | | 0.8 | % | | | 3.7 | % | | | 4.9 | % | | | 2.9 | % |
Government | | | 0.9 | % | | | 3.0 | % | | | 2.3 | % | | | 2.3 | % | | | 2.8 | % |
Financial Intermediation | | | 12.6 | % | | | 7.8 | % | | | 10.0 | % | | | 3.9 | % | | | 0.5 | % |
Rental Services | | | 1.8 | % | | | 2.6 | % | | | 1.7 | % | | | 1.4 | % | | | 1.3 | % |
Other Services | | | 4.3 | % | | | 3.2 | % | | | 3.7 | % | | | 2.3 | % | | | 1.8 | % |
| | | 2008 | | | 2009 | | | 2010 | | | 2011 | | | 2012 | |
Source: IBGE.
Prices and Wages
Since the adoption of the Plano Real in July 1994, Brazil reduced inflation from a high of 2,477.1% per annum in 1993 to much lower single-digit rates. The implementation of the inflation targeting regime by the Central Bank in June 1999 also contributed to a relatively stable rate of inflation since that time.
D-15
The following table sets forth principal price indices for the periods indicated.
Table No. 7
Extended National Consumer Price Index (IPCA)
| | | | | | |
| | | | | IPCA | |
Period | | | | Trailing
12 Months | |
2008 | | December | | | 5.9 | |
| | |
2009 | | December | | | 4.3 | |
| | |
2010 | | December | | | 5.9 | |
| | |
2011 | | December | | | 6.5 | |
| | |
2012 | | December | | | 5.2 | |
| | |
2013 | | June | | | 6.7 | |
| (1) | IPCA is the official price index adopted to verify results under Brazil’s inflation targeting regime. The index is released by IBGE. |
Source: IBGE.
For 2012 the target was 4.5%, with a tolerance interval of plus or minus 2.0 percentage points. The inflation rate, as measured by the Extended National Consumer Price Index (“IPCA”), rose 5.9% in 2008, 4.3% in 2009, 5.9% in 2010, 6.5% in 2011 and 5.8% in 2012. For 2013, 2014 and 2015, the inflation target is 4.5%, with a tolerance interval of plus or minus 2.0 percentage points.
In the first half of 2013, the twelve-month inflation measured by the IPCA reached 6.70%, 1.78% higher than the twelve-month inflation recorded in the first half of 2012. Inflation growth was due to an acceleration in market prices, which presented a cumulative increase of 8.28% over the trailing 12-month period ended June 30, 2013 (2.94% higher than the cumulative increase recorded over the trailing 12-month period ended June 30, 2012). During the same period, administered and monitored prices presented a cumulative increase of 1.77% (2.00% lower than the cumulative increase recorded for the same period in 2012). Within the set of market prices goods, prices of non-tradable goods presented a cumulative increase of 9.63% over the trailing 12-month period ended June 30, 2013 compared to a cumulative increase of 7.52% over the same period in 2012; and prices of tradable goods presented a cumulative increase of 6.75% over the trailing 12-month period ended June 30, 2013 (2.97% for 2012). The food and beverage group – influenced by weather factors, but less pronouncedly at the margin – presented a cumulative increase of 12.80% over the trailing 12-month period ended June 30, 2013 compared to a cumulative increase of 7.34% over the same period in 2012. Meanwhile, inflation in the service sector reached 8.64% over the trailing 12-month period ended June 30, 2013 (7.50% for 2012), remaining higher than the overall inflation rate. In the first half of 2013, there were also inflationary pressures, though declining, in the food and beverage segment.
Law No. 12,382, signed by President Rousseff on February 25, 2011, set a monthly minimum wage of R$545 and also established guidelines for minimum wage adjustments until 2015 based on inflation and GDP growth. For 2013, the minimum wage is R$678, an increase of 9.0% compared to the minimum wage of R$622 in 2012.
According to the Monthly Employment Survey conducted by IBGE in six major metropolitan regions of Brazil (Rio de Janeiro, São Paulo, Belo Horizonte, Porto Alegre, Recife and Salvador), the average real wages of all workers increased by 3.6% in 2008, 0.7% in 2009, 5.9% in 2010, 2.6% in 2011 and 3.2% in 2012.
D-16
Employment and Labor
The Ministry of Labor customarily reports Brazilian employment statistics in terms of formal employment. Formal employment comprises employment duly registered with the Ministry of Labor and subject to social security contributions by employers. The Ministry of Labor’s General File of Employed and Unemployed shows that formal employment rose 5.7% in 2008 (or 1,707,289 jobs), 4.4% in 2009 (or 1,397,844 jobs), 7.9% in 2010 (or 2,629,827 jobs), 5.4% in 2011 (or 1,944,560 jobs) and 3.4% in 2012 (or 1,301,842 jobs). In the first half of 2013, formal employment rose 2.1% with 826,168 new jobs created.
The table below sets forth employment levels by sector for the periods indicated.
Table No. 8
Level of Employment by Sector(1)
| | | | | | | | | | | | | | | | | | | | |
Sector | | 2008 | | | 2009 | | | 2010 | | | 2011 | | | 2012 | |
Manufacturing | | | 99.8 | | | | 100.0 | | | | 106.5 | | | | 108.9 | | | | 109.3 | |
| | | | | |
Public Utility/Industrial Services(2) | | | 98.6 | | | | 100.0 | | | | 105.1 | | | | 107.2 | | | | 109.6 | |
| | | | | |
Commerce | | | 96.0 | | | | 100.0 | | | | 107.0 | | | | 111.9 | | | | 115.5 | |
| | | | | |
Services | | | 96.3 | | | | 100.0 | | | | 106.6 | | | | 112.4 | | | | 116.0 | |
| | | | | |
Construction | | | 91.7 | | | | 100.0 | | | | 111.2 | | | | 117.7 | | | | 120.6 | |
| | | | | |
Government Service | | | 97.7 | | | | 100.0 | | | | 100.8 | | | | 102.0 | | | | 101.9 | |
| | | | | |
Total | | | 97.0 | | | | 100.0 | | | | 106.5 | | | | 111.1 | | | | 113.7 | |
| (1) | December 31, 2009 = 100. |
| (2) | Including water, electricity, telephone and gas services. |
Source: Central Bank.
The Federal Government measures unemployment using the average annual rate of unemployment in six major metropolitan areas (Rio de Janeiro, São Paulo, Belo Horizonte, Porto Alegre, Salvador and Recife). According to that measure, the unemployment rate (calculated by averaging the unemployment rate for each month in the year) was 7.9% in 2008, 8.1% in 2009, 6.7% in 2010, 6.0% in 2011 and 5.5% in 2012. The estimated unemployment rate was 6.0% in June 2013, a minor change over the June 2012 rate (5.9%).
Law No. 7,998, which was enacted on January 11, 1990, established a worker support fund (Fundo de Amparo ao Trabalhador, or “FAT”) to finance unemployment security programs and professional training programs. FAT receives funding from monthly federal contributions to certain other social programs, including unemployment programs (known by their acronym, “PIS/PASEP”). In accordance with the Constitution, 40% of the funds provided for FAT are allocated to finance economic growth programs managed by BNDES. As of December 31, 2012, FAT had a positive total balance of R$203.8 billion.
Under the Constitution, professional or union associations may be freely organized. There are no Federal Government formalities for the organization of a union other than registration at the appropriate agency, and public authorities are prohibited from intervening in or interfering with unions. No more than one union may be created to represent the same professional or economic group in the same geographic area.
Under Brazilian law, the main function of a union is to represent the general interests of its members as a group or individually. It may also enter into collective labor agreements and promote conciliation in collective labor disputes. The union must provide free legal assistance for its members. A union may not be affiliated with any international organization other than the International Labor Organization unless authorized by the President of the Republic.
D-17
The Constitution introduced a number of significant labor reforms, such as a reduction in the work week from 48 hours to 44 hours and a six-hour limit on the duration of an uninterrupted work shift. In addition, pregnant workers may not be dismissed for taking maternity leave of up to four months. With Law No. 11,770 dated September 9, 2008, the Federal Government established the Citizen Company Program (Programa Empresa Cidadã), which extends by 60 days the length of maternity leave for employees of a legal entity joining the program.
Under Brazil’s state-operated social security and pension system, employers are generally required to contribute 20% of each employee’s wages to the system on a monthly basis (except for employers of domestic employees, who contribute 12% of wages, and for employers of financial market employees, who contribute 22.5% of wages), while employees generally contribute between 8% and 11% of their monthly wages for retirement benefits (paid in connection with retirement due to old age, illness or length of service), workers’ compensation, death benefits, maternity leave, sick leave, disability and other social services. The contributions and benefits above minimum wage were readjusted by 6.2%, effective January 1, 2013. The cap on social security pensions paid to private sector retirees was raised to R$4,159 per month in 2013.
In November 1999, the National Congress enacted Law No. 9,876, which changed the rules for retirement for private sector employees. The law introduced a social security factor that is used to calculate benefits for retirees, taking into account not only age and years of contributions to the INSS, but also life expectancy. The new social security factor was phased in over a five-year period.
On December 19, 2003, the rules related to retirement and social security for civil servants were further modified by Constitutional Amendment No. 41. The adjustments included (i) an increase in the minimum retirement age for civil servants from 48 to 55 years for women and from 53 to 60 years for men; (ii) a reduction of 30.0% in pensions paid to widows and orphans of civil servants in excess of the monthly ceiling for retirement payments under the general social security system; (iii) a contribution to the social security system by retired civil servants of 11.0% of the amount by which the retired employee’s pension exceeds 60.0% of the above-mentioned ceiling in the case of federal retirees and 50.0% of the above-mentioned ceiling in the case of all other retired civil servants; (iv) a uniform contribution level for municipal, state and federal workers consisting of at least 11.0% of the amount of the employee’s salary; and (v) the institution of a complementary regime for new civil servants. The changes to the social security system under Constitutional Amendment No. 41 were intended to reduce the consolidated deficit in the pension system, which reached R$80.9 billion (2.7% of GDP) in 2008, R$92.3 billion (2.8% of GDP) in 2009, R$95.7 billion (2.5% of GDP) in 2010, R$93.0 billion (2.2% of GDP) in 2011 and R$102.6 billion (2.3% of GDP) in 2012.
Law No. 12,470, dated August 31, 2011, reduced the tax burden of the Micro Individual entrepreneur, by reducing the social security contribution rate from 11% to 5%. The objective of the reduction is to expand the incentives for the formalization of these entrepreneurs and their inclusion in the social security system.
Law No. 12,618, dated April 30, 2012, created a complementary regime for new civil servants. Under the new law, which seeks to reduce the country’s pension deficit gradually, the pension ceiling for defined-benefit plans of future Federal Government employees will be the same as the ceiling applicable to private-sector workers. To receive a larger benefit, public workers must make contributions to individual retirement accounts created by the law. The Federal Government will match any such contributions by public workers, with the government’s matching contributions limited to 8.5% of the amount by which each employee’s salary exceeds the pension ceiling.
State-Controlled Enterprises
In Brazil, there are two types of state enterprises: public companies and mixed-ownership companies. Public companies are corporations wholly-owned by the States or the Republic, created by special law to carry on economic activities in any of the corporate forms provided for by law. Examples of federal public companies are BNDES, Federal Savings Bank (Caixa Economica Federal or “CEF”), the Brazilian Post Office and Telegraph Corporation (Empresa Brasileira de Correios e Telégrafos) and the Mineral Resources Exploration Company (Companhia de Pesquisa de Recursos Minerais). Mixed-ownership companies are in corporate form and are majority owned by the Federal Government or a State government. Examples of mixed-ownership companies majority-owned by the Federal Government are Petrobras, Banco do Brasil and Eletrobras. Unless otherwise provided by the law authorizing the creation of a mixed-ownership company, the rights of the Federal Government are those conferred by Brazilian corporate law on majority shareholders generally.
Brazil also has autonomous institutions and public foundations. Autonomous institutions are entities established to carry out public functions which require decentralized financial and operating management, such as the Central Bank, the Securities
D-18
Commission (Comissão de Valores Mobiliarios or “CVM”), the Brazilian Institute of the Environment and Renewable National Resources (Instituto Brasileiro do Meio Ambiente e dos Recursos Naturais Renovávies or “IBAMA”), the National Institute of Industrial Property (Instituto Nacional da Propriedade Industrial or “INPI”), the National Transportation Infrastructure Department (Departamento Nacional de Infraestrutura de Transportes or “DNIT”) and the National Department of Mineral Production (Departamento Nacional de Produção Mineral or “DNPM”).
Public foundations are non-profit public law entities created to carry out activities not performed by public companies. Public foundations have administrative autonomy and manage their own assets, but their expenses are defrayed by the Federal Government and other sources. Examples of public foundations are the Brazilian Geographic and Statistics Institute (Instituto Brasileiro de Geografia e Estatistica or “IBGE”), the Applied Economics Research Institute (Instituto de Pesquisa Econômica Aplicada) and the National Council of Technological and Scientific Development (Conselho Nacional de Desenvolvimento Científico e Tecnológico).
Under Brazilian law, private parties may only engage in activities considered to be public services if they are authorized to do so by the Federal Government. Through public concessions, the Federal Government has authorized private parties to participate in areas formerly reserved to the Republic under the Constitution, including broadcasting and telecommunications, electric power service and facilities, hydroelectric power generation, certain interstate and international navigational services, interstate and international highway passenger transportation services and the operation of ports. The mining and processing of nuclear ores and minerals and their by-products remain under Federal Government monopoly.
Environment
The Ministry of the Environment (Ministério do Meio Ambiente, dos Recursos Hídricos e da Amazônia Legal) is the federal body responsible for formulating and implementing environmental policies. The National Council on the Environment (Conselho Nacional do Meio Ambiente) prepares environmental regulations, and IBAMA is charged with supervising and overseeing the application of those regulations. Provisional Measure No. 366, dated April 26, 2007 (subsequently enacted as Law No. 11,516 dated August 28, 2007), created the Chico Mendes Institute of Biodiversity Preservation (Instituto Chico Mendes de Conservação da Biodiversidade, or “ICMBIO”), vested with responsibility for the execution of national environmental preservation policies.
The Constitution contains a chapter on environmental protection, providing for the right to a clean environment and imposing upon the Federal Government, the States, the Federal District and municipalities duties to protect the environment, take measures against pollution and protect fauna and flora.
Guided by the premise that economic growth can be reconciled with the sustainable use of natural resources, over the past four decades Brazil has increased its efforts to improve the environment, aiming at ensuring long-term sustainable development. Today, the country is a key player in the global environmental agenda and an active member of important multilateral environmental agreements. Brazil also boasts one of largest reserves of tropical rainforest and freshwater biodiversity on the planet and one of the cleanest energy matrices in the industrialized world, with 46% of all energy deriving from renewable sources. It is also the world’s leading producer of sugarcane ethanol.
The Brazilian government’s efforts to promote sustainable development of the nation’s biomes have centered on combating deforestation, promoting the recovery and rational use of biological diversity, and expanding protected areas. These objectives have been pursued through the following strategies: coordination of specific policies for each biome, creation of spaces for the participation of society, institutional reform of the forest sector and expanded interpretation of the concept of biodiversity.
Law No. 12,651, dated May 25, 2012, established a new Brazilian Forest Code (Código Florestal Brasileiro). With the adoption of the new Forest Code, Brazil now has clearer rules on land use in rural and urban areas. The new Forest Code also better defines the roles of government, producers and citizens in preserving biodiversity, water, soil and climate integrity. It also provides funding for restoration of deforested areas. The new code does not change land allocation rules to accomplish its preservation goals. Instead, the code establishes rules designed to restore lands damaged as a result of non-compliance with preservation rules.
The new code contains rules for restoring Legal Reserves (sub-divided areas within larger privately owned lands that must be set aside and preserved for their natural resources) and Permanent Preservation Areas (Áreas de Preservação Permanente or “APP” – lands that cannot be used for economic purposes and must remain undeveloped). The Forest Code
D-19
distinguishes between landowners that engaged in deforestation prior to July 2008, when the Federal Government began considering substantial reforms to Brazil’s forestry laws, and those that engaged in deforestation after 2008. Fines imposed by IBAMA before July 22, 2008 may be suspended for landowners who join Brazil’s Environmental Recovery Program (Programa de Recuperação Ambiental) and, after a deforested area has been restored, the new Forest Code authorizes fines to be redirected for environmental services.
Lands designated as APPs and Legal Reserves are subject to certain preservation requirements under the Forest Code. The percentage of a biome that may be designated as an APP depends on the width of the biome’s water courses. A marginal zone around water courses must be preserved in order to prevent water contamination.
A property designated as a Legal Reserve must preserve its native vegetation. The amount of vegetation preserved varies according to the location of the biome. In the Legal Amazon (an area that includes all of the States of Acre, Pará, Amazonas, Roraima, Rondônia, Amapá and Mato Grosso, as well as the areas situated to the north of parallel 13° S in the States of Tocantins and Goiás, and areas to the west of meridian 44° W in the State of Maranhão) producers must preserve at least 80% of the existing forest. In the Cerrado, 35% of the land area must be preserved. The Cerrado is the second largest biome in South America and covers 22% of Brazilian territory. It completely covers the Federal District and most of Goiás (97%), Tocantins (91%), Maranhão (65%), Mato Grosso do Sul (61%), Minas Gerais (57%) and smaller areas of six other States. The Cerrado comprises the source of three major basins in South America (Amazon/Tocantins, São Francisco and Prata), which results in high water potential and rich biodiversity. In Brazil’s grassland and all other regions, 20% of existing vegetation must be preserved as Legal Reserves. Under the rules of the new code, certain areas where vegetation has been destroyed have been designated Legal Reserves and these areas cannot be further developed regardless of size.
Environmental concerns are also a part of the Federal Government’s broader agenda. Since the United Nations Conference on Environment and Development was held in 1992, sustainable development has been at the core of Brazilian foreign policy. On June 19, 2012, the summation document produced as a result of the United Nations Conference on Sustainable Development - Rio +20 (titled “The future we want”) was distributed to foreign delegations by the Federal Government. The objective of the conference was to renew international political commitment to sustainable development, through the assessment of progress and gaps in implementing decisions made at other major summits held on the subject and through the discussion of new and emerging issues.
Education
The Federal Government provides centralized guidelines for public and private education at all levels and is responsible for coordinating the National Board of Education, which evaluates and sets general rules on education. Local governments are responsible for funding free public education for all children up to the completion of secondary education. The Federal Government supplements public education through the Fund for the Maintenance and Development of Basic Education and Enhancement of the Teaching Profession (Fundo de Manutenção e Desenvolvimento da Educação Básica e de Valorização or “FUNDEB”). The educational cycle is divided into four main stages: preschool, primary, secondary and higher education.
Although primary education has become almost universal for children in Brazil and enrollment rates have risen across schools that provide instruction at other educational levels, education in Brazil is still improving in terms of both quality and access. To raise the quality of education in Brazil, in 2007 the Ministry of Education (“MEC”) launched the Education Development Plan (“EDP”), with the core objective of promoting the systemic vision of education by 2021. While attending primary school, students have access to a range of support programs to ensure that they stay in school. Among these are school meals, free distribution of textbooks, school transport, health promotion in schools and the Family Grant (Bolsa Família) programs.
As of December 31, 2012, 29.7 million students were attending primary school in Brazil, which represents around 98% of children between 7 and 14 years old (based on 2009 population data). The enrollment in secondary education has also increased in recent years. As of December 31, 2012, 8.4 million students are attending secondary school, compared to 3.8 million in 1991, which represents around 81% of children between 15 and 17 years old (based on 2009 population data). This increase can be attributed to specific policies aimed at encouraging students to stay in school and the additional resources provided to students by FUNDEB.
The University for All Program (Programa Universidade para Todos or “PROUNI”), launched in 2004, has increased access to higher education in Brazil. Through the PROUNI, low-income students receive full or partial scholarships in private institutions of higher education. Participating universities are granted a tax exemption. Since its inception, the PROUNI has offered 1.7 million scholarships.
D-20
Federal Government expenditures on education were R$21.9 billion in 2008, R$28.4 billion in 2009, R$38.3 billion in 2010, R$43.4 billion in 2011 and R$52.3 billion in 2012.
Wealth and Income Distribution
While the gap between Brazil’s wealthiest and poorest citizens remains significant, the gap between the highest and lowest social levels has decreased substantially in recent decades. Stabilization of the economy, through lower inflation levels, has given more purchasing power to the poor. The Gini Index measured by the World Bank shows that Brazil´s index decreased from 59.8 in 1999 to 54.7 in 2009. The Gini index measures, using a scale of 0 (perfect equality) to 100 (perfect inequality), the extent to which the distribution of income (or consumption) among individuals or households in a country deviates from a perfectly equal distribution.
Brazil is also implementing a set of structured and nationwide social policies, focused on civil rights and the reduction of poverty and inequality. The results of these social policies have advanced Brazil’s efforts to achieve the goals established by the United Nations Organization (“UNO”) for the Millennium Development Goals. The Brazilian goal was to reduce extreme poverty by 2015 to one fourth of that observed in 1990. New extreme poverty estimates show that this goal was achieved in 2007, and was surpassed in 2008 when the extreme poverty rate reached 4.8%, less than one fifth of the 1990 rate of 25.6%. If this rate of progress is maintained, extreme poverty in Brazil will be largely eradicated by 2014.
The main social welfare program that Brazil has adopted to address poverty is the Brazil Without Extreme Poverty Plan (Brasil sem Miséria), which launched in June 2011. The plan focuses on the 16 million Brazilians whose monthly income per capita is at or below R$70, as well as poor families (monthly income per capita between R$70 and R$140). The plan encompasses income transfer mechanisms, access to public services in education, health, welfare, sanitation and electricity, and initiatives to find impoverished residents employment. With a set of actions that involve the creation of new programs and the expansion of existing initiatives, in partnership with States, municipalities, public and private companies and civil society organizations, the Federal Government wants to include Brazil’s poorest citizens in the opportunities generated by Brazilian economic growth.
The Family Grant (Bolsa Familia), an income transfer program, has been incorporated into the Brazil Without Extreme Poverty Plan. Launched by the Federal Government in 2003, Family Grant is a conditional cash transfer program that provides more than 13 million families (around 50 million people) with a monthly cash allowance, provided that they meet certain criteria: the children in the beneficiary household are enrolled in school; they receive regular medical vaccination; and pregnant women receive full pre-natal care. Based on family income and the number and age of the children in the beneficiary household, families receive approximately R$32 to R$306 per month as a result of the program.
On March 8, 2013, President Dilma Rousseff announced new tax relief on products included in the “basic food basket,” which generally consists of dietary staples. With the relief, all products in the basic food basket will be free of federal taxes. The president said she expects the measure to stimulate the agriculture, industry and commerce sectors while generating more jobs. She also announced that the Federal Government had crafted new criteria for the basic food basket, which prioritizes more nutritious foods than it had before.
Antitrust Law
A new Brazilian Antitrust Law, Law No. 12,529, became effective at the end of May 2012 and established a new framework for competition policy in Brazil, changing the structure of its three antitrust agencies: the Administrative Council of Economic Defense (Conselho Administrativo de Defesa Econômica or “CADE”), the Secretariat of Economic Law of the Ministry of Justice (Secretaria de Direito Econômico or “SDE”) and the Secretariat for Economic Monitoring of the Ministry of Finance (Secretaria de Acompanhamento Econômico or “SEAE”). The new system will centralize the tasks of undertaking anticompetitive-conduct investigations, merger control and final antitrust regulatory approval in a single independent agency, the “New CADE”. The most significant institutional changes in the legislation affect SDE and SEAE. SDE’s Department of Economic Protection and Defense (“DPDE”) is abolished and its investigative and preliminary enforcement responsibilities in
D-21
competition cases are transferred to a new CADE General Superintendency, composed of a General Superintendent (“SG”) and two deputy Superintendents. SEAE will no longer be responsible for merger control analysis. In this sense CADE will become the sole Brazilian antitrust agency, simplifying the overall clearance process and promoting greater efficiency.
The main purpose of the law is to update the Brazilian antitrust clearance system, expediting the course of antitrust proceedings and furthering the country’s economic and social development. The law sets forth general criteria for determining anti-competitive behavior, such as tying, refusal to deal, price fixing, predatory pricing, exclusive dealing arrangements and resale price maintenance. Under the former antitrust system, all acts or transactions (regardless of form) were required to be submitted for antitrust approval if the act or transaction involved an entity (or group of entities, if a group of entities acted in concert) with more than R$400 million in revenues in Brazil during the preceding fiscal year. Under the new law, in addition to the existing R$400 million revenue threshold, submission of the transaction to CADE will only be required if a second company or group involved in the transaction had more than R$30 million in revenues in Brazil in the preceding fiscal year.
A market share criteria stipulated by the former law also has been abolished. Under the former antitrust system, a dominant position occurred whenever a company or group of companies controlled a significant share of the relevant market, whether that market control involved a product, a service or a related technology supplier, agent, purchaser or financial backer. A dominant position was presumed whenever the company or group of companies controlled twenty percent (20%) of a relevant market. The new law establishes that a dominant position is presumed whenever a company or group of companies is able to change the market conditions unilaterally or in coordination with others, or when it controls twenty percent (20%) or more of the relevant market. Companies holding a dominant position require CADE’s approval before engaging in transactions that increase their share of the relevant market.
The new law also provides for a clear definition of what is to be considered a “concentration act” that must be submitted to CADE for approval. Each of the following constitutes a “concentration act”: (i) the merger of two or more independent companies; (ii) the acquisition of one or more companies, directly or indirectly, through a purchase or exchange of shares, securities convertible into shares, quotas, bonds or assets (tangible or intangible), through a contract or otherwise; (iii) the control of the interest in one or more companies; (iv) the takeover by one or more companies of another company; and (v) the association, consortium or joint venture between two or more companies, except when such contracts are entered into for a specific enterprise and for a defined period, or in cases of public bids. Transactions subject to clearance will now have to wait for CADE’s final approval before they can close.
Under the new law, violations for anticompetitive practices could subject a company to fines between 0.1 and 20 percent of the company’s gross revenues for the fiscal year preceding the start of an antitrust investigation. If it is not possible to establish the gross revenue, a fine could be between R$50,000 and R$2 billion. The new law expressly notes that the revenues to be considered for the purpose of any fine should be revenues related to the relevant market in which the infringing anticompetitive practices occurred. Fines applicable to individuals intentionally participating in anticompetitive practices on behalf of a company will be calculated based on the fine imposed on their company and can range from 1 to 20 percent of the company’s fine.
Incentives for Private Investment
On December 30, 2004, Law No. 11,079 was enacted, providing for the formation of two types of public-private partnerships: (i) contracts for concessions of public works or utility services under which private party concessionaires receive payments from a public sector entity in addition to tariffs charged to end-users and (ii) contracts for rendering services under which a public sector entity is the end-user. Public-private partnership contracts must be worth at least R$20 million and provide for a service period of between five and thirty-five years, including any extensions of the term. All such contracts can only be awarded through a public bidding process. Law No. 11,196 of November 21, 2005 instituted tax exemptions (PIS and COFINS) for export companies, tax incentives for investment in technology and tax exemptions for specific real estate transactions. Law No. 11,196 also increased the limit on the amount of gross revenues a company can earn and still be considered a micro or small company.
In August 2006, National Treasury Executive Order No. 614 was published, establishing general norms to be applied to public-private partnership contracts. In accordance with the Executive Order, public-private partnership contracts in which the Federal Government assumes more than 40% of the entrepreneurship risk are accounted for as public assets.
D-22
On January 22, 2007, the Federal Government unveiled the Growth Acceleration Program (Programa de Aceleração do Crescimento or “PAC”), with the objective of increasing Brazil’s economic growth rate. PAC comprises a set of measures designed to (i) create incentives for private investment; (ii) increase public investment in infrastructure; and (iii) remove bureaucratic, administrative, normative, legal and legislative obstacles to growth. PAC measures are grouped under five broad headings: infrastructure investment, stimulus to credit and financing, improvement in the investment climate, tax exemptions and improvements in the tax system, and long-term fiscal measures.
On March 29, 2010, the Federal Government presented PAC 2. PAC 2 includes new investment projects for the periods from 2011 to 2014 and post-2014. It also includes projects initiated during PAC 1 with activities that will conclude after 2010. Similar to the first phase of the program, PAC 2 focuses on investments in the areas of logistics, energy and social development, organized under six major initiatives: Better Cities (urban infrastructure); Bringing Citizenship to the Community (safety and social inclusion); My House, My Life (housing); Water and Light for All (sanitation and access to electricity); Energy (renewable energy, oil and gas); and Transportation (highways, railways, airports).
At the end of its second year, an aggregate of R$472.4 billion in projects had been completed under PAC 2, representing 47.8% of the projects to be completed from 2011 through 2014. The program executed 31% more projects in 2012 than it did in 2011.
In the two years of PAC 2’s existence, several complex infrastructure projects, such as Belo Monte Hydroelectric Plant, have been initiated through PAC 2. The program also exceeded many of its targets, as was the case with the “My House, My Life 2” initiative, which, in 2012, delivered over one million housing units to the Brazilian populace. Under PAC 2, construction projects on almost 1,500 kilometers of highways and nearly 2,700 kilometers of railroad have been completed.
In addition, 15 projects in major Brazilian sea ports were completed through PAC 2. PAC 2 funded 15 additional airport projects that have increased airport capacity by about 14 million passengers per year. During the same period, concessions were issued at airports in Guarulhos, Campinas, Brasília and São Gonçalo do Amarante, which are expected to generate investments of over R$16.8 billion. PAC 2 projects also added more than 6,800 megawatts to Brazil’s national electrical system, with the completion of hydroelectric, wind and thermal plants. An electricity infrastructure project that now operates under PAC 2, known as the “Light for All” program, has generated electricity for nearly 1.5 million people throughout Brazil. PAC 2 projects have also increased production of oil and gas, with the opening of five new platforms.
In addition, nearly 500 water supply and treatment projects have been completed under PAC 2, benefiting more than one million families living in large and small municipalities.
In February 2007, Decree No. 6,047 was passed, creating the National Policy for Regional Development (Política Nacional de Desenvolvimento Regional or “PNDR”) to provide guidelines and programming to reduce regional inequalities. PNDR’s main source of financing, in addition to the General Budget of the Federal Government, comes from regional development funds. PNDR is monitored by the National Information System for Regional Development—also created by the Decree—and coordinated by the Ministry for National Integration.
Law No. 11,598 dated December 3, 2007, introduced simplified procedures for registering new companies and is intended to encourage the use of corporate formalities. Decree No. 6,620, dated October 29, 2008, governs the development of maritime port activities, including the construction and operation of new ports used to transport shipments. Contracts for new ports will have a term of 25 years that can be extended for an additional 25 years. Private enterprises that will obtain the right to build and operate new ports will be selected through public auctions.
In addition, on December 6, 2012, President Rousseff announced the launch of the Logistics Investment Program – Ports, a program expected to invest R$54.2 billion in the modernization and expansion of Brazil’s ports and harbor sector through the use of concessions and leases.
The Investment Support Program (“ISP”) allows the Republic to subsidize the interest rate of loans from BNDES to purchase capital goods and support export and technological innovation. The ISP, which began in 2009, has a credit authorization of R$312 billion, of which R$165.4 billion had been disbursed as of December 31, 2012.
In April 2012, the BNDES-administered ISP was extended for another year, through December 2013, with reduced fees, increased loan maturities and maximum levels of borrower contributions as part of the new measures announced by the Federal Government to encourage investments and to protect national industry. On December 5, 2012, the Brazilian Finance Minister announced new rates and conditions that will apply to the program in 2013. The new conditions will allow companies to invest about 8% more funds in capital goods and technological innovation.
D-23
On December 27, 2012, the Central Bank reduced its reserve requirements on demand deposits to make available approximately R$15 billion for lending, in an effort to bolster investment activity. Large banks that provide credit for investment in capital-goods can deduct up to 20% percent of their demand deposits for financing associated with ISP. The reserve requirement change took effect on January 30, 2013 and applies to banks with at least R$6 billion in capital.
To promote the completion of infrastructure projects in host cities for the FIFA World Cup in 2014, the Summer Olympic Games in 2016 and the Paralympic Games in 2016, the Federal Government created special incentives for host municipalities to finance projects. Cities hosting the FIFA World Cup may receive new loans for projects related to the tournament. Cities hosting the Summer Olympic Games and the Paralympic Games are eligible for a special tax exemption for constructing, expanding or upgrading stadiums. These projects will be included in the special tax regime called Recopa, which provides an exemption from taxes levied on materials and services for companies with projects approved by Brazil’s Sports Ministry prior to December 31, 2012.
Law No. 12,351, dated December 22, 2010, established new rules for oil exploration in the pre-salt layer of the ocean. The law changes the model of oil exploration in the pre-salt layer to include risk-sharing concessions. According to the law, companies will be hired to explore blocks and will split profits with the Republic. The companies will be chosen by the Federal Government for oil exploration according to the share of production they are willing to offer to the Federal Government.
Law No. 12,734, dated November 30, 2012, established new rules for distributing among Brazilian States any royalties and special participations related to oil, natural gas and other hydrocarbons exploitation. The State of Rio de Janeiro challenged the constitutionality of the law, and the Supreme Court has suspended its enforcement until the case has been adjudicated.
D-24
PRINCIPAL SECTORS OF THE ECONOMY
Industry
The industrial sector grew 4.1% in 2008, decreased 5.6% in 2009, increased 10.4% in 2010, increased 1.6% in 2011 and decreased 0.8% in 2012. Capital goods and durable consumer goods production respectively, increased 14.3% and 3.8% in 2008; decreased 17.4% and 6.4% in 2009; and increased 20.9% and 10.3% in 2010. In 2011, capital goods production increased 3.2% and durable consumer goods production decreased 2.0%. In 2012, capital goods and durable consumer goods production decreased 11.8% and 3.4%, respectively.
As of December 31, 2012, the industrial sector represented 26.3% of GDP, compared to 27.5% of GDP in 2011. As of December 31, 2012, mining, oil and gas represented 4.3%, manufacturing represented 13.3%, construction represented 5.7%, and public utilities represented 3.1% of the total industrial sector output.
Launched in August 2011, the Greater Brazil Plan comprises the Federal Government’s industrial, technological and foreign trade policies. The plan’s objectives are to sustain inclusive economic growth in adverse economic environments and to promote structural changes in Brazil’s role in the global economy. The Greater Brazil Plan focuses on innovation and the development of scale in Brazil’s productive industry, as well as sustained gains in labor productivity. The Greater Brazil Plan involves important measures that promote investment and exports as a means of addressing local currency appreciation, improving credit, advancing the regulatory framework for innovation, strengthening trade remedies against unfair imports and expanding business tax incentives, facilitating financing for the scaling of production and supply chain competitiveness.
In April 2012, the Federal Government launched additional measures under the Greater Brazil Plan, aimed at strengthening Brazilian industry in the face of competition from imported products. The expansion of the Greater Brazil Plan encompassed tax measures, foreign trade financing, incentives to stimulate the information and communication sectors, credit measures and the creation of a new automotive regime.
Mining, Oil and Gas.
In 1997, Law No. 9,478 ended Petrobras’s monopoly of the oil industry in Brazil and defined the Republic’s role in regulating and supervising the industry. The National Agency of Oil, Natural Gas and Biofuels (Agência Nacional do Petróleo, Gás Natural e Biocombustíveis or “ANP”), an agency linked to the Ministry of Mines and Energy, was created to regulate the oil industry in Brazil. One of ANP’s tasks is to conduct tenders for concessions to drill for oil and natural gas in defined areas or blocks. Since 1999, eleven tenders have been held, resulting in the award of block concessions to Petrobras and other Brazilian and international companies. On May 14, 2012, the eleventh bidding round for oil and natural gas concessions took place. The round generated a record R$2.8 billion in signing bonus revenue.
Brazil’s domestic oil is produced in sufficient amounts to meet Brazil’s domestic demand. The discovery of significant reserves in the pre-salt layer off of Brazil’s southeastern coast has the potential to turn Brazil into an oil exporting country. Official estimates by Petrobras show that the entire pre-salt area could contain 70 to 100 billion Barrels of Oil Equivalent. A new round of bidding for oil and natural gas concession rights in Brazil’s pre-salt layer will take place on October 21, 2013.
Brazil produced approximately 754 million barrels of oil and 26 billion cubic meters of natural gas in 2012. This represented a decrease of 1.8% in oil production and an increase of 7.3% in natural gas production compared to 2011. Between 2003 and 2012, oil production grew by 38.1% and natural gas production has grown by 63.6%.
With the issuance of Provisional Measure No. 532 dated April 28, 2011 (subsequently enacted as Law No. 12,490 dated September 16, 2011), ANP began to regulate the production of ethanol in Brazil. The Government has supported the development of production and distribution technologies to enable the use of ethanol as an alternative to petroleum. As the world’s largest producer and exporter of sugarcane ethanol, Brazil is now at the forefront of renewable energy among developing countries. The complete cycle of ethanol production comprises a national enterprise, from the development of special sugarcane varieties, crop techniques, processing, storage, and distribution to flex fuel engine technology. Today, research is focused on the development of sugarcane varieties, second-generation ethanol, and optimization of agricultural and industrial production processes. In 2012, national production of anhydrous and hydrated ethanol reached 23.5 million cubic meters, an increase of 2.8% compared to production in 2011.
D-25
The Federal Government has promoted biodiesel production and its use as a sustainable energy source—technically and economically—through the National Program for the Production and Use of Biodiesel (Programa Nacional de Produção e Uso do Biodiesel). Law No. 11,097, dated January 2005, mandates the addition of a minimum ratio of biodiesel to consumer traded diesel oil. Since January 1, 2010, all diesel oil traded in Brazil contains 5% biodiesel. Biodiesel production was 1.2 million cubic meters in 2008, 1.6 million cubic meters in 2009, 2.4 million cubic meters in 2010, 2.7 million cubic meters in 2011 and 2.7 million cubic meters in 2012.
Construction.
The construction sector grew by 7.9% in 2008, declined 0.7% in 2009; and grew by 11.6% in 2010, 3.6% in 2011 and 1.4% in 2012. Housing construction, including housing for individuals and cooperatives, reached R$259.5 billion in 2012 (5.9% of GDP). The Federal Government’s social housing initiative for low to middle income families, My House My Life, has also supported growth in the construction industry. Under the first stage of the program (2009-2010), 1 million homes were constructed. The second stage of the program (2011-2014) resulted in the construction of 1.2 million homes as of April 30, 2013, benefiting more than 4.2 million Brazilians. The Federal Government aims to build 2 million homes under the second stage of the program by 2014. Subsidies provided to homeowners under the program can equal up to 95% of the property value.
Mineral Resources.
Brazil’s mineral resources are extensive and mining activities have generally remained constant or expanded in recent years due to continuing exploration activity. Large iron ore and manganese reserves provide important sources of industrial raw materials and export earnings. Deposits of nickel, tin, chromite, bauxite, beryllium, copper, lead, tungsten, zinc and gold, as well as lesser known minerals, continue to be mined.
Table No. 9
Annual Changes in Industry Production
Mining and Manufacturing
| | | | | | | | | | | | | | | | | | | | |
| | | 2008 | | | 2009 | | | 2010 | | | 2011 | | | 2012 | |
By Category of Use | | | | | | | | | | | | | | | | | | | | |
| | | | | |
Capital Goods | | | 14.3 | | | | (17.4 | ) | | | 20.9 | | | | 3.2 | | | | (11.8 | ) |
| | | | | |
Intermediate Goods | | | 1.5 | | | | (8.8 | ) | | | 11.4 | | | | 0.3 | | | | (1.6 | ) |
Consumer Goods | | | 1.9 | | | | (2.7 | ) | | | 6.4 | | | | (0.4 | ) | | | (0.8 | ) |
Durable Goods | | | 3.8 | | | | (6.4 | ) | | | 10.3 | | | | (2.0 | ) | | | (3.4 | ) |
Nondurable Goods | | | 2.5 | | | | 0.2 | | | | 4.2 | | | | 0.9 | | | | (0.7 | ) |
Source: IBGE
Services
The services sector grew by 4.9% in 2008 (including a 12.6% rise in financial services and an 8.8% rise in communications—telecommunications, information technology, audiovisual services, news agencies and other information services), 2.1% in 2009 (including a 7.8% rise in financial services and a 0.8% rise in communications), 5.5% in 2010 (including a 10.0% rise in financial services and a 3.7% rise in communications), and 2.7% in 2011 (including a 3.9% rise in the financial services sector and a 4.9% rise in communications). In 2012, the services sector grew by 1.7%, including a 0.5% rise in the financial services sector and a 2.9% rise in the communications sector.
As of December 31, 2012, the service sector represented 68.5% of GDP, compared to 67.0% of GDP in 2011. As of December 31, 2012, retail services represented 12.7%; transport represented 5.3%; communications represented 2.9%; Government represented 16.9%; financial intermediation represented 7.0%; rental services represented 8.2%; and other services represented 15.5% of the total service sector output.
D-26
Transport
Brazil has a road network of approximately 1.71 million kilometers, of which approximately 11.8% is paved. Most paved roads are maintained by federal and State authorities, while the vast majority of unpaved roads are the responsibility of local authorities. Brazil’s railway system consists of approximately 28,692 kilometers. Between 2003 and 2011, freight traffic on railways in Brazil increased from 182.6 billion Revenue Tonne Kilometres (“RTK”) to 291.9 billion RTK, a growth of 59.9%.
The Federal Government has undertaken initiatives to improve Brazil’s highway, railway and shipping infrastructure. Further, the process of privatizing the operation and maintenance of certain highways has begun and private companies have been permitted to install toll booths on thousands of kilometers of the country’s roads. The program through which privatization occurs, the Concession Program of Federal Highways, began with the auction of five areas that had been maintained directly by Brazil’s Ministry of Transport, for a total length of 858.6 kilometers. The program now covers 11,191.1 kilometers of roads, divided into concessions managed by the Ministry of Transport, States, and municipalities and the National Land Transportation Regulatory Agency (Agência Nacional de Transportes Terrestres or “ANTT”).
On November 5, 2010, the Federal Government issued Provisional Measure No. 511, which subsequently became Law No. 12,404, to create the High Speed Train Company (Empresa de Transporte Ferroviário de Alta Velocidade S.A. or “ETAV”) to oversee the building and running of a high speed train linking the cities of Campinas, São Paulo and Rio de Janeiro and to authorize the Republic to offer a loan guarantee of up to R$20 billion by BNDES to a consortium selected to build the high speed train. The reference studies indicated an estimated cost of R$33.1 billion for the building of the 510.8 km route. The first auction of the ETAV (including the installation, operation, maintenance and soundproofing of ETAV systems, rolling stock and equipment), which took place on December 16, 2010, was invalidated because no company delivered a legally acceptable proposal. A new auction has not yet been scheduled. On August 16, 2012, the Federal Government changed the name of the ETAV and expanded its mandate. It is now known as the Planning and Logistics Company (Empresa de Planejamento e Logistica or “EPL”).
On August 15, 2012, President Rousseff announced the launch of the Logistics Investment Program – Roadways and Railways, a program with anticipated investments of R$133 billion for the modernization and expansion of Brazil’s roads and railway networks through public-private partnerships. Under the program, R$91.0 billion will be invested in over 10,000 kilometers of Brazil’s railways and R$42.5 billion will be invested in over 7,500 kilometers of the country’s roadways. The Logistics Investment Program aims to strengthen the competitiveness of the Brazilian economy by reducing transport-related costs. President Rousseff stated that the program will begin with concessions for Brazil’s roads and railways, but in the future will include investments in ports, airports and waterways. To administer this program, the Federal Government announced the creation of EPL, which will study logistics, plan investments, design projects and attract private investors to work with the Federal Government. The concession program aims to rationalize planning for the roadway and railway systems in order to improve domestic supply chains and national production.
Major Brazilian cities are served by both domestic and international airlines, and many smaller communities benefit from scheduled service by domestic airlines. In 2012, there were 193.1 million airline passengers in the 63 airports managed by Infraero (the state-owned company that manages airports in Brazil).
Brazil is in the process of issuing concessions for some of its airports. The São Gonçalo do Amarante international airport, in Rio Grande do Norte, was the first Brazilian airport to be privatized. The Inframérica consortium won the contract to build and operate the airport through concession at an auction on August 22, 2011, after submitting a bid of R$170 million (representing a 228.8% premium over the price the Federal Government projected). The concession provides that the airport must be built within three years (subject to penalty for failing to complete the construction within the prescribed period), and the period of the concession is 28 years.
An auction of concessions for Brazil’s three largest airports, in Guarulhos, Campinas (Viracopos) and Brasilia, took place on February 6, 2012. The minimum bid for concessions to build these airports was R$5.5 billion, but the concessions actually sold for R$24.5 billion or a 347% average premium. The R$24.5 billion will be collected in annual installments, adjusted by the IPCA, over the course of the concession period of each airport: 20 years for Guarulhos, 30 years for Campinas and 25 years for Brasilia. The National Civil Aviation Agency (Agência Nacional de Aviação Civil or “ANAC”) is responsible for monitoring the airports and managing their concession contracts. Brazil’s national airport authority, Infraero, will maintain 49% ownership of the airports and assist with their management.
D-27
One of the objectives of the concessions is to accelerate the completion of work required to meet current and future demand for air transportation, including for major events like the FIFA World Cup in 2014 and the Summer Olympics in 2016. By the end of the concession of each of the airports, investments of R$4.6 billion in Guarulhos, R$8.7 billion in Campinas (Viracopos) and R$2.8 billion in Brasilia are expected. Each of the companies managing airport construction projects is contractually required to complete improvements before the 2014 FIFA World Cup. The fine for noncompliance is R$150 million and an additional R$1.5 million per day of delay.
On December 20, 2012, the Federal Government announced the launch of the airport component of its Logistics Investment Program, which had been announced earlier in 2012 to improve Brazil’s national infrastructure. Through the Logistics Investment Program, the Federal Government will invest R$7.3 billion in 270 airports. The project aims to reduce delays, increase regional aviation routes, improve the quality of airport services, and facilitate access to air transportation. The Federal Government also has created Infraero Services, a subsidiary of Brazil’s national airport infrastructure company, Infraero, to help administer the airport program. Infraero Services will partner with an international operator to train personnel and enhance the quality of airport services. Another component of the airport program will be a public bidding process for concession agreements to manage Galeão Airport in Rio de Janeiro and Confins Airport in Belo Horizonte. Overall, the airport program aims to invest in and incentivize development of airport services, regional aviation, and regulation of private and public airports in Brazil.
With 8,500 km of sea coast, the Brazilian port industry handles more than 90% of Brazil’s exports. Each year, about 700 million tons of products pass through Brazilian ports. Brazil’s main ports are in Rio de Janeiro (State of Rio de Janeiro), Santos (State of São Paulo), Paranaguá (State of Paraná), Rio Grande (State of Rio Grande do Sul) and São Sebastião (State of São Paulo). The Brazilian port system consists of 37 public ports on Brazil’s rivers and coastlines, 42 private terminals and three port complexes operating under private concessions. Port policy is formulated by the Secretariat of Ports in the Office of the President of Brazil (Secretaria de Portos da Presidência or SEP/PR).
Provisional Measure No. 595, dated December 6, 2012 (subsequently enacted as Law No. 12,815 of June 5, 2013), is designed to improve planning for, and management of, Brazil’s ports by institutionally reorganizing the port sector. In furtherance of these goals, on December 6, 2012, President Rousseff announced the launch of the Logistics Investment Program – Ports, a program expected to invest R$54.2 billion in the modernization and expansion of Brazil’s ports and harbor sector through the use of concessions and leases. Of this amount, R$31 billion is expected to be invested during 2014 and 2015. The remaining R$23.2 billion is expected to be invested during 2016 and 2017. The measure is expected to improve infrastructure and stimulate economic growth in Brazil.
Telecommunications. Telecommunications services include fixed line telephony, mobile telephony, specialized mobile services (trunking), satellite telecommunications, internet access providers, transmission and reception of radio and TV signals, installation and other services.
Until the privatization of the telecommunication sector in 1998, the network was run by concessionaires in each State that were subsidiaries of Telecomunicações Brasileiras S.A. or Telebrás. Since the late 1980s, considerable investment has been made in the expansion of telecommunications services, including the establishment of cellular telephone systems in all of the States and the first fiber optic communications connection between the cities of Rio de Janeiro and São Paulo, which largely accounts for the recent significant growth in the communications sector. Law No. 9,295 dated July 19, 1996, permits the Federal Government to auction, to private companies, licenses to build and operate cellular telephone systems. In privatizing the telecommunication sector, the Federal Government sought to provide universal access to, and improve the quality of, telecommunications services through increased investment.
As a result, as of December 31, 2012, Brazil had approximately 44.3 million active fixed telephone lines and approximately 261.8 million cellular phones, compared to 38.8 million active fixed telephone lines and approximately 34.9 million cellular phones in 2002. In 2012, investment in the telecommunication sector amounted to R$25.3 billion, which represents an increase of 11% when compared to 2011. In 2012, Information Services increased by 2.9% in 2012 compared to an increase of 4.9% in 2011.
Electric Power. Between 2003 and 2004 the Federal Government laid the foundations for improvements to Brazil’s energy sector. Known as the “New Model”, these improvements were based on Laws No. 10,847 and 10,848 of March 15, 2004 and Decree No. 5,163 of July 30, 2004. The New Model for the electricity sector aims to ensure the security of Brazil’s electricity supply, to guarantee moderate energy tariffs and to promote social inclusion in the Brazilian electricity sector.
D-28
In institutional terms, the New Model created an entity responsible for long term planning in the electric sector, the Energy Research Company (“EPE”), an institution whose function is to continuously assess the security of electricity supply (the Electric Sector Monitoring Committee or “CMSE”); an institution to provide continuity to the activities of Brazil’s wholesale energy market (“MAE”); and an institution to address trade in electricity delivered through the Interconnected System (the Chamber for Trade in Electric Energy or “CCEE”). Other important changes included the designation of the Ministry of Mines and Energy (MME) as the authority responsible for concessions, and expansion of the autonomy of the National Electric System Operator (“NOS”).
With regard to energy trade, two markets were established for the sale and purchase of energy: the Regulated Contracting Environment (“ACR”), the market in which energy generators and distribution agents participate, and the Free Contracting Environment (“ACL”), the market in which generation agents, traders, importers, exporters and free consumers participate. The model includes a set of measures to be observed by actors in the sector, such as the requirements for distributors, a new methodology for calculating guarantees for the sale of generation capacity, contracting of hydroelectric and thermoelectric plants in proportion to ensure better balance between supply security and cost, as well as permanent monitoring of the continuity and security of supply in order to detect cyclical imbalances between supply and demand.
In terms of tariff moderation, the model provides for the purchase of electricity by distributors in the regulated market through auctions, subject to lowest cost criteria, which reduce the acquisition costs of electric energy. The Brazilian Electricity Regulatory Agency (Agência Nacional de Energia Elétrica), created in 1996, is responsible for regulating and auditing electric energy production, transmission, distribution and retail markets based on guidelines instituted by the Federal Government.
Decree No. 2,003, dated September 10, 1996, sets forth the regulatory framework for independent power producers (“IPPs”) and self-producers. Pursuant to this decree, the development of hydroelectric power plants by an IPP or a self-producer requires a concession (awarded following a bidding process) only when the project will generate power in excess of 1 MW in the case of an IPP and 10 MW in the case of a self-producer. In all other cases, including development of thermoelectric plants, the IPP or self-producer is only required to obtain authorization from, or to register with, ANEEL.
As of December 31, 2012, Brazil’s installed generating capacity was 126.8 GW. The Brazilian electric power matrix derives 80.5% of its energy from renewable sources and approximately 19.5% from non-renewable sources. This energy comes from a variety of sources: 66.5% is produced by hydroelectric plants, 24.0% is produced by thermal plants, 1.8% is produced by coal-fired plants, 1.6% is produced by nuclear power plants, 1.5% is produced by aeolian (wind) and solar plants, and the remaining energy is imported. In 2012, 80% of the total electricity power supply was internal public generation, 13.2% was internal self-producer generation and 6.8% was imported.
A key energy priority for the Federal Government is increasing access to electricity. The Light for All Program (Programa Luz para Todos) was introduced in 2003, with the objective of bringing electricity to more than 10 million people in Brazil’s rural areas, a goal which was achieved in May 2009. Through the program, electricity connections are made to homes free of charge. Since the creation of PAC 2, the Light for All Program has given nearly 1.5 million additional people throughout Brazil access to electricity. By 2014, the program aims to add 716,000 new electricity connections through PAC 2. As of December 31, 2012, 367,993 new electricity connections had been installed. According to the World Bank, in 2010, 98.7% of Brazilians had access to electricity.
Agriculture and Livestock
Brazil’s agricultural sector (crops and livestock) is among the most prosperous and competitive in the world. Brazil is the largest producer and exporter of coffee, the second largest producer and the largest exporter of soybeans and the largest exporter of sugar. In the 2012-2013 season, Brazil accounted for 37.2% of the world’s coffee production, 26.8% of global coffee exports, 30.6% of global soybeans production, 40.6% of global soybeans exports, and 48.6% of global sugar exports.
Brazil is the second largest producer of beef in the world and the largest global exporter of beef and broiler meat. In 2012, Brazil produced 9.3 billion tons of beef and exported 1.5 billion tons (18.7% of world exports). Broiler meat exports totaled 3.5 billion tons in the same period, corresponding to 34.8% of total global broiler meat exports.
D-29
Despite a slowdown in global agricultural trade, Brazilian agriculture exports have been growing, increasing Brazil’s relative share in the international market and consolidating Brazil’s position as one of the leading agricultural producers and exporters. In 2012, these agricultural exports were approximately U.S.$95.8 billion (accounting for 39.5% of Brazil’s total exports). Among the main products exported in 2012, soybean products ranked third, accounting for 10.8% of Brazil’s total exports; meats ranked seventh, accounting for 6.3% of Brazil’s total exports; sugar and ethanol ranked eighth, accounting for 6.2% of Brazil’s total exports; and coffee ranked eleventh, accounting for 2.7% of Brazil’s total exports.
The 2012-2013 agricultural harvest yielded record grain production of 165.9 million tons, 1.9% higher than the harvest from the previous season, representing a growth of 1.9% in planted area and 0.1% in productivity. Livestock also performed well, with gross revenue of R$112.1 billion in 2011 (an increase of approximately 9.2% over 2010 results).
The Federal Government’s Agriculture and Livestock Plan 2013/2014 includes R$115.2 billion in investments in Brazil’s agricultural crops. Of these resources, R$86.9 billion will finance the production and marketing of crops, and R$28.2 billion will support investment programs. The plan also increases the previous crop credit by 7.5% and reduces the controlled annual interest rate from 6.75% to 5.5%.
The estimated annual growth of Brazil’s grain production for the 2012-2013 season is expected to be 10.8%, yielding a total of 184.2 million tons of grain. This growth is expected to result from the expansion of cultivated area by approximately 4.1% and from productivity gains.
As of December 31, 2012, the agriculture sector represented 5.2% of GDP, compared to 5.5% of GDP in 2011.
D-30
BALANCE OF PAYMENTS AND FOREIGN TRADE
Balance of Payments
After five years of surpluses, from 2003 to 2007, Brazil had a current account deficit of $28.2 billion in 2008 (1.71% of GDP), $24.3 billion in 2009 (1.49% of GDP), $47.3 billion in 2010 (2.20% of GDP), $52.5 billion in 2011 (2.12% of GDP) and $54.2 billion in 2012 (2.41% of GDP). From 2008 to 2012, Brazil’s balance of payments registered surpluses of $3.0 billion, $46.7 billion, $49.1 billion, $58.6 billion and $18.9 billion, respectively.
Exports totaled $197.9 billion in 2008, $153.0 billion in 2009, $201.9 billion in 2010 and $256.0 billion in 2011. In 2012, exports totaled $242.6 billion, a 5.3% decrease from 2011. Imports totaled $173.1 billion in 2008, $127.7 billion in 2009, $181.8 billion in 2010 and $226.2 billion in 2011. In 2012, imports totaled $223.1 billion, resulting in a 1.4% decrease from 2011. From 2008 to 2012, Brazil showed trade surpluses of $24.8 billion, $25.3 billion, $20.1 billion, $29.8 billion and $19.4 billion, respectively.
In the first half of 2013, the trade balance presented a deficit of $3.1 billion. A significant decrease compared to a surplus of $7.1 billion accumulated during the same period of 2012. Exports totaled $114,4 billion (compared to $117.2 billion in the first half of 2012) while imports reached $117.5 billion (compared to $110.2 billion in 2012). Over a trailing 12-month period, by the first half of 2013, the trade balance presented a surplus of $9.3 billion.
The lower trade balance was prompted by a decline in exports (2.4%) and an increase in imports (6.7%) during the first half of 2013. Lower commodities prices largely influenced the drop in exports. The increase in imports was widespread but most significant in fuels and lubricants, largely as a result of a delay in the registration of imports of these materials.
Brazil’s net capital and financial account surplus was $70.2 billion in 2012, which represents a decrease from the surplus of $112.4 billion in 2011. Foreign direct investment net inflows totaled $65.3 billion in 2012, a decrease of 2.1% from 2011. Net portfolio investment inflows totaled $8.8 billion in 2012, compared to a net inflow of $35.3 billion in 2011.
The current account deficit accumulated in the first half of 2013 was $43.5 billion, compared to $25.2 billion during the same period of 2012. The services and income account accumulated a deficit of $42.0 billion in the first half of 2013 and the current unilateral transfers account presented a surplus of $1.5 billion. The balance of payments surplus for the first half of 2013 was approximately $6.3 billion, compared with $21.8 billion in the first six months of 2012.
The most significant changes in Brazil´s balance of payments during the first half of 2013 were related to a decrease in trade balance and in profits and dividends remittances. Nevertheless, foreign investments in Brazil remained at historically strong levels, outpacing Brazil’s current account deficit.
D-31
The following table sets forth information regarding Brazil’s balance of payments for each of the periods indicated.
Table No. 10
Balance of Payments (1)
| | | | | | | | | | | | | | | | | | | | |
| | | 2008 | | | 2009 | | | 2010 | | | 2011 | | | 2012 | |
Current Account | | | –28,192 | | | | –24,302 | | | | –47,273 | | | | –52,473 | | | | –54,230 | |
Trade Balance (fob) | | | 24,836 | | | | 25,290 | | | | 20,147 | | | | 29,793 | | | | 19,415 | |
Exports | | | 197,942 | | | | 152,995 | | | | 201,915 | | | | 256,040 | | | | 242,580 | |
Imports | | | –173,107 | | | | –127,705 | | | | –181,768 | | | | 226,247 | | | | –223,164 | |
Services and Income Balance | | | –57,252 | | | | –52,930 | | | | –70,322 | | | | –85,251 | | | | –76,492 | |
Services | | | –16,690 | | | | –19,245 | | | | –30,835 | | | | –37,932 | | | | –41,044 | |
Income | | | –40,562 | | | | –33,684 | | | | –39,486 | | | | –47,319 | | | | –35,448 | |
Compensation of employees | | | 545 | | | | 603 | | | | 498 | | | | 567 | | | | 511 | |
Profits and Dividends | | | –33,875 | | | | –25,218 | | | | –30,375 | | | | –38,166 | | | | –24,112 | |
Interest payments | | | –7,232 | | | | –9,069 | | | | –9,610 | | | | –9,719 | | | | –11,847 | |
Current Transfers (net) | | | 4,224 | | | | 3,338 | | | | 2,902 | | | | 2,984 | | | | 2,846 | |
Capital and Financial Account | | | 29,352 | | | | 71,301 | | | | 99,912 | | | | 112,381 | | | | 70,154 | |
Capital Account(2) | | | 1,055 | | | | 1,129 | | | | 1,119 | | | | 1,573 | | | | –1,877 | |
Financial Account | | | 28,297 | | | | 70,172 | | | | 98,793 | | | | 110,808 | | | | 72,030 | |
Direct Investment | | | 24,601 | | | | 36,033 | | | | 36,919 | | | | 67,689 | | | | 68,093 | |
Abroad | | | –20,457 | | | | 10,084 | | | | –11,588 | | | | 1,029 | | | | 2,821 | |
In Brazil | | | 45,058 | | | | 25,949 | | | | 48,506 | | | | 66,660 | | | | 65,272 | |
Portfolio Investments | | | 1,133 | | | | 50,283 | | | | 63,011 | | | | 35,311 | | | | 8,770 | |
Assets | | | 1,900 | | | | 4,125 | | | | –4,784 | | | | 16,858 | | | | –7,764 | |
Liabilities | | | –767 | | | | 46,159 | | | | 67,795 | | | | 18,453 | | | | 16,534 | |
Derivatives | | | –312 | | | | 156 | | | | –112 | | | | 3 | | | | 185 | |
Other Investments(3) | | | 2,875 | | | | –16,300 | | | | –1,024 | | | | 7,805 | | | | –5,018 | |
Assets | | | –5,269 | | | | –30,376 | | | | –42,567 | | | | –39,005 | | | | –24,547 | |
Liabilities | | | 8,143 | | | | 14,076 | | | | 41,543 | | | | 46,810 | | | | 19,529 | |
Errors and Omissions | | | 1809 | | | | –347 | | | | –3,538 | | | | –1,271 | | | | 2,976 | |
Overall Balance (Change in reserves) | | | 2,969 | | | | 46,651 | | | | 49,101 | | | | 58,637 | | | | 18,900 | |
| (1) | These figures were calculated in accordance with the methodology set forth in the IMF Balance of Payments Manual, Fifth Edition. |
| (2) | Includes migrant transfers. |
| (3) | Includes installments. |
Source: Central Bank
Foreign Trade
Brazilian exports of primary goods represented 46.8% of the total goods exported in 2012, while industrialized products (semi-manufactured and manufactured goods) represented 51.0% of the total exported.
Since 2009, the largest market for Brazilian products has been the Asian market, with exports in 2012 amounting to approximately $75.3 billion (31.1% of total exports), followed by the European Union with exports totaling approximately $48.9 billion (20.1% of total exports). Exports to the United States increased from $25.9 billion in 2011 (or 10.1% of all Brazilian exports) to $26.8 billion (or 11.1% of total Brazilian exports) in 2012. The volume of exports to Mercosul countries decreased from $32.4 billion (or 12.7% of total exports) in 2011 to $27.9 billion (or 11.5% of total exports) in 2012.
During the first six months of 2013, exports to the European Union reached $21.8 billion (representing 19.0% of all Brazilian exports), a decrease of 9.1% compared to the same period in 2012. Exports to the United States reached $11.6 billion (10.1% of all Brazilian exports), a decrease from the $13.8 billion in exports registered in 2012. Exports to Asia reached $37.9 billion, representing 33% of all Brazilian exports. Over the same period in 2012, exports to Asia were $35.9 billion, or 30.6% of Brazilian exports. China is Brazil´s most significant Asian partner in foreign trade. Exports to China totaled $41.2 billion in 2012, or 17% of all Brazilian exports. During the first half of 2013, exports to China reached $ 23.0 billion, or 20.1% of all Brazilian exports. Japan also receives exports from Brazil. Exports to Japan in 2012 totaled $8.0 billion, or 3.3% of all Brazilian exports. During the first half of 2013, exports to Japan were $3.8 billion, or 3.4% of all Brazilian exports.
To provide export financing under the terms and conditions prevailing in the international market, the Federal Government established the Export Financing Program, or PROEX, in 1991. There are two forms of credit assistance available under the program: direct financing and interest rate equalization. The funding consists of direct financing to Brazilian exporters (supplier’s credit) or to foreign importers (buyer’s credit); direct financing also may be provided for the production of goods and services for export. Interest rate equalization is credit assistance through which PROEX assumes part of the finance charges associated with a loan granted by another financial institution through equalization payments, making the net financial burden of the loan compatible with those available on the international market. The Federal Government more than doubled resources for PROEX from R$1.2 billion to R$3.1 billion and increased the financing period of the program from 10 to 15 years in April 2012 as part of the Greater Brazil Plan.
D-32
In 2012, the acquisition of raw materials and industrial supplies and materials represented 44.7% of total imports, and capital goods imports accounted for 21.8% of total imports. Consumer goods represented 17.6% of total imports, while fuel and oil represented 15.8% of the total. Imports from the European Union were $47.7 billion in 2012 (or 21.4% of all Brazilian imports), while imports from the United States were $32.6 billion in 2012 (or 14.6% of all Brazilian imports). Imports from Asia increased from $47.1 billion in 2008 (or 27.3% of all Brazilian imports) to $68.9 billion in 2012 (or 30.9% of all Brazilian imports).
During the first half of 2013, imports from the European Union reached $25.0 billion, representing 21.3% of all Brazilian imports, a decrease of 6.5% compared to the same period in 2012. Imports from the United States reached $17.6 billion (15.0% of all Brazilian imports), an increase from the $16.1 billion in imports registered in 2012. Imports from Asia reached $35.7 billion, representing 30.4% of all Brazilian imports. In the same period in 2012, imports from Asia were $34.3 billion (or 31.2% of all Brazilian imports).
Brazil has been reducing its import tariffs. From November 30, 1997 to December 31, 1999, the average tariff was 13.8%. The average tariff dropped to 13.0% as of January 1, 2001 and the maximum tariff was 55.0% as of that date. In 2012, the average tariff reached 11.6%, and the maximum tariff was 35.0%.
Brazil is a member of Mercosul. Mercosul is an economic and political agreement among Argentina, Brazil, Paraguay, Uruguay and Venezuela. On December 7, 2012, Bolivia signed a Mercosul incorporation protocol to become a full member of Mercosul. The protocol sets forth the requirements that Bolivia must meet to attain full membership, which may only take place after the legislatures of the full members in good standing ratify the protocol.
Mercosul’s primary interest has been eliminating obstacles to regional trade, such as high tariffs and income inequalities. A fundamental part of Mercosul is a common external tariff (“CET”), a complex schedule of taxes that apply to imports from non-member countries.
Mercosul originated in 1985, when the Presidents of Argentina and Brazil signed the Argentina-Brazil Integration and Economic Cooperation Program (Programa de Integração e Cooperação Econômica Argentina-Brasil or “PICE”). On June 29, 2012, Paraguay was suspended from Mercosul in response to the impeachment and removal of its president. The suspension resolution provided that Paraguay’s suspension would be lifted once its democratic government had been restored. Paraguay’s suspension from Mercosur was lifted on August 15, 2013, upon the inauguration of a new constitutional government in Paraguay. However, Paraguayan officials have expressed reservations about reincorporating into Mercosul, citing concerns about the propriety of Paraguay’s suspension in 2012 and the admission of Venezuela as a full member of Mercosul during Paraguay’s suspension.
On July 31, 2012, Venezuela was admitted to Mercosul as its fifth full member. In addition to the full member countries, Mercosul has five associate members: Bolivia, Chile, Colombia, Ecuador and Peru. Associate members are included in free trade treaties but have no voting rights within Mercosul.
In December 2011, the leaders of Mercosul agreed to raise tariffs temporarily up to 35 percent on one hundred imported products coming from outside of the trade zone, to offset trade imbalances caused by the global financial crisis. The objectives of the temporary increase were to protect local products from competition by cheap foreign imports and to maintain the region´s strong economic growth. The measure, which became effective on October 1, 2012, raised tariffs for an initial period of 12 months, with an option to renew the increase until December 31, 2014. On December 6, 2012, this measure was extended through December 31, 2014 for certain products.
D-33
The following tables set forth certain information regarding exports by aggregate factor and imports by end-use category.
Table No. 11
Brazilian Exports (FOB)
| | | | | | | | | | | | | | | | | | | | | | | | | | | | | | | | | | | | | | | | |
| | | 2008 | | | 2009 | | | 2010 | | | 2011 | | | 2012 | |
| | | in
$millions | | | % of
total | | | in
$millions | | | % of
total | | | in
$millions | | | % of
total | | | in
$millions | | | % of
total | | | in
$millions | | | % of
total | |
| | | | | | | | | | |
Primary products | | | 73,028 | | | | 36.9 | % | | | 61,957 | | | | 40.5 | % | | | 90,005 | | | | 44.6 | % | | | 122,457 | | | | 47.8 | % | | | 113,456 | | | | 46.8 | % |
Industrialized products | | | 119,756 | | | | 60.5 | % | | | 87,848 | | | | 57.4 | % | | | 107,770 | | | | 53.4 | % | | | 128,317 | | | | 50.1 | % | | | 123,749 | | | | 51.0 | % |
Semi-manufactured | | | 27,073 | | | | 13.7 | % | | | 20,499 | | | | 13.4 | % | | | 28,207 | | | | 14.0 | % | | | 36,026 | | | | 14.1 | % | | | 33,042 | | | | 13.6 | % |
Manufactured | | | 92,683 | | | | 46.8 | % | | | 67,349 | | | | 44.0 | % | | | 79,563 | | | | 39.4 | % | | | 92,291 | | | | 36.0 | % | | | 90,707 | | | | 37.4 | % |
Special operations | | | 5,159 | | | | 2.6 | % | | | 3,189 | | | | 2.1 | % | | | 4,140 | | | | 2.1 | % | | | 5,265 | | | | 2.1 | % | | | 5,375 | | | | 2.2 | % |
Total | | | 197,942 | | | | 100.0 | % | | | 152,995 | | | | 100.0 | % | | | 201,915 | | | | 100.0 | % | | | 256,040 | | | | 100.0 | % | | | 242,580 | | | | 100.0 | % |
Source: Ministry of Development, Industry and Trade
Table No. 12
Brazilian Imports (FOB)
| | | | | | | | | | | | | | | | | | | | | | | | | | | | | | | | | | | | | | | | |
| | | Brazilian Imports (FOB) | |
| | | 2008 | | | 2009 | | | 2010 | | | 2011 | | | 2012 | |
| | | in
$millions | | | % of
total | | | in
$millions | | | % of
total | | | in
$millions | | | % of
total | | | in
$millions | | | % of
total | | | in
$millions | | | % of
total | |
Capital goods | | | 35,933 | | | | 20.8 | % | | | 29,698 | | | | 23.3 | % | | | 41,008 | | | | 22.6 | % | | | 47,909 | | | | 21.2 | % | | | 48,623 | | | | 21.8 | % |
Consumption goods | | | 22,527 | | | | 13.0 | % | | | 21,524 | | | | 16.9 | % | | | 31,428 | | | | 17.3 | % | | | 40,087 | | | | 17.7 | % | | | 39,374 | | | | 17.6 | % |
Oil and Fuel | | | 31,469 | | | | 18.2 | % | | | 16,746 | | | | 13.1 | % | | | 25,341 | | | | 13.9 | % | | | 36,174 | | | | 16.0 | % | | | 35,313 | | | | 15.8 | % |
Intermediate goods | | | 83,056 | | | | 48.0 | % | | | 59,754 | | | | 46.8 | % | | | 83,992 | | | | 46.2 | % | | | 102,076 | | | | 45.1 | % | | | 99,840 | | | | 44.7 | % |
Total | | | 172,985 | | | | 100.0 | % | | | 127,722 | | | | 100.0 | % | | | 181,768 | | | | 100.0 | % | | | 226,246 | | | | 100.0 | % | | | 223,149 | | | | 100.0 | % |
Source: Ministry of Development, Industry and Trade
Soy and iron ore are some of the most significant Brazilian exports. In 2012, soy exports represented 10.8% of all Brazilian exports and iron ore exports represented 13.7% of all Brazilian exports. These items are exported to a wide range of commercial partners, however China received the biggest share of these exports in 2012.
D-34
The following tables set forth certain information regarding exports and imports by major commodity groups for the periods indicated.
Table No. 13
Exports (FOB Brazil)(1)
| | | | | | | | | | | | | | | | | | | | | | | | | | | | | | | | | | | | | | | | |
| | | 2008 | | | 2009 | | | 2010 | | | 2011 | | | 2012 | |
Item | | in
$millions | | | % of
total | | | In
$millions | | | % of
total | | | In
$millions | | | % of
total | | | in
$millions | | | % of
total | | | In
$millions | | | % of
total | |
Livestock and animal products | | $ | 13,974 | | | | 7.1 | | | $ | 11,225 | | | | 7.3 | | | $ | 13,526 | | | | 6.7 | | | $ | 15,215 | | | | 5.9 | | | $ | 15,365 | | | | 6.3 | |
Vegetable products | | | 18,563 | | | | 9.4 | | | | 18,198 | | | | 11.9 | | | | 20,250 | | | | 10.0 | | | | 30,041 | | | | 11.7 | | | | 31,357 | | | | 12.9 | |
Oils, fat and waxes of animals and plants | | | 2,992 | | | | 1.5 | | | | 1,471 | | | | 1.0 | | | | 1,661 | | | | 0.8 | | | | 2,590 | | | | 1.0 | | | | 2,539 | | | | 1.0 | |
Food, beverage and tobacco | | | 21,741 | | | | 11.0 | | | | 22,854 | | | | 14.9 | | | | 27,057 | | | | 13.4 | | | | 31,787 | | | | 12.4 | | | | 31,420 | | | | 13.0 | |
Mineral products | | | 38,185 | | | | 19.3 | | | | 28,709 | | | | 18.8 | | | | 51,401 | | | | 25.5 | | | | 71,785 | | | | 28.0 | | | | 60,483 | | | | 24.9 | |
Chemical products and derivatives | | | 9,481 | | | | 4.8 | | | | 8,107 | | | | 5.3 | | | | 10,273 | | | | 5.1 | | | | 12,258 | | | | 4.8 | | | | 11,570 | | | | 4.8 | |
Plastic and rubber, and derivatives | | | 4,961 | | | | 2.5 | | | | 4,452 | | | | 2.9 | | | | 5,342 | | | | 2.6 | | | | 6.611 | | | | 2.6 | | | | 6,113 | | | | 2.5 | |
Fur, leather and its derivatives | | | 2,039 | | | | 1.0 | | | | 1,287 | | | | 0.8 | | | | 1,866 | | | | 0.9 | | | | 2,160 | | | | 0.8 | | | | 2,180 | | | | 0.9 | |
Wood, wood charcoal and its products, etc. | | | 2,762 | | | | 1.4 | | | | 1,681 | | | | 1.1 | | | | 1,920 | | | | 1.0 | | | | 1,903 | | | | 0.7 | | | | 1,891 | | | | 0.8 | |
Paste of wood, paper and its derivatives, etc. | | | 5,898 | | | | 3.0 | | | | 5,046 | | | | 3.3 | | | | 6,820 | | | | 3.4 | | | | 7,248 | | | | 2.8 | | | | 6,716 | | | | 2.8 | |
Textile materials and their derivatives | | | 2,425 | | | | 1.2 | | | | 1,896 | | | | 1.2 | | | | 2,265 | | | | 1.1 | | | | 3,013 | | | | 1.2 | | | | 3,386 | | | | 1.4 | |
Shoes, hats, etc. | | | 2,032 | | | | 1.0 | | | | 1,481 | | | | 1.0 | | | | 1,653 | | | | 0.8 | | | | 1,504 | | | | 0.6 | | | | 1,292 | | | | 0.5 | |
Articles of stone, ceramic, glass, etc. | | | 1,897 | | | | 1.0 | | | | 1,406 | | | | 0.9 | | | | 1,685 | | | | 0.8 | | | | 1,724 | | | | 0.7 | | | | 1,719 | | | | 0.7 | |
Natural pearls, precious stones, etc. | | | 1,544 | | | | 0.8 | | | | 1,737 | | | | 1.1 | | | | 2,270 | | | | 1.1 | | | | 2,962 | | | | 1.2 | | | | 3,239 | | | | 1.3 | |
Common metals and their derivatives | | | 20,358 | | | | 10.3 | | | | 12,259 | | | | 8.0 | | | | 14,412 | | | | 7.1 | | | | 18,941 | | | | 7.4 | | | | 17,240 | | | | 7.1 | |
Machineries and equipments, electric materials, etc. | | | 19,441 | | | | 9.8 | | | | 13,326 | | | | 8.7 | | | | 16,217 | | | | 8.0 | | | | 19,225 | | | | 7.5 | | | | 18,806 | | | | 7.8 | |
Transport materials | | | 23,385 | | | | 11.3 | | | | 13,003 | | | | 8.5 | | | | 17,273 | | | | 8.6 | | | | 19,575 | | | | 7.6 | | | | 19,437 | | | | 8.0 | |
Scientific instruments and equipments | | | 831 | | | | 0.4 | | | | 694 | | | | 0.5 | | | | 829 | | | | 0.4 | | | | 965 | | | | 0.4 | | | | 931 | | | | 0.4 | |
Weapons and ammunition | | | 260 | | | | 0.1 | | | | 338 | | | | 0.2 | | | | 322 | | | | 0.2 | | | | 293 | | | | 0.1 | | | | 315 | | | | 0.1 | |
Goods and diverse products | | | 1,333 | | | | 0.7 | | | | 997 | | | | 0.7 | | | | 1,078 | | | | 0.5 | | | | 1,122 | | | | 0.4 | | | | 1,333 | | | | 0.5 | |
Objects of art, collection and antiques | | | 19 | | | | 0.0 | | | | 34 | | | | 0.0 | | | | 20 | | | | 0.0 | | | | 57 | | | | 0.0 | | | | 46 | | | | 0.0 | |
Special transactions | | | 4,821 | | | | 2.4 | | | | 2,796 | | | | 1.8 | | | | 3,775 | | | | 1.9 | | | | 5,060 | | | | 2.0 | | | | 5,204 | | | | 2.1 | |
| | | | | | | | | | | | | | | | | | | | | | | | | | | | | | | | | | | | | | | | |
| | | | | | | | | | |
Total | | | 197,942 | | | | 100.0 | | | | 152,995 | | | | 100.0 | | | | 201,915 | | | | 100.0 | | | | 256,040 | | | | 100.0 | | | | 242,580 | | | | 100.0 | |
| | | | | | | | | | | | | | | | | | | | | | | | | | | | | | | | | | | | | | | | |
| (1) | According to the NCM: Nomenclatura Comum do MERCOSUL (In English: Common Nomenclature of MERCOSUR). |
Source: Ministry of Development, Industry and Trade
D-35
Table No. 14
Imports (FOB Country of Origin)(1)
| | | | | | | | | | | | | | | | | | | | | | | | | | | | | | | | | | | | | | | | |
| | | 2008 | | | 2009 | | | 2010 | | | 2011 | | | 2012 | |
Item | | in
$millions | | | % of
total | | | in
$millions | | | % of
total | | | in
$millions | | | % of
total | | | in
$millions | | | % of
total | | | in
$millions | | | % of
total | |
| | | | | | | | | | |
Livestock and animal products | | $ | 1,240 | | | | 0.7 | | | $ | 1,294 | | | | 1.0 | | | $ | 1,675 | | | | 0.9 | | | $ | 2,298 | | | | 1.0 | | | $ | 2,330 | | | | 1.0 | |
Vegetable products | | | 4,377 | | | | 2.5 | | | | 3,578 | | | | 2.8 | | | | 4,329 | | | | 2.4 | | | | 5,026 | | | | 2.2 | | | | 5,217 | | | | 2.3 | |
Oils, fat and waxes of animals and plants | | | 743 | | | | 0.4 | | | | 599 | | | | 0.5 | | | | 746 | | | | 0.4 | | | | 1,051 | | | | 0.5 | | | | 958 | | | | 0.4 | |
Food, beverage and tobacco | | | 1,511 | | | | 0.9 | | | | 1,569 | | | | 1.2 | | | | 2,014 | | | | 1.1 | | | | 3,091 | | | | 1.4 | | | | 2,925 | | | | 1.3 | |
Mineral products | | | 37,180 | | | | 21.5 | | | | 20,181 | | | | 15.8 | | | | 32,028 | | | | 17.6 | | | | 44,537 | | | | 19.7 | | | | 42,219 | | | | 18.9 | |
Chemical products and their derivatives | | | 29,466 | | | | 17.0 | | | | 21,577 | | | | 16.9 | | | | 27,219 | | | | 15.0 | | | | 34,601 | | | | 15.3 | | | | 35,628 | | | | 16.0 | |
Plastic and rubber, and their derivatives | | | 9,100 | | | | 5.3 | | | | 7,084 | | | | 5.5 | | | | 10,511 | | | | 5.8 | | | | 13,208 | | | | 5.8 | | | | 12,507 | | | | 5.6 | |
Fur, leather and its derivatives | | | 427 | | | | 0.2 | | | | 338 | | | | 0.3 | | | | 476 | | | | 0.3 | | | | 612 | | | | 0.3 | | | | 595 | | | | 0.3 | |
Wood, wood charcoal and its products, etc | | | 189 | | | | 0.1 | | | | 123 | | | | 0.1 | | | | 149 | | | | 0.1 | | | | 196 | | | | 0.1 | | | | 188 | | | | 0.1 | |
Paste of wood, paper and its derivatives, etc | | | 1,906 | | | | 1.1 | | | | 1,511 | | | | 1.2 | | | | 2,104 | | | | 1.2 | | | | 2,384 | | | | 1.1 | | | | 2,203 | | | | 1.0 | |
Textile materials and their derivatives | | | 3,833 | | | | 2.2 | | | | 3,481 | | | | 2.7 | | | | 5,038 | | | | 2.8 | | | | 6,567 | | | | 2.9 | | | | 6,613 | | | | 3.0 | |
Shoes, hats, etc | | | 410 | | | | 0.2 | | | | 421 | | | | 0.3 | | | | 494 | | | | 0.3 | | | | 642 | | | | 0.3 | | | | 775 | | | | 0.3 | |
Articles of stone, ceramic, glass, etc | | | 1,097 | | | | 0.6 | | | | 866 | | | | 0.7 | | | | 1,335 | | | | 0.7 | | | | 1,835 | | | | 0.8 | | | | 1,951 | | | | 0.9 | |
Natural pearls, precious stones, etc | | | 545 | | | | 0.3 | | | | 369 | | | | 0.3 | | | | 557 | | | | 0.3 | | | | 697 | | | | 0.3 | | | | 649 | | | | 0.3 | |
Common metals and their derivatives | | | 11,480 | | | | 6.6 | | | | 7,783 | | | | 6.1 | | | | 13,372 | | | | 7.4 | | | | 14,244 | | | | 6.3 | | | | 13,788 | | | | 6.2 | |
Machineries and equipments, electric materials, etc | | | 45,624 | | | | 26.4 | | | | 36,611 | | | | 28.7 | | | | 50,799 | | | | 27.9 | | | | 60,115 | | | | 26.6 | | | | 60,163 | | | | 27.0 | |
Transport materials | | | 16,351 | | | | 9.5 | | | | 14,189 | | | | 11.1 | | | | 20,900 | | | | 11.5 | | | | 26,376 | | | | 11.7 | | | | 25,208 | | | | 11.3 | |
Scientific instruments and equipments | | | 6,248 | | | | 3.6 | | | | 5,091 | | | | 4.0 | | | | 6,420 | | | | 3.5 | | | | 6,765 | | | | 3.0 | | | | 6,913 | | | | 3.1 | |
Weapons and ammunition | | | 21 | | | | 0.0 | | | | 28 | | | | 0.0 | | | | 70 | | | | 0.0 | | | | 34 | | | | 0.0 | | | | 27 | | | | 0.0 | |
Goods and diverse products | | | 1,210 | | | | 0.7 | | | | 1,025 | | | | 0.8 | | | | 1,528 | | | | 0.8 | | | | 1,947 | | | | 0.9 | | | | 2,253 | | | | 1.0 | |
Objects of art, collection and antiques | | | 23 | | | | 0.0 | | | | 5 | | | | 0.0 | | | | 7 | | | | 0.0 | | | | 17 | | | | 0.0 | | | | 39 | | | | 0.0 | |
Special transactions | | | 0 | | | | 0.0 | | | | 0 | | | | 0.0 | | | | 0 | | | | 0.0 | | | | 0 | | | | 0.0 | | | | 0 | | | | 0.0 | |
| | | | | | | | | | | | | | | | | | | | | | | | | | | | | | | | | | | | | | | | |
Total | | | 172,985 | | | | 100.0 | | | | 127,722 | | | | 100.0 | | | | 181,768 | | | | 100.0 | | | | 226,246 | | | | 100.0 | | | | 223,149 | | | | 100.0 | |
Source : Ministry of Development, Industry and Trade
The following table sets forth certain details regarding Brazil’s foreign trade for the years indicated.
Table No. 15
Principal Foreign Trade Indicators
| | | | | | | | | | | | | | | | | | | | |
| | | 2008 | | | 2009 | | | 2010 | | | 2011 | | | 2012 | |
Exports as % of GDP | | | 12.0 | % | | | 9.4 | % | | | 9.4 | % | | | 10.3 | % | | | 9.8 | % |
Imports as % of GDP | | | 10.5 | % | | | 7.9 | % | | | 8.5 | % | | | 9.1 | % | | | 9.0 | % |
Trade Balance as % of GDP | | | 1.5 | % | | | 1.6 | % | | | 0.9 | % | | | 1.2 | % | | | 0.8 | % |
Growth (Decline) in foreign trade(1) | | | 31.9 | % | | | –24.3 | % | | | 36.7 | % | | | 25.7 | % | | | –3.4 | % |
Exports—% Increase (Decrease)(2) | | | 23.2 | | | | –22.7 | | | | 32.0 | | | | 26.8 | | | | –5.3 | |
Imports—% Increase (Decrease)(2) | | | 43.5 | | | | –26.2 | | | | 42.3 | | | | 24.5 | | | | –1.4 | |
Exports/Imports(3) | | | 1.14 | | | | 1.20 | | | | 1.11 | | | | 1.13 | | | | 1.09 | |
Exports | | | | | | | | | | | | | | | | | | | | |
$ in millions | | | 197,942 | | | | 152,995 | | | | 201,915 | | | | 256,040 | | | | 242,580 | |
1,000 tons | | | 468,942 | | | | 455,452 | | | | 520,117 | | | | 544,244 | | | | 546,266 | |
% change from prior period(4) | | | 1.6 | | | | –2.9 | | | | 14.2 | | | | 4.6 | | | | 0.4 | |
Imports | | | | | | | | | | | | | | | | | | | | |
$ in millions | | | 173,107 | | | | 127,705 | | | | 181,768 | | | | 226,246 | | | | 223,164 | |
1,000 tons | | | 124,494 | | | | 103,897 | | | | 138,195 | | | | 148,668 | | | | 141,757 | |
% change from prior period(4) | | | 4.7 | | | | –16.5 | | | | 33.0 | | | | 7.6 | | | | –4.6 | |
Trade Balance ($ in millions) | | | 24,836 | | | | 25,290 | | | | 20,147 | | | | 29,794 | | | | 19,416 | |
| (1) | Percentage change in exports and imports from previous year. |
| (2) | Percentage change from previous year. |
| (3) | Exports divided by imports. |
| (4) | Percentage change in volume, by weight. |
Source: Central Bank and Ministry of Development, Industry and Foreign Trade
D-36
The following tables set forth certain information regarding the destination of Brazil’s exports and the sources of its imports for the periods indicated.
Table No. 16
Exports (FOB Brazil) by Region
| | | | | | | | | | | | | | | | | | | | | | | | | | | | | | | | | | | | | | | | |
| | | 2008 | | | 2009 | | | 2010 | | | 2011 | | | 2012 | |
Item | | in
$millions | | | % of
total | | | in
$millions | | | % of
total | | | in
$millions | | | % of
total | | | in
$millions | | | % of
total | | | in
$millions | | | % of
total | |
LAIA(1) | | | 43,095 | | | | 21.77 | | | | 29,897 | | | | 19.54 | | | | 41,202 | | | | 20.41 | | | | 50,076 | | | | 19.56 | | | | 45,050 | | | | 18.57 | |
MERCOSUR | | | 21,737 | | | | 10.98 | | | | 15,829 | | | | 10.35 | | | | 22,602 | | | | 11.19 | | | | 32,444 | | | | 12.67 | | | | 27,858 | | | | 11.48 | |
LAIA ex-MERCOSUR | | | 21,357 | | | | 10.79 | | | | 14,068 | | | | 9.19 | | | | 18,601 | | | | 9.21 | | | | 17,632 | | | | 6.89 | | | | 17,192 | | | | 7.09 | |
USA(2) | | | 27,648 | | | | 13.97 | | | | 15,740 | | | | 10.29 | | | | 19,462 | | | | 9.64 | | | | 25,942 | | | | 10.13 | | | | 26,849 | | | | 11.07 | |
CARICOM(3) | | | 4,812 | | | | 2.43 | | | | 3,180 | | | | 2.08 | | | | 3,707 | | | | 1.84 | | | | 4,171 | | | | 1.63 | | | | 2,481 | | | | 1.02 | |
Canada | | | 1,866 | | | | 0.94 | | | | 1,712 | | | | 1.12 | | | | 2,321 | | | | 1.15 | | | | 3,130 | | | | 1.22 | | | | 3,080 | | | | 1.27 | |
Others America | | | 3,371 | | | | 1.70 | | | | 2,648 | | | | 1.73 | | | | 3,199 | | | | 1.58 | | | | 3,027 | | | | 1.18 | | | | 3,020 | | | | 1.24 | |
EU | | | 46,395 | | | | 23.44 | | | | 34,037 | | | | 22.25 | | | | 43,135 | | | | 21.36 | | | | 52,946 | | | | 20.68 | | | | 48,860 | | | | 20.14 | |
EFTA(4) | | | 2,339 | | | | 1.18 | | | | 1,852 | | | | 1.74 | | | | 2,464 | | | | 1.22 | | | | 2,861 | | | | 1.12 | | | | 2,858 | | | | 1.18 | |
Easter Europe | | | 5,580 | | | | 2.82 | | | | 3,383 | | | | 2.21 | | | | 4,788 | | | | 2.37 | | | | 5,174 | | | | 2.02 | | | | 4,327 | | | | 1.78 | |
Others Europe | | | 1,182 | | | | 0.60 | | | | 892 | | | | 0.58 | | | | 1,345 | | | | 0.67 | | | | 1,777 | | | | 0.69 | | | | 1,527 | | | | 0.63 | |
Asia (ex-Middle Eastern) | | | 37,442 | | | | 18.92 | | | | 40,239 | | | | 25.77 | | | | 56,273 | | | | 27.87 | | | | 76,697 | | | | 29.96 | | | | 75,325 | | | | 31.05 | |
Middle Eastern | | | 8,055 | | | | 4.07 | | | | 7,552 | | | | 4.94 | | | | 10,525 | | | | 5.21 | | | | 12,276 | | | | 4.79 | | | | 11,528 | | | | 4.75 | |
Africa | | | 10,170 | | | | 5.14 | | | | 8,692 | | | | 5.68 | | | | 9,262 | | | | 4.59 | | | | 12,225 | | | | 4.77 | | | | 12,213 | | | | 5.03 | |
Oceania | | | 1,356 | | | | 0.69 | | | | 558 | | | | 0.36 | | | | 662 | | | | 0.33 | | | | 923 | | | | 0.36 | | | | 592 | | | | 0.24 | |
Others | | | 4,631 | | | | 2.34 | | | | 2,614 | | | | 1.71 | | | | 3,570 | | | | 1.77 | | | | 4,814 | | | | 1.88 | | | | 4,871 | | | | 2.01 | |
| | | | | | | | | | | | | | | | | | | | | | | | | | | | | | | | | | | | | | | | |
Total | | | 197,942 | | | | 100.00 | | | | 152,995 | | | | 100.00 | | | | 201,915 | | | | 100.00 | | | | 256,040 | | | | 100.00 | | | | 242,580 | | | | 100.00 | |
| (1) | Latin American Integration Association. |
| (3) | Caribbean Community and Common Market. |
| (4) | European Free Trade Association. |
Source: Ministry of Development, Industry and Foreign Trade.
D-37
The following table sets forth imports by region:
Table No. 17
Imports (FOB Country of Origin) by Region
| | | | | | | | | | | | | | | | | | | | | | | | | | | | | | | | | | | | | | | | |
| | | 2008 | | | 2009 | | | 2010 | | | 2011 | | | 2012 | |
Item | | in
$millions | | | % of
total | | | in
$millions | | | % of
total | | | in
$millions | | | % of
total | | | in
$millions | | | % of
total | | | in
$millions | | | % of
total | |
LAIA(1) | | | 27,281 | | | | 15.77 | | | | 21,944 | | | | 17.18 | | | | 29,844 | | | | 16.42 | | | | 36,150 | | | | 15.98 | | | | 36,715 | | | | 16.45 | |
MERCOSUR | | | 14,934 | | | | 8.63 | | | | 13,107 | | | | 10.26 | | | | 16,620 | | | | 9.14 | | | | 20,642 | | | | 9.12 | | | | 20,247 | | | | 9.07 | |
LAIA ex-MERCOSUR | | | 12,347 | | | | 7.14 | | | | 8,837 | | | | 6.92 | | | | 13,223 | | | | 7.27 | | | | 15,508 | | | | 6.85 | | | | 16,468 | | | | 7.38 | |
USA(2) | | | 25,811 | | | | 14.92 | | | | 20,187 | | | | 15.81 | | | | 27,256 | | | | 14.99 | | | | 34,233 | | | | 15.13 | | | | 32,603 | | | | 14.61 | |
CARICOM(3) | | | 378 | | | | 0.22 | | | | 196 | | | | 0.15 | | | | 529 | | | | 0.29 | | | | 371 | | | | 0.16 | | | | 705 | | | | 0.32 | |
Canada | | | 3,210 | | | | 1.86 | | | | 1,602 | | | | 1.25 | | | | 2,714 | | | | 1.49 | | | | 3,556 | | | | 1.57 | | | | 3,072 | | | | 1.38 | |
Others America | | | 826 | | | | 0.48 | | | | 614 | | | | 0.48 | | | | 547 | | | | 0.30 | | | | 1,264 | | | | 0.56 | | | | 1,297 | | | | 0.58 | |
EU | | | 36,179 | | | | 20.91 | | | | 29,224 | | | | 22.88 | | | | 39,127 | | | | 21.53 | | | | 46,426 | | | | 20.52 | | | | 47,662 | | | | 21.36 | |
EFTA(4) | | | 2,901 | | | | 1.68 | | | | 2,564 | | | | 2.01 | | | | 3,585 | | | | 1.97 | | | | 3,658 | | | | 1.62 | | | | 3,669 | | | | 1.64 | |
Easter Europe | | | 5,338 | | | | 3.09 | | | | 2,105 | | | | 1.65 | | | | 3,023 | | | | 1.66 | | | | 5,175 | | | | 2.29 | | | | 4,109 | | | | 1.84 | |
Others Europe | | | 382 | | | | 0.22 | | | | 434 | | | | 0.34 | | | | 825 | | | | 0.45 | | | | 999 | | | | 0.44 | | | | 1,068 | | | | 0.48 | |
Asia (ex-Middle Eastern) | | | 47,131 | | | | 27.25 | | | | 36,141 | | | | 28.30 | | | | 56,150 | | | | 30.89 | | | | 70,080 | | | | 30.97 | | | | 68,867 | | | | 30.86 | |
Middle Eastern | | | 6,231 | | | | 3.60 | | | | 3,142 | | | | 2.46 | | | | 4,680 | | | | 2.57 | | | | 6,142 | | | | 2.71 | | | | 7,394 | | | | 3.31 | |
Africa | | | 15,761 | | | | 9.11 | | | | 8,466 | | | | 6.63 | | | | 11,297 | | | | 6.22 | | | | 15,436 | | | | 6.82 | | | | 14,266 | | | | 6.39 | |
Oceania | | | 1,310 | | | | 0.76 | | | | 899 | | | | 0.70 | | | | 1,401 | | | | 0.77 | | | | 2,011 | | | | 0.89 | | | | 1,354 | | | | 0.61 | |
Others | | | 247 | | | | 0.14 | | | | 205 | | | | 0.16 | | | | 789 | | | | 0.43 | | | | 745 | | | | 0.33 | | | | 367 | | | | 0.16 | |
| | | | | | | | | | | | | | | | | | | | | | | | | | | | | | | | | | | | | | | | |
Total | | | 172,985 | | | | 100.00 | | | | 127,722 | | | | 100.00 | | | | 181,768 | | | | 100.00 | | | | 226,246 | | | | 100.00 | | | | 223,149 | | | | 100.00 | |
| (1) | Latin American Integration Association. |
| (3) | Caribean Community and Common Market |
| (4) | European Free Trade Association. |
Source: Ministry of Development, Industry and Foreign Trade
Foreign Investment
Foreign Direct Investment (“FDI”) inflows totaled $45.1 billion in 2008, $25.9 billion in 2009, $48.5 billion in 2010 and $66.7 billion in 2011. In 2012, FDI inflows reached $65.3 billion. FDI inflows reached an accumulated amount of U.S.$30.0 billion in the first half of 2013.
Net foreign portfolio investment registered an outflow of approximately $767 million in 2008, but registered an inflow of approximately $46.2 billion in 2009, $67.8 billion in 2010, $18.5 billion in 2011 and $16.5 billion in 2012.
D-38
The following table sets forth information regarding foreign direct and portfolio investment in Brazil for each of the years indicated.
Table No. 18
Foreign Direct and Portfolio Investment in Brazil
| | | | | | | | | | | | | | | | | | | | | | | | | | | | | | | | | | | | |
| | | Inflows ($ millions) | | | Outflows ($ millions) | | | Total ($ millions) | |
| | | Portfolio(1) | | | Direct(2) | | | Total | | | Portfolio(1) | | | Direct(2) | | | Total | | | Portfolio | | | Direct | | | Total | |
| | | (in millions of dollars) | |
2008 | | | 266,460 | | | | 71,836 | | | | 338,296 | | | | 267,227 | | | | 26,778 | | | | 294,005 | | | | –767 | | | | 45,058 | | | | 44,291 | |
2009 | | | 194,451 | | | | 53,507 | | | | 247,958 | | | | 148,292 | | | | 27,558 | | | | 175,851 | | | | 46,159 | | | | 25,949 | | | | 72,107 | |
2010 | | | 175,109 | | | | 78,644 | | | | 253,752 | | | | 107,314 | | | | 30,137 | | | | 137,451 | | | | 67,795 | | | | 48,506 | | | | 116,301 | |
2011 | | | 128,371 | | | | 101,719 | | | | 230,090 | | | | 109,919 | | | | 35,058 | | | | 144,977 | | | | 18,453 | | | | 66,660 | | | | 85,113 | |
2012 | | | 155,250 | | | | 84,256 | | | | 239,505 | | | | 138,716 | | | | 18,984 | | | | 157,700 | | | | 16,534 | | | | 65,272 | | | | 81,806 | |
| (1) | Includes equity securities, bonds, commercial paper and notes, except those related to external debt restructurings. |
| (2) | Includes reinvested earnings and excludes intercompany debt transactions. |
Source: Central Bank
External financing needs, defined as the difference between the current account deficit and net foreign direct investment, have been negative since January 2002. In recent years, rising foreign direct investments have been greater than the current account deficit. In 2012, Brazil’s external financing needs were negative $11.0 billion. Brazil received more through net foreign direct investment ($65.3 billion) than it needed to finance its current account deficit ($54.2 billion). The following table sets forth the external financing needs of Brazil for each of the years indicated.
Table No. 19
External Financial Needs
| | | | | | | | | | | | |
| | | Current Account | | | Foreign Direct Investment | | | External Financial Needs | |
| | | ($million) | | | ($million) | | | ($million) | |
2008 | | | –28,192 | | | | 45,058 | | | | 16,866 | |
2009 | | | –24,302 | | | | 25,949 | | | | 1,646 | |
2010 | | | –47,273 | | | | 48,506 | | | | 1,233 | |
2011 | | | –52,473 | | | | 66,660 | | | | 14,188 | |
2012 | | | –54,230 | | | | 65,272 | | | | 11,041 | |
Source: Central Bank
International Reserves
Brazil’s international reserves have been increasing since 2007. Brazilian international reserves totaled $193.8 billion in 2008, $238.5 billion in 2009, $288.6 billion in 2010 and $352.0 billion in 2011. At the end of 2012, international reserves reached a record level of $373.1 billion, or $21.1 billion more than the value registered at the end of 2011. There was an increase of approximately 6.0% in 2012, largely as a result of purchases made by the Central Bank on the spot exchange market in order to contain appreciation of the real, most notably in the first half of the year, when a strong inflow of dollars to the domestic market led the Central Bank to make interventions almost on a daily basis. In 2012, the purchases made by the Central Bank on the spot market totaled $11.2 billion, compared with purchases of $47.9 billion made in 2011. Interventions by the Central Bank in the foreign exchange market occur in order to avoid excessive volatility, reduce the effects of an appreciated or depreciated exchange rate on inflation and reduce the effects of speculative activity.
The following table sets forth certain information regarding Brazil’s international reserves at the dates indicated.
Table No. 20
| | | | | | | | | | | | | | | | | | | | |
International Reserves As of December 31 | |
| | | 2008 | | | 2009 | | | 2010 | | | 2011 | | | 2012 | |
| | | ($ million) | | | ($ million) | | | ($ million) | | | ($ million) | | | ($ million) | |
Total Gold and Foreign Exchange | | | 191.869 | | | | 229.819 | | | | 277.667 | | | | 344.834 | | | | 365.645 | |
Gold(1) | | | 940 | | | | 1.175 | | | | 1.519 | | | | 1.654 | | | | 3.581 | |
Foreign Exchange | | | 190.929 | | | | 228.644 | | | | 276.148 | | | | 343.180 | | | | 362.064 | |
Special Drawing Rights | | | 1 | | | | 4.510 | | | | 4.450 | | | | 3.980 | | | | 3.987 | |
Other reserve assets(2) | | | 1.913 | | | | 3.244 | | | | 4.422 | | | | 205 | | | | 33 | |
Total Official Reserves | | | 193.783 | | | | 238.520 | | | | 288.575 | | | | 352.012 | | | | 373.147 | |
| (1) | Includes available stock of financial gold plus time deposits. |
| (2) | Includes financial derivatives, loans to nonbank nonresidents (includes export credit), reverse repo (securities borrowed with other securities used as collateral) and others. |
Source: Central Bank
D-39
Foreign Exchange Rates and Exchange Controls
The Brazilian foreign exchange system has been structured to enable the Federal Government, through the Central Bank, to regulate and control foreign exchange transactions carried out in Brazil.
In an attempt to stop the increasing appreciation of the Brazilian real against the U.S. dollar and other foreign currencies, the Federal Government has periodically taken measures to control the inflow of foreign capital. In recent years, a series of modifications to the Financial Transactions Tax (“IOF”) have taken place to ease the flow of foreign investment in the form of short-term bond issues and loans and curb appreciation of the real. On October 19, 2009, the Government announced an increase of the IOF on foreign capital inflows into Brazilian financial and capital markets. Under this rule, transactions that previously qualified for a 0% tax rate became taxed at 2.0%, regardless of whether they are related to short or long term investments in equities or fixed income.
In October 2010, the Brazilian government twice increased the IOF rate levied on exchange transactions related to the inflow of funds for foreign capital investments in the Brazilian market. Transactions subject to the increased tax include investments in fixed income instruments, such as debentures and other private debt instruments (títulos de dívida privada), and investment funds, including multimarket funds (fundos multimercado), stock funds (fundos de ações) and private equity funds (fundos de investimento em participações or “FIPs”). The first increase was made on October 4, 2010, when the transaction rate was increased from 2.0% to 4.0%. This increase was determined to be insufficient and few days later, on October 19, 2010, the applicable rate was increased again from 4.0% to 6.0%. At the same time, the IOF rate on exchange transactions for foreign capital investments related to the posting of margin (either initial or additional) required by the stock, commodities and futures exchanges was increased from 0.38% to 6.0%.
On October 6, 2010, the National Monetary Council authorized the National Treasury to purchase foreign currency on the spot market as much as four years in advance of maturing external debt. The prior limit had been two years. This policy was adopted by the Government, in part, to reduce overvaluation of the real.
On December 1, 2011, the Government implemented a new change to the IOF, extending the tax to derivatives transactions of foreign investors. Although the Government has the power to levy this tax, the IOF tax rate on derivatives has been set to zero since the decree was enacted.
On February 29, 2012 and March 9, 2012, the Government implemented additional changes to the IOF as a part of its efforts to counteract appreciation of the real. Specifically, the IOF tax was expanded to tax, at a 6.0% rate, currency exchange transactions in connection with the entry into Brazil of amounts originated from loans and/or securities contracted and/or issued abroad with an average term equal to or less than 1,800 days (5 years). Earlier, the government had amended the measure to increase the minimum term of loans exempt from tax from two to three years.
On December 5, 2012, the Federal Government announced that the 6.0% IOF entry tax on foreign borrowing would apply to loans with terms in excess of one year, instead of only applying to loans with terms in excess of two years. Brazil’s Finance Minister explained that this change was designed to expand the resources available for local companies to invest in production.
On June 4, 2013, the Federal Government announced it was cutting the IOF rate levied on foreign investments in fixed-income securities from 6% to 0%.
D-40
On June 12, 2013, the Federal Government announced it would no longer charge the IOF on increases in dollar short positions in financial derivatives. According to Minister of Finance Guido Mantega, the removal of the IOF is meant to contain the depreciation in local currency.
The Brazilian Central Bank, through Circular No. 3,662 dated July 11, 2013, eliminated capital requirements that increased the cost for banks of bringing into the country the proceeds of foreign currency loans raised by their subsidiaries abroad.
The real had an exchange rate of R$2.0435 to $1.00 on December 31, 2012. Foreign exchange inflow decreased to $16.8 billion in 2012, compared with foreign exchange inflow of $65.3 billion in 2011. The financial segment reported net inflows of $8.4 billion in 2012, compared to net inflows of $21.3 billion in 2011. Moreover, in 2012 there were net inflows of $8.4 billion in the commercial segment, which had net inflows of $43.9 billion in 2011.
Table No. 21
| | | | | | | | | | | | |
| | | Commercial | | | Financial | | | Total | |
| | | ($million) | | | ($million) | | | ($million) | |
2008 | | | 47,900 | | | | –48,883 | | | | –983 | |
2009 | | | 9,924 | | | | 18,808 | | | | 28,732 | |
2010 | | | –1,650 | | | | 26,004 | | | | 24,354 | |
2011 | | | 43,950 | | | | 21,329 | | | | 65,279 | |
2012 | | | 8,373 | | | | 8,380 | | | | 16,753 | |
Source: Central Bank
Brazilian law provides that whenever there is a serious imbalance in Brazil’s balance of payments or serious reasons to foresee such an imbalance, the Federal Government may, for a limited period of time, impose restrictions on the remittance to foreign investors of the proceeds of their investments in Brazil, as it did for approximately six months in 1989 and early 1990, and on the conversion of Brazilian currency into foreign currencies.
Swap Transactions
The Central Bank may enter into swap transactions, referenced in benchmark interest rates and foreign currencies, for the purposes of providing foreign exchange hedges for financial institutions and other economic agents in the Brazilian market. The Central Bank does not use swaps as a hedge instrument for its own portfolio. It enters into swap transactions only to diminish volatility in the exchange rate market. In other words, when the Central Bank realizes there are market gaps in the foreign exchange yield curve in Brazil, it announces swap auctions and supplies the demand for this instrument. Therefore, foreign exchange swaps represent an alternative tool to the Central Bank’s spot market intervention. As this instrument has short term maturity (usually no more than three months), is settled in Brazilian reais and there is no obligation to make delivery in foreign exchange, there is no material risk for Brazil.
These swaps are contracted through auctions in the Central Bank’s electronic system and are recorded on the BM&FBOVESPA stock, futures and commodities exchange, in the form of a standard agreement. In the long positions of these contracts, the Central Bank is on the asset side in a domestic interest rate (represented by the average rate for domestic interbank deposits (“DI”) for one business day and on the liability side in foreign currency plus a spread rate, which is a representative interest rate in US dollars. Inversely, in the short positions, the Central Bank is on the asset side in foreign currency plus a spread rate and on the liability side in average rates for domestic DI. Each contract has a notional value equivalent to U.S.$50,000 and is adjusted daily. The amount of required collateral is stipulated by the BM&FBOVESPA. Central Bank purchases of these contracts are known in the financial market as exchange swaps, and the selling operations are identified as reverse exchange swaps.
After not engaging in reverse exchange swaps in 2010, the Central Bank resumed reverse exchange swaps in January 2011. The Central Bank’s net exchange rate exposure was R$27.8 billion in 2008; R$0.0 (zero) in each of 2009 and 2010 (when no inverted swaps were sold); R$-3.0 billion in 2011; and R$4.2 billion in 2012. These figures are presented as assets on the balance sheet of the Central Bank when the value is positive and as liabilities when the value is negative.
D-41
On August 22, 2013, the Central Bank announced a program to provide foreign exchange hedging protection to economic actors and liquidity in the foreign exchange market. Effective August 23, 2013 and extending until at least December 31, 2013, the Central Bank will initiate (i) daily auctions of foreign exchange swaps on Mondays through Thursdays and (ii) Friday auctions of dollars with a repurchase commitment. The swap auctions will involve up to U.S.$500 million per day, and up to US$1 billion per day will be offered to the market through the auction of dollars with a repurchase commitment.
D-42
THE FINANCIAL SYSTEM
General
The principal authorities that regulate Brazilian financial institutions are the CMN, which is the highest federal agency responsible for defining Brazilian monetary policy, the Central Bank, which is responsible for the implementation, regulation and supervision of the financial system, and the CVM, which is charged with regulating and supervising the Brazilian capital market.
Banks in Brazil are subject to regulatory standards that are in some cases stricter than international banking standards and have managed recent international financial crises with relative stability. Capital injections and bank profits have kept the sector as a whole solvent, despite increases in the costs associated with financing.
The Brazilian financial system is composed of several types of public and private sector financial institutions. As of December 31, 2012, the Brazilian financial system included 137 multi-service banks, 22 commercial banks, 14 investment banks, and numerous savings and loan, brokerage, leasing and financial institutions. The average leverage level in 2012 for the Brazilian banking system as a whole was approximately 2.7 times shareholders’ equity, and Brazilian private sector financial institutions were generally well capitalized. In addition, public sector banking institutions play an important role in the banking industry. Public sector banks accounted for 50.8% of the banking system’s total demand deposits and 31.9% of total assets in December 2012. A significant portion of the activities of federal and State banks involves the lending of Federal Government funds to industry, agriculture and housing. See “—Public Sector Financial Institutions”.
The reduction of Brazil’s inflation rate brought about by the Plano Real in the 1990s curtailed the profits Brazilian banks had previously earned from investing deposits in Federal Government securities at high interest rates and made it more difficult for certain financial institutions to survive. To assist distressed banks and strengthen the financial system, in the 1990s, the Federal Government instituted a program for restructuring and strengthening private sector banks.
In addition, on November 16, 1995, the Federal Government instituted a deposit insurance system and established a program to restructure Brazil’s State banks. See “—Regulation by Central Bank”.
From the implementation of the Plano Real in the 1990s through December 31, 2012, 181 financial institutions were the subject of Central Bank intervention.
Institutional Framework
The basic framework of the modern Brazilian financial system resulted from the creation of regulatory institutions in the 1950s, 1960s and 1970s, During that period, important institutions were formed, including BNDES, currently one of the world’s largest development agencies, and the Housing Financial System (Sistema Financeiro de Habitação or “SFH”), which is dedicated to housing finance. The CMN, the Central Bank and the CVM were also established during that time.
The CMN is the deliberative body of the National Financial System and is responsible for, among other things: (i) establishing general guidelines for the implementation of monetary, exchange and credit policies; (ii) regulating the operation, supervision and formation of financial institutions; and (iii) regulating the instruments used to implement monetary and exchange rate policies. The CMN is currently composed of three members: the Minister of Finance, the Minister of Planning and Budget and the President of the Central Bank.
The Central Bank is responsible for ensuring the stability of the Brazilian real’s purchasing power and a solid and efficient financial system. The Central Bank also implements the monetary, currency and credit policies established by the CMN. In addition, the Central Bank is the official bank of the National Treasury, but is prohibited by the Constitution from financing the National Treasury, either directly or indirectly. The Central Bank is operationally independent and its president has ministerial rank. The Central Bank is administered by a board of directors. The president and each director are appointed by the President of the Republic, subject to confirmation by the Senate.
The CVM is the regulatory body responsible for the development and regulation of Brazilian stock and debenture markets. It is an autonomous, independent and decentralized agency, but it is linked to the Federal Government. Its main objectives are to promote the integrity of the stock market, ensure the efficient operation of Brazil’s stock exchanges, protect holders of securities and oversee the public issuance and trading of securities.
D-43
Monetary Policy and Money Supply
On July 1, 1999, Brazil formally adopted inflation targeting as its monetary policy framework. Brazilian law provides that: (i) inflation targets are to be established on the basis of variations of a widely known index, the IPCA; (ii) the inflation targets, as well as the tolerance intervals, are to be set by the CMN; (iii) inflation targets are to be set no later than June 30 of the second year prior to the year for which the target is being set; (iv) the Central Bank is responsible for implementing the policies necessary to achieve the targets; (v) the targets will be considered to have been met whenever the observed accumulated inflation during each calendar year falls within specified tolerance levels; (vi) if any target is not met, the Central Bank’s President must issue an open letter addressed to the Finance Minister explaining why the target was not met, the measures to be adopted to ensure that inflation returns to the tolerance levels and the period of time that will be needed for these measures to have an effect; and (vii) the Central Bank is to issue a quarterly inflation report that will provide information on the performance of the inflation targeting framework, the results of the monetary policy actions, and the perspectives regarding inflation. Since 2006, CMN has established an inflation target of 4.5%, with a tolerance level of plus or minus 2.0 percentage points, and the same target has been established for 2013 and 2014.
The Central Bank uses monetary policy instruments, principally the Over/Selic rate (a market-determined overnight rate for operations with federal bonds), to achieve the inflation targets. Since 2004 the Central Bank has fulfilled the inflation targets established by the CMN, and interest rates are gradually converging to lower levels.
The Central Bank reduced the Over/Selic rate target from 19.75% on September 14, 2005 to 11.25% on September 5, 2007. However, the Over/Selic target was raised from 11.25% on April 16, 2008 to 13.75% on September 10, 2008. Due to several economic factors influencing the Brazilian economy, the Central Bank started an expansionary monetary policy to counteract the effects of the 2008/2009 international financial crisis. This cycle of monetary policy began on January 21, 2009, when the Over/Selic rate target was reduced from 13.75% to 12.75%, and ended on July 22, 2009, when the Over/Selic rate target reached 8.75%. The Central Bank initiated a monetary tightening on April 28, 2010, gradually increasing the Over/Selic rate target from 8.75% on April 28, 2010 to 12.50% on July 20, 2011. With signs of additional turmoil in the global economy in 2011, the Over/Selic rate was reduced gradually from 12.50% on August 31, 2011 to 7.25% on October 10, 2012 in a new loosening cycle. The Central Bank raised the Selic interest rate from 7.25% to 7.50% per year on April 17, 2013, as a monetary policy response to persistent inflation, gradually increasing the Over/Selic rate target from 7.25% on April 17, 2013, to 8.50% on June 10, 2013.
The prospect of the US Federal Reserve tapering its quantitative easing policy has created great volatility in international markets. The Federal Government and the Central Bank may adopt several measures in order to contain excessive volatility. To date, COPOM has initiated a tightening monetary cycle at its April 17, 2013 meeting and the Federal Government announced IOF rate cuts on June 4, 2013 and on June 12, 2013. Government authorities are monitoring the market closely, and the Central Bank has reserved the right to intervene in the foreign exchange market in order to avoid excessive volatility, reduce the effects of an appreciated or depreciated exchange rate on inflation and reduce the effects of speculative activity.
Regarding the exchange rate, in a statement on August 19, 2013, the President of the Central Bank reiterated that the Central Bank is aware of the process of global realignment of currencies and closely following the developments in the domestic foreign exchange market. On August 22, 2013, the Central Bank announced a program to provide foreign exchange hedging protection to economic actors and liquidity in the foreign exchange market. Effective August 23, 2013 and extending until at least December 31, 2013, the Central Bank will initiate (i) daily auctions of foreign exchange swaps on Mondays through Thursdays and (ii) Friday auctions of dollars with a repurchase commitment. The swap auctions will involve up to U.S.$500 million per day, and up to US$1 billion per day will be offered to the market through the auction of dollars with a repurchase commitment.
The Central Bank periodically intervenes in the overnight funds market to maintain liquidity in that market and keep the Over/Selic rate close to its target rate. To control the level of liquidity in the economy, among other instruments, the Central Bank also sells securities with repurchase agreements or purchases securities with resale agreements for a future date. Such open market operations are known as “operações compromissadas,” which are indexed to the Over/Selic rate and totaled R$524.0 billion (or 11.9% of GDP) in the year ended December 31, 2012.
D-44
The Central Bank’s monetary and liquidity policies also had the effect of supporting price and financial stability. This allowed Brazil to manage adverse global economic conditions and return to economic growth in late 2009, ahead of many countries.
Since 1999, the Central Bank has attempted to reduce interest rates charged by financial institutions for domestic loans. The spread over the Over/Selic rate was 43.2% in December 1999 and 27.9% in December 2010.
In light of recent structural changes to the Brazilian macroeconomy (including a significant expansion of credit, better employment and income indicators, the steady and significant downward trajectory of interest rates and crucial institutional progress) and structural changes to Brazil’s credit market, the Central Bank revised the kinds of statistics that it maintained in order to provide the public with more information. The revised statistical models are designed to standardize statistical recordkeeping and provide more specific information about credit markets. The Central Bank’s new models affect the way that it reports statistics related to concessions, interest rates, spreads, deadlines and delinquency rates.
Under the new methodology, the spread over the Over/Selic rate was 14.3% in December 2011 and 11.6% in December 2012. For corporate entities, the spread decreased from 9.3% in December 2011 to 6.9% in December 2011. For individuals, the spread was 21.0% in December 2012 and 17.7% in December 2012.
The Federal Government has also implemented several measures to reduce spreads on domestic bank loans and to increase the demand for credit. Such measures can be broadly grouped into three categories: (i) measures to strengthen guarantees and the enforcement of contracts; (ii) measures to increase competition among lenders; and (iii) measures to ease the tax burden and the effects of banking regulations. Specific measures include the approval of amendments to the bankruptcy law and civil code, the dissemination of detailed information on market interest rates on the Central Bank’s website and modifications to the rules relating to the classification of loans and related provisions.
Reserve Requirements. All depositary institutions, commercial banks, multi-service banks, investment banks, development banks, savings and loans and financial institutions are required to satisfy reserve requirements set by the Central Bank. These reserve requirements are applied to a wide range of banking activities and transactions, such as demand deposits, savings deposits, time deposits, debt assumption transactions, automatic reinvestment deposits, funding transactions, repurchase agreements and export notes. Circular No. 3,632, dated February 21, 2013, provides that banks are generally required to deposit 44% of their average daily balance of demand deposits in excess of R$44 million in a non-interest-bearing account with the Central Bank. As of June 2014, the deposit requirement will be increased to 45% of each bank’s average daily balance of demand deposits. Financial institutions with a reserve requirement for cash deposits that are calculated to be R$500,000 or less are exempt from the reserve requirement obligation.
The following table sets forth selected information regarding percentage changes in the monetary base and money supply for the periods indicated.
Table No. 22
Percentage Increases in Monetary Base and Money Supply
| | | | | | | | | | | | | | | | | | | | |
| | | Year Ended December 31, | |
| | | 2008 | | | 2009 | | | 2010 | | | 2011 | | | 2012 | |
Monetary Base(1) | | | 0.6 | | | | 12.6 | | | | 24.6 | | | | 3.6 | | | | 8.9 | |
| | | | | |
M1(2) | | | –3.5 | | | | 12.0 | | | | 12.6 | | | | 1.2 | | | | 13.7 | |
| | | | | |
M2(3) | | | 37.3 | | | | 8.8 | | | | 16.7 | | | | 18.7 | | | | 8.8 | |
| (1) | Monetary base represents Central Bank liabilities, including currency and deposits held by commercial banks. |
| (2) | M1 is currency plus demand deposits. |
| (3) | Preliminary. M2 is M1 plus savings accounts and private securities, bank certificates of deposit (“CDBs”), mortgage bills (letras hipotecárias), real estate bills (letras imobiliárias), bills of exchange (letras de câmbio), and foreign exchange and acceptances. |
Source: Central Bank
D-45
Limitation of Public Sector Debt
Since May 1990, CMN has taken various measures to limit expansion of credit in the public sector. In July 1993, the CMN mandated the creation by the Central Bank of a Public Sector Operations Registration System designed to improve credit controls. The CMN has also limited the ability of public sector financial entities to issue additional public indebtedness. For example, before a State bank can raise funds abroad, it must first have a rating equivalent to investment grade or that of the Republic given by one or more well known international rating agencies.
The Fiscal Responsibility Law severely restricts personnel expenditures and extensions of credit at all levels of government in Brazil and provides ceilings for public sector debt. See “Public Finance—Fiscal Responsibility Law and Fiscal Crime Law”.
Public Sector Financial Institutions
Brazil’s main public sector financial institutions are Banco do Brasil, BNDES and CEF.
Banco do Brasil. Banco do Brasil is one of Brazil’s largest multi-service banks. It is organized as a mixed-capital company, with the Federal Government holding a majority of its voting shares, and is subject to legislation applicable to private sector entities, including all labor and tax legislation. Banco do Brasil functions as a private multiple service bank, although it does engage in some lending programs that implement certain policies established by the CMN. It is also the principal mechanism through which the Federal Government implements its rural credit policy. In addition, Banco do Brasil is responsible for (i) the payment and disbursement of resources required for executing the Federal Budget, (ii) the acquisition and financing of stocks of exportable goods and (iii) arranging payments and receipts made outside of Brazil. It is the main recipient of loans from the National Treasury and federal agencies. On December 31, 2012, Banco do Brasil had assets of U.S.$532.1 billion and shareholders’ equity of U.S.$32.5 billion. Banco do Brasil is currently the largest bank in Latin America by assets.
Pursuant to the terms of Provisional Measure No. 581, dated September 20, 2012 (subsequently enacted as Law No. 12,793, dated April 2, 2013), the National Treasury granted Banco do Brasil R$8.1 billion in federal securities to assist Banco do Brasil in expanding its operations.
BNDES. BNDES, the Federal Government-controlled development bank, is primarily engaged in providing medium- and long-term financing to the Brazilian private sector, particularly to industry, either directly or indirectly through other public and private sector financial institutions. BNDES was also responsible for administering the Federal Government’s privatization program. On December 31, 2012, BNDES and entities under its control had assets of approximately U.S.$339.5 billion and a net worth of approximately U.S.$25.5 billion.
As part of the measures taken to combat the impact of the financial crisis of 2008/2009, the Federal Government decided to lend R$100.0 billion to BNDES in 2009 through transfers of National Treasury bonds. The objective of the operation was to reinforce the flow of business credits, making projects feasible and ensuring continued investment in the Republic.
In 2012, the National Treasury issued securities with a present value of approximately R$55 billion in favor of BNDES. Of this amount, securities with a present value of approximately R$10 billion were issued on January 19, 2012 as the final tranche of a R$55 billion program that was authorized in 2011 to provide funds to BNDES and support long-term corporate investments. The remaining securities, with a present value of approximately R$45 billion, were issued to provide funds to the development bank and support long-term corporate investments as a part of a package of measures announced by the Federal Government in April 2012. From 2009 to 2012, the total securities issued by the National Treasury in favor of BNDES equaled approximately R$285 billion. On June 28, 2013, the National Treasury issued securities with a present value of approximately R$15 billion in favor of BNDES as authorized by Provisional Measure No. 618, dated June 5, 2013.
The “TJLP” or long-term interest rate, is used on loans from BNDES. The CMN reviews the TJLP rate every three months. On June 28, 2013, the CMN elected to keep the rate at 5.0% for the third quarter of 2013.
D-46
CEF. Caixa Econômica Federal, or CEF, a savings bank controlled by the Federal Government, is the principal agent of the Housing Finance System. It is involved principally in deposit-taking and financing for housing and related infrastructure. CEF also is an important instrument for public social policies. The bank is authorized to engage in activities permitted for commercial banks, mortgage companies, and sanitation and urban infrastructure companies. CEF may also provide social services as delegated by the Federal Government. Its main activities are related to raising funds through savings accounts, escrow and time deposits, and investment in loans substantially linked to housing. CEF’s assets on December 31, 2012 were approximately U.S.$343.9 billion, and its shareholders’ equity was approximately U.S.$12.3 billion.
The National Treasury granted CEF R$13 billion in federal securities for purposes of expanding its operational limits, according to the terms of Provisional Measure No. 581, dated September 20, 2012 (subsequently enacted as Law No. 12,793 dated April 2, 2013).
On June 28, 2013, the National Treasury issued securities with a present value of approximately R$8 billion in favor of CEF as authorized by Provisional Measure No. 620, dated June 12, 2013.
Other Financial Institutions. Other federal financial institutions include the Bank of the Amazon (Banco da Amazônia) whose mission is to promote development in the Amazon region, and the Bank of the Northeast of Brazil (Banco do Nordeste do Brasil), which is almost wholly owned by the Federal Government and has the mission of promoting sustainable development in northeastern Brazil, providing technical and financial training. From 1997 to 2008, several State banks were sold to private banks, including Banco do Estado do Rio de Janeiro S.A. (“BANERJ”) and Banco do Estado do Ceará (“BEC”), among others.
Private Sector Financial Institutions
Since 1988, Brazil has permitted the establishment of multi-service banks, which are licensed to provide a full range of commercial banking, investment banking (including securities underwriting and trading), consumer financing and other services, including fund management and real estate finance. As of December 31, 2012, there were 137 private multi-service banks operating in Brazil.
Private sector financial institutions include commercial banks, investment banks, multi-service banks and other financial institutions. Brazil’s 21 private sector commercial banks and 106 private multi-service banks with commercial portfolios are engaged in wholesale and retail banking. They are particularly active in taking demand deposits and lending for short-term working capital purposes. Brazil’s 14 investment banks are engaged primarily in collecting time deposits, specialized lending and underwriting securities. As of December 31, 2012, the consolidated shareholders’ equity of the private sector banking institutions in Brazil was R$592 billion.
Regulation by the Central Bank
The Central Bank is authorized to implement the currency and credit policies prescribed by the CMN and to supervise all financial institutions. Any amendment to a financial institution’s by-laws, increase in its capital or establishment or transfer of its principal place of business or any branch (whether in Brazil or abroad) must be approved by the Central Bank, which is also responsible for determining the minimum capital requirements for financial institutions. The Central Bank is responsible for ensuring that the accounting and statistical requirements established by the CMN are observed. Financial institutions must submit semi-annual financial statements reviewed by each institution’s independent auditors and a formal audit opinion, as well as monthly unaudited financial statements prepared in accordance with the standard accounting rules promulgated by the Central Bank.
As part of the Central Bank’s supervision of their activities, financial institutions are required to make full disclosure of credit transactions, foreign exchange transactions, the use of proceeds raised from export and import transactions, and any other related economic activity. Such data is usually supplied to the Central Bank on a daily basis through computer systems, reports and statements. The Central Bank also supervises the operations of consumer credit companies, securities dealers, stock brokerage companies, leasing companies, savings and loan associations and real-estate credit companies.
The Central Bank is also tasked to provide financial stability in Brazilian markets. Accordingly, in 2011 the Central Bank created the Financial Stability Committee (Comitê de Estabilidade Financeira or “Comef”), with the main objective of monitoring financial stability and establishing guidelines and strategies to mitigate risks to the financial system.
D-47
Central Bank regulations impose capital adequacy, liquidity, savings deposit insurance, and loan loss reserve requirements on regulated financial institutions, among others measures.
Capital Adequacy, Liquidity and Concentration Limits. Since January 1, 1995, Brazilian financial institutions have been required to comply with the Basel Accord on risk-based capital adequacy, modified by Resolution No. 2,099 dated August 17, 1994. In general, the Basel Accord requires banks to maintain a ratio of capital to assets and certain off-balance sheet items, determined on a risk-weighted basis, of at least 11% for risk-weighted assets and 20% for swap transactions. Tier 1, or core, capital includes equity capital (i.e., common shares and non-cumulative permanent preferred shares), share premium, retained earnings and certain disclosed reserves less goodwill. Tier 2, or supplementary, capital includes “hidden” reserves, asset revaluation reserves, general loan loss reserves, subordinated debt and other quasi-equity capital instruments (such as cumulative preferred shares, long-term preferred shares and mandatory convertible debt instruments). Tier 2 capital is limited to the total of a bank’s Tier 1 capital. There are also limitations on the maximum amount of certain Tier 2 capital items. To assess the capital adequacy of banks under the risk-based capital adequacy guidelines, a bank’s capital is evaluated on the basis of the aggregate amount of its assets, liabilities and off-balance sheet exposure. The risk-based capital adequacy guidelines also establish credit conversion formulae for determining the credit risk of off-balance sheet items, such as financial guarantees, letters of credit and foreign currency and interest rate contracts. Under Brazilian modifications to the Basel requirements (i) only Tier 1 capital (as modified with respect to revaluation reserves) may be counted towards the 11% minimum capital requirement, and (ii) the risk weights assigned to certain assets and credit conversion amounts differ to a minor extent.
In June 2004, the Central Bank governors and heads of bank supervisory authorities in the Group of Ten (“G-10”) countries endorsed a new capital adequacy framework known as Basel II. Basel II builds on the structure of the 1988 Basel requirements by aligning the minimum capital requirements more closely to the bank’s actual risk of economic loss. Basel II, among other things, requires higher levels of capital for borrowers that are thought to present higher levels of risk and establishes a new capital charge for exposures to risk of losses caused by operational failures or external events, including natural disasters.
On February 17, 2011, the Central Bank issued Communication No. 20,615 with preliminary guidelines and timetable for the implementation in Brazil of the most recent recommendations of the Basel Committee on Banking Supervision (“Basel III”), and on February 17, 2012, the Central Bank invited the public to comment on proposed Basel III implementation. These recommendations aim to improve prudential regulations on capital and liquidity of financial institutions, as pledged by member countries of the G-20 in November 2010.
On March 1, 2013, the Central Bank released a set of four Resolutions issued by the CMN and announced 15 Central Bank Circulars to be enacted to implement the recommendations of the Basel Committee on Banking Supervision regarding the capital structure of financial institutions in the Brazilian Financial System (“SFN”). Implementation in Brazil of the new capital structure starts on October 1, 2013, and follows the agreed international schedule until the completion of the process, in January 2022.
Measured by the Basel Index, the Brazilian financial system is, in general, well capitalized. In December 2012, the Basel Index of the Brazilian financial system was 16.4%, well above the minimum of 11% required in Brazil (which, in turn, is above the required 8% Basel Index). The Central Bank performs stress tests to estimate the impact of abrupt variations in interest rates and exchange rates on the financial system. Several methodologies are used to perform the stress tests, such as sensitivity analyses, ad-hoc scenario analyses and macroeconomic stress tests. The results through 2012 have shown that, only after extreme deterioration of the Brazilian macroeconomic environment for four consecutive quarters, would the Basel Index register below the regulatory minimum of 11%.
Circular No. 3,086 dated February 15, 2002 applies to investment funds and regulates the accounting for securities held in a fund’s portfolio. It also requires that the securities must be classified as securities for trading or securities to be held to maturity. Securities for trading are required to be marked to market daily. To qualify as securities to be held to maturity, (i) the fund must have the financial capacity to hold such securities until maturity and (ii) the fund must have a single investor (which, if that investor is another fund, must be a fund that itself has a single investor) that has the financial capacity to hold such securities to maturity.
According to Resolution No. 3,490, dated August 29, 2007, financial institutions and other institutions authorized to operate by the Central Bank must maintain, permanently, an amount of Reference Net Worth (Patrimônio de Referencia or “PR”) compatible with the risks of their activities. The value of PR must be above the Required Reference Net Worth
D-48
(“PRE”). The calculation of the PRE should include the exposure of branches abroad. Financial institutions should also maintain sufficient PR to deal with the interest rate risk of operations not included in the trading book. Pursuant to Resolution No. 4,193, dated March 1, 2013, on October 1, 2013 the provisions of Resolution No. 3,490/2007 will be replaced by a new capital maintenance requirement calculation methodology, including new minimum PR requirements and the introduction of additional common equity.
Circular No. 3,568, dated December 21, 2011, established new procedures for calculating the quota of the Required Reference Net Worth regarding the risk of exposures to gold, foreign currency, and assets and liabilities that are subject to exchange rate changes. Effective October 1, 2013, Circular No. 3,634, dated March 4, 2013, will replace Circular No. 3,568/2011 and establish new procedures for calculating exposure to risk-weighted assets (“RWA”).
Resolution No 3,658 dated December 17, 2008, modified and consolidated the legislation relating to the provision of information on credit operations to the Central Bank. The procedure that came into force on March 1, 2009, extended the data set and the required institutions that have to provide the information to the Central Bank for inclusion in the Credit Information System (“SCR”). The inclusion of explanatory notes with qualitative and quantitative information on all financial instruments, as well as a table prepared with a demonstration of sensitivity analysis for each type of market risk, became mandatory for inclusion in the balance sheet of publicly-traded companies, pursuant to a Instruction No. 475 of the CVM, published on December 17, 2008. The sensitivity analysis should show three possible stress scenarios: one where the selected risk variable is considered likely; another projecting a variation of at least 25%, and another of at least 50%.
Derivatives and Investment Securities. The Central Bank has issued two regulations—Circular No. 3,082 dated January 30, 2002 and Circular No. 3,068 dated November 8, 2001—to enhance the transparency of financial reporting by financial institutions. Circular No. 3,082 sets forth hedge accounting rules applicable to financial institutions. It requires, among other things, that all derivatives (including hedging transactions) must be marked to market at least monthly. In addition, derivative transactions that are used for hedging purposes are required to be classified according to the risk that is being hedged—market risk or cash flow—and must be with an unrelated third-party and not another company that is part of the consolidated group. Disclosure of, among other things, the strategy behind these derivative transactions and gains and losses arising from such transactions during the reporting period is also required in the notes to the financial statements. Circular No. 3,068 requires that securities held by financial institutions be classified as securities for sale, securities for trading or securities to be held to maturity. Securities for sale or trading are required to be marked to market. The classification also determines the accounting treatment for such securities, including the recognition of any gain or loss for revenue recognition purposes.
On February 8, 2002, the Central Bank issued Communication No. 9,253, which authorizes financial institutions to enter into swap operations, forward contracts and non-standardized options linked to federal public securities. Resolution No. 3,505 dated October 26, 2007 of the CMN authorizes financial institutions to enter into all kinds of options in the over-the-counter market (not only non-standardized options) as long as the derivative is registered in the over-the-counter market or in a system organized by authorized institutions.
Deposit Insurance. Since 1996, Brazil has had a deposit insurance system which functions through the Credit Guarantee Fund (Fundo Garantidor de Crédito or “FGC”) to protect certain creditors in cases of (i) intervention, nonjudicial liquidation or bankruptcy of an institution or (ii) the Central Bank’s recognition of a state of insolvency at an institution that, according to current law, is not subject to one of the mechanisms listed in (i) above. The participants in the FGC are all financial institutions and savings and loan associations, with the exception of credit cooperatives and the credit sections of cooperatives.
The following liabilities are covered by the guaranty provided by the FGC: demand deposits or those that may be withdrawn through prior notification; savings deposits; time deposits, in both book entry and certificated form; bills of exchange; real estate bonds; mortgage bonds; and agribusiness credit bill. The following liabilities are not covered by the guarantee: liabilities in the name of other institutions that are members of the National Financial System; deposits, loans or any other resources contracted or raised abroad; and credits in the name of certain persons affiliated with an institution, generally managers and other members of the consolidated group of which such institution is a member.
The FGC is a nonprofit, civil association governed by private law and headquartered in the municipality of São Paulo. The FGC is subject to the jurisdiction of the municipality of São Paulo and its duration is unlimited. The FGC guarantee covers up to R$250,000 per person of covered claims against a single institution or against all the institutions of a single financial conglomerate. On December 31, 2012, the net equity value of the FGC was R$31.5 billion.
D-49
CMN Resolution No. 4,222, dated May 23, 2013, revised the regulations governing the FCG. The two main changes, which were already approved by the FCG’s deliberative body, relate to: (i) an increase of the deposit guarantee for each deposit holder with funds in institutions affiliated with the FGC (ordinary guarantee) from R$70,000 to R$250,000; and (ii) the classification of the Agribusiness Credit Bill (Letra de Crédito do Agronegócio or “LCA”), which is a credit instrument issued by a public or private financial institution pegged to agribusiness credit rights, as a guaranteed credit. The increase in the ordinary guarantee amount is designed to provide greater security to deposit holders and other creditors of financial institutions, making the level of guaranteed deposits compatible with those available to depositors in Brazil’s economic peers. The LCA’s inclusion among the guaranteed credits is based on the nature of this financial instrument, which is mainly used in connection with retail operations.
The CMN also granted FCG access to information from the Credit Risk System (SRC) of the Central Bank for the purpose of analyzing credit operations related to Time Deposits with Special Guarantee (Depósitos a Prazo com Garantia Especial or “DPGE”), which serves as a key source of funds used by small and medium-sized banks in Brazil.
Loan Loss Reserves. CMN Resolution No. 2,682, dated December 21, 1999, and Resolution No. 2,697, dated February 24, 2000, introduced a nine-category classification system under which loans and other extensions of credit are assigned ratings ranging from AA to H according to perceived credit risk of the borrower or guarantor and the nature of the credit. The ratings are assigned initially when the extension of credit is made and thereafter are reevaluated on a monthly basis; a rating assigned to any credit is subject to change if there are amounts payable in respect of that credit that are in arrears. Loan-loss provisions vary according to the rating assigned to a particular credit and range from 0% for loans not in arrears) to 100% (for loans more than 180 days in arrears). As of December 2012, 92.4% of the outstanding loans and other extensions of credit of financial institutions operating in Brazil were classified as AA to C (less than 60 days in arrears).
Foreign Currency Loans. Financial institutions in Brazil are permitted to borrow foreign currency-denominated funds in the international markets (either through direct loans or through the issuance of debt securities). CMN Resolution No. 3,844, dated March 23, 2010, regulates the entry of foreign capital into Brazil and also provides for the registration of such foreign capital with the Central Bank. Pursuant to the CMN resolution, financial institutions may borrow foreign currency-denominated funds in the international markets for the purpose of investment in the domestic market, without regard to minimum periods of amortization and retention of the funds in Brazil. Instead, fiscal measures, such as the IOF, are now used to influence short-term capital flow.
CMN adopted Resolution No. 3,833, dated January 28, 2010, requiring the registration of hedge transactions conducted with foreign financial institutions or on a foreign stock exchange.
Payment Settlement System. Through CMN Resolution No. 2,949, dated April 4, 2002, the Central Bank instituted changes to the payment settlement system intended to minimize the systemic and credit risks that had been borne largely by the Central Bank. Under the revised payment system, payment orders in the Reserves Transfer System cannot be processed unless there is a sufficient balance in the paying institution’s reserve account. If the reserve balance is insufficient for the payment order to be processed, the order is queued until the reserve balance is sufficient to make the payment or is rejected. To avoid payment interruptions, the Central Bank introduced an intra-day credit line backed by Brazilian Treasury securities. There is no financial cost for this line, as long as repayment is made the same day; payments not made are treated as overnight loans for which a penalty rate is charged to the institution with the overdraft. This real-time gross settlement system is intended to prevent intra-day overdrafts from being created in the payment system.
Independent Accountants. Pursuant to CMN Resolution No. 3,198, dated May 27, 2004, financial institutions are required to replace their independent accountants no later than every fifth fiscal year. A former independent accountant of a financial institution can be re-hired only after three complete fiscal years have elapsed from its prior engagement by such financial institution. Independent accountants are required to prepare the following reports: (i) a report on the examined audited financial statements with respect to compliance with accounting principles as well as the relevant rules issued by the CMN and the Central Bank; (ii) a report evaluating the quality and adequacy of internal control procedures, including risk assessment criteria and data processing systems; and (iii) a report on the compliance with applicable operational laws and regulations.
Each independent accountant is required to communicate immediately to the Central Bank any event that may materially adversely affect the relevant financial institution’s status. Financial institutions are required to appoint an executive officer to a supervisory role in the area of accounting in order to ensure compliance with auditing and accounting rules and the rendering of accurate information.
D-50
Foreign Banks and Insurance Companies. Under current law, foreign banks duly authorized to operate in Brazil through a branch or a subsidiary are subject to the same rules, regulations and requirements applied to any other Brazilian financial institution. Under the Constitution, the National Congress has the authority to regulate the establishment of new foreign financial institutions in Brazil. However, since the issuance of Ministry of Finance Consideration No. 311 in August 1995, the President has permitted foreign ownership of banks in Brazil by decree, based on national interest. On December 31, 2012, there were 65 foreign-controlled or foreign-affiliated banks operating in Brazil and 17 banks in Brazil with significant foreign participation.
In January 1997, the CMN initiated several measures aimed at liberalizing foreign investment in the financial sector and permitting foreign stock ownership and control of banks in Brazil. In 1998, foreign banks acquired control of 42 financial institutions in Brazil, including 15 banks. Between December 1996 and December 2012, foreign bank participation in the Brazilian financial system’s total assets increased to 13.1% from 9.8%, and foreign bank participation in the Brazilian financial system’s shareholders’ equity increased to 13.5% from 10.3%.
Securities Markets
The CVM implements the policies of the CMN relating to the organization and operation of the securities industry. The CVM is responsible for regulating the country’s stock exchanges, protecting investors and shareholders against fraud or manipulation with respect to any securities traded on the stock exchanges and promulgating accounting and reporting rules to ensure the availability to the public of information on the securities being traded and the companies issuing them. The Central Bank has licensing authority over brokerage firms and dealers and controls foreign investment and foreign exchange transactions.
In 2008, the Brazilian Mercantile & Futures Exchange (Bolsa de Mercadorias & Futuros or “BM&F”) and the São Paulo Stock Exchange (Bolsa de Valores de São Paulo or “BOVESPA”) merged, creating the Securities, Commodities and Futures Exchange (“BM&FBOVESPA S.A.”). BM&FBOVESPA S.A. is one of the largest exchanges in the world in terms of market value, the second largest in the Americas, and a leading exchange in Latin America.
On December 31, 2012, there were 452 companies listed on BM&FBOVESPA S.A. and the aggregate market capitalization of all listed companies was approximately U.S.$1,235.3 billion. As of December 31, 2012, the aggregate trading volume on BM&FBOVESPA S.A. was approximately U.S.$912,4 billion. Trades in securities listed on the Brazilian stock exchanges may be effected off the exchanges in certain circumstances, although the volume of such trading is limited. The table below sets forth some indicators of market activity on BOVESPA in the five years ended December 31, 2012.
Table No. 23
Market Activity on BOVESPA
| | | | | | | | | | | | | | | | | | | | |
| | | 2008 | | | 2009 | | | 2010 | | | 2011 | | | 2012 | |
Number of Listed Companies(1) | | | 439 | | | | 434 | | | | 471 | | | | 466 | | | | 452 | |
Market Capitalization(2) | | | 588,470 | | | | 1,340,900 | | | | 1,542,080 | | | | 1,223,164 | | | | 1,235,270 | |
Market Volume(2) | | | 748,761 | | | | 652,399 | | | | 910,985 | | | | 965,257 | | | | 912,370 | |
| (1) | Under CVM Instruction No. 480/2009, since December 1, 2010, approximately 39 companies with authority to negotiate fixed-income securities started to be counted as stock exchange companies. |
| (2) | In millions of U.S. dollars. |
Source: BOVESPA.
In December 2000, BOVESPA announced the creation of the New Market (Novo Mercado), a special listing segment reserved for the securities of companies that voluntarily undertook to adopt certain corporate governance practices and provide disclosure beyond that required under Brazilian law then in effect. The listing rules (regulamento de listagem), among other requirements, (i) prohibit the issuance by the listed company of preferred (non-voting) shares, (ii) require that shares
D-51
representing not less than 25% of the capital of the listed company remain in circulation and be owned by persons other than the controlling shareholder of the listed company, (iii) require the listed company to offer shares to the public in ways that promote a broad dissemination of the shares, (iv) require the listed company to provide “tag-along” rights to minority shareholders that would permit them to sell their shares for the same terms and conditions as those for the sale by a shareholder of the controlling interest of the listed company, (v) require the listed company to provide to holders annual financial statements that have been prepared in accordance with generally accepted accounting principles of the United States or International Accounting Standards Committee, (vi) provide for enhanced quarterly reporting, and (vii) require the listed company to permit its minority shareholders to appoint a majority of the members of the listed company’s audit committee.
On October 31, 2001, the Federal Government enacted Law No. 10,303, which amended Brazilian corporation law and the law relating to the CVM. Law No. 10,303 imposes, among other things, restrictions on the issuance of preferred (non-voting) shares; under the law, a non-publicly traded company is prohibited from issuing preferred shares in an aggregate amount that exceeds 50% of that company’s capital stock, while publicly traded companies on the date that the law was enacted were permitted to continue issuing preferred shares in an aggregate amount that is not in excess of 2/3 of capital stock. Law No. 10,303 also gives minority shareholders the right to elect (x) two directors if such shareholders hold common shares that represent at least 15% of the voting shares or 10% of the total capital stock, or (y) one director if such shareholders hold common or preferred shares that represent at least 10% of the total capital stock. The directors so elected by the minority shareholders were given veto rights in the appointment of an independent auditor.
Finally, to convert a publicly held corporation into a close corporation, the purchaser is required to offer to purchase the remaining outstanding shares at their fair value (determined in accordance with the guidelines of the CVM). Companies were given one year to amend their bylaws to make these changes, although the 50% limitation on the issuance of preferred shares was made effective immediately. Law No. 10,303 also amended Brazilian securities laws to make market manipulation, insider trading and improper use of one’s position, profession, activity or function crimes punishable by imprisonment and fines. Law No. 10,303 is intended to promote investment in the domestic capital markets by affording additional protections to minority shareholders.
The Brazilian equity market is one of Latin America’s largest in terms of market capitalization. The average daily trading volume rose to U.S.$3.1 billion in 2008, U.S.$2.7 billion in 2009, U.S.$3.7 billion in 2010, U.S.$3.9 billion in 2011 and U.S.$3.7 billion in 2012. Trading on Brazilian stock exchanges by non-residents of Brazil is subject to specific rules under Brazilian foreign investment legislation.
The Brazilian equity market is characterized by significant short-term price volatility. The closing levels (U.S. dollar adjusted) for the IBOVESPA, an index maintained by BM&FBOVESPA, were 16,068 on December 31, 2008, 39,391 on December 31, 2009, 41,592 on December 31, 2010, 30,256 on December 31, 2011, and 29,827 on December 31, 2012.
D-52
PUBLIC FINANCE
Consolidated Public Sector Fiscal Performance
The consolidated public sector account includes the accounts of three tiers of government (federal, State and municipal) and their respective public companies (state-owned non-financial federal, State and municipal companies), as well as the Central Bank and the public social security system. In the disclosure below, the concept of public debt includes non-financial institutions as well as public funds that have no characteristics of financial intermediaries (i.e., those whose sources of funds are fiscal or para-fiscal contributions). It also includes the financial results of the Brazil-Paraguay joint electric energy company, Itaipu (Itaipu Binacional). Following the adoption of several important structural reforms, the Federal Government has pursued an objective of sustained surplus in the fiscal performance of the consolidated public sector as measured by the primary balance.
Fiscal balance in Brazil is measured by the financial balance, or nominal balance, and the primary balance, each of which is calculated according to the official statistical guidelines of the IMF:
| | • | | Financial Balance or Nominal Balance, which is referred to as the Public Sector Borrowing Requirement (“PSBR”), is calculated as the difference between the level of consolidated public sector debt in one period and the level of such debt in the previous period, excluding the effects of the Federal Government’s privatization program and the effect of exchange rate fluctuations on the debt levels between periods; |
| | • | | Primary Balance is the financial balance (or nominal balance) less net borrowing costs of the Federal Government. |
The PSBR was 2.0% of GDP in 2008, 3.3% of GDP in 2009, 2.5% of GDP in 2010, 2.6% of GDP in 2011 and 2.5% of GDP in 2012.
In recent years Brazil’s consolidated public sector primary surplus has been around 2.8% of GDP. It was R$103.6 billion (3.4% of GDP) in 2008. It reached R$64.8 billion (2.1% of GDP) in 2009, due to the international financial crisis, but increased to R$101.7 billion (2.8% of GDP) in 2010 and R$128.7 billion (3.1% of GDP) in 2011. In 2009, as a result of the Government’s response to the international crisis, the consolidated public sector primary surplus included the Growth Acceleration Program investment rebates (0.6% of GDP), so that the adjusted surplus target for the year was achieved. In 2012, Brazil’s consolidated public sector primary surplus was R$104.9 billion (2.4% of GDP).
The 2012 full consolidated public sector primary balance target of R$139.8 billion initially could not be met due to a decrease in tax revenue collections and more than R$45 billion in tax incentives offered as economic stimulus for local investments. As a result, the Federal Government deployed additional resources to achieve its consolidated public sector primary balance target. As authorized in the Budget Guideline Law (Lei de Diretrizes Orçamentárias, or “LDO”) for 2012, the Federal Government deducted R$39.3 billion of PAC expenses. Because State governments were unable to meet their fiscal target (R$42.8 billion) by R$21.3 billion, the Federal Government also used resources (R$12.4 billion) from its sovereign wealth fund (“FSB”) to supplement its revenue. The Federal Government also brought forward dividend payments from state-run enterprises, a measure that is contemplated in the law and in the budget. Part of the dividend payments was transferred to the Federal Government and another part was used to capitalize state-run enterprises, companies and banks. Through these measures, the target was met and public net debt declined for the year, from 36.4% of GDP in 2011 to 35.2% in 2012.
In the first half of 2013, the public sector registered a primary surplus of R$52.2 billion (2.3% of GDP) compared to R$65.7 billion (3.1% of GDP) in the first half of 2012. For the 12-month period ended June 30, 2013, the accumulated surplus was R$91.5 billion (2.0% of GDP).
Since 2011, the primary surplus targets have been fixed in nominal terms, calculated as an amount equivalent to 3.1% of the GDP projected for the next year in the LDO. The LDO for 2013 (Law No. 12,708, dated August 17, 2012) established as a target for 2013 a consolidated public sector primary surplus of R$155.9 billion (in nominal terms), and allows the deduction of up to R$65.2 billion of public expenditures under PAC, the Brazil Without Poverty Plan and tax exemptions. See “—2013 Budget”.
Set forth below are the public sector borrowing requirements for the five-year period ending December 31, 2012. In addition to the cash balance of the National Treasury, the public sector borrowing requirements include the borrowing requirements of public enterprises, the social security system, the Central Bank, States and municipalities and public funds.
D-53
Table No. 24
| | | | | | | | | | | | | | | | | | | | | | |
Public Sector Borrowing Requirements Historical Summary(1) | | | | | | | | | | | | | | | |
| | | | | 2008 | | | 2009 | | | 2010 | | | 2011 | | | 2012 | |
Selected Economic Indicators | | | | | | | | | | | | | | | | | | | | | | |
| | Real GDP Growth(2) | | | 5,2 | % | | | –0,3 | % | | | 7,5 | % | | | 2,7 | % | | | 0,9 | % |
| | Monetary Base (end of period) change | | | 0,6 | % | | | 12,6 | % | | | 24,6 | % | | | 3,6 | % | | | 8,9 | % |
| | Real interest rate(3) | | | 6,2 | % | | | 5,4 | % | | | 3,7 | % | | | 4,8 | % | | | 2,5 | % |
| | | | | | |
Public Finance(4) | | | | | | | | | | | | | | | | | | | | | | |
| | | | | | |
| | Nominal Balance | | | (2,0 | ) | | | (3,3 | ) | | | (2,5 | ) | | | (2,6 | ) | | | (2,5 | ) |
| | Primary balance | | | 3,4 | | | | 2,0 | | | | 2,7 | | | | 3,1 | | | | 2,4 | |
| | Interest rate | | | 2,0 | | | | 5,6 | | | | 0,6 | | | | 3,8 | | | | 1,4 | |
1-Surplus (deficit).
2-Accumulated change from prior period.
3-Accumulated change in the fiscal year, deflated by the IPCA.
4-All figures expressed as a percentage of GDP.
Source: Central Bank
The table below shows the contributions of the federal, State and local governments and public sector enterprises with regard to the PSBR.
Table No. 25
Public Sector Borrowing Requirements by Sector (1)(3)
| | | | | | | | | | | | | | | | | | | | | | |
Item | | | | % of GDP2008(2) | | | % of GDP2009(2) | | | % of GDP2010(2) | | | % of GDP2011(2) | | | % of GDP2012(2) | |
Total(4) | | | | | | | | | | | | | | | | | | | | | | |
| | Nominal | | | –2,0 | | | | –3,3 | | | | –2,5 | | | | –2,6 | | | | –2,5 | |
| | Primary | | | 3,4 | | | | 2,0 | | | | 2,7 | | | | 3,1 | | | | 2,4 | |
Federal Government | | | | | | | | | | | | | | | | | | | | | | |
| | Nominal | | | –0,8 | | | | –3,3 | | | | –1,2 | | | | –2,1 | | | | –1,4 | |
| | Primary | | | 2,4 | | | | 1,3 | | | | 2,1 | | | | 2,3 | | | | 2,0 | |
State and Local Government | | | | | | | | | | | | | | | | | | | | | | |
| | Nominal | | | –1,2 | | | | 0,1 | | | | –1,3 | | | | –0,5 | | | | –1,0 | |
| | Primary | | | 1,0 | | | | 0,7 | | | | 0,6 | | | | 0,8 | | | | 0,5 | |
Public Sector Enterprises | | | | | | | | | | | | | | | | | | | | | | |
| | Nominal | | | –0,1 | | | | 0,0 | | | | 0,0 | | | | 0,0 | | | | –0,1 | |
| | Primary | | | 0,1 | | | | 0,0 | | | | 0,1 | | | | 0,1 | | | | 0,1 | |
D-54
| (2) | Reflects the ratio of flows to GDP, both valued for the last month of the period. |
| (3) | Petrobrás, the state-controlled oil company that had historically accounted for approximately 0.5% of the primary surplus of the federal budget in nominal terms, was removed from the calculation of the primary surplus beginning in 2009. Eletrobrás, the state-controlled electricity holding company that historically had accounted for approximately 0.2% of the primary surplus of the federal budget in nominal terms, was also removed from the calculation of the primary surplus beginning in 2010. The IMF publication Government Finance Statistics 2001 recommends that federal state-owned companies be excluded from the fiscal accounts of the public sector. |
Source: Central Bank.
Budget Process
The Federal Government’s fiscal year is the calendar year. Responsibility for the preparation of the federal budget rests with the executive branch, although the National Congress plays a major role in budget determinations. The budget proposal is prepared based upon discussions among representatives from the National Treasury of the Ministry of Finance and the Federal Budget Secretariat (Secretaria de Orçamento Federal or “SOF”), jointly with the Planning and Strategic Investments Secretariat (Secretaria de Planejamento e Investimento Estratégico). After discussions among representatives of SOF, the National Treasury and each other Ministry, SOF submits a formal proposal of the LDO for the succeeding fiscal year to the President of the Republic. The President, in turn, submits the LDO proposal, with revisions, if any, to the National Congress. The LDO proposal for the following year must be submitted to the National Congress by April 15.
The federal LDO sets the macroeconomic and fiscal targets for the Government and nonfinancial enterprises. It also provides guidelines on budget formulation and execution. As required by the Fiscal Responsibility Law (Lei de Responsabilidade Fiscal or “LRF”), the LDO presents historical data about how the budget was executed in the preceding two fiscal years. It also includes fiscal targets and fiscal risks and projections for the following two years in terms of primary balances, debt stock, and revenue and expenditure aggregates.
At each level of government the LDO is prepared before the Annual Budget Law (Lei Orçamentária Annual or “LOA”). The LDO provides a basis for drafting the LOA, as the LDO sets out the main fiscal targets and priorities of the administration, including the capital expenditures for the subsequent fiscal year, along with the fiscal risks.
The National Congress is charged by law to approve and submit the LDO to the President by July 17 and may not begin its winter recess until it does so. The LDO becomes effective immediately if the National Congress approves the presidential proposal without revision. If the National Congress alters any item of the proposal, the President may veto any provision of the revised LDO. All provisions that are not vetoed become effective upon presidential signature. The National Congress may override the veto by a two-thirds majority vote. If the veto is overridden, the provision becomes effective upon the override.
The executive branch is charged with submitting to the National Congress a detailed budget proposal for the following fiscal year (Proposta de Lei Orçamentária) that is consistent with the broad guidelines set forth in the LDO. Each ministry proposes a detailed budget with respect to its operations, and SOF meets with each ministry to discuss its proposal. SOF finalizes a federal budget proposal, which it submits to the President, who may revise the proposal. The President is then required to submit the budget, as revised, to the National Congress by August 31.
The National Congress may itself propose revisions to the President’s proposed budget. The National Congress may not, however, propose alterations on any items regarding payments of external debt that the Republic has incurred. By December 22, the National Congress must submit to the President its approved budget for the following year.
The President is granted 15 days to review and sign the budget. If the National Congress alters any item of the proposal, the President may veto any provision of the revised LOA. If the President signs the budget or a veto is overridden prior to the end of the year, the provisions that are not vetoed or for which the veto has been overridden become effective as of January 1 of the following year as the LOA.
D-55
According to the Fiscal Responsibility Law, a Presidential Budget Implementation Decree (Decreto de Programação Orçamentário-Financeiro) should be issued within 30 days of Congress enacting the budget. The Implementation Decree provides a monthly schedule of revenues and expenditures. This schedule can subsequently be revised every two months in light of the performance of revenues, with adjustments in annual cash expenditure limits for each ministry as well as the amount of commitments that each ministry can enter into during each month. The Brazilian Constitution contains provisions that guarantee the funding of three types of government expenditures: revenue-sharing with States and municipalities, salaries (and pensions) for government employees; and interest on, and repayment of, the public debt.
Within 30 days after the end of each two-month period, the Federal Government publishes a summary report of the budget execution, as required by the Constitution. At the end of a two-month period, if the Federal Government finds that the budgeted amounts may prevent achievement of the primary surplus target, it will limit expenditures and financial transactions in order to achieve the surplus target.
Constitutional Amendment No. 32, effective since September 12, 2001, provides that the implementation of multi-year plans and budgets must occur through formal legislation and cannot be implemented through provisional measures. See “The Federative Republic of Brazil—Form of Government and Political Parties”.
Petrobrás, the state-controlled oil company that had historically accounted for approximately 0.5% of the primary surplus of the federal budget in nominal terms, was removed from the calculation of the primary surplus beginning in 2009. Eletrobrás, the state-controlled electricity holding company that historically had accounted for approximately 0.2% of the primary surplus of the federal budget in nominal terms, also was removed from the calculation of the primary surplus beginning in 2010. The IMF publication Government Finance Statistics 2001 recommends that federal state-owned companies be excluded from the fiscal accounts of the public sector.
The target set for public enterprises changed in 2009 primarily due to the withdrawal of Petrobrás Group companies from this category in May 2009. The Federal Government no longer includes the assets and liabilities of the Petrobrás Group companies in the calculation of Net Public Sector Debt (“DLSP”), and anticipated flows from transactions of the companies no longer affect DLSP and the financing needs of the Public Sector. Similarly, Eletrobras was also removed from public enterprise calculations in November 2010.
2013 Budget
The LDO for 2013 (Law No. 12,708, dated August 17, 2012) established a 2013 primary surplus target of R$155.9 billion for the consolidated public sector and R$108.1 billion for the Central Government. It also authorized the deduction of up to R$65.2 billion of public expenditures under the PAC, the Brazil Without Poverty Plan and tax exemptions when calculating the 2013 primary balance.
On May 22, 2013, the Federal Government announced a R$28 billion reduction in budget spending in 2013, but with all spending for previously identified priority investments to be preserved, including resources for social policies. On July 22, 2013, the Federal Government announced a further reduction of U.S.$10 billion in budget spending, including U.S.$5.6 billion in mandatory spending and U.S.$4.4 billion in discretionary spending, which will be used as additional primary reserves to offset possible lower-than-projected revenues from States and municipalities.
The principal assumptions underlying the 2013 budget estimates are set forth below.
Table No. 26
Principal 2013 Budget Assumptions
| | | | |
| | | Year Ending | |
| | | December 31,
2013 | |
Gross Domestic Product | | | | |
Nominal GDP (billions of reais) | | R$ | 4,834.4.0 | |
Real GDP Growth | | | 3.0 | % |
Inflation | | | | |
Domestic Inflation (IPCA) | | | 5.70 | % |
Source: SEPLAN/ SOF Federal Budget Secretarial
D-56
The following table sets forth revenues and expenditures of the Federal Government in 2011 and 2012, and as projected in the 2013 budget.
Table No. 27
| | | | | | | | | | | | |
| Primary Balance of the Central Government and 2013 Budget(1) | |
Year Ending December 31 | | | | | | | | | |
| | | 2011 | | | 2012 | | | 2013 Budget | |
1 - Total Revenues | | | 990.4 | | | | 1062.2 | | | | 1229.5 | |
1.1 - Treasury Revenues | | | 741.3 | | | | 783.4 | | | | 762.9 | |
1.1.1 - Gross Revenue | | | 757.4 | | | | 802.8 | | | | | |
Taxes | | | 355.9 | | | | 372.7 | | | | — | |
Social contributions | | | 285.7 | | | | 304.5 | | | | — | |
Other | | | 115.9 | | | | 125.7 | | | | 152.6 | |
Oil Exploration Concession | | | — | | | | — | | | | — | |
1.1.2 - (-) Restitutions | | | (15.9 | ) | | | (19.2 | ) | | | — | |
1.1.3 - (-) Fiscal Incentives | | | (0.3 | ) | | | (0.1 | ) | | | — | |
1.2 - Social Security Revenues | | | 245.9 | | | | 275.8 | | | | 314.1 | |
1.2.1 - Social Security Revenues - Urban | | | 240.5 | | | | 270.0 | | | | — | |
1.2.2 - Social Security Revenues - Rural | | | 5.4 | | | | 5.8 | | | | — | |
1.3 - Central Bank Revenues | | | 3.2 | | | | 3.0 | | | | — | |
2 - Transfers to States and Municipalities | | | 172.5 | | | | 181.4 | | | | 199.8 | |
3 - Total Net Revenue | | | 817.9 | | | | 880.8 | | | | 1029.7 | |
4 - Total Expenditures | | | 724.4 | | | | 805.0 | | | | 942.5 | |
4.1 - Treasury Expenditures | | | 439.2 | | | | 484.6 | | | | — | |
4.2 - Social Security Benefits | | | 281.4 | | | | 316.6 | | | | — | |
4.3 - Central Bank Expenditures | | | 3.8 | | | | 3.8 | | | | — | |
5 - Brazilian Sovereign Wealth Fund (FSB) | | | 0.0 | | | | 12.4 | | | | — | |
6 - Primary Balance(2) | | | 93.5 | | | | 88.3 | | | | 108.1 | |
6.1 - National Treasury | | | 129.6 | | | | 129.8 | | | | — | |
6.2 - Social Security | | | (35.5 | ) | | | (40.8 | ) | | | — | |
6.3 - Central Bank Result | | | (0.6 | ) | | | (0.8 | ) | | | — | |
7 - Methodological Adjustment | | | 1.1 | | | | 1.3 | | | | 0.0 | |
8 - Statistical Discrepancy | | | (1.6 | ) | | | (3.5 | ) | | | 0.0 | |
9 - Central Government Primary Balance | | | 93.0 | | | | 86.1 | | | | 108.1 | |
10 - Nominal Interest | | | (180.6 | ) | | | (147.3 | ) | | | (140.3 | ) |
11 - Central Government Nominal Outcome | | | (87.5 | ) | | | (61.2 | ) | | | (32.2 | ) |
1-Consolidated accounts of the National Treasury, Social Security and the Central Bank.
2-Above the line. Surplus/(deficit).
Source: Ministry of Finance/National Treasury Secretariat and Federal Budget Secretariat
Under Constitutional Amendment No. 27, dated March 21, 2000, which became effective on March 22, 2000, the Federal Government created the Desvinculação de Recursos da União, or DRU. It is a temporary budget control mechanism which allows the government to reallocate 20% of budget resources for priority purposes, thus adding flexibility to the budget. In other words, 20% of certain tax revenues that the Federal Government would otherwise have been required to devote to specific program areas under the Constitution may be reallocated to other expenses at the Government´s discretion. On December 21, 2011, the National Congress approved Constitutional Amendment No. 68, which extended the DRU until 2015.
D-57
The following table sets forth the expenditures of the Federal Government in the years indicated, by function. The figures in this table are not directly comparable with those set forth in the table above entitled “Primary Balance of the Federal Government and 2013 Budget”, because the expenditures set forth in the table above were calculated in accordance with the IMF methodology, which does not include, among other things, debt service expenditures and certain financial investments.
Table No. 28
Expenditures of the National Treasury by Function
(in millions of dollars)(1)
| | | | | | | | | | | | | | | | | | | | |
| | | 2009 | | | 2010 | | | 2011 | | | 2012 | | | 2013 | |
| | | | | | | | | | | | | | | Budget(2) | |
| | | | | |
Legislative | | | 2.115 | | | | 2.645 | | | | 2.955 | | | | 2.616 | | | | 3.491 | |
| | | | | |
Judiciary | | | 10.393 | | | | 12.966 | | | | 13.799 | | | | 11.905 | | | | 14.443 | |
| | | | | |
Administration and Planning | | | 6.693 | | | | 9.064 | | | | 9.211 | | | | 8.335 | | | | 13.159 | |
| | | | | |
Agriculture | | | 5.491 | | | | 5.032 | | | | 5.524 | | | | 5.021 | | | | 11.887 | |
| | | | | |
Communications | | | 183 | | | | 283 | | | | 377 | | | | 364 | | | | 800 | |
| | | | | |
National Defense and Public Security | | | 14.441 | | | | 19.888 | | | | 19.878 | | | | 18.067 | | | | 21.829 | |
Regional Development | | | — | | | | — | | | | — | | | | — | | | | — | |
| | | | | |
Education, Culture and Citizenship Rights | | | 15.150 | | | | 23.014 | | | | 26.870 | | | | 27.478 | | | | 39.034 | |
| | | | | |
Energy and Mineral Resources | | | 302 | | | | 277 | | | | 299 | | | | 320 | | | | 548 | |
| | | | | |
Housing and Urban Planning | | | 876 | | | | 1.064 | | | | 756 | | | | 638 | | | | 4.793 | |
| | | | | |
Industry, Commerce and Services | | | 1.334 | | | | 1.642 | | | | 1.625 | | | | 1.580 | | | | 3.867 | |
| | | | | |
Foreign Affairs | | | 719 | | | | 994 | | | | 1.061 | | | | 1.062 | | | | 980 | |
| | | | | |
Health and Sanitation | | | 24.845 | | | | 31.295 | | | | 37.556 | | | | 36.343 | | | | 47.287 | |
| | | | | |
Labor | | | 14.264 | | | | 17.547 | | | | 21.353 | | | | 21.144 | | | | 29.443 | |
| | | | | |
Assistance and Social Security | | | 161.879 | | | | 206.859 | | | | 241.032 | | | | 232.209 | | | | 242.025 | |
| | | | | |
Transportation | | | 4.128 | | | | 6.727 | | | | 6.362 | | | | 6.105 | | | | 12.107 | |
| | | | | |
Environmental Management | | | 774 | | | | 1.103 | | | | 1.295 | | | | 1.326 | | | | 3.946 | |
| | | | | |
Science and Technology | | | 2.419 | | | | 3.035 | | | | 3.055 | | | | 3.057 | | | | 4.983 | |
| | | | | |
Agricultural Organization | | | 1.221 | | | | 1.263 | | | | 1.226 | | | | 955 | | | | 2.742 | |
| | | | | |
Sports and Leisure | | | 76 | | | | 144 | | | | 184 | | | | 191 | | | | 1.651 | |
| | | | | |
Special Charges | | | 269.086 | | | | 248.647 | | | | 259.482 | | | | 344.219 | | | | 586.334 | |
Intergovernment Transfers | | | — | | | | — | | | | — | | | | — | | | | — | |
| | | | | |
Contingency Reserve | | | — | | | | — | | | | — | | | | — | | | | 21.603 | |
| | | | | |
SubTotal | | | 536.388 | | | | 593.488 | | | | 653.902 | | | | 722.936 | | | | 1.066.951 | |
| | | | | |
Refinancing Charges | | | 133.254 | | | | 212.265 | | | | 286.258 | | | | 152.936 | | | | — | |
| | | | | |
Total | | | 669.642 | | | | 805.753 | | | | 940.160 | | | | 875.872 | | | | 1.066.951 | |
1-Converted to U.S. dollars using the annual average commercial exchange rate (sell side).
2-Estimates. Source: General Budget of the Republic-Secretariat of Budget and Finance.
Source: Federal General Balance Sheet-Ministry of Finance
D-58
On April 15, 2013, the Federal Government sent to Congress a draft 2014 LDO. In the draft law, the Federal Government assumes an increase in the minimum wage from R$678 to R$719.48 in 2014. The draft law also sets funding for the Brazil Without Poverty program and PAC, which includes the My House, My Life Program, as priorities. In addition, the draft law sets a public sector nominal primary balance target for 2014 at R$167.4 billion (approximately 3.1% of GDP). Of this amount, the draft law projects R$67 billion in deductions and exemptions for priority investments. The draft law also aims to reduce public sector net debt, which stood at 60.4% of GDP in 2002, to 26.4% of GDP by 2016. The macroeconomic parameters contemplated by the draft law assume inflation of 4.5% for each of the years ending December 31, 2014, 2015 and 2016, with the Selic rate remaining constant at 7.25%. The draft law also assumes GDP growth of 4.5% for 2014, 5.0% for 2014 and 4.5% for 2016.
Taxation and Revenue Sharing Systems
The Brazilian taxation system operates at all levels of government and includes a broad variety of taxes. The Constitution authorizes the levying and collection of taxes by the taxing authorities of federal, State and municipal governments, and mandates that the Federal Government share a portion of its tax revenues with the States, municipalities and other institutions. The Federal Government collects taxes on personal and corporate income, industrial products (through the Imposto sobre Produtos Industrializados or “IPI”), rural property (through the Imposto sobre a Propriedade Territorial Rural, or “ITR”), financial transactions (through the IOF), certain mandatory contributions to the social security system from legal entities, employers and employees, and import and export tariffs. Municipalities and the Federal District collect taxes on urban property, transfers of property rights and services.
The tax burden in 2011 was 35.3% of GDP, as compared to 33.5% of GDP in 2010. The total amount of tax revenue collected in 2011 was R$1,462.9 billion. From this amount, 70.0% was collected by the Federal Government, 24.4% by the States and 5.5% by municipalities. Taxes in 2011 were derived mainly from the ICMS (21.4%), the Federal Income Tax (18.4%), Social Security (17.7%) and the Contribution for the Financing of Social Security or COFINS (11.9%).
The IOF tax, IPI, and PIS/CONFINS have been used as instruments to encourage certain activities through the application of a reduction or exemption. For example, projects in infrastructure sectors such as transportation, ports, energy and basic sanitation have been exempt from PIS/COFINS. These benefits are available for any purchases of machinery, equipment, construction materials and services acquired in Brazil and abroad.
Micro or small companies are eligible to participate in a simplified tax collection system known as “Simples Nacional,” which enables these companies to pay a single unified tax based on their level of gross revenues, rather than paying several different taxes. The Simples Nacional, established by Complementary Law No. 123, dated December 14, 2006, became effective on July 1, 2007. This law replaced the “Simples Federal” Law No. 9,317, dated December 5, 1996, merging six different federal taxes (Corporate Income Tax, IPI, CSLL, COFINS, PIS and employers’ contribution to social security), the ICMS at the State level and the Imposto Sobre Serviço at the municipal level. Under this system, taxes for micro and small companies will range from 4.0% to 17.4%, depending on each company’s business activity.
Income Taxation.
Brazil’s individual income tax rates for 2012 are progressive, at the following rates: 0%, 7.5%, 15.0%, 22.5% and 27.5%. The minimum taxable annual income is currently R$20,529.36. Income below that level is excluded from income taxes. Brazil offers only a restricted number of tax deductions.
D-59
For corporate and other legal entities the basic tax rate is 15.0%, while the surtax on taxable net income exceeding R$20,000 multiplied by the number of months of the period recorded is 10.0%; and the tax related to social welfare (Contribuição Social Sobre o Lucro Líquido or “CSLL”) levied on net profit is 9.0% with respect to enterprises in general, and 15.0% in the case of financial institutions.
For financial transactions on the fixed income market, the income tax rates for Brazilian citizens are also progressive, at the following rates: 15.0%, 17.5%, 20.0% and 22.5%. For foreigners, the income tax on fixed income was reduced from 15.0% to 0% in February of 2006.
Value Added and Other Taxes. The federal value added tax on manufactured products is levied at scheduled rates at each stage of the production and distribution process. Import and export tariffs are based on published tariff schedules.
The ICMS (the value added tax in Brazil) is a tax based on the movement of goods and services through interstate and inter-municipal transportation and communication. It is a tax that each State and the Federal District may establish, as determined by the 1988 Federal Constitution. The ICMS is a non-cumulative tax, allowing for the offset of the amount previously charged against the amount owing on each transaction or service. Since September 13, 1996, exports of primary and semi-finished goods and the acquisition of certain fixed assets have been exempted from paying the ICMS (Complementary Law No. 87 or “Kandir Law”).
The IOF was created by Law No. 5,143, dated October 20, 1966, and is a tax levied on transactions related to credit, foreign exchange, insurance, securities and gold (as a financial asset). Changes in the IOF are made by Presidential Decree.
Social Contributions. Business entities are required to make three contributions to social welfare funds: Contribution on Net Profit (“CSLL”), Contribution for Funding of Social Security (“COFINS”) and Contribution to the Social Integration Program and Civil Service Asset Formation Program (“PIS/PASEP”). CSLL is levied on net profit at a rate of 15% for financial institutions and 9% for other institutions. COFINS and PIS/PASEP have similar rules, with the mandatory contribution varying depending on the type of entity making the mandatory contribution.
Revenue Sharing. The Federal Government is required to transfer 48.0% of the proceeds from the IPI and the income tax as follows: (i) 21.5% to the States and Federal District Participation Funds, (ii) 23.5% to the Municipalities Participation Funds and (iii) 3.0% to the financing programs for the productive sectors in the North, Northeast and Central West Regions. The Federal Government must also transfer another 10.0% of the proceeds of the IPI to the States and Federal District ratably in proportion to their respective exports of manufactured products.
The Constitution also mandates the distribution to, or sharing with, the States and municipalities of certain other types of taxes collected by the Federal Government. For example, the Federal Government must share part of its revenues from automobile property taxes and the ITR. Likewise, States must share revenue from certain taxes with municipalities. All of the revenues derived from IOF levied on transactions in gold as a financial asset are allocated among municipalities (70%) and the State, Federal District or federal territory of origin (30%).
The Federal Government must dedicate at least 18.0% of annual tax revenues to education. States, municipalities and the Federal District must invest at least 25.0% of their annual revenues in education.
In each new fiscal year, the Federal Government must dedicate at least the same amount to public health investments and services as it dedicated in the previous fiscal year. The Government is also required to increase funding for public health by an amount that corresponds to the difference between the GDP in the prior year’s budget and the projected GDP for the new fiscal year. States and the Federal District must invest at least 12.0% of their annual revenues in health investments and services. Municipalities must contribute at least 15.0% of their annual revenues to this area.
Sovereign Fund
In September 2008, the Federal Government created a sovereign fund. The stated objectives of the fund are to promote investments in assets both in Brazil and abroad. It may be used to prevent the overvaluation of real, if necessary. It can also be used to stimulate public savings, limit the effects of economic cycles and promote strategic projects for Brazil in other nations.
In December 2008, the public sector primary surplus surpassed the target and the Federal Government used part of the surplus to capitalize the Sovereign Fund of Brazil – SFB. On December 31, 2012, the SFB was valued at R$2.9 billion.
D-60
Fiscal Responsibility Law and Fiscal Crime Law
On May 4, 2000, the Federal Government enacted the Fiscal Responsibility Law. The law sets forth fundamental principles and directives for public finance and establishes a comprehensive framework intended to eliminate fiscal imbalances. The law applies to each level of government, as well as to government-controlled funds, semi-autonomous entities and public enterprises.
The Fiscal Responsibility Law provides for, among other things:
| | • | | Strengthening of the budgetary process as a planning instrument, with bi-monthly evaluations of fiscal targets according to five key variables: revenues, expenditures, nominal and primary fiscal results and public sector debt. Non-compliance with bi-monthly targets for nominal and primary results will trigger automatic cuts in expenditure authorizations and in financial transactions separately at each level of government. |
| | • | | Regulation of the “golden rule”, which establishes that the volume of credit operations cannot exceed capital expenditures. |
| | • | | Tax exemptions must be accompanied by estimates of their budget and financial impact in the budget year and in the two following years. The proposing entity must also indicate that off-setting revenues exist. |
| | • | | Increases in expenditures must be accompanied by estimates of their budgetary and financial impact in the year in which they are first incurred and in the two following years, and by a declaration from the proposing entity stating that such increases are in compliance with the PPA, LDO and annual budget. Also acts creating or increasing expenditures must include the means through which the expenditures will be financed. |
| | • | | Limitations on personnel expenditures as a percentage of net current revenues to 50.0% for the Federal Government, 60.0% for the States, and 60.0% for municipalities. |
| | • | | Ceilings for public sector debt for the Federal Government, States and municipalities, which are to be verified every four months. |
| | • | | A prohibition against the Central Bank issuing its own securities. |
| | • | | The Federal Government may guarantee the borrowings of State or municipal governments or other entities, within the limits and conditions established by the Senate, only if the beneficiary of the guarantee presents a note in an amount that is greater than or equal to the guarantee. |
| | • | | Courts specialized in the review of public accounts are to advise administrations of actual and potential noncompliance with the Fiscal Responsibility Law. |
| | • | | Sanctions for irresponsible behavior and mismanagement are to be established along with civil and criminal penalties in the Fiscal Crime Law. |
Exceptions under the Fiscal Responsibility Law are severely limited. Limits on public sector debt and on credit operations are subject to review upon request by the President in the case of economic instability and monetary and foreign exchange shocks. Deadlines to reestablish equilibrium will be extended in the case of shortfalls in economic growth. In case of an officially recognized state of emergency, the limits will be temporarily suspended. Fiscal target annexes will be required to account for sources, and funds obtained from sale of public assets may not be used to finance current expenditures, except expenditures related to social security.
In accordance with the Fiscal Responsibility Law, Senate Resolution No. 40, dated December 20, 2001, defined the global limits for the consolidated net indebtedness of States and municipalities, and determined that a State’s debt cannot be higher than 200% of its net current revenue and a municipality’s debt cannot exceed 120% of its net current revenue. It also established mechanisms for annual reductions of indebtedness exceeding such limits.
On October 11, 2000, the Brazilian Senate approved legislation known as the Fiscal Crime Law (Lei de Crimes Fiscais). The legislation amends Brazil’s Penal Code (Decree Law No. 2,848, dated December 7, 1940) and certain other laws to
D-61
provide penalties for, among other things, borrowing in excess of authorized limits, the ordering of expenditures not authorized by law and administrative infractions of public finance laws. The legislation, which was approved by the Chamber of Deputies on May 17, 2000, was enacted on October 19, 2000. The Fiscal Crime Law is a complement to the Fiscal Responsibility Law.
D-62
PUBLIC DEBT
General
The three main public debt indicators in Brazil are as follows:
| | 1. | Net Public Sector Debt (NPSD), which is the main indicator of indebtedness used by the Brazilian government when making economic policy decisions. It is the indicator that most closely reflects the dynamics of public liabilities and the Federal Government’s fiscal policies, which are shown by the consolidated primary balance at all levels. NPSD in Brazil consists of the domestic and external debt of the Federal Government (including the Central Bank), State and local governments and non-financial public enterprises (except Petrobras and Eletrobras). The Federal Government includes in its LDO annual estimates of this indicator’s evolution for the current year and three subsequent years, based on its expectations about real interest rates, economic growth and primary surplus targets for the whole public sector. |
| | 2. | Gross General Government Debt (GGGD), which refers to federal, State and municipal government debts, within both the private sector and the financial public sector. Debts owed by state-owned companies (at the three levels of government) are not covered by the GGGD category. Central Bank liabilities also do not figure in this indicator, except its open-market operations committed to the financial sector. To avoid double counting, GGGD does not include liabilities owed by any governmental entity to another entity whose liabilities are otherwise included in GGGD. As a result, credits represented by public securities held by agencies, federal public funds and other federal entities are disregarded. |
| | 3. | Federal Public Debt (FPD), which is a component of NPSD and GGGD (the largest component by amount). It is expressed by the sum of the domestic and external debt for which the federal government is responsible. FPD has two components: the domestic federal public debt (“DFPD”), issued in local currency, and the external federal public debt (“EFPD”), issued in foreign currency. |
The aggregate amount of Gross General Government Debt increased from R$1,740.9 billion on December 31, 2008 to R$2,583.9 billion on December 31, 2012. Net Public Sector Debt increased from R$1,168.2 billion on December 31, 2008 to R$1,550.1 billion on December 31, 2012. Federal Public Debt was R$1,397.3 billion on December 31, 2008 and increased to R$2,008.0 billion on December 31, 2012. In terms of GDP ratios, Gross General Government Debt increased from 57.4% on December 31, 2008 to 58.7% on December 31, 2012. GDP ratios for Net Public Sector Debt and Federal Public Debt declined from 38.5% to 35.2% and from 46.1% to 45.6%, respectively.
As of June 30, 2013, the Gross General Government Debt was R$2,715.9 billion (59.3% of GDP), Net Public Sector Debt was R$1,580.3 billion (34.5% of GDP) and Federal Public Debt was R$1,985.6 billion (43.3% of GDP).
Domestic debt accounts for most of the Gross General Government Debt (95.0% in 2012). The domestic debt increased from R$1,595.9 billion on December 31, 2008 (52.6% of GDP) to R$2,454.9 billion on December 31, 2012 (55.8% of GDP). The general government external debt amounted to R$145.0 billion on December 31, 2008 (4.8% of GDP) and R$129.1 billion on December 31, 2012 (2.9% of GDP).
From 2008 to 2012, the international investment position of the consolidated public sector increased substantially: in 2008 net external assets were R$332.4 billion (10.9% of GDP) and reached R$619.4 billion (14.0% of GDP) in 2012. This movement was related to the growth of Central Bank’s external assets derived from international reserves accumulation, from R$483.1 billion (15.9% of GDP) on December 31, 2008 to R$753.2 billion (17.1% of GDP) on December 31, 2012.
With regard to domestic federal public debt, the Brazilian National Treasury Secretariat (Secretaria do Tesouro Nacional or “STN”) has been the sole issuer of securities, which it only issues for fiscal policy purposes. According to the Fiscal Responsibility Law (Complementary Law nº 101, of May 4, 2000, Lei de Responsabilidade Fiscal or “LRF”), the Central Bank is prohibited from issuing bonds in Brazil’s domestic market. Consequently, the Central Bank uses National Treasury bonds that are in its portfolio, as collateral. The aggregate amount of federal domestic securities debt held by the Central Bank rose from R$494.3 billion (16.3% of GDP) on December 31, 2008 to R$906.6 billion (20.6% of GDP) on December 31, 2012. A significant proportion of this portfolio was used as coverage in Central Bank repurchase (repo)
D-63
operations, which rose from R$325.2 billion (10.7% of GDP) on December 31, 2008 to R$524 billion (11.9% of GDP) on December 31, 2012. The LRF also provided for the transfer of the positive six-monthly balance from the Central Bank to the National Treasury, as well as its payment, when negative, by issuing securities to the monetary authority.
D-64
The following table sets forth the gross general government debt and the public sector net debt for each of the periods indicated.
Table No. 29
Public Sector Debt
Gross and net general government debt1/ (R$ million)
| | | | | | | | | | | | | | | | | | | | | | | | | | | | | | | | | | | | | | | | |
| | | 2008 | | | As a %
of GDP | | | 2009 | | | As a %
of GDP | | | 2010 | | | As a %
of GDP | | | 2011 | | | As a %
of GDP | | | 2012 | | | As a %
of GDP | |
| | | (in millions of reais, except percentages) | |
Net public sector debt (A= B+K+L) | | R$ | 1,168,238 | | | | 38.5 | | | R$ | 1,362,711 | | | | 42.1 | | | R$ | 1,475,820 | | | | 39.1 | | | R$ | 1,508,547 | | | | 36.4 | | | R$ | 1,550,083 | | | | 35.2 | |
Net general government debt (B=C+F+I+J)(1) | | | 1,175,202.9 | | | | 38.8 | | | | 1,378,128.7 | | | | 42.5 | | | | 1,495,284.5 | | | | 39.7 | | | | 1,536,153.9 | | | | 37.1 | | | | 1,581,280.6 | | | | 35.9 | |
Gross general government debt (C=D+E)(2) | | | 1,740,887.8 | | | | 57.4 | | | | 1,973,423.7 | | | | 60.9 | | | | 2,011,521.7 | | | | 53.4 | | | | 2,243,603.7 | | | | 54.2 | | | | 2,583,946.4 | | | | 58.7 | |
Domestic debt (D) | | | 1,595,877.5 | | | | 52.6 | | | | 1,861,984.1 | | | | 57.5 | | | | 1,902,124.9 | | | | 50.5 | | | | 2,135,219.2 | | | | 51.5 | | | | 2,454,886.1 | | | | 55.8 | |
Securities debt market(3) | | | 1,236,732.3 | | | | 40.8 | | | | 1,369,262.5 | | | | 42.3 | | | | 1,569,449.8 | | | | 41.6 | | | | 1,746,630.4 | | | | 42.2 | | | | 1,871,346.3 | | | | 42.5 | |
Central Bank repo operations(4) | | | 325,155.3 | | | | 10.7 | | | | 454,709.7 | | | | 14.0 | | | | 288,665.9 | | | | 7.7 | | | | 341,878.1 | | | | 8.3 | | | | 523,994.9 | | | | 11.9 | |
Other debts | | | 33,990.0 | | | | 1.1 | | | | 38,012.0 | | | | 1.2 | | | | 44,009.1 | | | | 1.2 | | | | 46,710.6 | | | | 1.1 | | | | 59,544.9 | | | | 1.4 | |
External debt (E) | | | 145,010.3 | | | | 4.8 | | | | 111,439.6 | | | | 3.4 | | | | 109,396.8 | | | | 2.9 | | | | 108,384.5 | | | | 2.6 | | | | 129,060.3 | | | | 2.9 | |
Federal government | | | 126,456.2 | | | | 4.2 | | | | 94,992.8 | | | | 2.9 | | | | 87,503.4 | | | | 2.3 | | | | 80,059.3 | | | | 1.9 | | | | 87,471.5 | | | | 2.0 | |
States government | | | 16,054.4 | | | | 0.5 | | | | 14,440.1 | | | | 0.4 | | | | 18,904.0 | | | | 0.5 | | | | 23,723.8 | | | | 0.6 | | | | 36,147.0 | | | | 0.8 | |
Local governments | | | 2,499.7 | | | | 0.1 | | | | 2,006.7 | | | | 0.1 | | | | 2,989.4 | | | | 0.1 | | | | 4,601.5 | | | | 0.1 | | | | 5,441.8 | | | | 0.1 | |
Assets of general government (F=G+H) | | | –563,424.5 | | | | –18.6 | | | | –830,612.3 | | | | –25.6 | | | | –979,407.7 | | | | –26.0 | | | | –1,128,443.6 | | | | –27.2 | | | | –1,395,198.5 | | | | –31.7 | |
Domestic assets (G) | | | –563,424.5 | | | | –18.6 | | | | –830,612.3 | | | | –25.6 | | | | –979,100.5 | | | | –26.0 | | | | –1,127,900.6 | | | | –27.2 | | | | –1,394,241.8 | | | | –31.7 | |
Of federal government in Central Bank | | | –255,216.7 | | | | –8.4 | | | | –406,354.4 | | | | –12.5 | | | | –404,516.4 | | | | –10.7 | | | | –475,622.3 | | | | –11.5 | | | | –620,401.3 | | | | –14.1 | |
Credits with official financial institutions(5) | | | –43,086.8 | | | | –1.4 | | | | –144,787.1 | | | | –4.5 | | | | –256,602.4 | | | | –6.8 | | | | –319,147.2 | | | | –7.7 | | | | –406,933.1 | | | | –9.2 | |
Worker assistance fund (FAT) | | | –136,181.1 | | | | –4.5 | | | | –140,030.2 | | | | –4.3 | | | | –146,359.7 | | | | –3.9 | | | | –157,508.5 | | | | –3.8 | | | | –170,953.5 | | | | –3.9 | |
Other assets | | | –128,939.9 | | | | –4.3 | | | | –139,440.6 | | | | –4.3 | | | | –171,621.9 | | | | –4.6 | | | | –175,622.6 | | | | –4.2 | | | | –195,953.9 | | | | –4.5 | |
External assets (H) | | | 0.0 | | | | 0.0 | | | | 0.0 | | | | 0.0 | | | | –307.2 | | | | 0.0 | | | | –543.0 | | | | 0.0 | | | | –956.6 | | | | 0.0 | |
Available Central Bank portfolio (I)(6) | | | 169,155.6 | | | | 5.6 | | | | 183,105.4 | | | | 5.7 | | | | 414,537.0 | | | | 11.0 | | | | 409,959.0 | | | | 9.9 | | | | 382,632.1 | | | | 8.7 | |
Exchange Equalization (J)(7) | | | –171,416.0 | | | | –5.7 | | | | 52,211.9 | | | | 1.6 | | | | 48,633.5 | | | | 1.3 | | | | 11,034.7 | | | | 0.3 | | | | 9,900.6 | | | | 0.2 | |
Central Bank net debt (K) | | | –31,922.1 | | | | –1.1 | | | | –39,188.9 | | | | –1.2 | | | | –43,401.4 | | | | –1.2 | | | | –52,616.8 | | | | –1.3 | | | | –59,653.3 | | | | –1.4 | |
Debt | | | 783,808.8 | | | | 25.8 | | | | 1,090,428.8 | | | | 33.7 | | | | 1,215,047.9 | | | | 32.2 | | | | 1,402,988.6 | | | | 33.9 | | | | 1,651,753.7 | | | | 37.5 | |
Monetary Base | | | 147,550.0 | | | | 4.9 | | | | 166,073.0 | | | | 5.1 | | | | 206,853.0 | | | | 5.5 | | | | 214,235.0 | | | | 5.2 | | | | 233,371.0 | | | | 5.3 | |
Repo operations | | | 325,155.3 | | | | 10.7 | | | | 454,709.7 | | | | 14.0 | | | | 288,665.9 | | | | 7.7 | | | | 341,878.1 | | | | 8.3 | | | | 523,994.9 | | | | 11.9 | |
Commercial bank deposits | | | 55,886.7 | | | | 1.8 | | | | 63,291.7 | | | | 2.0 | | | | 315,012.6 | | | | 8.4 | | | | 371,253.2 | | | | 9.0 | | | | 273,986.6 | | | | 6.2 | |
National Treasury operating account | | | 255,216.7 | | | | 8.4 | | | | 406,354.4 | | | | 12.5 | | | | 404,516.4 | | | | 10.7 | | | | 475,622.3 | | | | 11.5 | | | | 620,401.3 | | | | 14.1 | |
Assets | | | –815,730.8 | | | | –26.9 | | | | –1,129,617.7 | | | | –34.9 | | | | –1,258,449.3 | | | | –33.4 | | | | –1,455,605.4 | | | | –35.1 | | | | –1,711,407.0 | | | | –38.9 | |
Federal securities in Bacen | | | –494,310.9 | | | | –16.3 | | | | –637,815.0 | | | | –19.7 | | | | –703,203.0 | | | | –18.7 | | | | –751,837.2 | | | | –18.1 | | | | –906,627.0 | | | | –20.6 | |
External assets | | | –483,109.8 | | | | –15.9 | | | | –408,188.2 | | | | –12.6 | | | | –473,588.1 | | | | –12.6 | | | | –651,662.9 | | | | –15.7 | | | | –753,157.9 | | | | –17.1 | |
Other assets | | | 161,689.9 | | | | 5.3 | | | | –83,614.5 | | | | –2.6 | | | | –81,658.2 | | | | –2.2 | | | | –52,105.4 | | | | –1.3 | | | | –51,622.1 | | | | –1.2 | |
Public enterprises net debt (L)(8) | | | 24,957.5 | | | | 0.8 | | | | 23,771.0 | | | | 0.7 | | | | 23,937.0 | | | | 0.6 | | | | 25,009.8 | | | | 0.6 | | | | 28,455.7 | | | | 0.6 | |
Domestic debt | | | 47,379.1 | | | | 1.6 | | | | 43,075.5 | | | | 1.3 | | | | 40,329.0 | | | | 1.1 | | | | 39,655.4 | | | | 1.0 | | | | 41,296.7 | | | | 0.9 | |
Domestic assets | | | –28,081.5 | | | | –0.9 | | | | –23,521.5 | | | | –0.7 | | | | –21,198.4 | | | | –0.6 | | | | –19,999.0 | | | | –0.5 | | | | –18,475.9 | | | | –0.4 | |
Net external debt | | | 5,660.0 | | | | 0.2 | | | | 4,217.0 | | | | 0.1 | | | | 4,806.3 | | | | 0.1 | | | | 5,353.4 | | | | 0.1 | | | | 5,635.0 | | | | 0.1 | |
| | | | | | | | | | | | | | | | | | | | | | | | | | | | | | | | | | | | | | | | |
GDP(9) | | | 3,032,203.0 | | | | — | | | | 3,239,404.0 | | | | — | | | | 3,770,084.9 | | | | — | | | | 4,143,013.3 | | | | — | | | | 4,402,537.1 | | | | — | |
| | | | | | | | | | | | | | | | | | | | | | | | | | | | | | | | | | | | | | | | |
D-65
| (1) | Includes federal, State and local government debt with other economic agents. |
| (2) | Excludes Federal securities in the Central Bank and includes Central Bank repo operations. |
| (3) | Includes market securities debt, and other securitized credits, less investment within the government and among different government levels. |
| (4) | Includes repo operations carried out in the extra-market segment. |
| (5) | Includes credits with BNDES. |
| (6) | Difference between the Federal securities in Central Bank and the Central Bank repo operations stock. |
| (7) | Equalization of the financial result of exchange reserves operations and foreign exchange derivatives operations carried out by the Central Bank (MP 435). |
| (8) | Petrobras and Eletrobras excluded. |
| (9) | GDP accumulated in the last 12 months - current prices. |
Source: Central Bank
D-66
Brazil’s FPD stood at R$1,397.3 billion on December 31, 2008 and increased at an average of 9.1% a year until 2012, to R$2,008.0 billion on December 31, 2012. Nonetheless, FPD presented a downward trend as a percentage of GDP, falling from 46.1% in 2008 to 45.6% in 2012. The share of the domestic debt in the FPD increased from 90.5% in 2008 to 95.5% in 2012, and the share represented by external debt diminished from 9.5% in 2008 to 4.5% in 2012.
Since 2001, the National Treasury has published a Federal Public Debt Annual Borrowing Plan (“ABP”) with the objectives of making Brazil’s debt management process more predictable and transparent. In managing the FPD, the National Treasury seeks to meet the Federal Government’s borrowing requirements at the lowest possible long-term financing cost, while maintaining prudent risk levels. The National Treasury also supports the smooth operation of the Brazilian public debt bond market.
In addition to explaining the National Treasury’s debt management objectives, the ABP also includes guidelines for managing the FPD. These guidelines recommend: (i) gradually replacing floating rate bonds with fixed rate or inflation-linked instruments; (ii) increasing the average maturity of outstanding debt; (iii) adjusting the FPD’s maturity structure, with special attention to short-term debt; (iv) developing the yield curve on both domestic and external markets; (v) increasing the liquidity of federal public securities in the secondary market; (vi) broadening the investor base; and (vii) improving the external federal public debt profile through the issuance of benchmark securities, buybacks and structured operations.
Many of the guidelines set forth in the ABP were implemented during the period from 2008 through 2012. There was an improvement in the FPD composition during this period, reducing market and refinancing risks: the share of fixed rate securities increased (as a percentage of FPD) from 29.9% as of December 31, 2008, to 40.0% as of December 31, 2012; and inflation-linked securities increased from 26.6% as of December 31, 2008 to 33.9% as of December 31, 2012. The FPD linked to the exchange-rate was R$88.4 billion (4.4% of FPD) as of December 31, 2012, compared to R$135.2 billion (9.7% of FPD) as of December 31, 2008. In addition, the average maturity of the FPD increased from 3.5 years as of December 31, 2008 to 4.0 years as of December 31, 2012, while the percentage of the FPD maturing in 12 months declined from 25.4% as of December 31, 2008 to 24.4% as of December 31, 2012.
Table No. 30
Federal Public Debt(1) Indicators
| | | | | | | | | | | | | | | | | | | | |
| | | As of December 31, | |
| | | 2008 | | | 2009 | | | 2010 | | | 2011 | | | 2012 | |
| | | | | |
Stock of FPD held by public (R$ billion) | | $ | 1,397.3 | | | $ | 1,497.4 | | | $ | 1,694.0 | | | $ | 1,866.4 | | | $ | 2,008.0 | |
Domestic | | | 1,264.8 | | | | 1,398.4 | | | | 1,603.9 | | | | 1,783.1 | | | | 1,916.7 | |
External | | | 132.5 | | | | 99.0 | | | | 90.1 | | | | 83.3 | | | | 91.3 | |
| | | | | |
Stock of FPD held by public (% of GDP) | | | 46.1 | | | | 46.2 | | | | 44.9 | | | | 45.0 | | | | 45.6 | |
Domestic | | | 41.7 | | | | 43.2 | | | | 42.5 | | | | 43.0 | | | | 43.5 | |
External | | | 4.4 | | | | 3.1 | | | | 2.4 | | | | 2.0 | | | | 2.1 | |
| | | | | |
FPD profile (%): | | | | | | | | | | | | | | | | | | | | |
Fixed rate | | | 29.9 | | | | 32.2 | | | | 36.6 | | | | 37.2 | | | | 40.0 | |
Inflation linked | | | 26.6 | | | | 26.7 | | | | 26.6 | | | | 28.3 | | | | 33.9 | |
Floating rate | | | 33.9 | | | | 34.5 | | | | 31.6 | | | | 30.1 | | | | 21.7 | |
Exchange rate | | | 9.7 | | | | 6.6 | | | | 5.1 | | | | 4.4 | | | | 4.4 | |
| | | | | |
FPD maturity structure: | | | | | | | | | | | | | | | | | | | | |
Average maturity (years) | | | 3.5 | | | | 3.5 | | | | 3.5 | | | | 3.6 | | | | 4.0 | |
Average life (years) | | | 5.6 | | | | 5.5 | | | | 5.5 | | | | 5.7 | | | | 6.4 | |
Percentage maturing in 12 months (%) | | | 25.4 | | | | 23.6 | | | | 23.9 | | | | 21.9 | | | | 24.4 | |
| | | | | |
Memo: | | | | | | | | | | | | | | | | | | | | |
GDP (R$ billion) | | $ | 3,032.2 | | | $ | 3,239.4 | | | $ | 3,770.1 | | | $ | 4,143.0 | | | $ | 4,402.5 | |
| (1) | Includes the domestic debt and the external debt under National Treasury responsibility. |
Source: Ministry of Finance/National Treasury Secretariat
D-67
In 2011, Brazil’s credit rating was upgraded by all major international rating agencies. As a result, Brazil’s long-term foreign currency denominated debt moved into the second tier of the investment grade scale.
In April 2011, Fitch Ratings upgraded Brazil’s foreign and local currency Issuer Default Ratings (“IDRs”) to “BBB” from “BBB-” with a stable outlook and its Country Ceiling to “BBB+” from “BBB”. On October 25, 2011 and July 18, 2013, Fitch Ratings affirmed its investment grade rating of “BBB” with a stable outlook on Brazil’s foreign and local currency IDRs. In June 2011, Moody’s Investors Service (“Moody’s”) raised Brazil’s credit rating and maintained a positive outlook for Brazilian debt. On November 21, 2012, Moody’s affirmed the bond rating of Brazil at Baa2 and maintained its positive outlook. Likewise, Standard & Poor’s (“S&P”) upgraded Brazil’s debt risk rating in local currency to A- in 2011. This change in credit rating was particularly significant for Brazil, because more than 95% of its public debt on the market is real-denominated and credit ratings can affect borrowing costs. In June 2013, S&P revised the outlook on its long-term ratings for Brazil to negative from stable. At the same time, S&P affirmed its ‘BBB’ long-term and ‘A-2” short-term foreign currency sovereign credit ratings on the country. S&P also affirmed its ‘A-’ long-term and ‘A-2’ short-term local currency sovereign credit ratings.
Legal Aspects: Public Debt Regulation and Taxation
Brazil’s legal system is based on civil law (or public law) derived from European legal codes that distinguish between public and private governance, as opposed to common law, based on Anglo-Saxon systems. The legal system involves a Constitution and its amendments, complementary laws, ordinary laws, provisional measures and resolutions. The Constitution, written in 1988, and its amendments supersede other laws.
The Federal Constitution defines the responsibilities of the executive, legislative and judicial branches at all levels of government with respect to fiscal issues and the public debt; these are consistent with the IMF’s provisions on fiscal transparency, based on an evaluation it conducted in Brazil in 2001. As required by the IMF in its Fiscal Transparency Manual and based on the 2001 evaluation, Brazil’s ethical standards for civil servants, particularly those referring to Federal Public Debt managers, are public and transparent.
Pursuant to the Article 52 of the Federal Constitution, the Brazilian Senate is vested with powers to: (i) establish, at the request of the President, global limits for the consolidated debt of the Federal Government, the States, the Federal District and municipalities, (ii) provide the terms and conditions of the internal and external financial transactions of the Federal Government, including public sector enterprises, at all levels of government, (iii) provide for limits on the terms and conditions for guarantees by the Federal Government of any internal or external financial transaction, and (iv) establish global limits and conditions for the amount of the debt in the form of securities of the States, the Federal District and municipalities. In addition, all external financial transactions of the Federal Government, the States, the Federal Districts and municipalities must be authorized by the Senate.
The Constitution delegates to the Federal Government the right to establish general rules on public finance. Using this power, the Federal Government enacted the LRF, which adopted several rules regarding public debt. Together with Law 4,320 of 1964, the LRF provides the “structural regulation of the public debt” because it lays the foundation for Brazil’s public finances and debt management. In addition, the LDO, which guides the LOA, may contain provisions that further regulate the public debt. The LDO and the LOA provide for “periodic” regulation of the public debt, due to the fact they are only in force for the fiscal year to which they apply.
D-68
In 2001, the Senate approved Resolutions Nos. 40 and 43, which set global limits for the amount of consolidated public debt and public securities debt of the Federal District, States and municipalities, as well for domestic and external loans and guarantees by the Republic. Similar resolutions are included in State constitutions and municipal organic laws (constitutions), and they allow legislative branches at various government levels to further limit their public debt.
Law No. 10,683 of 2003 specifies that it is the responsibility of the Ministry of Finance (“MF”) to manage the Federal Government’s domestic and external public debt. Moreover, the LRF states that the MF must verify compliance with the limits and conditions related to each public loan facility. Federal Decree No. 6,102 of 2007 includes regulations promulgated under Law No. 10,683. That decree sets forth and approves the internal structure of the MF, stipulating that the National Treasury would manage the public domestic and external debt, directly or indirectly under the Federal Government, as well verify certain loan information. Administrative Act No. 183 of 2003, of the MF stipulates that the National Treasury will handle securities operations and Administrative Act No. 410 of 2003, of the STN defines the rules for public security auctions.
Managers of the federal executive branch are bound by Brazil’s Code of Public Ethics, which includes specific penalties for failing to comply with the LRF provisions. High-level government managers (ministers or secretaries) are also bound by the Code of Conduct of the High Federal Administration, which provides for admonition and ethical censorship depending on the gravity of the violation. In addition to these penalties, public servants who are convicted criminally, and have exhausted all appeals, for crimes against the economy, public administration and public assets, and whose accounts related to the exercise of public positions or offices have been rejected by the Courts of Audit for irreparable irregularities, will not be eligible for elected office.
On November 16, 2004, the Senate adopted Senate Resolution No. 20, which authorizes, among other things, (i) the issuance abroad of debt securities denominated in reais or a foreign currency and (ii) liability management through repurchases, exchanges and other transactions, including financial derivatives, in each case pursuant to the National Treasury’s Program of Securities Issuance and Management of Liabilities Abroad. The National Treasury is permitted to issue up to an aggregate of $75 billion under this program, subject to subsequent renewals by the Senate. The proceeds of the sale of securities under this program are used solely for the payment of the National Treasury’s federal public debt.
In connection with taxes on public bonds, Law No. 11,312, dated June 27, 2006, exempted non-resident investors from capital gains withholding taxes on Brazilian domestic government bonds. The exemption does not apply to investors who are resident in countries that have no capital gains taxes or that impose such a tax at a rate lower than 20%. The exemption is intended to increase the demand for Brazilian government bonds and reduce Brazil’s borrowing costs.
Brazilian residents who invest in domestic government bonds are subject to an IOF, regulated by Decree No. 6,306, of December 14, 2007. The tax is levied on redemptions, transfers or renegotiations traded in periods of up to 30 days, for fixed income securities operations. The maximum tax rate is 1.5% per day.
To slow the appreciation of Brazilian currency, the Federal Government increased the IOF on inflows of foreign resources to be applied in Brazil. Decree No. 7,412, of December 30, 2010, and Decree No. 7,632, of December 1, 2011, set a 6% tax on the settlement of exchange operations when the money enters the country to be invested in Brazilian financial and capital markets. Fixed income securities related to infrastructure investment (with specific characteristics described at Law No. 12,431, of June 24, 2001) and equity operations made on BM&FBOVESPA are exempt from this tax.
In addition, by Decree No. 7,698, of March 9, 2012, the Federal Government extended the IOF to tax, at a 6% rate, currency exchange transactions in connection with the entry into Brazil of amounts originated from loans and/or securities contracted and/or issued abroad with an average term of equal to or less than 1,800 days.
To contain depreciation of local currency as economic conditions changed during the first half of 2013, the Federal Government announced, by Decree No. 8,023 of June 4, 2013, the reduction of the IOF levied on foreign investments in fixed-income securities from 6% to 0%. Similarly, the Federal Government, by Decree No. 8,027 of June 12, 2013, announced it would no longer charge the IOF on increases in dollar short positions in financial derivatives.
D-69
Contingent Liabilities
In addition to regular federal domestic securities debt issuances, the Federal Government may assume and restructure liabilities resulting from the sale and closure of state enterprises, subsidies, and adjustments prior to privatization processes. In the past, such liabilities have been restructured to synchronize their maturity dates with the payment capacity of the National Treasury, as well as to lengthen the maturity of the public debt and to make transactions more transparent.
The Federal Government closely monitors its contingent liabilities. As required by the LRF, the LDO contains an Annex that provides information regarding fiscal risks and projections for the following two years in terms of primary balances, debt stock, and revenue and expenditure aggregates.
The main contingent liability monitored by the Federal Government concerns the Housing Compensation Fund for Salary Fluctuation (Fundo de Compensação de Variações Salariais or “FCVS”). Beginning in 1967, the Federal Government introduced a series of measures designed to provide subsidies to homeowners to address the effects of high inflation on mortgage rates. These subsidies were implemented in the form of the FCVS, which provided mortgage lenders in Brazil with a credit in an amount equal to the difference between the lender’s actual cost of funds and the amounts that the borrower was legally obligated to pay under the terms of his mortgage. Under the FCVS program, the borrower was absolved of the responsibility to pay the amount guaranteed by the Federal Government, and the lending institution recorded the amount guaranteed as an asset receivable.
Although the FCVS program has not covered any mortgages since March 1990, the aggregate amount of the FCVS subsidy still constitutes the main contingent liability of the Federal Government. The aggregate amount of securitized debt as of December 31, 2012 was R$8.22 billion, of which R$7.6 billion is FCVS. As of December 31, 2012, the Federal Government estimates the amount of debt yet to be securitized as R$107.7 billion (2.4% of GDP), of which approximately 80.0% is FCVS.
Public Sector External Debt
On December 31, 2012, Brazil’s consolidated public sector external debt totaled $108.6 billion, or 4.8% of GDP.
The following table sets forth details of Brazil’s public sector external debt by type of borrower at the end of the periods indicated.
Table No. 31
Public Sector External Debt by Type of Borrower
| | | | | | | | | | | | | | | | | | | | |
| | | 2008 | | | 2009 | | | 2010 | | | 2011 | | | 2012 | |
| | | (in millions of U.S. dollars) | |
Central Government | | | 54,373 | | | | 54,779 | | | | 51,888 | | | | 42,789 | | | | 42,856 | |
Public Entities(1) | | | 25,347 | | | | 36,443 | | | | 49,111 | | | | 54,839 | | | | 65,698 | |
Guaranteed | | | 14,373 | | | | 20,964 | | | | 25,520 | | | | 27,291 | | | | 32,162 | |
Non-Guaranteed | | | 10,973 | | | | 15,479 | | | | 23,590 | | | | 27,549 | | | | 33,537 | |
Total | | $ | 79,720 | | | $ | 91,222 | | | $ | 100,999 | | | $ | 97,629 | | | $ | 108,555 | |
External Debt/GDP (%) | | | 4.83 | % | | | 5.61 | % | | | 4.83 | % | | | 3.93 | % | | | 4.82 | % |
| | | | | | | | | | | | | | | | | | | | |
GDP | | $ | 1,650,897 | | | $ | 1,625,636 | | | $ | 2,089,829 | | | $ | 2,482,135 | | | $ | 2,252,628 | |
| | | | | | | | | | | | | | | | | | | | |
| (1) | Includes indebtedness of the Central Bank, public enterprises, mixed-ownership enterprises, semi-autonomous entities, States, municipalities, Petrobras and Eletrobras. |
Source: Central Bank
D-70
The following table sets forth Brazil’s public sector external debt by type of creditor at the end of the periods indicated.
Table No. 32
Public Sector External Debt by Type of Creditor(1)
| | | | | | | | | | | | | | | | | | | | |
| | | As of December 31, | |
| | | 2008 | | | 2009 | | | 2010 | | | 2011 | | | 2012 | |
| | | (in millions of dollars) | |
Commercial Banks | | | 10,485 | | | | 15,253 | | | | 14,860 | | | | 19,486 | | | | 16,842 | |
Foreign Governments | | | 3,280 | | | | 3,192 | | | | 10,889 | | | | 11,076 | | | | 11,078 | |
Multilateral Organizations | | | 24,116 | | | | 28,824 | | | | 34,097 | | | | 29,224 | | | | 32,399 | |
Bondholders | | | 41,562 | | | | 43,773 | | | | 41,042 | | | | 37,776 | | | | 48,494 | |
Other | | | 0 | | | | 0 | | | | 0 | | | | 1 | | | | 10,341 | |
Total | | $ | 79,720 | | | $ | 91,222 | | | $ | 100,999 | | | $ | 97,629 | | | $ | 119,154 | |
| (1) | Debt with an original maturity of one year or more. It includes indebtedness of the Central Bank, public enterprises, mixed-ownership enterprises, semi-autonomous entities, States, municipalities, Petrobras and Eletrobras. |
Source: Central Bank
Approximately 58.7% of the public sector external debt is denominated in US dollars. The following table sets forth details of Brazil’s public sector external debt by type of currency at the end of the periods indicated.
Table No. 33
Public Sector External Debt by Type of Currency(1)
(in millions of U.S. dollars)
| | | | | | | | | | | | | | | | | | | | | | | | | | | | | | | | | | | | | | | | |
| | | As of December 31, | |
| | | 2008 | | | % | | | 2009 | | | % | | | 2010 | | | % | | | 2011 | | | % | | | 2012 | | | % | |
| | | | | | | | | | |
U.S. Dollars | | | 40,452 | | | | 50.7 | | | | 46,352 | | | | 50.8 | | | | 50,368 | | | | 49.9 | | | | 54,804 | | | | 56.1 | | | | 63,673 | | | | 58.7 | |
Japanese Yen | | | 4,630 | | | | 5.8 | | | | 4,314 | | | | 4.7 | | | | 4,811 | | | | 4.8 | | | | 3,803 | | | | 3.9 | | | | 3,180 | | | | 2.9 | |
Due to World Bank(2) | | | 10,231 | | | | 12.8 | | | | 9,673 | | | | 10.6 | | | | 13,274 | | | | 13.1 | | | | 8,640 | | | | 8.8 | | | | 11,420 | | | | 10.5 | |
Deutsche Marks | | | 200 | | | | 0.3 | | | | 142 | | | | 0.2 | | | | 90 | | | | 0.1 | | | | 49 | | | | 0.1 | | | | 14 | | | | 0.0 | |
Due to IDB(2) | | | 13,024 | | | | 16.3 | | | | 13,739 | | | | 15.1 | | | | 14,904 | | | | 14.8 | | | | 14,536 | | | | 14.9 | | | | 14,761 | | | | 13.6 | |
Pounds Sterling | | | 139 | | | | 0.2 | | | | 119 | | | | 0.1 | | | | 160 | | | | 0.2 | | | | 186 | | | | 0.2 | | | | 194 | | | | 0.2 | |
Swiss Francs | | | 3 | | | | 0.0 | | | | 2 | | | | 0.0 | | | | 0 | | | | 0.0 | | | | 213 | | | | 0.2 | | | | 218 | | | | 0.2 | |
Special Drawing Rights | | | 7 | | | | 0.0 | | | | 4,516 | | | | 5.0 | | | | 4,451 | | | | 4.4 | | | | 4,436 | | | | 4.5 | | | | 4,439 | | | | 4.1 | |
Euros | | | 6,122 | | | | 7.7 | | | | 5,860 | | | | 6.4 | | | | 5,790 | | | | 5.7 | | | | 4,589 | | | | 4.7 | | | | 3,883 | | | | 3.6 | |
Others | | | 4,911 | | | | 6.2 | | | | 6,504 | | | | 7.1 | | | | 7,150 | | | | 7.1 | | | | 6,373 | | | | 6.5 | | | | 6,772 | | | | 6.2 | |
Total | | $ | 79,720 | | | | 100.0 | | | $ | 91,222 | | | | 100.0 | | | $ | 100,999 | | | | 100.0 | | | $ | 97,629 | | | | 100.0 | | | $ | 108,555 | | | | 100.0 | |
| | | | | | | | | | | | | | | | | | | | | | | | | | | | | | | | | | | | | | | | |
| (1) | Total registered public external debt. It includes indebtedness of the Central Bank, public enterprises, mixed-ownership enterprises, semi-autonomous entities, States, municipalities, Petrobras and Eletrobras. |
| (2) | Consists primarily of Dollars, Yen, Swiss Francs and Deutsche Marks. |
Source: Central Bank
D-71
Of Brazil’s public sector external debt, $55.1 billion is redeemable in 2021 or thereafter. This represents 46.3% of the public sector external debt. The following table sets forth the amortization schedule of Brazil’s public sector external debt by creditor.
Table No. 34
Public Sector External Debt Amortization Schedule by Creditor(1)
| | | | | | | | | | | | | | | | | | | | | | | | | | | | | | | | | | | | | | | | | | | | |
| | | Outstanding
12/31/2012 | | | 2013 | | | 2014 | | | 2015 | | | 2016 | | | 2017 | | | 2018 | | | 2019 | | | 2020 | | | 2021 | | | 2022 and
thereafter | |
| | | (in millions of dollars) | |
Multilateral Organizations | | | 32,399 | | | | 1,691 | | | | 1,832 | | | | 2,062 | | | | 1,951 | | | | 1,922 | | | | 1,783 | | | | 1,666 | | | | 1,552 | | | | 1,451 | | | | 16,489 | |
Commercial Banks | | | 16,842 | | | | 2,576 | | | | 1,416 | | | | 716 | | | | 1,444 | | | | 1,160 | | | | 463 | | | | 461 | | | | 2,320 | | | | 977 | | | | 5,308 | |
Foreign Governments | | | 11,078 | | | | 519 | | | | 467 | | | | 1,837 | | | | 1,768 | | | | 1,701 | | | | 1,705 | | | | 1,683 | | | | 260 | | | | 218 | | | | 919 | |
Bondholders | | | 48,494 | | | | 1,041 | | | | 833 | | | | 2,850 | | | | 1,910 | | | | 4,842 | | | | 1,056 | | | | 5,691 | | | | 1,723 | | | | 4,738 | | | | 23,811 | |
Other | | | 10,341 | | | | 16 | | | | 7 | | | | 5 | | | | 3 | | | | 2 | | | | 1 | | | | 1,699 | | | | 0 | | | | 0 | | | | 8,608 | |
Total | | $ | 119,154 | | | $ | 5,842 | | | $ | 4,556 | | | $ | 7,471 | | | $ | 7,077 | | | $ | 9,627 | | | $ | 5,009 | | | $ | 11,201 | | | $ | 5,855 | | | $ | 7,383 | | | $ | 55,135 | |
| | | | | | | | | | | | | | | | | | | | | | | | | | | | | | | | | | | | | | | | | | | | |
Notes:
| (1) | This table includes debt with an original maturity of one year or more. Amortization figures in this table include only scheduled payments on outstanding debt as of December 31, 2012. |
Source: Central Bank
External Federal Public Debt - EFPD
Brazil’s EFPD stood at R$132.5 billion in December 2008 (of which R$100.9 billion was represented by bonds and R$31.6 billion was in contractual debt), compared to R$91.3 billion in December 2012 (of which R$78.2 billion was represented by bonds and R$13.1 billion was in contractual debt). As a percentage of GDP, EFPD fell from 4.4% in December 2008 to 2.1% in December 2012.
In recent years, the National Treasury has concentrated its efforts on new debt issuances and reopenings of existing securities with benchmark maturities (10 and 30 years) on the global market, with the objective of developing the yield curve. This strategy is designed to provide liquidity for Brazilian government securities, which increases trading efficiency and lowers spreads between bid and ask prices. Along with fostering new debt issuances and reopenings of securities, the National Treasury has conducted liability management operations in order to: i) increase efficiency of the yield curve and reduce refinancing risk at specific points; ii) obtain net gains at current value (NPV savings); iii) redeem or exchange government securities that were issued during periods of unfavorable market conditions at high coupons. These operations are effected through tender-offers, exchange-offers and buyback operations, or take place in conjunction with new issuances.
There were three segments of liability management operations carried out over the last two decades. The first was the restructuring of Brazil’s external debt, known as the Brady restructuring, which concluded in 1994. The second occurred in August 2005, when the National Treasury held an auction to exchange approximately 80% of its C-Bonds (or $4.5 billion) for A-Bonds. In October 2005, the remaining stock of C-Bonds, estimated at $1.1 billion, was redeemed. On April 18, 2006, the Federal Government redeemed all of its outstanding Brady Bonds (approximately $6.6 billion) and thereby completed the third segment. Since the Brady restructuring in 1994, Brazil has timely serviced its external debt without default.
In 2005, due to the considerably lower need for external borrowing, Brazil decided to reduce its contractual debt and prepaid its $20.4 billion debt to the IMF. In the following year, Brazil bought back its remaining contractual debt with the Paris Club for $1.7 billion.
D-72
In June 2006, Brazil completed an offer to purchase EFPD securities denominated in dollars and euros consisting of 20 bonds scheduled to mature between 2007 and 2030, with a face-value amount of approximately $1.3 billion. In August 2006, Brazil completed an exchange offer of external debt securities denominated in dollars maturing in 2020, 2024, 2027 and 2030 for securities maturing in 2037. Approximately $500 million in securities at face value were exchanged.
Also in 2006, Brazil announced a permanent program to repurchase EFPD on a regular basis, which initially covered securities maturing up to 2010, including global bonds, euro bonds, Samurai bonds and Brady Bonds. In 2006, Brazil repurchased $7.1 billion in financial value ($6.1 billion at face value), or approximately one-third of the stock of Brazil’s global bonds and 15% of Brazil’s euro-denominated bonds maturing between 2007 and 2012.
The following table sets forth details of Brazil’s EFPD buyback program in the last 5 years.
Table No. 35
EFPD BUYBACK PROGRAM
| | | | | | | | |
| | | Face Value
(US$ million) | | | Financial Value
(US$ million) | |
2008 | | | 1,151.32 | | | | 1,479.42 | |
2009 | | | 1,084.57 | | | | 1,387.90 | |
2010 | | | 3,223.91 | | | | 4,276.82 | |
2011 | | | 2,277.80 | | | | 2,911.72 | |
2012 | | | 1,394.13 | | | | 1,774.98 | |
Source: Ministry of Finance/National Treasury Secretariat
Over the course of 2009, the National Treasury carried out two other operations: the exchange of financial characteristics for some contracts with multilateral organizations (World Bank and IDB) in July of 2009 and the prepayment of part of the Federal Government debt owed to the World Bank in December of 2009. Both the World Bank and the IDB allowed contract amendments to convert floating to fixed interest rates and in the case of the IDB, a conversion of principal debt into U.S. dollars. The renegotiation of all the loans not only generated interest savings, estimated at $77.56 million, but also brought greater predictability to the indexing factors applied to EFPD.
In September 2005, the National Treasury issued the Global BRL 2016 bond on the international market, the first security based on the yield curve in reais on the external market. The objective of this issuance was to take advantage of the enhanced synergy between internal and external debt markets, considering that the longest fixed rate security in the domestic market was a seven-year bond (NTN-F 2012). Global BRL 2022 and 2028 bonds were issued in 2006 and 2007, respectively. A Global BRL 2021 bond was issued in January 2012, and a Global BRL 2024 bond was issued in April 2012. Global 2023 bonds were issued in September 2012 and in May 2013.
With respect to external federal public debt market operations in 2012, the debt management strategy adopted by the National Treasury included the following:
1. Creation and improvement of benchmarks in the forward interest rate structure, through stragetic issuances in dollars or reais;
2. Maintenance of the bond buyback program for securities denominated in dollars, euros and reais;
3. Possibility of external liability management operations, with the aim of enhancing the efficiency of the external interest curve;
4. Monitoring of the External Contractual Debt in pursuit of operational alternatives capable of generating financial gains for the National Treasury.
Considering these guidelines and international market conditions in 2012, the National Treasury completed two external bond issuances denominated in dollars and one denominated in BRL, totaling U.S.$3.8 billion. The dollar-denominated
D-73
issuances included a reopening of the 10-year Global 2021 bond and the issuance of a new bond scheduled to mature in 2023. The real-denominated issuance involved a new bond, the BRL 2024, which was issued concurrently with a tender offer for outstanding Global BRL 2016 and 2022 bonds.
The favorable external market conditions in early 2012 made it possible for Brazil to reopen the Global 2021 bond in January. The reopening yielded a rate of return of 3.45% per year, which at the time was the lowest ever registered by a dollar-denominated Brazilian sovereign bond with a 10 year maturity. The overall volume of the Global 2021 bond issued in January 2012 was U.S.$825 million, raising the outstanding volume of this bond on the market to U.S.$2.99 billion.
In April 2012, the National Treasury accessed the bond market in reais and issued a Global BRL 2024 bond to take advantage of rising international investor demand for bonds issued by emerging countries and denominated in local currencies. The value of the issue was R$3.15 billion, including the green shoe offer in the Asian market.
Simultaneously with issuance of the Global BRL 2024 bond, the National Treasury performed a real-denominated external bond buyback transaction (tender offer). The transaction resulted in repurchases of outstanding Global BRL 2016 and 2022 bonds with a total face value of R$1.33 billion, and a then-prevailing market value of R$1.67 billion.
In September 2012, the National Treasury issued a new 10-year benchmark on the dollar market designated the Global 2023 bond. The issuance totaled U.S.$1.35 billion, with U.S.$1.25 billion sold in European and North American markets and U.S.$100 million in the Asian market. The Global 2023 bond was issued with an interest rate of 2.69% per year, setting a new record for the lowest rate on a dollar-denominated Brazilian bond with a 10 year maturity.
In May 2013, the National Treasury completed a reopening of its ten-year benchmark bond denominated in US Dollars, the Global 2023 bond. The reopening involved an offering with a face value of U.S.$800 million (U.S.$750 million in European and North American markets and U.S.$50 million in the Asian market). The bond was priced at 98.946% of its face value, with a net yield of 2.75% per year. The issuance was sold at a 98 basis points spread above the 10-year U.S. Treasury bond, making it the smallest differential achieved by a Brazilian sovereign issuance since 1995, when the Republic resumed its access to foreign markets.
In 2012, the National Treasury repurchased U.S.$675.4 million (face value) in dollar-denominated securities, U.S.$12.5 million (face value) in euro-denominated securities and U.S.$706.32 million in real-denominated securities, reducing the overall amount of interest payable to security holders by Brazil.
Finally, with the objective of securing the resources necessary to service the anticipated external federal public debt in coming years, the National Treasury acquired approximately U.S.$4.6 billion in currency in 2012, enough to pay approximately 51% of the entire external federal debt maturing through 2016.
Table No. 36
External Federal Public Debt (R$ billions)(1)
| | | | | | | | | | | | | | | | | | | | |
| | | 2008 | | | 2009 | | | 2010 | | | 2011 | | | 2012 | |
| | | | | |
External Federal Public Debt1 | | $ | 132.5 | | | $ | 99.0 | | | $ | 90.1 | | | $ | 83.3 | | | $ | 91.3 | |
EFPD (% of GDP) | | | 4.4 | | | | 3.1 | | | | 2.4 | | | | 2.0 | | | | 2.1 | |
| | | | | |
Securities | | | 100.9 | | | | 78.9 | | | | 69.4 | | | | 71.7 | | | | 78.2 | |
| | | | | |
Global US$ | | | 76.4 | | | | 58.7 | | | | 50.4 | | | | 55.4 | | | | 61.9 | |
| | | | | |
Euro | | | 13.4 | | | | 9.4 | | | | 6.6 | | | | 4.2 | | | | 2.3 | |
| | | | | |
Global BRL | | | 10.8 | | | | 10.6 | | | | 12.2 | | | | 12.0 | | | | 13.9 | |
| | | | | |
Bradies(2) | | | 0.4 | | | | 0.2 | | | | 0.2 | | | | 0.1 | | | | 0.1 | |
| | | | | |
Contractual | | | 31.6 | | | | 20.1 | | | | 20.7 | | | | 11.6 | | | | 13.1 | |
| | | | | |
Multilateral Organizations | | | 26.5 | | | | 16.9 | | | | 16.9 | | | | 6.9 | | | | 7.4 | |
| | | | | |
Private Financial Institutions/Gov. Agencies | | | 5.1 | | | | 3.2 | | | | 3.8 | | | | 4.7 | | | | 5.7 | |
| (1) | All EFPD values converted to USD and then, converted to BRL at the spot FX-rate as of the month’s last day. |
| (2) | Refers to the pre-Brady bond (BIB), which does not have an embedded call option. |
Source: National Treasury
D-74
Advances in External Debt Management
Since 2006, Brazil has made qualitative changes in its debt structure, including adopting a buyback program and launching tender offers involving EFPD bonds, in order to improve the maturity profile of its short-term debt. Brazil also offered its 2037 bonds, as part of a privately negotiated exchange offer transaction which occurred in 2006. The overall objective of these transactions was to improve Brazil’s external debt profile while lengthening average maturity terms. Other measures that Brazil adopted to further this objective included exercising the call option of Brady Bonds and repaying its debts to the Paris Club early.
Advances in Domestic Debt Management
The National Treasury adopted a series of measures in 2006 aimed at improving FPD management. In the case of the DFPD, the National Treasury took steps to streamline domestic market operations and consolidate the process of opening the market to nonresident investors. Law No. 11,312/06 was approved, granting nonresidents an income tax exemption on gains earned on investments in Brazil’s public domestic debt bonds. This measure aligned Brazil with international practices, particularly among emerging countries. The measure also produced cost reductions for Brazil and lengthened debt maturities as a result of greater demand on the part of nonresident investors for longer-term fixed rate and inflation-linked securities.
To improve FPD management the Secondary Securities Market Working Group was formed in 2007. Coordinated by the National Association of Financial Market Institutions (Associação Nacional das Instituições do Mercado Financeiro) and the Brazilian Association of Closed Pension Fund Entities (Associação Brasileira das Entidades Fechadas de Previdência Complementar), the working group is composed of representatives of the Central Bank, National Treasury, Securities Commission and Government Pension Fund Secretariat. The task of the working group is to strengthen the Brazilian capital markets segment, deepen discussion on the role of institutional investors in the secondary market and increase the liquidity levels of fixed rate securities in Brazil.
In 2007, the National Treasury issued 10-year fixed rate bonds, called NTN-F 2017s, in the Brazilian domestic market for the first time. When issued, these bonds became Brazil’s longest term fixed rate domestic debt security, supplanting the NTN-F 2014, which was previously considered the longest term security. By the end of 2007, R$13.2 billion in NTN-F 2017 bonds had been issued, making these bonds a benchmark security.
Also, in order to increase transparency in the trading of federal public bonds in the secondary market, the National Treasury and the Central Bank, through Joint Normative Act No. 15, dated January 14, 2008, raised the disclosure standards that financial institutions classified as dealers must meet to access the National Treasury’s special operations. Specifically, specialist dealers must now post twice daily bid and ask quotations for each bond that is trading. The daily opening spread (the disclosure of bid and ask bond prices) will only be considered in the evaluation criteria if the average yield of the proposals is better or equal to the average yield on each occasion. This measure will allow market participants to have greater knowledge of the prices of offered bonds, providing more transparency and improving the pricing of bonds in primary and secondary markets.
D-75
In February 2008, the Central Bank altered the way it calculated the GGGD, to be initially applied to data collected in January 2008. The alterations affect: (i) placement of National Treasury securities in the Central Bank’s portfolio and (ii) repo operations for which the monetary authority is liable. The modifications take into consideration the fact that the National Treasury securities in the Central Bank’s portfolio are related to monetary policy management and do not represent effective fiscal debt. Using the new methodology, GGGD reached 58% of GDP on December 31, 2007 (compared to 64.4% as calculated by the old methodology). The new calculation does not affect the net debt to GDP ratio. On December 31, 2012, the GGGD rose to 58.7% of GDP from 54.2% of GDP on December 31, 2011.
In 2010, the National Treasury introduced changes to its securities auctions and improvements to its dealers system, which were designed to improve the operation of the public securities market and thereby promote more efficient FPD financing. The changes adopted in connection with the auctions were made for the purpose of stimulating development of the secondary public bond market through fewer issuer interventions. Under the new dealers system, the performance of each dealer is evaluated every six months, and those with the worst performance are replaced. The performance evaluation is based mainly on direct and repo transactions with the market and shares in public offerings. The rules of and criteria for the dealer system are defined in Joint Normative Acts No. 28 and No. 29, dated February 6, 2013.
The presence of a broad and diversified investor base ensures enhanced demand stability for securities issued by Brazilian agencies and provides the bond market for Brazilian securities with increased liquidity, resulting in lower costs and decreased risk for the issuer. For these reasons, expanding the base of investors in Brazilian securities has been repeatedly discussed as a priority in National Treasury’s Annual Borrowing Plans. CMN Resolution No. 4034, dated November 30, 2011, altered the policy on investments in public securities involving the resources of the Extramarket Funds of state-owned companies (Extramarket Funds are funds managed by the Federal Government), semi-autonomous agencies and public funds. Based on this new resolution, the investment policies of those funds must be linked to one of the Anbima Market Index (“IMA”) indices (which represent theoretical portfolios of federal public securities), and the linked index cannot be an IMA index tied to the Selic overnight rate.
To comply with the CMN resolution, in February 2012, the National Treasury Secretariat performed securities exchange operations with Extramarket Funds. The securities exchange operations occurred February 7-28, 2012 and resulted in a redemption of R$61.2 billion in securities linked to the Selic overnight rate (LFT). The Anbima indexes that Extramercado Funds were linked to included the IMA-B, composed of securities linked to the consumer price index IPCA (NTN-B), the IRFM, composed of short, medium and long term fixed-rate securities (LTN and NTN-F) and the IRF-M1, composed of fixed rate securities due in less than one year. These operations resulted in a decrease of around 3.3% in the percentage of securities linked to the Selic overnight rate (compared to January 2012) and 11% of the LFT held by the market (compared to January 2012).
Likewise, on June 11, 2012, the National Treasury performed a securities exchange operation with the Labor Compensation Fund (Fundo de Garantia por Tempo de Serviço Labor Compensation Fund or “FGTS”). The exchange operation resulted in the redemption of R$44.1 billion securities, including R$38.1 billion in LFT and R$6 billion in short term fixed-rate securities (“LTN”). As a result, the FPD has been deeply transformed throughout the first half of 2012. After the operations in February and June, the percentage of the Government’s portfolio’s linked to a floating rate decreased from 66% as of January 2012 to 0.3% in December 2012.
On December 27, 2012, CMN adopted rules that set forth the terms of open private pension fund portfolios. The council issued Resolution No. 4176, which requires open pension fund entities to manage investment fund portfolios in such a way that the minimum average initial term of securities held in these portfolios will be 1,825 days (5 years) and, cumulatively, the average minimum refinancing term will be 1,095 days (3 years). Entities have a transition period, concluding on December 31, 2015, during which they must implement the new rules. As of May 31, 2013, portfolios that have average terms that are shorter than those prescribed by the new law cannot permit their average terms to be shortened further. These rules apply to the overall assets included in the funds offered by a single institution, and not to each fund individually. The objective of the new measure is to ensure that a majority of assets backing open private pension funds are not linked to very short-term interest rates.
D-76
External Debt Restructuring and Debt Record
In November 1983, in light of the Brazilian external debt portfolio at the time, Brazil decided to formalize a global agreement with representatives of 16 countries in the Paris Club framework, with the objective of consolidating its debt with those creditors. The agreement with the Paris Club resulted in specific bilateral agreements between Brazil and each one of the creditors involved, setting forth specific conditions for each agreement, including interest rates applicable to the refinancing operation, due dates and other terms. Another agreement was signed on February 12, 1992 to restructure part of the public sector debt financed by the Paris Club. The agreement involved 25 agencies in 13 different countries and rescheduled the debt for a period of 14 years, with a three year grace period. To induce its creditors in the Paris Club to agree to the restructuring, Brazil had to adopt a stabilization program approved by the IMF.
On July 9, 1992, Brazil and the Bank Advisory Committee, which consisted of nineteen of Brazil’s largest commercial bank creditors, reached an agreement on the restructuring of Brazil’s medium- and long-term public sector indebtedness owed to commercial banks, as well as a parallel arrangement for interest arrears accrued in respect of such indebtedness since January 1, 1991. Pursuant to that agreement, on April 15, 1994, Brazil issued approximately $43.1 billion principal amount of bonds (referred to as Brady Bonds) to holders of certain medium- and long-term public sector debt (which we refer to as Eligible Debt) of Brazil, or guaranteed by Brazil, owed to commercial banks and certain other private sector creditors in consideration for the tender by such holders of their Eligible Debt and interest arrears accrued in respect thereof since January 1, 1991.
On April 18, 2006, the Federal Government redeemed early $6.6 billion aggregate principal amount of Brady Bonds representing the entire outstanding amount of such bonds. Also, with the strong performance of the Brazilian economy, in early 2006, the National Treasury pre-paid its remaining debt owed to the Paris Club, corresponding to $1.74 billion. Since the Brady restructuring in 1994, Brazil has timely serviced its external debt without default.
D-77
TABLES AND SUPPLEMENTARY INFORMATION
Table No. 37
External Direct Debt of the Federal Government(1)
| | | | | | | | | | | | | | | | | | | | | | |
| | | | | | | | | | | | | | Principal Amount(2) | | | | |
Type | | Interest | | | Issue Date(2) | | | Final
Maturity | | | Currencies(3) | | Outstanding at
Dec 31,2012 | | | Interest | |
| | | | | | |
Multilateral Organizations | | | | | | | | | | | | | | | | | | | | | | |
World Bank | | | Variable | | | | 15-sept-02 | | | | 15-jun-17 | | | USD | | | 1 | | | | 1.563 | % |
World Bank | | | Variable | | | | 15-aug-08 | | | | 15-aug-23 | | | USD | | | 4 | | | | 0.863 | % |
World Bank | | | Variable | | | | 15-aug-09 | | | | 15-feb-39 | | | USD | | | 38 | | | | 1.563 | % |
World Bank | | | Variable | | | | 15-jul-05 | | | | 15-jan-22 | | | USD | | | 384 | | | | 1.563 | % |
World Bank | | | Variable | | | | 15-jan-07 | | | | 15-jul-23 | | | USD | | | 1 | | | | 1.313 | % |
World Bank | | | Variable | | | | 15-jan-06 | | | | 15-jul-22 | | | USD | | | 4 | | | | 1.313 | % |
World Bank | | | Variable | | | | 15-jun-07 | | | | 15-dec-22 | | | USD | | | 100 | | | | 0.863 | % |
World Bank | | | Variable | | | | 15-jun-06 | | | | 3-jun-24 | | | USD | | | 42 | | | | 0.863 | % |
World Bank | | | Variable | | | | 15-dec-08 | | | | 13-jan-41 | | | USD | | | 8 | | | | 0.813 | % |
World Bank | | | Variable | | | | 15-dec-09 | | | | 22-jun-40 | | | USD | | | 2 | | | | 0.813 | % |
World Bank | | | Variable | | | | 15-may-10 | | | | 15-may-40 | | | USD | | | 9 | | | | 0.813 | % |
World Bank | | | Variable | | | | 15-jul-04 | | | | 3-nov-20 | | | USD | | | 63 | | | | 0.813 | % |
World Bank | | | Variable | | | | 15-mar-00 | | | | 15-mar-13 | | | USD | | | 1 | | | | 7.000 | % |
World Bank | | | Variable | | | | 15-dec-03 | | | | 15-may-18 | | | USD | | | 3 | | | | 0.813 | % |
World Bank | | | Variable | | | | 15-nov-99 | | | | 15-nov-14 | | | USD | | | 3 | | | | 7.290 | % |
World Bank | | | Variable | | | | 10-may-12 | | | | 15-may-42 | | | USD | | | 98 | | | | 0.500 | % |
World Bank | | | Variable | | | | 2-dec-12 | | | | 7-jun-42 | | | USD | | | 2 | | | | 0.500 | % |
World Bank | | | Variable | | | | 13-sept-11 | | | | 15-sept-29 | | | USD | | | 0 | | | | 0.500 | % |
| | | | | | | | | | | | | | Total (World Bank) | | | 763 | | | | | |
| | | | | | |
IDB | | | 0.000 | % | | | 12-mar-07 | | | | 12-mar-19 | | | CAD | | | 14 | | | | 0.000 | % |
IDB | | | Variable | | | | 29-oct-98 | | | | 29-apr-18 | | | USD | | | 13 | | | | 4.670 | % |
IDB | | | 3.100 | % | | | 15-jun-07 | | | | 11-may-29 | | | USD | | | 30 | | | | 3.100 | % |
IDB | | | Variable | | | | 4-dec-99 | | | | 4-dec-19 | | | USD | | | 36 | | | | 4.670 | % |
IDB | | | Variable | | | | 24-may-98 | | | | 24-nov-20 | | | USD | | | 83 | | | | 4.670 | % |
IDB | | | Variable | | | | 2-sept-00 | | | | 2-sept-25 | | | USD | | | 77 | | | | 4.670 | % |
IDB | | | Variable | | | | 16-sept-97 | | | | 16-sept-19 | | | USD | | | 160 | | | | 5.360 | % |
IDB | | | Variable | | | | 16-mar-98 | | | | 16-mar-17 | | | USD | | | 24 | | | | 4.670 | % |
IDB | | | Variable | | | | 27-jul-00 | | | | 27-jul-20 | | | USD | | | 8 | | | | 4.670 | % |
IDB | | | Variable | | | | 15-nov-01 | | | | 15-dec-21 | | | USD | | | 15 | | | | 4.670 | % |
IDB | | | Variable | | | | 15-dec-02 | | | | 15-dec-22 | | | USD | | | 3 | | | | 4.670 | % |
D-78
| | | | | | | | | | | | | | | | | | | | | | |
| | | | | | | | | | | | | | Principal Amount(2) | | | | |
Type | | Interest | | | Issue Date(2) | | | Final
Maturity | | | Currencies(3) | | Outstanding at
Dec 31,2012 | | | Interest | |
IDB | | | Variable | | | | 8-jul-03 | | | | 8-jul-23 | | | USD | | | 3 | | | | 4.670 | % |
IDB | | | Variable | | | | 24-apr-06 | | | | 24-apr-31 | | | USD | | | 834 | | | | 5.360 | % |
IDB | | | Variable | | | | 11-dec-10 | | | | 11-dec-35 | | | USD | | | 3 | | | | 0.580 | % |
IDB | | | Variable | | | | 15-jun-02 | | | | 15-jun-22 | | | USD | | | 328 | | | | 4.670 | % |
IDB | | | 3.100 | % | | | 13-oct-06 | | | | 13-oct-13 | | | USD | | | 28 | | | | 3.100 | % |
IDB | | | 4.000 | % | | | 15-mar-07 | | | | 15-sept-15 | | | USD | | | 2 | | | | 4.000 | % |
IDB | | | 3.100 | % | | | 22-feb-07 | | | | 22-feb-16 | | | USD | | | 45 | | | | 3.100 | % |
IDB | | | Variable | | | | 15-dec-10 | | | | 15-dec-30 | | | USD | | | 42 | | | | 0.580 | % |
IDB | | | Variable | | | | 15-dec-10 | | | | 15-dec-30 | | | USD | | | 0 | | | | 0.580 | % |
IDB | | | Variable | | | | 18-may-01 | | | | 18-may-21 | | | USD | | | 235 | | | | 4.670 | % |
IDB | | | Variable | | | | 16-mar-98 | | | | 16-mar-22 | | | USD | | | 151 | | | | 4.670 | % |
IDB | | | Variable | | | | 26-sept-00 | | | | 1-feb-26 | | | USD | | | 111 | | | | 4.670 | % |
IDB | | | Variable | | | | 8-sept-06 | | | | 8-sept-29 | | | USD | | | 2 | | | | 4.670 | % |
IDB | | | 3.100 | % | | | 24-nov-06 | | | | 24-apr-16 | | | USD | | | 65 | | | | 3.100 | % |
IDB | | | 3.000 | % | | | 24-oct-06 | | | | 24-apr-16 | | | USD | | | 9 | | | | 3.000 | % |
IDB | | | 4.000 | % | | | 7-dec-00 | | | | 7-dec-25 | | | USD | | | 7 | | | | 4.000 | % |
IDB | | | Variable | | | | 15-may-07 | | | | 15-jan-27 | | | USD | | | 3 | | | | 0.580 | % |
IDB | | | Variable | | | | 8-aug-00 | | | | 8-aug-20 | | | USD | | | 2 | | | | 4.670 | % |
IDB | | | Variable | | | | 5-jun-01 | | | | 5-jun-20 | | | EUR | | | 1 | | | | 4.670 | % |
IDB | | | 3.000 | % | | | 6-jan-07 | | | | 6-jul-17 | | | USD | | | 6 | | | | 3.000 | % |
IDB | | | Variable | | | | 29-oct-00 | | | | 29-apr-19 | | | USD | | | 10 | | | | 3.000 | % |
IDB | | | Variable | | | | 30-apr-98 | | | | 30-oct-17 | | | USD | | | 9 | | | | 5.360 | % |
IDB | | | Variable | | | | 15-jan-08 | | | | 15-jan-28 | | | USD | | | 19 | | | | 5.360 | % |
IDB | | | Variable | | | | 15-jan-08 | | | | 15-jan-27 | | | USD | | | 39 | | | | 5.860 | % |
IDB | | | 3.100 | % | | | 26-dec-06 | | | | 26-jun-16 | | | USD | | | 143 | | | | 3.100 | % |
IDB | | | Variable | | | | 15-sept-98 | | | | 15-mar-18 | | | USD | | | 96 | | | | 4.670 | % |
IDB | | | Variable | | | | 24-nov-97 | | | | 24-nov-17 | | | USD | | | 96 | | | | 4.670 | % |
IDB | | | Variable | | | | 13-mar-99 | | | | 13-sept-24 | | | USD | | | 71 | | | | 4.670 | % |
IDB | | | Variable | | | | 10-mar-10 | | | | 10-mar-30 | | | USD | | | 2 | | | | 0.580 | % |
IDB | | | Variable | | | | 15-sept-10 | | | | 15-sept-30 | | | USD | | | 2 | | | | 0.580 | % |
| | | | | | | | | | | | | | Total (IDB) | | | 2,828 | | | | | |
| | | | | | |
Others | | | 5.820 | % | | | 1-sept-01 | | | | 1-mar-17 | | | USD | | | 7 | | | | 5.820 | % |
| | | | | | | | | | | | | | Total Others
(from Multilateral Organizations) | | | 7 | | | | | |
Total (Multilateral Organizations) | | | | | | | | | | | | | | | | | 3,598 | | | | | |
D-79
| | | | | | | | | | | | | | | | | | | | | | |
| | | | | | | | | | | | | | Principal Amount(2) | | | | |
Type | | Interest | | | Issue Date(2) | | | Final
Maturity | | | Currencies(3) | | Outstanding at
Dec 31,2012 | | | Interest | |
Foreign governments | | | | | | | | | | | | | | | | | | | | | | |
Governments Agencies | | | 2.000 | % | | | 21-apr-87 | | | | 31-dec-18 | | | USD | | | 6 | | | | 2.000 | % |
Governments Agencies | | | 8.240 | % | | | 3-mar-07 | | | | 2-jun-13 | | | JPY | | | 1 | | | | 8.240 | % |
Governments Agencies | | | 2.750 | % | | | 1-aug-01 | | | | 1-aug-16 | | | JPY | | | 17 | | | | 2.750 | % |
Governments Agencies | | | 2.000 | % | | | 30-jun-05 | | | | 30-jun-19 | | | EUR | | | 11 | | | | 2.000 | % |
Governments Agencies | | | 3.500 | % | | | 30-jun-05 | | | | 30-dec-16 | | | EUR | | | 0 | | | | 3.500 | % |
Governments Agencies | | | 4.500 | % | | | 17-jan-85 | | | | 31-dec-15 | | | DEM | | | 0 | | | | 4.500 | % |
Governments Agencies | | | 2.000 | % | | | 30-jun-05 | | | | 30-dec-16 | | | EUR | | | 0 | | | | 2.000 | % |
Governments Agencies | | | 4.200 | % | | | 15-oct-10 | | | | 20-aug-15 | | | USD | | | 5 | | | | 4.200 | % |
Governments Agencies | | | Variable | | | | 20-oct-10 | | | | 20-apr-28 | | | JPY | | | 34 | | | | 2.400 | % |
Governments Agencies | | | 4.500 | % | | | 30-jun-04 | | | | 30-dec-17 | | | DEM | | | 1 | | | | 4.500 | % |
Governments Agencies | | | Variable | | | | 26-dec-00 | | | | 26-dec-15 | | | JPY | | | 0 | | | | 2.400 | % |
Governments Agencies | | | Variable | | | | 26-dec-04 | | | | 26-jun-16 | | | JPY | | | 133 | | | | 2.600 | % |
Governments Agencies | | | Variable | | | | 24-may-07 | | | | 24-nov-17 | | | JPY | | | 65 | | | | 2.400 | % |
Governments Agencies | | | 4.500 | % | | | 26-jun-04 | | | | 29-jun-21 | | | EUR | | | 4 | | | | 4.500 | % |
Total (Foreign Governments) | | | | | | | | | | | | | | | | | 280 | | | | | |
| | | | | | |
BONDS | | | | | | | | | | | | | | | | | | | | | | |
Bonds (GLOBAL) | | | | | | | | | | | | | | | | | | | | | | |
Global Bond (2013) | | | 10.250 | % | | | 17-jun-03 | | | | 17-jun-13 | | | USD | | | 666 | | | | 10.250 | % |
Global Bond (2014) | | | 10.500 | % | | | 14-jul-04 | | | | 11-jul-14 | | | USD | | | 401 | | | | 10.500 | % |
Global Bond (2015) | | | 7.875 | % | | | 7-mar-05 | | | | 7-mar-15 | | | USD | | | 1,087 | | | | 7.875 | % |
Global Bond (2016) | | | 12.500 | % | | | 26-sept-05 | | | | 5-jan-16 | | | BRL | | | 1,410 | | | | 12.500 | % |
Global Bond (2017) | | | 6.000 | % | | | 14-nov-06 | | | | 13-jan-17 | | | USD | | | 2,506 | | | | 6.000 | % |
A Bond (2018) | | | 8.000 | % | | | 1-aug-05 | | | | 20-jan-18 | | | USD | | | 744 | | | | 8.000 | % |
Global Bond (2019) | | | 8.875 | % | | | 14-oct-04 | | | | 14-oct-19 | | | USD | | | 1,091 | | | | 8.875 | % |
Global Bond (2019-N) | | | 5.875 | % | | | 6-jan-09 | | | | 15-jan-19 | | | USD | | | 2,300 | | | | 5.875 | % |
Global Bond (2020) | | | 12.250 | % | | | 26-jan-00 | | | | 14-jan-20 | | | USD | | | 373 | | | | 12.250 | % |
Global Bond (2021) | | | 4.875 | % | | | 22-apr-10 | | | | 22-jan-21 | | | USD | | | 2,988 | | | | 4.875 | % |
Global Bond (2022) | | | 12.500 | % | | | 13-sept-06 | | | | 5-jan-22 | | | BRL | | | 1,105 | | | | 12.500 | % |
D-80
| | | | | | | | | | | | | | | | | | | | | | |
| | | | | | | | | | | | | | Principal Amount(2) | | | | |
Type | | Interest | | | Issue Date(2) | | | Final
Maturity | | | Currencies(3) | | Outstanding at
Dec 31,2012 | | | Interest | |
Global Bond (2023) | | | 2.625 | % | | | 12-sept-12 | | | | 5-jan-23 | | | USD | | | 1,350 | | | | 2.625 | % |
Global Bond (2024) | | | 6.600 | % | | | 16-mar-01 | | | | 14-apr-24 | | | USD | | | 1,745 | | | | 6.600 | % |
Global Bond (2024-B) | | | 8.875 | % | | | 16-apr-03 | | | | 14-apr-24 | | | USD | | | 664 | | | | 8.875 | % |
Global Bond (2024) | | | 8.500 | % | | | 27-apr-12 | | | | 5-jan-24 | | | BRL | | | 1,541 | | | | 8.500 | % |
Global Bond (2025) | | | 8.750 | % | | | 4-feb-05 | | | | 4-feb-25 | | | USD | | | 1,637 | | | | 8.750 | % |
Global Bond (2027) | | | 10.125 | % | | | 9-jun-97 | | | | 15-may-27 | | | USD | | | 2,519 | | | | 10.125 | % |
Global Bond (2028) | | | 10.250 | % | | | 14-feb-07 | | | | 10-jan-28 | | | BRL | | | 2,332 | | | | 10.250 | % |
Global Bond (2030) | | | 12.250 | % | | | 29-mar-00 | | | | 5-mar-30 | | | USD | | | 618 | | | | 12.250 | % |
Global Bond (2034) | | | 8.250 | % | | | 20-jan-04 | | | | 19-jan-34 | | | USD | | | 2,155 | | | | 8.250 | % |
Global Bond (2037) | | | 7.125 | % | | | 18-jan-06 | | | | 20-jan-37 | | | USD | | | 3,013 | | | | 7.125 | % |
Global Bond (2040) | | | 11.000 | % | | | 17-aug-00 | | | | 17-aug-40 | | | USD | | | 1,431 | | | | 11.000 | % |
Global Bond (2041) | | | 5.625 | % | | | 7-oct-09 | | | | 7-jan-41 | | | USD | | | 2,925 | | | | 5.625 | % |
| | | | | | | | | | | | | | Total (“Globals”) | | | 36,601 | | | | | |
Bonds (EUROS) | | | | | | | | | | | | | | | | | | | | | | |
2005 Euro Bond (2015) | | | 7.375 | % | | | 3-feb-05 | | | | 3-feb-15 | | | EUR | | | 655 | | | | 7.375 | % |
1997 Euro Bond (2017) | | | 11.000 | % | | | 26-jun-97 | | | | 26-jun-17 | | | ITL | | | 409 | | | | 11.000 | % |
| | | | | | | | | | | | | | Total (“Euros”) | | | 1,064 | | | | | |
Bonds (Others) | | | | | | | | | | | | | | | | | | | | | | |
1989 BIB | | | 6.000 | % | | | 31-08-1989 | | | | 15-sept-2013 | | | USD | | | 31 | | | | 6.000 | % |
| | | | | | | | | | | | | | Total (“Others”) | | | 31 | | | | | |
TOTAL (BONDS) | | | | | | | | | | | | | | | | | 37,696 | | | | | |
| | | | | | |
Commercial Banks | | | | | | | | | | | | | | | | | | | | | | |
Import Financing Credits with Guarantee of Foreign Governments | | | 5.540 | % | | | 29-dec-05 | | | | 29-jun-21 | | | USD | | | 344 | | | | 5.540 | % |
Import Financing Credits without Guarantee of Foreign Governments | | | Variable | | | | 19-jun-02 | | | | 5-aug-14 | | | USD | | | 0 | | | | 1.253 | % |
Import Financing Credits without Guarantee of Foreign Governments | | | 5.500 | % | | | 15-jun-10 | | | | 15-dec-16 | | | EUR | | | 431 | | | | 5.500 | % |
D-81
| | | | | | | | | | | | | | | | | | | | | | |
| | | | | | | | | | | | | | Principal Amount(2) | | | | |
Type | | Interest | | | Issue Date(2) | | | Final
Maturity | | | Currencies(3) | | Outstanding at
Dec 31,2012 | | | Interest | |
Import Financing Credits without Guarantee of Foreign Governments | | | 5.500 | % | | | 15-jun-10 | | | | 15-dec-16 | | | EUR | | | 209 | | | | 5.500 | % |
Import Financing Credits without Guarantee of Foreign Governments | | | 6.880 | % | | | 20-dec-02 | | | | 30-nov-15 | | | USD | | | 1 | | | | 6.880 | % |
Import Financing Credits without Guarantee of Foreign Governments | | | 6.880 | % | | | 29-nov-07 | | | | 19-jan-16 | | | USD | | | 2 | | | | 6.880 | % |
Import Financing Credits without Guarantee of Foreign Governments | | | 8.420 | % | | | 12-apr-97 | | | | 15-apr-15 | | | USD | | | 265 | | | | 8.420 | % |
Import Financing Credits without Guarantee of Foreign Governments | | | 5.100 | % | | | 14-dec-11 | | | | 15-jun-20 | | | EUR | | | 1 | | | | 5.100 | % |
Loans | | | Variable | | | | 5-dec-00 | | | | 1-dec-19 | | | GBP | | | 0 | | | | 1.080 | % |
Loans | | | Variable | | | | 5-dec-00 | | | | 1-apr-35 | | | GBP | | | 0 | | | | 1.080 | % |
Total (Commercial Banks) | | | | | | | | | | | | | | | | | 1,253 | | | | | |
| | | | | | |
Others | | | | | | | | | | | | | | | | | | | | | | |
Import Financing Credits without Guarantee of Foreign Governments | | | Variable | | | | 9-jan-03 | | | | 9-oct-13 | | | EUR | | | 1 | | | | 3.200 | % |
Import Financing Credits without Guarantee of Foreign Governments | | | Variable | | | | 13-feb-03 | | | | 17-feb-13 | | | EUR | | | 0 | | | | 3.250 | % |
Import Financing Credits without Guarantee of Foreign Governments | | | Variable | | | | 25-feb-01 | | | | 25-aug-18 | | | USD | | | 19 | | | | 1.563 | % |
Import Financing Credits without Guarantee of Foreign Governments | | | 7.330 | % | | | 14-mar-02 | | | | 14-mar-16 | | | USD | | | 9 | | | | 7.330 | % |
Total (Others) | | | | | | | | | | | | | | | | | 29 | | | | | |
| | | | | | |
TOTAL | | | | | | | | | |
| Total
Amount |
| | | | | 42,856 | | | | | |
| (1) | Does not include debt incurred by the Central Bank. |
| (2) | In the case of multiple tranches, the date refers to the first issuance of the security. |
| (3) | Currencies other than U.S. dollars translated into U.S. dollars by the exchange rate (sell side) as of December 31, 2012. |
Source: Central Bank.
D-82
Table No. 38
External Debt Guaranteed by the Federal Government
| | | | | | | | | | | | | | | | | | | | | | |
| | | | | | | | | | | | | | Principal Amount | |
| Type | | Interest | | | Issue
Date | | | Final
Maturity | | | Currencies | | Amount
Disbursed | | | Outstanding
at
Dec 31, 2012 | |
| | | | | | | | | | | | | | (in millions of dollars) | |
| | | | | | |
I. To Public Entities | | | | | | | | | | | | | | | | | | | | | | |
| | | | | | |
Multilateral Organizations | | | | | | | | | | | | | | | | | | | | | | |
World Bank | | | Various | | | | Various | | | | Various | | | Various | | | 11,604 | | | | 10,656 | |
Inter-American Development Bank (IDB) | | | Various | | | | Various | | | | Various | | | Various | | | 14,943 | | | | 11,657 | |
International Monetary Fund (IMF) | | | Various | | | | Various | | | | Various | | | SDR | | | 4,437 | | | | 4,437 | |
Others | | | Various | | | | Various | | | | Various | | | Various | | | 823 | | | | 684 | |
| | | | | | | | | |
| Total (Multilateral
Organizations) |
| | | 27,434 | |
| | | | | | |
Foreign Governments | | | | | | | | | | | | | | | | | | | | | | |
Import Financing Credits | | | Various | | | | Various | | | | Various | | | Various | | | 524 | | | | 305 | |
Original Loans | | | Various | | | | Various | | | | Various | | | Various | | | 2,487 | | | | 1,793 | |
| | | | | | | | | |
| Total (Foreing
Governments) |
| | | 2,098 | |
| | | | | | |
Commercial Banks | | | | | | | | | | | | | | | | | | | | | | |
Import Financing Credits without Guarantee of Foreign Governments | | | Various | | | | Various | | | | Various | | | Various | | | 350 | | | | 270 | |
Loans | | | Various | | | | Various | | | | Various | | | Various | | | 2,530 | | | | 2,260 | |
| | | | | | | | | | | Total (Commercial Banks) | | | | 2,530 | |
| | | | |
| | | | | | | | | | | Total for Public Entities | | | | 32,063 | |
II. To Private Companies | | | | | | | | | | | | | | | | | | | | | | |
(Including Privatized Companies) Loans | | | Various | | | | Various | | | | Various | | | Various | | | 547 | | | | 137 | |
III. Intercompany Loans | | | | | | | | | | | | | | | | | | | | | | |
| | | Various | | | | Various | | | | Various | | | Various | | | 0 | | | | 0 | |
| | | | | | | | | | | Total for Private Entities | | | | 137 | |
| | | | |
| | | | | | | | | |
| Total for Public and Private
Entites |
| | | 32,200 | |
| 1) | Currencies other than U.S. dollars are translated into U.S. dollars by the exchange rate (sell side) at December 31, 2012. |
Source: Central Bank.
D-83
Table No. 39
Domestic Securities Debt of the Federative Republic of Brazil
Outstanding on December 31, 2012
| | | | | | | | | | | | |
Name | | Index(1) | | Interest Rate | | Issuance Date | | Final Maturity | | Outstanding
Amount(3)
(millions of $) | |
| | | | | |
National Treasury Letters (NTL) | | Fixed | | — (2) | | Various (Sep 2010–Dec 2012) | | Various (Jan 2013–Jul 2016) | | $ | 271,005 | |
National Treasury Notes (NTN) | | | | | | | | | | | | |
A Series | | $ | | 6.00% | | Various (Dec 1997–Nov 2000) | | Various (Sep 2013–Apr 2024) | | $ | 4,149 | |
B Series | | IPCA | | 6.00% | | Various (Mar 2002–Dec 2012) | | Various (May 2013-Aug 2050) | | $ | 304,441 | |
C Series | | IGP-M | | 6% and 12% | | Various (Jan 2001–Dec 2006) | | Various (Jul 2017–Jan 2031) | | $ | 33,017 | |
F Series | | Fixed | | 10% | | Various (May 2006–Dec 2012) | | Various (Jan 2013–Jan 2023) | | $ | 118,835 | |
I Series | | $ | | 0% and 12% | | Various (May 1998–Apr 2001) | | Various (Jan 2013–Sep 2036) | | $ | 660 | |
P Series | | TR | | 6.00% | | Various (Jan 1998–Jan 2011) | | Various (Jan 2013–Jan 2027) | | $ | 114 | |
| | | | | |
National Treasury Bonds | | TR | | 6.00% | | Mar 2002 | | Various (Mar 2013–Sep 2013) | | $ | 3 | |
| | | | | |
Financial Treasury Letters (FTL) | | Overnight | | — | | Various (Set 2002–Dec 2012) | | Various (Mar 2013–Mar 2018) | | $ | 207,353 | |
A Series | | Overnight | | 0.0245%(4) | | Various (May 1998–May 2000) | | Various (May 2013–May 2015) | | $ | 434 | |
B Series | | Overnight | | — | | Various (Set 2000-Dec 2010) | | Sep 2015 | | $ | 169 | |
| | | | | |
National Treasury Certificate (CTN) | | IGP-M | | 12% | | Various (May 1998–Aug 2004) | | Various (May 2018–Aug 2024) | | $ | 4,215 | |
| | | | | |
Financial Treasury Certificate (CFT) | | | | | | | | | | | | |
A Series | | IGP-DI | | 6% and 12% | | Various (Sep 1998–Apr 2000) | | Various (Jan 2013–Sep 2028) | | $ | 741 | |
B Series | | TR | | 6.00% | | Various (Jan 1997–Jan 2006) | | Various (Jan 2027–Jan 2036) | | $ | 9 | |
D Series | | $ | | 0% and 6% | | Various (Apr 2000–Apr 2002) | | Jan 2016–May 2031 | | $ | 564 | |
E Series | | IGP-M | | Various | | Various (Dec 2000–Jan 2012) | | Various (Sep 2016–Jan 2042) | | $ | 699 | |
| | | | | |
Securitized Credits | | IGP-DI | | Various | | Various (Jun 1998–Aug 1998) | | (Jan 2022–Jan 2023) | | $ | 260 | |
| | INPC | | Various | | (Jun 1998) | | (Jul 2015) | | $ | 3 | |
| | TR | | Various | | Jan 1997–Jun 1998 | | Various (Jan 2014–Jan 2027) | | $ | 3,758 | |
| | | | | |
Public Debt Certificate (CDP) | | TR | | Various | | (Mar 1998-Mar 2002) | | Various (Mar 2028- Mar 2032) | | $ | 0 | |
Agrarian Debt Securities (TDA) | | TR | | Various | | Various | | Various(Jan 2013 – Oct 2032) | | $ | 1,691 | |
Total | | | | | | | | | | $ | 952,121 | |
Source: National Treasury Secretariat
| (1) | Securities indexed to each indicated rate/index: |
Overnight = Central Bank’s overnight rate
IGPM = General Price Index (market based)
$ = U.S. dollar exchange rate
TR = Index based on average daily rate of certificates of deposit issued by certain major Brazilian banks
TJLP = Long-term interest rate index
| (2) | Zero-coupon securities issued at a discount from their face amount. |
| (3) | Exchange rate (selling rate) at end of December 31, 2012 (R$2.0435 =U.S.$1.00). |
| (4) | Monthly interest rate. |
D-84