Exhibit D
TABLE OF CONTENTS
| | | | |
| | | Page | |
INTRODUCTION | | | D-1 | |
| |
MAP OF BRAZIL | | | D-1 | |
| |
SUMMARY | | | D-2 | |
| |
RECENT DEVELOPMENTS | | | D-4 | |
| |
THE FEDERATIVE REPUBLIC OF BRAZIL | | | D-11 | |
Geography and Population | | | D-11 | |
Form of Government | | | D-12 | |
Political Developments | | | D-13 | |
Foreign Affairs, International Organizations and International Economic Cooperation | | | D-13 | |
Employment and Labor | | | D-13 | |
Social Security | | | D-14 | |
State-Owned Enterprises | | | D-14 | |
Environment | | | D-14 | |
Education | | | D-15 | |
Wealth and Income Distribution | | | D-15 | |
Antitrust | | | D-15 | |
Anticorruption Laws | | | D-16 | |
Incentives for Private Investment | | | D-16 | |
| |
THE BRAZILIAN ECONOMY | | | D-17 | |
Historical Background | | | D-17 | |
Economy in 2017 | | | D-17 | |
Principal Sectors of the Economy | | | D-19 | |
| |
THE FINANCIAL SYSTEM | | | D-23 | |
General | | | D-23 | |
Foreign Exchange Rates and Exchange Controls | | | D-25 | |
Financial Institutions | | | D-26 | |
Banking Supervision | | | D-27 | |
Securities Markets | | | D-28 | |
| |
| BALANCE OF PAYMENTS | | D-30 | |
Current Account | | | D-30 | |
Financial Account | | | D-35 | |
Reserve Assets | | | D-36 | |
| |
| PUBLIC FINANCE | | D-38 | |
General | | | D-38 | |
Budget Process | | | D-39 | |
2018 Budget | | | D-40 | |
i
| | | | |
Federal Government Programs | | | D-40 | |
Taxation and Revenue Sharing Systems | | | D-40 | |
Sovereign Fund | | | D-41 | |
Fiscal Responsibility Law | | | D-41 | |
Fiscal Crime Law | | | D-42 | |
| |
PUBLIC DEBT | | | D-43 | |
General | | | D-43 | |
Public Debt Indicators | | | D-43 | |
Public Debt Management | | | D-45 | |
Internal Public Debt | | | D-46 | |
External Public Debt | | | D-47 | |
Regional Public Debt (State and Municipal) | | | D-48 | |
Contingent Liabilities | | | D-49 | |
External Debt Restructuring and Debt Record | | | D-49 | |
| |
TABLES AND SUPPLEMENTARY INFORMATION | | | D-50 | |
ii
Exhibit D
LIST OF TABLES
| | | | |
TABLE NO. 1 SELECTED BRAZILIAN ECONOMIC INDICATORS | | | D-2 | |
| |
TABLE NO. 2 PRINCIPAL 2018 BUDGET ASSUMPTIONS | | | D-5 | |
| |
TABLE NO. 3 PRIMARY BALANCE OF THE CENTRAL GOVERNMENT | | | D-6 | |
| |
TABLE NO. 4 EXPENDITURES OF THE NATIONAL TREASURY BY FUNCTION | | | D-7 | |
| |
TABLE NO. 5 PRINCIPAL 2019 BUDGET ASSUMPTIONS | | | D-8 | |
| |
TABLE NO. 6 ANNUAL BORROWING PLAN 2018 | | | D-9 | |
| |
TABLE NO. 7 BRAZILIAN POPULATION DISTRIBUTION BY AGE AND GENDER | | | D-11 | |
| |
TABLE NO. 8 SOCIAL INDICATORS | | | D-12 | |
| |
TABLE NO. 9 GDP AT CURRENT PRICES - DEMAND SIDE | | | D-18 | |
| |
TABLE NO. 10 GDP AT CURRENT PRICES - SUPPLY SIDE | | | D-18 | |
| |
TABLE NO. 11 REAL GROWTH (OR DECLINE) AT CURRENT PRICES BY SECTOR | | | D-19 | |
| |
TABLE NO. 12 ANNUAL CHANGES IN INDUSTRY PRODUCTION | | | D-19 | |
| |
TABLE NO. 13 BROAD NATIONAL CONSUMER PRICE INDEX (IPCA) | | | D-23 | |
| |
TABLE NO. 14 PERCENTAGE INCREASES/DECREASES IN MONETARY BASE AND MONEY SUPPLY | | | D-25 | |
| |
TABLE NO. 15 FOREIGN EXCHANGE TRANSACTIONS | | | D-26 | |
| |
TABLE NO. 16 COMMERCIAL EXCHANGE RATES | | | D-26 | |
| |
TABLE NO. 17 MARKET ACTIVITY ON B3 | | | D-29 | |
| |
TABLE NO. 18 BALANCE OF PAYMENTS | | | D-30 | |
| |
TABLE NO. 19 PRINCIPAL FOREIGN TRADE INDICATORS | | | D-30 | |
| |
TABLE NO. 20 EXPORTS BY REGION (FOB BRAZIL) | | | D-31 | |
| |
TABLE NO. 21 BRAZILIAN EXPORTS (FOB) | | | D-32 | |
| |
TABLE NO. 22 EXPORTS (FOB BRAZIL) | | | D-33 | |
| |
TABLE NO. 23 IMPORTS BY REGION (FOB BRAZIL) | | | D-34 | |
| |
TABLE NO. 24 BRAZILIAN IMPORTS (FOB) | | | D-35 | |
| |
TABLE NO. 25 IMPORTS (FOB BRAZIL) | | | D-35 | |
| |
TABLE NO. 26 FOREIGN DIRECT AND PORTFOLIO INVESTMENT IN BRAZIL | | | D-36 | |
| |
TABLE NO. 27 EXTERNAL FINANCING NEEDS | | | D-36 | |
| |
TABLE NO. 28 INTERNATIONAL RESERVES (INTERNATIONAL LIQUIDITY METRIC) | | | D-36 | |
| |
TABLE NO. 29 INTERNATIONAL RESERVES (CASH METRIC) | | | D-37 | |
| |
TABLE NO. 30 PUBLIC SECTOR BORROWING REQUIREMENTS | | | D-38 | |
| |
TABLE NO. 31 PUBLIC SECTOR DEBT | | | D-44 | |
| |
TABLE NO. 32 FEDERAL PUBLIC DEBT INDICATORS | | | D-45 | |
| |
TABLE NO. 33 FEDERAL PUBLIC DEBT RESULTS AND ANNUAL BORROWING PLAN 2017 | | | D-46 | |
| |
TABLE NO. 34 EXTERNAL PUBLIC DEBT BUYBACK PROGRAM | | | D-47 | |
| |
TABLE NO. 35 EXTERNAL FEDERAL PUBLIC DEBT | | | D-47 | |
| |
TABLE NO. 36 EXTERNAL DIRECT DEBT OF THE FEDERAL GOVERNMENT | | | D-50 | |
| |
TABLE NO. 37 EXTERNAL DEBT GUARANTEED BY THE FEDERAL GOVERNMENT | | | D-51 | |
| |
TABLE NO. 38 INTERNAL SECURITIES DEBT OF THE REPUBLIC | | | D-52 | |
iii
INTRODUCTION
In this report, references to “dollars”, “U.S. Dollars”, “US$” and “$” are to United States dollars, and references to “Real”, “Reais” and “R$” are to Brazilian Reais. References herein to “nominal” data are to data expressed in Reais that have not been adjusted to inflation, and references to “real” data are to data expressed in Reais that have been adjusted to inflation. The fiscal year of the federal government of Brazil (the “Federal Government”) ends December 31 of each year. The fiscal year ended December 31, 2017 is referred to herein as “2017”, and other years are referred to in a similar manner. Tables herein may not add up due to rounding.
The information included herein reflects the most recent information available at the time of filing.
MAP OF BRAZIL
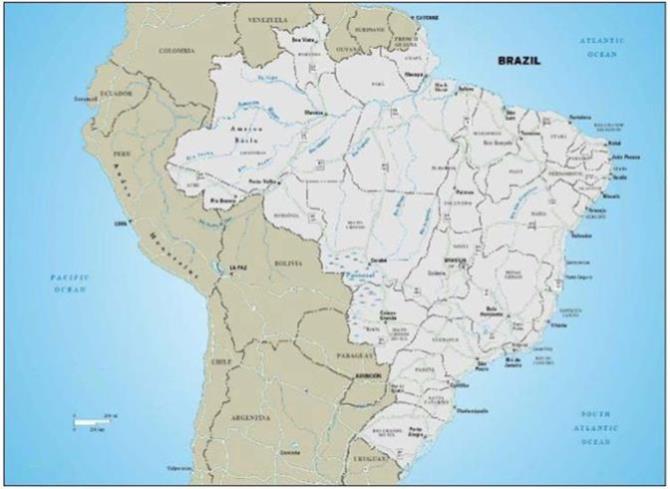
D-1
SUMMARY
The following is a summary of Brazil’s economic indicators for the period 2013-2017. The following summary does not purport to be complete and is qualified in its entirety by the more detailed information appearing elsewhere herein.
Table No. 1
Selected Brazilian Economic Indicators
| | | | | | | | | | | | | | | | | | | | |
| | | 2013 | | | 2014 | | | 2015 | | | 2016 | | | 2017 | |
Gross Domestic Product (“GDP”): | | | | | | | | | | | | | | | | | | | | |
(in billions of current R$) | | R$ | 5,331.6 | | | R$ | 5,779.0 | | | R$ | 5,995.8 | | | R$ | 6,259.2 | | | R$ | 6,559.9 | |
(in US$ billions current prices) (1) | | US$ | 2,468.5 | | | US$ | 2,454.8 | | | US$ | 1,796.2 | | | US$ | 1,797.2 | | | US$ | 2,055.2 | |
Real GDP Growth (or decline) (2) | | | 3.0 | % | | | 0.5 | % | | | -3.5 | % | | | -3.5 | % | | | 1.0 | % |
Population (millions) (3) | | | 201.0 | | | | 202.8 | | | | 204.5 | | | | 206.1 | | | | 207.7 | |
GDP Per Capita (in US$ current prices) | | US$ | 12,278.4 | | | US$ | 12,105.8 | | | US$ | 8,784.5 | | | US$ | 8,720.1 | | | US$ | 9,896.0 | |
Unemployment Rate (4) | | | 7.1 | % | | | 6.8 | % | | | 8.5 | % | | | 11.3 | % | | | 12.7 | % |
IPCA Rate (5) | | | 5.9 | % | | | 6.4 | % | | | 10.7 | % | | | 6.3 | % | | | 3.0 | % |
IGP-DI Rate(6) | | | 5.5 | % | | | 3.8 | % | | | 10.7 | % | | | 7.2 | % | | | -0.4 | % |
Nominal Exchange Rate Change (7) | | | 14.6 | % | | | 13.4 | % | | | 47.0 | % | | | -16.5 | % | | | 1.5 | % |
Domestic Real Interest Rate (8) | | | 2.2 | % | | | 4.2 | % | | | 2.4 | % | | | 7.3 | % | | | 6.8 | % |
| | | | | |
Balance of Payments (in US$ billions) | | | | | | | | | | | | | | | | | | | | |
Exports | | | 241.6 | | | | 224.1 | | | | 190.1 | | | | 184.5 | | | | 217.2 | |
Imports | | | 241.2 | | | | 230.7 | | | | 172.4 | | | | 139.4 | | | | 153.2 | |
Current Account | | | -74.8 | | | | -104.2 | | | | -59.4 | | | | -23.5 | | | | -9.8 | |
Capital and Financial Account (net) | | | 0.3 | | | | 0.2 | | | | 0.5 | | | | 0.3 | | | | 0.4 | |
Overall Balance (Change in Reserves) | | | -73.8 | | | | -100.6 | | | | -55.1 | | | | -16.4 | | | | -6.1 | |
Reserve Assets | | | -5.9 | | | | 10.8 | | | | 1.6 | | | | 9.2 | | | | 5.1 | |
Total Official Reserves | | | 375.8 | | | | 374.1 | | | | 368.7 | | | | 372.2 | | | | 382.0 | |
| | | | | |
Public Finance (% of GDP) (9) | | | | | | | | | | | | | | | | | | | | |
Central Government Primary Balance (10) | | | -1.4 | % | | | 0.4 | % | | | 2.0 | % | | | 2.6 | % | | | 1.8 | % |
Consolidated Public Sector Primary Balance (11) | | | -1.7 | % | | | 0.6 | % | | | 1.9 | % | | | 2.5 | % | | | 1.7 | % |
| | | | | |
Federal Public Debt (in R$ billions) | | | | | | | | | | | | | | | | | | | | |
Domestic Federal Public Debt (DFPD) (in R$ billions) | | R$ | 2,028.1 | | | R$ | 2,183.6 | | | R$ | 2,650.2 | | | R$ | 2,986.4 | | | R$ | 3,435.5 | |
External Federal Public Debt (EFPD) (in R$ billions) | | R$ | 94.7 | | | R$ | 112.3 | | | R$ | 142.8 | | | R$ | 126.5 | | | R$ | 123.8 | |
Total Federal Public Debt (in R$ billions) (12) | | R$ | 2,122.8 | | | R$ | 2,295.9 | | | R$ | 2,793.0 | | | R$ | 3,112.9 | | | R$ | 3,559.3 | |
Federal Public Debt as % of Nominal GDP | | | 39.8 | % | | | 39.7 | % | | | 46.6 | % | | | 49.7 | % | | | 54.3 | % |
| | | | | |
General Government Gross and Net | | | | | | | | | | | | | | | | | | | | |
General Government Gross Debt (GGGD) (in R$ billions) (13) | | R$ | 2,748.0 | | | R$ | 3,252.4 | | | R$ | 3,927.5 | | | R$ | 4,378.5 | | | R$ | 4,854.7 | |
GGGD as % of GDP | | | 51.5 | % | | | 56.3 | % | | | 65.5 | % | | | 70.0 | % | | | 74.0 | % |
Public Sector Net Debt (PSND) (in R$ billions) (14) | | R$ | 1,626.3 | | | R$ | 1,883.1 | | | R$ | 2,136.9 | | | R$ | 2,892.9 | | | R$ | 3,382.9 | |
PSND as % of GDP | | | 30.5 | % | | | 32.6 | % | | | 35.6 | % | | | 46.2 | % | | | 51.6 | % |
| Note: | Numbers may not total due to rounding. |
| (1) | Converted into U.S. Dollars based on the weighted average exchange rate for each year. |
| (2) | Cumulative over four quarters per year. |
| (4) | Annual average unemployment rate. |
| (5) | Broad National Consumer Price Index (Índice de Preços ao Consumidor Amplo or “IPCA”), as reported by the National Bureau of Geography and Statistics (Fundação Instituto Brasileiro de Geografia e Estatística or “IBGE”). |
D-2
| (6) | The General Price Index-Domestic Supply (Índice Geral de Preços-Disponibilidade Interna or “IGP-DI”) is one of multiple inflation indicators in Brazil, IGP-DI being one of the most widely used. The IGP-DI is calculated by the Getúlio Vargas Foundation, an independent research organization. |
| (7) | Year-over-Year percentage change of the nominal exchange rate: (+) depreciation or (-) appreciation of the Real against the U.S. Dollar (sell side). |
| (8) | “Domestic Real Interest Rate” represents the accumulated Selic (Sistema Especial de Liquidação e Custódia or “Selic”), adjusted to exclude effects of IPCA. |
| (9) | Calculated using the “below the line” financial method, with respect to changes in the public sector’s total net debt (domestic or external). Surpluses are represented by negative numbers and deficits are represented by positive numbers. |
| (10) | “Central Government” includes (i) the National Treasury (Secretaria do Tesouro Nacional), (ii) the Social Security System (Sistema da Previdência Social) and (iii) the Central Bank. “Primary Balance” represents revenues minus expenditures, excluding interest expenditures on public debt. |
| (11) | “Consolidated Public Sector” includes (i) the Central Government, Regional Governments (including state and municipal governments) and (ii) the state-owned enterprises, with the exception of Petróleo Brasileiro S.A.—Petrobras (“Petrobras”) and Centrais Elétricas Brasileiras S.A.—Eletrobras (“Eletrobras”). “Primary Balance” represents revenues minus expenditures, excluding interest expenditures on public debt. |
| (12) | Total Federal Public Debt, as reported by the National Treasury. |
| (13) | “General Government Gross Debt” (“General Government Gross Debt” or “GGGD”) defined as private and public sector financial debt of the federal, state and municipal governments, with the exception of (i) state-owned company debt (at all government levels) and (ii) Central Bank liabilities. |
| (14) | “Public Sector Net Debt” (“Public Sector Net Debt” or “PSND”) refers to total liabilities of the non-financial public sector (as deducted from its public sector financial assets held by (i) non-financial private agents, (ii) public financial agents and (iii) private financial agents. PSND includes Central Bank assets and liabilities including international reserves and the monetary base. |
Source: IBGE; Getúlio Vargas Foundation; Central Bank; National Treasury.
D-3
RECENT DEVELOPMENTS
THE FEDERATIVE REPUBLIC OF BRAZIL
Recent Political Developments
Corruption Investigations.
On July 12, 2017, former President Luiz Inácio Lula da Silva was found guilty of corruption in connection with the “Lava Jato” investigation and sentenced to imprisonment. He began to serve his sentence in April 2018, after both the Superior Court of Justice (Superior Tribunal de Justiça or “STJ”) and the Federal Supreme Court of Brazil (Supremo Tribunal Federal or “STF”) determined that former President Lula could be imprisoned while appealing his sentence. Former President Lula appealed this decision To the extent former President Lula registers as a presidential candidate in the October 2018 elections while imprisoned, the Electoral Court (“TSE”) will decide on the lawfulness of his candidacy. Aside from the President, members of the National Congress, State Governors and members of the State Legislature will be elected in October 2018.
As of the date hereof, the “Lava Jato” investigation is still ongoing. The investigation which initially targeted an alleged bribery, money laundering and embezzlement scheme involving the provision of goods and services to Petrobras, a majority state-owned company, grew in scope to a wide-reaching anti-corruption investigation and has had many stages since its inception in 2014.
Federal Intervention.
On February 16, 2018, the President launched a federal military intervention in the State of Rio de Janeiro aiming at halting the serious impairment of public order in the State of Rio de Janeiro. While this intervention is in force, which is until December 31, 2018, the federal constitution (Constituição da República Federativa do Brasil or the “Constitution”) cannot be amended.
Temporary Halt in the Transportation Sector
On May 21, 2018, Brazilian truck drivers began an eleven-day strike to protest high diesel prices. In order to put an end to the strike, the Federal Government agreed to (i) reduce diesel prices by R$0.46 per liter, (ii) maintain diesel prices stable for 60 days, (iii) reduce tolls for large trucks and (iv) fix minimum tariffs for freight. The constitutionality of the freight tariff is being disputed in the STF.
The reduction in the diesel price will generate R$4.0 billion in tax losses and R$9.5 billion in additional expenses, resulting from subsidies to Petrobras in 2018. To offset these tax losses, the Federal Government cut certain sectoral tax incentives. To offset the subsidies to Petrobras, the Federal Government cut expenses in the amount of R$3.4 billion and plans to use R$6.2 billion from contingency reserves.
Employment
As of June 30, 2018, formal employment remained stable at 38,212 thousand work posts, when compared to May 31, 2018.
In the second quarter of 2018, the unemployment rate in Brazil was 12.4%, a decrease of 0.7 percentage points compared to the first quarter of 2018 and a decrease of 0.6 percentage points compared to the second quarter of 2017.
Wages
The minimum monthly wage for 2018 was set at R$954, an increase of 1.8% compared to the 2017 minimum monthly wage of R$937. For 2019, the minimum monthly wage proposed by the Federal Government is R$1,002.00, an increase of 5.0% as compared to 2018.
Social Security
As of January 1, 2018, monthly benefits paid by Brazil’s state-operated social security and pension system increased by 2.1%. In 2018, the monthly lower and upper limits of the social security pensions paid to private sector retirees are R$954.0 and R$5,645.8, respectively.
THE BRAZILIAN ECONOMY
Gross Domestic Product
In the first quarter of 2018, the GDP increased by 0.4% compared to the fourth quarter of 2017. This was the fifth positive quarterly result after eight consecutive negative quarterly results on a quarter-to-quarter basis. Compared to the first quarter of 2017, the GDP increased by 1.2% in the first quarter of 2018. The result was mainly influenced by the industry sector, which grew by 1.6% when compared to the first quarter of 2017, driven by the increase in the production of beverages, furniture, machinery and equipment, paper and pulp, basic metals, vehicles and computer equipment.
The Federal Government estimates a negative impact of approximately 0.2 percentage points on the GDP (R$15.9 billion) due to the temporary halt in the transportation sector that took place in May 2018 caused by the truck drivers’ strike.
Prices
The IPCA increased from a negative 0.23% rate registered in June 2017 to 1.26% in June 2018. This was the highest IPCA for the month of June since 1995. The accumulated IPCA for 2018 to date was 2.60%, above the accumulated IPCA of 1.18% for the same period in 2017. With respect to the 12-month period ended on June 30, 2018, the index increased to 4.39%, when compared to the 3.00% rate registered for the same period ended on June 30, 2017.
The main driver of the IPCA increase was the Food and Beverages sector, which increased by 2.03%, and the Transportation Sector, which increased by 1.58%. The inflation figures for June were strongly driven by the temporary halt in the transportation sector that took place in May 2018.
In June 2018, the Central Bank Monetary Policy Committee (Comitê de Política Monetária or “COPOM”) kept the Selic interest rate stable at 6.50% per annum. COPOM forecasts IPCA inflation of 4.2% in 2018 and 3.7% in 2019 (in comparison with its prior forecast of 3.6% and 3.9% for 2018 and 2019, respectively). This forecast assumes an inflation rate target set by the National Monetary Council (Conselho Monetário Nacional, or “CMN”) of 6.50% for 2018 and 8.00% for 2019.
D-4
For 2021, the CMN set the inflation target at 3.75% with a tolerance interval of plus or minus 1.5 percentage points.
Principal Sectors of the Economy
In June 2018, the Federal Government approved a new mining code in the context of the Brazilian Mineral Industry Revitalization Program (Programa de Revitalização da Indústria Mineral Brasileira). The new code completes the process of modernizing the Brazilian mining legal framework, which the Federal Government started in July 2017. For additional information on this topic, please refer to “Mining, Oil and Gas” in the “The Brazilian Economy” section.
On July 26, 2018, the Federal Government privatized Cepisa, the entity responsible for the distribution of electricity in the State of Piauí. Cepisa is the first of a total of six energy distributors, in each case controlled by Eletrobras, that the Federal Government expects to privatize in the coming years. These six distributors have been (i) suffering recurring financial losses and (ii) struggling with meeting both service quality and financial balance goals defined by the Brazilian Electricity Regulatory Agency (ANEEL). These privatizations are being conducted as part of the Federal Government’s larger efforts to privatize Eletrobras. National Congress approval regarding the privatization of Eletrobras is still pending.
FINANCIAL SYSTEM
Financial Institutions
BNDES
In March 2018, the CMN decreased the long term interest rate used for loans granted by the Brazilian National Development Bank (“BNDES”) (Taxa de Juros de Longo Prazo or “TJLP”) from 6.75% to 6.60% per annum for the second quarter of 2018.
As of January 1, 2018, the TJLP was replaced by the TLP (applicable for new BNDES loans). On January 1, 2018, the first TLP remained at 6.75% per annum (same as prior TJLP). Thereafter, the TLP will be defined as the sum of IPCA rate plus a percentage of the five-year real interest rate of Brazil’s Treasury Bonds (Notas do Tesouro Nacional – Serie B, price-indexed bonds, or “NTB-B”). This percentage will be increased gradually until 2023, when the TLP will be redefined as the sum of IPCA plus 100% of the real interest rate of the NTN-B.
Loan Loss Reserves
As of June 2018, credit operations in arrears for over 90 days decreased by 0.2 percentage points to 3.1%, in comparison with May 2018. The level of credit operations in arrears with respect to credits granted to families decreased by 0.1 percentage points (3.5%) and to legal entities decreased by 0.4 percentage points (2.6%).
Foreign Exchange Rate
The Brazilian Real-U.S. Dollar exchange rate, as published by the Central Bank, was R$3.7549 to US$1.00 (sell side) on July 31, 2018.
BALANCE OF PAYMENTS
Balance of Payments
As of June 30, 2018, the current account registered a deficit of US$13.9 billion (0.7% of GDP) for the previous twelve months; the capital account registered a surplus of approximately U.S.$391.30 million and foreign direct investment was U.S.$64.3 billion (3.3% of GDP).
PUBLIC FINANCE
2018 Budget
Table No. 2
Principal 2018 Budget Assumptions
| | | | |
| | | As of May 31, 2018 | |
Gross Domestic Product | | | | |
Nominal GDP (in billions of Reais) | | | 6,968.0 | |
Real GDP Growth (or Decline) | | | 2.5 | % |
Inflation | | | | |
Domestic Inflation (IPCA) | | | 3.4 | % |
D-5
Source: SEPLAN/Federal Budget Secretariat (Secretaria de Orçamento Federal or “SOF”)
The following table sets forth revenues and expenditures of the Federal Government from 2014 through 2018.
Table No. 3
Primary Balance of the Central Government (1)
(in billions of Reais)
| | | | | | | | | | | | | | | | | | | | |
| | | 2014 | | | 2015 | | | 2016 | | | 2017 | | | 2018
Budget(5) | |
1—Total Revenues | | | 1,221.5 | | | | 1,247.8 | | | | 1,315.0 | | | | 1,383.1 | | | | 1,456.5 | |
1.1—RFB Revenues(2) | | | 739.2 | | | | 765.1 | | | | 819.8 | | | | 835.6 | | | | 886.7 | |
1.2—Fiscal Incentives | | | 0.0 | | | | 0.0 | | | | -0.2 | | | | -1.4 | | | | 0.0 | |
1.3—Social Security Net Revenues | | | 337.5 | | | | 350.3 | | | | 358.1 | | | | 374.8 | | | | 403.4 | |
1.4—Non—RFB Revenues | | | 144.8 | | | | 132.4 | | | | 137.2 | | | | 174.1 | | | | 166.4 | |
2—Transfers by Sharing Revenue | | | 198.5 | | | | 204.7 | | | | 226.8 | | | | 228.3 | | | | 235.1 | |
3—Total net Revenue | | | 1,023.0 | | | | 1,043.1 | | | | 1,088.1 | | | | 1,154.7 | | | | 1,221.4 | |
4—Total expenditures | | | 1,046.5 | | | | 1,164.5 | | | | 1,249.4 | | | | 1,279.0 | | | | 1,365.3 | |
4.1—Social security benefits | | | 394.2 | | | | 436.1 | | | | 507.9 | | | | 557.2 | | | | 596.3 | |
4.2—Personnel and Social Charges | | | 222.4 | | | | 238.5 | | | | 257.9 | | | | 284.0 | | | | 297.8 | |
4.3—Other mandatory expenditures | | | 160.4 | | | | 236.6 | | | | 199.9 | | | | 185.2 | | | | 358.6 | |
4.4—Discretionary expenditures—All branches | | | 269.6 | | | | 253.3 | | | | 283.7 | | | | 252.5 | | | | 112.6 | |
5—Brazilian sovereign wealth fund (FSB) | | | 0.0 | | | | 0.9 | | | | 0.0 | | | | 0.0 | | | | 0.0 | |
6—Primary Balance(3) | | | -23.5 | | | | -120.5 | | | | -161.3 | | | | -124.3 | | | | -143.9 | |
7—Methodological Adjustment | | | 0.0 | | | | 3.9 | | | | 3.9 | | | | 7.6 | | | | 1.2 | |
8—Statistical Discrepancy | | | 3.0 | | | | 0.0 | | | | -2.1 | | | | -1.8 | | | | -16.4 | |
9—Central Government Primary Balance(4) | | | -20.5 | | | | -116.7 | | | | -159.5 | | | | -118.4 | | | | -159.0 | |
10—Nominal Interest | | | -251.1 | | | | -397.2 | | | | -318.4 | | | | -340.9 | | | | -272.6 | |
11—Central Government Nominal Balance(4) | | | -271.5 | | | | -513.9 | | | | -477.8 | | | | -459.3 | | | | -431.6 | |
Note: Numbers may not total due to rounding.
| (1) | Consolidated accounts of (i) the National Treasury, (ii) the Social Security System and (iii) the Central Bank. |
| (2) | Brazilian Federal Tax Authority (Receita Federal do Brasil or “RFB”). |
| (3) | Calculated using the “above the line” method, with respect to the difference between the revenues and expenditures of the public sector. |
| (4) | Calculated using the “below the line” financial method, with respect to changes in public sector’s total net debt (domestic or external). Surpluses are represented by negative numbers and deficits are represented by positive numbers. |
Source: National Treasury
D-6
The following table sets forth the expenditures of the Federal Government by function in the years indicated. The figures in the table are not directly comparable to those set forth in Table No. 3 above, entitled “Primary Balance of the Central Government”, because the expenditures set forth in Table No. 3 were calculated in accordance with the International Monetary Fund (“IMF”) methodology, which does not include, among other things, debt service expenditures and certain financial investments.
Table No. 4
Expenditures of the National Treasury by Function
In millions of Reais (R$)
| | | | | | | | | | | | | | | | | | | | |
| | | 2014 | | | 2015 | | | 2016 | | | 2017 | | | 2018
Budget(1) | |
Legislative | | | 5,531.0 | | | | 5,914.4 | | | | 6,158.4 | | | | 6,210.5 | | | | 8,182.0 | |
Judiciary | | | 23,519.7 | | | | 25,500.6 | | | | 27,550.2 | | | | 29,374.1 | | | | 38,052.6 | |
Essential to Justice | | | 4,259.3 | | | | 4,944.7 | | | | 5,317.7 | | | | 5,924.6 | | | | 7,568.2 | |
Administration and Planning | | | 17,559.7 | | | | 18,264.6 | | | | 20,208.8 | | | | 22,657.0 | | | | 31,586.1 | |
National Defense | | | 34,435.6 | | | | 32,888.5 | | | | 56,792.8 | | | | 62,672.2 | | | | 73,528.8 | |
Public Security | | | 6,524.4 | | | | 6,865.8 | | | | 7,530.0 | | | | 8,060.9 | | | | 10,435.2 | |
Foreign Affairs | | | 2,251.3 | | | | 2,958.0 | | | | 2,652.6 | | | | 2,754.6 | | | | 2,761.2 | |
Social Assistance | | | 68,325.8 | | | | 69,176.7 | | | | 77,552.5 | | | | 83,076.9 | | | | 86,971.2 | |
Social Security | | | 493,124.8 | | | | 513,582.8 | | | | 578,960.1 | | | | 636,444.8 | | | | 689,469.3 | |
Health | | | 85,130.9 | | | | 92,154.1 | | | | 98,494.8 | | | | 100,890.1 | | | | 121,631.8 | |
Labor | | | 69,419.7 | | | | 65,089.6 | | | | 70,033.1 | | | | 69,292.4 | | | | 81,376.2 | |
Education | | | 73,059.8 | | | | 78,288.4 | | | | 84,634.6 | | | | 88,316.8 | | | | 112,791.6 | |
Culture | | | 858.9 | | | | 783.6 | | | | 882.3 | | | | 946.4 | | | | 2,024.9 | |
Citizenship Rights | | | 687.8 | | | | 635.3 | | | | 1,754.1 | | | | 1,342.5 | | | | 1,714.6 | |
Urban Planning | | | 1,486.2 | | | | 1,083.9 | | | | 1,480.4 | | | | 1,791.5 | | | | 5,501.3 | |
Housing | | | 7.5 | | | | 2.4 | | | | 9.4 | | | | 6.2 | | | | 63.0 | |
Sanitation | | | 483.1 | | | | 259.6 | | | | 409.0 | | | | 714.6 | | | | 964.3 | |
Environmental Management | | | 3,617.7 | | | | 2,813.7 | | | | 3,206.1 | | | | 2,903.1 | | | | 5,399.4 | |
Science and Technology | | | 6,115.8 | | | | 5,807.4 | | | | 5,778.9 | | | | 5,859.8 | | | | 7,823.7 | |
Agriculture | | | 9,833.4 | | | | 17,132.9 | | | | 18,771.6 | | | | 14,320.4 | | | | 29,132.0 | |
Agricultural Organization | | | 2,510.5 | | | | 1,558.0 | | | | 2,203.5 | | | | 1,720.5 | | | | 2,907.3 | |
Industry | | | 1,958.8 | | | | 1,790.8 | | | | 1,888.8 | | | | 1,956.6 | | | | 2,300.0 | |
Commerce and Services | | | 1,359.1 | | | | 1,102.1 | | | | 2,376.2 | | | | 2,088.6 | | | | 4,850.7 | |
Communications | | | 1,156.8 | | | | 1,074.3 | | | | 1,191.7 | | | | 1,022.3 | | | | 1,430.2 | |
Energy | | | 883.9 | | | | 1,467.1 | | | | 1,608.6 | | | | 1,697.9 | | | | 2,219.8 | |
Transportation | | | 13,891.7 | | | | 9,521.7 | | | | 9,829.1 | | | | 10,628.7 | | | | 17,107.5 | |
Sports and Leisure | | | 848.4 | | | | 651.4 | | | | 473.4 | | | | 307.3 | | | | 1,282.3 | |
Special Charges(2) | | | 614,100.8 | | | | 685,207.8 | | | | 787,351.1 | | | | 810,889.7 | | | | 2,125,287.2 | |
Contingency Reserve(3) | | | — | | | | — | | | | — | | | | — | | | | 32,058.7 | |
Subtotal | | | 1,542,942.3 | | | | 1,646,520.3 | | | | 1,875,099.7 | | | | 1,973,871.2 | | | | 3,506,421.1 | |
Special Charges - Debt | | | 497,037.0 | | | | 571,628.3 | | | | 653,848.1 | | | | 466,989.3 | | | | — | |
Total | | | 2,039,979.3 | | | | 2,218,148.6 | | | | 2,528,947.7 | | | | 2,440,860.5 | | | | 3,506,421.1 | |
Note: Numbers may not total due to rounding.
| (2) | “Special Charges” represents the total refinancing charges of Federal Government debt securities, plus (i) monetary and foreign exchange adjustments of such debt securities, (ii) refinancing charges of Federal Government contractual debt and (iii) monetary and foreign exchange adjustments of contractual debt of the Federal Government. “Special Charges” combines expenditures not directly associated with goods or services obtained, such as, for example, debts and reimbursements. |
| (3) | “Contingency Reserve” is part of the budget law as an assumption and is not specifically allocated to any government agency or body. It serves as a reserve for both the cancellation of debt and opening of additional credits. According to the current budgetary guidelines law, contingency reserves must (i) be indexed to both the fiscal and social security budgets and (ii) correspond to approximately three percent of each of the total tax revenue and social security contribution income, respectively. |
Source: Ministry of Finance (Ministério da Fazenda); National Treasury and SOF
2019 Budget
The budgetary guideline bill for 2019, sent to National Congress on April 13, 2018, set a nominal primary deficit for the consolidated public sector for 2019 of R$132 billion (approximately 1.8% of estimated GDP for 2019). The macroeconomic parameters contemplated by bill anticipate inflation of 4.3% and a projected GDP growth of 3.0% for 2019.
D-7
Table No. 5
Principal 2019 Budget Assumptions
| | | | |
| | | As of April 12, 2018 | |
Gross Domestic Product | | | | |
Nominal GDP (in billions of Reais) | | | 7,549.3 | |
Real GDP Growth (or Decline) | | | 3.0 | % |
Inflation | | | | |
Domestic Inflation (IPCA) | | | 4.3 | % |
Source: SEPLAN/Federal Budget Secretariat (Secretaria de Orçamento Federal or “SOF”)
Fiscal Balance
In June 2018, the consolidated public sector registered a primary deficit of R$13.5 billion compared to a deficit of R$19.6 billion in June, 2017. For the 12-month period ended June 30, 2018, the accumulated balance was a deficit of R$89.8 billion (1.3% of GDP).
In June 2018, the Brazilian Social Security System presented a deficit of R$14.5 billion, 8.3% higher (in real terms) than the Social Security System deficit registered in June 2017. For the 12-month period ended June 30, 2018, the deficit in Brazil’s Social Security System totalled R$195.3 billion (in real terms). At current market prices, the deficit accumulated in the preceding 12-month period ended on June 30, 2018 reached R$190.4 billion.
Sovereign Fund
On May 29, 2018, the Federal Government announced that it had concluded the redemption of Brazil’s Sovereign Wealth Fund (“FSB”) shares. The redeemed value, R$3.6 billion, will be used to towards the reduction of outstanding public debt. In addition, approximately R$500 million that were in the FSB will be transferred to the National Treasury.
PUBLIC DEBT
Public Debt Indicators
Public Sector Net Debt
As of June 30, 2018, Public Sector Net Debt was R$3,440.7 billion (51.4% of GDP) compared to R$3,112.9 billion (48.5% of GDP) as of June 30, 2017.
General Government Gross Debt
As of June 30, 2018, General Government Gross Debt was R$5,165.4 billion (77.2% of GDP) compared to R$4,674.6 billion (72.8% of GDP) as of June 30, 2017.
Federal Public Debt
The following table presents Brazil’s Federal Public Debt profile as of June 30, 2018:
| | | | | | | | | | | | | | | | | | | | | | | | |
| Federal Public Debt Profile | |
| | | June-18 | | | May-18 | | | June-17 | |
| | | | | | % | | | | | | % | | | | | | % | |
Federal Public Debt (R$ bn) | | R$ | 3,754.1 | | | | 100.0 | % | | R$ | 3,716.7 | | | | 100.0 | % | | R$ | 3,357.6 | | | | 100.0 | % |
Domestic | | R$ | 3,607.3 | | | | 96.1 | % | | R$ | 3,573.7 | | | | 96.2 | % | | R$ | 3,233.7 | | | | 96.3 | % |
Fixed-rate | | R$ | 1,287.2 | | | | 34.3 | % | | R$ | 1,288.5 | | | | 34.7 | % | | R$ | 1,178.1 | | | | 35.1 | % |
Inflation-linked | | R$ | 1,099.1 | | | | 29.3 | % | | R$ | 1,089.8 | | | | 29.3 | % | | R$
|
1,015.7 |
| | | 30.2 | % |
Selic rate | | R$ | 1,214.3 | | | | 32.3 | % | | R$ | 1,189.2 | | | | 32.0 | % | | R$ | 1,035.7 | | | | 30.8 | % |
D-8
| | | | | | | | | | | | | | | | | | | | | | | | |
FX | | R$ | 153.6 | | | | 4.1 | % | | R$ | 149.2 | | | | 4.0 | % | | R$ | 128.2 | | | | 3.8 | % |
Others | | | — | | | | — | | | | — | | | | — | | | | — | | | | — | |
External (R$ bn) | | R$ | 146.8 | | | | 3.9 | % | | R$ | 143.0 | | | | 3.8 | % | | R$ | 124.0 | | | | 3.7 | % |
Maturity Profile | | | | | | | | | | | | |
Average Maturity (years) | | | 4.1 | | | | 4.2 | | | | 4.4 | |
Maturing in 12 months (R$ bn) | | | R$ 759.9 | | | | R$ 753.9 | | | | R$ 502.4 | |
Maturing in 12 months (%) | | | 20.2% | | | | 20.3% | | | | 15.0% | |
Note: Numbers may not total due to rounding.
Source: National Treasury
The following table presents the reference limits for Federal Public Debt in 2018:
Table No. 6
Annual Borrowing Plan 2018
| | | | | | | | |
| | | Limits for 2018 | |
| | | Minimum | | | Maximum | |
Stock of Federal Public Debt (R$ Billion) | | | | | | | | |
Federal Public Debt | | | 3,780.0 | | | | 3,980.0 | |
Composition—% | | | | | | | | |
Fixed Rate | | | 32.0 | | | | 36.0 | |
Inflation Linked | | | 27.0 | | | | 31.0 | |
Floating Rate | | | 31.0 | | | | 35.0 | |
Exchange Rate | | | 3.0 | | | | 7.0 | |
Maturity Profile | | | | | | | | |
% Maturing in 12 months | | | 15.0 | | | | 18.0 | |
Average Maturity (years) | | | 4.0 | | | | 4.2 | |
Source: National Treasury
Public Debt Management
Golden Rule
In order to comply with the Golden Rule, the Federal Government will have to raise (i) R$181.9 billion in 2018, (ii) R$260.2 billion in 2019, (iii) R$307.3 in 2020 and (iv) R$228.4 in 2021. For 2018, resources will come from (i) early BNDES re-payments of certain loans with the National Treasury (each a “BNDES Early Re-payment”) (R$100 billion), (ii) redemption of the FSB shares (R$27 billion), (iii) liquidation of the National Development Fund (R$16 billion), (iv) cancellation of public expenditures scheduled for 2017 that have not yet been implemented (R$20 billion), and other varied sources (R$18.9 billion). For additional information on this topic, please refer to “Golden Rule” in the “Public Debt” section.
BNDES Early Re-Payments
In accordance with the fiscal consolidation program promoted by the Federal Government, new BNDES Early Re-payments were negotiated in 2018. BNDES re-paid R$30 billion in April and R$30 billion in June. BNDES Early Re-payments are expected to total R$100 billion in 2018. The proceeds of BNDES Early Re-payments will exclusively be used by the National Treasury for public debt relief and compliance with the Golden Rule. For additional information on this topic, please refer to “Internal Public Debt Levels” in the “Public Debt” section.
External Public Debt
Securities Offerings in 2018
On January 23, 2018, the Republic reopened US$1.5 billion of its 5.625% Global Notes due 2047.
Export Guarantees
D-9
On May 2, 2018, National Congress approved an increase of the 2018 Budget by R$1.2 billion in order to capitalize the Exports Guarantee Fund and pay the amounts outstanding on loans defaulted by Venezuela and Mozambique that had a guarantee from the Federal Government. These guarantees were granted by the Federal Government to Brazilian companies operating in each of Venezuela and Mozambique, in the context of the Agreement on Reciprocal Payments and Credits (“ARPC”) of the Latin American Integration Association (“ALADI”).
Regional Public Debt (State and Municipal)
Special Recovery Regime and Federal Government Guarantees
As of June 30, 2018, the Federal Government paid a total of R$1.9 billion in liabilities incurred by states and municipalities and only recovered 1.9% of this amount (via enforcement of collateral). The outstanding recoverable amount refers to instalments defaulted by the State of Rio de Janeiro. Enforcement of collateral relating to Rio de Janeiro’s debt is suspended until 2020, as a result of the Special Recovery Regime.
Rating Agencies
In February 2018, Fitch Ratings lowered Brazil’s long-term foreign currency sovereign credit rating from BB to BB- with a stable outlook. In addition, in April 2018, Moody’s Investors Service confirmed Brazil’s Ba2 long-term foreign currency sovereign credit rating and changed the outlook from negative to stable.
D-10

THE FEDERATIVE REPUBLIC OF BRAZIL
Geography and Population
Brazil is the fifth largest country in the world and occupies nearly half of the land area of South America, sharing borders with every country in South America except for Chile and Ecuador. Brazil is divided into 26 states and the Federal District, where the country’s capital, Brasília, is located. Brazil’s official language is Portuguese.
As of December 31, 2017, Brazil’s estimated population was 207.7 million. According to the most recent demographic census, as of 2010 the average age of the Brazilian population was 32.1 years. The following table sets forth the age distribution of the Brazilian population as of 2010.
Table No. 7
Brazilian Population Distribution by Age and Gender
| | | | | | | | | | | | | | | | |
Age | | Number of men | | | Percentage of men | | | Number of women | | | Percentage of women | |
0-4 years | | | 7,016,987 | | | | 3.7 | % | | | 6,779,172 | | | | 3.6 | % |
5-9 years | | | 7,624,144 | | | | 4.0 | % | | | 7,345,231 | | | | 3.9 | % |
10-14 years | | | 8,725,413 | | | | 4.6 | % | | | 8,441,348 | | | | 4.4 | % |
15-19 years | | | 8,558,868 | | | | 4.5 | % | | | 8,432,002 | | | | 4.4 | % |
20-24 years | | | 8,630,227 | | | | 4.5 | % | | | 8,614,963 | | | | 4.5 | % |
25-29 years | | | 8,460,995 | | | | 4.4 | % | | | 8,643,418 | | | | 4.5 | % |
30-34 years | | | 7,717,657 | | | | 4.0 | % | | | 8,026,855 | | | | 4.2 | % |
35-39 years | | | 6,766,665 | | | | 3.5 | % | | | 7,121,916 | | | | 3.7 | % |
40-44 years | | | 6,320,570 | | | | 3.3 | % | | | 6,688,797 | | | | 3.5 | % |
45-49 years | | | 5,692,013 | | | | 3.0 | % | | | 6,141,338 | | | | 3.2 | % |
50-54 years | | | 4,834,995 | | | | 2.5 | % | | | 5,305,407 | | | | 2.8 | % |
55-59 years | | | 3,902,344 | | | | 2.0 | % | | | 4,373,875 | | | | 2.3 | % |
60-64 years | | | 3,041,034 | | | | 1.6 | % | | | 3,468,085 | | | | 1.8 | % |
65-69 years | | | 2,224,065 | | | | 1.2 | % | | | 2,616,745 | | | | 1.4 | % |
70-74 years | | | 1,667,373 | | | | 0.9 | % | | | 2,074,264 | | | | 1.1 | % |
75-79 years | | | 1,090,518 | | | | 0.6 | % | | | 1,472,930 | | | | 0.8 | % |
80-84 years | | | 668,623 | | | | 0.4 | % | | | 998,349 | | | | 0.5 | % |
85-89 years | | | 310,759 | | | | 0.2 | % | | | 508,724 | | | | 0.3 | % |
90-94 years | | | 114,964 | | | | 0.1 | % | | | 211,595 | | | | 0.1 | % |
95-99 years | | | 31,529 | | | | 0.0 | % | | | 66,806 | | | | 0.0 | % |
Over 100 years | | | 7,247 | | | | 0.0 | % | | | 16,989 | | | | 0.0 | % |
Total Brazil | | | 190,755,799 | | | | | | | | | | | | | |
Source: IBGE
D-11
According to the United Nations’ Human Development Report Office, over the past three decades, Brazil has made significant progress in improving social welfare. From 1990 to 2015, (i) life expectancy increased by more than 14% from 65.3 years in 1990 to 74.7 years in 2015, and (ii) infant mortality decreased by more than 70% from 50.9 per 1,000 live births in 1990 to 14.6 per 1,000 live births in 2015. According to the IMF, real GDP per capita adjusted for purchasing power parity rose by approximately 130% from US$6,795.2 in 1990 to US$15,602.5 in 2017. In addition, the reduction in inflation under the Federal Government’s stabilization program, the Plano Real, and the consequent reduction in the rate of erosion of purchasing power have improved the social welfare of a large number of lower-income Brazilians.
The following table sets forth comparative GDP per capita figures and other selected comparative social indicators.
Table No. 8
Social Indicators
| | | | | | | | | | | | | | | | | | | | |
| | | Brazil | | | Chile | | | Colombia | | | Mexico | | | U.S. | |
GDP per Capita (1) | | $ | 15,483.5 | | | $ | 24,085.0 | | | $ | 14,552.0 | | | $ | 18,149.1 | | | $ | 59,531.7 | |
Life Expectancy at Birth (years) (2) | | | 75.5 | | | | 79.5 | | | | 74.4 | | | | 77.1 | | | | 78.7 | |
Infant Mortality Rate (per 1,000 births) (2) | | | 13.5 | | | | 7.2 | | | | 13.1 | | | | 12.6 | | | | 5.6 | |
Adult Literacy Rate (3) | | | 91.7 | % | | | 96.3 | % | | | 93.6 | % | | | 94.5 | % | | | n.a. | |
| (1) | GDP per capita estimates are derived from purchasing power parity (“PPP”) calculations with current international dollars. (based on the 2011 ICP round). PPP GDP is a gross value. Assumes that an international dollar has the same purchasing power over GDP as the U.S. Dollar does in the United States. GDP at purchaser’s prices is the sum of gross value added by all resident producers in the economy plus any product taxes and minus any subsidies not included in the value of the products. It is calculated without making deductions for depreciation of fabricated assets or for depletion and degradation of natural resources. |
| (3) | Data refers to the most recent available year (2015 for Colombia and Mexico, 2014 for Brazil, and 2013 for Chile). |
Source: World Bank
Form of Government
Brazil is a democratic federative republic. Its Constitution, enacted in 1988, grants broad powers to the Federal Government. Brazil’s 26 states are designated as autonomous entities within the federative union and have all powers that the Constitution does not preempt. The Constitution reserves to the Federal Government the exclusive power to legislate in certain areas such as monetary systems, foreign affairs and trade, social security and national defense.
The Government
The Constitution provides for three independent branches of government: an executive branch, a bicameral legislative branch and a judicial branch.
The executive branch is headed by the President, who is elected by direct vote for a term of four years and may only be re-elected for one consecutive term. The President’s powers include appointing ministers and key executives in selected administrative positions. The President may also issue decrees subject to National Congress confirmation (medidas provisórias) for a period of 60 days, extendable for a single period of 60 days, with the same scope and effect as legislation enacted by the National Congress. If confirmed by the National Congress, such decrees are enacted as law. Decrees subject to National Congress confirmation may not be used for certain matters, such as implementation of multi-year plans and budgets, the seizure of financial or other assets and any matters that the Constitution specifically requires National Congress to regulate through law.
The legislative branch of the Federal Government consists of a bicameral National Congress composed of the Senate and the Chamber of Deputies. The Senate is composed of 81 senators, elected for staggered eight-year terms. Each state and the Federal District may elect three senators. The Chamber of Deputies has 513 deputies, elected for concurrent four year terms. The number of deputies from each state is proportional to the size of its population, with each state entitled to a minimum of eight deputies and a maximum of 70 deputies, regardless of population size.
Judicial power is exercised by the STF, the Federal Regional Courts, military courts, labor courts, electoral courts and several lower state courts. The STF, has ultimate appellate jurisdiction over decisions rendered by lower federal and state courts on constitutional matters. The STJ is responsible for standardizing the interpretation of federal law. The members of both the STF and the STJ are appointed by the President and ratified by the Senate.
D-12
At the state level, executive power is exercised by governors elected for four year terms, legislative power is exercised by state deputies, also elected for four-year terms and judicial power is vested in state courts, with the possibility of appeals being filed with the STJ and STF.
Political Developments
Corruption Investigations.
On June 26, 2017, President Michel Temer was charged for corruption and obstruction of justice allegations. On August 2, 2017, the Chamber of Deputies voted to defer the prosecution until the end of Mr. Temer’s term in December 2018. On September 14, 2017, Mr. Temer was also charged for obstruction of justice and for an additional charge of criminal conspiracy. On October 25, 2017, the Chamber of Deputies voted to defer the prosecution until the end of Mr. Temer’s term in December 2018.
Foreign Affairs, International Organizations and International Economic Cooperation
Brazil maintains diplomatic and trade relations with almost every nation in the world. It has been a member of the United Nations since 1945 and is an original member of the IMF, the World Bank, the World Trade Organization, the Inter-American Development Bank, the Inter-American Investment Corporation, the African Development Bank Group and the International Fund for Agricultural Development.
In addition, Brazil is a member of several other organizations including, but not limited to, the Group of Twenty (G-20), the BRICS Group (including Brazil, Russia, India, China and South Africa), the Organization of American States, the Southern Common Market (Mercado Comum do Sul, or “Mercosul”) and the Union of South American Nations (União de Nações Sul-Americanas or “Unasul”). In 2016, Brazil joined the Paris Club and signed the Paris Climate Change accord. Brazil also has a number of international bilateral agreements in place that promote economic cooperation.
Employment and Labor
Employment Levels
The Ministry of Labor (Ministério do Trabalho) reports Brazilian employment statistics in terms of formal employment. Formal employment comprises employment registered with the Ministry of Labor and subject to social security contributions by employers. According to the Ministry of Labor statistics report, formal employment in Brazil decreased by 0.05% in 2017 (equivalent to approximately 20,832 jobs). In the fourth quarter of 2017, the unemployment rate in Brazil was 11.8%, statistically stable compared to the fourth quarter of 2016. The average unemployment rate for 2017 was 12.7%. The 2017 unemployment levels can be attributed to the slower pace of Brazil’s economic activity.
Labor Law Reform
In July 2017, National Congress approved the first major overhaul of Brazil’s labor laws in eight decades, aimed at modernizing the laws by providing greater flexibility in the relationship between employers and employees (the “Labor Law Reform”). One of the main features of the Labor Law Reform is that employers will be able to reach bargaining agreements with their workers on labor issues, including working hours, time banks, breaks, employee representatives, safety, salary, profit-sharing and vacation policies. The bargaining agreements take precedence over existing labor legislation but not over constitutional labor rights such as a mandatory Christmas bonus, minimum wage and maternity leave, giving them the force of law. The Labor Law Reform also, among other things, eliminates the power of courts to impose new labor obligations on employers, makes dues payable by the employees to the unions voluntary instead of mandatory, allows the hiring of as-needed instead of full-time employees, regulates work from home, limits union involvement in company dismissals and disputes and allows for arbitration clauses in employment agreements. The Labor Law Reform became effective in November 2017.
Wages
Federal guidelines for minimum wage adjustments applicable from 2016 to 2019 are based on inflation and GDP growth. The minimum monthly wage for 2017 was set at R$937, an increase of 6.5% compared to 2016.
D-13
Real average income (on a monthly basis) for the fourth quarter of 2017 was R$2,154, remaining stable when compared to the third quarter of 2017 (R$2,134) and the fourth quarter of 2016 (R$2,120).
Social Security
Under Brazil’s state-operated social security and pension system, employers are generally required to contribute 20% of each employee’s wages to the system on a monthly basis. As of January 1, 2017, monthly benefits paid by Brazil’s state-operated social security and pension system increased by 6.6%. In 2017, the monthly lower and upper limits of the social security pensions paid to private sector retirees were R$937.0 and R$5,531.3, respectively.
State-Owned Enterprises
Corporate Enterprises
Brazil has two types of state-owned enterprises: public enterprises and mixed-ownership companies. Public enterprises, which can exist in any legally permissible corporate form, are wholly owned by the states or the Federal Government and are created by specific laws to carry out economic activities. Examples of federal public enterprises are BNDES and the Federal Savings Bank (Caixa Economica Federal or “CEF”). Mixed-ownership companies are corporations majority-owned by the Federal Government or state governments. Petrobras, Banco do Brasil and Eletrobras are examples of mixed-ownership companies.
Autonomous Institutions and Public Foundations
Brazil has autonomous institutions and public foundations. Autonomous institutions, such as the Central Bank and the Brazilian Securities Commission (Comissão de Valores Mobiliarios or “CVM”), carry out public functions that require decentralized financial and operational management. Public foundations are public non-profit entities with administrative autonomy that manage their own assets. Their expenses are financed by the Federal Government and other sources.
Private Parties
Under Brazilian law, private parties may only engage in public activities with authorization of the Federal Government. Through public concessions, the Federal Government has authorized private parties to participate in areas formerly reserved to the Federal Government under the Constitution, including broadcasting and telecommunications, electric power service and facilities and hydroelectric power generation. Nuclear energy, as well as mining and processing of radioactive ores, minerals and their byproducts, remain under the Federal Government’s monopoly.
Environment
The Constitution grants citizens the right to a clean environment and imposes duties on the Federal Government, the states, the Federal District and municipalities to protect the environment, take measures against pollution and protect fauna and flora. At the federal level, the Ministry of the Environment (Ministério do Meio Ambiente, dos Recursos Hídricos e da Amazônia Legal) formulates and implements environmental policies, the National Council on the Environment (Conselho Nacional do Meio Ambiente) prepares environmental regulations and the Brazilian Institute of the Environment and Renewable National Resources (Instituto Brasileiro do Meio Ambiente e dos Recursos Naturais Renováveis, or “IBAMA”) supervises and oversees the application of environmental regulations.
Over the past four decades, Brazil has increased its efforts to improve the environment and ensure long-term sustainable economic development. The Federal Government’s efforts have focussed on combating deforestation, promoting the recovery and reasonable use of biological diversity and expanding protected areas. The Brazilian Forest Code (Código Florestal Brasileiro), enacted in 2012, establishes rules designed to restore lands damaged due to non-compliance with preservation rules, in addition to legal reserves (portions of privately-owned land preserved for natural resources) and permanent preservation areas, which are subject to certain preservation requirements.
Sustainable development is also at the core of Brazilian foreign policy. According to the Food and Agriculture Organization of the United Nations, Brazil alone registered more than 50% of the global reduction in carbon emissions between 2001 and 2015. Combating illegal deforestation is one of the primary factors in Brazil’s reduction in carbon emissions. Under the Paris Climate Change accord, Brazil committed to reduce its emissions by 37.5% (measured against emissions in 2005) by 2025. Additionally, Brazil committed to (i) restore and reforest 12 million hectares of forests, (ii) promote the use of sustainable bioenergy and (iii) achieve an estimated 45% share of clean energy in its energy consumption profile by 2030.
Brazil boasts one of the largest reserves of tropical rainforest and freshwater biodiversity on the planet, and, according to the Ministry of Mines and Energy (Ministério de Minas e Energia), one of the cleanest energy consumption profiles in the industrialized world, with 43.5% of all energy derived from renewable sources. It is also the world’s leading producer of sugarcane ethanol, according to the Brazilian Sugarcane Industry Association and the Brazilian Trade and Investment Promotion Agency.
D-14
Education
The Federal Government provides centralized guidelines for public and private education at all levels and coordinates the National Board of Education, which evaluates and sets general rules on education. State and municipal governments are responsible for funding free public education for all children up to the completion of secondary education.
Primary and Secondary Education
Primary education has become almost universal for children in Brazil, according to the Ministry of Education (Ministério de Educação), and continues to improve in terms of both quality and access. In primary schools, students have access to a range of support programs to ensure student retention, including the Family Grant (Bolsa Família), a conditional cash allowance program linked in part to school attendance. Public schools also provide free meals, textbooks, healthcare and transportation. As of December 31, 2017, (i) 27.3 million students attended the primary school system and (ii) 7.9 million students attended the secondary school system.
Higher Education
The University for All Program (Programa Universidade para Todos or “PROUNI”) awards full and partial scholarships to low income students to attend higher education institutions. Since its inception in 2004, PROUNI has granted 3.2 million scholarships.
Wealth and Income Distribution
While the income gap between Brazil’s wealthiest and poorest citizens remains significant, it has substantially decreased in recent decades. The stabilization of Brazil’s economy and lower inflation levels have increased the purchasing power of the lower-income population in Brazil.
Brazil’s main social welfare program to address poverty is the Brazil Without Extreme Poverty Plan (Brasil sem Miséria). The plan, which was established in 2011 and focuses on families with a monthly income per capita between R$85 and R$170, includes income transfer mechanisms, access to public services and initiatives for job placement. The Family Grant (Bolsa Familia), which is part of the Brazil Without Extreme Poverty Plan, is a conditional allowance program that has provided a monthly cash income to approximately 14 million families (40 million individuals), subject to compliance with certain statutory requirements, since 2003. Cash transfers under the Family Grant totaled R$29.0 billion in 2017.
The Federal Government also has a social housing initiative for low- to middle-income families called “My House My Life” (Minha Casa Minha Vida). As of December 31, 2017, the program generated contracts for 5.0 million houses and delivered approximately 3.7 million houses, benefiting 12 million citizens. Subsidies provided to homeowners under the program can cover up to 90% of the property value.
In addition, the Light for All Program (Programa Luz para Todos) had provided 188.6 thousand free electricity connections as of December 2017, representing 91% of the total goal of bringing electricity to 206.2 thousand residences between 2015 and 2018. Currently, the program benefits about 16 million people in rural areas across the country.
Antitrust
Under Brazil’s Antitrust Law, anticompetitive-conduct investigations, merger and acquisition controls and final antitrust regulatory approval are centralized in a single independent agency, the Administrative Council of Economic Defense (Conselho Administrativo de Defesa Econômica or “CADE”). The Antitrust Law sets forth general criteria for determining anti-competitive behavior, such as price fixing, predatory pricing, exclusive dealing arrangements and resale price maintenance.
All acts or transactions (regardless of form) are required to be submitted for antitrust approval if the act or transaction involves an entity or group with more than R$750 million in revenues in Brazil in the preceding fiscal year and a second entity or group with more than R$75 million in revenues in Brazil in the preceding fiscal year.
Anticompetitive practices may subject an entity to fines between 0.1% and 20% of the entity’s gross revenue for the fiscal year preceding the start of an antitrust investigation. If a company’s gross revenue cannot be assessed, it may be subject to a fine between R$50,000 and R$2 billion.
D-15
Anticorruption Laws
The Anticorruption Law, also known as the Clean Company Act, was enacted in 2014 to provide civil and administrative accountability of companies engaging in fraud, bribery and other corrupt practices. The principal innovations of the Anticorruption Law were: (i) companies can be held liable in cases of corruption, regardless of intent; (ii) significant administrative and judicial penalties may be imposed; (iii) fines may be reduced if companies cooperate in relevant investigations and (iv) the law may be enforced by all levels of government and covers Brazilian companies acting abroad.
National Strategy to Combat Corruption and Money Laundering – ENCCLA
The ENCCLA program, coordinated by the Ministry of Justice and Public Security (Ministério da Justiça e da Segurança Pública), prevents money laundering and corruption, in general. The ENCCLA is made up of over 70 agencies, members of the three branches of government, public prosecutors and civilians acting directly and indirectly to prevent corruption and money laundering. The ENCCLA encourages joint action, collaboration and expertise-sharing among entities through its yearly plenary session and the creation of working groups to implement specific goals and targets. The program has led to a number of developments in the fight against money laundering and corrupt practices, including the modernization of money laundering legislation, the creation of various registries such as the Registry of the Financial System Clients managed by the Central Bank, the institution of nationwide training programs, the optimization of technology networks and the improvement of publicly available resources for combating money-laundering and corruption.
Incentives for Private Investment
Technology
The Innovation Act (enacted in 2004 and updated in January 2016) encourages economic efficiency and the development and diffusion of technologies that have the potential to induce economic activity and improve competitiveness in international trade.
Intellectual Property
The Intellectual Property Law (enacted in 1996) regulates rights and obligations related to intellectual property and provides for the protection of these rights while counterbalancing social interest and technological and economic development. The statute protects inventions and utility models, industrial designs and trademarks.
Public-Private Partnerships
Brazilian law provides for two types of public-private partnerships: (i) contracts for concessions of public works or utility services and (ii) contracts for rendering services under which a public sector entity is the end-user. Public-private partnership contracts must be valued at a minimum of R$10 million and their terms vary between five and thirty-five years, including any term extension. All contracts are awarded through a public bidding process.
National Policy for Regional Development
The National Policy for Regional Development (Política Nacional de Desenvolvimento Regional or “PNDR”) addresses regional inequalities. PNDR’s main source of financing comes from regional development funds and the Federal Government. PNDR is monitored by the National Information System for Regional Development (Sistema Nacional de Informação para o Desenvolvimento Regional) and coordinated by the Ministry for National Integration (Ministério da Integração Nacional).
D-16
THE BRAZILIAN ECONOMY
Historical Background
In December 1993, with the aim of addressing the high inflation levels of the late 80s and early 90s, the Federal Government enacted the Plano Real economic program, which was highly successful in curtailing inflation, building a foundation for sustained economic growth and adopting fiscal austerity. The Plano Real was also designed to address persistent deficits in the Federal Government’s accounts, expansive credit policies and widespread, backward-looking indexation.
The Federal Government formally adopted inflation targeting as its monetary policy framework in 1999 in an environment shaped by the uncertainty of the impact of the devaluation of the Real in the Brazilian economy. Under the inflation-targeting regime, achievement of inflation targets is the main objective of the Central Bank’s monetary policy decisions. In 2016, aiming to restore fiscal balance, a public spending cap was also adopted. For more information, please refer to “Monetary Policy and Money Supply” in the “Financial System” section and “Ceiling on Public Spending” in the “Public Finance” section.
Economy in 2017
At the beginning of 2017, domestic economic activity displayed a slow and gradual recovery emerging from two years of recession (a 3.5% GDP contraction in both 2015 and 2016). In the first quarter of 2017, Brazil’s GDP grew at a rate of 1.1%, as compared to the fourth quarter of 2016, after eight consecutive quarters of negative results. In the second quarter of 2017, the GDP grew 0.6% when compared to the first quarter of 2017. By the end of 2017, economic activity showed clear signs of recovery, despite ongoing political instability.
The 2017 economic recovery was driven by, amongst other factors:
| | i. | a decline in consumer inflation, with IPCA ending at 2.95% in 2017; |
| | ii. | a lower Selic interest rate; |
| | iii. | more favourable tax collections, contributing to a 2017 public sector deficit of R$110.6 billion (1.7% of GDP). |
| | iv. | strong trade balance performance and external sector adjustment; and |
| | v. | stronger inflow of foreign direct investments, when compared to 2016. |
Gross Domestic Product
GDP is an aggregate measure of production equal to the sum of the market values of all final goods and services in a determine period of time.
Brazil’s GDP grew by 1.0% in 2017, after a contraction of 3.5% in 2016. The moderate increase in economic activity in 2017 was mostly driven by a very strong expansion of the harvest (especially with respect to soybeans and corn), leading to a 13.0% increase in the agricultural sector when compared to 2016. The industrial sector remained stable and the services sector grew 0.3%, each compared to 2016. On the demand side, gross fixed capital formation contracted by 1.8% and household consumption grew by 1.0%. The growth in household consumption was influenced by the decline in household debt, which, in turn, was mostly driven by the withdrawal of R$44 billion held in inactive FGTS (“Fundo de Garantia do Tempo de Serviço ”) accounts.
D-17
The following table sets forth Brazil’s GDP at current prices and expenditures for each of the years indicated.
Table No. 9
GDP at Current Prices - Demand Side
In Billions of Reais (R$), except percentages(1)
| | | | | | | | | | | | | | | | | | | | | | | | | | | | | | | | | | | | | | | | |
| | | 2013 | | | 2014 | | | 2015 | | | 2016 | | | 2017 | |
Final Consumption | | | 4,297.7 | | | | 80.6 | % | | | 4,745.3 | | | | 82.1 | % | | | 5,021.0 | | | | 83.7 | % | | | 5,270.1 | | | | 84.2 | % | | | 5,476.4 | | | | 83.5 | % |
Gross Capital Formation | | | 1,156.6 | | | | 21.7 | % | | | 1,187.5 | | | | 20.5 | % | | | 1,044.0 | | | | 17.4 | % | | | 963.1 | | | | 15.4 | % | | | 1,017.0 | | | | 15.5 | % |
Gross Fixed Capital Formation | | | 1,114.9 | | | | 20.9 | % | | | 1,148.5 | | | | 19.9 | % | | | 1,069.4 | | | | 17.8 | % | | | 1,009.2 | | | | 16.1 | % | | | 1,025.6 | | | | 15.6 | % |
Changes in Inventories | | | 41.7 | | | | 0.8 | % | | | 39.0 | | | | 0.7 | % | | | -25.4 | | | | -0.4 | % | | | -46.1 | | | | -0.7 | % | | | -8.6 | | | | -0.1 | % |
Exports of Goods and Services | | | 620.1 | | | | 11.6 | % | | | 636.4 | | | | 11.0 | % | | | 773.5 | | | | 12.9 | % | | | 782.1 | | | | 12.5 | % | | | 824.4 | | | | 12.6 | % |
Imports of Goods and Services | | | 742.8 | | | | 13.9 | % | | | 790.2 | | | | 13.7 | % | | | 842.6 | | | | 14.1 | % | | | 756.1 | | | | 12.1 | % | | | 757.8 | | | | 11.6 | % |
Gross Domestic Product | | | 5,331.6 | | | | 100 | % | | | 5,779.0 | | | | 100 | % | | | 5,995.8 | | | | 100 | % | | | 6,259.2 | | | | 100 | % | | | 6,559.9 | | | | 100 | % |
Note: Numbers may not total due to rounding.
| (1) | Percentages of total GDP. |
Source: IBGE
The following tables set forth the share of GDP by sector at current prices and real growth at current prices by sector for each of the years indicated.
Table No. 10
GDP at Current Prices - Supply Side
In Billions of Reais (R$), except percentages(1)
| | | | | | | | | | | | | | | | | | | | | | | | | | | | | | | | | | | | | | | | |
| | | 2013 | | | 2014 | | | 2015 | | | 2016 | | | 2017 | |
Agriculture | | | 240.3 | | | | 4.5 | % | | | 250.0 | | | | 4.3 | % | | | 259.0 | | | | 4.3 | % | | | 306.2 | | | | 4.9 | % | | | 299.5 | | | | 4.6 | % |
Industry | | | 1,131.6 | | | | 21.2 | % | | | 1,183.1 | | | | 20.5 | % | | | 1,160.8 | | | | 19.4 | % | | | 1,144.1 | | | | 18.3 | % | | | 1,212.0 | | | | 18.5 | % |
Mining, Oil and Gas | | | 189.4 | | | | 3.6 | % | | | 184.8 | | | | 3.2 | % | | | 110.8 | | | | 1.8 | % | | | 60.8 | | | | 1.0 | % | | | 100.8 | | | | 1.5 | % |
Manufacturing | | | 558.7 | | | | 10.5 | % | | | 597.4 | | | | 10.3 | % | | | 630.8 | | | | 10.5 | % | | | 645.2 | | | | 10.3 | % | | | 666.2 | | | | 10.2 | % |
Public Utilities | | | 92.8 | | | | 1.7 | % | | | 94.0 | | | | 1.6 | % | | | 123.2 | | | | 2.1 | % | | | 145.0 | | | | 2.3 | % | | | 149.8 | | | | 2.3 | % |
Construction | | | 290.6 | | | | 5.5 | % | | | 306.9 | | | | 5.3 | % | | | 296.0 | | | | 4.9 | % | | | 293.1 | | | | 4.7 | % | | | 295.2 | | | | 4.5 | % |
Services | | | 3,181.8 | | | | 59.7 | % | | | 3,539.7 | | | | 61.3 | % | | | 3,735.9 | | | | 62.3 | % | | | 3,957.7 | | | | 63.2 | % | | | 4,137.1 | | | | 63.1 | % |
Retail | | | 614.1 | | | | 11.5 | % | | | 676.6 | | | | 11.7 | % | | | 685.7 | | | | 11.4 | % | | | 699.6 | | | | 11.2 | % | | | 715.4 | | | | 10.9 | % |
Transportation | | | 203.4 | | | | 3.8 | % | | | 227.8 | | | | 3.9 | % | | | 226.5 | | | | 3.8 | % | | | 232.8 | | | | 3.7 | % | | | 246.5 | | | | 3.8 | % |
Communications | | | 157.5 | | | | 3.0 | % | | | 168.6 | | | | 2.9 | % | | | 176.0 | | | | 2.9 | % | | | 175.5 | | | | 2.8 | % | | | 180.2 | | | | 2.7 | % |
Financial (2) | | | 272.6 | | | | 5.1 | % | | | 318.7 | | | | 5.5 | % | | | 365.3 | | | | 6.1 | % | | | 443.6 | | | | 7.1 | % | | | 449.0 | | | | 6.8 | % |
Rental | | | 419.2 | | | | 7.9 | % | | | 463.8 | | | | 8.0 | % | | | 498.9 | | | | 8.3 | % | | | 524.7 | | | | 8.4 | % | | | 549.8 | | | | 8.4 | % |
Other | | | 768.9 | | | | 14.4 | % | | | 867.5 | | | | 15.0 | % | | | 897.9 | | | | 15.0 | % | | | 934.1 | | | | 14.9 | % | | | 999.9 | | | | 15.2 | % |
Government (3) | | | 746.2 | | | | 14.0 | % | | | 816.8 | | | | 14.1 | % | | | 885.6 | | | | 14.8 | % | | | 947.6 | | | | 15.1 | % | | | 996.2 | | | | 15.2 | % |
Value Added at Basic Prices | | | 4,553.8 | | | | 85.4 | % | | | 4,972.7 | | | | 86.0 | % | | | 5,155.6 | | | | 86.0 | % | | | 5,408.0 | | | | 86.4 | % | | | 5,648.6 | | | | 86.1 | % |
Taxes | | | 777.9 | | | | 14.6 | % | | | 806.2 | | | | 14.0 | % | | | 840.2 | | | | 14.0 | % | | | 851.2 | | | | 13.6 | % | | | 911.4 | | | | 13.9 | % |
GDP | | | 5,331.6 | | | | 100.0 | % | | | 5,779.0 | | | | 100.0 | % | | | 5,995.8 | | | | 100.0 | % | | | 6,259.2 | | | | 100.0 | % | | | 6,559.9 | | | | 100.0 | % |
Note: Numbers may not total due to rounding.
| (1) | Percentages of total GDP. |
| (2) | “Financial Services” includes financial intermediation, complementary social security and related services. |
| (3) | “Government Services” includes public education, health and administration services. |
Source: IBGE
D-18
Table No. 11
Real Growth (or Decline) at Current Prices by Sector
| | | | | | | | | | | | | | | | | | | | |
| | | 2013 | | | 2014 | | | 2015 | | | 2016 | | | 2017 | |
Real GDP | | | 3.0 | % | | | 0.5 | % | | | -3.5 | % | | | -3.5 | % | | | 1.0 | % |
Agriculture and Livestock | | | 8.4 | % | | | 2.8 | % | | | 3.3 | % | | | -4.3 | % | | | 13.0 | % |
Industry | | | 2.2 | % | | | -1.5 | % | | | -5.8 | % | | | -4.0 | % | | | 0.0 | % |
Mining, Oil and Gas | | | -3.2 | % | | | 9.1 | % | | | 5.7 | % | | | -2.7 | % | | | 4.3 | % |
Manufacturing | | | 3.0 | % | | | -4.7 | % | | | -8.5 | % | | | -5.6 | % | | | 1.7 | % |
Public Utilities | | | 1.6 | % | | | -1.9 | % | | | -0.4 | % | | | 7.1 | % | | | 0.9 | % |
Construction | | | 4.5 | % | | | -2.1 | % | | | -9.0 | % | | | -5.6 | % | | | -5.0 | % |
Services | | | 2.8 | % | | | 1.0 | % | | | -2.7 | % | | | -2.6 | % | | | 0.3 | % |
Retail Services | | | 3.4 | % | | | 0.6 | % | | | -7.3 | % | | | -6.1 | % | | | 1.8 | % |
Transportation | | | 2.6 | % | | | 1.5 | % | | | -4.3 | % | | | -6.8 | % | | | 0.9 | % |
Communications | | | 4.0 | % | | | 5.3 | % | | | -0.9 | % | | | -3.2 | % | | | -1.1 | % |
Financial Services | | | 1.8 | % | | | -0.6 | % | | | -1.2 | % | | | -3.3 | % | | | -1.3 | % |
Rental Services | | | 5.1 | % | | | 0.7 | % | | | -0.4 | % | | | 0.2 | % | | | 1.1 | % |
Other Services | | | 1.6 | % | | | 1.9 | % | | | -3.7 | % | | | -3.2 | % | | | 0.4 | % |
Government | | | 2.2 | % | | | 0.1 | % | | | 0.2 | % | | | 0.6 | % | | | -0.6 | % |
Source: IBGE
Principal Sectors of the Economy
The principal sectors of the Brazilian economy are industry, services and agriculture and livestock.
Industry
The industrial sector includes the mining, oil and gas, manufacturing, construction and public utilities subsectors. The industrial sector remained stable in 2017, after a contraction of 4.0% in 2016.
As of December 31, 2017, the industrial sector represented 18.5% of Brazil’s GDP, compared to 18.3% of GDP in 2016.
Table No. 12
Annual Changes in Industry Production
By Category of Use
| | | | | | | | | | | | | | | | | | | | |
| | | 2013 | | | 2014 | | | 2015 | | | 2016 | | | 2017 | |
Capital Goods | | | 12,2 | | | | -9,3 | | | | -25,3 | | | | -10,2 | | | | 6.3 | |
Intermediate Goods | | | 0,4 | | | | -2,4 | | | | -5,2 | | | | -6,5 | | | | 1.6 | |
Consumer Goods | | | 2,6 | | | | -2,3 | | | | -9,4 | | | | -5,4 | | | | 3.2 | |
Durable Goods | | | 4,4 | | | | -9,1 | | | | -18,5 | | | | -14,4 | | | | 13.5 | |
Nondurable Goods | | | 0,8 | | | | 3,7 | | | | -9,6 | | | | -3,8 | | | | -1.6 | |
Source: IBGE
Mining, Oil and Gas
The mining, oil and gas subsector grew by 4.3% in 2017, after a decline of 2.7% in 2016. The subsector represented only 1.5% of GDP in 2017.
In July 2017, the Federal Government introduced the Brazilian Mineral Industry Revitalization Program aiming at increasing the participation of the mining sector in Brazil’s GDP, creating jobs and attracting new investments. Through this program, the Federal Government sought to improve and modernize mining laws, including the rules on the calculation of mining royalties, environmental restoration and time extensions for mining-related research.
D-19
The Federal Government also created the ANM (National Mining Agency), which replaced the DNPM (National Department of Mineral Production) and seeks greater transparency, increased efficiency, reduced uncertainty and adherence to industry best practices in the regulation and pursuit of mining activities.
I. Oil and Gas.
The National Agency of Oil, Natural Gas and Biofuels (Agência Nacional do Petróleo, Gás Natural e Biocombustíveis or “ANP”) is an independent regulatory agency linked to the Ministry of Mines and Energy, which regulates the oil industry in Brazil. The ANP conducts tender offers for concessions to drill for oil and natural gas in defined areas, or blocks. The concession regime covers roughly 98% of the Brazilian sedimentary basin.
The Federal Government also has a production sharing regime for oil and gas exploration and production in pre-salt fields not under concession and other areas designated as strategic areas by the Federal Government. Under the production-sharing model, the National Energy Policy Council (“CNPE”), prior to conducting a public bid, gives Petrobras a preference right to act as the operator of any pre-salt deep-water field at a minimum consortium interest of 30%. Prior to 2016, Petrobras was required to be the exclusive operator of any pre-salt deep-water field, subject to a minimum 30% participation interest. Exploration and production rights for the blocks are subsequently offered under public bids. Winning bids are determined based on which bidder offers the Federal Government the highest share of excess oil, also known as “profit oil.”
The discovery of significant oil reserves in the pre-salt layer may potentially turn Brazil into an oil exporting country. The average annual daily production from the pre-salt layer reached an average of 1.3 million barrels per day in 2017, a 26% increase in comparison to 2016. Pre-salt layer production represents approximately 60% of Petrobras total oil production. Petrobras accounts for more than 80% of total oil production of Brazil.
Brazilian production reached approximately 956.9 million barrels of oil and 40.1 billion cubic meters of natural gas in 2017, which represents an increase of 4.2% in oil production and an increase of 5.9% in natural gas production compared to 2016. Between 2007 and 2018, oil production grew by 50%, while natural gas production more than doubled. The significant increase in oil and gas production can be attributed to the discovery of new production areas, which led to an increase in proven reserves.
In 2017, oil prices increased in comparison to 2016. Higher oil prices accounted for a 51.5% increase in royalties on production. An increase in internal production also contributed to the increase in royalties.
II. Ethanol and Biodiesel.
The ANP also regulates ethanol production in Brazil. The Federal Government has continuously supported the development of technologies, production and distribution of ethanol as an alternative to petroleum.
As the world’s largest producer of sugarcane ethanol, Brazil is now at the forefront of renewable energy among developing countries. Ethanol production comprises several activities such as development of special sugarcane varieties, crop techniques, processing, storage and distribution and flex fuel engine technology. Recently, research has been focused on the development of sugarcane varieties, second-generation ethanol, and optimization of agricultural and industrial production processes. In 2017, national production of anhydrous and hydrated ethanol reached 28.6 million cubic meters, a decrease of 0.3% compared to production in 2016.
The Federal Government also promotes biodiesel production and its use as a sustainable energy source through the National Program for the Production and Use of Biodiesel (Programa Nacional de Produção e Uso do Biodiesel). Biodiesel production reached 4.3 million cubic meters in 2017, an increase of 12.9% compared to production in 2016.
Manufacturing
The manufacturing subsector grew by 1.7% in 2017 after a decline of 5.6% in 2016. The result was influenced mainly by the increase in volume of value added in the manufacture of machinery and equipment, automotive industry, furniture and metal, rubber and plastic products. The manufacturing subsector represented 10.2% of GDP in 2016, remaining stable as compared to 2016.
Public Utilities
The public utilities subsector (electricity and gas, water, sewage and urban cleaning) presented an expansion of 0.9% in 2017 after expanding by 7.1% in 2016, corresponding to 2.3% of GDP in 2017.
D-20
Construction
The construction sector declined by 5.0% in 2017 after a decline of 5.6% in 2016. The construction sector represented 4.5% of GDP in 2017.
Services
Services, which include retail, transportation, communications, financial services, rental services and government subsectors such as public education, public health and public services in general, represent more than 60% of Brazil’s GDP. The services sector increased by 0.3% in 2017 after a contraction of 2.6% in 2016.
I. Transportation
i. Roads
Brazil has a road network of approximately 1.7 million kilometers, of which approximately 12.3% is paved, according to the National Confederation of Transportation (Confederação Nacional do Transporte). Most paved roads are maintained by federal and state authorities, while the vast majority of unpaved roads are under the responsibility of municipal authorities.
ii. Railroad
Between 2007 and 2017, freight traffic on railways in Brazil increased from 257.1 billion paid metric tons times kilometers travelled (Revenue Tonne Kilometres or “RTK”) to 375.2 billion RTKs, a growth of 45.9%. Brazil’s railway system currently consists of approximately 29.8 thousand kilometers.
iii. Air
Major Brazilian cities are served by both domestic and international airlines, and many smaller communities benefit from scheduled service by domestic airlines. In 2017, there were 108.6 million airline passengers in the 60 airports managed by Infraero, the state-owned enterprise that manages airports in Brazil.
The National Civil Aviation Agency (Agência Nacional de Aviação Civil) is responsible for monitoring the airports and managing airport concession contracts. Recently, a government program has been designed to improve and revamp the airport infrastructure of the country. Through this program, the Federal Government has granted concessions to private companies to run the major airports in the country.
iv. Water
With 8,500 kilometers of sea coast, the Brazilian port industry handles more than 90% of Brazil’s exports. In 2017, about 1.1 billion tons of products passed through Brazilian ports, an increase of 9.0% in comparison with 2016. Brazil’s main ports are located in the cities of Rio de Janeiro, Santos, Paranaguá, Rio Grande and São Sebastião. Of the 37 public ports managed by the Ministry of Transportation, Ports and Civil Aviation (Ministério dos Transportes, Portos e Aviação Civil), 18 are supervised by, granted to or operated by state and municipal governments. The other 19 maritime ports are administered directly by companies that are majority-owned by the Federal Government.
II. Telecommunications
The Brazilian Telecommunication Regulatory Agency (Agência Nacional de Telecomunicações, or “ANATEL”) is the agency responsible for regulating the telecommunications sector. The telecommunications sector includes telecommunications services (including fixed line and mobile telephony and internet access providers), computer services (including software development and data processing), audiovisual services (including cable TV programming and advertising and merchandising for TV and radio) and other services.
In 2017, investment in the telecommunications sector amounted to R$28.0 billion, including concessions, which represents a decrease of 1.2% when compared to 2016. Since the privatization of the sector, total investment in the telecommunication sector reached R$446.8 billion. Communication services decreased by 1.1% in 2017 when compared to 2016. In 2016, there was a decrease of 3.2% compared to the previous year.
D-21
Agriculture and Livestock
Brazil’s agriculture and livestock sector is among the most productive and competitive in the world, according to the United States Department of Agriculture (“USDA”). Despite the slowdown in global agricultural trade, Brazilian agricultural exports share in the international market has been increasing and Brazil is consolidating its position as one of the leading agricultural producers and exporters, according to the World Trade Organization. The agriculture and livestock sector, which represents approximately 5.0% of Brazil’s GDP, expanded 13.0% in 2017, after contracting by 4.3% in 2016. This increase in production can be attributed to favorable climate conditions.
According to data from the USDA, Brazil is the largest producer and exporter of coffee, the second largest producer and the largest exporter of soybeans and the largest producer and exporter of sugar in the world. As of July 2017, in the 2017/2018 season, Brazil accounted for 31.9% of the global coffee production, 23.1% of global coffee exports, 33.2 % of global soybeans production, 44.9% of global soybeans exports, 20.3% of global sugar production and 44.7% of global sugar exports.
Brazil is the second largest producer of beef in the world and the largest global exporter of broiler meat, according to the USDA. In 2017, Brazil produced 9.6 billion tons of beef and exported 1.9 billion tons (18.6% of world exports). Broiler meat exports totaled 3.8 billion tons in the same period, corresponding to 34.8% of total global broiler meat exports.
In 2017, agricultural exports accounted for approximately US$81.5 billion (accounting for 37.4% of Brazil’s total exports) compared to US$71.5 billion or 38.8% of Brazil’s total exports in 2016. Among the main products exported in 2017, soybeans accounted for 11.8% of Brazil’s total exports; meats accounted for 6.0% and green coffee accounted for 2.1%.
D-22
THE FINANCIAL SYSTEM
General
Brazil’s financial system consists of public and private sector financial institutions. As of December 31, 2017, the Brazilian financial system included 132 multi-service banks, 21 commercial banks, 13 investment banks and numerous savings and loan, brokerage and leasing financial institutions. A significant portion of the activities of federal and state banks involves lending Federal Government funds to industrial, agricultural and building development companies.
The principal authorities that regulate Brazilian financial institutions are (i) the CMN, the highest-level federal agency responsible for Brazil’s monetary policy, (ii) the Central Bank, responsible for the implementation, regulation and supervision of the financial system and (iii) the CVM, responsible for the development and regulation of the Brazilian capital markets.
In 2017, the average leverage of the Brazilian banking system was approximately 3.5 times shareholders’ equity and Brazilian private sector financial institutions were generally well-capitalized. Public sector banks, which play an important role in the Brazilian banking industry, accounted for 56.8% of the banking system’s total demand deposits and 38.6% of total assets as of December 2017.
Institutional Framework
Brazilian monetary and credit policies are formulated by the CMN with the principal objective of promoting Brazilian monetary stability, in addition to economic and social development. The CMN issues general guidelines for the operation of the national financial system and is responsible for (i) adapting the volume of money supply to the conditions of the economy, (ii) regulating the internal and external value of currency and the equilibrium of the balance of payments, (iii) guiding investments of funds of financial institutions, (iv) promoting the improvement of institutions and financial instruments, (v) ensuring liquidity and solvency of financial institutions, (vi) coordinating monetary, credit, budgetary and internal and external public debts and (v) setting inflation targets and tolerance intervals. The CMN is managed by its three members: the Minister of Finance, the Minister of Planning and Budget and the President of the Central Bank.
The Central Bank is responsible for ensuring the stability of the Brazilian Real’s purchasing power and a solid and efficient financial system, and it implements the monetary, currency and credit policies established by the CMN. Within the Central Bank, COPOM establishes the guidelines for monetary policy and sets the short-term interest rate target. The Central Bank is managed by a board of directors. The President and each director are appointed by the President of the Republic, subject to confirmation by the Senate.
A. Monetary Policy and Money Supply
Selic
During 2017 (i) the Central Bank maintained its monetary easing process and (ii) COPOM gradually reduced the Selic rate from 13.75% to 7.00% per year.
Inflation
Brazil adopted an inflation-targeting monetary policy framework in 1999. The CMN sets annual inflation targets and tolerance intervals based on the IPCA, Brazil’s principal inflation index, while the Central Bank uses monetary policy instruments, principally the Over/Selic rate, to achieve the inflation targets. The Over/Selic rate is a market-determined overnight rate for operations with federal bonds that functions as Brazil’s basic interest rate.
The following table sets forth the IPCA for the periods indicated.
Table No. 13
Broad National Consumer Price Index (IPCA)
Trailing Twelve Months
| | | | |
As of December 31, | | | |
2013 | | | 5.91 | |
2014 | | | 6.41 | |
2015 | | | 10.67 | |
D-23
| | | | |
As of December 31, | | | |
2016 | | | 6.29 | |
2017 | | | 2.95 | |
Source: IBGE
As of December 31, 2017, accumulated IPCA for the previous 12 months was 2.95%, a decrease from the accumulated IPCA of 6.29% registered in 2016. Food and Beverages exerted the biggest influence on the indexes over the year.
From 2006 to 2016, the CMN established an inflation target of 4.5%, with a tolerance level of plus or minus 2 percentage points. For 2017, the inflation target set by the CBN was 4.5% with a tolerance interval of plus or minus 1.5 percentage points. The Central Bank fulfilled these inflation targets in each year other than 2015 and 2017.
For 2018, the inflation target set by the CBN is 4.5% with a tolerance interval of plus or minus 1.5 percentage points.
For 2019, the inflation target is 4.25% with a tolerance interval of plus or minus 1.5 percentage points. For 2020, the inflation target is 4.0% with a tolerance interval of plus or minus 1.5 percentage points.
Open Market Operations
The Central Bank periodically intervenes in the overnight funds market to provide liquidity and maintain the Over/Selic rate near the target rate. Among other strategies to control liquidity levels, the Central Bank enters into open market transactions, including definitive or resale and repurchase agreements (operações compromissadas), which are indexed to the Over/Selic rate.
Open market operations totaled R$1,065.0 billion (16.2% of GDP) in 2017 compared to R$1,047.5 billion (16.7% of GDP) in 2016.
Swap Transactions
As part of its implementation of monetary and foreign exchange policy, the Central Bank periodically enters into interest rate and foreign exchange swaps conducted through auctions in the Central Bank’s electronic system and recorded in the B3 systems. The Central Bank generally enters into two types of swap contracts: (i) exchange swaps with periodic adjustments (Swap Cambial com Ajuste Periodico), which are based on the difference between the effective interest rate of interbank deposits and the Brazilian Real-U.S. Dollar exchange rate and (ii) exchange swaps with periodic adjustments based on one-day repurchase agreements, which are based on the difference between the Selic rate and the Brazilian Real-U.S. Dollar exchange rate. B3 assumes all credit risk arising from these swap transactions.
From August 2013 to March 2015, the Central Bank maintained a program providing foreign exchange hedging protection to economic agents and liquidity to the foreign exchange market. However, the program was discontinued in 2015 and the Central Bank is currently reducing its position in swap contracts through the use of reverse swaps. The amount of swaps decreased from R$85.5 billion in December 2016 to R$78.3 billion in December 2017.
Reserve Requirements and Money Supply
The Central Bank sets mandatory reserve requirements for all depositary institutions, commercial banks, multi-service banks, investment banks, development banks and savings and loans financial institutions. These reserve requirements are applied to a wide range of banking activities and transactions, such as demand deposits, savings deposits, time deposits, debt assumption transactions, automatic reinvestment deposits, funding transactions, repurchase agreements and export notes. For example, financial institutions are generally required to deposit 25% of their average daily balance of demand deposits in excess of R$200 million in a non-interest-bearing account with the Central Bank.
The following table sets forth selected information regarding changes in the monetary base and money supply for the periods indicated.
D-24
Table No. 14
Percentage Increases/Decreases in Monetary Base and Money Supply
| | | | | | | | | | | | | | | | | | | | |
| | | 2013 | | | 2014 | | | 2015 | | | 2016 | | | 2017 | |
Monetary Base (1) | | | 6.9 | % | | | 5.6 | % | | | -3.1 | % | | | 5.9 | % | | | 9.8 | % |
M1 (2) | | | 6.0 | % | | | 2.1 | % | | | -4.9 | % | | | 4.0 | % | | | 4.4 | % |
M2 (3) | | | 10.9 | % | | | 9.9 | % | | | 6.3 | % | | | 3.8 | % | | | 4.6 | % |
| (1) | “Monetary Base” represents Central Bank liabilities including, but not limited to, currency and deposits held by commercial banks. |
| (2) | “M1” represents currency plus demand deposits. |
| (3) | Preliminary data. “M2” represents M1 plus special interest-bearing deposits, savings deposits, and securities issued by custodian institutions. |
Source: Central Bank
Foreign Exchange Rates and Exchange Controls
Foreign Exchange Policy
The Brazilian foreign exchange system is structured to enable the Federal Government, through the Central Bank, to regulate and control foreign exchange transactions carried out in Brazil.
When a major imbalance in Brazil’s balance of payments occurs or is foreseeable, the Federal Government is authorized to temporarily impose restrictions on (i) the remittance to foreign investors of the proceeds of their investments in Brazil and (ii) the conversion of Brazilian currency into foreign currencies. In addition, the Federal Government may take measures to control the inflow of foreign capital from time to time in order to minimize volatility, stabilize the exchange rate and reduce the effects of speculative activity.
One of the mechanisms through which the Federal Government controls inflows of foreign capital is the Financial Transactions Tax (Imposto sobre Operações Financeiras or “IOF”). The IOF is levied on credit transactions, foreign exchange transactions, insurance transactions and transactions involving securities at varying rates.
D-25
The following table sets forth certain information regarding Brazil’s foreign exchange transactions.
Table No. 15
Foreign Exchange Transactions
In Millions of U.S. Dollars
| | | | | | | | | | | | | | | | | | | | |
| | | 2013 | | | 2014 | | | 2015 | | | 2016 | | | 2017 | |
Commercial | | | 11,136 | | | | 4,137 | | | | 25,486 | | | | 47,309 | | | | 52,924 | |
Financial | | | -23,396 | | | | -13,424 | | | | -16,071 | | | | -51,562 | | | | -52,299 | |
Total | | | -12,261 | | | | -9,287 | | | | 9,414 | | | | -4,252 | | | | 625 | |
Note: Numbers may not total due to rounding.
Source: Central Bank
Foreign Exchange Rates
In 1999, the Federal Government decided to adopt a floating exchange rate for the Real. The following table sets forth certain exchange rate information reported by the Central Bank for the sale of U.S. Dollars, expressed in nominal Reais, for the periods indicated. The Federal Reserve Bank of New York does not report a noon buying rate for the Real.
Table No. 16
Commercial Exchange Rates
R$/US$1.00 (Sell Side)
| | | | | | | | | | | | | | | | | | | | |
| | | 2013 | | | 2014 | | | 2015 | | | 2016 | | | 2017 | |
Average for Period (1) | | | 2.1605 | | | | 2.3547 | | | | 3.3387 | | | | 3.4833 | | | | 3.1925 | |
End of Period | | | 2.3426 | | | | 2.6562 | | | | 3.9048 | | | | 3.2591 | | | | 3.308 | |
% Change (End of Period) | | | 14.6 | % | | | 13.4 | % | | | 47.0 | % | | | -16.5 | % | | | 1.5 | % |
Note: Numbers may not total due to rounding.
| (1) | Weighted average of the exchange rates on business days during the period. |
Source: Central Bank
Financial Institutions
Public Sector Financial Institutions
Brazil’s main public sector financial institutions are Banco do Brasil, BNDES and CEF.
Banco do Brasil. Banco do Brasil, one of Brazil’s largest multi-service banks, is a mixed-ownership company, with the Federal Government holding a majority of its voting shares. It primarily functions as a private multi-service bank, but also has some lending programs that implement certain CMN policies. It is also the principal mechanism through which the Federal Government implements its rural credit policy. Banco do Brasil is the main recipient of loans from the National Treasury and federal agencies. On December 31, 2017, Banco do Brasil (i) had assets of R$1.3 trillion, (ii) a net worth of R$87.5 billion and (iii) was the largest bank in Latin America with respect to assets.
BNDES. BNDES, a development bank wholly owned by the Federal Government, is primarily engaged in providing medium- and long-term financing to the Brazilian private sector. As of December 31, 2017, BNDES and entities under its control had assets of approximately R$861.5 billion and a net worth of approximately R$62.8 billion. In 2017, BNDES repaid R$50 billion of its outstanding loans to the National Treasury.
CEF. CEF is a savings bank wholly owned by the Federal Government. It is primarily involved in deposit-taking and financing for housing and related infrastructure and may be used by the Federal Government to provide social services. Its main activities relate to raising funds through savings accounts, escrow and time deposits and investment in loans substantially linked to housing. CEF’s assets as of December 31, 2017, were approximately R$1.3 trillion, and its net worth as of the same date was approximately R$34.4 billion.
D-26
Other Financial Institutions. Other federal financial institutions include the Bank of the Amazon (Banco da Amazônia), whose mission is to promote development in the Amazon region and the Bank of the Northeast of Brazil (Banco do Nordeste do Brasil), which is almost wholly owned by the Federal Government and has the mission of promoting sustainable development in northeastern Brazil.
Private Sector Financial Institutions
Brazil permits the establishment of multi-service banks, which are licensed to provide a full range of commercial banking, investment banking (including securities underwriting and trading), consumer financing and other services, including fund management and real estate finance.
Private sector financial institutions include commercial banks, investment banks, multi-service banks and other financial institutions. Brazil’s 19 private sector commercial banks and 93 private multi-service banks with commercial portfolios are engaged in wholesale and retail banking. They are particularly active in taking demand deposits and lending for short-term working capital purposes. Brazil’s 12 private investment banks are engaged primarily in collecting time deposits, specialized lending and underwriting securities. As of December 31, 2017, the consolidated net worth of the private sector banking institutions in Brazil was R$592.6 billion.
Banking Supervision
The Central Bank implements the CMN’s currency and credit policies and supervises financial institutions according to the following objectives: (i) evaluate risks assumed by, and management capacity of, financial institutions, (ii) verify compliance with applicable norms and laws, (iii) stimulate the dissemination of information by financial institutions and (iv) supervise conduct with the objective of combating financing of terrorists and preventing money laundering.
Along with public and private banking institutions, the Central Bank supervises credit, finance and investment companies, savings banks and credit unions, including stock exchanges, insurance and capitalization companies and individuals or entities who carry out activities performed by financial institutions, among others. The Central Bank also oversees the operations of the national rural credit system and of the housing finance system, monitors the registration of foreign capital and exchange transactions and monitors the granting of credit to the public sector.
In addition, the Central Bank is responsible for maintaining financial stability in Brazilian markets. In 2011, the Central Bank created the Financial Stability Committee (Comitê de Estabilidade Financeira) with the main objective of monitoring financial stability and establishing guidelines and strategies to mitigate risks to the financial system, which include imposing adequate capital requirements, liquidity, savings deposit insurance and loan loss reserve requirements on regulated financial institutions, among other measures.
Financial System Solvency
Since 2011, the Central Bank has issued several resolutions and guidelines to implement the most recent recommendations of the Basel Committee on Banking Supervision regarding the capital structure of financial institutions (“Basel III”). Implementation of the new capital structure in Brazil commenced on October 1, 2013, and will follow the agreed international schedule until the completion of the process, in early 2022.
Results through 2017 of the Central Bank’s periodic stress tests of the Brazilian financial system indicate that it maintains adequate shock absorbing capacity as a result of its present capital levels.
Derivatives and Investment Securities
Derivatives and investment securities are subject to various financial reporting requirements issued by the Central Bank. Securities held by financial institutions are required to be classified into certain categories, with such classifications determining mark to market requirements and accounting treatment. Financial institutions are also subject to specific hedge accounting rules regarding derivatives transactions, including monthly mark-to-market (“OTC”) requirements, classification requirements, and requirements to disclose certain information, including strategy.
The CMN authorizes financial institutions to enter into a wide range of non-standard options in the over-the-counter market as long as the derivative is registered in the OTC market or in a system organized by authorized institutions.
D-27
Deposit Insurance
Since 1995, Brazil has maintained a deposit insurance system through the Credit Guarantee Fund (Fundo Garantidor de Crédito or “FGC”), a nonprofit civil association that provides guaranties. The deposit insurance system protects creditors in the event of intervention, non-judicial liquidation, bankruptcy or other insolvency of an institution. With the exception of credit cooperatives, the participants in the FGC are all financial institutions and savings and loan associations.
The FGC, whose guaranties cover up to R$250,000 per person of covered claims, guarantees demand deposits, savings deposits, time deposits (in both book entry and certificated form), bills of exchange, real estate bonds, mortgage bonds and agribusiness credit bills, among other liabilities.
The CMN also allows financial institutions to issue Time Deposits with Special Guarantee (Depósitos a Prazo com Garantia Especial or “DPGE”), which are guaranteed by the FGC by up to R$20 million. The DPGEs serve as a key source of funds used by small and medium-sized banks in Brazil.
As of December 31, 2017, the total equity of the FGC was R$66.4 billion.
Loan Loss Reserves
The CMN has a nine-category classification system for loans and other extensions of credit, which are assigned ratings ranging from AA to H based on perceived credit risk of the borrower or guarantor and the nature of the credit transaction. The ratings are initially assigned when the extension of credit is made and thereafter are reevaluated on a monthly basis.
In 2017, the credit operations classified between E and H remained stable at 6.9% of the outstanding credit for 2017. The delinquency rate (percentage of operations in arrears for over 90 days) fell from 3.7% in December 2016 to approximately 3.3% in December 2017.
Foreign Currency Loans
Financial institutions in Brazil are permitted to borrow foreign currency-denominated funds in the international markets either through direct loans or through the issuance of debt securities. CMN Resolution No. 3,844, dated March 23, 2010, regulates the entry into Brazil of foreign capital, which must be registered with the Central Bank. Pursuant to the CMN resolution, financial institutions may borrow foreign currency-denominated funds in the international markets for the purpose of investment in the domestic market, without regard to minimum periods of amortization and retention of the funds in Brazil. Instead, other measures, such as the IOF, may be used to influence short-term capital flows.
Payment Settlement System
Payment orders in the Reserves Transfer System (Sistema de Transferência de Reservas) cannot be processed unless there is a sufficient balance in the paying institution’s reserve account. To avoid payment interruptions, the Central Bank introduced an intra-day credit line backed by National Treasury securities. There is no financial cost for this line, as long as repayment is made the same day; payments not made on the same day are treated as overnight loans for which a penalty rate is charged to the institution with the overdraft. This real-time gross settlement system is intended to prevent intra-day overdrafts from being created in the payment system.
Foreign Banks
Currently, foreign banks may only operate in Brazil with prior authorization by decree issued by the executive branch. Foreign banks are subject to the same rules, regulations and requirements applicable to Brazilian financial institutions.
As of December 31, 2017, there were 64 foreign-controlled or foreign-affiliated banks operating in Brazil and 17 banks in Brazil with significant foreign participation. As of December 2017, foreign bank participation reached 13.3% in total assets and 13.2% in shareholders’ equity of the Brazilian financial system.
Securities Markets
Securities Regulation
The CVM, an autonomous, independent and decentralized agency linked to the Federal Government, implements the policies of the CMN relating to the organization and operation of the Brazilian securities market. It is responsible for regulating Brazil’s stock exchanges, protecting investors and shareholders against fraud or manipulation with respect to securities traded on Brazilian stock exchanges and promulgating accounting and reporting rules to ensure public access to information on issuers and their traded
D-28
securities. The CVM’s main objectives are to (i) promote the development of the stock market, (ii) promote the efficiency and regular operation of the stock and over-the-counter markets, (iii) protect the holders of securities and market investors against irregularities in the issuance of securities, (iv) ensure public access to information on traded securities and issuers and (v) continuously monitor the activities and services of the securities market.
The Central Bank has licensing authority over brokerage firms and dealers and controls foreign investment and foreign exchange transactions.
Brazilian Stock Exchange
B3 S.A. – Brasil, Bolsa, Balcão (formerly BM&FBOVESPA) is one of the world’s largest financial market infrastructure providers by market value. B3 was established in March 2017 when the securities, commodities and futures exchange activities of BM&FBOVESPA were combined with the activities of Cetip, a provider of financial services for the organized OTC market.
The table below sets forth certain indicators of market activity on B3.
Table No. 17
Market Activity on B3
| | | | | | | | | | | | | | | | | | | | |
| | | 2013 | | | 2014 | | | 2015 | | | 2016 | | | 2017 | |
Number of Listed Companies | | | 363 | | | | 363 | | | | 359 | | | | 349 | | | | 344 | |
Market Capitalization (in billions of U.S. Dollars) | | | 1,030.6 | | | | 844.5 | | | | 489.7 | | | | 757.0 | | | | 955.6 | |
Market Volume(1) (in billions of U.S. Dollars) | | | 851.5 | | | | 768.1 | | | | 500.5 | | | | 530.2 | | | | 672.2 | |
| (1) | Exchange rate (sell side) at the last business day of December 31 of each year. |
Source: B3
D-29
BALANCE OF PAYMENTS
The balance of payments records a country’s economic transactions with the rest of the world over a one-year period. The following table sets forth information regarding Brazil’s balance of payments for each of the periods indicated.
Table No. 18
Balance of Payments (1)
In Millions of U.S. Dollars
| | | | | | | | | | | | | | | | | | | | |
| | | 2013 | | | 2014 | | | 2015 | | | 2016 | | | 2017 | |
Current Account | | | -74,839 | | | | -104,181 | | | | -59,434 | | | | -23,546 | | | | -9,762 | |
Balance on Goods | | | 389 | | | | -6,629 | | | | 17,670 | | | | 45,037 | | | | 64,028 | |
Exports | | | 241,577 | | | | 224,098 | | | | 190,092 | | | | 184,453 | | | | 217,243 | |
| | | | | |
Imports | | | 241,189 | | | | 230,727 | | | | 172,422 | | | | 139,416 | | | | 153,215 | |
Services | | | -46,372 | | | | -48,107 | | | | -36,946 | | | | -30,447 | | | | -33,850 | |
Primary Income Balance | | | -32,539 | | | | -52,170 | | | | -42,910 | | | | -41,080 | | | | -42,572 | |
Secondary Income Balance | | | 3,683 | | | | 2,725 | | | | 2,751 | | | | 2,944 | | | | 2,632 | |
Capital Account(2) | | | 322 | | | | 232 | | | | 461 | | | | 274 | | | | 379 | |
Financial Account | | | -73,803 | | | | -100,599 | | | | -55,145 | | | | -16,415 | | | | -6,131 | |
Direct Investment | | | -54,744 | | | | -71,140 | | | | -61,200 | | | | -65,432 | | | | -64,417 | |
Net Acquisition of Financial Assets | | | 14,942 | | | | 26,040 | | | | 13,518 | | | | 12,816 | | | | 6,268 | |
Net Incurrence of Liabilities | | | 69,686 | | | | 97,180 | | | | 74,718 | | | | 78,248 | | | | 70,685 | |
Portfolio Investments | | | -32,282 | | | | -38,425 | | | | -22,246 | | | | 19,216 | | | | 13,445 | |
Net Acquisition of Financial Assets | | | 8,981 | | | | 2,822 | | | | -3,569 | | | | -599 | | | | 12,371 | |
Net Incurrence of Liabilities | | | 41,263 | | | | 41,247 | | | | 18,677 | | | | -19,815 | | | | -1,075 | |
Financial Derivatives and Employee Stock Options | | | -110 | | | | 1,568 | | | | 3,450 | | | | -969 | | | | 705 | |
Other Investments | | | 19,260 | | | | -3,434 | | | | 23,282 | | | | 21,532 | | | | 39,042 | |
Net Acquisition of Financial Assets | | | 38,306 | | | | 50,667 | | | | 43,970 | | | | 33,501 | | | | 44,824 | |
Net Incurrence of Liabilities | | | 19,046 | | | | 54,101 | | | | 20,688 | | | | 11,969 | | | | 5,781 | |
Reserve Assets | | | -5,927 | | | | 10,833 | | | | 1,569 | | | | 9,237 | | | | 5,093 | |
Net Errors and Omissions | | | 714 | | | | 3,351 | | | | 3,828 | | | | 6,857 | | | | 3,251 | |
Note: Numbers may not total due to rounding.
| (1) | Figures calculated in accordance with methodology set forth in the International Monetary Fund—Balance of Payments and International Investment Position Manual—Sixth Edition (IMF BPM6). |
| (2) | Includes migrant transfers. |
Source: Central Bank
Current Account
Brazil has had current account deficits since 2008. In 2017, the current account deficit represented 0.5% of GDP, a significant decrease from the 1.3% of GDP registered in 2016. This decrease was mostly driven by a historically strong trade balance in 2017, with exports increasing at a much higher pace than imports and registering a surplus of US$64.0 billion.
Balance of Goods
The following table provides information on the principal foreign trade indicators for the periods specified.
Table No. 19
Principal Foreign Trade Indicators
| | | | | | | | | | | | | | | | | | | | |
| | | 2013 | | | 2014 | | | 2015 | | | 2016 | | | 2017 | |
Exports in millions of U.S. Dollars | | | 241,577 | | | | 224,098 | | | | 190,092 | | | | 184,453 | | | | 217,243 | |
% change (1) | | | -0.3 | % | | | -7.2 | % | | | -15.2 | % | | | -3.0 | % | | | 17.8 | % |
% of GDP | | | 9.8 | % | | | 9.1 | % | | | 10.6 | % | | | 10.3 | % | | | 10.6 | % |
in thousands of tons | | | 558,499 | | | | 576,730 | | | | 637,627 | | | | 645,356 | | | | 691,990 | |
% change (2) | | | 2.2 | % | | | 3.3 | % | | | 10.6 | % | | | 1.2 | % | | | 7.2 | % |
D-30
| | | | | | | | | | | | | | | | | | | | |
Imports in millions of U.S. Dollars | | | 241,189 | | | | 230,727 | | | | 172,422 | | | | 139,416 | | | | 153,215 | |
% change (1) | | | 7.3 | % | | | -4.3 | % | | | -25.3 | % | | | -19.1 | % | | | 9.9 | % |
% of GDP | | | 9.8 | % | | | 9.4 | % | | | 9.6 | % | | | 7.8 | % | | | 7.5 | % |
in thousands of tons | | | 159,583 | | | | 165,309 | | | | 146,509 | | | | 139,908 | | | | 147,950 | |
% change (2) | | | 12.6 | % | | | 3.6 | % | | | -11.4 | % | | | -4.5 | % | | | 5.7 | % |
Exports/Imports (3) | | | -1.0 | | | | -1.0 | | | | -1.1 | | | | -1.3 | | | | -1.4 | |
Trade Balance in millions of U.S. Dollars | | | 389 | | | | -6,629 | | | | 17,670 | | | | 45,037 | | | | 64,028 | |
% change (1) | | | -97.8 | % | | | -1805.9 | % | | | -366.5 | % | | | 154.9 | % | | | 42.2 | % |
% of GDP | | | 0.0 | % | | | -0.3 | % | | | 1.0 | % | | | 2.5 | % | | | 3.1 | % |
GDP | | | 2,468,456 | | | | 2,454,846 | | | | 1,796,168 | | | | 1,797,234 | | | | 2,055,184 | |
Note: Numbers may not total due to rounding.
| (1) | Percentage change from previous year. |
| (2) | Percentage change in volume, by weight. |
| (3) | Exports divided by imports. |
Source: Central Bank and Ministry of Industry, Foreign Trade and Services (Ministério da Indústria, Comércio Exterior e Serviços)
Exports
Since 2009, the largest market for Brazilian products has been Asia, followed by the European Union. The following table sets forth certain information regarding the destination of Brazil’s exports for the periods indicated.
Table No. 20
Exports by Region (FOB Brazil) (1)
In Millions of U.S. Dollars, except for percentages(2)
| | | | | | | | | | | | | | | | | | | | | | | | | | | | | | | | | | | | | | | | |
| | | 2013 | | | 2014 | | | 2015 | | | 2016 | | | 2017 | |
Asia (ex-Middle Eastern) | | | 78,275 | | | | 32.3 | % | | | 73,944 | | | | 32.8 | % | | | 63,438 | | | | 33.2 | % | | | 62,139 | | | | 33.5 | % | | | 78,743 | | | | 36.2 | % |
China, Hong Kong and Macau | | | 49,372 | | | | 20.4 | % | | | 43,939 | | | | 19.5 | % | | | 37,716 | | | | 19.7 | % | | | 37,396 | | | | 20.2 | % | | | 50,173 | | | | 23.0 | % |
ASEAN (3) | | | 9,022 | | | | 3.7 | % | | | 11,350 | | | | 5.0 | % | | | 10,703 | | | | 5.6 | % | | | 10,616 | | | | 5.7 | % | | | 11,114 | | | | 5.1 | % |
Others | | | 7,197 | | | | 3.0 | % | | | 8,105 | | | | 3.6 | % | | | 7,052 | | | | 3.7 | % | | | 6,641 | | | | 3.6 | % | | | 9,116 | | | | 4.2 | % |
Japan | | | 7,964 | | | | 3.3 | % | | | 6,719 | | | | 3.0 | % | | | 4,845 | | | | 2.5 | % | | | 4,604 | | | | 2.5 | % | | | 5,263 | | | | 2.4 | % |
South Korea | | | 4,720 | | | | 2.0 | % | | | 3,831 | | | | 1.7 | % | | | 3,122 | | | | 1.6 | % | | | 2,881 | | | | 1.6 | % | | | 3,077 | | | | 1.4 | % |
Europe | | | 55,818 | | | | 23.1 | % | | | 50,905 | | | | 22.6 | % | | | 40,873 | | | | 21.4 | % | | | 39,812 | | | | 21.5 | % | | | 41,529 | | | | 19.1 | % |
European Union | | | 47,772 | | | | 19.7 | % | | | 42,047 | | | | 18.7 | % | | | 33,947 | | | | 17.8 | % | | | 33,357 | | | | 18.0 | % | | | 34,900 | | | | 16.0 | % |
Others | | | 5,072 | | | | 2.1 | % | | | 5,029 | | | | 2.2 | % | | | 4,462 | | | | 2.3 | % | | | 4,155 | | | | 2.2 | % | | | 3,893 | | | | 1.8 | % |
Russia | | | 2,974 | | | | 1.2 | % | | | 3,829 | | | | 1.7 | % | | | 2,464 | | | | 1.3 | % | | | 2,300 | | | | 1.2 | % | | | 2,737 | | | | 1.3 | % |
South America | | | 41,112 | | | | 17.0 | % | | | 36,703 | | | | 16.3 | % | | | 31,071 | | | | 16.3 | % | | | 30,034 | | | | 16.2 | % | | | 35,248 | | | | 16.2 | % |
Mercosur | | | 24,684 | | | | 10.2 | % | | | 20,421 | | | | 9.1 | % | | | 18,000 | | | | 9.4 | % | | | 18,382 | | | | 9.9 | % | | | 22,613 | | | | 10.4 | % |
Andean Community of Nations | | | 7,060 | | | | 2.9 | % | | | 6,636 | | | | 2.9 | % | | | 6,078 | | | | 3.2 | % | | | 6,265 | | | | 3.4 | % | | | 7,096 | | | | 3.3 | % |
Others | | | 9,369 | | | | 3.9 | % | | | 9,645 | | | | 4.3 | % | | | 6,993 | | | | 3.7 | % | | | 5,386 | | | | 2.9 | % | | | 5,539 | | | | 2.5 | % |
North America | | | 31,586 | | | | 13.1 | % | | | 33,013 | | | | 14.7 | % | | | 30,031 | | | | 15.7 | % | | | 29,336 | | | | 15.8 | % | | | 34,106 | | | | 15.7 | % |
United States of America | | | 24,653 | | | | 10.2 | % | | | 27,028 | | | | 12.0 | % | | | 24,080 | | | | 12.6 | % | | | 23,156 | | | | 12.5 | % | | | 26,873 | | | | 12.3 | % |
Mexico | | | 4,230 | | | | 1.7 | % | | | 3,670 | | | | 1.6 | % | | | 3,588 | | | | 1.9 | % | | | 3,813 | | | | 2.1 | % | | | 4,514 | | | | 2.1 | % |
Canada | | | 2,702 | | | | 1.1 | % | | | 2,316 | | | | 1.0 | % | | | 2,363 | | | | 1.2 | % | | | 2,366 | | | | 1.3 | % | | | 2,719 | | | | 1.2 | % |
Middle Eastern | | | 10,954 | | | | 4.5 | % | | | 10,419 | | | | 4.6 | % | | | 9,957 | | | | 5.2 | % | | | 10,146 | | | | 5.5 | % | | | 11,671 | | | | 5.4 | % |
Africa | | | 11,087 | | | | 4.6 | % | | | 9,701 | | | | 4.3 | % | | | 8,202 | | | | 4.3 | % | | | 7,832 | | | | 4.2 | % | | | 9,393 | | | | 4.3 | % |
Central America and Caribbean | | | 8,523 | | | | 3.5 | % | | | 5,869 | | | | 2.6 | % | | | 4,644 | | | | 2.4 | % | | | 3,671 | | | | 2.0 | % | | | 4,241 | | | | 1.9 | % |
Non-declared | | | 4,135 | | | | 1.7 | % | | | 4,038 | | | | 1.8 | % | | | 2,427 | | | | 1.3 | % | | | 1,732 | | | | 0.9 | % | | | 2,240 | | | | 1.0 | % |
Oceania | | | 545 | | | | 0.2 | % | | | 509 | | | | 0.2 | % | | | 490 | | | | 0.3 | % | | | 534 | | | | 0.3 | % | | | 567 | | | | 0.3 | % |
Total | | | 242,034 | | | | 100.0 | % | | | 225,101 | | | | 100.0 | % | | | 191,134 | | | | 100.0 | % | | | 185,235 | | | | 100.0 | % | | | 217,739 | | | | 100.0 | % |
Note: Numbers may not total due to rounding.
| (1) | According to the MERCOSUL Common Nomenclature (Nomenclatura Comum do MERCOSUL or “NCM”). |
D-31
| (2) | Percentages of total exports. |
| (3) | Association of Southeast Asian Nations. |
Source: Ministry of Industry, Foreign Trade and Services
The following table sets forth certain information regarding exports by product categories.
Table No. 21
Brazilian Exports (FOB) (1)
In Millions of U.S. Dollars, except for percentages(2)
| | | | | | | | | | | | | | | | | | | | | | | | | | | | | | | | | | | | | | | | |
| | | 2013 | | | 2014 | | | 2015 | | | 2016 | | | 2017 | |
Primary Products | | | 113,023 | | | | 46.7 | % | | | 109,556 | | | | 48.7 | % | | | 87,188 | | | | 45.6 | % | | | 79,175 | | | | 42.7 | % | | | 101,089 | | | | 46.4 | % |
Industrialized Products | | | 129,010 | | | | 53.3 | % | | | 115,545 | | | | 51.3 | % | | | 103,946 | | | | 54.4 | % | | | 106,104 | | | | 57.3 | % | | | 116,715 | | | | 53.6 | % |
Semi-Manufactured | | | 30,526 | | | | 12.6 | % | | | 29,065 | | | | 12.9 | % | | | 26,463 | | | | 13.8 | % | | | 27,965 | | | | 15.1 | % | | | 31,442 | | | | 14.4 | % |
Manufactured (3) | | | 98,485 | | | | 40.7 | % | | | 86,479 | | | | 38.4 | % | | | 77,483 | | | | 40.5 | % | | | 78,140 | | | | 42.2 | % | | | 85,273 | | | | 39.2 | % |
Total | | | 242,034 | | | | 100.0 | % | | | 225,101 | | | | 100.0 | % | | | 191,134 | | | | 100.0 | % | | | 185,280 | | | | 100.0 | % | | | 217,805 | | | | 100.0 | % |
Note: Numbers may not total due to rounding.
| (2) | Percentages of total exports. |
| (3) | Includes Special Transactions. Special Transactions code used when specific product codes are not identifiable for transactions such as: purchase and sale of ships and airplanes to be used for international transportation, purchase and sale of drilling platforms to be used in international waters, ships, airplanes and other transportation vehicles (on board consumption), postal packages, non-financial leases, personal property of migrants, donations and duty-free shops. |
Source: Ministry of Industry, Foreign Trade and Services
D-32
The following table sets forth certain information regarding exports by major commodity groups for the periods indicated.
Table No. 22
Exports (FOB Brazil)(1)
In Millions of U.S. Dollars, except for percentages(2)
| | | | | | | | | | | | | | | | | | | | | | | | | | | | | | | | | | | | | | | | |
| | | 2013 | | | 2014 | | | 2015 | | | 2016 | | | 2017 | |
Livestock and Animal Products | | | 16,631 | | | | 6.9 | % | | | 17,528 | | | | 7.8 | % | | | 14,483 | | | | 7.6 | % | | | 13,895 | | | | 7.5 | % | | | 15,380 | | | | 7.1 | % |
Vegetable Products | | | 36,113 | | | | 14.9 | % | | | 35,536 | | | | 15.8 | % | | | 34,099 | | | | 17.8 | % | | | 29,992 | | | | 16.2 | % | | | 37,256 | | | | 17.1 | % |
Oils, Fat and Waxes of Animals and Plants | | | 1,845 | | | | 0.8 | % | | | 1,584 | | | | 0.7 | % | | | 1,626 | | | | 0.9 | % | | | 1,251 | | | | 0.7 | % | | | 1,441 | | | | 0.7 | % |
Food, Beverage and Tobacco | | | 30,277 | | | | 12.5 | % | | | 26,013 | | | | 11.6 | % | | | 22,341 | | | | 11.7 | % | | | 24,434 | | | | 13.2 | % | | | 25,186 | | | | 11.6 | % |
Mineral Products | | | 53,706 | | | | 22.2 | % | | | 49,836 | | | | 22.1 | % | | | 31,153 | | | | 16.3 | % | | | 28,062 | | | | 15.1 | % | | | 41,803 | | | | 19.2 | % |
Chemical Products and Derivatives | | | 11,157 | | | | 4.6 | % | | | 11,503 | | | | 5.1 | % | | | 9,989 | | | | 5.2 | % | | | 9,208 | | | | 5.0 | % | | | 10,629 | | | | 4.9 | % |
Plastic and Rubber, and Derivatives | | | 5,605 | | | | 2.3 | % | | | 5,531 | | | | 2.5 | % | | | 5,127 | | | | 2.7 | % | | | 5,122 | | | | 2.8 | % | | | 5,456 | | | | 2.5 | % |
Fur, Leather and Derivatives | | | 2,607 | | | | 1.1 | % | | | 3,050 | | | | 1.4 | % | | | 2,372 | | | | 1.2 | % | | | 2,148 | | | | 1.2 | % | | | 2,007 | | | | 0.9 | % |
Wood, Wood Charcoal and Derivatives | | | 2,006 | | | | 0.8 | % | | | 2,245 | | | | 1.0 | % | | | 2,273 | | | | 1.2 | % | | | 2,363 | | | | 1.3 | % | | | 2,781 | | | | 1.3 | % |
Paste of Wood, Paper and Derivatives | | | 7,194 | | | | 3.0 | % | | | 7,262 | | | | 3.2 | % | | | 7,665 | | | | 4.0 | % | | | 7,496 | | | | 4.0 | % | | | 8,315 | | | | 3.8 | % |
Textile Materials and Derivatives | | | 2,368 | | | | 1.0 | % | | | 2,537 | | | | 1.1 | % | | | 2,371 | | | | 1.2 | % | | | 2,213 | | | | 1.2 | % | | | 2,372 | | | | 1.1 | % |
Shoes, Hats, etc. | | | 1,269 | | | | 0.5 | % | | | 1,244 | | | | 0.6 | % | | | 1,119 | | | | 0.6 | % | | | 1,169 | | | | 0.6 | % | | | 1,283 | | | | 0.6 | % |
Articles of Stone, Ceramic, Glass, etc. | | | 1,922 | | | | 0.8 | % | | | 1,940 | | | | 0.9 | % | | | 1,926 | | | | 1.0 | % | | | 1,847 | | | | 1.0 | % | | | 1,883 | | | | 0.9 | % |
Natural Pearls, Precious Stones, etc. | | | 3,207 | | | | 1.3 | % | | | 2,817 | | | | 1.3 | % | | | 2,755 | | | | 1.4 | % | | | 3,376 | | | | 1.8 | % | | | 3,306 | | | | 1.5 | % |
Common Metals and Derivatives | | | 14,805 | | | | 6.1 | % | | | 16,129 | | | | 7.2 | % | | | 15,266 | | | | 8.0 | % | | | 13,406 | | | | 7.2 | % | | | 16,315 | | | | 7.5 | % |
Machineries and Equipments, Electric Materials, etc. | | | 17,493 | | | | 7.2 | % | | | 16,944 | | | | 7.5 | % | | | 15,011 | | | | 7.9 | % | | | 14,887 | | | | 8.0 | % | | | 17,284 | | | | 7.9 | % |
Transport Materials | | | 26,574 | | | | 11.0 | % | | | 16,139 | | | | 7.2 | % | | | 16,243 | | | | 8.5 | % | | | 19,904 | | | | 10.7 | % | | | 19,845 | | | | 9.1 | % |
Scientific Instruments and Equipments | | | 912 | | | | 0.4 | % | | | 924 | | | | 0.4 | % | | | 855 | | | | 0.4 | % | | | 858 | | | | 0.5 | % | | | 930 | | | | 0.4 | % |
Weapons and Ammunition | | | 356 | | | | 0.1 | % | | | 317 | | | | 0.1 | % | | | 365 | | | | 0.2 | % | | | 343 | | | | 0.2 | % | | | 476 | | | | 0.2 | % |
Goods and Diverse Products | | | 1,038 | | | | 0.4 | % | | | 1,146 | | | | 0.5 | % | | | 977 | | | | 0.5 | % | | | 938 | | | | 0.5 | % | | | 935 | | | | 0.4 | % |
Objects of Art, Collection and Antiques | | | 122 | | | | 0.1 | % | | | 82 | | | | 0.0 | % | | | 113 | | | | 0.1 | % | | | 198 | | | | 0.1 | % | | | 188 | | | | 0.1 | % |
Special Transactions | | | 4,829 | | | | 2.0 | % | | | 4,794 | | | | 2.1 | % | | | 3,005 | | | | 1.6 | % | | | 2,125 | | | | 1.1 | % | | | 2,670 | | | | 1.2 | % |
Total | | | 242,034 | | | | 100 | % | | | 225,101 | | | | 100 | % | | | 191,134 | | | | 100 | % | | | 185,235 | | | | 100 | % | | | 217,739 | | | | 100 | % |
Note: Numbers may not total due to rounding.
| (2) | Percentages of total exports. |
Source: Ministry of Industry, Foreign Trade and Services
In 2017, soy products exports represented 11.8% of all Brazilian exports and iron ore exports represented 8.8% of all Brazilian exports. These items are exported to a wide range of commercial partners; however, China received the biggest share of these exports in 2017.
D-33
To provide export financing under the terms and conditions prevailing in the international market, the Federal Government established the Export Financing Program (Programa de Financiamento às Exportações or “PROEX”). There are two forms of credit assistance available under the program: direct financing and interest rate equalization. Direct financing can be provided to Brazilian exporters (supplier’s credit) or to foreign importers (buyer’s credit); direct financing may also be provided for the production of goods and services for export. Interest rate equalization is a form of credit assistance through which PROEX pays for part of the charges associated with a loan granted by another financial institution through equalization payments, making the net financial burden of the loan compatible with those available on the international market. The financing period of the program ranges from 60 days to 15 years.
The PROEX budget for 2018 is approximately R$3.6 billion, compared to R$4.8 billion in 2017.
Imports
The following table set forth certain information regarding the sources of Brazil’s imports for the periods indicated.
Table No. 23
Imports by Region (FOB Brazil)(1)
In Millions of U.S. Dollars, except for percentages(2)
| | | | | | | | | | | | | | | | | | | | | | | | | | | | | | | | | | | | | | | | |
| | | 2013 | | | 2014 | | | 2015 | | | 2016 | | | 2017 | |
Asia (ex-Middle Eastern) | | | 73,296 | | | | 30.6 | % | | | 71,281 | | | | 31.1 | % | | | 55,933 | | | | 32.6 | % | | | 43,249 | | | | 31.4 | % | | | 49,657 | | | | 32.9 | % |
China, Hong Kong and Macau | | | 38,156 | | | | 15.9 | % | | | 38,248 | | | | 16.7 | % | | | 31,342 | | | | 18.3 | % | | | 23,833 | | | | 17.3 | % | | | 27,903 | | | | 18.5 | % |
ASEAN(3) | | | 8,806 | | | | 3.7 | % | | | 8,624 | | | | 3.8 | % | | | 7,304 | | | | 4.3 | % | | | 6,004 | | | | 4.4 | % | | | 7,470 | | | | 5.0 | % |
Others | | | 9,761 | | | | 4.1 | % | | | 9,982 | | | | 4.4 | % | | | 6,989 | | | | 4.1 | % | | | 4,397 | | | | 3.2 | % | | | 5,281 | | | | 3.5 | % |
Japan | | | 9,492 | | | | 4.0 | % | | | 8,526 | | | | 3.7 | % | | | 5,421 | | | | 3.2 | % | | | 5,449 | | | | 4.0 | % | | | 5,240 | | | | 3.5 | % |
South Korea | | | 7,081 | | | | 3.0 | % | | | 5,901 | | | | 2.6 | % | | | 4,877 | | | | 2.8 | % | | | 3,566 | | | | 2.6 | % | | | 3,763 | | | | 2.5 | % |
Europe | | | 59,426 | | | | 24.8 | % | | | 55,499 | | | | 24.2 | % | | | 43,223 | | | | 25.2 | % | | | 36,447 | | | | 26.5 | % | | | 38,289 | | | | 25.4 | % |
European Union | | | 50,751 | | | | 21.2 | % | | | 46,719 | | | | 20.4 | % | | | 36,646 | | | | 21.4 | % | | | 31,062 | | | | 22.6 | % | | | 32,074 | | | | 21.3 | % |
Others | | | 5,999 | | | | 2.5 | % | | | 5,764 | | | | 2.5 | % | | | 4,356 | | | | 2.5 | % | | | 3,363 | | | | 2.4 | % | | | 3,571 | | | | 2.4 | % |
Russia | | | 2,676 | | | | 1.1 | % | | | 3,016 | | | | 1.3 | % | | | 2,221 | | | | 1.3 | % | | | 2,021 | | | | 1.5 | % | | | 2,645 | | | | 1.8 | % |
South America | | | 44,815 | | | | 18.7 | % | | | 43,095 | | | | 18.8 | % | | | 33,271 | | | | 19.4 | % | | | 29,197 | | | | 21.2 | % | | | 30,846 | | | | 20.5 | % |
Mercosur | | | 36,019 | | | | 15.0 | % | | | 35,018 | | | | 15.3 | % | | | 26,471 | | | | 15.4 | % | | | 23,803 | | | | 17.3 | % | | | 24,847 | | | | 16.5 | % |
Andean Community of Nations | | | 5,795 | | | | 2.4 | % | | | 5,363 | | | | 2.3 | % | | | 4,378 | | | | 2.6 | % | | | 3,528 | | | | 2.6 | % | | | 4,238 | | | | 2.8 | % |
Others | | | 3,002 | | | | 1.3 | % | | | 2,713 | | | | 1.2 | % | | | 2,421 | | | | 1.4 | % | | | 1,866 | | | | 1.4 | % | | | 1,761 | | | | 1.2 | % |
North America | | | 32,891 | | | | 13.7 | % | | | 30,330 | | | | 13.2 | % | | | 22,232 | | | | 13.0 | % | | | 18,825 | | | | 13.7 | % | | | 20,353 | | | | 13.5 | % |
United States of America | | | 19,975 | | | | 8.3 | % | | | 17,753 | | | | 7.7 | % | | | 13,064 | | | | 7.6 | % | | | 11,891 | | | | 8.6 | % | | | 12,026 | | | | 8.0 | % |
Mexico | | | 7,410 | | | | 3.1 | % | | | 7,386 | | | | 3.2 | % | | | 5,070 | | | | 3.0 | % | | | 3,630 | | | | 2.6 | % | | | 4,477 | | | | 3.0 | % |
Canada | | | 5,506 | | | | 2.3 | % | | | 5,190 | | | | 2.3 | % | | | 4,099 | | | | 2.4 | % | | | 3,303 | | | | 2.4 | % | | | 3,850 | | | | 2.6 | % |
Middle Eastern | | | 7369 | | | | 3.1 | % | | | 8000 | | | | 3.5 | % | | | 5313 | | | | 3.1 | % | | | 3569 | | | | 2.6 | % | | | 3964 | | | | 2.6 | % |
Africa | | | 17,446 | | | | 7.3 | % | | | 17,061 | | | | 7.4 | % | | | 8,764 | | | | 5.1 | % | | | 4,601 | | | | 3.3 | % | | | 5,532 | | | | 3.7 | % |
Central America and Caribbean | | | 3,181 | | | | 1.3 | % | | | 2,658 | | | | 1.2 | % | | | 1,602 | | | | 0.9 | % | | | 778 | | | | 0.6 | % | | | 683 | | | | 0.5 | % |
Oceania | | | 1,324 | | | | 0.6 | % | | | 1,232 | | | | 0.5 | % | | | 1,112 | | | | 0.6 | % | | | 887 | | | | 0.6 | % | | | 1,426 | | | | 0.9 | % |
Non-declared | | | 0.2 | | | | 0.00 | % | | | 0.0 | | | | 0.00 | % | | | 0.0 | | | | 0.00 | % | | | 0.0 | | | | 0.00 | % | | | 0.0 | | | | 0.00 | % |
Total | | | 239,748 | | | | 100 | % | | | 229,154 | | | | 100 | % | | | 171,449 | | | | 100 | % | | | 137,552 | | | | 100 | % | | | 150,749 | | | | 100 | % |
Note: Numbers may not total due to rounding.
| (2) | Percentages of total imports. |
| (3) | Association of Southeast Asian Nations. |
Source: Ministry of Industry, Foreign Trade and Services
The Mercosul Common Customs Tariff (Tarifa Externa Comum or “TEC”) is of up to 35%. However, member countries are entitled to a list of products that, at their discretion, will temporarily not be subject to the TEC. The list of exceptions allowed to each member country are as follows: Argentina, up to 100 products until December 31, 2021; Brazil, up to 100 products until December 31, 2021; Paraguay, up to 649 products until December 31, 2023; Uruguay, up to 225 products until December 31, 2022; and Venezuela up to 225 products until December 31, 2022. For such products included in the list of exceptions, each member country may impose higher or lower tariffs, as compared to the TEC. The maximum import tariff imposed by Brazil on products included in the list of exceptions was 55%. Up to 20% of the products on the list can be changed every six months.
The following table sets forth certain information regarding imports by end-use category.
D-34
Table No. 24
Brazilian Imports (FOB)(1)
In Millions of U.S. Dollars, except for percentages(2)
| | | | | | | | | | | | | | | | | | | | | | | | | | | | | | | | | | | | | | | | |
| | | 2013 | | | 2014 | | | 2015 | | | 2016 | | | 2017 | |
Consumption goods | | | 34,676 | | | | 14.5 | % | | | 33,115 | | | | 14.5 | % | | | 26,810 | | | | 15.6 | % | | | 21,726 | | | | 15.8 | % | | | 23,266 | | | | 15.4 | % |
Intermediate goods | | | 131,834 | | | | 55.0 | % | | | 127,059 | | | | 55.4 | % | | | 99,645 | | | | 58.1 | % | | | 85,070 | | | | 61.8 | % | | | 93,758 | | | | 62.2 | % |
Oil and Fuel | | | 40,546 | | | | 16.9 | % | | | 39,478 | | | | 17.2 | % | | | 21,717 | | | | 12.7 | % | | | 12,406 | | | | 9.0 | % | | | 17,574 | | | | 11.7 | % |
Capital goods | | | 32,691 | | | | 13.6 | % | | | 29,492 | | | | 12.9 | % | | | 23,290 | | | | 13.6 | % | | | 18,355 | | | | 13.3 | % | | | 16,132 | | | | 10.7 | % |
Total | | | 239,748 | | | | 100.0 | % | | | 229,145 | | | | 100.0 | % | | | 171,461 | | | | 100.0 | % | | | 137,557 | | | | 100.0 | % | | | 150,730 | | | | 100.0 | % |
Note: Numbers may not total due to rounding.
| (2) | Percentages of total imports. |
Source: Central Bank, with underlying information provided by Ministry of Industry, Foreign Trade and Services
The following table sets forth certain information regarding imports by major commodity groups for the periods indicated.
Table No. 25
Imports (FOB Brazil)(1)
In Millions of U.S. Dollars, except for percentages(2)
| | | | | | | | | | | | | | | | | | | | | | | | | | | | | | | | | | | | | | | | |
| | | 2013 | | | 2014 | | | 2015 | | | 2016 | | | 2017 | |
Livestock and Animal Products | | | 2,457 | | | | 1.0 | % | | | 2,570 | | | | 1.1 | % | | | 2,043 | | | | 1.2 | % | | | 2,227 | | | | 1.6 | % | | | 2,419 | | | | 1.6 | % |
Vegetable Products | | | 5,984 | | | | 2.5 | % | | | 5,252 | | | | 2.3 | % | | | 3,881 | | | | 2.3 | % | | | 5,063 | | | | 3.7 | % | | | 4,250 | | | | 2.8 | % |
Oils, Fat and Waxes of Animals and Plants | | | 953 | | | | 0.4 | % | | | 1,018 | | | | 0.4 | % | | | 838 | | | | 0.5 | % | | | 901 | | | | 0.7 | % | | | 1,036 | | | | 0.7 | % |
Food, Beverage and Tobacco | | | 2,868 | | | | 1.2 | % | | | 3,114 | | | | 1.4 | % | | | 2,751 | | | | 1.6 | % | | | 2,790 | | | | 2.0 | % | | | 3,500 | | | | 2.3 | % |
Mineral Products | | | 48,137 | | | | 20.1 | % | | | 47,205 | | | | 20.6 | % | | | 26,952 | | | | 15.7 | % | | | 16,638 | | | | 12.1 | % | | | 23,364 | | | | 15.5 | % |
Chemical Products and Derivatives | | | 38,236 | | | | 15.9 | % | | | 37,880 | | | | 16.5 | % | | | 32,089 | | | | 18.7 | % | | | 28,943 | | | | 21.0 | % | | | 31,311 | | | | 20.8 | % |
Plastic and Rubber, and Derivatives | | | 13,600 | | | | 5.7 | % | | | 12,941 | | | | 5.6 | % | | | 10,096 | | | | 5.9 | % | | | 8,392 | | | | 6.1 | % | | | 9,594 | | | | 6.4 | % |
Fur, Leather and Derivatives | | | 607 | | | | 0.3 | % | | | 631 | | | | 0.3 | % | | | 507 | | | | 0.3 | % | | | 363 | | | | 0.3 | % | | | 478 | | | | 0.3 | % |
Wood, Wood Charcoal and Derivatives | | | 164 | | | | 0.1 | % | | | 170 | | | | 0.1 | % | | | 132 | | | | 0.1 | % | | | 111 | | | | 0.1 | % | | | 109 | | | | 0.1 | % |
Paste of Wood, Paper and Derivatives | | | 2,105 | | | | 0.9 | % | | | 2,038 | | | | 0.9 | % | | | 1,498 | | | | 0.9 | % | | | 1,168 | | | | 0.8 | % | | | 1,183 | | | | 0.8 | % |
Textile Materials and Derivatives | | | 6,800 | | | | 2.8 | % | | | 7,148 | | | | 3.1 | % | | | 5,860 | | | | 3.4 | % | | | 4,213 | | | | 3.1 | % | | | 5,092 | | | | 3.4 | % |
Shoes, Hats, etc | | | 818 | | | | 0.3 | % | | | 817 | | | | 0.4 | % | | | 689 | | | | 0.4 | % | | | 492 | | | | 0.4 | % | | | 511 | | | | 0.3 | % |
Articles of Stone, Ceramic, Glass, etc | | | 2,080 | | | | 0.9 | % | | | 1,832 | | | | 0.8 | % | | | 1,349 | | | | 0.8 | % | | | 965 | | | | 0.7 | % | | | 1,089 | | | | 0.7 | % |
Natural Pearls, Precious Stones, etc | | | 542 | | | | 0.2 | % | | | 521 | | | | 0.2 | % | | | 381 | | | | 0.2 | % | | | 378 | | | | 0.3 | % | | | 437 | | | | 0.3 | % |
Common Metals and Derivatives | | | 13,706 | | | | 5.7 | % | | | 13,593 | | | | 5.9 | % | | | 10,852 | | | | 6.3 | % | | | 7,340 | | | | 5.3 | % | | | 8,639 | | | | 5.7 | % |
Machineries and Equipments, Electric Materials, etc | | | 64,039 | | | | 26.7 | % | | | 58,902 | | | | 25.7 | % | | | 45,197 | | | | 26.4 | % | | | 38,067 | | | | 27.7 | % | | | 38,130 | | | | 25.3 | % |
Transport Materials | | | 26,498 | | | | 11.1 | % | | | 23,925 | | | | 10.4 | % | | | 18,380 | | | | 10.7 | % | | | 12,979 | | | | 9.4 | % | | | 12,780 | | | | 8.5 | % |
Scientific Instruments and Equipments | | | 7,536 | | | | 3.1 | % | | | 7,104 | | | | 3.1 | % | | | 5,834 | | | | 3.4 | % | | | 4,959 | | | | 3.6 | % | | | 5,086 | | | | 3.4 | % |
Weapons and Ammunition | | | 41 | | | | 0.0 | % | | | 63 | | | | 0.0 | % | | | 39 | | | | 0.0 | % | | | 36 | | | | 0.0 | % | | | 28 | | | | 0.0 | % |
Goods and Diverse Products | | | 2,522 | | | | 1.1 | % | | | 2,367 | | | | 1.0 | % | | | 2,041 | | | | 1.2 | % | | | 1,516 | | | | 1.1 | % | | | 1,701 | | | | 1.1 | % |
Objects of Art, Collection and Antiques | | | 52 | | | | 0.0 | % | | | 66 | | | | 0.0 | % | | | 39 | | | | 0.0 | % | | | 13 | | | | 0.0 | % | | | 14 | | | | 0.0 | % |
Special Transactions | | | 0.0 | | | | 0.0 | % | | | 0.0 | | | | 0.0 | % | | | 0.0 | | | | 0.0 | % | | | 0.0 | | | | 0.0 | % | | | 0.0 | | | | 0.0 | % |
Total | | | 239,748 | | | | 100 | % | | | 229,154 | | | | 100 | % | | | 171,449 | | | | 100 | % | | | 137,552 | | | | 100 | % | | | 150,749 | | | | 100 | % |
Note: Numbers may not total due to rounding.
| (2) | Percentages of total imports. |
Source: Ministry of Industry, Foreign Trade and Services
Financial Account
Foreign Investment
In 2017, direct investment inflows in Brazil were widely spread among the various economic activity sectors and the volume of inflows was at an adequate level to finance the current account deficit. Foreign direct investment in 2017 totaled U.S.$70.7 billion (3.4% of the GDP).
D-35
The following table sets forth information regarding foreign direct and portfolio investment in Brazil for each of the years indicated.
Table No. 26
Foreign Direct and Portfolio Investment in Brazil (1)
In Millions of U.S. Dollars
| | | | | | | | | | | | | | | | | | | | |
| | | 2013 | | | 2014 | | | 2015 | | | 2016 | | | 2017 | |
Portfolio | | | | | | | | | | | | | | | | | | | | |
Net acquisition of Financial Assets | | | 8,981 | | | | 2,822 | | | | -3,569 | | | | -599 | | | | 12,371 | |
Net Incurrence of Liabilities | | | 41,263 | | | | 41,247 | | | | 18,677 | | | | -19,815 | | | | -1,075 | |
Total | | | -32,282 | | | | -38,425 | | | | -22,246 | | | | 19,216 | | | | 13,445 | |
Direct | | | | | | | | | | | | | | | | | | | | |
Net Acquisition of Financial Assets | | | 14,942 | | | | 26,040 | | | | 13,518 | | | | 12,816 | | | | 6,268 | |
Net Incurrence of Liabilities | | | 69,686 | | | | 97,180 | | | | 74,718 | | | | 78,248 | | | | 70,685 | |
Total | | | -54,744 | | | | -71,140 | | | | -61,200 | | | | -65,432 | | | | -64,417 | |
Note: Numbers may not total due to rounding.
| (1) | Figures calculated in accordance with methodology set forth in the IMF BPM6. |
Source: Central Bank
Other than in 2013 and 2014, external financing needs, which are defined as the difference between the current account deficit and net foreign direct investment, have generally been negative since January 2002, as rising foreign direct investments have been greater than the current account deficit.
The following table sets forth the external financing needs of Brazil for each of the years indicated.
Table No. 27
External Financing Needs
In Millions of U.S. Dollars
| | | | | | | | | | | | | | | | | | | | |
| | | 2013 | | | 2014 | | | 2015 | | | 2016 | | | 2017 | |
Current Account Deficit | | | 74,839 | | | | 104,181 | | | | 59,434 | | | | 23,546 | | | | 9,762 | |
Foreign Direct Investment | | | 69,686 | | | | 97,180 | | | | 74,718 | | | | 78,248 | | | | 70,685 | |
External Financing Needs | | | 5,153 | | | | 7,002 | | | | -15,284 | | | | -54,703 | | | | -60,923 | |
Note: Numbers may not total due to rounding.
Source: Central Bank
Reserve Assets
International Reserves
The Central Bank publishes the volume of international reserves using two metrics: cash (the most commonly used metric) and international liquidity. The international liquidity metric includes U.S. Dollars receivable by the Central Bank from banks as a result of loans that the Central Bank issued in foreign currency during the last major international financial crisis. These transactions are not included in the cash metric.
The following table sets forth Brazil’s international reserves, according to the international liquidity metric for calculating international reserves.
Table No. 28
International Reserves (International Liquidity Metric)
In Billions of U.S. Dollars
| | | | | | | | | | | | | | | | | | | | |
| | | As of December 31, 2017 | |
| | | 2013 | | | 2014 | | | 2015 | | | 2016 | | | 2017 | |
Total Official Reserves | | | 375.8 | | | | 374.1 | | | | 368.7 | | | | 372.2 | | | | 382.0 | |
D-36
Source: Central Bank
The following table sets forth certain information regarding Brazil’s international reserves, according to the cash metric for calculating international reserves, for each of the years indicated below.
Table No. 29
International Reserves (Cash Metric)
In Millions of U.S. Dollars
| | | | | | | | | | | | | | | | | | | | |
| | | As of December 31, 2017 | |
| | | 2013 | | | 2014 | | | 2015 | | | 2016 | | | 2017 | |
Total Gold and Foreign Exchange | | | 351,621 | | | | 357,391 | | | | 351,132 | | | | 356,361 | | | | 361,661 | |
Gold (1) | | | 2,592 | | | | 2,586 | | | | 2,289 | | | | 2,510 | | | | 2,816 | |
Foreign Exchange | | | 349,029 | | | | 354,805 | | | | 348,844 | | | | 353,851 | | | | 358,846 | |
Special Drawing Rights | | | 3,997 | | | | 3,762 | | | | 3,599 | | | | 3,493 | | | | 3,712 | |
Other Reserve Assets | | | 0 | | | | 2 | | | | 18 | | | | 2,943 | | | | 6,600 | |
Total Official Reserves | | | 358,808 | | | | 363,551 | | | | 356,464 | | | | 365,016 | | | | 373,972 | |
Note: Numbers may not total due to rounding.
| (1) | Includes available financial gold inventory plus time deposits. |
Source: Central Bank
D-37
PUBLIC FINANCE
General
Brazil’s consolidated public sector account includes the accounts of the three tiers of government (federal, state and municipal), the Central Bank and the public Social Security System.
Consolidated Public Sector Fiscal Performance
The primary goals of Federal Government’s fiscal policy are to promote the balanced management of public resources, to ensure the maintenance of economic stability and sustained growth and to be socially equitable. To fulfill its goals, acting in accordance with the monetary, credit and exchange policies, the Federal Government seeks to create the necessary conditions for the gradual decline of Brazil’s Public Sector Net Debt to GDP ratio, the reduction of Brazil’s interest rates and the improvement of Brazil’s public debt profile. Accordingly, every year, a primary balance target is established with the goal of ensuring the economic conditions necessary for the maintenance of sustained growth, which includes the long-term sustainability of public debt. The primary balance targets are fixed in nominal terms.
The budgetary guidelines law for 2017 (the “2017 Budgetary Guidelines”) had originally established a negative primary balance target of R$143.1 billion for the consolidated public sector in 2017. In September 2017, given a decrease in taxable revenues, the 2017 Budgetary Guidelines were amended to allow for a revised primary balance deficit of R$163.1 billion (2.5% of estimated GDP) for the consolidated public sector in 2017. Of this amount, a deficit of (i) R$159.0 billion (2.4% of estimated GDP), corresponded to the Central Government, (ii) R$3.0 billion corresponded to public enterprises and (iii) R$1.1 billion corresponded to the regional governments.
Fiscal Balance
Brazil measures both an overall balance and a primary balance, calculated according to the official statistical guidelines of the IMF. The overall balance is the difference between Brazil’s aggregate revenue (including investments) and total expenditures (including interest costs) in a given period (“Public Sector Borrowing Requirements”). The primary balance is the overall balance excluding nominal interest payments levied on net debt.
The following table sets forth the Public Sector Borrowing Requirements for the five-year period ending on December 31, 2017.
Table No. 30
Public Sector Borrowing Requirements(1)
In Billions of Reais (R$), except percentages(2)
| | | | | | | | | | | | | | | | | | | | | | | | | | | | | | | | | | | | | | | | |
| | | 2013 | | | 2014 | | | 2015 | | | 2016 | | | 2017 | |
| | | R$ | | | | | | R$ | | | | | | R$ | | | | | | R$ | | | | | | R$ | | | | |
Overall | | | 157.5 | | | | 3.0 | % | | | 343.9 | | | | 6.0 | % | | | 613.0 | | | | 10.2 | % | | | 562.8 | | | | 9.0 | % | | | 511.4 | | | | 7.8 | % |
Central Government | | | 110.6 | | | | 2.1 | % | | | 271.5 | | | | 4.7 | % | | | 513.9 | | | | 8.6 | % | | | 477.8 | | | | 7.6 | % | | | 459.3 | | | | 7.0 | % |
Federal Government (3) | | | 141.3 | | | | 2.6 | % | | | 294.2 | | | | 5.1 | % | | | 544.2 | | | | 9.1 | % | | | 481.7 | | | | 7.7 | % | | | 503.9 | | | | 7.7 | % |
Central Bank | | | -30.7 | | | | -0.6 | % | | | -22.7 | | | | -0.4 | % | | | -30.3 | | | | -0.5 | % | | | -3.9 | | | | -0.1 | % | | | -44.5 | | | | -0.7 | % |
Regional Governments | | | 44.0 | | | | 0.8 | % | | | 64.7 | | | | 1.1 | % | | | 89.1 | | | | 1.5 | % | | | 78.4 | | | | 1.3 | % | | | 46.8 | | | | 0.7 | % |
Public Enterprises (4) | | | 3.0 | | | | 0.1 | % | | | 7.7 | | | | 0.1 | % | | | 10.0 | | | | 0.2 | % | | | 6.6 | | | | 0.1 | % | | | 5.2 | | | | 0.1 | % |
Nominal Interest | | | 248.9 | | | | 4.7 | % | | | 311.4 | | | | 5.4 | % | | | 501.8 | | | | 8.4 | % | | | 407.0 | | | | 6.5 | % | | | 400.8 | | | | 6.1 | % |
Central Government | | | 185.8 | | | | 3.5 | % | | | 251.1 | | | | 4.3 | % | | | 397.2 | | | | 6.6 | % | | | 318.4 | | | | 5.1 | % | | | 340.9 | | | | 5.2 | % |
Federal Government (3) | | | 217.9 | | | | 4.1 | % | | | 273.9 | | | | 4.7 | % | | | 428.2 | | | | 7.1 | % | | | 323.2 | | | | 5.2 | % | | | 386.2 | | | | 5.9 | % |
Central Bank | | | -32.0 | | | | -0.6 | % | | | -22.8 | | | | -0.4 | % | | | -31.0 | | | | -0.5 | % | | | -4.9 | | | | -0.1 | % | | | -45.3 | | | | -0.7 | % |
Regional Governments | | | 60.3 | | | | 1.1 | % | | | 56.9 | | | | 1.0 | % | | | 98.8 | | | | 1.6 | % | | | 83.1 | | | | 1.3 | % | | | 54.3 | | | | 0.8 | % |
Public Enterprises (4) | | | 2.7 | | | | 0.1 | % | | | 3.4 | | | | 0.1 | % | | | 5.8 | | | | 0.1 | % | | | 5.6 | | | | 0.1 | % | | | 5.6 | | | | 0.1 | % |
Primary | | | -91.3 | | | | -1.7 | % | | | 32.5 | | | | 0.6 | % | | | 111.2 | | | | 1.9 | % | | | 155.8 | | | | 2.5 | % | | | 110.6 | | | | 1.7 | % |
Central Government | | | -75.3 | | | | -1.4 | % | | | 20.5 | | | | 0.4 | % | | | 116.7 | | | | 1.9 | % | | | 159.5 | | | | 2.5 | % | | | 118.4 | | | | 1.8 | % |
Federal Government | | | -126.5 | | | | -2.4 | % | | | -36.3 | | | | -0.6 | % | | | 30.1 | | | | 0.5 | % | | | 8.8 | | | | 0.1 | % | | | -64.8 | | | | -1.0 | % |
Central Bank | | | 1.3 | | | | 0.0 | % | | | 0.1 | | | | 0.0 | % | | | 0.7 | | | | 0.0 | % | | | 1.0 | | | | 0.0 | % | | | 0.8 | | | | 0.0 | % |
Social Security | | | 49.9 | | | | 0.9 | % | | | 56.7 | | | | 1.0 | % | | | 85.8 | | | | 1.4 | % | | | 149.7 | | | | 2.4 | % | | | 182.4 | | | | 2.8 | % |
Regional Governments | | | -16.3 | | | | -0.3 | % | | | 7.8 | | | | 0.1 | % | | | -9.7 | | | | -0.2 | % | | | -4.7 | | | | -0.1 | % | | | -7.5 | | | | -0.1 | % |
Public Enterprises (4) | | | 0.3 | | | | 0.0 | % | | | 4.3 | | | | 0.1 | % | | | 4.3 | | | | 0.1 | % | | | 1.0 | | | | 0.0 | % | | | -0.4 | | | | 0.0 | % |
GDP | | | 5,331.6 | | | | — | | | | 5,779.0 | | | | — | | | | 5,995.8 | | | | — | | | | 6,259.2 | | | | — | | | | 6,559.9 | | | | — | |
D-38
Note: Numbers may not total due to rounding.
| (1) | Calculated using the “below the line” financial method, with respect to changes in public sector’s total net debt (domestic or external). Surpluses are represented by negative numbers and deficits are represented by positive numbers. |
| (3) | Includes Social Security System. |
| (4) | Excludes Petrobras and Eletrobras. |
Source: Central Bank
Ceiling on Public Spending
In December 2016, the Federal Government established a ceiling on public spending for twenty fiscal years. This ceiling limits spending to the expenses incurred the prior year, adjusted for inflation. Noncompliance with the ceiling triggers limitations on government spending, including staff promotions, hiring or contracting additional debt.
Budget Process
The Constitution guarantees the funding of three types of government expenditures: revenue-sharing with states and municipalities; salaries and pensions for government employees; and repayment of public debt.
The Constitution requires that three laws be passed as part of the budget process: the Multi-Year Plan (Plano Plurianual), the Budgetary Guidelines (Lei de Diretrizes Orçamentárias) and the Annual Budget (Lei Orçamentária Anual). The budget processes at the state and municipal levels are substantially similar.
Multi-Year Plan
The Multi-Year Plan sets government priorities for a four-year period and must contain the Federal Government’s expenditure goals. The Multi-Year Plan is initiated by the executive branch and coordinated by the Secretariat of Planning and Strategic Investments (Secretaria de Planejamento e Investimento Estratégico or “SPI”). The Multi-Year Plan proposal must be submitted to the National Congress by August 31 of the first year of a presidential term. It becomes effective in the second year of the presidential term and expires in the first year of the next presidential term.
The Multi-Year Plan for the years 2016 through 2019 suggested an investment of over R$8.2 trillion. The financing of this investment would come from the Annual Budget, the state-owned enterprises investment budget and other sources of funds such as tax waivers, global expenditure plans, government credit agencies and public-private partnerships.
Budgetary Guidelines
The Budgetary Guidelines set the macroeconomic and fiscal targets for the Federal Government and non-financial enterprises. Additionally, the Budgetary Guidelines include historical data about how the budget was executed in the preceding two fiscal years and projections for the following two years.
The Budgetary Guidelines are initiated by the National Treasury of the Ministry of Finance, the SOF and the SPI, and then sent to the President for potential revisions. The proposal must be submitted to the National Congress by April 15 of each year. The National Congress may approve the proposal or alter any item before the Budgetary Guidelines must be submitted to the President by July 17 of each year. The President may veto any provision, but the National Congress may override the Presidential veto by a two-thirds majority vote.
Annual Budget
The Budgetary Guidelines provide a basis for preparing the Annual Budget. After conferral with each ministry, the SOF finalizes a federal budget proposal and submits it to the President, who may revise the proposal. The President must submit the Annual Budget proposal to the National Congress by August 31 of each year. By December 22 of each year, the National Congress must submit to the President its approved budget. It may propose revisions but may not alter items relating to the payment of external debt incurred by the Federal Government. The President is granted fifteen days to review and sign the budget, and the approved Annual Budget becomes effective as of January 1st of the following year. The presidential veto process mirrors the veto process for the Budgetary Guidelines.
The President must implement a budget implementation decree (Decreto de Programação Orçamentário-Financeiro) within 30 days of National Congress’ enactment of the annual budget. The implementation decree provides a monthly schedule of revenues and expenditures, which can be subsequently revised every two months in light of actual revenues. Within 30 days after the end of each two-month period, the Federal Government publishes a summary report of the budget execution and an evaluation report on revenues and expenditures. If the Federal Government finds that certain budgeted amounts may prevent achievement of the primary balance target, it will limit expenditures accordingly.
D-39
Petrobras and Eletrobras
Petrobras, the state-controlled oil company, which historically accounted for approximately 0.5% of the primary balance of the federal budget in nominal terms, was removed from the calculation of the primary balance beginning in 2009. Eletrobras, the state-controlled electricity holding company, which historically accounted for approximately 0.2% of the primary balance of the federal budget in nominal terms, was also removed from the calculation of the primary balance in 2010. Petrobras and Eletrobras were removed to avoid distortions in the companies’ management decisions.
2018 Budget
For information on the budget for 2018, please refer to “2018 Budget” in the “Recent Developments” section.
Federal Government Programs
Growth Acceleration Program (“PAC”)
The PAC is responsible for the management, implementation and monitoring of projects across the country and, therefore, is essential for the implementation of public policies.
Despite the economic adjustments that occurred in 2017, the program maintained a satisfactory pace of performance: as of December 31, 2017, an aggregate of R$547.5 billion in projects had been completed, representing 87.1% of the projects to be completed in the period between 2015 and 2018.
Investment Partnership Program — Projeto Crescer
The Investment Partnership Program (Programa de Parcerias para Investimentos or “PPI”) executes high priority infrastructure projects, whereby partnerships between the Federal Government and private investors and operators are fostered. Under the PPI, private investors are responsible for funding at least 20% of each project, with the remaining funds coming from certain loans and debt issuances.
In 2017, seventy projects were awarded to private operators, totalling R$28 billion in revenues and R$142 billion in investments in the infrastructure sector over the next decades. Around seventy-five additional projects are expected to be awarded in 2018.
Taxation and Revenue Sharing Systems
The Federal Government collects taxes on personal and corporate income, industrial products (through the Imposto sobre Produtos Industrializados or “IPI”), rural property (through the Imposto sobre a Propriedade Territorial Rural or “ITR”), financial transactions (through the IOF), Social Security and import and export tariffs. States and the Federal District collect taxes on motor vehicles, circulation of goods and services, and transfers of property rights while municipalities collect taxes on urban property, services, and transfers of property rights.
The gross tax burden in 2016 was 32.4% of GDP, as compared to 32.1% of GDP in 2015. The total amount of tax revenue collected in 2016 was R$2,027.0billion. Of this amount, 68.3% was collected by the Federal Government, 25.4% was collected by the states and 6.4% was collected by municipalities. Taxes in 2016 were derived mainly from the Tax on the Circulation of Goods and Transportation and Communication Services (Imposto sobre Operações relativas à Circulação de Mercadorias e sobre Prestações de Serviços de Transporte Interestadual e Intermunicipal e de Comunicação or “ICMS”) (20.4%), the Federal Income Tax (Imposto de Renda or “Income Tax”) (19.1%), Social Security tax (Instituto Nacional da Seguridade Social or “Social Security”) (16.5%) and the Contribution for the Financing of Social Security (Contribuição para Financiamento da Seguridade Social or “COFINS”) (9.9%).
Income Tax
Brazil’s individual Income Tax rates for 2017 are progressive and are at the following rates: 0%, 7.5%, 15%, 22.5% and 27.5%. The minimum taxable annual income is currently R$22,847.76. Brazil offers only a limited number of tax deductions.
For corporate and other legal entities, the basic tax rate is 15%. The surtax on taxable net income exceeding R$20,000 is 10%. The tax related to social welfare (Contribuição Social Sobre o Lucro Líquido or “CSLL”) levied on net profit is 9% with respect to business entities in general. For financial institutions, CSLL levied on net profit was raised from 15% to 20% for the period beginning on September 1, 2015 and ending on December 31, 2018. Thereafter, the CSLL rate for financial institutions will be 15%. For credit cooperatives, CSLL levied on net profit was raised from 15% to 17% for the period beginning on September 1, 2015 and ending on December 31, 2018. Thereafter, the CSLL rate for credit cooperatives will be 15%.
D-40
For financial transactions on the fixed and variable income market, the income tax rates for Brazilian citizens are progressive at the following rates: 15% for investments with terms longer than 720 days; 17.5% for investments with terms of up to 720 days; 20% for investments with terms of up to 360 days and 22.5% for investments with terms of up to 180 days.
Tax treatment of non-resident investors in Brazilian financial and capital investments differs depending on the origin of the funds. Investors from countries that do not have “favored taxation” status will have the right to Brazilian tax benefits, provided they fulfill the conditions established by the regulations of the Monetary National Council. Income tax in these cases follows specific rules and income tax rates range from 0% to 15%. In the case of investments from countries that are not subject to an income tax of 20% or more, the above-mentioned tax benefits do not apply. Instead, such investments are subject to the same rules governing domestic investors.
Simples Nacional
Small companies are eligible to participate in Simples Nacional, which enables them to pay a single unified tax based on their level of gross revenues, rather than paying several different taxes. The Simples Nacional, became effective on July 1, 2007 and merged six different Federal taxes (Corporate Income Tax, IPI, CSLL, COFINS, PIS and Social Security), one state tax (ICMS) and one municipal tax (Imposto Sobre Serviço or “ISS”).
Revenue Sharing
The Federal Government is required by the Constitution to transfer 49% of the proceeds from the IPI and Corporate Income Tax as follows: (i) 21.5% to the states and Federal District Participation Funds; (ii) 24.5% to the municipalities participation funds; and (iii) 3% to the financing programs for the productive sectors in the North, Northeast and Central West Regions. The Federal Government must also transfer 10% of the proceeds of the IPI to the states and Federal District, pro rata, according to their respective exports of manufactured products.
The Constitution also mandates the sharing with states and municipalities of certain other types of taxes collected by the Federal Government, such as automobile property taxes or the ITR. Likewise, states must share revenue from certain taxes with municipalities. In addition, all of the revenues derived from IOF levied on transactions in gold as a financial asset are allocated among municipalities (70%) and the state, Federal District or federal territory of origin (30%).
Required Investment in Education and Health
The Federal Government must dedicate at least 18% of annual tax revenues to education. States, municipalities and the Federal District must invest at least 25% of their annual tax revenues in education.
The Federal Government must allocate at least the same amount to public health investments and services as it did in the previous fiscal year. It is also required to increase funding for public health by an amount corresponding to the difference between the GDP in the prior year and the projected GDP for the new fiscal year. States and the Federal District must contribute at least 12% of their annual revenues to health investments. Municipalities must contribute at least 15% of their annual revenues to health investments. For as long as the current ceiling on public spending is in place, the minimum limits of investment in education and health will be increased by the inflation of the previous year.
All of the above described required investments in health and education have been successfully made in 2017.
Sovereign Fund
In December 2008, the public sector primary balance surpassed the target and the Federal Government used part of the surplus to capitalize the FSB. In May 2016, the Federal Government announced the winding down of the FSB, to be conducted over the coming years according to market conditions, aiming at maximizing revenue.
As of December 31, 2017, the shares held by the FSB were valued at R$3.7 billion.
Fiscal Responsibility Law
The Fiscal Responsibility Law (enacted in 2000) establishes a comprehensive framework intended to prevent fiscal imbalances. The law applies to each level of government, as well as to government-controlled funds, semi-autonomous entities and state-owned enterprises.
The Fiscal Responsibility Law requires bi-monthly evaluations of fiscal targets, with non-compliance triggering automatic cuts in expenditure authorizations. Increases in expenditures must be accompanied by estimates of their budgetary and financial impact, a declaration of compliance with the multi-year plan, budgetary guidelines and annual budget, and a description of the means through which the expenditures will be financed. Tax exemptions must also be accompanied by estimates of their budgetary and financial impact. Personnel expenditures are limited as a percentage of net current revenues to 50% for the Federal Government, 60% for the states and 60% for municipalities.
D-41
Exceptions to the Fiscal Responsibility Law are severely limited. Limits on public sector debt and on borrowing are subject to review by the President in the case of economic instability or monetary and foreign exchange shocks. Deadlines to reestablish equilibrium will be extended in the case of shortfalls in economic growth. In case of an officially recognized state of emergency, the limits will be temporarily suspended.
A Senate resolution passed in 2001 defined the global limits for the consolidated net indebtedness of states and municipalities. Specifically, a state’s debt cannot be higher than 200% of its net current revenue and a municipality’s debt cannot exceed 120% of its net current revenue.
Fiscal Crime Law
The Fiscal Crime Law (Lei de Crimes Fiscais), also enacted in 2000 to complement the Fiscal Responsibility Law, amended Brazil’s Penal Code and certain other laws to provide penalties for borrowing in excess of authorized limits, ordering expenditures not authorized by law and administrative infractions concerning public finance laws.
D-42
PUBLIC DEBT
General
Public debt in Brazil is regulated by the Fiscal Responsibility Law and other laws issued by the Federal Government, which provide the structural framework for public finance and debt management in Brazil. The Annual Budget, adopted in accordance with the Budgetary Guidelines, provides additional regulations for the applicable fiscal year.
The Constitution grants the Senate broad powers to regulate public debt. All external financial transactions of the Federal Government, the states, the Federal District and municipalities are required to be authorized by the Senate, which also sets global limits for the amount of consolidated public debt and debt securities of the Federal District, the states and municipalities, in addition to limits for domestic and external loans and guarantees by the Republic. The Constitution also empowers the Senate to provide terms and conditions of internal and external financial transactions of the Federal Government, among others. State constitutions and municipal constitutions (lei orgânica municipal) set public debt limits at the regional level and authorize legislative branches at various levels of government to further limit public debt.
The Ministry of Finance has overall responsibility to manage the Federal Government’s domestic and external public debt through the National Treasury, which manages securities operations and issues rules governing the auction of public securities. Pursuant to the Fiscal Responsibility Law, the Ministry of Finance is required to verify compliance of all public loan facilities with their terms and conditions.
The National Treasury is the sole issuer of public bonds in Brazil and is authorized, under a program issued by the Senate, to issue an aggregate of US$75 billion in foreign debt securities or liability management transactions such as repurchases, exchanges and financial derivatives, the proceeds of which are used solely for payment of the National Treasury’s federal public debt. In addition, the Central Bank, which is prohibited from issuing public bonds under the terms of the Fiscal Responsibility Law, buys and sells federal public debt securities on the secondary market using National Treasury bonds as collateral, exclusively for the purpose of conducting monetary policy.
Public Debt Indicators
There are three principal indicators of public debt reported in Brazil: (i) General Government Gross Debt, published by the Central Bank; (ii) Public Sector Net Debt, also published by the Central Bank; and (iii) Federal Public Debt, published by the National Treasury.
The overall public sector account balance reached 7.8% of GDP in 2017, with interest on debt corresponding to 6.1% of GDP.
Public Sector Net Debt
Public Sector Net Debt includes domestic and external debt incurred by (i) the Federal Government (including the Central Bank), (ii) state and municipal governments, and (iii) non-financial state-owned enterprises (excluding Petrobras and Eletrobras), each net of international reserves. The Brazilian government relies on Public Sector Net Debt as the principal measure of indebtedness used to make economic policy decisions, as it most closely reflects the status of public sector indebtedness and the Federal Government’s fiscal policies.
General Government Gross Debt
General Government Gross Debt, the majority of which is comprised of domestic debt, includes debt incurred by the Federal Government and state and municipal governments, whether owed to the private sector or to the financial public sector. This category excludes debt incurred by state-owned enterprises and the Central Bank (other than open-market transactions in the financial sector). General Government Gross Debt also excludes liabilities owed by any governmental entity to another entity whose liabilities are otherwise included in GGGD. As a result, debt represented by public securities held by agencies, federal public funds and other federal entities are disregarded.
In 2017, domestic debt constituted 95.3% of General Government Gross Debt. During 2017, the international investment position of the consolidated public sector decreased mainly due to the appreciation of the Real against the U.S. Dollar: in 2017, net external assets were R$1,010.2 billion (15.4% of GDP), as compared to R$964.1 billion (15.4% of GDP) in 2016.
D-43
The following table sets forth Public Sector Net Debt and General Government Gross Debt for each of the periods indicated below.
Table No. 31
Public Sector Debt
In Billions of Reais (R$), except percentages(1)
| | | | | | | | | | | | | | | | | | | | | | | | | | | | | | | | | | | | | | | | |
| | | 2013 | | | 2014 | | | 2015 | | | 2016 | | | 2017 | |
Net Public Sector Debt (A) where (A= B+K+L) | | | 1,626.3 | | | | 30.5 | % | | | 1,883.1 | | | | 32.6 | % | | | 2,136.9 | | | | 35.6 | % | | | 2,892.9 | | | | 46.2 | % | | | 3,382.9 | | | | 51.6 | % |
Net General Government Debt
(B) where (B=C+F+I+J) | | | 1,660.2 | | | | 31.1 | % | | | 1,915.8 | | | | 33.2 | % | | | 2,272.2 | | | | 37.9 | % | | | 2,995.0 | | | | 47.8 | % | | | 3,505.4 | | | | 53.4 | % |
Gross General Government
Debt (2) (C) where (C=D+E) | | | 2,748.0 | | | | 51.5 | % | | | 3,252.4 | | | | 56.3 | % | | | 3,927.5 | | | | 65.5 | % | | | 4,378.5 | | | | 70.0 | % | | | 4,854.7 | | | | 74.0 | % |
Domestic Debt (D) | | | 2,598.3 | | | | 48.7 | % | | | 3,063.2 | | | | 53.0 | % | | | 3,665.1 | | | | 61.1 | % | | | 4,150.3 | | | | 66.3 | % | | | 4,626.5 | | | | 70.5 | % |
Debt Securities Held by the Public (3) | | | 1,990.1 | | | | 37.3 | % | | | 2,141.1 | | | | 37.0 | % | | | 2,609.1 | | | | 43.5 | % | | | 2,943.6 | | | | 47.0 | % | | | 3,388.6 | | | | 51.7 | % |
Central Bank Repo Operations(4) | | | 528.7 | | | | 9.9 | % | | | 809.1 | | | | 14.0 | % | | | 913.3 | | | | 15.2 | % | | | 1,047.5 | | | | 16.7 | % | | | 1,065.0 | | | | 16.2 | % |
Other Debts | | | 79.5 | | | | 1.5 | % | | | 113.0 | | | | 2.0 | % | | | 142.7 | | | | 2.4 | % | | | 159.3 | | | | 2.5 | % | | | 172.9 | | | | 2.6 | % |
External Debt (E) | | | 149.7 | | | | 2.8 | % | | | 189.3 | | | | 3.3 | % | | | 262.4 | | | | 4.4 | % | | | 228.1 | | | | 3.6 | % | | | 228.2 | | | | 3.5 | % |
Federal Government | | | 90.1 | | | | 1.7 | % | | | 107.0 | | | | 1.9 | % | | | 136.5 | | | | 2.3 | % | | | 119.8 | | | | 1.9 | % | | | 115.4 | | | | 1.8 | % |
States Government | | | 52.6 | | | | 1.0 | % | | | 74.2 | | | | 1.3 | % | | | 113.7 | | | | 1.9 | % | | | 97.6 | | | | 1.6 | % | | | 101.6 | | | | 1.5 | % |
Municipal Governments | | | 7.0 | | | | 0.1 | % | | | 8.2 | | | | 0.1 | % | | | 12.1 | | | | 0.2 | % | | | 10.7 | | | | 0.2 | % | | | 11.2 | | | | 0.2 | % |
Asset of General Government (F) where (F=G+H) | | | -1,512.2 | | | | -28.4 | % | | | -1,579.9 | | | | -27.3 | % | | | -1,917.6 | | | | -32.0 | % | | | -2,014.8 | | | | -32.2 | % | | | -2,052.5 | | | | -31.3 | % |
Domestic Assets (G) | | | -1,511.7 | | | | -28.4 | % | | | -1,579.5 | | | | -27.3 | % | | | -1,917.5 | | | | -32.0 | % | | | -2,014.7 | | | | -32.2 | % | | | -2,052.4 | | | | -31.3 | % |
Of federal Government in Central Bank | | | -656.0 | | | | -12.3 | % | | | -605.9 | | | | -10.5 | % | | | -881.9 | | | | -14.7 | % | | | -1,039.8 | | | | -16.6 | % | | | -1,079.7 | | | | -16.5 | % |
Credits with Official Financial Institutions(5) | | | -466.9 | | | | -8.8 | % | | | -545.6 | | | | -9.4 | % | | | -567.4 | | | | -9.5 | % | | | -476.6 | | | | -7.6 | % | | | -450.9 | | | | -6.9 | % |
Worker Assistance Fund (FAT) | | | -183.7 | | | | -3.4 | % | | | -202.2 | | | | -3.5 | % | | | -226.7 | | | | -3.8 | % | | | -239.5 | | | | -3.8 | % | | | -255.4 | | | | -3.9 | % |
Other Assets | | | -205.2 | | | | -3.8 | % | | | -225.8 | | | | -3.9 | % | | | -241.5 | | | | -4.0 | % | | | -258.8 | | | | -4.1 | % | | | -266.4 | | | | -4.1 | % |
External Assets (H) | | | -0.5 | | | | 0.0 | % | | | -0.4 | | | | 0.0 | % | | | -0.1 | | | | 0.0 | % | | | -0.1 | | | | 0.0 | % | | | -0.1 | | | | 0.0 | % |
Central Bank non-earmarked portfolio (I) (6 | | | 429.4 | | | | 8.1 | % | | | 308.4 | | | | 5.3 | % | | | 373.2 | | | | 6.2 | % | | | 475.4 | | | | 7.6 | % | | | 594.5 | | | | 9.1 | % |
Exchange Equalization (J) (7) | | | -4.9 | | | | -0.1 | % | | | -65.2 | | | | -1.1 | % | | | -110.9 | | | | -1.9 | % | | | 155.9 | | | | 2.5 | % | | | 108.8 | | | | 1.7 | % |
Central Bank Net Debt (K) | | | -65.0 | | | | -1.2 | % | | | -72.0 | | | | -1.2 | % | | | -187.6 | | | | -3.1 | % | | | -157.3 | | | | -2.5 | % | | | -181.8 | | | | -2.8 | % |
Debt | | | 1,746.6 | | | | 32.8 | % | | | 1,961.4 | | | | 33.9 | % | | | 2,387.4 | | | | 39.8 | % | | | 2,726.5 | | | | 43.6 | % | | | 2,840.7 | | | | 43.3 | % |
Monetary Base | | | 249.5 | | | | 4.7 | % | | | 263.5 | | | | 4.6 | % | | | 255.3 | | | | 4.3 | % | | | 270.3 | | | | 4.3 | % | | | 296.8 | | | | 4.5 | % |
Repo Operations | | | 528.7 | | | | 9.9 | % | | | 809.1 | | | | 14.0 | % | | | 913.3 | | | | 15.2 | % | | | 1,047.5 | | | | 16.7 | % | | | 1,065.0 | | | | 16.2 | % |
Commercial Bank Deposits | | | 312.4 | | | | 5.9 | % | | | 282.9 | | | | 4.9 | % | | | 336.9 | | | | 5.6 | % | | | 368.9 | | | | 5.9 | % | | | 399.3 | | | | 6.1 | % |
National Treasury Operating Account | | | 656.0 | | | | 12.3 | % | | | 605.9 | | | | 10.5 | % | | | 881.9 | | | | 14.7 | % | | | 1,039.8 | | | | 16.6 | % | | | 1,079.7 | | | | 16.5 | % |
Assets | | | -1,811.6 | | | | -34.0 | % | | | -2,033.5 | | | | -35.2 | % | | | -2,575.1 | | | | -42.9 | % | | | -2,883.8 | | | | -46.1 | % | | | -3,022.6 | | | | -46.1 | % |
Federal Securities in Central Bank | | | -958.1 | | | | -18.0 | % | | | -1,117.4 | | | | -19.3 | % | | | -1,286.5 | | | | -21.5 | % | | | -1,522.8 | | | | -24.3 | % | | | -1,659.5 | | | | -25.3 | % |
External Assets | | | -869.5 | | | | -16.3 | % | | | -982.0 | | | | -17.0 | % | | | -1,423.6 | | | | -23.7 | % | | | -1,199.9 | | | | -19.2 | % | | | -1,249.4 | | | | -19.0 | % |
Other Assets | | | 16.0 | | | | 0.3 | % | | | 65.9 | | | | 1.1 | % | | | 135.1 | | | | 2.3 | % | | | -161.1 | | | | -2.6 | % | | | -113.7 | | | | -1.7 | % |
State-owned Enterprises Net Debt (L)(8) | | | 31.2 | | | | 0.6 | % | | | 39.4 | | | | 0.7 | % | | | 52.3 | | | | 0.9 | % | | | 55.3 | | | | 0.9 | % | | | 59.4 | | | | 0.9 | % |
Domestic Debt | | | 42.0 | | | | 0.8 | % | | | 46.7 | | | | 0.8 | % | | | 53.4 | | | | 0.9 | % | | | 58.7 | | | | 0.9 | % | | | 58.3 | | | | 0.9 | % |
Domestic Assets | | | -16.5 | | | | -0.3 | % | | | -13.9 | | | | -0.2 | % | | | -10.2 | | | | -0.2 | % | | | -11.2 | | | | -0.2 | % | | | -10.0 | | | | -0.2 | % |
Net external Debt | | | 5.7 | | | | 0.1 | % | | | 6.7 | | | | 0.1 | % | | | 9.1 | | | | 0.2 | % | | | 7.8 | | | | 0.1 | % | | | 11.2 | | | | 0.2 | % |
GDP (10) | | | 5,331.6 | | | | — | | | | 5,779.0 | | | | — | | | | 5,995.8 | | | | — | | | | 6,259.2 | | | | — | | | | 6,559.9 | | | | — | |
Note: Numbers may not total due to rounding.
| (2) | Excludes Federal Public Debt (“FPD”) securities in the Central Bank and includes Central Bank repo operations. |
| (3) | Includes FPD held by the National Treasury as well as other securitized credits. Excludes investments within and among government levels and any securities under the Exports Guarantee. |
| (4) | Includes repo operations carried out in the extra-market segment. |
| (5) | Includes credits granted to BNDES. |
| (6) | Share of FPD securities available for sale equals the difference between the FPD securities held by the Central Bank and outstanding repo operations. |
| (7) | Equalization of the financial result of exchange reserves operations and foreign exchange derivatives operations carried out by the Central Bank. |
| (8) | Excludes Petrobras and Eletrobras. |
| (9) | Accumulated GDP in the previous twelve months, in current prices. |
D-44
Source: Central Bank
Federal Public Debt
Federal Public Debt measures domestic and external debt incurred by the Federal Government only. It is comprised of (i) domestic federal public debt (Dívida Pública Federal Doméstica or “DFPD”), issued in local currency and (ii) external federal public debt (Dívida Pública Federal Externa or “EFPD”), issued in foreign currency.
The following table sets forth Federal Public Debt for each of the periods indicated below.
Table No. 32
Federal Public Debt Indicators (1)
| | | | | | | | | | | | | | | | | | | | |
| | | As of December 31, | |
| | | 2013 | | | 2014 | | | 2015 | | | 2016 | | | 2017 | |
FPD Outstanding (R$ billion) | | | 2,122.8 | | | | 2,295.9 | | | | 2,793.0 | | | | 3,112.9 | | | | 3,559.3 | |
Domestic | | | 2,028.1 | | | | 2,183.6 | | | | 2,650.2 | | | | 2,986.4 | | | | 3,435.5 | |
External | | | 94.7 | | | | 112.3 | | | | 142.8 | | | | 126.5 | | | | 123.8 | |
FPD Outstanding (% of GDP) | | | | | | | | | | | | | | | | | | | | |
Domestic | | | 38.0 | % | | | 37.8 | % | | | 44.2 | % | | | 47.7 | % | | | 52.4 | % |
External | | | 1.8 | % | | | 1.9 | % | | | 2.4 | % | | | 2.0 | % | | | 1.9 | % |
FPD profile (%) | | | | | | | | | | | | | | | | | | | | |
Fixed Rate | | | 42.0 | % | | | 41.6 | % | | | 39.4 | % | | | 35.7 | % | | | 35.3 | % |
Inflation Linked | | | 34.5 | % | | | 34.9 | % | | | 32.5 | % | | | 31.8 | % | | | 29.6 | % |
Floating Rate | | | 19.1 | % | | | 18.7 | % | | | 22.8 | % | | | 28.2 | % | | | 31.5 | % |
Exchange Rate | | | 4.3 | % | | | 4.9 | % | | | 5.3 | % | | | 4.2 | % | | | 3.6 | % |
FPD Maturity Structure: | | | | | | | | | | | | | | | | | | | | |
Average Maturity (years) | | | 4.2 | | | | 4.4 | | | | 4.6 | | | | 4.5 | | | | 4.3 | |
Average Life (years) | | | 6.3 | | | | 6.6 | | | | 6.6 | | | | 6.4 | | | | 5.9 | |
Percentage Maturing in 12 months (%) | | | 24.8 | % | | | 24.0 | % | | | 21.6 | % | | | 16.8 | % | | | 16.9 | % |
GDP (R$ billion) | | | 5,331.6 | | | | 5,779.0 | | | | 5,995.8 | | | | 6,259.2 | | | | 6,559.9 | |
Note: Numbers may not total due to rounding.
| (1) | Includes National Treasury’s domestic and external debt. |
Source: Ministry of Finance/National Treasury
Public Debt Management
In managing the Federal Public Debt, the National Treasury seeks to meet the Public Sector Borrowing Requirements at the lowest possible long-term financing cost, while maintaining adequate risk levels. Since 2001, it has published a Federal Public Debt Annual Borrowing Plan (Plano Annual de Financiamento or “Annual Borrowing Plan”), including guidelines for managing Federal Public Debt, such as (i) gradually replacing floating rate bonds with fixed rate or inflation-linked instruments; (ii) consolidating the share of exchange rate-linked instruments of outstanding debt, in accordance with long-term limits; (iii) relaxing the maturity structure, with special attention to short-term debt; (iv) increasing the average maturity of the outstanding debt; (v) developing the yield curve in both domestic and external markets (i.e., to issue benchmark bonds in the internal and external markets to provide price references to markets and enhance liquidity in the primary and secondary markets); (vi) increasing the liquidity of federal public securities on the secondary market; (vii) broadening the investor base; and (viii) improving the External Federal Public Debt profile through issuances of benchmark securities, buybacks and structured operations.
The 2017 Annual Borrowing Plan (“2017 Annual Borrowing Plan” or “ABP 2017”) focused on continuing the replacement of fixed-rate and inflation-linked securities with floating-rate ones. The following table presents the results for Federal Public Debt indicators compared against the limits set forth in the 2017 Annual Borrowing Plan.
D-45
Table No. 33
Federal Public Debt Results and Annual Borrowing Plan 2017
| | | | | | | | | | | | |
| | | As of December 31, | | | Limits for 2017 | |
| | | 2017 | | | Minimum | | | Maximum | |
Stock of FPD (R$ Billion) | | | | | | | | | | | | |
FPD | | R$ | 3,559.3 | | | R$ | 3,450.0 | | | R$ | 3,650.0 | |
Composition | | | | | | | | | | | | |
Fixed Rate | | | 35.3 | % | | | 32.0 | % | | | 36.0 | % |
Inflation Linked | | | 29.6 | % | | | 29.0 | % | | | 33.0 | % |
Floating Rate | | | 31.5 | % | | | 29.0 | % | | | 33.0 | % |
Exchange Rate | | | 3.6 | % | | | 3.0 | % | | | 7.0 | % |
Maturity Profile | | | | | | | | | | | | |
Average Maturity (years) | | | 4.3 | | | | 4.2 | | | | 4.4 | |
% Maturing in 12 months | | | 16.9 | % | | | 16.0 | % | | | 19.0 | % |
Note: Numbers may not total due to rounding.
Source: National Treasury
Golden Rule
The Golden Rule is a fiscal rule used widely in the public finance context that only allows debt issuances to finance capital spending, and not current expenses. The purpose of this rule is to prevent future generations from carrying the financial burden of current ones.
The Golden Rule is provided for in the Constitution, including the prerogative of the Federal Government to request the opening of additional or special credits in exceptional circumstances, in each case to be approved by a qualified majority in National Congress. In addition, the noncompliance with the Golden Rule may be considered a crime of responsibility by the President.
The Golden Rule has historically been fulfilled by the Federal Government. In 2017, however, in order to comply with the Golden Rule, the Federal Government had to use extraordinary revenues, particularly the R$50 billion BNDES Early Re-payment. For additional information on this topic, please refer to “Golden Rule” in the “Recent Developments” section.
Internal Public Debt
Internal Public Debt Policy
The National Treasury monitors market conditions with the goal of ensuring the proper functioning of the Federal Government bond market. During periods of high volatility in the financial markets, the National Treasury may conduct offerings to purchase government debt securities in order to stabilize the market, including through auction processes.
In May 2017, given particularly volatile market conditions, the National Treasury (i) cancelled a number of scheduled treasury debt auctions and (ii) conducted a number of non-scheduled, extraordinary treasury debt auctions, which resulted in net early debt redemptions of approximately R$2.1 billion.
Internal Public Debt Levels
In 2017, issuances were at R$720.6 billion and redemptions were at R$585.8 billion, leading to net issuances at R$134.8 billion. As a result, domestic debt outstanding increased 15.0% from R$2,986.4 billion in December 2016 to R$3,435.5 billion in December 2017, primarily due to a positive interest earned through appropriations in the amount of R$315.1 billion.
In accordance with the fiscal consolidation program promoted by the Federal Government, new BNDES Early Re-payments were negotiated in 2017. BNDES made an early repayment in the amount of R$50 billion in two instalments, one in September and one in October. The September R$33 billion instalment was comprised of (i) R$17.9 billion in cash and (ii) R$15.1 billion in debt securities, while the R$17 billion October instalment was fully paid in cash. The total amount of R$50 billion represented 10.8% of the R$462.5 billion owed by BNDES to the National Treasury. In line with what had been done in 2016, the National Treasury used the proceeds of the BNDES Early Re-payments exclusively for public debt relief. For additional information on this topic, please refer to “BNDES Early Re-Payments” in the “Recent Developments” section.
D-46
The aggregate amount of federal domestic securities debt held by the Central Bank increased from R$958.1 billion (18.0% of GDP) in 2013 to R$1,659.5 billion (25.3% of GDP) in 2017. A significant portion of this portfolio was used as collateral in Central Bank repurchase operations, amounting to R$1,065.0 billion (16.2% of GDP) in 2017. For more information, refer to Monetary Policy and Money Supply” in the “The Financial System” section.
External Public Debt
External Public Debt Policy
The National Treasury actively seeks to improve the external debt yield curve. In 2017, the National Treasury maintained its anticipated buyback program for external debt securities (“Anticipated Buyback Program”), pursuant to which bonds that do not adequately reflect current borrowing costs are taken out of circulation. This strategy also mitigates the refinancing risk of such debt.
The table set forth below describes the buyback volume of securities taken out of circulation pursuant to the Anticipated Buyback Program. The decrease in the repurchase average between 2014 and 2017 (US$520.1 million in face value) as compared to the average between 2006 and 2013 (US$3 billion in face value) is primarily related to the reduction in the outstanding amount of these securities over the past several years and the reduced frequency of external issuances by the National Treasury.
Table No. 34
External Public Debt Buyback Program
In Millions of U.S. Dollars
| | | | | | | | | | | | | | | | | | | | |
| | | 2013 | | | 2014 | | | 2015 | | | 2016 | | | 2017 | |
Face Value | | | 3,271.2 | | | | 740.0 | | | | 456.5 | | | | 381.7 | | | | 502.2 | |
Financial Value | | | 4,565.3 | | | | 941.3 | | | | 531.3 | | | | 417.6 | | | | 578.8 | |
Source: Ministry of Finance; National Treasury
Through issuances in international markets and advanced purchases of foreign currency, the National Treasury has sufficient cash to cover principal and interest flows with maturities of twelve months or more. As such, foreign debt payments for medium and long term debt of the National Treasury are financed.
On November 14, 2017 the National Treasury fully redeemed its dollar-denominated 5.875% Global Notes due 2019 for an amount of approximately USD$1.8 billion. This was the first time that the Republic exercised a make-whole call option. This redemption reduced the short-term maturities of the EFPD and minimized financing risk by US$33.2 million.
External Public Debt Levels
In 2017, outstanding external federal public debt reached R$123.8 billion (US$37.4 billion), of which R$111.3 billion (US$33.7 billion) was debt securities and R$12.5 billion (US$3.8 billion) was contractual debt. The variation was mainly due to the appreciation of the Real against the basket of currencies that make up the stock of external debt.
The following table sets forth a summary of external federal debt for the periods indicated:
Table No. 35
External Federal Public Debt
In Billions of Reais (R$), except percentages
| | | | | | | | | | | | | | | | | | | | |
| | | 2013 | | | 2014 | | | 2015 | | | 2016 | | | 2017 | |
External Federal Public Debt (1) | | | 94.7 | | | | 112.3 | | | | 142.8 | | | | 126.5 | | | | 123.8 | |
EFPD (% of GDP) | | | 1.8 | % | | | 1.9 | % | | | 2.4 | % | | | 2.0 | % | | | 1.9 | % |
Securities | | | 85.4 | | | | 102.6 | | | | 131.0 | | | | 116.6 | | | | 111.3 | |
Global US$ | | | 68.7 | | | | 82.6 | | | | 111.4 | | | | 101.1 | | | | 96.5 | |
Euro | | | 2.8 | | | | 6.0 | | | | 5.7 | | | | 4.6 | | | | 4.0 | |
D-47
| | | | | | | | | | | | | | | | | | | | |
| | | 2013 | | | 2014 | | | 2015 | | | 2016 | | | 2017 | |
Global R$ | | | 13.9 | | | | 13.9 | | | | 13.9 | | | | 10.8 | | | | 10.8 | |
Restructured Debt (2) | | | — | | | | — | | | | — | | | | — | | | | — | |
Contractual | | | 9.3 | | | | 9.7 | | | | 11.9 | | | | 10.0 | | | | 12.5 | |
Multilateral Organizations | | | 3.1 | | | | 3.5 | | | | 5.0 | | | | 3.8 | | | | 3.5 | |
Private Financial Institutions/Gov. Agencies | | | 6.2 | | | | 6.2 | | | | 6.9 | | | | 6.2 | | | | 9.0 | |
Note: Numbers may not total due to rounding.
| (1) | Values first converted to US$ and then converted to R$ at the spot foreign exchange rate as of the last day of the relevant month. |
| (2) | Refers to the pre-Brady bond (BIB), which does not have an embedded call option. |
Source: National Treasury
Securities Offerings in 2017
The National Treasury conducted two offerings in 2017 in accordance with its policy of improving the external debt yield curve.
On March 7, 2017, the Republic issued US$1.0 billion of its 6% Global Notes 2026, which bear interest at 6% paid semi-annually every April and October, until maturity in April 2026.
On October 3, 2017 the Republic issued US$3.0 billion of its 4.625% Global Notes due 2028, which bear interest at 4.625% paid semi-annually every January and July, until maturity in January 2028. In conjunction with this issuance, the Republic conducted an intra-day offer to purchase for cash certain series of outstanding bonds. Approximately US$2.1 billion of the proceeds of the issuance of the 4.625% Global Notes due 2028 were used to purchase outstanding bonds. The Republic used the remaining net proceeds of the offering to fully redeem its dollar-denominated 5.875% Global Notes due 2019.
Regional Public Debt (State and Municipal)
Management
In 1997, after the deterioration of the financial situation of the states and state banks in the aftermath of the launch of the Plano Real, the Federal Government established a fiscal consolidation program with subnational governments. The fiscal consolidation program provides criteria for the consolidation, refinancing and assumption of subnational debt (state or municipal) and establishes targets that regional governments are required to follow with regard to financial debt, primary result, personnel expenses, investments, revenues and privatizations. Payments for renegotiated debt payments are guaranteed by the tax revenues of regional governments collected by the Federal Government and voluntary transfers from the Federal Government to regional governments. Upon a default by a subnational entity to the Federal Government, the Federal Government can enforce guarantees by withholding transfers of tax revenues or voluntary transfers.
The CMN has taken various measures to limit expansion of credit in the public sector, including by limiting the ability of state-level public sector financial entities to issue additional public indebtedness. For example, state banks are required to have ratings equivalent to investment grade or the rating of the Federal Government, as given by one or more well-known international rating agencies, prior to raising funds abroad.
Complementary Law No. 156, enacted on December 28, 2016, authorizes restructuring of debt owed by states to the Federal Government under the following circumstances: (i) extension of the maturity of the relevant state debt for up to 20 years, (ii) granting a six-month grace period for the payment of interest, and (iii) gradually increasing the total amount for each instalment due after the grace period.\ Eighteen states requested the restructuring of their debt with the Federal Government, which amounts to R$458.9 billion. To date, only the state of Goiás has successfully concluded the renegotiation of its debt under this regime.
Special Recovery Regime
In May 2017, regulation aimed at helping states facing serious fiscal imbalances was enacted (the “Special Recovery Regime”). This regulation applies to states that cumulatively present (i) consolidated debt above net current revenue, (ii) personnel expenditures exceeding 70% of net current revenue and (iii) liability stock larger than cash position.
The Special Recovery Regime contemplates the creation of a plan for each such state that (i) identifies the fiscal situation of the state, (ii) details relevant adjustment measures to be implemented, (iii) assesses the impact of the relevant measures and (iv) sets forth deadlines for the adoption of such plan. Each plan has a maximum term of three years and may only be extended once.
D-48
Compensating measures in connection with the Special Recovery Regime involve spending cuts, a privatization program, reduction of tax benefits and increase in social security contributions. Although these measures do not affect the net worth of National Treasury loans or impact the primary balance, the estimated impact on payment flows to the Federal Government in connection with the Special Recovery Regime is R$7 billion for 2017 and R$37 billion until 2019.
Rio de Janeiro was the first state to join the Special Recovery Regime, leading to a moratorium on debt obligations owed by Rio de Janeiro to the Federal Government. Under the regime, Rio de Janeiro will (i) be offered R$11 billion in loans and (ii) have R$30 billions of its debt to the Federal Government suspended, in each case between 2017 and 2020.
In December 2017, Rio Grande do Sul applied to join the Special Recovery Regime. Approval is still pending. For additional information on this topic, please refer to “Special Recovery Regime and Federal Government Guarantees” in the “Recent Developments” section.
Federal Government Guarantees
The Federal Government also guarantees certain loans to Brazilian sub-national governments. These loans are counter-guaranteed by collateral, including permitted transfers and the sub-national government’s revenues. The outstanding balance of guarantees granted by the Federal Government under sub-national external loans increased from R$103.8 billion in 2016 to R$121.8 billion in 2017. Factors such as loan agreement disbursements, price indexes (for domestic debt) as well as exchange rate variation have an impact on the outstanding balance of guarantees.
The Federal Government paid liabilities incurred by the states and municipalities in the approximate amount of R$6.4 billion, of which (i) R$2.30 billion was paid in 2016 and (ii) R$4.06 billion was paid in 2017. To date, it has managed to recover 46.9% of the total amount paid, adjusted by the Selic rate, by executing collateral. The outstanding recoverable amount (R$3.4 billion) relates to debt defaulted by the State of Rio de Janeiro. For additional information on this topic, please refer to “Special Recovery Regime and Federal Government Guarantees” in the “Recent Developments” section.
Contingent Liabilities
In addition to regular federal domestic securities debt issuances, the Federal Government may assume and restructure liabilities resulting from the disposal or winding-up of state-owned enterprises, subsidies and adjustments made prior to privatization processes. In the past, such liabilities have been restructured to synchronize their maturity dates with the payment capacity of the National Treasury, as well as to lengthen the maturity of public debt and to make transactions more transparent.
The Federal Government closely monitors its contingent liabilities. As required by the Fiscal Responsibility Law, the Budgetary Guidelines for each year contains an annex that provides information regarding fiscal risks and projections for the subsequent two years in terms of primary balances, debt stock and revenue and expenditure aggregates.
The main contingent liability monitored by the Federal Government concerns the Compensation Fund for Salary Fluctuation (Fundo de Compensação de Variações Salariais or “FCVS”). The creditors of this debt are the agents of the Housing Financial System (or their assignees) who signed financing agreements with mortgagees, especially in the 1970s and 1980s. Such agreements held salary equivalence clauses and coverage of the FCVS debtor balance.
External Debt Restructuring and Debt Record
On April 15, 1994, Brazil issued approximately US$43.1 billion principal amount of bonds (referred to as Brady Bonds) to holders of certain medium and long term public sector debt (“eligible debt”) of Brazil, or guaranteed by Brazil, owed to commercial banks and certain other private sector creditors in consideration for the tender by such holders of their eligible debt and interest arrears accrued in respect thereof since January 1, 1991. Since the Brady restructuring in 1994, Brazil has timely serviced its external debt without default.
D-49
TABLES AND SUPPLEMENTARY INFORMATION
No. 36
External Direct Debt of the Federal Government (1)
in Millions of Currency of Denomination
| | | | | | | | | | | | | | | | |
| Type | | Interest | | Issue Date (2) | | Final Maturity | | Currencies (3) | | Principal Amount (2) Outstanding at Dec
31, 2017 | | | Interest | |
Multilateral Organizations | | | | | | | | | | | | | | | | |
World Bank | | Variable | | 15-Aug-08 | | 15-Aug-23 | | USD | | | 2.4 | | | | 1.89 | % |
World Bank | | Variable | | 15-Aug-09 | | 15-Feb-39 | | USD | | | 28.0 | | | | 2.59 | % |
World Bank | | Variable | | 15-Jul-05 | | 15-Jan-22 | | USD | | | 246.5 | | | | 2.59 | % |
World Bank | | Variable | | 15-Jan-07 | | 15-Jul-23 | | USD | | | 0.5 | | | | 2.34 | % |
World Bank | | Variable | | 15-Jan-06 | | 15-Jul-22 | | USD | | | 2.2 | | | | 2.34 | % |
World Bank | | Variable | | 15-Jun-07 | | 15-Dec-22 | | USD | | | 62.4 | | | | 1.89 | % |
World Bank | | Variable | | 15-Jun-06 | | 3-Jun-24 | | USD | | | 26.1 | | | | 1.89 | % |
World Bank | | Variable | | 15-Dec-08 | | 13-Jan-41 | | USD | | | 70.4 | | | | 1.84 | % |
World Bank | | Variable | | 15-Dec-09 | | 22-Jun-40 | | USD | | | 3.2 | | | | 1.84 | % |
World Bank | | Variable | | 15-May-10 | | 15-May-40 | | USD | | | 32.8 | | | | 1.84 | % |
World Bank | | Variable | | 15-Jul-04 | | 3-Nov-20 | | USD | | | 20.7 | | | | 1.84 | % |
World Bank | | Variable | | 10-May-12 | | 15-May-42 | | USD | | | 175.2 | | | | 1.84 | % |
World Bank | | Variable | | 2-Dec-12 | | 7-Jun-42 | | USD | | | 15.2 | | | | 1.84 | % |
World Bank | | Variable | | 13-Sep-11 | | 15-Sep-29 | | USD | | | 23.9 | | | | 1.84 | % |
World Bank | | Variable | | 15-Dec-03 | | 15-May-18 | | USD | | | 0.3 | | | | 0.00 | % |
| | | | | | | | Total (World Bank) | | | 709.7 | | | | | |
| | | | | | |
IDB | | Variable | | 11-dez-10 | | 11-dez-35 | | USD | | | 3.0 | | | | 1.69 | % |
IDB | | Variable | | 15-Dec-10 | | 15-Dec-30 | | USD | | | 131.6 | | | | 1.69 | % |
IDB | | Variable | | 15-Dec-10 | | 15-Dec-30 | | USD | | | 2.7 | | | | 1.69 | % |
IDB | | Variable | | 18-May-01 | | 18-May-21 | | USD | | | 98.4 | | | | 3.50 | % |
IDB | | Variable | | 15-Jan-08 | | 15-Jan-28 | | USD | | | 16.9 | | | | 3.50 | % |
IDB | | Variable | | 15-Jan-08 | | 15-Jan-27 | | USD | | | 35.5 | | | | 3.50 | % |
IDB | | Variable | | 10-Mar-10 | | 10-Mar-30 | | USD | | | 1.6 | | | | 1.69 | % |
IDB | | Variable | | 15-Sep-10 | | 15-Sep-30 | | USD | | | 3.7 | | | | 1.69 | % |
IDB | | Variable | | 30-Jan-12 | | 30-Jan-32 | | USD | | | 4.1 | | | | 1.69 | % |
IDB | | Variable | | 15-May-12 | | 15-May-32 | | USD | | | 5.8 | | | | 1.69 | % |
IDB | | Variable | | 01-Jun-14 | | 01-Jan-29 | | USD | | | 5.6 | | | | 1.69 | % |
IDB | | Variable | | 09-Mar-15 | | 10-Jun-28 | | USD | | | 3.8 | | | | 1.69 | % |
IDB | | Variable | | 15-Dec-14 | | 15-Nov-28 | | USD | | | 4.1 | | | | 2.59 | % |
| | | | | | | | Total (IDB) | | | 316.8 | | | | | |
| | | | | | |
Others | | 5.82% | | 24-Feb-15 | | 06-Aug-32 | | USD | | | 1.7 | | | | 5.82 | % |
Others | | 5.82% | | 20-Feb-15 | | 18-Aug-32 | | USD | | | 0.5 | | | | 5.82 | % |
| | | | Total Others (from Multilateral Organizations) | | | | | | | 2.2 | | | | | |
Total (Multilateral Organizations) | | | | | | | | | | | 1,028.8 | | | | | |
| | | |
Foreign governments | | | | | | | | | | |
| Governments Agencies | | 2.00% | | 21-abr-87 | | 31-dez-18 | | USD | | | 1.0 | | | | 2.00 | % |
Governments Agencies | | 2.00% | | 30-06-2005 | | 30-06-2019 | | EUR | | | 3.8 | | | | 2.00 | % |
Governments Agencies | | Variable | | 20-Oct-10 | | 20-Apr-28 | | JPY | | | 17.6 | | | | 1.00 | % |
Governments Agencies | | 4.50% | | 26-Jun-04 | | 29-Jun-21 | | EUR | | | 1.3 | | | | 4.50 | % |
Total (Foreing Governments) | | | | | | | | | | | 23.7 | | | | | |
| | | | | | |
BONDS | | | | | | | | | | | | | | | | |
Bonds (GLOBAL) | | | | | | | | | | | | | | | | |
Global Bond (2019) | | 8.88% | | 14-Oct-04 | | 14-Oct-19 | | USD | | | 624.0 | | | | 8.88 | % |
Global Bond (2020) | | 12.25% | | 26-Jan-00 | | 14-Jan-20 | | USD | | | 86.6 | | | | 12.25 | % |
Global Bond (2021) | | 4.88% | | 22-Apr-10 | | 22-Jan-21 | | USD | | | 2,728.2 | | | | 4.88 | % |
Global Bond (2022) | | 12.50% | | 13-Sep-06 | | 5-Jan-22 | | BRL | | | 682.8 | | | | 12.50 | % |
Global Bond (2023) | | 2.63% | | 12-Sep-12 | | 5-Jan-23 | | USD | | | 2,150.0 | | | | 2.63 | % |
Global Bond (2024) | | 8.88% | | 16-Mar-01 | | 14-Apr-24 | | USD | | | 1,029.0 | | | | 8.88 | % |
Global Bond (2024-B) | | 8.88% | | 16-Apr-03 | | 14-Apr-24 | | USD | | | 85.6 | | | | 8.88 | % |
Global Bond (2024) | | 8.50% | | 27-Apr-12 | | 5-Jan-24 | | BRL | | | 952.2 | | | | 8.50 | % |
Global Bond (2025) | | 8.75% | | 4-Feb-05 | | 4-Feb-25 | | USD | | | 688.2 | | | | 8.75 | % |
Global Bond (2025-B) | | 4.25% | | 1-Nov-13 | | 7-Jan-25 | | USD | | | 4,300.0 | | | | 4.25 | % |
Global Bond (2026) | | 6.00% | | 17-Mar-16 | | 7-Apr-26 | | USD | | | 2,176.2 | | | | 6.00 | % |
Global Bond (2027) | | 10.13% | | 9-Jun-97 | | 15-May-27 | | USD | | | 838.0 | | | | 10.13 | % |
Global Bond (2028) | | 4.63% | | 13-Oct-17 | | 13-Jan-28 | | USD | | | 3,000.0 | | | | 4.63 | % |
D-50
| | | | | | | | | | | | | | | | |
Global Bond (2028) | | 10.25% | | 14-Feb-07 | | 10-Jan-28 | | BRL | | | 1,440.4 | | | | 10.25 | % |
Global Bond (2030) | | 12.25% | | 29-Mar-00 | | 5-Mar-30 | | USD | | | 214.4 | | | | 12.25 | % |
Global Bond (2034) | | 8.25% | | 20-Jan-04 | | 19-Jan-34 | | USD | | | 1,469.4 | | | | 8.25 | % |
Global Bond (2037) | | 7.13% | | 18-Jan-06 | | 20-Jan-37 | | USD | | | 1,814.3 | | | | 7.13 | % |
Global Bond (2041) | | 5.63% | | 7-Oct-09 | | 7-Jan-41 | | USD | | | 2,377.1 | | | | 5.63 | % |
Global Bond (2045) | | 5.00% | | 1-Aug-14 | | 27-Jan-45 | | USD | | | 3,550.0 | | | | 5.00 | % |
Global Bond (2047) | | 5.63% | | 28-Jul-16 | | 21-Feb-47 | | USD | | | 1,500.0 | | | | 5.63 | % |
| | | | | | | | Total (“Global”) | | | 31,706.6 | | | | | |
Bonds (EUROS) | | | | | | | | | | | | | | | | |
2014 Euro Bond (2021) | | 2.88% | | 3-Apr-14 | | 1-Apr-21 | | EUR | | | 1,199.9 | | | | 2.88 | % |
| | | | | | | | Total (“Euros”) | | | 1,199.9 | | | | | |
TOTAL (BONDS) | | | | | | | | | | | 32,906.5 | | | | | |
| | | | | | |
Commercial Banks | | | | | | | | | | | | | | | | |
Import Financing Credits with Guarantee of Foreign Governments | | 5.54% | | 29-Dec-05 | | 29-Jun-21 | | USD | | | 167.4 | | | | 4.75 | % |
Import Financing Credits without Guarantee of Foreign Governments | | 5.50% | | 15-Dec-16 | | 15-Apr-27 | | EUR | | | 121.2 | | | | 5.50 | % |
Import Financing Credits without Guarantee of Foreign Governments | | 5.10% | | 14-Dec-11 | | 15-Jun-20 | | EUR | | | 422.9 | | | | 5.10 | % |
Import Financing Credits without Guarantee of Foreign Governments | | 5.50% | | 27-Sep-17 | | 27-Jan-24 | | EUR | | | 221.6 | | | | 5.50 | % |
Loans | | Variable | | 5-Dec-00 | | 1-Dec-19 | | GBP | | | 0.0 | | | | 0.52 | % |
Loans | | Variable | | 5-Dec-00 | | 1-Apr-35 | | GBP | | | 0.1 | | | | 0.52 | % |
Total (Commercial Banks) | | | | | | | | | | | 933.3 | | | | | |
Others | | | | | | | | | | | | | | | | |
Import Financing Credits without | | | | | | | | | | | | | | | | |
Guarantee of Foreign Governments | | Variable | | 25-Feb-01 | | 25-Aug-18 | | USD | | | 0.9 | | | | 2.59 | % |
Total (Others) | | | | | | | | | | | 0.9 | | | | | |
TOTAL | | | | | | Total Amount | | | | | 34,893.1 | | | | | |
| Note: | Numbers may not total due to rounding. |
| (1) | Excludes debt incurred by the Central Bank. |
| (2) | In the case of multiple tranches, issue date refers to the first date of issuance of the security. |
| (3) | In the case of variable rates, the interest rate refers to the last coupon paid. |
| (4) | Currencies other than U.S. dollars translated into U.S. dollars by the exchange rate (selling) as of December 31, 2017. |
Source: Central Bank.
Table No. 37
External Debt Guaranteed by the Federal Government (1)
In Millions of U.S. Dollars
| | | | | | | | | | | | | | | | | | | | | | | | |
| Type | | Interest | | | Issue Date | | | Final
Maturity | | | Currencies | | | Amount
Disbursed | | | Principal Amount
Outstanding as of Dec
31, 2017 | |
I. To Public Entities | | | | | | | | | | | | | | | | | | | | | | | | |
Multilateral Organizations | | | | | | | | | | | | | | | | | | | | | | | | |
World Bank | | | Various | | | | Various | | | | Various | | | | Various | | | | 16,367 | | | | 15,680 | |
Inter-American Development Bank (IDB) | | | Various | | | | Various | | | | Various | | | | Various | | | | 21,351 | | | | 14,144 | |
International Monetary Fund (IMF) | | | Various | | | | Various | | | | Various | | | | SDR | | | | 4,111 | | | | 4,111 | |
Others | | | Various | | | | Various | | | | Various | | | | Various | | | | 1,989 | | | | 1,483 | |
Total (Multilateral Organizations) | | | | 35,418 | |
Foreign Governments | | | | | | | | | | | | | | | | | | | | | | | | |
Import Financing Credits | | | Various | | | | Various | | | | Various | | | | Various | | | | 507 | | | | 73 | |
Original Loans | | | Various | | | | Various | | | | Various | | | | Various | | | | 2,998 | | | | 2,079 | |
Total (Foreign Governments) | | | | 2,152 | |
Commercial Banks | | | | | | | | | | | | | | | | | | | | | | | | |
Import Financing Credits without Guarantee of Foreign Governments | | | Various | | | | Various | | | | Various | | | | Various | | | | 320 | | | | 114 | |
Loans | | | Various | | | | Various | | | | Various | | | | Various | | | | 4,657 | | | | 3,252 | |
Total (Commercial Banks) | | | | 3,366 | |
Total for Public Entities | | | | 40,936 | |
D-51
| | | | | | | | | | | | | | | | | | | | | | | | |
| Type | | Interest | | | Issue Date | | | Final
Maturity | | | Currencies | | | Amount
Disbursed | | | Principal Amount
Outstanding as of Dec
31, 2017 | |
II. To Private Companies | | | | | | | | | | | | | | | | | | | | | | | | |
Loans (2) | | | Various | | | | Various | | | | Various | | | | Various | | | | 1 | | | | 0 | |
III. Intercompany Loans | | | | | | | | | | | | | | | | | | | | | | | | |
| | | Various | | | | Various | | | | Various | | | | Various | | | | 0 | | | | 0 | |
Total for Private Entities | | | | | | | | | |
Total for Public and Private Entities | | | | | | | | 40,936 | |
| Note: | Numbers may not total due to rounding. |
| (1) | Currencies other than U.S. Dollars are translated into U.S. Dollars with reference to the exchange rate (sell side) on December 29, 2017. |
| (2) | Includes privatized companies. |
Source: Central Bank.
Table No. 38
Internal Securities Debt of the Republic
In Millions of U.S. Dollars(1)
| | | | | | | | | | | | |
Name | | Index (2) | | Interest Rate(3) | | Issuance Date | | Final Maturity | | Outstanding as of Dec 31,
2017 | |
National Treasury Letters (NTL) | | Fixed | | —(4) | | Various (Jan 2014–Jan 2016) | | Various (Jan 2018–Jan 2023) | | | $259,185 | |
National Treasury Notes (NTN) | | | | | | | | | | | | |
A Series | | US$ | | 6.00% | | (Dec 1997) | | (Apr 2024) | | | $3,665 | |
B Series | | IPCA | | 6.00% | | Various (Mar 2002–Nov 2015) | | Various (Aug 2018-May 2055) | | | $289,621 | |
C Series | | IGP-M | | 6% and 12% | | Various (Jan 2001–May 2002) | | Various (Apr 2021–Jan 2031) | | | $22,266 | |
F Series | | Fixed | | 10% | | Various (Fev 2010–Jan 2016) | | Various (Jan 2018–Jan 2027) | | | $120,461 | |
I Series | | US$ | | 0% and 12% | | Various (Nov 2000–Fev 2001) | | Various (Jan 2018–Jul 2037) | | | $603 | |
P Series | | TR | | 6.00% | | Various (Mar 2003–Jan 2014) | | Various (Mar 2018–Jan 2030) | | | $83 | |
Financial Treasury Letters (FTL) | | Overnight | | — | | Various (Jul 2011–Jul 2016) | | Various (Mar 2018–Sep 2023) | | | $336,374 | |
National Treasury Certificate (CTN) | | IGP-M | | 12% | | Various (May 1998–Aug 2004) | | Various (May 2018–Aug 2024) | | | $5,655 | |
Financial Treasury Certificate (CFT) | | | | | | | | | | | | |
A Series | | IGP-DI | | 6% and 12% | | Various (Sep 1998–Apr 2000) | | Various (Jan 2018–Sep 2028) | | | $273 | |
B Series | | TR | | 6.00% | | Various (Jan 1997–Jan 2015) | | Various (Jan 2027–Jan 2036) | | | $19 | |
D Series | | US$ | | 0% and 6% | | (Jul 2000) | | May 2031 | | | $362 | |
E Series | | IGP-M | | Various | | Various (Dec 2000–Jan 2016) | | Various (Jan 2018–Jan 2046) | | | $2,435 | |
Securitized Credits | | IGP-DI | | Various | | Various (Jun 1998–Aug 1998) | | Various (Jan 2018–Jan 2023) | | | $106 | |
| | TR | | Various | | Jan 1997–Jun 1998 | | Various (Jan 2018–Jan 2027) | | | $2,030 | |
Public Debt Certificate (CDP) | | TR | | Various | | (Mar 1998-Mar 2002) | | Various (Mar 2028- Mar 2032) | | | 0.1 | |
Agrarian Debt Securities (TDA) | | TR | | Various | | Various | | Various(Jan 2018 – Nov 2035) | | | 554 | |
Total | | | | | | | | | | | 1,043,692 | |
Note: Numbers may not total due to rounding.
D-52
| (1) | Exchange rate (sell side) on December 27, 2017 (R$3.3080 = U.S.$1.00) |
| (2) | Securities indexed to each indicated rate/index: |
Overnight = Central Bank’s overnight rate
IGPM = General Price Index (market based)
IPCA = Broad National Consumer Price Index
IGP-DI = General Price Index-Domestic Supply
Fixed = Pre-fixed interest rates
US$ = U.S. Dollar exchange rate
TR = Index based on average daily rate of certificates of deposit issued by certain major Brazilian banks
| (4) | Zero-coupon securities issued at a discount. |
Source: National Treasury
D-53