Fidelity® Nasdaq Composite Index® Tracking Stock
Semi-Annual Report
May 31, 2020

See the inside front cover for important information about access to your fund’s shareholder reports.

Beginning on January 1, 2021, as permitted by regulations adopted by the Securities and Exchange Commission, paper copies of a fund’s shareholder reports will no longer be sent by mail, unless you specifically request paper copies of the reports from the fund or from your financial intermediary, such as a financial advisor, broker-dealer or bank. Instead, the reports will be made available on a website, and you will be notified by mail each time a report is posted and provided with a website link to access the report.
If you already elected to receive shareholder reports electronically, you will not be affected by this change and you need not take any action. You may elect to receive shareholder reports and other communications from a fund electronically, by contacting your financial intermediary. For Fidelity customers, visit Fidelity's web site or call Fidelity using the contact information listed below.
You may elect to receive all future reports in paper free of charge. If you wish to continue receiving paper copies of your shareholder reports, you may contact your financial intermediary or, if you are a Fidelity customer, visit Fidelity’s website, or call Fidelity at the applicable toll-free number listed below. Your election to receive reports in paper will apply to all funds held with the fund complex/your financial intermediary.
| Account Type | Website | Phone Number |
| Brokerage, Mutual Fund, or Annuity Contracts: | fidelity.com/mailpreferences | 1-800-343-3548 |
| Employer Provided Retirement Accounts: | netbenefits.fidelity.com/preferences (choose 'no' under Required Disclosures to continue to print) | 1-800-343-0860 |
| Advisor Sold Accounts Serviced Through Your Financial Intermediary: | Contact Your Financial Intermediary | Your Financial Intermediary's phone number |
| Advisor Sold Accounts Serviced by Fidelity: | institutional.fidelity.com | 1-877-208-0098 |
Contents
To view a fund's proxy voting guidelines and proxy voting record for the 12-month period ended June 30, visit http://www.fidelity.com/proxyvotingresults or visit the Securities and Exchange Commission's (SEC) web site at http://www.sec.gov.
You may also call 1-800-FIDELITY to request a free copy of the proxy voting guidelines.
Nasdaq®, OMX®, NASDAQ OMX®, Nasdaq Composite®, and The Nasdaq Stock Market®, Inc. are registered trademarks of The NASDAQ OMXGroup, Inc. (which with its Affiliates are the Corporations) and are licensed for use by Fidelity. The product has not been passed on by the Corporations as to its legality or suitability. The product is not issued, endorsed or sold by the Corporations. The Corporations make no warranties and bear no liability with respect to shares of the product.
Standard & Poor's, S&P and S&P 500 are registered service marks of The McGraw-Hill Companies, Inc. and have been licensed for use by Fidelity Distributors Corporation.
Other third-party marks appearing herein are the property of their respective owners.
All other marks appearing herein are registered or unregistered trademarks or service marks of FMR LLC or an affiliated company. © 2020 FMR LLC. All rights reserved.
This report and the financial statements contained herein are submitted for the general information of the shareholders of the Fund. This report is not authorized for distribution to prospective investors in the Fund unless preceded or accompanied by an effective prospectus.
A fund files its complete schedule of portfolio holdings with the SEC for the first and third quarters of each fiscal year on Form N-PORT. Forms N-PORT are available on the SEC’s web site at http://www.sec.gov. A fund's Forms N-PORT may be reviewed and copied at the SEC’s Public Reference Room in Washington, DC. Information regarding the operation of the SEC's Public Reference Room may be obtained by calling 1-800-SEC-0330.
For a complete list of a fund's portfolio holdings, view the most recent holdings listing, semiannual report, or annual report on Fidelity's web site at http://www.fidelity.com, http://www.institutional.fidelity.com, or http://www.401k.com, as applicable.
NOT FDIC INSURED •MAY LOSE VALUE •NO BANK GUARANTEE
Neither the Fund nor Fidelity Distributors Corporation is a bank.
Note to shareholders:
(No Action is Required by You)
As part of a regular review of its organizational structure, Fidelity has decided to merge certain entities to streamline operations, increase efficiency, simplify reporting, and reduce legal, compliance, and accounting complexity and costs. In separate events, Fidelity has merged four of its investment advisers and two of its broker-dealers.
Effective on or about January 1, 2020, following any required regulatory notices and approvals:
Investment advisers Fidelity Investments Money Management, Inc., FMR Co., Inc., and Fidelity SelectCo, LLC, merged with and into Fidelity Management & Research Company. In connection with the merger transactions, the resulting, merged investment adviser was then redomiciled from Massachusetts to Delaware, changed its corporate structure from a corporation to a limited liability company, and changed its name to “Fidelity Management & Research Company LLC”.
Broker-dealer Fidelity Distributors Corporation merged with and into Fidelity Investments Institutional Services Company, Inc. (“FIISC”). FIISC was then redomiciled from Massachusetts to Delaware, changed its corporate structure from a corporation to a limited liability company, and changed its name to “Fidelity Distributors Company LLC”.
These mergers are not expected to affect fund shareholders or Fidelity clients, nor are they expected to result in any changes to the day-to-day management of Fidelity’s brokerage services, the Fidelity funds, their investment policies and practices, their portfolio management teams, or the funds’ expenses.
Early in 2020, the outbreak and spread of a new coronavirus emerged as a public health emergency that had a major influence on financial markets, primarily based on its impact on the global economy and the outlook for corporate earnings. The virus causes a respiratory disease known as COVID-19. On March 11, the World Health Organization declared the COVID-19 outbreak a pandemic, citing sustained risk of further global spread.
In the weeks following, as the crisis worsened, we witnessed an escalating human tragedy with wide-scale social and economic consequences from coronavirus-containment measures. The outbreak of COVID-19 prompted a number of measures to limit the spread, including travel and border restrictions, quarantines, and restrictions on large gatherings. In turn, these resulted in lower consumer activity, diminished demand for a wide range of products and services, disruption in manufacturing and supply chains, and – given the wide variability in outcomes regarding the outbreak – significant market uncertainty and volatility. Amid the turmoil, the U.S. government took unprecedented action – in concert with the U.S. Federal Reserve and central banks around the world – to help support consumers, businesses, and the broader economy, and to limit disruption to the financial system.
The situation continues to unfold, and the extent and duration of its impact on financial markets and the economy remain highly uncertain. Extreme events such as the coronavirus crisis are “exogenous shocks” that can have significant adverse effects on mutual funds and their investments. Although multiple asset classes may be affected by market disruption, the duration and impact may not be the same for all types of assets.
Fidelity is committed to helping you stay informed amid news about COVID-19 and during increased market volatility, and we’re taking extra steps to be responsive to customer needs. We encourage you to visit our websites, where we offer ongoing updates, commentary, and analysis on the markets and our funds.
Premium/Discount Analysis (Unaudited)
Shares of Fidelity® Nasdaq Composite Index® Tracking Stock (the fund) are listed on The Nasdaq Stock Market® and can be bought and sold on the secondary market at market prices. Although the market price is expected to approximate the fund's NAV, it is possible that the market price and NAV will vary significantly. The closing market price is the daily closing price as reported on The Nasdaq Stock Market.
Premiums or discounts are the differences (expressed as a basis point differential with 1 basis point equaling 1/100 of 1%) between the fund's NAV and closing market price. A premium indicates that the closing market price is trading above the NAV. A discount indicates that the closing market price is trading below the NAV. A discrepancy may exist with respect to the timing of when the NAV is calculated and the determination of the closing market price.
The chart below presents information about the differences between the fund's daily closing market price and the fund's NAV.
Shares of Fidelity® Nasdaq Composite Index® Tracking Stock (the fund) are listed on The Nasdaq Stock Market® and can be bought and sold on the secondary market at market prices. Although the market price is expected to approximate the fund's NAV, it is possible that the market price and NAV will vary significantly. The closing market price is the daily closing price as reported on The Nasdaq Stock Market. Premiums or discounts are the differences (expressed as a basis point differential with 1 basis point equaling 1/100 of 1%) between the fund's NAV and closing market price. A premium indicates that the closing market price is trading above the NAV. A discount indicates that the closing market price is trading below the NAV. A discrepancy may exist with respect to the timing of when the NAV is calculated and the determination of the closing market price. The chart below presents information about the differences between the fund's daily closing market price and the fund's NAV.
Period Ended May 31, 2020
| From June 1, 2015 to May 31, 2020 | Closing Price Below NAV | Closing Price Above or Equal to NAV |
| Basis Point Differential | Number of Days | % of Total Days | Number of Days | % of Total Days |
| 0 - <25 | 352 | 27.96% | 825 | 65.53% |
| 25 - <50 | 12 | 0.95% | 63 | 5.00% |
| 50 - <75 | 0 | -- | 4 | 0.32% |
| 75 - <100 | 0 | -- | 1 | 0.08% |
| 100 or above | 0 | -- | 2 | 0.16% |
| Total | 364 | 28.91% | 895 | 71.09% |
Investment Summary (Unaudited)
Top Ten Stocks as of May 31, 2020
| | % of fund's net assets |
| Microsoft Corp. | 9.7 |
| Apple, Inc. | 9.7 |
| Amazon.com, Inc. | 8.5 |
| Facebook, Inc. Class A | 3.8 |
| Alphabet, Inc. Class C | 3.4 |
| Alphabet, Inc. Class A | 3.0 |
| Intel Corp. | 1.9 |
| NVIDIA Corp. | 1.5 |
| Cisco Systems, Inc. | 1.4 |
| Adobe, Inc. | 1.3 |
| | 44.2 |
Top Market Sectors as of May 31, 2020
| | % of fund's net assets |
| Information Technology | 41.9 |
| Communication Services | 17.6 |
| Consumer Discretionary | 15.1 |
| Health Care | 10.9 |
| Financials | 4.4 |
| Consumer Staples | 4.1 |
| Industrials | 3.4 |
| Real Estate | 1.1 |
| Utilities | 0.7 |
| Materials | 0.3 |
Asset Allocation (% of fund's net assets)
| As of May 31, 2020 * |
| | Stocks and Equity Futures | 100.0% |

* Foreign investments - 5.2%
Schedule of Investments May 31, 2020 (Unaudited)
Showing Percentage of Net Assets
| Common Stocks - 99.7% | | | |
| | | Shares | Value |
| COMMUNICATION SERVICES - 17.6% | | | |
| Diversified Telecommunication Services - 0.1% | | | |
| ATN International, Inc. | | 4,018 | $238,669 |
| Bandwidth, Inc. (a)(b) | | 4,104 | 454,928 |
| Cogent Communications Group, Inc. | | 9,251 | 707,887 |
| Consolidated Communications Holdings, Inc. (b) | | 28,927 | 175,298 |
| GCI Liberty, Inc. (a) | | 18,088 | 1,251,509 |
| Iridium Communications, Inc. (a) | | 26,593 | 611,639 |
| PDVWireless, Inc. (a) | | 4,619 | 247,578 |
| Vonage Holdings Corp. (a) | | 52,680 | 507,308 |
| | | | 4,194,816 |
| Entertainment - 2.4% | | | |
| Activision Blizzard, Inc. | | 138,693 | 9,983,122 |
| Bilibili, Inc. ADR (a) | | 31,250 | 1,013,438 |
| Electronic Arts, Inc. (a) | | 51,299 | 6,303,621 |
| iQIYI, Inc. ADR (a) | | 56,692 | 940,520 |
| LiveXLive Media, Inc. (a) | | 43,378 | 124,061 |
| NetEase, Inc. ADR | | 13,267 | 5,079,934 |
| Netflix, Inc. (a) | | 78,630 | 33,003,370 |
| Roku, Inc. Class A (a) | | 18,183 | 1,991,220 |
| Take-Two Interactive Software, Inc. (a) | | 20,911 | 2,847,451 |
| Zynga, Inc. (a) | | 172,255 | 1,576,133 |
| | | | 62,862,870 |
| Interactive Media & Services - 10.9% | | | |
| Alphabet, Inc.: | | | |
| Class A (a) | | 53,670 | 76,937,018 |
| Class C (a) | | 61,016 | 87,186,983 |
| Baidu.com, Inc. sponsored ADR (a) | | 50,227 | 5,351,687 |
| CarGurus, Inc. Class A (a) | | 18,851 | 489,749 |
| Facebook, Inc. Class A (a) | | 430,462 | 96,892,692 |
| IAC/InterActiveCorp (a) | | 14,365 | 3,883,865 |
| Luokung Technology Corp. (a) | | 61,953 | 29,285 |
| Match Group, Inc. (a)(b) | | 13,534 | 1,205,067 |
| Momo, Inc. ADR | | 31,934 | 619,520 |
| Qutoutiao, Inc. ADR (a)(b) | | 45,219 | 107,621 |
| SINA Corp. (a) | | 13,740 | 430,199 |
| TripAdvisor, Inc. | | 25,666 | 494,840 |
| Weibo Corp. sponsored ADR (a)(b) | | 15,477 | 476,227 |
| Yandex NV Series A (a)(b) | | 53,840 | 2,165,983 |
| YY, Inc. ADR (a) | | 9,261 | 565,384 |
| Zillow Group, Inc.: | | | |
| Class A (a) | | 12,263 | 710,763 |
| Class C (a)(b) | | 27,538 | 1,596,929 |
| | | | 279,143,812 |
| Media - 3.2% | | | |
| AMC Networks, Inc. Class A (a)(b) | | 10,199 | 288,326 |
| Cardlytics, Inc. (a) | | 5,933 | 403,978 |
| Charter Communications, Inc. Class A (a) | | 37,565 | 20,435,360 |
| Comcast Corp. Class A | | 814,488 | 32,253,725 |
| comScore, Inc. (a) | | 41,517 | 156,312 |
| Criteo SA sponsored ADR (a) | | 19,102 | 195,796 |
| Discovery Communications, Inc.: | | | |
| Class A (a)(b) | | 27,955 | 608,021 |
| Class C (non-vtg.) (a) | | 65,253 | 1,278,306 |
| DISH Network Corp. Class A (a) | | 54,112 | 1,712,645 |
| Fox Corp.: | | | |
| Class A | | 64,789 | 1,889,895 |
| Class B | | 49,181 | 1,415,429 |
| Liberty Broadband Corp.: | | | |
| Class A (a) | | 4,465 | 601,391 |
| Class C (a) | | 27,321 | 3,732,595 |
| Liberty Global PLC: | | | |
| Class A (a)(b) | | 36,415 | 773,455 |
| Class C (a) | | 82,504 | 1,702,058 |
| Liberty Latin America Ltd.: | | | |
| Class A (a) | | 13,767 | 137,257 |
| Class C (a)(b) | | 27,083 | 259,997 |
| Liberty Media Corp.: | | | |
| rights 6/2/20 (a) | | 5,245 | 57,013 |
| Liberty Braves Class C (a) | | 11,194 | 245,708 |
| Liberty Formula One Group Series C (a) | | 37,992 | 1,316,423 |
| Liberty SiriusXM Series A (a) | | 20,278 | 740,147 |
| Liberty SiriusXM Series C (a) | | 35,338 | 1,288,777 |
| Loral Space & Communications Ltd. | | 7,999 | 150,621 |
| News Corp.: | | | |
| Class A | | 67,741 | 829,827 |
| Class B | | 34,788 | 426,501 |
| Nexstar Broadcasting Group, Inc. Class A | | 8,874 | 739,293 |
| Scholastic Corp. | | 8,469 | 248,989 |
| Sinclair Broadcast Group, Inc. Class A (b) | | 16,067 | 300,292 |
| Sirius XM Holdings, Inc. (b) | | 804,739 | 4,683,581 |
| ViacomCBS, Inc.: | | | |
| Class A (b) | | 6,513 | 159,764 |
| Class B | | 97,606 | 2,024,348 |
| | | | 81,055,830 |
| Wireless Telecommunication Services - 1.0% | | | |
| Millicom International Cellular SA (b) | | 21,091 | 512,722 |
| Shenandoah Telecommunications Co. (b) | | 10,487 | 551,721 |
| T-Mobile U.S., Inc. (a) | | 220,742 | 22,083,030 |
| VEON Ltd. sponsored ADR | | 361,603 | 538,788 |
| Vodafone Group PLC sponsored ADR | | 75,099 | 1,239,884 |
| | | | 24,926,145 |
|
| TOTAL COMMUNICATION SERVICES | | | 452,183,473 |
|
| CONSUMER DISCRETIONARY - 15.1% | | | |
| Auto Components - 0.1% | | | |
| Dorman Products, Inc. (a) | | 6,292 | 439,937 |
| Fox Factory Holding Corp. (a) | | 8,083 | 582,865 |
| Gentex Corp. | | 44,536 | 1,177,532 |
| Gentherm, Inc. (a) | | 7,661 | 311,803 |
| The Goodyear Tire & Rubber Co. | | 52,191 | 397,174 |
| Visteon Corp. (a)(b) | | 6,254 | 450,288 |
| | | | 3,359,599 |
| Automobiles - 1.1% | | | |
| Tesla, Inc. (a) | | 32,988 | 27,544,980 |
| Distributors - 0.1% | | | |
| Core-Mark Holding Co., Inc. | | 11,338 | 317,237 |
| LKQ Corp. (a) | | 57,208 | 1,570,932 |
| Pool Corp. | | 7,049 | 1,896,322 |
| | | | 3,784,491 |
| Diversified Consumer Services - 0.2% | | | |
| Afya Ltd. (b) | | 11,903 | 233,894 |
| Arco Platform Ltd. Class A (a) | | 6,581 | 319,047 |
| Career Education Corp. (a) | | 17,328 | 282,100 |
| Frontdoor, Inc. (a) | | 17,062 | 778,880 |
| Grand Canyon Education, Inc. (a) | | 9,371 | 914,516 |
| Laureate Education, Inc. Class A (a) | | 26,971 | 262,428 |
| Strategic Education, Inc. | | 4,442 | 753,496 |
| Weight Watchers International, Inc. (a) | | 13,937 | 333,094 |
| | | | 3,877,455 |
| Hotels, Restaurants & Leisure - 1.5% | | | |
| Bloomin' Brands, Inc. | | 21,526 | 245,612 |
| Caesars Entertainment Corp. (a) | | 114,914 | 1,308,870 |
| Churchill Downs, Inc. (b) | | 7,314 | 970,348 |
| Cracker Barrel Old Country Store, Inc. | | 4,394 | 470,729 |
| Dave & Buster's Entertainment, Inc. | | 7,582 | 100,007 |
| Denny's Corp. (a) | | 14,695 | 159,367 |
| DraftKings, Inc. Class A (a)(b) | | 55,865 | 2,217,841 |
| Dunkin' Brands Group, Inc. | | 14,474 | 924,454 |
| Eldorado Resorts, Inc. (a)(b) | | 17,758 | 629,699 |
| Extended Stay America, Inc. unit | | 39,278 | 451,697 |
| Golden Entertainment, Inc. (a)(b) | | 13,876 | 169,218 |
| Huazhu Group Ltd. ADR | | 28,664 | 969,416 |
| Jack in the Box, Inc. | | 5,257 | 352,324 |
| Luckin Coffee, Inc. ADR (b) | | 7,624 | 16,468 |
| Marriott International, Inc. Class A | | 57,301 | 5,071,139 |
| Melco Crown Entertainment Ltd. sponsored ADR | | 40,074 | 642,386 |
| Monarch Casino & Resort, Inc. (a) | | 7,152 | 287,081 |
| Paddy Power Betfair PLC | | 11,954 | 1,517,656 |
| Papa John's International, Inc. (b) | | 6,876 | 535,572 |
| Penn National Gaming, Inc. (a) | | 23,512 | 771,429 |
| Playa Hotels & Resorts NV (a) | | 56,492 | 147,444 |
| Red Rock Resorts, Inc. | | 16,004 | 220,855 |
| Scientific Games Corp. Class A (a) | | 20,609 | 324,180 |
| Starbucks Corp. | | 209,877 | 16,368,307 |
| Texas Roadhouse, Inc. Class A | | 13,721 | 711,434 |
| The Cheesecake Factory, Inc. (b) | | 10,213 | 219,375 |
| Wendy's Co. | | 41,384 | 879,824 |
| Wingstop, Inc. (b) | | 5,974 | 728,529 |
| Wynn Resorts Ltd. | | 18,430 | 1,534,850 |
| | | | 38,946,111 |
| Household Durables - 0.3% | | | |
| Cavco Industries, Inc. (a) | | 2,167 | 412,142 |
| Garmin Ltd. | | 35,060 | 3,161,360 |
| Helen of Troy Ltd. (a)(b) | | 5,019 | 913,056 |
| iRobot Corp. (a)(b) | | 5,021 | 370,148 |
| LGI Homes, Inc. (a)(b) | | 5,634 | 469,988 |
| Newell Brands, Inc. | | 82,655 | 1,086,913 |
| Sonos, Inc. (a) | | 27,949 | 303,526 |
| Universal Electronics, Inc. (a) | | 4,542 | 205,480 |
| | | | 6,922,613 |
| Internet & Direct Marketing Retail - 10.3% | | | |
| Amazon.com, Inc. (a) | | 89,024 | 217,429,547 |
| Baozun, Inc. sponsored ADR (a)(b) | | 11,195 | 296,556 |
| CNOVA NV (a)(b) | | 49,959 | 177,462 |
| Ctrip.com International Ltd. ADR (a) | | 96,736 | 2,570,276 |
| eBay, Inc. | | 125,351 | 5,708,485 |
| Etsy, Inc. (a) | | 22,191 | 1,797,027 |
| Expedia, Inc. | | 25,130 | 1,997,332 |
| Groupon, Inc. (a) | | 130,366 | 166,217 |
| JD.com, Inc. sponsored ADR (a) | | 167,255 | 9,086,964 |
| Liberty Interactive Corp. QVC Group Series A (a)(b) | | 79,288 | 652,937 |
| MakeMyTrip Ltd. (a)(b) | | 15,644 | 242,326 |
| MercadoLibre, Inc. (a) | | 8,992 | 7,658,217 |
| Pinduoduo, Inc. ADR (a) | | 48,967 | 3,274,423 |
| Secoo Holding Ltd. ADR (a) | | 16,141 | 37,609 |
| Stamps.com, Inc. (a) | | 3,488 | 691,147 |
| Stitch Fix, Inc. (a)(b) | | 13,368 | 309,068 |
| The Booking Holdings, Inc. (a) | | 7,319 | 11,998,915 |
| The RealReal, Inc. (b) | | 21,422 | 287,269 |
| Waitr Holdings, Inc. (a) | | 46,861 | 115,747 |
| | | | 264,497,524 |
| Leisure Products - 0.2% | | | |
| BRP, Inc. | | 10,508 | 363,890 |
| Hasbro, Inc. | | 25,735 | 1,891,780 |
| Mattel, Inc. (a)(b) | | 66,624 | 613,607 |
| Peloton Interactive, Inc. Class A (a) | | 36,763 | 1,551,031 |
| | | | 4,420,308 |
| Multiline Retail - 0.2% | | | |
| Dollar Tree, Inc. (a) | | 43,333 | 4,241,001 |
| Ollie's Bargain Outlet Holdings, Inc. (a)(b) | | 12,498 | 1,142,942 |
| | | | 5,383,943 |
| Specialty Retail - 0.8% | | | |
| Bed Bath & Beyond, Inc. (b) | | 28,414 | 206,570 |
| Five Below, Inc. (a) | | 9,897 | 1,035,721 |
| Monro, Inc. (b) | | 7,406 | 408,071 |
| National Vision Holdings, Inc. (a) | | 16,590 | 444,280 |
| O'Reilly Automotive, Inc. (a) | | 13,237 | 5,523,006 |
| Office Depot, Inc. | | 132,937 | 328,354 |
| Rent-A-Center, Inc. (b) | | 12,808 | 326,092 |
| Ross Stores, Inc. | | 65,085 | 6,310,642 |
| Sleep Number Corp. (a) | | 6,687 | 208,434 |
| The Children's Place Retail Stores, Inc. (b) | | 4,039 | 168,184 |
| Tractor Supply Co. | | 21,151 | 2,580,845 |
| Ulta Beauty, Inc. (a) | | 10,622 | 2,591,874 |
| Urban Outfitters, Inc. (a) | | 22,082 | 374,069 |
| | | | 20,506,142 |
| Textiles, Apparel & Luxury Goods - 0.3% | | | |
| Columbia Sportswear Co. | | 12,930 | 944,666 |
| Crocs, Inc. (a) | | 14,505 | 415,568 |
| lululemon athletica, Inc. (a) | | 22,119 | 6,637,801 |
| Sequential Brands Group, Inc. (a)(b) | | 44,132 | 8,142 |
| Steven Madden Ltd. | | 17,196 | 404,450 |
| | | | 8,410,627 |
|
| TOTAL CONSUMER DISCRETIONARY | | | 387,653,793 |
|
| CONSUMER STAPLES - 4.1% | | | |
| Beverages - 1.6% | | | |
| Coca-Cola Bottling Co. Consolidated (b) | | 1,579 | 384,376 |
| MGP Ingredients, Inc. (b) | | 5,421 | 203,342 |
| Monster Beverage Corp. (a) | | 97,272 | 6,994,830 |
| National Beverage Corp. (a)(b) | | 9,965 | 567,806 |
| PepsiCo, Inc. | | 248,930 | 32,746,742 |
| | | | 40,897,096 |
| Food & Staples Retailing - 1.3% | | | |
| Casey's General Stores, Inc. | | 6,772 | 1,081,692 |
| Costco Wholesale Corp. | | 79,253 | 24,447,173 |
| Grocery Outlet Holding Corp. | | 18,126 | 667,218 |
| HF Foods Group, Inc. (a)(b) | | 19,024 | 136,212 |
| PriceSmart, Inc. | | 7,060 | 383,923 |
| Sprouts Farmers Market LLC (a) | | 24,453 | 614,504 |
| Walgreens Boots Alliance, Inc. | | 160,473 | 6,890,711 |
| | | | 34,221,433 |
| Food Products - 1.1% | | | |
| Beyond Meat, Inc. (b) | | 11,719 | 1,503,431 |
| Bridgford Foods Corp. (a) | | 4,317 | 68,036 |
| Cal-Maine Foods, Inc. | | 9,625 | 428,890 |
| Calavo Growers, Inc. (b) | | 4,245 | 248,375 |
| Freshpet, Inc. (a) | | 7,764 | 599,226 |
| Hostess Brands, Inc. Class A (a)(b) | | 28,166 | 340,104 |
| J&J Snack Foods Corp. | | 4,024 | 517,607 |
| Lancaster Colony Corp. | | 5,501 | 844,183 |
| Mondelez International, Inc. | | 255,946 | 13,339,906 |
| Pilgrim's Pride Corp. (a) | | 41,719 | 862,332 |
| Sanderson Farms, Inc. | | 3,756 | 495,867 |
| The Hain Celestial Group, Inc. (a)(b) | | 21,418 | 674,239 |
| The Kraft Heinz Co. | | 221,142 | 6,738,197 |
| The Simply Good Foods Co. (a) | | 20,692 | 352,385 |
| | | | 27,012,778 |
| Household Products - 0.1% | | | |
| Central Garden & Pet Co. Class A (non-vtg.) (a) | | 10,100 | 346,026 |
| Reynolds Consumer Products, Inc. | | 38,992 | 1,301,943 |
| WD-40 Co. (b) | | 2,823 | 541,593 |
| | | | 2,189,562 |
| Personal Products - 0.0% | | | |
| Inter Parfums, Inc. | | 6,815 | 316,284 |
|
| TOTAL CONSUMER STAPLES | | | 104,637,153 |
|
| ENERGY - 0.2% | | | |
| Energy Equipment & Services - 0.0% | | | |
| CSI Compressco LP | | 34,012 | 14,795 |
| Geospace Technologies Corp. (a) | | 8,177 | 64,435 |
| KLX Energy Services Holdings, Inc. (a)(b) | | 100,470 | 148,696 |
| Patterson-UTI Energy, Inc. | | 72,637 | 268,031 |
| SAExploration Holdings, Inc. (a)(b) | | 48,225 | 78,125 |
| Smart Sand, Inc. (a)(b) | | 82,648 | 87,607 |
| | | | 661,689 |
| Oil, Gas & Consumable Fuels - 0.2% | | | |
| Alliance Resource Partners LP | | 37,274 | 118,159 |
| Altus Midstream Co. (a)(b) | | 112,996 | 77,967 |
| Amplify Energy Corp. New warrants 5/4/22 (a) | | 322 | 5 |
| Blueknight Energy Partners LP | | 44,338 | 61,630 |
| Centennial Resource Development, Inc. Class A (a) | | 198,625 | 200,611 |
| Clean Energy Fuels Corp. (a) | | 88,851 | 185,699 |
| Diamondback Energy, Inc. | | 30,285 | 1,289,535 |
| Extraction Oil & Gas, Inc. (a)(b) | | 225,638 | 65,435 |
| National Energy Services Reunited Corp. (a)(b) | | 28,417 | 161,409 |
| Nextdecade Corp. (a)(b) | | 29,365 | 44,341 |
| Noble Energy, Inc. | | 95,502 | 833,732 |
| Pacific Ethanol, Inc. (a) | | 142,466 | 95,025 |
| PDC Energy, Inc. (a) | | 24,417 | 297,399 |
| Rosehill Resources, Inc. (a)(b) | | 128,821 | 43,245 |
| StealthGas, Inc. (a) | | 18,277 | 48,617 |
| Tellurian, Inc. (a)(b) | | 93,210 | 93,201 |
| Viper Energy Partners LP | | 22,706 | 238,186 |
| Westwater Resources, Inc. (a)(b) | | 26,701 | 59,543 |
| | | | 3,913,739 |
|
| TOTAL ENERGY | | | 4,575,428 |
|
| FINANCIALS - 4.4% | | | |
| Banks - 1.6% | | | |
| 1st Source Corp. | | 7,300 | 252,507 |
| Ameris Bancorp | | 14,522 | 351,868 |
| BancFirst Corp. | | 8,247 | 314,376 |
| Bank OZK (b) | | 20,469 | 460,348 |
| Banner Corp. | | 8,948 | 336,087 |
| BOK Financial Corp. (b) | | 13,690 | 697,369 |
| Boston Private Financial Holdings, Inc. | | 25,876 | 177,768 |
| Bridge Bancorp, Inc. | | 7,860 | 167,418 |
| Brookline Bancorp, Inc., Delaware | | 23,659 | 220,029 |
| Camden National Corp. | | 5,560 | 186,482 |
| Cathay General Bancorp | | 16,541 | 449,750 |
| Centerstate Banks of Florida, Inc. | | 25,981 | 410,500 |
| City Holding Co. | | 4,373 | 275,062 |
| Columbia Banking Systems, Inc. | | 15,054 | 366,715 |
| Commerce Bancshares, Inc. (b) | | 21,307 | 1,357,895 |
| Community Trust Bancorp, Inc. | | 5,968 | 195,989 |
| ConnectOne Bancorp, Inc. | | 12,650 | 185,449 |
| CVB Financial Corp. | | 29,035 | 566,473 |
| Eagle Bancorp, Inc. | | 7,916 | 256,162 |
| East West Bancorp, Inc. (b) | | 27,787 | 971,156 |
| Enterprise Bancorp, Inc. | | 3,398 | 78,290 |
| Enterprise Financial Services Corp. | | 7,956 | 233,668 |
| Farmers & Merchants Bancorp, Inc. | | 2,033 | 44,177 |
| Fifth Third Bancorp | | 123,115 | 2,387,200 |
| First Bancorp, North Carolina | | 8,876 | 225,628 |
| First Busey Corp. | | 14,174 | 253,856 |
| First Citizens Bancshares, Inc. | | 1,883 | 724,955 |
| First Financial Bancorp, Ohio | | 21,223 | 282,054 |
| First Financial Bankshares, Inc. | | 26,712 | 818,456 |
| First Financial Corp., Indiana | | 5,031 | 176,588 |
| First Hawaiian, Inc. | | 26,209 | 452,105 |
| First Internet Bancorp | | 7,264 | 116,805 |
| First Interstate Bancsystem, Inc. | | 7,975 | 249,219 |
| First Merchants Corp. | | 11,585 | 325,075 |
| First Midwest Bancorp, Inc., Delaware | | 23,812 | 310,747 |
| First of Long Island Corp. | | 9,012 | 137,613 |
| Flushing Financial Corp. | | 11,514 | 130,569 |
| Fulton Financial Corp. | | 34,385 | 385,456 |
| German American Bancorp, Inc. | | 7,835 | 242,728 |
| Glacier Bancorp, Inc. | | 18,339 | 755,383 |
| Great Southern Bancorp, Inc. | | 4,802 | 194,769 |
| Grupo Financiero Galicia SA sponsored ADR (b) | | 18,972 | 151,966 |
| Hancock Whitney Corp. | | 13,213 | 285,665 |
| HarborOne Bancorp, Inc. | | 21,236 | 169,251 |
| Heartland Financial U.S.A., Inc. | | 8,751 | 280,120 |
| Home Bancshares, Inc. | | 34,186 | 494,671 |
| Hope Bancorp, Inc. | | 31,405 | 298,190 |
| Howard Bancorp, Inc. (a) | | 8,407 | 86,676 |
| Huntington Bancshares, Inc. | | 174,270 | 1,549,260 |
| IBERIABANK Corp. | | 8,115 | 344,157 |
| Independent Bank Corp., Massachusetts | | 7,296 | 506,853 |
| Independent Bank Group, Inc. | | 11,374 | 430,847 |
| International Bancshares Corp. | | 14,664 | 451,358 |
| Investar Holding Corp. | | 3,593 | 46,889 |
| Investors Bancorp, Inc. | | 54,536 | 473,372 |
| Lakeland Bancorp, Inc. | | 17,336 | 192,430 |
| Lakeland Financial Corp. (b) | | 6,784 | 289,609 |
| Live Oak Bancshares, Inc. (b) | | 12,397 | 167,855 |
| Mid Penn Bancorp, Inc. | | 3,946 | 73,632 |
| NBT Bancorp, Inc. | | 10,735 | 336,220 |
| OceanFirst Financial Corp. | | 15,705 | 262,274 |
| Old National Bancorp, Indiana | | 35,069 | 476,588 |
| Opus Bank | | 11,412 | 222,420 |
| Pacific Premier Bancorp, Inc. (b) | | 13,490 | 291,654 |
| PacWest Bancorp (b) | | 19,845 | 343,517 |
| People's Utah Bancorp | | 7,507 | 185,948 |
| Peoples Financial Services Corp. | | 846 | 27,960 |
| Peoples United Financial, Inc. | | 79,628 | 911,741 |
| Pinnacle Financial Partners, Inc. | | 12,178 | 485,293 |
| Popular, Inc. | | 16,363 | 646,175 |
| Preferred Bank, Los Angeles | | 5,112 | 192,058 |
| Renasant Corp. | | 12,868 | 310,376 |
| Republic Bancorp, Inc., Kentucky Class A | | 6,170 | 197,749 |
| S&T Bancorp, Inc. | | 9,972 | 221,777 |
| Sandy Spring Bancorp, Inc. | | 10,120 | 245,410 |
| Seacoast Banking Corp., Florida (a) | | 13,465 | 292,864 |
| ServisFirst Bancshares, Inc. | | 12,242 | 427,001 |
| Signature Bank | | 9,659 | 994,008 |
| Simmons First National Corp. Class A | | 23,838 | 408,822 |
| South State Corp. | | 7,118 | 374,193 |
| Southside Bancshares, Inc. | | 9,162 | 258,368 |
| Stock Yards Bancorp, Inc. | | 6,877 | 234,024 |
| SVB Financial Group (a) | | 8,848 | 1,900,108 |
| TCF Financial Corp. | | 25,296 | 731,560 |
| Texas Capital Bancshares, Inc. (a) | | 10,537 | 281,970 |
| The First Bancorp, Inc. | | 2,649 | 54,596 |
| TowneBank | | 12,516 | 236,052 |
| Trico Bancshares | | 8,733 | 247,755 |
| Trustmark Corp. | | 14,115 | 335,796 |
| UMB Financial Corp. | | 10,017 | 513,672 |
| Umpqua Holdings Corp. | | 34,140 | 388,855 |
| Union Bankshares Corp. | | 16,860 | 390,309 |
| United Bankshares, Inc., West Virginia | | 23,155 | 673,347 |
| United Community Bank, Inc. (b) | | 17,090 | 334,110 |
| Univest Corp. of Pennsylvania | | 10,716 | 176,171 |
| Valley National Bancorp | | 74,573 | 595,093 |
| Veritex Holdings, Inc. | | 12,244 | 214,515 |
| Washington Trust Bancorp, Inc. | | 6,014 | 192,268 |
| WesBanco, Inc. | | 14,661 | 314,039 |
| Westamerica Bancorp. (b) | | 6,376 | 376,056 |
| Wintrust Financial Corp. | | 8,808 | 373,107 |
| Zions Bancorp NA | | 27,066 | 890,607 |
| | | | 40,583,971 |
| Capital Markets - 1.7% | | | |
| BGC Partners, Inc. Class A (b) | | 84,793 | 218,342 |
| Blucora, Inc. (a) | | 15,044 | 182,785 |
| Carlyle Group LP (b) | | 65,725 | 1,817,954 |
| CME Group, Inc. | | 64,195 | 11,722,007 |
| Diamond Hill Investment Group, Inc. | | 1,391 | 145,999 |
| E*TRADE Financial Corp. | | 38,174 | 1,738,444 |
| Hamilton Lane, Inc. Class A | | 6,659 | 487,239 |
| Interactive Brokers Group, Inc. | | 15,828 | 670,316 |
| LPL Financial | | 15,403 | 1,099,620 |
| MarketAxess Holdings, Inc. | | 6,954 | 3,536,735 |
| Morningstar, Inc. | | 8,225 | 1,261,057 |
| Northern Trust Corp. | | 38,541 | 3,045,124 |
| SEI Investments Co. | | 28,325 | 1,535,782 |
| T. Rowe Price Group, Inc. | | 42,230 | 5,105,607 |
| TD Ameritrade Holding Corp. | | 97,582 | 3,636,881 |
| The NASDAQ OMX Group, Inc. | | 29,915 | 3,543,731 |
| Tradeweb Markets, Inc. Class A | | 14,930 | 984,783 |
| Virtu Financial, Inc. Class A (b) | | 25,454 | 607,078 |
| XP, Inc. Class A (a) | | 65,717 | 1,995,168 |
| | | | 43,334,652 |
| Consumer Finance - 0.2% | | | |
| Credit Acceptance Corp. (a)(b) | | 3,095 | 1,144,593 |
| Encore Capital Group, Inc. (a)(b) | | 8,052 | 255,812 |
| EZCORP, Inc. (non-vtg.) Class A (a) | | 26,400 | 136,224 |
| First Cash Financial Services, Inc. | | 8,594 | 599,603 |
| LendingTree, Inc. (a)(b) | | 2,580 | 670,852 |
| LexinFintech Holdings Ltd. ADR (a) | | 23,192 | 189,015 |
| Navient Corp. | | 46,534 | 346,213 |
| PRA Group, Inc. (a)(b) | | 10,691 | 364,777 |
| SLM Corp. | | 78,434 | 594,530 |
| | | | 4,301,619 |
| Insurance - 0.7% | | | |
| American National Insurance Co. | | 5,573 | 418,811 |
| Amerisafe, Inc. | | 4,707 | 288,916 |
| Arch Capital Group Ltd. (a) | | 70,221 | 1,981,637 |
| Brighthouse Financial, Inc. (a) | | 20,404 | 606,203 |
| Cincinnati Financial Corp. | | 29,312 | 1,727,942 |
| eHealth, Inc. (a) | | 4,919 | 641,536 |
| Enstar Group Ltd. (a) | | 3,227 | 459,525 |
| Erie Indemnity Co. Class A (b) | | 8,731 | 1,573,675 |
| Fanhua, Inc. ADR | | 9,307 | 174,879 |
| James River Group Holdings Ltd. | | 8,043 | 311,023 |
| Kinsale Capital Group, Inc. | | 4,597 | 686,424 |
| National General Holdings Corp. | | 24,075 | 488,723 |
| National Western Life Group, Inc. | | 1,054 | 206,510 |
| Palomar Holdings, Inc. (a) | | 5,778 | 429,999 |
| Principal Financial Group, Inc. | | 48,810 | 1,885,042 |
| Safety Insurance Group, Inc. | | 3,871 | 295,125 |
| Selective Insurance Group, Inc. | | 9,630 | 505,094 |
| State Auto Financial Corp. | | 12,066 | 240,596 |
| Trupanion, Inc. (a)(b) | | 8,871 | 267,195 |
| United Fire Group, Inc. | | 7,714 | 206,967 |
| United Insurance Holdings Corp. | | 18,151 | 142,304 |
| Willis Group Holdings PLC | | 22,628 | 4,591,221 |
| | | | 18,129,347 |
| Mortgage Real Estate Investment Trusts - 0.0% | | | |
| AGNC Investment Corp. | | 92,273 | 1,194,013 |
| New York Mortgage Trust, Inc. | | 73,054 | 151,952 |
| | | | 1,345,965 |
| Thrifts & Mortgage Finance - 0.2% | | | |
| Capitol Federal Financial, Inc. | | 32,772 | 384,252 |
| HomeStreet, Inc. | | 8,200 | 195,324 |
| Kearny Financial Corp. | | 25,397 | 217,652 |
| Meridian Bancorp, Inc. Maryland | | 17,192 | 198,052 |
| Meta Financial Group, Inc. | | 11,067 | 200,534 |
| NMI Holdings, Inc. (a) | | 18,646 | 286,496 |
| Northfield Bancorp, Inc. | | 16,799 | 183,613 |
| Northwest Bancshares, Inc. | | 27,925 | 278,133 |
| TFS Financial Corp. | | 55,890 | 861,265 |
| Trustco Bank Corp., New York | | 32,373 | 203,950 |
| Washington Federal, Inc. | | 17,176 | 444,171 |
| WMI Holdings Corp. (a) | | 25,168 | 280,623 |
| WSFS Financial Corp. | | 12,372 | 342,333 |
| | | | 4,076,398 |
|
| TOTAL FINANCIALS | | | 111,771,952 |
|
| HEALTH CARE - 10.9% | | | |
| Biotechnology - 6.5% | | | |
| ACADIA Pharmaceuticals, Inc. (a) | | 28,865 | 1,434,013 |
| Acceleron Pharma, Inc. (a) | | 10,359 | 1,023,780 |
| ADMA Biologics, Inc. (a)(b) | | 59,414 | 195,472 |
| Aduro Biotech, Inc. (a) | | 65,308 | 213,557 |
| Agios Pharmaceuticals, Inc. (a) | | 14,018 | 725,291 |
| Aileron Therapeutics, Inc. (a) | | 76,558 | 124,024 |
| Aimmune Therapeutics, Inc. (a)(b) | | 16,419 | 272,720 |
| Akebia Therapeutics, Inc. (a) | | 34,792 | 404,979 |
| Aldeyra Therapeutics, Inc. (a)(b) | | 30,923 | 152,141 |
| Alector, Inc. (a)(b) | | 17,110 | 559,497 |
| Alexion Pharmaceuticals, Inc. (a) | | 40,420 | 4,846,358 |
| Alkermes PLC (a) | | 31,562 | 516,354 |
| Allakos, Inc. (a)(b) | | 9,911 | 644,215 |
| Allena Pharmaceuticals, Inc. (a) | | 67,231 | 112,948 |
| Allogene Therapeutics, Inc. (a)(b) | | 24,120 | 1,161,619 |
| Alnylam Pharmaceuticals, Inc. (a) | | 20,720 | 2,802,794 |
| Amarin Corp. PLC ADR (a)(b) | | 61,911 | 424,709 |
| Amgen, Inc. | | 105,581 | 24,251,956 |
| Amicus Therapeutics, Inc. (a)(b) | | 52,426 | 654,014 |
| Apellis Pharmaceuticals, Inc. (a) | | 15,320 | 516,131 |
| Applied Therapeutics, Inc. (a)(b) | | 6,114 | 278,309 |
| Arbutus Biopharma Corp. (a)(b) | | 78,780 | 170,953 |
| Arena Pharmaceuticals, Inc. (a) | | 10,607 | 633,980 |
| Argenx SE ADR (a) | | 4,667 | 1,023,473 |
| Arrowhead Pharmaceuticals, Inc. (a) | | 19,031 | 613,559 |
| Ascendis Pharma A/S sponsored ADR (a) | | 8,767 | 1,275,511 |
| Atara Biotherapeutics, Inc. (a) | | 28,587 | 328,751 |
| Athenex, Inc. (a)(b) | | 20,027 | 217,693 |
| Aurinia Pharmaceuticals, Inc. (a) | | 23,612 | 374,722 |
| AVROBIO, Inc. (a) | | 12,279 | 248,281 |
| Axovant Gene Therapies Ltd. (a)(b) | | 29,979 | 95,633 |
| BeiGene Ltd. ADR (a) | | 8,043 | 1,331,438 |
| Bellicum Pharmaceuticals, Inc. (a)(b) | | 13,350 | 101,861 |
| BeyondSpring, Inc. (a) | | 9,953 | 169,201 |
| BioCryst Pharmaceuticals, Inc. (a)(b) | | 54,937 | 246,942 |
| Biogen, Inc. (a) | | 30,999 | 9,519,483 |
| BioMarin Pharmaceutical, Inc. (a) | | 33,069 | 3,523,502 |
| bluebird bio, Inc. (a) | | 11,483 | 730,663 |
| Blueprint Medicines Corp. (a) | | 11,020 | 717,843 |
| Bridgebio Pharma, Inc. (b) | | 24,562 | 720,403 |
| CareDx, Inc. (a)(b) | | 10,508 | 337,517 |
| Cellectis SA sponsored ADR (a) | | 11,354 | 209,708 |
| ChemoCentryx, Inc. (a) | | 11,894 | 742,067 |
| Chimerix, Inc. (a) | | 62,326 | 194,457 |
| China Biologic Products Holdings, Inc. (a) | | 6,143 | 680,460 |
| Clementia Pharmaceuticals, Inc. rights (a)(c) | | 20,215 | 27,290 |
| Coherus BioSciences, Inc. (a) | | 17,417 | 324,653 |
| Constellation Pharmaceuticals, Inc. (a) | | 9,633 | 342,260 |
| Cortexyme, Inc. (b) | | 7,045 | 324,704 |
| Corvus Pharmaceuticals, Inc. (a)(b) | | 32,532 | 112,235 |
| CRISPR Therapeutics AG (a)(b) | | 12,226 | 789,555 |
| Cyclerion Therapeutics, Inc. (a)(b) | | 52,765 | 210,005 |
| Cytokinetics, Inc. (a)(b) | | 15,984 | 331,029 |
| CytomX Therapeutics, Inc. (a) | | 24,335 | 215,608 |
| Deciphera Pharmaceuticals, Inc. (a) | | 10,631 | 622,658 |
| Denali Therapeutics, Inc. (a)(b) | | 26,847 | 747,152 |
| Dicerna Pharmaceuticals, Inc. (a) | | 16,869 | 363,864 |
| Diffusion Pharmaceuticals, Inc. (a) | | 150,578 | 195,751 |
| Eagle Pharmaceuticals, Inc. (a) | | 3,973 | 203,656 |
| Editas Medicine, Inc. (a)(b) | | 12,307 | 333,150 |
| Eidos Therapeutics, Inc. (a)(b) | | 8,027 | 392,601 |
| Enanta Pharmaceuticals, Inc. (a) | | 5,064 | 260,745 |
| Epizyme, Inc. (a)(b) | | 20,870 | 366,269 |
| Esperion Therapeutics, Inc. (a)(b) | | 6,375 | 270,109 |
| Exact Sciences Corp. (a) | | 27,595 | 2,369,859 |
| Exelixis, Inc. (a) | | 57,829 | 1,428,955 |
| Exicure, Inc. (a) | | 54,159 | 150,020 |
| Fate Therapeutics, Inc. (a) | | 16,436 | 533,019 |
| FibroGen, Inc. (a) | | 16,365 | 547,246 |
| Five Prime Therapeutics, Inc. (a) | | 41,491 | 219,902 |
| G1 Therapeutics, Inc. (a) | | 10,955 | 185,906 |
| Galapagos Genomics NV sponsored ADR (a)(b) | | 1,233 | 250,028 |
| Gilead Sciences, Inc. | | 225,899 | 17,581,719 |
| Global Blood Therapeutics, Inc. (a)(b) | | 11,940 | 834,845 |
| GlycoMimetics, Inc. (a) | | 38,409 | 108,697 |
| Gossamer Bio, Inc. (a) | | 22,850 | 277,628 |
| Grifols SA ADR | | 26,199 | 495,947 |
| Gritstone Oncology, Inc. (a)(b) | | 18,268 | 118,011 |
| Halozyme Therapeutics, Inc. (a) | | 28,310 | 687,084 |
| Heron Therapeutics, Inc. (a)(b) | | 20,631 | 375,897 |
| Homology Medicines, Inc. (a) | | 13,757 | 195,900 |
| IGM Biosciences, Inc. (a)(b) | | 5,854 | 379,222 |
| ImmunoGen, Inc. (a) | | 58,073 | 271,782 |
| Immunomedics, Inc. (a)(b) | | 40,790 | 1,370,136 |
| Incyte Corp. (a) | | 39,647 | 4,040,426 |
| InflaRx NV (a)(b) | | 27,132 | 239,304 |
| Insmed, Inc. (a)(b) | | 20,485 | 497,581 |
| Intercept Pharmaceuticals, Inc. (a)(b) | | 6,688 | 483,275 |
| Ionis Pharmaceuticals, Inc. (a)(b) | | 25,224 | 1,417,841 |
| Iovance Biotherapeutics, Inc. (a)(b) | | 24,981 | 801,640 |
| Ironwood Pharmaceuticals, Inc. Class A (a)(b) | | 35,773 | 348,071 |
| Kalvista Pharmaceuticals, Inc. (a) | | 11,120 | 125,100 |
| Karuna Therapeutics, Inc. (a)(b) | | 5,626 | 528,056 |
| Karyopharm Therapeutics, Inc. (a) | | 16,332 | 301,979 |
| Kiniksa Pharmaceuticals Ltd. (a)(b) | | 9,855 | 205,674 |
| Kodiak Sciences, Inc. (a)(b) | | 9,384 | 606,300 |
| Lexicon Pharmaceuticals, Inc. (a)(b) | | 45,979 | 87,820 |
| Ligand Pharmaceuticals, Inc.: | | | |
| Class B (a)(b) | | 3,265 | 331,626 |
| General CVR (a) | | 1,530 | 20 |
| Glucagon CVR (a) | | 1,530 | 21 |
| rights (a) | | 1,530 | 21 |
| TR Beta CVR (a) | | 1,530 | 367 |
| Macrogenics, Inc. (a) | | 14,139 | 272,034 |
| Madrigal Pharmaceuticals, Inc. (a) | | 2,812 | 326,248 |
| Magenta Therapeutics, Inc. (a) | | 14,194 | 125,475 |
| Marker Therapeutics, Inc. (a)(b) | | 45,135 | 102,456 |
| Minerva Neurosciences, Inc. (a) | | 19,919 | 73,899 |
| Mirati Therapeutics, Inc. (a) | | 8,587 | 851,745 |
| Moderna, Inc. (a) | | 66,979 | 4,119,209 |
| Momenta Pharmaceuticals, Inc. (a) | | 23,602 | 742,991 |
| Myriad Genetics, Inc. (a) | | 19,089 | 277,363 |
| Natera, Inc. (a) | | 15,931 | 698,574 |
| Neurocrine Biosciences, Inc. (a) | | 17,189 | 2,144,500 |
| NextCure, Inc. (b) | | 6,622 | 206,673 |
| Novavax, Inc. (a) | | 10,372 | 477,527 |
| NuCana PLC ADR (a)(b) | | 13,541 | 84,902 |
| Opko Health, Inc. (a)(b) | | 150,282 | 342,643 |
| Organogenesis Holdings, Inc. Class A (a) | | 18,427 | 76,104 |
| Ovid Therapeutics, Inc. (a)(b) | | 32,887 | 175,945 |
| Precigen, Inc. (a)(b) | | 55,758 | 122,668 |
| Principia Biopharma, Inc. (a) | | 6,838 | 436,880 |
| ProQR Therapeutics BV (a)(b) | | 24,820 | 137,999 |
| Prothena Corp. PLC (a) | | 14,923 | 159,079 |
| PTC Therapeutics, Inc. (a) | | 12,729 | 645,488 |
| Regeneron Pharmaceuticals, Inc. (a) | | 19,275 | 11,811,913 |
| REGENXBIO, Inc. (a) | | 9,361 | 352,535 |
| Repligen Corp. (a) | | 9,981 | 1,307,212 |
| Replimune Group, Inc. (a) | | 11,498 | 215,932 |
| Revolution Medicines, Inc. (b) | | 12,877 | 395,581 |
| Rocket Pharmaceuticals, Inc. (a)(b) | | 20,219 | 380,319 |
| Rubius Therapeutics, Inc. (a)(b) | | 31,954 | 206,103 |
| Sage Therapeutics, Inc. (a) | | 10,500 | 375,060 |
| Sangamo Therapeutics, Inc. (a) | | 29,011 | 324,633 |
| Sarepta Therapeutics, Inc. (a) | | 14,490 | 2,206,392 |
| Savara, Inc. (a) | | 50,673 | 123,642 |
| Seattle Genetics, Inc. (a) | | 31,336 | 4,926,333 |
| Sellas Life Sciences Group, Inc. (a)(b) | | 34,771 | 119,265 |
| Seres Therapeutics, Inc. (a)(b) | | 37,600 | 206,424 |
| Solid Biosciences, Inc. (a)(b) | | 43,917 | 129,555 |
| Springworks Therapeutics, Inc. (a)(b) | | 11,303 | 430,305 |
| Synlogic, Inc. (a)(b) | | 40,203 | 100,910 |
| T2 Biosystems, Inc. (a)(b) | | 163,099 | 136,889 |
| TCR2 Therapeutics, Inc. (a) | | 11,657 | 117,736 |
| TG Therapeutics, Inc. (a) | | 27,276 | 508,697 |
| Tobira Therapeutics, Inc. rights (a)(c) | | 1,750 | 14,963 |
| Tocagen, Inc. (a) | | 67,993 | 82,272 |
| Turning Point Therapeutics, Inc. (a) | | 7,761 | 537,449 |
| Twist Bioscience Corp. (a)(b) | | 8,860 | 336,237 |
| Ultragenyx Pharmaceutical, Inc. (a)(b) | | 11,541 | 790,097 |
| uniQure B.V. (a) | | 9,225 | 619,551 |
| United Therapeutics Corp. (a) | | 8,568 | 1,010,596 |
| UNITY Biotechnology, Inc. (a)(b) | | 21,484 | 175,739 |
| UroGen Pharma Ltd. (a)(b) | | 7,178 | 168,468 |
| Vertex Pharmaceuticals, Inc. (a) | | 46,650 | 13,433,334 |
| Viela Bio, Inc. (b) | | 10,925 | 512,383 |
| Vir Biotechnology, Inc. (a)(b) | | 21,783 | 744,543 |
| Voyager Therapeutics, Inc. (a) | | 29,418 | 355,958 |
| Xencor, Inc. (a) | | 12,824 | 387,926 |
| Y-mAbs Therapeutics, Inc. (a) | | 9,315 | 355,647 |
| Zai Lab Ltd. ADR (a) | | 9,574 | 712,306 |
| | | | 167,566,508 |
| Health Care Equipment & Supplies - 2.0% | | | |
| Abiomed, Inc. (a) | | 8,507 | 1,904,717 |
| Accelerate Diagnostics, Inc. (a)(b) | | 19,640 | 163,994 |
| Align Technology, Inc. (a) | | 14,453 | 3,549,946 |
| Atricure, Inc. (a) | | 8,872 | 424,170 |
| Atrion Corp. (b) | | 462 | 296,599 |
| Cardiovascular Systems, Inc. (a) | | 8,390 | 324,861 |
| Dentsply Sirona, Inc. | | 40,314 | 1,875,407 |
| DexCom, Inc. (a) | | 16,579 | 6,272,001 |
| electroCore, Inc. (a) | | 104,052 | 96,716 |
| Heska Corp. (a)(b) | | 2,474 | 217,539 |
| Hologic, Inc. (a) | | 48,717 | 2,582,001 |
| ICU Medical, Inc. (a) | | 4,095 | 817,444 |
| IDEXX Laboratories, Inc. (a) | | 15,544 | 4,801,231 |
| Inari Medical, Inc. | | 7,833 | 344,652 |
| InMode Ltd. (a)(b) | | 9,185 | 269,212 |
| Insulet Corp. (a) | | 11,503 | 2,169,121 |
| Integra LifeSciences Holdings Corp. (a) | | 16,816 | 876,282 |
| Intuitive Surgical, Inc. (a) | | 20,893 | 12,118,567 |
| iRhythm Technologies, Inc. (a) | | 5,503 | 684,078 |
| LeMaitre Vascular, Inc. (b) | | 7,036 | 189,198 |
| LivaNova PLC (a) | | 10,254 | 548,486 |
| Masimo Corp. (a) | | 10,022 | 2,407,184 |
| Merit Medical Systems, Inc. (a)(b) | | 11,898 | 535,291 |
| Natus Medical, Inc. (a)(b) | | 9,390 | 200,946 |
| Neogen Corp. (a) | | 10,739 | 764,832 |
| Novocure Ltd. (a) | | 19,140 | 1,290,610 |
| NuVasive, Inc. (a) | | 10,531 | 638,179 |
| Orthofix International NV (a) | | 5,932 | 202,163 |
| Quidel Corp. (a) | | 7,980 | 1,396,500 |
| Shockwave Medical, Inc. (a) | | 7,639 | 336,192 |
| Silk Road Medical, Inc. (a) | | 7,837 | 299,922 |
| SmileDirectClub, Inc. (a)(b) | | 32,207 | 251,537 |
| Staar Surgical Co. (a)(b) | | 10,272 | 398,554 |
| Tactile Systems Technology, Inc. (a)(b) | | 5,158 | 249,905 |
| Tandem Diabetes Care, Inc. (a) | | 11,767 | 978,426 |
| Varex Imaging Corp. (a) | | 11,502 | 215,778 |
| Wright Medical Group NV (a) | | 25,436 | 751,634 |
| | | | 51,443,875 |
| Health Care Providers & Services - 0.5% | | | |
| 1Life Healthcare, Inc. (a)(b) | | 25,163 | 812,765 |
| Acadia Healthcare Co., Inc. (a) | | 19,171 | 548,482 |
| Addus HomeCare Corp. (a) | | 3,677 | 363,876 |
| Amedisys, Inc. (a) | | 6,208 | 1,192,246 |
| BioScrip, Inc. (a)(b) | | 37,626 | 571,915 |
| BioTelemetry, Inc. (a) | | 7,894 | 372,439 |
| Corvel Corp. (a) | | 4,205 | 285,477 |
| Covetrus, Inc. (a) | | 26,271 | 401,421 |
| Guardant Health, Inc. (a) | | 17,700 | 1,599,903 |
| HealthEquity, Inc. (a) | | 14,200 | 879,974 |
| Henry Schein, Inc. (a) | | 24,868 | 1,509,985 |
| LHC Group, Inc. (a) | | 6,184 | 1,004,962 |
| Magellan Health Services, Inc. (a) | | 5,402 | 405,096 |
| National Research Corp. Class A | | 6,083 | 345,028 |
| Patterson Companies, Inc. (b) | | 21,900 | 431,211 |
| Pennant Group, Inc. (a) | | 8,465 | 215,773 |
| Premier, Inc. (a)(b) | | 13,718 | 477,249 |
| Progyny, Inc. (a) | | 18,295 | 456,643 |
| R1 RCM, Inc. (a) | | 26,953 | 285,971 |
| The Ensign Group, Inc. | | 11,658 | 509,688 |
| | | | 12,670,104 |
| Health Care Technology - 0.4% | | | |
| Allscripts Healthcare Solutions, Inc. (a) | | 38,859 | 245,589 |
| Cerner Corp. | | 57,028 | 4,157,341 |
| Change Healthcare, Inc. | | 57,473 | 717,263 |
| Health Catalyst, Inc. (b) | | 9,815 | 266,379 |
| HMS Holdings Corp. (a) | | 18,796 | 587,187 |
| Inovalon Holdings, Inc. Class A (a)(b) | | 18,695 | 351,840 |
| Livongo Health, Inc. (b) | | 18,832 | 1,128,602 |
| Nextgen Healthcare, Inc. (a) | | 20,526 | 211,828 |
| Omnicell, Inc. (a) | | 8,589 | 574,690 |
| Schrodinger, Inc. (b) | | 9,039 | 618,720 |
| Tabula Rasa HealthCare, Inc. (a)(b) | | 5,394 | 288,201 |
| | | | 9,147,640 |
| Life Sciences Tools & Services - 0.8% | | | |
| 10X Genomics, Inc. (a) | | 9,770 | 761,767 |
| Adaptive Biotechnologies Corp. | | 23,223 | 898,730 |
| Bio-Techne Corp. | | 7,178 | 1,900,734 |
| BioNano Genomics, Inc. (a)(b) | | 209,443 | 94,040 |
| Bruker Corp. | | 27,432 | 1,187,257 |
| ICON PLC (a) | | 9,148 | 1,540,981 |
| Illumina, Inc. (a) | | 26,258 | 9,532,967 |
| Luminex Corp. | | 10,463 | 326,027 |
| Medpace Holdings, Inc. (a) | | 7,390 | 685,940 |
| NeoGenomics, Inc. (a)(b) | | 21,260 | 567,429 |
| Pacific Biosciences of California, Inc. (a)(b) | | 45,258 | 159,308 |
| PPD, Inc. | | 61,214 | 1,667,469 |
| PRA Health Sciences, Inc. (a) | | 12,272 | 1,270,152 |
| Syneos Health, Inc. (a) | | 20,126 | 1,227,485 |
| | | | 21,820,286 |
| Pharmaceuticals - 0.7% | | | |
| AcelRx Pharmaceuticals, Inc. (a) | | 75,544 | 105,006 |
| Aclaris Therapeutics, Inc. (a)(b) | | 73,002 | 102,933 |
| Adamis Pharmaceuticals Corp. (a)(b) | | 232,779 | 114,783 |
| Aerie Pharmaceuticals, Inc. (a)(b) | | 13,597 | 190,766 |
| Akcea Therapeutics, Inc. (a)(b) | | 21,631 | 322,302 |
| Amphastar Pharmaceuticals, Inc. (a)(b) | | 12,990 | 242,134 |
| ANI Pharmaceuticals, Inc. rights (a)(c) | | 739 | 0 |
| Arvinas Holding Co. LLC (a) | | 8,704 | 289,582 |
| Assertio Holdings, Inc. (a)(b) | | 133,767 | 131,975 |
| AstraZeneca PLC rights (a)(c) | | 1,845 | 0 |
| Axsome Therapeutics, Inc. (a) | | 7,409 | 570,345 |
| Corcept Therapeutics, Inc. (a)(b) | | 26,468 | 400,726 |
| Cronos Group, Inc. (a)(b) | | 75,384 | 494,402 |
| CymaBay Therapeutics, Inc. (a)(b) | | 77,195 | 286,007 |
| Dova Pharmaceuticals, Inc. rights (a)(c) | | 7,729 | 4,174 |
| Eloxx Pharmaceuticals, Inc. (a)(b) | | 30,808 | 104,439 |
| Endo International PLC (a)(b) | | 56,731 | 218,982 |
| EyeGate Pharmaceuticals, Inc. (a) | | 22,182 | 113,350 |
| GW Pharmaceuticals PLC ADR (a)(b) | | 5,996 | 736,009 |
| Horizon Pharma PLC (a) | | 35,825 | 1,817,402 |
| Innoviva, Inc. (a) | | 23,787 | 332,304 |
| Intra-Cellular Therapies, Inc. (a)(b) | | 16,529 | 345,126 |
| Jazz Pharmaceuticals PLC (a) | | 10,459 | 1,247,968 |
| Mylan NV (a) | | 97,533 | 1,664,888 |
| MyoKardia, Inc. (a) | | 9,411 | 962,651 |
| Nektar Therapeutics (a)(b) | | 33,817 | 733,829 |
| OptiNose, Inc. (a)(b) | | 28,800 | 124,416 |
| Pacira Biosciences, Inc. (a) | | 9,410 | 413,570 |
| Paratek Pharmaceuticals, Inc. (a)(b) | | 44,448 | 197,349 |
| Reata Pharmaceuticals, Inc. (a)(b) | | 5,252 | 763,221 |
| resTORbio, Inc. (a)(b) | | 111,435 | 241,814 |
| Revance Therapeutics, Inc. (a)(b) | | 15,645 | 326,981 |
| Sanofi SA sponsored ADR | | 39,006 | 1,915,585 |
| Supernus Pharmaceuticals, Inc. (a) | | 13,000 | 313,560 |
| Tetraphase Pharmaceuticals, Inc. (a) | | 32,907 | 71,079 |
| TherapeuticsMD, Inc. (a)(b) | | 139,587 | 157,733 |
| Theravance Biopharma, Inc. (a)(b) | | 14,294 | 360,924 |
| Tilray, Inc. Class 2 (a)(b) | | 31,597 | 311,230 |
| Tricida, Inc. (a)(b) | | 11,620 | 312,113 |
| Verrica Pharmaceuticals, Inc. (a)(b) | | 11,056 | 126,923 |
| Zogenix, Inc. (a) | | 10,914 | 317,925 |
| | | | 17,486,506 |
|
| TOTAL HEALTH CARE | | | 280,134,919 |
|
| INDUSTRIALS - 3.4% | | | |
| Aerospace & Defense - 0.1% | | | |
| AeroVironment, Inc. (a) | | 5,545 | 392,752 |
| Axon Enterprise, Inc. (a) | | 11,665 | 886,073 |
| Elbit Systems Ltd. (b) | | 8,484 | 1,195,311 |
| Kratos Defense & Security Solutions, Inc. (a) | | 23,685 | 439,357 |
| Mercury Systems, Inc. (a)(b) | | 10,589 | 946,127 |
| | | | 3,859,620 |
| Air Freight & Logistics - 0.2% | | | |
| Air Transport Services Group, Inc. (a) | | 14,753 | 317,780 |
| Atlas Air Worldwide Holdings, Inc. (a) | | 6,919 | 270,256 |
| C.H. Robinson Worldwide, Inc. | | 23,158 | 1,878,809 |
| Expeditors International of Washington, Inc. | | 30,535 | 2,331,958 |
| Forward Air Corp. | | 6,328 | 314,375 |
| Hub Group, Inc. Class A (a) | | 7,570 | 354,049 |
| | | | 5,467,227 |
| Airlines - 0.2% | | | |
| Allegiant Travel Co. (b) | | 3,475 | 370,261 |
| American Airlines Group, Inc. (b) | | 69,917 | 734,129 |
| Hawaiian Holdings, Inc. (b) | | 9,827 | 141,804 |
| JetBlue Airways Corp. (a) | | 49,956 | 503,057 |
| Ryanair Holdings PLC sponsored ADR (a) | | 18,932 | 1,358,750 |
| SkyWest, Inc. | | 11,277 | 361,653 |
| United Airlines Holdings, Inc. (a)(b) | | 51,892 | 1,455,052 |
| | | | 4,924,706 |
| Building Products - 0.1% | | | |
| AAON, Inc. | | 10,994 | 595,545 |
| American Woodmark Corp. (a) | | 3,795 | 238,174 |
| Apogee Enterprises, Inc. | | 7,358 | 151,943 |
| Builders FirstSource, Inc. (a) | | 21,594 | 449,371 |
| Caesarstone Sdot-Yam Ltd. | | 14,273 | 159,001 |
| Gibraltar Industries, Inc. (a) | | 7,331 | 322,637 |
| Patrick Industries, Inc. (b) | | 5,845 | 303,180 |
| Ufp Industries, Inc. | | 12,655 | 578,713 |
| | | | 2,798,564 |
| Commercial Services & Supplies - 0.5% | | | |
| Casella Waste Systems, Inc. Class A (a) | | 9,898 | 504,303 |
| Cimpress PLC (a)(b) | | 5,764 | 519,509 |
| Cintas Corp. | | 18,305 | 4,538,908 |
| Copart, Inc. (a) | | 42,649 | 3,812,394 |
| Healthcare Services Group, Inc. (b) | | 16,928 | 404,918 |
| Herman Miller, Inc. | | 12,655 | 291,318 |
| Interface, Inc. | | 18,057 | 153,304 |
| Kimball International, Inc. Class B | | 11,847 | 132,568 |
| McGrath RentCorp. | | 5,419 | 302,163 |
| Mobile Mini, Inc. | | 9,897 | 317,100 |
| SP Plus Corp. (a)(b) | | 6,102 | 124,298 |
| Stericycle, Inc. (a) | | 15,252 | 836,267 |
| Tetra Tech, Inc. | | 10,821 | 853,777 |
| U.S. Ecology, Inc. | | 7,192 | 242,155 |
| | | | 13,032,982 |
| Construction & Engineering - 0.0% | | | |
| Aegion Corp. (a)(b) | | 12,840 | 192,728 |
| Primoris Services Corp. | | 13,919 | 232,308 |
| Williams Scotsman Corp. (a)(b) | | 26,620 | 355,111 |
| | | | 780,147 |
| Electrical Equipment - 0.1% | | | |
| Ballard Power Systems, Inc. (a)(b) | | 50,234 | 537,055 |
| Encore Wire Corp. | | 5,310 | 256,420 |
| Sunrun, Inc. (a) | | 27,056 | 451,835 |
| TPI Composites, Inc. (a) | | 10,621 | 220,386 |
| Vicor Corp. (a) | | 5,420 | 330,512 |
| | | | 1,796,208 |
| Industrial Conglomerates - 0.1% | | | |
| Icahn Enterprises LP | | 40,023 | 1,998,348 |
| Raven Industries, Inc. | | 9,109 | 195,388 |
| | | | 2,193,736 |
| Machinery - 0.5% | | | |
| Altra Industrial Motion Corp. | | 14,662 | 454,522 |
| Chart Industries, Inc. (a) | | 8,721 | 342,299 |
| Columbus McKinnon Corp. (NY Shares) | | 6,660 | 202,531 |
| Franklin Electric Co., Inc. | | 9,623 | 488,079 |
| Kornit Digital Ltd. (a) | | 8,400 | 392,700 |
| Lincoln Electric Holdings, Inc. (b) | | 10,002 | 821,864 |
| Middleby Corp. (a) | | 9,099 | 619,642 |
| Nordson Corp. | | 9,842 | 1,853,741 |
| Omega Flex, Inc. (b) | | 3,346 | 342,296 |
| PACCAR, Inc. | | 63,157 | 4,664,776 |
| RBC Bearings, Inc. (a) | | 5,117 | 719,706 |
| Sun Hydraulics Corp. | | 8,236 | 294,602 |
| TriMas Corp. (a) | | 10,847 | 256,532 |
| Woodward, Inc. | | 10,284 | 705,277 |
| | | | 12,158,567 |
| Marine - 0.0% | | | |
| Golden Ocean Group Ltd. (b) | | 48,181 | 148,398 |
| Star Bulk Carriers Corp. (b) | | 27,830 | 141,655 |
| | | | 290,053 |
| Professional Services - 0.5% | | | |
| 51job, Inc. sponsored ADR (a) | | 7,391 | 476,646 |
| CoStar Group, Inc. (a) | | 6,678 | 4,386,110 |
| Exponent, Inc. | | 10,385 | 770,982 |
| Forrester Research, Inc. (a) | | 5,927 | 186,108 |
| Huron Consulting Group, Inc. (a) | | 5,397 | 249,665 |
| ICF International, Inc. | | 4,324 | 283,568 |
| Kelly Services, Inc. Class A (non-vtg.) | | 12,217 | 183,133 |
| Upwork, Inc. (a) | | 24,940 | 310,254 |
| Verisk Analytics, Inc. | | 28,879 | 4,986,826 |
| | | | 11,833,292 |
| Road & Rail - 0.9% | | | |
| AMERCO | | 3,241 | 1,045,223 |
| ArcBest Corp. (b) | | 8,426 | 188,658 |
| Avis Budget Group, Inc. (a)(b) | | 14,278 | 307,405 |
| CSX Corp. | | 137,765 | 9,861,219 |
| Heartland Express, Inc. | | 18,662 | 408,698 |
| J.B. Hunt Transport Services, Inc. | | 18,287 | 2,188,405 |
| Landstar System, Inc. | | 6,246 | 726,160 |
| Lyft, Inc. (a) | | 55,901 | 1,747,465 |
| Marten Transport Ltd. | | 13,256 | 339,221 |
| Old Dominion Freight Lines, Inc. | | 21,445 | 3,669,025 |
| Saia, Inc. (a) | | 5,515 | 598,047 |
| Universal Logistics Holdings, Inc. | | 11,009 | 163,594 |
| Werner Enterprises, Inc. (b) | | 14,321 | 661,917 |
| | | | 21,905,037 |
| Trading Companies & Distributors - 0.2% | | | |
| Beacon Roofing Supply, Inc. (a) | | 12,667 | 311,862 |
| BMC Stock Holdings, Inc. (a) | | 14,894 | 389,776 |
| Fastenal Co. | | 104,660 | 4,318,272 |
| H&E Equipment Services, Inc. | | 8,428 | 144,456 |
| HD Supply Holdings, Inc. (a) | | 29,364 | 931,132 |
| Rush Enterprises, Inc. Class A | | 6,945 | 289,051 |
| | | | 6,384,549 |
|
| TOTAL INDUSTRIALS | | | 87,424,688 |
|
| INFORMATION TECHNOLOGY - 41.9% | | | |
| Communications Equipment - 1.7% | | | |
| Acacia Communications, Inc. (a) | | 8,710 | 587,925 |
| Cisco Systems, Inc. | | 760,030 | 36,344,635 |
| CommScope Holding Co., Inc. (a) | | 43,086 | 444,217 |
| EchoStar Holding Corp. Class A (a) | | 11,669 | 363,606 |
| Ericsson (B Shares) sponsored ADR | | 68,981 | 630,486 |
| F5 Networks, Inc. (a) | | 11,479 | 1,663,537 |
| Infinera Corp. (a) | | 46,687 | 232,501 |
| InterDigital, Inc. | | 7,036 | 386,769 |
| Ituran Location & Control Ltd. | | 9,333 | 159,688 |
| Lumentum Holdings, Inc. (a) | | 14,415 | 1,056,908 |
| NETGEAR, Inc. (a)(b) | | 8,769 | 225,626 |
| NetScout Systems, Inc. (a) | | 16,291 | 447,514 |
| Radware Ltd. (a) | | 11,959 | 284,863 |
| ViaSat, Inc. (a) | | 13,091 | 549,822 |
| Viavi Solutions, Inc. (a) | | 48,144 | 557,989 |
| | | | 43,936,086 |
| Electronic Equipment & Components - 0.8% | | | |
| Avnet, Inc. | | 18,795 | 511,976 |
| CDW Corp. | | 24,887 | 2,760,217 |
| Cognex Corp. (b) | | 32,113 | 1,822,092 |
| Coherent, Inc. (a) | | 4,938 | 717,047 |
| ePlus, Inc. (a) | | 3,466 | 255,479 |
| Flextronics International Ltd. (a) | | 98,550 | 956,921 |
| FLIR Systems, Inc. | | 24,734 | 1,142,711 |
| Hollysys Automation Technologies Ltd. | | 17,162 | 214,353 |
| II-VI, Inc. (a) | | 17,548 | 834,056 |
| Insight Enterprises, Inc. (a) | | 7,567 | 387,884 |
| IPG Photonics Corp. (a) | | 10,073 | 1,565,344 |
| Itron, Inc. (a) | | 8,087 | 520,965 |
| Littelfuse, Inc. | | 4,923 | 799,938 |
| MTS Systems Corp. | | 7,210 | 126,968 |
| National Instruments Corp. | | 25,219 | 976,480 |
| Novanta, Inc. (a) | | 7,124 | 731,706 |
| OSI Systems, Inc. (a) | | 4,237 | 321,037 |
| PC Connection, Inc. | | 6,344 | 274,568 |
| Plexus Corp. (a) | | 6,425 | 412,614 |
| Sanmina Corp. (a) | | 15,211 | 404,765 |
| ScanSource, Inc. (a) | | 6,952 | 171,367 |
| Tech Data Corp. (a) | | 5,953 | 811,037 |
| Trimble, Inc. (a) | | 43,809 | 1,713,808 |
| TTM Technologies, Inc. (a) | | 24,744 | 286,288 |
| Zebra Technologies Corp. Class A (a) | | 9,338 | 2,440,206 |
| | | | 21,159,827 |
| IT Services - 3.7% | | | |
| Akamai Technologies, Inc. (a) | | 29,680 | 3,140,144 |
| Amdocs Ltd. | | 25,374 | 1,579,785 |
| Automatic Data Processing, Inc. | | 77,035 | 11,284,857 |
| Cardtronics PLC (a)(b) | | 10,442 | 252,592 |
| Cass Information Systems, Inc. | | 4,182 | 168,702 |
| Cognizant Technology Solutions Corp. Class A | | 97,099 | 5,146,247 |
| CSG Systems International, Inc. (b) | | 7,567 | 358,297 |
| Euronet Worldwide, Inc. (a) | | 9,063 | 858,538 |
| Exela Technologies, Inc. (a)(b) | | 168,590 | 54,758 |
| ExlService Holdings, Inc. (a) | | 7,228 | 442,137 |
| Fiserv, Inc. (a) | | 121,231 | 12,943,834 |
| GDS Holdings Ltd. ADR (a) | | 19,845 | 1,131,165 |
| Jack Henry & Associates, Inc. | | 14,165 | 2,561,882 |
| ManTech International Corp. Class A | | 5,733 | 445,683 |
| MongoDB, Inc. Class A (a) | | 9,197 | 2,134,716 |
| NIC, Inc. | | 15,647 | 376,467 |
| Okta, Inc. (a) | | 20,573 | 4,023,667 |
| Paychex, Inc. | | 65,288 | 4,719,017 |
| PayPal Holdings, Inc. (a) | | 210,093 | 32,566,516 |
| Perficient, Inc. (a) | | 6,078 | 206,895 |
| QIWI PLC Class B sponsored ADR | | 15,347 | 214,014 |
| Sabre Corp. (b) | | 61,761 | 430,474 |
| StoneCo Ltd. Class A (a)(b) | | 27,288 | 864,484 |
| Sykes Enterprises, Inc. (a) | | 9,917 | 270,337 |
| Ttec Holdings, Inc. | | 10,400 | 440,544 |
| Tucows, Inc. (a)(b) | | 3,235 | 194,326 |
| VeriSign, Inc. (a) | | 20,520 | 4,494,085 |
| Verra Mobility Corp. (a) | | 37,479 | 408,896 |
| Virtusa Corp. (a) | | 7,331 | 220,443 |
| Wix.com Ltd. (a) | | 9,586 | 2,131,255 |
| | | | 94,064,757 |
| Semiconductors & Semiconductor Equipment - 9.7% | | | |
| Advanced Energy Industries, Inc. (a) | | 8,255 | 551,682 |
| Advanced Micro Devices, Inc. (a) | | 208,514 | 11,218,053 |
| Ambarella, Inc. (a) | | 7,189 | 407,904 |
| Amkor Technology, Inc. (a) | | 48,067 | 508,549 |
| Analog Devices, Inc. | | 66,621 | 7,524,842 |
| Applied Materials, Inc. | | 163,315 | 9,175,037 |
| ASML Holding NV | | 12,998 | 4,282,971 |
| Axcelis Technologies, Inc. (a) | | 9,477 | 254,457 |
| Broadcom, Inc. | | 71,472 | 20,817,649 |
| Brooks Automation, Inc. | | 15,088 | 603,067 |
| Cabot Microelectronics Corp. | | 5,890 | 853,225 |
| Canadian Solar, Inc. (a)(b) | | 14,771 | 277,695 |
| Cirrus Logic, Inc. (a) | | 11,604 | 841,058 |
| Cree, Inc. (a)(b) | | 21,068 | 1,110,073 |
| Diodes, Inc. (a) | | 10,763 | 523,512 |
| Enphase Energy, Inc. (a) | | 23,363 | 1,359,493 |
| Entegris, Inc. | | 25,580 | 1,531,730 |
| First Solar, Inc. (a)(b) | | 17,035 | 794,172 |
| FormFactor, Inc. (a) | | 16,830 | 423,611 |
| Intel Corp. | | 766,005 | 48,204,695 |
| KLA-Tencor Corp. | | 28,526 | 5,019,435 |
| Kopin Corp. (a) | | 56,043 | 58,285 |
| Kulicke & Soffa Industries, Inc. | | 14,556 | 325,472 |
| Lam Research Corp. | | 26,293 | 7,195,605 |
| Lattice Semiconductor Corp. (a)(b) | | 27,678 | 688,352 |
| MACOM Technology Solutions Holdings, Inc. (a) | | 14,754 | 468,440 |
| Marvell Technology Group Ltd. | | 123,030 | 4,013,239 |
| Maxim Integrated Products, Inc. | | 49,724 | 2,868,080 |
| Microchip Technology, Inc. | | 43,534 | 4,180,135 |
| Micron Technology, Inc. (a) | | 200,236 | 9,593,307 |
| MKS Instruments, Inc. | | 10,661 | 1,126,121 |
| Monolithic Power Systems, Inc. | | 8,395 | 1,760,851 |
| Nova Measuring Instruments Ltd. (a) | | 6,979 | 332,898 |
| NVIDIA Corp. | | 109,648 | 38,927,233 |
| NXP Semiconductors NV | | 50,854 | 4,887,069 |
| ON Semiconductor Corp. (a) | | 78,812 | 1,299,610 |
| Power Integrations, Inc. | | 6,074 | 658,118 |
| Qorvo, Inc. (a) | | 21,001 | 2,199,645 |
| Qualcomm, Inc. | | 204,331 | 16,526,291 |
| Rambus, Inc. (a) | | 25,215 | 391,841 |
| Semtech Corp. (a) | | 13,557 | 720,961 |
| Silicon Laboratories, Inc. (a) | | 8,591 | 804,633 |
| Silicon Motion Technology Corp. sponsored ADR | | 8,026 | 361,732 |
| Skyworks Solutions, Inc. | | 31,185 | 3,696,670 |
| SolarEdge Technologies, Inc. (a) | | 8,511 | 1,207,711 |
| SunPower Corp. (a)(b) | | 41,020 | 296,164 |
| Synaptics, Inc. (a)(b) | | 7,212 | 459,549 |
| Teradyne, Inc. | | 30,121 | 2,018,709 |
| Texas Instruments, Inc. | | 167,109 | 19,842,523 |
| Tower Semiconductor Ltd. (a) | | 19,991 | 402,019 |
| Universal Display Corp. | | 8,435 | 1,236,571 |
| Xilinx, Inc. | | 43,754 | 4,023,180 |
| | | | 248,853,924 |
| Software - 15.9% | | | |
| 2U, Inc. (a) | | 11,348 | 413,862 |
| ACI Worldwide, Inc. (a) | | 23,065 | 636,133 |
| Adobe, Inc. (a) | | 86,599 | 33,479,173 |
| Alarm.com Holdings, Inc. (a) | | 10,457 | 494,512 |
| Altair Engineering, Inc. Class A (a)(b) | | 8,844 | 345,712 |
| ANSYS, Inc. (a) | | 15,385 | 4,353,955 |
| AppFolio, Inc. (a)(b) | | 3,570 | 565,881 |
| Appian Corp. Class A (a)(b) | | 7,758 | 441,896 |
| Aspen Technology, Inc. (a) | | 12,863 | 1,358,847 |
| Atlassian Corp. PLC (a) | | 21,596 | 4,001,739 |
| Autodesk, Inc. (a) | | 39,707 | 8,353,559 |
| Blackbaud, Inc. | | 10,278 | 602,394 |
| BlackLine, Inc. (a) | | 11,306 | 840,036 |
| Bottomline Technologies, Inc. (a) | | 9,492 | 480,295 |
| Cadence Design Systems, Inc. (a) | | 50,868 | 4,643,740 |
| CDK Global, Inc. | | 23,195 | 911,795 |
| Check Point Software Technologies Ltd. (a) | | 25,366 | 2,781,889 |
| Citrix Systems, Inc. | | 21,409 | 3,171,101 |
| CommVault Systems, Inc. (a) | | 10,263 | 415,241 |
| Cornerstone OnDemand, Inc. (a) | | 12,252 | 473,540 |
| Coupa Software, Inc. (a) | | 11,707 | 2,663,460 |
| Crowdstrike Holdings, Inc. (b) | | 20,362 | 1,787,987 |
| CyberArk Software Ltd. (a) | | 6,590 | 683,910 |
| Datadog, Inc. Class A (a) | | 31,416 | 2,239,018 |
| Descartes Systems Group, Inc. (Canada) (a) | | 16,872 | 804,356 |
| DocuSign, Inc. (a) | | 32,782 | 4,580,957 |
| Dropbox, Inc. Class A (a) | | 42,600 | 961,482 |
| Ebix, Inc. (b) | | 7,714 | 172,871 |
| Everbridge, Inc. (a) | | 6,681 | 977,163 |
| FireEye, Inc. (a) | | 46,977 | 586,273 |
| Five9, Inc. (a) | | 11,843 | 1,234,041 |
| Fortinet, Inc. (a) | | 31,194 | 4,342,205 |
| GTY Govtech, Inc. (a)(b) | | 23,510 | 88,163 |
| Intuit, Inc. | | 46,860 | 13,604,395 |
| j2 Global, Inc. | | 9,559 | 748,470 |
| LivePerson, Inc. (a)(b) | | 13,877 | 519,694 |
| LogMeIn, Inc. | | 7,819 | 663,833 |
| Magic Software Enterprises Ltd. | | 9,210 | 93,666 |
| Manhattan Associates, Inc. (a) | | 12,353 | 1,092,005 |
| Microsoft Corp. | | 1,360,105 | 249,239,218 |
| MicroStrategy, Inc. Class A (a) | | 2,027 | 252,321 |
| Mimecast Ltd. (a) | | 12,709 | 530,982 |
| NICE Systems Ltd. sponsored ADR (a) | | 8,388 | 1,561,342 |
| Nortonlifelock, Inc. | | 111,662 | 2,543,660 |
| Nuance Communications, Inc. (a) | | 50,759 | 1,161,366 |
| Nutanix, Inc. Class A (a) | | 35,568 | 855,766 |
| Open Text Corp. | | 50,057 | 2,079,573 |
| Parametric Technology Corp. (a) | | 21,579 | 1,648,204 |
| Pareteum Corp. (a)(b) | | 176,841 | 77,120 |
| Paylocity Holding Corp. (a) | | 10,117 | 1,315,261 |
| Pegasystems, Inc. | | 15,093 | 1,435,646 |
| Pluralsight, Inc. (a)(b) | | 23,307 | 485,485 |
| Progress Software Corp. | | 9,866 | 398,586 |
| Proofpoint, Inc. (a) | | 10,895 | 1,266,762 |
| Qualys, Inc. (a)(b) | | 7,768 | 895,806 |
| Rapid7, Inc. (a) | | 10,199 | 498,629 |
| RealPage, Inc. (a) | | 15,744 | 1,067,758 |
| Safe-T Group Ltd. ADR (a)(b) | | 52,870 | 69,260 |
| Sapiens International Corp. NV (b) | | 12,306 | 289,437 |
| Splunk, Inc. (a) | | 27,760 | 5,158,918 |
| SPS Commerce, Inc. (a) | | 7,703 | 525,036 |
| SS&C Technologies Holdings, Inc. | | 45,484 | 2,633,296 |
| SurveyMonkey (a) | | 28,840 | 581,126 |
| Synopsys, Inc. (a) | | 27,393 | 4,955,668 |
| Talend SA ADR (a)(b) | | 8,506 | 262,240 |
| Tenable Holdings, Inc. (a) | | 19,634 | 613,955 |
| The Trade Desk, Inc. (a)(b) | | 7,511 | 2,340,127 |
| TiVo Corp. | | 35,000 | 213,150 |
| Varonis Systems, Inc. (a) | | 6,445 | 543,894 |
| Verint Systems, Inc. (a) | | 12,580 | 583,335 |
| Workday, Inc. Class A (a) | | 29,948 | 5,493,362 |
| Zoom Video Communications, Inc. Class A (a) | | 29,927 | 5,371,298 |
| Zscaler, Inc. (a)(b) | | 24,295 | 2,383,097 |
| | | | 405,939,933 |
| Technology Hardware, Storage & Peripherals - 10.1% | | | |
| Apple, Inc. | | 782,446 | 248,770,881 |
| Logitech International SA (b) | | 31,430 | 1,868,199 |
| Nano Dimension Ltd. ADR (a)(b) | | 104,690 | 271,147 |
| NetApp, Inc. | | 41,046 | 1,828,189 |
| Seagate Technology LLC | | 48,255 | 2,559,445 |
| Stratasys Ltd. (a)(b) | | 14,173 | 253,130 |
| Super Micro Computer, Inc. (a) | | 10,491 | 272,346 |
| Western Digital Corp. | | 54,939 | 2,437,643 |
| | | | 258,260,980 |
|
| TOTAL INFORMATION TECHNOLOGY | | | 1,072,215,507 |
|
| MATERIALS - 0.3% | | | |
| Chemicals - 0.1% | | | |
| AgroFresh Solutions, Inc. (a) | | 12,872 | 34,240 |
| Balchem Corp. | | 6,484 | 652,615 |
| Innospec, Inc. | | 5,500 | 423,995 |
| Loop Industries, Inc. (a)(b) | | 7,688 | 65,963 |
| Methanex Corp. | | 17,783 | 288,150 |
| | | | 1,464,963 |
| Containers & Packaging - 0.0% | | | |
| Silgan Holdings, Inc. | | 20,638 | 690,135 |
| Metals & Mining - 0.2% | | | |
| Ferroglobe PLC (a)(b) | | 104,116 | 74,079 |
| Ferroglobe Representation & Warranty Insurance (a)(c) | | 7,187 | 0 |
| Kaiser Aluminum Corp. | | 4,107 | 294,677 |
| Pan American Silver Corp. (b) | | 40,930 | 1,199,249 |
| Royal Gold, Inc. | | 12,364 | 1,646,885 |
| SSR Mining, Inc. (a) | | 26,191 | 503,713 |
| Steel Dynamics, Inc. | | 37,840 | 1,005,030 |
| | | | 4,723,633 |
| Paper & Forest Products - 0.0% | | | |
| Mercer International, Inc. (SBI) | | 22,566 | 182,108 |
|
| TOTAL MATERIALS | | | 7,060,839 |
|
| REAL ESTATE - 1.1% | | | |
| Equity Real Estate Investment Trusts (REITs) - 1.0% | | | |
| American Finance Trust, Inc. | | 24,182 | 177,012 |
| Brookfield Property REIT, Inc. Class A (b) | | 11,320 | 117,615 |
| CareTrust (REIT), Inc. | | 20,899 | 389,348 |
| CyrusOne, Inc. | | 19,541 | 1,452,678 |
| Equinix, Inc. | | 15,287 | 10,664,670 |
| Gaming & Leisure Properties | | 40,025 | 1,382,464 |
| Gladstone Commercial Corp. | | 9,533 | 170,831 |
| Government Properties Income Trust | | 10,839 | 274,118 |
| Hospitality Properties Trust (SBI) | | 32,213 | 217,438 |
| Industrial Logistics Properties Trust | | 14,964 | 280,575 |
| Lamar Advertising Co. Class A | | 14,622 | 969,439 |
| Potlatch Corp. | | 14,419 | 490,102 |
| Regency Centers Corp. | | 28,436 | 1,216,776 |
| Retail Opportunity Investments Corp. | | 30,382 | 285,287 |
| Sabra Health Care REIT, Inc. | | 41,440 | 557,782 |
| SBA Communications Corp. Class A | | 19,881 | 6,245,219 |
| Senior Housing Properties Trust (SBI) | | 71,407 | 255,637 |
| Uniti Group, Inc. | | 36,010 | 297,083 |
| | | | 25,444,074 |
| Real Estate Management & Development - 0.1% | | | |
| Brookfield Property Partners LP | | 74,362 | 768,005 |
| Colliers International Group, Inc. | | 7,735 | 399,489 |
| FirstService Corp. | | 8,466 | 790,132 |
| Newmark Group, Inc. | | 29,112 | 123,726 |
| Redfin Corp. (a) | | 15,912 | 477,201 |
| The RMR Group, Inc. | | 5,203 | 140,273 |
| | | | 2,698,826 |
|
| TOTAL REAL ESTATE | | | 28,142,900 |
|
| UTILITIES - 0.7% | | | |
| Electric Utilities - 0.6% | | | |
| Alliant Energy Corp. | | 45,569 | 2,249,286 |
| Exelon Corp. | | 175,518 | 6,724,095 |
| MGE Energy, Inc. | | 7,236 | 491,252 |
| Otter Tail Corp. | | 8,658 | 371,515 |
| Xcel Energy, Inc. | | 93,023 | 6,049,286 |
| | | | 15,885,434 |
| Independent Power and Renewable Electricity Producers - 0.1% | | | |
| Atlantica Sustainable Infrastr (b) | | 19,978 | 523,424 |
| Terraform Power, Inc. | | 45,055 | 828,111 |
| | | | 1,351,535 |
| Water Utilities - 0.0% | | | |
| Middlesex Water Co. (b) | | 4,453 | 302,181 |
|
| TOTAL UTILITIES | | | 17,539,150 |
|
| TOTAL COMMON STOCKS | | | |
| (Cost $1,734,601,587) | | | 2,553,339,802 |
|
| Money Market Funds - 3.2% | | | |
| Fidelity Cash Central Fund 0.11% (d) | | 4,854,069 | 4,855,040 |
| Fidelity Securities Lending Cash Central Fund 0.10% (d)(e) | | 76,965,721 | 76,973,418 |
| TOTAL MONEY MARKET FUNDS | | | |
| (Cost $81,826,255) | | | 81,828,458 |
| TOTAL INVESTMENT IN SECURITIES - 102.9% | | | |
| (Cost $1,816,427,842) | | | 2,635,168,260 |
| NET OTHER ASSETS (LIABILITIES) - (2.9)% | | | (73,562,474) |
| NET ASSETS - 100% | | | $2,561,605,786 |
| Futures Contracts | | | | | |
| | Number of contracts | Expiration Date | Notional Amount | Value | Unrealized Appreciation/(Depreciation) |
| Purchased | | | | | |
| Equity Index Contracts | | | | | |
| CME E-mini NASDAQ 100 Index Contracts (United States) | 44 | June 2020 | $8,413,020 | $1,547,476 | $1,547,476 |
The notional amount of futures purchased as a percentage of Net Assets is 0.3%
For the period, the average monthly notional amount at value for futures contracts in the aggregate was $134,872,707.
Legend
(a) Non-income producing
(b) Security or a portion of the security is on loan at period end.
(c) Level 3 security
(d) Affiliated fund that is generally available only to investment companies and other accounts managed by Fidelity Investments. The rate quoted is the annualized seven-day yield of the fund at period end. A complete unaudited listing of the fund's holdings as of its most recent quarter end is available upon request. In addition, each Fidelity Central Fund's financial statements are available on the SEC's website or upon request.
(e) Investment made with cash collateral received from securities on loan.
Affiliated Central Funds
Information regarding fiscal year to date income earned by the Fund from investments in Fidelity Central Funds is as follows:
| Fund | Income earned |
| Fidelity Cash Central Fund | $1,144,903 |
| Fidelity Securities Lending Cash Central Fund | 687,426 |
| Total | $1,832,329 |
Amounts in the income column in the above table include any capital gain distributions from underlying funds, which are presented in the corresponding line-item in the Statement of Operations, if applicable. Amount for Fidelity Securities Lending Cash Central Fund represents the income earned on investing cash collateral, less rebates paid to borrowers and any lending agent fees associated with the loan, plus any premium payments received for lending certain types of securities.
Investment Valuation
The following is a summary of the inputs used, as of May 31, 2020, involving the Fund's assets and liabilities carried at fair value. The inputs or methodology used for valuing securities may not be an indication of the risk associated with investing in those securities. For more information on valuation inputs, and their aggregation into the levels used below, please refer to the Investment Valuation section in the accompanying Notes to Financial Statements.
| | Valuation Inputs at Reporting Date: |
| Description | Total | Level 1 | Level 2 | Level 3 |
| Investments in Securities: | | | | |
| Equities: | | | | |
| Communication Services | $452,183,473 | $452,183,473 | $-- | $-- |
| Consumer Discretionary | 387,653,793 | 387,653,793 | -- | -- |
| Consumer Staples | 104,637,153 | 104,637,153 | -- | -- |
| Energy | 4,575,428 | 4,575,428 | -- | -- |
| Financials | 111,771,952 | 111,771,952 | -- | -- |
| Health Care | 280,134,919 | 280,088,492 | -- | 46,427 |
| Industrials | 87,424,688 | 87,424,688 | -- | -- |
| Information Technology | 1,072,215,507 | 1,072,215,507 | -- | -- |
| Materials | 7,060,839 | 7,060,839 | -- | -- |
| Real Estate | 28,142,900 | 28,142,900 | -- | -- |
| Utilities | 17,539,150 | 17,539,150 | -- | -- |
| Money Market Funds | 81,828,458 | 81,828,458 | -- | -- |
| Total Investments in Securities: | $2,635,168,260 | $2,635,121,833 | $-- | $46,427 |
| Derivative Instruments: | | | | |
| Assets | | | | |
| Futures Contracts | $1,547,476 | $1,547,476 | $-- | $-- |
| Total Assets | $1,547,476 | $1,547,476 | $-- | $-- |
| Total Derivative Instruments: | $1,547,476 | $1,547,476 | $-- | $-- |
Value of Derivative Instruments
The following table is a summary of the Fund's value of derivative instruments by primary risk exposure as of May 31, 2020. For additional information on derivative instruments, please refer to the Derivative Instruments section in the accompanying Notes to Financial Statements.
| Primary Risk Exposure / Derivative Type | Value |
| | Asset | Liability |
| Equity Risk | | |
| Futures Contracts(a) | $1,547,476 | $0 |
| Total Equity Risk | 1,547,476 | 0 |
| Total Value of Derivatives | $1,547,476 | $0 |
(a) Reflects gross cumulative appreciation (depreciation) on futures contracts as presented in the Schedule of Investments. In the Statement of Assets and Liabilities, the period end daily variation margin is included in receivable or payable for daily variation margin on futures contracts, and the net cumulative appreciation (depreciation) is included in Total accumulated earnings (loss).
See accompanying notes which are an integral part of the financial statements.
Financial Statements
Statement of Assets and Liabilities
| | | May 31, 2020 (Unaudited) |
| Assets | | |
Investment in securities, at value (including securities loaned of $75,377,633) — See accompanying schedule:
Unaffiliated issuers (cost $1,734,601,587) | $2,553,339,802 | |
| Fidelity Central Funds (cost $81,826,255) | 81,828,458 | |
| Total Investment in Securities (cost $1,816,427,842) | | $2,635,168,260 |
| Segregated cash with brokers for derivative instruments | | 645,000 |
| Foreign currency held at value (cost $5,242) | | 5,039 |
| Receivable for investments sold | | 1,159,125 |
| Dividends receivable | | 2,042,209 |
| Distributions receivable from Fidelity Central Funds | | 103,609 |
| Receivable for daily variation margin on futures contracts | | 88,386 |
| Other receivables | | 11,138 |
| Total assets | | 2,639,222,766 |
| Liabilities | | |
| Payable for investments purchased | $206,450 | |
| Accrued management fee | 426,445 | |
| Other payables and accrued expenses | 16,755 | |
| Collateral on securities loaned | 76,967,330 | |
| Total liabilities | | 77,616,980 |
| Net Assets | | $2,561,605,786 |
| Net Assets consist of: | | |
| Paid in capital | | $1,672,871,831 |
| Total accumulated earnings (loss) | | 888,733,955 |
| Net Assets | | $2,561,605,786 |
| Net Asset Value, offering price and redemption price per share ($2,561,605,786 ÷ 6,930,000 shares) | | $369.64 |
See accompanying notes which are an integral part of the financial statements.
Statement of Operations
| | | Six months ended May 31, 2020 (Unaudited) |
| Investment Income | | |
| Dividends | | $12,437,825 |
| Interest | | 60,010 |
| Income from Fidelity Central Funds (including $687,426 from security lending) | | 1,832,329 |
| Total income | | 14,330,164 |
| Expenses | | |
| Management fee | $2,416,157 | |
| Independent trustees' fees and expenses | 6,459 | |
| Miscellaneous | 23,570 | |
| Total expenses | | 2,446,186 |
| Net investment income (loss) | | 11,883,978 |
| Realized and Unrealized Gain (Loss) | | |
| Net realized gain (loss) on: | | |
| Investment securities: | | |
| Unaffiliated issuers | 2,044,212 | |
| Redemptions in-kind with affiliated entities | 24,173,425 | |
| Fidelity Central Funds | 2,613 | |
| Foreign currency transactions | 810 | |
| Futures contracts | 60,572,585 | |
| Total net realized gain (loss) | | 86,793,645 |
| Change in net unrealized appreciation (depreciation) on: | | |
| Investment securities: | | |
| Unaffiliated issuers | 145,530,546 | |
| Fidelity Central Funds | (865) | |
| Assets and liabilities in foreign currencies | 372 | |
| Futures contracts | (19,929,108) | |
| Total change in net unrealized appreciation (depreciation) | | 125,600,945 |
| Net gain (loss) | | 212,394,590 |
| Net increase (decrease) in net assets resulting from operations | | $224,278,568 |
See accompanying notes which are an integral part of the financial statements.
Statement of Changes in Net Assets
| | Six months ended May 31, 2020 (Unaudited) | Year ended November 30, 2019 |
| Increase (Decrease) in Net Assets | | |
| Operations | | |
| Net investment income (loss) | $11,883,978 | $22,964,780 |
| Net realized gain (loss) | 86,793,645 | 90,871,653 |
| Change in net unrealized appreciation (depreciation) | 125,600,945 | 246,608,407 |
| Net increase (decrease) in net assets resulting from operations | 224,278,568 | 360,444,840 |
| Distributions to shareholders | (32,350,130) | (22,429,700) |
| Share transactions | | |
| Proceeds from sales of shares | 218,365,532 | 216,266,412 |
| Cost of shares redeemed | (51,158,251) | (200,133,424) |
| Net increase (decrease) in net assets resulting from share transactions | 167,207,281 | 16,132,988 |
| Total increase (decrease) in net assets | 359,135,719 | 354,148,128 |
| Net Assets | | |
| Beginning of period | 2,202,470,067 | 1,848,321,939 |
| End of period | $2,561,605,786 | $2,202,470,067 |
| Other Information | | |
| Shares | | |
| Sold | 630,000 | 730,000 |
| Redeemed | (160,000) | (690,000) |
| Net increase (decrease) | 470,000 | 40,000 |
See accompanying notes which are an integral part of the financial statements.
Fidelity Nasdaq Composite Index Tracking Stock
| | Six months ended (Unaudited) May 31, | Years endedNovember 30, | | | | |
| | 2020 | 2019 | 2018 | 2017 | 2016 | 2015 |
| Selected Per–Share Data | | | | | | |
| Net asset value, beginning of period | $340.94 | $287.90 | $270.47 | $209.73 | $201.07 | $188.45 |
| Income from Investment Operations | | | | | | |
| Net investment income (loss)A | 1.76 | 3.53 | 2.76 | 2.40 | 2.43 | 2.14 |
| Net realized and unrealized gain (loss) | 31.86 | 52.98 | 17.36 | 60.58 | 8.56 | 12.44 |
| Total from investment operations | 33.62 | 56.51 | 20.12 | 62.98 | 10.99 | 14.58 |
| Distributions from net investment income | (1.78) | (3.47) | (2.69) | (2.24) | (2.33) | (1.96) |
| Distributions from net realized gain | (3.14) | – | – | – | – | – |
| Total distributions | (4.92) | (3.47) | (2.69) | (2.24) | (2.33) | (1.96) |
| Net asset value, end of period | $369.64 | $340.94 | $287.90 | $270.47 | $209.73 | $201.07 |
| Total ReturnB,C | 10.04% | 19.83% | 7.42% | 30.21% | 5.56% | 7.79% |
| Ratios to Average Net AssetsD,E | | | | | | |
| Expenses before reductions | .21%F | .27% | .27% | .31% | .32% | .42% |
| Expenses net of fee waivers, if any | .21%F | .21% | .21% | .21% | .21% | .21% |
| Expenses net of all reductions | .21%F | .21% | .21% | .21% | .21% | .21% |
| Net investment income (loss) | 1.04%F | 1.15% | .95% | .99% | 1.25% | 1.11% |
| Supplemental Data | | | | | | |
| Net assets, end of period (000 omitted) | $2,561,606 | $2,202,470 | $1,848,322 | $1,479,445 | $755,017 | $663,523 |
| Portfolio turnover rateG,H | 17%F | 6% | 10% | 12% | 6% | 9% |
A Calculated based on average shares outstanding during the period.
B Total returns for periods of less than one year are not annualized.
C Total returns would have been lower if certain expenses had not been reduced during the applicable periods shown.
D Fees and expenses of any underlying Fidelity Central Funds are not included in the Fund's expense ratio. The Fund indirectly bears its proportionate share of the expenses of any underlying Fidelity Central Funds.
E Expense ratios reflect operating expenses of the Fund. Expenses before reductions do not reflect amounts reimbursed by the investment adviser or reductions from expense offset arrangements and do not represent the amount paid by the Fund during periods when reimbursements or reductions occur. Expenses net of fee waivers reflect expenses after reimbursement by the investment adviser but prior to reductions from expense offset arrangements. Expenses net of all reductions represent the net expenses paid by the Fund.
F Annualized
G Amount does not include the portfolio activity of any underlying Fidelity Central Funds.
H Portfolio turnover rate excludes securities received or delivered in-kind.
See accompanying notes which are an integral part of the financial statements.
Notes to Financial Statements
For the period ended May 31, 2020
1. Organization.
Fidelity Nasdaq Composite Index Tracking Stock (the Fund) is an exchange-traded fund of Fidelity Commonwealth Trust (the Trust) and is authorized to issue an unlimited number of shares. The Trust is registered under the Investment Company Act of 1940, as amended (the 1940 Act), as an open-end management investment company organized as a Massachusetts business trust. The Fund may operate as a non-diversified fund, as defined under the 1940 Act, to the approximate extent the Index is non-diversified.
Effective January 1, 2020:
Investment advisers Fidelity Investments Money Management, Inc., FMR Co., Inc., and Fidelity SelectCo, LLC, merged with and into Fidelity Management & Research Company. In connection with the merger transactions, the resulting, merged investment adviser was then redomiciled from Massachusetts to Delaware, changed its corporate structure from a corporation to a limited liability company, and changed its name to "Fidelity Management & Research Company LLC".
2. Investments in Fidelity Central Funds.
The Fund invests in Fidelity Central Funds, which are open-end investment companies generally available only to other investment companies and accounts managed by the investment adviser and its affiliates. The Fund's Schedule of Investments lists each of the Fidelity Central Funds held as of period end, if any, as an investment of the Fund, but does not include the underlying holdings of each Fidelity Central Fund. As an Investing Fund, the Fund indirectly bears its proportionate share of the expenses of the underlying Fidelity Central Funds.
The Money Market Central Funds seek preservation of capital and current income and are managed by the investment adviser. Annualized expenses of the Money Market Central Funds as of their most recent shareholder report date ranged from less than .005% to .01%.
A complete unaudited list of holdings for each Fidelity Central Fund is available upon request or at the Securities and Exchange Commission (the SEC) website at www.sec.gov. In addition, the financial statements of the Fidelity Central Funds are available on the SEC website or upon request.
3. Significant Accounting Policies.
The Fund is an investment company and applies the accounting and reporting guidance of the Financial Accounting Standards Board (FASB) Accounting Standards Codification Topic 946 Financial Services – Investments Companies. The financial statements have been prepared in conformity with accounting principles generally accepted in the United States of America (GAAP), which require management to make certain estimates and assumptions at the date of the financial statements. Actual results could differ from those estimates. Subsequent events, if any, through the date that the financial statements were issued have been evaluated in the preparation of the financial statements. The following summarizes the significant accounting policies of the Fund:
Investment Valuation. Investments are valued as of 4:00 p.m. Eastern time on the last calendar day of the period. The Board of Trustees (the Board) has delegated the day to day responsibility for the valuation of the Fund's investments to the Fair Value Committee (the Committee) established by the Fund's investment adviser. In accordance with valuation policies and procedures approved by the Board, the Fund attempts to obtain prices from one or more third party pricing vendors or brokers to value its investments. When current market prices, quotations or currency exchange rates are not readily available or reliable, investments will be fair valued in good faith by the Committee, in accordance with procedures adopted by the Board. Factors used in determining fair value vary by investment type and may include market or investment specific events. The frequency with which these procedures are used cannot be predicted and they may be utilized to a significant extent. The Committee oversees the Fund's valuation policies and procedures and reports to the Board on the Committee's activities and fair value determinations. The Board monitors the appropriateness of the procedures used in valuing the Fund's investments and ratifies the fair value determinations of the Committee.
The Fund categorizes the inputs to valuation techniques used to value its investments into a disclosure hierarchy consisting of three levels as shown below:
- Level 1 – quoted prices in active markets for identical investments
- Level 2 – other significant observable inputs (including quoted prices for similar investments, interest rates, prepayment speeds, etc.)
- Level 3 – unobservable inputs (including the Fund's own assumptions based on the best information available)
Valuation techniques used to value the Fund's investments by major category are as follows:
Equity securities, including restricted securities, for which market quotations are readily available, are valued at the last reported sale price or official closing price as reported by a third party pricing vendor on the primary market or exchange on which they are traded and are categorized as Level 1 in the hierarchy. In the event there were no sales during the day or closing prices are not available, securities are valued at the last quoted bid price or may be valued using the last available price and are generally categorized as Level 2 in the hierarchy. For foreign equity securities, when market or security specific events arise, comparisons to the valuation of American Depositary Receipts (ADRs), futures contracts, Exchange-Traded Funds (ETFs) and certain indexes as well as quoted prices for similar securities may be used and would be categorized as Level 2 in the hierarchy. For equity securities, including restricted securities, where observable inputs are limited, assumptions about market activity and risk are used and these securities may be categorized as Level 3 in the hierarchy.
Futures contracts are valued at the settlement price established each day by the board of trade or exchange on which they are traded and are categorized as Level 1 in the hierarchy. Investments in open-end mutual funds, including the Fidelity Central Funds, are valued at their closing net asset value (NAV) each business day and are categorized as Level 1 in the hierarchy.
Changes in valuation techniques may result in transfers in or out of an assigned level within the disclosure hierarchy. The aggregate value of investments by input level as of May 31, 2020 is included at the end of the Fund's Schedule of Investments.
Foreign Currency. The Fund may use foreign currency contracts to facilitate transactions in foreign-denominated securities. Gains and losses from these transactions may arise from changes in the value of the foreign currency or if the counterparties do not perform under the contracts' terms.
Foreign-denominated assets, including investment securities, and liabilities are translated into U.S. dollars at the exchange rates at period end. Purchases and sales of investment securities, income and dividends received and expenses denominated in foreign currencies are translated into U.S. dollars at the exchange rate in effect on the transaction date.
The effects of exchange rate fluctuations on investments are included with the net realized and unrealized gain (loss) on investment securities. Other foreign currency transactions resulting in realized and unrealized gain (loss) are disclosed separately.
Investment Transactions and Income. For financial reporting purposes, the Fund's investment holdings and NAV include trades executed through the end of the last business day of the period. The NAV per share for processing shareholder transactions is calculated as of the close of business of the New York Stock Exchange (NYSE), normally 4:00 p.m. Eastern time and includes trades executed through the end of the prior business day. Gains and losses on securities sold are determined on the basis of identified cost and include proceeds received from litigation. Dividend income is recorded on the ex-dividend date, except for certain dividends from foreign securities where the ex-dividend date may have passed, which are recorded as soon as the Fund is informed of the ex-dividend date. Non-cash dividends included in dividend income, if any, are recorded at the fair market value of the securities received. Income and capital gain distributions from Fidelity Central Funds, if any, are recorded on the ex-dividend date. Certain distributions received by the Fund represent a return of capital or capital gain. The Fund determines the components of these distributions subsequent to the ex-dividend date, based upon receipt of tax filings or other correspondence relating to the underlying investment. These distributions are recorded as a reduction of cost of investments and/or as a realized gain. Interest income is accrued as earned and includes coupon interest and amortization of premium and accretion of discount on debt securities as applicable. Investment income is recorded net of foreign taxes withheld where recovery of such taxes is uncertain.
Expenses. Expenses directly attributable to a fund are charged to that fund. Expenses attributable to more than one fund are allocated among the respective funds on the basis of relative net assets or other appropriate methods. Expense estimates are accrued in the period to which they relate and adjustments are made when actual amounts are known.
Income Tax Information and Distributions to Shareholders. Each year, the Fund intends to qualify as a regulated investment company under Subchapter M of the Internal Revenue Code, including distributing substantially all of its taxable income and realized gains. As a result, no provision for U.S. Federal income taxes is required. The Fund files a U.S. federal tax return, in addition to state and local tax returns as required. The Fund's federal income tax returns are subject to examination by the Internal Revenue Service (IRS) for a period of three fiscal years after they are filed. State and local tax returns may be subject to examination for an additional fiscal year depending on the jurisdiction. Realized gain or loss resulting from in-kind redemptions is not taxable to the Fund and is not distributed to shareholders of the Fund. Foreign taxes are provided for based on the Fund's understanding of the tax rules and rates that exist in the foreign markets in which it invests.
Distributions are recorded on the ex-dividend date. Income and capital gain distributions are determined in accordance with income tax regulations, which may differ from GAAP.
Capital accounts within the financial statements are adjusted for permanent book-tax differences. These adjustments have no impact on net assets or the results of operations. Capital accounts are not adjusted for temporary book-tax differences which will reverse in a subsequent period.
Book-tax differences are primarily due to futures contracts, foreign currency transactions, passive foreign investment companies (PFIC), market discount, redemptions in kind, partnerships, capital loss carryforwards and losses deferred due to wash sales.
As of period end, the cost and unrealized appreciation (depreciation) in securities, and derivatives if applicable, for federal income tax purposes were as follows:
| Gross unrealized appreciation | $930,128,737 |
| Gross unrealized depreciation | (114,708,172) |
| Net unrealized appreciation (depreciation) | $815,420,565 |
| Tax cost | $1,821,295,171 |
4. Derivative Instruments.
Risk Exposures and the Use of Derivative Instruments. The Fund's investment objective allows the Fund to enter into various types of derivative contracts, including futures contracts. Derivatives are investments whose value is primarily derived from underlying assets, indices or reference rates and may be transacted on an exchange or over-the-counter (OTC). Derivatives may involve a future commitment to buy or sell a specified asset based on specified terms, to exchange future cash flows at periodic intervals based on a notional principal amount, or for one party to make one or more payments upon the occurrence of specified events in exchange for periodic payments from the other party.
The Fund used derivatives to increase returns and to manage exposure to certain risks as defined below. The success of any strategy involving derivatives depends on analysis of numerous economic factors, and if the strategies for investment do not work as intended, the Fund may not achieve its objectives.
The Fund's use of derivatives increased or decreased its exposure to the following risk:
| Equity Risk | Equity risk relates to the fluctuations in the value of financial instruments as a result of changes in market prices (other than those arising from interest rate risk or foreign exchange risk), whether caused by factors specific to an individual investment, its issuer, or all factors affecting all instruments traded in a market or market segment.
|
The Fund is also exposed to additional risks from investing in derivatives, such as liquidity risk and counterparty credit risk. Liquidity risk is the risk that the Fund will be unable to close out the derivative in the open market in a timely manner. Counterparty credit risk is the risk that the counterparty will not be able to fulfill its obligation to the Fund. Counterparty credit risk related to exchange-traded futures contracts may be mitigated by the protection provided by the exchange on which they trade.
Investing in derivatives may involve greater risks than investing in the underlying assets directly and, to varying degrees, may involve risk of loss in excess of any initial investment and collateral received and amounts recognized in the Statement of Assets and Liabilities. In addition, there may be the risk that the change in value of the derivative contract does not correspond to the change in value of the underlying instrument.
Futures Contracts. A futures contract is an agreement between two parties to buy or sell a specified underlying instrument for a fixed price at a specified future date. The Fund used futures contracts to manage its exposure to the stock market.
Upon entering into a futures contract, a fund is required to deposit either cash or securities (initial margin) with a clearing broker in an amount equal to a certain percentage of the face value of the contract. Futures contracts are marked-to-market daily and subsequent daily payments (variation margin) are made or received by a fund depending on the daily fluctuations in the value of the futures contracts and are recorded as unrealized appreciation or (depreciation). This receivable and/or payable, if any, is included in daily variation margin on futures contracts in the Statement of Assets and Liabilities. Realized gain or (loss) is recorded upon the expiration or closing of a futures contract. The net realized gain (loss) and change in net unrealized appreciation (depreciation) on futures contracts during the period is presented in the Statement of Operations.
Any open futures contracts at period end are presented in the Schedule of Investments under the caption "Futures Contracts". The notional amount at value reflects each contract's exposure to the underlying instrument or index at period end and is representative of volume of activity during the period. Cash deposited to meet initial margin requirements is presented as segregated cash with brokers for derivative instruments in the Statement of Assets and Liabilities.
5. Purchases and Sales of Investments.
Purchases and sales of securities, other than short-term securities and in-kind transactions are noted in the table below.
| | Purchases ($) | Sales ($) |
| Fidelity Nasdaq Composite Index Tracking Stock | 594,394,918 | 174,920,340 |
Securities received and delivered in-kind through subscriptions and redemptions totaled $186,296,913 and $50,464,554, respectively.
6. Fees and Other Transactions with Affiliates.
Management Fee. Fidelity Management & Research Company LLC (the investment adviser) and its affiliates provide the Fund with investment management related services for which the Fund pays a monthly management fee. The Fund pays an all-inclusive management fee based on annual rate of .21% of the Fund's average net assets; and the investment adviser pays all ordinary operating expenses of the Fund, except fees and expenses of the independent Trustees and certain miscellaneous expenses such as proxy and shareholder meeting expenses.
Sub-Adviser. Geode Capital Management, LLC (Geode), serves as sub-adviser for the Fund. Geode provides discretionary investment advisory services to the Fund and is paid by the investment adviser for providing these services.
Interfund Trades. Funds may purchase from or sell securities to other Fidelity Funds under procedures adopted by the Board. The procedures have been designed to ensure these interfund trades are executed in accordance with Rule 17a-7 of the 1940 Act. Interfund trades are included within the respective purchases and sales amounts shown in the Purchases and Sales of Investments note.
Other. During the period, the investment adviser reimbursed the Fund for certain losses in the amount of $1,300.
7. Security Lending.
The Fund lends portfolio securities from time to time in order to earn additional income. For equity securities, lending agents are used, including National Financial Services (NFS), an affiliate of the Fund. Pursuant to a securities lending agreement, NFS will receive a fee, which is capped at 9.9% of daily lending revenue, for its services as lending agent. The Fund may lend securities to certain qualified borrowers, including NFS. On the settlement date of the loan, the Fund receives collateral (in the form of U.S. Treasury obligations, letters of credit and/or cash) against the loaned securities and maintains collateral in an amount not less than 100% of the market value of the loaned securities during the period of the loan. The market value of the loaned securities is determined at the close of business of the Fund and any additional required collateral is delivered to the Fund on the next business day. The Fund or borrower may terminate the loan at any time, and if the borrower defaults on its obligation to return the securities loaned because of insolvency or other reasons, the Fund may apply collateral received from the borrower against the obligation. The Fund may experience delays and costs in recovering the securities loaned. Any cash collateral received is invested in the Fidelity Securities Lending Cash Central Fund. The value of loaned securities and cash collateral at period end are disclosed on the Fund's Statement of Assets and Liabilities. The value of securities loaned to NFS, as affiliated borrower, at period end was $963,575. Total fees paid by the Fund to NFS, as lending agent, amounted to $71,686. Security lending income represents the income earned on investing cash collateral, less rebates paid to borrowers and any lending agent fees associated with the loan, plus any premium payments received for lending certain types of securities. Security lending income is presented in the Statement of Operations as a component of income from Fidelity Central Funds, and includes $26,044 from securities loaned to NFS, as affiliated borrower.
8. Share Transactions.
The Fund issues and redeems shares at NAV only with certain authorized participants in large increments known as Creation Units. Purchases of Creation Units are made by tendering a basket of designated stocks to the Fund and redemption proceeds are paid with a basket of securities from the Fund's portfolio with a balancing cash component to equate the market value of the basket of securities delivered or redeemed to the NAV per Creation Unit on the transaction date. Cash may be substituted equivalent to the value of certain securities generally when they are not available in sufficient quantity for delivery. The Fund's shares are available in smaller increments to investors in the secondary market at market prices and may be subject to commissions. Authorized participants pay a transaction fee to the shareholder servicing agent when purchasing and redeeming Creation Units of the Fund. The transaction fee is used to defray the costs associated with the issuance and redemption of Creation Units.
9. Other.
The Fund's organizational documents provide former and current trustees and officers with a limited indemnification against liabilities arising in connection with the performance of their duties to the Fund. In the normal course of business, the Fund may also enter into contracts that provide general indemnifications. The Fund's maximum exposure under these arrangements is unknown as this would be dependent on future claims that may be made against the Fund. The risk of material loss from such claims is considered remote.
10. Coronavirus (COVID-19) Pandemic.
An outbreak of COVID-19 first detected in China during December 2019 has since spread globally and was declared a pandemic by the World Health Organization during March 2020. Developments that disrupt global economies and financial markets, such as the COVID-19 pandemic, may magnify factors that affect the Fund's performance.
Shareholder Expense Example
As a shareholder of the Fund, you incur two types of costs: (1) transaction costs and (2) ongoing costs, including management fees and other Fund expenses. This Example is intended to help you understand your ongoing costs (in dollars) of investing in the Fund and to compare these costs with the ongoing costs of investing in other mutual funds.
The Example is based on an investment of $1,000 invested at the beginning of the period and held for the entire period (December 1, 2019 to May 31, 2020).
Actual Expenses
The first line of the accompanying table provides information about actual account values and actual expenses. You may use the information in this line, together with the amount you invested, to estimate the expenses that you paid over the period. Simply divide your account value by $1,000.00 (for example, an $8,600 account value divided by $1,000.00 = 8.6), then multiply the result by the number in the first line under the heading entitled "Expenses Paid During Period" to estimate the expenses you paid on your account during this period. In addition, the Fund, as a shareholder in the underlying Fidelity Central Funds, will indirectly bear its pro-rata share of the fees and expenses incurred by the underlying Fidelity Central Funds. These fees and expenses are not included in the Fund's annualized expense ratio used to calculate the expense estimate in the table below.
Hypothetical Example for Comparison Purposes
The second line of the accompanying table provides information about hypothetical account values and hypothetical expenses based on the Fund's actual expense ratio and an assumed rate of return of 5% per year before expenses, which is not the Fund's actual return. The hypothetical account values and expenses may not be used to estimate the actual ending account balance or expenses you paid for the period. You may use this information to compare the ongoing costs of investing in the Fund and other funds. To do so, compare this 5% hypothetical example with the 5% hypothetical examples that appear in the shareholder reports of the other funds. In addition, the Fund, as a shareholder in the underlying Fidelity Central Funds, will indirectly bear its pro-rata share of the fees and expenses incurred by the underlying Fidelity Central Funds. These fees and expenses are not included in the Fund's annualized expense ratio used to calculate the expense estimate in the table below.
Please note that the expenses shown in the table are meant to highlight your ongoing costs only and do not reflect any transaction costs. Therefore, the second line of the table is useful in comparing ongoing costs only, and will not help you determine the relative total costs of owning different funds.
| | Annualized Expense Ratio-A | Beginning
Account Value
December 1, 2019 | Ending
Account Value
May 31, 2020 | Expenses Paid
During Period-B
December 1, 2019
to May 31, 2020 |
| Actual | .21% | $1,000.00 | $1,100.40 | $1.10 |
| Hypothetical-C | | $1,000.00 | $1,023.95 | $1.06 |
A Annualized expense ratio reflects expenses net of applicable fee waivers.
B Expenses are equal to the Fund's annualized expense ratio, multiplied by the average account value over the period, multiplied by 183/366 (to reflect the one-half year period).
C 5% return per year before expenses
Board Approval of Investment Advisory Contracts and Management Fees
Fidelity Nasdaq Composite Index Tracking Stock
Each year, the Board of Trustees, including the Independent Trustees (together, the Board), votes on the renewal of the management contract with Fidelity Management & Research Company LLC (FMR) and the sub-advisory agreement (Sub-Advisory Agreement) for the fund with Geode Capital Management, LLC (Geode) (together, the Advisory Contracts). FMR and Geode are referred to herein as the Investment Advisers. The Board, assisted by the advice of fund counsel and Independent Trustees' counsel, requests and considers a broad range of information relevant to the renewal of the Advisory Contracts throughout the year.
Approval of Amended and Restated Advisory Contracts. At its November 2019 meeting, the Board unanimously determined to approve an amended and restated management contract and sub-advisory agreements (Amended and Restated Contracts) for a stub period of January 1, 2020 through January 31, 2020 in connection with a consolidation of certain of Fidelity's advisory businesses. The Board considered that, on or about January 1, 2020, FMR Co., Inc. (FMRC) expected to merge with and into FMR and, after the merger, FMR expected to redomicile as a Delaware limited liability company. The Board noted that the Amended and Restated Contracts will reflect the replacement of FMRC with FMR and will take effect upon the completion of the merger. The Board noted that references to FMR in the Amended and Restated Contracts would be updated to reflect FMR's new form of organization and domicile. The Board also noted Fidelity's assurance that neither the planned consolidation nor the Amended and Restated Contracts will change the investment processes, the level or nature of services provided, the resources and personnel allocated, trading and compliance operations, or any fees paid by the fund.
The Board meets regularly and, at each of its meetings, covers an extensive agenda of topics and materials and considers factors that are relevant to its annual consideration of the renewal of the fund's Advisory Contracts, including the services and support provided to the fund and its shareholders. The Board has established various standing committees (Committees), each composed of and chaired by Independent Trustees with varying backgrounds, to which the Board has assigned specific subject matter responsibilities in order to enhance effective decision-making by the Board. The Board, acting directly and through its Committees, requests and receives information concerning the annual consideration of the renewal of the fund's Advisory Contracts. The Board also meets as needed to review matters specifically related to the Board's annual consideration of the renewal of the Advisory Contracts. Members of the Board may also meet with trustees of other Fidelity funds through joint ad hoc committees to discuss certain matters relevant to all of the Fidelity funds.
At its January 2020 meeting, the Board unanimously determined to renew the fund's Advisory Contracts. In reaching its determination, the Board considered all factors it believed relevant, including (i) the nature, extent, and quality of the services provided to the fund and its shareholders (including the investment performance of the fund); (ii) the competitiveness of the fund's management fee and total expense ratio relative to peer funds; (iii) the total costs of the services provided by and the profits realized by Fidelity and Geode from their respective relationships with the fund; and (iv) the extent to which, if any, economies of scale exist and are realized as the fund grows, and whether any economies of scale are appropriately shared with fund shareholders.
In considering whether to renew the Advisory Contracts for the fund, the Board reached a determination, with the assistance of fund counsel and Independent Trustees' counsel and through the exercise of its business judgment, that the renewal of the Advisory Contracts was in the best interests of the fund and its shareholders and that the compensation payable under the Advisory Contracts was fair and reasonable. The Board's decision to renew the Advisory Contracts was not based on any single factor, but rather was based on a comprehensive consideration of all the information provided to the Board at its meetings throughout the year. The Board, in reaching its determination to renew the Advisory Contracts, was aware that shareholders of the fund have a broad range of investment choices available to them, including a wide choice among funds offered by Fidelity's competitors, and that the fund's shareholders, who have the opportunity to review and weigh the disclosure provided by the fund in its prospectus and other public disclosures, have chosen to invest in this fund, which is part of the Fidelity family of funds.
Nature, Extent, and Quality of Services Provided. The Board considered staffing as it relates to the fund, including the backgrounds of investment personnel of Fidelity and Geode, and also considered the fund's investment objective, strategies, and related investment philosophy. The Independent Trustees also had discussions with senior management of Fidelity's investment operations and investment groups and with representatives of Geode. The Board considered the structure of the investment personnel compensation programs and whether the structures provide appropriate incentives to act in the best interests of the fund. Additionally, the Board considered the portfolio managers' investments, if any, in the funds that they manage.
The Trustees also discussed with representatives of Fidelity, at meetings throughout the year, Fidelity's role in, among other things, overseeing compliance with federal securities laws and other applicable requirements by Geode with respect to the fund and monitoring and overseeing the performance and investment capabilities of Geode. The Trustees considered that the Board had received from Fidelity periodic reports about its oversight and due diligence processes, as well as periodic reports regarding the performance of Geode.
The Board also considered the nature, extent and quality of services provided by Geode. The Trustees noted that under the Sub-Advisory Agreement, subject to oversight by Fidelity, Geode is responsible for, among other things, identifying investments and arranging for execution of portfolio transactions to implement the fund's investment strategy. In addition, the Trustees noted that Geode is responsible for providing such reporting as may be requested by Fidelity to fulfill its oversight responsibilities discussed above.
Resources Dedicated to Investment Management and Support Services. The Board and the Fund Oversight and Research Committees reviewed the general qualifications and capabilities of Fidelity's and Geode's investment staffs, including their size, education, experience, and resources, as well as Fidelity's and Geode's approach to recruiting, training, managing, and compensating investment personnel. The Board considered that Fidelity's and Geode's investment professionals have extensive resources, tools and capabilities so as to provide competitive investment results over time, and that those professionals also have access to sophisticated tools that permit them to assess portfolio construction and risk and performance attribution characteristics continuously. Additionally, in its deliberations, the Board considered Fidelity's and Geode's trading, risk management, compliance, and technology and operations capabilities and resources, which are integral parts of the investment management process.
Shareholder and Administrative Services. The Board considered (i) the nature, extent, quality, and cost of advisory and administrative services provided by the Investment Advisers and their affiliates under the Advisory Contracts and by FMR's affiliates under separate agreements covering pricing and bookkeeping and securities lending services for the fund; (ii) the nature and extent of the supervision of third party service providers, principally State Street Bank and Trust Company, the fund's transfer agent and custodian; and (iii) the resources devoted to, and the record of compliance with, the fund's compliance policies and procedures. The Board also reviewed the allocation of fund brokerage, including allocations to brokers affiliated with the Investment Advisers.
The Board noted that the growth of fund assets over time across the complex allows Fidelity to reinvest in the development of services designed to enhance the value and convenience of the Fidelity funds as investment vehicles. These services include 24-hour access to account information and market information over the Internet and through telephone representatives, investor education materials and asset allocation tools, and the expanded availability of Fidelity Investor Centers.
Investment in a Large Fund Family. The Board considered the benefits to shareholders of investing in a Fidelity fund, including the benefits of investing in a fund that is part of a large family of funds offering a variety of investment disciplines and providing a large variety of mutual fund investor services. The Board noted that Fidelity had taken, or had made recommendations that resulted in the Fidelity funds taking, a number of actions over the previous year that benefited particular funds, including: (i) continuing to dedicate additional resources to Fidelity's investment research process, which includes meetings with management of issuers of securities in which the funds invest, and to the support of the senior management team that oversees asset management; (ii) continuing efforts to enhance Fidelity's global research capabilities; (iii) launching new funds and ETFs with innovative structures, strategies and pricing and making other enhancements to meet client needs; (iv) launching new share classes of existing funds; (v) eliminating purchase minimums and broadening eligibility requirements for certain funds and share classes; (vi) reducing management fees and total expenses for certain target date funds and index funds; (vii) lowering expense caps for certain existing funds and classes, and converting certain voluntary expense caps to contractual caps, to reduce expenses borne by shareholders; (viii) rationalizing product lines and gaining increased efficiencies from fund mergers, liquidations, and share class consolidations; (ix) continuing to develop, acquire and implement systems and technology to improve services to the funds and shareholders, strengthen information security, and increase efficiency; and (x) continuing to implement enhancements to further strengthen Fidelity's product line to increase investors' probability of success in achieving their investment goals, including retirement income goals.
Investment Performance. The Board considered whether the fund has operated in accordance with its investment objective, as well as its record of compliance with its investment restrictions and its performance history.
The Board took into account discussions that occur at Board meetings throughout the year with representatives of the Investment Advisers about fund investment performance. In this regard the Board noted that as part of regularly scheduled fund reviews and other reports to the Board on fund performance, the Board considers annualized return information for the fund for different time periods, measured against the securities market index the fund seeks to track. The Board also periodically considers the fund's tracking error versus its benchmark index. In its evaluation of fund investment performance, the Board gave particular attention to information indicating changes in performance of certain Fidelity funds for specific time periods and discussed with the Investment Advisers the reasons for any overperformance or underperformance.
In addition to reviewing absolute and relative fund performance, the Independent Trustees periodically consider the appropriateness of fund performance metrics in evaluating the results achieved. In general, the Independent Trustees believe that an index fund's performance should be evaluated based on net performance (after fees and expenses) of both the highest performing and lowest performing fund share classes, where applicable, compared to a fund's benchmark index, over appropriate time periods taking into account relevant factors including the following: general market conditions; the characteristics of the fund's benchmark index; the extent to which statistical sampling is employed; any securities lending revenues; and fund cash flows and other factors.
The Independent Trustees recognize that shareholders evaluate performance on a net basis over their own holding periods, for which one-, three-, and five-year periods are often used as a proxy. For this reason, the performance information reviewed by the Board also included net cumulative total return information for the fund and its benchmark index for the most recent one-, three-, and five-year periods ended June 30, 2019, as shown below. A peer group is not shown below because the fund does not generally utilize a peer group for performance comparison purposes.
Fidelity Nasdaq Composite Index Tracking Stock

Based on its review, the Board concluded that the nature, extent, and quality of services provided to the fund under the Advisory Contracts should continue to benefit the shareholders of the fund.
Competitiveness of Management Fee and Total Expense Ratio. The Board considered the fund's management fee and total expense ratio compared to "mapped groups" of competitive funds created for the purpose of facilitating the Trustees' competitive analysis of management fees and total expenses. Fidelity creates "mapped groups" by combining similar Lipper investment objective categories that have comparable investment mandates. Combining Lipper investment objective categories aids the Board's management fee and total expense ratio comparisons by broadening the competitive group used for comparison.
Management Fee. The Board considered two proprietary management fee comparisons for the 12-month periods ended June 30 (December 31 for periods prior to 2017) shown in basis points (BP) in the chart below. The group of Lipper funds used by the Board for management fee comparisons is referred to below as the "Total Mapped Group." The Total Mapped Group comparison focuses on a fund's standing in terms of gross management fees before expense reimbursements or caps relative to the total universe of funds with comparable investment mandates, regardless of whether their management fee structures also are comparable. Funds with comparable investment mandates offer exposure to similar types of securities. Funds with comparable management fee structures have similar management fee contractual arrangements (
e.g., flat rate charged for advisory services, all-inclusive fee rate,
etc.). "TMG %" represents the percentage of funds in the Total Mapped Group that had management fees that were lower than the fund's. For example, a hypothetical TMG % of 20% would mean that 80% of the funds in the Total Mapped Group had higher, and 20% had lower, management fees than the fund. The fund's actual TMG %s and the number of funds in the Total Mapped Group are in the chart below. The "Asset-Sized Peer Group" (ASPG) comparison focuses on a fund's standing relative to a subset of non-Fidelity funds within the Total Mapped Group that are similar in size and management fee structure. For example, if a fund is in the first quartile of the ASPG, the fund's management fee ranks in the least expensive or lowest 25% of funds in the ASPG. The ASPG represents at least 15% of the funds in the Total Mapped Group with comparable asset size and management fee structures, subject to a minimum of 50 funds (or all funds in the Total Mapped Group if fewer than 50). Additional information, such as the ASPG quartile in which the fund's management fee rate ranked, is also included in the chart and was considered by the Board.
Fidelity Nasdaq Composite Index Tracking Stock
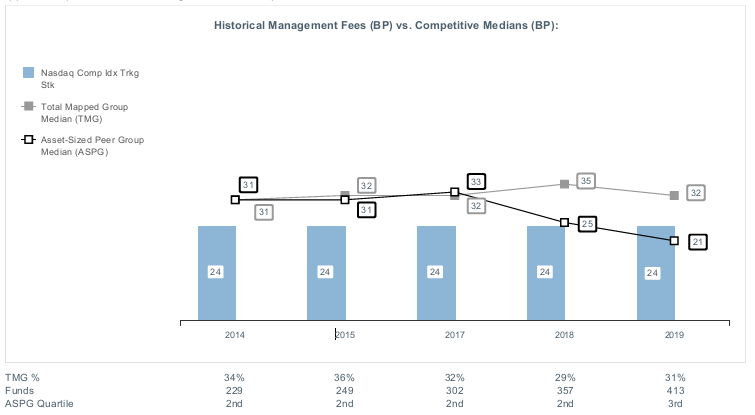
The Board noted that the fund's management fee rate ranked below the median of its Total Mapped Group and above the median of its ASPG for the 12-month period ended June 30, 2019. The Board considered that Fidelity has not identified any comparable publicly available ETFs and that Fidelity believes this provides it with a competitive advantage in the marketplace. The Board also considered that Fidelity believes the fund's management fee is reasonable given that the fund's total expense ratio is 9 basis points below its competitive median.
The Board noted that it and the boards of other Fidelity funds formed an ad hoc Committee on Group Fee, which meets periodically, to conduct an in-depth review of the "group fee" component of the management fee of funds with such management fee structures. The Committee's focus included the mechanics of the group fee, the competitive landscape of group fee structures, Fidelity funds with no group fee component (such as the fund) and investment products not included in group fee assets. The Board also considered that, for funds subject to the group fee, FMR agreed to voluntarily waive fees over a specified period of time in amounts designed to account for assets converted from certain funds to certain collective investment trusts.
Based on its review, the Board concluded that the fund's management fee is fair and reasonable in light of the services that the fund receives and the other factors considered.
Total Expense Ratio. In its review of the fund's total expense ratio, the Board considered the fund's management fee rate as well as other fund expenses, such as transfer agent fees, pricing and bookkeeping fees, and custodial, legal, and audit fees. The Board also noted that Fidelity may agree to waive fees or reimburse expenses from time to time, and the extent to which, if any, it has done so for the fund. As part of its review, the Board also considered the current and historical total expense ratios of the fund compared to competitive fund median expenses.
The Board noted that the fund's total expense ratio ranked below the competitive median for the 12-month period ended June 30, 2019.
Fees Charged to Other Clients. The Board also considered fee structures applicable to clients of Fidelity and Geode, such as other funds advised or subadvised by Fidelity or Geode, pension plan clients, and other institutional clients with similar mandates. The Board noted that a joint ad hoc committee created by it and the boards of other Fidelity funds periodically reviews and compares Fidelity's institutional investment advisory business with its business of providing services to the Fidelity funds and also noted the most recent findings of the committee. The Board noted that the committee's review included a consideration of the differences in services provided, fees charged, and costs incurred, as well as competition in the markets serving the different categories of clients.
Based on its review of total expense ratios and fees charged to other Fidelity clients, the Board concluded that the fund's total expense ratio was reasonable in light of the services that the fund and its shareholders receive and the other factors considered.
Costs of the Services and Profitability. The Board considered the revenues earned and the expenses incurred by Fidelity in conducting the business of developing, marketing, distributing, managing, administering and servicing the fund and servicing the fund's shareholders. The Board also considered the level of Fidelity's profits in respect of all the Fidelity funds.
On an annual basis, Fidelity presents to the Board information about the profitability of its relationships with the fund. Fidelity calculates profitability information for each fund, as well as aggregate profitability information for groups of Fidelity funds and all Fidelity funds, using a series of detailed revenue and cost allocation methodologies which originate with the books and records of Fidelity on which Fidelity's audited financial statements are based. The Audit Committee of the Board reviews any significant changes from the prior year's methodologies and the full Board approves such changes.
PricewaterhouseCoopers LLP (PwC), auditor to Fidelity and certain Fidelity funds, has been engaged annually by the Board as part of the Board's assessment of Fidelity's profitability analysis. PwC's engagement includes the review and assessment of the methodologies used by Fidelity in determining the revenues and expenses attributable to Fidelity's mutual fund business, and completion of agreed-upon procedures in respect of the mathematical accuracy of the fund profitability information and its conformity to established allocation methodologies. After considering PwC's reports issued under the engagement and information provided by Fidelity, the Board concluded that while other allocation methods may also be reasonable, Fidelity's profitability methodologies are reasonable in all material respects.
The Board also reviewed Fidelity's and Geode's non-fund businesses and potential indirect benefits such businesses may have received as a result of their association with Fidelity's mutual fund business (i.e., fall-out benefits) as well as cases where Fidelity's and Geode's affiliates may benefit from the funds' business. The Board noted that changes to fall-out benefits year-over-year reflect business developments at Fidelity's and Geode's various businesses. The Board considered that a joint ad hoc committee created by it and the boards of other Fidelity funds had recently been established, and met periodically, to evaluate potential fall-out benefits (PFOB Committee). The Board noted that the PFOB Committee, among other things: (i) discussed the legal framework surrounding potential fall-out benefits; (ii) reviewed the Board's responsibilities and approach to potential fall-out benefits; and (iii) reviewed practices employed by competitor funds regarding the review of potential fall-out benefits.
The Board considered the costs of the services provided by and the profits realized by Fidelity in connection with the operation of the fund, including the conclusions of the PFOB Committee, and was satisfied that the profitability was not excessive.
The Board also considered information regarding the profitability of Geode's relationship with the fund.
Economies of Scale. The Board considered whether there have been economies of scale in respect of the management of the Fidelity funds, whether the Fidelity funds (including the fund) have appropriately benefited from any such economies of scale, and whether there is potential for realization of any further economies of scale. The Board considered the extent to which the fund will benefit from economies of scale as assets grow through increased services to the fund, through waivers or reimbursements, or through fee or expense ratio reductions. The Board also noted that a committee (the Economies of Scale Committee) created by it and the boards of other Fidelity funds periodically analyzes whether Fidelity attains economies of scale in respect of the management and servicing of the Fidelity funds, whether the Fidelity funds have appropriately benefited from such economies of scale, and whether there is potential for realization of any further economies of scale.
The Board concluded, taking into account the analysis of the Economies of Scale Committee, that economies of scale, if any, are being appropriately shared between fund shareholders and Fidelity.
Additional Information Requested by the Board. In order to develop fully the factual basis for consideration of the Fidelity funds' advisory contracts, the Board requested and received additional information on certain topics, including: (i) fund flow and performance trends, in particular the underperformance of certain funds and strategies, and Fidelity's long-term strategies for certain funds; (ii) consideration of performance fees for additional funds; (iii) changes in Fidelity's non-fund businesses and the impact of such changes on the funds; (iv) metrics for evaluating index fund and ETF performance and information about ETF trading characteristics; (v) the methodology with respect to evaluating competitive fund data and peer group classifications and fee comparisons; (vi) the expense structures for different funds and classes; (vii) information regarding other accounts managed by Fidelity, including collective investment trusts and separately managed accounts; and (viii) Fidelity's philosophies and strategies for evaluating funds and classes with lower or declining asset levels.
Based on its evaluation of all of the conclusions noted above, and after considering all factors it believed relevant, the Board concluded that the advisory and sub-advisory fee arrangements are fair and reasonable, and that the fund's Amended and Restated Contracts should be approved and the fund's Advisory Contracts should be renewed.
Liquidity Risk Management Program
The Securities and Exchange Commission adopted Rule 22e-4 under the Investment Company Act of 1940 (the Liquidity Rule) to promote effective liquidity risk management throughout the open-end investment company industry, thereby reducing the risk that funds will be unable to meet their redemption obligations and mitigating dilution of the interests of fund shareholders.
The Fund has adopted and implemented a liquidity risk management program pursuant to the Liquidity Rule (the Program) effective December 1, 2018. The Program is reasonably designed to assess and manage the Fund’s liquidity risk and to comply with the requirements of the Liquidity Rule. The Fund’s Board of Trustees (the Board) has designated the Fund’s investment adviser as administrator of the Program. The Fidelity advisers have established a Liquidity Risk Management Committee (the LRM Committee) to manage the Program for each of the Fidelity Funds. The LRM Committee monitors the adequacy and effectiveness of implementation of the Program and on a periodic basis assesses each Fund’s liquidity risk based on a variety of factors including (1) the Fund’s investment strategy, (2) portfolio liquidity and cash flow projections during normal and reasonably foreseeable stressed conditions, (3) shareholder redemptions, (4) borrowings and other funding sources and (5) in the case of exchange-traded funds, certain additional factors including the effect of the Fund’s prices and spreads, market participants, and basket compositions on the overall liquidity of the Fund’s portfolio, as applicable.
In accordance with the Program, each of the Fund’s portfolio investments is classified into one of four liquidity categories described below based on a determination of a reasonable expectation for how long it would take to convert the investment to cash (or sell or dispose of the investment) without significantly changing its market value.
- Highly liquid investments – cash or convertible to cash within three business days or less
- Moderately liquid investments – convertible to cash in three to seven calendar days
- Less liquid investments – can be sold or disposed of, but not settled, within seven calendar days
- Illiquid investments – cannot be sold or disposed of within seven calendar days
Liquidity classification determinations take into account a variety of factors including various market, trading and investment-specific considerations, as well as market depth, and generally utilize analysis from a third-party liquidity metrics service.
The Liquidity Rule places a 15% limit on a fund’s illiquid investments and requires funds that do not primarily hold assets that are highly liquid investments to determine and maintain a minimum percentage of the fund’s net assets to be invested in highly liquid investments (highly liquid investment minimum or HLIM). The Program includes provisions reasonably designed to comply with the 15% limit on illiquid investments and for determining, periodically reviewing and complying with the HLIM requirement as applicable.
At a recent meeting of the Fund’s Board of Trustees, the LRM Committee provided a written report to the Board pertaining to the operation, adequacy, and effectiveness of implementation of the Program for the annual period from December 1, 2018 through November 30, 2019. The report concluded that the Program has been implemented and is operating effectively and is reasonably designed to assess and manage the Fund’s liquidity risk.

ETF-SANN-0720
1.795572.116