| | |
| UNITED STATES
SECURITIES AND EXCHANGE COMMISSION |
| | |
| CERTIFIED SHAREHOLDER REPORT OF REGISTERED
MANAGEMENT INVESTMENT COMPANIES
|
| | |
| Investment Company Act file number: | (811-02675) |
| | |
| Exact name of registrant as specified in charter: | Putnam Tax Exempt Income Fund |
| | |
| Address of principal executive offices: | 100 Federal Street, Boston, Massachusetts 02110 |
| | |
| Name and address of agent for service: | Robert T. Burns, Vice President
100 Federal Street
Boston, Massachusetts 02110 |
| | |
| Copy to: | Bryan Chegwidden, Esq.
Ropes & Gray LLP
1211 Avenue of the Americas
New York, New York 10036 |
| | |
| Registrant's telephone number, including area code: | (617) 292-1000 |
| | |
| Date of fiscal year end: | September 30, 2021 |
| | |
| Date of reporting period: | October 1, 2020 — March 31, 2021 |
| | |
|
Item 1. Report to Stockholders: | |
| | |
| The following is a copy of the report transmitted to stockholders pursuant to Rule 30e-1 under the Investment Company Act of 1940: | |
Putnam
Tax Exempt
Income Fund
Semiannual report
3 | 31 | 21
Message from the Trustees
May 11, 2021
Dear Fellow Shareholder:
As society continues to grapple with the Covid-19 pandemic, optimism remains tempered by concern about newer, more aggressive strains of the virus. After infection rates dropped early in the year, they began to rise again in some areas during March. At the same time, the pace of vaccinations accelerated, and several states eased restrictions on consumer activity.
Markets appear to expect an improving economy. The S&P 500 Index crossed the 4,000 threshold as the calendar turned to April. In addition, yields rose in the bond market. This is typically a sign that fixed-income investors anticipate both higher gross domestic product (GDP) growth and the risk of inflation.
No matter how markets move, Putnam’s portfolio managers and analysts keep their focus on researching new opportunities and potential risks. This active approach is intended to serve you through changing conditions.
As always, thank you for investing with Putnam.
About the fund
Municipal bonds can play
a key role in a tax-smart
investment plan
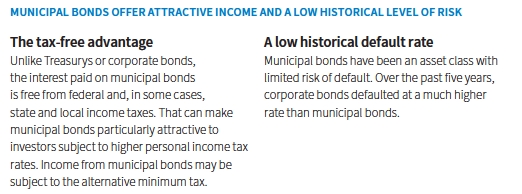
Municipal bonds finance important public projects, such as schools, roads, and hospitals. Because the income from municipal bonds is generally exempt from federal income tax, these bonds can help investors keep more of the income they receive from their investment. Putnam Tax Exempt Income Fund offers an additional advantage — the flexibility to invest in municipal bonds issued by any state in the country.
Putnam Tax Exempt Income Fund takes an active investment approach
Municipal bonds are backed by either the issuing city, town, or other government entity or by revenues collected from usage fees. The fund’s portfolio managers can select bonds from a variety of state and local governments. Because a state’s fiscal health can affect the prices of its bonds, this flexibility is a distinct advantage.

The bottom line: Income you keep after paying taxes matters more than pre-tax yield
You keep more income from municipal bonds because it is exempt from most state and federal income taxes
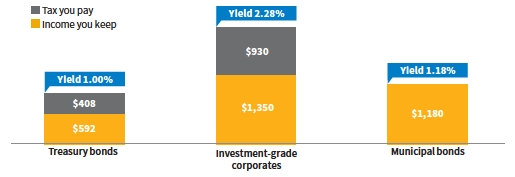
Source: Bloomberg Index Services Limited, Putnam, as of 3/31/21. Past performance is no guarantee of future results. Yields for U.S. Treasurys, investment-grade corporates, and municipal bonds are represented by the average “yield to worst” — a calculation of the lowest possible yield generated without defaulting — of the Bloomberg Barclays U.S. Treasury Index, an unmanaged index of U.S. dollar-denominated, fixed-rate, nominal debt issued by the U.S. Treasury; the Bloomberg Barclays U.S. Corporate Bond Index, an unmanaged index of U.S. dollar-denominated investment-grade, fixed-rate, taxable corporate bonds; and the Bloomberg Barclays Municipal Bond Index, an unmanaged index of long-term fixed-rate, investment-grade tax-exempt bonds, respectively. You cannot invest directly in an index. Bond investments are subject to interest-rate risk (the risk of bond prices falling if interest rates rise) and credit risk (the risk of an issuer defaulting on interest or principal payments). Interest-rate risk is greater for longer-term bonds, and credit risk is greater for below-investment-grade bonds. Income from municipal bonds may be subject to the alternative minimum tax. Annual after-tax income is based on a 40.80% federal income tax rate. This rate reflects the Tax Cuts and Jobs Act of 2017 and includes the 3.80% Medicare surtax. The income data is based on a hypothetical $100,000 investment.
Defaults in the municipal bond market have been a relative rarity
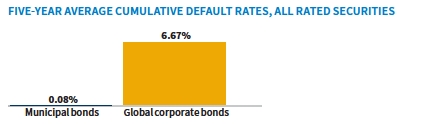
Source: Moody’s Investor Services, Annual U.S. Municipal Bond Defaults and Recoveries, Five-Year Average Cumulative Default Rates, 1970–2019 (July 2020). Most recent data available.

Current performance may be lower or higher than the quoted past performance, which cannot guarantee future results. Share price, principal value, and return will fluctuate, and you may have a gain or a loss when you sell your shares. Performance of class A shares assumes reinvestment of distributions and does not account for taxes. Fund returns in the bar chart do not reflect a sales charge of 4.00%; had they, returns would have been lower. See below and pages 10–11 for additional performance information. For a portion of the periods, the fund had expense limitations, without which returns would have been lower. To obtain the most recent month-end performance, visit putnam.com.
* Source: Bloomberg Index Services Limited.
† Source: Lipper, a Refinitiv company.
‡ The fund’s benchmark, the Bloomberg Barclays Municipal Bond Index, was introduced on 12/31/79, which post-dates the inception of the fund’s class A shares.
§ Returns for the six-month period are not annualized, but cumulative.
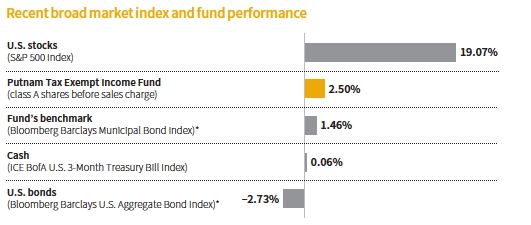
This comparison shows your fund’s performance in the context of broad market indexes for the six months ended 3/31/21. See above and pages 10–11 for additional fund performance information. Index descriptions can be found on pages 15–16.
* Source: Bloomberg Index Services Limited.


Paul, how did municipal bonds perform during the reporting period?
With an improving economic outlook and positive supply/demand technicals, the municipal bond market performed well on an absolute and relative basis. The Bloomberg Barclays Municipal Bond Index [the benchmark] rose 1.46%, outperforming U.S. Treasuries and the broader U.S. fixed-income markets. November was rewarding due to announcements by Pfizer/BioNTech and Moderna about the efficacy of their Covid-19 vaccines and the end of election uncertainty. In its final policy meeting of 2020, the Federal Reserve kept its key overnight interest rate near zero and remained committed to its bond-buying program to support the credit markets. The Fed indicated the measures would stay in place until its maximum employment and price stability goals were met.
The positive sentiment continued into the new year, on the heels of the $900 billion Covid-19 aid bill passed in December 2020. Investors were also in an upbeat mood due to the Biden administration’s plans to boost the Covid-19 vaccine rollout and to pass another stimulus package to spur economic growth. However,

Top 10 state allocations are shown as a percentage of the fund’s net assets as of 3/31/21. Investments in Puerto Rico represented 0.0% of the fund’s net assets. Summary information may differ from the portfolio schedule included in the financial statements due to the inclusion of derivative securities, any interest accruals, the floating rate portion of tender option bonds, if applicable, and the use of different classifications of securities for presentation purposes. Holdings and allocations may vary over time.
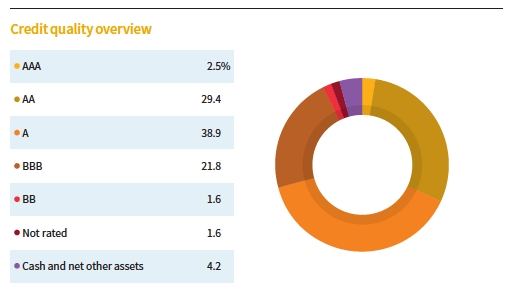
Credit qualities are shown as a percentage of the fund’s net assets as of 3/31/21. A bond rated BBB or higher (SP-3 or higher, for short-term debt) is considered investment grade. This chart reflects the highest security rating provided by one or more of Standard & Poor’s, Moody’s, and Fitch. Ratings may vary over time.
Cash and net other assets, if any, represent the market value weights of cash, derivatives, and short-term securities in the portfolio. The fund itself has not been rated by an independent rating agency.
municipals reversed course in February, along with other interest rate-sensitive, fixed-income securities. Investors worried that additional stimulus measures would accelerate the economic recovery and lead to rising inflation. This resulted in higher bond yields further out on the yield curve while short-term interest rates remained near zero, anchored by the Fed’s monetary policy. The sharp rise in bond yields unsettled the financial markets. Underscoring inflation fears, oil prices spiked to their highest in more than a year on March 15, 2021.
Municipals regained their footing in March 2021, with President Biden’s signing of the $1.9 trillion American Rescue Plan. This Covid-19-relief bill included another round of stimulus checks and $350 billion in aid to state and local governments. Later in the month, with inflation concerns still on the minds of investors, the Fed downplayed the possibility that it would reduce its support for the economy any time soon. Fed officials also revised their economic outlook for stronger growth for 2021 and affirmed that they still expected to keep interest rates near zero until 2023.
What contributed to the improving municipal fundamentals and favorable technicals?
Credit fundamentals continue to improve, in our view. We’ve seen an uptick in state and local tax revenue from second-quarter 2020 crisis levels, although states with income taxes have generally navigated the pandemic better than states that rely more on sales taxes. Furthermore, we believe improving economic activity, job growth, home-price appreciation, and the federal government’s direct aid to state and local governments is supporting a recovery in credit fundamentals. And despite pandemic-related challenges, defaults remain low and within long-term ranges. In 2020, the default rate represented less than 0.25% of the overall municipal bond market, and defaults within the investment-grade-rated universe were a rare occurrence.

With the outlook and market confidence generally improving, technicals are favorable as well. Fund flows, a measure of investor demand for mutual funds, totaled $51 billion for the six-month period. This demand was met with new issue supply that was down 5% from the same period a year ago, which helped to support prices. Tax-exempt supply was relatively steady on a year-over-year basis and was met by very strong demand. The Biden administration’s proposed infrastructure plan, which includes increased taxes for corporations, could generate additional interest in tax-free municipal bonds. As such, we believe the technical backdrop is favorable for the asset class and should continue to be a tailwind for the balance of 2021.
How did the fund perform during the reporting period?
For the six months ended March 31, 2021, the fund outperformed the municipal benchmark and the average return of its Lipper peer group, General & Insured Municipal Debt Funds.
What strategies influenced the fund’s performance during the period?
At period-end, the fund held an overweight exposure to investment-grade bonds rated A and BBB relative to the benchmark. The fund also held a slightly underweight exposure to lower-rated, high-yield bonds relative to its Lipper peer group. From a sector- or industry-positioning perspective, we favored continuing-care retirement communities, pre-paid gas, and power and water/sewer utilities, as well as other revenue sectors, relative to the fund’s Lipper peer group.
Duration positioning, a measure of the fund’s interest-rate sensitivity, was generally neutral relative to the level of its Lipper peer group at period-end. Our yield-curve positioning was defined by an overweight in bonds with maturities of 10 to 20 years relative to the Lipper peer group at period-end. As part of this strategy, the fund held an underweight exposure to long maturity holdings compared with the benchmark.
The fund held an overweight exposure to revenue bonds versus general obligation bonds compared with its Lipper peer group. The fund’s exposure to state and local governments was limited to those with, in our view, diverse tax bases and the ability to enact broad revenue enhancements or expense cuts. As part of our strategy for state debt, we held an overweight exposure to Illinois relative to the Lipper peer group. We believe Illinois’ financial profile continues to stabilize and that its flexibility and credit fundamentals were not completely reflected by market spreads.
We remain cautious about Puerto Rico due to what we believe are its seemingly fragile economy, weak demographic trends, poor-quality infrastructure, volatile political environment, and history of fiscal mismanagement. As such, the fund remained underweight in its exposure to Puerto Rico municipal debt relative to its Lipper peer group with no exposure at period-end. The portfolio’s exposure was less than 0.5% of total net assets and predominantly composed of pre-refunded bonds. We continue to monitor the Commonwealth’s ongoing restructuring efforts for potential opportunities.
What is your outlook for the municipal bond market in the coming months?
Municipal bonds have withstood a lot of market volatility since March 11, 2020, when the World Health Organization announced the coronavirus outbreak had reached the level of a pandemic. Just over a year later, we believe we are coming out on the other side of this health crisis, with the aid of multiple relief packages and medical advancements. The recent cash
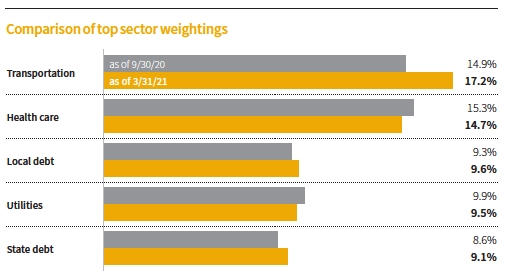
This chart shows how the fund’s top weightings have changed over the past six months. Allocations are shown as a percentage of the fund’s net assets. Current period summary information may differ from the information in the portfolio schedule notes included in the financial statements due to the inclusion of derivative securities, any interest accruals, the floating rate portion of tender option bonds, if applicable, the timing of matured security transactions, the use of different classifications of securities for presentation purposes, and rounding. Holdings and allocations may vary over time.
infusions provided by the American Rescue Plan will help state and local governments enter their 2022 budget sessions with enough cash on hand to help absorb the economic stress of the pandemic, in our view.
In addition, we believe that with the easing of mobility restrictions and the American Rescue Plan, U.S. economic growth will be strong in 2021. At the same time, the Fed remains committed to its twin goals of maximum employment and 2% sustained inflation. With these and other factors at play, we believe the greatest opportunities reside in the lower parts of the investment-grade universe as well as the high-yield sectors at this point in the economic recovery.
We’ll continue to adjust the portfolio to reflect the team’s best ideas to secure income as well as total return prospects in this evolving interest-rate environment.
Thank you, Paul, for your time and insights today.
The views expressed in this report are exclusively those of Putnam Management and are subject to change. They are not meant as investment advice.
Please note that the holdings discussed in this report may not have been held by the fund for the entire period. Portfolio composition is subject to review in accordance with the fund’s investment strategy and may vary in the future. Current and future portfolio holdings are subject to risk. Statements in the Q&A concerning the fund’s performance or portfolio composition relative to those of the fund’s Lipper peer group may reference information produced by Lipper Inc. or through a third party.
Your fund’s performance
This section shows your fund’s performance, price, and distribution information for periods ended March 31, 2021, the end of the first half of its current fiscal year. In accordance with regulatory requirements for mutual funds, we also include expense information taken from the fund’s current prospectus. Performance should always be considered in light of a fund’s investment strategy. Data represent past performance. Past performance does not guarantee future results. More recent returns may be less or more than those shown. Investment return and principal value will fluctuate, and you may have a gain or a loss when you sell your shares. Performance information does not reflect any deduction for taxes a shareholder may owe on fund distributions or on the redemption of fund shares. For the most recent month-end performance, please visit the Individual Investors section at putnam.com or call Putnam at 1-800-225-1581. Class R6 and Y shares are not available to all investors. See the Terms and definitions section in this report for definitions of the share classes offered by your fund.
Fund performance Total return for periods ended 3/31/21
| | | | | | | | | |
| | Annual | | | | | | | | |
| | average | | Annual | | Annual | | Annual | | |
| | (life of fund) | 10 years | average | 5 years | average | 3 years | average | 1 year | 6 months |
| Class A (12/31/76) | | | | | | | | | |
| Before sales charge | 6.22% | 57.34% | 4.64% | 19.11% | 3.56% | 15.12% | 4.81% | 7.14% | 2.50% |
| After sales charge | 6.12 | 51.05 | 4.21 | 14.34 | 2.72 | 10.52 | 3.39 | 2.85 | –1.60 |
| Class B (1/4/93) | | | | | | | | | |
| Before CDSC | 6.05 | 49.55 | 4.11 | 15.51 | 2.93 | 12.95 | 4.14 | 6.59 | 2.31 |
| After CDSC | 6.05 | 49.55 | 4.11 | 13.51 | 2.57 | 9.95 | 3.21 | 1.59 | –2.69 |
| Class C (7/26/99) | | | | | | | | | |
| Before CDSC | 6.06 | 47.84 | 3.99 | 14.62 | 2.77 | 12.42 | 3.98 | 6.41 | 2.23 |
| After CDSC | 6.06 | 47.84 | 3.99 | 14.62 | 2.77 | 12.42 | 3.98 | 5.41 | 1.23 |
| Class R6 (5/22/18) | | | | | | | | | |
| Net asset value | 6.29 | 60.98 | 4.88 | 20.47 | 3.79 | 15.81 | 5.01 | 7.41 | 2.76 |
| Class Y (1/2/08) | | | | | | | | | |
| Net asset value | 6.29 | 61.05 | 4.88 | 20.52 | 3.80 | 15.86 | 5.03 | 7.50 | 2.74 |
Current performance may be lower or higher than the quoted past performance, which cannot guarantee future results. After-sales-charge returns for class A shares reflect the deduction of the maximum 4.00% sales charge levied at the time of purchase. Class B share returns after contingent deferred sales charge (CDSC) reflect the applicable CDSC, which is 5% in the first year, declining over time to 1% in the sixth year, and is eliminated thereafter. Class C share returns after CDSC reflect a 1% CDSC for the first year that is eliminated thereafter. Class R6 and Y shares have no initial sales charge or CDSC. Performance for class B, C, and Y shares before their inception is derived from the historical performance of class A shares, adjusted for the applicable sales charge (or CDSC) and the higher operating expenses for such shares, except for class Y shares, for which 12b-1 fees are not applicable. Performance for class R6 shares prior to their inception is derived from the historical performance of class Y shares and has not been adjusted for the lower investor servicing fees applicable to class R6 shares; had it, returns would have been higher.
For a portion of the periods, the fund had expense limitations, without which returns would have been lower.
Class B and C share performance reflects conversion to class A shares after eight years.
|
| 10 Tax Exempt Income Fund |
Comparative index returns For periods ended 3/31/21
| | | | | | | | | |
| | Annual | | | | | | | | |
| | average | | Annual | | Annual | | Annual | | |
| | (life of fund) | 10 years | average | 5 years | average | 3 years | average | 1 year | 6 months |
| Bloomberg Barclays | | | | | | | | | |
| Municipal Bond | —† | 55.84% | 4.54% | 18.72% | 3.49% | 15.47% | 4.91% | 5.51% | 1.46% |
| Index* | | | | | | | | | |
| Lipper General & | | | | | | | | | |
| Insured Municipal | | | | | | | | | |
| Debt Funds | 5.66% | 57.61 | 4.61 | 18.18 | 3.38 | 14.66 | 4.66 | 6.74 | 2.41 |
| category average‡ | | | | | | | | | |
Index and Lipper results should be compared with fund performance before sales charge, before CDSC, or at net asset value.
* Source: Bloomberg Index Services Limited.
† The fund’s benchmark, the Bloomberg Barclays Municipal Bond Index, was introduced on 12/31/79, which post-dates the inception of the fund’s class A shares.
‡ Over the 6-month, 1-year, 3-year, 5-year, 10-year, and life-of-fund periods ended 3/31/21, there were 290, 287, 251, 220, 163, and 8 funds, respectively, in this Lipper category.
Fund price and distribution information For the six-month period ended 3/31/21
| | | | | | |
| Distributions | Class A | Class B | Class C | Class R6 | Class Y |
| Number | 6 | 6 | 6 | 6 | 6 |
| Income1 | $0.096641 | $0.070141 | $0.063760 | $0.108745 | $0.107904 |
| Capital gains2 | — | — | — | — | — |
| Total | $0.096641 | $0.070141 | $0.063760 | $0.108745 | $0.107904 |
| | Before | After | Net | Net | Net | Net |
| | sales | sales | asset | asset | asset | asset |
| Share value | charge | charge | value | value | value | value |
| 9/30/20 | $8.68 | $9.04 | $8.68 | $8.70 | $8.69 | $8.70 |
| 3/31/21 | 8.80 | 9.17 | 8.81 | 8.83 | 8.82 | 8.83 |
| | Before | After | Net | Net | Net | Net |
| Current rate | sales | sales | asset | asset | asset | asset |
| (end of period) | charge | charge | value | value | value | value |
| Current dividend rate3 | 2.14% | 2.06% | 1.55% | 1.40% | 2.41% | 2.39% |
| Taxable equivalent4 | 3.61 | 3.48 | 2.62 | 2.36 | 4.07 | 4.04 |
| Current 30-day | | | | | | |
| SEC yield5 | N/A | 0.91 | 0.36 | 0.21 | 1.21 | 1.20 |
| Taxable equivalent4 | N/A | 1.54 | 0.61 | 0.35 | 2.04 | 2.03 |
The classification of distributions, if any, is an estimate. Before-sales-charge share value and current dividend rate for class A shares, if applicable, do not take into account any sales charge levied at the time of purchase. After-sales-charge share value, current dividend rate, and current 30-day SEC yield, if applicable, are calculated assuming that the maximum sales charge (4.00% for class A shares) was levied at the time of purchase. Final distribution information will appear on your year-end tax forms.
1 For some investors, investment income may be subject to the federal alternative minimum tax.
2 Capital gains, if any, are taxable for federal and, in most cases, state purposes.
3 Most recent distribution, including any return of capital and excluding capital gains, annualized and divided by share price before or after sales charge at period-end.
4 Assumes maximum 40.80% federal and state combined tax rate for 2020. Results for investors subject to lower tax rates would not be as advantageous.
5 Based only on investment income and calculated using the maximum offering price for each share class, in accordance with SEC guidelines.
|
| Tax Exempt Income Fund 11 |
Your fund’s expenses
As a mutual fund investor, you pay ongoing expenses, such as management fees, distribution fees (12b-1 fees), and other expenses. Using the following information, you can estimate how these expenses affect your investment and compare them with the expenses of other funds. You may also pay one-time transaction expenses, including sales charges (loads) and redemption fees, which are not shown in this section and would have resulted in higher total expenses. For more information, see your fund’s prospectus or talk to your financial representative.
Expense ratios
| | | | | |
| | Class A | Class B | Class C | Class R6 | Class Y |
| Total annual operating expenses for the fiscal | | | | | |
| year ended 9/30/20 | 0.83%* | 1.43% | 1.58% | 0.56% | 0.58% |
| Annualized expense ratio for the six-month | | | | | |
| period ended 3/31/21 | 0.81% | 1.41% | 1.56% | 0.54% | 0.56% |
Fiscal year expense information in this table is taken from the most recent prospectus, is subject to change, and may differ from that shown for the annualized expense ratio and in the financial highlights of this report.
Expenses are shown as a percentage of average net assets.
* Distribution and service (12b-1) fees have been restated to reflect current fees.
Expenses per $1,000
The following table shows the expenses you would have paid on a $1,000 investment in each class of the fund from 10/1/20 to 3/31/21. It also shows how much a $1,000 investment would be worth at the close of the period, assuming actual returns and expenses.
| | | | | |
| | Class A | Class B | Class C | Class R6 | Class Y |
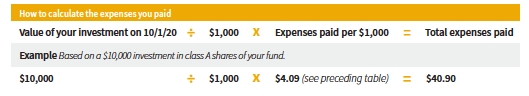
| Expenses paid per $1,000*† | $4.09 | $7.11 | $7.87 | $2.73 | $2.83 |
| Ending value (after expenses) | $1,025.00 | $1,023.10 | $1,022.30 | $1,027.60 | $1,027.40 |
* Expenses for each share class are calculated using the fund’s annualized expense ratio for each class, which represents the ongoing expenses as a percentage of average net assets for the six months ended 3/31/21. The expense ratio may differ for each share class.
† Expenses are calculated by multiplying the expense ratio by the average account value for the period; then multiplying the result by the number of days in the period; and then dividing that result by the number of days in the year.
|
| 12 Tax Exempt Income Fund |
Estimate the expenses you paid
To estimate the ongoing expenses you paid for the six months ended 3/31/21, use the following calculation method. To find the value of your investment on 10/1/20, call Putnam at 1-800-225-1581.
Compare expenses using the SEC’s method
The Securities and Exchange Commission (SEC) has established guidelines to help investors assess fund expenses. Per these guidelines, the following table shows your fund’s expenses based on a $1,000 investment, assuming a hypothetical 5% annualized return. You can use this information to compare the ongoing expenses (but not transaction expenses or total costs) of investing in the fund with those of other funds. All mutual fund shareholder reports will provide this information to help you make this comparison. Please note that you cannot use this information to estimate your actual ending account balance and expenses paid during the period.
| | | | | |
| | Class A | Class B | Class C | Class R6 | Class Y |
| Expenses paid per $1,000*† | $4.08 | $7.09 | $7.85 | $2.72 | $2.82 |
| Ending value (after expenses) | $1,020.89 | $1,017.90 | $1,017.15 | $1,022.24 | $1,022.14 |
* Expenses for each share class are calculated using the fund’s annualized expense ratio for each class, which represents the ongoing expenses as a percentage of average net assets for the six months ended 3/31/21. The expense ratio may differ for each share class.
† Expenses are calculated by multiplying the expense ratio by the average account value for the six-month period; then multiplying the result by the number of days in the six-month period; and then dividing that result by the number of days in the year.
|
| Tax Exempt Income Fund 13 |
Consider these risks before investing
Capital gains, if any, are taxable for federal and, in most cases, state purposes. For some investors, investment income may be subject to the federal alternative minimum tax. Income from federally tax-exempt funds may be subject to state and local taxes. Bond investments are subject to interest-rate risk (the risk of bond prices falling if interest rates rise) and credit risk (the risk of an issuer defaulting on interest or principal payments). Interest-rate risk is generally greater for longer-term bonds, and credit risk is generally greater for below-investment-grade bonds. Unlike bonds, funds that invest in bonds have fees and expenses. Tax-exempt bonds may be issued under the Internal Revenue Code only by limited types of issuers for limited types of projects. As a result, the fund’s investments may be focused in certain market segments and be more vulnerable to fluctuations in the values of the securities it holds than a more broadly invested fund. Interest the fund receives might be taxable. The value of investments in the fund’s portfolio may fall or fail to rise over extended periods of time for a variety of reasons, including general economic, political, or financial market conditions; investor sentiment and market perceptions; government actions; geopolitical events or changes; and factors related to a specific issuer, geography, industry, or sector. These and other factors may lead to increased volatility and reduced liquidity in the fund’s portfolio holdings. Our investment techniques, analyses, and judgments may not produce the outcome we intend. The investments we select for the fund may not perform as well as other securities that we do not select for the fund. We, or the fund’s other service providers, may experience disruptions or operating errors that could have a negative effect on the fund. You can lose money by investing in the fund.
|
| 14 Tax Exempt Income Fund |
Terms and definitions
Important terms
Total return shows how the value of the fund’s shares changed over time, assuming you held the shares through the entire period and reinvested all distributions in the fund.
Before sales charge, or net asset value, is the price, or value, of one share of a mutual fund, without a sales charge. Before-sales-charge figures fluctuate with market conditions, and are calculated by dividing the net assets of each class of shares by the number of outstanding shares in the class.
After sales charge is the price of a mutual fund share plus the maximum sales charge levied at the time of purchase. After-sales-charge performance figures shown here assume the 4.00% maximum sales charge for class A shares.
Contingent deferred sales charge (CDSC) is generally a charge applied at the time of the redemption of class B or C shares and assumes redemption at the end of the period. Your fund’s class B CDSC declines over time from a 5% maximum during the first year to 1% during the sixth year. After the sixth year, the CDSC no longer applies. The CDSC for class C shares is 1% for one year after purchase.
Share classes
Class A shares are generally subject to an initial sales charge and no CDSC (except on certain redemptions of shares bought without an initial sales charge).
Class B shares are closed to new investments and are only available by exchange from another Putnam fund or through dividend and/or capital gains reinvestment. They are not subject to an initial sales charge and may be subject to a CDSC.
Class C shares are not subject to an initial sales charge and are subject to a CDSC only if the shares are redeemed during the first year.
Class R6 shares are not subject to an initial sales charge or CDSC and carry no 12b-1 fee. They are generally only available to employer-sponsored retirement plans, corporate and institutional clients, and clients in other approved programs.
Class Y shares are not subject to an initial sales charge or CDSC and carry no 12b-1 fee. They are generally only available to corporate and institutional clients and clients in other approved programs.
Fixed-income terms
Current rate is the annual rate of return earned from dividends or interest of an investment. Current rate is expressed as a percentage of the price of a security, fund share, or principal investment.
Yield curve is a graph that plots the yields of bonds with equal credit quality against their differing maturity dates, ranging from shortest to longest. It is used as a benchmark for other debt, such as mortgage or bank lending rates.
Comparative indexes
Bloomberg Barclays Municipal Bond Index is an unmanaged index of long-term fixed-rate investment-grade tax-exempt bonds.
Bloomberg Barclays U.S. Aggregate Bond Index is an unmanaged index of U.S. investment-grade fixed-income securities.
ICE BofA (Intercontinental Exchange Bank of America) U.S. 3-Month Treasury Bill Index is an unmanaged index that seeks to measure the performance of U.S. Treasury bills available in the marketplace.
S&P 500 Index is an unmanaged index of common stock performance.
Indexes assume reinvestment of all distributions and do not account for fees. Securities and performance of a fund and an index will differ. You cannot invest directly in an index.
BLOOMBERG® is a trademark and service mark of Bloomberg Finance L.P. and its affiliates (collectively “Bloomberg”). BARCLAYS® is a trademark and service mark of Barclays Bank Plc (collectively with its
|
| Tax Exempt Income Fund 15 |
affiliates, “Barclays”), used under license. Bloomberg or Bloomberg’s licensors, including Barclays, own all proprietary rights in the Bloomberg Barclays Indices. Neither Bloomberg nor Barclays approves or endorses this material, or guarantees the accuracy or completeness of any information herein, or makes any warranty, express or limited, as to the results to be obtained therefrom, and to the maximum extent allowed by law, neither shall have any liability or responsibility for injury or damages arising in connection therewith.
ICE Data Indices, LLC (“ICE BofA”), used with permission. ICE BofA permits use of the ICE BofA indices and related data on an “as is” basis; makes no warranties regarding same; does not guarantee the suitability, quality, accuracy, timeliness, and/or completeness of the ICE BofA indices or any data included in, related to, or derived therefrom; assumes no liability in connection with the use of the foregoing; and does not sponsor, endorse, or recommend Putnam Investments, or any of its products or services.
Lipper, a Refinitiv company, is a third-party industry-ranking entity that ranks mutual funds. Its rankings do not reflect sales charges. Lipper rankings are based on total return at net asset value relative to other funds that have similar current investment styles or objectives as determined by Lipper. Lipper may change a fund’s category assignment at its discretion. Lipper category averages reflect performance trends for funds within a category.
Other information for shareholders
Important notice regarding delivery of shareholder documents
In accordance with Securities and Exchange Commission (SEC) regulations, Putnam sends a single notice of internet availability, or a single printed copy, of annual and semiannual shareholder reports, prospectuses, and proxy statements to Putnam shareholders who share the same address, unless a shareholder requests otherwise. If you prefer to receive your own copy of these documents, please call Putnam at 1-800-225-1581, and Putnam will begin sending individual copies within 30 days.
Proxy voting
Putnam is committed to managing our mutual funds in the best interests of our shareholders. The Putnam funds’ proxy voting guidelines and procedures, as well as information regarding how your fund voted proxies relating to portfolio securities during the 12-month period ended June 30, 2020, are available in the Individual Investors section of putnam.com and on the SEC’s website, www.sec.gov. If you have questions about finding forms on the SEC’s website, you may call the SEC at 1-800-SEC-0330. You may also obtain the Putnam funds’ proxy voting guidelines and procedures at no charge by calling Putnam’s Shareholder Services at 1-800-225-1581.
Fund portfolio holdings
The fund will file a complete schedule of its portfolio holdings with the SEC for the first and third quarters of each fiscal year on Form N-PORT within 60 days of the end of such fiscal quarter. Shareholders may obtain the fund’s Form N-PORT on the SEC’s website at www.sec.gov.
Prior to its use of Form N-PORT, the fund filed its complete schedule of its portfolio holdings with the SEC on Form N-Q, which is available online at www.sec.gov.
Trustee and employee fund ownership
Putnam employees and members of the Board of Trustees place their faith, confidence, and, most importantly, investment dollars in Putnam mutual funds. As of March 31, 2021, Putnam employees had approximately $559,000,000 and the Trustees had approximately $79,000,000 invested in Putnam mutual funds. These amounts include investments by the Trustees’ and employees’ immediate family members as well as investments through retirement and deferred compensation plans.
|
| 16 Tax Exempt Income Fund |
Financial statements
These sections of the report, as well as the accompanying Notes, constitute the fund’s financial statements.
The fund’s portfolio lists all the fund’s investments and their values as of the last day of the reporting period. Holdings are organized by asset type and industry sector, country, or state to show areas of concentration and diversification.
Statement of assets and liabilities shows how the fund’s net assets and share price are determined. All investment and non-investment assets are added together. Any unpaid expenses and other liabilities are subtracted from this total. The result is divided by the number of shares to determine the net asset value per share, which is calculated separately for each class of shares. (For funds with preferred shares, the amount subtracted from total assets includes the liquidation preference of preferred shares.)
Statement of operations shows the fund’s net investment gain or loss. This is done by first adding up all the fund’s earnings — from dividends and interest income — and subtracting its operating expenses to determine net investment income (or loss). Then, any net gain or loss the fund realized on the sales of its holdings — as well as any unrealized gains or losses over the period — is added to or subtracted from the net investment result to determine the fund’s net gain or loss for the fiscal period.
Statement of changes in net assets shows how the fund’s net assets were affected by the fund’s net investment gain or loss, by distributions to shareholders, and by changes in the number of the fund’s shares. It lists distributions and their sources (net investment income or realized capital gains) over the current reporting period and the most recent fiscal year-end. The distributions listed here may not match the sources listed in the Statement of operations because the distributions are determined on a tax basis and may be paid in a different period from the one in which they were earned. Dividend sources are estimated at the time of declaration. Actual results may vary. Any non-taxable return of capital cannot be determined until final tax calculations are completed after the end of the fund’s fiscal year.
Financial highlights provide an overview of the fund’s investment results, per-share distributions, expense ratios, net investment income ratios, and portfolio turnover in one summary table, reflecting the five most recent reporting periods. In a semiannual report, the highlights table also includes the current reporting period.
|
| Tax Exempt Income Fund 17 |
The fund’s portfolio 3/31/21 (Unaudited)
Key to holding’s abbreviations
| |
| ABAG Association Of Bay Area Governments | PSFG Permanent School Fund Guaranteed |
| AGM Assured Guaranty Municipal Corporation | Q-SBLF Qualified School Board Loan Fund |
| AMBAC AMBAC Indemnity Corporation | U.S. Govt. Coll. U.S. Government Collateralized |
| BAM Build America Mutual | VRDN Variable Rate Demand Notes, which are floating- |
| FGIC Financial Guaranty Insurance Company | rate securities with long-term maturities that carry |
| FRB Floating Rate Bonds: the rate shown is the current | coupons that reset and are payable upon demand |
| interest rate at the close of the reporting period. Rates | either daily, weekly or monthly. The rate shown is the |
| may be subject to a cap or floor. For certain securities, | current interest rate at the close of the reporting |
| the rate may represent a fixed rate currently in place | period. Rates are set by remarketing agents and may |
| at the close of the reporting period. | take into consideration market supply and demand, |
| G.O. Bonds General Obligation Bonds | credit quality and the current SIFMA Municipal Swap |
| NATL National Public Finance Guarantee Corporation | Index rate, which was 0.07% as of the close of the |
| | reporting period. |
| | | |
| MUNICIPAL BONDS AND NOTES (103.3%)* | Rating** | Principal amount | Value |
| Alabama (0.5%) | | | |
| Jefferson Cnty., Swr. Rev. Bonds, Ser. D, | | | |
| 6.50%, 10/1/53 | BBB | $1,000,000 | $1,175,243 |
| Jefferson, Cnty. Rev. Bonds, (Refunding warrants) | | | |
| 5.00%, 9/15/34 | AA | 2,575,000 | 3,081,573 |
| 5.00%, 9/15/33 | AA | 350,000 | 419,815 |
| | | | 4,676,631 |
| Alaska (1.1%) | | | |
| AK State Indl. Dev. & Export Auth. Rev. Bonds, | | | |
| (Tanana Chiefs Conference), Ser. A | | | |
| 4.00%, 10/1/44 | A+/F | 6,425,000 | 7,174,993 |
| 4.00%, 10/1/39 | A+/F | 2,575,000 | 2,912,711 |
| | | | 10,087,704 |
| Arizona (3.0%) | | | |
| AZ Game & Fish Dept. and Comm. Rev. Bonds, | | | |
| (AGF Administration Bldg.), 5.00%, 7/1/21 | Aa2 | 135,000 | 135,477 |
| AZ State Indl. Dev. Auth. Rev. Bonds, (Equitable | | | |
| School Revolving Fund, LLC Oblig. Group) | | | |
| 4.00%, 11/1/45 | A | 2,200,000 | 2,504,546 |
| 4.00%, 11/1/40 | A | 800,000 | 922,273 |
| 4.00%, 11/1/39 | A | 750,000 | 867,796 |
| 4.00%, 11/1/38 | A | 600,000 | 696,695 |
| 4.00%, 11/1/37 | A | 1,100,000 | 1,281,322 |
| AZ State Indl. Dev. Auth. Ed. 144A Rev. Bonds, | | | |
| (BASIS Schools, Inc.), Ser. D, 5.00%, 7/1/51 | BB | 1,025,000 | 1,140,805 |
| AZ State Sports & Tourism Auth. Rev. Bonds, | | | |
| (Multi-Purpose Stadium Fac.), Ser. A, 5.00%, 7/1/30 | A1 | 500,000 | 521,905 |
| El Mirage, G.O. Bonds, AGM, 5.00%, 7/1/42 | AA | 250,000 | 262,697 |
| Glendale, Indl. Dev. Auth. Sr. Living Fac. Rev. Bonds, | | | |
| (Royal Oaks Life Care Cmnty.), 5.00%, 5/15/39 | BBB–/F | 3,500,000 | 3,803,060 |
| Lake Havasu City, Waste Wtr. Syst. Rev. Bonds, | | | |
| Ser. B, AGM, 5.00%, 7/1/43 | AA | 250,000 | 290,037 |
|
| 18 Tax Exempt Income Fund |
| | | |
| MUNICIPAL BONDS AND NOTES (103.3%)* cont. | Rating** | Principal amount | Value |
| Arizona cont. | | | |
| Maricopa Cnty., Indl. Dev. Auth. Ed. Rev. Bonds | | | |
| (Great Hearts Academies), Ser. C, 5.00%, 7/1/48 | AA– | $600,000 | $697,753 |
| (Reid Traditional Schools Painted Rock Academy), | | | |
| 5.00%, 7/1/36 | Baa3 | 250,000 | 279,044 |
| (Horizon Cmnty. Learning Ctr.), 5.00%, 7/1/35 | BB+ | 350,000 | 379,972 |
| Northern AZ U. Rev. Bonds, 5.00%, 6/1/34 | A1 | 250,000 | 280,020 |
| Phoenix, Civic Impt. Corp. Dist. Rev. Bonds, | | | |
| (Civic Plaza), Ser. B, FGIC, NATL, 5.50%, 7/1/43 | Aa2 | 1,000,000 | 1,562,717 |
| Phoenix, Indl. Dev. Auth. Ed. Rev. Bonds | | | |
| (Great Hearts Academies), 5.00%, 7/1/44 | BBB– | 1,000,000 | 1,071,841 |
| (Great Hearts Academies), Ser. A, 5.00%, 7/1/36 | BBB– | 1,010,000 | 1,116,835 |
| (Choice Academies, Inc.), 4.875%, 9/1/22 | BB | 65,000 | 66,694 |
| (Great Hearts Academies), 3.75%, 7/1/24 | BBB– | 145,000 | 151,731 |
| Phoenix, Indl. Dev. Auth. Ed. 144A Rev. Bonds, | | | |
| (BASIS Schools, Inc.) | | | |
| 5.00%, 7/1/35 | BB | 100,000 | 109,696 |
| Ser. A, 5.00%, 7/1/35 | BB | 150,000 | 164,545 |
| Salt River Project Agricultural Impt. & Pwr. | | | |
| Dist. Rev. Bonds | | | |
| 5.00%, 1/1/29 ## | Aa1 | 2,700,000 | 3,433,926 |
| 5.00%, 1/1/28 ## | Aa1 | 1,000,000 | 1,247,954 |
| Salt Verde, Fin. Corp. Gas Rev. Bonds | | | |
| 5.50%, 12/1/29 | A3 | 1,900,000 | 2,478,560 |
| 5.00%, 12/1/37 | A3 | 500,000 | 694,842 |
| U. of AZ Board of Regents Syst. Rev. Bonds, | | | |
| (Green Bond), Ser. A, 5.00%, 7/1/41 | Aa2 | 200,000 | 233,658 |
| Yavapai Cnty., Indl. Dev. Auth. Hosp. Fac. Rev. Bonds, | | | |
| (Yavapai Regl. Med. Ctr.), Ser. A, 5.25%, 8/1/33 | A2 | 100,000 | 108,799 |
| Yavapai Cnty., Indl. Dev. Ed. Auth. Rev. Bonds, | | | |
| (Agribusiness & Equine Ctr.), 5.00%, 3/1/32 | BB+ | 265,000 | 274,573 |
| Yuma, Indl. Dev. Auth. Hosp. Rev. Bonds, (Yuma Regl. | | | |
| Med. Ctr.), Ser. A, 5.25%, 8/1/32 | A | 400,000 | 453,733 |
| | | | 27,233,506 |
| California (5.7%) | | | |
| ABAG Fin. Auth. for Nonprofit Corps. Rev. Bonds, | | | |
| (Episcopal Sr. Cmntys.), Ser. A, 5.00%, 7/1/42 | A–/F | 1,300,000 | 1,340,273 |
| CA Hsg. Fin. Agcy. Muni. Certif. Rev. Bonds, Ser. 21-1, | | | |
| Class A, 3.50%, 11/20/35 | BBB+ | 3,200,000 | 3,653,847 |
| CA Pub. Fin. Auth. VRDN, (Sharp Hlth. Care Oblig. | | | |
| Group), Ser. C, 0.04%, 8/1/52 | VMIG 1 | 1,500,000 | 1,500,000 |
| CA State VRDN | | | |
| Ser. A-2, 0.03%, 5/1/33 (Prerefunded 5/3/21) | VMIG 1 | 3,800,000 | 3,800,000 |
| Ser. A-3, 0.03%, 5/1/33 (Prerefunded 5/3/21) | VMIG 1 | 9,380,000 | 9,380,000 |
| CA State Infrastructure & Econ. Dev. Bank | | | |
| Mandatory Put Bonds (8/1/21), (California Academy | | | |
| of Sciences), Ser. B, 0.456%, 8/1/47 | A2 | 1,000,000 | 999,981 |
| CA State Poll. Control Fin. Auth. Rev. Bonds, | | | |
| (San Jose Wtr. Co.), 4.75%, 11/1/46 | A | 1,700,000 | 1,929,946 |
| CA State Poll. Control Fin. Auth. 144A Rev. Bonds, | | | |
| (Wtr. Furnishing), 5.00%, 11/21/45 | Baa3 | 3,500,000 | 3,705,956 |
|
| Tax Exempt Income Fund 19 |
| | | |
| MUNICIPAL BONDS AND NOTES (103.3%)* cont. | Rating** | Principal amount | Value |
| California cont. | | | |
| CA State Pub. Wks. Board Rev. Bonds, (Various Cap. | | | |
| Projects.), Ser. A, 5.00%, 8/1/33 ## | Aa3 | $4,500,000 | $5,659,303 |
| CA Statewide Cmnty. Dev. Auth. Rev. Bonds | | | |
| (899 Charleston, LLC), Ser. A, 5.25%, 11/1/44 | BB/P | 655,000 | 677,792 |
| AGM, 5.00%, 11/15/44 (Prerefunded 11/15/24) | AA | 1,500,000 | 1,754,197 |
| M-S-R Energy Auth. Rev. Bonds, Ser. A, | | | |
| 6.50%, 11/1/39 | BBB+ | 2,250,000 | 3,596,960 |
| San Bernardino Cnty., FRB, Ser. C, 0.345%, 8/1/23 | AA+ | 7,500,000 | 7,447,817 |
| San Francisco, City & Cnty. Arpt. Comm. Intl. Arpt. | | | |
| VRDN Rev. Bonds, Ser. B, 0.06%, 5/1/58 | VMIG 1 | 2,000,000 | 2,000,000 |
| U. of CA VRDN Rev. Bonds, Ser. AL-4, 0.04%, 5/15/48 | VMIG 1 | 4,800,000 | 4,800,000 |
| | | | 52,246,072 |
| Colorado (3.2%) | | | |
| CO State Hlth. Fac. Auth. Rev. Bonds | | | |
| (Valley View Hosp. Assn.), 5.00%, 5/15/45 | A– | 1,000,000 | 1,127,159 |
| (Covenant Retirement Cmnty.), Ser. A, | | | |
| 5.00%, 12/1/35 | A–/F | 1,000,000 | 1,108,730 |
| (CommonSpirit Health Oblig. Group), Ser. A-1, | | | |
| 4.00%, 8/1/37 T | Baa1 | 425,000 | 479,852 |
| (CommonSpirit Health Oblig. Group), Ser. A-1, | | | |
| 4.00%, 8/1/38 T | Baa1 | 650,000 | 732,722 |
| (CommonSpirit Health Oblig. Group), Ser. A-1, | | | |
| 4.00%, 8/1/39 T | Baa1 | 650,000 | 731,397 |
| (CommonSpirit Health Oblig. Group), Ser. A-1, | | | |
| 4.00%, 8/1/39 T | Baa1 | 2,250,000 | 2,507,575 |
| (CommonSpirit Health Oblig. Group), Ser. A-2, | | | |
| 4.00%, 8/1/49 T | Baa1 | 4,500,000 | 4,995,807 |
| CO State Hlth. Fac. Auth. Hosp. Rev. Bonds, | | | |
| (Covenant Living Cmnty. and Svcs. Oblig. Group), | | | |
| 4.00%, 12/1/50 | A–/F | 4,100,000 | 4,523,997 |
| Denver City & Cnty., Arpt. Rev. Bonds, (Sub. Syst.), | | | |
| Ser. A, 5.50%, 11/15/31 | A2 | 1,925,000 | 2,156,034 |
| E-470 CO Pub. Hwy. Auth. Rev. Bonds, Ser. A, NATL, | | | |
| zero %, 9/1/34 | A2 | 5,000,000 | 3,721,956 |
| Park Creek, Metro. Dist. Tax Allocation Bonds, | | | |
| (Sr. Ltd. Property Tax Supported), Ser. A, | | | |
| 5.00%, 12/1/45 | A/F | 225,000 | 253,997 |
| Regl. Trans. Dist. Rev. Bonds, | | | |
| (Denver Transit Partners, LLC) | | | |
| 5.00%, 1/15/32 | Baa2 | 1,000,000 | 1,289,945 |
| 4.00%, 7/15/34 | Baa2 | 1,000,000 | 1,187,530 |
| 4.00%, 1/15/33 | Baa2 | 350,000 | 418,210 |
| Vauxmont, Metro. Dist. G.O. Bonds, AGM | | | |
| 5.00%, 12/1/50 | AA | 1,500,000 | 1,795,926 |
| 5.00%, 12/1/31 | AA | 230,000 | 289,117 |
| 3.25%, 12/15/50 | AA | 2,000,000 | 2,115,728 |
| | | | 29,435,682 |
|
| 20 Tax Exempt Income Fund |
| | | |
| MUNICIPAL BONDS AND NOTES (103.3%)* cont. | Rating** | Principal amount | Value |
| Connecticut (1.0%) | | | |
| CT State Hlth. & Edl. Fac. Auth. Rev. Bonds, | | | |
| (Masonicare Issue), Ser. F, 5.00%, 7/1/34 | BBB+/F | $1,500,000 | $1,671,308 |
| CT State Hsg. Fin. Auth. Mtge. Program Rev. Bonds | | | |
| Ser. B-1, 4.10%, 11/15/39 T | Aaa | 1,685,000 | 1,791,061 |
| Ser. B-1, 4.15%, 11/15/44 T | Aaa | 4,065,000 | 4,314,623 |
| Ser. F-2, 2.20%, 5/15/23 | Aaa | 965,000 | 993,444 |
| | | | 8,770,436 |
| District of Columbia (2.5%) | | | |
| DC Rev. Bonds | | | |
| (Howard U.), Ser. A, 6.50%, 10/1/41 | | | |
| (Prerefunded 4/1/21) | BBB– | 2,955,000 | 2,955,000 |
| (Intl. School), 5.00%, 7/1/54 | BBB | 1,275,000 | 1,452,713 |
| (KIPP DC), Ser. A, 5.00%, 7/1/48 | BBB+ | 1,250,000 | 1,449,277 |
| (D.C. Intl. School), 5.00%, 7/1/39 | BBB | 2,000,000 | 2,333,870 |
| (KIPP DC), Ser. A, 5.00%, 7/1/37 | BBB+ | 2,500,000 | 2,950,193 |
| DC Ballpark Rev. Bonds, Ser. B-1, FGIC, NATL, | | | |
| 5.00%, 2/1/25 | A2 | 1,035,000 | 1,038,081 |
| Metro. Washington, Arpt. Auth. Dulles Toll | | | |
| Rd. Rev. Bonds | | | |
| (Dulles Metrorail & Capital Impt Project), Ser. B, | | | |
| 4.00%, 10/01/53 T | A– | 2,050,000 | 2,308,860 |
| (Dulles Metrorail & Capital Impt Project), Ser. B, | | | |
| 4.00%, 10/01/44 T | A– | 2,050,000 | 2,326,918 |
| (Metrorail), Ser. A, zero %, 10/1/37 | A– | 11,000,000 | 6,215,000 |
| | | | 23,029,912 |
| Florida (4.3%) | | | |
| Double Branch Cmnty. Dev. Dist. Special Assmt. | | | |
| Bonds, Ser. A-1, 4.25%, 5/1/34 | A | 890,000 | 934,640 |
| FL State Dev. Fin. Corp. Ed. Fac. Rev. Bonds, | | | |
| (River City Ed. Oblig. Group) | | | |
| 4.00%, 7/1/55 | Baa3 | 750,000 | 794,358 |
| 4.00%, 7/1/45 | Baa3 | 600,000 | 640,811 |
| Halifax Hosp. Med. Ctr. Rev. Bonds, 5.00%, 6/1/36 | A– | 3,700,000 | 4,218,117 |
| Lakeland, Hosp. Syst. Rev. Bonds, | | | |
| (Lakeland Regl. Hlth.) | | | |
| 5.00%, 11/15/45 | A2 | 1,735,000 | 1,944,935 |
| 5.00%, 11/15/40 | A2 | 2,175,000 | 2,449,612 |
| Lee Cnty., Indl. Dev. Auth. Rev. Bonds, | | | |
| (Shell Point/Waterside Hlth.) | | | |
| 5.00%, 11/15/49 | BBB+ | 1,800,000 | 2,066,760 |
| 5.00%, 11/15/39 | BBB+ | 750,000 | 871,029 |
| Miami-Dade Cnty., Aviation Rev. Bonds | | | |
| Ser. B, 5.00%, 10/1/40 | A– | 5,000,000 | 5,930,128 |
| Ser. A, 5.00%, 10/1/38 | A– | 1,750,000 | 2,032,729 |
| Ser. A, 4.00%, 10/1/44 | A– | 3,000,000 | 3,347,757 |
| Orange Cnty., Hlth. Fac. Auth. Rev. Bonds, | | | |
| (Presbyterian Retirement Cmntys.), 5.00%, 8/1/34 | A–/F | 1,800,000 | 1,956,852 |
| Palm Beach Cnty., Hlth. Fac. Auth. Rev. Bonds, | | | |
| (Acts Retirement-Life Cmnty., Inc.), 5.00%, 11/15/32 | A–/F | 5,000,000 | 5,870,622 |
| Southeast Overtown Park West Cmnty. Redev. Agcy. | | | |
| 144A Tax Alloc. Bonds, Ser. A-1, 5.00%, 3/1/30 | BBB+ | 480,000 | 528,994 |
|
| Tax Exempt Income Fund 21 |
| | | |
| MUNICIPAL BONDS AND NOTES (103.3%)* cont. | Rating** | Principal amount | Value |
| Florida cont. | | | |
| Tampa, Cap. Impt. Cigarette Tax Rev. Bonds, | | | |
| (Cap. Appn.), Ser. A | | | |
| zero %, 9/1/49 | A1 | $2,250,000 | $790,054 |
| zero %, 9/1/42 | A1 | 830,000 | 396,847 |
| Tampa, Hosp. Rev. Bonds, (H. Lee Moffitt Cancer Ctr. | | | |
| & Research Inst.), 4.00%, 7/1/45 | A2 | 2,500,000 | 2,820,981 |
| Volusia Cnty., Edl. Fac. Auth. Rev. Bonds, | | | |
| (Embry-Riddle Aeronautical University, Inc.), Ser. A | | | |
| 4.00%, 10/15/39 | A2 | 500,000 | 567,454 |
| 4.00%, 10/15/37 | A2 | 725,000 | 827,227 |
| 4.00%, 10/15/35 | A2 | 325,000 | 373,851 |
| | | | 39,363,758 |
| Georgia (4.4%) | | | |
| Atlanta, Tax Alloc. Bonds, (Atlantic Station), | | | |
| 5.00%, 12/1/24 | A3 | 800,000 | 915,573 |
| Cobb Cnty., Kennestone Hosp. Auth. Rev. Bonds, | | | |
| (WellStar Hlth. Syst. Oblig. Group) | | | |
| 4.00%, 4/1/41 | A2 | 275,000 | 318,693 |
| 4.00%, 4/1/39 | A2 | 475,000 | 553,385 |
| 4.00%, 4/1/36 | A2 | 250,000 | 294,099 |
| 4.00%, 4/1/35 | A2 | 225,000 | 265,649 |
| 4.00%, 4/1/34 | A2 | 250,000 | 295,894 |
| 4.00%, 4/1/33 | A2 | 200,000 | 237,694 |
| Gainesville & Hall Cnty., Dev. Auth. Edl. Fac. Rev. | | | |
| Bonds, (Riverside Military Academy), 5.00%, 3/1/37 | BB/F | 450,000 | 445,599 |
| Gainesville & Hall Cnty., Hosp. Auth. Rev. | | | |
| Bonds, (Northeast GA Hlth. Syst., Inc.), Ser. A, | | | |
| 5.00%, 2/15/36 | A | 4,000,000 | 4,781,632 |
| Geo L Smith II GA Congress Ctr. Rev. Bonds, | | | |
| (Signia Hotel Mgt., LLC.), 4.00%, 1/1/54 ## | BBB– | 2,400,000 | 2,667,852 |
| Main Street Natural Gas, Inc. Gas Supply Mandatory | | | |
| Put Bonds (9/1/23), Ser. B, 0.823%, 4/1/48 | Aa2 | 7,000,000 | 7,039,159 |
| Main Street Natural Gas, Inc. Gas Supply Rev. Bonds, | | | |
| Ser. A, 5.00%, 5/15/33 | A3 | 1,500,000 | 1,842,427 |
| Monroe Cnty., Dev. Auth. Rev. Bonds, | | | |
| (Oglethorpe Pwr. Corp.), Ser. B, 0.09%, 1/1/36 | VMIG 1 | 12,820,000 | 12,820,000 |
| Muni. Election Auth. of GA Rev. Bonds, | | | |
| (Plant Vogtle Units 3 & 4), Ser. A | | | |
| 5.50%, 7/1/60 | A | 3,500,000 | 4,001,643 |
| 5.00%, 1/1/56 | A2 | 2,500,000 | 2,953,768 |
| 4.00%, 1/1/59 | A2 | 1,000,000 | 1,098,796 |
| | | | 40,531,863 |
| Guam (0.1%) | | | |
| Territory of GU, Pwr. Auth. Rev. Bonds, Ser. A | | | |
| 5.00%, 10/1/34 | Baa2 | 200,000 | 207,988 |
| AGM, 5.00%, 10/1/30 | AA | 500,000 | 529,495 |
| | | | 737,483 |
|
| 22 Tax Exempt Income Fund |
| | | |
| MUNICIPAL BONDS AND NOTES (103.3%)* cont. | Rating** | Principal amount | Value |
| Hawaii (0.3%) | | | |
| HI State Harbor Syst. Rev. Bonds, Ser. A | | | |
| 4.00%, 7/1/36 | Aa3 | $375,000 | $437,902 |
| 4.00%, 7/1/33 | Aa3 | 1,500,000 | 1,769,806 |
| 4.00%, 7/1/31 | Aa3 | 250,000 | 297,585 |
| | | | 2,505,293 |
| Idaho (0.2%) | | | |
| ID State Hlth. Fac. Auth. Rev. Bonds, (St. Luke’s Hlth. | | | |
| Sys. Oblig. Group), Ser. A, 5.00%, 3/1/37 | A3 | 1,500,000 | 1,808,944 |
| | | | 1,808,944 |
| Illinois (10.1%) | | | |
| Chicago, G.O. Bonds | | | |
| Ser. A, 6.00%, 1/1/38 | BBB+ | 2,880,000 | 3,466,892 |
| Ser. B-2, 5.50%, 1/1/37 | BBB+ | 4,000,000 | 4,469,410 |
| Ser. A, 5.00%, 1/1/30 | BBB+ | 3,950,000 | 4,877,837 |
| Chicago, Board of Ed. G.O. Bonds | | | |
| Ser. C, 5.25%, 12/1/39 | BB | 1,500,000 | 1,650,742 |
| (School Reform), Ser. B-1, NATL, zero %, 12/1/21 | Baa2 | 1,000,000 | 995,450 |
| Chicago, Hsg. Auth. Rev. Bonds, Ser. A, 5.00%, 1/1/31 | AA– | 4,540,000 | 5,433,604 |
| Chicago, Motor Fuel Tax Rev. Bonds, AGM | | | |
| 5.00%, 1/1/33 | AA | 1,000,000 | 1,074,184 |
| 5.00%, 1/1/30 | AA | 200,000 | 215,954 |
| Chicago, O’Hare Intl. Arpt. Rev. Bonds, Ser. A | | | |
| 5.00%, 1/1/38 | A | 200,000 | 240,950 |
| 5.00%, 1/1/37 | A | 1,200,000 | 1,449,601 |
| 4.00%, 1/1/37 | A | 2,000,000 | 2,325,088 |
| Chicago, Waste Wtr. Transmission Rev. Bonds | | | |
| 5.00%, 1/1/44 | A | 3,000,000 | 3,333,833 |
| (2nd Lien), 5.00%, 1/1/39 | A | 2,720,000 | 3,024,243 |
| Chicago, Wtr. Wks Rev. Bonds | | | |
| 5.00%, 11/1/29 | A | 1,750,000 | 2,121,996 |
| AGM, 5.00%, 11/1/25 | AA | 1,420,000 | 1,424,784 |
| IL State G.O. Bonds | | | |
| 5.00%, 11/1/41 | Baa3 | 1,250,000 | 1,405,354 |
| 5.00%, 1/1/41 | Baa3 | 700,000 | 775,740 |
| 5.00%, 1/1/35 | Baa3 | 1,000,000 | 1,121,011 |
| Ser. B, 5.00%, 10/1/32 | Baa3 | 2,000,000 | 2,369,276 |
| Ser. A, 5.00%, 12/1/31 | Baa3 | 2,870,000 | 3,355,329 |
| Ser. C, 5.00%, 11/1/29 | Baa3 | 3,550,000 | 4,148,000 |
| 5.00%, 2/1/29 | Baa3 | 2,725,000 | 3,189,245 |
| Ser. A, 5.00%, 12/1/28 | Baa3 | 2,000,000 | 2,389,560 |
| Ser. D, 5.00%, 11/1/28 | Baa3 | 6,425,000 | 7,584,767 |
| 5.00%, 2/1/28 | Baa3 | 2,350,000 | 2,760,573 |
| Ser. D, 5.00%, 11/1/27 | Baa3 | 2,800,000 | 3,337,685 |
| Ser. A, 4.00%, 3/1/38 | Baa3 | 2,250,000 | 2,494,438 |
| IL State Fin. Auth. Mandatory Put Bonds (9/1/22), | | | |
| (Field Museum of Natural History), 0.578%, 11/1/34 | A2 | 7,820,000 | 7,788,653 |
| IL State Fin. Auth. Rev. Bonds | | | |
| (U. of Chicago (The)), Ser. A, 5.00%, 10/1/35 ## | Aa2 | 1,150,000 | 1,588,235 |
| (U. of Chicago (The)), Ser. A, 5.00%, 10/1/34 ## | Aa2 | 1,500,000 | 2,044,655 |
| (U. of Chicago (The)), Ser. A, 5.00%, 10/1/33 ## | Aa2 | 1,750,000 | 2,361,566 |
|
| Tax Exempt Income Fund 23 |
| | | |
| MUNICIPAL BONDS AND NOTES (103.3%)* cont. | Rating** | Principal amount | Value |
| Illinois cont. | | | |
| IL State Fin. Auth. Rev. Bonds | | | |
| (U. of Chicago (The)), Ser. A, 5.00%, 10/1/32 ## | Aa2 | $2,000,000 | $2,677,482 |
| (Riverside Hlth. Syst. Oblig. Group), | | | |
| 4.00%, 11/15/31 | A+ | 500,000 | 564,729 |
| IL State Fin. Auth. Student Hsg. & Academic Fac. Rev. | | | |
| Bonds, (U. of IL Chicago), 5.00%, 2/15/50 | Baa3 | 500,000 | 547,792 |
| Metro. Pier & Exposition Auth. Rev. Bonds, | | | |
| (McCormick Place Expansion), Ser. A, 5.00%, 6/15/57 | BBB | 2,500,000 | 2,924,963 |
| Metro. Wtr. Reclamation Dist. of Greater Chicago | | | |
| G.O. Bonds, (Green Bond), Ser. E, 5.00%, 12/1/29 | AA | 1,580,000 | 1,947,744 |
| | | | 93,481,365 |
| Indiana (1.0%) | | | |
| IN State Fin. Auth. Edl. Fac. Rev. Bonds, (Butler U.), | | | |
| Ser. B, 5.00%, 2/1/27 | A– | 935,000 | 964,087 |
| Whiting, Env. Fac. Mandatory Put Bonds (6/5/26), | | | |
| (BP Products North America, Inc.), Ser. A, | | | |
| 5.00%, 12/1/44 | A2 | 7,050,000 | 8,569,587 |
| | | | 9,533,674 |
| Kansas (0.3%) | | | |
| KS State Dev. Fin. Auth. Rev. Bonds, | | | |
| (Lifespace Cmnty’s. Inc.), Ser. S, 5.00%, 5/15/30 | BBB/F | 2,900,000 | 2,906,977 |
| | | | 2,906,977 |
| Kentucky (3.8%) | | | |
| KY Pub. Trans. Infrastructure Auth. Rev. Bonds, | | | |
| (1st Tier Downtown Crossing), Ser. A, 6.00%, 7/1/53 | Baa2 | 1,400,000 | 1,540,444 |
| KY State Econ. Dev. Fin. Auth. Rev. Bonds, | | | |
| (Louisville Arena Auth., Inc.), Ser. A, AGM, | | | |
| 5.00%, 12/1/45 | AA | 2,750,000 | 3,327,217 |
| KY State Property & Bldg. Comm. Rev. Bonds | | | |
| (No. 119), 5.00%, 5/1/37 | A1 | 2,500,000 | 3,049,110 |
| (Project No. 117), Ser. B, 5.00%, 5/1/28 | A1 | 565,000 | 695,644 |
| KY State Pub. Energy Auth. | | | |
| Gas Supply Mandatory Put Bonds (6/1/25), | | | |
| Ser. C-1, 4.00%, 12/1/49 | A1 | 9,750,000 | 10,975,308 |
| Gas Supply Mandatory Put Bonds (1/1/25), Ser. B, | | | |
| 4.00%, 1/1/49 | A1 | 5,000,000 | 5,533,911 |
| Louisville & Jefferson Cnty., Metro. Govt. Hlth. Syst. | | | |
| Rev. Bonds, (Norton Healthcare, Inc.), Ser. A | | | |
| 5.00%, 10/1/30 | A | 1,135,000 | 1,364,215 |
| 4.00%, 10/1/34 | A | 6,000,000 | 6,648,250 |
| Louisville, Regl. Arpt. Auth. Syst. Rev. Bonds, Ser. A | | | |
| 5.00%, 7/1/31 | A | 415,000 | 466,821 |
| 5.00%, 7/1/30 | A | 1,000,000 | 1,126,916 |
| | | | 34,727,836 |
| Louisiana (0.8%) | | | |
| LA State Pub. Fac. Auth. Rev. Bonds, (LA State | | | |
| U. Greenhouse Phase III), Ser. A, 5.00%, 7/1/59 | A3 | 3,000,000 | 3,584,786 |
| St. John The Baptist Parish Mandatory Put Bonds | | | |
| (7/1/26), (Marathon Oil Corp.), Ser. A-3, 2.20%, 6/1/37 | Baa3 | 4,000,000 | 4,132,344 |
| | | | 7,717,130 |
|
| 24 Tax Exempt Income Fund |
| | | |
| MUNICIPAL BONDS AND NOTES (103.3%)* cont. | Rating** | Principal amount | Value |
| Maryland (0.9%) | | | |
| Gaithersburg, Econ. Dev. Rev. Bonds, | | | |
| (Asbury, Oblig. Group), Ser. A, 5.00%, 1/1/36 | BBB/F | $750,000 | $824,574 |
| MD Econ. Dev. Corp. Rev. Bonds, (Morgan State U.) | | | |
| 5.00%, 7/1/56 | BBB– | 1,000,000 | 1,177,070 |
| 5.00%, 7/1/50 | BBB– | 1,250,000 | 1,478,034 |
| MD State Econ. Dev. Corp. Rev. Bonds, | | | |
| (Seagirt Marine Term.), Ser. A | | | |
| 5.00%, 6/1/49 | Baa3 | 500,000 | 553,297 |
| 5.00%, 6/1/44 | Baa3 | 500,000 | 555,951 |
| MD State Hlth. & Higher Ed. Fac. Auth. Rev. Bonds | | | |
| (Adventist Hlth. Care Oblig. Group), | | | |
| 5.00%, 1/1/36 ## | Baa3 | 1,000,000 | 1,203,607 |
| (Adventist Hlth. Care Oblig. Group), | | | |
| 5.00%, 1/1/30 ## | Baa3 | 285,000 | 339,075 |
| (Adventist Hlth. Care Oblig. Group), | | | |
| 5.00%, 1/1/29 ## | Baa3 | 290,000 | 341,552 |
| (Adventist Hlth. Care Oblig. Group), | | | |
| 5.00%, 1/1/28 ## | Baa3 | 300,000 | 348,969 |
| (Adventist Hlth. Care Oblig. Group), | | | |
| 5.00%, 1/1/27 ## | Baa3 | 430,000 | 493,676 |
| (Stevenson U.), 4.00%, 6/1/51 | BBB– | 1,000,000 | 1,103,472 |
| | | | 8,419,277 |
| Massachusetts (3.0%) | | | |
| MA State Edl. Fin. Auth. Rev. Bonds, Ser. B, | | | |
| 5.70%, 1/1/31 | AA | 550,000 | 556,102 |
| MA State Hsg. Fin. Agcy. Rev. Bonds, Ser. A, | | | |
| 5.10%, 12/1/30 | Aa2 | 895,000 | 896,678 |
| MA State Port Auth. Rev. Bonds, Ser. E, 5.00%, 7/1/51 | Aa2 | 12,000,000 | 15,000,463 |
| MA State Wtr. Resource Auth. Rev. Bonds, Ser. A-3, | | | |
| 0.08%, 8/1/37 | VMIG 1 | 11,425,000 | 11,425,000 |
| | | | 27,878,243 |
| Michigan (8.5%) | | | |
| Belding Area School G.O. Bonds, Ser. A, Q-SBLF, | | | |
| 5.00%, 5/1/40 | AA | 300,000 | 355,722 |
| Chippewa, Valley School G.O. Bonds, Ser. A, Q-SBLF, | | | |
| 5.00%, 5/1/34 | Aa1 | 250,000 | 297,387 |
| Detroit, G.O. Bonds, AMBAC, 5.25%, 4/1/24 | A–/P | 77,500 | 77,575 |
| Detroit, Downtown Dev. Auth. Tax Alloc. Bonds, | | | |
| Ser. A, AGM | | | |
| 5.00%, 7/1/48 | AA | 7,000,000 | 7,855,025 |
| 5.00%, 7/1/38 | AA | 1,000,000 | 1,126,916 |
| Genesee Cnty., Wtr. Supply Syst. G.O. Bonds | | | |
| BAM, 5.25%, 2/1/40 | AA | 200,000 | 232,759 |
| (Wtr. Supply Syst.), Ser. B, BAM, 5.00%, 2/1/33 | AA | 250,000 | 297,263 |
| Grand Rapids, Wtr. Supply Syst. Rev. Bonds, | | | |
| 5.00%, 1/1/41 | Aa2 | 400,000 | 468,830 |
| Grand Valley, State U. Rev. Bonds, (MI State U.), | | | |
| Ser. A, U.S. Govt. Coll., 5.00%, 12/1/32 | A1 | 250,000 | 294,222 |
| Great Lakes, Wtr. Auth. Swr. Rev. Bonds, (Brazos | | | |
| Presbyterian Homes, Inc.), Ser. C, 5.00%, 7/1/36 | A+ | 7,780,000 | 9,292,641 |
|
| Tax Exempt Income Fund 25 |
| | | |
| MUNICIPAL BONDS AND NOTES (103.3%)* cont. | Rating** | Principal amount | Value |
| Michigan cont. | | | |
| Karegnondi, Wtr. Auth. Rev. Bonds | | | |
| (Wtr. Supply Syst.), Ser. A, 5.25%, 11/1/31 | A2 | $250,000 | $280,260 |
| (Wtr. Supply Syst.), Ser. A, 5.25%, 11/1/30 | A2 | 3,000,000 | 3,363,116 |
| 5.00%, 11/1/36 | A | 1,285,000 | 1,581,908 |
| 5.00%, 11/1/34 | A | 1,600,000 | 1,977,483 |
| 5.00%, 11/1/31 | A | 1,100,000 | 1,368,320 |
| Kentwood, Economic Dev. Rev. Bonds | | | |
| (Holland Home), 5.625%, 11/15/32 | BBB–/F | 350,000 | 362,764 |
| (Holland Home Oblig. Group), 5.00%, 11/15/37 | BBB–/F | 2,250,000 | 2,479,512 |
| Kentwood, Pub. School G.O. Bonds, | | | |
| (School Bldg. & Site), 5.00%, 5/1/41 | AA– | 250,000 | 295,759 |
| Lansing, School Dist. G.O. Bonds, | | | |
| (School Bldg. & Site), Ser. I, Q-SBLF, 5.00%, 5/1/41 | AA | 225,000 | 266,305 |
| Lincoln, Cons. School Dist. G.O. Bonds, Ser. A, AGM, | | | |
| Q-SBLF, 5.00%, 5/1/40 | AA | 200,000 | 235,530 |
| Livonia, Pub. School Dist. G.O. Bonds, AGM, | | | |
| 5.00%, 5/1/45 | AA | 200,000 | 234,851 |
| MI Pub. Pwr. Agcy. Rev. Bonds, Ser. A, 5.00%, 1/1/27 | A2 | 700,000 | 721,678 |
| MI State Fin. Auth. Rev. Bonds | | | |
| (Detroit Pub. Ltg. Auth.), Ser. B, 5.00%, 7/1/44 | BB+ | 1,150,000 | 1,226,349 |
| Ser. H-1, 5.00%, 10/1/39 (Prerefunded 10/1/24) | AA– | 5,250,000 | 5,983,575 |
| (Local Govt. Loan Program — Detroit Wtr. & Swr. | | | |
| Dept. (DWSD)), Ser. D-2, 5.00%, 7/1/34 | A+ | 400,000 | 468,226 |
| (Local Govt. Loan Program Pub. Ltg. Auth.), Ser. B, | | | |
| 5.00%, 7/1/34 | BB+ | 500,000 | 540,929 |
| (Detroit Wtr. & Swr.), Ser. C-6, 5.00%, 7/1/33 | AA– | 270,000 | 307,329 |
| Ser. H-1, 5.00%, 10/1/30 | AA– | 500,000 | 575,312 |
| (Detroit), Ser. C-3, 5.00%, 4/1/26 | Aa2 | 1,000,000 | 1,184,396 |
| (Detroit), Ser. C-3, 5.00%, 4/1/24 | Aa2 | 500,000 | 562,368 |
| (Local Govt. Loan Program), Ser. F1, | | | |
| 4.50%, 10/1/29 | BB+ | 850,000 | 884,754 |
| (Wayne Cnty.), BAM, 4.00%, 11/1/55 | AA | 4,000,000 | 4,597,903 |
| (Tobacco Settlement), Ser. A-1, 2.326%, 6/1/30 | A | 3,500,000 | 3,605,011 |
| MI State Fin. Auth. Ltd. Oblig. Rev. Bonds, | | | |
| (College for Creative Studies), 5.00%, 12/1/45 | BBB+ | 250,000 | 262,159 |
| MI State Hosp. Fin. Auth. Rev. Bonds, (Trinity Health | | | |
| Corp. Oblig. Group) | | | |
| Ser. A, 4.00%, 12/1/49 T | Aa3 | 4,100,000 | 4,695,234 |
| Ser. A, U.S. Govt. Coll., 5.00% 12/1/47 T | Aa3 | 5,155,000 | 5,570,880 |
| MI State Hsg. Dev. Auth. Rev. Bonds, (Rental Hsg.) | | | |
| Ser. A, 4.625%, 10/1/39 | AA | 225,000 | 237,177 |
| Ser. A, 4.45%, 10/1/34 | AA | 100,000 | 105,584 |
| Ser. D, 3.95%, 10/1/37 | AA | 1,050,000 | 1,072,781 |
| MI State Strategic Fund Ltd. Oblig. Rev. Bonds, | | | |
| (Detroit Edison Co.), AMBAC, 7.00%, 5/1/21 | Aa3 | 1,500,000 | 1,507,303 |
| Oakland U. Rev. Bonds | | | |
| 5.00%, 3/1/39 | A1 | 2,000,000 | 2,223,460 |
| Ser. A, 5.00%, 3/1/33 | A1 | 500,000 | 540,232 |
| 5.00%, 3/1/32 | A1 | 130,000 | 144,552 |
|
| 26 Tax Exempt Income Fund |
| | | |
| MUNICIPAL BONDS AND NOTES (103.3%)* cont. | Rating** | Principal amount | Value |
| Michigan cont. | | | |
| Pontiac City, G.O. Bonds, | | | |
| (Pontiac School Dist.), Q-SBLF | | | |
| 4.00%, 5/1/40 | Aa1 | $1,000,000 | $1,183,449 |
| 4.00%, 5/1/38 | Aa1 | 2,000,000 | 2,379,621 |
| 4.00%, 5/1/34 | Aa1 | 1,000,000 | 1,205,328 |
| 4.00%, 5/1/33 | Aa1 | 2,220,000 | 2,686,630 |
| Rochester, Cmnty. School Dist. G.O. Bonds, Ser. I, | | | |
| 5.00%, 5/1/36 | AA | 250,000 | 299,157 |
| Warren, Cons. School Dist. G.O. Bonds, Ser. A, | | | |
| Q-SBLF, 5.00%, 5/1/35 | AA | 350,000 | 421,705 |
| | | | 77,937,230 |
| Mississippi (0.9%) | | | |
| MS State Bus. Fin. Corp. Rev. Bonds, (System Energy | | | |
| Resources, Inc.), 2.50%, 4/1/22 | BBB+ | 6,525,000 | 6,550,663 |
| MS State Bus. Fin. Corp. Sol. Waste Disp. Mandatory | | | |
| Put Bonds (6/3/24), (Waste Management, Inc.), | | | |
| 2.20%, 3/1/27 | A– | 1,250,000 | 1,312,529 |
| | | | 7,863,192 |
| Missouri (2.2%) | | | |
| Kansas City, Indl. Dev. Auth. Arpt. Special | | | |
| Oblig. Rev. Bonds | | | |
| (Kansas City Intl. Arpt. Terminal), Ser. B, | | | |
| 5.00%, 3/1/39 | A2 | 5,980,000 | 7,221,064 |
| (Kansas City Intl. Arpt. Terminal), Ser. B, | | | |
| 5.00%, 3/1/38 | A2 | 2,480,000 | 3,002,596 |
| AGM, 4.00%, 3/1/57 | AA | 5,000,000 | 5,604,250 |
| St. Louis, Muni. Fin. Corp. Rev. Bonds, AGM | | | |
| 5.00%, 10/1/49 | AA | 2,250,000 | 2,752,064 |
| 5.00%, 10/1/40 | AA | 1,000,000 | 1,256,588 |
| | | | 19,836,562 |
| Montana (0.1%) | | | |
| MT State Fac. Fin. Auth. Rev. Bonds, (SCL Hlth. Syst.), | | | |
| Ser. A, 4.00%, 1/1/37 | Aa3 | 600,000 | 705,424 |
| | | | 705,424 |
| Nebraska (1.4%) | | | |
| Central Plains Energy Project Gas Supply Mandatory | | | |
| Put Bonds (8/1/25), 4.00%, 12/1/49 | Aa2 | 3,250,000 | 3,690,784 |
| Central Plains, Energy Mandatory Put Bonds | | | |
| (1/1/24), (No. 4), 5.00%, 3/1/50 | A2 | 8,050,000 | 8,969,240 |
| | | | 12,660,024 |
| Nevada (2.2%) | | | |
| Clark Cnty., G.O. Bonds, AMBAC, 3.00%, 11/1/35 | Aa1 | 18,175,000 | 18,190,823 |
| Sparks, Tourism Impt. Dist. No. 1 144A Rev. | | | |
| Bonds, Ser. A | | | |
| 2.75%, 6/15/28 | Ba2 | 1,800,000 | 1,839,721 |
| 2.50%, 6/15/24 | Ba2 | 650,000 | 656,272 |
| | | | 20,686,816 |
|
| Tax Exempt Income Fund 27 |
| | | |
| MUNICIPAL BONDS AND NOTES (103.3%)* cont. | Rating** | Principal amount | Value |
| New Hampshire (0.8%) | | | |
| NH State Hlth. & Ed. Fac. Auth. Rev. Bonds | | | |
| (Kendel at Hanover), 5.00%, 10/1/46 | BBB+/F | $625,000 | $701,266 |
| (Catholic Med. Ctr.), 5.00%, 7/1/44 | BBB+ | 1,500,000 | 1,734,212 |
| (Southern NH Med. Ctr.), 5.00%, 10/1/37 | A– | 4,500,000 | 5,126,246 |
| | | | 7,561,724 |
| New Jersey (5.2%) | | | |
| NJ State Econ. Dev. Auth. Rev. Bonds | | | |
| (Provident Group-Montclair State U. Student | | | |
| Hsg. & Properties), 5.00%, 6/1/37 | AA | 1,250,000 | 1,470,521 |
| Ser. B, 5.00%, 11/1/26 | Baa1 | 5,400,000 | 6,549,270 |
| 4.00%, 6/15/50 | Baa1 | 1,250,000 | 1,389,936 |
| 4.00%, 6/15/46 | Baa1 | 1,500,000 | 1,675,579 |
| NJ State Econ. Dev. Auth. Special Fac. Rev. Bonds, | | | |
| (Port Newark Container Term., LLC), 5.00%, 10/1/37 | Baa3 | 3,000,000 | 3,456,368 |
| NJ State Hlth. Care Fac. Fin. Auth. VRDN, | | | |
| (AHS Hosp. Corp.), Ser. B, 0.04%, 7/1/36 | VMIG 1 | 1,500,000 | 1,500,000 |
| NJ State Trans. Trust Fund Auth. Rev. Bonds | | | |
| Ser. A, 5.00%, 12/15/39 | Baa1 | 1,200,000 | 1,453,923 |
| Ser. AA, 5.00%, 6/15/38 | Baa1 | 1,975,000 | 2,383,364 |
| Ser. A, 5.00%, 12/15/34 | Baa1 | 4,100,000 | 5,004,564 |
| Ser. AA, 4.00%, 6/15/45 | Baa1 | 8,325,000 | 9,313,486 |
| (Trans. Syst.), Ser. C, AMBAC, zero %, 12/15/24 | Baa1 | 8,760,000 | 8,463,656 |
| Tobacco Settlement Fin. Corp. Rev. Bonds, Ser. A, | | | |
| 5.00%, 6/1/35 | A– | 4,000,000 | 4,876,964 |
| | | | 47,537,631 |
| New Mexico (0.2%) | | | |
| Sante Fe, Retirement Fac. Rev. Bonds, (El Castillo | | | |
| Retirement Res.), 5.00%, 5/15/32 | BB+/F | 2,155,000 | 2,201,211 |
| | | | 2,201,211 |
| New York (7.0%) | | | |
| Brookhaven, Local Dev. Corp. Rev. Bonds, | | | |
| (Brookhaven Memorial Hosp. Med. Ctr., Inc. Oblig. | | | |
| Group), 4.50%, 10/1/25 | BBB– | 2,560,000 | 2,686,237 |
| Metro. Trans. Auth. Rev. Bonds, Ser. C-1, | | | |
| 4.00%, 11/15/35 | A3 | 4,000,000 | 4,457,550 |
| Metro. Trans. Auth. Dedicated Tax Mandatory Put | | | |
| Bonds (6/1/22), Ser. A-2A, 0.52%, 11/1/26 | AA | 4,310,000 | 4,309,281 |
| NY City, G.O. Bonds, Ser. A, 5.00%, 8/1/39 | Aa2 | 8,300,000 | 10,317,840 |
| NY City, G.O. Bonds, Ser. D-1, 4.00%, 3/1/42 | Aa2 | 3,500,000 | 4,000,286 |
| NY City, Muni. Wtr. & Swr. Syst. Fin. Auth. Rev. Bonds, | | | |
| (2nd Gen. Resolution), 5.00%, 6/15/46 | Aa1 | 2,000,000 | 2,328,998 |
| NY City, Transitional Fin. Auth. Rev. Bonds, | | | |
| 4.00%, 5/1/45 | AAA | 4,000,000 | 4,593,679 |
| NY State Dorm. Auth. Personal Income Tax Rev. | | | |
| Bonds, Ser. D | | | |
| 4.00%, 2/15/47 | Aa2 | 9,530,000 | 10,793,601 |
| 4.00%, 2/15/40 | Aa2 | 1,500,000 | 1,723,787 |
| 4.00%, 2/15/38 | Aa2 | 4,000,000 | 4,624,747 |
| NY State Trans. Dev. Corp. Exempt Fac. Rev. | | | |
| Bonds, (Empire State Thruway Partners, LLC.), | | | |
| 4.00%, 4/30/53 | BBB–/F | 5,000,000 | 5,569,955 |
|
| 28 Tax Exempt Income Fund |
| | | |
| MUNICIPAL BONDS AND NOTES (103.3%)* cont. | Rating** | Principal amount | Value |
| New York cont. | | | |
| NY State Trans. Special Fac. Dev. Corp. Rev. Bonds, | | | |
| (Laguardia Arpt. Term. B Redev. Program), Ser. A, | | | |
| 5.00%, 7/1/41 | Baa3 | $2,000,000 | $2,242,378 |
| Port Auth. of NY & NJ Rev. Bonds | | | |
| Ser. 207, 5.00%, 9/15/31 | Aa3 | 3,800,000 | 4,687,998 |
| Ser. 172nd, 4.50%, 4/1/37 | Aa3 | 1,940,000 | 1,998,693 |
| | | | 64,335,030 |
| Ohio (4.7%) | | | |
| Akron, Income Tax Rev. Bonds | | | |
| 4.00%, 12/1/41 | AA– | 750,000 | 831,437 |
| 4.00%, 12/1/40 | AA– | 1,345,000 | 1,494,073 |
| 4.00%, 12/1/38 | AA– | 770,000 | 858,355 |
| Buckeye, Tobacco Settlement Fin. Auth. Rev. Bonds, | | | |
| Ser. B-2, Class 2, 5.00%, 6/1/55 | BB/P | 2,900,000 | 3,269,604 |
| Cleveland-Cuyahoga Cnty., Port Auth. Cultural | | | |
| Fac. Rev. Bonds | | | |
| (Playhouse Square Foundation), 5.50%, 12/1/53 | BB+ | 2,500,000 | 2,665,233 |
| (Cleveland Museum of Natural History (The)), | | | |
| 5.00%, 7/1/36 | A3 | 300,000 | 386,089 |
| (Cleveland Museum of Natural History (The)), | | | |
| 5.00%, 7/1/35 | A3 | 200,000 | 258,413 |
| (Cleveland Museum of Natural History (The)), | | | |
| 5.00%, 7/1/34 | A3 | 300,000 | 388,781 |
| (Cleveland Museum of Natural History (The)), | | | |
| 4.00%, 7/1/46 | A3 | 950,000 | 1,092,333 |
| (Cleveland Museum of Natural History (The)), | | | |
| 4.00%, 7/1/41 | A3 | 230,000 | 267,875 |
| (Cleveland Museum of Natural History (The)), | | | |
| 4.00%, 7/1/40 | A3 | 250,000 | 292,152 |
| (Cleveland Museum of Natural History (The)), | | | |
| 4.00%, 7/1/39 | A3 | 200,000 | 234,364 |
| (Cleveland Museum of Natural History (The)), | | | |
| 4.00%, 7/1/38 | A3 | 250,000 | 293,885 |
| (Cleveland Museum of Natural History (The)), | | | |
| 4.00%, 7/1/37 | A3 | 200,000 | 235,891 |
| Columbus, Swr. VRDN, Ser. B, 0.03%, 6/1/32 | VMIG 1 | 1,430,000 | 1,430,000 |
| Confluence Cmnty. Auth. Rev. Bonds, | | | |
| (Stadium & Sports) | | | |
| 4.00%, 5/1/39 | AA+ | 750,000 | 851,193 |
| 4.00%, 5/1/34 | AA+ | 1,280,000 | 1,484,057 |
| 4.00%, 5/1/33 | AA+ | 560,000 | 653,923 |
| Franklin Cnty., Hlth. Care Fac. Rev. Bonds, | | | |
| (Ohio Living) | | | |
| 6.125%, 7/1/40 | BBB/F | 940,000 | 980,211 |
| 6.125%, 7/1/40 (Prerefunded 7/1/22) | AAA/P | 60,000 | 64,326 |
| 6.00%, 7/1/35 | BBB/F | 1,765,000 | 1,842,248 |
| 6.00%, 7/1/35 (Prerefunded 7/1/22) | AAA/P | 110,000 | 117,761 |
| Hamilton Cnty., Hlth. Care Rev. Bonds, | | | |
| (Life Enriching Cmntys.), 5.00%, 1/1/32 | BBB–/F | 1,000,000 | 1,041,722 |
| Lancaster, Port Auth. Mandatory Put Bonds | | | |
| (2/1/25), Ser. A, 5.00%, 8/1/49 | Aa2 | 4,250,000 | 4,928,355 |
|
| Tax Exempt Income Fund 29 |
| | | |
| MUNICIPAL BONDS AND NOTES (103.3%)* cont. | Rating** | Principal amount | Value |
| Ohio cont. | | | |
| Middleburg Heights, Hosp. Rev. Bonds, | | | |
| (Southwest Gen. Hlth. Ctr.), 5.00%, 8/1/47 | | | |
| (Prerefunded 8/1/22) | A2 | $1,500,000 | $1,597,093 |
| OH State Higher Edl. Fac. Comm. Rev. Bonds, | | | |
| (Kenyon College 2020), 4.00%, 7/1/44 | A2 | 5,650,000 | 6,395,627 |
| OH State Hosp. Rev. Bonds, (Premier Hlth. Partners | | | |
| Oblig. Group) | | | |
| 4.00%, 11/15/41 | Baa1 | 455,000 | 505,984 |
| 4.00%, 11/15/39 | Baa1 | 1,325,000 | 1,482,452 |
| OH State Hosp. Fac. Rev. Bonds, (Cleveland Clinic | | | |
| Hlth. Syst.), Ser. A, U.S. Govt. Coll., 4.00%, 1/1/43 | | | |
| (Prerefunded 1/1/28) | AAA/P | 15,000 | 17,969 |
| OH State Private Activity Rev. Bonds, | | | |
| (Portsmouth Bypass), AGM, 5.00%, 12/31/35 | AA | 1,750,000 | 1,997,311 |
| Scioto Cnty., Hosp. Rev. Bonds, | | | |
| (Southern OH Med. Ctr.) | | | |
| 5.00%, 2/15/34 | A3 | 645,000 | 747,016 |
| 5.00%, 2/15/33 | A3 | 355,000 | 412,122 |
| Southeastern OH Port Auth. Hosp. Fac. Rev. Bonds | | | |
| 5.75%, 12/1/32 | BB–/F | 1,350,000 | 1,423,187 |
| (Memorial Hlth. Syst. Oblig. Group), | | | |
| 5.50%, 12/1/43 | BB–/F | 145,000 | 157,306 |
| Warren Cnty., Hlth. Care Fac. Rev. Bonds, | | | |
| (Otterbein Homes Oblig. Group), Ser. A | | | |
| 4.00%, 7/1/39 | A | 500,000 | 560,909 |
| 4.00%, 7/1/38 | A | 1,000,000 | 1,123,967 |
| 4.00%, 7/1/34 | A | 1,170,000 | 1,327,983 |
| | | | 43,711,207 |
| Oregon (0.6%) | | | |
| Gilliam Cnty., Solid Waste Disp. 144A Mandatory | | | |
| Put Bonds (5/3/21), (Waste Mgt., Inc.), Ser. A, | | | |
| 2.40%, 8/1/25 | A– | 1,625,000 | 1,627,377 |
| Portland, Rev. Bonds, Ser. C, 7.701%, 6/1/22 | Aaa | 3,820,000 | 4,010,418 |
| | | | 5,637,795 |
| Pennsylvania (3.8%) | | | |
| Centre Ctny., Hosp. Auth. Rev. Bonds, | | | |
| (Mount Nittany Med. Ctr.), Ser. A, 5.00%, 11/15/41 | A+ | 500,000 | 573,671 |
| Cumberland Cnty., Muni. Auth. Rev. Bonds, | | | |
| (Diakon Lutheran Social Ministries) | | | |
| 5.00%, 1/1/32 | BBB+/F | 120,000 | 136,079 |
| 5.00%, 1/1/31 | BBB+/F | 100,000 | 113,642 |
| East Hempfield Twp., Indl. Dev. Auth. Rev. | | | |
| Bonds, (Millersville U. Student Hsg. & Svcs., Inc.), | | | |
| 5.00%, 7/1/29 | Ba1 | 500,000 | 514,185 |
| PA State Tpk. Comm. Rev. Bonds | | | |
| Ser. A, 5.00%, 12/1/44 | A1 | 5,245,000 | 5,981,299 |
| Ser. B-1, 5.00%, 6/1/42 | A3 | 1,725,000 | 2,035,276 |
| Ser. 2nd, 5.00%, 12/1/36 | A3 | 2,000,000 | 2,438,634 |
| Ser. A, 4.00%, 12/1/50 | A | 3,500,000 | 4,010,647 |
| zero %, 12/1/44 | A2 | 5,000,000 | 5,481,193 |
|
| 30 Tax Exempt Income Fund |
| | | |
| MUNICIPAL BONDS AND NOTES (103.3%)* cont. | Rating** | Principal amount | Value |
| Pennsylvania cont. | | | |
| Philadelphia, Auth. for Indl. Dev. Rev. Bonds, | | | |
| (Independence Charter School-West) | | | |
| 5.00%, 6/15/39 | BB/P | $500,000 | $546,218 |
| 4.00%, 6/15/29 | BB/P | 350,000 | 375,578 |
| Philadelphia, Gas Wks. Rev. Bonds | | | |
| 5.00%, 8/1/32 | A | 1,000,000 | 1,166,078 |
| 5.00%, 8/1/31 | A | 1,000,000 | 1,161,937 |
| Philadelphia, School Dist. G.O. Bonds, Ser. A | | | |
| 4.00%, 9/1/37 | A2 | 1,850,000 | 2,105,105 |
| 4.00%, 9/1/36 | A2 | 2,000,000 | 2,289,711 |
| South Central PA, Gen. Auth. Rev. Bonds, | | | |
| (WellSpan Health Oblig. Group), Ser. A, | | | |
| 4.00%, 6/1/49 | Aa3 | 5,000,000 | 5,626,130 |
| | | | 34,555,383 |
| Rhode Island (0.5%) | | | |
| RI Hlth. & Edl. Bldg. Corp. Rev. Bonds, | | | |
| (Lifespan Oblig. Group-Hosp. Fin.), 5.00%, 5/15/33 | BBB+ | 1,000,000 | 1,144,320 |
| Tobacco Settlement Fin. Corp. Rev. Bonds, Ser. B, | | | |
| 5.00%, 6/1/50 | BBB–/P | 3,250,000 | 3,596,591 |
| | | | 4,740,911 |
| South Carolina (3.6%) | | | |
| Charleston Cnty., Arpt. Dist. Syst. Rev. Bonds, Ser. A, | | | |
| 5.25%, 7/1/33 | A1 | 5,320,000 | 5,859,838 |
| Lexington Cnty., Hlth. Svcs. Dist. Rev. Bonds, | | | |
| (LexMed Oblig. Group) | | | |
| 4.00%, 11/1/32 | A1 | 750,000 | 852,642 |
| 4.00%, 11/1/31 | A1 | 750,000 | 855,459 |
| Myrtle Beach, Tax Allocation Bonds, (Myrtle Beach | | | |
| Air Force Base Redev.) | | | |
| 5.00%, 10/1/29 | A2 | 1,000,000 | 1,194,768 |
| 5.00%, 10/1/28 | A2 | 425,000 | 510,963 |
| Patriots Energy Group Fin. Agcy. Gas Supply | | | |
| Mandatory Put Bonds (2/1/24), Ser. A, | | | |
| 4.00%, 10/1/48 | Aa2 | 4,205,000 | 4,591,280 |
| SC State Jobs Econ. Dev. Auth. Hosp. VRDN | | | |
| (Prisma Hlth. Oblig. Group), Ser. B, 0.06%, 5/1/48 | VMIG 1 | 500,000 | 500,000 |
| SC State Pub. Svcs. Auth. Rev. Bonds | | | |
| Ser. A, 5.50%, 12/1/54 | A2 | 2,000,000 | 2,262,443 |
| Ser. E, 5.50%, 12/1/53 | A2 | 2,000,000 | 2,236,042 |
| Ser. E, 5.25%, 12/1/55 | A2 | 1,970,000 | 2,304,268 |
| Ser. E, 5.00%, 12/1/48 | A2 | 1,455,000 | 1,612,460 |
| Ser. A, 5.00%, 12/1/36 | A2 | 4,000,000 | 4,757,151 |
| SC Trans. Infrastructure Bank Mandatory Put Bonds | | | |
| (10/1/22), Ser. 03B, 0.527%, 10/1/31 | Aa3 | 5,970,000 | 5,973,909 |
| | | | 33,511,223 |
| Tennessee (0.6%) | | | |
| Chattanooga, Hlth. Edl. & Hsg. Fac. Rev. Bonds, | | | |
| (CommonSpirit Health Oblig. Group) | | | |
| Ser. A-1, 4.00%, 8/1/37 T | Baa1 | 425,000 | 490,474 |
| Ser. A-1, 4.00%, 8/1/38 T | Baa1 | 425,000 | 489,679 |
| Ser. A-2, 5.00%, 8/1/44 T | Baa1 | 425,000 | 504,127 |
|
| Tax Exempt Income Fund 31 |
| | | |
| MUNICIPAL BONDS AND NOTES (103.3%)* cont. | Rating** | Principal amount | Value |
| Tennessee cont. | | | |
| Chattanooga, Hlth. Edl. & Hsg. Fac. Rev. Bonds, | | | |
| (CommonSpirit Health Oblig. Group) | | | |
| Ser. A-1, 4.00%, 8/1/44 T | Baa1 | $875,000 | $996,022 |
| Ser. A-2, 5.00%, 8/1/49 T | Baa1 | 775,000 | 918,245 |
| Memphis-Shelby Cnty. Arpt. Auth. ## | A2 | 1,800,000 | 2,217,366 |
| | | | 5,615,913 |
| Texas (7.3%) | | | |
| Arlington, Higher Ed. Fin. Corp. Rev. Bonds | | | |
| (Riverwalk Education Foundation, Inc.), PSFG, | | | |
| 4.00%, 8/15/44 | AAA | 4,600,000 | 5,239,303 |
| (Uplift Ed.), Ser. A, PSFG, 4.00%, 12/1/31 | AAA | 365,000 | 422,362 |
| Central TX Regl. Mobility Auth. Rev. Bonds, Ser. B | | | |
| 4.00%, 1/1/51 ## | A– | 2,750,000 | 3,114,760 |
| 4.00%, 1/1/40 ## | A– | 750,000 | 873,284 |
| Clifton, Higher Ed. Fin. Corp. Rev. Bonds, | | | |
| (IDEA Pub. Schools) | | | |
| Ser. B, 5.00%, 8/15/27 | A– | 375,000 | 442,265 |
| PSFG, 4.00%, 8/15/31 | AAA | 2,000,000 | 2,334,541 |
| Clifton, Higher Ed. Fin. Corp. Ed. Rev. Bonds, | | | |
| (IDEA Pub. Schools), PSFG, 5.00%, 8/15/33 | AAA | 1,000,000 | 1,167,359 |
| Dallas, Area Rapid Transit Rev. Bonds, Ser. A, | | | |
| 5.00%, 12/1/46 | AA+ | 9,030,000 | 10,556,440 |
| Dallas, Area Rapid Transit Sales Tax Rev. Bonds, | | | |
| Ser. A, 5.00%, 12/1/41 | AA+ | 2,215,000 | 2,604,797 |
| Harris Cnty., Cultural Ed. Fac. Fin. Corp. Rev. | | | |
| Bonds, (YMCA of the Greater Houston Area), Ser. A, | | | |
| 5.00%, 6/1/28 | Baa2 | 1,300,000 | 1,354,936 |
| Houston, Higher Ed. Fin. Co. Rev. Bonds, | | | |
| (Cosmos Foundation), Ser. A, 5.00%, 2/15/32 | BBB | 1,250,000 | 1,283,522 |
| Houston, Util. Syst. Rev. Bonds, Ser. D, | | | |
| 5.00%, 11/15/39 | Aa2 | 2,285,000 | 2,612,576 |
| Irving, Hotel Occupancy Tax Rev. Bonds | | | |
| 5.00%, 8/15/39 | BBB+ | 600,000 | 680,666 |
| 5.00%, 8/15/36 | BBB+ | 430,000 | 492,549 |
| 5.00%, 8/15/34 | BBB+ | 300,000 | 345,679 |
| 5.00%, 8/15/33 | BBB+ | 240,000 | 277,611 |
| 5.00%, 8/15/31 | BBB+ | 100,000 | 116,575 |
| Lower CO River Auth. Transmission Svcs. Contract | | | |
| Corp. Rev. Bonds, 5.00%, 5/15/40 | A | 750,000 | 858,839 |
| Matagorda Cnty., Poll. Control Rev. Bonds, | | | |
| (Dist. No. 1), Ser. A, AMBAC, 4.40%, 5/1/30 | A– | 2,250,000 | 2,721,203 |
| New Hope, Cultural Ed. Fac. Fin. Corp. Rev. Bonds | | | |
| (Wesleyan Homes, Inc.), 5.50%, 1/1/43 | BB–/P | 750,000 | 778,102 |
| (CHF-Stephenville, LLC), 5.375%, 4/1/28 | | | |
| (Prerefunded 4/1/23) | AAA/P | 1,150,000 | 1,266,856 |
| (CHF-Collegiate Hsg. Stephenville III, LLC), 5.00%, | | | |
| 4/1/47 (Prerefunded 4/1/25) | AAA/P | 3,155,000 | 3,717,758 |
| (TX Woman’s U. CHF-Collegiate Hsg. Dining), | | | |
| Ser. B-1, AGM, 4.00%, 7/1/48 | AA | 1,705,000 | 1,865,125 |
| (Children’s Hlth. Syst. of TX), Ser. A, 4.00%, 8/15/34 | Aa3 | 1,000,000 | 1,142,458 |
|
| 32 Tax Exempt Income Fund |
| | | |
| MUNICIPAL BONDS AND NOTES (103.3%)* cont. | Rating** | Principal amount | Value |
| Texas cont. | | | |
| North TX, Tollway Auth. Rev. Bonds, (1st Tier), Ser. I, | | | |
| 6.50%, 1/1/43 | A1 | $9,700,000 | $11,542,567 |
| SA Energy Acquisition Pub. Fac. Corp. Rev. Bonds, | | | |
| (Gas Supply), 5.50%, 8/1/25 | A2 | 250,000 | 297,370 |
| Tarrant Cnty., Cultural Ed. Fac. Fin. Corp. Retirement | | | |
| Fac. Rev. Bonds, (Buckner Retirement Svcs., Inc.), | | | |
| 5.00%, 11/15/37 | A/F | 2,750,000 | 3,224,550 |
| TX Private Activity Surface Trans. Corp. Rev. Bonds, | | | |
| (Segment 3C), 5.00%, 6/30/58 | Baa3 | 5,000,000 | 5,976,287 |
| TX State Muni. Pwr. Agcy. Rev. Bonds, (Syst. Net/ | | | |
| Transmission Converting Security), 5.00%, 9/1/37 | A+ | 250,000 | 250,816 |
| | | | 67,561,156 |
| Utah (2.2%) | | | |
| Murray City, Hosp. VRDN, (IHC Hlth. Svcs., Inc.), | | | |
| Ser. C, 0.05%, 5/15/36 | A-1+ | 8,775,000 | 8,775,000 |
| Salt Lake City, Arpt. Rev. Bonds, Ser. A, 5.00%, 7/1/43 | A2 | 5,000,000 | 5,978,187 |
| UT Infrastructure Agcy. Rev. Bonds, Ser. A | | | |
| 4.00%, 10/15/41 | BBB–/F | 500,000 | 566,784 |
| 4.00%, 10/15/38 | BBB–/F | 500,000 | 572,446 |
| 4.00%, 10/15/36 | BBB–/F | 300,000 | 346,134 |
| 4.00%, 10/15/34 | BBB–/F | 800,000 | 929,092 |
| 4.00%, 10/15/32 | BBB–/F | 500,000 | 592,880 |
| 3.00%, 10/15/45 | BBB–/F | 1,000,000 | 999,330 |
| UT State Charter School Fin. Auth. Rev. Bonds, | | | |
| (UT Charter Academies, Inc.) | | | |
| 5.00%, 10/15/38 | AA | 720,000 | 837,291 |
| 5.00%, 10/15/33 | AA | 420,000 | 494,320 |
| 5.00%, 10/15/31 | AA | 530,000 | 629,523 |
| | | | 20,720,987 |
| Virginia (3.4%) | | | |
| Fairfax Cnty., Econ. Dev. Auth. Res. Care Fac. Rev. | | | |
| Bonds, (Goodwin House, Inc.), Ser. A, 5.00%, 10/1/42 | BBB+/F | 625,000 | 696,164 |
| Federal Home Loan Mortgage Corporation Rev. | | | |
| Bonds, Ser. M-053, Class A, 2.55%, 6/15/35 | AA+ | 7,394,995 | 7,715,381 |
| Henrico Cnty., Indl. Dev. Auth. Rev. Bonds, AGM, | | | |
| 5.929%, 8/23/27 (Escrowed to maturity) | A2 | 9,700,000 | 11,425,225 |
| VA State Small Bus. Fin. Auth. Rev. Bonds | | | |
| (95 Express Lanes, LLC), 5.00%, 7/1/49 | BBB– | 4,000,000 | 4,118,638 |
| (Express Lanes, LLC), 5.00%, 7/1/34 | BBB– | 1,200,000 | 1,236,497 |
| (National Sr. Campuses, Inc. Oblig. Group), | | | |
| 4.00%, 1/1/45 | A/F | 6,000,000 | 6,565,685 |
| | | | 31,757,590 |
| Washington (1.3%) | | | |
| King Cnty., Public Hosp. Dist. No. 1 G.O. Bonds, | | | |
| (Valley Med. Ctr.), 5.00%, 12/1/37 | A2 | 4,500,000 | 5,466,561 |
| Port of Seattle, Rev. Bonds, Ser. C, 5.00%, 4/1/40 | A1 | 1,000,000 | 1,109,407 |
| WA State Hlth. Care Fac. Auth. Mandatory Put Bonds | | | |
| (7/1/22), (Fred Hutchinson Cancer Research Ctr.), | | | |
| Ser. B, 1.173%, 1/1/42 | A+ | 2,500,000 | 2,510,228 |
|
| Tax Exempt Income Fund 33 |
| | | |
| MUNICIPAL BONDS AND NOTES (103.3%)* cont. | Rating** | Principal amount | Value |
| Washington cont. | | | |
| Washington St., Edu. Facs. Rev. Bonds, (Seattle U.) | | | |
| 4.00%, 5/1/50 | A | $1,200,000 | $1,341,205 |
| 4.00%, 5/1/45 | A | 1,000,000 | 1,123,111 |
| | | | 11,550,512 |
| Wisconsin (0.6%) | | | |
| Pub. Fin. Auth. Arpt. Fac. Rev. Bonds, | | | |
| (Sr. Oblig. Group), 5.25%, 7/1/28 | BBB+ | 1,000,000 | 1,046,465 |
| WI State Hlth. & Edl. Fac. Auth. Rev. Bonds | | | |
| (Hmong American Peace Academy, Ltd.), | | | |
| 5.00%, 3/15/50 | BBB | 1,375,000 | 1,621,449 |
| (Three Pillars Sr. Living), 5.00%, 8/15/28 | | | |
| (Prerefunded 8/15/23) | BBB+/F | 1,040,000 | 1,151,786 |
| (Thedacare, Inc.), 4.00%, 12/15/49 | A1 | 1,000,000 | 1,120,328 |
| (Hmong American Peace Academy, Ltd.), | | | |
| 4.00%, 3/15/30 | BBB | 400,000 | 445,879 |
| | | | 5,385,907 |
| Total municipal bonds and notes (cost $891,035,260) | | $951,165,214 |
| | | |
| | Principal amount/ | |
| SHORT-TERM INVESTMENTS (1.3%)* | | shares | Value |
| Putnam Short Term Investment Fund 0.09% L | Shares | 9,717,385 | $9,717,385 |
| State Street Institutional U.S. Government Money Market Fund, | | | |
| Premier Class 0.04% P | Shares | 410,000 | 410,000 |
| U.S. Treasury Cash Management Bills 0.033%, 6/1/21 # ∆ § | | $1,200,000 | 1,199,969 |
| U.S. Treasury Cash Management Bills 0.018%, 7/13/21 § | | 800,000 | 799,959 |
| Total short-term investments (cost $12,127,276) | | | $12,127,313 |
| |
| TOTAL INVESTMENTS | | | |
| Total investments (cost $903,162,536) | | | $963,292,527 |
Notes to the fund’s portfolio
Unless noted otherwise, the notes to the fund’s portfolio are for the close of the fund’s reporting period, which ran from October 1, 2020 through March 31, 2021 (the reporting period). Within the following notes to the portfolio, references to “Putnam Management” represent Putnam Investment Management, LLC, the fund’s manager, an indirect wholly-owned subsidiary of Putnam Investments, LLC and references to “ASC 820” represent Accounting Standards Codification 820 Fair Value Measurements and Disclosures.
* Percentages indicated are based on net assets of $921,125,127.
** The Moody’s, Standard & Poor’s or Fitch ratings indicated are believed to be the most recent ratings available at the close of the reporting period for the securities listed. Ratings are generally ascribed to securities at the time of issuance. While the agencies may from time to time revise such ratings, they undertake no obligation to do so, and the ratings do not necessarily represent what the agencies would ascribe to these securities at the close of the reporting period. Securities rated by Fitch are indicated by “/F.” Securities rated by Putnam are indicated by “/P.” The Putnam rating categories are comparable to the Standard & Poor’s classifications. If a security is insured, it will usually be rated by the ratings organizations based on the financial strength of the insurer. For further details regarding security ratings, please see the Statement of Additional Information.
# This security, in part or in entirety, was pledged and segregated with the broker to cover margin requirements for futures contracts at the close of the reporting period. Collateral at period end totaled $517,000 and is included in Investments in securities on the Statement of assets and liabilities (Notes 1 and 8).
|
| 34 Tax Exempt Income Fund |
∆ This security, in part or in entirety, was pledged and segregated with the custodian for collateral on certain derivative contracts at the close of the reporting period. Collateral at period end totaled $323,000 and is included in Investments in securities on the Statement of assets and liabilities (Notes 1 and 8).
§ This security, in part or in entirety, was pledged and segregated with the custodian for collateral on the initial margin on certain centrally cleared derivative contracts at the close of the reporting period. Collateral at period end totaled $1,110,920 and is included in Investments in securities on the Statement of assets and liabilities (Notes 1 and 8).
## Forward commitment, in part or in entirety (Note 1).
L Affiliated company (Note 5). The rate quoted in the security description is the annualized 7-day yield of the fund at the close of the reporting period.
P This security was pledged, or purchased with cash that was pledged, to the fund for collateral on certain derivative contracts. The rate quoted in the security description is the annualized 7-day yield of the fund at the close of the reporting period.
T Underlying security in a tender option bond transaction. This security has been segregated as collateral for financing transactions.
At the close of the reporting period, the fund maintained liquid assets totaling $79,196,639 to cover certain derivative contracts, tender option bonds and the settlement of certain securities.
Unless otherwise noted, the rates quoted in Short-term investments security descriptions represent the weighted average yield to maturity.
144A after the name of an issuer represents securities exempt from registration under Rule 144A of the Securities Act of 1933, as amended. These securities may be resold in transactions exempt from registration, normally to qualified institutional buyers.
On Mandatory Put Bonds, the rates shown are the current interest rates at the close of the reporting period and the dates shown represent the next mandatory put dates. Rates are set by remarketing agents and may take into consideration market supply and demand, credit quality and the current SIFMA Municipal Swap Index, 1 Month US LIBOR or 3 Month US LIBOR rates, which were 0.07%, 0.11% and 0.19%, respectively, as of the close of the reporting period.
The dates shown parenthetically on prerefunded bonds represent the next prerefunding dates.
The dates shown on debt obligations are the original maturity dates.
The fund had the following sector concentrations greater than 10% at the close of the reporting period (as a percentage of net assets):
| | |
| Transportation | 17.3% | |
| Health care | 17.3 | |
| Utilities | 12.2 | |
| | | | | |
| FUTURES CONTRACTS OUTSTANDING at 3/31/21 (Unaudited) | | | |
| | Number of | Notional | | Expiration | Unrealized |
| | contracts | amount | Value | date | appreciation |
| U.S. Treasury Bond 30 yr (Short) | 44 | $6,802,125 | $6,802,125 | Jun-21 | $163,526 |
| U.S. Treasury Note 5 yr (Short) | 420 | 51,827,344 | 51,827,344 | Jun-21 | 251,711 |
| Unrealized appreciation | | | | | 415,237 |
| Unrealized (depreciation) | | | | | — |
| Total | | | | | $415,237 |
|
| Tax Exempt Income Fund 35 |
| | | | | | |
| OTC TOTAL RETURN SWAP CONTRACTS OUTSTANDING at 3/31/21 (Unaudited) | |
| | | Upfront | | | | |
| | | premium | Termina- | Payments | Total return | Unrealized |
| Swap counterparty/ | | received | tion | received (paid) | received by | appreciation/ |
| Notional amount | Value | (paid) | date | by fund | or paid by fund | (depreciation) |
| Citibank, N.A. | | | | | | |
| $20,000,000 | $309,520 | $— | 5/13/21 | — | 0.32% minus | $(309,520) |
| | | | | | Municipal Market | |
| | | | | | Data Index AAA | |
| | | | | | municipal yields | |
| | | | | | 5 Year rate — At | |
| | | | | | maturity | |
| 20,000,000 | 296,640 | — | 5/10/21 | — | 0.33% minus | (296,640) |
| | | | | | Municipal Market | |
| | | | | | Data Index AAA | |
| | | | | | municipal yields | |
| | | | | | 5 Year rate — At | |
| | | | | | maturity | |
| 19,000,000 | 153,083 | — | 6/15/21 | — | 0.50% minus | (153,083) |
| | | | | | Municipal Market | |
| | | | | | Data Index AAA | |
| | | | | | municipal yields | |
| | | | | | 5 Year rate — At | |
| | | | | | maturity | |
| 5,000,000 | 356,545 | — | 5/13/21 | — | 1.52% minus | 356,546 |
| | | | | | Municipal Market | |
| | | | | | Data Index AAA | |
| | | | | | municipal yields | |
| | | | | | 30 Year rate — At | |
| | | | | | maturity | |
| Morgan Stanley & Co. International PLC | | | | |
| 3,400,000 | 29,747 | — | 4/14/21 | — | 0.40% minus | (29,747) |
| | | | | | Municipal Market | |
| | | | | | Data Index AAA | |
| | | | | | municipal yields | |
| | | | | | 5 Year rate — At | |
| | | | | | maturity | |
| 7,000,000 | 61,243 | — | 4/14/21 | — | 0.40% minus | (61,243) |
| | | | | | Municipal Market | |
| | | | | | Data Index AAA | |
| | | | | | municipal yields | |
| | | | | | 5 Year rate — At | |
| | | | | | maturity | |
| 7,680,000 | 75,272 | — | 4/20/21 | — | 0.40% minus | (75,272) |
| | | | | | Municipal Market | |
| | | | | | Data Index AAA | |
| | | | | | municipal yields | |
| | | | | | 5 Year rate — At | |
| | | | | | maturity | |
| 2,600,000 | 164,941 | — | 4/14/21 | — | 1.50% minus | 164,941 |
| | | | | | Municipal Market | |
| | | | | | Data Index AAA | |
| | | | | | municipal yields | |
| | | | | | 30 Year rate — At | |
| | | | | | maturity | |
|
| 36 Tax Exempt Income Fund |
| | | | | | |
| OTC TOTAL RETURN SWAP CONTRACTS OUTSTANDING at 3/31/21 (Unaudited) cont. | |
| | | Upfront | | | | |
| | | premium | Termina- | Payments | Total return | Unrealized |
| Swap counterparty/ | | received | tion | received (paid) | received by | appreciation/ |
| Notional amount | Value | (paid) | date | by fund | or paid by fund | (depreciation) |
| Morgan Stanley & Co. International PLC cont. | | | | |
| $1,920,000 | $130,364 | $— | 4/20/21 | — | 1.50% minus | $130,364 |
| | | | | | Municipal Market | |
| | | | | | Data Index AAA | |
| | | | | | municipal yields | |
| | | | | | 30 Year rate — At | |
| | | | | | maturity | |
| 5,000,000 | 333,270 | — | 5/10/21 | — | 1.54% minus | 333,270 |
| | | | | | Municipal Market | |
| | | | | | Data Index AAA | |
| | | | | | municipal yields | |
| | | | | | 30 Year rate — At | |
| | | | | | maturity | |
| Upfront premium received | — | | Unrealized appreciation | | 985,121 |
| Upfront premium (paid) | | — | | Unrealized (depreciation) | | (925,505) |
| Total | | $— | | Total | | $59,616 |
| | | | | | |
| CENTRALLY CLEARED TOTAL RETURN SWAP CONTRACTS OUTSTANDING at 3/31/21 (Unaudited) | |
| | | Upfront | | | | |
| | | premium | Termina- | Payments | Total return | |
| | | received | tion | received (paid) | received by | Unrealized |
| Notional amount | Value | (paid) | date | by fund | or paid by fund | depreciation |
| $42,392,000 | $42,985 | $(428) | 3/29/26 | 2.51% — At | USA Non Revised | $(43,413) |
| | | | | maturity | Consumer Price | |
| | | | | | Index-Urban | |
| | | | | | (CPI-U) — At | |
| | | | | | maturity | |
| Total | | $(428) | | | | $(43,413) |
|
| Tax Exempt Income Fund 37 |
ASC 820 establishes a three-level hierarchy for disclosure of fair value measurements. The valuation hierarchy is based upon the transparency of inputs to the valuation of the fund’s investments. The three levels are defined as follows:
Level 1: Valuations based on quoted prices for identical securities in active markets.
Level 2: Valuations based on quoted prices in markets that are not active or for which all significant inputs are observable, either directly or indirectly.
Level 3: Valuations based on inputs that are unobservable and significant to the fair value measurement.
The following is a summary of the inputs used to value the fund’s net assets as of the close of the reporting period:
| | | |
| | | | Valuation inputs | |
| Investments in securities: | Level 1 | Level 2 | Level 3 |
| Municipal bonds and notes | $— | $951,165,214 | $— |
| Short-term investments | 410,000 | 11,717,313 | — |
| Totals by level | $410,000 | $962,882,527 | $— |
| | | |
| | | | Valuation inputs | |
| Other financial instruments: | Level 1 | Level 2 | Level 3 |
| Futures contracts | $415,237 | $— | $— |
| Total return swap contracts | — | 16,631 | — |
| Totals by level | $415,237 | $16,631 | $— |
The accompanying notes are an integral part of these financial statements.
|
| 38 Tax Exempt Income Fund |
Statement of assets and liabilities 3/31/21 (Unaudited)
| |
| ASSETS | |
| Investment in securities, at value (Note 1): | |
| Unaffiliated issuers (identified cost $893,445,151) | $953,575,142 |
| Affiliated issuers (identified cost $9,717,385) (Notes 1 and 5) | 9,717,385 |
| Interest and other receivables | 9,726,471 |
| Receivable for shares of the fund sold | 116,510 |
| Receivable for investments sold | 834,000 |
| Receivable for sales of delayed delivery securities (Note 1) | 6,143,990 |
| Receivable for variation margin on futures contracts (Note 1) | 88,215 |
| Unrealized appreciation on OTC swap contracts (Note 1) | 985,121 |
| Prepaid assets | 55,222 |
| Total assets | 981,242,056 |
| |
| LIABILITIES | |
| Payable to custodian | 89,500 |
| Payable for investments purchased | 466,649 |
| Payable for purchases of delayed delivery securities (Note 1) | 36,606,852 |
| Payable for shares of the fund repurchased | 810,372 |
| Payable for compensation of Manager (Note 2) | 327,916 |
| Payable for custodian fees (Note 2) | 12,051 |
| Payable for investor servicing fees (Note 2) | 104,343 |
| Payable for Trustee compensation and expenses (Note 2) | 449,080 |
| Payable for administrative services (Note 2) | 2,906 |
| Payable for distribution fees (Note 2) | 498,872 |
| Payable for floating rate notes issued (Note 1) | 19,072,917 |
| Distributions payable to shareholders | 231,228 |
| Unrealized depreciation on OTC swap contracts (Note 1) | 925,505 |
| Collateral on certain derivative contracts, at value (Notes 1 and 8) | 410,000 |
| Other accrued expenses | 108,738 |
| Total liabilities | 60,116,929 |
| | |
| Net assets | $921,125,127 |
| |
| REPRESENTED BY | |
| Paid-in capital (Unlimited shares authorized) (Notes 1 and 4) | $854,872,011 |
| Total distributable earnings (Note 1) | 66,253,116 |
| Total — Representing net assets applicable to capital shares outstanding | $921,125,127 |
(Continued on next page)
|
| Tax Exempt Income Fund 39 |
Statement of assets and liabilities cont.
| |
| COMPUTATION OF NET ASSET VALUE AND OFFERING PRICE | |
| Net asset value and redemption price per class A share | |
| ($776,724,362 divided by 88,225,446 shares) | $8.80 |
| Offering price per class A share (100/96.00 of $8.80)* | $9.17 |
| Net asset value and offering price per class B share ($934,635 divided by 106,093 shares)** | $8.81 |
| Net asset value and offering price per class C share ($16,912,823 divided by 1,915,464 shares)** | $8.83 |
| Net asset value, offering price and redemption price per class R6 share | |
| ($4,229,267 divided by 479,333 shares) | $8.82 |
| Net asset value, offering price and redemption price per class Y share | |
| ($122,324,040 divided by 13,857,204 shares) | $8.83 |
*On single retail sales of less than $100,000. On sales of $100,000 or more the offering price is reduced.
**Redemption price per share is equal to net asset value less any applicable contingent deferred sales charge.
The accompanying notes are an integral part of these financial statements.
|
| 40 Tax Exempt Income Fund |
Statement of operations Six months ended 3/31/21 (Unaudited)
| |
| INVESTMENT INCOME | |
| Interest (including interest income of $21,775 from investments in affiliated issuers) (Note 5) | $13,750,409 |
| Total investment income | 13,750,409 |
| |
| EXPENSES | |
| Compensation of Manager (Note 2) | 1,965,715 |
| Investor servicing fees (Note 2) | 316,400 |
| Custodian fees (Note 2) | 10,440 |
| Trustee compensation and expenses (Note 2) | 21,106 |
| Distribution fees (Note 2) | 1,082,082 |
| Administrative services (Note 2) | 15,890 |
| Interest and fees expense (Note 1) | 92,389 |
| Other | 179,307 |
| Total expenses | 3,683,329 |
| Expense reduction (Note 2) | (385) |
| Net expenses | 3,682,944 |
| | |
| Net investment income | 10,067,465 |
| |
| REALIZED AND UNREALIZED GAIN (LOSS) | |
| Net realized gain (loss) on: | |
| Securities from unaffiliated issuers (Notes 1 and 3) | 7,713,120 |
| Futures contracts (Note 1) | 520,180 |
| Swap contracts (Note 1) | (20,880) |
| Total net realized gain | 8,212,420 |
| Change in net unrealized appreciation on: | |
| Securities from unaffiliated issuers | 5,300,685 |
| Futures contracts | 441,622 |
| Swap contracts | 6,879 |
| Total change in net unrealized appreciation | 5,749,186 |
| | |
| Net gain on investments | 13,961,606 |
| |
| Net increase in net assets resulting from operations | $24,029,071 |
The accompanying notes are an integral part of these financial statements.
|
| Tax Exempt Income Fund 41 |
Statement of changes in net assets
| | |
| DECREASE IN NET ASSETS | Six months ended 3/31/21* | Year ended 9/30/20 |
| Operations | | |
| Net investment income | $10,067,465 | $22,397,025 |
| Net realized gain (loss) on investments | 8,212,420 | (1,620,143) |
| Change in net unrealized appreciation of investments | 5,749,186 | 1,327,491 |
| Net increase in net assets resulting from operations | 24,029,071 | 22,104,373 |
| Distributions to shareholders (Note 1): | | |
| From ordinary income | | |
| Taxable net investment income | | |
| Class A | (195,902) | (538,064) |
| Class B | (267) | (1,747) |
| Class C | (5,129) | (17,344) |
| Class R6 | (1,005) | (2,409) |
| Class Y | (30,081) | (59,768) |
| From tax-exempt net investment income | | |
| Class A | (8,432,497) | (19,348,413) |
| Class B | (8,598) | (40,714) |
| Class C | (141,990) | (405,923) |
| Class M | — | (19,901) |
| Class R6 | (48,730) | (95,934) |
| Class Y | (1,447,136) | (2,579,487) |
| Net realized short-term gain on investments | | |
| Class A | — | (9,057,370) |
| Class B | — | (31,312) |
| Class C | — | (298,288) |
| Class R6 | — | (40,093) |
| Class Y | — | (969,564) |
| From net realized long-term gain on investments | | |
| Class A | — | (8,723,408) |
| Class B | — | (29,936) |
| Class C | — | (286,548) |
| Class R6 | — | (38,667) |
| Class Y | — | (938,062) |
| Decrease from capital share transactions (Note 4) | (15,336,922) | (22,851,306) |
| Total decrease in net assets | (1,619,186) | (44,269,885) |
| |
| NET ASSETS | | |
| Beginning of period | 922,744,313 | 967,014,198 |
| End of period | $921,125,127 | $922,744,313 |
*Unaudited.
The accompanying notes are an integral part of these financial statements.
|
| 42 Tax Exempt Income Fund |
|
| This page left blank intentionally. |
|
| Tax Exempt Income Fund 43 |
Financial highlights (For a common share outstanding throughout the period)
| | | | | | | | | | | | | |
| | INVESTMENT OPERATIONS | LESS DISTRIBUTIONS | RATIOS AND SUPPLEMENTAL DATA |
| | | | | | | | | | | | | Ratio of net | |
| | Net asset | | Net realized | | | | | | | | Ratio | investment | |
| | value, | | and unrealized | Total from | From net | From net | | Net asset | Total return | Net assets, | of expenses | income (loss) | Portfolio |
| | beginning | Net investment | gain (loss) | investment | investment | realized gain | Total | value, end | at net asset | end of period | to average | to average | turnover |
| Period ended | of period | income (loss) | on investments | operations | income | on investments | distributions | of period | value (%)a | (in thousands) | net assets (%)b | net assets (%) | (%) |
| Class A | | | | | | | | | | | | | |
| March 31, 2021** | $8.68 | .09 | .13 | .22 | (.10) | — | (.10) | $8.80 | 2.50 * | $776,724 | .40*c | 1.07* | 15* |
| September 30, 2020 | 8.86 | .21 | .01 | .22 | (.21) | (.19) | (.40) | 8.68 | 2.62 | 785,840 | .80c | 2.44 | 41 |
| September 30, 2019 | 8.41 | .24 | .49 | .73 | (.26) | (.02) | (.28) | 8.86 | 8.84 | 841,144 | .78c | 2.80 | 63 |
| September 30, 2018 | 8.63 | .26 | (.21) | .05 | (.27) | — | (.27) | 8.41 | .56 | 815,986 | .77 | 3.06 | 42 |
| September 30, 2017 | 8.86 | .29 | (.22) | .07 | (.30) | — | (.30) | 8.63 | .88 | 894,935 | .78e | 3.40 | 35 |
| September 30, 2016 | 8.70 | .32 | .15 | .47 | (.31) | — | (.31) | 8.86 | 5.54 | 910,921 | .77f | 3.59f | 21 |
| Class B | | | | | | | | | | | | | |
| March 31, 2021** | $8.68 | .07 | .13 | .20 | (.07) | — | (.07) | $8.81 | 2.31* | $935 | .70*c | .78* | 15* |
| September 30, 2020 | 8.86 | .15 | .02 | .17 | (.16) | (.19) | (.35) | 8.68 | 1.95 | 1,367 | 1.43c | 1.84 | 41 |
| September 30, 2019 | 8.42 | .19 | .48 | .67 | (.21) | (.02) | (.23) | 8.86 | 8.03 | 3,238 | 1.41c | 2.20 | 63 |
| September 30, 2018 | 8.63 | .21 | (.21) | —d | (.21) | — | (.21) | 8.42 | .04 | 4,653 | 1.40 | 2.43 | 42 |
| September 30, 2017 | 8.86 | .24 | (.22) | .02 | (.25) | — | (.25) | 8.63 | .24 | 6,786 | 1.41e | 2.76 | 35 |
| September 30, 2016 | 8.70 | .26 | .16 | .42 | (.26) | — | (.26) | 8.86 | 4.87 | 6,876 | 1.40f | 2.96f | 21 |
| Class C | | | | | | | | | | | | | |
| March 31, 2021** | $8.70 | .06 | .13 | .19 | (.06) | — | (.06) | $8.83 | 2.23* | $16,913 | .78*c | .70* | 15* |
| September 30, 2020 | 8.88 | .14 | .02 | .16 | (.15) | (.19) | (.34) | 8.70 | 1.79 | 21,434 | 1.58c | 1.67 | 41 |
| September 30, 2019 | 8.44 | .17 | .48 | .65 | (.19) | (.02) | (.21) | 8.88 | 7.85 | 27,210 | 1.56c | 2.03 | 63 |
| September 30, 2018 | 8.65 | .19 | (.20) | (.01) | (.20) | — | (.20) | 8.44 | (.11) | 30,378 | 1.55 | 2.28 | 42 |
| September 30, 2017 | 8.88 | .22 | (.22) | —d | (.23) | — | (.23) | 8.65 | .09 | 40,251 | 1.56e | 2.62 | 35 |
| September 30, 2016 | 8.72 | .25 | .15 | .40 | (.24) | — | (.24) | 8.88 | 4.70 | 40,983 | 1.55f | 2.80f | 21 |
| Class R6 | | | | | | | | | | | | | |
| March 31, 2021** | $8.69 | .11 | .13 | .24 | (.11) | — | (.11) | $8.82 | 2.76* | $4,229 | .27*c | 1.21* | 15* |
| September 30, 2020 | 8.88 | .23 | .01 | .24 | (.24) | (.19) | (.43) | 8.69 | 2.76 | 3,809 | .56c | 2.67 | 41 |
| September 30, 2019 | 8.44 | .26 | .48 | .74 | (.28) | (.02) | (.30) | 8.88 | 8.97 | 3,927 | .54c | 3.04 | 63 |
| September 30, 2018 † | 8.47 | .09 | (.02) | .07 | (.10) | — | (.10) | 8.44 | .83* | 10 | .19* | 1.23* | 42 |
| Class Y | | | | | | | | | | | | | |
| March 31, 2021** | $8.70 | .11 | .13 | .24 | (.11) | — | (.11) | $8.83 | 2.74* | $122,324 | .28*c | 1.20* | 15* |
| September 30, 2020 | 8.88 | .23 | .01 | .24 | (.23) | (.19) | (.42) | 8.70 | 2.84 | 110,294 | .58c | 2.64 | 41 |
| September 30, 2019 | 8.44 | .26 | .48 | .74 | (.28) | (.02) | (.30) | 8.88 | 8.93 | 85,832 | .56c | 3.00 | 63 |
| September 30, 2018 | 8.65 | .28 | (.20) | .08 | (.29) | — | (.29) | 8.44 | .89 | 72,534 | .55 | 3.27 | 42 |
| September 30, 2017 | 8.88 | .31 | (.22) | .09 | (.32) | — | (.32) | 8.65 | 1.09 | 65,741 | .56e | 3.60 | 35 |
| September 30, 2016 | 8.72 | .34 | .15 | .49 | (.33) | — | (.33) | 8.88 | 5.75 | 52,776 | .55f | 3.79f | 21 |
* Not annualized.
** Unaudited.
† For the period May 22, 2018 (commencement of operations) to September 30, 2018.
a Total return assumes dividend reinvestment and does not reflect the effect of sales charges.
b Includes amounts paid through expense offset arrangements, if any (Note 2). Also excludes acquired fund fees, if any.
c Includes interest and fee expense associated with borrowings which amounted to 0.01%, 0.03% and 0.01% of average net assets for the periods ended March 31, 2021, September 30, 2020 and September 30, 2019, respectively.
d Amount represents less than $0.01 per share.
e Includes one-time merger costs of 0.01% as a percentage of average net assets.
f Reflects a voluntary waiver of certain fund expenses in effect during the period. As a result of such waiver, the expenses of each class reflect a reduction of less than 0.01% as a percentage of average net assets.
The accompanying notes are an integral part of these financial statements.
| |
| 44 Tax Exempt Income Fund | Tax Exempt Income Fund 45 |
Notes to financial statements 3/31/21 (Unaudited)
Within the following Notes to financial statements, references to “State Street” represent State Street Bank and Trust Company, references to “the SEC” represent the Securities and Exchange Commission, references to “Putnam Management” represent Putnam Investment Management, LLC, the fund’s manager, an indirect wholly-owned subsidiary of Putnam Investments, LLC and references to “OTC”, if any, represent over-the-counter. Unless otherwise noted, the “reporting period” represents the period from October 1, 2020 through March 31, 2021.
Putnam Tax Exempt Income Fund (the fund) is a Massachusetts business trust, which is registered under the Investment Company Act of 1940, as amended, as a diversified open-end management investment company. The goal of the fund is to seek as high a level of current income exempt from federal income tax as Putnam Management believes to be consistent with preservation of capital. The fund invests mainly in bonds that pay interest that is exempt from federal income tax (but that may be subject to federal alternative minimum tax (AMT)), are investment-grade in quality, and have intermediate- to long-term maturities (i.e., three years or longer). Under normal circumstances, the fund invests at least 80% of its net assets in tax-exempt investments, which for purposes of this policy exclude investments paying interest subject to the federal AMT for individuals. This investment policy cannot be changed without the approval of the fund’s shareholders. Tax-exempt investments are issued by or for states, territories or possessions of the United States or by their political subdivisions, agencies, authorities or other government entities, and the income from these investments is exempt from both federal and the applicable state’s income tax. Interest income from private activity bonds may be subject to federal AMT for individuals. These investments are not included for the purpose of complying with the 80% investment policy. Putnam Management may consider, among other factors, credit, interest rate and prepayment risks, as well as general market conditions, when deciding whether to buy or sell investments.
The fund offers class A, class B, class C, class R6 and class Y shares. Purchases of class B shares are closed to new and existing investors except by exchange from class B shares of another Putnam fund or through dividend and/ or capital gains reinvestment. Class A shares are sold with a maximum front-end sales charge of 4.00%. Class A shares generally are not subject to a contingent deferred sales charge, and class R6 and class Y shares are not subject to a contingent deferred sales charge. Class B shares, which convert to class A shares after approximately eight years, are not subject to a front-end sales charge and are subject to a contingent deferred sales charge if those shares are redeemed within six years of purchase. Class C shares are subject to a one-year 1.00% contingent deferred sales charge and generally convert to class A shares after approximately eight years. Prior to March 1, 2021, class C shares generally converted to class A shares after approximately ten years. The expenses for class A, class B and class C shares may differ based on the distribution fee of each class, which is identified in Note 2. Class R6 and class Y shares, which are sold at net asset value, are generally subject to the same expenses as class A, class B and class C shares, but do not bear a distribution fee, and in the case of class R6 shares, bear a lower investor servicing fee, which is identified in Note 2. Class R6 and class Y shares are not available to all investors.
In the normal course of business, the fund enters into contracts that may include agreements to indemnify another party under given circumstances. The fund’s maximum exposure under these arrangements is unknown as this would involve future claims that may be, but have not yet been, made against the fund. However, the fund’s management team expects the risk of material loss to be remote.
The fund has entered into contractual arrangements with an investment adviser, administrator, distributor, shareholder servicing agent and custodian, who each provide services to the fund. Unless expressly stated otherwise, shareholders are not parties to, or intended beneficiaries of these contractual arrangements, and these contractual arrangements are not intended to create any shareholder right to enforce them against the service providers or to seek any remedy under them against the service providers, either directly or on behalf of the fund.
Under the fund’s Amended and Restated Agreement and Declaration of Trust, any claims asserted against or on behalf of the Putnam Funds, including claims against Trustees and Officers, must be brought in state and federal courts located within the Commonwealth of Massachusetts.
Note 1: Significant accounting policies
The following is a summary of significant accounting policies consistently followed by the fund in the preparation of its financial statements. The preparation of financial statements is in conformity with accounting principles generally accepted in the United States of America and requires management to make estimates and assumptions that affect the reported amounts of assets and liabilities in the financial statements and the reported amounts of increases and decreases in net assets from operations. Actual results could differ from those
|
| 46 Tax Exempt Income Fund |
estimates. Subsequent events after the Statement of assets and liabilities date through the date that the financial statements were issued have been evaluated in the preparation of the financial statements.
Investment income, realized and unrealized gains and losses and expenses of the fund are borne pro-rata based on the relative net assets of each class to the total net assets of the fund, except that each class bears expenses unique to that class (including the distribution fees applicable to such classes). Each class votes as a class only with respect to its own distribution plan or other matters on which a class vote is required by law or determined by the Trustees. If the fund were liquidated, shares of each class would receive their pro-rata share of the net assets of the fund. In addition, the Trustees declare separate dividends on each class of shares.
Security valuation Portfolio securities and other investments are valued using policies and procedures adopted by the Board of Trustees. The Trustees have formed a Pricing Committee to oversee the implementation of these procedures and have delegated responsibility for valuing the fund’s assets in accordance with these procedures to Putnam Management. Putnam Management has established an internal Valuation Committee that is responsible for making fair value determinations, evaluating the effectiveness of the pricing policies of the fund and reporting to the Pricing Committee.
Tax-exempt bonds and notes are generally valued on the basis of valuations provided by an independent pricing service approved by the Trustees. Such services use information with respect to transactions in bonds, quotations from bond dealers, market transactions in comparable securities and various relationships between securities in determining value. These securities will generally be categorized as Level 2.
Market quotations are not considered to be readily available for certain debt obligations (including short-term investments with remaining maturities of 60 days or less) and other investments; such investments are valued on the basis of valuations furnished by an independent pricing service approved by the Trustees or dealers selected by Putnam Management. Such services or dealers determine valuations for normal institutional-size trading units of such securities using methods based on market transactions for comparable securities and various relationships, generally recognized by institutional traders, between securities (which consider such factors as security prices, yields, maturities and ratings). These securities will generally be categorized as Level 2. Securities quoted in foreign currencies, if any, are translated into U.S. dollars at the current exchange rate.
Investments in open-end investment companies (excluding exchange-traded funds), if any, which can be classified as Level 1 or Level 2 securities, are valued based on their net asset value. The net asset value of such investment companies equals the total value of their assets less their liabilities and divided by the number of their outstanding shares.
To the extent a pricing service or dealer is unable to value a security or provides a valuation that Putnam Management does not believe accurately reflects the security’s fair value, the security will be valued at fair value by Putnam Management in accordance with policies and procedures approved by the Trustees. Certain investments, including certain restricted and illiquid securities and derivatives, are also valued at fair value following procedures approved by the Trustees. These valuations consider such factors as significant market or specific security events such as interest rate or credit quality changes, various relationships with other securities, discount rates, U.S. Treasury, U.S. swap and credit yields, index levels, convexity exposures, recovery rates, sales and other multiples and resale restrictions. These securities are classified as Level 2 or as Level 3 depending on the priority of the significant inputs.
To assess the continuing appropriateness of fair valuations, the Valuation Committee reviews and affirms the reasonableness of such valuations on a regular basis after considering all relevant information that is reasonably available. Such valuations and procedures are reviewed periodically by the Trustees. The fair value of securities is generally determined as the amount that the fund could reasonably expect to realize from an orderly disposition of such securities over a reasonable period of time. By its nature, a fair value price is a good faith estimate of the value of a security in a current sale and does not reflect an actual market price, which may be different by a material amount.
Security transactions and related investment income Security transactions are recorded on the trade date (the date the order to buy or sell is executed). Gains or losses on securities sold are determined on the identified cost basis.
Interest income, net of any applicable withholding taxes, if any, and including amortization and accretion of premiums and discounts on debt securities, is recorded on the accrual basis.
Securities purchased or sold on a forward commitment or delayed delivery basis may be settled at a future date beyond customary settlement time; interest income is accrued based on the terms of the securities. Losses
|
| Tax Exempt Income Fund 47 |
may arise due to changes in the fair value of the underlying securities or if the counterparty does not perform under the contract.
Futures contracts The fund uses futures contracts for hedging treasury term structure risk and for yield curve positioning.
The potential risk to the fund is that the change in value of futures contracts may not correspond to the change in value of the hedged instruments. In addition, losses may arise from changes in the value of the underlying instruments, if there is an illiquid secondary market for the contracts, if interest or exchange rates move unexpectedly or if the counterparty to the contract is unable to perform. With futures, there is minimal counterparty credit risk to the fund since futures are exchange traded and the exchange’s clearinghouse, as counterparty to all exchange traded futures, guarantees the futures against default. Risks may exceed amounts recognized on the Statement of assets and liabilities. When the contract is closed, the fund records a realized gain or loss equal to the difference between the value of the contract at the time it was opened and the value at the time it was closed.
Futures contracts are valued at the quoted daily settlement prices established by the exchange on which they trade. The fund and the broker agree to exchange an amount of cash equal to the daily fluctuation in the value of the futures contract. Such receipts or payments are known as “variation margin.”
Futures contracts outstanding at period end, if any, are listed after the fund’s portfolio.
Total return swap contracts The fund entered into OTC and/or centrally cleared total return swap contracts, which are arrangements to exchange a market-linked return for a periodic payment, both based on a notional principal amount, for hedging sector exposure and for gaining exposure to specific sectors.
To the extent that the total return of the security, index or other financial measure underlying the transaction exceeds or falls short of the offsetting interest rate obligation, the fund will receive a payment from or make a payment to the counterparty. OTC and/or centrally cleared total return swap contracts are marked to market daily based upon quotations from an independent pricing service or market maker. Any change is recorded as an unrealized gain or loss on OTC total return swaps. Daily fluctuations in the value of centrally cleared total return swaps are settled through a central clearing agent and are recorded in variation margin on the Statement of assets and liabilities and recorded as unrealized gain or loss. Payments received or made are recorded as realized gains or losses. Certain OTC and/or centrally cleared total return swap contracts may include extended effective dates. Payments related to these swap contracts are accrued based on the terms of the contract. The fund could be exposed to credit or market risk due to unfavorable changes in the fluctuation of interest rates or in the price of the underlying security or index, the possibility that there is no liquid market for these agreements or that the counterparty may default on its obligation to perform. The fund’s maximum risk of loss from counterparty risk or central clearing risk is the fair value of the contract. This risk may be mitigated for OTC total return swap contracts by having a master netting arrangement between the fund and the counterparty and for centrally cleared total return swap contracts through the daily exchange of variation margin. There is minimal counterparty risk with respect to centrally cleared total return swap contracts due to the clearinghouse guarantee fund and other resources that are available in the event of a clearing member default. Risk of loss may exceed amounts recognized on the Statement of assets and liabilities.
OTC and/or centrally cleared total return swap contracts outstanding, including their respective notional amounts at period end, if any, are listed after the fund’s portfolio.
Master agreements The fund is a party to ISDA (International Swaps and Derivatives Association, Inc.) Master Agreements (Master Agreements) with certain counterparties that govern OTC derivative and foreign exchange contracts entered into from time to time. The Master Agreements may contain provisions regarding, among other things, the parties’ general obligations, representations, agreements, collateral requirements, events of default and early termination. With respect to certain counterparties, in accordance with the terms of the Master Agreements, collateral pledged to the fund is held in a segregated account by the fund’s custodian and, with respect to those amounts which can be sold or repledged, is presented in the fund’s portfolio.
Collateral pledged by the fund is segregated by the fund’s custodian and identified in the fund’s portfolio. Collateral can be in the form of cash or debt securities issued by the U.S. Government or related agencies or other securities as agreed to by the fund and the applicable counterparty. Collateral requirements are determined based on the fund’s net position with each counterparty.
Termination events applicable to the fund may occur upon a decline in the fund’s net assets below a specified threshold over a certain period of time. Termination events applicable to counterparties may occur upon a decline in the counterparty’s long-term and short-term credit ratings below a specified level. In each case,
|
| 48 Tax Exempt Income Fund |
upon occurrence, the other party may elect to terminate early and cause settlement of all derivative and foreign exchange contracts outstanding, including the payment of any losses and costs resulting from such early termination, as reasonably determined by the terminating party. Any decision by one or more of the fund’s counterparties to elect early termination could impact the fund’s future derivative activity.
At the close of the reporting period, the fund had a net liability position of $402,697 on open derivative contracts subject to the Master Agreements. Collateral pledged by the fund at period end for these agreements totaled $323,000 and may include amounts related to unsettled agreements.
Tender option bond transactions The fund may participate in transactions whereby a fixed-rate bond is transferred to a tender option bond trust (TOB trust) sponsored by a broker. The TOB trust funds the purchase of the fixed rate bonds by issuing floating-rate bonds to third parties and allowing the fund to retain the residual interest in the TOB trust’s assets and cash flows, which are in the form of inverse floating rate bonds. The inverse floating rate bonds held by the fund give the fund the right to (1) cause the holders of the floating rate bonds to tender their notes at par, and (2) to have the fixed-rate bond held by the TOB trust transferred to the fund, causing the TOB trust to collapse. The fund accounts for the transfer of the fixed-rate bond to the TOB trust as a secured borrowing by including the fixed-rate bond in the fund’s portfolio and including the floating rate bond as a liability in the Statement of assets and liabilities. At the close of the reporting period, the fund’s investments with a value of $33,853,477 were held by the TOB trust and served as collateral for $19,072,917 in floating-rate bonds outstanding. For the reporting period ended, the fund incurred interest expense of $11,898 for these investments based on an average interest rate of 0.12%.
Interfund lending The fund, along with other Putnam funds, may participate in an interfund lending program pursuant to an exemptive order issued by the SEC. This program allows the fund to borrow from other Putnam funds that permit such transactions. Interfund lending transactions are subject to each fund’s investment policies and borrowing and lending limits. Interest earned or paid on the interfund lending transaction will be based on the average of certain current market rates. During the reporting period, the fund did not utilize the program.
Lines of credit The fund participates, along with other Putnam funds, in a $317.5 million unsecured committed line of credit and a $235.5 million unsecured uncommitted line of credit, both provided by State Street. Borrowings may be made for temporary or emergency purposes, including the funding of shareholder redemption requests and trade settlements. Interest is charged to the fund based on the fund’s borrowing at a rate equal to 1.25% plus the higher of (1) the Federal Funds rate and (2) the Overnight Bank Funding Rate (overnight LIBOR prior to October 16, 2020) for the committed line of credit and 1.30% plus the higher of (1) the Federal Funds rate and (2) the Overnight Bank Funding Rate (1.30% prior to October 16, 2020) for the uncommitted line of credit. A closing fee equal to 0.04% of the committed line of credit and 0.04% of the uncommitted line of credit has been paid by the participating funds. In addition, a commitment fee of 0.21% per annum on any unutilized portion of the committed line of credit is allocated to the participating funds based on their relative net assets and paid quarterly. During the reporting period, the fund had no borrowings against these arrangements.
Federal taxes It is the policy of the fund to distribute all of its income within the prescribed time period and otherwise comply with the provisions of the Internal Revenue Code of 1986, as amended (the Code), applicable to regulated investment companies. It is also the intention of the fund to distribute an amount sufficient to avoid imposition of any excise tax under Section 4982 of the Code.
The fund is subject to the provisions of Accounting Standards Codification 740 Income Taxes (ASC 740). ASC 740 sets forth a minimum threshold for financial statement recognition of the benefit of a tax position taken or expected to be taken in a tax return. The fund did not have a liability to record for any unrecognized tax benefits in the accompanying financial statements. No provision has been made for federal taxes on income, capital gains or unrealized appreciation on securities held nor for excise tax on income and capital gains. Each of the fund’s federal tax returns for the prior three fiscal years remains subject to examination by the Internal Revenue Service.
Pursuant to federal income tax regulations applicable to regulated investment companies, the fund has elected to defer certain capital losses of $1,313,135 recognized during the period between November 1, 2019 and September 30, 2020 to its fiscal year ending September 30, 2021.
Tax cost of investments includes adjustments to net unrealized appreciation (depreciation) which may not necessarily be final tax cost basis adjustments, but closely approximate the tax basis unrealized gains and losses that may be realized and distributed to shareholders. The aggregate identified cost on a tax basis is $904,801,135, resulting in gross unrealized appreciation and depreciation of $70,439,660 and $11,516,400, respectively, or net unrealized appreciation of $58,923,260.
|
| Tax Exempt Income Fund 49 |
Distributions to shareholders Income dividends are recorded daily by the fund and are paid monthly. Distributions from capital gains, if any, are recorded on the ex-dividend date and paid at least annually. The amount and character of income and gains to be distributed are determined in accordance with income tax regulations which may differ from generally accepted accounting principles. Dividend sources are estimated at the time of declaration. Actual results may vary. Any non-taxable return of capital cannot be determined until final tax calculations are completed after the end of the fund’s fiscal year. Reclassifications are made to the fund’s capital accounts to reflect income and gains available for distribution (or available capital loss carryovers) under income tax regulations.
Note 2: Management fee, administrative services and other transactions
The fund pays Putnam Management a management fee (based on the fund’s average net assets and computed and paid monthly) at annual rates that may vary based on the average of the aggregate net assets of all open-end mutual funds sponsored by Putnam Management (excluding net assets of funds that are invested in, or that are invested in by, other Putnam funds to the extent necessary to avoid “double counting” of those assets). Such annual rates may vary as follows:
| | | | |
| 0.590% | of the first $5 billion, | | 0.390% | of the next $50 billion, |
| 0.540% | of the next $5 billion, | | 0.370% | of the next $50 billion, |
| 0.490% | of the next $10 billion, | | 0.360% | of the next $100 billion and |
| 0.440% | of the next $10 billion, | | 0.355% | of any excess thereafter. |
For the reporting period, the management fee represented an effective rate (excluding the impact from any expense waivers in effect) of 0.211% of the fund’s average net assets.
Putnam Management has contractually agreed, through January 30, 2022, to waive fees and/or reimburse the fund’s expenses to the extent necessary to limit the cumulative expenses of the fund, exclusive of brokerage, interest, taxes, investment-related expenses, extraordinary expenses, acquired fund fees and expenses and payments under the fund’s investor servicing contract, investment management contract and distribution plans, on a fiscal year-to-date basis to an annual rate of 0.20% of the fund’s average net assets over such fiscal year-to-date period. During the reporting period, the fund’s expenses were not reduced as a result of this limit.
Putnam Investments Limited (PIL), an affiliate of Putnam Management, is authorized by the Trustees to manage a separate portion of the assets of the fund as determined by Putnam Management from time to time. PIL did not manage any portion of the assets of the fund during the reporting period. If Putnam Management were to engage the services of PIL, Putnam Management would pay a quarterly sub-management fee to PIL for its services at an annual rate of 0.40% of the average net assets of the portion of the fund managed by PIL.
The fund reimburses Putnam Management an allocated amount for the compensation and related expenses of certain officers of the fund and their staff who provide administrative services to the fund. The aggregate amount of all such reimbursements is determined annually by the Trustees.
Custodial functions for the fund’s assets are provided by State Street. Custody fees are based on the fund’s asset level, the number of its security holdings and transaction volumes.
Putnam Investor Services, Inc., an affiliate of Putnam Management, provides investor servicing agent functions to the fund. Putnam Investor Services, Inc. received fees for investor servicing for class A, class B, class C and class Y shares that included (1) a per account fee for each direct and underlying non-defined contribution account (retail account) of the fund; (2) a specified rate of the fund’s assets attributable to defined contribution plan accounts; and (3) a specified rate based on the average net assets in retail accounts. Putnam Investor Services, Inc. has agreed that the aggregate investor servicing fees for each fund’s retail and defined contribution accounts for these share classes will not exceed an annual rate of 0.25% of the fund’s average assets attributable to such accounts.
Class R6 shares paid a monthly fee based on the average net assets of class R6 shares at an annual rate of 0.05%.
During the reporting period, the expenses for each class of shares related to investor servicing fees were as follows:
| | | | |
| Class A | $267,048 | | Class R6 | 1,008 |
| Class B | 378 | | Class Y | 41,050 |
| Class C | 6,916 | | Total | $316,400 |
|
| 50 Tax Exempt Income Fund |
The fund has entered into expense offset arrangements with Putnam Investor Services, Inc. and State Street whereby Putnam Investor Services, Inc.’s and State Street’s fees are reduced by credits allowed on cash balances. For the reporting period, the fund’s expenses were reduced by $385 under the expense offset arrangements.
Each Independent Trustee of the fund receives an annual Trustee fee, of which $639, as a quarterly retainer, has been allocated to the fund, and an additional fee for each Trustees meeting attended. Trustees also are reimbursed for expenses they incur relating to their services as Trustees.
The fund has adopted a Trustee Fee Deferral Plan (the Deferral Plan) which allows the Trustees to defer the receipt of all or a portion of Trustees fees payable on or after July 1, 1995. The deferred fees remain invested in certain Putnam funds until distribution in accordance with the Deferral Plan.
The fund has adopted an unfunded noncontributory defined benefit pension plan (the Pension Plan) covering all Trustees of the fund who have served as a Trustee for at least five years and were first elected prior to 2004. Benefits under the Pension Plan are equal to 50% of the Trustee’s average annual attendance and retainer fees for the three years ended December 31, 2005. The retirement benefit is payable during a Trustee’s lifetime, beginning the year following retirement, for the number of years of service through December 31, 2006. Pension expense for the fund is included in Trustee compensation and expenses in the Statement of operations. Accrued pension liability is included in Payable for Trustee compensation and expenses in the Statement of assets and liabilities. The Trustees have terminated the Pension Plan with respect to any Trustee first elected after 2003.
The fund has adopted distribution plans (the Plans) with respect to the following share classes pursuant to Rule 12b–1 under the Investment Company Act of 1940. The purpose of the Plans is to compensate Putnam Retail Management Limited Partnership, an indirect wholly-owned subsidiary of Putnam Investments, LLC, for services provided and expenses incurred in distributing shares of the fund. The Plans provide payments by the fund to Putnam Retail Management Limited Partnership at an annual rate of up to the following amounts (Maximum %) of the average net assets attributable to each class. The Trustees have approved payment by the fund at the following annual rate (Approved %) of the average net assets attributable to each class. During the reporting period, the class-specific expenses related to distribution fees were as follows:
| | | |
| | Maximum % | Approved % | Amount |
| Class A | 0.35% | 0.25% | $976,280 |
| Class B | 1.00% | 0.85% | 4,697 |
| Class C | 1.00% | 1.00% | 101,105 |
| Total | | | $1,082,082 |
For the reporting period, Putnam Retail Management Limited Partnership, acting as underwriter, received net commissions of $15,107 from the sale of class A shares and received $1,020 and no monies in contingent deferred sales charges from redemptions of class B and class C shares, respectively.
A deferred sales charge of up to 1.00% is assessed on certain redemptions of class A shares. For the reporting period, Putnam Retail Management Limited Partnership, acting as underwriter, received $60 on class A redemptions.
Note 3: Purchases and sales of securities
During the reporting period, the cost of purchases and the proceeds from sales, excluding short-term investments, were as follows:
| | |
| | Cost of purchases | Proceeds from sales |
| Investments in securities (Long-term) | $139,229,044 | $129,386,333 |
| U.S. government securities (Long-term) | — | — |
| Total | $139,229,044 | $129,386,333 |
The fund may purchase or sell investments from or to other Putnam funds in the ordinary course of business, which can reduce the fund’s transaction costs, at prices determined in accordance with SEC requirements and policies approved by the Trustees. During the reporting period, purchases or sales of long-term securities from or to other Putnam funds, if any, did not represent more than 5% of the fund’s total cost of purchases and/or total proceeds from sales.
|
| Tax Exempt Income Fund 51 |
Note 4: Capital shares
At the close of the reporting period, there were an unlimited number of shares of beneficial interest authorized. Transactions, including, if applicable, direct exchanges pursuant to share conversions, in capital shares were as follows:
| | | | |
| | SIX MONTHS ENDED 3/31/21 | YEAR ENDED 9/30/20 |
| Class A | Shares | Amount | Shares | Amount |
| Shares sold | 3,572,620 | $31,405,632 | 8,826,079 | $76,431,228 |
| Shares issued in connection with | | | | |
| reinvestment of distributions | 871,175 | 7,659,087 | 3,879,568 | 33,578,275 |
| | 4,443,795 | 39,064,719 | 12,705,647 | 110,009,503 |
| Shares repurchased | (6,798,155) | (59,731,011) | (17,089,018) | (146,948,687) |
| Net decrease | (2,354,360) | $(20,666,292) | (4,383,371) | $(36,939,184) |
| |
| | SIX MONTHS ENDED 3/31/21 | YEAR ENDED 9/30/20 |
| Class B | Shares | Amount | Shares | Amount |
| Shares sold | 1,727 | $14,940 | 9,862 | $87,192 |
| Shares issued in connection with | | | | |
| reinvestment of distributions | 939 | 8,253 | 10,084 | 87,441 |
| | 2,666 | 23,193 | 19,946 | 174,633 |
| Shares repurchased | (54,036) | (475,461) | (228,007) | (1,966,612) |
| Net decrease | (51,370) | $(452,268) | (208,061) | $(1,791,979) |
| |
| | SIX MONTHS ENDED 3/31/21 | YEAR ENDED 9/30/20 |
| Class C | Shares | Amount | Shares | Amount |
| Shares sold | 128,040 | $1,122,484 | 447,553 | $3,923,822 |
| Shares issued in connection with | | | | |
| reinvestment of distributions | 15,389 | 135,648 | 102,787 | 892,739 |
| | 143,429 | 1,258,132 | 550,340 | 4,816,561 |
| Shares repurchased | (691,413) | (6,084,730) | (1,150,951) | (9,949,801) |
| Net decrease | (547,984) | $(4,826,598) | (600,611) | $(5,133,240) |
| |
| | | | YEAR ENDED 9/30/20* |
| Class M | | | Shares | Amount |
| Shares sold | | | 11,234 | $99,867 |
| Shares issued in connection with reinvestment of distributions | | 1,224 | 10,871 |
| | | | 12,458 | 110,738 |
| Shares repurchased | | | (649,448) | (5,760,873) |
| Net decrease | | | (636,990) | $(5,650,135) |
|
| 52 Tax Exempt Income Fund |
| | | | |
| | SIX MONTHS ENDED 3/31/21 | YEAR ENDED 9/30/20 |
| Class R6 | Shares | Amount | Shares | Amount |
| Shares sold | 69,506 | $613,810 | 170,493 | $1,477,246 |
| Shares issued in connection with | | | | |
| reinvestment of distributions | 5,603 | 49,377 | 19,131 | 165,952 |
| | 75,109 | 663,187 | 189,624 | 1,643,198 |
| Shares repurchased | (33,885) | (298,041) | (193,801) | (1,666,523) |
| Net increase (decrease) | 41,224 | $365,146 | (4,177) | $(23,325) |
| |
| | SIX MONTHS ENDED 3/31/21 | YEAR ENDED 9/30/20 |
| Class Y | Shares | Amount | Shares | Amount |
| Shares sold | 3,027,888 | $26,566,211 | 6,122,395 | $53,307,280 |
| Shares issued in connection with | | | | |
| reinvestment of distributions | 117,312 | 1,034,271 | 411,871 | 3,574,484 |
| | 3,145,200 | 27,600,482 | 6,534,266 | 56,881,764 |
| Shares repurchased | (1,967,494) | (17,357,392) | (3,520,764) | (30,195,207) |
| Net increase | 1,177,706 | $10,243,090 | 3,013,502 | $26,686,557 |
* Effective November 25, 2019, the fund converted all of its class M shares to class A shares and class M shares were no longer able to be purchased.
Note 5: Affiliated transactions
Transactions during the reporting period with any company which is under common ownership or control were as follows:
| | | | | |
| | | | | | Shares |
| | | | | | outstanding |
| | | | | | and fair |
| | Fair value as | Purchase | Sale | Investment | value as |
| Name of affiliate | of 9/30/20 | cost | proceeds | income | of 3/31/21 |
| Short-term investments | | | | | |
| Putnam Short Term | | | | | |
| Investment Fund* | $21,205,293 | $175,414,940 | $186,902,848 | $21,775 | $9,717,385 |
| Total Short-term | | | | | |
| investments | $21,205,293 | $175,414,940 | $186,902,848 | $21,775 | $9,717,385 |
* Management fees charged to Putnam Short Term Investment Fund have been waived by Putnam Management. There were no realized or unrealized gains or losses during the period.
Note 6: Market, credit and other risks
In the normal course of business, the fund trades financial instruments and enters into financial transactions where risk of potential loss exists due to changes in the market (market risk) or failure of the contracting party to the transaction to perform (credit risk). The fund may be exposed to additional credit risk that an institution or other entity with which the fund has unsettled or open transactions will default.
On July 27, 2017, the United Kingdom’s Financial Conduct Authority (“FCA”), which regulates LIBOR, announced a desire to phase out the use of LIBOR by the end of 2021. In November 2020, this date was extended until June 30, 2023 for certain widely followed tenors (overnight and one-, three-, six-, and 12-month U.S. dollar LIBOR). LIBOR has historically been a common benchmark interest rate index used to make adjustments to variable-rate loans. It is used throughout global banking and financial industries to determine interest rates for a variety of financial instruments and borrowing arrangements. The transition process might lead to increased volatility and illiquidity in markets that currently rely on LIBOR to determine interest rates. It could also lead to a reduction in the value of some LIBOR-based investments and reduce the effectiveness of new hedges placed against existing LIBOR-based investments. While some LIBOR-based instruments may contemplate a scenario where LIBOR is no
|
| Tax Exempt Income Fund 53 |
longer available by providing for an alternative rate-setting methodology, not all may have such provisions and there may be significant uncertainty regarding the effectiveness of any such alternative methodologies. Since the usefulness of LIBOR as a benchmark could deteriorate during the transition period, these effects could occur prior to June 30, 2023.
Beginning in January 2020, global financial markets have experienced, and may continue to experience, significant volatility resulting from the spread of a virus known as COVID–19. The outbreak of COVID–19 has resulted in travel and border restrictions, quarantines, supply chain disruptions, lower consumer demand, and general market uncertainty. The effects of COVID–19 have adversely affected, and may continue to adversely affect, the global economy, the economies of certain nations, and individual issuers, all of which may negatively impact the fund’s performance.
Note 7: Summary of derivative activity
The volume of activity for the reporting period for any derivative type that was held during the period is listed below and was based on an average of the holdings at the end of each fiscal quarter:
| |
| Futures contracts (number of contracts) | 200 |
| OTC total return swap contracts (notional) | $55,300,000 |
| Centrally cleared total return swap contracts (notional) | $18,200,000 |
The following is a summary of the fair value of derivative instruments as of the close of the reporting period:
| | | | |
| Fair value of derivative instruments as of the close of the reporting period | |
| | ASSET DERIVATIVES | LIABILITY DERIVATIVES |
| Derivatives not | | | | |
| accounted for as | Statement of | | Statement of | |
| hedging instruments | assets and | | assets and | |
| under ASC 815 | liabilities location | Fair value | liabilities location | Fair value |
| | Receivables, Net | | | |
| | assets — Unrealized | | Payables, Net assets — | |
| Interest rate contracts | appreciation | $1,400,358* | Unrealized depreciation | $968,490 * |
| Total | | $1,400,358 | | $968,490 |
* Includes cumulative appreciation/depreciation of futures contracts and/or centrally cleared swaps as reported in the fund’s portfolio. Only current day’s variation margin is reported within the Statement of assets and liabilities.
The following is a summary of realized and change in unrealized gains or losses of derivative instruments in the Statement of operations for the reporting period (Note 1):
| | | |
| Amount of realized gain or (loss) on derivatives recognized in net gain or (loss) on investments | |
| Derivatives not accounted for as hedging | | | |
| instruments under ASC 815 | Futures | Swaps | Total |
| Interest rate contracts | $520,180 | $(20,880) | $499,300 |
| Total | $520,180 | $(20,880) | $499,300 |
| |
| Change in unrealized appreciation or (depreciation) on derivatives recognized in net gain or (loss) |
| on investments | | | |
| Derivatives not accounted for as hedging | | | |
| instruments under ASC 815 | Futures | Swaps | Total |
| Interest rate contracts | $441,622 | $6,879 | $448,501 |
| Total | $441,622 | $6,879 | $448,501 |
|
| 54 Tax Exempt Income Fund |
Note 8: Offsetting of financial and derivative assets and liabilities
The following table summarizes any derivatives, repurchase agreements and reverse repurchase agreements, at the end of the reporting period, that are subject to an enforceable master netting agreement or similar agreement. For securities lending transactions or borrowing transactions associated with securities sold short, if any, see Note 1. For financial reporting purposes, the fund does not offset financial assets and financial liabilities that are subject to the master netting agreements in the Statement of assets and liabilities.
| | | | |
| | Citibank, N. A. | JPMorgan Securities LLC | Morgan Stanley & Co. International PLC | Total |
| Assets: | | | | |
| OTC Total return swap contracts*# | $356,546 | $— | $628,575 | $985,121 |
| Futures contracts§ | — | 88,215 | — | 88,215 |
| Total Assets | $356,546 | $88,215 | $628,575 | $1,073,336 |
| Liabilities: | | | | |
| OTC Total return swap contracts*# | 759,243 | — | 166,262 | 925,505 |
| Futures contracts§ | — | — | — | — |
| Total Liabilities | $759,243 | $— | $166,262 | $925,505 |
| Total Financial and Derivative | $(402,697) | $88,215 | $462,313 | $147,831 |
| Net Assets | | | | |
| Total collateral | $(323,000) | $— | $410,000 | |
| received (pledged)†## | | | | |
| Net amount | $(79,697) | $88,215 | $52,313 | |
| Controlled collateral received | | | | |
| (including TBA commitments)** | $— | $— | $410,000 | $410,000 |
| Uncontrolled collateral received | $— | $— | $— | $— |
| Collateral (pledged) (including | | | | |
| TBA commitments)** | $(323,000) | $— | $— | $(323,000) |
* Excludes premiums, if any. Included in unrealized appreciation and depreciation on OTC swap contracts on the Statement of assets and liabilities.
** Included with Investments in securities on the Statement of assets and liabilities.
† Additional collateral may be required from certain brokers based on individual agreements.
# Covered by master netting agreement (Note 1).
##Any over-collateralization of total financial and derivative net assets is not shown. Collateral may include amounts related to unsettled agreements.
§ Includes current day’s variation margin only as reported on the Statement of assets and liabilities, which is not collateralized. Cumulative appreciation/(depreciation) for futures contracts and centrally cleared swap contracts is represented in the tables listed after the fund’s portfolio. Collateral pledged for initial margin on futures contracts and centrally cleared swap contracts, which is not included in the table above, amounted to $517,000 and $1,110,920, respectively.
|
| Tax Exempt Income Fund 55 |
Note 9: New accounting pronouncements
In March 2020, the Financial Accounting Standards Board (FASB) issued Accounting Standards Update (ASU) 2020–04, Reference Rate Reform (Topic 848) — Facilitation of the Effects of Reference Rate Reform on Financial Reporting. The amendments in ASU 2020–04 provide optional temporary financial reporting relief from the effect of certain types of contract modifications due to the planned discontinuation of LIBOR and other interbank-offered based reference rates as of the end of 2021. The discontinuation of LIBOR was subsequently extended to June 30, 2023. ASU 2020–04 is effective for certain reference rate-related contract modifications that occur during the period March 12, 2020 through December 31, 2022. Management is currently evaluating the impact, if any, of applying this provision.
|
| 56 Tax Exempt Income Fund |
Fund information
Founded over 80 years ago, Putnam Investments was built around the concept that a balance between risk and reward is the hallmark of a well-rounded financial program. We manage funds across income, value, blend, growth, sustainable, asset allocation, absolute return, and global sector categories.
| | |
| Investment Manager | Trustees | Michael J. Higgins |
| Putnam Investment | Kenneth R. Leibler, Chair | Vice President, Treasurer, |
| Management, LLC | Liaquat Ahamed | and Clerk |
| 100 Federal Street | Ravi Akhoury | |
| Boston, MA 02110 | Barbara M. Baumann | Jonathan S. Horwitz |
| | Katinka Domotorffy | Executive Vice President, |
| Investment Sub-Advisor | Catharine Bond Hill | Principal Executive Officer, |
| Putnam Investments Limited | Paul L. Joskow | and Compliance Liaison |
| 60 St James’s Street | Robert E. Patterson | |
| London, England SW1A 1ER | George Putnam, III | Richard T. Kircher |
| | Robert L. Reynolds | Vice President and BSA |
| Marketing Services | Manoj P. Singh | Compliance Officer |
| Putnam Retail Management | Mona K. Sutphen | |
| 100 Federal Street | | Susan G. Malloy |
| Boston, MA 02110 | Officers | Vice President and |
| | Robert L. Reynolds | Assistant Treasurer |
| Custodian | President | |
| State Street Bank | | Denere P. Poulack |
| and Trust Company | Robert T. Burns | Assistant Vice President, Assistant |
| | Vice President and | Clerk, and Assistant Treasurer |
| Legal Counsel | Chief Legal Officer | |
| Ropes & Gray LLP | | Janet C. Smith |
| | James F. Clark | Vice President, |
| | Vice President, Chief Compliance | Principal Financial Officer, |
| | Officer, and Chief Risk Officer | Principal Accounting Officer, |
| | | and Assistant Treasurer |
| | Nancy E. Florek | |
| | Vice President, Director of | Mark C. Trenchard |
| | Proxy Voting and Corporate | Vice President |
| | Governance, Assistant Clerk, | |
| | and Assistant Treasurer | |
This report is for the information of shareholders of Putnam Tax Exempt Income Fund. It may also be used as sales literature when preceded or accompanied by the current prospectus, the most recent copy of Putnam’s Quarterly Performance Summary, and Putnam’s Quarterly Ranking Summary. For more recent performance, please visit putnam.com. Investors should carefully consider the investment objectives, risks, charges, and expenses of a fund, which are described in its prospectus. For this and other information or to request a prospectus or summary prospectus, call 1-800-225-1581 toll free. Please read the prospectus carefully before investing. The fund’s Statement of Additional Information contains additional information about the fund’s Trustees and is available without charge upon request by calling 1-800-225-1581.

| |
| Item 3. Audit Committee Financial Expert: |
| |
| Item 4. Principal Accountant Fees and Services: |
| |
| Item 5. Audit Committee of Listed Registrants |
| |
| Item 6. Schedule of Investments: |
| |
| The registrant's schedule of investments in unaffiliated issuers is included in the report to shareholders in Item 1 above. |
| |
| Item 7. Disclosure of Proxy Voting Policies and Procedures For Closed-End Management Investment Companies: |
| |
| Item 8. Portfolio Managers of Closed-End Investment Companies |
| |
| Item 9. Purchases of Equity Securities by Closed-End Management Investment Companies and Affiliated Purchasers: |
| |
| Item 10. Submission of Matters to a Vote of Security Holders: |
| |
| Item 11. Controls and Procedures: |
| |
| (a) The registrant's principal executive officer and principal financial officer have concluded, based on their evaluation of the effectiveness of the design and operation of the registrant's disclosure controls and procedures as of a date within 180 days of the filing date of this report, that the design and operation of such procedures are generally effective to provide reasonable assurance that information required to be disclosed by the registrant in this report is recorded, processed, summarized and reported within the time periods specified in the Commission's rules and forms. |
| |
| (b) Changes in internal control over financial reporting: Not applicable |
| |
| Item 12. Disclosures of Securities Lending Activities for Closed-End Investment Companies: |
| |
| Pursuant to the requirements of the Securities Exchange Act of 1934 and the Investment Company Act of 1940, the registrant has duly caused this report to be signed on its behalf by the undersigned, thereunto duly authorized. |
| |
| Putnam Tax Exempt Income Fund |
| |
| By (Signature and Title): |
| |
| /s/ Janet C. Smith
Janet C. Smith
Principal Accounting Officer
|
| |
| Pursuant to the requirements of the Securities Exchange Act of 1934 and the Investment Company Act of 1940, this report has been signed below by the following persons on behalf of the registrant and in the capacities and on the dates indicated. |
| |
| By (Signature and Title): |
| |
| /s/ Jonathan S. Horwitz
Jonathan S. Horwitz
Principal Executive Officer
|
| |
| By (Signature and Title): |
| |
| /s/ Janet C. Smith
Janet C. Smith
Principal Financial Officer
|