EXHIBIT 99.2
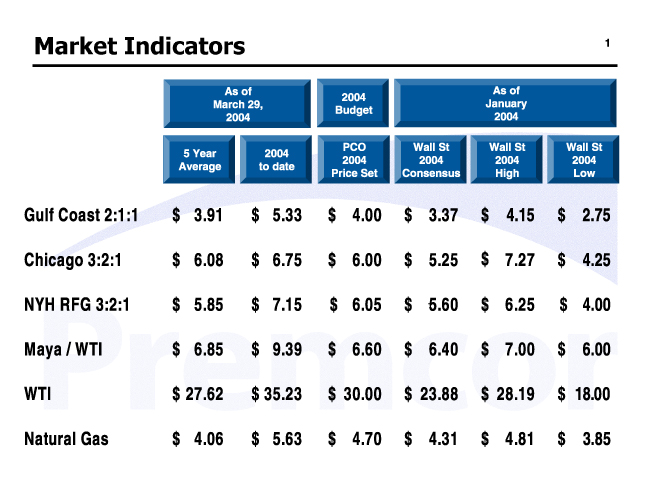
Market Indicators 1
As of March 29, 2004 2004 Budget As of January 2004
PCO Wall St Wall St Wall St
5 Year 2004
2004 2004 2004 2004
Average to date Price Set(1) Consensus High Low
Gulf Coast 2:1:1 $ 3.91 $ 5.33 $ 4.00 $ 3.37 $ 4.15 $ 2.75
Chicago 3:2:1 $ 6.08 $ 6.75 $ 6.00 $ 5.25 $ 7.27 $ 4.25
NYH RFG 3:2:1 $ 4.80 $ 7.18 $ 6.05 $ 5.60 $ 6.25 $ 4.00
Maya / WTI $ 6.85 $ 9.39 $ 6.60 $ 6.40 $ 7.00 $ 6.00
WTI $ 27.62 $ 35.23 $ 30.00 $ 23.88 $ 28.19 $ 18.00
Natural Gas $ 4.06 $ 5.63 $ 4.70 $ 4.31 $ 4.81 $ 3.85
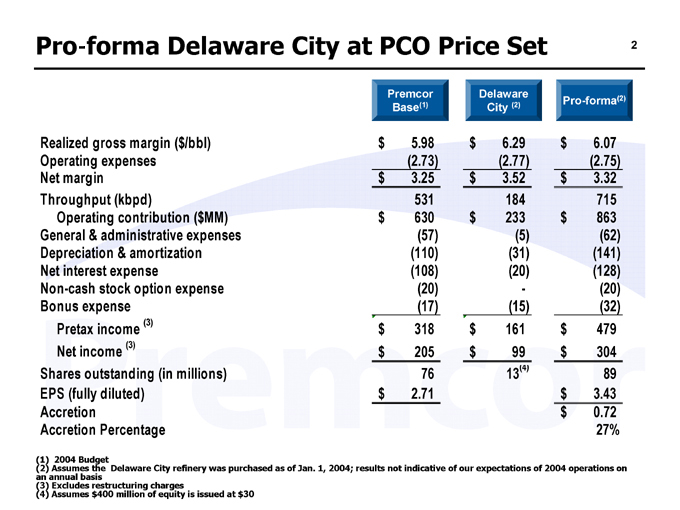
Pro formaDelaware City at PCO Price Set 2
Premcor Delaware
Pro-forma(2)
Base(1) City (2)
Realized gross margin ($/bbl) $ 5.98 $ 6.29 $ 6.07
Operating expenses (2.73) (2.77) (2.75)
Net margin $3.25 $ 3.52 $ 3.32
Throughput (kbpd) 531 184 715
Operating contribution ($MM) $ 630 $ 233 $ 863
General & administrative expenses (57) (5) (62)
Depreciation & amortization 531 (31) (141)
Net interest expense (108) (20) (128)
Non-cash stock option expense (20) - (20)
Bonus expense (17) (15) (32)
Pretax income (3) $318 $ 161 $ 479
Net income (3) $205 $ 99 $ 304
Shares outstanding (in millions) 76 13(4) 89
EPS (fully diluted) $2.71 $ 3.43
Accretion $ 0.72
Accretion Percentage 27%
(1) 2004 Budget
(2) Assumes the Delaware City refinery was purchased as of Jan. 1, 2004; results not indicative of our expectations of 2004 operations on an annual basis
(3) Excludes restructuring charges
(4) Assumes $400 million of equity is issued at $30
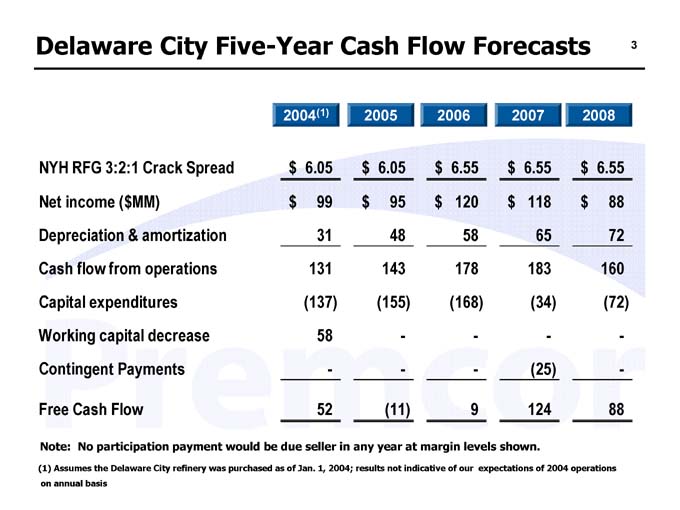
Delaware City Five-Year Cash Flow Forecasts 3
2004(1) 2005 2006 2007 2008
NYH RFG 3:2:1 Crack Spread $ 6.05 $ 6.05 $ 6.55 $ 6.55 $ 6.55
Net income ($MM) $ 99 $ 95 $ 120 $ 118 $ 88
Depreciation & amortization 31 48 58 65 72
Cash flow from operations 131 143 178 183 160
Capital expenditures (137) (155) (168) (34) (72)
Working capital decrease 58 - - - -
Contingent Payments - - - (25) -
Free Cash Flow 52 (11) 9 124 88
Note: No participation payment would be due seller in any year at margin levels shown.
(1) Assumes the Delaware City refinery was purchased as of Jan. 1, 2004; results not indicative of our expectations of 2004 operations on annual basis